UNITED STATES
SECURITIES AND EXCHANGE COMMISSION
Washington, D.C. 20549
FORM N-CSR
CERTIFIED SHAREHOLDER REPORT OF REGISTERED
MANAGEMENT INVESTMENT COMPANIES
Investment Company Act file number 811-3114
Fidelity Select Portfolios
(Exact name of registrant as specified in charter)
245 Summer St., Boston, Massachusetts 02210
(Address of principal executive offices) (Zip code)
Marc Bryant, Secretary
245 Summer St.
Boston, Massachusetts 02210
(Name and address of agent for service)
Registrant's telephone number, including area code: 617-563-7000
Date of fiscal year end: | February 28 |
|
|
Date of reporting period: | February 28, 2014 |
Item 1. Reports to Stockholders
Fidelity®
Select Portfolios®
Health Care Sector
Biotechnology Portfolio
Health Care Portfolio
Medical Delivery Portfolio
Medical Equipment and Systems Portfolio
Pharmaceuticals Portfolio
Annual Report
February 28, 2014
(Fidelity Cover Art)
Contents
Shareholder Expense Example |
| |
Biotechnology Portfolio | Performance | |
| Management's Discussion | |
| Investment Changes | |
| Investments | |
| Financial Statements | |
Health Care Portfolio | Performance | |
| Management's Discussion | |
| Investment Changes | |
| Investments | |
| Financial Statements | |
Medical Delivery Portfolio | Performance | |
| Management's Discussion | |
| Investment Changes | |
| Investments | |
| Financial Statements | |
Medical Equipment and Systems Portfolio | Performance | |
| Management's Discussion | |
| Investment Changes | |
| Investments | |
| Financial Statements | |
Pharmaceuticals Portfolio | Performance | |
| Management's Discussion | |
| Investment Changes | |
| Investments | |
| Financial Statements | |
Notes to Financial Statements |
| |
Report of Independent Registered Public Accounting Firm |
| |
Trustees and Officers |
| |
Distributions |
| |
Proxy Voting Results |
|
To view a fund's proxy voting guidelines and proxy voting record for the 12-month period ended June 30, visit http://www.fidelity.com/proxyvotingresults or visit the Securities and Exchange Commission's (SEC) web site at http://www.sec.gov. You may also call 1-800-544-8544 to request a free copy of the proxy voting guidelines.
Standard & Poor's, S&P and S&P 500 are registered service marks of The McGraw-Hill Companies, Inc. and have been licensed for use by Fidelity Distributors Corporation.
Other third-party marks appearing herein are the property of their respective owners.
All other marks appearing herein are registered or unregistered trademarks or service marks of FMR LLC or an affiliated company. © 2014 FMR LLC. All rights reserved.
Annual Report
This report and the financial statements contained herein are submitted for the general information of the shareholders of the funds. This report is not authorized for distribution to prospective investors in the funds unless preceded or accompanied by an effective prospectus.
A fund files its complete schedule of portfolio holdings with the SEC for the first and third quarters of each fiscal year on Form N-Q. Forms N-Q are available on the SEC's web site at http://www.sec.gov. A fund's Forms N-Q may be reviewed and copied at the SEC's Public Reference Room in Washington, DC. Information regarding the operation of the SEC's Public Reference Room may be obtained by calling 1-800-SEC-0330. For a complete list of a fund's portfolio holdings, view the most recent holdings listing, semiannual report, or annual report on Fidelity's web site at http://www.fidelity.com, http://www.advisor.fidelity.com, or http://www.401k.com, as applicable.
NOT FDIC INSURED • MAY LOSE VALUE • NO BANK GUARANTEE
Neither the funds nor Fidelity Distributors Corporation is a bank.
Annual Report
Shareholder Expense Example
As a shareholder of a Fund, you incur two types of costs: (1) transaction costs including redemption fees and (2) ongoing costs, including management fees and other Fund expenses. This Example is intended to help you understand your ongoing costs (in dollars) of investing in the Funds and to compare these costs with the ongoing costs of investing in other mutual funds.
The Example is based on an investment of $1,000 invested at the beginning of the period and held for the entire period (September 1, 2013 to February 28, 2014).
Actual Expenses
The first line of the accompanying table for each fund provides information about actual account values and actual expenses. You may use the information in this line, together with the amount you invested, to estimate the expenses that you paid over the period. Simply divide your account value by $1,000.00 (for example, an $8,600 account value divided by $1,000.00 = 8.6), then multiply the result by the number in the first line for a fund under the heading entitled "Expenses Paid During Period" to estimate the expenses you paid on your account during this period. A small balance maintenance fee of $12.00 that is charged once a year may apply for certain accounts with a value of less than $2,000. This fee is not included in the table below. If it was, the estimate of expenses you paid during the period would be higher, and your ending account value lower, by this amount. In addition, each Fund, as a shareholder in the underlying Fidelity Central Funds, will indirectly bear its pro-rata share of the fees and expenses incurred by the underlying Fidelity Central Funds. These fees and expenses are not included in the Fund's annualized expense ratio used to calculate the expense estimate in the table below.
Hypothetical Example for Comparison Purposes
The second line of the accompanying table for each fund provides information about hypothetical account values and hypothetical expenses based on a fund's actual expense ratio and an assumed rate of return of 5% per year before expenses, which is not the Fund's actual return. The hypothetical account values and expenses may not be used to estimate the actual ending account balance or expenses you paid for the period. You may use this information to compare the ongoing costs of investing in the Fund and other funds. To do so, compare this 5% hypothetical example with the 5% hypothetical examples that appear in the shareholder reports of the other funds. A small balance maintenance fee of $12.00 that is charged once a year may apply for certain accounts with a value of less than $2,000. This fee is not included in the table below. If it was, the estimate of expenses you paid during the period would be higher, and your ending account value lower, by this amount. In addition, each Fund, as a shareholder in the underlying Fidelity Central Funds, will indirectly bear its pro-rata share of the fees and expenses incurred by the underlying Fidelity Central Funds. These fees and expenses are not included in the Fund's annualized expense ratio used to calculate the expense estimate in the table below.
Please note that the expenses shown in the table are meant to highlight your ongoing costs only and do not reflect any transaction costs. Therefore, the second line of the table is useful in comparing ongoing costs only, and will not help you determine the relative total costs of owning different funds. In addition, if these transactional costs were included, your costs would have been higher.
| Annualized | Beginning | Ending | Expenses Paid |
Biotechnology Portfolio | .75% |
|
|
|
Actual |
| $ 1,000.00 | $ 1,377.20 | $ 4.42 |
Hypothetical A |
| $ 1,000.00 | $ 1,021.08 | $ 3.76 |
Health Care Portfolio | .76% |
|
|
|
Actual |
| $ 1,000.00 | $ 1,370.20 | $ 4.47 |
Hypothetical A |
| $ 1,000.00 | $ 1,021.03 | $ 3.81 |
Medical Delivery Portfolio | .81% |
|
|
|
Actual |
| $ 1,000.00 | $ 1,170.20 | $ 4.36 |
Hypothetical A |
| $ 1,000.00 | $ 1,020.78 | $ 4.06 |
Medical Equipment and Systems Portfolio | .79% |
|
|
|
Actual |
| $ 1,000.00 | $ 1,230.90 | $ 4.37 |
Hypothetical A |
| $ 1,000.00 | $ 1,020.88 | $ 3.96 |
Pharmaceuticals Portfolio | .80% |
|
|
|
Actual |
| $ 1,000.00 | $ 1,294.30 | $ 4.55 |
Hypothetical A |
| $ 1,000.00 | $ 1,020.83 | $ 4.01 |
A 5% return per year before expenses
B Annualized expense ratio reflects expenses net of applicable fee waivers.
* Expenses are equal to each Fund's annualized expense ratio, multiplied by the average account value over the period, multiplied by 181/365 (to reflect the one-half year period). The fees and expenses of the underlying Fidelity Central Funds in which the Fund invests are not included in the Fund's annualized expense ratio.
Annual Report
Biotechnology Portfolio
Performance: The Bottom Line
Average annual total return reflects the change in the value of an investment, assuming reinvestment of the fund's distributions from dividend income and capital gains (the profits earned upon the sale of securities that have grown in value, if any) and assuming a constant rate of performance each year. The $10,000 table and the fund's returns do not reflect the deduction of taxes that a shareholder would pay on fund distributions or the redemption of fund shares. During periods of reimbursement by Fidelity, a fund's total return will be greater than it would be had the reimbursement not occurred. How a fund did yesterday is no guarantee of how it will do tomorrow.
Average Annual Total Returns
Periods ended February 28, 2014 | Past 1 | Past 5 | Past 10 |
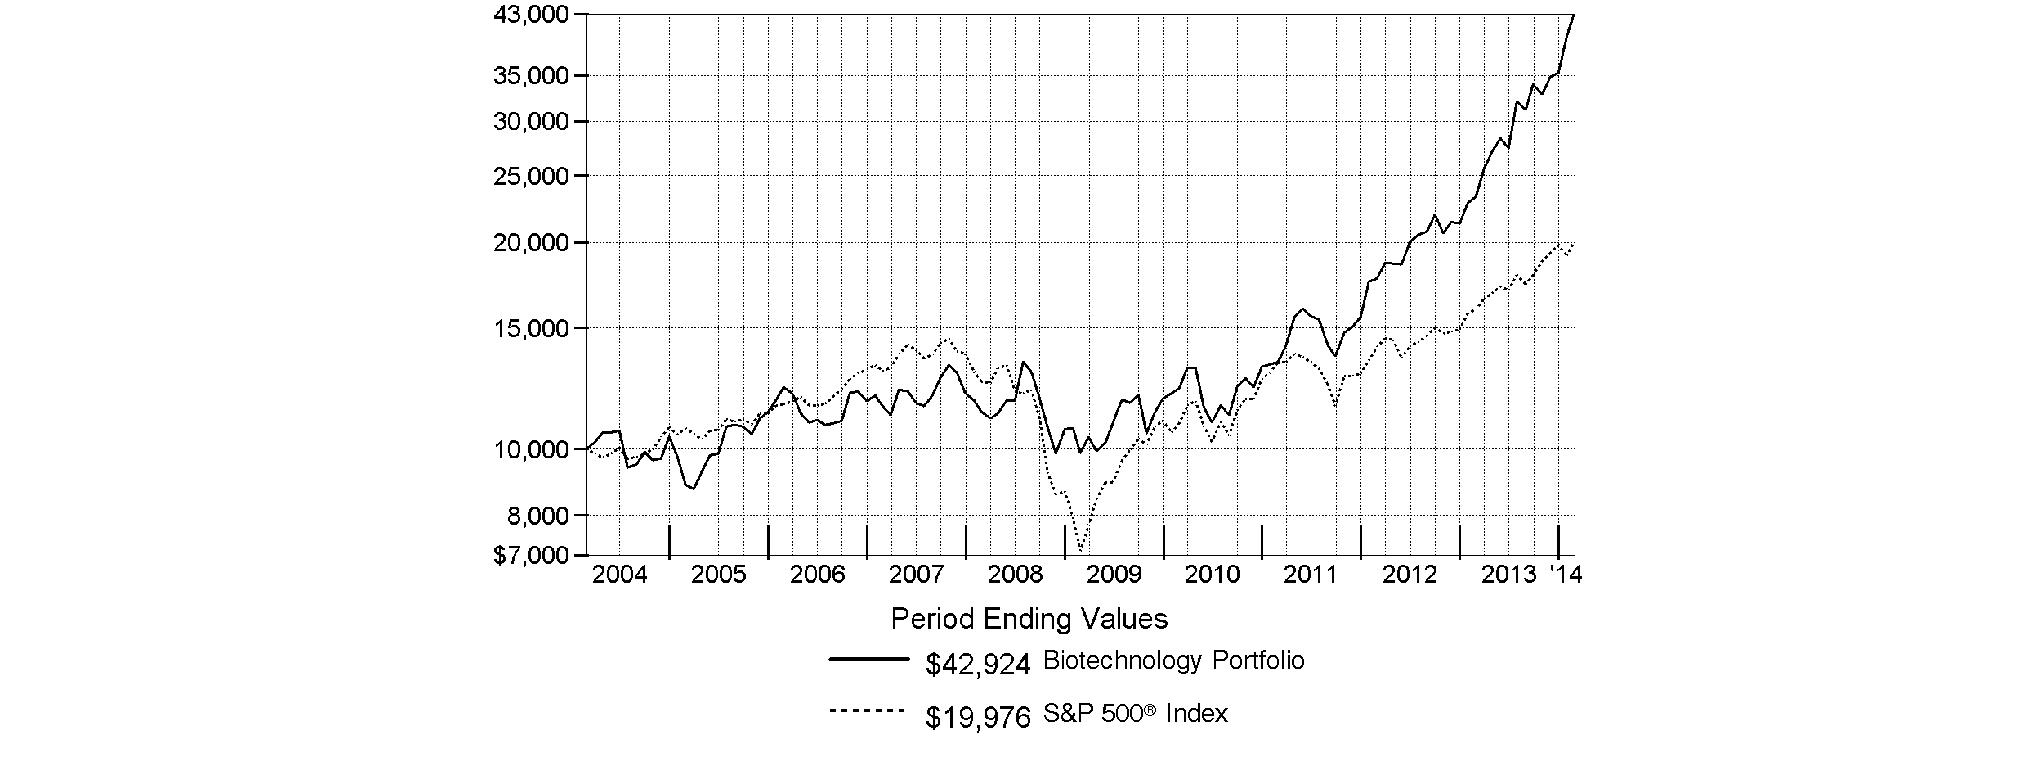
Biotechnology Portfolio | 84.25% | 34.20% | 15.68% |
$10,000 Over 10 Years
Let's say hypothetically that $10,000 was invested in Biotechnology Portfolio on February 29, 2004. The chart shows how the value of your investment would have changed, and also shows how the S&P 500® Index performed over the same period.
Annual Report
Biotechnology Portfolio
Management's Discussion of Fund Performance
Market Recap: Stocks overcame fears of higher interest rates - not to mention their worst January in four years - to finish sharply higher for the 12 months ending February 28, 2014. The broad S&P 500® Index and the blue-chip Dow Jones Industrial AverageSM gained 25.37% and 19.01%, respectively, amid generally favorable earnings reports and accommodative monetary policies worldwide. Performance generally increased along the risk spectrum, with smaller-cap and growth strategies leading the way. An ebullient market helped the growth-oriented Nasdaq Composite Index® to a 38.10% period gain, for example. On the other hand, both cyclical and defensive stocks had representation in the top-performing industry sectors: returns were highest in health care and consumer discretionary; lowest in utilities and telecommunication services. From a macroeconomic perspective, data still points to slow but steady improvement in the U.S., and Europe's recession may well be over. Reports from China have disappointed, but continue to suggest a relatively soft landing there. Mixed signals from the U.S. Federal Reserve as to when it might curtail its stimulative bond buying kept markets in flux during the spring and summer. Stocks regained momentum in October despite a federal budget impasse and brief government shutdown, and lower volatility prevailed through year-end. Shedding new-year concerns about China's economy, an emerging-markets sell-off and confirmation (at last) of Fed tapering - alongside confirmation of a presumably dovish Janet Yellen as new Fed chair - February saw stocks back in record territory, bearing down on the five-year anniversary of the market's bottom.
Comments from Rajiv Kaul, Portfolio Manager of Biotechnology Portfolio: For the year, the fund returned 84.25%, topping the 78.72% gain of its industry benchmark, the MSCI U.S. IMI Biotechnology 25-50 Index, and more than tripling the return of the broadly based S&P 500®. As a group, biotechnology stocks delivered outstanding performance, spurred by favorable product stories and investors' preference for companies with earnings growth that was less dependent on the broader U.S. economy. Compared with the MSCI industry index, stock selection in the small-cap area had the most favorable impact on the fund's performance. The top relative contributor by far was Intercept Pharmaceuticals. This stock rocketed higher in January, after the firm announced successful results from a study of obeticholic acid, or OCA, as a treatment for a form of chronic liver disease. I aggressively added to the fund's stake here, making Intercept the fund's fourth-largest holding by period end. Also lifting the fund's results was ACADIA Pharmaceuticals. In this case, the stock had been moving higher since November 2012, following the announcement of positive phase three clinical data on pimavanserin, a treatment for Parkinson's disease psychosis. Elsewhere, a takeover bid from biotech heavyweight Amgen at the beginning of July significantly lifted the share price of Onyx Pharmaceuticals and made the latter a meaningful contributor as well. I sold Onyx in August to lock in profits. I'll also mention a non-index position in Karyopharm Therapeutics, a stock that debuted in November and more than doubled in value by period end. Conversely, overweighting Ironwood Pharmaceuticals worked against us, as expectations for its recently launched drug LINZESS®, a treatment for irritable bowel syndrome, got ahead of sales, which were reasonably strong but not what the market had been hoping for. Also hampering performance was overweighted exposure to Spectrum Pharmaceuticals.
The views expressed above reflect those of the portfolio manager(s) only through the end of the period as stated on the cover of this report and do not necessarily represent the views of Fidelity or any other person in the Fidelity organization. Any such views are subject to change at any time based upon market or other conditions and Fidelity disclaims any responsibility to update such views. These views may not be relied on as investment advice and, because investment decisions for a Fidelity fund are based on numerous factors, may not be relied on as an indication of trading intent on behalf of any Fidelity fund.
Annual Report
Biotechnology Portfolio
Investment Changes (Unaudited)
Top Ten Stocks as of February 28, 2014 | ||
| % of fund's | % of fund's net assets |
Gilead Sciences, Inc. | 13.3 | 14.7 |
Amgen, Inc. | 9.2 | 13.4 |
Biogen Idec, Inc. | 6.7 | 6.2 |
Intercept Pharmaceuticals, Inc. | 4.9 | 0.5 |
Alexion Pharmaceuticals, Inc. | 4.5 | 4.0 |
Celgene Corp. | 4.2 | 7.3 |
Regeneron Pharmaceuticals, Inc. | 3.8 | 3.6 |
Vertex Pharmaceuticals, Inc. | 3.0 | 3.3 |
BioMarin Pharmaceutical, Inc. | 1.7 | 1.7 |
Pharmacyclics, Inc. | 1.7 | 2.4 |
| 53.0 | |
Top Industries (% of fund's net assets) | |||
As of February 28, 2014 | |||
 | Biotechnology | 95.7% |
|
 | Pharmaceuticals | 3.9% |
|
 | Life Sciences Tools & Services | 0.1% |
|
 | Health Care Equipment & Supplies | 0.0%† |
|
 | Personal Products | 0.0%† |
|
 | All Others* | 0.3% |
|

As of August 31, 2013 | |||
| Biotechnology | 97.6% |
|
| Pharmaceuticals | 2.1% |
|
| Health Care Providers & Services | 0.1% |
|
| Life Sciences Tools & Services | 0.1% |
|
| Health Care Equipment & Supplies | 0.0%† |
|
| All Others* | 0.1% |
|

* Includes short-term investments and net other assets (liabilities). |
† Amount represents less than 0.1% |
Annual Report
Biotechnology Portfolio
Investments February 28, 2014
Showing Percentage of Net Assets
Common Stocks - 99.3% | |||
Shares | Value | ||
BIOTECHNOLOGY - 95.5% | |||
Biotechnology - 95.5% | |||
ACADIA Pharmaceuticals, Inc. (a)(d) | 4,205,963 | $ 119,028,753 | |
Acceleron Pharma, Inc. (d)(e) | 2,164,269 | 101,569,144 | |
Acorda Therapeutics, Inc. (a)(e) | 2,317,115 | 84,899,094 | |
ADMA Biologics, Inc. | 399,700 | 3,401,447 | |
Aegerion Pharmaceuticals, Inc. (a)(d)(e) | 2,173,495 | 119,020,586 | |
Agenus, Inc. (a)(d) | 150,089 | 733,935 | |
Agenus, Inc. warrants 1/9/18 (a)(g) | 1,548,000 | 228,732 | |
Agios Pharmaceuticals, Inc. (d) | 68,333 | 2,136,090 | |
Agios Pharmaceuticals, Inc. (f) | 83,457 | 2,608,866 | |
Alexion Pharmaceuticals, Inc. (a) | 2,781,842 | 491,829,666 | |
Alkermes PLC (a) | 2,082,594 | 101,359,850 | |
Alnylam Pharmaceuticals, Inc. (a) | 1,595,818 | 129,644,254 | |
AMAG Pharmaceuticals, Inc. (a)(d) | 739,909 | 15,338,314 | |
Ambit Biosciences Corp. | 806,137 | 8,794,955 | |
Amgen, Inc. | 8,147,681 | 1,010,475,398 | |
Anacor Pharmaceuticals, Inc. (a) | 152,715 | 2,901,585 | |
Arena Pharmaceuticals, Inc. (a)(d) | 53,045 | 345,323 | |
ARIAD Pharmaceuticals, Inc. (a)(d) | 9,117,251 | 79,228,911 | |
ArQule, Inc. (a) | 8,342 | 18,770 | |
Array BioPharma, Inc. (a) | 3,855,096 | 18,581,563 | |
Arrowhead Research Corp. (a)(d)(e) | 3,109,885 | 60,456,164 | |
Auspex Pharmaceuticals, Inc. | 356,180 | 8,797,646 | |
Biogen Idec, Inc. (a) | 2,168,789 | 738,863,037 | |
BioMarin Pharmaceutical, Inc. (a) | 2,294,144 | 185,825,664 | |
Bionovo, Inc. warrants 2/2/16 (a) | 1,043,150 | 9,086 | |
Bluebird Bio, Inc. | 181,419 | 4,626,185 | |
Cara Therapeutics, Inc. | 610,950 | 11,534,736 | |
Catalyst Pharmaceutical Partners, Inc.: | |||
warrants 5/2/17 (a) | 141,443 | 138,072 | |
warrants 5/30/17 (a) | 282,100 | 347,254 | |
Celgene Corp. (a) | 2,875,102 | 462,172,647 | |
Cell Therapeutics, Inc. (a)(d) | 3,168,223 | 12,197,659 | |
Cell Therapeutics, Inc. warrants 7/6/16 (a) | 835,596 | 155,613 | |
Celldex Therapeutics, Inc. (a)(d) | 3,017,584 | 88,173,804 | |
Cellectar Biosciences, Inc. (a) | 2,334,890 | 912,942 | |
Cepheid, Inc. (a)(d) | 638,300 | 34,251,178 | |
Chimerix, Inc. | 134,308 | 2,686,160 | |
Clovis Oncology, Inc. (a) | 928,369 | 73,916,740 | |
Cubist Pharmaceuticals, Inc. (a) | 1,542,419 | 122,653,159 | |
Curis, Inc. (a)(d) | 3,562,162 | 10,864,594 | |
Cytokinetics, Inc. (a) | 1,063,466 | 10,475,140 | |
Cytokinetics, Inc. warrants 6/25/17 (a) | 3,828,480 | 1,813,283 | |
Dendreon Corp. (a)(d) | 887,140 | 2,554,963 | |
Dicerna Pharmaceuticals, Inc. | 98,900 | 3,631,608 | |
Dyax Corp. (a)(e) | 10,144,763 | 98,099,858 | |
Dynavax Technologies Corp. (a) | 53,843 | 100,148 | |
Eleven Biotherapeutics, Inc. | 639,460 | 10,359,252 | |
Emergent BioSolutions, Inc. (a) | 292,700 | 7,241,398 | |
| |||
Shares | Value | ||
Enanta Pharmaceuticals, Inc. (e) | 999,266 | $ 36,812,959 | |
Epizyme, Inc. (d)(e) | 3,064,650 | 91,633,035 | |
Esperion Therapeutics, Inc. (d) | 78,392 | 1,218,996 | |
Exact Sciences Corp. (a)(d) | 1,393,802 | 18,746,637 | |
Exelixis, Inc. (a)(d) | 1,849,687 | 13,058,790 | |
Fate Therapeutics, Inc. | 1,381,284 | 8,913,426 | |
Fibrocell Science, Inc. (a)(d)(e) | 3,326,640 | 18,928,582 | |
Genmab A/S (a) | 855,776 | 38,653,565 | |
Genocea Biosciences, Inc. | 470,400 | 6,900,768 | |
Genomic Health, Inc. (a) | 558,528 | 14,750,724 | |
Geron Corp. (a)(e) | 15,448,486 | 73,457,551 | |
Gilead Sciences, Inc. (a) | 17,774,703 | 1,471,567,659 | |
Halozyme Therapeutics, Inc. (a)(d) | 3,025,923 | 42,635,255 | |
Heron Therapeutics, Inc. (a) | 254,266 | 3,567,352 | |
Hyperion Therapeutics, Inc. (a)(d)(e) | 1,999,059 | 61,970,829 | |
Idenix Pharmaceuticals, Inc. (a)(d) | 179,922 | 1,227,068 | |
Ignyta, Inc. | 43,400 | 388,430 | |
ImmunoGen, Inc. (a)(d) | 1,586,457 | 26,017,895 | |
Immunomedics, Inc. (a)(d) | 3,014,504 | 14,288,749 | |
Incyte Corp. (a) | 2,536,251 | 162,979,489 | |
Infinity Pharmaceuticals, Inc. (a) | 1,434,533 | 22,493,477 | |
Insys Therapeutics, Inc. (a) | 540,319 | 36,352,662 | |
Intercept Pharmaceuticals, Inc. (a)(e) | 1,315,567 | 540,040,254 | |
InterMune, Inc. (a)(d)(e) | 4,548,064 | 136,623,843 | |
Intrexon Corp. (d) | 300,349 | 7,803,067 | |
Ironwood Pharmaceuticals, Inc. Class A (a)(d) | 4,692,810 | 68,092,673 | |
Isis Pharmaceuticals, Inc. (a)(d) | 2,326,787 | 118,666,137 | |
KaloBios Pharmaceuticals, Inc. | 1,512,664 | 4,916,158 | |
Karyopharm Therapeutics, Inc. (d)(e) | 2,055,682 | 82,515,075 | |
Keryx Biopharmaceuticals, Inc. (a)(d) | 2,473,263 | 39,695,871 | |
Kindred Biosciences, Inc. | 119,650 | 2,699,304 | |
KYTHERA Biopharmaceuticals, Inc. (a)(d)(e) | 1,304,079 | 65,164,828 | |
Lexicon Pharmaceuticals, Inc. (a) | 10,295,323 | 18,428,628 | |
Ligand Pharmaceuticals, Inc. Class B (a)(e) | 1,497,001 | 104,415,820 | |
Macrogenics, Inc. | 1,171,880 | 41,015,800 | |
MannKind Corp. (a)(d) | 8,724,206 | 54,002,835 | |
Medivation, Inc. (a) | 2,394,585 | 172,194,607 | |
Merrimack Pharmaceuticals, Inc. (a)(d) | 422,049 | 2,101,804 | |
MiMedx Group, Inc. (a) | 1,088,864 | 7,785,378 | |
Mirati Therapeutics, Inc. (a) | 198,700 | 4,834,371 | |
Momenta Pharmaceuticals, Inc. (a) | 1,149,777 | 17,016,700 | |
Myriad Genetics, Inc. (a)(d) | 1,978,943 | 71,657,526 | |
Neurocrine Biosciences, Inc. (a) | 2,981,368 | 52,561,518 | |
NewLink Genetics Corp. (a)(d)(e) | 1,791,947 | 79,204,057 | |
Novavax, Inc. (a)(d)(e) | 15,593,121 | 99,795,974 | |
Novelos Therapeutics, Inc. warrants 12/6/16 (a) | 2,362,400 | 425 | |
NPS Pharmaceuticals, Inc. (a) | 2,457,213 | 85,953,311 | |
OncoMed Pharmaceuticals, Inc. (d) | 175,400 | 6,054,808 | |
Common Stocks - continued | |||
Shares | Value | ||
BIOTECHNOLOGY - CONTINUED | |||
Biotechnology - continued | |||
Onconova Therapeutics, Inc. (d) | 430,114 | $ 3,655,969 | |
Ophthotech Corp. (d)(e) | 1,898,926 | 63,936,838 | |
Opko Health, Inc. (a)(d) | 3,977,909 | 37,869,694 | |
Oragenics, Inc. (a)(e) | 2,616,358 | 9,785,179 | |
Orexigen Therapeutics, Inc. (a)(d)(e) | 6,034,709 | 41,880,880 | |
Organovo Holdings, Inc. (a)(d) | 1,753,017 | 18,021,015 | |
Osiris Therapeutics, Inc. (a)(d)(e) | 2,020,095 | 30,846,851 | |
OvaScience, Inc. (a) | 212,300 | 2,290,717 | |
PDL BioPharma, Inc. (d) | 260,333 | 2,231,054 | |
Pharmacyclics, Inc. (a) | 1,321,213 | 183,199,395 | |
PolyMedix, Inc. (a)(e) | 115,509 | 3,003 | |
PolyMedix, Inc. warrants 4/10/16 (a)(e) | 2,961,167 | 30 | |
Portola Pharmaceuticals, Inc. | 1,502,087 | 36,635,902 | |
Prana Biotechnology Ltd. ADR (a)(d) | 914,134 | 10,338,856 | |
Progenics Pharmaceuticals, Inc. (a)(e) | 3,852,060 | 17,989,120 | |
Prosensa Holding BV (a) | 205,163 | 1,347,921 | |
Protalix BioTherapeutics, Inc. (a)(d) | 1,055,842 | 5,099,717 | |
Prothena Corp. PLC (a) | 371,132 | 13,364,463 | |
PTC Therapeutics, Inc. (a)(d)(e) | 1,556,944 | 48,825,764 | |
Puma Biotechnology, Inc. (a) | 970,866 | 112,872,881 | |
Raptor Pharmaceutical Corp. (a)(d)(e) | 3,086,957 | 48,866,529 | |
Receptos, Inc. (e) | 1,328,183 | 61,607,768 | |
Regeneron Pharmaceuticals, Inc. (a) | 1,262,849 | 419,897,293 | |
Regulus Therapeutics, Inc. (a)(d) | 1,600,001 | 17,968,011 | |
Rigel Pharmaceuticals, Inc. (a) | 15,551 | 53,495 | |
Sangamo Biosciences, Inc. (a)(d)(e) | 4,581,918 | 83,390,908 | |
Sarepta Therapeutics, Inc. (a)(d) | 947,632 | 27,509,757 | |
Seattle Genetics, Inc. (a)(d) | 1,983,060 | 104,289,125 | |
Sophiris Bio, Inc. (a)(e) | 1,289,615 | 5,264,210 | |
Sorrento Therapeutics, Inc. (a)(g) | 471,200 | 5,428,224 | |
Sorrento Therapeutics, Inc. (a) | 133,000 | 1,532,160 | |
Spectrum Pharmaceuticals, Inc. (a)(d)(e) | 4,223,900 | 35,269,565 | |
Stemline Therapeutics, Inc. (e) | 1,243,399 | 32,154,298 | |
Sunesis Pharmaceuticals, Inc. (a)(d) | 2,824,764 | 18,502,204 | |
Synageva BioPharma Corp. (a)(d) | 508,324 | 58,289,513 | |
Synergy Pharmaceuticals, Inc. (a)(d) | 2,411,172 | 14,635,814 | |
Synergy Pharmaceuticals, Inc. warrants 11/14/16 (a) | 354,400 | 1,045,480 | |
Synta Pharmaceuticals Corp. (a)(d) | 3,520,817 | 21,758,649 | |
Synthetic Biologics, Inc. (a) | 900 | 2,430 | |
TESARO, Inc. (a) | 1,160,015 | 38,292,095 | |
Theravance, Inc. (a)(d) | 1,287,856 | 47,650,672 | |
Threshold Pharmaceuticals, Inc. (a) | 1,262,685 | 6,313,425 | |
Threshold Pharmaceuticals, Inc. warrants 3/16/16 (a) | 631,520 | 1,713,244 | |
UniQure B.V. | 201,114 | 3,318,381 | |
United Therapeutics Corp. (a) | 1,155,709 | 117,212,007 | |
Verastem, Inc. (a)(d)(e) | 1,453,933 | 19,439,084 | |
Vertex Pharmaceuticals, Inc. (a) | 4,075,800 | 329,569,188 | |
| |||
Shares | Value | ||
Vical, Inc. (a)(e) | 6,407,245 | $ 9,739,012 | |
Xencor, Inc. | 1,494,900 | 16,802,676 | |
XOMA Corp. (a) | 4,689,019 | 39,200,199 | |
ZIOPHARM Oncology, Inc. (a)(d) | 3,811,792 | 16,238,234 | |
| 10,537,956,795 | ||
HEALTH CARE EQUIPMENT & SUPPLIES - 0.0% | |||
Health Care Equipment - 0.0% | |||
Alsius Corp. (a) | 314,300 | 3 | |
Aradigm Corp. (a) | 6,398,160 | 1,727,503 | |
InVivo Therapeutics Holdings Corp. (a) | 1,004,700 | 2,612,220 | |
| 4,339,726 | ||
LIFE SCIENCES TOOLS & SERVICES - 0.1% | |||
Life Sciences Tools & Services - 0.1% | |||
BG Medicine, Inc. (a)(d) | 1,177,641 | 1,530,933 | |
ChromaDex, Inc. (a)(d) | 2,195,100 | 3,775,572 | |
Transgenomic, Inc. (a)(g) | 236,500 | 1,217,975 | |
Transgenomic, Inc. (a) | 46,240 | 238,136 | |
Transgenomic, Inc. warrants 2/3/17 (a)(g) | 1,419,000 | 14 | |
| 6,762,630 | ||
PERSONAL PRODUCTS - 0.0% | |||
Personal Products - 0.0% | |||
MYOS Corp. (a)(g) | 33,334 | 296,673 | |
PHARMACEUTICALS - 3.7% | |||
Pharmaceuticals - 3.7% | |||
AcelRx Pharmaceuticals, Inc. (a)(d) | 654,629 | 7,482,409 | |
Auxilium Pharmaceuticals, Inc. (a) | 1,087,121 | 33,428,971 | |
AVANIR Pharmaceuticals Class A (a)(e) | 10,558,013 | 43,921,334 | |
ContraVir Pharmaceuticals, Inc. (a)(d) | 237,733 | 370,863 | |
Egalet Corp. | 697,800 | 8,980,686 | |
Horizon Pharma, Inc. (a)(d)(e) | 3,430,767 | 41,923,973 | |
Horizon Pharma, Inc.: | |||
warrants 2/28/17 (a)(e) | 319,539 | 2,561,134 | |
warrants 9/25/17 (a)(e) | 759,050 | 5,935,680 | |
Intra-Cellular Therapies, Inc. (e) | 1,536,950 | 24,944,699 | |
Jazz Pharmaceuticals PLC (a) | 319,665 | 48,571,498 | |
NeurogesX, Inc. (a)(e) | 3,131,785 | 31,318 | |
Pacira Pharmaceuticals, Inc. (a) | 1,026,533 | 80,315,942 | |
Perrigo Co. PLC | 549 | 90,278 | |
Relypsa, Inc. | 1,154,961 | 45,574,761 | |
Repros Therapeutics, Inc. (a)(d) | 776,100 | 15,172,755 | |
TherapeuticsMD, Inc. (a) | 1,330,507 | 9,140,583 | |
Zogenix, Inc. (a)(e) | 9,804,706 | 42,650,471 | |
Zogenix, Inc. warrants 7/27/17 (a)(e) | 498,465 | 433,839 | |
| 411,531,194 | ||
TOTAL COMMON STOCKS (Cost $6,078,386,625) |
| ||
Preferred Stocks - 0.4% | |||
Shares | Value | ||
Convertible Preferred Stocks - 0.3% | |||
BIOTECHNOLOGY - 0.1% | |||
Biotechnology - 0.1% | |||
Versartis, Inc. Series E (g) | 7,746,596 | $ 8,738,160 | |
Xenon Pharmaceuticals, Inc. Series E (a)(g) | 981,626 | 4,476,215 | |
| 13,214,375 | ||
PHARMACEUTICALS - 0.2% | |||
Pharmaceuticals - 0.2% | |||
aTyr Pharma, Inc. 8.00% (g) | 3,455,296 | 8,738,444 | |
Zafgen, Inc. Series E (g) | 5,172,990 | 11,238,321 | |
| 19,976,765 | ||
TOTAL CONVERTIBLE PREFERRED STOCKS | 33,191,140 | ||
Nonconvertible Preferred Stocks - 0.1% | |||
BIOTECHNOLOGY - 0.1% | |||
Biotechnology - 0.1% | |||
Moderna LLC Series D, 8.00% (g) | 207,494 | 4,425,847 | |
PHARMACEUTICALS - 0.0% | |||
Pharmaceuticals - 0.0% | |||
Equilibrate Asia Therapeutics Series D (g) | 3,661,108 | 59,749 | |
Equilibrate Worldwide Therapeutics Series D (g) | 3,661,108 | 147,067 | |
Neuropathic Worldwide Therapeutics Series D (g) | 3,661,108 | 27,568 | |
Oculus Worldwide Therapeutics Series D (g) | 3,661,108 | 45,947 | |
Orchestrate U.S. Therapeutics, Inc. Series D (g) | 3,661,108 | 64,326 | |
Orchestrate Worldwide Therapeutics Series D (g) | 3,661,108 | 114,886 | |
| 459,543 | ||
TOTAL NONCONVERTIBLE PREFERRED STOCKS | 4,885,390 | ||
TOTAL PREFERRED STOCKS (Cost $40,324,452) |
| ||
Money Market Funds - 7.3% | |||
Shares | Value | ||
Fidelity Cash Central Fund, 0.10% (b) | 69,750,874 | $ 69,750,874 | |
Fidelity Securities Lending Cash Central Fund, 0.09% (b)(c) | 739,482,057 | 739,482,057 | |
TOTAL MONEY MARKET FUNDS (Cost $809,232,931) |
| ||
TOTAL INVESTMENT PORTFOLIO - 107.0% (Cost $6,927,944,008) | 11,808,196,479 | ||
NET OTHER ASSETS (LIABILITIES) - (7.0)% | (774,883,763) | ||
NET ASSETS - 100% | $ 11,033,312,716 | ||
Legend |
(a) Non-income producing |
(b) Affiliated fund that is generally available only to investment companies and other accounts managed by Fidelity Investments. The rate quoted is the annualized seven-day yield of the fund at period end. A complete unaudited listing of the fund's holdings as of its most recent quarter end is available upon request. In addition, each Fidelity Central Fund's financial statements, which are not covered by the Fund's Report of Independent Registered Public Accounting Firm, are available on the SEC's website or upon request. |
(c) Investment made with cash collateral received from securities on loan. |
(d) Security or a portion of the security is on loan at period end. |
(e) Affiliated company |
(f) Security exempt from registration under Rule 144A of the Securities Act of 1933. These securities may be resold in transactions exempt from registration, normally to qualified institutional buyers. At the end of the period, the value of these securities amounted to $2,608,866 or 0.0% of net assets. |
(g) Restricted securities - Investment in securities not registered under the Securities Act of 1933 (excluding 144A issues). At the end of the period, the value of restricted securities (excluding 144A issues) amounted to $45,248,148 or 0.4% of net assets. |
Additional information on each restricted holding is as follows: |
Security | Acquisition Date | Acquisition Cost |
Agenus, Inc. warrants 1/9/18 | 1/9/08 | $ 1,930,622 |
aTyr Pharma, Inc. 8.00% | 4/8/13 - 5/17/13 | $ 8,738,444 |
Equilibrate Asia Therapeutics Series D | 5/17/13 | $ 59,749 |
Equilibrate Worldwide Therapeutics Series D | 5/17/13 | $ 147,067 |
Moderna LLC Series D, 8.00% | 11/6/13 | $ 4,425,847 |
MYOS Corp. | 7/2/12 | $ 416,675 |
Security | Acquisition Date | Acquisition Cost |
Neuropathic Worldwide Therapeutics Series D | 5/17/13 | $ 27,568 |
Oculus Worldwide Therapeutics Series D | 5/17/13 | $ 45,947 |
Orchestrate U.S. Therapeutics, Inc. Series D | 5/17/13 | $ 64,326 |
Orchestrate Worldwide Therapeutics Series D | 5/17/13 | $ 114,886 |
Sorrento Therapeutics, Inc. | 5/15/12 | $ 1,884,800 |
Transgenomic, Inc. | 2/3/12 | $ 2,828,200 |
Transgenomic, Inc. warrants 2/3/17 | 2/3/12 | $ 9,800 |
Versartis, Inc. Series E | 2/14/14 | $ 8,738,160 |
Xenon Pharmaceuticals, Inc. Series E | 3/23/01 | $ 6,724,138 |
Zafgen, Inc. Series E | 11/25/13 | $ 11,238,321 |
Affiliated Central Funds |
Information regarding fiscal year to date income earned by the Fund from investments in Fidelity Central Funds is as follows: |
Fund | Income earned |
Fidelity Cash Central Fund | $ 43,216 |
Fidelity Securities Lending Cash Central Fund | 12,562,635 |
Total | $ 12,605,851 |
Other Affiliated Issuers |
An affiliated company is a company in which the Fund has ownership of at least 5% of the voting securities. Fiscal year to date transactions with companies which are or were affiliates are as follows: |
Affiliate | Value, | Purchases | Sales | Dividend | Value, |
Acceleron Pharma, Inc. | $ - | $ 61,220,714 | $ - | $ - | $ 101,569,144 |
Acorda Therapeutics, Inc. | 42,491,985 | 30,030,450 | - | - | 84,899,094 |
Aegerion Pharmaceuticals, Inc. | 59,281,220 | 57,064,799 | 51,857,257 | - | 119,020,586 |
Agenus, Inc. | 642,381 | - | - | - | - |
Agenus, Inc. warrants 1/9/18 | 78,596 | - | - | - | - |
Arrowhead Research Corp. | - | 51,296,146 | - | - | 60,456,164 |
AVANIR Pharmaceuticals Class A | 13,567,786 | 19,987,853 | - | - | 43,921,334 |
Cell Therapeutics, Inc. | 8,945,719 | - | 9,356,172 | - | - |
Cell Therapeutics, Inc. warrants 7/6/16 | 20,931 | - | - | - | - |
Coronado Biosciences, Inc. | - | 18,641,698 | 4,602,336 | - | - |
Cytokinetics, Inc. | 6,368,038 | - | - | - | - |
Cytokinetics, Inc. warrants 6/25/17 | 393,737 | - | - | - | - |
Dyax Corp. | 12,120,655 | 53,384,996 | 7,463,884 | - | 98,099,858 |
Enanta Pharmaceuticals, Inc. | - | 39,985,297 | 3,549,927 | - | 36,812,959 |
Epizyme, Inc. | - | 78,891,646 | - | - | 91,633,035 |
Fibrocell Science, Inc. | 9,272,915 | 3,667,040 | - | - | 18,928,582 |
Geron Corp. | 8,274,163 | 58,294,010 | 7,955,186 | - | 73,457,551 |
Horizon Pharma, Inc. | 3,392,458 | 12,207,223 | - | - | 41,923,973 |
Horizon Pharma, Inc. warrants 2/28/17 | 15 | - | - | - | 2,561,134 |
Horizon Pharma, Inc. warrants 9/25/17 | 36 | - | - | - | 5,935,680 |
Hyperion Therapeutics, Inc. | - | 46,879,521 | - | - | 61,970,829 |
Intercept Pharmaceuticals, Inc. | 4,597,883 | 58,319,907 | - | - | 540,040,254 |
InterMune, Inc. | 28,143,738 | 40,670,212 | - | - | 136,623,843 |
Intra-Cellular Therapies, Inc. | - | 16,539,723 | - | - | 24,944,699 |
Karyopharm Therapeutics, Inc. | - | 37,058,073 | - | - | 82,515,075 |
KYTHERA Biopharmaceuticals, Inc. | - | 51,350,080 | - | - | 65,164,828 |
Affiliate | Value, | Purchases | Sales | Dividend | Value, |
Ligand Pharmaceuticals, Inc. Class B | $ 9,019,689 | $ 37,667,095 | $ - | $ - | $ 104,415,820 |
NeurogesX, Inc. | 845,582 | - | - | - | 31,318 |
NewLink Genetics Corp. | 8,314,975 | 29,474,174 | - | - | 79,204,057 |
Novavax, Inc. | 13,380,647 | 38,710,067 | - | - | 99,795,974 |
Novelos Therapeutics, Inc. | 1,144,096 | - | - | - | - |
Novelos Therapeutics, Inc. warrants 12/6/16 | 23,713 | - | - | - | - |
Ophthotech Corp. | - | 52,319,211 | - | - | 63,936,838 |
Oragenics, Inc. | 5,390,881 | 2,645,750 | - | - | 9,785,179 |
Orexigen Therapeutics, Inc. | 15,372,407 | 41,444,885 | 14,245,482 | - | 41,880,880 |
Osiris Therapeutics, Inc. | 2,851,890 | 28,257,412 | - | - | 30,846,851 |
PolyMedix, Inc. | 698,828 | - | - | - | 3,003 |
PolyMedix, Inc. warrants 4/10/16 | 4,541 | - | - | - | 30 |
Progenics Pharmaceuticals, Inc. | 11,847,515 | 14,774,742 | 18,654,358 | - | 17,989,120 |
PTC Therapeutics, Inc. | - | 37,754,122 | 7,077,168 | - | 48,825,764 |
Raptor Pharmaceutical Corp. | 7,318,718 | 9,155,046 | - | - | 48,866,529 |
Receptos, Inc. | - | 49,555,966 | 5,743,638 | - | 61,607,768 |
Sangamo Biosciences, Inc. | 19,381,686 | 38,195,740 | 2,264,477 | - | 83,390,908 |
Sophiris Bio, Inc. | - | 6,305,000 | 88,563 | - | 5,264,210 |
Spectrum Pharmaceuticals, Inc. | 39,774,600 | 7,913,424 | 2,109,435 | - | 35,269,565 |
Stemline Therapeutics, Inc. | 5,884,230 | 14,212,900 | - | - | 32,154,298 |
Targacept, Inc. | 5,509,566 | 4,261,692 | 10,108,560 | - | - |
Verastem, Inc. | 898,357 | 19,740,622 | - | - | 19,439,084 |
Vical, Inc. | 12,922,016 | 8,780,477 | - | - | 9,739,012 |
Zogenix, Inc. | 2,701,510 | 15,232,983 | 217,706 | - | 42,650,471 |
Zogenix, Inc. warrants 7/27/17 | 5,428 | - | - | - | 433,839 |
Total | $ 360,883,131 | $ 1,191,890,696 | $ 145,294,149 | $ - | $ 2,526,009,140 |
Other Information |
The following is a summary of the inputs used, as of February 28, 2014, involving the Fund's assets and liabilities carried at fair value. The inputs or methodology used for valuing securities may not be an indication of the risk associated with investing in those securities. For more information on valuation inputs, and their aggregation into the levels used in the table below, please refer to the Investment Valuation section in the accompanying Notes to Financial Statements. |
Valuation Inputs at Reporting Date: | ||||
Description | Total | Level 1 | Level 2 | Level 3 |
Investments in Securities: | ||||
Common Stocks | $ 10,960,887,018 | $ 10,933,372,973 | $ 22,249,832 | $ 5,264,213 |
Preferred Stocks | 38,076,530 | - | - | 38,076,530 |
Money Market Funds | 809,232,931 | 809,232,931 | - | - |
Total Investments in Securities: | $ 11,808,196,479 | $ 11,742,605,904 | $ 22,249,832 | $ 43,340,743 |
See accompanying notes which are an integral part of the financial statements.
Annual Report
Biotechnology Portfolio
Financial Statements
Statement of Assets and Liabilities
| February 28, 2014 | |
|
|
|
Assets | ||
Investment in securities, at value (including securities loaned of $689,922,272) - See accompanying schedule: Unaffiliated issuers (cost $4,745,657,233) | $ 8,472,954,408 |
|
Fidelity Central Funds (cost $809,232,931) | 809,232,931 |
|
Other affiliated issuers (cost $1,373,053,844) | 2,526,009,140 |
|
Total Investments (cost $6,927,944,008) |
| $ 11,808,196,479 |
Receivable for investments sold | 42,414,295 | |
Receivable for fund shares sold | 68,303,938 | |
Dividends receivable | 4,544,413 | |
Distributions receivable from Fidelity Central Funds | 1,502,243 | |
Prepaid expenses | 33,279 | |
Other receivables | 168,539 | |
Total assets | 11,925,163,186 | |
|
|
|
Liabilities | ||
Payable for investments purchased | $ 122,711,748 | |
Payable for fund shares redeemed | 23,330,902 | |
Accrued management fee | 4,727,650 | |
Other affiliated payables | 1,298,656 | |
Other payables and accrued expenses | 299,457 | |
Collateral on securities loaned, at value | 739,482,057 | |
Total liabilities | 891,850,470 | |
|
|
|
Net Assets | $ 11,033,312,716 | |
Net Assets consist of: |
| |
Paid in capital | $ 6,197,551,101 | |
Accumulated net investment loss | (2,984,590) | |
Accumulated undistributed net realized gain (loss) on investments and foreign currency transactions | (41,506,266) | |
Net unrealized appreciation (depreciation) on investments | 4,880,252,471 | |
Net Assets, for 49,823,663 shares outstanding | $ 11,033,312,716 | |
Net Asset Value, offering price and redemption price per share ($11,033,312,716 ÷ 49,823,663 shares) | $ 221.45 | |
Statement of Operations
| Year ended February 28, 2014 | |
|
|
|
Investment Income |
|
|
Dividends |
| $ 16,098,759 |
Interest |
| 29,593 |
Income from Fidelity Central Funds (including $12,562,635 from security lending) |
| 12,605,851 |
Total income |
| 28,734,203 |
|
|
|
Expenses | ||
Management fee | $ 36,804,051 | |
Transfer agent fees | 11,290,960 | |
Accounting and security lending fees | 1,246,798 | |
Custodian fees and expenses | 71,384 | |
Independent trustees' compensation | 128,844 | |
Registration fees | 719,349 | |
Audit | 53,055 | |
Legal | 92,077 | |
Interest | 9,813 | |
Miscellaneous | 57,674 | |
Total expenses before reductions | 50,474,005 | |
Expense reductions | (383,166) | 50,090,839 |
Net investment income (loss) | (21,356,636) | |
Realized and Unrealized Gain (Loss) Net realized gain (loss) on: | ||
Investment securities: |
|
|
Unaffiliated issuers | 14,130,956 | |
Other affiliated issuers | (8,037,870) |
|
Foreign currency transactions | (18,781) | |
Total net realized gain (loss) |
| 6,074,305 |
Change in net unrealized appreciation (depreciation) on investment securities | 4,047,853,105 | |
Net gain (loss) | 4,053,927,410 | |
Net increase (decrease) in net assets resulting from operations | $ 4,032,570,774 | |
See accompanying notes which are an integral part of the financial statements.
Annual Report
Statement of Changes in Net Assets
| Year ended | Year ended |
Increase (Decrease) in Net Assets |
|
|
Operations |
|
|
Net investment income (loss) | $ (21,356,636) | $ (3,565,629) |
Net realized gain (loss) | 6,074,305 | 28,880,064 |
Change in net unrealized appreciation (depreciation) | 4,047,853,105 | 605,920,510 |
Net increase (decrease) in net assets resulting from operations | 4,032,570,774 | 631,234,945 |
Distributions to shareholders from net realized gain | (19,359,860) | (122,210,105) |
Share transactions | 6,286,734,102 | 2,048,861,225 |
Reinvestment of distributions | 18,562,365 | 115,347,882 |
Cost of shares redeemed | (2,736,980,053) | (964,521,211) |
Net increase (decrease) in net assets resulting from share transactions | 3,568,316,414 | 1,199,687,896 |
Redemption fees | 1,059,947 | 182,621 |
Total increase (decrease) in net assets | 7,582,587,275 | 1,708,895,357 |
|
|
|
Net Assets | ||
Beginning of period | 3,450,725,441 | 1,741,830,084 |
End of period (including accumulated net investment loss of $2,984,590 and accumulated net investment loss of $1,465, respectively) | $ 11,033,312,716 | $ 3,450,725,441 |
Other Information Shares | ||
Sold | 37,746,580 | 18,573,347 |
Issued in reinvestment of distributions | 106,764 | 1,211,311 |
Redeemed | (16,664,868) | (8,962,811) |
Net increase (decrease) | 21,188,476 | 10,821,847 |
Financial Highlights
Years ended February 28, | 2014 | 2013 | 2012 H | 2011 | 2010 |
Selected Per-Share Data |
|
|
|
|
|
Net asset value, beginning of period | $ 120.51 | $ 97.78 | $ 74.01 | $ 67.83 | $ 54.62 |
Income from Investment Operations |
|
|
|
|
|
Net investment income (loss) B | (.54) | (.16) | (.23) | (.41) E | (.39) F |
Net realized and unrealized gain (loss) | 101.91 | 29.36 | 24.11 | 6.59 | 13.60 |
Total from investment operations | 101.37 | 29.20 | 23.88 | 6.18 | 13.21 |
Distributions from net realized gain | (.46) | (6.48) | (.12) | - | - |
Redemption fees added to paid in capital B | .03 | .01 | .01 | - I | - I |
Net asset value, end of period | $ 221.45 | $ 120.51 | $ 97.78 | $ 74.01 | $ 67.83 |
Total Return A | 84.25% | 31.78% | 32.31% | 9.11% | 24.19% |
Ratios to Average Net Assets C, G |
|
|
|
|
|
Expenses before reductions | .76% | .81% | .83% | .87% | .91% |
Expenses net of fee waivers, if any | .76% | .80% | .83% | .87% | .91% |
Expenses net of all reductions | .75% | .79% | .83% | .86% | .91% |
Net investment income (loss) | (.32)% | (.15)% | (.27)% | (.59)% E | (.64)% F |
Supplemental Data |
|
|
|
|
|
Net assets, end of period (000 omitted) | $ 11,033,313 | $ 3,450,725 | $ 1,741,830 | $ 1,012,907 | $ 1,068,656 |
Portfolio turnover rate D | 35% | 42% | 106% | 119% | 109% |
A Total returns would have been lower if certain expenses had not been reduced during the applicable periods shown.
B Calculated based on average shares outstanding during the period.
C Fees and expenses of any underlying Fidelity Central Funds are not included in the Fund's expense ratio. The Fund indirectly bears its proportionate share of the expenses of any underlying Fidelity Central Funds.
D Amount does not include the portfolio activity of any underlying Fidelity Central Funds.
E Investment income per share reflects a large, non-recurring dividend which amounted to $.11 per share. Excluding this non-recurring dividend, the ratio of net investment income (loss) to average net assets would have been (.75)%.
F Investment income per share reflects a large, non-recurring dividend which amounted to $.09 per share. Excluding this non-recurring dividend, the ratio of net investment income (loss) to average net assets would have been (.78)%.
G Expense ratios reflect operating expenses of the Fund. Expenses before reductions do not reflect amounts reimbursed by the investment adviser or reductions from brokerage service arrangements or reductions from other expense offset arrangements and do not represent the amount paid by the Fund during periods when reimbursements or reductions occur. Expenses net of fee waivers reflect expenses after reimbursement by the investment adviser but prior to reductions from brokerage service arrangements or other expense offset arrangements. Expenses net of all reductions represent the net expenses paid by the Fund.
H For the year ended February 29.
I Amount represents less than $.01 per share.
See accompanying notes which are an integral part of the financial statements.
Annual Report
Health Care Portfolio
Performance: The Bottom Line
Average annual total return reflects the change in the value of an investment, assuming reinvestment of the fund's distributions from dividend income and capital gains (the profits earned upon the sale of securities that have grown in value, if any) and assuming a constant rate of performance each year. The $10,000 table and the fund's returns do not reflect the deduction of taxes that a shareholder would pay on fund distributions or the redemption of fund shares. During periods of reimbursement by Fidelity, a fund's total return will be greater than it would be had the reimbursement not occurred. How a fund did yesterday is no guarantee of how it will do tomorrow.
Average Annual Total Returns
Periods ended February 28, 2014 | Past 1 | Past 5 | Past 10 |
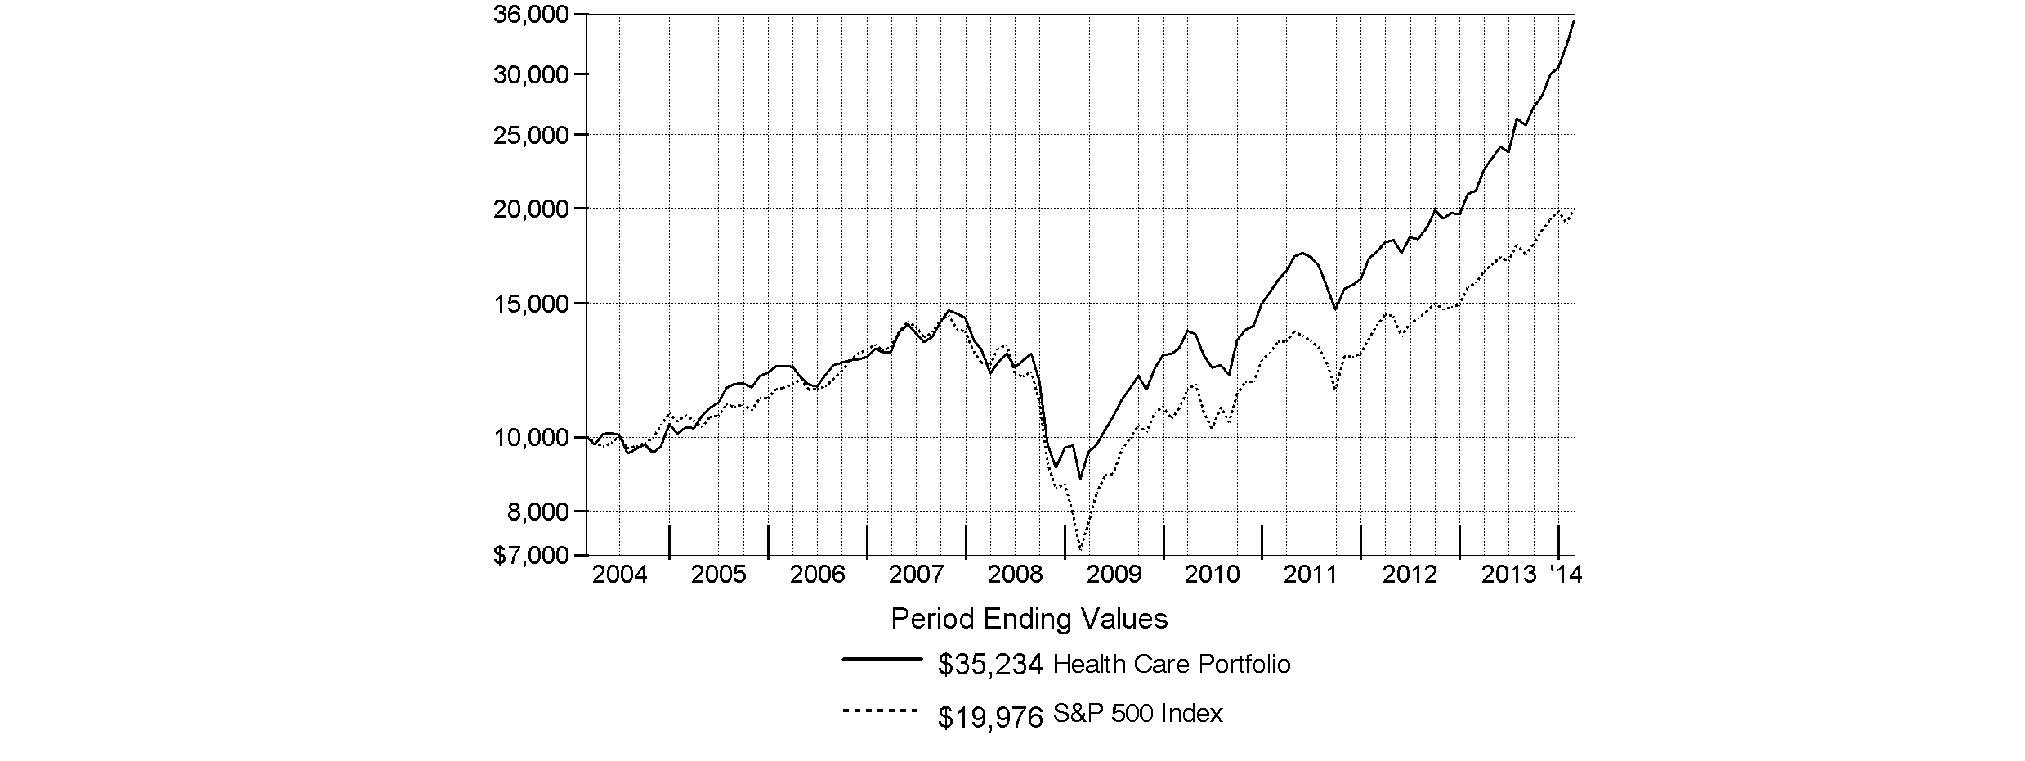
Health Care Portfolio | 67.13% | 31.94% | 13.42% |
$10,000 Over 10 Years
Let's say hypothetically that $10,000 was invested in Health Care Portfolio on February 29, 2004. The chart shows how the value of your investment would have changed, and also shows how the S&P 500 Index performed over the same period.
Annual Report
Health Care Portfolio
Management's Discussion of Fund Performance
Market Recap: Stocks overcame fears of higher interest rates - not to mention their worst January in four years - to finish sharply higher for the 12 months ending February 28, 2014. The broad S&P 500® Index and the blue-chip Dow Jones Industrial AverageSM gained 25.37% and 19.01%, respectively, amid generally favorable earnings reports and accommodative monetary policies worldwide. Performance generally increased along the risk spectrum, with smaller-cap and growth strategies leading the way. An ebullient market helped the growth-oriented Nasdaq Composite Index® to a 38.10% period gain, for example. On the other hand, both cyclical and defensive stocks had representation in the top-performing industry sectors: returns were highest in health care and consumer discretionary; lowest in utilities and telecommunication services. From a macroeconomic perspective, data still points to slow but steady improvement in the U.S., and Europe's recession may well be over. Reports from China have disappointed, but continue to suggest a relatively soft landing there. Mixed signals from the U.S. Federal Reserve as to when it might curtail its stimulative bond buying kept markets in flux during the spring and summer. Stocks regained momentum in October despite a federal budget impasse and brief government shutdown, and lower volatility prevailed through year-end. Shedding new-year concerns about China's economy, an emerging-markets sell-off and confirmation (at last) of Fed tapering - alongside confirmation of a presumably dovish Janet Yellen as new Fed chair - February saw stocks back in record territory, bearing down on the five-year anniversary of the market's bottom.
Comments from Edward Yoon, Portfolio Manager of Health Care Portfolio: For the year, the fund gained 67.13%, beating the 41.64% advance of the MSCI® U.S. IMI Health Care 25-50 Index, as well as the S&P 500®. Health care was the best-performing sector of the broader market over the past 12 months. Investors flocked to its stability early in the period amid a broader move into more-defensive areas, largely driven by ongoing weakness in the global economy. The sector was attractive later in the year as well, as it's less sensitive to overall economic activity and provides the potential for growth, possibly with less volatility than investing in the broad market. Outsized returns from biotechnology stocks helped the sector's strong return, as did an aging global population that continues to fuel demand for medical products and services. Versus the sector benchmark, exceptional stock picking drove the fund's return. We did well with life science tools & services companies, where a top relative contributor was genetic analysis-tool maker Illumina. Elsewhere, stock positions in pharmaceuticals by and large helped the most, especially heavily underweighting and eventually selling large-cap firm Johnson & Johnson. Positioning in biotech also helped, but I did reduce exposure to parts of this market during the period, namely the small-cap segment, where valuations have become more expensive on a risk-adjusted basis versus earlier in 2013. Notable relative detractors were hard to come by this period. The only really noteworthy blow came from stock picking in health care services. Here, I'll mention our non-index stake in Canada-based pharmacy benefit manager (PBM) Catamaran. Near-term uncertainty and decelerating growth weighed on this volatile stock.
The views expressed above reflect those of the portfolio manager(s) only through the end of the period as stated on the cover of this report and do not necessarily represent the views of Fidelity or any other person in the Fidelity organization. Any such views are subject to change at any time based upon market or other conditions and Fidelity disclaims any responsibility to update such views. These views may not be relied on as investment advice and, because investment decisions for a Fidelity fund are based on numerous factors, may not be relied on as an indication of trading intent on behalf of any Fidelity fund.
Annual Report
Health Care Portfolio
Investment Changes (Unaudited)
Top Ten Stocks as of February 28, 2014 | ||
| % of fund's | % of fund's net assets |
Actavis PLC | 5.2 | 4.4 |
Amgen, Inc. | 4.8 | 6.1 |
Alexion Pharmaceuticals, Inc. | 4.5 | 3.6 |
Gilead Sciences, Inc. | 4.1 | 7.6 |
Biogen Idec, Inc. | 3.8 | 4.2 |
McKesson Corp. | 3.7 | 3.3 |
Boston Scientific Corp. | 3.5 | 3.6 |
Illumina, Inc. | 3.3 | 2.2 |
Merck & Co., Inc. | 3.3 | 2.4 |
Bristol-Myers Squibb Co. | 2.9 | 0.5 |
| 39.1 | |
Top Industries (% of fund's net assets) | |||
As of February 28, 2014 | |||
| Biotechnology | 30.0% |
|
| Pharmaceuticals | 28.3% |
|
| Health Care Equipment & Supplies | 14.4% |
|
| Health Care Providers & Services | 11.8% |
|
| Life Sciences Tools & Services | 7.6% |
|
| All Others* | 7.9% |
|

As of August 31, 2013 | |||
| Biotechnology | 33.2% |
|
| Pharmaceuticals | 25.8% |
|
| Health Care Providers & Services | 16.8% |
|
| Health Care Equipment & Supplies | 12.4% |
|
| Health Care Technology | 5.0% |
|
| All Others* | 6.8% |
|

* Includes short-term investments and net other assets (liabilities). |
Annual Report
Health Care Portfolio
Investments February 28, 2014
Showing Percentage of Net Assets
Common Stocks - 98.1% | |||
Shares | Value | ||
BIOTECHNOLOGY - 29.9% | |||
Biotechnology - 29.9% | |||
Actelion Ltd. | 280,000 | $ 29,687,322 | |
Aegerion Pharmaceuticals, Inc. (a) | 355,500 | 19,467,180 | |
Alexion Pharmaceuticals, Inc. (a) | 1,580,000 | 279,344,000 | |
Alnylam Pharmaceuticals, Inc. (a) | 79,800 | 6,482,952 | |
Amgen, Inc. | 2,400,000 | 297,648,000 | |
Array BioPharma, Inc. (a) | 3,000,000 | 14,460,000 | |
Arrowhead Research Corp. (a) | 700,000 | 13,608,000 | |
BioCryst Pharmaceuticals, Inc. (a) | 1,100,000 | 12,859,000 | |
Biogen Idec, Inc. (a) | 690,000 | 235,069,200 | |
Cubist Pharmaceuticals, Inc. (a) | 950,000 | 75,544,000 | |
Discovery Laboratories, Inc. (a) | 3,600,000 | 9,504,000 | |
Dyax Corp. (a) | 1,280,000 | 12,377,600 | |
Genomic Health, Inc. (a) | 750,000 | 19,807,500 | |
Gilead Sciences, Inc. (a) | 3,060,000 | 253,337,400 | |
Grifols SA ADR | 1,400,000 | 58,912,000 | |
Innate Pharma SA (a) | 1,100,000 | 15,942,465 | |
Insmed, Inc. (a) | 807,500 | 16,158,075 | |
Intercept Pharmaceuticals, Inc. (a) | 220,000 | 90,310,000 | |
InterMune, Inc. (a) | 2,000,000 | 60,080,000 | |
Kindred Biosciences, Inc. | 700,000 | 15,792,000 | |
Medivation, Inc. (a) | 840,000 | 60,404,400 | |
Myriad Genetics, Inc. (a) | 300,000 | 10,863,000 | |
Neurocrine Biosciences, Inc. (a) | 1,750,000 | 30,852,500 | |
NewLink Genetics Corp. (a) | 280,000 | 12,376,000 | |
Novavax, Inc. (a) | 2,000,000 | 12,800,000 | |
NPS Pharmaceuticals, Inc. (a) | 400,000 | 13,992,000 | |
Pharmacyclics, Inc. (a) | 300,000 | 41,598,000 | |
PTC Therapeutics, Inc. (a) | 500,000 | 15,680,000 | |
Puma Biotechnology, Inc. (a) | 260,000 | 30,227,600 | |
Regeneron Pharmaceuticals, Inc. (a) | 65,000 | 21,612,500 | |
Swedish Orphan Biovitrum AB (a) | 1,100,000 | 14,582,830 | |
Vanda Pharmaceuticals, Inc. (a)(d) | 1,600,000 | 24,208,000 | |
Vertex Pharmaceuticals, Inc. (a) | 150,000 | 12,129,000 | |
ZIOPHARM Oncology, Inc. (a)(d) | 2,000,000 | 8,520,000 | |
| 1,846,236,524 | ||
DIVERSIFIED CONSUMER SERVICES - 0.3% | |||
Specialized Consumer Services - 0.3% | |||
Carriage Services, Inc. | 850,000 | 17,365,500 | |
HEALTH CARE EQUIPMENT & SUPPLIES - 14.4% | |||
Health Care Equipment - 13.0% | |||
Accuray, Inc. (a) | 1,000,000 | 9,380,000 | |
Boston Scientific Corp. (a) | 16,400,000 | 214,840,000 | |
Cardiovascular Systems, Inc. (a) | 500,000 | 17,500,000 | |
CONMED Corp. | 990,000 | 46,153,800 | |
Covidien PLC | 700,000 | 50,365,000 | |
Edwards Lifesciences Corp. (a) | 760,000 | 53,017,600 | |
Genmark Diagnostics, Inc. (a) | 2,026,880 | 25,254,925 | |
HeartWare International, Inc. (a) | 325,000 | 31,209,750 | |
Insulet Corp. (a) | 400,000 | 18,964,000 | |
| |||
Shares | Value | ||
Intuitive Surgical, Inc. (a) | 205,000 | $ 91,190,150 | |
Lumenis Ltd. Class B | 800,000 | 9,760,000 | |
Masimo Corp. (a) | 1,600,000 | 40,880,000 | |
Smith & Nephew PLC sponsored ADR | 500,000 | 39,820,000 | |
Steris Corp. | 739,644 | 34,134,571 | |
Stryker Corp. | 800,000 | 64,192,000 | |
Volcano Corp. (a) | 1,800,000 | 38,628,000 | |
Zeltiq Aesthetics, Inc. (a) | 900,000 | 17,091,000 | |
| 802,380,796 | ||
Health Care Supplies - 1.4% | |||
Derma Sciences, Inc. (a) | 1,000,000 | 14,690,000 | |
The Cooper Companies, Inc. | 570,000 | 73,079,700 | |
| 87,769,700 | ||
TOTAL HEALTH CARE EQUIPMENT & SUPPLIES | 890,150,496 | ||
HEALTH CARE PROVIDERS & SERVICES - 11.8% | |||
Health Care Distributors & Services - 4.3% | |||
Amplifon SpA | 3,000,000 | 18,344,187 | |
EBOS Group Ltd. | 2,200,000 | 18,463,245 | |
McKesson Corp. | 1,290,000 | 228,394,500 | |
| 265,201,932 | ||
Health Care Facilities - 2.0% | |||
Emeritus Corp. (a) | 1,200,000 | 37,836,000 | |
NMC Health PLC | 1,700,000 | 13,237,318 | |
Ramsay Health Care Ltd. | 350,000 | 15,069,561 | |
Surgical Care Affiliates, Inc. | 650,000 | 19,773,000 | |
Universal Health Services, Inc. Class B | 440,000 | 35,323,200 | |
| 121,239,079 | ||
Health Care Services - 2.2% | |||
Air Methods Corp. (a) | 600,000 | 32,412,000 | |
Catamaran Corp. (a) | 1,000,000 | 45,028,448 | |
MEDNAX, Inc. (a) | 1,000,000 | 60,820,000 | |
| 138,260,448 | ||
Managed Health Care - 3.3% | |||
Cigna Corp. | 1,000,000 | 79,590,000 | |
Humana, Inc. | 650,000 | 73,099,000 | |
UnitedHealth Group, Inc. | 700,000 | 54,089,000 | |
| 206,778,000 | ||
TOTAL HEALTH CARE PROVIDERS & SERVICES | 731,479,459 | ||
HEALTH CARE TECHNOLOGY - 3.0% | |||
Health Care Technology - 3.0% | |||
Cerner Corp. (a) | 2,300,000 | 141,151,000 | |
HealthStream, Inc. (a) | 460,000 | 13,257,200 | |
Medidata Solutions, Inc. (a) | 511,270 | 32,772,407 | |
| 187,180,607 | ||
INDUSTRIAL CONGLOMERATES - 1.5% | |||
Industrial Conglomerates - 1.5% | |||
Danaher Corp. | 1,170,000 | 89,493,300 | |
Common Stocks - continued | |||
Shares | Value | ||
IT SERVICES - 0.3% | |||
Data Processing & Outsourced Services - 0.3% | |||
Maximus, Inc. | 411,100 | $ 19,646,469 | |
LIFE SCIENCES TOOLS & SERVICES - 7.6% | |||
Life Sciences Tools & Services - 7.6% | |||
Agilent Technologies, Inc. | 1,800,000 | 102,474,000 | |
Bruker BioSciences Corp. (a) | 1,100,000 | 25,014,000 | |
Illumina, Inc. (a)(d) | 1,200,000 | 205,788,000 | |
Thermo Fisher Scientific, Inc. | 1,100,000 | 136,994,000 | |
| 470,270,000 | ||
PHARMACEUTICALS - 28.3% | |||
Pharmaceuticals - 28.3% | |||
AbbVie, Inc. | 1,000,000 | 50,910,000 | |
Actavis PLC (a) | 1,450,000 | 320,188,998 | |
Bristol-Myers Squibb Co. | 3,300,000 | 177,441,000 | |
Dechra Pharmaceuticals PLC | 1,700,000 | 19,998,313 | |
Forest Laboratories, Inc. (a) | 1,280,000 | 124,889,600 | |
Impax Laboratories, Inc. (a) | 600,000 | 15,462,000 | |
Jazz Pharmaceuticals PLC (a) | 170,000 | 25,830,650 | |
Merck & Co., Inc. | 3,600,000 | 205,164,000 | |
Mylan, Inc. (a) | 550,000 | 30,563,500 | |
Orexo AB (a)(d) | 803,352 | 21,237,617 | |
Pacira Pharmaceuticals, Inc. (a) | 350,000 | 27,384,000 | |
Perrigo Co. PLC | 1,070,000 | 175,950,800 | |
Prestige Brands Holdings, Inc. (a) | 956,458 | 27,249,488 | |
Salix Pharmaceuticals Ltd. (a) | 1,410,230 | 152,192,022 | |
Shire PLC sponsored ADR | 650,000 | 107,347,500 | |
Teva Pharmaceutical Industries Ltd. sponsored ADR | 2,000,000 | 99,780,000 | |
The Medicines Company (a) | 1,200,000 | 36,660,000 | |
TherapeuticsMD, Inc. (a) | 1,065,029 | 7,316,749 | |
UCB SA | 400,000 | 32,105,778 | |
Valeant Pharmaceuticals International (Canada) (a) | 660,000 | 94,210,783 | |
| 1,751,882,798 | ||
PROFESSIONAL SERVICES - 1.0% | |||
Human Resource & Employment Services - 1.0% | |||
Towers Watson & Co. | 320,599 | 34,977,351 | |
WageWorks, Inc. (a) | 400,000 | 23,660,000 | |
| 58,637,351 | ||
TOTAL COMMON STOCKS (Cost $4,103,997,933) |
| ||
Convertible Preferred Stocks - 0.3% | |||
|
|
|
|
BIOTECHNOLOGY - 0.1% | |||
Biotechnology - 0.1% | |||
Ariosa Diagnostics (a)(e) | 496,689 | 3,000,002 | |
| |||
Shares | Value | ||
HEALTH CARE TECHNOLOGY - 0.2% | |||
Health Care Technology - 0.2% | |||
Castlight Health, Inc.: | |||
Series C (a)(e) | 90,850 | $ 735,885 | |
Series D (a)(e) | 1,784,800 | 14,456,880 | |
| 15,192,765 | ||
TOTAL CONVERTIBLE PREFERRED STOCKS (Cost $14,322,475) |
| ||
Money Market Funds - 3.5% | |||
|
|
|
|
Fidelity Cash Central Fund, 0.10% (b) | 119,107,977 | 119,107,977 | |
Fidelity Securities Lending Cash Central Fund, 0.09% (b)(c) | 96,858,465 | 96,858,465 | |
TOTAL MONEY MARKET FUNDS (Cost $215,966,442) |
| ||
TOTAL INVESTMENT PORTFOLIO - 101.9% (Cost $4,334,286,850) | 6,296,501,713 | ||
NET OTHER ASSETS (LIABILITIES) - (1.9)% | (116,221,710) | ||
NET ASSETS - 100% | $ 6,180,280,003 | ||
Legend |
(a) Non-income producing |
(b) Affiliated fund that is generally available only to investment companies and other accounts managed by Fidelity Investments. The rate quoted is the annualized seven-day yield of the fund at period end. A complete unaudited listing of the fund's holdings as of its most recent quarter end is available upon request. In addition, each Fidelity Central Fund's financial statements, which are not covered by the Fund's Report of Independent Registered Public Accounting Firm, are available on the SEC's website or upon request. |
(c) Investment made with cash collateral received from securities on loan. |
(d) Security or a portion of the security is on loan at period end. |
(e) Restricted securities - Investment in securities not registered under the Securities Act of 1933 (excluding 144A issues). At the end of the period, the value of restricted securities (excluding 144A issues) amounted to $18,192,767 or 0.3% of net assets. |
Additional information on each restricted holding is as follows: |
Security | Acquisition Date | Acquisition Cost |
Ariosa Diagnostics | 11/30/11 | $ 3,000,002 |
Castlight Health, Inc. Series C | 12/6/12 | $ 548,421 |
Castlight Health, Inc. Series D | 4/25/12 | $ 10,774,052 |
Affiliated Central Funds |
Information regarding fiscal year to date income earned by the Fund from investments in Fidelity Central Funds is as follows: |
Fund | Income earned |
Fidelity Cash Central Fund | $ 59,923 |
Fidelity Securities Lending Cash Central Fund | 752,218 |
Total | $ 812,141 |
Other Affiliated Issuers |
An affiliated company is a company in which the Fund has ownership of at least 5% of the voting securities. Fiscal year to date transactions with companies which are or were affiliates are as follows: |
Affiliate | Value, | Purchases | Sales | Dividend | Value, |
Carriage Services, Inc. | $ 18,143,653 | $ - | $ 2,749,537 | $ 87,500 | $ - |
Derma Sciences, Inc. | 11,097,000 | 3,482,986 | 2,411,896 | - | - |
Total | $ 29,240,653 | $ 3,482,986 | $ 5,161,433 | $ 87,500 | $ - |
Other Information |
The following is a summary of the inputs used, as of February 28, 2014, involving the Fund's assets and liabilities carried at fair value. The inputs or methodology used for valuing securities may not be an indication of the risk associated with investing in those securities. For more information on valuation inputs, and their aggregation into the levels used in the table below, please refer to the Investment Valuation section in the accompanying Notes to Financial Statements. |
Valuation Inputs at Reporting Date: | ||||
Description | Total | Level 1 | Level 2 | Level 3 |
Investments in Securities: | ||||
Common Stocks | $ 6,062,342,504 | $ 6,062,342,504 | $ - | $ - |
Convertible Preferred Stocks | 18,192,767 | - | - | 18,192,767 |
Money Market Funds | 215,966,442 | 215,966,442 | - | - |
Total Investments in Securities: | $ 6,296,501,713 | $ 6,278,308,946 | $ - | $ 18,192,767 |
Distribution of investments by country or territory of incorporation, as a percentage of total net assets, is as follows (Unaudited): |
United States of America | 80.2% |
Ireland | 9.3% |
Canada | 2.2% |
Israel | 1.8% |
Bailiwick of Jersey | 1.7% |
United Kingdom | 1.1% |
Others (Individually Less Than 1%) | 3.7% |
| 100.0% |
See accompanying notes which are an integral part of the financial statements.
Annual Report
Health Care Portfolio
Financial Statements
Statement of Assets and Liabilities
| February 28, 2014 | |
|
|
|
Assets | ||
Investment in securities, at value (including securities loaned of $91,475,948) - See accompanying schedule: Unaffiliated issuers (cost $4,118,320,408) | $ 6,080,535,271 |
|
Fidelity Central Funds (cost $215,966,442) | 215,966,442 |
|
Total Investments (cost $4,334,286,850) |
| $ 6,296,501,713 |
Cash |
| 134,449 |
Receivable for investments sold | 52,596,546 | |
Receivable for fund shares sold | 26,175,293 | |
Dividends receivable | 2,726,415 | |
Distributions receivable from Fidelity Central Funds | 28,858 | |
Prepaid expenses | 19,138 | |
Other receivables | 153,031 | |
Total assets | 6,378,335,443 | |
|
|
|
Liabilities | ||
Payable for investments purchased | $ 84,983,644 | |
Payable for fund shares redeemed | 12,547,784 | |
Accrued management fee | 2,657,110 | |
Other affiliated payables | 795,408 | |
Other payables and accrued expenses | 213,029 | |
Collateral on securities loaned, at value | 96,858,465 | |
Total liabilities | 198,055,440 | |
|
|
|
Net Assets | $ 6,180,280,003 | |
Net Assets consist of: |
| |
Paid in capital | $ 3,925,510,806 | |
Accumulated net investment loss | (65,597) | |
Accumulated undistributed net realized gain (loss) on investments and foreign currency transactions | 292,595,296 | |
Net unrealized appreciation (depreciation) on investments and assets and liabilities in foreign currencies | 1,962,239,498 | |
Net Assets, for 28,496,076 shares outstanding | $ 6,180,280,003 | |
Net Asset Value, offering price and redemption price per share ($6,180,280,003 ÷ 28,496,076 shares) | $ 216.88 | |
Statement of Operations
| Year ended February 28, 2014 | |
|
|
|
Investment Income |
|
|
Dividends (including $87,500 earned from other affiliated issuers) |
| $ 24,734,588 |
Interest |
| 86 |
Income from Fidelity Central Funds (including $752,218 from security lending) |
| 812,141 |
Total income |
| 25,546,815 |
|
|
|
Expenses | ||
Management fee | $ 22,000,830 | |
Transfer agent fees | 6,708,075 | |
Accounting and security lending fees | 1,036,199 | |
Custodian fees and expenses | 128,103 | |
Independent trustees' compensation | 75,546 | |
Appreciation in deferred trustee compensation account | 1,041 | |
Registration fees | 263,360 | |
Audit | 54,828 | |
Legal | 56,884 | |
Interest | 928 | |
Miscellaneous | 38,170 | |
Total expenses before reductions | 30,363,964 | |
Expense reductions | (342,430) | 30,021,534 |
Net investment income (loss) | (4,474,719) | |
Realized and Unrealized Gain (Loss) Net realized gain (loss) on: | ||
Investment securities: |
|
|
Unaffiliated issuers | 708,702,613 | |
Other affiliated issuers | 1,794,941 |
|
Foreign currency transactions | (108,412) | |
Total net realized gain (loss) |
| 710,389,142 |
Change in net unrealized appreciation (depreciation) on: Investment securities | 1,417,657,073 | |
Assets and liabilities in foreign currencies | 27,860 | |
Total change in net unrealized appreciation (depreciation) |
| 1,417,684,933 |
Net gain (loss) | 2,128,074,075 | |
Net increase (decrease) in net assets resulting from operations | $ 2,123,599,356 | |
See accompanying notes which are an integral part of the financial statements.
Annual Report
Statement of Changes in Net Assets
| Year ended | Year ended |
Increase (Decrease) in Net Assets |
|
|
Operations |
|
|
Net investment income (loss) | $ (4,474,719) | $ 8,618,999 |
Net realized gain (loss) | 710,389,142 | 270,711,145 |
Change in net unrealized appreciation (depreciation) | 1,417,684,933 | 161,746,113 |
Net increase (decrease) in net assets resulting from operations | 2,123,599,356 | 441,076,257 |
Distributions to shareholders from net investment income | (673,800) | (7,644,611) |
Distributions to shareholders from net realized gain | (449,807,909) | (233,576,413) |
Total distributions | (450,481,709) | (241,221,024) |
Share transactions | 2,072,747,792 | 587,069,831 |
Reinvestment of distributions | 430,582,894 | 229,888,847 |
Cost of shares redeemed | (720,645,554) | (468,724,036) |
Net increase (decrease) in net assets resulting from share transactions | 1,782,685,132 | 348,234,642 |
Redemption fees | 136,125 | 27,171 |
Total increase (decrease) in net assets | 3,455,938,904 | 548,117,046 |
|
|
|
Net Assets | ||
Beginning of period | 2,724,341,099 | 2,176,224,053 |
End of period (including accumulated net investment loss of $65,597 and undistributed net investment income of $639,646, respectively) | $ 6,180,280,003 | $ 2,724,341,099 |
Other Information Shares | ||
Sold | 11,268,250 | 4,198,660 |
Issued in reinvestment of distributions | 2,393,364 | 1,723,942 |
Redeemed | (4,057,826) | (3,383,695) |
Net increase (decrease) | 9,603,788 | 2,538,907 |
Financial Highlights
Years ended February 28, | 2014 | 2013 | 2012 G | 2011 | 2010 |
Selected Per-Share Data |
|
|
|
|
|
Net asset value, beginning of period | $ 144.20 | $ 133.07 | $ 133.93 | $ 109.17 | $ 73.65 |
Income from Investment Operations |
|
|
|
|
|
Net investment income (loss) B | (.20) | .50 | - H | .04 | .06 |
Net realized and unrealized gain (loss) | 92.44 | 24.74 | 10.86 | 24.90 | 35.71 |
Total from investment operations | 92.24 | 25.24 | 10.86 | 24.94 | 35.77 |
Distributions from net investment income | (.03) | (.44) | - | (.17) | (.25) |
Distributions from net realized gain | (19.53) | (13.67) | (11.72) | (.01) | (.01) |
Total distributions | (19.57) J | (14.11) | (11.72) | (.18) | (.25) I |
Redemption fees added to paid in capital B | .01 | - H | - H | - H | - H |
Net asset value, end of period | $ 216.88 | $ 144.20 | $ 133.07 | $ 133.93 | $ 109.17 |
Total Return A | 67.13% | 20.07% | 9.10% | 22.86% | 48.65% |
Ratios to Average Net Assets C, F |
|
|
|
|
|
Expenses before reductions | .77% | .79% | .80% | .82% | .88% |
Expenses net of fee waivers, if any | .77% | .79% | .80% | .82% | .88% |
Expenses net of all reductions | .76% | .78% | .80% | .82% | .87% |
Net investment income (loss) | (.11)% | .36% | .00% E | .03% | .07% |
Supplemental Data |
|
|
|
|
|
Net assets, end of period (000 omitted) | $ 6,180,280 | $ 2,724,341 | $ 2,176,224 | $ 1,991,604 | $ 1,727,742 |
Portfolio turnover rate D | 99% | 95% | 130% | 99% | 116% |
A Total returns would have been lower if certain expenses had not been reduced during the applicable periods shown.
B Calculated based on average shares outstanding during the period.
C Fees and expenses of any underlying Fidelity Central Funds are not included in the Fund's expense ratio. The Fund indirectly bears its proportionate share of the expenses of any underlying Fidelity Central Funds.
D Amount does not include the portfolio activity of any underlying Fidelity Central Funds.
E Amount represents less than .01%.
F Expense ratios reflect operating expenses of the Fund. Expenses before reductions do not reflect amounts reimbursed by the investment adviser or reductions from brokerage service arrangements or reductions from other expense offset arrangements and do not represent the amount paid by the Fund during periods when reimbursements or reductions occur. Expenses net of fee waivers reflect expenses after reimbursement by the investment adviser but prior to reductions from brokerage service arrangements or other expense offset arrangements. Expenses net of all reductions represent the net expenses paid by the Fund.
G For the year ended February 29.
H Amount represents less than $.01 per share.
I Total distributions of $.25 per share is comprised of distributions from net investment income of $.245 and distributions from net realized gain of $.005 per share.
J Total distributions of $19.57 per share is comprised of distributions from net investment income of $0.034 and distributions from net realized gain of $19.532 per share.
See accompanying notes which are an integral part of the financial statements.
Annual Report
Medical Delivery Portfolio
Performance: The Bottom Line
Average annual total return reflects the change in the value of an investment, assuming reinvestment of the fund's distributions from dividend income and capital gains (the profits earned upon the sale of securities that have grown in value, if any) and assuming a constant rate of performance each year. The $10,000 table and the fund's returns do not reflect the deduction of taxes that a shareholder would pay on fund distributions or the redemption of fund shares. During periods of reimbursement by Fidelity, a fund's total return will be greater than it would be had the reimbursement not occurred. How a fund did yesterday is no guarantee of how it will do tomorrow.
Average Annual Total Returns
Periods ended February 28, 2014 | Past 1 | Past 5 | Past 10 |
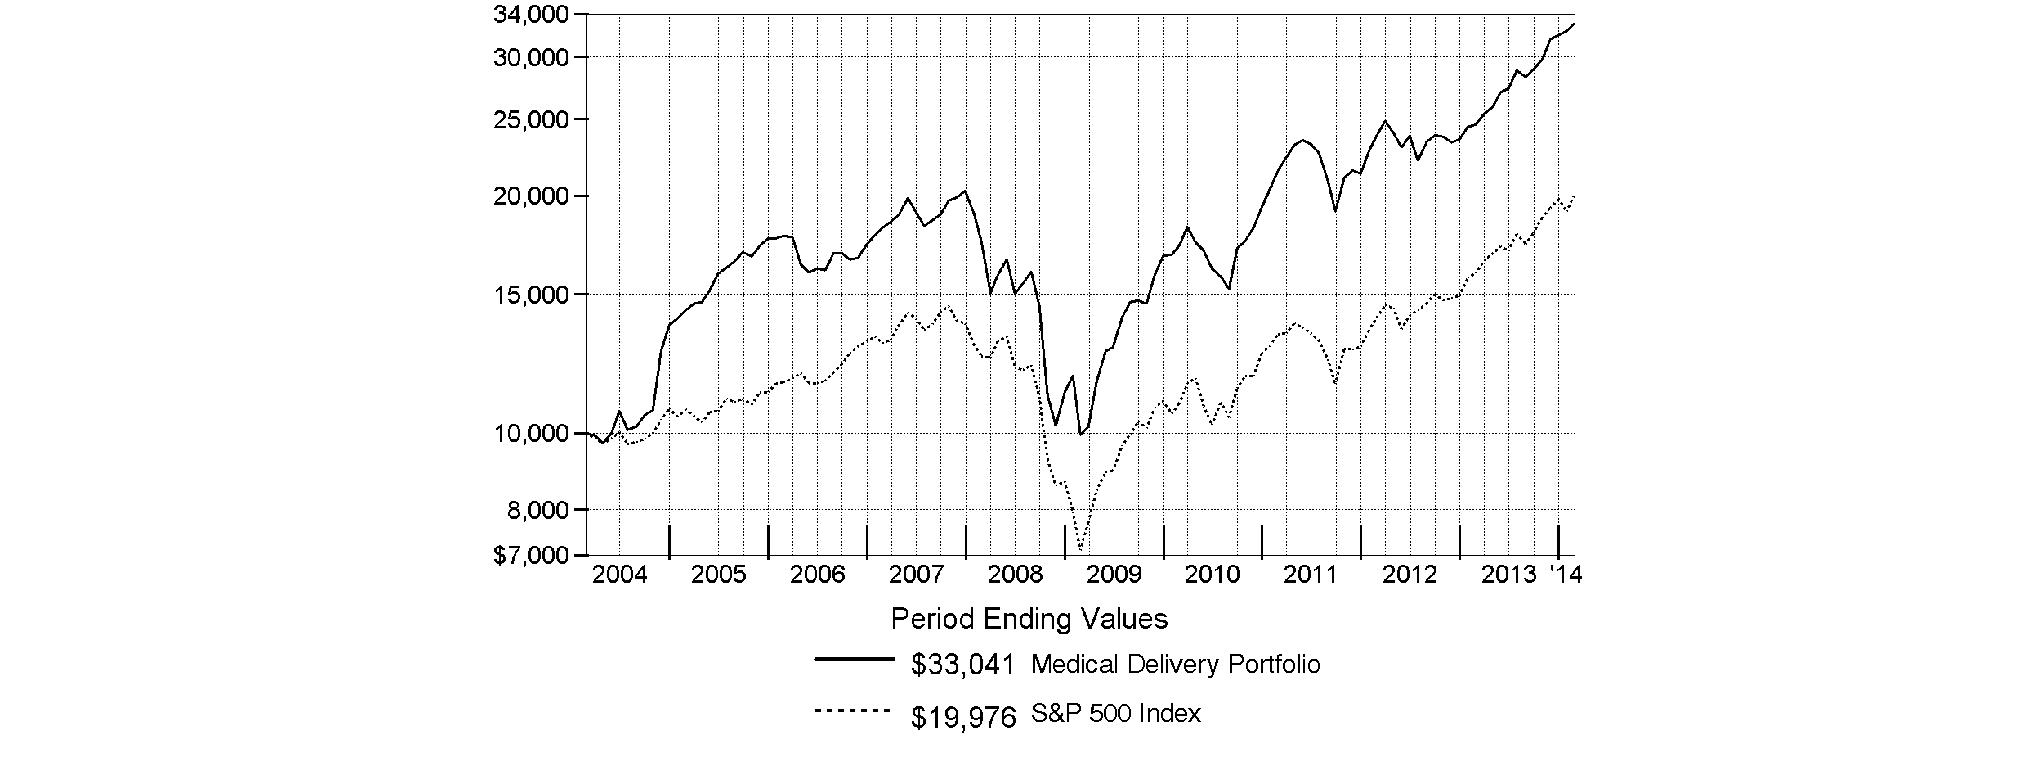
Medical Delivery Portfolio | 34.22% | 27.15% | 12.70% |
$10,000 Over 10 Years
Let's say hypothetically that $10,000 was invested in Medical Delivery Portfolio on February 29, 2004. The chart shows how the value of your investment would have changed, and also shows how the S&P 500 Index performed over the same period.
Annual Report
Medical Delivery Portfolio
Management's Discussion of Fund Performance
Market Recap: Stocks overcame fears of higher interest rates - not to mention their worst January in four years - to finish sharply higher for the 12 months ending February 28, 2014. The broad S&P 500® Index and the blue-chip Dow Jones Industrial AverageSM gained 25.37% and 19.01%, respectively, amid generally favorable earnings reports and accommodative monetary policies worldwide. Performance generally increased along the risk spectrum, with smaller-cap and growth strategies leading the way. An ebullient market helped the growth-oriented Nasdaq Composite Index® to a 38.10% period gain, for example. On the other hand, both cyclical and defensive stocks had representation in the top-performing industry sectors: returns were highest in health care and consumer discretionary; lowest in utilities and telecommunication services. From a macroeconomic perspective, data still points to slow but steady improvement in the U.S., and Europe's recession may well be over. Reports from China have disappointed, but continue to suggest a relatively soft landing there. Mixed signals from the U.S. Federal Reserve as to when it might curtail its stimulative bond buying kept markets in flux during the spring and summer. Stocks regained momentum in October despite a federal budget impasse and brief government shutdown, and lower volatility prevailed through year-end. Shedding new-year concerns about China's economy, an emerging-markets sell-off and confirmation (at last) of Fed tapering - alongside confirmation of a presumably dovish Janet Yellen as new Fed chair - February saw stocks back in record territory, bearing down on the five-year anniversary of the market's bottom.
Comments from Steven Bullock, Portfolio Manager of Medical Delivery Portfolio: For the year, the fund gained 34.22%, trailing the 38.80% return of its industry benchmark, the MSCI® U.S. IMI Health Care Providers & Services 25-50 Index, but easily besting the broadly based S&P 500®. Medical delivery stocks outperformed during the past year, primarily due to low health care cost inflation, which led to profit-margin expansion and continued strong growth in the pharmaceuticals supply chain. Versus the industry index, it hurt to underweight managed health care stocks, which outperformed. I increased the fund's absolute stake in managed care and in health care facilities - particularly hospitals - but maintained a relative underweighting in both. The fund's positioning in health care services also detracted, especially security selection. I cut back on distributors and health care services, but maintained overweightings in those areas. At the stock level, it hurt the most to underweight and eventually sell managed-care firm Humana. The fund's position in Quest Diagnostics also detracted, as weak demand for laboratory testing weighed on the stock. Home-infusion services provider BioScrip hurt performance, when its non-core pharmacy benefit management (PBM) business came under severe pressure, as did pharmacy benefit manager and major fund holding Express Scripts Holding, which lagged the index during the period. On the positive side, pharmaceuticals wholesaler McKesson was our top contributor, as the stock benefited from increasing demand for prescription drugs, as well as strong generic-drug price inflation. HCA Holdings, a hospital operator, also helped, as the market anticipated additional revenue and admissions from patients newly insured due to the ACA. Our timing was good with a non-index position in Towers Watson, a provider of private health exchanges, and it helped to own outperforming drug distribution company Cardinal Health.
The views expressed above reflect those of the portfolio manager(s) only through the end of the period as stated on the cover of this report and do not necessarily represent the views of Fidelity or any other person in the Fidelity organization. Any such views are subject to change at any time based upon market or other conditions and Fidelity disclaims any responsibility to update such views. These views may not be relied on as investment advice and, because investment decisions for a Fidelity fund are based on numerous factors, may not be relied on as an indication of trading intent on behalf of any Fidelity fund.
Annual Report
Medical Delivery Portfolio
Investment Changes (Unaudited)
Top Ten Stocks as of February 28, 2014 | ||
| % of fund's | % of fund's net assets |
UnitedHealth Group, Inc. | 17.2 | 19.1 |
Express Scripts Holding Co. | 15.4 | 15.8 |
McKesson Corp. | 8.8 | 8.0 |
Cardinal Health, Inc. | 7.7 | 2.9 |
DaVita HealthCare Partners, Inc. | 4.9 | 3.4 |
HCA Holdings, Inc. | 4.9 | 4.8 |
Cigna Corp. | 4.7 | 6.2 |
Quest Diagnostics, Inc. | 3.5 | 4.0 |
Henry Schein, Inc. | 3.4 | 2.9 |
Aetna, Inc. | 3.0 | 3.4 |
| 73.5 | |
Top Industries (% of fund's net assets) | |||
As of February 28, 2014 | |||
| Health Care Providers & Services | 95.3% |
|
| Food & Staples Retailing | 1.0% |
|
| Diversified Consumer Services | 0.8% |
|
| Health Care Equipment & Supplies | 0.7% |
|
| Professional Services | 0.5% |
|
| All Others* | 1.7% |
|

As of August 31, 2013 | |||
| Health Care Providers & Services | 92.3% |
|
| Food & Staples Retailing | 1.4% |
|
| Professional Services | 1.3% |
|
| Diversified Consumer Services | 0.7% |
|
| Health Care Equipment & Supplies | 0.5% |
|
| All Others* | 3.8% |
|

* Includes short-term investments and net other assets (liabilities). |
Annual Report
Medical Delivery Portfolio
Investments February 28, 2014
Showing Percentage of Net Assets
Common Stocks - 99.4% | |||
Shares | Value | ||
CHEMICALS - 0.2% | |||
Specialty Chemicals - 0.2% | |||
Sigma Aldrich Corp. | 15,200 | $ 1,435,032 | |
COMMERCIAL SERVICES & SUPPLIES - 0.2% | |||
Environmental & Facility Services - 0.2% | |||
Stericycle, Inc. (a) | 12,200 | 1,390,800 | |
DIVERSIFIED CONSUMER SERVICES - 0.8% | |||
Specialized Consumer Services - 0.8% | |||
H&R Block, Inc. | 179,100 | 5,666,724 | |
FOOD & STAPLES RETAILING - 1.0% | |||
Drug Retail - 1.0% | |||
CVS Caremark Corp. | 71,500 | 5,229,510 | |
Jean Coutu Group, Inc. Class A (sub. vtg.) | 97,100 | 1,836,245 | |
| 7,065,755 | ||
HEALTH CARE EQUIPMENT & SUPPLIES - 0.7% | |||
Health Care Equipment - 0.7% | |||
Covidien PLC | 19,600 | 1,410,220 | |
Intuitive Surgical, Inc. (a) | 3,900 | 1,734,837 | |
NxStage Medical, Inc. (a) | 139,300 | 1,932,091 | |
| 5,077,148 | ||
HEALTH CARE PROVIDERS & SERVICES - 95.3% | |||
Health Care Distributors & Services - 21.2% | |||
AmerisourceBergen Corp. | 55,000 | 3,731,750 | |
Cardinal Health, Inc. | 741,200 | 53,018,036 | |
Henry Schein, Inc. (a) | 198,500 | 23,629,440 | |
McKesson Corp. | 343,000 | 60,728,150 | |
MWI Veterinary Supply, Inc. (a) | 34,900 | 5,685,908 | |
| 146,793,284 | ||
Health Care Facilities - 8.8% | |||
Community Health Systems, Inc. (a) | 476,200 | 19,767,062 | |
HCA Holdings, Inc. (a) | 661,400 | 33,863,680 | |
LifePoint Hospitals, Inc. (a) | 54,300 | 2,945,775 | |
The Ensign Group, Inc. | 60,200 | 2,383,920 | |
U.S. Physical Therapy, Inc. | 49,000 | 1,625,820 | |
| 60,586,257 | ||
Health Care Services - 35.8% | |||
Accretive Health, Inc. (a)(d) | 1,137,000 | 9,414,360 | |
Air Methods Corp. (a) | 136,900 | 7,395,338 | |
BioScrip, Inc. (a) | 1,072,202 | 7,644,800 | |
Catamaran Corp. (a) | 101,712 | 4,579,933 | |
Corvel Corp. (a) | 75,600 | 3,478,356 | |
| |||
Shares | Value | ||
DaVita HealthCare Partners, Inc. (a) | 495,900 | $ 34,083,207 | |
Express Scripts Holding Co. (a) | 1,417,750 | 106,770,753 | |
Fresenius SE & Co. KGaA | 57,600 | 8,952,294 | |
Laboratory Corp. of America Holdings (a) | 70,700 | 6,613,278 | |
Landauer, Inc. | 79,200 | 3,838,032 | |
MEDNAX, Inc. (a) | 297,700 | 18,106,114 | |
Omnicare, Inc. | 141,900 | 8,357,910 | |
Providence Service Corp. (a) | 26,400 | 701,976 | |
Quest Diagnostics, Inc. (d) | 460,000 | 24,380,000 | |
Team Health Holdings, Inc. (a) | 86,700 | 3,903,234 | |
| 248,219,585 | ||
Managed Health Care - 29.5% | |||
Aetna, Inc. | 284,200 | 20,664,182 | |
Centene Corp. (a) | 159,100 | 10,131,488 | |
Cigna Corp. | 413,900 | 32,942,301 | |
Molina Healthcare, Inc. (a) | 292,900 | 11,036,472 | |
Qualicorp SA (a) | 281,500 | 2,549,978 | |
Triple-S Management Corp. (a) | 110,000 | 1,842,500 | |
UnitedHealth Group, Inc. | 1,546,197 | 119,474,642 | |
WellPoint, Inc. | 61,800 | 5,598,462 | |
| 204,240,025 | ||
TOTAL HEALTH CARE PROVIDERS & SERVICES | 659,839,151 | ||
HEALTH CARE TECHNOLOGY - 0.1% | |||
Health Care Technology - 0.1% | |||
HMS Holdings Corp. (a) | 24,900 | 509,454 | |
INDUSTRIAL CONGLOMERATES - 0.2% | |||
Industrial Conglomerates - 0.2% | |||
Danaher Corp. | 18,800 | 1,438,012 | |
IT SERVICES - 0.2% | |||
Data Processing & Outsourced Services - 0.2% | |||
Maximus, Inc. | 22,000 | 1,051,380 | |
MACHINERY - 0.2% | |||
Industrial Machinery - 0.2% | |||
Pall Corp. | 17,200 | 1,479,200 | |
PROFESSIONAL SERVICES - 0.5% | |||
Human Resource & Employment Services - 0.3% | |||
Towers Watson & Co. | 15,700 | 1,712,870 | |
Research & Consulting Services - 0.2% | |||
Verisk Analytics, Inc. (a) | 22,700 | 1,446,331 | |
TOTAL PROFESSIONAL SERVICES | 3,159,201 | ||
TOTAL COMMON STOCKS (Cost $437,964,355) |
| ||
Money Market Funds - 4.0% | |||
Shares | Value | ||
Fidelity Cash Central Fund, 0.10% (b) | 3,246,111 | $ 3,246,111 | |
Fidelity Securities Lending Cash Central Fund, 0.09% (b)(c) | 24,914,225 | 24,914,225 | |
TOTAL MONEY MARKET FUNDS (Cost $28,160,336) |
| ||
TOTAL INVESTMENT PORTFOLIO - 103.4% (Cost $466,124,691) | 716,272,193 | ||
NET OTHER ASSETS (LIABILITIES) - (3.4)% | (23,786,135) | ||
NET ASSETS - 100% | $ 692,486,058 | ||
Legend |
(a) Non-income producing |
(b) Affiliated fund that is generally available only to investment companies and other accounts managed by Fidelity Investments. The rate quoted is the annualized seven-day yield of the fund at period end. A complete unaudited listing of the fund's holdings as of its most recent quarter end is available upon request. In addition, each Fidelity Central Fund's financial statements, which are not covered by the Fund's Report of Independent Registered Public Accounting Firm, are available on the SEC's website or upon request. |
(c) Investment made with cash collateral received from securities on loan. |
(d) Security or a portion of the security is on loan at period end. |
Affiliated Central Funds |
Information regarding fiscal year to date income earned by the Fund from investments in Fidelity Central Funds is as follows: |
Fund | Income earned |
Fidelity Cash Central Fund | $ 15,036 |
Fidelity Securities Lending Cash Central Fund | 15,193 |
Total | $ 30,229 |
Other Information |
All investments are categorized as Level 1 under the Fair Value Hierarchy. The inputs or methodology used for valuing securities may not be an indication of the risk associated with investing in those securities. For more information on valuation inputs, please refer to the Investment Valuation section in the accompanying Notes to Financial Statements. |
See accompanying notes which are an integral part of the financial statements.
Annual Report
Medical Delivery Portfolio
Financial Statements
Statement of Assets and Liabilities
| February 28, 2014 | |
|
|
|
Assets | ||
Investment in securities, at value (including securities loaned of $24,450,048) - See accompanying schedule: Unaffiliated issuers (cost $437,964,355) | $ 688,111,857 |
|
Fidelity Central Funds (cost $28,160,336) | 28,160,336 |
|
Total Investments (cost $466,124,691) |
| $ 716,272,193 |
Foreign currency held at value (cost $4) | 4 | |
Receivable for investments sold | 4,084,233 | |
Receivable for fund shares sold | 645,344 | |
Dividends receivable | 109,604 | |
Distributions receivable from Fidelity Central Funds | 2,655 | |
Prepaid expenses | 3,647 | |
Other receivables | 14,880 | |
Total assets | 721,132,560 | |
|
|
|
Liabilities | ||
Payable for investments purchased | $ 1,377,729 | |
Payable for fund shares redeemed | 1,858,305 | |
Accrued management fee | 319,051 | |
Other affiliated payables | 140,705 | |
Other payables and accrued expenses | 36,487 | |
Collateral on securities loaned, at value | 24,914,225 | |
Total liabilities | 28,646,502 | |
|
|
|
Net Assets | $ 692,486,058 | |
Net Assets consist of: |
| |
Paid in capital | $ 419,219,081 | |
Accumulated net investment loss | (4,626) | |
Accumulated undistributed net realized gain (loss) on investments and foreign currency transactions | 23,125,227 | |
Net unrealized appreciation (depreciation) on investments and assets and liabilities in foreign currencies | 250,146,376 | |
Net Assets, for 9,165,850 shares outstanding | $ 692,486,058 | |
Net Asset Value, offering price and redemption price per share ($692,486,058 ÷ 9,165,850 shares) | $ 75.55 | |
Statement of Operations
| Year ended February 28, 2014 | |
|
|
|
Investment Income |
|
|
Dividends |
| $ 4,804,352 |
Income from Fidelity Central Funds (including $15,193 from security lending) |
| 30,229 |
Total income |
| 4,834,581 |
|
|
|
Expenses | ||
Management fee | $ 3,704,688 | |
Transfer agent fees | 1,432,092 | |
Accounting and security lending fees | 243,794 | |
Custodian fees and expenses | 14,962 | |
Independent trustees' compensation | 13,277 | |
Registration fees | 31,655 | |
Audit | 45,924 | |
Legal | 11,218 | |
Interest | 1,559 | |
Miscellaneous | 9,291 | |
Total expenses before reductions | 5,508,460 | |
Expense reductions | (24,697) | 5,483,763 |
Net investment income (loss) | (649,182) | |
Realized and Unrealized Gain (Loss) Net realized gain (loss) on: | ||
Investment securities: |
|
|
Unaffiliated issuers | 65,914,152 | |
Foreign currency transactions | (3,150) | |
Total net realized gain (loss) |
| 65,911,002 |
Change in net unrealized appreciation (depreciation) on: Investment securities | 128,109,647 | |
Assets and liabilities in foreign currencies | (429) | |
Total change in net unrealized appreciation (depreciation) |
| 128,109,218 |
Net gain (loss) | 194,020,220 | |
Net increase (decrease) in net assets resulting from operations | $ 193,371,038 | |
See accompanying notes which are an integral part of the financial statements.
Annual Report
Statement of Changes in Net Assets
| Year ended | Year ended |
Increase (Decrease) in Net Assets |
|
|
Operations |
|
|
Net investment income (loss) | $ (649,182) | $ 729,219 |
Net realized gain (loss) | 65,911,002 | 78,580,762 |
Change in net unrealized appreciation (depreciation) | 128,109,218 | (75,363,913) |
Net increase (decrease) in net assets resulting from operations | 193,371,038 | 3,946,068 |
Distributions to shareholders from net investment income | - | (299,615) |
Distributions to shareholders from net realized gain | (41,435,622) | (31,559,328) |
Total distributions | (41,435,622) | (31,858,943) |
Share transactions | 261,222,310 | 239,485,576 |
Reinvestment of distributions | 40,055,096 | 30,763,816 |
Cost of shares redeemed | (323,684,837) | (549,770,786) |
Net increase (decrease) in net assets resulting from share transactions | (22,407,431) | (279,521,394) |
Redemption fees | 9,206 | 25,054 |
Total increase (decrease) in net assets | 129,537,191 | (307,409,215) |
|
|
|
Net Assets | ||
Beginning of period | 562,948,867 | 870,358,082 |
End of period (including accumulated net investment loss of $4,626 and accumulated net investment loss of $75,161, respectively) | $ 692,486,058 | $ 562,948,867 |
Other Information Shares | ||
Sold | 3,857,742 | 3,859,479 |
Issued in reinvestment of distributions | 580,095 | 531,970 |
Redeemed | (4,670,775) | (9,199,114) |
Net increase (decrease) | (232,938) | (4,807,665) |
Financial Highlights
Years ended February 28, | 2014 | 2013 | 2012 F | 2011 | 2010 |
Selected Per-Share Data |
|
|
|
|
|
Net asset value, beginning of period | $ 59.90 | $ 61.26 | $ 55.32 | $ 44.38 | $ 25.53 |
Income from Investment Operations |
|
|
|
|
|
Net investment income (loss) B | (.07) | .06 | (.03) | (.25) | (.24) |
Net realized and unrealized gain (loss) | 20.08 | 1.77 | 5.96 | 11.19 | 19.09 |
Total from investment operations | 20.01 | 1.83 | 5.93 | 10.94 | 18.85 |
Distributions from net investment income | - | (.03) | - | - | - |
Distributions from net realized gain | (4.36) | (3.16) | - | - | - |
Total distributions | (4.36) | (3.19) | - | - | - |
Redemption fees added to paid in capital B | - G | - G | .01 | - G | - G |
Net asset value, end of period | $ 75.55 | $ 59.90 | $ 61.26 | $ 55.32 | $ 44.38 |
Total Return A | 34.22% | 3.17% | 10.74% | 24.65% | 73.83% |
Ratios to Average Net Assets C, E |
|
|
|
|
|
Expenses before reductions | .82% | .84% | .86% | .89% | .96% |
Expenses net of fee waivers, if any | .82% | .84% | .86% | .89% | .96% |
Expenses net of all reductions | .82% | .83% | .84% | .88% | .96% |
Net investment income (loss) | (.10)% | .10% | (.05)% | (.54)% | (.67)% |
Supplemental Data |
|
|
|
|
|
Net assets, end of period (000 omitted) | $ 692,486 | $ 562,949 | $ 870,358 | $ 566,400 | $ 466,110 |
Portfolio turnover rate D | 65% | 96% | 86% | 55% | 50% |
A Total returns would have been lower if certain expenses had not been reduced during the applicable periods shown.
B Calculated based on average shares outstanding during the period.
C Fees and expenses of any underlying Fidelity Central Funds are not included in the Fund's expense ratio. The Fund indirectly bears its proportionate share of the expenses of any underlying Fidelity Central Funds.
D Amount does not include the portfolio activity of any underlying Fidelity Central Funds.
E Expense ratios reflect operating expenses of the Fund. Expenses before reductions do not reflect amounts reimbursed by the investment adviser or reductions from brokerage service arrangements or reductions from other expense offset arrangements and do not represent the amount paid by the Fund during periods when reimbursements or reductions occur. Expenses net of fee waivers reflect expenses after reimbursement by the investment adviser but prior to reductions from brokerage service arrangements or other expense offset arrangements. Expenses net of all reductions represent the net expenses paid by the Fund.
F For the year ended February 29.
G Amount represents less than $.01 per share.
See accompanying notes which are an integral part of the financial statements.
Annual Report
Medical Equipment and Systems Portfolio
Performance: The Bottom Line
Average annual total return reflects the change in the value of an investment, assuming reinvestment of the fund's distributions from dividend income and capital gains (the profits earned upon the sale of securities that have grown in value, if any) and assuming a constant rate of performance each year. The $10,000 table and the fund's returns do not reflect the deduction of taxes that a shareholder would pay on fund distributions or the redemption of fund shares. During periods of reimbursement by Fidelity, a fund's total return will be greater than it would be had the reimbursement not occurred. How a fund did yesterday is no guarantee of how it will do tomorrow.
Average Annual Total Returns
Periods ended February 28, 2014 | Past 1 | Past 5 | Past 10 |
Medical Equipment and Systems Portfolio | 37.03% | 21.76% | 11.00% |
$10,000 Over 10 Years
Let's say hypothetically that $10,000 was invested in Medical Equipment and Systems Portfolio on February 29, 2004. The chart shows how the value of your investment would have changed, and also shows how the S&P 500 Index performed over the same period.
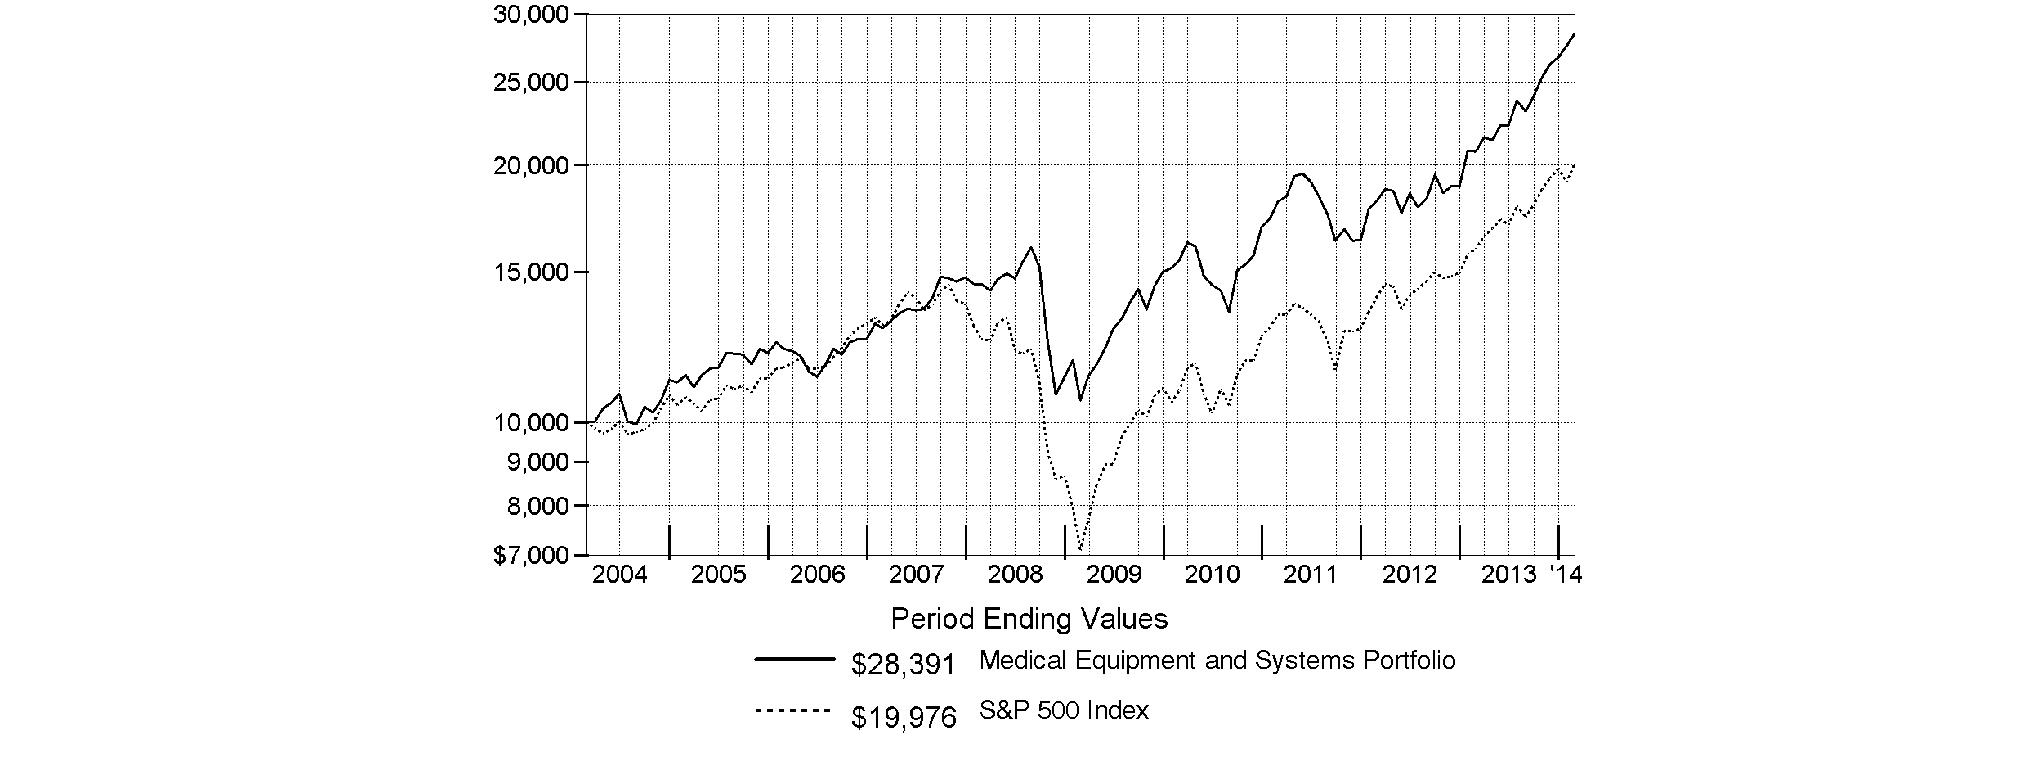
Annual Report
Medical Equipment and Systems Portfolio
Management's Discussion of Fund Performance
Market Recap: Stocks overcame fears of higher interest rates - not to mention their worst January in four years - to finish sharply higher for the 12 months ending February 28, 2014. The broad S&P 500® Index and the blue-chip Dow Jones Industrial AverageSM gained 25.37% and 19.01%, respectively, amid generally favorable earnings reports and accommodative monetary policies worldwide. Performance generally increased along the risk spectrum, with smaller-cap and growth strategies leading the way. An ebullient market helped the growth-oriented Nasdaq Composite Index® to a 38.10% period gain, for example. On the other hand, both cyclical and defensive stocks had representation in the top-performing industry sectors: returns were highest in health care and consumer discretionary; lowest in utilities and telecommunication services. From a macroeconomic perspective, data still points to slow but steady improvement in the U.S., and Europe's recession may well be over. Reports from China have disappointed, but continue to suggest a relatively soft landing there. Mixed signals from the U.S. Federal Reserve as to when it might curtail its stimulative bond buying kept markets in flux during the spring and summer. Stocks regained momentum in October despite a federal budget impasse and brief government shutdown, and lower volatility prevailed through year-end. Shedding new-year concerns about China's economy, an emerging-markets sell-off and confirmation (at last) of Fed tapering - alongside confirmation of a presumably dovish Janet Yellen as new Fed chair - February saw stocks back in record territory, bearing down on the five-year anniversary of the market's bottom.
Comments from Edward Yoon, Portfolio Manager of Medical Equipment and Systems Portfolio: For the year, the fund gained 37.03%, outpacing the 25.02% advance of the MSCI® U.S. IMI Health Care Equipment & Supplies 25-50 Index and the broadly based S&P 500®. The industry produced a solid return relative to the broader market as fundamentals stabilized and improved throughout the course of the year. The group faced a difficult market in the U.S., however, due partly to cyclical headwinds such as still-high unemployment and a greater focus on cost containment. Hospitals, the industry's key customers, faced increased reimbursement pressure that has contributed to slowing growth among medical equipment stocks. While the domestic backdrop presented some hurdles, multinational companies continued their aggressive investment in and expansion into emerging markets. Opportunities abroad mounted, as developing countries continue to build new hospitals and expand infrastructure to accommodate an emerging middle class spending more on health care. Versus the industry index, exceptional stock picking far and away drove the fund's solid return. During the period, I found a lot of stocks I liked in the equipment segment, which dominates the MSCI index. Here, the fund's largest position at period end, medical device maker Boston Scientific, was easily our top contributor. Picks in the non-index life science tools & services segment also helped. I took advantage of some flatter stretches in the share price of Illumina at the beginning of the period to establish a fairly large position, but I began to dial back my exposure as the stock's valuation rose. Conversely, some choices in the non-index health care services segment nicked results, but notable relative detractors were hard to come by this period. At the individual stock level, it hurt the most to underweight St. Jude Medical, a maker of defibrillators and other implantable cardiac devices.
The views expressed above reflect those of the portfolio manager(s) only through the end of the period as stated on the cover of this report and do not necessarily represent the views of Fidelity or any other person in the Fidelity organization. Any such views are subject to change at any time based upon market or other conditions and Fidelity disclaims any responsibility to update such views. These views may not be relied on as investment advice and, because investment decisions for a Fidelity fund are based on numerous factors, may not be relied on as an indication of trading intent on behalf of any Fidelity fund.
Annual Report
Medical Equipment and Systems Portfolio
Investment Changes (Unaudited)
Top Ten Stocks as of February 28, 2014 | ||
| % of fund's | % of fund's net assets |
Boston Scientific Corp. | 12.5 | 12.1 |
Covidien PLC | 7.3 | 5.3 |
Stryker Corp. | 6.5 | 7.7 |
Intuitive Surgical, Inc. | 5.2 | 5.0 |
Abbott Laboratories | 5.0 | 3.9 |
Medtronic, Inc. | 4.3 | 6.3 |
The Cooper Companies, Inc. | 4.1 | 5.5 |
Edwards Lifesciences Corp. | 3.2 | 0.2 |
Baxter International, Inc. | 3.1 | 3.6 |
Actavis PLC | 2.6 | 2.1 |
| 53.8 | |
Top Industries (% of fund's net assets) | |||
As of February 28, 2014 | |||
| Health Care Equipment & Supplies | 86.6% |
|
| Life Sciences Tools & Services | 4.9% |
|
| Pharmaceuticals | 3.6% |
|
| Biotechnology | 1.9% |
|
| Industrial Conglomerates | 1.2% |
|
| All Others* | 1.8% |
|

As of August 31, 2013 | |||
| Health Care Equipment & Supplies | 84.0% |
|
| Pharmaceuticals | 6.9% |
|
| Health Care Technology | 2.8% |
|
| Life Sciences Tools & Services | 2.4% |
|
| Biotechnology | 2.3% |
|
| All Others* | 1.6% |
|

* Includes short-term investments and net other assets (liabilities). |
Annual Report
Medical Equipment and Systems Portfolio
Investments February 28, 2014
Showing Percentage of Net Assets
Common Stocks - 98.2% | |||
Shares | Value | ||
BIOTECHNOLOGY - 1.5% | |||
Biotechnology - 1.5% | |||
Genomic Health, Inc. (a)(d) | 300,000 | $ 7,923,000 | |
Grifols SA ADR | 300,000 | 12,624,000 | |
Myriad Genetics, Inc. (a) | 128,000 | 4,634,880 | |
| 25,181,880 | ||
HEALTH CARE EQUIPMENT & SUPPLIES - 85.8% | |||
Health Care Equipment - 75.3% | |||
Abbott Laboratories | 2,150,000 | 85,527,000 | |
Accuray, Inc. (a)(d) | 1,280,000 | 12,006,400 | |
Atricure, Inc. (a) | 560,000 | 11,642,400 | |
Baxter International, Inc. | 770,000 | 53,515,000 | |
Boston Scientific Corp. (a) | 16,400,000 | 214,840,001 | |
Cardiovascular Systems, Inc. (a) | 350,000 | 12,250,000 | |
CONMED Corp. | 730,000 | 34,032,600 | |
Covidien PLC | 1,750,000 | 125,912,500 | |
DexCom, Inc. (a) | 200,000 | 9,020,000 | |
Edwards Lifesciences Corp. (a)(d) | 800,000 | 55,808,000 | |
Exactech, Inc. (a)(e) | 800,000 | 18,640,000 | |
Genmark Diagnostics, Inc. (a) | 1,272,306 | 15,852,933 | |
HeartWare International, Inc. (a) | 240,000 | 23,047,200 | |
Inogen, Inc. | 295,000 | 5,165,450 | |
Insulet Corp. (a) | 380,000 | 18,015,800 | |
Integra LifeSciences Holdings Corp. (a) | 500,000 | 23,520,000 | |
Intuitive Surgical, Inc. (a) | 200,000 | 88,966,000 | |
Lumenis Ltd. Class B | 400,000 | 4,880,000 | |
Masimo Corp. (a) | 1,250,000 | 31,937,500 | |
Medtronic, Inc. | 1,240,000 | 73,482,400 | |
Natus Medical, Inc. (a) | 600,000 | 15,060,000 | |
NxStage Medical, Inc. (a) | 500,000 | 6,935,000 | |
PW Medtech Group Ltd. (a) | 10,000,000 | 4,522,875 | |
ResMed, Inc. (d) | 1,000,000 | 44,020,000 | |
Smith & Nephew PLC sponsored ADR (d) | 470,000 | 37,430,800 | |
St. Jude Medical, Inc. | 290,000 | 19,522,800 | |
Steris Corp. | 511,420 | 23,602,033 | |
Stryker Corp. | 1,400,000 | 112,336,000 | |
Teleflex, Inc. | 60,000 | 6,119,400 | |
Tornier NV (a) | 1,000,000 | 19,200,000 | |
Varian Medical Systems, Inc. (a) | 80,000 | 6,706,400 | |
Volcano Corp. (a)(d) | 1,500,000 | 32,190,000 | |
Wright Medical Group, Inc. (a) | 400,000 | 12,728,000 | |
Zeltiq Aesthetics, Inc. (a) | 550,000 | 10,444,500 | |
Zimmer Holdings, Inc. | 280,000 | 26,275,200 | |
| 1,295,154,192 | ||
Health Care Supplies - 10.5% | |||
Alere, Inc. (a) | 570,000 | 20,941,800 | |
Align Technology, Inc. (a) | 80,000 | 4,186,400 | |
ASAHI INTECC Co. Ltd. | 160,000 | 6,862,533 | |
| |||
Shares | Value | ||
DENTSPLY International, Inc. | 700,000 | $ 31,766,000 | |
Derma Sciences, Inc. (a) | 400,000 | 5,876,000 | |
Quidel Corp. (a)(d) | 400,000 | 11,208,000 | |
The Cooper Companies, Inc. | 550,000 | 70,515,500 | |
The Spectranetics Corp. (a) | 700,000 | 20,972,000 | |
Vascular Solutions, Inc. (a) | 360,000 | 9,367,200 | |
| 181,695,433 | ||
TOTAL HEALTH CARE EQUIPMENT & SUPPLIES | 1,476,849,625 | ||
HEALTH CARE PROVIDERS & SERVICES - 1.2% | |||
Health Care Distributors & Services - 0.6% | |||
Amplifon SpA | 1,600,000 | 9,783,566 | |
Health Care Services - 0.6% | |||
Miraca Holdings, Inc. | 250,000 | 11,398,251 | |
TOTAL HEALTH CARE PROVIDERS & SERVICES | 21,181,817 | ||
INDUSTRIAL CONGLOMERATES - 1.2% | |||
Industrial Conglomerates - 1.2% | |||
Danaher Corp. | 280,000 | 21,417,200 | |
LIFE SCIENCES TOOLS & SERVICES - 4.9% | |||
Life Sciences Tools & Services - 4.9% | |||
Agilent Technologies, Inc. | 420,000 | 23,910,600 | |
Bruker BioSciences Corp. (a) | 460,000 | 10,460,400 | |
Eurofins Scientific SA | 35,000 | 10,232,164 | |
Illumina, Inc. (a) | 228,000 | 39,099,720 | |
| 83,702,884 | ||
PHARMACEUTICALS - 3.6% | |||
Pharmaceuticals - 3.6% | |||
Actavis PLC (a) | 200,000 | 44,164,000 | |
Salix Pharmaceuticals Ltd. (a) | 160,000 | 17,267,200 | |
| 61,431,200 | ||
TOTAL COMMON STOCKS (Cost $1,182,792,093) |
| ||
Preferred Stocks - 1.6% | |||
|
|
|
|
Convertible Preferred Stocks - 0.8% | |||
BIOTECHNOLOGY - 0.4% | |||
Biotechnology - 0.4% | |||
Ariosa Diagnostics (a)(f) | 347,782 | 2,100,603 | |
Ariosa Diagnostics Series B (f) | 53,177 | 321,189 | |
Roka Bioscience, Inc. Series E, 8.00% (f) | 3,136,640 | 4,000,000 | |
| 6,421,792 | ||
Preferred Stocks - continued | |||
Shares | Value | ||
Convertible Preferred Stocks - continued | |||
HEALTH CARE TECHNOLOGY - 0.4% | |||
Health Care Technology - 0.4% | |||
Castlight Health, Inc. Series D (a)(f) | 999,300 | $ 8,094,330 | |
TOTAL CONVERTIBLE PREFERRED STOCKS | 14,516,122 | ||
Nonconvertible Preferred Stocks - 0.8% | |||
HEALTH CARE EQUIPMENT & SUPPLIES - 0.8% | |||
Health Care Equipment - 0.8% | |||
Sartorius AG (non-vtg.) | 100,000 | 13,568,349 | |
TOTAL PREFERRED STOCKS (Cost $21,847,076) |
| ||
Money Market Funds - 3.8% | |||
|
|
|
|
Fidelity Cash Central Fund, 0.10% (b) | 1,086,765 | 1,086,765 | |
Fidelity Securities Lending Cash Central Fund, 0.09% (b)(c) | 63,416,228 | 63,416,228 | |
TOTAL MONEY MARKET FUNDS (Cost $64,502,993) |
| ||
TOTAL INVESTMENT PORTFOLIO - 103.6% (Cost $1,269,142,162) | 1,782,352,070 | ||
NET OTHER ASSETS (LIABILITIES) - (3.6)% | (62,035,502) | ||
NET ASSETS - 100% | $ 1,720,316,568 | ||
Legend |
(a) Non-income producing |
(b) Affiliated fund that is generally available only to investment companies and other accounts managed by Fidelity Investments. The rate quoted is the annualized seven-day yield of the fund at period end. A complete unaudited listing of the fund's holdings as of its most recent quarter end is available upon request. In addition, each Fidelity Central Fund's financial statements, which are not covered by the Fund's Report of Independent Registered Public Accounting Firm, are available on the SEC's website or upon request. |
(c) Investment made with cash collateral received from securities on loan. |
(d) Security or a portion of the security is on loan at period end. |
(e) Affiliated company |
(f) Restricted securities - Investment in securities not registered under the Securities Act of 1933 (excluding 144A issues). At the end of the period, the value of restricted securities (excluding 144A issues) amounted to $14,516,122 or 0.8% of net assets. |
Additional information on each restricted holding is as follows: |
Security | Acquisition Date | Acquisition Cost |
Ariosa Diagnostics | 11/30/11 - 3/1/13 | $ 2,100,603 |
Ariosa Diagnostics Series B | 3/1/13 | $ 321,189 |
Castlight Health, Inc. Series D | 4/25/12 | $ 6,032,334 |
Roka Bioscience, Inc. Series E, 8.00% | 11/20/13 | $ 4,000,000 |
Affiliated Central Funds |
Information regarding fiscal year to date income earned by the Fund from investments in Fidelity Central Funds is as follows: |
Fund | Income earned |
Fidelity Cash Central Fund | $ 11,144 |
Fidelity Securities Lending Cash Central Fund | 398,671 |
Total | $ 409,815 |
Other Affiliated Issuers |
An affiliated company is a company in which the Fund has ownership of at least 5% of the voting securities. Fiscal year to date transactions with companies which are or were affiliates are as follows: |
Affiliate | Value, | Purchases | Sales | Dividend | Value, |
Exactech, Inc. | $ 16,569,000 | $ 2,043,545 | $ 4,146,176 | $ - | $ 18,640,000 |
Other Information |
The following is a summary of the inputs used, as of February 28, 2014, involving the Fund's assets and liabilities carried at fair value. The inputs or methodology used for valuing securities may not be an indication of the risk associated with investing in those securities. For more information on valuation inputs, and their aggregation into the levels used in the table below, please refer to the Investment Valuation section in the accompanying Notes to Financial Statements. |
Valuation Inputs at Reporting Date: | ||||
Description | Total | Level 1 | Level 2 | Level 3 |
Investments in Securities: | ||||
Common Stocks | $ 1,689,764,606 | $ 1,689,764,606 | $ - | $ - |
Preferred Stocks | 28,084,471 | 13,568,349 | - | 14,516,122 |
Money Market Funds | 64,502,993 | 64,502,993 | - | - |
Total Investments in Securities: | $ 1,782,352,070 | $ 1,767,835,948 | $ - | $ 14,516,122 |
Distribution of investments by country or territory of incorporation, as a percentage of total net assets, is as follows (Unaudited): |
United States of America | 82.5% |
Ireland | 9.9% |
United Kingdom | 2.2% |
Netherlands | 1.1% |
Japan | 1.0% |
Others (Individually Less Than 1%) | 3.3% |
| 100.0% |
See accompanying notes which are an integral part of the financial statements.
Annual Report
Medical Equipment and Systems Portfolio
Financial Statements
Statement of Assets and Liabilities
| February 28, 2014 | |
|
|
|
Assets | ||
Investment in securities, at value (including securities loaned of $61,617,185) - See accompanying schedule: Unaffiliated issuers (cost $1,191,512,283) | $ 1,699,209,077 |
|
Fidelity Central Funds (cost $64,502,993) | 64,502,993 |
|
Other affiliated issuers (cost $13,126,886) | 18,640,000 |
|
Total Investments (cost $1,269,142,162) |
| $ 1,782,352,070 |
Receivable for investments sold | 10,073,558 | |
Receivable for fund shares sold | 1,352,072 | |
Dividends receivable | 386,648 | |
Distributions receivable from Fidelity Central Funds | 89,358 | |
Prepaid expenses | 7,664 | |
Other receivables | 29,995 | |
Total assets | 1,794,291,365 | |
|
|
|
Liabilities | ||
Payable for investments purchased | $ 6,648,305 | |
Payable for fund shares redeemed | 2,749,228 | |
Accrued management fee | 789,193 | |
Other affiliated payables | 303,494 | |
Other payables and accrued expenses | 68,349 | |
Collateral on securities loaned, at value | 63,416,228 | |
Total liabilities | 73,974,797 | |
|
|
|
Net Assets | $ 1,720,316,568 | |
Net Assets consist of: |
| |
Paid in capital | $ 1,122,330,970 | |
Distributions in excess of net investment income | (445,755) | |
Accumulated undistributed net realized gain (loss) on investments and foreign currency transactions | 85,220,871 | |
Net unrealized appreciation (depreciation) on investments and assets and liabilities in foreign currencies | 513,210,482 | |
Net Assets, for 45,230,670 shares outstanding | $ 1,720,316,568 | |
Net Asset Value, offering price and redemption price per share ($1,720,316,568 ÷ 45,230,670 shares) | $ 38.03 | |
Statement of Operations
| Year ended February 28, 2014 | |
|
|
|
Investment Income |
|
|
Dividends |
| $ 12,102,088 |
Interest |
| 26 |
Income from Fidelity Central Funds (including $398,671 from security lending) |
| 409,815 |
Total income |
| 12,511,929 |
|
|
|
Expenses | ||
Management fee | $ 8,335,383 | |
Transfer agent fees | 3,008,833 | |
Accounting and security lending fees | 478,480 | |
Custodian fees and expenses | 55,330 | |
Independent trustees' compensation | 28,607 | |
Registration fees | 60,325 | |
Audit | 44,736 | |
Legal | 23,283 | |
Interest | 2,591 | |
Miscellaneous | 16,995 | |
Total expenses before reductions | 12,054,563 | |
Expense reductions | (84,853) | 11,969,710 |
Net investment income (loss) | 542,219 | |
Realized and Unrealized Gain (Loss) Net realized gain (loss) on: | ||
Investment securities: |
|
|
Unaffiliated issuers | 241,759,902 | |
Other affiliated issuers | 244,151 |
|
Foreign currency transactions | (54,442) | |
Total net realized gain (loss) |
| 241,949,611 |
Change in net unrealized appreciation (depreciation) on: Investment securities | 235,331,272 | |
Assets and liabilities in foreign currencies | 15,720 | |
Total change in net unrealized appreciation (depreciation) |
| 235,346,992 |
Net gain (loss) | 477,296,603 | |
Net increase (decrease) in net assets resulting from operations | $ 477,838,822 | |
See accompanying notes which are an integral part of the financial statements.
Annual Report
Statement of Changes in Net Assets
| Year ended | Year ended |
Increase (Decrease) in Net Assets |
|
|
Operations |
|
|
Net investment income (loss) | $ 542,219 | $ 1,676,247 |
Net realized gain (loss) | 241,949,611 | 55,693,801 |
Change in net unrealized appreciation (depreciation) | 235,346,992 | 112,550,953 |
Net increase (decrease) in net assets resulting from operations | 477,838,822 | 169,921,001 |
Distributions to shareholders from net investment income | - | (2,142,447) |
Distributions to shareholders from net realized gain | (151,100,524) | (54,255,083) |
Total distributions | (151,100,524) | (56,397,530) |
Share transactions | 331,322,104 | 216,598,206 |
Reinvestment of distributions | 144,921,726 | 54,158,373 |
Cost of shares redeemed | (487,114,820) | (340,863,585) |
Net increase (decrease) in net assets resulting from share transactions | (10,870,990) | (70,107,006) |
Redemption fees | 12,218 | 8,764 |
Total increase (decrease) in net assets | 315,879,526 | 43,425,229 |
|
|
|
Net Assets | ||
Beginning of period | 1,404,437,042 | 1,361,011,813 |
End of period (including distributions in excess of net investment income of $445,755 and distributions in excess of net investment income of $943,858, respectively) | $ 1,720,316,568 | $ 1,404,437,042 |
Other Information Shares | ||
Sold | 9,478,330 | 7,408,450 |
Issued in reinvestment of distributions | 4,182,266 | 1,952,608 |
Redeemed | (14,326,567) | (12,033,703) |
Net increase (decrease) | (665,971) | (2,672,645) |
Financial Highlights
Years ended February 28, | 2014 | 2013 | 2012 G | 2011 | 2010 |
Selected Per-Share Data |
|
|
|
|
|
Net asset value, beginning of period | $ 30.60 | $ 28.02 | $ 29.55 | $ 25.23 | $ 17.30 |
Income from Investment Operations |
|
|
|
|
|
Net investment income (loss) B | .01 | .04 | .01 | (.01) E | (.03) |
Net realized and unrealized gain (loss) | 10.94 | 3.77 | (.10) | 4.33 | 7.96 |
Total from investment operations | 10.95 | 3.81 | (.09) | 4.32 | 7.93 |
Distributions from net investment income | - | (.05) | (.02) | - | - |
Distributions from net realized gain | (3.52) | (1.18) | (1.43) | - | - |
Total distributions | (3.52) | (1.23) | (1.44) I | - | - |
Redemption fees added to paid in capital B, H | - | - | - | - | - |
Net asset value, end of period | $ 38.03 | $ 30.60 | $ 28.02 | $ 29.55 | $ 25.23 |
Total Return A | 37.03% | 14.09% | .23% | 17.12% | 45.84% |
Ratios to Average Net Assets C, F |
|
|
|
|
|
Expenses before reductions | .80% | .83% | .84% | .86% | .91% |
Expenses net of fee waivers, if any | .80% | .83% | .84% | .86% | .91% |
Expenses net of all reductions | .79% | .82% | .84% | .86% | .90% |
Net investment income (loss) | .04% | .13% | .02% | (.04)% E | (.13)% |
Supplemental Data |
|
|
|
|
|
Net assets, end of period (000 omitted) | $ 1,720,317 | $ 1,404,437 | $ 1,361,012 | $ 1,408,343 | $ 1,377,991 |
Portfolio turnover rate D | 75% | 69% | 120% | 92% | 83% |
A Total returns would have been lower if certain expenses had not been reduced during the applicable periods shown.
B Calculated based on average shares outstanding during the period.
C Fees and expenses of any underlying Fidelity Central Funds are not included in the Fund's expense ratio. The Fund indirectly bears its proportionate share of the expenses of any underlying Fidelity Central Funds.
D Amount does not include the portfolio activity of any underlying Fidelity Central Funds.
E Investment income per share reflects a large, non-recurring dividend which amounted to $.04 per share. Excluding this non-recurring dividend, the ratio of net investment income (loss) to average net assets would have been (.18)%.
F Expense ratios reflect operating expenses of the Fund. Expenses before reductions do not reflect amounts reimbursed by the investment adviser or reductions from brokerage service arrangements or reductions from other expense offset arrangements and do not represent the amount paid by the Fund during periods when reimbursements or reductions occur. Expenses net of fee waivers reflect expenses after reimbursement by the investment adviser but prior to reductions from brokerage service arrangements or other expense offset arrangements. Expenses net of all reductions represent the net expenses paid by the Fund.
G For the year ended February 29.
H Amount represents less than $.01 per share.
I Total distributions of $1.44 per share is comprised of distributions from net investment income of $.015 and distributions from net realized gain of $1.426 per share.
See accompanying notes which are an integral part of the financial statements.
Annual Report
Pharmaceuticals Portfolio
Performance: The Bottom Line
Average annual total return reflects the change in the value of an investment, assuming reinvestment of the fund's distributions from dividend income and capital gains (the profits earned upon the sale of securities that have grown in value, if any) and assuming a constant rate of performance each year. The $10,000 table and the fund's returns do not reflect the deduction of taxes that a shareholder would pay on fund distributions or the redemption of fund shares. During periods of reimbursement by Fidelity, a fund's total return will be greater than it would be had the reimbursement not occurred. How a fund did yesterday is no guarantee of how it will do tomorrow.
Average Annual Total Returns
Periods ended February 28, 2014 | Past 1 | Past 5 | Past 10 |
Pharmaceuticals Portfolio | 46.77% | 28.17% | 12.56% |
$10,000 Over 10 Years
Let's say hypothetically that $10,000 was invested in Pharmaceuticals Portfolio on February 29, 2004. The chart shows how the value of your investment would have changed, and also shows how the S&P 500 Index performed over the same period.
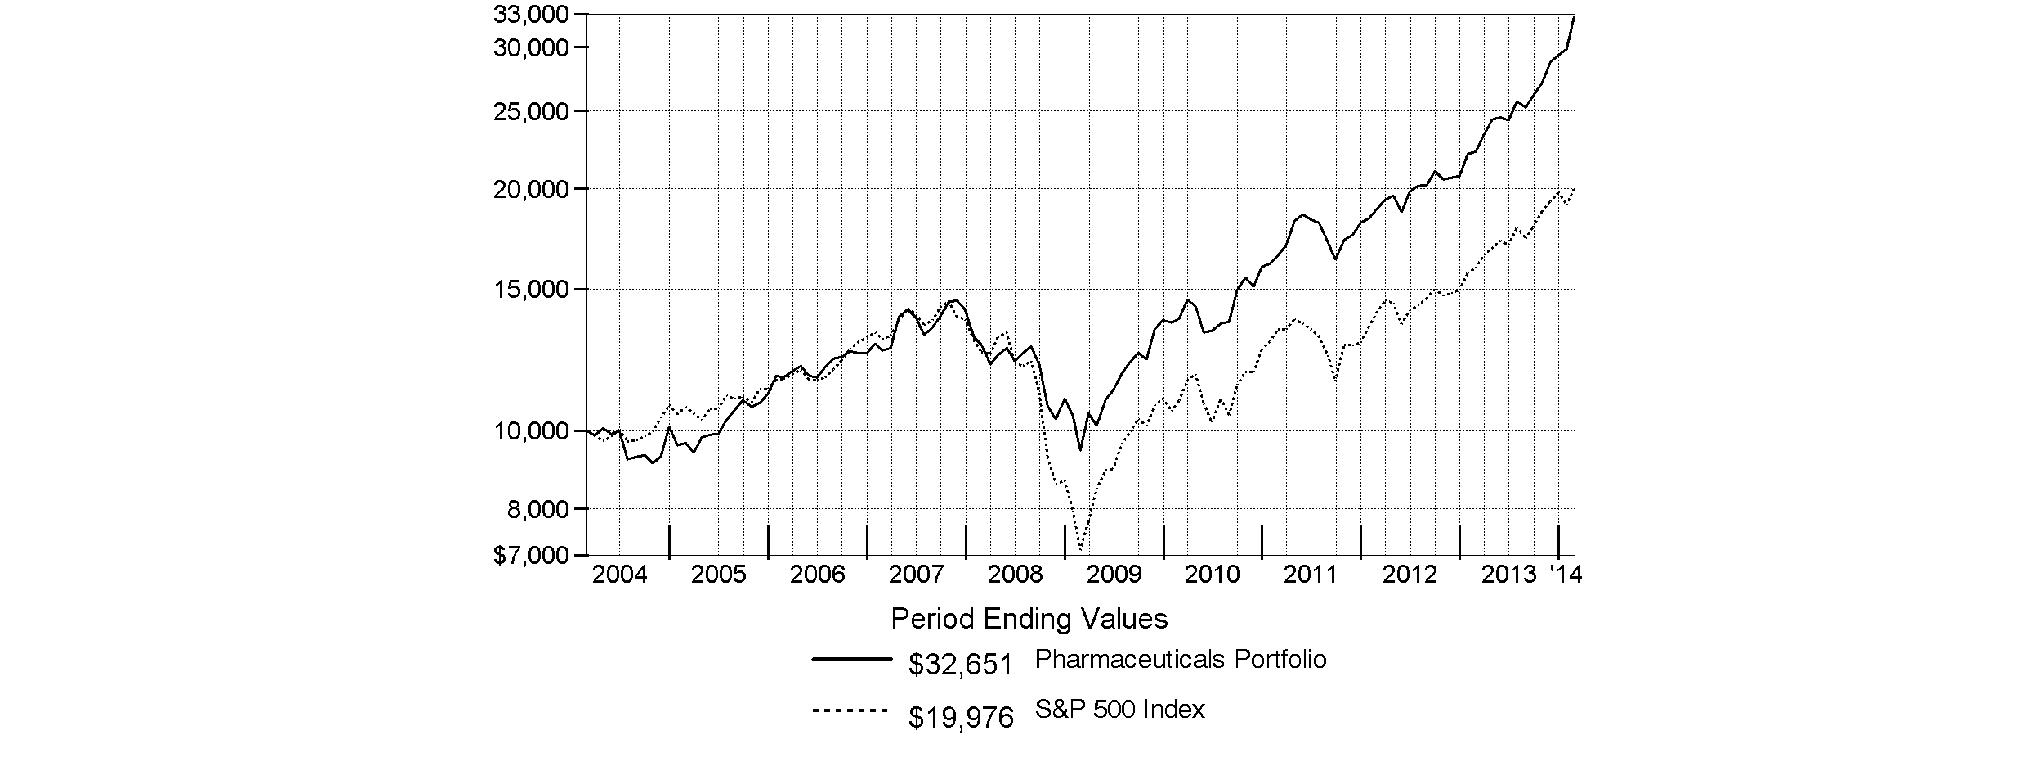
Annual Report
Pharmaceuticals Portfolio
Management's Discussion of Fund Performance
Market Recap: Stocks overcame fears of higher interest rates - not to mention their worst January in four years - to finish sharply higher for the 12 months ending February 28, 2014. The broad S&P 500® Index and the blue-chip Dow Jones Industrial AverageSM gained 25.37% and 19.01%, respectively, amid generally favorable earnings reports and accommodative monetary policies worldwide. Performance generally increased along the risk spectrum, with smaller-cap and growth strategies leading the way. An ebullient market helped the growth-oriented Nasdaq Composite Index® to a 38.10% period gain, for example. On the other hand, both cyclical and defensive stocks had representation in the top-performing industry sectors: returns were highest in health care and consumer discretionary; lowest in utilities and telecommunication services. From a macroeconomic perspective, data still points to slow but steady improvement in the U.S., and Europe's recession may well be over. Reports from China have disappointed, but continue to suggest a relatively soft landing there. Mixed signals from the U.S. Federal Reserve as to when it might curtail its stimulative bond buying kept markets in flux during the spring and summer. Stocks regained momentum in October despite a federal budget impasse and brief government shutdown, and lower volatility prevailed through year-end. Shedding new-year concerns about China's economy, an emerging-markets sell-off and confirmation (at last) of Fed tapering - alongside confirmation of a presumably dovish Janet Yellen as new Fed chair - February saw stocks back in record territory, bearing down on the five-year anniversary of the market's bottom.
Comments from Asher Anolic, Portfolio Manager of Pharmaceuticals Portfolio: For the year, the fund returned 46.77%, outpacing the 44.24% gain of the S&P® Custom Pharmaceuticals Index and the broad-based S&P 500® Index. A big driver behind the index and fund's strength this period was mid- and small-cap names that offered either a compelling product or generic drugs. The fund's biggest contributor versus the industry index was Actavis. The generic drugmaker announced in May it would acquire Ireland-based Warner Chilcott, which focuses on women's dermatology and gastrointestinal products. This acquisition, completed in October, helped Actavis grow its branded products lineup and gave the firm a tax-rate advantage. In February, Actavis reported plans to buy Forest Laboratories, adding higher-margin, branded treatments for Alzheimer's, hypertension and other disorders to its drug portfolio. Over-the-counter medicine maker Perrigo was another contributor, and its shares benefited from its October announcement of first-quarter 2014 financial results that beat analysts' expectations. Elsewhere, underweighting large index component and pharma giant Johnson & Johnson turned out to be a big contributor this period. The stock performed nicely on an absolute basis, but it couldn't keep pace with the rapid growth of its industry peers. On the flip side, overweighting France-based Sanofi hurt, as the stock suffered over the past year, as management misexecuted and investors became wary of potential future competition for Lantus®, its treatment for diabetes. Underweighting global biopharma giant Bristol-Myers Squibb was another big detractor. The stock had a big runup in May amid optimism about the firm's new oncology drug candidate, nivolumab. Of note, a small cash position, on average, also hurt the fund in a rising market.
The views expressed above reflect those of the portfolio manager(s) only through the end of the period as stated on the cover of this report and do not necessarily represent the views of Fidelity or any other person in the Fidelity organization. Any such views are subject to change at any time based upon market or other conditions and Fidelity disclaims any responsibility to update such views. These views may not be relied on as investment advice and, because investment decisions for a Fidelity fund are based on numerous factors, may not be relied on as an indication of trading intent on behalf of any Fidelity fund.
Annual Report
Pharmaceuticals Portfolio
Investment Changes (Unaudited)
Top Ten Stocks as of February 28, 2014 | ||
| % of fund's | % of fund's net assets |
Novartis AG sponsored ADR | 6.3 | 6.9 |
AbbVie, Inc. | 6.2 | 3.7 |
AstraZeneca PLC sponsored ADR | 5.8 | 2.9 |
Actavis PLC | 5.4 | 3.3 |
Sanofi SA sponsored ADR | 5.4 | 8.7 |
Johnson & Johnson | 5.1 | 7.8 |
Bristol-Myers Squibb Co. | 5.1 | 3.5 |
Perrigo Co. PLC | 4.7 | 4.0 |
Merck & Co., Inc. | 4.4 | 4.9 |
Valeant Pharmaceuticals International (Canada) | 3.9 | 3.6 |
| 52.3 | |
Top Industries (% of fund's net assets) | |||
As of February 28, 2014 | |||
| Pharmaceuticals | 87.3% |
|
| Biotechnology | 5.8% |
|
| Health Care Equipment & Supplies | 2.4% |
|
| Health Care Providers & Services | 1.2% |
|
| Household Products | 0.9% |
|
| All Others* | 2.4% |
|

As of August 31, 2013 | |||
| Pharmaceuticals | 91.7% |
|
| Biotechnology | 5.5% |
|
| Health Care Equipment & Supplies | 0.7% |
|
| Personal Products | 0.3% |
|
| Chemicals | 0.3% |
|
| All Others* | 1.5% |
|

* Includes short-term investments and net other assets (liabilities). |
Annual Report
Pharmaceuticals Portfolio
Investments February 28, 2014
Showing Percentage of Net Assets
Common Stocks - 98.2% | |||
Shares | Value | ||
BIOTECHNOLOGY - 5.8% | |||
Biotechnology - 5.8% | |||
Agios Pharmaceuticals, Inc. | 2,300 | $ 71,898 | |
Agios Pharmaceuticals, Inc. (e) | 18,514 | 578,748 | |
Alexion Pharmaceuticals, Inc. (a) | 54,900 | 9,706,320 | |
AMAG Pharmaceuticals, Inc. (a)(d) | 113,600 | 2,354,928 | |
Amgen, Inc. | 148,800 | 18,454,176 | |
Cara Therapeutics, Inc. | 150,300 | 2,837,664 | |
Celldex Therapeutics, Inc. (a) | 33,100 | 967,182 | |
Cubist Pharmaceuticals, Inc. (a) | 147,500 | 11,729,200 | |
Discovery Laboratories, Inc. (a) | 232,000 | 612,480 | |
Eleven Biotherapeutics, Inc. | 29,100 | 471,420 | |
Genmab A/S (a) | 86,500 | 3,907,019 | |
Grifols SA Class B | 5,400 | 228,937 | |
Innate Pharma SA (a) | 190,800 | 2,765,293 | |
Insmed, Inc. (a) | 72,100 | 1,442,721 | |
Intercept Pharmaceuticals, Inc. (a) | 15,798 | 6,485,079 | |
Medivation, Inc. (a) | 188,100 | 13,526,271 | |
Novavax, Inc. (a) | 319,100 | 2,042,240 | |
Oncothyreon, Inc. (a)(d) | 343,600 | 1,061,724 | |
Regulus Therapeutics, Inc. (a) | 54,000 | 606,420 | |
Swedish Orphan Biovitrum AB (a) | 153,900 | 2,040,270 | |
United Therapeutics Corp. (a) | 102,900 | 10,436,118 | |
Vanda Pharmaceuticals, Inc. (a) | 134,200 | 2,030,446 | |
| 94,356,554 | ||
CHEMICALS - 0.3% | |||
Specialty Chemicals - 0.3% | |||
Royal DSM NV | 74,901 | 4,786,248 | |
HEALTH CARE EQUIPMENT & SUPPLIES - 2.4% | |||
Health Care Equipment - 2.4% | |||
Abbott Laboratories | 883,300 | 35,137,674 | |
DBV Technologies SA (a)(d) | 83,000 | 2,405,863 | |
Genmark Diagnostics, Inc. (a) | 63,400 | 789,964 | |
| 38,333,501 | ||
HEALTH CARE PROVIDERS & SERVICES - 1.2% | |||
Health Care Distributors & Services - 0.7% | |||
McKesson Corp. | 32,300 | 5,718,715 | |
PharMerica Corp. (a) | 218,000 | 5,253,800 | |
| 10,972,515 | ||
Health Care Services - 0.5% | |||
Accretive Health, Inc. (a) | 406,452 | 3,365,423 | |
Express Scripts Holding Co. (a) | 68,200 | 5,136,142 | |
| 8,501,565 | ||
TOTAL HEALTH CARE PROVIDERS & SERVICES | 19,474,080 | ||
HOUSEHOLD PRODUCTS - 0.9% | |||
Household Products - 0.9% | |||
Reckitt Benckiser Group PLC | 187,400 | 15,420,656 | |
| |||
Shares | Value | ||
LIFE SCIENCES TOOLS & SERVICES - 0.3% | |||
Life Sciences Tools & Services - 0.3% | |||
Eurofins Scientific SA | 17,300 | $ 5,057,612 | |
PERSONAL PRODUCTS - 0.0% | |||
Personal Products - 0.0% | |||
MYOS Corp. (a)(f) | 40,000 | 356,000 | |
PHARMACEUTICALS - 87.3% | |||
Pharmaceuticals - 87.3% | |||
AbbVie, Inc. | 1,975,790 | 100,587,469 | |
Actavis PLC (a) | 402,320 | 88,840,302 | |
Aerie Pharmaceuticals, Inc. | 91,900 | 2,110,943 | |
Akorn, Inc. (a) | 47,900 | 1,236,778 | |
ALK-Abello A/S | 30,500 | 3,948,950 | |
Allergan, Inc. | 75,900 | 9,639,300 | |
AstraZeneca PLC sponsored ADR | 1,391,800 | 94,308,368 | |
Auxilium Pharmaceuticals, Inc. (a) | 172,700 | 5,310,525 | |
Bayer AG | 68,700 | 9,757,658 | |
Biodelivery Sciences International, Inc. (a) | 396,900 | 3,718,953 | |
Bristol-Myers Squibb Co. | 1,550,910 | 83,392,431 | |
Cempra, Inc. (a) | 262,200 | 2,986,458 | |
DepoMed, Inc. (a) | 562,100 | 6,773,305 | |
Durect Corp. (a) | 865,100 | 1,202,489 | |
Eli Lilly & Co. | 420,800 | 25,083,888 | |
Endo Health Solutions, Inc. (a)(d) | 310,400 | 24,776,128 | |
Forest Laboratories, Inc. (a) | 476,200 | 46,462,834 | |
GlaxoSmithKline PLC sponsored ADR | 850,800 | 47,593,752 | |
Impax Laboratories, Inc. (a) | 271,000 | 6,983,670 | |
Jazz Pharmaceuticals PLC (a) | 124,200 | 18,871,569 | |
Johnson & Johnson | 905,700 | 83,433,084 | |
Lannett Co., Inc. (a) | 51,500 | 2,208,835 | |
Merck & Co., Inc. | 1,247,236 | 71,079,980 | |
Mylan, Inc. (a) | 935,100 | 51,963,507 | |
Novartis AG sponsored ADR | 1,228,098 | 102,153,192 | |
Novo Nordisk A/S Series B sponsored ADR | 781,000 | 37,120,930 | |
Pacira Pharmaceuticals, Inc. (a) | 50,000 | 3,912,000 | |
Pain Therapeutics, Inc. (a) | 221,917 | 1,253,831 | |
Paladin Labs, Inc. (a) | 67,700 | 8,685,507 | |
Perrigo Co. PLC | 463,552 | 76,226,491 | |
Pfizer, Inc. | 1,840,088 | 59,085,226 | |
Prestige Brands Holdings, Inc. (a) | 124,592 | 3,549,626 | |
Questcor Pharmaceuticals, Inc. (d) | 307,900 | 18,704,925 | |
Revance Therapeutics, Inc. | 7,400 | 199,282 | |
Roche Holding AG (participation certificate) | 135,683 | 41,776,814 | |
Sagent Pharmaceuticals, Inc. (a) | 434,000 | 9,183,440 | |
Salix Pharmaceuticals Ltd. (a) | 259,000 | 27,951,280 | |
Sanofi SA sponsored ADR | 1,703,322 | 88,300,212 | |
Shire PLC sponsored ADR (d) | 259,900 | 42,922,485 | |
Teva Pharmaceutical Industries Ltd. sponsored ADR | 487,189 | 24,305,859 | |
The Medicines Company (a) | 105,200 | 3,213,860 | |
Common Stocks - continued | |||
Shares | Value | ||
PHARMACEUTICALS - CONTINUED | |||
Pharmaceuticals - continued | |||
UCB SA | 400 | $ 32,106 | |
Valeant Pharmaceuticals International (Canada) (a) | 442,127 | 63,110,804 | |
XenoPort, Inc. (a) | 175,500 | 1,096,875 | |
Zoetis, Inc. Class A | 704,300 | 21,847,386 | |
| 1,426,903,307 | ||
TOTAL COMMON STOCKS (Cost $1,142,152,294) |
| ||
Convertible Preferred Stocks - 0.0% | |||
|
|
|
|
LIFE SCIENCES TOOLS & SERVICES - 0.0% | |||
Life Sciences Tools & Services - 0.0% | |||
Living Proof, Inc. 8.00% (f) | 112,714 |
| |
Money Market Funds - 3.8% | |||
|
|
|
|
Fidelity Cash Central Fund, 0.10% (b) | 20,085,798 | 20,085,798 | |
Fidelity Securities Lending Cash Central Fund, 0.09% (b)(c) | 41,937,240 | 41,937,240 | |
TOTAL MONEY MARKET FUNDS (Cost $62,023,038) |
| ||
TOTAL INVESTMENT PORTFOLIO - 102.0% (Cost $1,204,375,332) | 1,666,910,996 | ||
NET OTHER ASSETS (LIABILITIES) - (2.0)% | (32,167,570) | ||
NET ASSETS - 100% | $ 1,634,743,426 | ||
Legend |
(a) Non-income producing |
(b) Affiliated fund that is generally available only to investment companies and other accounts managed by Fidelity Investments. The rate quoted is the annualized seven-day yield of the fund at period end. A complete unaudited listing of the fund's holdings as of its most recent quarter end is available upon request. In addition, each Fidelity Central Fund's financial statements, which are not covered by the Fund's Report of Independent Registered Public Accounting Firm, are available on the SEC's website or upon request. |
(c) Investment made with cash collateral received from securities on loan. |
(d) Security or a portion of the security is on loan at period end. |
(e) Security exempt from registration under Rule 144A of the Securities Act of 1933. These securities may be resold in transactions exempt from registration, normally to qualified institutional buyers. At the end of the period, the value of these securities amounted to $578,748 or 0.0% of net assets. |
(f) Restricted securities - Investment in securities not registered under the Securities Act of 1933 (excluding 144A issues). At the end of the period, the value of restricted securities (excluding 144A issues) amounted to $556,000 or 0.0% of net assets. |
Additional information on each restricted holding is as follows: |
Security | Acquisition Date | Acquisition Cost |
Living Proof, Inc. 8.00% | 2/13/13 | $ 200,000 |
MYOS Corp. | 7/2/12 | $ 500,000 |
Affiliated Central Funds |
Information regarding fiscal year to date income earned by the Fund from investments in Fidelity Central Funds is as follows: |
Fund | Income earned |
Fidelity Cash Central Fund | $ 24,316 |
Fidelity Securities Lending Cash Central Fund | 270,045 |
Total | $ 294,361 |
Other Information |
The following is a summary of the inputs used, as of February 28, 2014, involving the Fund's assets and liabilities carried at fair value. The inputs or methodology used for valuing securities may not be an indication of the risk associated with investing in those securities. For more information on valuation inputs, and their aggregation into the levels used in the table below, please refer to the Investment Valuation section in the accompanying Notes to Financial Statements. |
Valuation Inputs at Reporting Date: | ||||
Description | Total | Level 1 | Level 2 | Level 3 |
Investments in Securities: | ||||
Common Stocks | $ 1,604,687,958 | $ 1,562,682,207 | $ 42,005,751 | $ - |
Convertible Preferred Stocks | 200,000 | - | - | 200,000 |
Money Market Funds | 62,023,038 | 62,023,038 | - | - |
Total Investments in Securities: | $ 1,666,910,996 | $ 1,624,705,245 | $ 42,005,751 | $ 200,000 |
Distribution of investments by country or territory of incorporation, as a percentage of total net assets, is as follows (Unaudited): |
United States of America | 51.9% |
Ireland | 11.3% |
United Kingdom | 9.6% |
Switzerland | 8.9% |
France | 5.7% |
Canada | 4.4% |
Denmark | 2.8% |
Bailiwick of Jersey | 2.6% |
Israel | 1.5% |
Others (Individually Less Than 1%) | 1.3% |
| 100.0% |
See accompanying notes which are an integral part of the financial statements.
Annual Report
Pharmaceuticals Portfolio
Financial Statements
Statement of Assets and Liabilities
| February 28, 2014 | |
|
|
|
Assets | ||
Investment in securities, at value (including securities loaned of $39,381,476) - See accompanying schedule: Unaffiliated issuers (cost $1,142,352,294) | $ 1,604,887,958 |
|
Fidelity Central Funds (cost $62,023,038) | 62,023,038 |
|
Total Investments (cost $1,204,375,332) |
| $ 1,666,910,996 |
Receivable for investments sold | 77,399,853 | |
Receivable for fund shares sold | 8,978,105 | |
Dividends receivable | 7,797,383 | |
Distributions receivable from Fidelity Central Funds | 14,168 | |
Prepaid expenses | 6,251 | |
Other receivables | 31,918 | |
Total assets | 1,761,138,674 | |
|
|
|
Liabilities | ||
Payable for investments purchased | $ 81,146,219 | |
Payable for fund shares redeemed | 2,249,131 | |
Accrued management fee | 697,828 | |
Other affiliated payables | 265,785 | |
Other payables and accrued expenses | 99,045 | |
Collateral on securities loaned, at value | 41,937,240 | |
Total liabilities | 126,395,248 | |
|
|
|
Net Assets | $ 1,634,743,426 | |
Net Assets consist of: |
| |
Paid in capital | $ 1,093,194,264 | |
Undistributed net investment income | 6,519,745 | |
Accumulated undistributed net realized gain (loss) on investments and foreign currency transactions | 72,492,942 | |
Net unrealized appreciation (depreciation) on investments and assets and liabilities in foreign currencies | 462,536,475 | |
Net Assets, for 76,411,864 shares outstanding | $ 1,634,743,426 | |
Net Asset Value, offering price and redemption price per share ($1,634,743,426 ÷ 76,411,864 shares) | $ 21.39 | |
Statement of Operations
| Year ended February 28, 2014 | |
|
|
|
Investment Income |
|
|
Dividends |
| $ 27,578,280 |
Interest |
| 319 |
Income from Fidelity Central Funds (including $270,045 from security lending) |
| 294,361 |
Income before foreign taxes withheld |
| 27,872,960 |
Less foreign taxes withheld |
| (1,790,896) |
Total income |
| 26,082,064 |
|
|
|
Expenses | ||
Management fee | $ 6,567,771 | |
Transfer agent fees | 2,437,320 | |
Accounting and security lending fees | 394,514 | |
Custodian fees and expenses | 43,934 | |
Independent trustees' compensation | 22,324 | |
Registration fees | 120,465 | |
Audit | 46,127 | |
Legal | 18,229 | |
Interest | 997 | |
Miscellaneous | 12,894 | |
Total expenses before reductions | 9,664,575 | |
Expense reductions | (78,625) | 9,585,950 |
Net investment income (loss) | 16,496,114 | |
Realized and Unrealized Gain (Loss) Net realized gain (loss) on: | ||
Investment securities: |
|
|
Unaffiliated issuers | 201,689,484 | |
Foreign currency transactions | 17,096 | |
Total net realized gain (loss) |
| 201,706,580 |
Change in net unrealized appreciation (depreciation) on: Investment securities | 250,053,245 | |
Assets and liabilities in foreign currencies | 1,874 | |
Total change in net unrealized appreciation (depreciation) |
| 250,055,119 |
Net gain (loss) | 451,761,699 | |
Net increase (decrease) in net assets resulting from operations | $ 468,257,813 | |
See accompanying notes which are an integral part of the financial statements.
Annual Report
Statement of Changes in Net Assets
| Year ended | Year ended |
Increase (Decrease) in Net Assets |
|
|
Operations |
|
|
Net investment income (loss) | $ 16,496,114 | $ 12,305,487 |
Net realized gain (loss) | 201,706,580 | 28,204,734 |
Change in net unrealized appreciation (depreciation) | 250,055,119 | 90,407,220 |
Net increase (decrease) in net assets resulting from operations | 468,257,813 | 130,917,441 |
Distributions to shareholders from net investment income | (11,589,044) | (10,455,612) |
Distributions to shareholders from net realized gain | (115,013,141) | (14,704,906) |
Total distributions | (126,602,185) | (25,160,518) |
Share transactions | 687,383,334 | 336,546,113 |
Reinvestment of distributions | 122,417,330 | 24,435,405 |
Cost of shares redeemed | (427,820,714) | (271,573,650) |
Net increase (decrease) in net assets resulting from share transactions | 381,979,950 | 89,407,868 |
Redemption fees | 43,637 | 17,062 |
Total increase (decrease) in net assets | 723,679,215 | 195,181,853 |
|
|
|
Net Assets | ||
Beginning of period | 911,064,211 | 715,882,358 |
End of period (including undistributed net investment income of $6,519,745 and undistributed net investment income of $3,565,748, respectively) | $ 1,634,743,426 | $ 911,064,211 |
Other Information Shares | ||
Sold | 36,408,752 | 22,249,886 |
Issued in reinvestment of distributions | 6,585,841 | 1,635,914 |
Redeemed | (23,077,006) | (18,109,515) |
Net increase (decrease) | 19,917,587 | 5,776,285 |
Financial Highlights
Years ended February 28, | 2014 | 2013 | 2012 F | 2011 | 2010 |
Selected Per-Share Data |
|
|
|
|
|
Net asset value, beginning of period | $ 16.13 | $ 14.11 | $ 12.74 | $ 10.93 | $ 7.60 |
Income from Investment Operations |
|
|
|
|
|
Net investment income (loss) B | .26 | .23 | .15 | .17 | .14 |
Net realized and unrealized gain (loss) | 6.96 | 2.26 | 1.64 | 1.96 | 3.35 |
Total from investment operations | 7.22 | 2.49 | 1.79 | 2.13 | 3.49 |
Distributions from net investment income | (.18) | (.20) | (.11) | (.13) | (.16) |
Distributions from net realized gain | (1.77) | (.27) | (.31) | (.19) | - |
Total distributions | (1.96) H | (.47) | (.42) | (.32) | (.16) |
Redemption fees added to paid in capital B, G | - | - | - | - | - |
Net asset value, end of period | $ 21.39 | $ 16.13 | $ 14.11 | $ 12.74 | $ 10.93 |
Total Return A | 46.77% | 17.93% | 14.34% | 19.68% | 46.05% |
Ratios to Average Net Assets C, E |
|
|
|
|
|
Expenses before reductions | .82% | .85% | .89% | .94% | 1.01% |
Expenses net of fee waivers, if any | .81% | .85% | .89% | .94% | 1.01% |
Expenses net of all reductions | .81% | .84% | .88% | .94% | 1.00% |
Net investment income (loss) | 1.39% | 1.54% | 1.12% | 1.42% | 1.49% |
Supplemental Data |
|
|
|
|
|
Net assets, end of period (000 omitted) | $ 1,634,743 | $ 911,064 | $ 715,882 | $ 391,020 | $ 235,535 |
Portfolio turnover rate D | 95% | 54% | 73% | 102% | 221% |
A Total returns would have been lower if certain expenses had not been reduced during the applicable periods shown.
B Calculated based on average shares outstanding during the period.
C Fees and expenses of any underlying Fidelity Central Funds are not included in the Fund's expense ratio. The Fund indirectly bears its proportionate share of the expenses of any underlying Fidelity Central Funds.
D Amount does not include the portfolio activity of any underlying Fidelity Central Funds.
E Expense ratios reflect operating expenses of the Fund. Expenses before reductions do not reflect amounts reimbursed by the investment adviser or reductions from brokerage service arrangements or reductions from other expense offset arrangements and do not represent the amount paid by the Fund during periods when reimbursements or reductions occur. Expenses net of fee waivers reflect expenses after reimbursement by the investment adviser but prior to reductions from brokerage service arrangements or other expense offset arrangements. Expenses net of all reductions represent the net expenses paid by the Fund.
F For the year ended February 29.
G Amount represents less than $.01 per share.
H Total distributions of $1.96 per share is comprised of distributions from net investment income of $0.182 and distributions from net realized gain of $1.773 per share.
See accompanying notes which are an integral part of the financial statements.
Annual Report
Notes to Financial Statements
For the period ended February 28, 2014
1. Organization.
Biotechnology Portfolio, Health Care Portfolio, Medical Delivery Portfolio, Medical Equipment and Systems Portfolio, and Pharmaceuticals Portfolio (the Funds) are non-diversified funds of Fidelity Select Portfolios (the Trust). The Trust is registered under the Investment Company Act of 1940, as amended (the 1940 Act), as an open-end management investment company organized as a Massachusetts business trust. The Funds invest primarily in securities of companies whose principal business activities fall within specific industries. Each Fund is authorized to issue an unlimited number of shares.
2. Investments in Fidelity Central Funds.
The Funds invest in Fidelity Central Funds, which are open-end investment companies generally available only to other investment companies and accounts managed by the investment adviser and its affiliates. The Funds' Schedules of Investments list each of the Fidelity Central Funds held as of period end, if any, as an investment of each Fund, but do not include the underlying holdings of each Fidelity Central Fund. As an Investing Fund, each Fund indirectly bears its proportionate share of the expenses of the underlying Fidelity Central Funds.
The Money Market Central Funds seek preservation of capital and current income and are managed by Fidelity Investments Money Management, Inc. (FIMM), an affiliate of the investment adviser. Annualized expenses of the Money Market Central Funds as of their most recent shareholder report date are less than .01%.
A complete unaudited list of holdings for each Fidelity Central Fund is available upon request or at the Securities and Exchange Commission (the SEC) website at www.sec.gov. In addition, the financial statements of the Fidelity Central Funds, which are not covered by the Funds' Report of Independent Registered Public Accounting Firm, are available on the SEC website or upon request.
3. Significant Accounting Policies.
The financial statements have been prepared in conformity with accounting principles generally accepted in the United States of America (GAAP), which require management to make certain estimates and assumptions at the date of the financial statements. Actual results could differ from those estimates. Subsequent events, if any, through the date that the financial statements were issued have been evaluated in the preparation of the financial statements. The following summarizes the significant accounting policies of the Funds:
Investment Valuation. Investments are valued as of 4:00 p.m. Eastern time on the last calendar day of the period. In accordance with valuation policies and procedures approved by the Board of Trustees (the Board), each Fund attempts to obtain prices from one or more third party pricing vendors or brokers to value its investments. When current market prices, quotations or currency exchange rates are not readily available or reliable, investments will be fair valued in good faith by the Fidelity SelectCo, LLC (SelectCo) Fair Value Committee (the Committee), in accordance with procedures adopted by the Board. Factors used in determining fair value vary by investment type and may include market or investment specific events. The frequency with which these procedures are used cannot be predicted and they may be utilized to a significant extent. The Committee oversees each Fund's valuation policies and procedures and is responsible for approving and reporting to the Board all fair value determinations.
Each Fund categorizes the inputs to valuation techniques used to value their investments into a disclosure hierarchy consisting of three levels as shown below:
Level 1 - quoted prices in active markets for identical investments
Level 2 - other significant observable inputs (including quoted prices for similar investments, interest rates, prepayment speeds, etc.)
Level 3 - unobservable inputs (including the Fund's own assumptions based on the best information available)
Valuation techniques used to value each Fund's investments by major category are as follows:
Equity securities, including restricted securities, for which market quotations are readily available, are valued at the last reported sale price or official closing price as reported by a third party pricing vendor on the primary market or exchange on which they are traded and are categorized as Level 1 in the hierarchy. In the event there were no sales during the day or closing prices are not available, securities are valued at the last quoted bid price or may be valued using the last available price and are generally categorized as Level 2 in the hierarchy. For foreign equity securities, when market or security specific events arise, comparisons to the valuation of American Depositary Receipts (ADRs), futures contracts, Exchange-Traded Funds (ETFs) and certain indexes as well as quoted prices for similar securities may be used and would be categorized as Level 2 in the hierarchy. Utilizing these techniques may result in transfers between Level 1 and Level 2. For equity securities, including restricted securities, where observable inputs are limited, assumptions about market activity and risk are used and these securities may be categorized as Level 3 in the hierarchy.
Investments in open-end mutual funds, including the Fidelity Central Funds, are valued at their closing net asset value (NAV) each business day and are categorized as Level 1 in the hierarchy.
Annual Report
3. Significant Accounting Policies - continued
Investment Valuation - continued
Changes in valuation techniques may result in transfers in or out of an assigned level within the disclosure hierarchy. The aggregate value of investments by input level, as of February 28, 2014 is included at the end of each applicable Fund's Schedule of Investments.
Foreign Currency. The Funds may use foreign currency contracts to facilitate transactions in foreign-denominated securities. Gains and losses from these transactions may arise from changes in the value of the foreign currency or if the counterparties do not perform under the contracts' terms.
Foreign-denominated assets, including investment securities, and liabilities are translated into U.S. dollars at the exchange rates at period end. Purchases and sales of investment securities, income and dividends received and expenses denominated in foreign currencies are translated into U.S. dollars at the exchange rate in effect on the transaction date.
The effects of exchange rate fluctuations on investments are included with the net realized and unrealized gain (loss) on investment securities. Other foreign currency transactions resulting in realized and unrealized gain (loss) are disclosed separately.
Investment Transactions and Income. For financial reporting purposes, the Funds' investment holdings and NAV include trades executed through the end of the last business day of the period. The NAV per share for processing shareholder transactions is calculated as of the close of business of the New York Stock Exchange (NYSE), normally 4:00 p.m. Eastern time and includes trades executed through the end of the prior business day. Gains and losses on securities sold are determined on the basis of identified cost and may include proceeds received from litigation. Dividend income is recorded on the ex-dividend date, except for certain dividends from foreign securities where the ex-dividend date may have passed, which are recorded as soon as the Funds are informed of the ex-dividend date. Non-cash dividends included in dividend income, if any, are recorded at the fair market value of the securities received. Distributions received on securities that represent a return of capital or capital gain are recorded as a reduction of cost of investments and/or as a realized gain. Subsequent to ex-dividend date the Funds determine the components of these distributions, based upon receipt of tax filings or other correspondence relating to the underlying investment. Interest income and distributions from the Fidelity Central Funds are accrued as earned. Interest income includes coupon interest and amortization of premium and accretion of discount on debt securities. Investment income is recorded net of foreign taxes withheld where recovery of such taxes is uncertain.
Expenses. Expenses directly attributable to a fund are charged to that fund. Expenses attributable to more than one fund are allocated among the respective funds on the basis of relative net assets or other appropriate methods. Expense estimates are accrued in the period to which they relate and adjustments are made when actual amounts are known.
Deferred Trustee Compensation. Under a Deferred Compensation Plan (the Plan) for Health Care Portfolio, independent Trustees may elect to defer receipt of a portion of their annual compensation. Deferred amounts are invested in a cross-section of Fidelity funds, are marked-to-market and remain in the Fund until distributed in accordance with the Plan. The investment of deferred amounts and the offsetting payable to the Trustees are included in the accompanying Statement of Assets and Liabilities.
Income Tax Information and Distributions to Shareholders. Each year, each Fund intends to qualify as a regulated investment company under Subchapter M of the Internal Revenue Code, including distributing substantially all of its taxable income and realized gains. As a result, no provision for U.S. Federal income taxes is required. As of February 28, 2014, each Fund did not have any unrecognized tax benefits in the financial statements; nor is each Fund aware of any tax positions for which it is reasonably possible that the total amounts of unrecognized tax benefits will significantly change in the next twelve months. Each Fund files a U.S. federal tax return, in addition to state and local tax returns as required. The Fund's federal income tax returns are subject to examination by the Internal Revenue Service (IRS) for a period of three fiscal years after they are filed. State and local tax returns may be subject to examination for an additional fiscal year depending on the jurisdiction. Foreign taxes are provided for based on each Fund's understanding of the tax rules and rates that exist in the foreign markets in which it invests.
Distributions are declared and recorded on the ex-dividend date. Income and capital gain distributions are determined in accordance with income tax regulations, which may differ from GAAP. In addition, certain Funds claimed a portion of the payment made to redeeming shareholders as a distribution for income tax purposes.
Capital accounts within the financial statements are adjusted for permanent book-tax differences. These adjustments have no impact on net assets or the results of operations. Capital accounts are not adjusted for temporary book-tax differences which will reverse in a subsequent period.
Book-tax differences are primarily due to foreign currency transactions, passive foreign investment companies (PFIC), deferred trustees compensation, net operating losses and losses deferred due to wash sales and excise tax regulation.
Annual Report
Notes to Financial Statements - continued
3. Significant Accounting Policies - continued
Income Tax Information and Distributions to Shareholders - continued
The federal tax cost of investment securities and unrealized appreciation (depreciation) as of period end were as follows for each Fund:
| Tax cost | Gross unrealized | Gross unrealized | Net unrealized |
Biotechnology Portfolio | $ 6,966,457,447 | $ 5,003,725,679 | $ (161,986,647) | $ 4,841,739,032 |
Health Care Portfolio | 4,338,613,479 | 1,991,873,364 | (33,985,130) | 1,957,888,234 |
Medical Delivery Portfolio | 469,126,890 | 256,664,056 | (9,518,753) | 247,145,303 |
Medical Equipment and Systems Portfolio | 1,272,051,663 | 529,128,789 | (18,828,382) | 510,300,407 |
Pharmaceuticals Portfolio | 1,207,064,198 | 463,658,718 | (3,811,920) | 459,846,798 |
The tax-based components of distributable earnings as of period end were as follows for each Fund:
| Undistributed | Undistributed | Net unrealized |
Biotechnology Portfolio | $ - | $ - | $ 4,841,739,032 |
Health Care Portfolio | 114,000,733 | 182,921,192 | 1,957,912,869 |
Medical Delivery Portfolio | 6,970,043 | 19,157,384 | 247,144,177 |
Medical Equipment and Systems Portfolio | 34,433,604 | 53,696,768 | 510,300,981 |
Pharmaceuticals Portfolio | 33,381,024 | 48,327,621 | 459,847,609 |
Certain of the Funds intend to elect to defer to the next fiscal year capital losses recognized during the period November 1, 2013 to February 28, 2014 and ordinary losses recognized during the period January 1, 2014 to February 28, 2014. Loss deferrals were as follows:
| Capital losses | Ordinary losses |
Biotechnology Portfolio | $ (2,992,827) | $ (2,938,950) |
Medical Equipment and Systems Portfolio | - | (436,772) |
The tax character of distributions paid was as follows:
February 28, 2014 |
|
|
|
| Ordinary Income | Long-term | Total |
Biotechnology Portfolio | $ 1,818,993 | $ 17,540,867 | $ 19,359,860 |
Health Care Portfolio | 144,841,581 | 305,640,128 | 450,481,709 |
Medical Delivery Portfolio | 23,223,879 | 18,211,743 | 41,435,622 |
Medical Equipment and Systems Portfolio | 23,860,944 | 127,239,580 | 151,100,524 |
Pharmaceuticals Portfolio | 13,738,981 | 112,863,204 | 126,602,185 |
February 28, 2013 |
|
|
|
| Ordinary Income | Long-term | Total |
Biotechnology Portfolio | $ 18,771,575 | $ 103,438,530 | $ 122,210,105 |
Health Care Portfolio | 26,738,737 | 214,482,287 | 241,221,024 |
Medical Delivery Portfolio | 299,615 | 31,559,328 | 31,858,943 |
Medical Equipment and Systems Portfolio | 2,142,447 | 54,255,083 | 56,397,530 |
Pharmaceuticals Portfolio | 11,753,342 | 13,407,176 | 25,160,518 |
Trading (Redemption) Fees. Shares held by investors in the Funds less than 30 days may be subject to a redemption fee equal to .75% of the NAV of shares redeemed. All redemption fees, which reduce the proceeds of the shareholder redemption, are retained by the Funds and accounted for as an addition to paid in capital.
Restricted Securities. The Funds may invest in securities that are subject to legal or contractual restrictions on resale. These securities generally may be resold in transactions exempt from registration or to the public if the securities are registered. Disposal of these securities may involve time-consuming negotiations and expense, and prompt sale at an acceptable price may be difficult. Information regarding restricted securities is included at the end of each applicable Fund's Schedule of Investments.
Annual Report
4. Purchases and Sales of Investments.
Purchases and sales of securities, other than short-term securities, are noted in the table below.
| Purchases ($) | Sales ($) |
Biotechnology Portfolio | 5,853,280,421 | 2,352,458,020 |
Health Care Portfolio | 5,225,313,390 | 3,930,547,367 |
Medical Delivery Portfolio | 421,449,498 | 468,587,579 |
Medical Equipment and Systems Portfolio | 1,122,830,336 | 1,271,324,375 |
Pharmaceuticals Portfolio | 1,373,472,418 | 1,108,197,777 |
5. Fees and Other Transactions with Affiliates.
Management Fee. Effective August 1, 2013, SelectCo replaced Fidelity Management and Research Company (FMR), an affiliate of SelectCo, as investment adviser to the Funds. The investment adviser and its affiliates provide the Funds with investment management related services for which the Funds pay a monthly management fee. The management fee is the sum of an individual fund fee rate and an annualized group fee rate. The individual fund fee rate is applied to each Fund's average net assets. The group fee rate is based upon the average net assets of all the mutual funds advised by FMR and the investment adviser. The group fee rate decreases as assets under management increase and increases as assets under management decrease. For the reporting period, each Fund's annual management fee rate expressed as a percentage of each Fund's average net assets was as follows.
| Individual Rate | Group Rate | Total |
Biotechnology Portfolio | .30% | .25% | .55% |
Health Care Portfolio | .30% | .25% | .55% |
Medical Delivery Portfolio | .30% | .25% | .55% |
Medical Equipment and Systems Portfolio | .30% | .25% | .55% |
Pharmaceuticals Portfolio | .30% | .25% | .55% |
Transfer Agent Fees. Fidelity Investments Institutional Operations Company, Inc. (FIIOC), an affiliate of the investment adviser, is the Funds' transfer, dividend disbursing and shareholder servicing agent. FIIOC receives account fees and asset-based fees that vary according to account size and type of account. FIIOC pays for typesetting, printing and mailing of shareholder reports, except proxy statements. For the period, transfer agent fees were equivalent to the following annual rates expressed as a percentage of average net assets:
Biotechnology Portfolio | .17% |
Health Care Portfolio | .17% |
Medical Delivery Portfolio | .21% |
Medical Equipment and Systems Portfolio | .20% |
Pharmaceuticals Portfolio | .21% |
Accounting and Security Lending Fees. Fidelity Service Company, Inc. (FSC), an affiliate of the investment adviser, maintains each Fund's accounting records. The accounting fee is based on the level of average net assets for each month. Under a separate contract, FSC administers the security lending program. The security lending fee is based on the number and duration of lending transactions.
Brokerage Commissions. Certain Funds placed a portion of their portfolio transactions with brokerage firms which are affiliates of the investment adviser. Brokerage commissions are included in net realized gain (loss) and change in net unrealized appreciation (depreciation) in the Statement of Operations. The commissions paid to these affiliated firms were as follows:
| Amount |
Biotechnology Portfolio | $ 116,279 |
Health Care Portfolio | 52,668 |
Medical Delivery Portfolio | 8,750 |
Medical Equipment and Systems Portfolio | 21,239 |
Pharmaceuticals Portfolio | 20,767 |
Annual Report
Notes to Financial Statements - continued
5. Fees and Other Transactions with Affiliates - continued
Interfund Lending Program. Pursuant to an Exemptive Order issued by the SEC, the Funds, along with other registered investment companies having management contracts with FMR or other affiliated entities of FMR, may participate in an interfund lending program. This program provides an alternative credit facility allowing the funds to borrow from, or lend money to, other participating affiliated funds. At period end, there were no interfund loans outstanding. Each applicable fund's activity in this program during the period for which loans were outstanding was as follows:
| Borrower | Average Loan | Weighted | Interest Expense |
Biotechnology Portfolio | Borrower | $ 28,231,821 | .32% | $ 9,813 |
Health Care Portfolio | Borrower | 21,411,400 | .31% | 928 |
Medical Delivery Portfolio | Borrower | 11,020,765 | .30% | 1,559 |
Medical Equipment and Systems Portfolio | Borrower | 7,064,400 | .31% | 2,142 |
Pharmaceuticals Portfolio | Borrower | 10,052,333 | .30% | 997 |
Other. During the period, the investment adviser reimbursed Biotechnology Portfolio for certain losses in the amount of $19,826.
6. Committed Line of Credit.
Certain Funds participate with other funds managed by the investment adviser or an affiliate in a $4.25 billion credit facility (the "line of credit") to be utilized for temporary or emergency purposes to fund shareholder redemptions or for other short-term liquidity purposes. The participating funds have agreed to pay commitment fees on their pro-rata portion of the line of credit, which are reflected in Miscellaneous expenses on the Statement of Operations, and are as follows:
Biotechnology Portfolio | $ 10,479 |
Health Care Portfolio | 6,760 |
Medical Delivery Portfolio | 1,279 |
Medical Equipment and Systems Portfolio | 2,873 |
Pharmaceuticals Portfolio | 2,118 |
During the period, there were no borrowings on this line of credit.
7. Security Lending.
Certain Funds lend portfolio securities through a lending agent from time to time in order to earn additional income. For equity securities, a lending agent is used and may loan securities to certain qualified borrowers, which prior to August 1, 2013 included Fidelity Capital Markets (FCM), a broker-dealer affiliated with the Funds. On the settlement date of the loan, each applicable Fund receives collateral (in the form of U.S. Treasury obligations, letters of credit and/or cash) against the loaned securities and maintains collateral in an amount not less than 100% of the market value of the loaned securities during the period of the loan. The market value of the loaned securities is determined at the close of business of the Funds and any additional required collateral is delivered to the Funds on the next business day. If the borrower defaults on its obligation to return the securities loaned because of insolvency or other reasons, the Funds may apply collateral received from the borrower against the obligation. The Funds may experience delays and costs in recovering the securities loaned. Any cash collateral received is invested in the Fidelity Securities Lending Cash Central Fund. The value of loaned securities and cash collateral at period end are disclosed on each applicable Fund's Statement of Assets and Liabilities. At period end, there were no security loans outstanding with FCM. Security lending income represents the income earned on investing cash collateral, less rebates paid to borrowers and any lending agent fees associated with the loan, plus any premium payments received for lending certain types of securities. Security lending income is presented on each applicable Fund's Statement of Operations as a component of income from Fidelity Central Funds. FCM security lending activity was as follows:
| Security Lending |
Biotechnology Portfolio | $ 488,040 |
Health Care Portfolio | 762 |
Medical Equipment and Systems Portfolio | 14,426 |
Pharmaceuticals Portfolio | 20,020 |
Annual Report
8. Bank Borrowings.
Each Fund is permitted to have bank borrowings for temporary or emergency purposes to fund shareholder redemptions or for other short-term liquidity requirements. Each Fund has established borrowing arrangements with certain banks. The interest rate on the borrowings is the bank's base rate, as revised from time to time. At period end, there were no bank borrowings outstanding. Each applicable Fund's activity in this program during the period for which loans were outstanding was as follows:
| Average Loan | Weighted Average | Interest Expense |
Medical Equipment and Systems Portfolio | $ 3,736,429 | .62% | $ 449 |
9. Expense Reductions.
Commissions paid to certain brokers with whom the investment adviser, or its affiliates, places trades on behalf of Certain Funds include an amount in addition to trade execution, which may be rebated back to the Funds to offset certain expenses. In addition, through arrangements with each applicable Fund's custodian, credits realized as a result of uninvested cash balances were used to reduce each applicable Fund's expenses. All of the applicable expense reductions are noted in the table below.
| Brokerage Service | Custody |
Biotechnology Portfolio | $ 348,777 | $ 422 |
Health Care Portfolio | 323,367 | 186 |
Medical Delivery Portfolio | 19,865 | - |
Medical Equipment and Systems Portfolio | 75,117 | 213 |
Pharmaceuticals Portfolio | 74,458 | - |
In addition, FMR reimbursed a portion of each Fund's operating expenses during the period as follows:
| Reimbursement |
Biotechnology Portfolio | $ 33,967 |
Health Care Portfolio | 18,877 |
Medical Delivery Portfolio | 4,832 |
Medical Equipment and Systems Portfolio | 9,523 |
Pharmaceuticals Portfolio | 4,167 |
10. Other.
The Funds' organizational documents provide former and current trustees and officers with a limited indemnification against liabilities arising in connection with the performance of their duties to the Funds. In the normal course of business, the Funds may also enter into contracts that provide general indemnifications. The Funds' maximum exposure under these arrangements is unknown as this would be dependent on future claims that may be made against the Funds. The risk of material loss from such claims is considered remote.
Mutual funds managed by the investment adviser or its affiliates were the owners of record, in aggregate, of approximately 20% of the total outstanding shares of Pharmaceuticals Portfolio.
Annual Report
Report of Independent Registered Public Accounting Firm
To the Trustees of Fidelity Select Portfolios and the Shareholders of Biotechnology Portfolio, Health Care Portfolio, Medical Delivery Portfolio, Medical Equipment and Systems Portfolio and Pharmaceuticals Portfolio:
In our opinion, the accompanying statements of assets and liabilities, including the schedules of investments, and the related statements of operations and of changes in net assets and the financial highlights present fairly, in all material respects, the financial positions of Biotechnology Portfolio, Health Care Portfolio, Medical Delivery Portfolio, Medical Equipment and Systems Portfolio and Pharmaceuticals Portfolio (funds of Fidelity Select Portfolios) at February 28, 2014, the results of each of their operations for the year then ended, the changes in each of their net assets for each of the two years in the period then ended and the financial highlights for each of the five years in the period then ended, in conformity with accounting principles generally accepted in the United States of America. These financial statements and financial highlights (hereafter referred to as "financial statements") are the responsibility of the Fidelity Select Portfolios' management. Our responsibility is to express an opinion on these financial statements based on our audits. We conducted our audits of these financial statements in accordance with the standards of the Public Company Accounting Oversight Board (United States). Those standards require that we plan and perform the audit to obtain reasonable assurance about whether the financial statements are free of material misstatement. An audit includes examining, on a test basis, evidence supporting the amounts and disclosures in the financial statements, assessing the accounting principles used and significant estimates made by management, and evaluating the overall financial statement presentation. We believe that our audits, which included confirmation of securities at February 28, 2014 by correspondence with the custodian and brokers, provide a reasonable basis for our opinion.
PricewaterhouseCoopers LLP
Boston, Massachusetts
April 15, 2014
Annual Report
Trustees and Officers
The Trustees and officers of the trust and funds, as applicable, are listed below. The Board of Trustees governs each fund and is responsible for protecting the interests of shareholders. The Trustees are experienced executives who meet periodically throughout the year to oversee each fund's activities, review contractual arrangements with companies that provide services to each fund, oversee management of the risks associated with such activities and contractual arrangements, and review each fund's performance. Except for Ned C. Lautenbach and William S. Stavropoulos, each of the Trustees oversees 74 funds. Mr. Lautenbach and Mr. Stavropoulos each oversees 246 funds.
The Trustees hold office without limit in time except that (a) any Trustee may resign; (b) any Trustee may be removed by written instrument, signed by at least two-thirds of the number of Trustees prior to such removal; (c) any Trustee who requests to be retired or who has become incapacitated by illness or injury may be retired by written instrument signed by a majority of the other Trustees; and (d) any Trustee may be removed at any special meeting of shareholders by a two-thirds vote of the outstanding voting securities of the trust. The officers hold office without limit in time, except that any officer may resign or may be removed by a vote of a majority of the Trustees at any regular meeting or any special meeting of the Trustees. Except as indicated, each individual has held the office shown or other offices in the same company for the past five years.
Experience, Skills, Attributes, and Qualifications of the Funds' Trustees. The Governance and Nominating Committee has adopted a statement of policy that describes the experience, qualifications, attributes, and skills that are necessary and desirable for potential Independent Trustee candidates (Statement of Policy). The Board believes that each Trustee satisfied at the time he or she was initially elected or appointed a Trustee, and continues to satisfy, the standards contemplated by the Statement of Policy. The Governance and Nominating Committee also engages professional search firms to help identify potential Independent Trustee candidates who have the experience, qualifications, attributes, and skills consistent with the Statement of Policy. From time to time, additional criteria based on the composition and skills of the current Independent Trustees, as well as experience or skills that may be appropriate in light of future changes to board composition, business conditions, and regulatory or other developments, have also been considered by the professional search firms and the Governance and Nominating Committee. In addition, the Board takes into account the Trustees' commitment and participation in Board and committee meetings, as well as their leadership of standing and ad hoc committees throughout their tenure.
In determining that a particular Trustee was and continues to be qualified to serve as a Trustee, the Board has considered a variety of criteria, none of which, in isolation, was controlling. The Board believes that, collectively, the Trustees have balanced and diverse experience, qualifications, attributes, and skills, which allow the Board to operate effectively in governing each fund and protecting the interests of shareholders. Information about the specific experience, skills, attributes, and qualifications of each Trustee, which in each case led to the Board's conclusion that the Trustee should serve (or continue to serve) as a trustee of the funds, is provided below.
Board Structure and Oversight Function. Brian B. Hogan is an interested person (as defined in the 1940 Act) and currently serves as Chairman. The Trustees have determined that an interested Chairman is appropriate and benefits shareholders because an interested Chairman has a personal and professional stake in the quality and continuity of services provided to the funds. Independent Trustees exercise their informed business judgment to appoint an individual of their choosing to serve as Chairman, regardless of whether the Trustee happens to be independent or a member of management. The Independent Trustees have determined that they can act independently and effectively without having an Independent Trustee serve as Chairman and that a key structural component for assuring that they are in a position to do so is for the Independent Trustees to constitute a substantial majority for the Board. The Independent Trustees also regularly meet in executive session. Michael E. Wiley serves as Chairman of the Independent Trustees and as such (i) acts as a liaison between the Independent Trustees and management with respect to matters important to the Independent Trustees and (ii) with management prepares agendas for Board meetings.
Fidelity funds are overseen by different Boards of Trustees. The funds' Board oversees Fidelity's sector portfolios. Other Boards oversee Fidelity's equity and high income funds, and Fidelity's investment grade bond, money market, and asset allocation funds. The use of separate Boards, each with its own committee structure, allows the Trustees of each group of Fidelity funds to focus on the unique issues of the funds they oversee, including common research, investment, and operational issues. On occasion, the separate Boards establish joint committees to address issues of overlapping consequences for the Fidelity funds overseen by each Board.
The Trustees operate using a system of committees to facilitate the timely and efficient consideration of all matters of importance to the Trustees, each fund, and fund shareholders and to facilitate compliance with legal and regulatory requirements and oversight of the funds' activities and associated risks. The Board, acting through its committees, has charged SelectCo and its affiliates with (i) identifying events or circumstances the occurrence of which could have demonstrably adverse effects on the funds' business and/or reputation; (ii) implementing processes and controls to lessen the possibility that such events or circumstances occur or to mitigate the effects of such events or circumstances if they do occur; and (iii) creating and maintaining a system designed to evaluate continuously business and market conditions in order to facilitate the identification and implementation processes described in (i) and (ii) above. Because the day-to-day operations and activities of the funds are carried out by or through SelectCo, its affiliates, and other service providers, the funds' exposure to risks is mitigated but not eliminated by the processes overseen by the Trustees. While each of the Board's committees has responsibility for overseeing different aspects of the funds' activities, oversight is exercised primarily through the Operations and Audit Committees. Appropriate personnel, including but not limited to the funds' Chief Compliance Officer (CCO), SelectCo's internal auditor, the independent accountants, the funds' Treasurer and portfolio management personnel, make periodic reports to the Board's committees, as appropriate. The responsibilities of each standing committee, including their oversight responsibilities, are described further under "Standing Committees of the Funds' Trustees."
The funds' Statement of Additional Information (SAI) includes more information about the Trustees. To request a free copy, call Fidelity at 1-800-544-8544.
Annual Report
Interested Trustee*:
Correspondence intended for the Trustee who is an interested person may be sent to Fidelity Investments, 245 Summer Street, Boston, Massachusetts 02210.
Name, Year of Birth; Principal Occupations and Other Relevant Experience+ | |
Brian B. Hogan (1964) | |
Year of Election or Appointment: 2014 Trustee Chairman of the Board of Trustees | |
| Mr. Hogan also serves as Trustee or Vice President of other funds. Mr. Hogan serves as President of FMR's Equity Division (2009-present). Previously, Mr. Hogan served as Senior Vice President, Equity Research of FMR (2006-2009) and as a portfolio manager. |
* Trustee has been determined to be an "Interested Trustee" by virtue of, among other things, his affiliation with the trust or various entities under common control with SelectCo.
+ The information above includes the Trustee's principal occupation during the last five years and other information relating to the experience, attributes, and skills relevant to the Trustee's qualifications to serve as a Trustee, which led to the conclusion that the Trustee should serve as a Trustee for each fund.
Independent Trustees:
Correspondence intended for each Independent Trustee (that is, the Trustees other than the Interested Trustee) may be sent to Fidelity Investments, P.O. Box 55235, Boston, Massachusetts 02205-5235.
Name, Year of Birth; Principal Occupations and Other Relevant Experience+ | |
Ned C. Lautenbach (1944) | |
Year of Election or Appointment: 2000 Trustee | |
| Mr. Lautenbach also serves as Trustee of other Fidelity funds. Mr. Lautenbach currently serves as the Lead Director of the Eaton Corporation Board of Directors (diversified industrial, 1997-present). Mr. Lautenbach is Chairman of the Board of Directors of the Philharmonic Center for the Arts in Naples, Florida (2012-present) and a member of the Council on Foreign Relations (1994-present). Previously, Mr. Lautenbach was a Partner/Advisory Partner at Clayton, Dubilier & Rice, LLC (private equity investment, 1998-2010), as well as a Director of Sony Corporation (2006-2007). |
David A. Rosow (1942) | |
Year of Election or Appointment: 2013 Trustee | |
| Mr. Rosow also serves as Trustee of other Fidelity funds. Mr. Rosow is Chairman and Chief Executive Officer of International Golf Group, Inc. (golf course development, 1989-present). Previously, Mr. Rosow served as Chairman and Chief Executive Officer of Rosow & Company, Inc. (private investment company, 1989-2011), a Lead Director of Hudson United Bancorp (2001-2006) and as a Director of TD Banknorth (1996-2006). In addition, Mr. Rosow is a member (2008-present) and President (2009-present) of the Town Council of Palm Beach, Florida. Mr. Rosow served as a Member of the Advisory Board of other Fidelity funds (2012-2013). |
Garnett A. Smith (1947) | |
Year of Election or Appointment: 2013 Trustee | |
| Mr. Smith also serves as Trustee of other Fidelity funds. Prior to Mr. Smith's retirement, he served as Chairman and Chief Executive Officer of Inbrand Corp. (manufacturer of personal absorbent products, 1990-1997). He also served as President (1986-1990) of Inbrand Corp. Prior to his employment with Inbrand Corp., he was employed by a retail fabric chain and North Carolina National Bank. In addition, Mr. Smith is a board member of the Jackson Hole Land Trust (2009-present). Mr. Smith served as a Member of the Advisory Board of other Fidelity funds (2012-2013). |
William S. Stavropoulos (1939) | |
Year of Election or Appointment: 2001 Trustee | |
| Mr. Stavropoulos also serves as Trustee of other Fidelity funds. Mr. Stavropoulos serves as President and Founder of the Michigan Baseball Foundation, the Great Lakes Loons (2007-present). Mr. Stavropoulos is Chairman Emeritus of the Board of Directors of The Dow Chemical Company, where he previously served in numerous senior management positions, including President, CEO (1995-2000; 2002-2004), Chairman of the Executive Committee (2000-2006), and as a member of the Board of Directors (1990-2006). Currently, Mr. Stavropoulos is Chairman of the Board of Directors of Univar Inc. (global distributor of commodity and specialty chemicals), a Director of Teradata Corporation (data warehousing and technology solutions), and Maersk Inc. (industrial conglomerate), and a member of the Advisory Board for Metalmark Capital LLC (private equity investment, 2005-present). Mr. Stavropoulos is an operating advisor to Clayton, Dubilier & Rice, LLC (private equity investment). In addition, Mr. Stavropoulos is a member of the University of Notre Dame Advisory Council for the College of Science, a Trustee of the Rollin L. Gerstacker Foundation, and a Director of the Naples Philharmonic Center for the Arts. Previously, Mr. Stavropoulos served as a Director of Chemical Financial Corporation (bank holding company, 1993-2012) and Tyco International, Ltd. (multinational manufacturing and services, 2007-2012). |
Michael E. Wiley (1950) | |
Year of Election or Appointment: 2008 Trustee Chairman of the Independent Trustees | |
| Mr. Wiley also serves as Trustee of other Fidelity funds. Mr. Wiley serves as a Director of Asia Pacific Exploration Consolidated (international oil and gas exploration and production, 2008-present). Mr. Wiley serves as a Director of Tesoro Corporation (independent oil refiner and marketer, 2005-present), and a Director of Bill Barrett Corporation (exploration and production, 2005-present). In addition, Mr. Wiley also serves as a Director of Post Oak Bank (privately-held bank, 2004-present). Previously, Mr. Wiley served as a Trustee of other Fidelity funds (2008-2013), as a member of the Board of Trustees of the University of Tulsa (2000-2006; 2007-2010), as a Senior Energy Advisor of Katzenbach Partners, LLC (consulting, 2006-2007), as an Advisory Director of Riverstone Holdings (private investment), Chairman, President, and CEO of Baker Hughes, Inc. (oilfield services, 2000-2004), and as Director of Spinnaker Exploration Company (exploration and production, 2001-2005). |
+ The information above includes each Trustee's principal occupation during the last five years and other information relating to the experience, attributes, and skills relevant to each Trustee's qualifications to serve as a Trustee, which led to the conclusion that each Trustee should serve as a Trustee for each fund.
Officers:
Except for Anthony R. Rochte, correspondence intended for each officer may be sent to Fidelity Investments, 245 Summer Street, Boston, Massachusetts 02210. Correspondence intended for Mr. Rochte may be sent to SelectCo, 1225 17th Street, Denver, Colorado 80202-5541. Officers appear below in alphabetical order.
Name, Year of Birth; Principal Occupation | |
Christopher S. Bartel (1971) | |
Year of Election or Appointment: 2009 Vice President | |
| Mr. Bartel also serves as Vice President of other funds. Mr. Bartel serves as a Director, President, and Chief Executive Officer of Fidelity Management & Research (Japan) Inc. (2012-present), a Director of Fidelity Management & Research (Hong Kong) (2012-present), and Senior Vice President of Global Equity Research (2010-present). Previously, Mr. Bartel served as Senior Vice President of Equity Research (2009-2010), Managing Director of Research (2006-2009), and an analyst and portfolio manager (2000-2006). |
Elizabeth Paige Baumann (1968) | |
Year of Election or Appointment: 2012 Anti-Money Laundering (AML) Officer | |
| Ms. Baumann also serves as AML Officer of other funds. She is Chief AML Officer of FMR LLC (2012-present) and is an employee of Fidelity Investments. Previously, Ms. Baumann served as Vice President and Deputy Anti-Money Laundering Officer (2007-2012). |
Marc Bryant (1966) | |
Year of Election or Appointment: 2013 Secretary | |
| Mr. Bryant also serves as an officer of other funds. He is Senior Vice President and Deputy General Counsel of FMR LLC. Prior to joining Fidelity Investments, Mr. Bryant served as a Senior Vice President and the Head of Global Retail Legal for AllianceBernstein L.P. (2006-2010), and as the General Counsel for ProFund Advisors LLC (2001-2006). |
William C. Coffey (1969) | |
Year of Election or Appointment: 2009 Assistant Secretary | |
| Mr. Coffey also serves as Assistant Secretary of other funds. He is Senior Vice President and Deputy General Counsel of FMR LLC (2010-present), and is an employee of Fidelity Investments. Previously, Mr. Coffey served as Vice President and Associate General Counsel of FMR LLC (2005-2009). |
Jonathan Davis (1968) | |
Year of Election or Appointment: 2010 Assistant Treasurer | |
| Mr. Davis also serves as Assistant Treasurer of other funds. Mr. Davis is an employee of Fidelity Investments. Previously, Mr. Davis served as Vice President and Associate General Counsel of FMR LLC (2003-2010). |
Adrien E. Deberghes (1967) | |
Year of Election or Appointment: 2013 President and Treasurer | |
| Mr. Deberghes also serves as an officer of other funds. He is an employee of Fidelity Investments (2008-present). Prior to joining Fidelity Investments, Mr. Deberghes was Senior Vice President of Mutual Fund Administration at State Street Corporation (2007-2008), Senior Director of Mutual Fund Administration at Investors Bank & Trust (2005-2007), and Director of Finance for Dunkin' Brands (2000-2005). |
Stephanie J. Dorsey (1969) | |
Year of Election or Appointment: 2010 Assistant Treasurer | |
| Ms. Dorsey also serves as an officer of other funds. She is an employee of Fidelity Investments (2008-present) and has served in other fund officer roles. Prior to joining Fidelity Investments, Ms. Dorsey served as Treasurer (2004-2008) of the JPMorgan Mutual Funds and Vice President (2004-2008) of JPMorgan Chase Bank. |
Joseph A. Hanlon (1968) | |
Year of Election or Appointment: 2012 Chief Compliance Officer | |
| Mr. Hanlon also serves as Chief Compliance Officer of other funds. Mr. Hanlon serves as Compliance Officer of FMR, FMR Co., Inc., Fidelity Investments Money Management, Inc. (FIMM), Fidelity Research and Analysis Company (FRAC), and Fidelity Management & Research (Hong Kong) (2009-present), as Senior Vice President of the Fidelity Asset Management Division (2009-present), and is an employee of Fidelity Investments. Previously, Mr. Hanlon served as Compliance Officer of Fidelity Management & Research (Japan) Inc. (2009-2013), Strategic Advisers, Inc. (2009-2013), and Fidelity Management & Research (U.K.) Inc. (2009-2013). |
Brian B. Hogan (1964) | |
Year of Election or Appointment: 2009 Vice President | |
| Mr. Hogan also serves as Trustee or Vice President of other funds. Mr. Hogan serves as President of FMR's Equity Division (2009-present). Previously, Mr. Hogan served as Senior Vice President, Equity Research of FMR (2006-2009) and as a portfolio manager. |
Chris Maher (1972) | |
Year of Election or Appointment: 2013 Assistant Treasurer | |
| Mr. Maher serves as Assistant Treasurer of other funds. Mr. Maher is Vice President of Valuation Oversight and is an employee of Fidelity Investments. Previously, Mr. Maher served as Vice President of Asset Management Compliance (2013), Vice President of FMR's Program Management Group (2010-2013), and Vice President of Valuation Oversight (2008-2010). |
Christine Reynolds (1958) | |
Year of Election or Appointment: 2008 Chief Financial Officer | |
| Ms. Reynolds also serves as Chief Financial Officer of other funds. Ms. Reynolds became President of Fidelity Pricing and Cash Management Services (FPCMS) in August 2008. Ms. Reynolds served as Chief Operating Officer of FPCMS (2007-2008). Previously, Ms. Reynolds served as President, Treasurer, and Anti-Money Laundering officer of the Fidelity funds (2004-2007). |
Kenneth B. Robins (1969) | |
Year of Election or Appointment: 2013 Deputy Treasurer | |
| Mr. Robins also serves as an officer of other funds. Mr. Robins serves as Executive Vice President of Fidelity Investments Money Management, Inc. (FIMM) (2013-present) and is an employee of Fidelity Investments (2004-present). Previously, Mr. Robins served in other fund officer roles. |
Anthony R. Rochte (1968) | |
Year of Election or Appointment: 2013 Vice President | |
| Mr. Rochte also serves as Vice President of other funds. Mr. Rochte serves as President of Fidelity SelectCo, LLC (2012-present) and is an employee of Fidelity Investments (2012-present). Prior to joining Fidelity Investments, Mr. Rochte served as Senior Managing Director and head of State Street Global Advisors' North American Intermediary Business Group (2006-2012). |
Stacie M. Smith (1974) | |
Year of Election or Appointment: 2013 Assistant Treasurer | |
| Ms. Smith also serves as an officer of other funds. She is an employee of Fidelity Investments (2009-present) and has served in other fund officer roles. Prior to joining Fidelity Investments, Ms. Smith served as Senior Audit Manager of Ernst & Young LLP (1996-2009). |
Renee Stagnone (1975) | |
Year of Election or Appointment: 2013 Deputy Treasurer | |
| Ms. Stagnone also serves as Deputy Treasurer of other funds. Ms. Stagnone is an employee of Fidelity Investments. |
Joseph F. Zambello (1957) | |
Year of Election or Appointment: 2011 Deputy Treasurer | |
| Mr. Zambello also serves as Deputy Treasurer of other funds. Mr. Zambello is an employee of Fidelity Investments. Previously, Mr. Zambello served as Vice President of FMR's Program Management Group (2009-2011) and Vice President of the Transfer Agent Oversight Group (2005-2009). |
Annual Report
Distributions (Unaudited)
The Board of Trustees of each fund voted to pay to shareholders of record at the opening of business on record date the following distributions per share derived from capital gains realized from sales of portfolio securities and dividends derived from net investment income:
| Pay Date | Record Date | Dividends | Capital Gains |
Health Care Portfolio | 04/14/14 | 04/11/14 | $0.000 | $10.417 |
Biotechnology Portfolio | 04/14/14 | 04/11/14 | $0.000 | $0.000 |
Pharmaceuticals Portfolio | 04/14/14 | 04/11/14 | $0.086 | $0.982 |
Medical Equipment and Systems Portfolio | 04/14/14 | 04/11/14 | $0.000 | $1.958 |
Medical Delivery Portfolio | 04/14/14 | 04/11/14 | $0.000 | $2.888 |
The funds hereby designate as capital gain dividend the amounts noted below for the taxable year ended February 28, 2014, or, if subsequently determined to be different, the net capital gain of such year.
Health Care Portfolio | $428,274,643 |
Biotechnology Portfolio | $17,515,808 |
Pharmaceuticals Portfolio | $149,884,812 |
Medical Equipment and Systems Portfolio | $165,799,002 |
Medical Delivery Portfolio | $27,026,916 |
A percentage of the dividends distributed during the fiscal year for the following funds qualify for the dividends-received deduction for corporate shareholders:
| April 2013 | December 2013 |
Health Care Portfolio | 33% | 11% |
Biotechnology Portfolio | 100% | 0% |
Pharmaceuticals Portfolio | 29% | 100% |
Medical Equipment and Systems Portfolio | 100% | 39% |
Medical Delivery Portfolio | 0% | 18% |
A percentage of the dividends distributed during the fiscal year for the following funds may be taken into account as a dividend for purposes of the maximum rate under section 1(h) (11) of the Internal Revenue Code:
| April 2013 | December 2013 |
Health Care Portfolio | 34% | 14% |
Biotechnology Portfolio | 81% | 0% |
Pharmaceuticals Portfolio | 100% | 100% |
Medical Equipment and Systems Portfolio | 100% | 50% |
Medical Delivery Portfolio | 0% | 18% |
The funds will notify shareholders in January 2015 of amounts for use in preparing 2014 income tax returns.
Annual Report
Proxy Voting Results
A special meeting of each fund's shareholders was held on June 18, 2013. The results of votes taken among shareholders on the proposals before them are reported below. Each vote reported represents one dollar of net asset value held on the record date for the meeting.
PROPOSAL 1 | ||
To elect a Board of Trustees.A | ||
Ned C. Lautenbach | # of | % of |
Affirmative | 25,828,395,115.78 | 94.160 |
Withheld | 1,602,101,684.27 | 5.840 |
TOTAL | 27,430,496,800.05 | 100.000 |
Ronald P. O'Hanley | ||
Affirmative | 25,907,936,922.24 | 94.450 |
Withheld | 1,522,559,877.81 | 5.550 |
TOTAL | 27,430,496,800.05 | 100.000 |
David A. Rosow | ||
Affirmative | 25,805,492,959.91 | 94.076 |
Withheld | 1,625,003,840.14 | 5.924 |
TOTAL | 27,430,496,800.05 | 100.000 |
Garnett A. Smith | ||
Affirmative | 25,892,258,831.97 | 94.393 |
Withheld | 1,538,237,968.08 | 5.607 |
TOTAL | 27,430,496,800.05 | 100.000 |
William S. Stavropoulos | ||
Affirmative | 25,738,476,030.34 | 93.832 |
Withheld | 1,692,020,769.71 | 6.168 |
TOTAL | 27,430,496,800.05 | 100.000 |
Michael E. Wiley | ||
Affirmative | 25,923,640,743.27 | 94.507 |
Withheld | 1,506,856,056.78 | 5.493 |
TOTAL | 27,430,496,800.05 | 100.000 |
PROPOSAL 2 | ||
To approve a management contract between Biotechnology Portfolio and Fidelity SelectCo, LLC. | ||
| # of | % of |
Affirmative | 1,917,591,427.36 | 82.875 |
Against | 90,485,094.37 | 3.911 |
Abstain | 109,316,716.42 | 4.724 |
Broker Non-Vote | 196,464,993.92 | 8.490 |
TOTAL | 2,313,858,232.07 | 100.000 |
PROPOSAL 2 | ||
To approve a management contract between Health Care Portfolio and Fidelity SelectCo, LLC. | ||
| # of | % of |
Affirmative | 1,460,650,205.11 | 84.271 |
Against | 76,898,841.85 | 4.437 |
Abstain | 81,074,186.19 | 4.678 |
Broker Non-Vote | 114,656,341.99 | 6.614 |
TOTAL | 1,733,279,575.14 | 100.000 |
PROPOSAL 2 | ||
To approve a management contract between Medical Delivery Portfolio and Fidelity SelectCo, LLC. | ||
| # of | % of |
Affirmative | 275,454,099.41 | 81.076 |
Against | 21,222,859.35 | 6.247 |
Abstain | 17,673,349.76 | 5.201 |
Broker Non-Vote | 25,401,237.10 | 7.476 |
TOTAL | 339,751,545.62 | 100.000 |
PROPOSAL 2 | ||
To approve a management contract between Medical Equipment and Systems Portfolio and Fidelity SelectCo, LLC. | ||
| # of | % of |
Affirmative | 728,940,682.79 | 83.162 |
Against | 40,979,331.94 | 4.676 |
Abstain | 41,151,779.55 | 4.694 |
Broker Non-Vote | 65,463,633.82 | 7.468 |
TOTAL | 876,535,428.10 | 100.000 |
PROPOSAL 2 | ||
To approve a management contract between Pharmaceuticals Portfolio and Fidelity SelectCo, LLC. | ||
| # of | % of |
Affirmative | 565,353,301.03 | 87.294 |
Against | 22,581,218.88 | 3.486 |
Abstain | 33,737,635.92 | 5.209 |
Broker Non-Vote | 25,977,276.62 | 4.011 |
TOTAL | 647,649,432.45 | 100.000 |
PROPOSAL 3 | ||
For Biotechnology Portfolio, a shareholder proposal requesting that the Board of Trustees institute "Procedures to prevent holding investments in companies that, in management's judgment, substantially contribute to genocide or crimes against humanity."B | ||
| # of | % of |
Affirmative | 635,809,560.17 | 27.479 |
Against | 1,334,478,969.56 | 57.674 |
Abstain | 147,104,708.43 | 6.357 |
Broker Non-Vote | 196,464,993.91 | 8.490 |
TOTAL | 2,313,858,232.07 | 100.000 |
PROPOSAL 3 | ||
For Health Care Portfolio, a shareholder proposal requesting that the Board of Trustees institute "Procedures to prevent holding investments in companies that, in management's judgment, substantially contribute to genocide or crimes against humanity."B | ||
| # of | % of |
Affirmative | 490,742,239.31 | 28.313 |
Against | 1,012,893,839.67 | 58.438 |
Abstain | 114,987,153.96 | 6.635 |
Broker Non-Vote | 114,656,342.20 | 6.614 |
TOTAL | 1,733,279,575.14 | 100.000 |
A Denotes trust-wide proposal and voting results. | ||
B Proposal was not approved by shareholders. | ||
Annual Report
Investment Adviser
Fidelity SelectCo, LLC
Denver, CO
Investment Sub-Advisers
FMR Co., Inc.
Fidelity Management & Research
(U.K.) Inc.
Fidelity Management & Research
(Hong Kong) Limited
Fidelity Management & Research
(Japan) Inc.
General Distributor
Fidelity Distributors Corporation
Smithfield, RI
Transfer and Service Agents
Fidelity Investments Institutional Operations Company, Inc.
Boston, MA
Fidelity Service Company, Inc.
Boston, MA
Custodian
Brown Brothers Harriman & Co.
Boston, MA
Corporate Headquarters
245 Summer Street
Boston, MA 02210
1-800-544-8888
The Fidelity Telephone Connection
Mutual Fund 24-Hour Service
Exchanges/Redemptions
and Account Assistance 1-800-544-6666
Product Information 1-800-544-8888
Retirement Accounts 1-800-544-4774
(8 a.m. - 9 p.m.)
TDD Service 1-800-544-0118
for the deaf and hearing impaired
(9 a.m. - 9 p.m. Eastern time)
Fidelity Automated Service
Telephone (FAST®)
1-800-544-5555
Automated line for quickest service

SELHC-UANNPRO-0414
1.910421.104
Fidelity®
Select Portfolios®
Financials Sector
Banking Portfolio
Brokerage and Investment Management Portfolio
Consumer Finance Portfolio
Financial Services Portfolio
Insurance Portfolio
Annual Report
February 28, 2014
(Fidelity Cover Art)
Contents
Shareholder Expense Example |
| |
Banking Portfolio | Performance | |
| Management's Discussion | |
| Investment Changes | |
| Investments | |
| Financial Statements | |
Brokerage and Investment | Performance | |
| Management's Discussion | |
| Investment Changes | |
| Investments | |
| Financial Statements | |
Consumer Finance Portfolio | Performance | |
| Management's Discussion | |
| Investment Changes | |
| Investments | |
| Financial Statements | |
Financial Services Portfolio | Performance | |
| Management's Discussion | |
| Investment Changes | |
| Investments | |
| Financial Statements | |
Insurance Portfolio | Performance | |
| Management's Discussion | |
| Investment Changes | |
| Investments | |
| Financial Statements | |
Notes to Financial Statements |
| |
Report of Independent Registered Public Accounting Firm |
| |
Trustees and Officers |
| |
Distributions |
| |
Proxy Voting Results |
|
To view a fund's proxy voting guidelines and proxy voting record for the 12-month period ended June 30, visit http://www.fidelity.com/proxyvotingresults or visit the Securities and Exchange Commission's (SEC) web site at http://www.sec.gov. You may also call 1-800-544-8544 to request a free copy of the proxy voting guidelines.
Standard & Poor's, S&P and S&P 500 are registered service marks of The McGraw-Hill Companies, Inc. and have been licensed for use by Fidelity Distributors Corporation.
Other third-party marks appearing herein are the property of their respective owners.
All other marks appearing herein are registered or unregistered trademarks or service marks of FMR LLC or an affiliated company. © 2014 FMR LLC. All rights reserved.
Annual Report
This report and the financial statements contained herein are submitted for the general information of the shareholders of the funds. This report is not authorized for distribution to prospective investors in the funds unless preceded or accompanied by an effective prospectus.
A fund files its complete schedule of portfolio holdings with the SEC for the first and third quarters of each fiscal year on Form N-Q. Forms N-Q are available on the SEC's web site at http://www.sec.gov. A fund's Forms N-Q may be reviewed and copied at the SEC's Public Reference Room in Washington, DC. Information regarding the operation of the SEC's Public Reference Room may be obtained by calling 1-800-SEC-0330. For a complete list of a fund's portfolio holdings, view the most recent holdings listing, semiannual report, or annual report on Fidelity's web site at http://www.fidelity.com, http://www.advisor.fidelity.com, or http://www.401k.com, as applicable.
NOT FDIC INSURED • MAY LOSE VALUE • NO BANK GUARANTEE
Neither the funds nor Fidelity Distributors Corporation is a bank.
Annual Report
Shareholder Expense Example
As a shareholder of a Fund, you incur two types of costs: (1) transaction costs, including redemption fees and (2) ongoing costs, including management fees and other Fund expenses. This Example is intended to help you understand your ongoing costs (in dollars) of investing in the Funds and to compare these costs with the ongoing costs of investing in other mutual funds.
The Example is based on an investment of $1,000 invested at the beginning of the period and held for the entire period (September 1, 2013 to February 28, 2014).
Actual Expenses
The first line of the accompanying table for each fund provides information about actual account values and actual expenses. You may use the information in this line, together with the amount you invested, to estimate the expenses that you paid over the period. Simply divide your account value by $1,000.00 (for example, an $8,600 account value divided by $1,000.00 = 8.6), then multiply the result by the number in the first line for a fund under the heading entitled "Expenses Paid During Period" to estimate the expenses you paid on your account during this period. A small balance maintenance fee of $12.00 that is charged once a year may apply for certain accounts with a value of less than $2,000. This fee is not included in the table below. If it was, the estimate of expenses you paid during the period would be higher, and your ending account value lower, by this amount. In addition, each Fund, as a shareholder in the underlying Fidelity Central Funds, will indirectly bear its pro-rata share of the fees and expenses incurred by the underlying Fidelity Central Funds. These fees and expenses are not included in the Fund's annualized expense ratio used to calculate the expense estimate in the table below.
Hypothetical Example for Comparison Purposes
The second line of the accompanying table for each fund provides information about hypothetical account values and hypothetical expenses based on a fund's actual expense ratio and an assumed rate of return of 5% per year before expenses, which is not the Fund's actual return. The hypothetical account values and expenses may not be used to estimate the actual ending account balance or expenses you paid for the period. You may use this information to compare the ongoing costs of investing in the Fund and other funds. To do so, compare this 5% hypothetical example with the 5% hypothetical examples that appear in the shareholder reports of the other funds. A small balance maintenance fee of $12.00 that is charged once a year may apply for certain accounts with a value of less than $2,000. This fee is not included in the table below. If it was, the estimate of expenses you paid during the period would be higher, and your ending account value lower, by this amount. In addition, each Fund, as a shareholder in the underlying Fidelity Central Funds, will indirectly bear its pro-rata share of the fees and expenses incurred by the underlying Fidelity Central Funds. These fees and expenses are not included in the Fund's annualized expense ratio used to calculate the expense estimate in the table below.
Please note that the expenses shown in the table are meant to highlight your ongoing costs only and do not reflect any transaction costs. Therefore, the second line of the table is useful in comparing ongoing costs only, and will not help you determine the relative total costs of owning different funds. In addition, if these transactional costs were included, your costs would have been higher.
| Annualized | Beginning | Ending | Expenses Paid |
Banking Portfolio | .81% |
|
|
|
Actual |
| $ 1,000.00 | $ 1,146.50 | $ 4.31 |
Hypothetical A |
| $ 1,000.00 | $ 1,020.78 | $ 4.06 |
Brokerage and Investment Management Portfolio | .80% |
|
|
|
Actual |
| $ 1,000.00 | $ 1,172.70 | $ 4.31 |
Hypothetical A |
| $ 1,000.00 | $ 1,020.83 | $ 4.01 |
Consumer Finance Portfolio | .84% |
|
|
|
Actual |
| $ 1,000.00 | $ 1,106.80 | $ 4.39 |
Hypothetical A |
| $ 1,000.00 | $ 1,020.63 | $ 4.21 |
Financial Services Portfolio | .81% |
|
|
|
Actual |
| $ 1,000.00 | $ 1,138.00 | $ 4.29 |
Hypothetical A |
| $ 1,000.00 | $ 1,020.78 | $ 4.06 |
Insurance Portfolio | .81% |
|
|
|
Actual |
| $ 1,000.00 | $ 1,130.20 | $ 4.28 |
Hypothetical A |
| $ 1,000.00 | $ 1,020.78 | $ 4.06 |
A 5% return per year before expenses
B Annualized expense ratio reflects expenses net of applicable fee waivers.
* Expenses are equal to each Fund's annualized expense ratio, multiplied by the average account value over the period, multiplied by 181/365 (to reflect the one-half year period).
Annual Report
Banking Portfolio
Performance: The Bottom Line
Average annual total return reflects the change in the value of an investment, assuming reinvestment of the fund's distributions from dividend income and capital gains (the profits earned upon the sale of securities that have grown in value, if any) and assuming a constant rate of performance each year. The $10,000 table and the fund's returns do not reflect the deduction of taxes that a shareholder would pay on fund distributions or the redemption of fund shares. During periods of reimbursement by Fidelity, a fund's total return will be greater than it would be had the reimbursement not occurred. How a fund did yesterday is no guarantee of how it will do tomorrow.
Average Annual Total Returns
Periods ended February 28, 2014 | Past 1 | Past 5 | Past 10 |
Banking Portfolio | 30.48% | 25.18% | 1.16% |
$10,000 Over 10 Years
Let's say hypothetically that $10,000 was invested in Banking Portfolio on February 29, 2004. The chart shows how the value of your investment would have changed, and also shows how the S&P 500® Index performed over the same period.
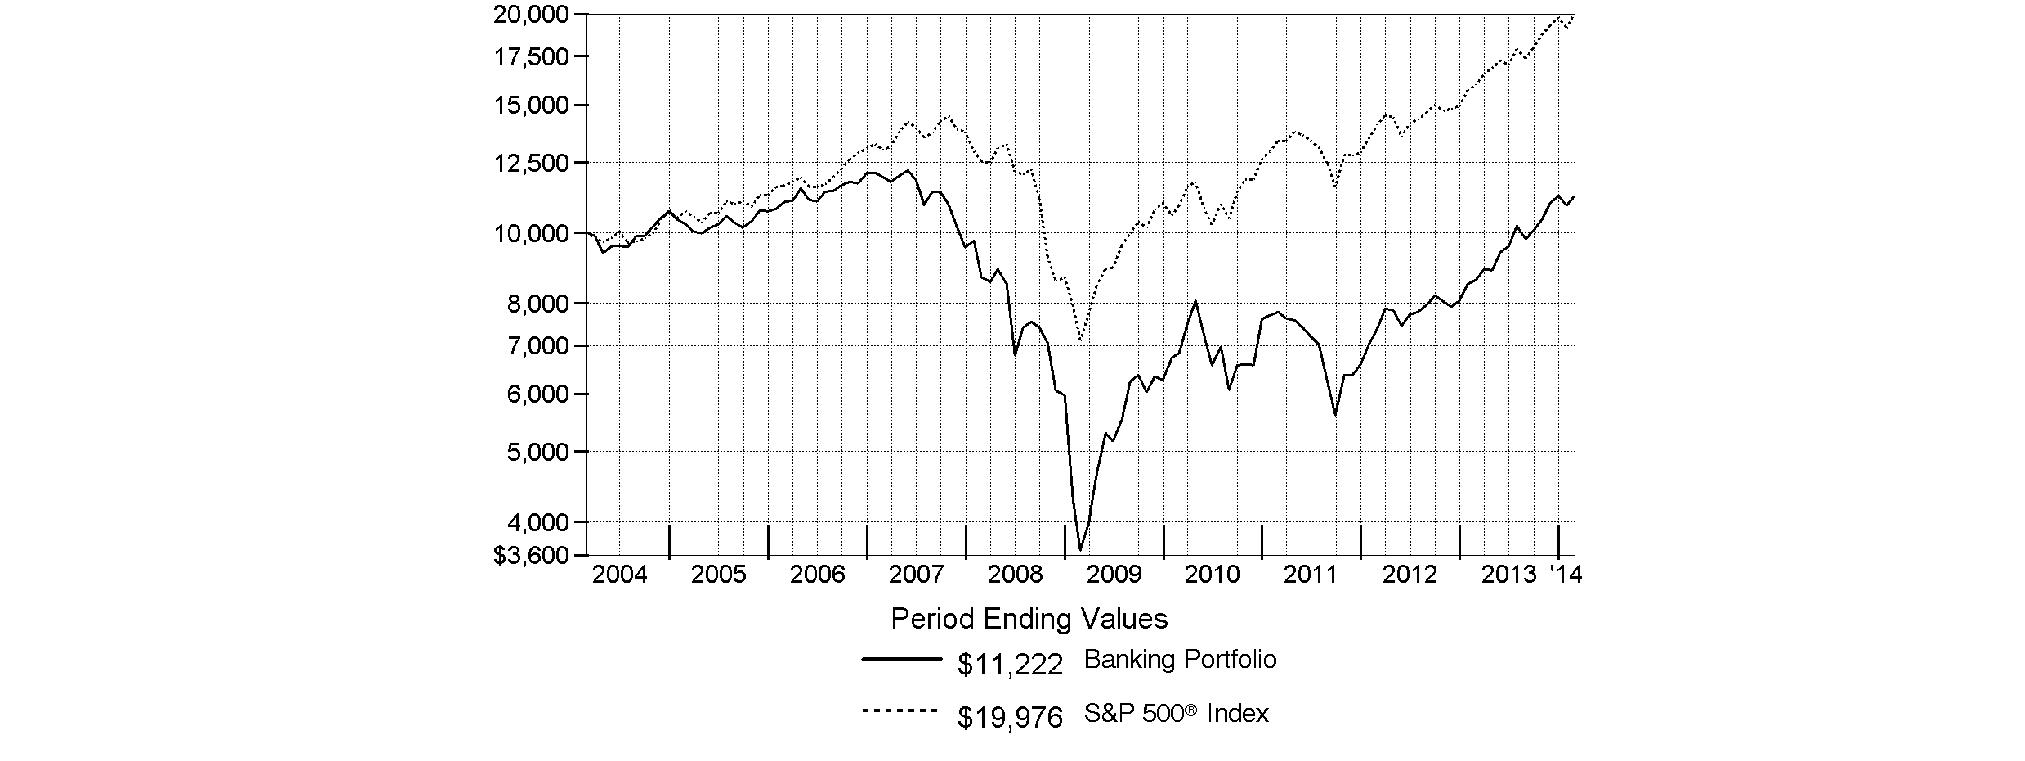
Annual Report
Banking Portfolio
Management's Discussion of Fund Performance
Market Recap: Stocks overcame fears of higher interest rates - not to mention their worst January in four years - to finish sharply higher for the 12 months ending February 28, 2014. The broad S&P 500® Index and the blue-chip Dow Jones Industrial AverageSM gained 25.37% and 19.01%, respectively, amid generally favorable earnings reports and accommodative monetary policies worldwide. Performance generally increased along the risk spectrum, with smaller-cap and growth strategies leading the way. An ebullient market helped the growth-oriented Nasdaq Composite Index® to a 38.10% period gain, for example. On the other hand, both cyclical and defensive stocks had representation in the top-performing industry sectors: returns were highest in health care and consumer discretionary; lowest in utilities and telecommunication services. From a macroeconomic perspective, data still points to slow but steady improvement in the U.S., and Europe's recession may well be over. Reports from China have disappointed, but continue to suggest a relatively soft landing there. Mixed signals from the U.S. Federal Reserve as to when it might curtail its stimulative bond buying kept markets in flux during the spring and summer. Stocks regained momentum in October despite a federal budget impasse and brief government shutdown, and lower volatility prevailed through year-end. Shedding new-year concerns about China's economy, an emerging-markets sell-off and confirmation (at last) of Fed tapering - alongside confirmation of a presumably dovish Janet Yellen as new Fed chair - February saw stocks back in record territory, bearing down on the five-year anniversary of the market's bottom.
Comments from John Sheehy, Portfolio Manager of Banking Portfolio: For the year, the fund returned 30.48%, trailing the 32.38% gain of the MSCI U.S. IMI Banks 25-50 Index but outpacing the S&P 500®. Versus the broader market, bank stocks benefited from strong outperformance in regional banks and diversified banks, while the thrifts & mortgage finance companies, as a group, slightly underperformed. Versus the MSCI industry index, the fund's performance was hurt by several non-index positions in the diversified banks group, especially shares of banks in emerging markets. Brazil-based Itau Unibanco Holding was the fund's largest relative detractor. During the second quarter of 2013, I roughly doubled our position here while selling our other banks in emerging markets. Elsewhere, overweighting loan servicer Ocwen Financial worked against us. In the final two months of the period, Ocwen's share price fell sharply, as financial regulators raised questions about the company's ability to handle the huge influx of loan servicing rights it acquired from various banks during the past few years. Not owning mortgage insurer MGIC Investment also detracted in view of this index constituent's triple-digit percentage gain. Additionally, the fund's cash position detracted in a robust market environment. Conversely, fund performance was lifted by a non-benchmark stake in Capital One Financial, which derives more than half of its revenue from credit card operations. This stock, one of the fund's largest holdings at period end, was aided by continuing improvement in credit card loan growth and relatively low delinquencies. Also lifting our results were Bank of the Ozarks, a specialty real estate lender based in Arkansas, and CVB Financial, a southern California-based commercial lender. I sold CVB Financial late in the period, as I was concerned that the valuation had become stretched.
The views expressed above reflect those of the portfolio manager(s) only through the end of the period as stated on the cover of this report and do not necessarily represent the views of Fidelity or any other person in the Fidelity organization. Any such views are subject to change at any time based upon market or other conditions and Fidelity disclaims any responsibility to update such views. These views may not be relied on as investment advice and, because investment decisions for a Fidelity fund are based on numerous factors, may not be relied on as an indication of trading intent on behalf of any Fidelity fund.
Annual Report
Banking Portfolio
Investment Changes (Unaudited)
Top Ten Stocks as of February 28, 2014 | ||
| % of fund's | % of fund's net assets |
Wells Fargo & Co. | 11.7 | 11.5 |
U.S. Bancorp | 9.6 | 13.2 |
M&T Bank Corp. | 5.0 | 4.4 |
SunTrust Banks, Inc. | 5.0 | 3.7 |
JPMorgan Chase & Co. | 4.9 | 1.3 |
Bank of America Corp. | 4.9 | 1.2 |
Citigroup, Inc. | 4.9 | 0.0 |
PNC Financial Services Group, Inc. | 3.6 | 5.0 |
Commerce Bancshares, Inc. | 3.5 | 1.9 |
Capital One Financial Corp. | 3.4 | 3.7 |
| 56.5 | |
Top Industries (% of fund's net assets) | |||
As of February 28, 2014 | |||
 | Commercial Banks | 70.8% |
|
 | Diversified Financial Services | 15.1% |
|
 | Thrifts & Mortgage Finance | 5.2% |
|
 | Consumer Finance | 5.1% |
|
 | IT Services | 0.9% |
|
 | All Others* | 2.9% |
|

As of August 31, 2013 | |||
| Commercial Banks | 81.4% |
|
| Consumer Finance | 5.7% |
|
| Thrifts & Mortgage Finance | 4.7% |
|
| Diversified Financial Services | 3.0% |
|
| IT Services | 2.6% |
|
| All Others* | 2.6% |
|

* Includes short-term investments and net other assets (liabilities). |
Annual Report
Banking Portfolio
Investments February 28, 2014
Showing Percentage of Net Assets
Common Stocks - 97.1% | |||
Shares | Value | ||
CAPITAL MARKETS - 0.7% | |||
Asset Management & Custody Banks - 0.7% | |||
The Blackstone Group LP | 158,600 | $ 5,289,310 | |
COMMERCIAL BANKS - 69.7% | |||
Diversified Banks - 26.7% | |||
Barclays PLC | 1,349,308 | 5,684,049 | |
Comerica, Inc. | 489,800 | 23,598,564 | |
Nordea Bank AB | 441,400 | 6,323,269 | |
Standard Chartered PLC (United Kingdom) | 379,818 | 8,045,707 | |
U.S. Bancorp | 1,886,200 | 77,598,268 | |
Wells Fargo & Co. | 2,036,792 | 94,547,884 | |
| 215,797,741 | ||
Regional Banks - 43.0% | |||
1st Source Corp. | 341,200 | 10,645,440 | |
Bancorp, Inc., Delaware (a) | 212,100 | 4,061,715 | |
Bank of the Ozarks, Inc. | 226,300 | 14,351,946 | |
BB&T Corp. | 297,100 | 11,230,380 | |
BBCN Bancorp, Inc. | 393,400 | 6,695,668 | |
Capital Bank Financial Corp. Series A (a) | 209,800 | 4,825,400 | |
CapitalSource, Inc. | 641,300 | 9,427,110 | |
City National Corp. | 196,200 | 14,681,646 | |
Commerce Bancshares, Inc. | 630,555 | 28,160,586 | |
First Republic Bank | 434,900 | 22,601,753 | |
German American Bancorp, Inc. | 43,379 | 1,254,521 | |
Hanmi Financial Corp. | 311,800 | 7,305,474 | |
Heartland Financial U.S.A., Inc. | 287,600 | 7,736,440 | |
Huntington Bancshares, Inc. | 2,591,451 | 24,696,528 | |
Lakeland Financial Corp. | 50,353 | 1,913,414 | |
M&T Bank Corp. (d) | 346,700 | 40,421,753 | |
National Penn Bancshares, Inc. | 841,549 | 9,088,729 | |
OFG Bancorp (d) | 213,180 | 3,410,880 | |
PacWest Bancorp (d) | 162,400 | 7,048,160 | |
PNC Financial Services Group, Inc. | 352,241 | 28,806,269 | |
Popular, Inc. (a) | 221,600 | 6,335,544 | |
Prosperity Bancshares, Inc. | 302,900 | 19,176,599 | |
Spar Nord Bank A/S | 431,400 | 4,588,088 | |
SunTrust Banks, Inc. | 1,069,400 | 40,294,992 | |
UMB Financial Corp. | 211,700 | 13,197,378 | |
Wilshire Bancorp, Inc. | 653,000 | 6,627,950 | |
| 348,584,363 | ||
TOTAL COMMERCIAL BANKS | 564,382,104 | ||
CONSUMER FINANCE - 5.1% | |||
Consumer Finance - 5.1% | |||
Capital One Financial Corp. | 380,600 | 27,947,458 | |
SLM Corp. | 572,900 | 13,715,226 | |
| 41,662,684 | ||
| |||
Shares | Value | ||
DIVERSIFIED FINANCIAL SERVICES - 15.1% | |||
Other Diversified Financial Services - 14.7% | |||
Bank of America Corp. | 2,394,700 | $ 39,584,391 | |
Citigroup, Inc. | 813,900 | 39,579,957 | |
JPMorgan Chase & Co. | 699,600 | 39,751,272 | |
| 118,915,620 | ||
Specialized Finance - 0.4% | |||
McGraw Hill Financial, Inc. | 40,200 | 3,202,332 | |
TOTAL DIVERSIFIED FINANCIAL SERVICES | 122,117,952 | ||
IT SERVICES - 0.9% | |||
Data Processing & Outsourced Services - 0.9% | |||
Total System Services, Inc. | 242,000 | 7,371,320 | |
REAL ESTATE INVESTMENT TRUSTS - 0.4% | |||
Mortgage REITs - 0.4% | |||
Altisource Residential Corp. Class B (d) | 117,600 | 3,361,008 | |
THRIFTS & MORTGAGE FINANCE - 5.2% | |||
Thrifts & Mortgage Finance - 5.2% | |||
Dime Community Bancshares, Inc. | 584,600 | 9,821,280 | |
Meridian Interstate Bancorp, Inc. (a) | 78,301 | 1,894,884 | |
Ocwen Financial Corp. (a) | 525,300 | 19,667,232 | |
Radian Group, Inc. | 104,300 | 1,621,865 | |
United Financial Bancorp, Inc. | 499,700 | 8,799,717 | |
| 41,804,978 | ||
TOTAL COMMON STOCKS (Cost $678,707,455) |
| ||
Nonconvertible Preferred Stocks - 1.1% | |||
|
|
|
|
COMMERCIAL BANKS - 1.1% | |||
Diversified Banks - 1.1% | |||
Itau Unibanco Holding SA sponsored ADR | 679,040 |
| |
Money Market Funds - 8.6% | |||
Shares | Value | ||
Fidelity Cash Central Fund, 0.10% (b) | 17,801,125 | $ 17,801,125 | |
Fidelity Securities Lending Cash Central Fund, 0.09% (b)(c) | 51,890,638 | 51,890,638 | |
TOTAL MONEY MARKET FUNDS (Cost $69,691,763) |
| ||
TOTAL INVESTMENT PORTFOLIO - 106.8% (Cost $757,861,925) | 864,725,932 | ||
NET OTHER ASSETS (LIABILITIES) - (6.8)% | (54,745,722) | ||
NET ASSETS - 100% | $ 809,980,210 | ||
Legend |
(a) Non-income producing |
(b) Affiliated fund that is generally available only to investment companies and other accounts managed by Fidelity Investments. The rate quoted is the annualized seven-day yield of the fund at period end. A complete unaudited listing of the fund's holdings as of its most recent quarter end is available upon request. In addition, each Fidelity Central Fund's financial statements, which are not covered by the Fund's Report of Independent Registered Public Accounting Firm, are available on the SEC's website or upon request. |
(c) Investment made with cash collateral received from securities on loan. |
(d) Security or a portion of the security is on loan at period end. |
Affiliated Central Funds |
Information regarding fiscal year to date income earned by the Fund from investments in Fidelity Central Funds is as follows: |
Fund | Income earned |
Fidelity Cash Central Fund | $ 22,283 |
Fidelity Securities Lending Cash Central Fund | 52,497 |
Total | $ 74,780 |
Other Information |
The following is a summary of the inputs used, as of February 28, 2014, involving the Fund's assets and liabilities carried at fair value. The inputs or methodology used for valuing securities may not be an indication of the risk associated with investing in those securities. For more information on valuation inputs, and their aggregation into the levels used in the table below, please refer to the Investment Valuation section in the accompanying Notes to Financial Statements. |
Valuation Inputs at Reporting Date: | ||||
Description | Total | Level 1 | Level 2 | Level 3 |
Investments in Securities: | ||||
Common Stocks | $ 785,989,356 | $ 780,305,307 | $ 5,684,049 | $ - |
Nonconvertible Preferred Stocks | 9,044,813 | 9,044,813 | - | - |
Money Market Funds | 69,691,763 | 69,691,763 | - | - |
Total Investments in Securities: | $ 864,725,932 | $ 859,041,883 | $ 5,684,049 | $ - |
See accompanying notes which are an integral part of the financial statements.
Annual Report
Banking Portfolio
Financial Statements
Statement of Assets and Liabilities
| February 28, 2014 | |
|
|
|
Assets | ||
Investment in securities, at value (including securities loaned of $51,288,348) - See accompanying schedule: Unaffiliated issuers (cost $688,170,162) | $ 795,034,169 |
|
Fidelity Central Funds (cost $69,691,763) | 69,691,763 |
|
Total Investments (cost $757,861,925) |
| $ 864,725,932 |
Receivable for investments sold | 73,239,621 | |
Receivable for fund shares sold | 1,037,792 | |
Dividends receivable | 1,555,585 | |
Distributions receivable from Fidelity Central Funds | 7,658 | |
Prepaid expenses | 3,605 | |
Other receivables | 21,715 | |
Total assets | 940,591,908 | |
|
|
|
Liabilities | ||
Payable for investments purchased | $ 75,689,068 | |
Payable for fund shares redeemed | 2,472,878 | |
Accrued management fee | 368,027 | |
Other affiliated payables | 155,362 | |
Other payables and accrued expenses | 35,725 | |
Collateral on securities loaned, at value | 51,890,638 | |
Total liabilities | 130,611,698 | |
|
|
|
Net Assets | $ 809,980,210 | |
Net Assets consist of: |
| |
Paid in capital | $ 702,580,504 | |
Undistributed net investment income | 2,398,723 | |
Accumulated undistributed net realized gain (loss) on investments and foreign currency transactions | (1,864,690) | |
Net unrealized appreciation (depreciation) on investments and assets and liabilities in foreign currencies | 106,865,673 | |
Net Assets, for 31,023,537 shares outstanding | $ 809,980,210 | |
Net Asset Value, offering price and redemption price per share ($809,980,210 ÷ 31,023,537 shares) | $ 26.11 | |
Statement of Operations
| Year ended February 28, 2014 | |
|
|
|
Investment Income |
|
|
Dividends |
| $ 13,432,476 |
Income from Fidelity Central Funds |
| 74,780 |
Total income |
| 13,507,256 |
|
|
|
Expenses | ||
Management fee | $ 3,689,881 | |
Transfer agent fees | 1,351,064 | |
Accounting and security lending fees | 247,302 | |
Custodian fees and expenses | 28,588 | |
Independent trustees' compensation | 13,000 | |
Registration fees | 40,966 | |
Audit | 43,918 | |
Legal | 11,416 | |
Miscellaneous | 6,999 | |
Total expenses before reductions | 5,433,134 | |
Expense reductions | (68,088) | 5,365,046 |
Net investment income (loss) | 8,142,210 | |
Realized and Unrealized Gain (Loss) Net realized gain (loss) on: | ||
Investment securities: |
|
|
Unaffiliated issuers | 79,607,275 | |
Foreign currency transactions | 57,707 | |
Total net realized gain (loss) |
| 79,664,982 |
Change in net unrealized appreciation (depreciation) on: Investment securities | 79,044,314 | |
Assets and liabilities in foreign currencies | 1,666 | |
Total change in net unrealized appreciation (depreciation) |
| 79,045,980 |
Net gain (loss) | 158,710,962 | |
Net increase (decrease) in net assets resulting from operations | $ 166,853,172 | |
See accompanying notes which are an integral part of the financial statements.
Annual Report
Fund Name
Financial Statements - continued
Statement of Changes in Net Assets
| Year ended | Year ended |
Increase (Decrease) in Net Assets |
|
|
Operations |
|
|
Net investment income (loss) | $ 8,142,210 | $ 6,644,162 |
Net realized gain (loss) | 79,664,982 | 28,762,782 |
Change in net unrealized appreciation (depreciation) | 79,045,980 | 35,942,241 |
Net increase (decrease) in net assets resulting from operations | 166,853,172 | 71,349,185 |
Distributions to shareholders from net investment income | (5,835,222) | (6,092,882) |
Distributions to shareholders from net realized gain | (15,904,464) | - |
Total distributions | (21,739,686) | (6,092,882) |
Share transactions | 391,060,219 | 205,300,987 |
Reinvestment of distributions | 21,186,604 | 5,934,143 |
Cost of shares redeemed | (277,968,854) | (175,700,047) |
Net increase (decrease) in net assets resulting from share transactions | 134,277,969 | 35,535,083 |
Redemption fees | 26,791 | 23,579 |
Total increase (decrease) in net assets | 279,418,246 | 100,814,965 |
|
|
|
Net Assets | ||
Beginning of period | 530,561,964 | 429,746,999 |
End of period (including undistributed net investment income of $2,398,723 and undistributed net investment income of $930,688, respectively) | $ 809,980,210 | $ 530,561,964 |
Other Information Shares | ||
Sold | 16,023,012 | 10,627,011 |
Issued in reinvestment of distributions | 828,397 | 307,206 |
Redeemed | (11,613,739) | (9,249,788) |
Net increase (decrease) | 5,237,670 | 1,684,429 |
Financial Highlights
Years ended February 28, | 2014 | 2013 | 2012 F | 2011 | 2010 |
Selected Per-Share Data |
|
|
|
|
|
Net asset value, beginning of period | $ 20.58 | $ 17.83 | $ 18.92 | $ 16.63 | $ 9.04 |
Income from Investment Operations |
|
|
|
|
|
Net investment income (loss) B | .29 | .26 | .09 | (.01) | .06 |
Net realized and unrealized gain (loss) | 5.97 | 2.73 | (1.11) | 2.31 | 7.74 |
Total from investment operations | 6.26 | 2.99 | (1.02) | 2.30 | 7.80 |
Distributions from net investment income | (.20) | (.24) | (.07) | (.01) | (.21) |
Distributions from net realized gain | (.53) | - | - | - | - |
Total distributions | (.73) | (.24) | (.07) | (.01) | (.21) |
Redemption fees added to paid in capital B, G | - | - | - | - | - |
Net asset value, end of period | $ 26.11 | $ 20.58 | $ 17.83 | $ 18.92 | $ 16.63 |
Total Return A | 30.48% | 16.86% | (5.31)% | 13.83% | 87.04% |
Ratios to Average Net Assets C, E |
|
|
|
|
|
Expenses before reductions | .81% | .85% | .88% | .89% | .95% |
Expenses net of fee waivers, if any | .81% | .85% | .88% | .89% | .95% |
Expenses net of all reductions | .80% | .83% | .87% | .88% | .94% |
Net investment income (loss) | 1.22% | 1.37% | .55% | (.04)% | .46% |
Supplemental Data |
|
|
|
|
|
Net assets, end of period (000 omitted) | $ 809,980 | $ 530,562 | $ 429,747 | $ 518,317 | $ 359,438 |
Portfolio turnover rate D | 91% | 69% | 91% | 73% | 105% |
A Total returns would have been lower if certain expenses had not been reduced during the applicable periods shown.
B Calculated based on average shares outstanding during the period.
C Fees and expenses of any underlying Fidelity Central Funds are not included in the Fund's expense ratio. The Fund indirectly bears its proportionate share of the expenses of any underlying Fidelity Central Funds.
D Amount does not include the portfolio activity of any underlying Fidelity Central Funds.
E Expense ratios reflect operating expenses of the Fund. Expenses before reductions do not reflect amounts reimbursed by the investment adviser or reductions from brokerage service arrangements or reductions from other expense offset arrangements and do not represent the amount paid by the Fund during periods when reimbursements or reductions occur. Expenses net of fee waivers reflect expenses after reimbursement by the investment adviser but prior to reductions from brokerage service arrangements or other expense offset arrangements. Expenses net of all reductions represent the net expenses paid by the Fund.
F For the year ended February 29.
G Amount represents less than $.01 per share.
See accompanying notes which are an integral part of the financial statements.
Annual Report
Brokerage and Investment Management Portfolio
Performance: The Bottom Line
Average annual total return reflects the change in the value of an investment, assuming reinvestment of the fund's distributions from dividend income and capital gains (the profits earned upon the sale of securities that have grown in value, if any) and assuming a constant rate of performance each year. The $10,000 table and the fund's returns do not reflect the deduction of taxes that a shareholder would pay on fund distributions or the redemption of fund shares. During periods of reimbursement by Fidelity, a fund's total return will be greater than it would be had the reimbursement not occurred. How a fund did yesterday is no guarantee of how it will do tomorrow.
Average Annual Total Returns
Periods ended February 28, 2014 | Past 1 | Past 5 | Past 10 |
Brokerage and Investment Management Portfolio | 29.29% | 23.25% | 7.04% |
$10,000 Over 10 Years
Let's say hypothetically that $10,000 was invested in Brokerage and Investment Management Portfolio on February 29, 2004. The chart shows how the value of your investment would have changed, and also shows how the S&P 500 Index performed over the same period.
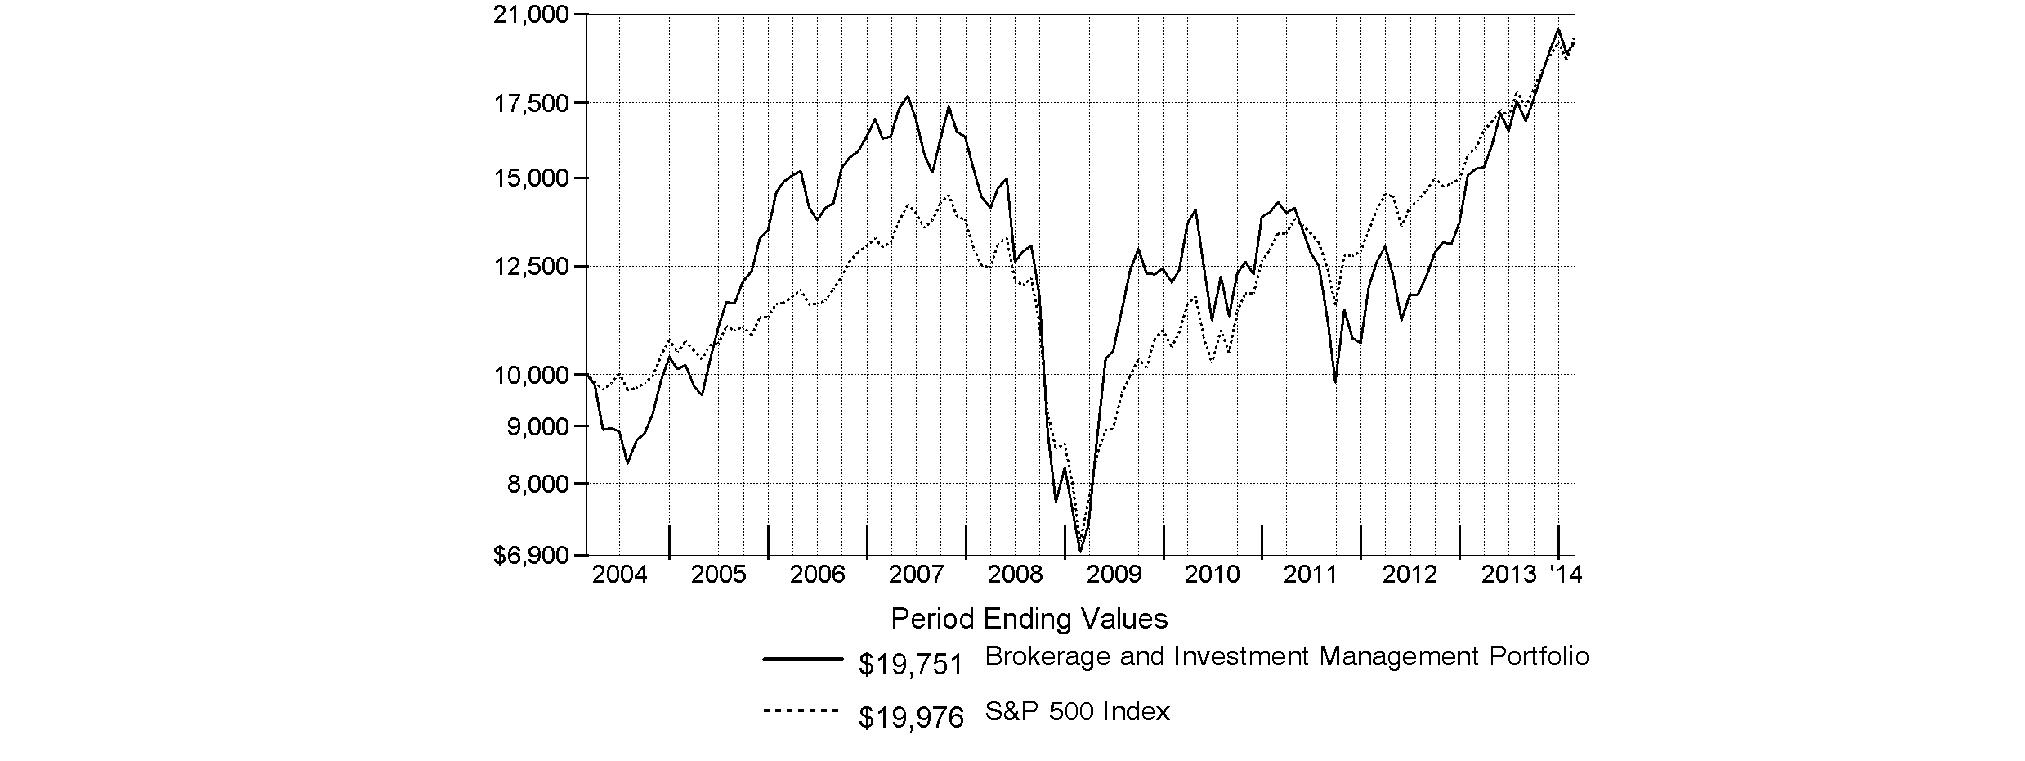
Annual Report
Brokerage and Investment Management Portfolio
Management's Discussion of Fund Performance
Market Recap: Stocks overcame fears of higher interest rates - not to mention their worst January in four years - to finish sharply higher for the 12 months ending February 28, 2014. The broad S&P 500® Index and the blue-chip Dow Jones Industrial AverageSM gained 25.37% and 19.01%, respectively, amid generally favorable earnings reports and accommodative monetary policies worldwide. Performance generally increased along the risk spectrum, with smaller-cap and growth strategies leading the way. An ebullient market helped the growth-oriented Nasdaq Composite Index® to a 38.10% period gain, for example. On the other hand, both cyclical and defensive stocks had representation in the top-performing industry sectors: returns were highest in health care and consumer discretionary; lowest in utilities and telecommunication services. From a macroeconomic perspective, data still points to slow but steady improvement in the U.S., and Europe's recession may well be over. Reports from China have disappointed, but continue to suggest a relatively soft landing there. Mixed signals from the U.S. Federal Reserve as to when it might curtail its stimulative bond buying kept markets in flux during the spring and summer. Stocks regained momentum in October despite a federal budget impasse and brief government shutdown, and lower volatility prevailed through year-end. Shedding new-year concerns about China's economy, an emerging-markets sell-off and confirmation (at last) of Fed tapering - alongside confirmation of a presumably dovish Janet Yellen as new Fed chair - February saw stocks back in record territory, bearing down on the five-year anniversary of the market's bottom.
Comments from Christopher Lee, Portfolio Manager of Brokerage and Investment Management Portfolio: For the year, the fund returned 29.29%, versus 30.03% for the MSCI® U.S. IMI Capital Markets 25-50 Index and 25.37% for the broad-based S&P 500®. The industry benefited as the equity market rally boosted fee revenue, trading volumes and new issuance. Security selection aided performance relative to the MSCI industry index, with notable contributions from the out-of-benchmark thrifts & mortgage finance and specialized finance segments, as well as investment banking & brokerage and diversified capital markets. Top individual contributors included online broker E*TRADE Financial, whose stock rose as loan losses in its bank business eased and investors refocused on its growing brokerage business. An out-of-index stake in government-controlled mortgage finance company Fannie Mae helped, as rising home prices and speculation that the Federal government would relinquish its majority ownership drove the stock sharply higher last spring. I opportunistically sold the fund's stake soon thereafter. Conversely, a small average cash position detracted. Individual disappointments included asset manager Virtus Investment Partners, whose share price was held back by concern that rising interest rates would lead to asset outflows from its emerging-markets and fixed-income products. Largely avoiding online broker and index component TD Ameritrade Holding also hurt, as the market rally helped fuel the stock's strong return.
The views expressed above reflect those of the portfolio manager(s) only through the end of the period as stated on the cover of this report and do not necessarily represent the views of Fidelity or any other person in the Fidelity organization. Any such views are subject to change at any time based upon market or other conditions and Fidelity disclaims any responsibility to update such views. These views may not be relied on as investment advice and, because investment decisions for a Fidelity fund are based on numerous factors, may not be relied on as an indication of trading intent on behalf of any Fidelity fund.
Annual Report
Brokerage and Investment Management Portfolio
Investment Changes (Unaudited)
Top Ten Stocks as of February 28, 2014 | ||
| % of fund's | % of fund's net assets |
Invesco Ltd. | 5.2 | 5.0 |
Ameriprise Financial, Inc. | 5.2 | 5.9 |
Franklin Resources, Inc. | 5.1 | 5.3 |
BlackRock, Inc. Class A | 4.5 | 5.0 |
E*TRADE Financial Corp. | 4.1 | 3.9 |
Affiliated Managers Group, Inc. | 4.0 | 4.8 |
Raymond James Financial, Inc. | 3.9 | 4.6 |
American Capital Ltd. | 3.7 | 2.9 |
State Street Corp. | 3.6 | 5.7 |
JPMorgan Chase & Co. | 3.6 | 2.4 |
| 42.9 | |
Top Industries (% of fund's net assets) | |||
As of February 28, 2014 | |||
| Capital Markets | 80.6% |
|
| Diversified Financial Services | 13.5% |
|
| Commercial Banks | 1.6% |
|
| Software | 1.1% |
|
| Insurance | 0.7% |
|
| All Others* | 2.5% |
|

As of August 31, 2013 | |||
| Capital Markets | 90.6% |
|
 | Diversified Financial Services | 8.1% |
|
 | Thrifts & Mortgage Finance | 0.6% |
|
| All Others* | 0.7% |
|

* Includes short-term investments and net other assets (liabilities). |
Annual Report
Brokerage and Investment Management Portfolio
Investments February 28, 2014
Showing Percentage of Net Assets
Common Stocks - 97.8% | |||
Shares | Value | ||
CAPITAL MARKETS - 80.6% | |||
Asset Management & Custody Banks - 54.8% | |||
Affiliated Managers Group, Inc. (a) | 175,900 | $ 33,077,995 | |
American Capital Ltd. (a) | 1,979,100 | 30,794,796 | |
Ameriprise Financial, Inc. | 395,700 | 43,127,343 | |
Apollo Global Management LLC Class A | 228,200 | 7,345,758 | |
Apollo Investment Corp. | 2,051,422 | 17,560,172 | |
Ares Capital Corp. | 1,099,400 | 19,822,182 | |
Ashmore Group PLC | 1,077,400 | 5,711,971 | |
BlackRock, Inc. Class A | 123,100 | 37,525,804 | |
China Cinda Asset Mngmt Co. Ltd. (H Shares) | 6,614,000 | 3,988,573 | |
Eaton Vance Corp. (non-vtg.) | 571,600 | 21,629,344 | |
Fortress Investment Group LLC | 438,500 | 3,810,565 | |
Franklin Resources, Inc. | 791,600 | 42,152,700 | |
Invesco Ltd. | 1,275,400 | 43,746,220 | |
KKR & Co. LP | 456,700 | 11,024,738 | |
Northern Trust Corp. | 263,200 | 16,278,920 | |
Oaktree Capital Group LLC Class A | 250,000 | 15,420,000 | |
Och-Ziff Capital Management Group LLC Class A | 254,900 | 3,433,503 | |
SEI Investments Co. | 615,600 | 20,665,692 | |
State Street Corp. | 461,800 | 30,326,406 | |
T. Rowe Price Group, Inc. | 156,000 | 12,662,520 | |
The Blackstone Group LP | 439,800 | 14,667,330 | |
Virtus Investment Partners, Inc. (a) | 81,400 | 15,072,024 | |
WisdomTree Investments, Inc. (a) | 456,400 | 7,110,712 | |
| 456,955,268 | ||
Diversified Capital Markets - 0.5% | |||
UBS AG (NY Shares) | 195,200 | 4,169,472 | |
Investment Banking & Brokerage - 25.3% | |||
Charles Schwab Corp. | 703,600 | 18,652,436 | |
E*TRADE Financial Corp. (a) | 1,539,200 | 34,585,824 | |
Evercore Partners, Inc. Class A | 417,700 | 23,240,828 | |
FXCM, Inc. Class A (d) | 1,100,000 | 18,535,000 | |
GFI Group, Inc. | 2,000,000 | 8,020,000 | |
Goldman Sachs Group, Inc. | 118,800 | 19,774,260 | |
KCG Holdings, Inc. Class A | 712,800 | 8,475,192 | |
LPL Financial | 263,900 | 14,166,152 | |
Monex Group, Inc. | 850,400 | 3,467,780 | |
Morgan Stanley | 967,600 | 29,802,080 | |
Raymond James Financial, Inc. | 615,700 | 32,496,646 | |
| 211,216,198 | ||
TOTAL CAPITAL MARKETS | 672,340,938 | ||
COMMERCIAL BANKS - 1.6% | |||
Diversified Banks - 1.6% | |||
Barclays PLC | 3,118,649 | 13,137,514 | |
| |||
Shares | Value | ||
DIVERSIFIED FINANCIAL SERVICES - 13.5% | |||
Other Diversified Financial Services - 5.8% | |||
Citigroup, Inc. | 373,800 | $ 18,177,894 | |
JPMorgan Chase & Co. | 527,700 | 29,983,914 | |
| 48,161,808 | ||
Specialized Finance - 7.7% | |||
Interactive Brokers Group, Inc. | 703,600 | 15,648,064 | |
IntercontinentalExchange Group, Inc. | 105,500 | 22,032,620 | |
McGraw Hill Financial, Inc. | 175,900 | 14,012,194 | |
The NASDAQ OMX Group, Inc. | 334,100 | 12,826,099 | |
| 64,518,977 | ||
TOTAL DIVERSIFIED FINANCIAL SERVICES | 112,680,785 | ||
INSURANCE - 0.7% | |||
Life & Health Insurance - 0.7% | |||
St. James's Place Capital PLC | 400,000 | 5,860,925 | |
SOFTWARE - 1.1% | |||
Application Software - 1.1% | |||
FactSet Research Systems, Inc. | 88,800 | 9,349,752 | |
THRIFTS & MORTGAGE FINANCE - 0.3% | |||
Thrifts & Mortgage Finance - 0.3% | |||
Ocwen Financial Corp. (a) | 75,000 | 2,808,000 | |
TOTAL COMMON STOCKS (Cost $722,085,284) |
| ||
Money Market Funds - 0.1% | |||
|
|
|
|
Fidelity Cash Central Fund, 0.10% (b) | 380 | 380 | |
Fidelity Securities Lending Cash Central Fund, 0.09% (b)(c) | 802,125 | 802,125 | |
TOTAL MONEY MARKET FUNDS (Cost $802,505) |
| ||
TOTAL INVESTMENT PORTFOLIO - 97.9% (Cost $722,887,789) | 816,980,419 | ||
NET OTHER ASSETS (LIABILITIES) - 2.1% | 17,241,531 | ||
NET ASSETS - 100% | $ 834,221,950 | ||
Legend |
(a) Non-income producing |
(b) Affiliated fund that is generally available only to investment companies and other accounts managed by Fidelity Investments. The rate quoted is the annualized seven-day yield of the fund at period end. A complete unaudited listing of the fund's holdings as of its most recent quarter end is available upon request. In addition, each Fidelity Central Fund's financial statements, which are not covered by the Fund's Report of Independent Registered Public Accounting Firm, are available on the SEC's website or upon request. |
(c) Investment made with cash collateral received from securities on loan. |
(d) Security or a portion of the security is on loan at period end. |
Affiliated Central Funds |
Information regarding fiscal year to date income earned by the Fund from investments in Fidelity Central Funds is as follows: |
Fund | Income earned |
Fidelity Cash Central Fund | $ 28,259 |
Fidelity Securities Lending Cash Central Fund | 122,227 |
Total | $ 150,486 |
Other Information |
The following is a summary of the inputs used, as of February 28, 2014, involving the Fund's assets and liabilities carried at fair value. The inputs or methodology used for valuing securities may not be an indication of the risk associated with investing in those securities. For more information on valuation inputs, and their aggregation into the levels used in the table below, please refer to the Investment Valuation section in the accompanying Notes to Financial Statements. |
Valuation Inputs at Reporting Date: | ||||
Description | Total | Level 1 | Level 2 | Level 3 |
Investments in Securities: | ||||
Common Stocks | $ 816,177,914 | $ 803,040,400 | $ 13,137,514 | $ - |
Money Market Funds | 802,505 | 802,505 | - | - |
Total Investments in Securities: | $ 816,980,419 | $ 803,842,905 | $ 13,137,514 | $ - |
See accompanying notes which are an integral part of the financial statements.
Annual Report
Brokerage and Investment Management Portfolio
Financial Statements
Statement of Assets and Liabilities
| February 28, 2014 | |
|
|
|
Assets | ||
Investment in securities, at value (including securities loaned of $783,525) - See accompanying schedule: Unaffiliated issuers (cost $722,085,284) | $ 816,177,914 |
|
Fidelity Central Funds (cost $802,505) | 802,505 |
|
Total Investments (cost $722,877,789) |
| $ 816,980,419 |
Receivable for investments sold | 56,327,495 | |
Receivable for fund shares sold | 264,408 | |
Dividends receivable | 1,309,002 | |
Distributions receivable from Fidelity Central Funds | 2,001 | |
Prepaid expenses | 3,894 | |
Other receivables | 19,488 | |
Total assets | 874,906,707 | |
|
|
|
Liabilities | ||
Payable for investments purchased | $ 4,336,553 | |
Payable for fund shares redeemed | 3,178,863 | |
Accrued management fee | 420,473 | |
Notes payable to affiliates | 31,717,000 | |
Other affiliated payables | 182,441 | |
Other payables and accrued expenses | 47,302 | |
Collateral on securities loaned, at value | 802,125 | |
Total liabilities | 40,684,757 | |
|
|
|
Net Assets | $ 834,221,950 | |
Net Assets consist of: |
| |
Paid in capital | $ 738,825,958 | |
Undistributed net investment income | 956,539 | |
Accumulated undistributed net realized gain (loss) on investments and foreign currency transactions | 350,468 | |
Net unrealized appreciation (depreciation) on investments and assets and liabilities in foreign currencies | 94,088,985 | |
Net Assets, for 11,587,515 shares outstanding | $ 834,221,950 | |
Net Asset Value, offering price and redemption price per share ($834,221,950 ÷ 11,587,515 shares) | $ 71.99 | |
Statement of Operations
| Year ended February 28, 2014 | |
|
|
|
Investment Income |
|
|
Dividends |
| $ 16,832,145 |
Interest |
| 201 |
Income from Fidelity Central Funds |
| 150,486 |
Total income |
| 16,982,832 |
|
|
|
Expenses | ||
Management fee | $ 4,062,508 | |
Transfer agent fees | 1,503,034 | |
Accounting and security lending fees | 261,542 | |
Custodian fees and expenses | 43,335 | |
Independent trustees' compensation | 13,803 | |
Registration fees | 63,091 | |
Audit | 40,253 | |
Legal | 11,791 | |
Interest | 1,653 | |
Miscellaneous | 6,919 | |
Total expenses before reductions | 6,007,929 | |
Expense reductions | (135,779) | 5,872,150 |
Net investment income (loss) | 11,110,682 | |
Realized and Unrealized Gain (Loss) Net realized gain (loss) on: | ||
Investment securities: |
|
|
Unaffiliated issuers | 83,088,770 | |
Foreign currency transactions | (198,120) | |
Total net realized gain (loss) |
| 82,890,650 |
Change in net unrealized appreciation (depreciation) on: Investment securities | 72,443,527 | |
Assets and liabilities in foreign currencies | (6,111) | |
Total change in net unrealized appreciation (depreciation) |
| 72,437,416 |
Net gain (loss) | 155,328,066 | |
Net increase (decrease) in net assets resulting from operations | $ 166,438,748 | |
See accompanying notes which are an integral part of the financial statements.
Annual Report
Statement of Changes in Net Assets
| Year ended | Year ended |
Increase (Decrease) in Net Assets |
|
|
Operations |
|
|
Net investment income (loss) | $ 11,110,682 | $ 11,074,871 |
Net realized gain (loss) | 82,890,650 | 23,383,260 |
Change in net unrealized appreciation (depreciation) | 72,437,416 | 47,766,557 |
Net increase (decrease) in net assets resulting from operations | 166,438,748 | 82,224,688 |
Distributions to shareholders from net investment income | (4,659,584) | (9,530,873) |
Distributions to shareholders from net realized gain | (192,147) | - |
Total distributions | (4,851,731) | (9,530,873) |
Share transactions | 554,727,078 | 260,177,013 |
Reinvestment of distributions | 4,673,424 | 9,158,425 |
Cost of shares redeemed | (491,582,846) | (150,492,325) |
Net increase (decrease) in net assets resulting from share transactions | 67,817,656 | 118,843,113 |
Redemption fees | 44,045 | 7,873 |
Total increase (decrease) in net assets | 229,448,718 | 191,544,801 |
|
|
|
Net Assets | ||
Beginning of period | 604,773,232 | 413,228,431 |
End of period (including undistributed net investment income of $956,539 and distributions in excess of net investment income of $1,676,111, respectively) | $ 834,221,950 | $ 604,773,232 |
Other Information Shares | ||
Sold | 8,304,983 | 5,081,081 |
Issued in reinvestment of distributions | 63,949 | 183,536 |
Redeemed | (7,582,311) | (3,204,634) |
Net increase (decrease) | 786,621 | 2,059,983 |
Financial Highlights
Years ended February 28, | 2014 | 2013 | 2012 F | 2011 | 2010 |
Selected Per-Share Data |
|
|
|
|
|
Net asset value, beginning of period | $ 55.99 | $ 47.28 | $ 54.11 | $ 47.32 | $ 26.68 |
Income from Investment Operations |
|
|
|
|
|
Net investment income (loss) B | .99 | 1.31 | .26 | .39 | .27 |
Net realized and unrealized gain (loss) | 15.41 | 8.52 | (6.56) | 6.71 | 20.62 |
Total from investment operations | 16.40 | 9.83 | (6.30) | 7.10 | 20.89 |
Distributions from net investment income | (.39) | (1.12) | (.53) | (.31) | (.25) |
Distributions from net realized gain | (.02) | - | - | - | - |
Total distributions | (.40) H | (1.12) | (.53) | (.31) | (.25) |
Redemption fees added to paid in capital B, G | - | - | - | - | - |
Net asset value, end of period | $ 71.99 | $ 55.99 | $ 47.28 | $ 54.11 | $ 47.32 |
Total Return A | 29.29% | 21.08% | (11.51)% | 15.03% | 78.44% |
Ratios to Average Net Assets C, E |
|
|
|
|
|
Expenses before reductions | .82% | .87% | .89% | .88% | .93% |
Expenses net of fee waivers, if any | .82% | .87% | .89% | .88% | .93% |
Expenses net of all reductions | .80% | .78% | .85% | .86% | .89% |
Net investment income (loss) | 1.52% | 2.72% | .57% | .79% | .64% |
Supplemental Data |
|
|
|
|
|
Net assets, end of period (000 omitted) | $ 834,222 | $ 604,773 | $ 413,228 | $ 551,976 | $ 555,473 |
Portfolio turnover rate D | 182% | 308% | 294% | 153% | 264% |
A Total returns would have been lower if certain expenses had not been reduced during the applicable periods shown.
B Calculated based on average shares outstanding during the period.
C Fees and expenses of any underlying Fidelity Central Funds are not included in the Fund's expense ratio. The Fund indirectly bears its proportionate share of the expenses of any underlying Fidelity Central Funds.
D Amount does not include the portfolio activity of any underlying Fidelity Central Funds.
E Expense ratios reflect operating expenses of the Fund. Expenses before reductions do not reflect amounts reimbursed by the investment adviser or reductions from brokerage service arrangements or reductions from other expense offset arrangements and do not represent the amount paid by the Fund during periods when reimbursements or reductions occur. Expenses net of fee waivers reflect expenses after reimbursement by the investment adviser but prior to reductions from brokerage service arrangements or other expense offset arrangements. Expenses net of all reductions represent the net expenses paid by the Fund.
F For the year ended February 29.
G Amount represents less than $.01 per share.
H Total distributions of $.40 per share is comprised of distributions from net investment income of $.388 and distributions from net realized gain of $.016 per share.
See accompanying notes which are an integral part of the financial statements.
Annual Report
Consumer Finance Portfolio
Performance: The Bottom Line
Average annual total return reflects the change in the value of an investment, assuming reinvestment of the fund's distributions from dividend income and capital gains (the profits earned upon the sale of securities that have grown in value, if any) and assuming a constant rate of performance each year. The $10,000 table and the fund's returns do not reflect the deduction of taxes that a shareholder would pay on fund distributions or the redemption of fund shares. During periods of reimbursement by Fidelity, a fund's total return will be greater than it would be had the reimbursement not occurred. How a fund did yesterday is no guarantee of how it will do tomorrow.
Average Annual Total Returns
Periods ended February 28, 2014 | Past 1 | Past 5 | Past 10 |
Consumer Finance PortfolioA | 24.31% | 20.44% | -6.06% |
A Prior to December 1, 2010, Consumer Finance Portfolio was named Home Finance Portfolio, and the fund operated under certain different investment policies and compared its performance to a different additional index. The fund's historical performance may not represent its current investment policies.
$10,000 Over 10 Years
Let's say hypothetically that $10,000 was invested in Consumer Finance Portfolio on February 29, 2004. The chart shows how the value of your investment would have changed, and also shows how the S&P 500 Index performed over the same period.
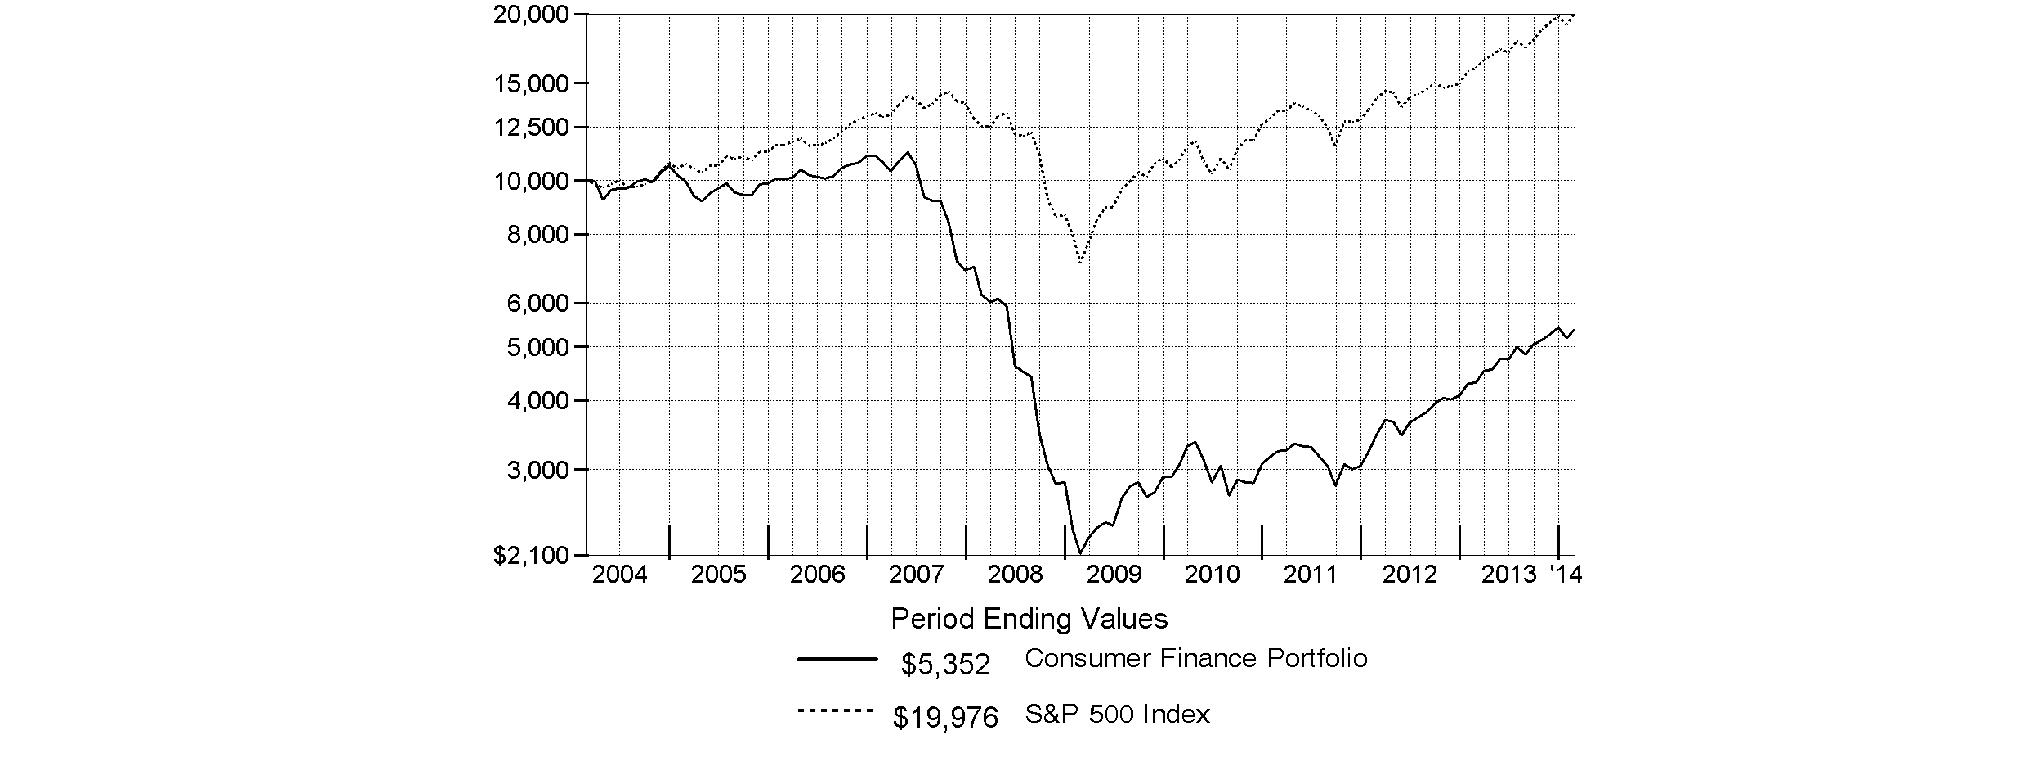
Annual Report
Consumer Finance Portfolio
Management's Discussion of Fund Performance
Market Recap: Stocks overcame fears of higher interest rates - not to mention their worst January in four years - to finish sharply higher for the 12 months ending February 28, 2014. The broad S&P 500® Index and the blue-chip Dow Jones Industrial AverageSM gained 25.37% and 19.01%, respectively, amid generally favorable earnings reports and accommodative monetary policies worldwide. Performance generally increased along the risk spectrum, with smaller-cap and growth strategies leading the way. An ebullient market helped the growth-oriented Nasdaq Composite Index® to a 38.10% period gain, for example. On the other hand, both cyclical and defensive stocks had representation in the top-performing industry sectors: returns were highest in health care and consumer discretionary; lowest in utilities and telecommunication services. From a macroeconomic perspective, data still points to slow but steady improvement in the U.S., and Europe's recession may well be over. Reports from China have disappointed, but continue to suggest a relatively soft landing there. Mixed signals from the U.S. Federal Reserve as to when it might curtail its stimulative bond buying kept markets in flux during the spring and summer. Stocks regained momentum in October despite a federal budget impasse and brief government shutdown, and lower volatility prevailed through year-end. Shedding new-year concerns about China's economy, an emerging-markets sell-off and confirmation (at last) of Fed tapering - alongside confirmation of a presumably dovish Janet Yellen as new Fed chair - February saw stocks back in record territory, bearing down on the five-year anniversary of the market's bottom.
Comments from Shilpa Mehra, Portfolio Manager of Consumer Finance Portfolio: For the year, the fund returned 24.31%, beating the 22.64% advance of the S&P® Consumer Finance Index and trailing the broad-based S&P 500®. Within the S&P® industry index, data processing & outsourced services and consumer finance were top performers, followed by regional banks and diversified banks. Mortgage real estate investment trusts (REITs) and thrifts & mortgage finance were laggards. The fund benefited versus the industry index from an overweighting in data processing & outsourced services. Standouts from this segment included FleetCor Technologies, which provides prepaid fuel cards globally. The company's global acquisition strategy helped drive this out-of-index stock sharply higher. Elsewhere, a sizable overweighting in credit card company Capital One Financial contributed, as management's renewed focus on shareholder value raised investors' awareness of the company's earnings growth potential. Underweighting mortgage REITs, especially sizable index component Annaly Capital Management, also helped. By contrast, having less exposure than the industry benchmark to the regional banks segment, in particular strong-performer KeyCorp, modestly detracted. KeyCorp was not in the fund at period end. An underweighted position in credit card issuer Discover Financial Services further weighed on performance as low credit losses, strong execution, solid loan growth and recent share buybacks drove an outsized gain.
The views expressed above reflect those of the portfolio manager(s) only through the end of the period as stated on the cover of this report and do not necessarily represent the views of Fidelity or any other person in the Fidelity organization. Any such views are subject to change at any time based upon market or other conditions and Fidelity disclaims any responsibility to update such views. These views may not be relied on as investment advice and, because investment decisions for a Fidelity fund are based on numerous factors, may not be relied on as an indication of trading intent on behalf of any Fidelity fund.
Annual Report
Consumer Finance Portfolio
Investment Changes (Unaudited)
Top Ten Stocks as of February 28, 2014 | ||
| % of fund's | % of fund's net assets |
Capital One Financial Corp. | 7.9 | 8.3 |
Visa, Inc. Class A | 7.3 | 8.2 |
MasterCard, Inc. Class A | 6.3 | 7.6 |
American Express Co. | 5.8 | 5.6 |
American Capital Agency Corp. | 5.4 | 1.4 |
SLM Corp. | 5.2 | 5.3 |
Discover Financial Services | 4.8 | 3.1 |
JPMorgan Chase & Co. | 3.4 | 3.0 |
Bank of America Corp. | 3.3 | 3.9 |
New York Community Bancorp, Inc. | 2.8 | 1.8 |
| 52.2 | |
Top Industries (% of fund's net assets) | |||
As of February 28, 2014 | |||
| Consumer Finance | 27.9% |
|
| Thrifts & Mortgage Finance | 18.5% |
|
| IT Services | 18.2% |
|
| Real Estate Investment Trusts | 13.8% |
|
| Diversified Financial Services | 10.0% |
|
| All Others* | 11.6% |
|

As of August 31, 2013 | |||
| Consumer Finance | 24.8% |
|
| IT Services | 21.8% |
|
| Commercial Banks | 21.5% |
|
| Thrifts & Mortgage Finance | 11.3% |
|
| Diversified Financial Services | 10.7% |
|
| All Others* | 9.9% |
|

* Includes short-term investments and net other assets (liabilities). |
Annual Report
Consumer Finance Portfolio
Investments February 28, 2014
Showing Percentage of Net Assets
Common Stocks - 99.5% | |||
Shares | Value | ||
CAPITAL MARKETS - 1.6% | |||
Investment Banking & Brokerage - 1.6% | |||
E*TRADE Financial Corp. (a) | 180,400 | $ 4,053,588 | |
COMMERCIAL BANKS - 8.1% | |||
Diversified Banks - 5.2% | |||
U.S. Bancorp | 158,200 | 6,508,348 | |
Wells Fargo & Co. | 139,800 | 6,489,516 | |
| 12,997,864 | ||
Regional Banks - 2.9% | |||
PNC Financial Services Group, Inc. | 79,200 | 6,476,976 | |
TCF Financial Corp. | 46,900 | 756,028 | |
| 7,233,004 | ||
TOTAL COMMERCIAL BANKS | 20,230,868 | ||
COMMERCIAL SERVICES & SUPPLIES - 0.7% | |||
Diversified Support Services - 0.7% | |||
Intrum Justitia AB | 61,000 | 1,779,105 | |
CONSUMER FINANCE - 27.9% | |||
Consumer Finance - 27.9% | |||
American Express Co. | 159,600 | 14,568,288 | |
Capital One Financial Corp. | 270,500 | 19,862,815 | |
Cash America International, Inc. | 31,746 | 1,270,475 | |
Credit Acceptance Corp. (a) | 21,600 | 2,983,824 | |
Discover Financial Services | 210,500 | 12,078,490 | |
EZCORP, Inc. (non-vtg.) Class A (a) | 69,700 | 881,008 | |
First Cash Financial Services, Inc. (a) | 60,300 | 3,185,649 | |
Nelnet, Inc. Class A | 45,300 | 1,817,436 | |
Santander Consumer U.S.A. Holdings, Inc. | 7,000 | 177,310 | |
SLM Corp. | 543,900 | 13,020,966 | |
| 69,846,261 | ||
DIVERSIFIED FINANCIAL SERVICES - 10.0% | |||
Other Diversified Financial Services - 9.2% | |||
Bank of America Corp. | 506,000 | 8,364,180 | |
Citigroup, Inc. | 130,400 | 6,341,352 | |
JPMorgan Chase & Co. | 148,100 | 8,415,042 | |
| 23,120,574 | ||
Specialized Finance - 0.8% | |||
PHH Corp. (a)(d) | 71,700 | 1,866,351 | |
TOTAL DIVERSIFIED FINANCIAL SERVICES | 24,986,925 | ||
IT SERVICES - 18.2% | |||
Data Processing & Outsourced Services - 18.2% | |||
EVERTEC, Inc. | 24,900 | 604,074 | |
Fidelity National Information Services, Inc. | 70,100 | 3,898,261 | |
FleetCor Technologies, Inc. (a) | 15,300 | 1,987,929 | |
MasterCard, Inc. Class A | 202,600 | 15,746,072 | |
| |||
Shares | Value | ||
Total System Services, Inc. | 161,300 | $ 4,913,198 | |
Visa, Inc. Class A | 81,484 | 18,410,495 | |
| 45,560,029 | ||
REAL ESTATE INVESTMENT TRUSTS - 13.8% | |||
Mortgage REITs - 13.8% | |||
Altisource Residential Corp. Class B (d) | 38,600 | 1,103,188 | |
American Capital Agency Corp. | 606,500 | 13,518,885 | |
Annaly Capital Management, Inc. | 234,900 | 2,626,182 | |
Capstead Mortgage Corp. | 58,500 | 754,065 | |
Chimera Investment Corp. | 869,700 | 2,774,343 | |
Hatteras Financial Corp. | 138,400 | 2,729,248 | |
Invesco Mortgage Capital, Inc. | 179,557 | 3,021,944 | |
MFA Financial, Inc. | 529,300 | 4,160,298 | |
New Residential Investment Corp. | 272,100 | 1,738,719 | |
Redwood Trust, Inc. (d) | 100,200 | 2,014,020 | |
| 34,440,892 | ||
REAL ESTATE MANAGEMENT & DEVELOPMENT - 0.7% | |||
Real Estate Services - 0.7% | |||
Altisource Portfolio Solutions SA | 17,400 | 1,711,812 | |
THRIFTS & MORTGAGE FINANCE - 18.5% | |||
Thrifts & Mortgage Finance - 18.5% | |||
BofI Holding, Inc. (a) | 17,400 | 1,619,940 | |
Capitol Federal Financial, Inc. | 94,000 | 1,142,100 | |
EverBank Financial Corp. | 117,800 | 2,110,976 | |
Flagstar Bancorp, Inc. (a) | 34,800 | 770,472 | |
Hudson City Bancorp, Inc. | 714,585 | 6,788,558 | |
MGIC Investment Corp. (a) | 484,753 | 4,343,387 | |
Nationstar Mortgage Holdings, Inc. (a)(d) | 88,100 | 2,539,923 | |
New York Community Bancorp, Inc. (d) | 435,000 | 6,951,300 | |
Northfield Bancorp, Inc. | 50,900 | 644,394 | |
Ocwen Financial Corp. (a) | 168,700 | 6,316,128 | |
People's United Financial, Inc. | 284,800 | 4,035,616 | |
Provident Financial Services, Inc. | 37,800 | 701,568 | |
Radian Group, Inc. (d) | 236,265 | 3,673,921 | |
TFS Financial Corp. (a) | 215,600 | 2,548,392 | |
Washington Federal, Inc. | 92,200 | 2,067,124 | |
| 46,253,799 | ||
TOTAL COMMON STOCKS (Cost $196,210,803) |
| ||
Money Market Funds - 6.1% | |||
Shares | Value | ||
Fidelity Securities Lending Cash Central Fund, 0.09% (b)(c) | 15,320,925 | $ 15,320,925 | |
TOTAL INVESTMENT PORTFOLIO - 105.6% (Cost $211,531,728) | 264,184,204 | ||
NET OTHER ASSETS (LIABILITIES) - (5.6)% | (13,962,512) | ||
NET ASSETS - 100% | $ 250,221,692 | ||
Legend |
(a) Non-income producing |
(b) Affiliated fund that is generally available only to investment companies and other accounts managed by Fidelity Investments. The rate quoted is the annualized seven-day yield of the fund at period end. A complete unaudited listing of the fund's holdings as of its most recent quarter end is available upon request. In addition, each Fidelity Central Fund's financial statements, which are not covered by the Fund's Report of Independent Registered Public Accounting Firm, are available on the SEC's website or upon request. |
(c) Investment made with cash collateral received from securities on loan. |
(d) Security or a portion of the security is on loan at period end. |
Affiliated Central Funds |
Information regarding fiscal year to date income earned by the Fund from investments in Fidelity Central Funds is as follows: |
Fund | Income earned |
Fidelity Cash Central Fund | $ 4,046 |
Fidelity Securities Lending Cash Central Fund | 85,510 |
Total | $ 89,556 |
Other Information |
All investments are categorized as Level 1 under the Fair Value Hierarchy. The inputs or methodology used for valuing securities may not be an indication of the risk associated with investing in those securities. For more information on valuation inputs, please refer to the Investment Valuation section in the accompanying Notes to Financial Statements. |
See accompanying notes which are an integral part of the financial statements.
Annual Report
Consumer Finance Portfolio
Financial Statements
Statement of Assets and Liabilities
| February 28, 2014 | |
|
|
|
Assets | ||
Investment in securities, at value (including securities loaned of $14,901,462) - See accompanying schedule: Unaffiliated issuers (cost $196,210,803) | $ 248,863,279 |
|
Fidelity Central Funds (cost $15,320,925) | 15,320,925 |
|
Total Investments (cost $211,531,728) |
| $ 264,184,204 |
Receivable for investments sold | 2,481,230 | |
Receivable for fund shares sold | 778,696 | |
Dividends receivable | 121,879 | |
Distributions receivable from Fidelity Central Funds | 11,132 | |
Prepaid expenses | 1,605 | |
Other receivables | 9,774 | |
Total assets | 267,588,520 | |
|
|
|
Liabilities | ||
Payable to custodian bank | $ 446,875 | |
Payable for investments purchased | 558,186 | |
Payable for fund shares redeemed | 836,438 | |
Accrued management fee | 115,472 | |
Other affiliated payables | 55,760 | |
Other payables and accrued expenses | 33,172 | |
Collateral on securities loaned, at value | 15,320,925 | |
Total liabilities | 17,366,828 | |
|
|
|
Net Assets | $ 250,221,692 | |
Net Assets consist of: |
| |
Paid in capital | $ 209,060,428 | |
Undistributed net investment income | 459,666 | |
Accumulated undistributed net realized gain (loss) on investments and foreign currency transactions | (11,950,878) | |
Net unrealized appreciation (depreciation) on investments | 52,652,476 | |
Net Assets, for 15,480,988 shares outstanding | $ 250,221,692 | |
Net Asset Value, offering price and redemption price per share ($250,221,692 ÷ 15,480,988 shares) | $ 16.16 | |
Statement of Operations
| Year ended February 28, 2014 | |
|
|
|
Investment Income |
|
|
Dividends |
| $ 8,217,490 |
Interest |
| 13 |
Income from Fidelity Central Funds |
| 89,556 |
Total income |
| 8,307,059 |
|
|
|
Expenses | ||
Management fee | $ 1,578,952 | |
Transfer agent fees | 647,470 | |
Accounting and security lending fees | 114,097 | |
Custodian fees and expenses | 14,361 | |
Independent trustees' compensation | 5,478 | |
Registration fees | 35,000 | |
Audit | 39,596 | |
Legal | 5,250 | |
Interest | 2,314 | |
Miscellaneous | 3,648 | |
Total expenses before reductions | 2,446,166 | |
Expense reductions | (66,460) | 2,379,706 |
Net investment income (loss) | 5,927,353 | |
Realized and Unrealized Gain (Loss) Net realized gain (loss) on: | ||
Investment securities: |
|
|
Unaffiliated issuers | 34,648,482 | |
Foreign currency transactions | 647 | |
Total net realized gain (loss) |
| 34,649,129 |
Change in net unrealized appreciation (depreciation) on investment securities | 20,933,018 | |
Net gain (loss) | 55,582,147 | |
Net increase (decrease) in net assets resulting from operations | $ 61,509,500 | |
See accompanying notes which are an integral part of the financial statements.
Annual Report
Statement of Changes in Net Assets
| Year ended | Year ended |
Increase (Decrease) in Net Assets |
|
|
Operations |
|
|
Net investment income (loss) | $ 5,927,353 | $ 5,391,023 |
Net realized gain (loss) | 34,649,129 | 28,622,069 |
Change in net unrealized appreciation (depreciation) | 20,933,018 | 22,333,097 |
Net increase (decrease) in net assets resulting from operations | 61,509,500 | 56,346,189 |
Distributions to shareholders from net investment income | (5,610,392) | (5,254,457) |
Distributions to shareholders from net realized gain | (37,860,128) | (261,707) |
Total distributions | (43,470,520) | (5,516,164) |
Share transactions | 129,379,846 | 282,686,434 |
Reinvestment of distributions | 42,335,822 | 5,347,969 |
Cost of shares redeemed | (243,098,406) | (201,716,370) |
Net increase (decrease) in net assets resulting from share transactions | (71,382,738) | 86,318,033 |
Redemption fees | 9,208 | 17,217 |
Total increase (decrease) in net assets | (53,334,550) | 137,165,275 |
|
|
|
Net Assets | ||
Beginning of period | 303,556,242 | 166,390,967 |
End of period (including undistributed net investment income of $459,666 and undistributed net investment income of $153,363, respectively) | $ 250,221,692 | $ 303,556,242 |
Other Information Shares | ||
Sold | 7,887,236 | 20,232,913 |
Issued in reinvestment of distributions | 2,727,248 | 367,092 |
Redeemed | (14,882,954) | (14,034,397) |
Net increase (decrease) | (4,268,470) | 6,565,608 |
Financial Highlights
Years ended February 28, | 2014 | 2013 | 2012 F | 2011 | 2010 |
Selected Per-Share Data |
|
|
|
|
|
Net asset value, beginning of period | $ 15.37 | $ 12.62 | $ 11.97 | $ 11.58 | $ 8.38 |
Income from Investment Operations |
|
|
|
|
|
Net investment income (loss) B | .34 | .28 | .22 | .19 | .22 |
Net realized and unrealized gain (loss) | 3.18 | 2.72 | .64 | .48 | 3.44 |
Total from investment operations | 3.52 | 3.00 | .86 | .67 | 3.66 |
Distributions from net investment income | (.40) | (.24) | (.20) | (.28) | (.46) |
Distributions from net realized gain | (2.33) | (.01) | (.01) | - | - |
Total distributions | (2.73) | (.25) | (.21) | (.28) | (.46) |
Redemption fees added to paid in capital B, G | - | - | - | - | - |
Net asset value, end of period | $ 16.16 | $ 15.37 | $ 12.62 | $ 11.97 | $ 11.58 |
Total Return A | 24.31% | 23.92% | 7.41% | 5.83% | 44.74% |
Ratios to Average Net Assets C, E |
|
|
|
|
|
Expenses before reductions | .85% | .89% | .95% | 1.01% | 1.05% |
Expenses net of fee waivers, if any | .85% | .89% | .95% | 1.01% | 1.05% |
Expenses net of all reductions | .83% | .86% | .94% | .98% | 1.02% |
Net investment income (loss) | 2.07% | 1.98% | 1.96% | 1.63% | 2.18% |
Supplemental Data |
|
|
|
|
|
Net assets, end of period (000 omitted) | $ 250,222 | $ 303,556 | $ 166,391 | $ 102,081 | $ 85,409 |
Portfolio turnover rate D | 89% | 79% | 113% | 161% | 153% |
A Total returns would have been lower if certain expenses had not been reduced during the applicable periods shown.
B Calculated based on average shares outstanding during the period.
C Fees and expenses of any underlying Fidelity Central Funds are not included in the Fund's expense ratio. The Fund indirectly bears its proportionate share of the expenses of any underlying Fidelity Central Funds.
D Amount does not include the portfolio activity of any underlying Fidelity Central Funds.
E Expense ratios reflect operating expenses of the Fund. Expenses before reductions do not reflect amounts reimbursed by the investment adviser or reductions from brokerage service arrangements or reductions from other expense offset arrangements and do not represent the amount paid by the Fund during periods when reimbursements or reductions occur. Expenses net of fee waivers reflect expenses after reimbursement by the investment adviser but prior to reductions from brokerage service arrangements or other expense offset arrangements. Expenses net of all reductions represent the net expenses paid by the Fund.
F For the year ended February 29.
G Amount represents less than $.01 per share.
See accompanying notes which are an integral part of the financial statements.
Annual Report
Financial Services Portfolio
Performance: The Bottom Line
Average annual total return reflects the change in the value of an investment, assuming reinvestment of the fund's distributions from dividend income and capital gains (the profits earned upon the sale of securities that have grown in value, if any) and assuming a constant rate of performance each year. The $10,000 table and the fund's returns do not reflect the deduction of taxes that a shareholder would pay on fund distributions or the redemption of fund shares. During periods of reimbursement by Fidelity, a fund's total return will be greater than it would be had the reimbursement not occurred. How a fund did yesterday is no guarantee of how it will do tomorrow.
Average Annual Total Returns
Periods ended February 28, 2014 | Past 1 | Past 5 | Past 10 |
Financial Services Portfolio | 24.56% | 20.28% | 0.28% |
$10,000 Over 10 Years
Let's say hypothetically that $10,000 was invested in Financial Services Portfolio on February 29, 2004. The chart shows how the value of your investment would have changed, and also shows how the S&P 500 Index performed over the same period.
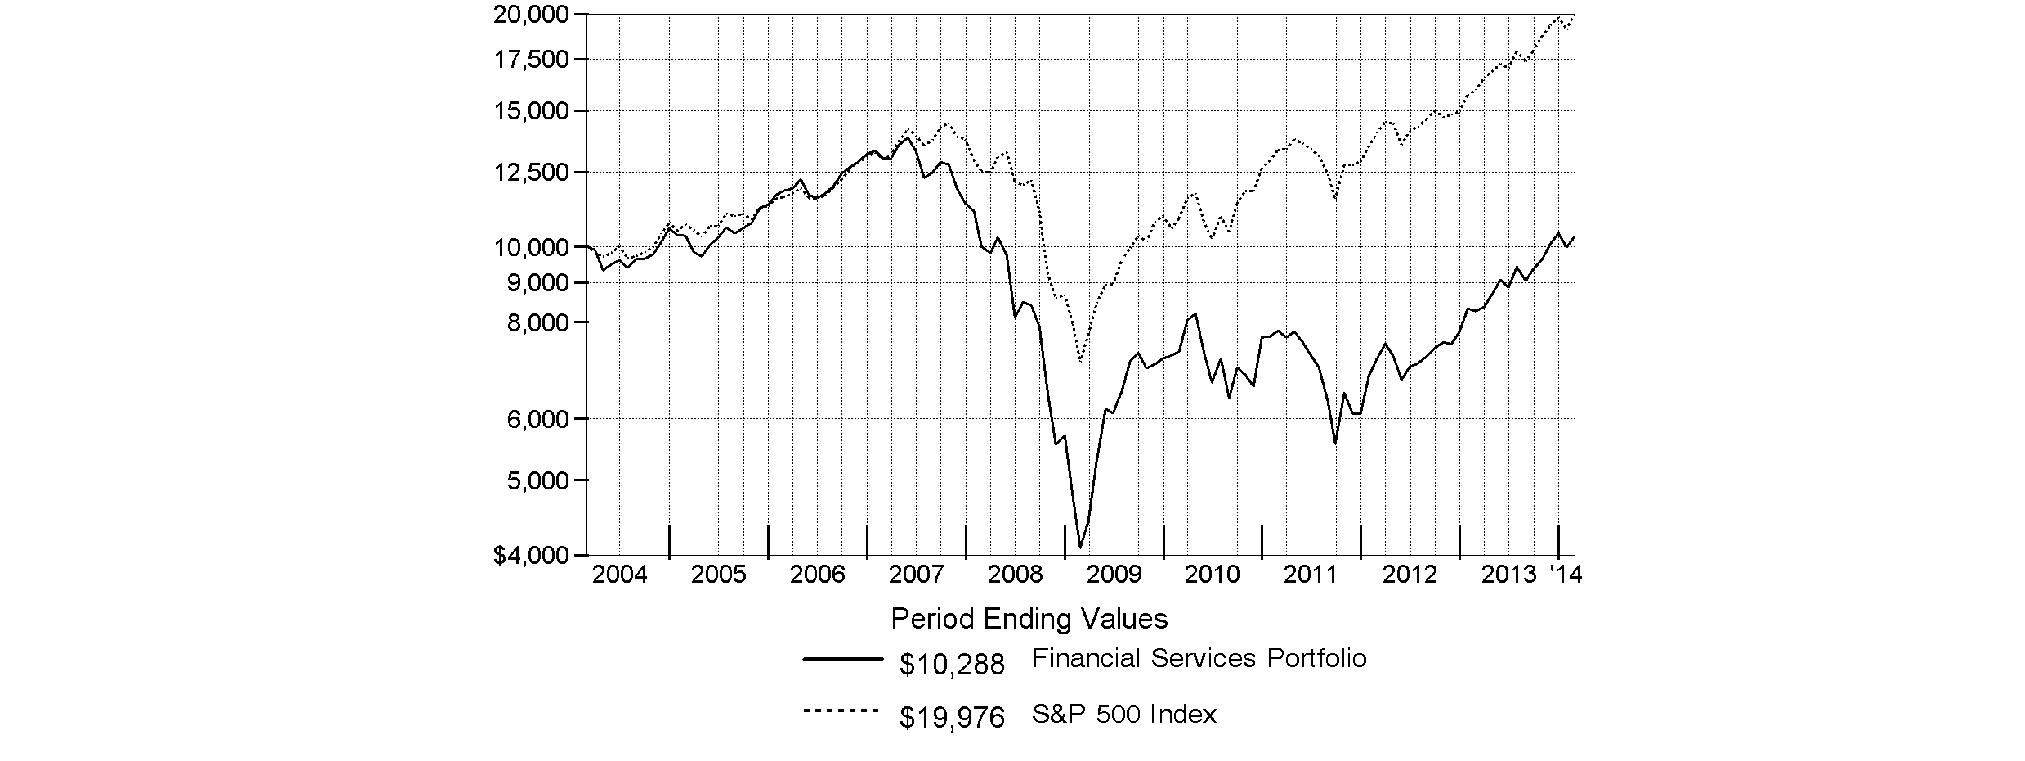
Annual Report
Financial Services Portfolio
Management's Discussion of Fund Performance
Market Recap: Stocks overcame fears of higher interest rates - not to mention their worst January in four years - to finish sharply higher for the 12 months ending February 28, 2014. The broad S&P 500® Index and the blue-chip Dow Jones Industrial AverageSM gained 25.37% and 19.01%, respectively, amid generally favorable earnings reports and accommodative monetary policies worldwide. Performance generally increased along the risk spectrum, with smaller-cap and growth strategies leading the way. An ebullient market helped the growth-oriented Nasdaq Composite Index® to a 38.10% period gain, for example. On the other hand, both cyclical and defensive stocks had representation in the top-performing industry sectors: returns were highest in health care and consumer discretionary; lowest in utilities and telecommunication services. From a macroeconomic perspective, data still points to slow but steady improvement in the U.S., and Europe's recession may well be over. Reports from China have disappointed, but continue to suggest a relatively soft landing there. Mixed signals from the U.S. Federal Reserve as to when it might curtail its stimulative bond buying kept markets in flux during the spring and summer. Stocks regained momentum in October despite a federal budget impasse and brief government shutdown, and lower volatility prevailed through year-end. Shedding new-year concerns about China's economy, an emerging-markets sell-off and confirmation (at last) of Fed tapering - alongside confirmation of a presumably dovish Janet Yellen as new Fed chair - February saw stocks back in record territory, bearing down on the five-year anniversary of the market's bottom.
Comments from Christopher Lee, Portfolio Manager of Financial Services Portfolio: For the year, the fund returned 24.56%, versus 23.73% for the MSCI® U.S. IMI Financials 25-50 Index and 25.37% for the broad-based S&P 500® Index. The equity market's strength, improving economic growth and rising interest rates all provided tailwinds for the sector's strong return. Relative to the MSCI sector benchmark, the biggest contributions came from stock picks in thrifts & mortgage finance, the out-of-index data processing & outsourced services group, and asset management & custody banks. In particular, the fund benefited from the opportunistic sale last spring of government-controlled mortgage finance company Fannie Mae after the stock surged. In addition, shares of alternative asset manager Blackstone Group soared as the company realized profits from real estate and equity investments made during the downturn. On the downside, a small cash position in an up market, an underweighting in the strong-performing life & health insurance group and disappointing stock selection within diversified banks hindered relative performance. In terms of individual detractors, underexposure to consumer finance giant American Express hurt, as the strength of the firm's high-end customer base drove an outsized gain. Specialized real estate investment trust (REIT) Rayonier disappointed due to pricing pressure in the cellulose fiber business. Blackstone and Fannie Mae were not in the sector index, and American Express and Rayonier were not in the portfolio at period end.
The views expressed above reflect those of the portfolio manager(s) only through the end of the period as stated on the cover of this report and do not necessarily represent the views of Fidelity or any other person in the Fidelity organization. Any such views are subject to change at any time based upon market or other conditions and Fidelity disclaims any responsibility to update such views. These views may not be relied on as investment advice and, because investment decisions for a Fidelity fund are based on numerous factors, may not be relied on as an indication of trading intent on behalf of any Fidelity fund.
Annual Report
Financial Services Portfolio
Investment Changes (Unaudited)
Top Ten Stocks as of February 28, 2014 | ||
| % of fund's | % of fund's net assets |
Bank of America Corp. | 5.5 | 5.5 |
U.S. Bancorp | 5.0 | 4.8 |
JPMorgan Chase & Co. | 4.9 | 5.0 |
Citigroup, Inc. | 4.8 | 5.1 |
Wells Fargo & Co. | 4.5 | 4.0 |
Capital One Financial Corp. | 3.9 | 4.0 |
American Tower Corp. | 3.3 | 3.0 |
MetLife, Inc. | 2.8 | 2.7 |
Berkshire Hathaway, Inc. Class B | 2.6 | 1.4 |
Simon Property Group, Inc. | 2.4 | 2.5 |
| 39.7 | |
Top Industries (% of fund's net assets) | |||
As of February 28, 2014 | |||
| Diversified Financial Services | 22.8% |
|
| Commercial Banks | 15.7% |
|
| Insurance | 15.3% |
|
| Capital Markets | 13.6% |
|
| Real Estate Investment Trusts | 10.6% |
|
| All Others* | 22.0% |
|

As of August 31, 2013 | |||
| Insurance | 19.8% |
|
| Commercial Banks | 19.5% |
|
| Diversified Financial Services | 19.4% |
|
| Capital Markets | 12.8% |
|
| Real Estate Investment Trusts | 10.2% |
|
| All Others* | 18.3% |
|

* Includes short-term investments and net other assets (liabilities). |
Annual Report
Financial Services Portfolio
Investments February 28, 2014
Showing Percentage of Net Assets
Common Stocks - 97.3% | |||
Shares | Value | ||
CAPITAL MARKETS - 13.6% | |||
Asset Management & Custody Banks - 10.5% | |||
Affiliated Managers Group, Inc. (a) | 52,183 | $ 9,813,013 | |
Ameriprise Financial, Inc. | 101,940 | 11,110,441 | |
BlackRock, Inc. Class A | 22,503 | 6,859,815 | |
Franklin Resources, Inc. | 256,200 | 13,642,650 | |
Invesco Ltd. | 525,109 | 18,011,239 | |
Oaktree Capital Group LLC Class A | 146,900 | 9,060,792 | |
The Blackstone Group LP | 408,404 | 13,620,273 | |
| 82,118,223 | ||
Investment Banking & Brokerage - 3.1% | |||
E*TRADE Financial Corp. (a) | 370,500 | 8,325,135 | |
FXCM, Inc. Class A | 236,100 | 3,978,285 | |
Raymond James Financial, Inc. | 222,761 | 11,757,326 | |
| 24,060,746 | ||
TOTAL CAPITAL MARKETS | 106,178,969 | ||
COMMERCIAL BANKS - 15.7% | |||
Diversified Banks - 9.5% | |||
U.S. Bancorp | 954,284 | 39,259,244 | |
Wells Fargo & Co. | 750,201 | 34,824,330 | |
| 74,083,574 | ||
Regional Banks - 6.2% | |||
BB&T Corp. | 352,700 | 13,332,060 | |
CoBiz, Inc. | 273,400 | 3,051,144 | |
Commerce Bancshares, Inc. | 168,437 | 7,522,396 | |
Fifth Third Bancorp | 518,728 | 11,253,804 | |
M&T Bank Corp. (d) | 75,050 | 8,750,080 | |
Popular, Inc. (a) | 160,000 | 4,574,400 | |
| 48,483,884 | ||
TOTAL COMMERCIAL BANKS | 122,567,458 | ||
CONSUMER FINANCE - 6.3% | |||
Consumer Finance - 6.3% | |||
Capital One Financial Corp. | 412,616 | 30,298,393 | |
SLM Corp. | 581,459 | 13,920,128 | |
Springleaf Holdings, Inc. | 163,300 | 4,600,161 | |
| 48,818,682 | ||
DIVERSIFIED CONSUMER SERVICES - 1.1% | |||
Specialized Consumer Services - 1.1% | |||
H&R Block, Inc. | 269,272 | 8,519,766 | |
DIVERSIFIED FINANCIAL SERVICES - 22.8% | |||
Multi-Sector Holdings - 2.6% | |||
Berkshire Hathaway, Inc. Class B (a) | 178,190 | 20,630,838 | |
Other Diversified Financial Services - 15.2% | |||
Bank of America Corp. | 2,564,417 | 42,389,814 | |
Citigroup, Inc. | 768,980 | 37,395,497 | |
JPMorgan Chase & Co. | 675,400 | 38,376,228 | |
| 118,161,539 | ||
| |||
Shares | Value | ||
Specialized Finance - 5.0% | |||
IntercontinentalExchange Group, Inc. | 78,747 | $ 16,445,523 | |
McGraw Hill Financial, Inc. | 185,676 | 14,790,950 | |
MSCI, Inc. Class A (a) | 168,800 | 7,378,248 | |
| 38,614,721 | ||
TOTAL DIVERSIFIED FINANCIAL SERVICES | 177,407,098 | ||
HEALTH CARE PROVIDERS & SERVICES - 0.6% | |||
Health Care Facilities - 0.6% | |||
Brookdale Senior Living, Inc. (a) | 147,000 | 4,930,380 | |
INSURANCE - 15.3% | |||
Insurance Brokers - 2.8% | |||
Brown & Brown, Inc. | 257,400 | 7,747,740 | |
Marsh & McLennan Companies, Inc. | 297,064 | 14,306,602 | |
| 22,054,342 | ||
Life & Health Insurance - 4.2% | |||
MetLife, Inc. | 431,350 | 21,856,505 | |
Prudential PLC | 217,784 | 4,931,225 | |
Torchmark Corp. | 73,400 | 5,689,234 | |
| 32,476,964 | ||
Property & Casualty Insurance - 7.0% | |||
Allied World Assurance Co. Holdings Ltd. | 54,804 | 5,465,055 | |
Allstate Corp. | 281,300 | 15,263,338 | |
Fidelity National Financial, Inc. Class A | 333,500 | 11,025,510 | |
The Travelers Companies, Inc. | 206,298 | 17,296,024 | |
XL Group PLC Class A | 185,100 | 5,627,040 | |
| 54,676,967 | ||
Reinsurance - 1.3% | |||
Everest Re Group Ltd. | 69,380 | 10,354,271 | |
TOTAL INSURANCE | 119,562,544 | ||
INTERNET SOFTWARE & SERVICES - 1.6% | |||
Internet Software & Services - 1.6% | |||
eBay, Inc. (a) | 131,300 | 7,716,501 | |
Equinix, Inc. (a) | 22,500 | 4,274,100 | |
| 11,990,601 | ||
IT SERVICES - 5.3% | |||
Data Processing & Outsourced Services - 5.3% | |||
EVERTEC, Inc. | 277,870 | 6,741,126 | |
Fiserv, Inc. (a) | 204,210 | 11,854,391 | |
FleetCor Technologies, Inc. (a) | 62,995 | 8,184,940 | |
The Western Union Co. | 370,500 | 6,198,465 | |
Visa, Inc. Class A | 37,100 | 8,382,374 | |
| 41,361,296 | ||
REAL ESTATE INVESTMENT TRUSTS - 10.6% | |||
Mortgage REITs - 2.8% | |||
Blackstone Mortgage Trust, Inc. | 183,300 | 5,310,201 | |
NorthStar Realty Finance Corp. | 366,600 | 5,685,966 | |
Common Stocks - continued | |||
Shares | Value | ||
REAL ESTATE INVESTMENT TRUSTS - CONTINUED | |||
Mortgage REITs - continued | |||
Redwood Trust, Inc. (d) | 284,150 | $ 5,711,415 | |
Starwood Property Trust, Inc. | 221,700 | 5,325,234 | |
| 22,032,816 | ||
Residential REITs - 1.5% | |||
Essex Property Trust, Inc. | 37,100 | 6,204,975 | |
Starwood Waypoint Residential (a) | 184,520 | 5,002,337 | |
| 11,207,312 | ||
Retail REITs - 3.0% | |||
CBL & Associates Properties, Inc. | 255,500 | 4,545,345 | |
Simon Property Group, Inc. | 116,279 | 18,754,640 | |
| 23,299,985 | ||
Specialized REITs - 3.3% | |||
American Tower Corp. | 318,840 | 25,975,895 | |
TOTAL REAL ESTATE INVESTMENT TRUSTS | 82,516,008 | ||
REAL ESTATE MANAGEMENT & DEVELOPMENT - 3.2% | |||
Real Estate Operating Companies - 0.5% | |||
Global Logistic Properties Ltd. | 1,640,000 | 3,661,263 | |
Real Estate Services - 2.7% | |||
Altisource Portfolio Solutions SA | 58,660 | 5,770,971 | |
CBRE Group, Inc. (a) | 562,631 | 15,725,536 | |
| 21,496,507 | ||
TOTAL REAL ESTATE MANAGEMENT & DEVELOPMENT | 25,157,770 | ||
THRIFTS & MORTGAGE FINANCE - 1.2% | |||
Thrifts & Mortgage Finance - 1.2% | |||
MGIC Investment Corp. (a) | 251,500 | 2,253,440 | |
| |||
Shares | Value | ||
Ocwen Financial Corp. (a) | 146,480 | $ 5,484,211 | |
Radian Group, Inc. | 103,200 | 1,604,760 | |
| 9,342,411 | ||
TOTAL COMMON STOCKS (Cost $668,531,346) |
| ||
Money Market Funds - 4.9% | |||
|
|
|
|
Fidelity Cash Central Fund, 0.10% (b) | 27,458,417 | 27,458,417 | |
Fidelity Securities Lending Cash Central Fund, 0.09% (b)(c) | 10,921,100 | 10,921,100 | |
TOTAL MONEY MARKET FUNDS (Cost $38,379,517) |
| ||
TOTAL INVESTMENT PORTFOLIO - 102.2% (Cost $706,910,863) | 796,732,500 | ||
NET OTHER ASSETS (LIABILITIES) - (2.2)% | (17,208,211) | ||
NET ASSETS - 100% | $ 779,524,289 | ||
Legend |
(a) Non-income producing |
(b) Affiliated fund that is generally available only to investment companies and other accounts managed by Fidelity Investments. The rate quoted is the annualized seven-day yield of the fund at period end. A complete unaudited listing of the fund's holdings as of its most recent quarter end is available upon request. In addition, each Fidelity Central Fund's financial statements, which are not covered by the Fund's Report of Independent Registered Public Accounting Firm, are available on the SEC's website or upon request. |
(c) Investment made with cash collateral received from securities on loan. |
(d) Security or a portion of the security is on loan at period end. |
Affiliated Central Funds |
Information regarding fiscal year to date income earned by the Fund from investments in Fidelity Central Funds is as follows: |
Fund | Income earned |
Fidelity Cash Central Fund | $ 18,826 |
Fidelity Securities Lending Cash Central Fund | 114,524 |
Total | $ 133,350 |
Other Information |
The following is a summary of the inputs used, as of February 28, 2014, involving the Fund's assets and liabilities carried at fair value. The inputs or methodology used for valuing securities may not be an indication of the risk associated with investing in those securities. For more information on valuation inputs, and their aggregation into the levels used in the table below, please refer to the Investment Valuation section in the accompanying Notes to Financial Statements. |
Valuation Inputs at Reporting Date: | ||||
Description | Total | Level 1 | Level 2 | Level 3 |
Investments in Securities: | ||||
Common Stocks | $ 758,352,983 | $ 753,421,758 | $ 4,931,225 | $ - |
Money Market Funds | 38,379,517 | 38,379,517 | - | - |
Total Investments in Securities: | $ 796,732,500 | $ 791,801,275 | $ 4,931,225 | $ - |
See accompanying notes which are an integral part of the financial statements.
Annual Report
Financial Services Portfolio
Financial Statements
Statement of Assets and Liabilities
| February 28, 2014 | |
|
|
|
Assets | ||
Investment in securities, at value (including securities loaned of $10,800,866) - See accompanying schedule: Unaffiliated issuers (cost $668,531,346) | $ 758,352,983 |
|
Fidelity Central Funds (cost $38,379,517) | 38,379,517 |
|
Total Investments (cost $706,910,863) |
| $ 796,732,500 |
Receivable for investments sold | 1,791,914 | |
Receivable for fund shares sold | 2,032,036 | |
Dividends receivable | 826,359 | |
Distributions receivable from Fidelity Central Funds | 2,456 | |
Prepaid expenses | 3,812 | |
Other receivables | 11,405 | |
Total assets | 801,400,482 | |
|
|
|
Liabilities | ||
Payable for investments purchased | $ 9,358,138 | |
Payable for fund shares redeemed | 1,063,499 | |
Accrued management fee | 345,581 | |
Other affiliated payables | 145,735 | |
Other payables and accrued expenses | 42,140 | |
Collateral on securities loaned, at value | 10,921,100 | |
Total liabilities | 21,876,193 | |
|
|
|
Net Assets | $ 779,524,289 | |
Net Assets consist of: |
| |
Paid in capital | $ 694,126,337 | |
Undistributed net investment income | 1,137,853 | |
Accumulated undistributed net realized gain (loss) on investments and foreign currency transactions | (5,562,765) | |
Net unrealized appreciation (depreciation) on investments and assets and liabilities in foreign currencies | 89,822,864 | |
Net Assets, for 9,635,095 shares outstanding | $ 779,524,289 | |
Net Asset Value, offering price and redemption price per share ($779,524,289 ÷ 9,635,095 shares) | $ 80.90 | |
Statement of Operations
| Year ended February 28, 2014 | |
|
|
|
Investment Income |
|
|
Dividends |
| $ 15,260,409 |
Interest |
| 101 |
Income from Fidelity Central Funds |
| 133,350 |
Total income |
| 15,393,860 |
|
|
|
Expenses | ||
Management fee | $ 3,800,127 | |
Transfer agent fees | 1,456,144 | |
Accounting and security lending fees | 249,837 | |
Custodian fees and expenses | 60,721 | |
Independent trustees' compensation | 13,098 | |
Registration fees | 40,386 | |
Audit | 43,488 | |
Legal | 11,919 | |
Miscellaneous | 7,154 | |
Total expenses before reductions | 5,682,874 | |
Expense reductions | (147,477) | 5,535,397 |
Net investment income (loss) | 9,858,463 | |
Realized and Unrealized Gain (Loss) Net realized gain (loss) on: | ||
Investment securities: |
|
|
Unaffiliated issuers | 90,971,045 | |
Foreign currency transactions | (52,969) | |
Total net realized gain (loss) |
| 90,918,076 |
Change in net unrealized appreciation (depreciation) on: Investment securities | 44,693,594 | |
Assets and liabilities in foreign currencies | 1,987 | |
Total change in net unrealized appreciation (depreciation) |
| 44,695,581 |
Net gain (loss) | 135,613,657 | |
Net increase (decrease) in net assets resulting from operations | $ 145,472,120 | |
See accompanying notes which are an integral part of the financial statements.
Annual Report
Statement of Changes in Net Assets
| Year ended | Year ended |
Increase (Decrease) in Net Assets |
|
|
Operations |
|
|
Net investment income (loss) | $ 9,858,463 | $ 7,675,290 |
Net realized gain (loss) | 90,918,076 | 15,043,757 |
Change in net unrealized appreciation (depreciation) | 44,695,581 | 42,947,773 |
Net increase (decrease) in net assets resulting from operations | 145,472,120 | 65,666,820 |
Distributions to shareholders from net investment income | (6,729,366) | (6,085,400) |
Share transactions | 225,300,994 | 292,034,591 |
Reinvestment of distributions | 6,569,326 | 5,948,865 |
Cost of shares redeemed | (207,165,684) | (180,543,241) |
Net increase (decrease) in net assets resulting from share transactions | 24,704,636 | 117,440,215 |
Redemption fees | 17,661 | 25,104 |
Total increase (decrease) in net assets | 163,465,051 | 177,046,739 |
|
|
|
Net Assets | ||
Beginning of period | 616,059,238 | 439,012,499 |
End of period (including undistributed net investment income of $1,137,853 and undistributed net investment income of $609,096, respectively) | $ 779,524,289 | $ 616,059,238 |
Other Information Shares | ||
Sold | 2,986,460 | 4,757,449 |
Issued in reinvestment of distributions | 83,052 | 96,934 |
Redeemed | (2,831,630) | (3,083,350) |
Net increase (decrease) | 237,882 | 1,771,033 |
Financial Highlights
Years ended February 28, | 2014 | 2013 | 2012 F | 2011 | 2010 |
Selected Per-Share Data |
|
|
|
|
|
Net asset value, beginning of period | $ 65.56 | $ 57.57 | $ 62.81 | $ 59.32 | $ 33.45 |
Income from Investment Operations |
|
|
|
|
|
Net investment income (loss) B | 1.06 | .99 | .21 | .17 | .37 |
Net realized and unrealized gain (loss) | 15.03 | 7.75 | (5.31) | 3.49 | 26.14 |
Total from investment operations | 16.09 | 8.74 | (5.10) | 3.66 | 26.51 |
Distributions from net investment income | (.75) | (.75) | (.14) | (.18) | (.62) |
Distributions from net realized gain | - | - | - | - | (.03) |
Total distributions | (.75) | (.75) | (.14) | (.18) | (.65) |
Redemption fees added to paid in capital B | - G | - G | - G | .01 | .01 |
Net asset value, end of period | $ 80.90 | $ 65.56 | $ 57.57 | $ 62.81 | $ 59.32 |
Total Return A | 24.56% | 15.26% | (8.07)% | 6.21% | 79.56% |
Ratios to Average Net Assets C, E |
|
|
|
|
|
Expenses before reductions | .83% | .87% | .90% | .92% | .96% |
Expenses net of fee waivers, if any | .83% | .87% | .90% | .92% | .96% |
Expenses net of all reductions | .81% | .78% | .84% | .88% | .92% |
Net investment income (loss) | 1.43% | 1.66% | .39% | .28% | .70% |
Supplemental Data |
|
|
|
|
|
Net assets, end of period (000 omitted) | $ 779,524 | $ 616,059 | $ 439,012 | $ 512,227 | $ 482,520 |
Portfolio turnover rate D | 197% | 271% | 384% | 242% | 301% |
A Total returns would have been lower if certain expenses had not been reduced during the applicable periods shown.
B Calculated based on average shares outstanding during the period.
C Fees and expenses of any underlying Fidelity Central Funds are not included in the Fund's expense ratio. The Fund indirectly bears its proportionate share of the expenses of any underlying Fidelity Central Funds.
D Amount does not include the portfolio activity of any underlying Fidelity Central Funds.
E Expense ratios reflect operating expenses of the Fund. Expenses before reductions do not reflect amounts reimbursed by the investment adviser or reductions from brokerage service arrangements or reductions from other expense offset arrangements and do not represent the amount paid by the Fund during periods when reimbursements or reductions occur. Expenses net of fee waivers reflect expenses after reimbursement by the investment adviser but prior to reductions from brokerage service arrangements or other expense offset arrangements. Expenses net of all reductions represent the net expenses paid by the Fund.
F For the year ended February 29.
G Amount represents less than $.01 per share.
See accompanying notes which are an integral part of the financial statements.
Annual Report
Insurance Portfolio
Performance: The Bottom Line
Average annual total return reflects the change in the value of an investment, assuming reinvestment of the fund's distributions from dividend income and capital gains (the profits earned upon the sale of securities that have grown in value, if any) and assuming a constant rate of performance each year. The $10,000 table and the fund's returns do not reflect the deduction of taxes that a shareholder would pay on fund distributions or the redemption of fund shares. During periods of reimbursement by Fidelity, a fund's total return will be greater than it would be had the reimbursement not occurred. How a fund did yesterday is no guarantee of how it will do tomorrow.
Average Annual Total Returns
Periods ended February 28, 2014 | Past 1 | Past 5 | Past 10 |
Insurance Portfolio | 25.82% | 25.77% | 4.47% |
$10,000 Over 10 Years
Let's say hypothetically that $10,000 was invested in Insurance Portfolio on February 29, 2004. The chart shows how the value of your investment would have changed, and also shows how the S&P 500 Index performed over the same period.
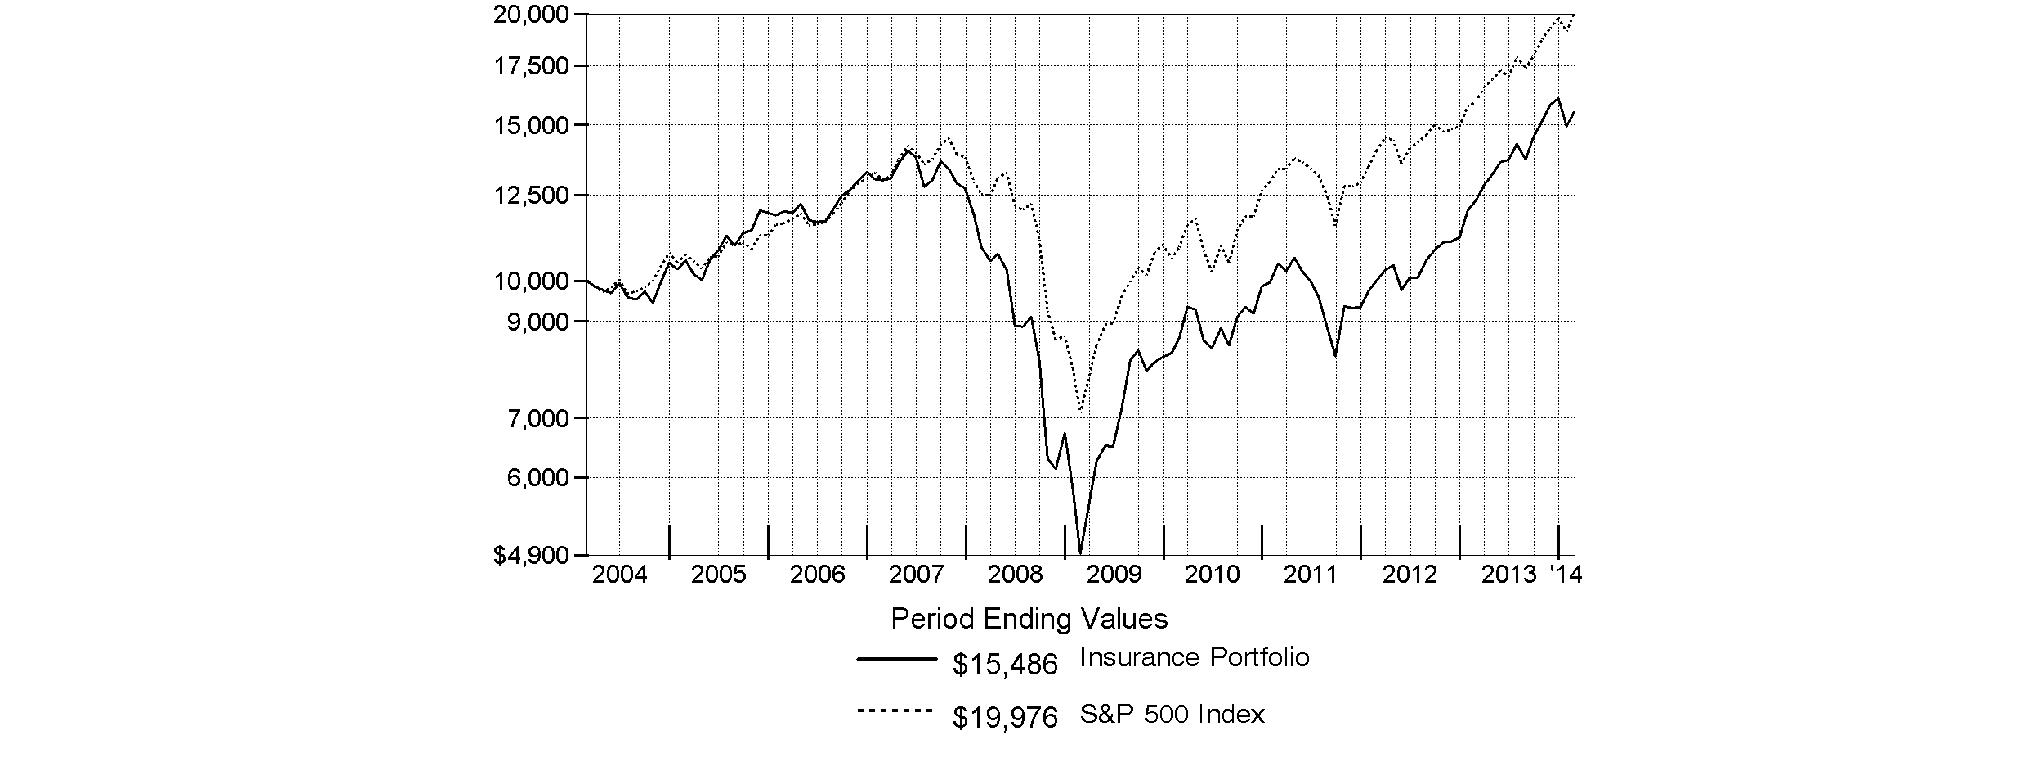
Annual Report
Insurance Portfolio
Management's Discussion of Fund Performance
Market Recap: Stocks overcame fears of higher interest rates - not to mention their worst January in four years - to finish sharply higher for the 12 months ending February 28, 2014. The broad S&P 500® Index and the blue-chip Dow Jones Industrial AverageSM gained 25.37% and 19.01%, respectively, amid generally favorable earnings reports and accommodative monetary policies worldwide. Performance generally increased along the risk spectrum, with smaller-cap and growth strategies leading the way. An ebullient market helped the growth-oriented Nasdaq Composite Index® to a 38.10% period gain, for example. On the other hand, both cyclical and defensive stocks had representation in the top-performing industry sectors: returns were highest in health care and consumer discretionary; lowest in utilities and telecommunication services. From a macroeconomic perspective, data still points to slow but steady improvement in the U.S., and Europe's recession may well be over. Reports from China have disappointed, but continue to suggest a relatively soft landing there. Mixed signals from the U.S. Federal Reserve as to when it might curtail its stimulative bond buying kept markets in flux during the spring and summer. Stocks regained momentum in October despite a federal budget impasse and brief government shutdown, and lower volatility prevailed through year-end. Shedding new-year concerns about China's economy, an emerging-markets sell-off and confirmation (at last) of Fed tapering - alongside confirmation of a presumably dovish Janet Yellen as new Fed chair - February saw stocks back in record territory, bearing down on the five-year anniversary of the market's bottom.
Comments from Peter Deutsch, who became sole Portfolio Manager of Insurance Portfolio on January 1, 2014: For the year, the fund returned 25.82%, compared with 26.17% for its benchmark, the MSCI® U.S. IMI Insurance 25-50 Index, and 25.37% for the broad-based S&P 500®. Within the MSCI industry benchmark, the biggest winners were life & health insurance stocks, while the property and casualty (P&C) segment lagged. Within the portfolio, security selection was strong in P&C, reinsurance and multi-line insurance. Standouts included title insurer Fidelity National Financial, a P&C stock that benefited from better-than-expected demand, a recent acquisition and the creation of a new tracking stock for its private equity investments. Not owning multi-line insurer Loews until December contributed because the share price stalled due to poor performance from its non-insurance subsidiaries. By contrast, an underweighting in life & health insurance and an overweighting in P&C detracted, along with a small cash position. Individual disappointments included medical malpractice insurance company ProAssurance, a P&C stock whose return was flat due to a recent acquisition, declining demand and a reduction in its reserve-release program. An underweighting in U.S. life insurer Prudential Financial also hurt, as rising interest rates helped fuel a sizable share price gain.
The views expressed above reflect those of the portfolio manager(s) only through the end of the period as stated on the cover of this report and do not necessarily represent the views of Fidelity or any other person in the Fidelity organization. Any such views are subject to change at any time based upon market or other conditions and Fidelity disclaims any responsibility to update such views. These views may not be relied on as investment advice and, because investment decisions for a Fidelity fund are based on numerous factors, may not be relied on as an indication of trading intent on behalf of any Fidelity fund.
Annual Report
Insurance Portfolio
Investment Changes (Unaudited)
Top Ten Stocks as of February 28, 2014 | ||
| % of fund's | % of fund's net assets |
American International Group, Inc. | 10.3 | 8.2 |
MetLife, Inc. | 9.4 | 7.5 |
The Travelers Companies, Inc. | 7.2 | 7.4 |
ACE Ltd. | 6.9 | 7.1 |
Marsh & McLennan Companies, Inc. | 6.1 | 5.9 |
The Chubb Corp. | 5.6 | 6.2 |
Allstate Corp. | 5.2 | 2.2 |
AFLAC, Inc. | 4.8 | 4.4 |
Prudential Financial, Inc. | 4.3 | 3.3 |
Hartford Financial Services Group, Inc. | 2.6 | 2.8 |
| 62.4 | |
Top Industries (% of fund's net assets) | |||
As of February 28, 2014 | |||
| Insurance | 97.3% |
|
| Diversified Financial Services | 2.0% |
|
| Capital Markets | 0.4% |
|
| All Others* | 0.3% |
|

As of August 31, 2013 | |||
| Insurance | 98.6% |
|
 | Diversified Financial Services | 0.1% |
|
| All Others* | 1.3% |
|

* Includes short-term investments and net other assets (liabilities). |
Annual Report
Insurance Portfolio
Investments February 28, 2014
Showing Percentage of Net Assets
Common Stocks - 99.7% | |||
Shares | Value | ||
CAPITAL MARKETS - 0.4% | |||
Asset Management & Custody Banks - 0.4% | |||
Carlyle Group LP | 42,300 | $ 1,534,221 | |
DIVERSIFIED FINANCIAL SERVICES - 2.0% | |||
Multi-Sector Holdings - 2.0% | |||
Berkshire Hathaway, Inc. Class B (a) | 74,300 | 8,602,454 | |
INSURANCE - 97.3% | |||
Insurance Brokers - 11.4% | |||
Aon PLC | 74,700 | 6,394,320 | |
Arthur J. Gallagher & Co. | 155,300 | 7,174,860 | |
Brown & Brown, Inc. | 257,300 | 7,744,730 | |
Marsh & McLennan Companies, Inc. | 542,700 | 26,136,432 | |
Willis Group Holdings PLC | 43,700 | 1,798,692 | |
| 49,249,034 | ||
Life & Health Insurance - 26.3% | |||
AFLAC, Inc. | 321,200 | 20,582,496 | |
American Equity Investment Life Holding Co. | 600 | 13,116 | |
Citizens, Inc. Class A (a) | 1,300 | 9,542 | |
FBL Financial Group, Inc. Class A | 300 | 12,552 | |
Kansas City Life Insurance Co. | 200 | 9,840 | |
Lincoln National Corp. | 52,800 | 2,646,864 | |
MetLife, Inc. | 795,975 | 40,332,053 | |
National Western Life Insurance Co. Class A | 100 | 22,605 | |
Primerica, Inc. | 60,400 | 2,707,128 | |
Principal Financial Group, Inc. | 228,300 | 10,353,405 | |
Protective Life Corp. | 53,400 | 2,784,276 | |
Prudential Financial, Inc. | 220,189 | 18,623,586 | |
Prudential PLC | 1,854 | 41,980 | |
StanCorp Financial Group, Inc. | 32,100 | 2,124,378 | |
Torchmark Corp. | 60,100 | 4,658,351 | |
Unum Group | 234,000 | 8,138,520 | |
| 113,060,692 | ||
Multi-Line Insurance - 15.9% | |||
American Financial Group, Inc. | 500 | 28,580 | |
American International Group, Inc. | 891,200 | 44,355,022 | |
American International Group, Inc. warrants 1/19/21 (a) | 56,569 | 1,079,902 | |
Assurant, Inc. | 19,800 | 1,299,474 | |
Hartford Financial Services Group, Inc. | 321,400 | 11,310,066 | |
Horace Mann Educators Corp. | 900 | 25,749 | |
Loews Corp. | 73,700 | 3,204,476 | |
Zurich Insurance Group AG | 23,428 | 7,178,904 | |
| 68,482,173 | ||
Property & Casualty Insurance - 38.0% | |||
ACE Ltd. | 303,349 | 29,688,767 | |
Allied World Assurance Co. Holdings Ltd. | 63,300 | 6,312,276 | |
| |||
Shares | Value | ||
Allstate Corp. | 409,900 | $ 22,241,174 | |
Amerisafe, Inc. | 800 | 34,832 | |
Amtrust Financial Services, Inc. (d) | 31,600 | 1,194,480 | |
Arch Capital Group Ltd. (a) | 800 | 44,896 | |
Argo Group International Holdings, Ltd. | 500 | 22,070 | |
Aspen Insurance Holdings Ltd. | 1,400 | 52,584 | |
Assured Guaranty Ltd. | 114,700 | 2,815,885 | |
Axis Capital Holdings Ltd. | 17,000 | 747,490 | |
Baldwin & Lyons, Inc. Class B | 400 | 10,284 | |
Beazley PLC | 810,196 | 3,581,724 | |
Cincinnati Financial Corp. | 1,300 | 60,944 | |
Donegal Group, Inc. Class A | 100 | 1,411 | |
EMC Insurance Group | 300 | 9,150 | |
Employers Holdings, Inc. | 800 | 15,736 | |
Erie Indemnity Co. Class A | 1,300 | 94,354 | |
esure Group PLC | 567,500 | 2,561,078 | |
Fidelity National Financial, Inc. Class A | 270,000 | 8,926,200 | |
First American Financial Corp. | 116,300 | 3,133,122 | |
Global Indemnity PLC (a) | 300 | 7,824 | |
Hanover Insurance Group, Inc. | 50,900 | 2,994,956 | |
HCI Group, Inc. (d) | 1,000 | 48,420 | |
Hilltop Holdings, Inc. (a) | 500 | 12,255 | |
Hiscox Ltd. | 216,481 | 2,363,554 | |
Infinity Property & Casualty Corp. | 140 | 10,325 | |
Lancashire Holdings Ltd. | 191,500 | 2,352,161 | |
Markel Corp. (a) | 10,000 | 5,780,000 | |
MBIA, Inc. (a) | 900 | 12,195 | |
Meadowbrook Insurance Group, Inc. | 700 | 3,759 | |
Mercury General Corp. | 200 | 9,060 | |
National Interstate Corp. | 700 | 21,189 | |
Navigators Group, Inc. (a) | 400 | 24,248 | |
OneBeacon Insurance Group Ltd. | 200 | 3,280 | |
ProAssurance Corp. | 145,100 | 6,596,246 | |
Progressive Corp. | 153,000 | 3,746,970 | |
Selective Insurance Group, Inc. | 2,500 | 57,600 | |
State Auto Financial Corp. | 1,900 | 38,038 | |
Stewart Information Services Corp. | 700 | 25,886 | |
The Chubb Corp. | 274,958 | 24,053,326 | |
The Travelers Companies, Inc. | 367,300 | 30,794,432 | |
Tower Group International Ltd. | 3,700 | 10,212 | |
United Fire Group, Inc. | 600 | 17,388 | |
W.R. Berkley Corp. | 32,600 | 1,344,424 | |
XL Group PLC Class A | 51,200 | 1,556,480 | |
| 163,432,685 | ||
Reinsurance - 5.7% | |||
Alleghany Corp. (a) | 25 | 9,638 | |
Enstar Group Ltd. (a) | 200 | 25,036 | |
Everest Re Group Ltd. | 56,400 | 8,417,136 | |
Greenlight Capital Re, Ltd. (a) | 1,100 | 34,595 | |
Maiden Holdings Ltd. | 700 | 7,861 | |
Montpelier Re Holdings Ltd. | 1,100 | 31,361 | |
Reinsurance Group of America, Inc. | 89,733 | 6,908,544 | |
RenaissanceRe Holdings Ltd. | 44,878 | 4,286,298 | |
Common Stocks - continued | |||
Shares | Value | ||
INSURANCE - CONTINUED | |||
Reinsurance - continued | |||
Third Point Reinsurance Ltd. | 36,500 | $ 547,500 | |
Validus Holdings Ltd. | 120,500 | 4,435,605 | |
| 24,703,574 | ||
TOTAL INSURANCE | 418,928,158 | ||
TOTAL COMMON STOCKS (Cost $349,432,200) |
| ||
Money Market Funds - 0.0% | |||
|
|
|
|
Fidelity Securities Lending Cash Central Fund, 0.09% (b)(c) | 35,000 |
| |
TOTAL INVESTMENT PORTFOLIO - 99.7% (Cost $349,467,200) | 429,099,833 | ||
NET OTHER ASSETS (LIABILITIES) - 0.3% | 1,381,926 | ||
NET ASSETS - 100% | $ 430,481,759 | ||
Legend |
(a) Non-income producing |
(b) Affiliated fund that is generally available only to investment companies and other accounts managed by Fidelity Investments. The rate quoted is the annualized seven-day yield of the fund at period end. A complete unaudited listing of the fund's holdings as of its most recent quarter end is available upon request. In addition, each Fidelity Central Fund's financial statements, which are not covered by the Fund's Report of Independent Registered Public Accounting Firm, are available on the SEC's website or upon request. |
(c) Investment made with cash collateral received from securities on loan. |
(d) Security or a portion of the security is on loan at period end. |
Affiliated Central Funds |
Information regarding fiscal year to date income earned by the Fund from investments in Fidelity Central Funds is as follows: |
Fund | Income earned |
Fidelity Cash Central Fund | $ 10,521 |
Fidelity Securities Lending Cash Central Fund | 480 |
Total | $ 11,001 |
Other Information |
The following is a summary of the inputs used, as of February 28, 2014, involving the Fund's assets and liabilities carried at fair value. The inputs or methodology used for valuing securities may not be an indication of the risk associated with investing in those securities. For more information on valuation inputs, and their aggregation into the levels used in the table below, please refer to the Investment Valuation section in the accompanying Notes to Financial Statements. |
Valuation Inputs at Reporting Date: | ||||
Description | Total | Level 1 | Level 2 | Level 3 |
Investments in Securities: | ||||
Common Stocks | $ 429,064,833 | $ 429,022,853 | $ 41,980 | $ - |
Money Market Funds | 35,000 | 35,000 | - | - |
Total Investments in Securities: | $ 429,099,833 | $ 429,057,853 | $ 41,980 | $ - |
Distribution of investments by country or territory of incorporation, as a percentage of total net assets, is as follows (Unaudited): |
United States of America | 80.1% |
Switzerland | 10.1% |
Bermuda | 6.1% |
United Kingdom | 2.1% |
Others (Individually Less Than 1%) | 1.6% |
| 100.0% |
See accompanying notes which are an integral part of the financial statements.
Annual Report
Insurance Portfolio
Financial Statements
Statement of Assets and Liabilities
| February 28, 2014 | |
|
|
|
Assets | ||
Investment in securities, at value (including securities loaned of $34,488) - See accompanying schedule: Unaffiliated issuers (cost $349,432,200) | $ 429,064,833 |
|
Fidelity Central Funds (cost $35,000) | 35,000 |
|
Total Investments (cost $349,467,200) |
| $ 429,099,833 |
Cash |
| 307 |
Receivable for investments sold | 5,210,113 | |
Receivable for fund shares sold | 262,301 | |
Dividends receivable | 1,089,053 | |
Distributions receivable from Fidelity Central Funds | 81 | |
Prepaid expenses | 2,585 | |
Other receivables | 13,287 | |
Total assets | 435,677,560 | |
|
|
|
Liabilities | ||
Payable for fund shares redeemed | $ 4,738,816 | |
Accrued management fee | 205,326 | |
Notes payable to affiliates | 75,000 | |
Other affiliated payables | 95,355 | |
Other payables and accrued expenses | 46,304 | |
Collateral on securities loaned, at value | 35,000 | |
Total liabilities | 5,195,801 | |
|
|
|
Net Assets | $ 430,481,759 | |
Net Assets consist of: |
| |
Paid in capital | $ 329,930,871 | |
Undistributed net investment income | 1,110,409 | |
Accumulated undistributed net realized gain (loss) on investments and foreign currency transactions | 19,806,420 | |
Net unrealized appreciation (depreciation) on investments and assets and liabilities in foreign currencies | 79,634,059 | |
Net Assets, for 6,514,245 shares outstanding | $ 430,481,759 | |
Net Asset Value, offering price and redemption price per share ($430,481,759 ÷ 6,514,245 shares) | $ 66.08 | |
Statement of Operations
| Year ended February 28, 2014 | |
|
|
|
Investment Income |
|
|
Dividends |
| $ 9,723,796 |
Interest |
| 15 |
Income from Fidelity Central Funds |
| 11,001 |
Total income |
| 9,734,812 |
|
|
|
Expenses | ||
Management fee | $ 2,706,547 | |
Transfer agent fees | 1,001,223 | |
Accounting and security lending fees | 186,395 | |
Custodian fees and expenses | 33,231 | |
Independent trustees' compensation | 9,922 | |
Registration fees | 68,558 | |
Audit | 39,906 | |
Legal | 7,431 | |
Interest | 5,022 | |
Miscellaneous | 4,811 | |
Total expenses before reductions | 4,063,046 | |
Expense reductions | (44,485) | 4,018,561 |
Net investment income (loss) | 5,716,251 | |
Realized and Unrealized Gain (Loss) Net realized gain (loss) on: | ||
Investment securities: |
|
|
Unaffiliated issuers | 61,580,558 | |
Foreign currency transactions | 2,567 | |
Total net realized gain (loss) |
| 61,583,125 |
Change in net unrealized appreciation (depreciation) on: Investment securities | 35,522,267 | |
Assets and liabilities in foreign currencies | 793 | |
Total change in net unrealized appreciation (depreciation) |
| 35,523,060 |
Net gain (loss) | 97,106,185 | |
Net increase (decrease) in net assets resulting from operations | $ 102,822,436 | |
See accompanying notes which are an integral part of the financial statements.
Annual Report
Statement of Changes in Net Assets
| Year ended | Year ended |
Increase (Decrease) in Net Assets |
|
|
Operations |
|
|
Net investment income (loss) | $ 5,716,251 | $ 3,633,721 |
Net realized gain (loss) | 61,583,125 | 28,752,750 |
Change in net unrealized appreciation (depreciation) | 35,523,060 | 22,071,432 |
Net increase (decrease) in net assets resulting from operations | 102,822,436 | 54,457,903 |
Distributions to shareholders from net investment income | (5,025,333) | (2,671,620) |
Distributions to shareholders from net realized gain | (38,049,834) | (4,976,342) |
Total distributions | (43,075,167) | (7,647,962) |
Share transactions | 369,681,359 | 51,037,876 |
Reinvestment of distributions | 42,144,995 | 7,552,084 |
Cost of shares redeemed | (348,195,310) | (69,107,383) |
Net increase (decrease) in net assets resulting from share transactions | 63,631,044 | (10,517,423) |
Redemption fees | 32,542 | 2,211 |
Total increase (decrease) in net assets | 123,410,855 | 36,294,729 |
|
|
|
Net Assets | ||
Beginning of period | 307,070,904 | 270,776,175 |
End of period (including undistributed net investment income of $1,110,409 and undistributed net investment income of $955,417, respectively) | $ 430,481,759 | $ 307,070,904 |
Other Information Shares | ||
Sold | 5,802,380 | 980,985 |
Issued in reinvestment of distributions | 641,929 | 146,776 |
Redeemed | (5,335,482) | (1,415,569) |
Net increase (decrease) | 1,108,827 | (287,808) |
Financial Highlights
Years ended February 28, | 2014 | 2013 | 2012 F | 2011 | 2010 |
Selected Per-Share Data |
|
|
|
|
|
Net asset value, beginning of period | $ 56.81 | $ 47.56 | $ 50.04 | $ 41.55 | $ 23.95 |
Income from Investment Operations |
|
|
|
|
|
Net investment income (loss) B | .75 | .68 | .43 | .47 | .34 |
Net realized and unrealized gain (loss) | 13.75 | 10.06 | (2.52) | 8.36 | 17.60 |
Total from investment operations | 14.50 | 10.74 | (2.09) | 8.83 | 17.94 |
Distributions from net investment income | (.61) | (.52) | (.39) | (.34) | (.34) |
Distributions from net realized gain | (4.62) | (.97) | - | - | - |
Total distributions | (5.23) | (1.49) | (.39) | (.34) | (.34) |
Redemption fees added to paid in capital B, G | - | - | - | - | - |
Net asset value, end of period | $ 66.08 | $ 56.81 | $ 47.56 | $ 50.04 | $ 41.55 |
Total Return A | 25.82% | 22.91% | (4.13)% | 21.31% | 74.97% |
Ratios to Average Net Assets C, E |
|
|
|
|
|
Expenses before reductions | .83% | .87% | .89% | .93% | .99% |
Expenses net of fee waivers, if any | .83% | .87% | .89% | .93% | .99% |
Expenses net of all reductions | .82% | .85% | .88% | .91% | .97% |
Net investment income (loss) | 1.17% | 1.35% | .94% | 1.05% | .96% |
Supplemental Data |
|
|
|
|
|
Net assets, end of period (000 omitted) | $ 430,482 | $ 307,071 | $ 270,776 | $ 248,055 | $ 150,176 |
Portfolio turnover rate D | 126% | 157% | 153% | 193% | 215% |
A Total returns would have been lower if certain expenses had not been reduced during the applicable periods shown.
B Calculated based on average shares outstanding during the period.
C Fees and expenses of any underlying Fidelity Central Funds are not included in the Fund's expense ratio. The Fund indirectly bears its proportionate share of the expenses of any underlying Fidelity Central Funds.
D Amount does not include the portfolio activity of any underlying Fidelity Central Funds.
E Expense ratios reflect operating expenses of the Fund. Expenses before reductions do not reflect amounts reimbursed by the investment adviser or reductions from brokerage service arrangements or reductions from other expense offset arrangements and do not represent the amount paid by the Fund during periods when reimbursements or reductions occur. Expenses net of fee waivers reflect expenses after reimbursement by the investment adviser but prior to reductions from brokerage service arrangements or other expense offset arrangements. Expenses net of all reductions represent the net expenses paid by the Fund.
F For the year ended February 29.
G Amount represents less than $.01 per share.
See accompanying notes which are an integral part of the financial statements.
Annual Report
Notes to Financial Statements
For the period ended February 28, 2014
1. Organization.
Banking Portfolio, Brokerage and Investment Management Portfolio, Financial Services Portfolio, Consumer Finance Portfolio and Insurance Portfolio (the Funds) are funds of Fidelity Select Portfolios (the Trust). The Trust is registered under the Investment Company Act of 1940, as amended (the 1940 Act), as an open-end management investment company organized as a Massachusetts business trust. The Funds are non-diversified with the exception of Banking Portfolio and Financial Services Portfolio. The Funds invest primarily in securities of companies whose principal business activities fall within specific industries. Each Fund is authorized to issue an unlimited number of shares.
2. Investments in Fidelity Central Funds.
The Funds invest in Fidelity Central Funds, which are open-end investment companies generally available only to other investment companies and accounts managed by the investment adviser and its affiliates. The Funds' Schedules of Investments list each of the Fidelity Central Funds held as of period end, if any, as an investment of each Fund, but do not include the underlying holdings of each Fidelity Central Fund. As an Investing Fund, each Fund indirectly bears its proportionate share of the expenses of the underlying Fidelity Central Funds.
The Money Market Central Funds seek preservation of capital and current income and are managed by Fidelity Investments Money Management, Inc. (FIMM), an affiliate of the investment adviser. Annualized expenses of the Money Market Central Funds as of their most recent shareholder report date are less than .01%.
A complete unaudited list of holdings for each Fidelity Central Fund is available upon request or at the Securities and Exchange Commission (the SEC) website at www.sec.gov. In addition, the financial statements of the Fidelity Central Funds, which are not covered by the Funds' Report of Independent Registered Public Accounting Firm, are available on the SEC website or upon request.
3. Significant Accounting Policies.
The financial statements have been prepared in conformity with accounting principles generally accepted in the United States of America (GAAP), which require management to make certain estimates and assumptions at the date of the financial statements. Actual results could differ from those estimates. Subsequent events, if any, through the date that the financial statements were issued have been evaluated in the preparation of the financial statements. The following summarizes the significant accounting policies of the Funds:
Investment Valuation. Investments are valued as of 4:00 p.m. Eastern time on the last calendar day of the period. In accordance with valuation policies and procedures approved by the Board of Trustees (the Board), each Fund attempts to obtain prices from one or more third party pricing vendors or brokers to value its investments. When current market prices, quotations or currency exchange rates are not readily available or reliable, investments will be fair valued in good faith by the Fidelity SelectCo, LLC (SelectCo) Fair Value Committee (the Committee), in accordance with procedures adopted by the Board. Factors used in determining fair value vary by investment type and may include market or investment specific events. The frequency with which these procedures are used cannot be predicted and they may be utilized to a significant extent. The Committee oversees each Fund's valuation policies and procedures and is responsible for approving and reporting to the Board all fair value determinations.
Each Fund categorizes the inputs to valuation techniques used to value their investments into a disclosure hierarchy consisting of three levels as shown below:
Level 1 - quoted prices in active markets for identical investments
Level 2 - other significant observable inputs (including quoted prices for similar investments, interest rates, prepayment speeds, etc.)
Level 3 - unobservable inputs (including the Fund's own assumptions based on the best information available)
Valuation techniques used to value each Fund's investments by major category are as follows:
Equity securities, including restricted securities, for which market quotations are readily available, are valued at the last reported sale price or official closing price as reported by a third party pricing vendor on the primary market or exchange on which they are traded and are categorized as Level 1 in the hierarchy. In the event there were no sales during the day or closing prices are not available, securities are valued at the last quoted bid price or may be valued using the last available price and are generally categorized as Level 2 in the hierarchy. For foreign equity securities, when market or security specific events arise, comparisons to the valuation of American Depositary Receipts (ADRs), futures contracts, Exchange-Traded Funds (ETFs) and certain indexes as well as quoted prices for similar securities may be used and would be categorized as Level 2 in the hierarchy. Utilizing these techniques may result in transfers between Level 1 and Level 2. For equity securities, including restricted securities, where observable inputs are limited, assumptions about market activity and risk are used and these securities may be categorized as Level 3 in the hierarchy.
Investments in open-end mutual funds, including the Fidelity Central Funds, are valued at their closing net asset value (NAV) each business day and are categorized as Level 1 in the hierarchy.
Changes in valuation techniques may result in transfers in or out of an assigned level within the disclosure hierarchy. The aggregate value of investments by input level, as of February 28, 2014, is included at the end of each applicable Fund's Schedule of Investments.
Annual Report
3. Significant Accounting Policies - continued
Foreign Currency. The Funds may use foreign currency contracts to facilitate transactions in foreign-denominated securities. Gains and losses from these transactions may arise from changes in the value of the foreign currency or if the counterparties do not perform under the contracts' terms.
Foreign-denominated assets, including investment securities, and liabilities are translated into U.S. dollars at the exchange rates at period end. Purchases and sales of investment securities, income and dividends received and expenses denominated in foreign currencies are translated into U.S. dollars at the exchange rate in effect on the transaction date.
The effects of exchange rate fluctuations on investments are included with the net realized and unrealized gain (loss) on investment securities. Other foreign currency transactions resulting in realized and unrealized gain (loss) are disclosed separately.
Investment Transactions and Income. For financial reporting purposes, the Funds' investment holdings and NAV include trades executed through the end of the last business day of the period. The NAV per share for processing shareholder transactions is calculated as of the close of business of the New York Stock Exchange (NYSE), normally 4:00 p.m. Eastern time and includes trades executed through the end of the prior business day. Gains and losses on securities sold are determined on the basis of identified cost and may include proceeds received from litigation. Dividend income is recorded on the ex-dividend date, except for certain dividends from foreign securities where the ex-dividend date may have passed, which are recorded as soon as the Funds are informed of the ex-dividend date. Non-cash dividends included in dividend income, if any, are recorded at the fair market value of the securities received. Distributions received on securities that represent a return of capital or capital gain are recorded as a reduction of cost of investments and/or as a realized gain. Subsequent to ex-dividend date the Funds determine the components of these distributions, based upon receipt of tax filings or other correspondence relating to the underlying investment. Interest income and distributions from the Fidelity Central Funds are accrued as earned. Interest income includes coupon interest and amortization of premium and accretion of discount on debt securities. Investment income is recorded net of foreign taxes withheld where recovery of such taxes is uncertain.
Expenses. Expenses directly attributable to a fund are charged to that fund. Expenses attributable to more than one fund are allocated among the respective funds on the basis of relative net assets or other appropriate methods. Expense estimates are accrued in the period to which they relate and adjustments are made when actual amounts are known.
Income Tax Information and Distributions to Shareholders. Each year, each Fund intends to qualify as a regulated investment company under Subchapter M of the Internal Revenue Code, including distributing substantially all of its taxable income and realized gains. As a result, no provision for U.S. Federal income taxes is required. As of February 28, 2014, each Fund did not have any unrecognized tax benefits in the financial statements; nor is each Fund aware of any tax positions for which it is reasonably possible that the total amounts of unrecognized tax benefits will significantly change in the next twelve months. Each Fund files a U.S. federal tax return, in addition to state and local tax returns as required. The Fund's federal income tax returns are subject to examination by the Internal Revenue Service (IRS) for a period of three fiscal years after they are filed. State and local tax returns may be subject to examination for an additional fiscal year depending on the jurisdiction. Foreign taxes are provided for based on each Fund's understanding of the tax rules and rates that exist in the foreign markets in which it invests.
Distributions are declared and recorded on the ex-dividend date. Income and capital gain distributions are determined in accordance with income tax regulations, which may differ from GAAP. In addition, certain Funds claimed a portion of the payment made to redeeming shareholders as a distribution for income tax purposes.
Capital accounts within the financial statements are adjusted for permanent book-tax differences. These adjustments have no impact on net assets or the results of operations. Capital accounts are not adjusted for temporary book-tax differences which will reverse in a subsequent period.
Book-tax differences are primarily due to foreign currency transactions, passive foreign investment companies (PFIC), partnerships, deferred trustees compensation, capital loss carryforwards and losses deferred due to wash sales and excise tax regulations.
The federal tax cost of investment securities and unrealized appreciation (depreciation) as of period end were as follows for each Fund:
| Tax cost | Gross unrealized appreciation | Gross unrealized depreciation | Net unrealized |
Banking Portfolio | $ 785,545,971 | $ 114,075,225 | $ (34,895,264) | $ 79,179,961 |
Brokerage and Investment Management Portfolio | 723,474,771 | 111,729,770 | (18,224,122) | 93,505,648 |
Consumer Finance Portfolio | 212,831,292 | 57,014,070 | (5,661,158) | 51,352,912 |
Financial Services Portfolio | 711,423,916 | 91,520,073 | (6,211,489) | 85,308,584 |
Insurance Portfolio | 351,014,197 | 79,880,687 | (1,795,051) | 78,085,636 |
Annual Report
Notes to Financial Statements - continued
3. Significant Accounting Policies - continued
Income Tax Information and Distributions to Shareholders - continued
The tax-based components of distributable earnings as of period end were as follows for each Fund:
| Undistributed | Undistributed long-term | Capital loss | Net unrealized appreciation |
Banking Portfolio | $ 10,810,742 | $ 17,407,528 | $ - | $ 79,181,627 |
Brokerage and Investment Management Portfolio | 960,908 | 937,450 | - | 95,502,003 |
Consumer Finance Portfolio | 459,778 | 13,924,295 | (22,686,164) | 51,352,912 |
Financial Services Portfolio | 1,138,006 | - | (1,049,711) | 85,309,811 |
Insurance Portfolio | 13,042,515 | 9,421,313 | - | 78,087,062 |
Capital loss carryforwards are only available to offset future capital gains of the Funds to the extent provided by regulations and may be limited. Under the Regulated Investment Company Modernization Act of 2010 (the Act), the Funds are permitted to carry forward capital losses incurred in taxable years beginning after December 22, 2010 for an unlimited period and such capital losses are required to be used prior to any losses that expire. The capital loss carryforward information presented below, including any applicable limitation, is estimated as of fiscal period end and is subject to adjustment.
| Fiscal year of expiration |
| ||
| 2017 | 2018 | 2019 | Total capital loss |
Consumer Finance Portfolio | $ - | $ (21,674,500) | $ (1,011,664) | $ (22,686,164) |
Financial Services Portfolio | (376,786) | (672,925) | - | (1,049,711) |
Due to large subscriptions in a prior period, $22,686,164 of capital losses that will be available to offset future capital gains of the Consumer Finance Portfolio will be limited to approximately $5,418,625 per year.
Certain of the Funds intend to elect to defer to the next fiscal year capital losses recognized during the period November 1, 2013 to February 28, 2014. Loss deferrals were as follows:
| Capital losses |
Consumer Finance Portfolio | $ 1,889,445 |
The tax character of distributions paid was as follows:
February 28, 2014 |
|
|
|
| Ordinary Income | Long-Term | Total |
Banking Portfolio | $ 5,835,222 | $ 15,904,464 | $ 21,739,686 |
Brokerage and Investment Management Portfolio | 4,851,731 | - | 4,851,731 |
Consumer Finance Portfolio | 16,102,735 | 27,367,785 | 43,470,520 |
Financial Services Portfolio | 6,729,366 | - | 6,729,366 |
Insurance Portfolio | 12,192,698 | 30,882,469 | 43,075,167 |
February 28, 2013 |
|
|
|
| Ordinary Income | Long-Term | Total |
Banking Portfolio | $ 6,092,882 | $ - | $ 6,092,882 |
Brokerage and Investment Management Portfolio | 9,530,873 | - | 9,530,873 |
Consumer Finance Portfolio | 5,516,164 | - | 5,516,164 |
Financial Services Portfolio | 6,085,400 | - | 6,085,400 |
Insurance Portfolio | 2,671,620 | 4,976,342 | 7,647,962 |
Trading (Redemption) Fees. Shares held by investors in the Funds less than 30 days may be subject to a redemption fee equal to .75% of the NAV of shares redeemed. All redemption fees, which reduce the proceeds of the shareholder redemption, are retained by the Funds and accounted for as an addition to paid in capital.
Annual Report
4. Purchases and Sales of Investments.
Purchases and sales of securities, other than short-term securities, are noted in the table below.
| Purchases ($) | Sales ($) |
Banking Portfolio | 710,866,036 | 589,727,224 |
Brokerage and Investment Management Portfolio | 1,369,843,820 | 1,282,620,762 |
Consumer Finance Portfolio | 252,556,630 | 359,635,743 |
Financial Services Portfolio | 1,361,338,943 | 1,317,474,215 |
Insurance Portfolio | 629,198,313 | 593,513,942 |
5. Fees and Other Transactions with Affiliates.
Management Fee. Effective August 1, 2013, SelectCo replaced Fidelity Management and Research Company (FMR), an affiliate of SelectCo, as investment adviser to the Funds. The investment adviser and its affiliates provide the Funds with investment management related services for which the Funds pay a monthly management fee. The management fee is the sum of an individual fund fee rate and an annualized group fee rate. The individual fund fee rate is applied to each Fund's average net assets. The group fee rate is based upon the average net assets of all the mutual funds advised by FMR and the investment adviser. The group fee rate decreases as assets under management increase and increases as assets under management decrease. For the reporting period, each Fund's annual management fee rate expressed as a percentage of each Fund's average net assets was as follows:
| Individual Rate | Group Rate | Total |
Banking Portfolio | .30% | .25% | .55% |
Brokerage and Investment Management Portfolio | .30% | .25% | .55% |
Consumer Finance Portfolio | .30% | .25% | .55% |
Financial Services Portfolio | .30% | .25% | .55% |
Insurance Portfolio | .30% | .25% | .55% |
Transfer Agent Fees. Fidelity Investments Institutional Operations Company, Inc. (FIIOC), an affiliate of the investment adviser, is the Funds' transfer, dividend disbursing and shareholder servicing agent. FIIOC receives account fees and asset-based fees that vary according to account size and type of account. FIIOC pays for typesetting, printing and mailing of shareholder reports, except proxy statements. For the period, transfer agent fees were equivalent to the following annual rates expressed as a percentage of average net assets:
Banking Portfolio | .20% |
Brokerage and Investment Management Portfolio | .21% |
Consumer Finance Portfolio | .23% |
Financial Services Portfolio | .21% |
Insurance Portfolio | .20% |
Accounting and Security Lending Fees. Fidelity Service Company, Inc. (FSC), an affiliate of the investment adviser, maintains each Fund's accounting records. The accounting fee is based on the level of average net assets for each month. Under a separate contract, FSC administers the security lending program. The security lending fee is based on the number and duration of lending transactions.
Brokerage Commissions. Certain Funds placed a portion of their portfolio transactions with brokerage firms which are affiliates of the investment adviser. Brokerage commissions are included in net realized gain (loss) and change in net unrealized appreciation (depreciation) in the Statement of Operations. The commissions paid to these affiliated firms were as follows:
| Amount |
Banking Portfolio | $ 25,711 |
Brokerage and Investment Management Portfolio | 62,533 |
Consumer Finance Portfolio | 16,234 |
Financial Services Portfolio | 49,556 |
Insurance Portfolio | 12,592 |
Interfund Lending Program. Pursuant to an Exemptive Order issued by the SEC, the Funds, along with other registered investment companies having management contracts with FMR or other affiliated entities of FMR, may participate in an interfund lending program. This program provides an alternative credit facility allowing the funds to borrow from, or lend money to, other participating affiliated funds. At period end, Consumer Finance Portfolio had no interfund loans outstanding. Brokerage and Investment Management Portfolio's, and Insurance Portfolio's open loans, including
Annual Report
Notes to Financial Statements - continued
5. Fees and Other Transactions with Affiliates - continued
Interfund Lending Program - continued
accrued interest, at period end are presented under the caption "Notes payable to affiliates" in the their Statements of Assets and Liabilities. Each applicable fund's activity in this program during the period for which loans were outstanding was as follows:
| Borrower or | Average Loan | Weighted | Interest Expense |
Brokerage and Investment Management Portfolio | Borrower | $ 12,020,267 | .33% | $ 1,653 |
Consumer Finance Portfolio | Borrower | 20,650,375 | .31% | 1,439 |
Insurance Portfolio | Borrower | 8,990,500 | .30% | 1,347 |
6. Committed Line of Credit.
Certain Funds participate with other funds managed by the investment adviser or an affiliate in a $4.25 billion credit facility (the "line of credit") to be utilized for temporary or emergency purposes to fund shareholder redemptions or for other short-term liquidity purposes. The participating funds have agreed to pay commitment fees on their pro-rata portion of the line of credit, which are reflected in Miscellaneous expenses on the Statement of Operations, and are as follows:
Banking Portfolio | $ 1,213 |
Brokerage and Investment Management Portfolio | 1,288 |
Consumer Finance Portfolio | 602 |
Financial Services Portfolio | 1,292 |
Insurance Portfolio | 863 |
During the period, there were no borrowings on this line of credit.
7. Security Lending.
Certain Funds lend portfolio securities through a lending agent from time to time in order to earn additional income. For equity securities, a lending agent is used and may loan securities to certain qualified borrowers, which prior to August 1, 2013, included Fidelity Capital Markets (FCM), a broker-dealer affiliated with the Funds. On the settlement date of the loan, each applicable Fund receives collateral (in the form of U.S. Treasury obligations, letters of credit and/or cash) against the loaned securities and maintains collateral in an amount not less than 100% of the market value of the loaned securities during the period of the loan. The market value of the loaned securities is determined at the close of business of the Funds and any additional required collateral is delivered to the Funds on the next business day. If the borrower defaults on its obligation to return the securities loaned because of insolvency or other reasons, the Funds may apply collateral received from the borrower against the obligation. The Funds may experience delays and costs in recovering the securities loaned. Any cash collateral received is invested in the Fidelity Securities Lending Cash Central Fund. The value of loaned securities and cash collateral at period end are disclosed on each applicable Fund's Statement of Assets and Liabilities. Security lending income represents the income earned on investing cash collateral, less rebates paid to borrowers and any lending agent fees associated with the loan, plus any premium payments received for lending certain types of securities. Security lending income is presented on each applicable Fund's Statement of Operations as a component of income from Fidelity Central Funds. Security lending activity was as follows:
| Total Security Lending Income | Security Lending |
Banking Portfolio | $ 52,497 | $ - |
Brokerage and Investment Management Portfolio | 122,227 | 33 |
Consumer Finance Portfolio | 85,510 | - |
Financial Services Portfolio | 114,524 | 5 |
Insurance Portfolio | 480 | - |
Annual Report
8. Bank Borrowings.
Each Fund is permitted to have bank borrowings for temporary or emergency purposes to fund shareholder redemptions or for other short-term liquidity requirements. Each Fund has established borrowing arrangements with certain banks. The interest rate on the borrowings is the bank's base rate, as revised from time to time. At period end, there were no bank borrowings outstanding. Each applicable Fund's activity in this program during the period for which loans were outstanding was as follows:
| Average Loan | Weighted | Interest Expense |
Consumer Finance Portfolio | $ 27,145,000 | .58% | $ 875 |
Insurance Portfolio | 9,283,360 | .57% | 3,675 |
9. Expense Reductions.
Commissions paid to certain brokers with whom the investment adviser, or its affiliates, places trades on behalf of Certain Funds include an amount in addition to trade execution, which may be rebated back to the Funds to offset certain expenses. In addition, through arrangements with each applicable Fund's custodian, credits realized as a result of uninvested cash balances were used to reduce each applicable Fund's expenses. All of the applicable expense reductions are noted in the table below.
| Brokerage | Custody |
|
|
|
Banking Portfolio | $ 64,991 | $ - |
Brokerage and Investment Management Portfolio | 133,057 | - |
Consumer Finance Portfolio | 63,576 | - |
Financial Services Portfolio | 143,798 | 78 |
Insurance Portfolio | 42,937 | 33 |
In addition, FMR reimbursed a portion of each Fund's operating expenses during the period as follows:
| Reimbursement |
|
|
Banking Portfolio | $ 3,097 |
Brokerage and Investment Management Portfolio | 2,722 |
Consumer Finance Portfolio | 2,884 |
Financial Services Portfolio | 3,601 |
Insurance Portfolio | 1,515 |
10. Other.
The Funds' organizational documents provide former and current trustees and officers with a limited indemnification against liabilities arising in connection with the performance of their duties to the Funds. In the normal course of business, the Funds may also enter into contracts that provide general indemnifications. The Funds' maximum exposure under these arrangements is unknown as this would be dependent on future claims that may be made against the Funds. The risk of material loss from such claims is considered remote.
At the end of the period, Strategic Advisers U.S. Opportunity Fund was the owner of record of approximately 20%, 12%, 12% and 11% of the total outstanding shares of Banking Portfolio, Brokerage and Investment Management Portfolio, Consumer Finance Portfolio and Financial Services Portfolio, respectively. VIP FundsManager 60% Portfolio was the owner of record of approximately 18%, 20%, 24% and 21%of the total outstanding shares of Banking Portfolio, Consumer Finance Portfolio, Financial Services Portfolio and Insurance Portfolio, respectively. Mutual funds managed by the investment adviser or its affiliates were the owners of record, in the aggregate, of approximately 53%, 35%, 42%, 53% and 34% of the total outstanding shares of Banking Portfolio, Brokerage and Investment Management Portfolio, Consumer Finance Portfolio, Financial Services Portfolio and Insurance Portfolio, respectively.
Annual Report
Report of Independent Registered Public Accounting Firm
To the Trustees of Fidelity Select Portfolios and the Shareholders of Banking Portfolio, Brokerage and Investment Management Portfolio, Consumer Finance Portfolio, Financial Services Portfolio and Insurance Portfolio:
In our opinion, the accompanying statements of assets and liabilities, including the schedules of investments, and the related statements of operations and of changes in net assets and the financial highlights present fairly, in all material respects, the financial positions of Banking Portfolio, Brokerage and Investment Management Portfolio, Consumer Finance Portfolio, Financial Services Portfolio and Insurance Portfolio (funds of Fidelity Select Portfolios) at February 28, 2014, the results of each of their operations for the year then ended, the changes in each of their net assets for each of the two years in the period then ended and the financial highlights for each of the five years in the period then ended, in conformity with accounting principles generally accepted in the United States of America. These financial statements and financial highlights (hereafter referred to as "financial statements") are the responsibility of the Fidelity Select Portfolios' management. Our responsibility is to express an opinion on these financial statements based on our audits. We conducted our audits of these financial statements in accordance with the standards of the Public Company Accounting Oversight Board (United States). Those standards require that we plan and perform the audit to obtain reasonable assurance about whether the financial statements are free of material misstatement. An audit includes examining, on a test basis, evidence supporting the amounts and disclosures in the financial statements, assessing the accounting principles used and significant estimates made by management, and evaluating the overall financial statement presentation. We believe that our audits, which included confirmation of securities at February 28, 2014 by correspondence with the custodian and brokers, provide a reasonable basis for our opinion.
PricewaterhouseCoopers LLP
Boston, Massachusetts
April 14, 2014
Annual Report
Trustees and Officers
The Trustees and officers of the trust and funds, as applicable, are listed below. The Board of Trustees governs each fund and is responsible for protecting the interests of shareholders. The Trustees are experienced executives who meet periodically throughout the year to oversee each fund's activities, review contractual arrangements with companies that provide services to each fund, oversee management of the risks associated with such activities and contractual arrangements, and review each fund's performance. Except for Ned C. Lautenbach and William S. Stavropoulos, each of the Trustees oversees 74 funds. Mr. Lautenbach and Mr. Stavropoulos each oversees 246 funds.
The Trustees hold office without limit in time except that (a) any Trustee may resign; (b) any Trustee may be removed by written instrument, signed by at least two-thirds of the number of Trustees prior to such removal; (c) any Trustee who requests to be retired or who has become incapacitated by illness or injury may be retired by written instrument signed by a majority of the other Trustees; and (d) any Trustee may be removed at any special meeting of shareholders by a two-thirds vote of the outstanding voting securities of the trust. The officers hold office without limit in time, except that any officer may resign or may be removed by a vote of a majority of the Trustees at any regular meeting or any special meeting of the Trustees. Except as indicated, each individual has held the office shown or other offices in the same company for the past five years.
Experience, Skills, Attributes, and Qualifications of the Funds' Trustees. The Governance and Nominating Committee has adopted a statement of policy that describes the experience, qualifications, attributes, and skills that are necessary and desirable for potential Independent Trustee candidates (Statement of Policy). The Board believes that each Trustee satisfied at the time he or she was initially elected or appointed a Trustee, and continues to satisfy, the standards contemplated by the Statement of Policy. The Governance and Nominating Committee also engages professional search firms to help identify potential Independent Trustee candidates who have the experience, qualifications, attributes, and skills consistent with the Statement of Policy. From time to time, additional criteria based on the composition and skills of the current Independent Trustees, as well as experience or skills that may be appropriate in light of future changes to board composition, business conditions, and regulatory or other developments, have also been considered by the professional search firms and the Governance and Nominating Committee. In addition, the Board takes into account the Trustees' commitment and participation in Board and committee meetings, as well as their leadership of standing and ad hoc committees throughout their tenure.
In determining that a particular Trustee was and continues to be qualified to serve as a Trustee, the Board has considered a variety of criteria, none of which, in isolation, was controlling. The Board believes that, collectively, the Trustees have balanced and diverse experience, qualifications, attributes, and skills, which allow the Board to operate effectively in governing each fund and protecting the interests of shareholders. Information about the specific experience, skills, attributes, and qualifications of each Trustee, which in each case led to the Board's conclusion that the Trustee should serve (or continue to serve) as a trustee of the funds, is provided below.
Board Structure and Oversight Function. Brian B. Hogan is an interested person (as defined in the 1940 Act) and currently serves as Chairman. The Trustees have determined that an interested Chairman is appropriate and benefits shareholders because an interested Chairman has a personal and professional stake in the quality and continuity of services provided to the funds. Independent Trustees exercise their informed business judgment to appoint an individual of their choosing to serve as Chairman, regardless of whether the Trustee happens to be independent or a member of management. The Independent Trustees have determined that they can act independently and effectively without having an Independent Trustee serve as Chairman and that a key structural component for assuring that they are in a position to do so is for the Independent Trustees to constitute a substantial majority for the Board. The Independent Trustees also regularly meet in executive session. Michael E. Wiley serves as Chairman of the Independent Trustees and as such (i) acts as a liaison between the Independent Trustees and management with respect to matters important to the Independent Trustees and (ii) with management prepares agendas for Board meetings.
Fidelity funds are overseen by different Boards of Trustees. The funds' Board oversees Fidelity's sector portfolios. Other Boards oversee Fidelity's equity and high income funds, and Fidelity's investment grade bond, money market, and asset allocation funds. The use of separate Boards, each with its own committee structure, allows the Trustees of each group of Fidelity funds to focus on the unique issues of the funds they oversee, including common research, investment, and operational issues. On occasion, the separate Boards establish joint committees to address issues of overlapping consequences for the Fidelity funds overseen by each Board.
The Trustees operate using a system of committees to facilitate the timely and efficient consideration of all matters of importance to the Trustees, each fund, and fund shareholders and to facilitate compliance with legal and regulatory requirements and oversight of the funds' activities and associated risks. The Board, acting through its committees, has charged SelectCo and its affiliates with (i) identifying events or circumstances the occurrence of which could have demonstrably adverse effects on the funds' business and/or reputation; (ii) implementing processes and controls to lessen the possibility that such events or circumstances occur or to mitigate the effects of such events or circumstances if they do occur; and (iii) creating and maintaining a system designed to evaluate continuously business and market conditions in order to facilitate the identification and implementation processes described in (i) and (ii) above. Because the day-to-day operations and activities of the funds are carried out by or through SelectCo, its affiliates, and other service providers, the funds' exposure to risks is mitigated but not eliminated by the processes overseen by the Trustees. While each of the Board's committees has responsibility for overseeing different aspects of the funds' activities, oversight is exercised primarily through the Operations and Audit Committees. Appropriate personnel, including but not limited to the funds' Chief Compliance Officer (CCO), SelectCo's internal auditor, the independent accountants, the funds' Treasurer and portfolio management personnel, make periodic reports to the Board's committees, as appropriate. The responsibilities of each standing committee, including their oversight responsibilities, are described further under "Standing Committees of the Funds' Trustees."
The funds' Statement of Additional Information (SAI) includes more information about the Trustees. To request a free copy, call Fidelity at 1-800-544-8544.
Annual Report
Trustees and Officers - continued
Interested Trustee*:
Correspondence intended for the Trustee who is an interested person may be sent to Fidelity Investments, 245 Summer Street, Boston, Massachusetts 02210.
Name, Year of Birth; Principal Occupations and Other Relevant Experience+ | |
Brian B. Hogan (1964) | |
Year of Election or Appointment: 2014 Trustee Chairman of the Board of Trustees | |
| Mr. Hogan also serves as Trustee or Vice President of other funds. Mr. Hogan serves as President of FMR's Equity Division (2009-present). Previously, Mr. Hogan served as Senior Vice President, Equity Research of FMR (2006-2009) and as a portfolio manager. |
* Trustee has been determined to be an "Interested Trustee" by virtue of, among other things, his affiliation with the trust or various entities under common control with SelectCo.
+ The information above includes the Trustee's principal occupation during the last five years and other information relating to the experience, attributes, and skills relevant to the Trustee's qualifications to serve as a Trustee, which led to the conclusion that the Trustee should serve as a Trustee for each fund.
Independent Trustees:
Correspondence intended for each Independent Trustee (that is, the Trustees other than the Interested Trustee) may be sent to Fidelity Investments, P.O. Box 55235, Boston, Massachusetts 02205-5235.
Name, Year of Birth; Principal Occupations and Other Relevant Experience+ | |
Ned C. Lautenbach (1944) | |
Year of Election or Appointment: 2000 Trustee | |
| Mr. Lautenbach also serves as Trustee of other Fidelity funds. Mr. Lautenbach currently serves as the Lead Director of the Eaton Corporation Board of Directors (diversified industrial, 1997-present). Mr. Lautenbach is Chairman of the Board of Directors of the Philharmonic Center for the Arts in Naples, Florida (2012-present) and a member of the Council on Foreign Relations (1994-present). Previously, Mr. Lautenbach was a Partner/Advisory Partner at Clayton, Dubilier & Rice, LLC (private equity investment, 1998-2010), as well as a Director of Sony Corporation (2006-2007). |
David A. Rosow (1942) | |
Year of Election or Appointment: 2013 Trustee | |
| Mr. Rosow also serves as Trustee of other Fidelity funds. Mr. Rosow is Chairman and Chief Executive Officer of International Golf Group, Inc. (golf course development, 1989-present). Previously, Mr. Rosow served as Chairman and Chief Executive Officer of Rosow & Company, Inc. (private investment company, 1989-2011), a Lead Director of Hudson United Bancorp (2001-2006) and as a Director of TD Banknorth (1996-2006). In addition, Mr. Rosow is a member (2008-present) and President (2009-present) of the Town Council of Palm Beach, Florida. Mr. Rosow served as a Member of the Advisory Board of other Fidelity funds (2012-2013). |
Garnett A. Smith (1947) | |
Year of Election or Appointment: 2013 Trustee | |
| Mr. Smith also serves as Trustee of other Fidelity funds. Prior to Mr. Smith's retirement, he served as Chairman and Chief Executive Officer of Inbrand Corp. (manufacturer of personal absorbent products, 1990-1997). He also served as President (1986-1990) of Inbrand Corp. Prior to his employment with Inbrand Corp., he was employed by a retail fabric chain and North Carolina National Bank. In addition, Mr. Smith is a board member of the Jackson Hole Land Trust (2009-present). Mr. Smith served as a Member of the Advisory Board of other Fidelity funds (2012-2013). |
William S. Stavropoulos (1939) | |
Year of Election or Appointment: 2001 Trustee | |
| Mr. Stavropoulos also serves as Trustee of other Fidelity funds. Mr. Stavropoulos serves as President and Founder of the Michigan Baseball Foundation, the Great Lakes Loons (2007-present). Mr. Stavropoulos is Chairman Emeritus of the Board of Directors of The Dow Chemical Company, where he previously served in numerous senior management positions, including President, CEO (1995-2000; 2002-2004), Chairman of the Executive Committee (2000-2006), and as a member of the Board of Directors (1990-2006). Currently, Mr. Stavropoulos is Chairman of the Board of Directors of Univar Inc. (global distributor of commodity and specialty chemicals), a Director of Teradata Corporation (data warehousing and technology solutions), and Maersk Inc. (industrial conglomerate), and a member of the Advisory Board for Metalmark Capital LLC (private equity investment, 2005-present). Mr. Stavropoulos is an operating advisor to Clayton, Dubilier & Rice, LLC (private equity investment). In addition, Mr. Stavropoulos is a member of the University of Notre Dame Advisory Council for the College of Science, a Trustee of the Rollin L. Gerstacker Foundation, and a Director of the Naples Philharmonic Center for the Arts. Previously, Mr. Stavropoulos served as a Director of Chemical Financial Corporation (bank holding company, 1993-2012) and Tyco International, Ltd. (multinational manufacturing and services, 2007-2012). |
Michael E. Wiley (1950) | |
Year of Election or Appointment: 2008 Trustee Chairman of the Independent Trustees | |
| Mr. Wiley also serves as Trustee of other Fidelity funds. Mr. Wiley serves as a Director of Asia Pacific Exploration Consolidated (international oil and gas exploration and production, 2008-present). Mr. Wiley serves as a Director of Tesoro Corporation (independent oil refiner and marketer, 2005-present), and a Director of Bill Barrett Corporation (exploration and production, 2005-present). In addition, Mr. Wiley also serves as a Director of Post Oak Bank (privately-held bank, 2004-present). Previously, Mr. Wiley served as a Trustee of other Fidelity funds (2008-2013), as a member of the Board of Trustees of the University of Tulsa (2000-2006; 2007-2010), as a Senior Energy Advisor of Katzenbach Partners, LLC (consulting, 2006-2007), as an Advisory Director of Riverstone Holdings (private investment), Chairman, President, and CEO of Baker Hughes, Inc. (oilfield services, 2000-2004), and as Director of Spinnaker Exploration Company (exploration and production, 2001-2005). |
+ The information above includes each Trustee's principal occupation during the last five years and other information relating to the experience, attributes, and skills relevant to each Trustee's qualifications to serve as a Trustee, which led to the conclusion that each Trustee should serve as a Trustee for each fund.
Officers:
Except for Anthony R. Rochte, correspondence intended for each officer may be sent to Fidelity Investments, 245 Summer Street, Boston, Massachusetts 02210. Correspondence intended for Mr. Rochte may be sent to SelectCo, 1225 17th Street, Denver, Colorado 80202-5541. Officers appear below in alphabetical order.
Name, Year of Birth; Principal Occupation | |
Christopher S. Bartel (1971) | |
Year of Election or Appointment: 2009 Vice President | |
| Mr. Bartel also serves as Vice President of other funds. Mr. Bartel serves as a Director, President, and Chief Executive Officer of Fidelity Management & Research (Japan) Inc. (2012-present), a Director of Fidelity Management & Research (Hong Kong) (2012-present), and Senior Vice President of Global Equity Research (2010-present). Previously, Mr. Bartel served as Senior Vice President of Equity Research (2009-2010), Managing Director of Research (2006-2009), and an analyst and portfolio manager (2000-2006). |
Elizabeth Paige Baumann (1968) | |
Year of Election or Appointment: 2012 Anti-Money Laundering (AML) Officer | |
| Ms. Baumann also serves as AML Officer of other funds. She is Chief AML Officer of FMR LLC (2012-present) and is an employee of Fidelity Investments. Previously, Ms. Baumann served as Vice President and Deputy Anti-Money Laundering Officer (2007-2012). |
Marc Bryant (1966) | |
Year of Election or Appointment: 2013 Secretary | |
| Mr. Bryant also serves as an officer of other funds. He is Senior Vice President and Deputy General Counsel of FMR LLC. Prior to joining Fidelity Investments, Mr. Bryant served as a Senior Vice President and the Head of Global Retail Legal for AllianceBernstein L.P. (2006-2010), and as the General Counsel for ProFund Advisors LLC (2001-2006). |
William C. Coffey (1969) | |
Year of Election or Appointment: 2009 Assistant Secretary | |
| Mr. Coffey also serves as Assistant Secretary of other funds. He is Senior Vice President and Deputy General Counsel of FMR LLC (2010-present), and is an employee of Fidelity Investments. Previously, Mr. Coffey served as Vice President and Associate General Counsel of FMR LLC (2005-2009). |
Jonathan Davis (1968) | |
Year of Election or Appointment: 2010 Assistant Treasurer | |
| Mr. Davis also serves as Assistant Treasurer of other funds. Mr. Davis is an employee of Fidelity Investments. Previously, Mr. Davis served as Vice President and Associate General Counsel of FMR LLC (2003-2010). |
Adrien E. Deberghes (1967) | |
Year of Election or Appointment: 2013 President and Treasurer | |
| Mr. Deberghes also serves as an officer of other funds. He is an employee of Fidelity Investments (2008-present). Prior to joining Fidelity Investments, Mr. Deberghes was Senior Vice President of Mutual Fund Administration at State Street Corporation (2007-2008), Senior Director of Mutual Fund Administration at Investors Bank & Trust (2005-2007), and Director of Finance for Dunkin' Brands (2000-2005). |
Stephanie J. Dorsey (1969) | |
Year of Election or Appointment: 2010 Assistant Treasurer | |
| Ms. Dorsey also serves as an officer of other funds. She is an employee of Fidelity Investments (2008-present) and has served in other fund officer roles. Prior to joining Fidelity Investments, Ms. Dorsey served as Treasurer (2004-2008) of the JPMorgan Mutual Funds and Vice President (2004-2008) of JPMorgan Chase Bank. |
Joseph A. Hanlon (1968) | |
Year of Election or Appointment: 2012 Chief Compliance Officer | |
| Mr. Hanlon also serves as Chief Compliance Officer of other funds. Mr. Hanlon serves as Compliance Officer of FMR, FMR Co., Inc., Fidelity Investments Money Management, Inc. (FIMM), Fidelity Research and Analysis Company (FRAC), and Fidelity Management & Research (Hong Kong) (2009-present), as Senior Vice President of the Fidelity Asset Management Division (2009-present), and is an employee of Fidelity Investments. Previously, Mr. Hanlon served as Compliance Officer of Fidelity Management & Research (Japan) Inc. (2009-2013), Strategic Advisers, Inc. (2009-2013), and Fidelity Management & Research (U.K.) Inc. (2009-2013). |
Brian B. Hogan (1964) | |
Year of Election or Appointment: 2009 Vice President | |
| Mr. Hogan also serves as Trustee or Vice President of other funds. Mr. Hogan serves as President of FMR's Equity Division (2009-present). Previously, Mr. Hogan served as Senior Vice President, Equity Research of FMR (2006-2009) and as a portfolio manager. |
Chris Maher (1972) | |
Year of Election or Appointment: 2013 Assistant Treasurer | |
| Mr. Maher serves as Assistant Treasurer of other funds. Mr. Maher is Vice President of Valuation Oversight and is an employee of Fidelity Investments. Previously, Mr. Maher served as Vice President of Asset Management Compliance (2013), Vice President of FMR's Program Management Group (2010-2013), and Vice President of Valuation Oversight (2008-2010). |
Christine Reynolds (1958) | |
Year of Election or Appointment: 2008 Chief Financial Officer | |
| Ms. Reynolds also serves as Chief Financial Officer of other funds. Ms. Reynolds became President of Fidelity Pricing and Cash Management Services (FPCMS) in August 2008. Ms. Reynolds served as Chief Operating Officer of FPCMS (2007-2008). Previously, Ms. Reynolds served as President, Treasurer, and Anti-Money Laundering officer of the Fidelity funds (2004-2007). |
Kenneth B. Robins (1969) | |
Year of Election or Appointment: 2013 Deputy Treasurer | |
| Mr. Robins also serves as an officer of other funds. Mr. Robins serves as Executive Vice President of Fidelity Investments Money Management, Inc. (FIMM) (2013-present) and is an employee of Fidelity Investments (2004-present). Previously, Mr. Robins served in other fund officer roles. |
Anthony R. Rochte (1968) | |
Year of Election or Appointment: 2013 Vice President | |
| Mr. Rochte also serves as Vice President of other funds. Mr. Rochte serves as President of Fidelity SelectCo, LLC (2012-present) and is an employee of Fidelity Investments (2012-present). Prior to joining Fidelity Investments, Mr. Rochte served as Senior Managing Director and head of State Street Global Advisors' North American Intermediary Business Group (2006-2012). |
Stacie M. Smith (1974) | |
Year of Election or Appointment: 2013 Assistant Treasurer | |
| Ms. Smith also serves as an officer of other funds. She is an employee of Fidelity Investments (2009-present) and has served in other fund officer roles. Prior to joining Fidelity Investments, Ms. Smith served as Senior Audit Manager of Ernst & Young LLP (1996-2009). |
Renee Stagnone (1975) | |
Year of Election or Appointment: 2013 Deputy Treasurer | |
| Ms. Stagnone also serves as Deputy Treasurer of other funds. Ms. Stagnone is an employee of Fidelity Investments. |
Joseph F. Zambello (1957) | |
Year of Election or Appointment: 2011 Deputy Treasurer | |
| Mr. Zambello also serves as Deputy Treasurer of other funds. Mr. Zambello is an employee of Fidelity Investments. Previously, Mr. Zambello served as Vice President of FMR's Program Management Group (2009-2011) and Vice President of the Transfer Agent Oversight Group (2005-2009). |
Annual Report
Distributions (Unaudited)
The Board of Trustees of each fund voted to pay to shareholders of record at the opening of business on record date the following distributions per share derived from capital gains realized from sales of portfolio securities and dividends derived from net investment income:
| Pay Date | Record Date | Dividends | Capital Gains |
Financial Services Portfolio | 04/14/14 | 04/11/14 | $0.102 | $- |
Brokerage and Investment Management Portfolio | 04/14/14 | 04/11/14 | $0.102 | $0.100 |
Insurance Portfolio | 04/14/14 | 04/11/14 | $0.184 | $3.538 |
Consumer Finance Portfolio | 04/14/14 | 04/11/14 | $0.033 | $0.989 |
Banking Portfolio | 04/14/14 | 04/11/14 | $0.070 | $0.745 |
The funds hereby designate as capital gain dividend the amounts noted below for the taxable year ended February 28, 2014, or, if subsequently determined to be different, the net capital gain of such year.
Brokerage and Investment Management Portfolio | $4,352,757 |
Insurance Portfolio | $34,475,283 |
Consumer Finance Portfolio | $28,768,798 |
Banking Portfolio | $33,311,993 |
A percentage of the dividends distributed during the fiscal year for the following funds qualify for the dividends-received deduction for corporate shareholders:
| April 2013 | December 2013 |
Financial Services Portfolio | 9% | 90% |
Brokerage and Investment Management Portfolio | 0% | 100% |
Insurance Portfolio | 16% | 49% |
Consumer Finance Portfolio | 9% | 32% |
Banking Portfolio | 100% | 100% |
A percentage of the dividends distributed during the fiscal year for the following funds may be taken into account as a dividend for purposes of the maximum rate under section 1(h) (11) of the Internal Revenue Code:
| April 2013 | December 2013 |
Financial Services Portfolio | 26% | 100% |
Brokerage and Investment Management Portfolio | 0% | 100% |
Insurance Portfolio | 100% | 68% |
Consumer Finance Portfolio | 9% | 33% |
Banking Portfolio | 100% | 100% |
The funds will notify shareholders in January 2015 of amounts for use in preparing 2014 income tax returns.
Annual Report
Proxy Voting Results
A special meeting of each fund's shareholders was held on June 18, 2013. The results of votes taken among shareholders on the proposals before them are reported below. Each vote reported represents one dollar of net asset value held on the record date for the meeting.
PROPOSAL 1 | ||
To elect a Board of Trustees. A | ||
Ned C. Lautenbach | # of | % of |
Affirmative | 25,828,395,115.78 | 94.160 |
Withheld | 1,602,101,684.27 | 5.840 |
TOTAL | 27,430,496,800.05 | 100.000 |
Ronald P. O'Hanley | ||
Affirmative | 25,907,936,922.24 | 94.450 |
Withheld | 1,522,559,877.81 | 5.550 |
TOTAL | 27,430,496,800.05 | 100.000 |
David A. Rosow | ||
Affirmative | 25,805,492,959.91 | 94.076 |
Withheld | 1,625,003,840.14 | 5.924 |
TOTAL | 27,430,496,800.05 | 100.000 |
Garnett A. Smith | ||
Affirmative | 25,892,258,831.97 | 94.393 |
Withheld | 1,538,237,968.08 | 5.607 |
TOTAL | 27,430,496,800.05 | 100.000 |
William S. Stavropoulos | ||
Affirmative | 25,738,476,030.34 | 93.832 |
Withheld | 1,692,020,769.71 | 6.168 |
TOTAL | 27,430,496,800.05 | 100.000 |
Michael E. Wiley | ||
Affirmative | 25,923,640,743.27 | 94.507 |
Withheld | 1,506,856,056.78 | 5.493 |
TOTAL | 27,430,496,800.05 | 100.000 |
PROPOSAL 2 | ||
To approve a management contract between Banking Portfolio and Fidelity SelectCo, LLC. | ||
| # of | % of |
Affirmative | 340,347,649.37 | 87.561 |
Against | 20,233,959.90 | 5.206 |
Abstain | 14,639,575.03 | 3.766 |
Broker Non-Vote | 13,476,953.57 | 3.467 |
TOTAL | 388,698,137.87 | 100.000 |
PROPOSAL 2 | ||
To approve a management contract between Brokerage and Investment Management Portfolio and Fidelity SelectCo, LLC. | ||
| # of | % of |
Affirmative | 366,104,561.21 | 84.794 |
Against | 17,259,309.38 | 3.998 |
Abstain | 24,139,215.72 | 5.590 |
Broker Non-Vote | 24,258,494.24 | 5.618 |
TOTAL | 431,761,580.55 | 100.000 |
PROPOSAL 2 | ||
To approve a management contract between Consumer Finance Portfolio and Fidelity SelectCo, LLC. | ||
| # of | % of |
Affirmative | 197,165,570.88 | 90.003 |
Against | 7,782,770.67 | 3.553 |
Abstain | 6,696,794.90 | 3.057 |
Broker Non-Vote | 7,421,293.15 | 3.387 |
TOTAL | 219,066,429.60 | 100.000 |
PROPOSAL 2 | ||
To approve a management contract between Financial Services Portfolio and Fidelity SelectCo, LLC. | ||
| # of | % of |
Affirmative | 382,192,548.48 | 87.833 |
Against | 23,451,875.71 | 5.389 |
Abstain | 18,355,961.00 | 4.218 |
Broker Non-Vote | 11,139,709.07 | 2.560 |
TOTAL | 435,140,094.26 | 100.000 |
PROPOSAL 2 | ||
To approve a management contract between Insurance Portfolio and Fidelity SelectCo, LLC. | ||
| # of | % of |
Affirmative | 255,832,293.53 | 90.434 |
Against | 13,509,772.19 | 4.776 |
Abstain | 8,843,289.67 | 3.126 |
Broker Non-Vote | 4,710,096.53 | 1.664 |
TOTAL | 282,895,451.92 | 100.000 |
A Denotes trust-wide proposal and voting results.
Annual Report
Fidelity®
Select Portfolios®
Energy Sector
Energy Portfolio
Energy Service Portfolio
Natural Gas Portfolio
Natural Resources Portfolio
Annual Report
February 28, 2014
(Fidelity Cover Art)
Contents
Shareholder Expense Example |
| |
Energy Portfolio | Performance | |
| Management's Discussion | |
| Investment Changes | |
| Investments | |
| Financial Statements | |
Energy Service Portfolio | Performance | |
| Management's Discussion | |
| Investment Changes | |
| Investments | |
| Financial Statements | |
Natural Gas Portfolio | Performance | |
| Management's Discussion | |
| Investment Changes | |
| Investments | |
| Financial Statements | |
Natural Resources Portfolio | Performance | |
| Management's Discussion | |
| Investment Changes | |
| Investments | |
| Financial Statements | |
Notes to Financial Statements |
| |
Report of Independent Registered Public Accounting Firm |
| |
Trustees and Officers |
| |
Distributions |
| |
Proxy Voting Results |
|
To view a fund's proxy voting guidelines and proxy voting record for the 12-month period ended June 30, visit http://www.fidelity.com/proxyvotingresults or visit the Securities and Exchange Commission's (SEC) web site at http://www.sec.gov. You may also call 1-800-544-8544 to request a free copy of the proxy voting guidelines.
Standard & Poor's, S&P and S&P 500 are registered service marks of The McGraw-Hill Companies, Inc. and have been licensed for use by Fidelity Distributors Corporation.
Other third-party marks appearing herein are the property of their respective owners.
All other marks appearing herein are registered or unregistered trademarks or service marks of FMR LLC or an affiliated company. © 2014 FMR LLC. All rights reserved.
This report and the financial statements contained herein are submitted for the general information of the shareholders of the funds. This report is not authorized for distribution to prospective investors in the funds unless preceded or accompanied by an effective prospectus.
A fund files its complete schedule of portfolio holdings with the SEC for the first and third quarters of each fiscal year on Form N-Q. Forms N-Q are available on the SEC's web site at http://www.sec.gov. A fund's Forms N-Q may be reviewed and copied at the SEC's Public Reference Room in Washington, DC. Information regarding the operation of the SEC's Public Reference Room may be obtained by calling 1-800-SEC-0330. For a complete list of a fund's portfolio holdings, view the most recent holdings listing, semiannual report, or annual report on Fidelity's web site at http://www.fidelity.com, http://www.advisor.fidelity.com, or http://www.401k.com, as applicable.
NOT FDIC INSURED • MAY LOSE VALUE • NO BANK GUARANTEE
Neither the funds nor Fidelity Distributors Corporation is a bank.
Annual Report
Shareholder Expense Example
As a shareholder of a Fund, you incur two types of costs: (1) transaction costs, including redemption fees and (2) ongoing costs, including management fees and other Fund expenses. This Example is intended to help you understand your ongoing costs (in dollars) of investing in the Funds and to compare these costs with the ongoing costs of investing in other mutual funds.
The Example is based on an investment of $1,000 invested at the beginning of the period and held for the entire period (September 1, 2013 to February 28, 2014).
Actual Expenses
The first line of the accompanying table for each fund provides information about actual account values and actual expenses. You may use the information in this line, together with the amount you invested, to estimate the expenses that you paid over the period. Simply divide your account value by $1,000.00 (for example, an $8,600 account value divided by $1,000.00 = 8.6), then multiply the result by the number in the first line for a fund under the heading entitled "Expenses Paid During Period" to estimate the expenses you paid on your account during this period. A small balance maintenance fee of $12.00 that is charged once a year may apply for certain accounts with a value of less than $2,000. This fee is not included in the table below. If it was, the estimate of expenses you paid during the period would be higher, and your ending account value lower, by this amount. In addition, each Fund, as a shareholder in the underlying Fidelity Central Funds, will indirectly bear its pro-rata share of the fees and expenses incurred by the underlying Fidelity Central Funds. These fees and expenses are not included in the Fund's annualized expense ratio used to calculate the expense estimate in the table below.
Hypothetical Example for Comparison Purposes
The second line of the accompanying table for each fund provides information about hypothetical account values and hypothetical expenses based on a fund's actual expense ratio and an assumed rate of return of 5% per year before expenses, which is not the Fund's actual return. The hypothetical account values and expenses may not be used to estimate the actual ending account balance or expenses you paid for the period. You may use this information to compare the ongoing costs of investing in the Fund and other funds. To do so, compare this 5% hypothetical example with the 5% hypothetical examples that appear in the shareholder reports of the other funds. A small balance maintenance fee of $12.00 that is charged once a year may apply for certain accounts with a value of less than $2,000. This fee is not included in the table below. If it was, the estimate of expenses you paid during the period would be higher, and your ending account value lower, by this amount. In addition, each Fund, as a shareholder in the underlying Fidelity Central Funds, will indirectly bear its pro-rata share of the fees and expenses incurred by the underlying Fidelity Central Funds. These fees and expenses are not included in the Fund's annualized expense ratio used to calculate the expense estimate in the table below.
Please note that the expenses shown in the table are meant to highlight your ongoing costs only and do not reflect any transaction costs. Therefore, the second line of the table is useful in comparing ongoing costs only, and will not help you determine the relative total costs of owning different funds. In addition, if these transactional costs were included, your costs would have been higher.
| Annualized | Beginning | Ending | Expenses Paid |
Energy Portfolio | .79% |
|
|
|
Actual |
| $ 1,000.00 | $ 1,079.70 | $ 4.07 |
HypotheticalA |
| $ 1,000.00 | $ 1,020.88 | $ 3.96 |
Energy Service Portfolio | .79% |
|
|
|
Actual |
| $ 1,000.00 | $ 1,086.30 | $ 4.09 |
HypotheticalA |
| $ 1,000.00 | $ 1,020.88 | $ 3.96 |
Natural Gas Portfolio | .83% |
|
|
|
Actual |
| $ 1,000.00 | $ 1,126.50 | $ 4.38 |
HypotheticalA |
| $ 1,000.00 | $ 1,020.68 | $ 4.16 |
Natural Resources Portfolio | .83% |
|
|
|
Actual |
| $ 1,000.00 | $ 1,075.10 | $ 4.27 |
HypotheticalA |
| $ 1,000.00 | $ 1,020.68 | $ 4.16 |
A 5% return per year before expenses
B Annualized expense ratio reflects expenses net of applicable fee waivers.
* Expenses are equal to each Fund's annualized expense ratio, multiplied by the average account value over the period, multiplied by 181/365 (to reflect the one-half year period).
Annual Report
Energy Portfolio
Performance: The Bottom Line
Average annual total return reflects the change in the value of an investment, assuming reinvestment of the fund's distributions from dividend income and capital gains (the profits earned upon the sale of securities that have grown in value, if any) and assuming a constant rate of performance each year. The $10,000 table and the fund's returns do not reflect the deduction of taxes that a shareholder would pay on fund distributions or the redemption of fund shares. During periods of reimbursement by Fidelity, a fund's total return will be greater than it would be had the reimbursement not occurred. How a fund did yesterday is no guarantee of how it will do tomorrow.
Average Annual Total Returns
Periods ended February 28, 2014 | Past 1 | Past 5 | Past 10 |
Energy Portfolio | 15.43% | 18.93% | 12.11% |
$10,000 Over 10 Years
Let's say hypothetically that $10,000 was invested in Energy Portfolio on February 29, 2004. The chart shows how the value of your investment would have changed, and also shows how the S&P 500® Index performed over the same period.
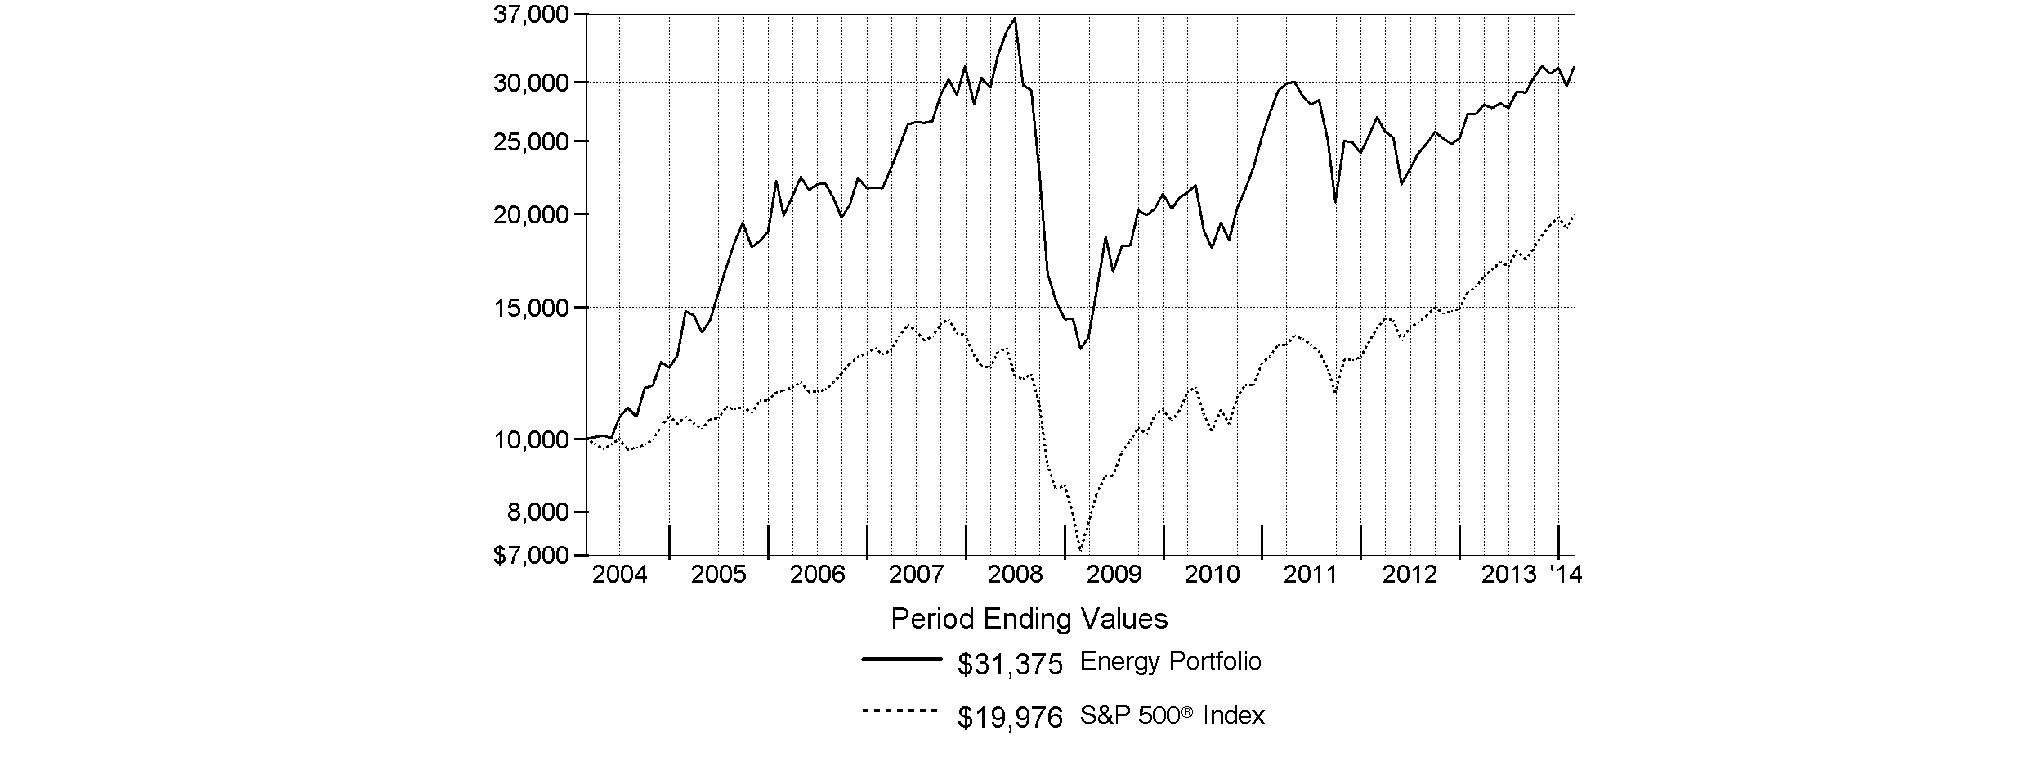
Annual Report
Energy Portfolio
Management's Discussion of Fund Performance
Market Recap: Stocks overcame fears of higher interest rates - not to mention their worst January in four years - to finish sharply higher for the 12 months ending February 28, 2014. The broad S&P 500® Index and the blue-chip Dow Jones Industrial AverageSM gained 25.37% and 19.01%, respectively, amid generally favorable earnings reports and accommodative monetary policies worldwide. Performance generally increased along the risk spectrum, with smaller-cap and growth strategies leading the way. An ebullient market helped the growth-oriented Nasdaq Composite Index® to a 38.10% period gain, for example. On the other hand, both cyclical and defensive stocks had representation in the top-performing industry sectors: returns were highest in health care and consumer discretionary; lowest in utilities and telecommunication services. From a macroeconomic perspective, data still points to slow but steady improvement in the U.S., and Europe's recession may well be over. Reports from China have disappointed, but continue to suggest a relatively soft landing there. Mixed signals from the U.S. Federal Reserve as to when it might curtail its stimulative bond buying kept markets in flux during the spring and summer. Stocks regained momentum in October despite a federal budget impasse and brief government shutdown, and lower volatility prevailed through year-end. Shedding new-year concerns about China's economy, an emerging-markets sell-off and confirmation (at last) of Fed tapering - alongside confirmation of a presumably dovish Janet Yellen as new Fed chair - February saw stocks back in record territory, bearing down on the five-year anniversary of the market's bottom.
Comments from John Dowd, Portfolio Manager of Energy Portfolio: For the year, the fund returned 15.43%, slightly ahead of the 15.17% gain of MSCI® U.S. IMI Energy 25-50 Index but lagging the S&P 500®. Relative to the broader market, the energy sector was hurt by significant underperformance of large integrated oil & gas firms, which struggled with lower oil prices and declines in global production. Versus the sector benchmark, stock picking among oil & gas exploration & production firms (E&Ps) helped the most. Here, Cimarex Energy - which I bought in June - and EOG Resources led the way. Both stocks rose more than 50% for the period and were among the fund's largest holdings at period end. Underweighting integrated oil & gas firms also proved helpful. Although benchmark heavyweights Exxon Mobil and Chevron were the fund's two largest holdings, my positions in both were lighter than the index, as I was drawn to the value of their smaller U.S. peers. Both companies had downward revisions to their 2014 crude oil production forecasts, which held back their stock prices but boosted the fund's relative performance. Two E&Ps also were among the fund's biggest individual detractors. Here, an underweighting in ConocoPhillips hurt, as its stock rose on positive earnings surprises. Shares of deep water E&P firm Cobalt International Energy declined on news a key well did not strike oil, and I eliminated the position by period end. A sizable stake in Anadarko Petroleum stung when its share price dropped after a court ruled the firm should be liable for at least $5 billion in clean-up costs related to its former chemicals business Kerr-McGee, which it acquired in 2006. Elsewhere, early on I held back on refiner Valero Energy, thinking it was overvalued. But the stock price rose after higher refining volume helped it crush third-quarter profit estimates, hurting relative performance. I shifted to an overweighting here by period end. Stock selection in service companies also hurt, as I favored smaller company FMC Technologies over industry leader Baker Hughes, whose share price rose 41% for the period.
The views expressed above reflect those of the portfolio manager(s) only through the end of the period as stated on the cover of this report and do not necessarily represent the views of Fidelity or any other person in the Fidelity organization. Any such views are subject to change at any time based upon market or other conditions and Fidelity disclaims any responsibility to update such views. These views may not be relied on as investment advice and, because investment decisions for a Fidelity fund are based on numerous factors, may not be relied on as an indication of trading intent on behalf of any Fidelity fund.
Annual Report
Energy Portfolio
Investment Changes (Unaudited)
Top Ten Stocks as of February 28, 2014 | ||
| % of fund's | % of fund's net assets |
Exxon Mobil Corp. | 13.4 | 12.5 |
Chevron Corp. | 10.4 | 8.2 |
EOG Resources, Inc. | 7.6 | 5.4 |
Anadarko Petroleum Corp. | 4.6 | 4.2 |
Schlumberger Ltd. | 4.1 | 5.0 |
FMC Technologies, Inc. | 3.5 | 2.7 |
ConocoPhillips Co. | 3.5 | 0.5 |
Noble Energy, Inc. | 3.1 | 2.8 |
Cimarex Energy Co. | 3.1 | 2.8 |
Halliburton Co. | 3.1 | 5.5 |
| 56.4 | |
Top Industries (% of fund's net assets) | |||
As of February 28, 2014 | |||
 | Oil, Gas & | 79.4% |
|
 | Energy Equipment & Services | 17.5% |
|
 | Construction & Engineering | 0.2% |
|
 | All Others* | 2.9% |
|

As of August 31, 2013 | |||
| Oil, Gas & | 72.6% |
|
 | Energy Equipment & Services | 25.5% |
|
| All Others* | 1.9% |
|

* Includes short-term investments and net other assets (liabilities). |
Annual Report
Energy Portfolio
Investments February 28, 2014
Showing Percentage of Net Assets
Common Stocks - 97.1% | |||
Shares | Value | ||
CONSTRUCTION & ENGINEERING - 0.2% | |||
Construction & Engineering - 0.2% | |||
URS Corp. | 87,722 | $ 4,079,073 | |
ENERGY EQUIPMENT & SERVICES - 17.5% | |||
Oil & Gas Drilling - 1.5% | |||
Ocean Rig UDW, Inc. (United States) (a) | 263,200 | 4,582,312 | |
Odfjell Drilling A/S | 1,522,272 | 8,800,873 | |
Pacific Drilling SA (a) | 175,097 | 1,901,553 | |
Vantage Drilling Co. (a) | 5,432,707 | 9,507,237 | |
Xtreme Drilling & Coil Services Corp. (a) | 1,613,600 | 6,032,967 | |
| 30,824,942 | ||
Oil & Gas Equipment & Services - 16.0% | |||
Baker Hughes, Inc. | 79,689 | 5,042,720 | |
Cameron International Corp. (a) | 573,857 | 36,761,279 | |
Core Laboratories NV | 45,753 | 8,603,852 | |
Dril-Quip, Inc. (a) | 35,374 | 3,804,827 | |
FMC Technologies, Inc. (a) | 1,398,459 | 70,258,580 | |
Forum Energy Technologies, Inc. (a) | 294,354 | 7,623,769 | |
Halliburton Co. | 1,068,092 | 60,881,244 | |
National Oilwell Varco, Inc. | 131,299 | 10,115,275 | |
Oceaneering International, Inc. | 294,327 | 21,067,927 | |
Schlumberger Ltd. | 887,481 | 82,535,733 | |
Total Energy Services, Inc. | 149,500 | 2,902,782 | |
Weatherford International Ltd. (a) | 539,126 | 8,987,230 | |
| 318,585,218 | ||
TOTAL ENERGY EQUIPMENT & SERVICES | 349,410,160 | ||
OIL, GAS & CONSUMABLE FUELS - 79.4% | |||
Coal & Consumable Fuels - 1.4% | |||
Peabody Energy Corp. | 1,613,322 | 28,329,934 | |
Integrated Oil & Gas - 25.4% | |||
Chevron Corp. | 1,788,723 | 206,293,424 | |
Exxon Mobil Corp. | 2,781,948 | 267,818,136 | |
Hess Corp. | 31,014 | 2,482,050 | |
Imperial Oil Ltd. | 211,800 | 9,529,374 | |
Suncor Energy, Inc. | 622,900 | 20,549,568 | |
| 506,672,552 | ||
Oil & Gas Exploration & Production - 40.6% | |||
Anadarko Petroleum Corp. | 1,083,015 | 91,146,542 | |
Bankers Petroleum Ltd. (a) | 2,705,400 | 12,020,742 | |
Bill Barrett Corp. (a) | 138,530 | 3,510,350 | |
Bonanza Creek Energy, Inc. (a) | 279,300 | 13,956,621 | |
Cabot Oil & Gas Corp. | 824,403 | 28,854,105 | |
Chesapeake Energy Corp. | 524,823 | 13,598,164 | |
Cimarex Energy Co. | 528,645 | 61,169,513 | |
| |||
Shares | Value | ||
ConocoPhillips Co. | 1,043,096 | $ 69,365,884 | |
Continental Resources, Inc. (a)(d) | 250,886 | 29,985,895 | |
Energen Corp. | 42,162 | 3,391,511 | |
EOG Resources, Inc. | 796,782 | 150,926,446 | |
EPL Oil & Gas, Inc. (a) | 171,200 | 5,153,120 | |
EQT Corp. | 469,698 | 48,045,408 | |
Evolution Petroleum Corp. | 162,643 | 2,114,359 | |
Gulfport Energy Corp. (a) | 151,467 | 10,011,969 | |
Halcon Resources Corp. (a) | 1,010,000 | 3,848,100 | |
Kodiak Oil & Gas Corp. (a) | 1,514,651 | 17,888,028 | |
Laredo Petroleum Holdings, Inc. (a) | 412,301 | 10,756,933 | |
Noble Energy, Inc. | 912,088 | 62,715,171 | |
Northern Oil & Gas, Inc. (a) | 515,901 | 7,181,342 | |
PDC Energy, Inc. (a) | 386,051 | 23,985,349 | |
Pioneer Natural Resources Co. | 233,499 | 46,975,329 | |
Rex Energy Corp. (a) | 4,434 | 84,246 | |
Sanchez Energy Corp. (a)(d) | 377,500 | 11,245,725 | |
SM Energy Co. | 294,689 | 21,733,314 | |
Southwestern Energy Co. (a) | 1,118,492 | 46,238,459 | |
Synergy Resources Corp. (a) | 310,020 | 3,283,112 | |
TAG Oil Ltd. (a) | 1,149,675 | 3,083,658 | |
Whiting Petroleum Corp. (a) | 110,626 | 7,601,112 | |
| 809,870,507 | ||
Oil & Gas Refining & Marketing - 5.6% | |||
Marathon Petroleum Corp. | 315,068 | 26,465,712 | |
Phillips 66 Co. | 474,018 | 35,484,987 | |
Valero Energy Corp. | 934,581 | 44,841,196 | |
World Fuel Services Corp. | 110,177 | 4,960,169 | |
| 111,752,064 | ||
Oil & Gas Storage & Transport - 6.4% | |||
Access Midstream Partners LP | 418,658 | 23,633,244 | |
Cheniere Energy, Inc. (a) | 306,800 | 15,165,124 | |
Crosstex Energy, Inc. | 36,598 | 1,523,575 | |
Magellan Midstream Partners LP | 87,219 | 5,902,110 | |
Markwest Energy Partners LP | 131,739 | 8,411,535 | |
MPLX LP | 218,343 | 10,657,322 | |
ONEOK, Inc. | 91,600 | 5,417,224 | |
Phillips 66 Partners LP | 168,633 | 7,726,764 | |
Plains GP Holdings LP Class A | 130,700 | 3,659,600 | |
SemGroup Corp. Class A | 61,800 | 4,160,376 | |
Targa Resources Corp. | 98,190 | 9,500,864 | |
The Williams Companies, Inc. | 696,410 | 28,761,733 | |
Valero Energy Partners LP | 73,743 | 2,727,754 | |
| 127,247,225 | ||
TOTAL OIL, GAS & CONSUMABLE FUELS | 1,583,872,282 | ||
TOTAL COMMON STOCKS (Cost $1,505,938,703) |
| ||
Money Market Funds - 4.5% | |||
Shares | Value | ||
Fidelity Cash Central Fund, 0.10% (b) | 54,519,805 | $ 54,519,805 | |
Fidelity Securities Lending Cash Central Fund, 0.09% (b)(c) | 36,414,950 | 36,414,950 | |
TOTAL MONEY MARKET FUNDS (Cost $90,934,755) |
| ||
TOTAL INVESTMENT PORTFOLIO - 101.6% (Cost $1,596,873,458) | 2,028,296,270 |
NET OTHER ASSETS (LIABILITIES) - (1.6)% | (32,488,659) | ||
NET ASSETS - 100% | $ 1,995,807,611 | ||
Legend |
(a) Non-income producing |
(b) Affiliated fund that is generally available only to investment companies and other accounts managed by Fidelity Investments. The rate quoted is the annualized seven-day yield of the fund at period end. A complete unaudited listing of the fund's holdings as of its most recent quarter end is available upon request. In addition, each Fidelity Central Fund's financial statements, which are not covered by the Fund's Report of Independent Registered Public Accounting Firm, are available on the SEC's website or upon request. |
(c) Investment made with cash collateral received from securities on loan. |
(d) Security or a portion of the security is on loan at period end. |
Affiliated Central Funds |
Information regarding fiscal year to date income earned by the Fund from investments in Fidelity Central Funds is as follows: |
Fund | Income earned |
Fidelity Cash Central Fund | $ 24,106 |
Fidelity Securities Lending Cash Central Fund | 782,690 |
Total | $ 806,796 |
Other Information |
All investments are categorized as Level 1 under the Fair Value Hierarchy. The inputs or methodology used for valuing securities may not be an indication of the risk associated with investing in those securities. For more information on valuation inputs, please refer to the Investment Valuation section in the accompanying Notes to Financial Statements. |
See accompanying notes which are an integral part of the financial statements.
Annual Report
Energy Portfolio
Financial Statements
Statement of Assets and Liabilities
| February 28, 2014 | |
|
|
|
Assets | ||
Investment in securities, at value (including securities loaned of $35,951,490) - See accompanying schedule: Unaffiliated issuers (cost $1,505,938,703) | $ 1,937,361,515 |
|
Fidelity Central Funds (cost $90,934,755) | 90,934,755 |
|
Total Investments (cost $1,596,873,458) |
| $ 2,028,296,270 |
Receivable for investments sold | 35,489,652 | |
Receivable for fund shares sold | 7,138,392 | |
Dividends receivable | 4,972,776 | |
Distributions receivable from Fidelity Central Funds | 5,327 | |
Prepaid expenses | 10,767 | |
Other receivables | 49,411 | |
Total assets | 2,075,962,595 | |
|
|
|
Liabilities | ||
Payable for investments purchased | $ 39,563,177 | |
Payable for fund shares redeemed | 2,892,360 | |
Accrued management fee | 870,209 | |
Other affiliated payables | 363,958 | |
Other payables and accrued expenses | 50,330 | |
Collateral on securities loaned, at value | 36,414,950 | |
Total liabilities | 80,154,984 | |
|
|
|
Net Assets | $ 1,995,807,611 | |
Net Assets consist of: |
| |
Paid in capital | $ 1,471,530,508 | |
Undistributed net investment income | 2,667,396 | |
Accumulated undistributed net realized gain (loss) on investments and foreign currency transactions | 90,183,400 | |
Net unrealized appreciation (depreciation) on investments and assets and liabilities in foreign currencies | 431,426,307 | |
Net Assets, for 35,478,945 shares outstanding | $ 1,995,807,611 | |
Net Asset Value, offering price and redemption price per share ($1,995,807,611 ÷ 35,478,945 shares) | $ 56.25 | |
Statement of Operations
| Year ended February 28, 2014 | |
|
|
|
Investment Income |
|
|
Dividends |
| $ 31,006,597 |
Interest |
| 6 |
Income from Fidelity Central Funds |
| 806,796 |
Total income |
| 31,813,399 |
|
|
|
Expenses | ||
Management fee | $ 11,265,863 | |
Transfer agent fees | 4,233,530 | |
Accounting and security lending fees | 623,582 | |
Custodian fees and expenses | 38,281 | |
Independent trustees' compensation | 38,786 | |
Registration fees | 55,630 | |
Audit | 57,609 | |
Legal | 33,725 | |
Interest | 4,091 | |
Miscellaneous | 24,434 | |
Total expenses before reductions | 16,375,531 | |
Expense reductions | (129,500) | 16,246,031 |
Net investment income (loss) | 15,567,368 | |
Realized and Unrealized Gain (Loss) Net realized gain (loss) on: | ||
Investment securities: |
|
|
Unaffiliated issuers | 322,655,595 | |
Foreign currency transactions | 59,677 | |
Total net realized gain (loss) |
| 322,715,272 |
Change in net unrealized appreciation (depreciation) on: Investment securities | (48,775,427) | |
Assets and liabilities in foreign currencies | 4,798 | |
Total change in net unrealized appreciation (depreciation) |
| (48,770,629) |
Net gain (loss) | 273,944,643 | |
Net increase (decrease) in net assets resulting from operations | $ 289,512,011 | |
See accompanying notes which are an integral part of the financial statements.
Annual Report
Energy Portfolio
Financial Statements - continued
Statement of Changes in Net Assets
| Year ended | Year ended |
Increase (Decrease) in Net Assets |
|
|
Operations |
|
|
Net investment income (loss) | $ 15,567,368 | $ 21,761,229 |
Net realized gain (loss) | 322,715,272 | 13,633,395 |
Change in net unrealized appreciation (depreciation) | (48,770,629) | (47,372,508) |
Net increase (decrease) in net assets resulting from operations | 289,512,011 | (11,977,884) |
Distributions to shareholders from net investment income | (15,215,278) | (18,731,365) |
Distributions to shareholders from net realized gain | (204,942,916) | (14,385,264) |
Total distributions | (220,158,194) | (33,116,629) |
Share transactions | 362,585,110 | 409,900,203 |
Reinvestment of distributions | 212,043,462 | 31,802,132 |
Cost of shares redeemed | (775,193,374) | (774,101,022) |
Net increase (decrease) in net assets resulting from share transactions | (200,564,802) | (332,398,687) |
Redemption fees | 26,953 | 36,846 |
Total increase (decrease) in net assets | (131,184,032) | (377,456,354) |
|
|
|
Net Assets | ||
Beginning of period | 2,126,991,643 | 2,504,447,997 |
End of period (including undistributed net investment income of $2,667,396 and distributions in excess of net investment income of $1,146,415, respectively) | $ 1,995,807,611 | $ 2,126,991,643 |
Other Information Shares | ||
Sold | 6,275,361 | 8,050,534 |
Issued in reinvestment of distributions | 3,846,875 | 620,890 |
Redeemed | (13,451,035) | (15,279,430) |
Net increase (decrease) | (3,328,799) | (6,608,006) |
Financial Highlights
Years ended February 28, | 2014 | 2013 | 2012 F | 2011 | 2010 |
Selected Per-Share Data |
|
|
|
|
|
Net asset value, beginning of period | $ 54.81 | $ 55.14 | $ 60.22 | $ 43.55 | $ 27.43 |
Income from Investment Operations |
|
|
|
|
|
Net investment income (loss) B | .44 | .53 | .41 | .29 | .07 |
Net realized and unrealized gain (loss) | 7.86 | (.04) | (5.06) | 16.63 | 16.14 |
Total from investment operations | 8.30 | .49 | (4.65) | 16.92 | 16.21 |
Distributions from net investment income | (.46) | (.47) | (.40) | (.25) | (.09) |
Distributions from net realized gain | (6.40) | (.35) | (.03) | - | - |
Total distributions | (6.86) | (.82) | (.43) | (.25) | (.09) |
Redemption fees added to paid in capital B, G | - | - | - | - | - |
Net asset value, end of period | $ 56.25 | $ 54.81 | $ 55.14 | $ 60.22 | $ 43.55 |
Total Return A | 15.43% | 1.00% | (7.68)% | 38.95% | 59.11% |
Ratios to Average Net Assets C, E |
|
|
|
|
|
Expenses before reductions | .80% | .82% | .83% | .85% | .90% |
Expenses net of fee waivers, if any | .80% | .82% | .83% | .85% | .90% |
Expenses net of all reductions | .80% | .81% | .82% | .85% | .90% |
Net investment income (loss) | .76% | 1.04% | .77% | .64% | .18% |
Supplemental Data |
|
|
|
|
|
Net assets, end of period (000 omitted) | $ 1,995,808 | $ 2,126,992 | $ 2,504,448 | $ 3,033,023 | $ 2,134,018 |
Portfolio turnover rate D | 98% | 80% | 90% | 107% | 97% |
A Total returns would have been lower if certain expenses had not been reduced during the applicable periods shown.
B Calculated based on average shares outstanding during the period.
C Fees and expenses of any underlying Fidelity Central Funds are not included in the Fund's expense ratio. The Fund indirectly bears its proportionate share of the expenses of any underlying Fidelity Central Funds.
D Amount does not include the portfolio activity of any underlying Fidelity Central Funds.
E Expense ratios reflect operating expenses of the Fund. Expenses before reductions do not reflect amounts reimbursed by the investment adviser or reductions from brokerage service arrangements or reductions from other expense offset arrangements and do not represent the amount paid by the Fund during periods when reimbursements or reductions occur. Expenses net of fee waivers reflect expenses after reimbursement by the investment adviser but prior to reductions from brokerage service arrangements or other expense offset arrangements. Expenses net of all reductions represent the net expenses paid by the Fund.
F For the year ended February 29.
G Amount represents less than $.01 per share.
See accompanying notes which are an integral part of the financial statements.
Annual Report
Energy Service Portfolio
Performance: The Bottom Line
Average annual total return reflects the change in the value of an investment, assuming reinvestment of the fund's distributions from dividend income and capital gains (the profits earned upon the sale of securities that have grown in value, if any) and assuming a constant rate of performance each year. The $10,000 table and the fund's returns do not reflect the deduction of taxes that a shareholder would pay on fund distributions or the redemption of fund shares. During periods of reimbursement by Fidelity, a fund's total return will be greater than it would be had the reimbursement not occurred. How a fund did yesterday is no guarantee of how it will do tomorrow.
Average Annual Total Returns
Periods ended February 28, 2014 | Past 1 | Past 5 | Past 10 |
Energy Service Portfolio | 16.62% | 20.59% | 10.66% |
$10,000 Over 10 Years
Let's say hypothetically that $10,000 was invested in Energy Service Portfolio on February 29, 2004. The chart shows how the value of your investment would have changed, and also shows how the S&P 500 Index performed over the same period.
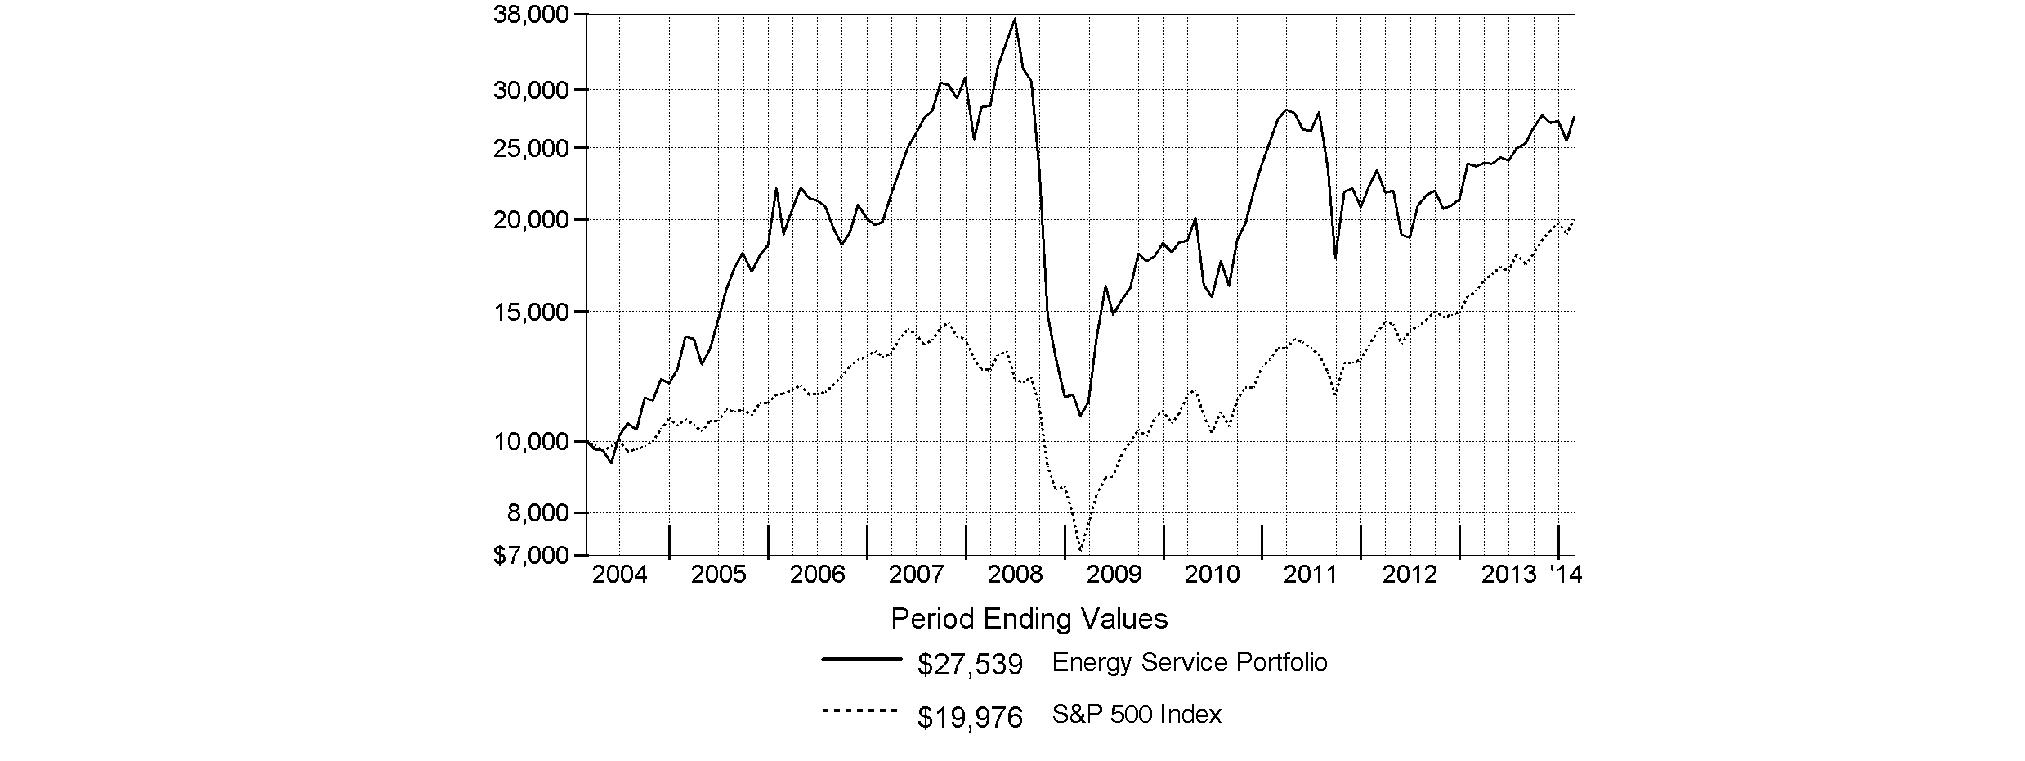
Annual Report
Energy Service Portfolio
Management's Discussion of Fund Performance
Market Recap: Stocks overcame fears of higher interest rates - not to mention their worst January in four years - to finish sharply higher for the 12 months ending February 28, 2014. The broad S&P 500® Index and the blue-chip Dow Jones Industrial AverageSM gained 25.37% and 19.01%, respectively, amid generally favorable earnings reports and accommodative monetary policies worldwide. Performance generally increased along the risk spectrum, with smaller-cap and growth strategies leading the way. An ebullient market helped the growth-oriented Nasdaq Composite Index® to a 38.10% period gain, for example. On the other hand, both cyclical and defensive stocks had representation in the top-performing industry sectors: returns were highest in health care and consumer discretionary; lowest in utilities and telecommunication services. From a macroeconomic perspective, data still points to slow but steady improvement in the U.S., and Europe's recession may well be over. Reports from China have disappointed, but continue to suggest a relatively soft landing there. Mixed signals from the U.S. Federal Reserve as to when it might curtail its stimulative bond buying kept markets in flux during the spring and summer. Stocks regained momentum in October despite a federal budget impasse and brief government shutdown, and lower volatility prevailed through year-end. Shedding new-year concerns about China's economy, an emerging-markets sell-off and confirmation (at last) of Fed tapering - alongside confirmation of a presumably dovish Janet Yellen as new Fed chair - February saw stocks back in record territory, bearing down on the five-year anniversary of the market's bottom.
Comments from Benjamin Shuleva, who became sole Portfolio Manager of Energy Service Portfolio on February 1, 2014, after serving as Co-Manager: For the year, the fund returned 16.62%, underperforming the 19.16% advance of its industry benchmark, the MSCI® U.S. IMI Energy Equipment & Services 25-50 Index, and the broadly based S&P 500®. Overall, it was a relatively flat year for energy service fundamentals and industry activity levels. Oil prices globally were volatile, but averaged in line with the prior year. Natural gas prices remained too low for exploration & production (E&P) firms to drill their natural gas prospects, and the U.S. land rig count ended 2013 within 1% of where it started the year. Versus the MSCI industry benchmark, stock picks in the oil & gas drilling segment detracted. Here, not owning index component and contract land driller Helmerich & Payne was the biggest miss, as the stock rose more than 50% on record earnings and revenue. Elsewhere, pressure-control equipment maker Cameron International also hurt, as the company stumbled on execution, resulting in downwardly revised financial guidance. Conversely, industry giant Halliburton was the fund's biggest relative contributor, with its stock rising on increased market share and improved free cash flow. The position was reduced, but it remains a key holding for the fund. Avoiding index component Diamond Offshore Drilling also helped, as waning demand for its older rigs hurt the stock price. I initiated a position in Norwegian well service and engineering company Odfjell Drilling when the firm went public in September, but its shares were hurt by declining global offshore rig rates, making it a detractor for the period.
The views expressed above reflect those of the portfolio manager(s) only through the end of the period as stated on the cover of this report and do not necessarily represent the views of Fidelity or any other person in the Fidelity organization. Any such views are subject to change at any time based upon market or other conditions and Fidelity disclaims any responsibility to update such views. These views may not be relied on as investment advice and, because investment decisions for a Fidelity fund are based on numerous factors, may not be relied on as an indication of trading intent on behalf of any Fidelity fund.
Annual Report
Energy Service Portfolio
Investment Changes (Unaudited)
Top Ten Stocks as of February 28, 2014 | ||
| % of fund's | % of fund's net assets |
Schlumberger Ltd. | 18.0 | 16.1 |
Halliburton Co. | 15.4 | 14.8 |
National Oilwell Varco, Inc. | 9.5 | 11.3 |
Cameron International Corp. | 6.8 | 7.0 |
Baker Hughes, Inc. | 4.8 | 2.5 |
FMC Technologies, Inc. | 4.6 | 4.8 |
Ensco PLC Class A | 4.5 | 4.7 |
Oceaneering International, Inc. | 4.1 | 3.0 |
Weatherford International Ltd. | 3.6 | 3.1 |
Noble Corp. | 3.3 | 4.6 |
| 74.6 | |
Top Industries (% of fund's net assets) | |||
As of February 28, 2014 | |||
| Energy Equipment & Services | 96.4% |
|
| Oil, Gas & | 1.5% |
|
| All Others* | 2.1% |
|

As of August 31, 2013 | |||
| Energy Equipment & Services | 94.8% |
|
| Machinery | 0.6% |
|
| Electrical Equipment | 0.2% |
|
 | Oil, Gas & | 0.1% |
|
| All Others* | 4.3% |
|

* Includes short-term investments and net other assets (liabilities). |
Annual Report
Energy Service Portfolio
Investments February 28, 2014
Showing Percentage of Net Assets
Common Stocks - 97.9% | |||
Shares | Value | ||
ENERGY EQUIPMENT & SERVICES - 96.4% | |||
Oil & Gas Drilling - 18.6% | |||
C.A.T. oil AG (Bearer) | 39,500 | $ 969,671 | |
Cathedral Energy Services Ltd. | 272,100 | 1,154,944 | |
Ensco PLC Class A | 884,800 | 46,593,568 | |
Eurasia Drilling Co. Ltd. GDR (Reg. S) | 141,000 | 4,194,750 | |
Hercules Offshore, Inc. (a) | 678,800 | 3,231,088 | |
Nabors Industries Ltd. | 285,900 | 6,581,418 | |
Noble Corp. | 1,105,535 | 34,326,862 | |
Ocean Rig UDW, Inc. (United States) (a) | 843,313 | 14,682,079 | |
Odfjell Drilling A/S | 4,212,145 | 24,352,121 | |
Precision Drilling Corp. | 467,000 | 5,165,020 | |
Rowan Companies PLC (a) | 501,100 | 16,716,696 | |
Unit Corp. (a) | 58,100 | 3,567,340 | |
Vantage Drilling Co. (a) | 10,890,400 | 19,058,200 | |
Xtreme Drilling & Coil Services Corp. (a) | 3,842,900 | 14,367,927 | |
| 194,961,684 | ||
Oil & Gas Equipment & Services - 77.8% | |||
Baker Hughes, Inc. | 794,622 | 50,283,680 | |
C&J Energy Services, Inc. (a)(d) | 100,000 | 2,585,000 | |
Cameron International Corp. (a) | 1,114,488 | 71,394,101 | |
Core Laboratories NV | 71,800 | 13,501,990 | |
Dresser-Rand Group, Inc. (a) | 140,500 | 7,633,365 | |
Dril-Quip, Inc. (a) | 246,000 | 26,459,760 | |
Exterran Holdings, Inc. | 53,000 | 2,171,410 | |
FMC Technologies, Inc. (a) | 957,662 | 48,112,939 | |
Forbes Energy Services Ltd. (a) | 332,915 | 1,354,964 | |
Forum Energy Technologies, Inc. (a) | 133,259 | 3,451,408 | |
Frank's International NV | 340,800 | 8,056,512 | |
Geospace Technologies Corp. (a) | 55,400 | 4,253,058 | |
Halliburton Co. | 2,822,034 | 160,855,938 | |
Helix Energy Solutions Group, Inc. (a) | 342,100 | 8,087,244 | |
Hornbeck Offshore Services, Inc. (a) | 241,800 | 10,339,368 | |
ION Geophysical Corp. (a) | 325,000 | 1,322,750 | |
National Oilwell Varco, Inc. | 1,289,662 | 99,355,560 | |
Oceaneering International, Inc. | 605,600 | 43,348,848 | |
Oil States International, Inc. (a) | 202,800 | 19,249,776 | |
Schlumberger Ltd. | 2,022,411 | 188,084,226 | |
ShawCor Ltd. Class A | 111,300 | 4,596,540 | |
Spectrum ASA | 315,910 | 1,915,882 | |
TETRA Technologies, Inc. (a) | 84,900 | 1,018,800 | |
Weatherford International Ltd. (a) | 2,260,366 | 37,680,301 | |
| 815,113,420 | ||
TOTAL ENERGY EQUIPMENT & SERVICES | 1,010,075,104 | ||
| |||
Shares | Value | ||
OIL, GAS & CONSUMABLE FUELS - 1.5% | |||
Coal & Consumable Fuels - 0.2% | |||
Peabody Energy Corp. | 116,900 | $ 2,052,764 | |
Oil & Gas Refining & Marketing - 0.7% | |||
CVR Refining, LP | 336,246 | 7,020,816 | |
Oil & Gas Storage & Transport - 0.6% | |||
Golar LNG Ltd. (NASDAQ) | 58,800 | 2,152,080 | |
StealthGas, Inc. (a) | 426,733 | 4,484,964 | |
| 6,637,044 | ||
TOTAL OIL, GAS & CONSUMABLE FUELS | 15,710,624 | ||
TOTAL COMMON STOCKS (Cost $663,759,704) |
| ||
Money Market Funds - 2.5% | |||
|
|
|
|
Fidelity Cash Central Fund, 0.10% (b) | 24,429,526 | 24,429,526 | |
Fidelity Securities Lending Cash Central Fund, 0.09% (b)(c) | 2,152,700 | 2,152,700 | |
TOTAL MONEY MARKET FUNDS (Cost $26,582,226) |
| ||
TOTAL INVESTMENT PORTFOLIO - 100.4% (Cost $690,341,930) | 1,052,367,954 |
NET OTHER ASSETS (LIABILITIES) - (0.4)% | (4,388,404) | ||
NET ASSETS - 100% | $ 1,047,979,550 | ||
Legend |
(a) Non-income producing |
(b) Affiliated fund that is generally available only to investment companies and other accounts managed by Fidelity Investments. The rate quoted is the annualized seven-day yield of the fund at period end. A complete unaudited listing of the fund's holdings as of its most recent quarter end is available upon request. In addition, each Fidelity Central Fund's financial statements, which are not covered by the Fund's Report of Independent Registered Public Accounting Firm, are available on the SEC's website or upon request. |
(c) Investment made with cash collateral received from securities on loan. |
(d) Security or a portion of the security is on loan at period end. |
Affiliated Central Funds |
Information regarding fiscal year to date income earned by the Fund from investments in Fidelity Central Funds is as follows: |
Fund | Income earned |
Fidelity Cash Central Fund | $ 22,654 |
Fidelity Securities Lending Cash Central Fund | 12,321 |
Total | $ 34,975 |
Other Information |
All investments are categorized as Level 1 under the Fair Value Hierarchy. The inputs or methodology used for valuing securities may not be an indication of the risk associated with investing in those securities. For more information on valuation inputs, please refer to the Investment Valuation section in the accompanying Notes to Financial Statements. |
Distribution of investments by country or territory of incorporation, as a percentage of total net assets, is as follows (Unaudited): |
United States of America | 57.1% |
Curacao | 18.0% |
United Kingdom | 9.4% |
Switzerland | 3.6% |
Norway | 2.5% |
Canada | 2.4% |
Cayman Islands | 2.2% |
Netherlands | 2.1% |
Marshall Islands | 1.8% |
Others (Individually Less Than 1%) | 0.9% |
| 100.0% |
See accompanying notes which are an integral part of the financial statements.
Annual Report
Energy Service Portfolio
Financial Statements
Statement of Assets and Liabilities
| February 28, 2014 | |
|
|
|
Assets | ||
Investment in securities, at value (including securities loaned of $2,161,060) - See accompanying schedule: Unaffiliated issuers (cost $663,759,704) | $ 1,025,785,728 |
|
Fidelity Central Funds (cost $26,582,226) | 26,582,226 |
|
Total Investments (cost $690,341,930) |
| $ 1,052,367,954 |
Receivable for investments sold | 5,686,427 | |
Receivable for fund shares sold | 3,415,668 | |
Dividends receivable | 1,145,856 | |
Distributions receivable from Fidelity Central Funds | 1,012 | |
Prepaid expenses | 6,093 | |
Other receivables | 21,980 | |
Total assets | 1,062,644,990 | |
|
|
|
Liabilities | ||
Payable for investments purchased | $ 8,934,636 | |
Payable for fund shares redeemed | 2,899,887 | |
Accrued management fee | 447,409 | |
Other affiliated payables | 185,277 | |
Other payables and accrued expenses | 45,531 | |
Collateral on securities loaned, at value | 2,152,700 | |
Total liabilities | 14,665,440 | |
|
|
|
Net Assets | $ 1,047,979,550 | |
Net Assets consist of: |
| |
Paid in capital | $ 651,513,492 | |
Undistributed net investment income | 261,041 | |
Accumulated undistributed net realized gain (loss) on investments and foreign currency transactions | 34,177,596 | |
Net unrealized appreciation (depreciation) on investments and assets and liabilities in foreign currencies | 362,027,421 | |
Net Assets, for 12,167,499 shares outstanding | $ 1,047,979,550 | |
Net Asset Value, offering price and redemption price per share ($1,047,979,550 ÷ 12,167,499 shares) | $ 86.13 | |
Statement of Operations
| Year ended February 28, 2014 | |
|
|
|
Investment Income |
|
|
Dividends |
| $ 11,991,772 |
Interest |
| 5 |
Income from Fidelity Central Funds |
| 34,975 |
Total income |
| 12,026,752 |
|
|
|
Expenses | ||
Management fee | $ 6,284,682 | |
Transfer agent fees | 2,315,373 | |
Accounting and security lending fees | 371,086 | |
Custodian fees and expenses | 25,387 | |
Independent trustees' compensation | 21,900 | |
Registration fees | 52,282 | |
Audit | 54,913 | |
Legal | 19,029 | |
Interest | 5,204 | |
Miscellaneous | 13,109 | |
Total expenses before reductions | 9,162,965 | |
Expense reductions | (63,651) | 9,099,314 |
Net investment income (loss) | 2,927,438 | |
Realized and Unrealized Gain (Loss) Net realized gain (loss) on: | ||
Investment securities: |
|
|
Unaffiliated issuers | 91,137,127 | |
Foreign currency transactions | 21,814 | |
Total net realized gain (loss) |
| 91,158,941 |
Change in net unrealized appreciation (depreciation) on: Investment securities | 83,598,302 | |
Assets and liabilities in foreign currencies | 1,972 | |
Total change in net unrealized appreciation (depreciation) |
| 83,600,274 |
Net gain (loss) | 174,759,215 | |
Net increase (decrease) in net assets resulting from operations | $ 177,686,653 | |
See accompanying notes which are an integral part of the financial statements.
Annual Report
Energy Service Portfolio
Financial Statements - continued
Statement of Changes in Net Assets
| Year ended | Year ended |
Increase (Decrease) in Net Assets |
|
|
Operations |
|
|
Net investment income (loss) | $ 2,927,438 | $ 56,885 |
Net realized gain (loss) | 91,158,941 | (10,197,257) |
Change in net unrealized appreciation (depreciation) | 83,600,274 | (8,430,644) |
Net increase (decrease) in net assets resulting from operations | 177,686,653 | (18,571,016) |
Distributions to shareholders from net investment income | (2,225,534) | - |
Share transactions | 309,554,779 | 458,926,393 |
Reinvestment of distributions | 2,129,219 | - |
Cost of shares redeemed | (675,601,095) | (586,274,324) |
Net increase (decrease) in net assets resulting from share transactions | (363,917,097) | (127,347,931) |
Redemption fees | 32,958 | 33,045 |
Total increase (decrease) in net assets | (188,423,020) | (145,885,902) |
|
|
|
Net Assets | ||
Beginning of period | 1,236,402,570 | 1,382,288,472 |
End of period (including undistributed net investment income of $261,041 and accumulated net investment loss of $409,089, respectively) | $ 1,047,979,550 | $ 1,236,402,570 |
Other Information Shares | ||
Sold | 3,832,579 | 6,636,814 |
Issued in reinvestment of distributions | 25,285 | - |
Redeemed | (8,396,346) | (8,864,023) |
Net increase (decrease) | (4,538,482) | (2,227,209) |
Financial Highlights
Years ended February 28, | 2014 | 2013 | 2012 H | 2011 | 2010 |
Selected Per-Share Data |
|
|
|
|
|
Net asset value, beginning of period | $ 74.01 | $ 73.01 | $ 85.88 | $ 58.27 | $ 33.87 |
Income from Investment Operations |
|
|
|
|
|
Net investment income (loss) B | .21 | - I | (.09) | (.04) | .02 E |
Net realized and unrealized gain (loss) | 12.09 | 1.00 F | (12.79) | 27.65 | 24.41 |
Total from investment operations | 12.30 | 1.00 | (12.88) | 27.61 | 24.43 |
Distributions from net investment income | (.18) | - | - | - | (.04) |
Redemption fees added to paid in capital B | - I | - I | .01 | - I | .01 |
Net asset value, end of period | $ 86.13 | $ 74.01 | $ 73.01 | $ 85.88 | $ 58.27 |
Total Return A | 16.62% | 1.37% | (14.99)% | 47.38% | 72.15% |
Ratios to Average Net Assets C, G |
|
|
|
|
|
Expenses before reductions | .80% | .82% | .82% | .85% | .91% |
Expenses net of fee waivers, if any | .80% | .82% | .82% | .85% | .91% |
Expenses net of all reductions | .80% | .81% | .81% | .85% | .91% |
Net investment income (loss) | .26% | .01% | (.12)% | (.06)% | .04% E |
Supplemental Data |
|
|
|
|
|
Net assets, end of period (000 omitted) | $ 1,047,980 | $ 1,236,403 | $ 1,382,288 | $ 2,040,691 | $ 1,282,428 |
Portfolio turnover rate D | 34% | 49% | 74% | 85% | 84% |
A Total returns would have been lower if certain expenses had not been reduced during the applicable periods shown.
B Calculated based on average shares outstanding during the period.
C Fees and expenses of any underlying Fidelity Central Funds are not included in the Fund's expense ratio. The Fund indirectly bears its proportionate share of the expenses of any underlying Fidelity Central Funds.
D Amount does not include the portfolio activity of any underlying Fidelity Central Funds.
E Investment income per share reflects a large, non-recurring dividend which amounted to $.10 per share. Excluding this non-recurring dividend, the ratio of net investment income (loss) to average net assets would have been (.15)%.
F The amount shown for a share outstanding does not correspond with the aggregate net gain (loss) on investments for the period due to the timing of sales and repurchases of shares in relation to fluctuating market values of the investments of the Fund.
G Expense ratios reflect operating expenses of the Fund. Expenses before reductions do not reflect amounts reimbursed by the investment adviser or reductions from brokerage service arrangements or reductions from other expense offset arrangements and do not represent the amount paid by the Fund during periods when reimbursements or reductions occur. Expenses net of fee waivers reflect expenses after reimbursement by the investment adviser but prior to reductions from brokerage service arrangements or other expense offset arrangements. Expenses net of all reductions represent the net expenses paid by the Fund.
H For the year ended February 29.
I Amount represents less than $.01 per share.
See accompanying notes which are an integral part of the financial statements.
Annual Report
Natural Gas Portfolio
Performance: The Bottom Line
Average annual total return reflects the change in the value of an investment, assuming reinvestment of the fund's distributions from dividend income and capital gains (the profits earned upon the sale of securities that have grown in value, if any) and assuming a constant rate of performance each year. The $10,000 table and the fund's returns do not reflect the deduction of taxes that a shareholder would pay on fund distributions or the redemption of fund shares. During periods of reimbursement by Fidelity, a fund's total return will be greater than it would be had the reimbursement not occurred. How a fund did yesterday is no guarantee of how it will do tomorrow.
Average Annual Total Returns
Periods ended February 28, 2014 | Past 1 | Past 5 | Past 10 |
Natural Gas Portfolio | 21.28% | 16.44% | 9.62% |
$10,000 Over 10 Years
Let's say hypothetically that $10,000 was invested in Natural Gas Portfolio on February 29, 2004. The chart shows how the value of your investment would have changed, and also shows how the S&P 500 Index performed over the same period.
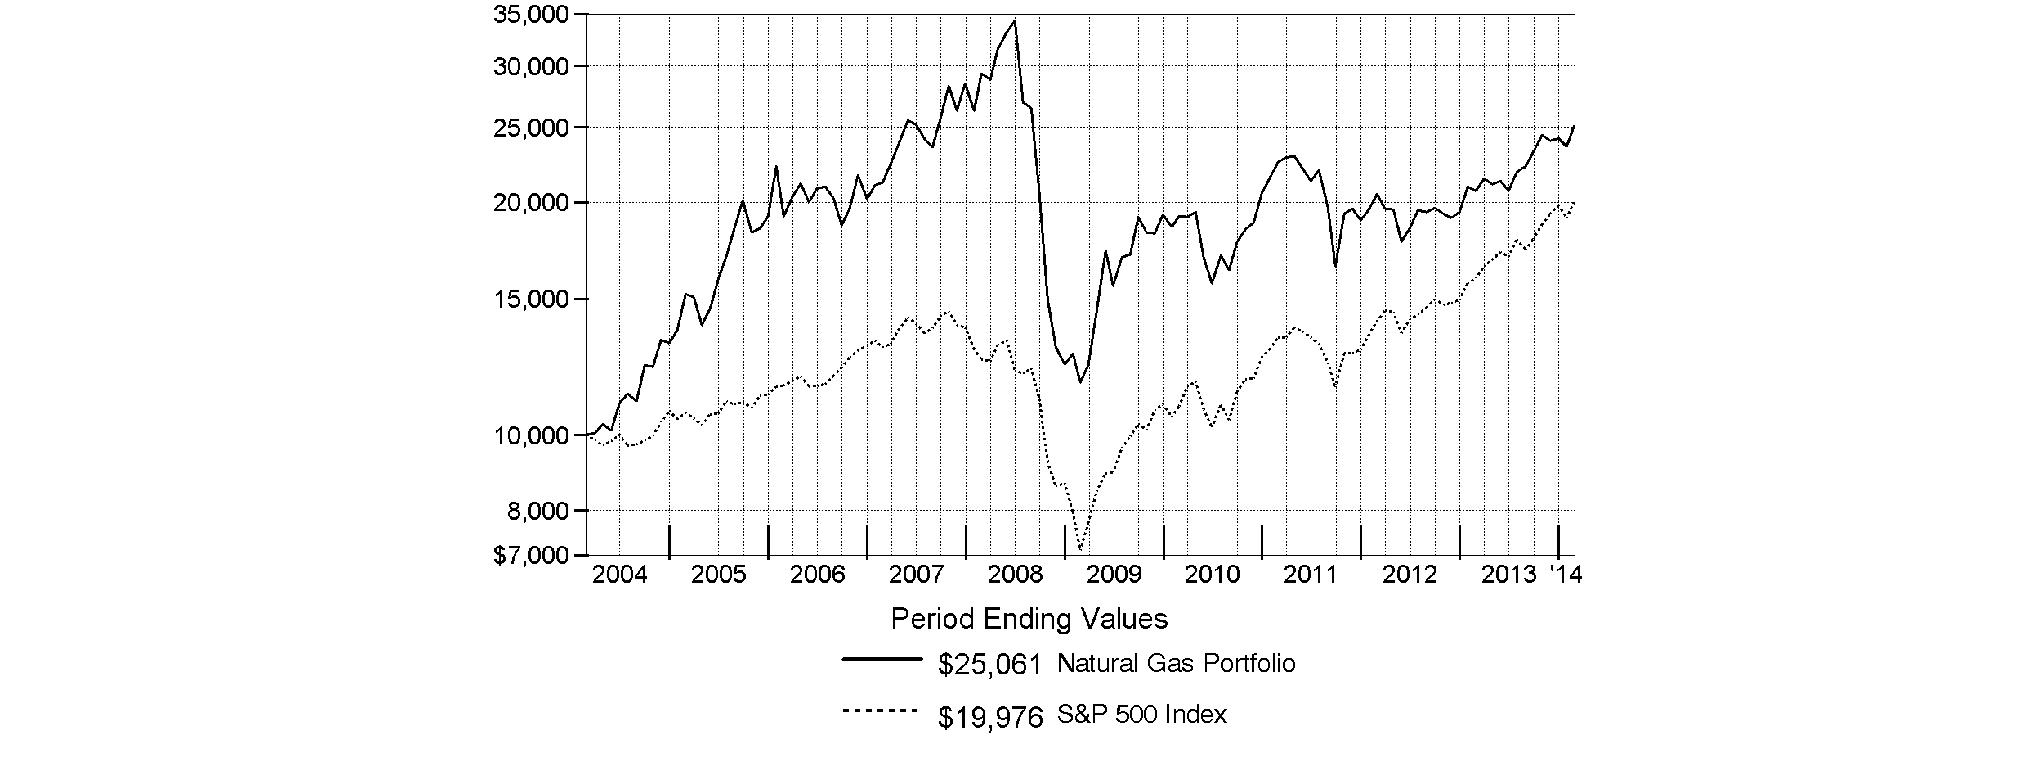
Annual Report
Natural Gas Portfolio
Management's Discussion of Fund Performance
Market Recap: Stocks overcame fears of higher interest rates - not to mention their worst January in four years - to finish sharply higher for the 12 months ending February 28, 2014. The broad S&P 500® Index and the blue-chip Dow Jones Industrial AverageSM gained 25.37% and 19.01%, respectively, amid generally favorable earnings reports and accommodative monetary policies worldwide. Performance generally increased along the risk spectrum, with smaller-cap and growth strategies leading the way. An ebullient market helped the growth-oriented Nasdaq Composite Index® to a 38.10% period gain, for example. On the other hand, both cyclical and defensive stocks had representation in the top-performing industry sectors: returns were highest in health care and consumer discretionary; lowest in utilities and telecommunication services. From a macroeconomic perspective, data still points to slow but steady improvement in the U.S., and Europe's recession may well be over. Reports from China have disappointed, but continue to suggest a relatively soft landing there. Mixed signals from the U.S. Federal Reserve as to when it might curtail its stimulative bond buying kept markets in flux during the spring and summer. Stocks regained momentum in October despite a federal budget impasse and brief government shutdown, and lower volatility prevailed through year-end. Shedding new-year concerns about China's economy, an emerging-markets sell-off and confirmation (at last) of Fed tapering - alongside confirmation of a presumably dovish Janet Yellen as new Fed chair - February saw stocks back in record territory, bearing down on the five-year anniversary of the market's bottom.
Comments from Ted Davis, Portfolio Manager of Natural Gas Portfolio: For the year, the fund gained 21.28%, beating the 20.43% return of its industry benchmark, the S&P Custom® Natural Gas Index, but lagging the broadly based S&P 500®. Natural gas prices remained volatile, driven largely by extreme weather. On balance, natural gas prices rose 32% over the 12 months, and the frigid temperatures of late have done a lot to improve the supply/demand imbalance we've seen the past few years. Versus the industry index, the fund's top individual contributor by far was exploration & production (E&P) firm Cimarex Energy, as the stock benefited from substantial unconventional oil resource discoveries. Timely trading in E&P firm Apache helped, as I gradually eliminated the fund's position here when the stock began to struggle toward period end. I'll also mention Cheniere Energy, a storage & transport company that I believe is positioned well in the growing market for liquefied natural gas (LNG) exports. I established a non-index stake in Cheniere in October when its stock was trading at an attractive entry point, and its shares climbed through period end. At the subindustry level, stock selection in oil & gas equipment & services added the most value, including benchmark heavyweight Halliburton, the fund's largest holding at period end. Conversely, we had some weak picks in oil & gas drilling, including our largest relative detractor, offshore rig company Ensco. Not owning U.S. shale driller and index member Pioneer Natural Resources also hurt, as its stock rose 60%. Our cash stake detracted, as did the fund's foreign holdings, due in part to currency fluctuations.
The views expressed above reflect those of the portfolio manager(s) only through the end of the period as stated on the cover of this report and do not necessarily represent the views of Fidelity or any other person in the Fidelity organization. Any such views are subject to change at any time based upon market or other conditions and Fidelity disclaims any responsibility to update such views. These views may not be relied on as investment advice and, because investment decisions for a Fidelity fund are based on numerous factors, may not be relied on as an indication of trading intent on behalf of any Fidelity fund.
Annual Report
Natural Gas Portfolio
Investment Changes (Unaudited)
Top Ten Stocks as of February 28, 2014 | ||
| % of fund's | % of fund's net assets |
Halliburton Co. | 7.0 | 4.8 |
Schlumberger Ltd. | 5.8 | 7.7 |
Encana Corp. | 4.9 | 4.4 |
Canadian Natural Resources Ltd. | 4.3 | 0.9 |
Devon Energy Corp. | 4.0 | 6.2 |
Anadarko Petroleum Corp. | 4.0 | 4.6 |
Cabot Oil & Gas Corp. | 3.6 | 0.9 |
Marathon Oil Corp. | 3.5 | 0.0 |
Spectra Energy Corp. | 3.2 | 0.0 |
Ensco PLC Class A | 3.1 | 5.0 |
| 43.4 | |
Top Industries (% of fund's net assets) | |||
As of February 28, 2014 | |||
| Oil, Gas & | 65.1% |
|
| Energy Equipment & Services | 27.5% |
|
| Multi-Utilities | 2.6% |
|
| Gas Utilities | 1.7% |
|
| All Others* | 3.1% |
|

As of August 31, 2013 | |||
| Oil, Gas & | 62.1% |
|
| Energy Equipment & Services | 28.7% |
|
| Gas Utilities | 4.4% |
|
| All Others* | 4.8% |
|

* Includes short-term investments and net other assets (liabilities). |
Annual Report
Natural Gas Portfolio
Investments February 28, 2014
Showing Percentage of Net Assets
Common Stocks - 96.8% | |||
Shares | Value | ||
ENERGY EQUIPMENT & SERVICES - 27.5% | |||
Oil & Gas Drilling - 6.5% | |||
Ensco PLC Class A | 500,400 | $ 26,351,064 | |
Nabors Industries Ltd. | 283,300 | 6,521,566 | |
Precision Drilling Corp. (d) | 1,121,400 | 12,345,224 | |
Rowan Companies PLC (a) | 281,800 | 9,400,848 | |
| 54,618,702 | ||
Oil & Gas Equipment & Services - 21.0% | |||
Baker Hughes, Inc. | 260,800 | 16,503,424 | |
Cameron International Corp. (a) | 154,300 | 9,884,458 | |
Halliburton Co. | 1,036,602 | 59,086,314 | |
National Oilwell Varco, Inc. | 223,800 | 17,241,552 | |
Schlumberger Ltd. | 527,400 | 49,048,200 | |
Trican Well Service Ltd. | 486,300 | 6,144,077 | |
Weatherford International Ltd. (a) | 1,109,700 | 18,498,699 | |
| 176,406,724 | ||
TOTAL ENERGY EQUIPMENT & SERVICES | 231,025,426 | ||
GAS UTILITIES - 1.7% | |||
Gas Utilities - 1.7% | |||
AGL Resources, Inc. | 215,200 | 10,123,008 | |
Atmos Energy Corp. | 13 | 599 | |
ONE Gas, Inc. (a) | 125,950 | 4,279,781 | |
| 14,403,388 | ||
MULTI-UTILITIES - 2.6% | |||
Multi-Utilities - 2.6% | |||
CenterPoint Energy, Inc. | 420,300 | 9,940,095 | |
NiSource, Inc. | 331,100 | 11,528,902 | |
| 21,468,997 | ||
OIL, GAS & CONSUMABLE FUELS - 65.0% | |||
Integrated Oil & Gas - 8.8% | |||
Hess Corp. | 248,700 | 19,903,461 | |
Husky Energy, Inc. | 707,500 | 21,513,163 | |
Occidental Petroleum Corp. | 122,100 | 11,785,092 | |
Suncor Energy, Inc. | 621,200 | 20,493,485 | |
| 73,695,201 | ||
Oil & Gas Exploration & Production - 41.2% | |||
Anadarko Petroleum Corp. | 401,200 | 33,764,992 | |
Apache Corp. | 3 | 238 | |
Athabasca Oil Corp. (a) | 686,100 | 5,297,711 | |
Bellatrix Exploration Ltd. (a) | 624,100 | 4,762,616 | |
Cabot Oil & Gas Corp. | 872,500 | 30,537,500 | |
Canadian Natural Resources Ltd. | 985,100 | 36,048,272 | |
| |||
Shares | Value | ||
Cimarex Energy Co. | 171,200 | $ 19,809,552 | |
ConocoPhillips Co. | 246,800 | 16,412,200 | |
Crown Point Energy, Inc. (a)(e) | 181,658 | 121,401 | |
Devon Energy Corp. | 527,946 | 34,010,281 | |
Emerald Oil, Inc. warrants 2/4/16 (a) | 15,002 | 0 | |
Encana Corp. | 2,175,900 | 41,266,053 | |
Energy XXI (Bermuda) Ltd. | 237,900 | 5,509,764 | |
EOG Resources, Inc. | 75,885 | 14,374,137 | |
Lekoil Ltd. (a)(d) | 3,560,300 | 4,054,092 | |
Lightstream Resources Ltd. (d) | 473,693 | 2,669,416 | |
Marathon Oil Corp. | 875,700 | 29,335,950 | |
Newfield Exploration Co. (a) | 235,600 | 6,641,564 | |
Painted Pony Petroleum Ltd. (a) | 883,600 | 6,814,724 | |
Paramount Resources Ltd. Class A (a) | 227,100 | 9,290,734 | |
PDC Energy, Inc. (a) | 109,600 | 6,809,448 | |
Penn West Petroleum Ltd. | 816,900 | 6,698,683 | |
Resolute Energy Corp. (a) | 853,000 | 7,949,960 | |
Rice Energy, Inc. | 197,200 | 4,732,800 | |
Southwestern Energy Co. (a) | 56,900 | 2,352,246 | |
Surge Energy, Inc. (d) | 1,104,600 | 5,885,614 | |
Talisman Energy, Inc. | 1,081,500 | 11,134,381 | |
| 346,284,329 | ||
Oil & Gas Refining & Marketing - 3.7% | |||
Dynagas LNG Partners LP (a) | 300,800 | 6,560,448 | |
Marathon Petroleum Corp. | 82,600 | 6,938,400 | |
Phillips 66 Co. | 169,800 | 12,711,228 | |
Tesoro Corp. | 94,600 | 4,825,546 | |
| 31,035,622 | ||
Oil & Gas Storage & Transport - 11.3% | |||
Cheniere Energy, Inc. (a) | 244,900 | 12,105,407 | |
GasLog Ltd. | 498,800 | 10,504,728 | |
ONEOK, Inc. | 418,700 | 24,761,918 | |
Spectra Energy Corp. | 713,900 | 26,614,192 | |
StealthGas, Inc. (a) | 461,600 | 4,851,416 | |
Teekay Corp. | 185,500 | 11,083,625 | |
TransCanada Corp. | 127,700 | 5,620,968 | |
| 95,542,254 | ||
TOTAL OIL, GAS & CONSUMABLE FUELS | 546,557,406 | ||
TOTAL COMMON STOCKS (Cost $758,696,547) |
| ||
Convertible Bonds - 0.1% | ||||
| Principal Amount |
| ||
OIL, GAS & CONSUMABLE FUELS - 0.1% | ||||
Oil & Gas Exploration & Production - 0.1% | ||||
Cobalt International Energy, Inc. 2.625% 12/1/19 | $ 600,000 |
| ||
Money Market Funds - 5.5% | |||
Shares | Value | ||
Fidelity Cash Central Fund, 0.10% (b) | 25,998,590 | $ 25,998,590 | |
Fidelity Securities Lending Cash Central Fund, 0.09% (b)(c) | 20,593,700 | 20,593,700 | |
TOTAL MONEY MARKET FUNDS (Cost $46,592,290) |
| ||
TOTAL INVESTMENT PORTFOLIO - 102.4% (Cost $805,884,337) | 860,625,757 |
NET OTHER ASSETS (LIABILITIES) - (2.4)% | (20,111,849) | ||
NET ASSETS - 100% | $ 840,513,908 | ||
Legend |
(a) Non-income producing |
(b) Affiliated fund that is generally available only to investment companies and other accounts managed by Fidelity Investments. The rate quoted is the annualized seven-day yield of the fund at period end. A complete unaudited listing of the fund's holdings as of its most recent quarter end is available upon request. In addition, each Fidelity Central Fund's financial statements, which are not covered by the Fund's Report of Independent Registered Public Accounting Firm, are available on the SEC's website or upon request. |
(c) Investment made with cash collateral received from securities on loan. |
(d) Security or a portion of the security is on loan at period end. |
(e) Security exempt from registration under Rule 144A of the Securities Act of 1933. These securities may be resold in transactions exempt from registration, normally to qualified institutional buyers. At the end of the period, the value of these securities amounted to $121,401 or 0.0% of net assets. |
Affiliated Central Funds |
Information regarding fiscal year to date income earned by the Fund from investments in Fidelity Central Funds is as follows: |
Fund | Income earned |
Fidelity Cash Central Fund | $ 17,958 |
Fidelity Securities Lending Cash Central Fund | 308,623 |
Total | $ 326,581 |
Other Information |
The following is a summary of the inputs used, as of February 28, 2014, involving the Fund's assets and liabilities carried at fair value. The inputs or methodology used for valuing securities may not be an indication of the risk associated with investing in those securities. For more information on valuation inputs, and their aggregation into the levels used in the table below, please refer to the Investment Valuation section in the accompanying Notes to Financial Statements. |
Valuation Inputs at Reporting Date: | ||||
Description | Total | Level 1 | Level 2 | Level 3 |
Investments in Securities: | ||||
Common Stocks | $ 813,455,217 | $ 813,455,217 | $ - | $ - |
Convertible Bonds | 578,250 | - | 578,250 | - |
Money Market Funds | 46,592,290 | 46,592,290 | - | - |
Total Investments in Securities: | $ 860,625,757 | $ 860,047,507 | $ 578,250 | $ - |
Distribution of investments by country or territory of incorporation, as a percentage of total net assets, is as follows (Unaudited): |
United States of America | 58.6% |
Canada | 23.3% |
Curacao | 5.8% |
United Kingdom | 4.2% |
Bermuda | 2.7% |
Marshall Islands | 2.7% |
Switzerland | 2.2% |
Others (Individually Less Than 1%) | 0.5% |
| 100.0% |
See accompanying notes which are an integral part of the financial statements.
Annual Report
Natural Gas Portfolio
Financial Statements
Statement of Assets and Liabilities
| February 28, 2014 | |
|
|
|
Assets | ||
Investment in securities, at value (including securities loaned of $19,967,341) - See accompanying schedule: Unaffiliated issuers (cost $759,292,047) | $ 814,033,467 |
|
Fidelity Central Funds (cost $46,592,290) | 46,592,290 |
|
Total Investments (cost $805,884,337) |
| $ 860,625,757 |
Receivable for investments sold | 13,409,844 | |
Receivable for fund shares sold | 593,604 | |
Dividends receivable | 1,238,575 | |
Interest receivable | 3,938 | |
Distributions receivable from Fidelity Central Funds | 6,844 | |
Prepaid expenses | 3,239 | |
Other receivables | 24,761 | |
Total assets | 875,906,562 | |
|
|
|
Liabilities | ||
Payable for investments purchased | $ 12,705,295 | |
Payable for fund shares redeemed | 1,537,782 | |
Accrued management fee | 355,200 | |
Other affiliated payables | 147,498 | |
Other payables and accrued expenses | 53,179 | |
Collateral on securities loaned, at value | 20,593,700 | |
Total liabilities | 35,392,654 | |
|
|
|
Net Assets | $ 840,513,908 | |
Net Assets consist of: |
| |
Paid in capital | $ 1,135,326,400 | |
Undistributed net investment income | 711,132 | |
Accumulated undistributed net realized gain (loss) on investments and foreign currency transactions | (350,261,899) | |
Net unrealized appreciation (depreciation) on investments and assets and liabilities in foreign currencies | 54,738,275 | |
Net Assets, for 21,462,662 shares outstanding | $ 840,513,908 | |
Net Asset Value, offering price and redemption price per share ($840,513,908 ÷ 21,462,662 shares) | $ 39.16 | |
Statement of Operations
| Year ended February 28, 2014 | |
|
|
|
Investment Income |
|
|
Dividends |
| $ 11,706,696 |
Interest |
| 15,917 |
Income from Fidelity Central Funds |
| 326,581 |
Total income |
| 12,049,194 |
|
|
|
Expenses | ||
Management fee | $ 3,678,515 | |
Transfer agent fees | 1,546,116 | |
Accounting and security lending fees | 244,884 | |
Custodian fees and expenses | 27,077 | |
Independent trustees' compensation | 12,495 | |
Registration fees | 47,183 | |
Audit | 39,600 | |
Legal | 10,451 | |
Interest | 164 | |
Miscellaneous | 7,905 | |
Total expenses before reductions | 5,614,390 | |
Expense reductions | (61,632) | 5,552,758 |
Net investment income (loss) | 6,496,436 | |
Realized and Unrealized Gain (Loss) Net realized gain (loss) on: | ||
Investment securities: |
|
|
Unaffiliated issuers | 62,994,138 | |
Foreign currency transactions | (32,290) | |
Total net realized gain (loss) |
| 62,961,848 |
Change in net unrealized appreciation (depreciation) on: Investment securities | 61,553,782 | |
Assets and liabilities in foreign currencies | 22,782 | |
Total change in net unrealized appreciation (depreciation) |
| 61,576,564 |
Net gain (loss) | 124,538,412 | |
Net increase (decrease) in net assets resulting from operations | $ 131,034,848 | |
See accompanying notes which are an integral part of the financial statements.
Annual Report
Natural Gas Portfolio
Financial Statements - continued
Statement of Changes in Net Assets
| Year ended | Year ended |
Increase (Decrease) in Net Assets |
|
|
Operations |
|
|
Net investment income (loss) | $ 6,496,436 | $ 6,427,872 |
Net realized gain (loss) | 62,961,848 | 50,946,752 |
Change in net unrealized appreciation (depreciation) | 61,576,564 | (53,773,245) |
Net increase (decrease) in net assets resulting from operations | 131,034,848 | 3,601,379 |
Distributions to shareholders from net investment income | (6,060,459) | (5,539,434) |
Distributions to shareholders from net realized gain | (5,925,348) | (1,080,476) |
Total distributions | (11,985,807) | (6,619,910) |
Share transactions | 307,452,527 | 191,939,367 |
Reinvestment of distributions | 11,256,726 | 6,127,922 |
Cost of shares redeemed | (247,338,730) | (288,673,684) |
Net increase (decrease) in net assets resulting from share transactions | 71,370,523 | (90,606,395) |
Redemption fees | 21,783 | 17,095 |
Total increase (decrease) in net assets | 190,441,347 | (93,607,831) |
|
|
|
Net Assets | ||
Beginning of period | 650,072,561 | 743,680,392 |
End of period (including undistributed net investment income of $711,132 and undistributed net investment income of $303,922, respectively) | $ 840,513,908 | $ 650,072,561 |
Other Information Shares | ||
Sold | 8,329,283 | 6,269,617 |
Issued in reinvestment of distributions | 302,074 | 196,748 |
Redeemed | (6,952,603) | (9,280,431) |
Net increase (decrease) | 1,678,754 | (2,814,066) |
Financial Highlights
Years ended February 28, | 2014 | 2013 | 2012 G | 2011 | 2010 |
Selected Per-Share Data |
|
|
|
|
|
Net asset value, beginning of period | $ 32.86 | $ 32.91 | $ 36.50 | $ 31.34 | $ 19.16 |
Income from Investment Operations |
|
|
|
|
|
Net investment income (loss) B | .35 | .30 | .26 | .29 E | (.04) |
Net realized and unrealized gain (loss) | 6.61 | (.03) J | (3.56) | 5.19 | 12.22 |
Total from investment operations | 6.96 | .27 | (3.30) | 5.48 | 12.18 |
Distributions from net investment income | (.33) | (.27) | (.29) | (.26) | - |
Distributions from net realized gain | (.32) | (.05) | - | (.06) | - |
Total distributions | (.66) I | (.32) | (.29) | (.32) | - |
Redemption fees added to paid in capital B, H | - | - | - | - | - |
Net asset value, end of period | $ 39.16 | $ 32.86 | $ 32.91 | $ 36.50 | $ 31.34 |
Total Return A | 21.28% | .86% J | (9.03)% | 17.58% | 63.57% |
Ratios to Average Net Assets C, F |
|
|
|
|
|
Expenses before reductions | .84% | .87% | .86% | .89% | .93% |
Expenses net of fee waivers, if any | .84% | .87% | .86% | .89% | .93% |
Expenses net of all reductions | .84% | .86% | .86% | .88% | .93% |
Net investment income (loss) | .98% | .96% | .81% | .95% E | (.13)% |
Supplemental Data |
|
|
|
|
|
Net assets, end of period (000 omitted) | $ 840,514 | $ 650,073 | $ 743,680 | $ 990,083 | $ 1,141,747 |
Portfolio turnover rate D | 135% | 107% | 63% | 167% | 110% |
A Total returns would have been lower if certain expenses had not been reduced during the applicable periods shown.
B Calculated based on average shares outstanding during the period.
C Fees and expenses of any underlying Fidelity Central Funds are not included in the Fund's expense ratio. The Fund indirectly bears its proportionate share of the expenses of any underlying Fidelity Central Funds.
D Amount does not include the portfolio activity of any underlying Fidelity Central Funds.
E Investment income per share reflects a large, non-recurring dividend which amounted to $.15 per share. Excluding this non-recurring dividend, the ratio of net investment income (loss) to average net assets would have been .47%.
F Expense ratios reflect operating expenses of the Fund. Expenses before reductions do not reflect amounts reimbursed by the investment adviser or reductions from brokerage service arrangements or reductions from other expense offset arrangements and do not represent the amount paid by the Fund during periods when reimbursements or reductions occur. Expenses net of fee waivers reflect expenses after reimbursement by the investment adviser but prior to reductions from brokerage service arrangements or other expense offset arrangements. Expenses net of all reductions represent the net expenses paid by the Fund.
G For the year ended February 29.
H Amount represents less than $.01 per share.
I Total distributions of $.66 per share is comprised of distributions from net investment income of $.332 and distributions from net realized gain of $.324 per share.
J Net realized and unrealized gain (loss) per share reflects proceeds received from litigation which amounted to $.03 per share. Excluding these litigation proceeds, the total return would have been 0.75%.
See accompanying notes which are an integral part of the financial statements.
Annual Report
Natural Resources Portfolio
Performance: The Bottom Line
Average annual total return reflects the change in the value of an investment, assuming reinvestment of the fund's distributions from dividend income and capital gains (the profits earned upon the sale of securities that have grown in value, if any) and assuming a constant rate of performance each year. The $10,000 table and the fund's returns do not reflect the deduction of taxes that a shareholder would pay on fund distributions or the redemption of fund shares. During periods of reimbursement by Fidelity, a fund's total return will be greater than it would be had the reimbursement not occurred. How a fund did yesterday is no guarantee of how it will do tomorrow.
Average Annual Total Returns
Periods ended February 28, 2014 | Past 1 | Past 5 | Past 10 |
Natural Resources Portfolio | 13.97% | 18.18% | 12.03% |
$10,000 Over 10 Years
Let's say hypothetically that $10,000 was invested in Natural Resources Portfolio on February 29, 2004. The chart shows how the value of your investment would have changed, and also shows how the S&P 500 Index performed over the same period.
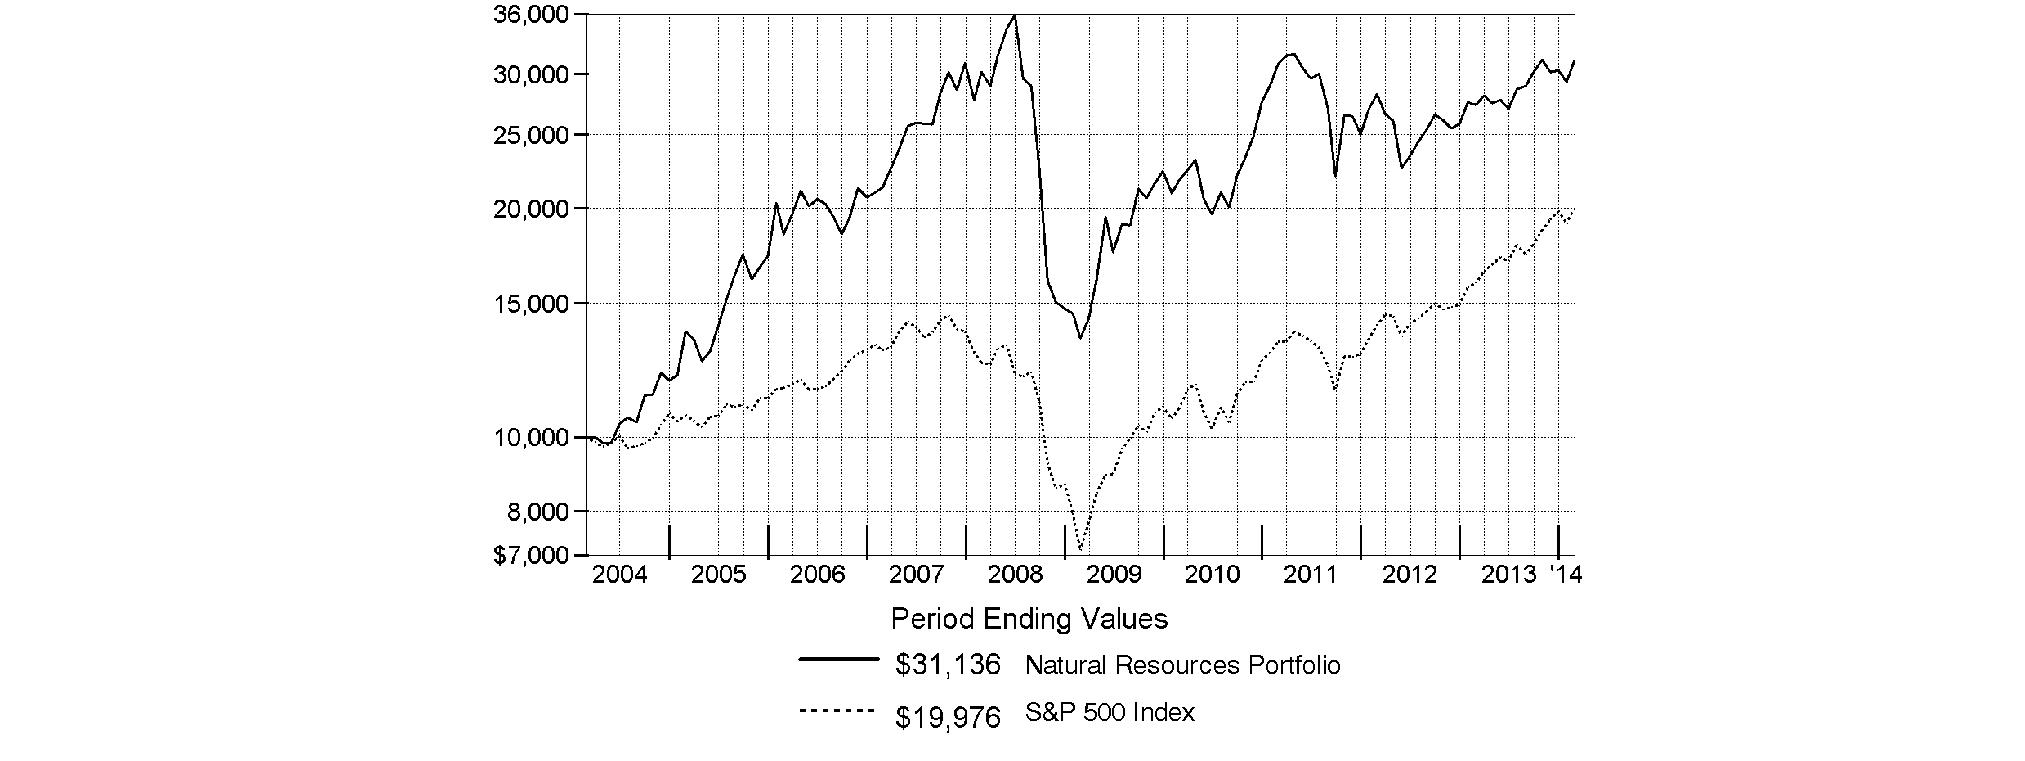
Annual Report
Natural Resources Portfolio
Management's Discussion of Fund Performance
Market Recap: Stocks overcame fears of higher interest rates - not to mention their worst January in four years - to finish sharply higher for the 12 months ending February 28, 2014. The broad S&P 500® Index and the blue-chip Dow Jones Industrial AverageSM gained 25.37% and 19.01%, respectively, amid generally favorable earnings reports and accommodative monetary policies worldwide. Performance generally increased along the risk spectrum, with smaller-cap and growth strategies leading the way. An ebullient market helped the growth-oriented Nasdaq Composite Index® to a 38.10% period gain, for example. On the other hand, both cyclical and defensive stocks had representation in the top-performing industry sectors: returns were highest in health care and consumer discretionary; lowest in utilities and telecommunication services. From a macroeconomic perspective, data still points to slow but steady improvement in the U.S., and Europe's recession may well be over. Reports from China have disappointed, but continue to suggest a relatively soft landing there. Mixed signals from the U.S. Federal Reserve as to when it might curtail its stimulative bond buying kept markets in flux during the spring and summer. Stocks regained momentum in October despite a federal budget impasse and brief government shutdown, and lower volatility prevailed through year-end. Shedding new-year concerns about China's economy, an emerging-markets sell-off and confirmation (at last) of Fed tapering - alongside confirmation of a presumably dovish Janet Yellen as new Fed chair - February saw stocks back in record territory, bearing down on the five-year anniversary of the market's bottom.
Comments from John Dowd, Portfolio Manager of Natural Resources Portfolio: For the year, the fund returned 13.97%, nicely ahead of the 12.27% gain of S&P® North American Natural Resources Sector Index but trailing the S&P 500®. Relative to the broader market, natural resources stocks were hurt by both the underperformance of the integrated oil & gas segment, which struggled with lower oil prices and declines in global production, and gold-mining stocks, which returned -26% on falling commodity prices. Versus the S&P® industry benchmark, stock picking among oil & gas exploration & production firms (E&Ps) helped the most. Here, Cimarex Energy - which I bought in June - and EOG Resources led the way. Both stocks rose more than 50% for the period and were among the fund's largest holdings at period end. Underweighting integrated oil & gas firms also proved helpful, including Chevron, whose downward revisions to its 2014 crude oil production forecast held back its stock price. Some E&Ps also were among the fund's biggest individual detractors. An underweighting in ConocoPhillips hurt, as its stock rose on positive earnings surprises. Shares of deep water E&P firm Cobalt International Energy declined on news a key well did not strike oil, and I eliminated the position by period end. Elsewhere, my overall timing in gold-mining stocks helped the fund, although a stake in Gold Fields, based in South Africa, was a large detractor. Gold Fields was one of the fund's foreign holdings that hurt due in part to currency fluctuations.
The views expressed above reflect those of the portfolio manager(s) only through the end of the period as stated on the cover of this report and do not necessarily represent the views of Fidelity or any other person in the Fidelity organization. Any such views are subject to change at any time based upon market or other conditions and Fidelity disclaims any responsibility to update such views. These views may not be relied on as investment advice and, because investment decisions for a Fidelity fund are based on numerous factors, may not be relied on as an indication of trading intent on behalf of any Fidelity fund.
Annual Report
Natural Resources Portfolio
Investment Changes (Unaudited)
Top Ten Stocks as of February 28, 2014 | ||
| % of fund's | % of fund's net assets |
EOG Resources, Inc. | 7.9 | 5.2 |
Anadarko Petroleum Corp. | 4.5 | 4.0 |
Schlumberger Ltd. | 4.0 | 4.6 |
Noble Energy, Inc. | 3.8 | 3.2 |
Exxon Mobil Corp. | 3.8 | 1.7 |
Halliburton Co. | 3.7 | 6.1 |
Chevron Corp. | 3.6 | 1.7 |
ConocoPhillips Co. | 3.5 | 0.7 |
FMC Technologies, Inc. | 3.5 | 2.6 |
Cimarex Energy Co. | 3.4 | 2.8 |
| 41.7 | |
Top Industries (% of fund's net assets) | |||
As of February 28, 2014 | |||
| Oil, Gas & | 65.7% |
|
 | Energy Equipment & Services | 18.8% |
|
 | Metals & Mining | 8.5% |
|
 | Containers & Packaging | 2.7% |
|
| Paper & Forest Products | 1.4% |
|
| All Others* | 2.9% |
|

As of August 31, 2013 | |||
| Oil, Gas & | 57.3% |
|
| Energy Equipment & Services | 23.6% |
|
| Metals & Mining | 10.7% |
|
| Containers & Packaging | 2.8% |
|
| Paper & Forest Products | 0.9% |
|
| All Others* | 4.7% |
|

* Includes short-term investments and net other assets (liabilities). |
Annual Report
Natural Resources Portfolio
Investments February 28, 2014
Showing Percentage of Net Assets
Common Stocks - 98.4% | |||
Shares | Value | ||
CHEMICALS - 1.1% | |||
Fertilizers & Agricultural Chemicals - 1.1% | |||
Monsanto Co. | 90,300 | $ 9,934,806 | |
CONSTRUCTION & ENGINEERING - 0.2% | |||
Construction & Engineering - 0.2% | |||
URS Corp. | 48,800 | 2,269,200 | |
CONTAINERS & PACKAGING - 2.7% | |||
Metal & Glass Containers - 1.2% | |||
Ball Corp. | 210,600 | 11,700,936 | |
Paper Packaging - 1.5% | |||
Rock-Tenn Co. Class A | 127,300 | 14,209,226 | |
TOTAL CONTAINERS & PACKAGING | 25,910,162 | ||
ENERGY EQUIPMENT & SERVICES - 18.8% | |||
Oil & Gas Drilling - 1.4% | |||
Ocean Rig UDW, Inc. (United States) (a) | 127,400 | 2,218,034 | |
Odfjell Drilling A/S | 740,800 | 4,282,866 | |
Vantage Drilling Co. (a) | 2,249,900 | 3,937,325 | |
Xtreme Drilling & Coil Services Corp. (a) | 842,900 | 3,151,455 | |
| 13,589,680 | ||
Oil & Gas Equipment & Services - 17.4% | |||
Baker Hughes, Inc. | 91,500 | 5,790,120 | |
Cameron International Corp. (a) | 270,000 | 17,296,200 | |
Core Laboratories NV | 21,700 | 4,080,685 | |
FMC Technologies, Inc. (a) | 658,900 | 33,103,136 | |
Forum Energy Technologies, Inc. (a) | 148,500 | 3,846,150 | |
Halliburton Co. | 609,300 | 34,730,100 | |
National Oilwell Varco, Inc. | 153,158 | 11,799,292 | |
Oceaneering International, Inc. | 145,100 | 10,386,258 | |
Schlumberger Ltd. | 404,692 | 37,636,356 | |
Total Energy Services, Inc. | 100,000 | 1,941,660 | |
Weatherford International Ltd. (a) | 260,100 | 4,335,867 | |
| 164,945,824 | ||
TOTAL ENERGY EQUIPMENT & SERVICES | 178,535,504 | ||
METALS & MINING - 8.5% | |||
Diversified Metals & Mining - 1.6% | |||
Freeport-McMoRan Copper & Gold, Inc. | 265,400 | 8,657,348 | |
Teck Resources Ltd. Class B (sub. vtg.) | 198,400 | 4,413,070 | |
Turquoise Hill Resources Ltd. (a) | 436,050 | 1,665,756 | |
| 14,736,174 | ||
Gold - 6.2% | |||
AngloGold Ashanti Ltd. sponsored ADR | 196,700 | 3,457,986 | |
Barrick Gold Corp. (d) | 257,900 | 5,254,424 | |
Franco-Nevada Corp. | 241,000 | 12,316,617 | |
Gold Fields Ltd. sponsored ADR | 1,332,400 | 4,916,556 | |
Goldcorp, Inc. | 255,500 | 6,869,173 | |
| |||
Shares | Value | ||
Harmony Gold Mining Co. Ltd. sponsored ADR | 530,400 | $ 1,718,496 | |
IAMGOLD Corp. | 508,200 | 1,886,302 | |
Kinross Gold Corp. | 295,867 | 1,544,397 | |
Newmont Mining Corp. | 204,200 | 4,749,692 | |
Randgold Resources Ltd. sponsored ADR | 118,900 | 9,397,856 | |
Royal Gold, Inc. | 37,600 | 2,583,496 | |
Yamana Gold, Inc. | 401,000 | 4,012,535 | |
| 58,707,530 | ||
Precious Metals & Minerals - 0.7% | |||
Pan American Silver Corp. (d) | 128,600 | 1,811,974 | |
Silver Wheaton Corp. | 204,600 | 5,219,859 | |
| 7,031,833 | ||
TOTAL METALS & MINING | 80,475,537 | ||
OIL, GAS & CONSUMABLE FUELS - 65.7% | |||
Coal & Consumable Fuels - 1.4% | |||
Peabody Energy Corp. | 770,400 | 13,528,224 | |
Integrated Oil & Gas - 10.5% | |||
Chevron Corp. | 294,600 | 33,976,218 | |
Exxon Mobil Corp. | 370,800 | 35,696,916 | |
Imperial Oil Ltd. | 102,400 | 4,607,214 | |
Occidental Petroleum Corp. | 59,200 | 5,713,984 | |
Suncor Energy, Inc. | 580,600 | 19,154,085 | |
| 99,148,417 | ||
Oil & Gas Exploration & Production - 42.3% | |||
Anadarko Petroleum Corp. | 508,600 | 42,803,776 | |
Bankers Petroleum Ltd. (a) | 1,229,800 | 5,464,297 | |
Bonanza Creek Energy, Inc. (a) | 109,000 | 5,446,730 | |
BPZ Energy, Inc. (a) | 500,300 | 1,030,618 | |
Cabot Oil & Gas Corp. | 364,350 | 12,752,250 | |
Chesapeake Energy Corp. | 252,180 | 6,533,984 | |
Cimarex Energy Co. | 275,600 | 31,889,676 | |
ConocoPhillips Co. | 501,700 | 33,363,050 | |
Continental Resources, Inc. (a)(d) | 143,700 | 17,175,024 | |
Energen Corp. | 24,400 | 1,962,736 | |
EOG Resources, Inc. | 398,000 | 75,389,160 | |
EPL Oil & Gas, Inc. (a) | 76,440 | 2,300,844 | |
EQT Corp. | 198,800 | 20,335,252 | |
Evolution Petroleum Corp. | 78,400 | 1,019,200 | |
Gulfport Energy Corp. (a) | 74,400 | 4,917,840 | |
Halcon Resources Corp. (a) | 570,000 | 2,171,700 | |
Kodiak Oil & Gas Corp. (a) | 746,300 | 8,813,803 | |
Laredo Petroleum Holdings, Inc. (a) | 260,400 | 6,793,836 | |
Murphy Oil Corp. | 46,900 | 2,784,453 | |
Noble Energy, Inc. | 523,000 | 35,961,480 | |
Northern Oil & Gas, Inc. (a)(d) | 321,195 | 4,471,034 | |
PDC Energy, Inc. (a) | 165,000 | 10,251,450 | |
Pioneer Natural Resources Co. | 108,000 | 21,727,440 | |
Sanchez Energy Corp. (a)(d) | 199,100 | 5,931,189 | |
SM Energy Co. | 139,600 | 10,295,500 | |
Southwestern Energy Co. (a) | 542,200 | 22,414,548 | |
Common Stocks - continued | |||
Shares | Value | ||
OIL, GAS & CONSUMABLE FUELS - CONTINUED | |||
Oil & Gas Exploration & Production - continued | |||
Synergy Resources Corp. (a) | 159,600 | $ 1,690,164 | |
TAG Oil Ltd. (a) | 615,100 | 1,649,821 | |
Whiting Petroleum Corp. (a) | 54,400 | 3,737,824 | |
| 401,078,679 | ||
Oil & Gas Refining & Marketing - 5.5% | |||
Marathon Petroleum Corp. | 163,300 | 13,717,200 | |
Phillips 66 Co. | 207,900 | 15,563,394 | |
Valero Energy Corp. | 437,100 | 20,972,058 | |
World Fuel Services Corp. | 52,700 | 2,372,554 | |
| 52,625,206 | ||
Oil & Gas Storage & Transport - 6.0% | |||
Access Midstream Partners LP | 189,800 | 10,714,210 | |
Cheniere Energy, Inc. (a) | 157,400 | 7,780,282 | |
Magellan Midstream Partners LP | 48,500 | 3,281,995 | |
Markwest Energy Partners LP | 64,800 | 4,137,480 | |
MPLX LP | 114,400 | 5,583,864 | |
Phillips 66 Partners LP | 89,500 | 4,100,890 | |
SemGroup Corp. Class A | 30,000 | 2,019,600 | |
Targa Resources Corp. | 46,200 | 4,470,312 | |
The Williams Companies, Inc. | 336,600 | 13,901,580 | |
Valero Energy Partners LP | 36,800 | 1,361,232 | |
| 57,351,445 | ||
TOTAL OIL, GAS & CONSUMABLE FUELS | 623,731,971 | ||
PAPER & FOREST PRODUCTS - 1.4% | |||
Paper Products - 1.4% | |||
International Paper Co. | 269,200 | 13,161,188 | |
TOTAL COMMON STOCKS (Cost $824,983,173) |
| ||
Money Market Funds - 5.2% | |||
Shares | Value | ||
Fidelity Cash Central Fund, 0.10% (b) | 18,082,127 | $ 18,082,127 | |
Fidelity Securities Lending Cash Central Fund, 0.09% (b)(c) | 31,685,350 | 31,685,350 | |
TOTAL MONEY MARKET FUNDS (Cost $49,767,477) |
| ||
TOTAL INVESTMENT PORTFOLIO - 103.6% (Cost $874,750,650) | 983,785,845 |
NET OTHER ASSETS (LIABILITIES) - (3.6)% | (34,391,710) | ||
NET ASSETS - 100% | $ 949,394,135 | ||
Legend |
(a) Non-income producing |
(b) Affiliated fund that is generally available only to investment companies and other accounts managed by Fidelity Investments. The rate quoted is the annualized seven-day yield of the fund at period end. A complete unaudited listing of the fund's holdings as of its most recent quarter end is available upon request. In addition, each Fidelity Central Fund's financial statements, which are not covered by the Fund's Report of Independent Registered Public Accounting Firm, are available on the SEC's website or upon request. |
(c) Investment made with cash collateral received from securities on loan. |
(d) Security or a portion of the security is on loan at period end. |
Affiliated Central Funds |
Information regarding fiscal year to date income earned by the Fund from investments in Fidelity Central Funds is as follows: |
Fund | Income earned |
Fidelity Cash Central Fund | $ 15,454 |
Fidelity Securities Lending Cash Central Fund | 535,529 |
Total | $ 550,983 |
Other Information |
All investments are categorized as Level 1 under the Fair Value Hierarchy. The inputs or methodology used for valuing securities may not be an indication of the risk associated with investing in those securities. For more information on valuation inputs, please refer to the Investment Valuation section in the accompanying Notes to Financial Statements. |
Distribution of investments by country or territory of incorporation, as a percentage of total net assets, is as follows (Unaudited): |
United States of America | 82.5% |
Canada | 9.4% |
Curacao | 4.0% |
South Africa | 1.1% |
Bailiwick of Jersey | 1.0% |
Others (Individually Less Than 1%) | 2.0% |
| 100.0% |
See accompanying notes which are an integral part of the financial statements.
Annual Report
Natural Resources Portfolio
Financial Statements
Statement of Assets and Liabilities
| February 28, 2014 | |
|
|
|
Assets | ||
Investment in securities, at value (including securities loaned of $30,923,227) - See accompanying schedule: Unaffiliated issuers (cost $824,983,173) | $ 934,018,368 |
|
Fidelity Central Funds (cost $49,767,477) | 49,767,477 |
|
Total Investments (cost $874,750,650) |
| $ 983,785,845 |
Receivable for investments sold | 16,657,887 | |
Receivable for fund shares sold | 834,710 | |
Dividends receivable | 1,428,418 | |
Distributions receivable from Fidelity Central Funds | 3,761 | |
Prepaid expenses | 5,059 | |
Other receivables | 28,542 | |
Total assets | 1,002,744,222 | |
|
|
|
Liabilities | ||
Payable to custodian bank | $ 14 | |
Payable for investments purchased | 18,174,541 | |
Payable for fund shares redeemed | 2,825,137 | |
Accrued management fee | 424,347 | |
Other affiliated payables | 198,504 | |
Other payables and accrued expenses | 42,194 | |
Collateral on securities loaned, at value | 31,685,350 | |
Total liabilities | 53,350,087 | |
|
|
|
Net Assets | $ 949,394,135 | |
Net Assets consist of: |
| |
Paid in capital | $ 838,183,582 | |
Distributions in excess of net investment income | (205,092) | |
Accumulated undistributed net realized gain (loss) on investments and foreign currency transactions | 2,380,035 | |
Net unrealized appreciation (depreciation) on investments and assets and liabilities in foreign currencies | 109,035,610 | |
Net Assets, for 25,083,633 shares outstanding | $ 949,394,135 | |
Net Asset Value, offering price and redemption price per share ($949,394,135 ÷ 25,083,633 shares) | $ 37.85 | |
Statement of Operations
| Year ended February 28, 2014 | |
|
|
|
Investment Income |
|
|
Dividends |
| $ 13,101,899 |
Income from Fidelity Central Funds |
| 550,983 |
Total income |
| 13,652,882 |
|
|
|
Expenses | ||
Management fee | $ 5,499,929 | |
Transfer agent fees | 2,325,148 | |
Accounting and security lending fees | 336,180 | |
Custodian fees and expenses | 33,662 | |
Independent trustees' compensation | 18,958 | |
Registration fees | 29,764 | |
Audit | 53,264 | |
Legal | 16,506 | |
Interest | 1,380 | |
Miscellaneous | 12,100 | |
Total expenses before reductions | 8,326,891 | |
Expense reductions | (75,857) | 8,251,034 |
Net investment income (loss) | 5,401,848 | |
Realized and Unrealized Gain (Loss) Net realized gain (loss) on: | ||
Investment securities: |
|
|
Unaffiliated issuers | 113,060,079 | |
Foreign currency transactions | (142,982) | |
Total net realized gain (loss) |
| 112,917,097 |
Change in net unrealized appreciation (depreciation) on: Investment securities | 9,076,922 | |
Assets and liabilities in foreign currencies | 1,795 | |
Total change in net unrealized appreciation (depreciation) |
| 9,078,717 |
Net gain (loss) | 121,995,814 | |
Net increase (decrease) in net assets resulting from operations | $ 127,397,662 | |
See accompanying notes which are an integral part of the financial statements.
Annual Report
Statement of Changes in Net Assets
| Year ended | Year ended |
Increase (Decrease) in Net Assets |
|
|
Operations |
|
|
Net investment income (loss) | $ 5,401,848 | $ 10,229,731 |
Net realized gain (loss) | 112,917,097 | 7,080,422 |
Change in net unrealized appreciation (depreciation) | 9,078,717 | (85,369,970) |
Net increase (decrease) in net assets resulting from operations | 127,397,662 | (68,059,817) |
Distributions to shareholders from net investment income | (2,402,760) | (2,965,193) |
Distributions to shareholders from net realized gain | (22,192,850) | - |
Total distributions | (24,595,610) | (2,965,193) |
Share transactions | 202,197,233 | 206,073,881 |
Reinvestment of distributions | 23,551,043 | 2,845,421 |
Cost of shares redeemed | (433,697,922) | (513,976,231) |
Net increase (decrease) in net assets resulting from share transactions | (207,949,646) | (305,056,929) |
Redemption fees | 13,984 | 29,174 |
Total increase (decrease) in net assets | (105,133,610) | (376,052,765) |
|
|
|
Net Assets | ||
Beginning of period | 1,054,527,745 | 1,430,580,510 |
End of period (including distributions in excess of net investment income of $205,092 and distributions in excess of net investment income of $5,579,312, respectively) | $ 949,394,135 | $ 1,054,527,745 |
Other Information Shares | ||
Sold | 5,546,646 | 6,393,747 |
Issued in reinvestment of distributions | 649,501 | 88,101 |
Redeemed | (12,041,120) | (16,015,960) |
Net increase (decrease) | (5,844,973) | (9,534,112) |
Financial Highlights
Years ended February 28, | 2014 | 2013 | 2012 F | 2011 | 2010 |
Selected Per-Share Data |
|
|
|
|
|
Net asset value, beginning of period | $ 34.10 | $ 35.36 | $ 39.07 | $ 27.66 | $ 17.24 |
Income from Investment Operations |
|
|
|
|
|
Net investment income (loss) B | .20 | .28 | .20 | .12 | - G |
Net realized and unrealized gain (loss) | 4.52 | (1.45) | (3.59) | 11.49 | 10.54 |
Total from investment operations | 4.72 | (1.17) | (3.39) | 11.61 | 10.54 |
Distributions from net investment income | (.10) | (.09) | (.26) | (.11) | (.02) |
Distributions from net realized gain | (.88) | - | (.06) | (.09) | (.10) |
Total distributions | (.97) H | (.09) | (.32) | (.20) | (.12) |
Redemption fees added to paid in capital B, G | - | - | - | - | - |
Net asset value, end of period | $ 37.85 | $ 34.10 | $ 35.36 | $ 39.07 | $ 27.66 |
Total Return A | 13.97% | (3.30)% | (8.63)% | 42.09% | 61.13% |
Ratios to Average Net Assets C, E |
|
|
|
|
|
Expenses before reductions | .84% | .86% | .84% | .88% | .93% |
Expenses net of fee waivers, if any | .84% | .85% | .84% | .88% | .93% |
Expenses net of all reductions | .83% | .84% | .84% | .87% | .92% |
Net investment income (loss) | .54% | .89% | .58% | .39% | (.01)% |
Supplemental Data |
|
|
|
|
|
Net assets, end of period (000 omitted) | $ 949,394 | $ 1,054,528 | $ 1,430,581 | $ 1,971,764 | $ 1,484,857 |
Portfolio turnover rate D | 99% | 76% | 88% | 113% | 85% |
A Total returns would have been lower if certain expenses had not been reduced during the applicable periods shown.
B Calculated based on average shares outstanding during the period.
C Fees and expenses of any underlying Fidelity Central Funds are not included in the Fund's expense ratio. The Fund indirectly bears its proportionate share of the expenses of any underlying Fidelity Central Funds.
D Amount does not include the portfolio activity of any underlying Fidelity Central Funds.
E Expense ratios reflect operating expenses of the Fund. Expenses before reductions do not reflect amounts reimbursed by the investment adviser or reductions from brokerage service arrangements or reductions from other expense offset arrangements and do not represent the amount paid by the Fund during periods when reimbursements or reductions occur. Expenses net of fee waivers reflect expenses after reimbursement by the investment adviser but prior to reductions from brokerage service arrangements or other expense offset arrangements. Expenses net of all reductions represent the net expenses paid by the Fund.
F For the year ended February 29.
G Amount represents less than $.01 per share.
H Total distributions of $.97 per share is comprised of distributions from net investment income of $.095 and distributions from net realized gain of $.877 per share.
See accompanying notes which are an integral part of the financial statements.
Annual Report
Notes to Financial Statements
For the period ended February 28, 2014
1. Organization.
Energy Portfolio, Energy Service Portfolio, Natural Gas Portfolio and Natural Resources Portfolio (the Funds) are funds of Fidelity Select Portfolios (the Trust). Energy Portfolio, Energy Service Portfolio and Natural Gas Portfolio are non-diversified funds. The Trust is registered under the Investment Company Act of 1940, as amended (the 1940 Act), as an open-end management investment company organized as a Massachusetts business trust. The Funds invest primarily in securities of companies whose principal business activities fall within specific industries. Each Fund is authorized to issue an unlimited number of shares. Certain Funds' investments in emerging markets can be subject to social, economic, regulatory, and political uncertainties and can be extremely volatile. The Natural Resources Portfolio may also invest in certain precious metals.
2. Investments in Fidelity Central Funds.
The Funds invest in Fidelity Central Funds, which are open-end investment companies generally available only to other investment companies and accounts managed by the investment adviser and its affiliates. The Funds' Schedules of Investments list each of the Fidelity Central Funds held as of period end, if any, as an investment of each Fund, but do not include the underlying holdings of each Fidelity Central Fund. As an Investing Fund, each Fund indirectly bears its proportionate share of the expenses of the underlying Fidelity Central Funds.
The Money Market Central Funds seek preservation of capital and current income and are managed by Fidelity Investments Money Management, Inc. (FIMM), an affiliate of the investment adviser. Annualized expenses of the Money Market Central Funds as of their most recent shareholder report date are less than .01%.
A complete unaudited list of holdings for each Fidelity Central Fund is available upon request or at the Securities and Exchange Commission (the SEC) website at www.sec.gov. In addition, the financial statements of the Fidelity Central Funds, which are not covered by the Funds' Report of Independent Registered Public Accounting Firm, are available on the SEC website or upon request.
3. Significant Accounting Policies.
The financial statements have been prepared in conformity with accounting principles generally accepted in the United States of America (GAAP), which require management to make certain estimates and assumptions at the date of the financial statements. Actual results could differ from those estimates. Subsequent events, if any, through the date that the financial statements were issued have been evaluated in the preparation of the financial statements. The following summarizes the significant accounting policies of the Funds:
Investment Valuation. Investments are valued as of 4:00 p.m. Eastern time on the last calendar day of the period. In accordance with valuation policies and procedures approved by the Board of Trustees (the Board), each Fund attempts to obtain prices from one or more third party pricing vendors or brokers to value its investments. When current market prices, quotations or currency exchange rates are not readily available or reliable, investments will be fair valued in good faith by the Fidelity SelectCo, LLC (SelectCo) Fair Value Committee (the Committee), in accordance with procedures adopted by the Board. Factors used in determining fair value vary by investment type and may include market or investment specific events, changes in interest rates and credit quality. The frequency with which these procedures are used cannot be predicted and they may be utilized to a significant extent. The Committee oversees each Fund's valuation policies and procedures and is responsible for approving and reporting to the Board all fair value determinations.
Each Fund categorizes the inputs to valuation techniques used to value their investments into a disclosure hierarchy consisting of three levels as shown below:
Level 1 - quoted prices in active markets for identical investments
Level 2 - other significant observable inputs (including quoted prices for similar investments, interest rates, prepayment speeds, etc.)
Level 3 - unobservable inputs (including the Fund's own assumptions based on the best information available)
Valuation techniques used to value each Fund's investments by major category are as follows:
Equity securities, including restricted securities, for which market quotations are readily available, are valued at the last reported sale price or official closing price as reported by a third party pricing vendor on the primary market or exchange on which they are traded and are categorized as Level 1 in the hierarchy. In the event there were no sales during the day or closing prices are not available, securities are valued at the last quoted bid price or may be valued using the last available price and are generally categorized as Level 2 in the hierarchy. For foreign equity securities, when market or security specific events arise, comparisons to the valuation of American Depositary Receipts (ADRs), futures contracts, Exchange-Traded Funds (ETFs) and certain indexes as well as quoted prices for similar securities may be used and would be categorized as Level 2 in the hierarchy. Utilizing these techniques may result in transfers between Level 1 and Level 2. For equity securities, including restricted securities, where observable inputs are limited, assumptions about market activity and risk are used and these securities may be categorized as Level 3 in the hierarchy.
Annual Report
3. Significant Accounting Policies - continued
Investment Valuation - continued
Debt securities, including restricted securities, are valued based on evaluated prices received from third party pricing vendors or from brokers who make markets in such securities. Corporate bonds are valued by pricing vendors who utilize matrix pricing which considers yield or price of bonds of comparable quality, coupon, maturity and type or by broker-supplied prices. When independent prices are unavailable or unreliable, debt securities may be valued utilizing pricing methodologies which consider similar factors that would be used by third party pricing vendors. Debt securities are generally categorized as Level 2 in the hierarchy but may be Level 3 depending on the circumstances.
Investments in open-end mutual funds, including the Fidelity Central Funds, are valued at their closing net asset value (NAV) each business day and are categorized as Level 1 in the hierarchy.
Changes in valuation techniques may result in transfers in or out of an assigned level within the disclosure hierarchy. The aggregate value of investments by input level, as of February 28, 2014, is included at the end of each applicable Fund's Schedule of Investments.
Foreign Currency. The Funds may use foreign currency contracts to facilitate transactions in foreign-denominated securities. Gains and losses from these transactions may arise from changes in the value of the foreign currency or if the counterparties do not perform under the contracts' terms.
Foreign-denominated assets, including investment securities, and liabilities are translated into U.S. dollars at the exchange rates at period end. Purchases and sales of investment securities, income and dividends received and expenses denominated in foreign currencies are translated into U.S. dollars at the exchange rate in effect on the transaction date.
The effects of exchange rate fluctuations on investments are included with the net realized and unrealized gain (loss) on investment securities. Other foreign currency transactions resulting in realized and unrealized gain (loss) are disclosed separately.
Investment Transactions and Income. For financial reporting purposes, the Funds' investment holdings and NAV include trades executed through the end of the last business day of the period. The NAV per share for processing shareholder transactions is calculated as of the close of business of the New York Stock Exchange (NYSE), normally 4:00 p.m. Eastern time and includes trades executed through the end of the prior business day. Gains and losses on securities sold are determined on the basis of identified cost and may include proceeds received from litigation. Dividend income is recorded on the ex-dividend date, except for certain dividends from foreign securities where the ex-dividend date may have passed, which are recorded as soon as the Funds are informed of the ex-dividend date. Non-cash dividends included in dividend income, if any, are recorded at the fair market value of the securities received. Distributions received on securities that represent a return of capital or capital gain are recorded as a reduction of cost of investments and/or as a realized gain. Subsequent to ex-dividend date the Funds determine the components of these distributions, based upon receipt of tax filings or other correspondence relating to the underlying investment. Interest income and distributions from the Fidelity Central Funds are accrued as earned. Interest income includes coupon interest and amortization of premium and accretion of discount on debt securities. Investment income is recorded net of foreign taxes withheld where recovery of such taxes is uncertain.
Expenses. Expenses directly attributable to a fund are charged to that fund. Expenses attributable to more than one fund are allocated among the respective funds on the basis of relative net assets or other appropriate methods. Expense estimates are accrued in the period to which they relate and adjustments are made when actual amounts are known.
Income Tax Information and Distributions to Shareholders. Each year, each Fund intends to qualify as a regulated investment company under Subchapter M of the Internal Revenue Code, including distributing substantially all of its taxable income and realized gains. As a result, no provision for U.S. Federal income taxes is required. As of February 28, 2014, each Fund did not have any unrecognized tax benefits in the financial statements; nor is each Fund aware of any tax positions for which it is reasonably possible that the total amounts of unrecognized tax benefits will significantly change in the next twelve months. Each Fund files a U.S. federal tax return, in addition to state and local tax returns as required. The Fund's federal income tax returns are subject to examination by the Internal Revenue Service (IRS) for a period of three fiscal years after they are filed. State and local tax returns may be subject to examination for an additional fiscal year depending on the jurisdiction. Foreign taxes are provided for based on each Fund's understanding of the tax rules and rates that exist in the foreign markets in which it invests.
Distributions are declared and recorded on the ex-dividend date. Income and capital gain distributions are determined in accordance with income tax regulations, which may differ from GAAP. In addition, certain Funds claimed a portion of the payment made to redeeming shareholders as a distribution for income tax purposes.
Capital accounts within the financial statements are adjusted for permanent book-tax differences. These adjustments have no impact on net assets or the results of operations. Capital accounts are not adjusted for temporary book-tax differences which will reverse in a subsequent period.
Book-tax differences are primarily due to foreign currency transactions, passive foreign investment companies (PFIC), partnerships, deferred trustees compensation, capital loss carryforwards and losses deferred due to wash sales and excise tax regulations.
Annual Report
Notes to Financial Statements - continued
3. Significant Accounting Policies - continued
Income Tax Information and Distributions to Shareholders - continued
The federal tax cost of investment securities and unrealized appreciation (depreciation) as of period end were as follows for each Fund:
| Tax cost | Gross unrealized | Gross unrealized | Net unrealized |
Energy Portfolio | $ 1,599,927,756 | $ 463,292,029 | $ (34,923,515) | $ 428,368,514 |
Energy Service Portfolio | 692,676,924 | 369,963,256 | (10,272,226) | 359,691,030 |
Natural Gas Portfolio | 807,522,313 | 73,311,243 | (20,207,799) | 53,103,444 |
Natural Resources Portfolio | 877,809,734 | 161,124,420 | (55,148,309) | 105,976,111 |
The tax-based components of distributable earnings as of period end were as follows for each Fund:
| Undistributed | Undistributed | Capital loss | Net unrealized appreciation |
Energy Portfolio | $ 3,174,559 | $ 101,254,008 | $ - | $ 428,372,009 |
Energy Service Portfolio | 268,005 | 36,512,591 | - | 359,692,427 |
Natural Gas Portfolio | 1,536,689 | - | (344,792,492) | 53,100,299 |
Natural Resources Portfolio | 80,745 | 5,439,119 | - | 105,976,526 |
Capital loss carryforwards are only available to offset future capital gains of the Fund to the extent provided by regulations and may be limited. Under the Regulated Investment Company Modernization Act of 2010 (the Act), the Fund is permitted to carry forward capital losses incurred in taxable years beginning after December 22, 2010 for an unlimited period and such capital losses are required to be used prior to any losses that expire. The capital loss carryforward information presented below, including any applicable limitation, is estimated as of fiscal period end and is subject to adjustment.
| Fiscal year of expiration | ||
| 2018 | 2019 | Total with expiration |
Natural Gas Portfolio | $ (129,039,784) | $ (215,752,708) | $ (344,792,492) |
Certain of the Funds intend to elect to defer to the next fiscal year capital losses recognized during the period November 1, 2013 to February 28, 2014. Loss deferrals were as follows:
| Capital losses |
Energy Portfolio | $ (8,016,307) |
Natural Gas Portfolio | (4,653,113) |
The tax character of distributions paid was as follows:
February 28, 2014 |
|
|
|
| Ordinary Income | Long-term | Total |
Energy Portfolio | $ 58,207,320 | $ 161,950,874 | $ 220,158,194 |
Energy Service Portfolio | 2,225,534 | - | 2,225,534 |
Natural Gas Portfolio | 11,985,807 | - | 11,985,807 |
Natural Resources Portfolio | 2,402,760 | 22,192,850 | 24,595,610 |
February 28, 2013 |
|
|
|
| Ordinary Income | Long-term | Total |
Energy Portfolio | $ 18,731,365 | $ 14,385,264 | $ 33,116,629 |
Natural Gas Portfolio | 6,619,910 | - | 6,619,910 |
Natural Resources Portfolio | 2,965,193 | - | 2,965,193 |
Annual Report
3. Significant Accounting Policies - continued
Trading (Redemption) Fees. Shares held by investors in the Funds less than 30 days may be subject to a redemption fee equal to .75% of the NAV of shares redeemed. All redemption fees, which reduce the proceeds of the shareholder redemption, are retained by the Funds and accounted for as an addition to paid in capital.
Restricted Securities. The Funds may invest in securities that are subject to legal or contractual restrictions on resale. These securities generally may be resold in transactions exempt from registration or to the public if the securities are registered. Disposal of these securities may involve time-consuming negotiations and expense, and prompt sale at an acceptable price may be difficult. Information regarding restricted securities is included at the end of each applicable Fund's Schedule of Investments.
4. Purchases and Sales of Investments.
Purchases and sales of securities, other than short-term securities, are noted in the table below.
| Purchases ($) | Sales ($) |
Energy Portfolio | 1,963,871,207 | 2,404,145,949 |
Energy Service Portfolio | 376,976,641 | 713,552,837 |
Natural Gas Portfolio | 931,470,985 | 876,656,823 |
Natural Resources Portfolio | 971,491,164 | 1,204,290,673 |
5. Fees and Other Transactions with Affiliates.
Management Fee. Effective August 1, 2013, SelectCo replaced Fidelity Management and Research Company (FMR), an affiliate of SelectCo, as investment adviser to the Funds. The investment adviser and its affiliates provide the Funds with investment management related services for which the Funds pay a monthly management fee. The management fee is the sum of an individual fund fee rate and an annualized group fee rate. The individual fund fee rate is applied to each Fund's average net assets. The group fee rate is based upon the average net assets of all the mutual funds advised by FMR and the investment adviser. The group fee rate decreases as assets under management increase and increases as assets under management decrease. For the reporting period, each Fund's annual management fee rate expressed as a percentage of each Fund's average net assets was as follows.
| Individual Rate | Group Rate | Total |
Energy Portfolio | .30% | .25% | .55% |
Energy Service Portfolio | .30% | .25% | .55% |
Natural Gas Portfolio | .30% | .25% | .55% |
Natural Resources Portfolio | .30% | .25% | .55% |
Transfer Agent Fees. Fidelity Investments Institutional Operations Company, Inc. (FIIOC), an affiliate of the investment adviser, is the Funds' transfer, dividend disbursing and shareholder servicing agent. FIIOC receives account fees and asset-based fees that vary according to account size and type of account. FIIOC pays for typesetting, printing and mailing of shareholder reports, except proxy statements. For the period, transfer agent fees were equivalent to the following annual rates expressed as a percentage of average net assets:
Energy Portfolio | .21% |
Energy Service Portfolio | .20% |
Natural Gas Portfolio | .23% |
Natural Resources Portfolio | .23% |
Accounting and Security Lending Fees. Fidelity Service Company, Inc. (FSC), an affiliate of the investment adviser, maintains each Fund's accounting records. The accounting fee is based on the level of average net assets for each month. Under a separate contract, FSC administers the security lending program. The security lending fee is based on the number and duration of lending transactions.
Brokerage Commissions. Certain Funds placed a portion of their portfolio transactions with brokerage firms which are affiliates of the investment adviser. Brokerage commissions are included in net realized gain (loss) and change in net unrealized appreciation (depreciation) in the Statement of Operations. The commissions paid to these affiliated firms were as follows:
| Amount |
Energy Portfolio | $ 57,745 |
Energy Service Portfolio | 22,499 |
Natural Gas Portfolio | 18,733 |
Natural Resources Portfolio | 29,398 |
Annual Report
Notes to Financial Statements - continued
5. Fees and Other Transactions with Affiliates - continued
Interfund Lending Program. Pursuant to an Exemptive Order issued by the SEC, the Funds, along with other registered investment companies having management contracts with FMR or other affiliated entities of FMR, may participate in an interfund lending program. This program provides an alternative credit facility allowing the funds to borrow from, or lend money to, other participating affiliated funds. At period end, there were no interfund loans outstanding. Each applicable fund's activity in this program during the period for which loans were outstanding was as follows:
| Borrower or | Average Loan | Weighted Average | Interest Expense |
Energy Portfolio | Borrower | $ 8,889,189 | .33% | $ 3,017 |
Energy Service Portfolio | Borrower | 15,602,375 | .32% | 3,284 |
Natural Gas Portfolio | Borrower | 8,894,500 | .33% | 164 |
Natural Resources Portfolio | Borrower | 15,535,600 | .32% | 1,380 |
6. Committed Line of Credit.
Certain Funds participate with other funds managed by the investment adviser or an affiliate in a $4.25 billion credit facility (the "line of credit") to be utilized for temporary or emergency purposes to fund shareholder redemptions or for other short-term liquidity purposes. The participating funds have agreed to pay commitment fees on their pro-rata portion of the line of credit, which are reflected in Miscellaneous expenses on the Statement of Operations, and are as follows:
Energy Portfolio | $ 4,158 |
Energy Service Portfolio | 2,320 |
Natural Gas Portfolio | 1,307 |
Natural Resources Portfolio | 2,056 |
During the period, there were no borrowings on this line of credit.
7. Security Lending.
Certain Funds lend portfolio securities through a lending agent from time to time in order to earn additional income. For equity securities, a lending agent is used and may loan securities to certain qualified borrowers, which prior to August 1, 2013 included Fidelity Capital Markets (FCM), a broker-dealer affiliated with the Funds. On the settlement date of the loan, each applicable Fund receives collateral (in the form of U.S. Treasury obligations, letters of credit and/or cash) against the loaned securities and maintains collateral in an amount not less than 100% of the market value of the loaned securities during the period of the loan. The market value of the loaned securities is determined at the close of business of the Funds and any additional required collateral is delivered to the Funds on the next business day. If the borrower defaults on its obligation to return the securities loaned because of insolvency or other reasons, the Funds may apply collateral received from the borrower against the obligation. The Funds may experience delays and costs in recovering the securities loaned. Any cash collateral received is invested in the Fidelity Securities Lending Cash Central Fund. The value of loaned securities and cash collateral at period end are disclosed on each applicable Fund's Statement of Assets and Liabilities. Security lending income represents the income earned on investing cash collateral, less rebates paid to borrowers and any lending agent fees associated with the loan, plus any premium payments received for lending certain types of securities. Security lending income is presented on each applicable Fund's Statement of Operations as a component of income from Fidelity Central Funds.
Security lending activity was as follows:
| Total Security Lending Income |
Energy Portfolio | $ 782,690 |
Energy Service Portfolio | 12,321 |
Natural Gas Portfolio | 308,623 |
Natural Resources Portfolio | 535,529 |
8. Bank Borrowings.
Each Fund is permitted to have bank borrowings for temporary or emergency purposes to fund shareholder redemptions or for other short-term liquidity requirements. Each Fund has established borrowing arrangements with certain banks. The interest rate on the borrowings is the bank's base rate, as revised from time to time. At period end, there were no bank borrowings outstanding. Each applicable Fund's activity in this program during the period for which loans were outstanding was as follows:
| Average Loan | Weighted Average | Interest Expense |
Energy Portfolio | $ 10,008,333 | .64% | $ 1,074 |
Energy Service Portfolio | 14,648,375 | .59% | 1,920 |
Annual Report
9. Expense Reductions.
Commissions paid to certain brokers with whom the investment adviser, or its affiliates, places trades on behalf of Certain Funds include an amount in addition to trade execution, which may be rebated back to the Funds to offset certain expenses. In addition, through arrangements with each applicable Fund's custodian, credits realized as a result of uninvested cash balances were used to reduce each applicable Fund's expenses. All of the applicable expense reductions are noted in the table below.
| Brokerage Service | Custody |
Energy Portfolio | $ 114,871 | $ - |
Energy Service Portfolio | 54,780 | 2 |
Natural Gas Portfolio | 57,739 | 30 |
Natural Resources Portfolio | 66,997 | - |
In addition, FMR reimbursed a portion of each Fund's operating expenses during the period as follows:
| Reimbursement |
Energy Portfolio | $ 14,629 |
Energy Service Portfolio | 8,869 |
Natural Gas Portfolio | 3,863 |
Natural Resources Portfolio | 8,860 |
10. Other.
The Funds' organizational documents provide former and current trustees and officers with a limited indemnification against liabilities arising in connection with the performance of their duties to the Funds. In the normal course of business, the Funds may also enter into contracts that provide general indemnifications. The Funds' maximum exposure under these arrangements is unknown as this would be dependent on future claims that may be made against the Funds. The risk of material loss from such claims is considered remote.
At the end of the period, Strategic Advisers U.S. Opportunity Fund was the owner of record of approximately 18% of the total outstanding shares of Natural Gas Portfolio. Mutual funds managed by the investment adviser or its affiliates were the owners of record, in the aggregate, of approximately 22% of the total outstanding shares of Natural Gas Portfolio.
Annual Report
Report of Independent Registered Public Accounting Firm
To the Trustees of Fidelity Select Portfolios and the Shareholders of Energy Portfolio, Energy Service Portfolio, Natural Gas Portfolio and Natural Resources Portfolio:
In our opinion, the accompanying statements of assets and liabilities, including the schedules of investments, and the related statements of operations and of changes in net assets and the financial highlights present fairly, in all material respects, the financial positions of Energy Portfolio, Energy Service Portfolio, Natural Gas Portfolio and Natural Resources Portfolio (funds of Fidelity Select Portfolios) at February 28, 2014, the results of each of their operations for the year then ended, the changes in each of their net assets for each of the two years in the period then ended and the financial highlights for each of the five years in the period then ended, in conformity with accounting principles generally accepted in the United States of America. These financial statements and financial highlights (hereafter referred to as "financial statements") are the responsibility of the Fidelity Select Portfolios' management. Our responsibility is to express an opinion on these financial statements based on our audits. We conducted our audits of these financial statements in accordance with the standards of the Public Company Accounting Oversight Board (United States). Those standards require that we plan and perform the audit to obtain reasonable assurance about whether the financial statements are free of material misstatement. An audit includes examining, on a test basis, evidence supporting the amounts and disclosures in the financial statements, assessing the accounting principles used and significant estimates made by management, and evaluating the overall financial statement presentation. We believe that our audits, which included confirmation of securities at February 28, 2014 by correspondence with the custodian and brokers, provide a reasonable basis for our opinion.
PricewaterhouseCoopers LLP
Boston, Massachusetts
April 14, 2014
Annual Report
Trustees and Officers
The Trustees and officers of the trust and funds, as applicable, are listed below. The Board of Trustees governs each fund and is responsible for protecting the interests of shareholders. The Trustees are experienced executives who meet periodically throughout the year to oversee each fund's activities, review contractual arrangements with companies that provide services to each fund, oversee management of the risks associated with such activities and contractual arrangements, and review each fund's performance. Except for Ned C. Lautenbach and William S. Stavropoulos, each of the Trustees oversees 74 funds. Mr. Lautenbach and Mr. Stavropoulos each oversees 246 funds.
The Trustees hold office without limit in time except that (a) any Trustee may resign; (b) any Trustee may be removed by written instrument, signed by at least two-thirds of the number of Trustees prior to such removal; (c) any Trustee who requests to be retired or who has become incapacitated by illness or injury may be retired by written instrument signed by a majority of the other Trustees; and (d) any Trustee may be removed at any special meeting of shareholders by a two-thirds vote of the outstanding voting securities of the trust. The officers hold office without limit in time, except that any officer may resign or may be removed by a vote of a majority of the Trustees at any regular meeting or any special meeting of the Trustees. Except as indicated, each individual has held the office shown or other offices in the same company for the past five years.
Experience, Skills, Attributes, and Qualifications of the Funds' Trustees. The Governance and Nominating Committee has adopted a statement of policy that describes the experience, qualifications, attributes, and skills that are necessary and desirable for potential Independent Trustee candidates (Statement of Policy). The Board believes that each Trustee satisfied at the time he or she was initially elected or appointed a Trustee, and continues to satisfy, the standards contemplated by the Statement of Policy. The Governance and Nominating Committee also engages professional search firms to help identify potential Independent Trustee candidates who have the experience, qualifications, attributes, and skills consistent with the Statement of Policy. From time to time, additional criteria based on the composition and skills of the current Independent Trustees, as well as experience or skills that may be appropriate in light of future changes to board composition, business conditions, and regulatory or other developments, have also been considered by the professional search firms and the Governance and Nominating Committee. In addition, the Board takes into account the Trustees' commitment and participation in Board and committee meetings, as well as their leadership of standing and ad hoc committees throughout their tenure.
In determining that a particular Trustee was and continues to be qualified to serve as a Trustee, the Board has considered a variety of criteria, none of which, in isolation, was controlling. The Board believes that, collectively, the Trustees have balanced and diverse experience, qualifications, attributes, and skills, which allow the Board to operate effectively in governing each fund and protecting the interests of shareholders. Information about the specific experience, skills, attributes, and qualifications of each Trustee, which in each case led to the Board's conclusion that the Trustee should serve (or continue to serve) as a trustee of the funds, is provided below.
Board Structure and Oversight Function. Brian B. Hogan is an interested person (as defined in the 1940 Act) and currently serves as Chairman. The Trustees have determined that an interested Chairman is appropriate and benefits shareholders because an interested Chairman has a personal and professional stake in the quality and continuity of services provided to the funds. Independent Trustees exercise their informed business judgment to appoint an individual of their choosing to serve as Chairman, regardless of whether the Trustee happens to be independent or a member of management. The Independent Trustees have determined that they can act independently and effectively without having an Independent Trustee serve as Chairman and that a key structural component for assuring that they are in a position to do so is for the Independent Trustees to constitute a substantial majority for the Board. The Independent Trustees also regularly meet in executive session. Michael E. Wiley serves as Chairman of the Independent Trustees and as such (i) acts as a liaison between the Independent Trustees and management with respect to matters important to the Independent Trustees and (ii) with management prepares agendas for Board meetings.
Fidelity funds are overseen by different Boards of Trustees. The funds' Board oversees Fidelity's sector portfolios. Other Boards oversee Fidelity's equity and high income funds, and Fidelity's investment grade bond, money market, and asset allocation funds. The use of separate Boards, each with its own committee structure, allows the Trustees of each group of Fidelity funds to focus on the unique issues of the funds they oversee, including common research, investment, and operational issues. On occasion, the separate Boards establish joint committees to address issues of overlapping consequences for the Fidelity funds overseen by each Board.
The Trustees operate using a system of committees to facilitate the timely and efficient consideration of all matters of importance to the Trustees, each fund, and fund shareholders and to facilitate compliance with legal and regulatory requirements and oversight of the funds' activities and associated risks. The Board, acting through its committees, has charged SelectCo and its affiliates with (i) identifying events or circumstances the occurrence of which could have demonstrably adverse effects on the funds' business and/or reputation; (ii) implementing processes and controls to lessen the possibility that such events or circumstances occur or to mitigate the effects of such events or circumstances if they do occur; and (iii) creating and maintaining a system designed to evaluate continuously business and market conditions in order to facilitate the identification and implementation processes described in (i) and (ii) above. Because the day-to-day operations and activities of the funds are carried out by or through SelectCo, its affiliates, and other service providers, the funds' exposure to risks is mitigated but not eliminated by the processes overseen by the Trustees. While each of the Board's committees has responsibility for overseeing different aspects of the funds' activities, oversight is exercised primarily through the Operations and Audit Committees. Appropriate personnel, including but not limited to the funds' Chief Compliance Officer (CCO), SelectCo's internal auditor, the independent accountants, the funds' Treasurer and portfolio management personnel, make periodic reports to the Board's committees, as appropriate. The responsibilities of each standing committee, including their oversight responsibilities, are described further under "Standing Committees of the Funds' Trustees."
The funds' Statement of Additional Information (SAI) includes more information about the Trustees. To request a free copy, call Fidelity at 1-800-544-8544.
Annual Report
Trustees and Officers - continued
Interested Trustee*:
Correspondence intended for the Trustee who is an interested person may be sent to Fidelity Investments, 245 Summer Street, Boston, Massachusetts 02210.
Name, Year of Birth; Principal Occupations and Other Relevant Experience+ | |
Brian B. Hogan (1964) | |
Year of Election or Appointment: 2014 Trustee Chairman of the Board of Trustees | |
| Mr. Hogan also serves as Trustee or Vice President of other funds. Mr. Hogan serves as President of FMR's Equity Division (2009-present). Previously, Mr. Hogan served as Senior Vice President, Equity Research of FMR (2006-2009) and as a portfolio manager. |
* Trustee has been determined to be an "Interested Trustee" by virtue of, among other things, his affiliation with the trust or various entities under common control with SelectCo.
+ The information above includes the Trustee's principal occupation during the last five years and other information relating to the experience, attributes, and skills relevant to the Trustee's qualifications to serve as a Trustee, which led to the conclusion that the Trustee should serve as a Trustee for each fund.
Independent Trustees:
Correspondence intended for each Independent Trustee (that is, the Trustees other than the Interested Trustee) may be sent to Fidelity Investments, P.O. Box 55235, Boston, Massachusetts 02205-5235.
Name, Year of Birth; Principal Occupations and Other Relevant Experience+ | |
Ned C. Lautenbach (1944) | |
Year of Election or Appointment: 2000 Trustee | |
| Mr. Lautenbach also serves as Trustee of other Fidelity funds. Mr. Lautenbach currently serves as the Lead Director of the Eaton Corporation Board of Directors (diversified industrial, 1997-present). Mr. Lautenbach is Chairman of the Board of Directors of the Philharmonic Center for the Arts in Naples, Florida (2012-present) and a member of the Council on Foreign Relations (1994-present). Previously, Mr. Lautenbach was a Partner/Advisory Partner at Clayton, Dubilier & Rice, LLC (private equity investment, 1998-2010), as well as a Director of Sony Corporation (2006-2007). |
David A. Rosow (1942) | |
Year of Election or Appointment: 2013 Trustee | |
| Mr. Rosow also serves as Trustee of other Fidelity funds. Mr. Rosow is Chairman and Chief Executive Officer of International Golf Group, Inc. (golf course development, 1989-present). Previously, Mr. Rosow served as Chairman and Chief Executive Officer of Rosow & Company, Inc. (private investment company, 1989-2011), a Lead Director of Hudson United Bancorp (2001-2006) and as a Director of TD Banknorth (1996-2006). In addition, Mr. Rosow is a member (2008-present) and President (2009-present) of the Town Council of Palm Beach, Florida. Mr. Rosow served as a Member of the Advisory Board of other Fidelity funds (2012-2013). |
Garnett A. Smith (1947) | |
Year of Election or Appointment: 2013 Trustee | |
| Mr. Smith also serves as Trustee of other Fidelity funds. Prior to Mr. Smith's retirement, he served as Chairman and Chief Executive Officer of Inbrand Corp. (manufacturer of personal absorbent products, 1990-1997). He also served as President (1986-1990) of Inbrand Corp. Prior to his employment with Inbrand Corp., he was employed by a retail fabric chain and North Carolina National Bank. In addition, Mr. Smith is a board member of the Jackson Hole Land Trust (2009-present). Mr. Smith served as a Member of the Advisory Board of other Fidelity funds (2012-2013). |
William S. Stavropoulos (1939) | |
Year of Election or Appointment: 2001 Trustee | |
| Mr. Stavropoulos also serves as Trustee of other Fidelity funds. Mr. Stavropoulos serves as President and Founder of the Michigan Baseball Foundation, the Great Lakes Loons (2007-present). Mr. Stavropoulos is Chairman Emeritus of the Board of Directors of The Dow Chemical Company, where he previously served in numerous senior management positions, including President, CEO (1995-2000; 2002-2004), Chairman of the Executive Committee (2000-2006), and as a member of the Board of Directors (1990-2006). Currently, Mr. Stavropoulos is Chairman of the Board of Directors of Univar Inc. (global distributor of commodity and specialty chemicals), a Director of Teradata Corporation (data warehousing and technology solutions), and Maersk Inc. (industrial conglomerate), and a member of the Advisory Board for Metalmark Capital LLC (private equity investment, 2005-present). Mr. Stavropoulos is an operating advisor to Clayton, Dubilier & Rice, LLC (private equity investment). In addition, Mr. Stavropoulos is a member of the University of Notre Dame Advisory Council for the College of Science, a Trustee of the Rollin L. Gerstacker Foundation, and a Director of the Naples Philharmonic Center for the Arts. Previously, Mr. Stavropoulos served as a Director of Chemical Financial Corporation (bank holding company, 1993-2012) and Tyco International, Ltd. (multinational manufacturing and services, 2007-2012). |
Michael E. Wiley (1950) | |
Year of Election or Appointment: 2008 Trustee Chairman of the Independent Trustees | |
| Mr. Wiley also serves as Trustee of other Fidelity funds. Mr. Wiley serves as a Director of Asia Pacific Exploration Consolidated (international oil and gas exploration and production, 2008-present). Mr. Wiley serves as a Director of Tesoro Corporation (independent oil refiner and marketer, 2005-present), and a Director of Bill Barrett Corporation (exploration and production, 2005-present). In addition, Mr. Wiley also serves as a Director of Post Oak Bank (privately-held bank, 2004-present). Previously, Mr. Wiley served as a Trustee of other Fidelity funds (2008-2013), as a member of the Board of Trustees of the University of Tulsa (2000-2006; 2007-2010), as a Senior Energy Advisor of Katzenbach Partners, LLC (consulting, 2006-2007), as an Advisory Director of Riverstone Holdings (private investment), Chairman, President, and CEO of Baker Hughes, Inc. (oilfield services, 2000-2004), and as Director of Spinnaker Exploration Company (exploration and production, 2001-2005). |
+ The information above includes each Trustee's principal occupation during the last five years and other information relating to the experience, attributes, and skills relevant to each Trustee's qualifications to serve as a Trustee, which led to the conclusion that each Trustee should serve as a Trustee for each fund.
Officers:
Except for Anthony R. Rochte, correspondence intended for each officer may be sent to Fidelity Investments, 245 Summer Street, Boston, Massachusetts 02210. Correspondence intended for Mr. Rochte may be sent to SelectCo, 1225 17th Street, Denver, Colorado 80202-5541. Officers appear below in alphabetical order.
Name, Year of Birth; Principal Occupation | |
Christopher S. Bartel (1971) | |
Year of Election or Appointment: 2009 Vice President | |
| Mr. Bartel also serves as Vice President of other funds. Mr. Bartel serves as a Director, President, and Chief Executive Officer of Fidelity Management & Research (Japan) Inc. (2012-present), a Director of Fidelity Management & Research (Hong Kong) (2012-present), and Senior Vice President of Global Equity Research (2010-present). Previously, Mr. Bartel served as Senior Vice President of Equity Research (2009-2010), Managing Director of Research (2006-2009), and an analyst and portfolio manager (2000-2006). |
Elizabeth Paige Baumann (1968) | |
Year of Election or Appointment: 2012 Anti-Money Laundering (AML) Officer | |
| Ms. Baumann also serves as AML Officer of other funds. She is Chief AML Officer of FMR LLC (2012-present) and is an employee of Fidelity Investments. Previously, Ms. Baumann served as Vice President and Deputy Anti-Money Laundering Officer (2007-2012). |
Marc Bryant (1966) | |
Year of Election or Appointment: 2013 Secretary | |
| Mr. Bryant also serves as an officer of other funds. He is Senior Vice President and Deputy General Counsel of FMR LLC. Prior to joining Fidelity Investments, Mr. Bryant served as a Senior Vice President and the Head of Global Retail Legal for AllianceBernstein L.P. (2006-2010), and as the General Counsel for ProFund Advisors LLC (2001-2006). |
William C. Coffey (1969) | |
Year of Election or Appointment: 2009 Assistant Secretary | |
| Mr. Coffey also serves as Assistant Secretary of other funds. He is Senior Vice President and Deputy General Counsel of FMR LLC (2010-present), and is an employee of Fidelity Investments. Previously, Mr. Coffey served as Vice President and Associate General Counsel of FMR LLC (2005-2009). |
Jonathan Davis (1968) | |
Year of Election or Appointment: 2010 Assistant Treasurer | |
| Mr. Davis also serves as Assistant Treasurer of other funds. Mr. Davis is an employee of Fidelity Investments. Previously, Mr. Davis served as Vice President and Associate General Counsel of FMR LLC (2003-2010). |
Adrien E. Deberghes (1967) | |
Year of Election or Appointment: 2013 President and Treasurer | |
| Mr. Deberghes also serves as an officer of other funds. He is an employee of Fidelity Investments (2008-present). Prior to joining Fidelity Investments, Mr. Deberghes was Senior Vice President of Mutual Fund Administration at State Street Corporation (2007-2008), Senior Director of Mutual Fund Administration at Investors Bank & Trust (2005-2007), and Director of Finance for Dunkin' Brands (2000-2005). |
Stephanie J. Dorsey (1969) | |
Year of Election or Appointment: 2010 Assistant Treasurer | |
| Ms. Dorsey also serves as an officer of other funds. She is an employee of Fidelity Investments (2008-present) and has served in other fund officer roles. Prior to joining Fidelity Investments, Ms. Dorsey served as Treasurer (2004-2008) of the JPMorgan Mutual Funds and Vice President (2004-2008) of JPMorgan Chase Bank. |
Joseph A. Hanlon (1968) | |
Year of Election or Appointment: 2012 Chief Compliance Officer | |
| Mr. Hanlon also serves as Chief Compliance Officer of other funds. Mr. Hanlon serves as Compliance Officer of FMR, FMR Co., Inc., Fidelity Investments Money Management, Inc. (FIMM), Fidelity Research and Analysis Company (FRAC), and Fidelity Management & Research (Hong Kong) (2009-present), as Senior Vice President of the Fidelity Asset Management Division (2009-present), and is an employee of Fidelity Investments. Previously, Mr. Hanlon served as Compliance Officer of Fidelity Management & Research (Japan) Inc. (2009-2013), Strategic Advisers, Inc. (2009-2013), and Fidelity Management & Research (U.K.) Inc. (2009-2013). |
Brian B. Hogan (1964) | |
Year of Election or Appointment: 2009 Vice President | |
| Mr. Hogan also serves as Trustee or Vice President of other funds. Mr. Hogan serves as President of FMR's Equity Division (2009-present). Previously, Mr. Hogan served as Senior Vice President, Equity Research of FMR (2006-2009) and as a portfolio manager. |
Chris Maher (1972) | |
Year of Election or Appointment: 2013 Assistant Treasurer | |
| Mr. Maher serves as Assistant Treasurer of other funds. Mr. Maher is Vice President of Valuation Oversight and is an employee of Fidelity Investments. Previously, Mr. Maher served as Vice President of Asset Management Compliance (2013), Vice President of FMR's Program Management Group (2010-2013), and Vice President of Valuation Oversight (2008-2010). |
Christine Reynolds (1958) | |
Year of Election or Appointment: 2008 Chief Financial Officer | |
| Ms. Reynolds also serves as Chief Financial Officer of other funds. Ms. Reynolds became President of Fidelity Pricing and Cash Management Services (FPCMS) in August 2008. Ms. Reynolds served as Chief Operating Officer of FPCMS (2007-2008). Previously, Ms. Reynolds served as President, Treasurer, and Anti-Money Laundering officer of the Fidelity funds (2004-2007). |
Kenneth B. Robins (1969) | |
Year of Election or Appointment: 2013 Deputy Treasurer | |
| Mr. Robins also serves as an officer of other funds. Mr. Robins serves as Executive Vice President of Fidelity Investments Money Management, Inc. (FIMM) (2013-present) and is an employee of Fidelity Investments (2004-present). Previously, Mr. Robins served in other fund officer roles. |
Anthony R. Rochte (1968) | |
Year of Election or Appointment: 2013 Vice President | |
| Mr. Rochte also serves as Vice President of other funds. Mr. Rochte serves as President of Fidelity SelectCo, LLC (2012-present) and is an employee of Fidelity Investments (2012-present). Prior to joining Fidelity Investments, Mr. Rochte served as Senior Managing Director and head of State Street Global Advisors' North American Intermediary Business Group (2006-2012). |
Stacie M. Smith (1974) | |
Year of Election or Appointment: 2013 Assistant Treasurer | |
| Ms. Smith also serves as an officer of other funds. She is an employee of Fidelity Investments (2009-present) and has served in other fund officer roles. Prior to joining Fidelity Investments, Ms. Smith served as Senior Audit Manager of Ernst & Young LLP (1996-2009). |
Renee Stagnone (1975) | |
Year of Election or Appointment: 2013 Deputy Treasurer | |
| Ms. Stagnone also serves as Deputy Treasurer of other funds. Ms. Stagnone is an employee of Fidelity Investments. |
Joseph F. Zambello (1957) | |
Year of Election or Appointment: 2011 Deputy Treasurer | |
| Mr. Zambello also serves as Deputy Treasurer of other funds. Mr. Zambello is an employee of Fidelity Investments. Previously, Mr. Zambello served as Vice President of FMR's Program Management Group (2009-2011) and Vice President of the Transfer Agent Oversight Group (2005-2009). |
Annual Report
Distributions (Unaudited)
The Board of Trustees of each fund voted to pay to shareholders of record at the opening of business on record date the following distributions per share derived from capital gains realized from sales of portfolio securities and dividends derived from net investment income:
| Pay Date | Record Date | Dividends | Capital Gains |
Energy Portfolio | 04/07/14 | 04/04/14 | $0.087 | $2.746 |
Energy Service Portfolio | 04/07/14 | 04/04/14 | $0.022 | $2.993 |
Natural Gas Portfolio | 04/07/14 | 04/04/14 | $0.034 | $0.039 |
Natural Resources Portfolio | 04/07/14 | 04/04/14 | $0.004 | $0.220 |
The funds hereby designate as capital gain dividend the amounts noted below for the taxable year ended February 28, 2014, or, if subsequently determined to be different, the net capital gain of such year.
Energy Portfolio | $ 263,336,755 |
Energy Service Portfolio | $ 38,309,089 |
Natural Resources Portfolio | $ 34,017,959 |
A percentage of the dividends distributed during the fiscal year for the following funds qualify for the dividends-received deduction for corporate shareholders:
Energy Portfolio |
|
April 2013 | 99% |
December 2013 | 38% |
Energy Service Portfolio |
|
December 2013 | 100% |
Natural Gas Portfolio |
|
April 2013 | 100% |
December 20, 2013 (ex-date) | 100% |
December 30, 2013 (ex-date) | 89% |
Natural Resources Portfolio |
|
December 2013 | 100% |
A percentage of the dividends distributed during the fiscal year for the following funds may be taken into account as a dividend for purposes of the maximum rate under section 1(h) (11) of the Internal Revenue Code:
Energy Portfolio |
|
April 2013 | 99% |
December 2013 | 45% |
Energy Service Portfolio |
|
December 2013 | 100% |
Natural Gas Portfolio |
|
April 2013 | 100% |
December 2013 | 100% |
Natural Resources Portfolio |
|
December 2013 | 100% |
The funds will notify shareholders in January 2015 of amounts for use in preparing 2014 income tax returns.
Annual Report
Proxy Voting Results
A special meeting of each fund's shareholders was held on June 18, 2013. The results of votes taken among shareholders on the proposals before them are reported below. Each vote reported represents one dollar of net asset value held on the record date for the meeting.
PROPOSAL 1 | ||
To elect a Board of Trustees. A | ||
| # of | % of |
Ned C. Lautenbach | ||
Affirmative | 25,828,395,115.78 | 94.160 |
Withheld | 1,602,101,684.27 | 5.840 |
TOTAL | 27,430,496,800.05 | 100.000 |
Ronald P. O'Hanley | ||
Affirmative | 25,907,936,922.24 | 94.450 |
Withheld | 1,522,559,877.81 | 5.550 |
TOTAL | 27,430,496,800.05 | 100.000 |
David A. Rosow | ||
Affirmative | 25,805,492,959.91 | 94.076 |
Withheld | 1,625,003,840.14 | 5.924 |
TOTAL | 27,430,496,800.05 | 100.000 |
Garnett A. Smith | ||
Affirmative | 25,892,258,831.97 | 94.393 |
Withheld | 1,538,237,968.08 | 5.607 |
TOTAL | 27,430,496,800.05 | 100.000 |
William S. Stavropoulos | ||
Affirmative | 25,738,476,030.34 | 93.832 |
Withheld | 1,692,020,769.71 | 6.168 |
TOTAL | 27,430,496,800.05 | 100.000 |
Michael E. Wiley | ||
Affirmative | 25,923,640,743.27 | 94.507 |
Withheld | 1,506,856,056.78 | 5.493 |
TOTAL | 27,430,496,800.05 | 100.000 |
PROPOSAL 2 | ||
To approve a management contract between Energy Portfolio and Fidelity SelectCo, LLC. | ||
| # of | % of |
Affirmative | 1,123,667,595.06 | 84.541 |
Against | 66,131,212.87 | 4.975 |
Abstain | 63,827,255.74 | 4.802 |
Broker Non-Vote | 75,523,084.07 | 5.682 |
TOTAL | 1,329,149,147.74 | 100.000 |
PROPOSAL 2 | ||
To approve a management contract between Energy Service Portfolio and Fidelity SelectCo, LLC. | ||
| # of | % of |
Affirmative | 645,498,387.29 | 84.946 |
Against | 33,409,158.57 | 4.397 |
Abstain | 33,438,738.73 | 4.400 |
Broker Non-Vote | 47,550,441.63 | 6.257 |
TOTAL | 759,896,726.22 | 100.000 |
PROPOSAL 2 | ||
To approve a management contract between Natural Gas Portfolio and Fidelity SelectCo, LLC. | ||
| # of | % of |
Affirmative | 299,519,308.49 | 78.743 |
Against | 16,626,864.21 | 4.372 |
Abstain | 21,125,424.08 | 5.553 |
Broker Non-Vote | 43,106,986.49 | 11.332 |
TOTAL | 380,378,583.27 | 100.000 |
PROPOSAL 2 | ||
To approve a management contract between Natural Resources Portfolio and Fidelity SelectCo, LLC. | ||
| # of | % of |
Affirmative | 464,592,888.36 | 83.574 |
Against | 24,605,583.11 | 4.427 |
Abstain | 30,066,842.67 | 5.408 |
Broker Non-Vote | 36,643,226.80 | 6.591 |
TOTAL | 555,908,540.94 | 100.000 |
A Denotes trust-wide proposal and voting results. | ||
Annual Report
Investment Adviser
Fidelity SelectCo, LLC
Denver, CO
Investment Sub-Advisers
FMR Co., Inc.
Fidelity Management & Research
(U.K.) Inc.
Fidelity Management & Research
(Hong Kong) Limited
Fidelity Management & Research
(Japan) Inc.
General Distributor
Fidelity Distributors Corporation
Smithfield, RI
Transfer and Service Agents
Fidelity Investments Institutional Operations Company, Inc.
Boston, MA
Fidelity Service Company, Inc.
Boston, MA
Custodian
Brown Brothers Harriman & Co.
Boston, MA
Corporate Headquarters
245 Summer Street
Boston, MA 02210
1-800-544-8888
The Fidelity Telephone Connection
Mutual Fund 24-Hour Service
Exchanges/Redemptions
and Account Assistance 1-800-544-6666
Product Information 1-800-544-8888
Retirement Accounts 1-800-544-4774
(8 a.m. - 9 p.m.)
TDD Service 1-800-544-0118
for the deaf and hearing impaired
(9 a.m. - 9 p.m. Eastern time)
Fidelity Automated Service
Telephone (FAST®)
1-800-544-5555
Automated line for quickest service
SELNR-UANNPRO-0414
1.910419.104
Fidelity®
Select Portfolios®
Utilities Sector
Utilities Portfolio
Annual Report
February 28, 2014
(Fidelity Cover Art)
Contents
Performance | How the fund has done over time. | |
Management's Discussion of Fund Performance | The Portfolio Manager's review of fund performance and strategy. | |
Shareholder Expense Example |
| |
Investment Changes |
| |
Investments |
| |
Financial Statements |
| |
Notes to Financial Statements |
| |
Report of Independent Registered Public Accounting Firm |
| |
Trustees and Officers |
| |
Distributions |
| |
Proxy Voting Results |
|
To view a fund's proxy voting guidelines and proxy voting record for the 12-month period ended June 30, visit http://www.fidelity.com/proxyvotingresults or visit the Securities and Exchange Commission's (SEC) web site at http://www.sec.gov. You may also call 1-800-544-8544 to request a free copy of the proxy voting guidelines.
Standard & Poor's, S&P and S&P 500 are registered service marks of The McGraw-Hill Companies, Inc. and have been licensed for use by Fidelity Distributors Corporation.
Other third-party marks appearing herein are the property of their respective owners.
All other marks appearing herein are registered or unregistered trademarks or service marks of FMR LLC or an affiliated company. © 2014 FMR LLC. All rights reserved.
This report and the financial statements contained herein are submitted for the general information of the shareholders of the fund. This report is not authorized for distribution to prospective investors in the fund unless preceded or accompanied by an effective prospectus.
A fund files its complete schedule of portfolio holdings with the SEC for the first and third quarters of each fiscal year on Form N-Q. Forms N-Q are available on the SEC's web site at http://www.sec.gov. A fund's Forms N-Q may be reviewed and copied at the SEC's Public Reference Room in Washington, DC. Information regarding the operation of the SEC's Public Reference Room may be obtained by calling 1-800-SEC-0330. For a complete list of a fund's portfolio holdings, view the most recent holdings listing, semiannual report, or annual report on Fidelity's web site at http://www.fidelity.com, http://www.advisor.fidelity.com, or http://www.401k.com, as applicable.
NOT FDIC INSURED • MAY LOSE VALUE • NO BANK GUARANTEE
Neither the fund nor Fidelity Distributors Corporation is a bank.
Annual Report
Performance: The Bottom Line
Average annual total return reflects the change in the value of an investment, assuming reinvestment of the fund's distributions from dividend income and capital gains (the profits earned upon the sale of securities that have grown in value, if any) and assuming a constant rate of performance each year. The $10,000 table and the fund's returns do not reflect the deduction of taxes that a shareholder would pay on fund distributions or the redemption of fund shares. During periods of reimbursement by Fidelity, a fund's total return will be greater than it would be had the reimbursement not occurred. How a fund did yesterday is no guarantee of how it will do tomorrow.
Average Annual Total Returns
Periods ended February 28, 2014 | Past 1 | Past 5 | Past 10 |
Utilities Portfolio A | 18.71% | 17.75% | 9.80% |
A Prior to October 1, 2006, Utilities Portfolio operated under certain different investment policies and compared its performance to a different additional index. The fund's historical performance may not represent its current investment policies.
$10,000 Over 10 Years
Let's say hypothetically that $10,000 was invested in Utilities Portfolio on February 29, 2004. The chart shows how the value of your investment would have changed, and also shows how the S&P 500® Index performed over the same period.
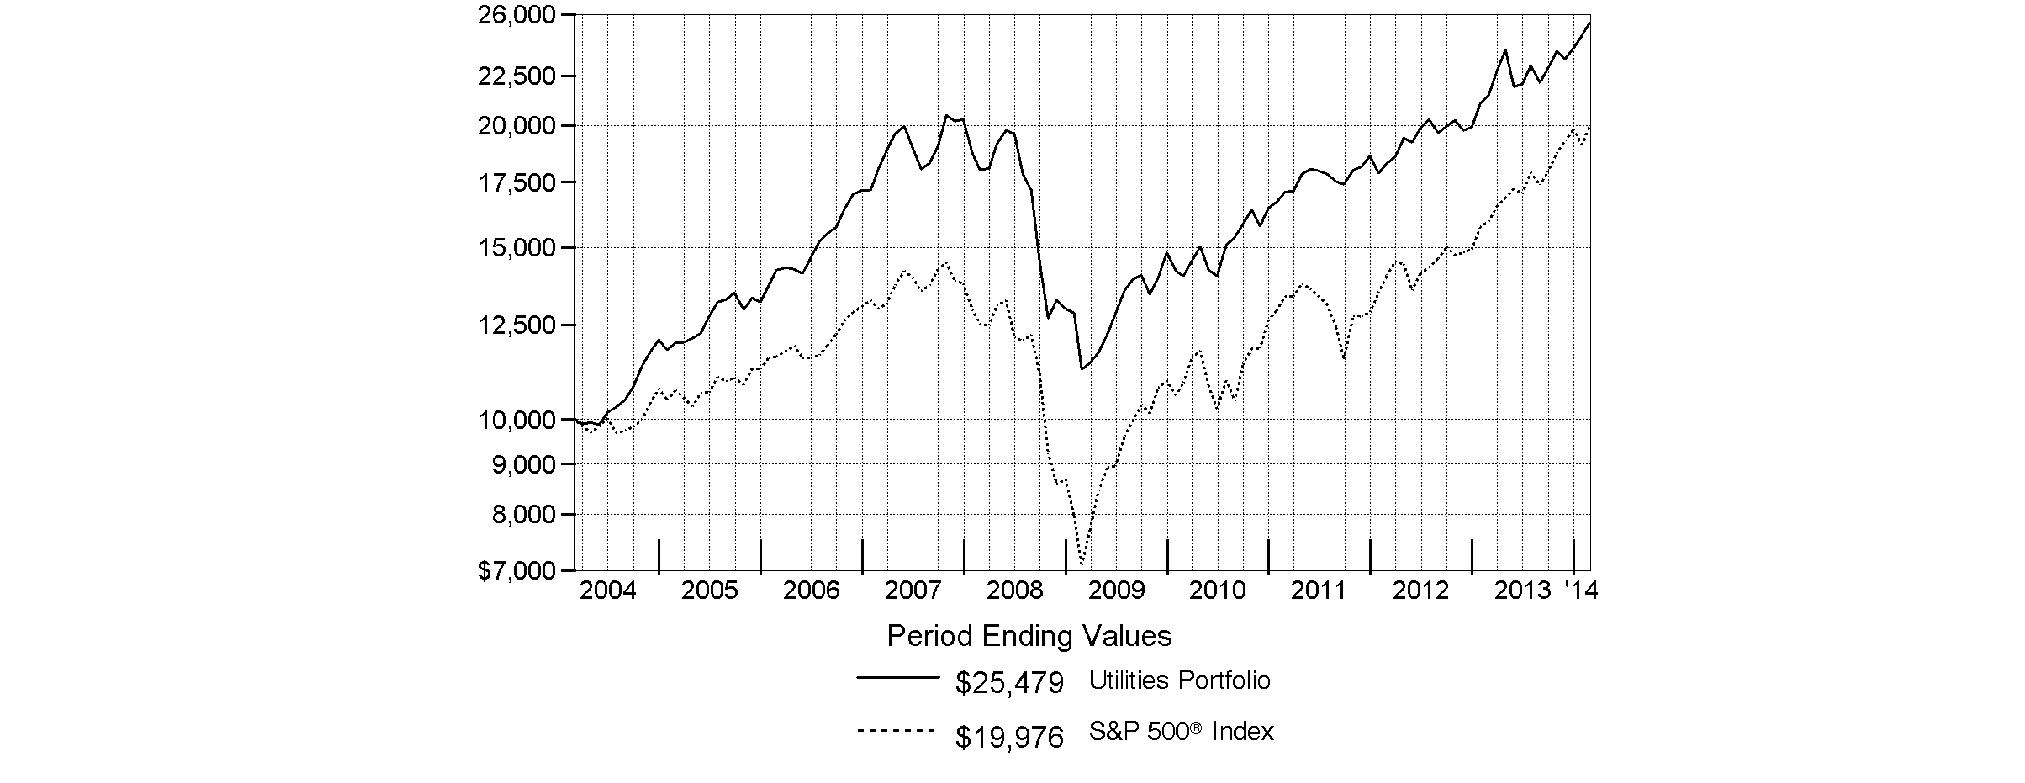
Annual Report
Management's Discussion of Fund Performance
Market Recap: Stocks overcame fears of higher interest rates - not to mention their worst January in four years - to finish sharply higher for the 12 months ending February 28, 2014. The broad S&P 500® Index and the blue-chip Dow Jones Industrial AverageSM gained 25.37% and 19.01%, respectively, amid generally favorable earnings reports and accommodative monetary policies worldwide. Performance generally increased along the risk spectrum, with smaller-cap and growth strategies leading the way. An ebullient market helped the growth-oriented Nasdaq Composite Index® to a 38.10% period gain. Data still points to slow but steady improvement in the U.S., and Europe's recession may well be over. Reports from China have disappointed, but continue to suggest a relatively soft landing there. Mixed signals from the U.S. Federal Reserve as to when it might curtail its stimulative bond buying kept markets in flux during the spring and summer. Stocks regained momentum in October despite a federal budget impasse and brief government shutdown, and lower volatility prevailed through year-end. Shedding new-year concerns about China's economy, an emerging-markets sell-off and confirmation (at last) of Fed tapering - alongside confirmation of a presumably dovish Janet Yellen as new Fed chair - February saw stocks back in record territory, bearing down on the five-year anniversary of the market's bottom.
Comments from Douglas Simmons, Portfolio Manager of Utilities Portfolio: For the year, the fund returned 18.71%, significantly outperforming the 13.50% gain of its sector benchmark, the MSCI® U.S. IMI Utilities 25-50 Index, but underperforming the broadly based S&P 500®. Utilities stocks underperformed the broader equity market, largely because of soft power demand and power prices. Versus the MSCI index, the fund benefited from its stock picks in oil & gas storage & transport, its out-of-benchmark holdings in oil & gas exploration & production and security selection in multi-utilities. Underweighting electric utilities also helped. The top two contributors were out-of-benchmark holdings in companies offering growth opportunities in natural gas infrastructure: Cheniere Energy, which is constructing the first natural gas export terminals in the United States; and diversified energy company Energen, which owns both a natural gas distribution utility and natural gas-producing acreage. On the down side, we were hurt by security selection in water utilities, and by the fund's small cash position - held for liquidity purposes - which was a drag in an up market. The largest individual detractor versus the MSCI benchmark was untimely ownership of Dominion Resources, a company that owns both midstream assets - or those involved in shipping and storage - and a Virginia utility.
The views expressed above reflect those of the portfolio manager(s) only through the end of the period as stated on the cover of this report and do not necessarily represent the views of Fidelity or any other person in the Fidelity organization. Any such views are subject to change at any time based upon market or other conditions and Fidelity disclaims any responsibility to update such views. These views may not be relied on as investment advice and, because investment decisions for a Fidelity fund are based on numerous factors, may not be relied on as an indication of trading intent on behalf of any Fidelity fund.
Annual Report
Shareholder Expense Example
As a shareholder of the Fund, you incur two types of costs: (1) transaction costs, including redemption fees and (2) ongoing costs, including management fees and other Fund expenses. This Example is intended to help you understand your ongoing costs (in dollars) of investing in the Fund and to compare these costs with the ongoing costs of investing in other mutual funds.
The Example is based on an investment of $1,000 invested at the beginning of the period and held for the entire period (September 1, 2013 to February 28, 2014).
Actual Expenses
The first line of the accompanying table provides information about actual account values and actual expenses. You may use the information in this line, together with the amount you invested, to estimate the expenses that you paid over the period. Simply divide your account value by $1,000.00 (for example, an $8,600 account value divided by $1,000.00 = 8.6), then multiply the result by the number in the first line under the heading entitled "Expenses Paid During Period" to estimate the expenses you paid on your account during this period. A small balance maintenance fee of $12.00 that is charged once a year may apply for certain accounts with a value of less than $2,000. This fee is not included in the table below. If it was, the estimate of expenses you paid during the period would be higher, and your ending account value lower, by this amount. In addition, the Fund, as a shareholder in the underlying Fidelity Central Funds, will indirectly bear its pro-rata share of the fees and expenses incurred by the underlying Fidelity Central Funds. These fees and expenses are not included in the Fund's annualized expense ratio used to calculate the expense estimate in the table below.
Hypothetical Example for Comparison Purposes
The second line of the accompanying table provides information about hypothetical account values and hypothetical expenses based on the Fund's actual expense ratio and an assumed rate of return of 5% per year before expenses, which is not the Fund's actual return. The hypothetical account values and expenses may not be used to estimate the actual ending account balance or expenses you paid for the period. You may use this information to compare the ongoing costs of investing in the Fund and other funds. To do so, compare this 5% hypothetical example with the 5% hypothetical examples that appear in the shareholder reports of the other funds. A small balance maintenance fee of $12.00 that is charged once a year may apply for certain accounts with a value of less than $2,000. This fee is not included in the table below. If it was, the estimate of expenses you paid during the period would be higher, and your ending account value lower, by this amount. In addition, the Fund, as a shareholder in the underlying Fidelity Central Funds, will indirectly bear its pro-rata share of the fees and expenses incurred by the underlying Fidelity Central Funds. These fees and expenses are not included in the Fund's annualized expense ratio used to calculate the expense estimate in the table below.
Please note that the expenses shown in the table are meant to highlight your ongoing costs only and do not reflect any transaction costs. Therefore, the second line of the table is useful in comparing ongoing costs only, and will not help you determine the relative total costs of owning different funds. In addition, if these transactional costs were included, your costs would have been higher.
| Annualized | Beginning | Ending | Expenses Paid |
Actual | .81% | $ 1,000.00 | $ 1,152.30 | $ 4.32 |
HypotheticalA |
| $ 1,000.00 | $ 1,020.78 | $ 4.06 |
A 5% return per year before expenses
B Annualized expense ratio reflects expenses net of applicable fee waivers.
* Expenses are equal to the Fund's annualized expense ratio, multiplied by the average account value over the period, multiplied by 181/365 (to reflect the one-half year period). The fees and expenses of the underlying Fidelity Central Funds in which the Fund invests are not included in the Fund's annualized expense ratio.
Annual Report
Investment Changes (Unaudited)
Top Ten Stocks as of February 28, 2014 | ||
| % of fund's | % of fund's net assets |
NextEra Energy, Inc. | 11.0 | 7.0 |
Dominion Resources, Inc. | 10.4 | 0.0 |
Sempra Energy | 9.2 | 7.9 |
OGE Energy Corp. | 5.7 | 5.6 |
Verizon Communications, Inc. | 5.1 | 0.0 |
Energy Transfer Equity LP | 4.4 | 3.6 |
NiSource, Inc. | 4.1 | 3.9 |
PG&E Corp. | 4.1 | 4.1 |
ONEOK, Inc. | 4.0 | 5.1 |
Edison International | 4.0 | 4.4 |
| 62.0 | |
Top Industries (% of fund's net assets) | |||
As of February 28, 2014 | |||
 | Multi-Utilities | 32.3% |
|
 | Electric Utilities | 30.7% |
|
 | Oil, Gas & Consumable Fuels | 19.7% |
|
 | Independent Power Producers & Energy Traders | 9.1% |
|
 | Diversified Telecommunication Services | 5.1% |
|
 | All Others* | 3.1% |
|

As of August 31, 2013 | |||
| Electric Utilities | 32.2% |
|
| Multi-Utilities | 26.0% |
|
| Oil, Gas & Consumable Fuels | 18.3% |
|
| Independent Power Producers & Energy Traders | 14.9% |
|
| Gas Utilities | 7.0% |
|
| All Others* | 1.6% |
|

* Includes short-term investments and net other assets (liabilities). |
Annual Report
Investments February 28, 2014
Showing Percentage of Net Assets
Common Stocks - 99.5% | |||
Shares | Value | ||
DIVERSIFIED TELECOMMUNICATION SERVICES - 5.1% | |||
Integrated Telecommunication Services - 5.1% | |||
Verizon Communications, Inc. | 747,900 | $ 35,585,082 | |
ELECTRIC UTILITIES - 30.7% | |||
Electric Utilities - 30.7% | |||
American Electric Power Co., Inc. | 540,247 | 27,120,399 | |
Duke Energy Corp. | 126,300 | 8,952,144 | |
Edison International | 529,612 | 27,735,780 | |
Exelon Corp. | 448,600 | 13,641,926 | |
FirstEnergy Corp. | 109,300 | 3,364,254 | |
ITC Holdings Corp. | 158,049 | 16,215,827 | |
NextEra Energy, Inc. | 839,785 | 76,747,953 | |
OGE Energy Corp. | 1,096,485 | 39,473,460 | |
| 213,251,743 | ||
INDEPENDENT POWER PRODUCERS & ENERGY TRADERS - 9.1% | |||
Independent Power Producers & Energy Traders - 9.1% | |||
Calpine Corp. (a) | 1,076,237 | 20,502,315 | |
NRG Energy, Inc. | 836,102 | 24,305,485 | |
The AES Corp. | 1,376,802 | 18,793,347 | |
| 63,601,147 | ||
METALS & MINING - 0.4% | |||
Diversified Metals & Mining - 0.4% | |||
U.S. Silica Holdings, Inc. (d) | 89,970 | 2,951,016 | |
MULTI-UTILITIES - 32.3% | |||
Multi-Utilities - 32.3% | |||
Ameren Corp. | 144,336 | 5,832,618 | |
CenterPoint Energy, Inc. | 750,707 | 17,754,221 | |
Dominion Resources, Inc. | 1,044,012 | 72,454,433 | |
NiSource, Inc. | 828,423 | 28,845,689 | |
PG&E Corp. | 650,137 | 28,645,036 | |
Public Service Enterprise Group, Inc. | 200,100 | 7,335,666 | |
Sempra Energy | 674,551 | 63,724,833 | |
| 224,592,496 | ||
OIL, GAS & CONSUMABLE FUELS - 19.7% | |||
Oil & Gas Exploration & Production - 2.1% | |||
Energen Corp. | 184,441 | 14,836,434 | |
Oil & Gas Storage & Transport - 17.6% | |||
Atlas Energy LP | 93,934 | 3,987,498 | |
Cheniere Energy Partners LP Holdings LLC | 788,650 | 15,575,838 | |
Cheniere Energy, Inc. (a) | 345,467 | 17,076,434 | |
Enbridge, Inc. (d) | 179,000 | 7,565,429 | |
| |||
Shares | Value | ||
Energy Transfer Equity LP | 700,416 | $ 30,573,158 | |
Inter Pipeline Ltd. (d) | 212,400 | 5,744,947 | |
Kinder Morgan Holding Co. LLC | 125,500 | 3,997,175 | |
ONEOK, Inc. | 473,074 | 27,977,596 | |
Plains GP Holdings LP Class A | 355,690 | 9,959,320 | |
| 122,457,395 | ||
TOTAL OIL, GAS & CONSUMABLE FUELS | 137,293,829 | ||
REAL ESTATE INVESTMENT TRUSTS - 2.0% | |||
Specialized REITs - 2.0% | |||
American Tower Corp. | 166,264 | 13,545,528 | |
WIRELESS TELECOMMUNICATION SERVICES - 0.2% | |||
Wireless Telecommunication Services - 0.2% | |||
Telephone & Data Systems, Inc. | 70,242 | 1,600,815 | |
TOTAL COMMON STOCKS (Cost $601,142,436) |
| ||
Money Market Funds - 2.5% | |||
|
|
|
|
Fidelity Cash Central Fund, 0.10% (b) | 3,008,488 | 3,008,488 | |
Fidelity Securities Lending Cash Central Fund, 0.09% (b)(c) | 14,215,095 | 14,215,095 | |
TOTAL MONEY MARKET FUNDS (Cost $17,223,583) |
| ||
TOTAL INVESTMENT PORTFOLIO - 102.0% (Cost $618,366,019) | 709,645,239 | ||
NET OTHER ASSETS (LIABILITIES) - (2.0)% | (13,712,740) | ||
NET ASSETS - 100% | $ 695,932,499 | ||
Legend |
(a) Non-income producing |
(b) Affiliated fund that is generally available only to investment companies and other accounts managed by Fidelity Investments. The rate quoted is the annualized seven-day yield of the fund at period end. A complete unaudited listing of the fund's holdings as of its most recent quarter end is available upon request. In addition, each Fidelity Central Fund's financial statements, which are not covered by the Fund's Report of Independent Registered Public Accounting Firm, are available on the SEC's website or upon request. |
(c) Investment made with cash collateral received from securities on loan. |
(d) Security or a portion of the security is on loan at period end. |
Affiliated Central Funds |
Information regarding fiscal year to date income earned by the Fund from investments in Fidelity Central Funds is as follows: |
Fund | Income earned |
Fidelity Cash Central Fund | $ 13,285 |
Fidelity Securities Lending Cash Central Fund | 51,707 |
Total | $ 64,992 |
Other Information |
All investments are categorized as Level 1 under the Fair Value Hierarchy. The inputs or methodology used for valuing securities may not be an indication of the risk associated with investing in those securities. For more information on valuation inputs, please refer to the Investment Valuation section in the accompanying Notes to Financial Statements. |
See accompanying notes which are an integral part of the financial statements.
Annual Report
Financial Statements
Statement of Assets and Liabilities
| February 28, 2014 | |
|
|
|
Assets | ||
Investment in securities, at value (including securities loaned of $13,779,580) - See accompanying schedule: Unaffiliated issuers (cost $601,142,436) | $ 692,421,656 |
|
Fidelity Central Funds (cost $17,223,583) | 17,223,583 |
|
Total Investments (cost $618,366,019) |
| $ 709,645,239 |
Receivable for investments sold | 18,011,364 | |
Receivable for fund shares sold | 897,214 | |
Dividends receivable | 2,136,347 | |
Distributions receivable from Fidelity Central Funds | 4,535 | |
Prepaid expenses | 3,091 | |
Other receivables | 24,108 | |
Total assets | 730,721,898 | |
|
|
|
Liabilities | ||
Payable for investments purchased | $ 18,683,824 | |
Payable for fund shares redeemed | 1,434,251 | |
Accrued management fee | 308,705 | |
Other affiliated payables | 110,753 | |
Other payables and accrued expenses | 36,771 | |
Collateral on securities loaned, at value | 14,215,095 | |
Total liabilities | 34,789,399 | |
|
|
|
Net Assets | $ 695,932,499 | |
Net Assets consist of: |
| |
Paid in capital | $ 585,598,120 | |
Undistributed net investment income | 3,436,635 | |
Accumulated undistributed net realized gain (loss) on investments and foreign currency transactions | 15,619,267 | |
Net unrealized appreciation (depreciation) on investments and assets and liabilities in foreign currencies | 91,278,477 | |
Net Assets, for 9,852,351 shares outstanding | $ 695,932,499 | |
Net Asset Value, offering price and redemption price per share ($695,932,499 ÷ 9,852,351 shares) | $ 70.64 | |
Statement of Operations
| Year ended February 28, 2014 | |
|
|
|
Investment Income |
|
|
Dividends |
| $ 18,218,193 |
Income from Fidelity Central Funds |
| 64,992 |
Total income |
| 18,283,185 |
|
|
|
Expenses | ||
Management fee | $ 3,278,511 | |
Transfer agent fees | 1,234,994 | |
Accounting and security lending fees | 221,098 | |
Custodian fees and expenses | 14,276 | |
Independent trustees' compensation | 10,911 | |
Registration fees | 47,864 | |
Audit | 39,875 | |
Legal | 9,642 | |
Interest | 3,323 | |
Miscellaneous | 7,751 | |
Total expenses before reductions | 4,868,245 | |
Expense reductions | (106,511) | 4,761,734 |
Net investment income (loss) | 13,521,451 | |
Realized and Unrealized Gain (Loss) Net realized gain (loss) on: | ||
Investment securities: |
|
|
Unaffiliated issuers | 23,739,604 | |
Foreign currency transactions | (23,258) | |
Total net realized gain (loss) |
| 23,716,346 |
Change in net unrealized appreciation (depreciation) on: Investment securities | 56,163,613 | |
Assets and liabilities in foreign currencies | 678 | |
Total change in net unrealized appreciation (depreciation) |
| 56,164,291 |
Net gain (loss) | 79,880,637 | |
Net increase (decrease) in net assets resulting from operations | $ 93,402,088 | |
See accompanying notes which are an integral part of the financial statements.
Annual Report
Statement of Changes in Net Assets
| Year ended | Year ended |
Increase (Decrease) in Net Assets |
|
|
Operations |
|
|
Net investment income (loss) | $ 13,521,451 | $ 13,750,466 |
Net realized gain (loss) | 23,716,346 | 53,493,632 |
Change in net unrealized appreciation (depreciation) | 56,164,291 | 18,561,695 |
Net increase (decrease) in net assets resulting from operations | 93,402,088 | 85,805,793 |
Distributions to shareholders from net investment income | (8,245,345) | (5,973,646) |
Distributions to shareholders from net realized gain | (4,809,786) | - |
Total distributions | (13,055,131) | (5,973,646) |
Share transactions | 522,009,446 | 222,822,612 |
Reinvestment of distributions | 12,368,212 | 5,732,879 |
Cost of shares redeemed | (451,211,733) | (294,987,858) |
Net increase (decrease) in net assets resulting from share transactions | 83,165,925 | (66,432,367) |
Redemption fees | 37,400 | 13,113 |
Total increase (decrease) in net assets | 163,550,282 | 13,412,893 |
|
|
|
Net Assets | ||
Beginning of period | 532,382,217 | 518,969,324 |
End of period (including undistributed net investment income of $3,436,635 and distributions in excess of net investment income of $481, respectively) | $ 695,932,499 | $ 532,382,217 |
Other Information Shares | ||
Sold | 7,881,437 | 3,964,937 |
Issued in reinvestment of distributions | 188,339 | 103,651 |
Redeemed | (6,938,672) | (5,221,879) |
Net increase (decrease) | 1,131,104 | (1,153,291) |
Financial Highlights
Years ended February 28, | 2014 | 2013 | 2012 F | 2011 | 2010 |
Selected Per-Share Data |
|
|
|
|
|
Net asset value, beginning of period | $ 61.04 | $ 52.56 | $ 50.28 | $ 42.24 | $ 34.94 |
Income from Investment Operations |
|
|
|
|
|
Net investment income (loss) B | 1.49 | 1.41 | 1.43 | 1.14 | 1.21 |
Net realized and unrealized gain (loss) | 9.80 | 7.70 | 1.99 | 8.09 | 7.34 |
Total from investment operations | 11.29 | 9.11 | 3.42 | 9.23 | 8.55 |
Distributions from net investment income | (1.07) | (.63) | (1.14) | (1.19) | (1.25) |
Distributions from net realized gain | (.62) | - | - | - | - |
Total distributions | (1.69) | (.63) | (1.14) | (1.19) | (1.25) |
Redemption Fees added to paid in capital B, G | - | - | - | - | - |
Net asset value, end of period | $ 70.64 | $ 61.04 | $ 52.56 | $ 50.28 | $ 42.24 |
Total Return A | 18.71% | 17.46% | 6.85% | 22.07% | 24.50% |
Ratios to Average Net Assets C, E |
|
|
|
|
|
Expenses before reductions | .82% | .83% | .86% | .90% | .95% |
Expenses net of fee waivers, if any | .82% | .83% | .86% | .90% | .95% |
Expenses net of all reductions | .80% | .79% | .84% | .87% | .93% |
Net investment income (loss) | 2.28% | 2.49% | 2.78% | 2.46% | 2.98% |
Supplemental Data |
|
|
|
|
|
Net assets, end of period (000 omitted) | $ 695,932 | $ 532,382 | $ 518,969 | $ 454,097 | $ 335,992 |
Portfolio turnover rate D | 160% | 158% | 202% | 238% | 226% |
A Total returns would have been lower if certain expenses had not been reduced during the applicable periods shown.
B Calculated based on average shares outstanding during the period.
C Fees and expenses of any underlying Fidelity Central Funds are not included in the Fund's expense ratio. The Fund indirectly bears its proportionate share of the expenses of any underlying Fidelity Central Funds.
D Amount does not include the portfolio activity of any underlying Fidelity Central Funds.
E Expense ratios reflect operating expenses of the Fund. Expenses before reductions do not reflect amounts reimbursed by the investment adviser or reductions from brokerage service arrangements or reductions from other expense offset arrangements and do not represent the amount paid by the Fund during periods when reimbursements or reductions occur. Expenses net of fee waivers reflect expenses after reimbursement by the investment adviser but prior to reductions from brokerage service arrangements or other expense offset arrangements. Expenses net of all reductions represent the net expenses paid by the Fund.
F For the year ended February 29.
G Amount represents less than $.01 per share.
See accompanying notes which are an integral part of the financial statements.
Annual Report
Notes to Financial Statements
For the period ended February 28, 2014
1. Organization.
Utilities Portfolio (the Fund) is a non-diversified fund of Fidelity Select Portfolios (the Trust) and is authorized to issue an unlimited number of shares. The Trust is registered under the Investment Company Act of 1940, as amended (the 1940 Act), as an open-end management investment company organized as a Massachusetts business trust. The Fund invests primarily in securities of companies whose principal business activities fall within specific industries.
2. Investments in Fidelity Central Funds.
The Fund invests in Fidelity Central Funds, which are open-end investment companies generally available only to other investment companies and accounts managed by the investment adviser and its affiliates. The Fund's Schedule of Investments lists each of the Fidelity Central Funds held as of period end, if any, as an investment of the Fund, but does not include the underlying holdings of each Fidelity Central Fund. As an Investing Fund, the Fund indirectly bears its proportionate share of the expenses of the underlying Fidelity Central Funds.
The Money Market Central Funds seek preservation of capital and current income and are managed by Fidelity Investments Money Management, Inc. (FIMM), an affiliate of the investment adviser. Annualized expenses of the Money Market Central Funds as of their most recent shareholder report date are less than .01%.
A complete unaudited list of holdings for each Fidelity Central Fund is available upon request or at the Securities and Exchange Commission (the SEC) website at www.sec.gov. In addition, the financial statements of the Fidelity Central Funds, which are not covered by the Fund's Report of Independent Registered Public Accounting Firm, are available on the SEC website or upon request.
3. Significant Accounting Policies.
The financial statements have been prepared in conformity with accounting principles generally accepted in the United States of America (GAAP), which require management to make certain estimates and assumptions at the date of the financial statements. Actual results could differ from those estimates. Subsequent events, if any, through the date that the financial statements were issued have been evaluated in the preparation of the financial statements. The following summarizes the significant accounting policies of the Fund:
Investment Valuation. Investments are valued as of 4:00 p.m. Eastern time on the last calendar day of the period. In accordance with valuation policies and procedures approved by the Board of Trustees (the Board), the Fund attempts to obtain prices from one or more third party pricing vendors or brokers to value its investments. When current market prices, quotations or currency exchange rates are not readily available or reliable, investments will be fair valued in good faith by the Fidelity SelectCo, LLC (SelectCo) Fair Value Committee (the Committee), in accordance with procedures adopted by the Board. Factors used in determining fair value vary by investment type and may include market or investment specific events. The frequency with which these procedures are used cannot be predicted and they may be utilized to a significant extent. The Committee oversees the Fund's valuation policies and procedures and is responsible for approving and reporting to the Board all fair value determinations.
The Fund categorizes the inputs to valuation techniques used to value its investments into a disclosure hierarchy consisting of three levels as shown below:
Level 1 - quoted prices in active markets for identical investments
Level 2 - other significant observable inputs (including quoted prices for similar investments, interest rates, prepayment speeds, etc.)
Level 3 - unobservable inputs (including the Fund's own assumptions based on the best information available)
Valuation techniques used to value the Fund's investments by major category are as follows:
Equity securities, including restricted securities, for which market quotations are readily available, are valued at the last reported sale price or official closing price as reported by a third party pricing vendor on the primary market or exchange on which they are traded and are categorized as Level 1 in the hierarchy. In the event there were no sales during the day or closing prices are not available, securities are valued at the last quoted bid price or may be valued using the last available price and are generally categorized as Level 2 in the hierarchy. For foreign equity securities, when market or security specific events arise, comparisons to the valuation of American Depositary Receipts (ADRs), futures contracts, Exchange-Traded Funds (ETFs) and certain indexes as well as quoted prices for similar securities may be used and would be categorized as Level 2 in the hierarchy. Utilizing these techniques may result in transfers between Level 1 and Level 2. For equity securities, including restricted securities, where observable inputs are limited, assumptions about market activity and risk are used and these securities may be categorized as Level 3 in the hierarchy.
Investments in open-end mutual funds, including the Fidelity Central Funds, are valued at their closing net asset value (NAV) each business day and are categorized as Level 1 in the hierarchy.
Changes in valuation techniques may result in transfers in or out of an assigned level within the disclosure hierarchy.
Annual Report
3. Significant Accounting Policies - continued
Foreign Currency. The Fund may use foreign currency contracts to facilitate transactions in foreign-denominated securities. Gains and losses from these transactions may arise from changes in the value of the foreign currency or if the counterparties do not perform under the contracts' terms.
Foreign-denominated assets, including investment securities, and liabilities are translated into U.S. dollars at the exchange rates at period end. Purchases and sales of investment securities, income and dividends received and expenses denominated in foreign currencies are translated into U.S. dollars at the exchange rate in effect on the transaction date.
The effects of exchange rate fluctuations on investments are included with the net realized and unrealized gain (loss) on investment securities. Other foreign currency transactions resulting in realized and unrealized gain (loss) are disclosed separately.
Investment Transactions and Income. For financial reporting purposes, the Fund's investment holdings and NAV include trades executed through the end of the last business day of the period. The NAV per share for processing shareholder transactions is calculated as of the close of business of the New York Stock Exchange (NYSE), normally 4:00 p.m. Eastern time and includes trades executed through the end of the prior business day. Gains and losses on securities sold are determined on the basis of identified cost and may include proceeds received from litigation. Dividend income is recorded on the ex-dividend date, except for certain dividends from foreign securities where the ex-dividend date may have passed, which are recorded as soon as the Fund is informed of the ex-dividend date. Non-cash dividends included in dividend income, if any, are recorded at the fair market value of the securities received. Distributions received on securities that represent a return of capital or capital gain are recorded as a reduction of cost of investments and/or as a realized gain. Subsequent to ex-dividend date the Fund determines the components of these distributions, based upon receipt of tax filings or other correspondence relating to the underlying investment. Interest income and distributions from the Fidelity Central Funds are accrued as earned. Investment income is recorded net of foreign taxes withheld where recovery of such taxes is uncertain.
Expenses. Expenses directly attributable to a fund are charged to that fund. Expenses attributable to more than one fund are allocated among the respective funds on the basis of relative net assets or other appropriate methods. Expense estimates are accrued in the period to which they relate and adjustments are made when actual amounts are known.
Income Tax Information and Distributions to Shareholders. Each year, the Fund intends to qualify as a regulated investment company under Subchapter M of the Internal Revenue Code, including distributing substantially all of its taxable income and realized gains. As a result, no provision for U.S. Federal income taxes is required. As of February 28, 2014, the Fund did not have any unrecognized tax benefits in the financial statements; nor is the Fund aware of any tax positions for which it is reasonably possible that the total amounts of unrecognized tax benefits will significantly change in the next twelve months. The Fund files a U.S. federal tax return, in addition to state and local tax returns as required. The Fund's federal income tax returns are subject to examination by the Internal Revenue Service (IRS) for a period of three fiscal years after they are filed. State and local tax returns may be subject to examination for an additional fiscal year depending on the jurisdiction. Foreign taxes are provided for based on the Fund's understanding of the tax rules and rates that exist in the foreign markets in which it invests.
Distributions are declared and recorded on the ex-dividend date. Income and capital gain distributions are determined in accordance with income tax regulations, which may differ from GAAP. In addition, the Fund claimed a portion of the payment made to redeeming shareholders as a distribution for income tax purposes.
Capital accounts within the financial statements are adjusted for permanent book-tax differences. These adjustments have no impact on net assets or the results of operations. Capital accounts are not adjusted for temporary book-tax differences which will reverse in a subsequent period.
Book-tax differences are primarily due to foreign currency transactions, partnerships, deferred trustees compensation and losses deferred due to wash sales.
The federal tax cost of investment securities and unrealized appreciation (depreciation) as of period end were as follows:
Gross unrealized appreciation | $ 92,271,309 |
Gross unrealized depreciation | (1,502,753) |
Net unrealized appreciation (depreciation) on securities and other investments | $ 90,768,556 |
|
|
Tax Cost | $ 618,876,683 |
The tax-based components of distributable earnings as of period end were as follows:
Undistributed ordinary income | $ 7,065,888 |
Undistributed long-term capital gain | $ 12,501,234 |
Net unrealized appreciation (depreciation) | $ 90,767,813 |
Annual Report
Notes to Financial Statements - continued
3. Significant Accounting Policies - continued
Income Tax Information and Distributions to Shareholders - continued
The tax character of distributions paid was as follows:
| February 28, 2014 | February 28, 2013 |
Ordinary Income | $ 8,245,345 | $ 5,973,646 |
Long-term Capital Gains | 4,809,786 | - |
Total | $ 13,055,131 | $ 5,973,646 |
Trading (Redemption) Fees. Shares held by investors in the Fund less than 30 days may be subject to a redemption fee equal to .75% of the NAV of shares redeemed. All redemption fees, which reduce the proceeds of the shareholder redemption, are retained by the Fund and accounted for as an addition to paid in capital.
4. Purchases and Sales of Investments.
Purchases and sales of securities, other than short-term securities, aggregated $1,022,132,909 and $933,997,066, respectively.
5. Fees and Other Transactions with Affiliates.
Management Fee. Effective August 1, 2013, SelectCo replaced Fidelity Management and Research Company (FMR), an affiliate of SelectCo, as investment adviser to the Fund. The investment adviser and its affiliates provide the Fund with investment management related services for which the Fund pays a monthly management fee. The management fee is the sum of an individual fund fee rate that is based on an annual rate of .30% of the Fund's average net assets and an annualized group fee rate that averaged .25% during the period. The group fee rate is based upon the average net assets of all the mutual funds advised by FMR and the investment adviser. The group fee rate decreases as assets under management increase and increases as assets under management decrease. For the reporting period, the total annual management fee rate was .55% of the Fund's average net assets.
Transfer Agent Fees. Fidelity Investments Institutional Operations Company, Inc. (FIIOC), an affiliate of the investment adviser, is the Fund's transfer, dividend disbursing and shareholder servicing agent. FIIOC receives account fees and asset-based fees that vary according to account size and type of account. FIIOC pays for typesetting, printing and mailing of shareholder reports, except proxy statements. For the period, the transfer agent fees were equivalent to an annual rate of .21% of average net assets.
Accounting and Security Lending Fees. Fidelity Service Company, Inc. (FSC), an affiliate of the investment adviser, maintains the Fund's accounting records. The accounting fee is based on the level of average net assets for each month. Under a separate contract, FSC administers the security lending program. The security lending fee is based on the number and duration of lending transactions.
Brokerage Commissions. The Fund placed a portion of its portfolio transactions with brokerage firms which are affiliates of the investment adviser. Brokerage commissions are included in net realized gain (loss) and change in net unrealized appreciation (depreciation) in the Statement of Operations. The commissions paid to these affiliated firms were $23,647 for the period.
Interfund Lending Program. Pursuant to an Exemptive Order issued by the SEC, the Fund, along with other registered investment companies having management contracts with FMR or other affiliated entities of FMR, may participate in an interfund lending program. This program provides an alternative credit facility allowing the funds to borrow from, or lend money to, other participating affiliated funds. At period end, there were no interfund loans outstanding. The Fund's activity in this program during the period for which loans were outstanding was as follows:
Borrower or Lender | Average Loan | Weighted Average | Interest |
Borrower | $ 9,068,049 | .32% | $ 3,267 |
6. Committed Line of Credit.
The Fund participates with other funds managed by the investment adviser or an affiliate in a $4.25 billion credit facility (the "line of credit") to be utilized for temporary or emergency purposes to fund shareholder redemptions or for other short-term liquidity purposes. The Fund has agreed to pay commitment fees on its pro-rata portion of the line of credit, which amounted to $1,154 and is reflected in Miscellaneous expenses on the Statement of Operations. During the period, there were no borrowings on this line of credit.
Annual Report
7. Security Lending.
The Fund lends portfolio securities through a lending agent from time to time in order to earn additional income. For equity securities, a lending agent is used and may loan securities to certain qualified borrowers, which prior to August 1, 2013 included Fidelity Capital Markets (FCM), a broker-dealer affiliated with the Fund. On the settlement date of the loan, the Fund receives collateral (in the form of U.S. Treasury obligations, letters of credit and/or cash) against the loaned securities and maintains collateral in an amount not less than 100% of the market value of the loaned securities during the period of the loan. The market value of the loaned securities is determined at the close of business of the Fund and any additional required collateral is delivered to the Fund on the next business day. If the borrower defaults on its obligation to return the securities loaned because of insolvency or other reasons, the Fund may apply collateral received from the borrower against the obligation. The Fund may experience delays and costs in recovering the securities loaned. Any cash collateral received is invested in the Fidelity Securities Lending Cash Central Fund. The value of loaned securities and cash collateral at period end are disclosed on the Fund's Statement of Assets and Liabilities. Security lending income represents the income earned on investing cash collateral, less rebates paid to borrowers and any lending agent fees associated with the loan, plus any premium payments received for lending certain types of securities. Security lending income is presented in the Statement of Operations as a component of income from Fidelity Central Funds. Total security lending income during the period amounted to $51,707. During the period, there were no securities loaned to FCM.
8. Bank Borrowings.
The Fund is permitted to have bank borrowings for temporary or emergency purposes to fund shareholder redemptions or for other short-term liquidity requirements. The Fund has established borrowing arrangements with certain banks. The interest rate on the borrowings is the bank's base rate, as revised from time to time. The average loan balance during the period for which loans were outstanding amounted to $1,697,000. The weighted average interest rate was .59%. The interest expense amounted to $56 under the bank borrowing program. At period end, there were no bank borrowings outstanding.
9. Expense Reductions.
Commissions paid to certain brokers with whom the investment adviser, or its affiliates, places trades on behalf of the Fund include an amount to the Fund in addition to trade execution, which may be rebated back to the Fund to offset certain expenses. This amount totaled $101,789 for the period.
In addition, FMR reimbursed a portion of the Fund's operating expenses during the period in the amount of $4,722.
10. Other.
The Fund's organizational documents provide former and current trustees and officers with a limited indemnification against liabilities arising in connection with the performance of their duties to the Fund. In the normal course of business, the Fund may also enter into contracts that provide general indemnifications. The Fund's maximum exposure under these arrangements is unknown as this would be dependent on future claims that may be made against the Fund. The risk of material loss from such claims is considered remote.
At the end of the period, Strategic Advisers U.S. Opportunity Fund was the owner of record of approximately 18% of the total outstanding shares of the Fund. Mutual funds managed by the investment adviser or its affiliates were the owners of record, in the aggregate, of approximately 24% of the total outstanding shares of the Fund.
Annual Report
Report of Independent Registered Public Accounting Firm
To the Trustees of Fidelity Select Portfolios and the Shareholders of Utilities Portfolio:
In our opinion, the accompanying statement of assets and liabilities, including the schedule of investments, and the related statements of operations and of changes in net assets and the financial highlights present fairly, in all material respects, the financial position of Utilities Portfolio (a fund of Fidelity Select Portfolios) at February 28, 2014, the results of its operations for the year then ended, the changes in its net assets for each of the two years in the period then ended and the financial highlights for each of the five years in the period then ended, in conformity with accounting principles generally accepted in the United States of America. These financial statements and financial highlights (hereafter referred to as "financial statements") are the responsibility of the Utilities Portfolio's management. Our responsibility is to express an opinion on these financial statements based on our audits. We conducted our audits of these financial statements in accordance with the standards of the Public Company Accounting Oversight Board (United States). Those standards require that we plan and perform the audit to obtain reasonable assurance about whether the financial statements are free of material misstatement. An audit includes examining, on a test basis, evidence supporting the amounts and disclosures in the financial statements, assessing the accounting principles used and significant estimates made by management, and evaluating the overall financial statement presentation. We believe that our audits, which included confirmation of securities at February 28, 2014 by correspondence with the custodian and brokers, provide a reasonable basis for our opinion.
PricewaterhouseCoopers LLP
Boston, Massachusetts
April 11, 2014
Annual Report
Trustees and Officers
The Trustees and officers of the trust and fund, as applicable, are listed below. The Board of Trustees governs the fund and is responsible for protecting the interests of shareholders. The Trustees are experienced executives who meet periodically throughout the year to oversee the fund's activities, review contractual arrangements with companies that provide services to the fund, oversee management of the risks associated with such activities and contractual arrangements, and review the fund's performance. Except for Ned C. Lautenbach and William S. Stavropoulos, each of the Trustees oversees 74 funds. Mr. Lautenbach and Mr. Stavropoulos each oversees 246 funds.
The Trustees hold office without limit in time except that (a) any Trustee may resign; (b) any Trustee may be removed by written instrument, signed by at least two-thirds of the number of Trustees prior to such removal; (c) any Trustee who requests to be retired or who has become incapacitated by illness or injury may be retired by written instrument signed by a majority of the other Trustees; and (d) any Trustee may be removed at any special meeting of shareholders by a two-thirds vote of the outstanding voting securities of the trust. The officers hold office without limit in time, except that any officer may resign or may be removed by a vote of a majority of the Trustees at any regular meeting or any special meeting of the Trustees. Except as indicated, each individual has held the office shown or other offices in the same company for the past five years.
Experience, Skills, Attributes, and Qualifications of the Fund's Trustees. The Governance and Nominating Committee has adopted a statement of policy that describes the experience, qualifications, attributes, and skills that are necessary and desirable for potential Independent Trustee candidates (Statement of Policy). The Board believes that each Trustee satisfied at the time he or she was initially elected or appointed a Trustee, and continues to satisfy, the standards contemplated by the Statement of Policy. The Governance and Nominating Committee also engages professional search firms to help identify potential Independent Trustee candidates who have the experience, qualifications, attributes, and skills consistent with the Statement of Policy. From time to time, additional criteria based on the composition and skills of the current Independent Trustees, as well as experience or skills that may be appropriate in light of future changes to board composition, business conditions, and regulatory or other developments, have also been considered by the professional search firms and the Governance and Nominating Committee. In addition, the Board takes into account the Trustees' commitment and participation in Board and committee meetings, as well as their leadership of standing and ad hoc committees throughout their tenure.
In determining that a particular Trustee was and continues to be qualified to serve as a Trustee, the Board has considered a variety of criteria, none of which, in isolation, was controlling. The Board believes that, collectively, the Trustees have balanced and diverse experience, qualifications, attributes, and skills, which allow the Board to operate effectively in governing the fund and protecting the interests of shareholders. Information about the specific experience, skills, attributes, and qualifications of each Trustee, which in each case led to the Board's conclusion that the Trustee should serve (or continue to serve) as a trustee of the fund, is provided below.
Board Structure and Oversight Function. Brian B. Hogan is an interested person (as defined in the 1940 Act) and currently serves as Chairman. The Trustees have determined that an interested Chairman is appropriate and benefits shareholders because an interested Chairman has a personal and professional stake in the quality and continuity of services provided to the fund. Independent Trustees exercise their informed business judgment to appoint an individual of their choosing to serve as Chairman, regardless of whether the Trustee happens to be independent or a member of management. The Independent Trustees have determined that they can act independently and effectively without having an Independent Trustee serve as Chairman and that a key structural component for assuring that they are in a position to do so is for the Independent Trustees to constitute a substantial majority for the Board. The Independent Trustees also regularly meet in executive session. Michael E. Wiley serves as Chairman of the Independent Trustees and as such (i) acts as a liaison between the Independent Trustees and management with respect to matters important to the Independent Trustees and (ii) with management prepares agendas for Board meetings.
Fidelity funds are overseen by different Boards of Trustees. The fund's Board oversees Fidelity's sector portfolios. Other Boards oversee Fidelity's equity and high income funds, and Fidelity's investment grade bond, money market, and asset allocation funds. The use of separate Boards, each with its own committee structure, allows the Trustees of each group of Fidelity funds to focus on the unique issues of the funds they oversee, including common research, investment, and operational issues. On occasion, the separate Boards establish joint committees to address issues of overlapping consequences for the Fidelity funds overseen by each Board.
The Trustees operate using a system of committees to facilitate the timely and efficient consideration of all matters of importance to the Trustees, the fund, and fund shareholders and to facilitate compliance with legal and regulatory requirements and oversight of the fund's activities and associated risks. The Board, acting through its committees, has charged SelectCo and its affiliates with (i) identifying events or circumstances the occurrence of which could have demonstrably adverse effects on the fund's business and/or reputation; (ii) implementing processes and controls to lessen the possibility that such events or circumstances occur or to mitigate the effects of such events or circumstances if they do occur; and (iii) creating and maintaining a system designed to evaluate continuously business and market conditions in order to facilitate the identification and implementation processes described in (i) and (ii) above. Because the day-to-day operations and activities of the fund are carried out by or through SelectCo, its affiliates, and other service providers, the fund's exposure to risks is mitigated but not eliminated by the processes overseen by the Trustees. While each of the Board's committees has responsibility for overseeing different aspects of the fund's activities, oversight is exercised primarily through the Operations and Audit Committees. Appropriate personnel, including but not limited to the fund's Chief Compliance Officer (CCO), SelectCo's internal auditor, the independent accountants, the fund's Treasurer and portfolio management personnel, make periodic reports to the Board's committees, as appropriate. The responsibilities of each standing committee, including their oversight responsibilities, are described further under "Standing Committees of the Fund's Trustees."
The fund's Statement of Additional Information (SAI) includes more information about the Trustees. To request a free copy, call Fidelity at 1-800-544-8544.
Annual Report
Trustees and Officers - continued
Interested Trustee*:
Correspondence intended for the Trustee who is an interested person may be sent to Fidelity Investments, 245 Summer Street, Boston, Massachusetts 02210.
Name, Year of Birth; Principal Occupations and Other Relevant Experience+ | |
Brian B. Hogan (1964) | |
Year of Election or Appointment: 2014 Trustee Chairman of the Board of Trustees | |
| Mr. Hogan also serves as Trustee or Vice President of other funds. Mr. Hogan serves as President of FMR's Equity Division (2009-present). Previously, Mr. Hogan served as Senior Vice President, Equity Research of FMR (2006-2009) and as a portfolio manager. |
* Trustee has been determined to be an "Interested Trustee" by virtue of, among other things, his affiliation with the trust or various entities under common control with SelectCo.
+ The information above includes the Trustee's principal occupation during the last five years and other information relating to the experience, attributes, and skills relevant to the Trustee's qualifications to serve as a Trustee, which led to the conclusion that the Trustee should serve as a Trustee for the fund.
Independent Trustees:
Correspondence intended for each Independent Trustee (that is, the Trustees other than the Interested Trustee) may be sent to Fidelity Investments, P.O. Box 55235, Boston, Massachusetts 02205-5235.
Name, Year of Birth; Principal Occupations and Other Relevant Experience+ | |
Ned C. Lautenbach (1944) | |
Year of Election or Appointment: 2000 Trustee | |
| Mr. Lautenbach also serves as Trustee of other Fidelity funds. Mr. Lautenbach currently serves as the Lead Director of the Eaton Corporation Board of Directors (diversified industrial, 1997-present). Mr. Lautenbach is Chairman of the Board of Directors of the Philharmonic Center for the Arts in Naples, Florida (2012-present) and a member of the Council on Foreign Relations (1994-present). Previously, Mr. Lautenbach was a Partner/Advisory Partner at Clayton, Dubilier & Rice, LLC (private equity investment, 1998-2010), as well as a Director of Sony Corporation (2006-2007). |
David A. Rosow (1942) | |
Year of Election or Appointment: 2013 Trustee | |
| Mr. Rosow also serves as Trustee of other Fidelity funds. Mr. Rosow is Chairman and Chief Executive Officer of International Golf Group, Inc. (golf course development, 1989-present). Previously, Mr. Rosow served as Chairman and Chief Executive Officer of Rosow & Company, Inc. (private investment company, 1989-2011), a Lead Director of Hudson United Bancorp (2001-2006) and as a Director of TD Banknorth (1996-2006). In addition, Mr. Rosow is a member (2008-present) and President (2009-present) of the Town Council of Palm Beach, Florida. Mr. Rosow served as a Member of the Advisory Board of other Fidelity funds (2012-2013). |
Garnett A. Smith (1947) | |
Year of Election or Appointment: 2013 Trustee | |
| Mr. Smith also serves as Trustee of other Fidelity funds. Prior to Mr. Smith's retirement, he served as Chairman and Chief Executive Officer of Inbrand Corp. (manufacturer of personal absorbent products, 1990-1997). He also served as President (1986-1990) of Inbrand Corp. Prior to his employment with Inbrand Corp., he was employed by a retail fabric chain and North Carolina National Bank. In addition, Mr. Smith is a board member of the Jackson Hole Land Trust (2009-present). Mr. Smith served as a Member of the Advisory Board of other Fidelity funds (2012-2013). |
William S. Stavropoulos (1939) | |
Year of Election or Appointment: 2001 Trustee | |
| Mr. Stavropoulos also serves as Trustee of other Fidelity funds. Mr. Stavropoulos serves as President and Founder of the Michigan Baseball Foundation, the Great Lakes Loons (2007-present). Mr. Stavropoulos is Chairman Emeritus of the Board of Directors of The Dow Chemical Company, where he previously served in numerous senior management positions, including President, CEO (1995-2000; 2002-2004), Chairman of the Executive Committee (2000-2006), and as a member of the Board of Directors (1990-2006). Currently, Mr. Stavropoulos is Chairman of the Board of Directors of Univar Inc. (global distributor of commodity and specialty chemicals), a Director of Teradata Corporation (data warehousing and technology solutions), and Maersk Inc. (industrial conglomerate), and a member of the Advisory Board for Metalmark Capital LLC (private equity investment, 2005-present). Mr. Stavropoulos is an operating advisor to Clayton, Dubilier & Rice, LLC (private equity investment). In addition, Mr. Stavropoulos is a member of the University of Notre Dame Advisory Council for the College of Science, a Trustee of the Rollin L. Gerstacker Foundation, and a Director of the Naples Philharmonic Center for the Arts. Previously, Mr. Stavropoulos served as a Director of Chemical Financial Corporation (bank holding company, 1993-2012) and Tyco International, Ltd. (multinational manufacturing and services, 2007-2012). |
Michael E. Wiley (1950) | |
Year of Election or Appointment: 2008 Trustee Chairman of the Independent Trustees | |
| Mr. Wiley also serves as Trustee of other Fidelity funds. Mr. Wiley serves as a Director of Asia Pacific Exploration Consolidated (international oil and gas exploration and production, 2008-present). Mr. Wiley serves as a Director of Tesoro Corporation (independent oil refiner and marketer, 2005-present), and a Director of Bill Barrett Corporation (exploration and production, 2005-present). In addition, Mr. Wiley also serves as a Director of Post Oak Bank (privately-held bank, 2004-present). Previously, Mr. Wiley served as a Trustee of other Fidelity funds (2008-2013), as a member of the Board of Trustees of the University of Tulsa (2000-2006; 2007-2010), as a Senior Energy Advisor of Katzenbach Partners, LLC (consulting, 2006-2007), as an Advisory Director of Riverstone Holdings (private investment), Chairman, President, and CEO of Baker Hughes, Inc. (oilfield services, 2000-2004), and as Director of Spinnaker Exploration Company (exploration and production, 2001-2005). |
+ The information above includes each Trustee's principal occupation during the last five years and other information relating to the experience, attributes, and skills relevant to each Trustee's qualifications to serve as a Trustee, which led to the conclusion that each Trustee should serve as a Trustee for the fund.
Officers:
Except for Anthony R. Rochte, correspondence intended for each officer may be sent to Fidelity Investments, 245 Summer Street, Boston, Massachusetts 02210. Correspondence intended for Mr. Rochte may be sent to SelectCo, 1225 17th Street, Denver, Colorado 80202-5541. Officers appear below in alphabetical order.
Name, Year of Birth; Principal Occupation | |
Christopher S. Bartel (1971) | |
Year of Election or Appointment: 2009 Vice President | |
| Mr. Bartel also serves as Vice President of other funds. Mr. Bartel serves as a Director, President, and Chief Executive Officer of Fidelity Management & Research (Japan) Inc. (2012-present), a Director of Fidelity Management & Research (Hong Kong) (2012-present), and Senior Vice President of Global Equity Research (2010-present). Previously, Mr. Bartel served as Senior Vice President of Equity Research (2009-2010), Managing Director of Research (2006-2009), and an analyst and portfolio manager (2000-2006). |
Elizabeth Paige Baumann (1968) | |
Year of Election or Appointment: 2012 Anti-Money Laundering (AML) Officer | |
| Ms. Baumann also serves as AML Officer of other funds. She is Chief AML Officer of FMR LLC (2012-present) and is an employee of Fidelity Investments. Previously, Ms. Baumann served as Vice President and Deputy Anti-Money Laundering Officer (2007-2012). |
Marc Bryant (1966) | |
Year of Election or Appointment: 2013 Secretary | |
| Mr. Bryant also serves as an officer of other funds. He is Senior Vice President and Deputy General Counsel of FMR LLC. Prior to joining Fidelity Investments, Mr. Bryant served as a Senior Vice President and the Head of Global Retail Legal for AllianceBernstein L.P. (2006-2010), and as the General Counsel for ProFund Advisors LLC (2001-2006). |
William C. Coffey (1969) | |
Year of Election or Appointment: 2009 Assistant Secretary | |
| Mr. Coffey also serves as Assistant Secretary of other funds. He is Senior Vice President and Deputy General Counsel of FMR LLC (2010-present), and is an employee of Fidelity Investments. Previously, Mr. Coffey served as Vice President and Associate General Counsel of FMR LLC (2005-2009). |
Jonathan Davis (1968) | |
Year of Election or Appointment: 2010 Assistant Treasurer | |
| Mr. Davis also serves as Assistant Treasurer of other funds. Mr. Davis is an employee of Fidelity Investments. Previously, Mr. Davis served as Vice President and Associate General Counsel of FMR LLC (2003-2010). |
Adrien E. Deberghes (1967) | |
Year of Election or Appointment: 2013 President and Treasurer | |
| Mr. Deberghes also serves as an officer of other funds. He is an employee of Fidelity Investments (2008-present). Prior to joining Fidelity Investments, Mr. Deberghes was Senior Vice President of Mutual Fund Administration at State Street Corporation (2007-2008), Senior Director of Mutual Fund Administration at Investors Bank & Trust (2005-2007), and Director of Finance for Dunkin' Brands (2000-2005). |
Stephanie J. Dorsey (1969) | |
Year of Election or Appointment: 2010 Assistant Treasurer | |
| Ms. Dorsey also serves as an officer of other funds. She is an employee of Fidelity Investments (2008-present) and has served in other fund officer roles. Prior to joining Fidelity Investments, Ms. Dorsey served as Treasurer (2004-2008) of the JPMorgan Mutual Funds and Vice President (2004-2008) of JPMorgan Chase Bank. |
Joseph A. Hanlon (1968) | |
Year of Election or Appointment: 2012 Chief Compliance Officer | |
| Mr. Hanlon also serves as Chief Compliance Officer of other funds. Mr. Hanlon serves as Compliance Officer of FMR, FMR Co., Inc., Fidelity Investments Money Management, Inc. (FIMM), Fidelity Research and Analysis Company (FRAC), and Fidelity Management & Research (Hong Kong) (2009-present), as Senior Vice President of the Fidelity Asset Management Division (2009-present), and is an employee of Fidelity Investments. Previously, Mr. Hanlon served as Compliance Officer of Fidelity Management & Research (Japan) Inc. (2009-2013), Strategic Advisers, Inc. (2009-2013), and Fidelity Management & Research (U.K.) Inc. (2009-2013). |
Brian B. Hogan (1964) | |
Year of Election or Appointment: 2009 Vice President | |
| Mr. Hogan also serves as Trustee or Vice President of other funds. Mr. Hogan serves as President of FMR's Equity Division (2009-present). Previously, Mr. Hogan served as Senior Vice President, Equity Research of FMR (2006-2009) and as a portfolio manager. |
Chris Maher (1972) | |
Year of Election or Appointment: 2013 Assistant Treasurer | |
| Mr. Maher serves as Assistant Treasurer of other funds. Mr. Maher is Vice President of Valuation Oversight and is an employee of Fidelity Investments. Previously, Mr. Maher served as Vice President of Asset Management Compliance (2013), Vice President of FMR's Program Management Group (2010-2013), and Vice President of Valuation Oversight (2008-2010). |
Christine Reynolds (1958) | |
Year of Election or Appointment: 2008 Chief Financial Officer | |
| Ms. Reynolds also serves as Chief Financial Officer of other funds. Ms. Reynolds became President of Fidelity Pricing and Cash Management Services (FPCMS) in August 2008. Ms. Reynolds served as Chief Operating Officer of FPCMS (2007-2008). Previously, Ms. Reynolds served as President, Treasurer, and Anti-Money Laundering officer of the Fidelity funds (2004-2007). |
Kenneth B. Robins (1969) | |
Year of Election or Appointment: 2013 Deputy Treasurer | |
| Mr. Robins also serves as an officer of other funds. Mr. Robins serves as Executive Vice President of Fidelity Investments Money Management, Inc. (FIMM) (2013-present) and is an employee of Fidelity Investments (2004-present). Previously, Mr. Robins served in other fund officer roles. |
Anthony R. Rochte (1968) | |
Year of Election or Appointment: 2013 Vice President | |
| Mr. Rochte also serves as Vice President of other funds. Mr. Rochte serves as President of Fidelity SelectCo, LLC (2012-present) and is an employee of Fidelity Investments (2012-present). Prior to joining Fidelity Investments, Mr. Rochte served as Senior Managing Director and head of State Street Global Advisors' North American Intermediary Business Group (2006-2012). |
Stacie M. Smith (1974) | |
Year of Election or Appointment: 2013 Assistant Treasurer | |
| Ms. Smith also serves as an officer of other funds. She is an employee of Fidelity Investments (2009-present) and has served in other fund officer roles. Prior to joining Fidelity Investments, Ms. Smith served as Senior Audit Manager of Ernst & Young LLP (1996-2009). |
Renee Stagnone (1975) | |
Year of Election or Appointment: 2013 Deputy Treasurer | |
| Ms. Stagnone also serves as Deputy Treasurer of other funds. Ms. Stagnone is an employee of Fidelity Investments. |
Joseph F. Zambello (1957) | |
Year of Election or Appointment: 2011 Deputy Treasurer | |
| Mr. Zambello also serves as Deputy Treasurer of other funds. Mr. Zambello is an employee of Fidelity Investments. Previously, Mr. Zambello served as Vice President of FMR's Program Management Group (2009-2011) and Vice President of the Transfer Agent Oversight Group (2005-2009). |
Annual Report
Distributions (Unaudited)
The Board of Trustees of Select Utilities Portfolio voted to pay on April 7, 2014 to shareholders of record at the opening of business on April 4, 2014 a distribution of $1.573 per share derived from capital gains realized from sales of portfolio securities and a dividend of $0.336 per share from net investment income.
The fund hereby designates as a capital gain dividend with respect to the taxable year ended February 28, 2014, $17,311,020, or, if subsequently determined to be different, the net capital gain of such year.
The fund designates 100% of the dividends distributed in December, during the fiscal year as qualifying for the dividends-received deduction for corporate shareholders.
The fund designates 100% of the dividends distributed during the fiscal year as amounts which may be taken into account as a dividends distributed in December, during the fiscal year as amounts which may be taken into account as a dividend for the purposes of the maximum rate under section 1(h)(11) of the Internal Revenue Code.
The fund will notify shareholders in January 2015 of amounts for use in preparing 2014 income tax returns.
Annual Report
Proxy Voting Results
A special meeting of Utilities Portfolio's shareholders was held on June 18, 2013. The results of votes taken among shareholders on the proposals before them are reported below. Each vote reported represents one dollar of net asset value held on the record date for the meeting.
PROPOSAL 1 | ||
To elect a Board of Trustees. A | ||
| # of | % of |
Ned C. Lautenbach | ||
Affirmative | 25,828,395,115.78 | 94.160 |
Withheld | 1,602,101,684.27 | 5.840 |
TOTAL | 27,430,496,800.05 | 100.000 |
Ronald P. O'Hanley | ||
Affirmative | 25,907,936,922.24 | 94.450 |
Withheld | 1,522,559,877.81 | 5.550 |
TOTAL | 27,430,496,800.05 | 100.000 |
David A. Rosow | ||
Affirmative | 25,805,492,959.91 | 94.076 |
Withheld | 1,625,003,840.14 | 5.924 |
TOTAL | 27,430,496,800.05 | 100.000 |
Garnett A. Smith | ||
Affirmative | 25,892,258,831.97 | 94.393 |
Withheld | 1,538,237,968.08 | 5.607 |
TOTAL | 27,430,496,800.05 | 100.000 |
William S. Stavropoulos | ||
Affirmative | 25,738,476,030.34 | 93.832 |
Withheld | 1,692,020,769.71 | 6.168 |
TOTAL | 27,430,496,800.05 | 100.000 |
Michael E. Wiley | ||
Affirmative | 25,923,640,743.27 | 94.507 |
Withheld | 1,506,856,056.78 | 5.493 |
TOTAL | 27,430,496,800.05 | 100.000 |
PROPOSAL 2 | ||
To approve a management contract between the fund and Fidelity SelectCo, LLC. | ||
| # of | % of |
Affirmative | 273,123,586.14 | 83.598 |
Against | 13,186,360.53 | 4.037 |
Abstain | 21,130,505.12 | 6.467 |
Broker Non-Vote | 19,270,277.16 | 5.898 |
TOTAL | 326,710,728.95 | 100.000 |
A Denotes trust-wide proposal and voting results. | ||
Semiannual Report
Fidelity®
Select Portfolios®
Consumer Discretionary Sector
Automotive Portfolio
Construction and Housing Portfolio
Consumer Discretionary Portfolio
Leisure Portfolio
Multimedia Portfolio
Retailing Portfolio
Annual Report
February 28, 2014
(Fidelity Cover Art)
Contents
Shareholder Expense Example |
| |
Automotive Portfolio | Performance | |
| Management's Discussion | |
| Investment Changes | |
| Investments | |
| Financial Statements | |
Construction and Housing Portfolio | Performance | |
| Management's Discussion | |
| Investment Changes | |
| Investments | |
| Financial Statements | |
Consumer Discretionary Portfolio | Performance | |
| Management's Discussion | |
| Investment Changes | |
| Investments | |
| Financial Statements | |
Leisure Portfolio | Performance | |
| Management's Discussion | |
| Investment Changes | |
| Investments | |
| Financial Statements | |
Multimedia Portfolio | Performance | |
| Management's Discussion | |
| Investment Changes | |
| Investments | |
| Financial Statements | |
Retailing Portfolio | Performance | |
| Management's Discussion | |
| Investment Changes | |
| Investments | |
| Financial Statements | |
Notes to Financial Statements |
| |
Report of Independent Registered Public Accounting Firm |
| |
Trustees and Officers |
| |
Distributions |
| |
Proxy Voting Results |
|
To view a fund's proxy voting guidelines and proxy voting record for the 12-month period ended June 30, visit http://www.fidelity.com/proxyvotingresults or visit the Securities and Exchange Commission's (SEC) web site at http://www.sec.gov. You may also call 1-800-544-8544 to request a free copy of the proxy voting guidelines.
Standard & Poor's, S&P and S&P 500 are registered service marks of The McGraw-Hill Companies, Inc. and have been licensed for use by Fidelity Distributors Corporation.
Other third-party marks appearing herein are the property of their respective owners.
All other marks appearing herein are registered or unregistered trademarks or service marks of FMR LLC or an affiliated company. © 2014 FMR LLC. All rights reserved.
Annual Report
This report and the financial statements contained herein are submitted for the general information of the shareholders of the funds. This report is not authorized for distribution to prospective investors in the funds unless preceded or accompanied by an effective prospectus.
A fund files its complete schedule of portfolio holdings with the SEC for the first and third quarters of each fiscal year on Form N-Q. Forms N-Q are available on the SEC's web site at http://www.sec.gov. A fund's Forms N-Q may be reviewed and copied at the SEC's Public Reference Room in Washington, DC. Information regarding the operation of the SEC's Public Reference Room may be obtained by calling 1-800-SEC-0330. For a complete list of a fund's portfolio holdings, view the most recent holdings listing, semiannual report, or annual report on Fidelity's web site at http://www.fidelity.com, http://www.advisor.fidelity.com, or http://www.401k.com, as applicable.
NOT FDIC INSURED • MAY LOSE VALUE • NO BANK GUARANTEE
Neither the funds nor Fidelity Distributors Corporation is a bank.
Annual Report
Shareholder Expense Example
As a shareholder of a Fund, you incur two types of costs: (1) transaction costs, including redemption fees and (2) ongoing costs, including management fees and other Fund expenses. This Example is intended to help you understand your ongoing costs (in dollars) of investing in the Funds and to compare these costs with the ongoing costs of investing in other mutual funds.
The Example is based on an investment of $1,000 invested at the beginning of the period and held for the entire period (September 1, 2013 to February 28, 2014).
Actual Expenses
The first line of the accompanying table for each fund provides information about actual account values and actual expenses. You may use the information in this line, together with the amount you invested, to estimate the expenses that you paid over the period. Simply divide your account value by $1,000.00 (for example, an $8,600 account value divided by $1,000.00 = 8.6), then multiply the result by the number in the first line for a fund under the heading entitled "Expenses Paid During Period" to estimate the expenses you paid on your account during this period. A small balance maintenance fee of $12.00 that is charged once a year may apply for certain accounts with a value of less than $2,000. This fee is not included in the table below. If it was, the estimate of expenses you paid during the period would be higher, and your ending account value lower, by this amount. In addition, each Fund, as a shareholder in the underlying Fidelity Central Funds, will indirectly bear its pro-rata share of the fees and expenses incurred by the underlying Fidelity Central Funds. These fees and expenses are not included in the Fund's annualized expense ratio used to calculate the expense estimate in the table below.
Hypothetical Example for Comparison Purposes
The second line of the accompanying table for each fund provides information about hypothetical account values and hypothetical expenses based on a fund's actual expense ratio and an assumed rate of return of 5% per year before expenses, which is not the Fund's actual return. The hypothetical account values and expenses may not be used to estimate the actual ending account balance or expenses you paid for the period. You may use this information to compare the ongoing costs of investing in the Fund and other funds. To do so, compare this 5% hypothetical example with the 5% hypothetical examples that appear in the shareholder reports of the other funds. A small balance maintenance fee of $12.00 that is charged once a year may apply for certain accounts with a value of less than $2,000. This fee is not included in the table below. If it was, the estimate of expenses you paid during the period would be higher, and your ending account value lower, by this amount. In addition, each Fund, as a shareholder in the underlying Fidelity Central Funds, will indirectly bear its pro-rata share of the fees and expenses incurred by the underlying Fidelity Central Funds. These fees and expenses are not included in the Fund's annualized expense ratio used to calculate the expense estimate in the table below.
Please note that the expenses shown in the table are meant to highlight your ongoing costs only and do not reflect any transaction costs. Therefore, the second line of the table is useful in comparing ongoing costs only, and will not help you determine the relative total costs of owning different funds. In addition, if these transactional costs were included, your costs would have been higher.
| Annualized Expense Ratio B | Beginning | Ending | Expenses Paid |
Automotive Portfolio | .82% |
|
|
|
Actual |
| $ 1,000.00 | $ 1,132.70 | $ 4.34 |
HypotheticalA |
| $ 1,000.00 | $ 1,020.73 | $ 4.11 |
Construction and Housing Portfolio | .81% |
|
|
|
Actual |
| $ 1,000.00 | $ 1,178.10 | $ 4.37 |
HypotheticalA |
| $ 1,000.00 | $ 1,020.78 | $ 4.06 |
Consumer Discretionary Portfolio | .81% |
|
|
|
Actual |
| $ 1,000.00 | $ 1,162.00 | $ 4.34 |
HypotheticalA |
| $ 1,000.00 | $ 1,020.78 | $ 4.06 |
Leisure Portfolio | .81% |
|
|
|
Actual |
| $ 1,000.00 | $ 1,190.10 | $ 4.40 |
HypotheticalA |
| $ 1,000.00 | $ 1,020.78 | $ 4.06 |
Multimedia Portfolio | .80% |
|
|
|
Actual |
| $ 1,000.00 | $ 1,199.70 | $ 4.36 |
HypotheticalA |
| $ 1,000.00 | $ 1,020.83 | $ 4.01 |
Retailing Portfolio | .82% |
|
|
|
Actual |
| $ 1,000.00 | $ 1,179.30 | $ 4.43 |
HypotheticalA |
| $ 1,000.00 | $ 1,020.73 | $ 4.11 |
A 5% return per year before expenses
B Annualized expense ratio reflects expenses net of applicable fee waivers.
* Expenses are equal to each Fund's annualized expense ratio, multiplied by the average account value over the period, multiplied by 181/365 (to reflect the one-half year period).
Annual Report
Automotive Portfolio
Performance: The Bottom Line
Average annual total return reflects the change in the value of an investment, assuming reinvestment of the fund's distributions from dividend income and capital gains (the profits earned upon the sale of securities that have grown in value, if any) and assuming a constant rate of performance each year. The $10,000 table and the fund's returns do not reflect the deduction of taxes that a shareholder would pay on fund distributions or the redemption of fund shares. During periods of reimbursement by Fidelity, a fund's total return will be greater than it would be had the reimbursement not occurred. How a fund did yesterday is no guarantee of how it will do tomorrow.
Average Annual Total Returns
Periods ended February 28, 2014 | Past 1 | Past 5 | Past 10 |
Automotive Portfolio | 42.33% | 44.68% | 7.63% |
$10,000 Over 10 Years
Let's say hypothetically that $10,000 was invested in Automotive Portfolio on February 29, 2004. The chart shows how the value of your investment would have changed, and also shows how the S&P 500® Index performed over the same period.
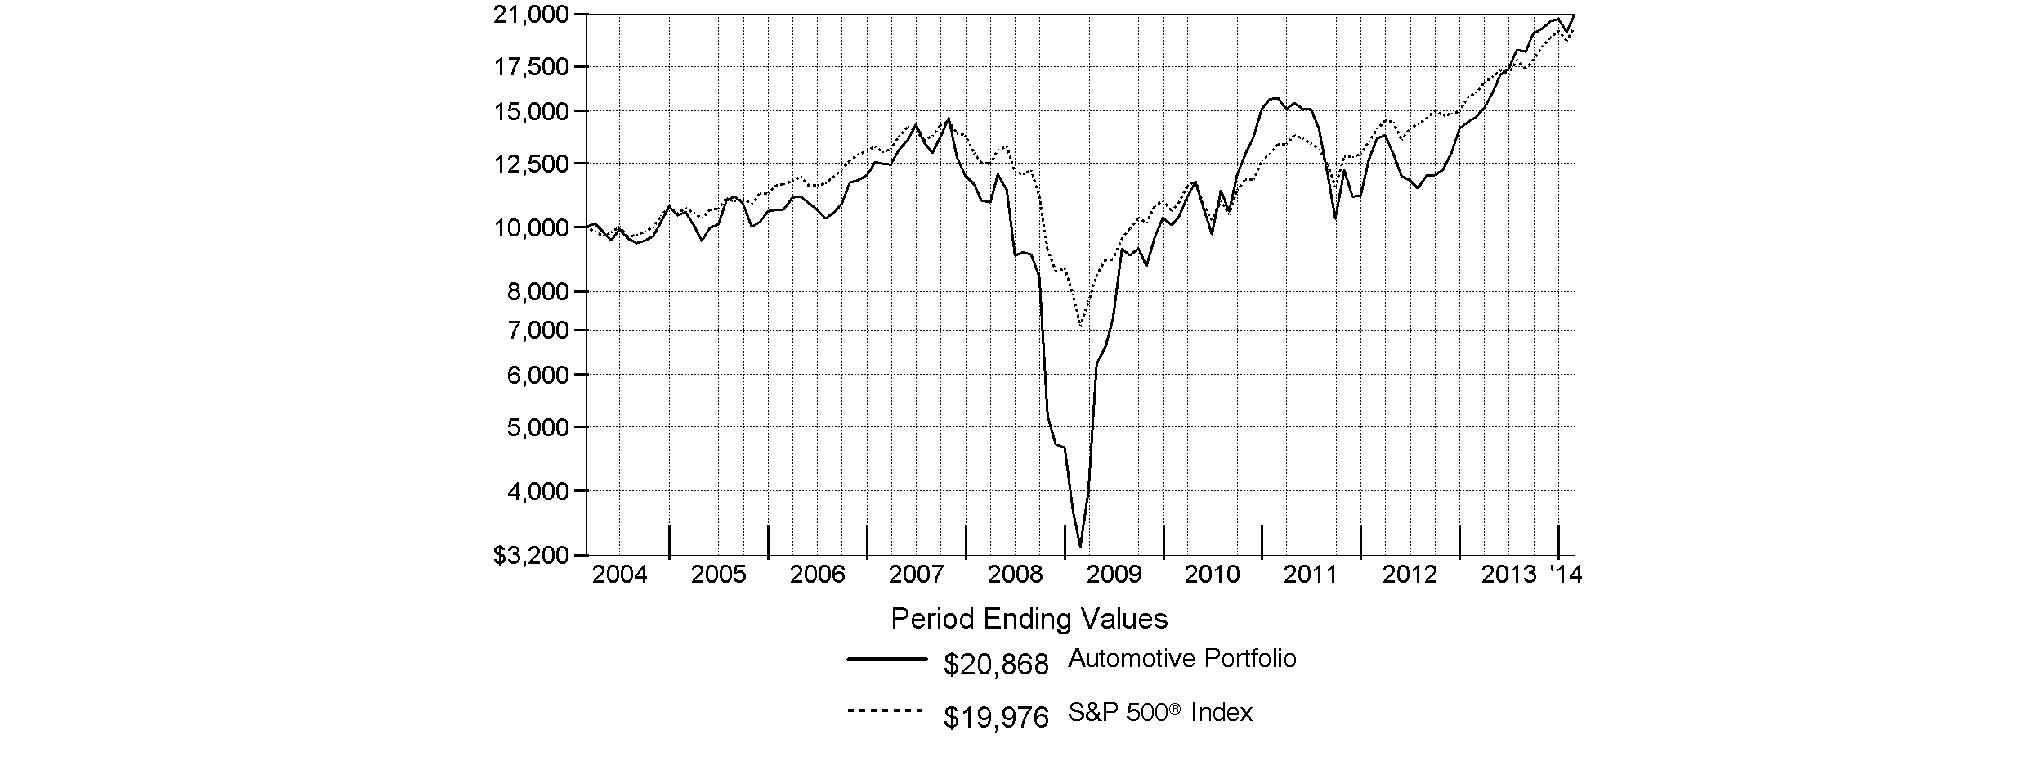
Annual Report
Automotive Portfolio
Management's Discussion of Fund Performance
Market Recap: Stocks overcame fears of higher interest rates - not to mention their worst January in four years - to finish sharply higher for the 12 months ending February 28, 2014. The broad S&P 500® Index and the blue-chip Dow Jones Industrial AverageSM gained 25.37% and 19.01%, respectively, amid generally favorable earnings reports and accommodative monetary policies worldwide. Performance generally increased along the risk spectrum, with smaller-cap and growth strategies leading the way. An ebullient market helped the growth-oriented Nasdaq Composite Index® to a 38.10% period gain, for example. On the other hand, both cyclical and defensive stocks had representation in the top-performing industry sectors: returns were highest in health care and consumer discretionary; lowest in utilities and telecommunication services. From a macroeconomic perspective, data still points to slow but steady improvement in the U.S., and Europe's recession may well be over. Reports from China have disappointed, but continue to suggest a relatively soft landing there. Mixed signals from the U.S. Federal Reserve as to when it might curtail its stimulative bond buying kept markets in flux during the spring and summer. Stocks regained momentum in October despite a federal budget impasse and brief government shutdown, and lower volatility prevailed through year-end. Shedding new-year concerns about China's economy, an emerging-markets sell-off and confirmation (at last) of Fed tapering - alongside confirmation of a presumably dovish Janet Yellen as new Fed chair - February saw stocks back in record territory, bearing down on the five-year anniversary of the market's bottom.
Comments from Annie Rosen, Portfolio Manager of Automotive Portfolio: For the year, the fund gained 42.33%, modestly behind the 42.78% result of its industry benchmark, the S&P® Custom Automobiles & Components Index, and easily outpacing the S&P 500®. Domestic car sales saw healthy sales volumes driven by a number of factors including demand from buyers who had delayed purchases in recent years and had been driving older cars. Additionally, strong gains in the broad market lifted consumer confidence, while greater access to credit and attractive lender rates boosted affordability. From a global perspective, Europe began showing signs of stability and China, the largest automotive market in world, produced stronger-than-expected new-car sales growth this year. Versus the industry benchmark, the fund missed out by not owning enough of Tesla Motors, which was by far its biggest individual detractor for the year. I added the stock to fund during the past year and upped our stake to an overweighting by period end, but it wasn't enough to offset the negative impact of being underweighted for most of the year. Shares of Tesla took off as the automaker commercialized its first electric luxury vehicle, the Model S, to rave reviews, and the company moved into profitability much earlier than investors anticipated. The fund's modest cash position, on average, also hurt. Lighter-than-benchmark allocations to Toyota and Ford were the fund's first- and second-biggest individual contributors to results, respectively. Despite Toyota's initial yen-related strength in April and May, the stock underperformed for the full year. Shares of Ford were hurt by the firm's late-2013 announcement that its 2014 pre-tax income would decrease compared with results for the prior year in the face of its many new models, particularly the aluminum-bodied F-150 pickup truck.
The views expressed above reflect those of the portfolio manager(s) only through the end of the period as stated on the cover of this report and do not necessarily represent the views of Fidelity or any other person in the Fidelity organization. Any such views are subject to change at any time based upon market or other conditions and Fidelity disclaims any responsibility to update such views. These views may not be relied on as investment advice and, because investment decisions for a Fidelity fund are based on numerous factors, may not be relied on as an indication of trading intent on behalf of any Fidelity fund.
Annual Report
Automotive Portfolio
Investment Changes (Unaudited)
Top Ten Stocks as of February 28, 2014 | ||
| % of fund's | % of fund's net assets |
Toyota Motor Corp. sponsored ADR | 11.2 | 13.2 |
Honda Motor Co. Ltd. sponsored ADR | 10.6 | 11.7 |
Delphi Automotive PLC | 6.6 | 6.4 |
Ford Motor Co. | 6.4 | 6.5 |
General Motors Co. | 6.3 | 8.6 |
Tesla Motors, Inc. | 6.2 | 3.4 |
Visteon Corp. | 4.9 | 1.9 |
BorgWarner, Inc. | 4.8 | 4.7 |
Harley-Davidson, Inc. | 4.6 | 4.9 |
Johnson Controls, Inc. | 4.2 | 4.9 |
| 65.8 | |
Top Industries (% of fund's net assets) | |||
As of February 28, 2014 | |||
 | Automobiles | 52.6% |
|
 | Auto Components | 39.6% |
|
 | Leisure Equipment & Products | 2.0% |
|
 | Distributors | 1.9% |
|
 | Commercial Services & Supplies | 1.0% |
|
 | All Others* | 2.9% |
|

As of August 31, 2013 | |||
| Automobiles | 51.7% |
|
 | Auto Components | 45.9% |
|
| All Others* | 2.4% |
|

* Includes short-term investments and net other assets (liabilities). |
Annual Report
Automotive Portfolio
Investments February 28, 2014
Showing Percentage of Net Assets
Common Stocks - 94.6% | |||
Shares | Value | ||
AUTO COMPONENTS - 39.6% | |||
Auto Parts & Equipment - 34.4% | |||
Autoliv, Inc. | 21,555 | $ 2,076,609 | |
BorgWarner, Inc. | 167,300 | 10,280,585 | |
Dana Holding Corp. | 162,200 | 3,516,496 | |
Delphi Automotive PLC | 214,078 | 14,251,172 | |
Gentex Corp. | 68,300 | 2,142,571 | |
Johnson Controls, Inc. | 181,970 | 8,989,318 | |
Magna International, Inc. Class A (sub. vtg.) | 56,884 | 5,063,719 | |
Tenneco, Inc. (a) | 134,546 | 8,105,051 | |
TRW Automotive Holdings Corp. (a) | 106,200 | 8,742,384 | |
Visteon Corp. (a) | 126,800 | 10,578,924 | |
| 73,746,829 | ||
Tires & Rubber - 5.2% | |||
Cooper Tire & Rubber Co. | 45,200 | 1,126,836 | |
Pirelli & C. S.p.A. | 124,700 | 2,168,755 | |
The Goodyear Tire & Rubber Co. | 290,126 | 7,795,686 | |
| 11,091,277 | ||
TOTAL AUTO COMPONENTS | 84,838,106 | ||
AUTOMOBILES - 49.6% | |||
Automobile Manufacturers - 45.0% | |||
Ford Motor Co. | 885,861 | 13,633,401 | |
General Motors Co. | 372,944 | 13,500,573 | |
Honda Motor Co. Ltd. sponsored ADR (e) | 630,705 | 22,736,915 | |
Hyundai Motor Co. | 30,770 | 7,068,856 | |
Tata Motors Ltd. sponsored ADR | 61,200 | 2,134,656 | |
Tesla Motors, Inc. (a)(e) | 53,900 | 13,195,259 | |
Toyota Motor Corp. sponsored ADR (e) | 208,697 | 24,062,764 | |
| 96,332,424 | ||
Motorcycle Manufacturers - 4.6% | |||
Harley-Davidson, Inc. | 148,800 | 9,829,728 | |
TOTAL AUTOMOBILES | 106,162,152 | ||
COMMERCIAL SERVICES & SUPPLIES - 1.0% | |||
Diversified Support Services - 1.0% | |||
KAR Auction Services, Inc. | 69,400 | 2,162,504 | |
DISTRIBUTORS - 1.9% | |||
Distributors - 1.9% | |||
LKQ Corp. (a) | 147,400 | 4,110,986 | |
ELECTRONIC EQUIPMENT & COMPONENTS - 0.5% | |||
Electronic Equipment & Instruments - 0.5% | |||
Research Frontiers, Inc. (a)(e) | 166,870 | 1,002,889 | |
| |||
Shares | Value | ||
LEISURE EQUIPMENT & PRODUCTS - 2.0% | |||
Leisure Products - 2.0% | |||
Brunswick Corp. | 95,900 | $ 4,295,361 | |
TOTAL COMMON STOCKS (Cost $130,832,823) |
| ||
Nonconvertible Preferred Stocks - 3.0% | |||
|
|
|
|
AUTOMOBILES - 3.0% | |||
Automobile Manufacturers - 3.0% | |||
Volkswagen AG | 24,900 |
| |
Nonconvertible Bonds - 0.0% | ||||
| Principal Amount |
| ||
AUTOMOBILES - 0.0% | ||||
Automobile Manufacturers - 0.0% | ||||
General Motors Corp. 6.75% 5/1/28 (d) | $ 31,005,000 |
| ||
Money Market Funds - 16.0% | |||
Shares |
| ||
Fidelity Cash Central Fund, 0.10% (b) | 1,058,065 | 1,058,065 | |
Fidelity Securities Lending Cash Central Fund, 0.09% (b)(c) | 33,275,100 | 33,275,100 | |
TOTAL MONEY MARKET FUNDS (Cost $34,333,165) |
| ||
TOTAL INVESTMENT PORTFOLIO - 113.6% (Cost $170,602,235) | 243,400,996 | ||
NET OTHER ASSETS (LIABILITIES) - (13.6)% | (29,173,619) | ||
NET ASSETS - 100% | $ 214,227,377 | ||
Legend |
(a) Non-income producing |
(b) Affiliated fund that is generally available only to investment companies and other accounts managed by Fidelity Investments. The rate quoted is the annualized seven-day yield of the fund at period end. A complete unaudited listing of the fund's holdings as of its most recent quarter end is available upon request. In addition, each Fidelity Central Fund's financial statements, which are not covered by the Fund's Report of Independent Registered Public Accounting Firm, are available on the SEC's website or upon request. |
(c) Investment made with cash collateral received from securities on loan. |
(d) Non-income producing - Security is in default. |
(e) Security or a portion of the security is on loan at period end. |
Affiliated Central Funds |
Information regarding fiscal year to date income earned by the Fund from investments in Fidelity Central Funds is as follows: |
Fund | Income earned |
Fidelity Cash Central Fund | $ 5,807 |
Fidelity Securities Lending Cash Central Fund | 200,757 |
Total | $ 206,564 |
Other Information |
The following is a summary of the inputs used, as of February 28, 2014, involving the Fund's assets and liabilities carried at fair value. The inputs or methodology used for valuing securities may not be an indication of the risk associated with investing in those securities. For more information on valuation inputs, and their aggregation into the levels used in the table below, please refer to the Investment Valuation section in the accompanying Notes to Financial Statements. |
Valuation Inputs at Reporting Date: | ||||
Description | Total | Level 1 | Level 2 | Level 3 |
Investments in Securities: | ||||
Common Stocks | $ 202,571,998 | $ 202,571,998 | $ - | $ - |
Nonconvertible Preferred Stocks | 6,495,830 | 6,495,830 | - | - |
Nonconvertible Bonds | 3 | - | - | 3 |
Money Market Funds | 34,333,165 | 34,333,165 | - | - |
Total Investments in Securities: | $ 243,400,996 | $ 243,400,993 | $ - | $ 3 |
Distribution of investments by country or territory of incorporation, as a percentage of total net assets, is as follows (Unaudited): |
United States of America | 60.9% |
Japan | 21.8% |
Bailiwick of Jersey | 6.6% |
Korea (South) | 3.3% |
Germany | 3.0% |
Canada | 2.4% |
Italy | 1.0% |
India | 1.0% |
| 100.0% |
See accompanying notes which are an integral part of the financial statements.
Annual Report
Automotive Portfolio
Financial Statements
Statement of Assets and Liabilities
| February 28, 2014 | |
|
|
|
Assets | ||
Investment in securities, at value (including securities loaned of $32,012,544) - See accompanying schedule: Unaffiliated issuers (cost $136,269,070) | $ 209,067,831 |
|
Fidelity Central Funds (cost $34,333,165) | 34,333,165 |
|
Total Investments (cost $170,602,235) |
| $ 243,400,996 |
Receivable for investments sold | 6,341,284 | |
Receivable for fund shares sold | 122,788 | |
Dividends receivable | 387,115 | |
Distributions receivable from Fidelity Central Funds | 10,415 | |
Prepaid expenses | 1,406 | |
Other receivables | 9,077 | |
Total assets | 250,273,081 | |
|
|
|
Liabilities | ||
Payable for fund shares redeemed | $ 2,586,744 | |
Accrued management fee | 101,584 | |
Other affiliated payables | 48,046 | |
Other payables and accrued expenses | 34,230 | |
Collateral on securities loaned, at value | 33,275,100 | |
Total liabilities | 36,045,704 | |
|
|
|
Net Assets | $ 214,227,377 | |
Net Assets consist of: |
| |
Paid in capital | $ 125,796,835 | |
Undistributed net investment income | 140,380 | |
Accumulated undistributed net realized gain (loss) on investments and foreign currency transactions | 15,492,171 | |
Net unrealized appreciation (depreciation) on investments and assets and liabilities in foreign currencies | 72,797,991 | |
Net Assets, for 3,761,716 shares outstanding | $ 214,227,377 | |
Net Asset Value, offering price and redemption price per share ($214,227,377 ÷ 3,761,716 shares) | $ 56.95 | |
Statement of Operations
| Year ended February 28, 2014 | |
|
|
|
Investment Income |
|
|
Dividends |
| $ 2,973,124 |
Interest |
| 6 |
Income from Fidelity Central Funds (including $200,757 from security lending) |
| 206,564 |
Total income |
| 3,179,694 |
|
|
|
Expenses | ||
Management fee | $ 1,393,555 | |
Transfer agent fees | 488,125 | |
Accounting and security lending fees | 105,854 | |
Custodian fees and expenses | 21,096 | |
Independent trustees' compensation | 5,453 | |
Registration fees | 52,264 | |
Audit | 39,142 | |
Legal | 3,718 | |
Interest | 824 | |
Miscellaneous | 2,541 | |
Total expenses before reductions | 2,112,572 | |
Expense reductions | (15,310) | 2,097,262 |
Net investment income (loss) | 1,082,432 | |
Realized and Unrealized Gain (Loss) Net realized gain (loss) on: | ||
Investment securities: |
|
|
Unaffiliated issuers | 31,507,669 | |
Foreign currency transactions | 2,506 | |
Total net realized gain (loss) |
| 31,510,175 |
Change in net unrealized appreciation (depreciation) on: Investment securities | 39,575,334 | |
Assets and liabilities in foreign currencies | 78 | |
Total change in net unrealized appreciation (depreciation) |
| 39,575,412 |
Net gain (loss) | 71,085,587 | |
Net increase (decrease) in net assets resulting from operations | $ 72,168,019 | |
See accompanying notes which are an integral part of the financial statements.
Annual Report
Statement of Changes in Net Assets
| Year ended | Year ended |
Increase (Decrease) in Net Assets |
|
|
Operations |
|
|
Net investment income (loss) | $ 1,082,432 | $ 795,311 |
Net realized gain (loss) | 31,510,175 | 265,086 |
Change in net unrealized appreciation (depreciation) | 39,575,412 | 1,978,742 |
Net increase (decrease) in net assets resulting from operations | 72,168,019 | 3,039,139 |
Distributions to shareholders from net investment income | (885,596) | (740,892) |
Distributions to shareholders from net realized gain | (4,386,096) | (99,972) |
Total distributions | (5,271,692) | (840,864) |
Share transactions | 346,807,270 | 113,289,906 |
Reinvestment of distributions | 4,915,856 | 802,629 |
Cost of shares redeemed | (347,373,661) | (143,364,154) |
Net increase (decrease) in net assets resulting from share transactions | 4,349,465 | (29,271,619) |
Redemption fees | 22,954 | 16,206 |
Total increase (decrease) in net assets | 71,268,746 | (27,057,138) |
|
|
|
Net Assets | ||
Beginning of period | 142,958,631 | 170,015,769 |
End of period (including undistributed net investment income of $140,380 and accumulated net investment loss of $89, respectively) | $ 214,227,377 | $ 142,958,631 |
Other Information Shares | ||
Sold | 6,778,630 | 2,953,140 |
Issued in reinvestment of distributions | 89,039 | 21,299 |
Redeemed | (6,622,397) | (3,926,750) |
Net increase (decrease) | 245,272 | (952,311) |
Financial Highlights
Years ended February 28, | 2014 | 2013 | 2012 F | 2011 | 2010 |
Selected Per-Share Data |
|
|
|
|
|
Net asset value, beginning of period | $ 40.65 | $ 38.05 | $ 46.87 | $ 31.63 | $ 10.07 |
Income from Investment Operations |
|
|
|
|
|
Net investment income (loss) B | .22 | .24 | .03 | (.08) | (.06) |
Net realized and unrealized gain (loss) | 16.96 | 2.65 | (6.45) | 15.94 | 21.67 |
Total from investment operations | 17.18 | 2.89 | (6.42) | 15.86 | 21.61 |
Distributions from net investment income | (.15) | (.26) | (.02) | - | (.07) |
Distributions from net realized gain | (.73) | (.02) | (2.41) | (.63) | - |
Total distributions | (.88) | (.29) I | (2.42) H | (.63) | (.07) |
Redemption fees added to paid in capital B | - G | - G | .02 | .01 | .02 |
Net asset value, end of period | $ 56.95 | $ 40.65 | $ 38.05 | $ 46.87 | $ 31.63 |
Total Return A | 42.33% | 7.64% | (13.06)% | 50.90% | 215.39% |
Ratios to Average Net Assets C, E |
|
|
|
|
|
Expenses before reductions | .84% | .91% | .90% | .91% | .99% |
Expenses net of fee waivers, if any | .84% | .91% | .90% | .91% | .99% |
Expenses net of all reductions | .83% | .89% | .90% | .91% | .97% |
Net investment income (loss) | .43% | .66% | .08% | (.19)% | (.23)% |
Supplemental Data |
|
|
|
|
|
Net assets, end of period (000 omitted) | $ 214,227 | $ 142,959 | $ 170,016 | $ 373,632 | $ 146,023 |
Portfolio turnover rate D | 148% | 72% | 49% | 91% | 156% |
A Total returns would have been lower if certain expenses had not been reduced during the applicable periods shown.
B Calculated based on average shares outstanding during the period.
C Fees and expenses of any underlying Fidelity Central Funds are not included in the Fund's expense ratio. The Fund indirectly bears its proportionate share of the expenses of any underlying Fidelity Central Funds.
D Amount does not include the portfolio activity of any underlying Fidelity Central Funds.
E Expense ratios reflect operating expenses of the Fund. Expenses before reductions do not reflect amounts reimbursed by the investment adviser or reductions from brokerage service arrangements or reductions from other expense offset arrangements and do not represent the amount paid by the Fund during periods when reimbursements or reductions occur. Expenses net of fee waivers reflect expenses after reimbursement by the investment adviser but prior to reductions from brokerage service arrangements or other expense offset arrangements. Expenses net of all reductions represent the net expenses paid by the Fund.
F For the year ended February 29.
G Amount represents less than $.01 per share.
H Total distributions of $2.42 per share is comprised of distributions from net investment income of $0.015 and distributions from net realized gain of $2.408 per share.
I Total distributions of $.29 per share is comprised of distributions from net investment income of $0.261 and distributions from net realized gain of $0.024 per share.
See accompanying notes which are an integral part of the financial statements.
Annual Report
Construction and Housing Portfolio
Performance: The Bottom Line
Average annual total return reflects the change in the value of an investment, assuming reinvestment of the fund's distributions from dividend income and capital gains (the profits earned upon the sale of securities that have grown in value, if any) and assuming a constant rate of performance each year. The $10,000 table and the fund's returns do not reflect the deduction of taxes that a shareholder would pay on fund distributions or the redemption of fund shares. During periods of reimbursement by Fidelity, a fund's total return will be greater than it would be had the reimbursement not occurred. How a fund did yesterday is no guarantee of how it will do tomorrow.
Average Annual Total Returns
Periods ended February 28, 2014 | Past 1 | Past 5 | Past 10 |
Construction and Housing Portfolio | 19.84% | 29.16% | 9.51% |
$10,000 Over 10 Years
Let's say hypothetically that $10,000 was invested in Construction and Housing Portfolio on February 29, 2004. The chart shows how the value of your investment would have changed, and also shows how the S&P 500 Index performed over the same period.
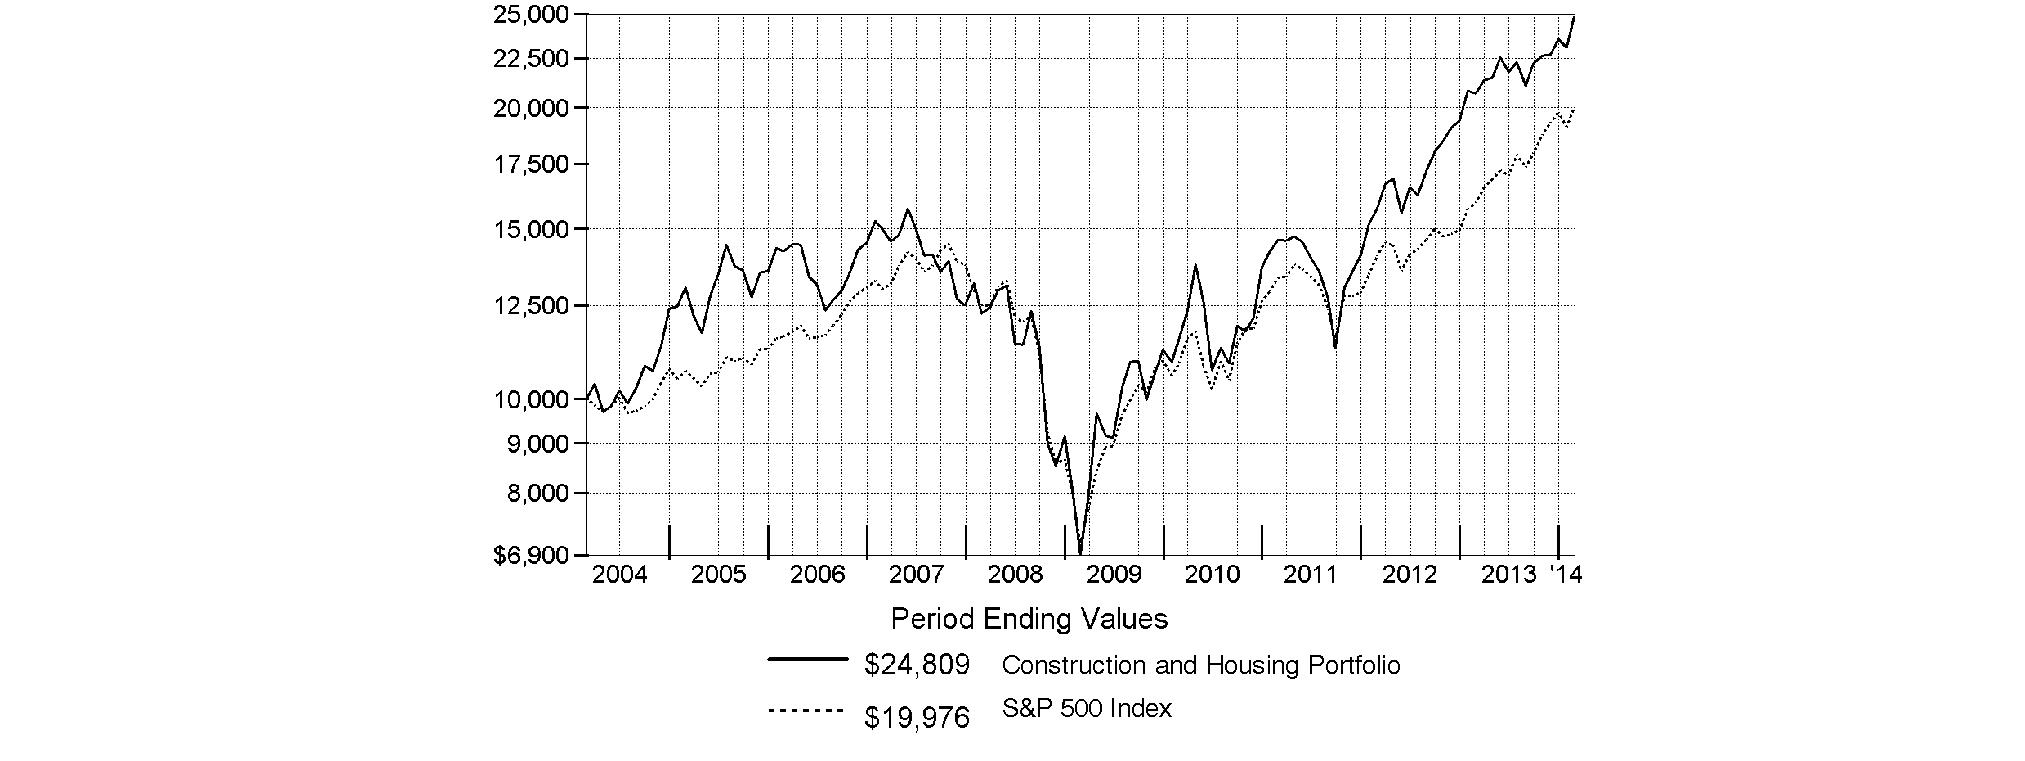
Annual Report
Construction and Housing Portfolio
Management's Discussion of Fund Performance
Market Recap: Stocks overcame fears of higher interest rates - not to mention their worst January in four years - to finish sharply higher for the 12 months ending February 28, 2014. The broad S&P 500® Index and the blue-chip Dow Jones Industrial AverageSM gained 25.37% and 19.01%, respectively, amid generally favorable earnings reports and accommodative monetary policies worldwide. Performance generally increased along the risk spectrum, with smaller-cap and growth strategies leading the way. An ebullient market helped the growth-oriented Nasdaq Composite Index® to a 38.10% period gain, for example. On the other hand, both cyclical and defensive stocks had representation in the top-performing industry sectors: returns were highest in health care and consumer discretionary; lowest in utilities and telecommunication services. From a macroeconomic perspective, data still points to slow but steady improvement in the U.S., and Europe's recession may well be over. Reports from China have disappointed, but continue to suggest a relatively soft landing there. Mixed signals from the U.S. Federal Reserve as to when it might curtail its stimulative bond buying kept markets in flux during the spring and summer. Stocks regained momentum in October despite a federal budget impasse and brief government shutdown, and lower volatility prevailed through year-end. Shedding new-year concerns about China's economy, an emerging-markets sell-off and confirmation (at last) of Fed tapering - alongside confirmation of a presumably dovish Janet Yellen as new Fed chair - February saw stocks back in record territory, bearing down on the five-year anniversary of the market's bottom.
Comments from Holger Boerner, Portfolio Manager of Construction and Housing Portfolio: For the year, the fund returned 19.84% versus 20.34% for its industry benchmark, the MSCI® U.S. IMI Construction & Housing 25-50 Index, and 25.37% for the broad-based S&P 500®. Within the MSCI industry benchmark, the residential real estate investment trusts (REITs) and homebuilding segments were pressured by rising interest rates, while building products suppliers and home improvement retail [retailers] benefited as spending on remodeling rose. An underweighting in residential REITs aided performance versus the industry benchmark, as did stock picks in construction & engineering. Top individual contributors included an out-of-index stake in Generac Holdings that rallied when sales of its standby generators surpassed expectations. Not owning student housing REIT and index component American Campus Community also helped, as near-term challenges pressured earnings and the stock. By contrast, security selection in the building products and home improvement retail groups detracted. Individual disappointments included homebuilder PulteGroup and thrift & mortgage finance company Walker & Dunlop. The fund had an overweighting in PulteGroup when it lagged, but no exposure when it outperformed. Walker & Dunlop's shares fell due to reduced lending volume from government-sponsored entities. American Campus, PulteGroup and Walker & Dunlop were not held at period end.
The views expressed above reflect those of the portfolio manager(s) only through the end of the period as stated on the cover of this report and do not necessarily represent the views of Fidelity or any other person in the Fidelity organization. Any such views are subject to change at any time based upon market or other conditions and Fidelity disclaims any responsibility to update such views. These views may not be relied on as investment advice and, because investment decisions for a Fidelity fund are based on numerous factors, may not be relied on as an indication of trading intent on behalf of any Fidelity fund.
Annual Report
Construction and Housing Portfolio
Investment Changes (Unaudited)
Top Ten Stocks as of February 28, 2014 | ||
| % of fund's | % of fund's net assets |
Home Depot, Inc. | 23.9 | 24.6 |
Lowe's Companies, Inc. | 10.0 | 12.2 |
Lennar Corp. Class A | 3.8 | 2.4 |
Vulcan Materials Co. | 3.7 | 2.9 |
Masco Corp. | 3.6 | 2.9 |
Jacobs Engineering Group, Inc. | 3.6 | 2.6 |
Essex Property Trust, Inc. | 3.3 | 2.8 |
Quanta Services, Inc. | 3.2 | 2.8 |
Mid-America Apartment Communities, Inc. | 3.2 | 1.7 |
Fortune Brands Home & Security, Inc. | 3.1 | 2.6 |
| 61.4 | |
Top Industries (% of fund's net assets) | |||
As of February 28, 2014 | |||
| Specialty Retail | 34.6% |
|
| Real Estate Investment Trusts | 15.7% |
|
| Construction & Engineering | 15.7% |
|
| Household Durables | 13.2% |
|
| Building Products | 8.9% |
|
| All Others* | 11.9% |
|

As of August 31, 2013 | |||
| Specialty Retail | 37.5% |
|
| Real Estate Investment Trusts | 14.5% |
|
| Construction & Engineering | 13.6% |
|
| Household Durables | 13.5% |
|
| Building Products | 8.1% |
|
| All Others* | 12.8% |
|

* Includes short-term investments and net other assets (liabilities). |
Annual Report
Construction and Housing Portfolio
Investments February 28, 2014
Showing Percentage of Net Assets
Common Stocks - 98.5% | |||
Shares | Value | ||
BUILDING PRODUCTS - 8.9% | |||
Building Products - 8.9% | |||
A.O. Smith Corp. | 92,600 | $ 4,602,220 | |
Armstrong World Industries, Inc. (a) | 70,500 | 3,869,745 | |
Fortune Brands Home & Security, Inc. | 244,700 | 11,437,278 | |
Masco Corp. | 585,000 | 13,659,750 | |
| 33,568,993 | ||
CONSTRUCTION & ENGINEERING - 15.7% | |||
Construction & Engineering - 15.7% | |||
AECOM Technology Corp. (a) | 238,600 | 7,620,884 | |
EMCOR Group, Inc. | 210,300 | 9,837,834 | |
Fluor Corp. | 27,149 | 2,109,206 | |
Jacobs Engineering Group, Inc. (a) | 224,450 | 13,612,893 | |
MasTec, Inc. (a) | 222,100 | 9,092,774 | |
Quanta Services, Inc. (a) | 344,600 | 12,133,366 | |
Tutor Perini Corp. (a) | 189,736 | 4,676,992 | |
| 59,083,949 | ||
CONSTRUCTION MATERIALS - 6.4% | |||
Construction Materials - 6.4% | |||
Eagle Materials, Inc. | 115,700 | 10,227,880 | |
Vulcan Materials Co. | 205,165 | 13,936,858 | |
| 24,164,738 | ||
ELECTRICAL EQUIPMENT - 1.8% | |||
Electrical Components & Equipment - 1.8% | |||
Generac Holdings, Inc. | 121,026 | 6,894,851 | |
HOUSEHOLD DURABLES - 12.2% | |||
Homebuilding - 12.2% | |||
KB Home (d) | 404,200 | 8,245,680 | |
Lennar Corp. Class A (d) | 326,428 | 14,323,661 | |
Ryland Group, Inc. | 177,570 | 8,272,986 | |
Taylor Morrison Home Corp. | 156,018 | 3,919,172 | |
Taylor Wimpey PLC | 1,361,100 | 2,849,038 | |
Toll Brothers, Inc. (a) | 210,614 | 8,216,052 | |
| 45,826,589 | ||
PAPER & FOREST PRODUCTS - 1.2% | |||
Forest Products - 1.2% | |||
Boise Cascade Co. | 148,500 | 4,394,115 | |
REAL ESTATE INVESTMENT TRUSTS - 15.7% | |||
Residential REITs - 15.0% | |||
American Homes 4 Rent Class A | 42,900 | 702,702 | |
Apartment Investment & Management Co. Class A | 236,071 | 7,056,162 | |
AvalonBay Communities, Inc. | 50,659 | 6,533,491 | |
Equity Residential (SBI) | 128,792 | 7,530,468 | |
Essex Property Trust, Inc. | 75,200 | 12,577,200 | |
| |||
Shares | Value | ||
Mid-America Apartment Communities, Inc. | 178,165 | $ 12,051,081 | |
UDR, Inc. | 387,400 | 9,998,794 | |
| 56,449,898 | ||
Specialized REITs - 0.7% | |||
Weyerhaeuser Co. | 91,500 | 2,700,165 | |
TOTAL REAL ESTATE INVESTMENT TRUSTS | 59,150,063 | ||
REAL ESTATE MANAGEMENT & DEVELOPMENT - 2.0% | |||
Real Estate Operating Companies - 2.0% | |||
Forest City Enterprises, Inc. Class A (a) | 384,600 | 7,492,008 | |
SPECIALTY RETAIL - 34.6% | |||
Computer & Electronics Retail - 0.7% | |||
Best Buy Co., Inc. | 105,300 | 2,804,139 | |
Home Improvement Retail - 33.9% | |||
Home Depot, Inc. | 1,094,661 | 89,795,042 | |
Lowe's Companies, Inc. | 755,534 | 37,799,366 | |
| 127,594,408 | ||
TOTAL SPECIALTY RETAIL | 130,398,547 | ||
TOTAL COMMON STOCKS (Cost $256,343,521) |
| ||
Convertible Preferred Stocks - 1.0% | |||
|
|
|
|
HOUSEHOLD DURABLES - 1.0% | |||
Homebuilding - 1.0% | |||
Blu Homes, Inc. Series A, 5.00% (e) | 865,801 |
| |
Money Market Funds - 2.3% | |||
|
|
|
|
Fidelity Cash Central Fund, 0.10% (b) | 298,416 | 298,416 | |
Fidelity Securities Lending Cash Central Fund, 0.09% (b)(c) | 8,412,675 | 8,412,675 | |
TOTAL MONEY MARKET FUNDS (Cost $8,711,091) |
| ||
TOTAL INVESTMENT PORTFOLIO - 101.8% (Cost $269,054,613) | 383,684,945 | ||
NET OTHER ASSETS (LIABILITIES) - (1.8)% | (6,934,706) | ||
NET ASSETS - 100% | $ 376,750,239 | ||
Legend |
(a) Non-income producing |
(b) Affiliated fund that is generally available only to investment companies and other accounts managed by Fidelity Investments. The rate quoted is the annualized seven-day yield of the fund at period end. A complete unaudited listing of the fund's holdings as of its most recent quarter end is available upon request. In addition, each Fidelity Central Fund's financial statements, which are not covered by the Fund's Report of Independent Registered Public Accounting Firm, are available on the SEC's website or upon request. |
(c) Investment made with cash collateral received from securities on loan. |
(d) Security or a portion of the security is on loan at period end. |
(e) Restricted securities - Investment in securities not registered under the Securities Act of 1933 (excluding 144A issues). At the end of the period, the value of restricted securities (excluding 144A issues) amounted to $4,000,001 or 1.0% of net assets. |
Additional information on each restricted holding is as follows: |
Security | Acquisition Date | Acquisition Cost |
Blu Homes, Inc. Series A, 5.00% | 6/10/13 | $ 4,000,001 |
Affiliated Central Funds |
Information regarding fiscal year to date income earned by the Fund from investments in Fidelity Central Funds is as follows: |
Fund | Income earned |
Fidelity Cash Central Fund | $ 3,640 |
Fidelity Securities Lending Cash Central Fund | 72,804 |
Total | $ 76,444 |
Other Information |
The following is a summary of the inputs used, as of February 28, 2014, involving the Fund's assets and liabilities carried at fair value. The inputs or methodology used for valuing securities may not be an indication of the risk associated with investing in those securities. For more information on valuation inputs, and their aggregation into the levels used in the tables below, please refer to the Security Valuation section in the accompanying Notes to Financial Statements. |
Valuation Inputs at Reporting Date: | ||||
Description | Total | Level 1 | Level 2 | Level 3 |
Investments in Securities: | ||||
Common Stocks | $ 370,973,853 | $ 370,973,853 | $ - | $ - |
Convertible Preferred Stocks | 4,000,001 | - | - | 4,000,001 |
Money Market Funds | 8,711,091 | 8,711,091 | - | - |
Total Investments in Securities: | $ 383,684,945 | $ 379,684,944 | $ - | $ 4,000,001 |
Valuation Inputs at Reporting Date: |
The following is a reconciliation of Investments in Securities for which Level 3 inputs were used in determining value: |
Investments in Securities: | |
Convertible Preferred Stocks | |
Beginning Balance | $ - |
Total Realized Gain (Loss) | - |
Total Unrealized Gain (Loss) | - |
Cost of Purchases | 4,000,001 |
Proceeds of Sales | - |
Amortization/Accretion | - |
Transfers in to Level 3 | - |
Transfers out of Level 3 | - |
Ending Balance | $ 4,000,001 |
The change in unrealized gain (loss) for the period attributable to Level 3 securities held at February 28, 2014 | $ - |
The information used in the above reconciliation represents fiscal year to date activity for any Investments in Securities identified as using Level 3 inputs at either the beginning or the end of the current fiscal period. Transfers in or out of Level 3 represent the beginning value of any Security or Instrument where a change in the pricing level occurred from the beginning to the end of the period. The cost of purchases and the proceeds of sales may include securities received or delivered through corporate actions or exchanges. Realized and unrealized gains (losses) disclosed in the reconciliation are included in Net Gain (Loss) on the Fund's Statement of Operations. |
See accompanying notes which are an integral part of the financial statements.
Annual Report
Construction and Housing Portfolio
Financial Statements
Statement of Assets and Liabilities
| February 28, 2014 | |
|
|
|
Assets | ||
Investment in securities, at value (including securities loaned of $8,076,476) - See accompanying schedule: Unaffiliated issuers (cost $260,343,522) | $ 374,973,854 |
|
Fidelity Central Funds (cost $8,711,091) | 8,711,091 |
|
Total Investments (cost $269,054,613) |
| $ 383,684,945 |
Cash |
| 79,010 |
Receivable for investments sold | 4,997,489 | |
Receivable for fund shares sold | 1,104,502 | |
Dividends receivable | 67,555 | |
Distributions receivable from Fidelity Central Funds | 1,153 | |
Prepaid expenses | 3,936 | |
Other receivables | 9,281 | |
Total assets | 389,947,871 | |
|
|
|
Liabilities | ||
Payable for investments purchased | $ 2,938,925 | |
Payable for fund shares redeemed | 1,569,574 | |
Accrued management fee | 167,503 | |
Other affiliated payables | 75,091 | |
Other payables and accrued expenses | 33,864 | |
Collateral on securities loaned, at value | 8,412,675 | |
Total liabilities | 13,197,632 | |
|
|
|
Net Assets | $ 376,750,239 | |
Net Assets consist of: |
| |
Paid in capital | $ 247,627,108 | |
Undistributed net investment income | 293,999 | |
Accumulated undistributed net realized gain (loss) on investments and foreign currency transactions | 14,198,588 | |
Net unrealized appreciation (depreciation) on investments and assets and liabilities in foreign currencies | 114,630,544 | |
Net Assets, for 6,554,582 shares outstanding | $ 376,750,239 | |
Net Asset Value, offering price and redemption price per share ($376,750,239 ÷ 6,554,582 shares) | $ 57.48 | |
Statement of Operations
| Year ended February 28, 2014 | |
|
|
|
Investment Income |
|
|
Dividends |
| $ 7,411,028 |
Income from Fidelity Central Funds (including $72,804 from security lending) |
| 76,444 |
Total income |
| 7,487,472 |
|
|
|
Expenses | ||
Management fee | $ 3,226,030 | |
Transfer agent fees | 1,163,015 | |
Accounting and security lending fees | 221,193 | |
Custodian fees and expenses | 28,272 | |
Independent trustees' compensation | 10,253 | |
Registration fees | 56,687 | |
Audit | 39,298 | |
Legal | 11,405 | |
Interest | 4,356 | |
Miscellaneous | 6,754 | |
Total expenses before reductions | 4,767,263 | |
Expense reductions | (35,734) | 4,731,529 |
Net investment income (loss) | 2,755,943 | |
Realized and Unrealized Gain (Loss) Net realized gain (loss) on: | ||
Investment securities: |
|
|
Unaffiliated issuers | 67,752,913 | |
Foreign currency transactions | 4,418 | |
Total net realized gain (loss) |
| 67,757,331 |
Change in net unrealized appreciation (depreciation) on: Investment securities | 21,804,512 | |
Assets and liabilities in foreign currencies | (972) | |
Total change in net unrealized appreciation (depreciation) |
| 21,803,540 |
Net gain (loss) | 89,560,871 | |
Net increase (decrease) in net assets resulting from operations | $ 92,316,814 | |
See accompanying notes which are an integral part of the financial statements.
Annual Report
Statement of Changes in Net Assets
| Year ended | Year ended |
Increase (Decrease) in Net Assets |
|
|
Operations |
|
|
Net investment income (loss) | $ 2,755,943 | $ 1,422,445 |
Net realized gain (loss) | 67,757,331 | 13,168,598 |
Change in net unrealized appreciation (depreciation) | 21,803,540 | 77,122,286 |
Net increase (decrease) in net assets resulting from operations | 92,316,814 | 91,713,329 |
Distributions to shareholders from net investment income | (2,143,451) | (1,172,487) |
Distributions to shareholders from net realized gain | (30,955,679) | (4,637,838) |
Total distributions | (33,099,130) | (5,810,325) |
Share transactions | 257,018,640 | 698,619,193 |
Reinvestment of distributions | 31,832,059 | 5,599,926 |
Cost of shares redeemed | (752,370,411) | (180,705,745) |
Net increase (decrease) in net assets resulting from share transactions | (463,519,712) | 523,513,374 |
Redemption fees | 45,240 | 76,720 |
Total increase (decrease) in net assets | (404,256,788) | 609,493,098 |
|
|
|
Net Assets | ||
Beginning of period | 781,007,027 | 171,513,929 |
End of period (including undistributed net investment income of $293,999 and undistributed net investment income of $139,301, respectively) | $ 376,750,239 | $ 781,007,027 |
Other Information Shares | ||
Sold | 4,703,955 | 14,575,583 |
Issued in reinvestment of distributions | 601,082 | 115,773 |
Redeemed | (13,768,181) | (3,960,211) |
Net increase (decrease) | (8,463,144) | 10,731,145 |
Financial Highlights
Years ended February 28, | 2014 | 2013 | 2012 F | 2011 | 2010 |
Selected Per-Share Data |
|
|
|
|
|
Net asset value, beginning of period | $ 52.01 | $ 40.01 | $ 37.43 | $ 29.89 | $ 18.01 |
Income from Investment Operations |
|
|
|
|
|
Net investment income (loss) B | .26 | .19 | .21 | .18 | .22 |
Net realized and unrealized gain (loss) | 9.65 | 12.47 | 2.62 | 7.63 | 11.91 |
Total from investment operations | 9.91 | 12.66 | 2.83 | 7.81 | 12.13 |
Distributions from net investment income | (.30) | (.14) | (.25) | (.28) | (.25) |
Distributions from net realized gain | (4.14) | (.53) | - | - | - |
Total distributions | (4.44) | (.67) | (.25) | (.28) | (.25) |
Redemption fees added to paid in capital B | - G | .01 | - G | .01 | - G |
Net asset value, end of period | $ 57.48 | $ 52.01 | $ 40.01 | $ 37.43 | $ 29.89 |
Total Return A | 19.84% | 31.79% | 7.65% | 26.24% | 67.46% |
Ratios to Average Net Assets C, E |
|
|
|
|
|
Expenses before reductions | .81% | .86% | .96% | .98% | 1.01% |
Expenses net of fee waivers, if any | .81% | .86% | .96% | .98% | 1.01% |
Expenses net of all reductions | .81% | .86% | .96% | .98% | 1.01% |
Net investment income (loss) | .47% | .42% | .59% | .55% | .84% |
Supplemental Data |
|
|
|
|
|
Net assets, end of period (000 omitted) | $ 376,750 | $ 781,007 | $ 171,514 | $ 112,200 | $ 99,562 |
Portfolio turnover rate D | 53% | 47% | 81% | 101% | 82% |
A Total returns would have been lower if certain expenses had not been reduced during the applicable periods shown.
B Calculated based on average shares outstanding during the period.
C Fees and expenses of any underlying Fidelity Central Funds are not included in the Fund's expense ratio. The Fund indirectly bears its proportionate share of the expenses of any underlying Fidelity Central Funds.
D Amount does not include the portfolio activity of any underlying Fidelity Central Funds.
E Expense ratios reflect operating expenses of the Fund. Expenses before reductions do not reflect amounts reimbursed by the investment adviser or reductions from brokerage service arrangements or reductions from other expense offset arrangements and do not represent the amount paid by the Fund during periods when reimbursements or reductions occur. Expenses net of fee waivers reflect expenses after reimbursement by the investment adviser but prior to reductions from brokerage service arrangements or other expense offset arrangements. Expenses net of all reductions represent the net expenses paid by the Fund.
F For the year ended February 29.
G Amount represents less than $.01 per share.
See accompanying notes which are an integral part of the financial statements.
Annual Report
Consumer Discretionary Portfolio
Performance: The Bottom Line
Average annual total return reflects the change in the value of an investment, assuming reinvestment of the fund's distributions from dividend income and capital gains (the profits earned upon the sale of securities that have grown in value, if any) and assuming a constant rate of performance each year. The $10,000 table and the fund's returns do not reflect the deduction of taxes that a shareholder would pay on fund distributions or the redemption of fund shares. During periods of reimbursement by Fidelity, a fund's total return will be greater than it would be had the reimbursement not occurred. How a fund did yesterday is no guarantee of how it will do tomorrow.
Average Annual Total Returns
Periods ended February 28, 2014 | Past 1 | Past 5 | Past 10 |
Consumer Discretionary Portfolio A | 32.17% | 29.06% | 8.50% |
A Prior to October 1, 2006, Consumer Discretionary Portfolio was named Consumer Industries Portfolio, and the fund operated under certain different investment policies and compared its performance to a different additional index. The fund's historical performance may not represent its current investment policies.
$10,000 Over 10 Years
Let's say hypothetically that $10,000 was invested in Consumer Discretionary Portfolio on February 29, 2004. The chart shows how the value of your investment would have changed, and also shows how the S&P 500 Index performed over the same period.
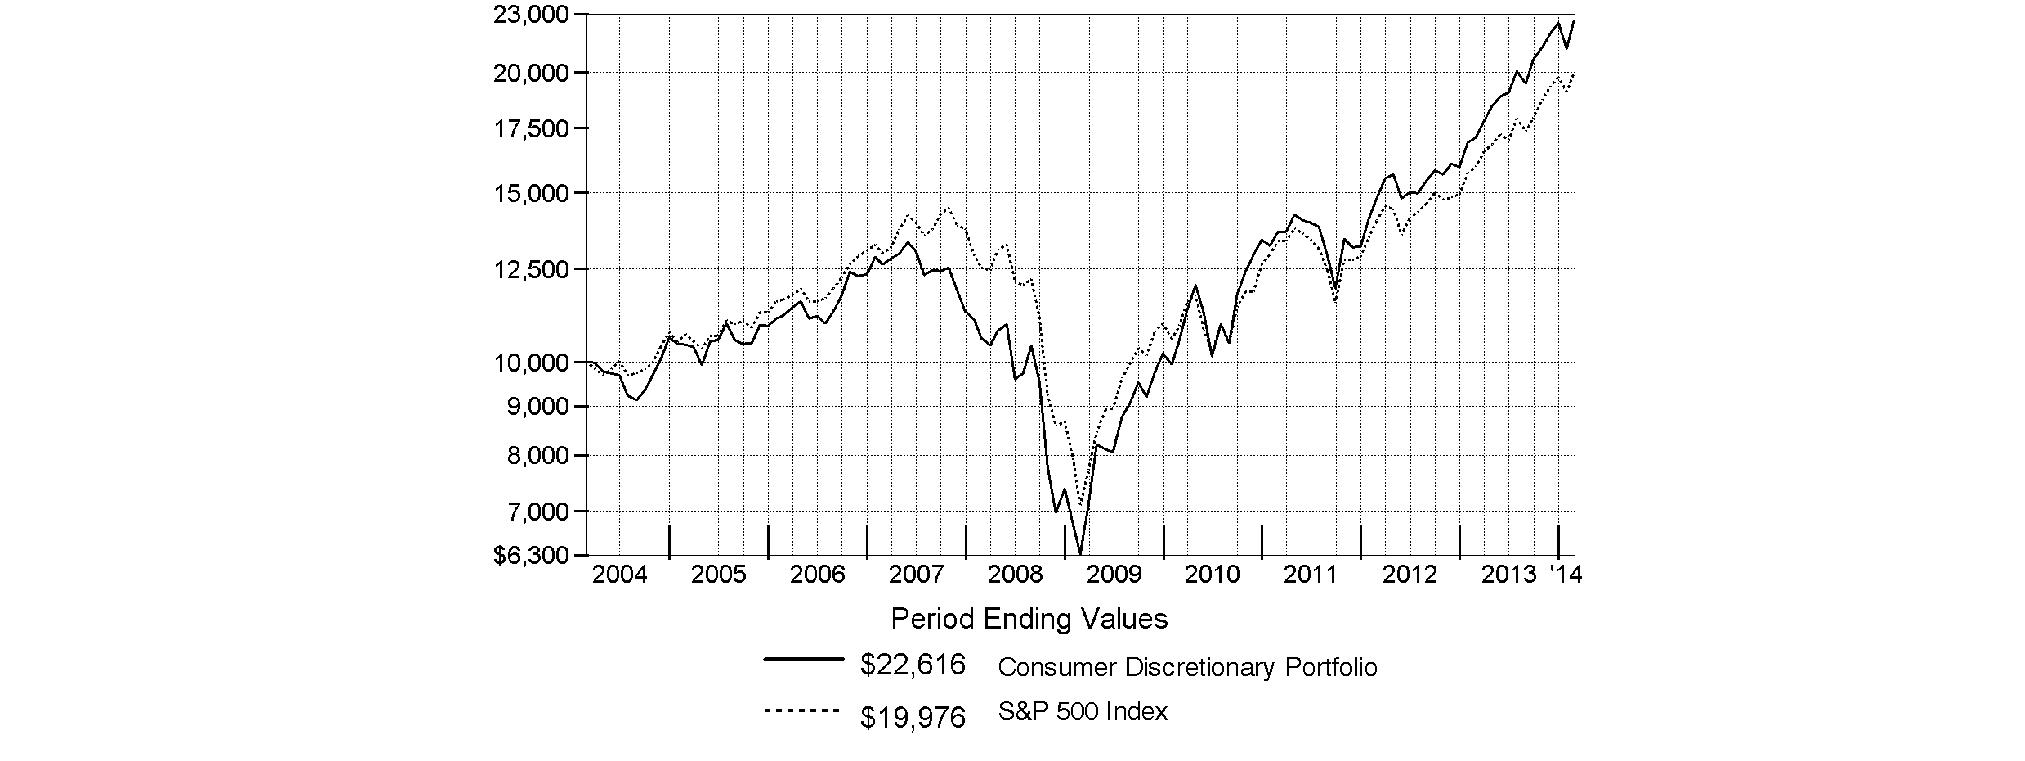
Annual Report
Consumer Discretionary Portfolio
Management's Discussion of Fund Performance
Market Recap: Stocks overcame fears of higher interest rates - not to mention their worst January in four years - to finish sharply higher for the 12 months ending February 28, 2014. The broad S&P 500® Index and the blue-chip Dow Jones Industrial AverageSM gained 25.37% and 19.01%, respectively, amid generally favorable earnings reports and accommodative monetary policies worldwide. Performance generally increased along the risk spectrum, with smaller-cap and growth strategies leading the way. An ebullient market helped the growth-oriented Nasdaq Composite Index® to a 38.10% period gain, for example. On the other hand, both cyclical and defensive stocks had representation in the top-performing industry sectors: returns were highest in health care and consumer discretionary; lowest in utilities and telecommunication services. From a macroeconomic perspective, data still points to slow but steady improvement in the U.S., and Europe's recession may well be over. Reports from China have disappointed, but continue to suggest a relatively soft landing there. Mixed signals from the U.S. Federal Reserve as to when it might curtail its stimulative bond buying kept markets in flux during the spring and summer. Stocks regained momentum in October despite a federal budget impasse and brief government shutdown, and lower volatility prevailed through year-end. Shedding new-year concerns about China's economy, an emerging-markets sell-off and confirmation (at last) of Fed tapering - alongside confirmation of a presumably dovish Janet Yellen as new Fed chair - February saw stocks back in record territory, bearing down on the five-year anniversary of the market's bottom.
Comments from Gordon Scott, Portfolio Manager of Consumer Discretionary Portfolio: For the year, the fund rose 32.17%, trailing the 35.34% gain of the MSCI® U.S. IMI Consumer Discretionary 25-50 Index but nicely outpacing the broad-based S&P 500®. The global macroeconomic backdrop remained supportive of consumer discretionary earnings and stock performance. Improving economic fundamentals in the U.S., a recovery in housing- and automobile-related industries, and economic stabilization in the eurozone all helped to temper a weak holiday sales season and support the sector's ongoing outperformance. Positioning in the cable & satellite group hurt the most versus the sector index, especially Comcast, which I sold in November once it reached my price target. In apparel retail, teen fashion retailer American Eagle Outfitters faced headwinds ranging from declining mall traffic to a major earnings miss in August. I exited the position in October following a review of the company's competitive characteristics, which no longer met my criteria for durable returns on capital. On the plus side, the fund benefited from its large average underweighting in fast-food chain McDonald's, as the stock lagged the index because investors favored growth-oriented names. By the end of 2013, the stock dropped to under $100 per share - which appealed to me in both absolute and relative terms - so I was comfortable building an overweighted stake at an attractive entry point. Elsewhere, my research led me to avoid auto manufacturers, including index name Ford Motor, and instead invest in distributors, suppliers and parts retailers, such as LKQ and AutoZone - decisions that contributed to relative performance. Note that I sold LKQ near period end once its price exceeded my target.
The views expressed above reflect those of the portfolio manager(s) only through the end of the period as stated on the cover of this report and do not necessarily represent the views of Fidelity or any other person in the Fidelity organization. Any such views are subject to change at any time based upon market or other conditions and Fidelity disclaims any responsibility to update such views. These views may not be relied on as investment advice and, because investment decisions for a Fidelity fund are based on numerous factors, may not be relied on as an indication of trading intent on behalf of any Fidelity fund.
Annual Report
Consumer Discretionary Portfolio
Investment Changes (Unaudited)
Top Ten Stocks as of February 28, 2014 | ||
| % of fund's | % of fund's net assets |
The Walt Disney Co. | 6.4 | 4.6 |
McDonald's Corp. | 4.4 | 0.0 |
Dollar General Corp. | 4.3 | 3.0 |
Twenty-First Century Fox, Inc. Class A | 4.3 | 4.9 |
Yum! Brands, Inc. | 3.7 | 3.1 |
DIRECTV | 3.5 | 0.0 |
Dollar Tree, Inc. | 3.3 | 2.5 |
Time Warner, Inc. | 3.2 | 3.6 |
Lowe's Companies, Inc. | 3.1 | 3.7 |
Ross Stores, Inc. | 2.9 | 1.7 |
| 39.1 | |
Top Industries (% of fund's net assets) | |||
As of February 28, 2014 | |||
| Media | 25.2% |
|
| Specialty Retail | 20.7% |
|
| Hotels, Restaurants & Leisure | 16.8% |
|
| Textiles, Apparel & Luxury Goods | 11.2% |
|
| Multiline Retail | 10.0% |
|
| All Others* | 16.1% |
|

As of August 31, 2013 | |||
| Specialty Retail | 31.6% |
|
| Media | 23.4% |
|
| Textiles, Apparel & Luxury Goods | 12.3% |
|
| Hotels, Restaurants & Leisure | 11.0% |
|
| Internet & Catalog Retail | 5.5% |
|
| All Others* | 16.2% |
|

* Includes short-term investments and net other assets (liabilities). |
Annual Report
Consumer Discretionary Portfolio
Investments February 28, 2014
Showing Percentage of Net Assets
Common Stocks - 99.9% | |||
Shares | Value | ||
AUTO COMPONENTS - 4.0% | |||
Auto Parts & Equipment - 4.0% | |||
Delphi Automotive PLC | 171,606 | $ 11,423,811 | |
Johnson Controls, Inc. | 221,231 | 10,928,811 | |
| 22,352,622 | ||
COMMERCIAL SERVICES & SUPPLIES - 2.1% | |||
Diversified Support Services - 2.1% | |||
KAR Auction Services, Inc. | 376,776 | 11,740,340 | |
HOTELS, RESTAURANTS & LEISURE - 16.8% | |||
Hotels, Resorts & Cruise Lines - 3.4% | |||
Marriott International, Inc. Class A | 103,450 | 5,610,094 | |
Wyndham Worldwide Corp. | 184,104 | 13,417,500 | |
| 19,027,594 | ||
Restaurants - 13.4% | |||
Bloomin' Brands, Inc. (a) | 135,743 | 3,412,579 | |
Burger King Worldwide, Inc. (d) | 438,363 | 11,651,689 | |
McDonald's Corp. | 258,923 | 24,636,523 | |
Starbucks Corp. | 63,834 | 4,529,661 | |
Texas Roadhouse, Inc. Class A | 383,785 | 10,151,113 | |
Yum! Brands, Inc. | 274,393 | 20,327,033 | |
| 74,708,598 | ||
TOTAL HOTELS, RESTAURANTS & LEISURE | 93,736,192 | ||
HOUSEHOLD DURABLES - 4.7% | |||
Homebuilding - 2.8% | |||
NVR, Inc. (a) | 13,066 | 15,574,672 | |
Housewares & Specialties - 1.9% | |||
Jarden Corp. (a) | 172,161 | 10,582,737 | |
TOTAL HOUSEHOLD DURABLES | 26,157,409 | ||
INTERNET & CATALOG RETAIL - 4.6% | |||
Internet Retail - 4.6% | |||
Liberty Interactive Corp. Series A (a) | 384,947 | 11,240,452 | |
priceline.com, Inc. (a) | 10,518 | 14,187,099 | |
| 25,427,551 | ||
INTERNET SOFTWARE & SERVICES - 0.6% | |||
Internet Software & Services - 0.6% | |||
eBay, Inc. (a) | 61,000 | 3,584,970 | |
MEDIA - 25.2% | |||
Broadcasting - 0.6% | |||
Liberty Media Corp. Class A (a) | 24,400 | 3,346,704 | |
Cable & Satellite - 6.9% | |||
DIRECTV (a) | 250,086 | 19,406,674 | |
| |||
Shares | Value | ||
DISH Network Corp. Class A (a) | 88,058 | $ 5,181,333 | |
Liberty Global PLC Class A (a) | 164,444 | 14,232,628 | |
| 38,820,635 | ||
Movies & Entertainment - 17.7% | |||
The Madison Square Garden Co. Class A (a) | 148,647 | 8,474,365 | |
The Walt Disney Co. | 444,747 | 35,940,004 | |
Time Warner, Inc. | 265,405 | 17,816,638 | |
Twenty-First Century Fox, Inc. Class A | 709,489 | 23,796,261 | |
Viacom, Inc. Class B (non-vtg.) | 143,100 | 12,554,163 | |
| 98,581,431 | ||
TOTAL MEDIA | 140,748,770 | ||
MULTILINE RETAIL - 10.0% | |||
General Merchandise Stores - 10.0% | |||
Dollar General Corp. (a) | 397,541 | 23,812,706 | |
Dollar Tree, Inc. (a) | 337,731 | 18,497,527 | |
Target Corp. | 219,311 | 13,715,710 | |
| 56,025,943 | ||
SPECIALTY RETAIL - 20.7% | |||
Apparel Retail - 9.1% | |||
Abercrombie & Fitch Co. Class A (d) | 81,708 | 3,238,088 | |
Foot Locker, Inc. | 372,596 | 15,540,979 | |
Ross Stores, Inc. | 225,934 | 16,447,995 | |
TJX Companies, Inc. | 251,695 | 15,469,175 | |
| 50,696,237 | ||
Automotive Retail - 1.0% | |||
AutoZone, Inc. (a) | 3,293 | 1,773,083 | |
O'Reilly Automotive, Inc. (a) | 24,335 | 3,670,935 | |
| 5,444,018 | ||
Home Improvement Retail - 3.1% | |||
Lowe's Companies, Inc. | 349,647 | 17,492,839 | |
Homefurnishing Retail - 1.8% | |||
Williams-Sonoma, Inc. | 167,573 | 9,759,452 | |
Specialty Stores - 5.7% | |||
Cabela's, Inc. Class A (a) | 160,833 | 10,666,445 | |
Dick's Sporting Goods, Inc. | 134,757 | 7,232,408 | |
PetSmart, Inc. | 148,572 | 9,963,238 | |
Sally Beauty Holdings, Inc. (a) | 140,904 | 4,043,945 | |
| 31,906,036 | ||
TOTAL SPECIALTY RETAIL | 115,298,582 | ||
TEXTILES, APPAREL & LUXURY GOODS - 11.2% | |||
Apparel, Accessories & Luxury Goods - 8.6% | |||
Fossil Group, Inc. (a) | 58,334 | 6,703,160 | |
PVH Corp. | 90,652 | 11,461,132 | |
Ralph Lauren Corp. | 65,130 | 10,491,140 | |
Swatch Group AG (Bearer) (Reg.) | 77,761 | 9,142,112 | |
VF Corp. | 172,738 | 10,120,719 | |
| 47,918,263 | ||
Common Stocks - continued | |||
Shares | Value | ||
TEXTILES, APPAREL & LUXURY GOODS - CONTINUED | |||
Footwear - 2.6% | |||
NIKE, Inc. Class B | 87,775 | $ 6,872,783 | |
Wolverine World Wide, Inc. | 282,610 | 7,449,600 | |
| 14,322,383 | ||
TOTAL TEXTILES, APPAREL & LUXURY GOODS | 62,240,646 | ||
TOTAL COMMON STOCKS (Cost $446,343,124) |
| ||
Money Market Funds - 0.8% | |||
|
|
|
|
Fidelity Cash Central Fund, 0.10% (b) | 218,162 | 218,162 | |
Fidelity Securities Lending Cash Central Fund, 0.09% (b)(c) | 4,329,375 | 4,329,375 | |
TOTAL MONEY MARKET FUNDS (Cost $4,547,537) |
| ||
TOTAL INVESTMENT PORTFOLIO - 100.7% (Cost $450,890,661) | 561,860,562 | ||
NET OTHER ASSETS (LIABILITIES) - (0.7)% | (3,992,255) | ||
NET ASSETS - 100% | $ 557,868,307 | ||
Legend |
(a) Non-income producing |
(b) Affiliated fund that is generally available only to investment companies and other accounts managed by Fidelity Investments. The rate quoted is the annualized seven-day yield of the fund at period end. A complete unaudited listing of the fund's holdings as of its most recent quarter end is available upon request. In addition, each Fidelity Central Fund's financial statements, which are not covered by the Fund's Report of Independent Registered Public Accounting Firm, are available on the SEC's website or upon request. |
(c) Investment made with cash collateral received from securities on loan. |
(d) Security or a portion of the security is on loan at period end. |
Affiliated Central Funds |
Information regarding fiscal year to date income earned by the Fund from investments in Fidelity Central Funds is as follows: |
Fund | Income earned |
Fidelity Cash Central Fund | $ 8,650 |
Fidelity Securities Lending Cash Central Fund | 36,881 |
Total | $ 45,531 |
Other Information |
All investments are categorized as Level 1 under the Fair Value Hierarchy. The inputs or methodology used for valuing securities may not be an indication of the risk associated with investing in those securities. For more information on valuation inputs, please refer to the Investment Valuation section in the accompanying Notes to Financial Statements. |
See accompanying notes which are an integral part of the financial statements.
Annual Report
Consumer Discretionary Portfolio
Financial Statements
Statement of Assets and Liabilities
| February 28, 2014 | |
|
|
|
Assets | ||
Investment in securities, at value (including securities loaned of $4,244,190) - See accompanying schedule: Unaffiliated issuers (cost $446,343,124) | $ 557,313,025 |
|
Fidelity Central Funds (cost $4,547,537) | 4,547,537 |
|
Total Investments (cost $450,890,661) |
| $ 561,860,562 |
Receivable for investments sold | 1,733,683 | |
Receivable for fund shares sold | 579,344 | |
Dividends receivable | 584,631 | |
Distributions receivable from Fidelity Central Funds | 736 | |
Prepaid expenses | 2,800 | |
Other receivables | 19,331 | |
Total assets | 564,781,087 | |
|
|
|
Liabilities | ||
Payable for investments purchased | $ 1,050,055 | |
Payable for fund shares redeemed | 1,119,964 | |
Accrued management fee | 251,369 | |
Other affiliated payables | 111,372 | |
Other payables and accrued expenses | 50,645 | |
Collateral on securities loaned, at value | 4,329,375 | |
Total liabilities | 6,912,780 | |
|
|
|
Net Assets | $ 557,868,307 | |
Net Assets consist of: |
| |
Paid in capital | $ 412,633,849 | |
Undistributed net investment income | 210,307 | |
Accumulated undistributed net realized gain (loss) on investments and foreign currency transactions | 34,054,250 | |
Net unrealized appreciation (depreciation) on investments | 110,969,901 | |
Net Assets, for 16,750,346 shares outstanding | $ 557,868,307 | |
Net Asset Value, offering price and redemption price per share ($557,868,307 ÷ 16,750,346 shares) | $ 33.30 | |
Statement of Operations
| Year ended February 28, 2014 | |
|
|
|
Investment Income |
|
|
Dividends |
| $ 4,919,474 |
Income from Fidelity Central Funds (including $36,881 from security lending) |
| 45,531 |
Total income |
| 4,965,005 |
|
|
|
Expenses | ||
Management fee | $ 2,877,818 | |
Transfer agent fees | 1,062,066 | |
Accounting and security lending fees | 198,901 | |
Custodian fees and expenses | 23,292 | |
Independent trustees' compensation | 10,148 | |
Registration fees | 52,120 | |
Audit | 43,496 | |
Legal | 7,958 | |
Interest | 908 | |
Miscellaneous | 5,422 | |
Total expenses before reductions | 4,282,129 | |
Expense reductions | (53,491) | 4,228,638 |
Net investment income (loss) | 736,367 | |
Realized and Unrealized Gain (Loss) Net realized gain (loss) on: | ||
Investment securities: |
|
|
Unaffiliated issuers | 91,268,719 | |
Foreign currency transactions | 4,318 | |
Total net realized gain (loss) |
| 91,273,037 |
Change in net unrealized appreciation (depreciation) on investment securities | 44,699,651 | |
Net gain (loss) | 135,972,688 | |
Net increase (decrease) in net assets resulting from operations | $ 136,709,055 | |
See accompanying notes which are an integral part of the financial statements.
Annual Report
Statement of Changes in Net Assets
| Year ended | Year ended |
Increase (Decrease) in Net Assets |
|
|
Operations |
|
|
Net investment income (loss) | $ 736,367 | $ 1,389,581 |
Net realized gain (loss) | 91,273,037 | 32,698,179 |
Change in net unrealized appreciation (depreciation) | 44,699,651 | 14,080,239 |
Net increase (decrease) in net assets resulting from operations | 136,709,055 | 48,167,999 |
Distributions to shareholders from net investment income | (578,657) | (1,423,771) |
Distributions to shareholders from net realized gain | (47,823,082) | (28,825,549) |
Total distributions | (48,401,739) | (30,249,320) |
Share transactions | 207,782,224 | 157,798,400 |
Reinvestment of distributions | 47,650,396 | 29,828,221 |
Cost of shares redeemed | (183,807,571) | (86,154,173) |
Net increase (decrease) in net assets resulting from share transactions | 71,625,049 | 101,472,448 |
Redemption fees | 10,981 | 9,795 |
Total increase (decrease) in net assets | 159,943,346 | 119,400,922 |
|
|
|
Net Assets | ||
Beginning of period | 397,924,961 | 278,524,039 |
End of period (including undistributed net investment income of $210,307 and undistributed net investment income of $71,669, respectively) | $ 557,868,307 | $ 397,924,961 |
Other Information Shares | ||
Sold | 6,567,558 | 5,875,814 |
Issued in reinvestment of distributions | 1,476,762 | 1,171,513 |
Redeemed | (5,817,316) | (3,249,221) |
Net increase (decrease) | 2,227,004 | 3,798,106 |
Financial Highlights
Years ended February 28, | 2014 | 2013 | 2012 F | 2011 | 2010 |
Selected Per-Share Data |
|
|
|
|
|
Net asset value, beginning of period | $ 27.40 | $ 25.97 | $ 24.98 | $ 19.37 | $ 11.67 |
Income from Investment Operations |
|
|
|
|
|
Net investment income (loss) B | .04 | .11 | .17 | .05 | .06 |
Net realized and unrealized gain (loss) | 8.67 | 3.70 | 1.91 | 5.71 | 7.70 |
Total from investment operations | 8.71 | 3.81 | 2.08 | 5.76 | 7.76 |
Distributions from net investment income | (.03) | (.11) | (.12) | (.05) | (.06) |
Distributions from net realized gain | (2.77) | (2.27) | (.97) | (.10) | - |
Total distributions | (2.81) H | (2.38) | (1.09) | (.15) | (.06) |
Redemption fees added to paid in capital B, G | - | - | - | - | - |
Net asset value, end of period | $ 33.30 | $ 27.40 | $ 25.97 | $ 24.98 | $ 19.37 |
Total Return A | 32.17% | 15.38% | 8.67% | 29.75% | 66.54% |
Ratios to Average Net Assets C, E |
|
|
|
|
|
Expenses before reductions | .82% | .86% | .89% | .96% | 1.10% |
Expenses net of fee waivers, if any | .82% | .86% | .89% | .96% | 1.10% |
Expenses net of all reductions | .81% | .84% | .88% | .95% | 1.08% |
Net investment income (loss) | .14% | .43% | .72% | .23% | .37% |
Supplemental Data |
|
|
|
|
|
Net assets, end of period (000 omitted) | $ 557,868 | $ 397,925 | $ 278,524 | $ 203,083 | $ 77,011 |
Portfolio turnover rate D | 138% | 170% | 174% | 196% | 134% |
A Total returns would have been lower if certain expenses had not been reduced during the applicable periods shown.
B Calculated based on average shares outstanding during the period.
C Fees and expenses of any underlying Fidelity Central Funds are not included in the Fund's expense ratio. The Fund indirectly bears its proportionate share of the expenses of any underlying Fidelity Central Funds.
D Amount does not include the portfolio activity of any underlying Fidelity Central Funds.
E Expense ratios reflect operating expenses of the Fund. Expenses before reductions do not reflect amounts reimbursed by the investment adviser or reductions from brokerage service arrangements or reductions from other expense offset arrangements and do not represent the amount paid by the Fund during periods when reimbursements or reductions occur. Expenses net of fee waivers reflect expenses after reimbursement by the investment adviser but prior to reductions from brokerage service arrangements or other expense offset arrangements. Expenses net of all reductions represent the net expenses paid by the Fund.
F For the year ended February 29.
G Amount represents less than $.01 per share.
H Total distributions of $2.81 per share is comprised of distributions from net investment income of $.034 and distributions from net realized gain of $2.772 per share.
See accompanying notes which are an integral part of the financial statements.
Annual Report
Leisure Portfolio
Performance: The Bottom Line
Average annual total return reflects the change in the value of an investment, assuming reinvestment of the fund's distributions from dividend income and capital gains (the profits earned upon the sale of securities that have grown in value, if any) and assuming a constant rate of performance each year. The $10,000 table and the fund's returns do not reflect the deduction of taxes that a shareholder would pay on fund distributions or the redemption of fund shares. During periods of reimbursement by Fidelity, a fund's total return will be greater than it would be had the reimbursement not occurred. How a fund did yesterday is no guarantee of how it will do tomorrow.
Average Annual Total Returns
Periods ended February 28, 2014 | Past 1 | Past 5 | Past 10 |
Leisure Portfolio | 34.71% | 27.60% | 11.27% |
$10,000 Over 10 Years
Let's say hypothetically that $10,000 was invested in Leisure Portfolio on February 29, 2004. The chart shows how the value of your investment would have changed, and also shows how the S&P 500 Index performed over the same period.
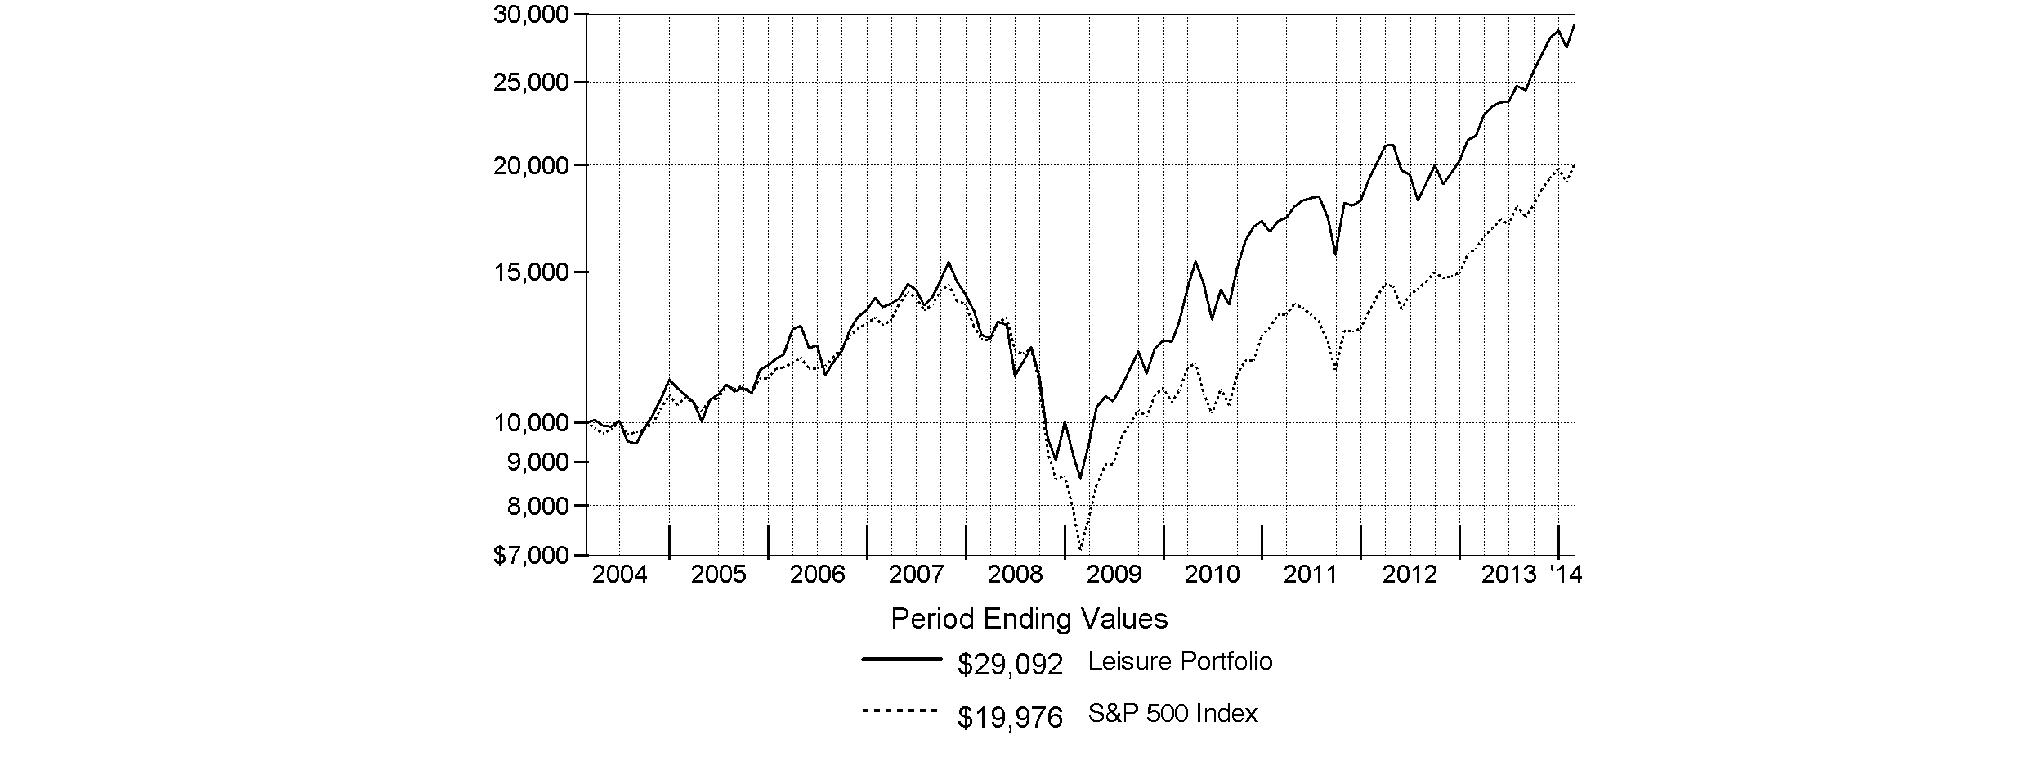
Annual Report
Leisure Portfolio
Management's Discussion of Fund Performance
Market Recap: Stocks overcame fears of higher interest rates - not to mention their worst January in four years - to finish sharply higher for the 12 months ending February 28, 2014. The broad S&P 500® Index and the blue-chip Dow Jones Industrial AverageSM gained 25.37% and 19.01%, respectively, amid generally favorable earnings reports and accommodative monetary policies worldwide. Performance generally increased along the risk spectrum, with smaller-cap and growth strategies leading the way. An ebullient market helped the growth-oriented Nasdaq Composite Index® to a 38.10% period gain, for example. On the other hand, both cyclical and defensive stocks had representation in the top-performing industry sectors: returns were highest in health care and consumer discretionary; lowest in utilities and telecommunication services. From a macroeconomic perspective, data still points to slow but steady improvement in the U.S., and Europe's recession may well be over. Reports from China have disappointed, but continue to suggest a relatively soft landing there. Mixed signals from the U.S. Federal Reserve as to when it might curtail its stimulative bond buying kept markets in flux during the spring and summer. Stocks regained momentum in October despite a federal budget impasse and brief government shutdown, and lower volatility prevailed through year-end. Shedding new-year concerns about China's economy, an emerging-markets sell-off and confirmation (at last) of Fed tapering - alongside confirmation of a presumably dovish Janet Yellen as new Fed chair - February saw stocks back in record territory, bearing down on the five-year anniversary of the market's bottom.
Comments from Katherine Shaw, who became sole Portfolio Manager of Leisure Portfolio on February 1, 2014, after serving as Co-Manager: For the year, the fund gained 34.71%, solidly outperforming the 31.08% return of its industry benchmark, the MSCI® U.S. IMI Consumer Services 25-50 Index, and the broad-based S&P 500®. Stock selection was the biggest driver of results relative to the MSCI® index. The fund's overweighting in casino operator Las Vegas Sands was among the top contributors. The company experienced improved margins and has significantly improved its return of cash to shareholders with increased dividends and stock buybacks. Elsewhere, holdings in restaurants - where I added substantially to the fund's weighting within this subindustry - proved highly beneficial. Underweighting fast-food retailer McDonald's was by far the biggest relative contributor. As the stock declined, I bought additional shares to keep my positioning in McDonald's in check, as a percentage of assets, because I did not want my underweighting to grow larger than my intended bet. Even though McDonald's is still among the fund's largest positions at period end, it remains an underweighting, as I believe I can find similarly valued companies with improving margins or cheaper valuations that offer the same or better growth. Turning to other contributing restaurant names, Jack in the Box and Brinker International, the latter of which owns franchises such as Chili's Grill & Bar and Maggiano's Little Italy, were both additive overweightings. These companies saw margins expand, especially as the U.S. consumer strengthened and food costs stabilized, and the stocks performed well. Core holding Starbucks, a high-end coffee retailer and our largest holding, also performed very well and provided a lift. The company's solid top-line results both in the U.S. and abroad, and its growing margins, buoyed by higher consumer demand and the two-year decline in coffee prices, helped propel the stock. On the downside, the fund's stock selection in casinos & gaming was the largest detractor. Here, the fund just didn't own enough companies with exposure to Macau. Specifically, we didn't own index stock MGM Resorts International and held a lighter-than-index stake in Wynn Resorts. As the period progressed, I increased the fund's exposure to Wynn, but I continued to avoid MGM Resorts, believing I could find better growth opportunities at more reasonable valuations. Bally Technologies, a provider of equipment to casinos, also detracted. However, at period end, I still believed in the prospects for Bally, as demand for its products in the long-term should improve.
The views expressed above reflect those of the portfolio manager(s) only through the end of the period as stated on the cover of this report and do not necessarily represent the views of Fidelity or any other person in the Fidelity organization. Any such views are subject to change at any time based upon market or other conditions and Fidelity disclaims any responsibility to update such views. These views may not be relied on as investment advice and, because investment decisions for a Fidelity fund are based on numerous factors, may not be relied on as an indication of trading intent on behalf of any Fidelity fund.
Annual Report
Leisure Portfolio
Investment Changes (Unaudited)
Top Ten Stocks as of February 28, 2014 | ||
| % of fund's | % of fund's net assets |
Starbucks Corp. | 14.0 | 16.3 |
McDonald's Corp. | 10.1 | 12.8 |
Las Vegas Sands Corp. | 9.8 | 7.6 |
Yum! Brands, Inc. | 9.6 | 4.1 |
Wyndham Worldwide Corp. | 5.5 | 7.2 |
Starwood Hotels & Resorts Worldwide, Inc. | 4.8 | 3.4 |
Jack in the Box, Inc. | 3.9 | 1.6 |
Bally Technologies, Inc. | 3.2 | 1.4 |
Panera Bread Co. Class A | 3.2 | 2.1 |
Chipotle Mexican Grill, Inc. | 3.2 | 2.6 |
| 67.3 | |
Top Industries (% of fund's net assets) | |||
As of February 28, 2014 | |||
| Hotels, Restaurants & Leisure | 91.9% |
|
| Diversified Consumer Services | 2.5% |
|
| Media | 1.9% |
|
| Real Estate Investment Trusts | 0.9% |
|
| Commercial Services & Supplies | 0.7% |
|
| All Others* | 2.1% |
|

As of August 31, 2013 | |||
| Hotels, Restaurants & Leisure | 87.1% |
|
| Diversified Consumer Services | 3.8% |
|
| Media | 2.8% |
|
| Software | 1.4% |
|
| Leisure Equipment & Products | 1.2% |
|
| All Others* | 3.7% |
|

* Includes short-term investments and net other assets (liabilities). |
Annual Report
Leisure Portfolio
Investments February 28, 2014
Showing Percentage of Net Assets
Common Stocks - 98.5% | |||
Shares | Value | ||
COMMERCIAL SERVICES & SUPPLIES - 0.7% | |||
Diversified Support Services - 0.7% | |||
KAR Auction Services, Inc. | 127,400 | $ 3,969,784 | |
DIVERSIFIED CONSUMER SERVICES - 2.5% | |||
Specialized Consumer Services - 2.5% | |||
H&R Block, Inc. | 155,800 | 4,929,512 | |
Steiner Leisure Ltd. (a) | 203,644 | 9,005,138 | |
| 13,934,650 | ||
HOTELS, RESTAURANTS & LEISURE - 91.9% | |||
Casinos & Gaming - 18.0% | |||
Bally Technologies, Inc. (a) | 270,700 | 18,339,925 | |
Las Vegas Sands Corp. | 652,276 | 55,606,529 | |
Melco Crown Entertainment Ltd. sponsored ADR (a) | 107,970 | 4,634,072 | |
MGM China Holdings Ltd. | 684,400 | 2,919,077 | |
Penn National Gaming, Inc. (a) | 422,112 | 5,424,139 | |
Wynn Resorts Ltd. | 64,100 | 15,543,609 | |
| 102,467,351 | ||
Hotels, Resorts & Cruise Lines - 14.0% | |||
Extended Stay America, Inc. unit | 174,800 | 4,453,904 | |
Marriott International, Inc. Class A | 306,800 | 16,637,764 | |
Starwood Hotels & Resorts Worldwide, Inc. | 329,900 | 27,203,554 | |
Wyndham Worldwide Corp. | 426,000 | 31,046,880 | |
| 79,342,102 | ||
Leisure Facilities - 0.7% | |||
Cedar Fair LP (depositary unit) | 80,588 | 4,287,282 | |
Restaurants - 59.2% | |||
Bloomin' Brands, Inc. (a) | 186,122 | 4,679,107 | |
Bravo Brio Restaurant Group, Inc. (a) | 144,169 | 2,233,178 | |
Brinker International, Inc. | 258,400 | 14,212,000 | |
Chipotle Mexican Grill, Inc. (a) | 31,510 | 17,809,767 | |
Del Frisco's Restaurant Group, Inc. (a) | 174,930 | 4,555,177 | |
Denny's Corp. (a) | 16,672 | 113,370 | |
Domino's Pizza, Inc. | 135,000 | 10,673,100 | |
Dunkin' Brands Group, Inc. | 50,000 | 2,583,500 | |
Fiesta Restaurant Group, Inc. (a) | 80,800 | 4,058,584 | |
Jack in the Box, Inc. (a) | 387,400 | 22,256,130 | |
McDonald's Corp. | 605,000 | 57,565,750 | |
Panera Bread Co. Class A (a) | 98,786 | 17,911,878 | |
Papa John's International, Inc. | 120,170 | 6,116,653 | |
Red Robin Gourmet Burgers, Inc. (a) | 97,119 | 7,568,484 | |
Ruth's Hospitality Group, Inc. | 541,154 | 6,688,663 | |
Sonic Corp. (a) | 281,100 | 5,728,818 | |
Starbucks Corp. | 1,123,600 | 79,730,655 | |
Texas Roadhouse, Inc. Class A | 278,208 | 7,358,602 | |
The Cheesecake Factory, Inc. | 145,000 | 6,890,400 | |
| |||
Shares | Value | ||
Whitbread PLC | 40,319 | $ 3,029,451 | |
Yum! Brands, Inc. | 733,500 | 54,337,680 | |
| 336,100,947 | ||
TOTAL HOTELS, RESTAURANTS & LEISURE | 522,197,682 | ||
MEDIA - 1.9% | |||
Broadcasting - 0.5% | |||
CBS Corp. Class B | 44,700 | 2,998,476 | |
Cable & Satellite - 0.5% | |||
DIRECTV (a) | 36,925 | 2,865,380 | |
Movies & Entertainment - 0.9% | |||
Twenty-First Century Fox, Inc. Class A | 99,500 | 3,337,230 | |
Viacom, Inc. Class B (non-vtg.) | 19,500 | 1,710,735 | |
| 5,047,965 | ||
TOTAL MEDIA | 10,911,821 | ||
REAL ESTATE INVESTMENT TRUSTS - 0.9% | |||
Specialized REITs - 0.9% | |||
Gaming & Leisure Properties | 138,586 | 5,277,355 | |
SOFTWARE - 0.4% | |||
Application Software - 0.4% | |||
Intuit, Inc. | 26,500 | 2,070,975 | |
TEXTILES, APPAREL & LUXURY GOODS - 0.2% | |||
Footwear - 0.2% | |||
Deckers Outdoor Corp. (a) | 13,400 | 996,290 | |
TOTAL COMMON STOCKS (Cost $345,343,070) |
| ||
Money Market Funds - 0.6% | |||
|
|
|
|
Fidelity Cash Central Fund, 0.10% (b) | 3,663,528 |
| |
TOTAL INVESTMENT PORTFOLIO - 99.1% (Cost $349,006,598) | 563,022,085 | ||
NET OTHER ASSETS (LIABILITIES) - 0.9% | 5,127,350 | ||
NET ASSETS - 100% | $ 568,149,435 | ||
Legend |
(a) Non-income producing |
(b) Affiliated fund that is generally available only to investment companies and other accounts managed by Fidelity Investments. The rate quoted is the annualized seven-day yield of the fund at period end. A complete unaudited listing of the fund's holdings as of its most recent quarter end is available upon request. In addition, each Fidelity Central Fund's financial statements, which are not covered by the Fund's Report of Independent Registered Public Accounting Firm, are available on the SEC's website or upon request. |
Affiliated Central Funds |
Information regarding fiscal year to date income earned by the Fund from investments in Fidelity Central Funds is as follows: |
Fund | Income earned |
Fidelity Cash Central Fund | $ 5,956 |
Fidelity Securities Lending Cash Central Fund | 216,237 |
Total | $ 222,193 |
Other Information |
All investments are categorized as Level 1 under the Fair Value Hierarchy. The inputs or methodology used for valuing securities may not be an indication of the risk associated with investing in those securities. For more information on valuation inputs, please refer to the Investment Valuation section in the accompanying Notes to Financial Statements. |
See accompanying notes which are an integral part of the financial statements.
Annual Report
Leisure Portfolio
Financial Statements
Statement of Assets and Liabilities
| February 28, 2014 | |
|
|
|
Assets | ||
Investment in securities, at value - See accompanying schedule: Unaffiliated issuers (cost $345,343,070) | $ 559,358,557 |
|
Fidelity Central Funds (cost $3,663,528) | 3,663,528 |
|
Total Investments (cost $349,006,598) |
| $ 563,022,085 |
Receivable for investments sold | 6,757,449 | |
Receivable for fund shares sold | 456,446 | |
Dividends receivable | 562,506 | |
Distributions receivable from Fidelity Central Funds | 62 | |
Prepaid expenses | 2,027 | |
Other receivables | 11,539 | |
Total assets | 570,812,114 | |
|
|
|
Liabilities | ||
Payable for investments purchased | $ 1,618,015 | |
Payable for fund shares redeemed | 647,603 | |
Accrued management fee | 253,578 | |
Other affiliated payables | 106,991 | |
Other payables and accrued expenses | 36,492 | |
Total liabilities | 2,662,679 | |
|
|
|
Net Assets | $ 568,149,435 | |
Net Assets consist of: |
| |
Paid in capital | $ 340,757,890 | |
Undistributed net investment income | 1,312,554 | |
Accumulated undistributed net realized gain (loss) on investments and foreign currency transactions | 12,063,428 | |
Net unrealized appreciation (depreciation) on investments and assets and liabilities in foreign currencies | 214,015,563 | |
Net Assets, for 4,206,743 shares outstanding | $ 568,149,435 | |
Net Asset Value, offering price and redemption price per share ($568,149,435 ÷ 4,206,743 shares) | $ 135.06 | |
Statement of Operations
| Year ended February 28, 2014 | |
|
|
|
Investment Income |
|
|
Dividends |
| $ 6,827,970 |
Special dividends |
| 1,528,686 |
Interest |
| 5,454 |
Income from Fidelity Central Funds (including $216,237 from security lending) |
| 222,193 |
Total income |
| 8,584,303 |
|
|
|
Expenses | ||
Management fee | $ 2,443,829 | |
Transfer agent fees | 888,696 | |
Accounting and security lending fees | 171,288 | |
Custodian fees and expenses | 16,360 | |
Independent trustees' compensation | 8,512 | |
Registration fees | 35,439 | |
Audit | 40,880 | |
Legal | 6,354 | |
Miscellaneous | 4,638 | |
Total expenses before reductions | 3,615,996 | |
Expense reductions | (34,884) | 3,581,112 |
Net investment income (loss) | 5,003,191 | |
Realized and Unrealized Gain (Loss) Net realized gain (loss) on: | ||
Investment securities: |
|
|
Unaffiliated issuers | 40,483,339 | |
Foreign currency transactions | 3,685 | |
Total net realized gain (loss) |
| 40,487,024 |
Change in net unrealized appreciation (depreciation) on: Investment securities | 80,532,984 | |
Assets and liabilities in foreign currencies | 76 | |
Total change in net unrealized appreciation (depreciation) |
| 80,533,060 |
Net gain (loss) | 121,020,084 | |
Net increase (decrease) in net assets resulting from operations | $ 126,023,275 | |
See accompanying notes which are an integral part of the financial statements.
Annual Report
Statement of Changes in Net Assets
| Year ended | Year ended |
Increase (Decrease) in Net Assets |
|
|
Operations |
|
|
Net investment income (loss) | $ 5,003,191 | $ 5,171,779 |
Net realized gain (loss) | 40,487,024 | 29,159,126 |
Change in net unrealized appreciation (depreciation) | 80,533,060 | (18,514,352) |
Net increase (decrease) in net assets resulting from operations | 126,023,275 | 15,816,553 |
Distributions to shareholders from net investment income | (3,941,566) | (4,448,135) |
Distributions to shareholders from net realized gain | (33,282,431) | (14,222,894) |
Total distributions | (37,223,997) | (18,671,029) |
Share transactions | 218,419,527 | 156,429,390 |
Reinvestment of distributions | 35,849,441 | 17,865,449 |
Cost of shares redeemed | (122,631,715) | (264,267,746) |
Net increase (decrease) in net assets resulting from share transactions | 131,637,253 | (89,972,907) |
Redemption fees | 11,576 | 21,280 |
Total increase (decrease) in net assets | 220,448,107 | (92,806,103) |
|
|
|
Net Assets | ||
Beginning of period | 347,701,328 | 440,507,431 |
End of period (including undistributed net investment income of $1,312,554 and undistributed net investment income of $1,020,608, respectively) | $ 568,149,435 | $ 347,701,328 |
Other Information Shares | ||
Sold | 1,710,491 | 1,447,422 |
Issued in reinvestment of distributions | 287,411 | 175,454 |
Redeemed | (1,001,721) | (2,547,299) |
Net increase (decrease) | 996,181 | (924,423) |
Financial Highlights
Years ended February 28, | 2014 | 2013 | 2012 H | 2011 | 2010 |
Selected Per-Share Data |
|
|
|
|
|
Net asset value, beginning of period | $ 108.30 | $ 106.53 | $ 91.26 | $ 69.99 | $ 46.24 |
Income from Investment Operations |
|
|
|
|
|
Net investment income (loss) B | 1.40 E | 1.40 F | .64 | .55 | .43 |
Net realized and unrealized gain (loss) | 35.09 | 6.22 | 14.73 | 21.22 | 23.73 |
Total from investment operations | 36.49 | 7.62 | 15.37 | 21.77 | 24.16 |
Distributions from net investment income | (1.01) | (1.36) | (.09) | (.52) | (.41) |
Distributions from net realized gain | (8.72) | (4.50) | (.01) | - | - |
Total distributions | (9.73) | (5.86) | (.10) | (.52) | (.41) |
Redemption fees added to paid in capitalB | - I | .01 | -I | .02 | -I |
Net asset value, end of period | $ 135.06 | $ 108.30 | $ 106.53 | $ 91.26 | $ 69.99 |
Total ReturnA | 34.71% | 7.52% | 16.85% | 31.16% | 52.35% |
Ratios to Average Net Assets C, G |
|
|
|
|
|
Expenses before reductions | .82% | .85% | .86% | .90% | .94% |
Expenses net of fee waivers, if any | .82% | .85% | .86% | .90% | .94% |
Expenses net of all reductions | .81% | .83% | .86% | .89% | .93% |
Net investment income (loss) | 1.13%E | 1.33%F | .68% | .66% | .70% |
Supplemental Data |
|
|
|
|
|
Net assets, end of period (000 omitted) | $ 568,149 | $ 347,701 | $ 440,507 | $ 411,239 | $ 224,465 |
Portfolio turnover rateD | 65% | 90% | 77% | 112% | 99% |
A Total returns would have been lower if certain expenses had not been reduced during the applicable periods shown.
B Calculated based on average shares outstanding during the period.
C Fees and expenses of any underlying Fidelity Central Funds are not included in the Fund's expense ratio. The Fund indirectly bears its proportionate share of the expenses of any underlying Fidelity Central Funds.
D Amount does not include the portfolio activity of any underlying Fidelity Central Funds.
E Investment income per share reflects a large, non-recurring dividend which amounted to $.43 per share. Excluding this non-recurring dividend, the ratio of net investment income (loss) to average net assets would have been .79%.
F Investment income per share reflects a large, non-recurring dividend which amounted to $.53 per share. Excluding this non-recurring dividend, the ratio of net investment income (loss) to average net assets would have been .82%.
G Expense ratios reflect operating expenses of the Fund. Expenses before reductions do not reflect amounts reimbursed by the investment adviser or reductions from brokerage service arrangements or reductions from other expense offset arrangements and do not represent the amount paid by the Fund during periods when reimbursements or reductions occur. Expenses net of fee waivers reflect expenses after reimbursement by the investment adviser but prior to reductions from brokerage service arrangements or other expense offset arrangements. Expenses net of all reductions represent the net expenses paid by the Fund.
H For the year ended February 29.
I Amount represents less than $.01 per share.
See accompanying notes which are an integral part of the financial statements.
Annual Report
Multimedia Portfolio
Performance: The Bottom Line
Average annual total return reflects the change in the value of an investment, assuming reinvestment of the fund's distributions from dividend income and capital gains (the profits earned upon the sale of securities that have grown in value, if any) and assuming a constant rate of performance each year. The $10,000 table and the fund's returns do not reflect the deduction of taxes that a shareholder would pay on fund distributions or the redemption of fund shares. During periods of reimbursement by Fidelity, a fund's total return will be greater than it would be had the reimbursement not occurred. How a fund did yesterday is no guarantee of how it will do tomorrow.
Average Annual Total Returns
Periods ended February 28, 2014 | Past 1 | Past 5 | Past 10 |
Multimedia Portfolio | 37.01% | 36.51% | 10.57% |
$10,000 Over 10 Years
Let's say hypothetically that $10,000 was invested in Multimedia Portfolio on February 29, 2004. The chart shows how the value of your investment would have changed, and also shows how the S&P 500 Index performed over the same period.
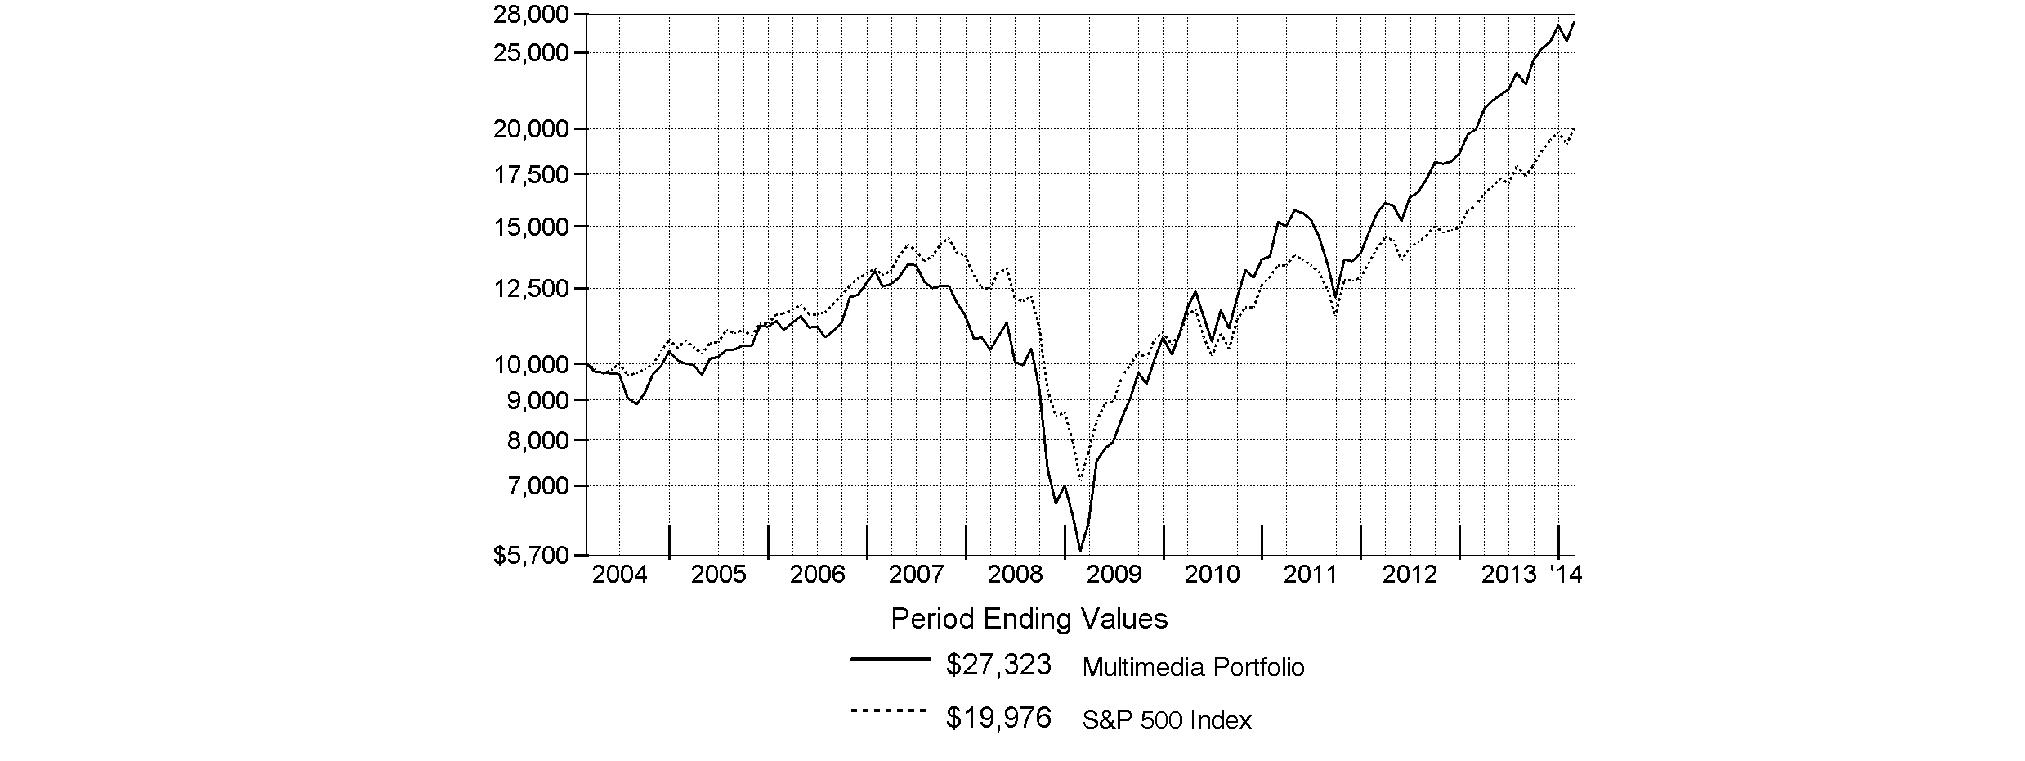
Annual Report
Multimedia Portfolio
Management's Discussion of Fund Performance
Market Recap: Stocks overcame fears of higher interest rates - not to mention their worst January in four years - to finish sharply higher for the 12 months ending February 28, 2014. The broad S&P 500® Index and the blue-chip Dow Jones Industrial AverageSM gained 25.37% and 19.01%, respectively, amid generally favorable earnings reports and accommodative monetary policies worldwide. Performance generally increased along the risk spectrum, with smaller-cap and growth strategies leading the way. An ebullient market helped the growth-oriented Nasdaq Composite Index® to a 38.10% period gain, for example. On the other hand, both cyclical and defensive stocks had representation in the top-performing industry sectors: returns were highest in health care and consumer discretionary; lowest in utilities and telecommunication services. From a macroeconomic perspective, data still points to slow but steady improvement in the U.S., and Europe's recession may well be over. Reports from China have disappointed, but continue to suggest a relatively soft landing there. Mixed signals from the U.S. Federal Reserve as to when it might curtail its stimulative bond buying kept markets in flux during the spring and summer. Stocks regained momentum in October despite a federal budget impasse and brief government shutdown, and lower volatility prevailed through year-end. Shedding new-year concerns about China's economy, an emerging-markets sell-off and confirmation (at last) of Fed tapering - alongside confirmation of a presumably dovish Janet Yellen as new Fed chair - February saw stocks back in record territory, bearing down on the five-year anniversary of the market's bottom.
Comments from Nidhi Gupta, Portfolio Manager of Multimedia Portfolio: For the year, the fund rose 37.01%, compared with a 41.32% return of its industry benchmark, the MSCI® U.S. IMI Media 25-50 Index, and a 25.37% increase for the broad-based S&P 500®. Multimedia stocks performed well during the period, continuing a multiyear trend. Content providers were the clear winners, especially those that have been able to increase their pricing power as the macroeconomic environment improved. Relative to the MSCI® index, the fund was underweighted Time Warner Cable, DirectTV and Charter Communications, which hurt when the stocks outperformed amid noise about potential consolidation among some cable providers. Avoiding World Wrestling Entertainment (WWE), a media and entertainment company, detracted from results. The stock had a strong run in the first months of 2014, when the company rolled out its Internet subscription service. I felt this new service would cannibalize WWE's core business rather than provide a boost and continued to underweight the stock. Among content providers, Viacom had a strong run but experienced some profit taking in the second half of the period, so an underweighting hurt. Lastly, the fund's cash position was also a meaningful detractor during the period. The fund experienced significant volatility in asset flows during the five-month period from June through October; the excess cash I held to meet redemptions underperformed against the index's rising performance. On the positive side, mass media company CBS proved beneficial to fund performance, as shares rose after management renegotiated distribution agreements at significantly higher prices. The fund's out-of-index stake in Netflix also aided performance. Netflix provides on-demand, commercial-free content to subscribers for a relatively low cost compared with a subscription to cable service. Additionally, I owned media and entertainment giant News Corp. because I believed the market was undervaluing its Twenty-First Century Fox media assets. When News Corp. spun out its underperforming newspaper assets and renamed itself Twenty-First Century Fox, the market began to correctly value both businesses such that the sum of the parts was greater than the whole, leading to outperformance for News Corp.
The views expressed above reflect those of the portfolio manager(s) only through the end of the period as stated on the cover of this report and do not necessarily represent the views of Fidelity or any other person in the Fidelity organization. Any such views are subject to change at any time based upon market or other conditions and Fidelity disclaims any responsibility to update such views. These views may not be relied on as investment advice and, because investment decisions for a Fidelity fund are based on numerous factors, may not be relied on as an indication of trading intent on behalf of any Fidelity fund.
Annual Report
Multimedia Portfolio
Investment Changes (Unaudited)
Top Ten Stocks as of February 28, 2014 | ||
| % of fund's | % of fund's net assets |
The Walt Disney Co. | 17.8 | 15.0 |
Comcast Corp. Class A | 9.6 | 7.9 |
CBS Corp. Class B | 8.3 | 8.5 |
Time Warner, Inc. | 7.8 | 9.4 |
Viacom, Inc. Class B (non-vtg.) | 5.0 | 7.5 |
Time Warner Cable, Inc. | 4.6 | 4.9 |
Twenty-First Century Fox, Inc. Class A | 4.4 | 4.8 |
Comcast Corp. Class A (special) (non-vtg.) | 3.7 | 1.9 |
Live Nation Entertainment, Inc. | 3.3 | 0.6 |
DIRECTV | 2.9 | 3.2 |
| 67.4 | |
Top Industries (% of fund's net assets) | |||
As of February 28, 2014 | |||
| Media | 93.0% |
|
 | Internet Software & Services | 4.3% |
|
 | Internet & CatalogRetail | 2.5% |
|
| All Others* | 0.2% |
|

As of August 31, 2013 | |||
| Media | 96.9% |
|
| All Others* | 3.1% |
|
 |
|
|
|
|
|
|
|
|
|
|
|

* Includes short-term investments and net other assets (liabilities). |
Annual Report
Multimedia Portfolio
Investments February 28, 2014
Showing Percentage of Net Assets
Common Stocks - 99.8% | |||
Shares | Value | ||
INTERNET & CATALOG RETAIL - 2.5% | |||
Internet Retail - 2.5% | |||
Netflix, Inc. (a) | 56,400 | $ 25,133,532 | |
zulily, Inc. | 2,200 | 150,458 | |
| 25,283,990 | ||
INTERNET SOFTWARE & SERVICES - 4.3% | |||
Internet Software & Services - 4.3% | |||
Facebook, Inc. Class A (a) | 152,900 | 10,467,534 | |
Google, Inc. Class A (a) | 8,300 | 10,089,895 | |
Yahoo!, Inc. (a) | 576,400 | 22,289,388 | |
| 42,846,817 | ||
MEDIA - 93.0% | |||
Advertising - 4.7% | |||
Interpublic Group of Companies, Inc. | 736,500 | 13,050,780 | |
National CineMedia, Inc. | 173,600 | 2,666,496 | |
Omnicom Group, Inc. | 387,700 | 29,341,136 | |
Sizmek, Inc. | 202,700 | 2,511,453 | |
| 47,569,865 | ||
Broadcasting - 15.4% | |||
CBS Corp. Class B | 1,254,400 | 84,145,152 | |
Cumulus Media, Inc. Class A (a) | 866,210 | 5,682,338 | |
Discovery Communications, Inc.: | |||
Class A (a) | 128,250 | 10,685,790 | |
Class C (non-vtg.) (a) | 228,450 | 17,620,349 | |
Entercom Communications Corp. Class A (a) | 76,053 | 752,164 | |
Liberty Media Corp. Class A (a) | 145,493 | 19,955,820 | |
Sinclair Broadcast Group, Inc. | 555,700 | 16,459,834 | |
| 155,301,447 | ||
Cable & Satellite - 29.9% | |||
AMC Networks, Inc. Class A (a) | 106,100 | 8,065,722 | |
Charter Communications, Inc. | 104,600 | 13,260,142 | |
Comcast Corp.: | |||
Class A | 1,874,450 | 96,890,321 | |
Class A (special) (non-vtg.) | 743,070 | 37,075,478 | |
DIRECTV (a) | 381,913 | 29,636,449 | |
DISH Network Corp. Class A (a) | 325,600 | 19,158,304 | |
Liberty Global PLC: | |||
Class A (a) | 298,089 | 25,799,603 | |
Class C | 237,679 | 20,121,904 | |
Starz - Liberty Capital Series A (a) | 186,000 | 5,948,280 | |
Time Warner Cable, Inc. | 330,669 | 46,409,394 | |
| 302,365,597 | ||
Movies & Entertainment - 40.1% | |||
DreamWorks Animation SKG, Inc. | 164,000 | 4,905,240 | |
| |||
Shares | Value | ||
Lions Gate Entertainment Corp. (d) | 182,977 | $ 5,626,543 | |
Live Nation Entertainment, Inc. (a) | 1,450,400 | 32,909,576 | |
The Madison Square Garden Co. Class A (a) | 119,400 | 6,806,994 | |
The Walt Disney Co. | 2,229,604 | 180,174,297 | |
Time Warner, Inc. | 1,171,722 | 78,657,698 | |
Twenty-First Century Fox, Inc.: | |||
Class A | 1,330,207 | 44,615,143 | |
Class B | 5,100 | 165,903 | |
Viacom, Inc. Class B (non-vtg.) | 575,000 | 50,444,750 | |
| 404,306,144 | ||
Publishing - 2.9% | |||
E.W. Scripps Co. Class A (a) | 190,300 | 3,733,686 | |
Gannett Co., Inc. | 411,300 | 12,236,175 | |
Journal Communications, Inc. | 306,475 | 2,810,376 | |
Meredith Corp. | 101,700 | 4,759,560 | |
The New York Times Co. Class A (d) | 343,300 | 5,636,986 | |
| 29,176,783 | ||
TOTAL MEDIA | 938,719,836 | ||
TOTAL COMMON STOCKS (Cost $662,699,833) |
| ||
Money Market Funds - 2.8% | |||
|
|
|
|
Fidelity Cash Central Fund, 0.10% (b) | 3,014,698 | 3,014,698 | |
Fidelity Securities Lending Cash Central Fund, 0.09% (b)(c) | 25,122,975 | 25,122,975 | |
TOTAL MONEY MARKET FUNDS (Cost $28,137,673) |
| ||
TOTAL INVESTMENT PORTFOLIO - 102.6% (Cost $690,837,506) | 1,034,988,316 | ||
NET OTHER ASSETS (LIABILITIES) - (2.6)% | (26,000,692) | ||
NET ASSETS - 100% | $ 1,008,987,624 | ||
Legend |
(a) Non-income producing |
(b) Affiliated fund that is generally available only to investment companies and other accounts managed by Fidelity Investments. The rate quoted is the annualized seven-day yield of the fund at period end. A complete unaudited listing of the fund's holdings as of its most recent quarter end is available upon request. In addition, each Fidelity Central Fund's financial statements, which are not covered by the Fund's Report of Independent Registered Public Accounting Firm, are available on the SEC's website or upon request. |
(c) Investment made with cash collateral received from securities on loan. |
(d) Security or a portion of the security is on loan at period end. |
Affiliated Central Funds |
Information regarding fiscal year to date income earned by the Fund from investments in Fidelity Central Funds is as follows: |
Fund | Income earned |
Fidelity Cash Central Fund | $ 28,117 |
Fidelity Securities Lending Cash Central Fund | 111,647 |
Total | $ 139,764 |
Other Information |
All investments are categorized as Level 1 under the Fair Value Hierarchy. The inputs or methodology used for valuing securities may not be an indication of the risk associated with investing in those securities. For more information on valuation inputs, please refer to the Investment Valuation section in the accompanying Notes to Financial Statements. |
See accompanying notes which are an integral part of the financial statements.
Annual Report
Multimedia Portfolio
Financial Statements
Statement of Assets and Liabilities
| February 28, 2014 | |
|
|
|
Assets | ||
Investment in securities, at value (including securities loaned of $25,179,585) - See accompanying schedule: Unaffiliated issuers (cost $662,699,833) | $ 1,006,850,643 |
|
Fidelity Central Funds (cost $28,137,673) | 28,137,673 |
|
Total Investments (cost $690,837,506) |
| $ 1,034,988,316 |
Receivable for investments sold | 344,484 | |
Receivable for fund shares sold | 2,984,773 | |
Dividends receivable | 972,412 | |
Distributions receivable from Fidelity Central Funds | 3,130 | |
Prepaid expenses | 5,341 | |
Other receivables | 38,558 | |
Total assets | 1,039,337,014 | |
|
|
|
Liabilities | ||
Payable for fund shares redeemed | $ 4,546,149 | |
Accrued management fee | 440,424 | |
Other affiliated payables | 181,365 | |
Other payables and accrued expenses | 58,477 | |
Collateral on securities loaned, at value | 25,122,975 | |
Total liabilities | 30,349,390 | |
|
|
|
Net Assets | $ 1,008,987,624 | |
Net Assets consist of: |
| |
Paid in capital | $ 651,452,898 | |
Undistributed net investment income | 63,422 | |
Accumulated undistributed net realized gain (loss) on investments and foreign currency transactions | 13,320,494 | |
Net unrealized appreciation (depreciation) on investments | 344,150,810 | |
Net Assets, for 12,343,364 shares outstanding | $ 1,008,987,624 | |
Net Asset Value, offering price and redemption price per share ($1,008,987,624 ÷ 12,343,364 shares) | $ 81.74 | |
Statement of Operations
| Year ended February 28, 2014 | |
|
|
|
Investment Income |
|
|
Dividends |
| $ 9,722,561 |
Interest |
| 28 |
Income from Fidelity Central Funds (including $111,647 from security lending) |
| 139,764 |
Total income |
| 9,862,353 |
|
|
|
Expenses | ||
Management fee | $ 5,085,124 | |
Transfer agent fees | 1,864,793 | |
Accounting and security lending fees | 317,091 | |
Custodian fees and expenses | 20,869 | |
Independent trustees' compensation | 17,785 | |
Registration fees | 102,594 | |
Audit | 40,163 | |
Legal | 14,290 | |
Interest | 6,680 | |
Miscellaneous | 8,549 | |
Total expenses before reductions | 7,477,938 | |
Expense reductions | (133,271) | 7,344,667 |
Net investment income (loss) | 2,517,686 | |
Realized and Unrealized Gain (Loss) Net realized gain (loss) on: | ||
Investment securities: |
|
|
Unaffiliated issuers | 57,241,013 | |
Foreign currency transactions | (462) | |
Total net realized gain (loss) |
| 57,240,551 |
Change in net unrealized appreciation (depreciation) on: Investment securities | 209,848,511 | |
Assets and liabilities in foreign currencies | 389 | |
Total change in net unrealized appreciation (depreciation) |
| 209,848,900 |
Net gain (loss) | 267,089,451 | |
Net increase (decrease) in net assets resulting from operations | $ 269,607,137 | |
See accompanying notes which are an integral part of the financial statements.
Annual Report
Statement of Changes in Net Assets
| Year ended | Year ended |
Increase (Decrease) in Net Assets |
|
|
Operations |
|
|
Net investment income (loss) | $ 2,517,686 | $ 3,382,280 |
Net realized gain (loss) | 57,240,551 | 811,665 |
Change in net unrealized appreciation (depreciation) | 209,848,900 | 86,559,833 |
Net increase (decrease) in net assets resulting from operations | 269,607,137 | 90,753,778 |
Distributions to shareholders from net investment income | (2,246,127) | (3,485,896) |
Distributions to shareholders from net realized gain | (27,566,069) | - |
Total distributions | (29,812,196) | (3,485,896) |
Share transactions | 908,932,040 | 539,936,328 |
Reinvestment of distributions | 28,916,204 | 3,390,166 |
Cost of shares redeemed | (826,095,931) | (156,442,466) |
Net increase (decrease) in net assets resulting from share transactions | 111,752,313 | 386,884,028 |
Redemption fees | 73,997 | 57,823 |
Total increase (decrease) in net assets | 351,621,251 | 474,209,733 |
|
|
|
Net Assets | ||
Beginning of period | 657,366,373 | 183,156,640 |
End of period (including undistributed net investment income of $63,422 and distributions in excess of net investment income of $139,171, respectively) | $ 1,008,987,624 | $ 657,366,373 |
Other Information Shares | ||
Sold | 12,464,403 | 9,657,499 |
Issued in reinvestment of distributions | 368,735 | 59,456 |
Redeemed | (11,169,177) | (2,815,324) |
Net increase (decrease) | 1,663,961 | 6,901,631 |
Financial Highlights
Years ended February 28, | 2014 | 2013 | 2012 H | 2011 | 2010 |
Selected Per-Share Data |
|
|
|
|
|
Net asset value, beginning of period | $ 61.55 | $ 48.48 | $ 47.80 | $ 34.39 | $ 18.27 |
Income from Investment Operations |
|
|
|
|
|
Net investment income (loss) B | .20 | .53 E | .29 | .14 | .13 F |
Net realized and unrealized gain (loss) | 22.46 | 12.96 | .96 | 13.39 | 16.12 |
Total from investment operations | 22.66 | 13.49 | 1.25 | 13.53 | 16.25 |
Distributions from net investment income | (.19) | (.43) | (.32) | (.12) | (.13) |
Distributions from net realized gain | (2.30) | - | (.25) | - | - |
Total distributions | (2.48) J | (.43) | (.57) | (.12) | (.13) |
Redemption fees added to paid in capital B | .01 | .01 | - I | - I | - I |
Net asset value, end of period | $ 81.74 | $ 61.55 | $ 48.48 | $ 47.80 | $ 34.39 |
Total Return A | 37.01% | 27.91% | 2.73% | 39.37% | 88.96% |
Ratios to Average Net Assets C, G |
|
|
|
|
|
Expenses before reductions | .81% | .88% | .90% | .94% | 1.08% |
Expenses net of fee waivers, if any | .81% | .88% | .90% | .94% | 1.08% |
Expenses net of all reductions | .80% | .88% | .90% | .94% | 1.07% |
Net investment income (loss) | .27% | .97% E | .64% | .37% | .44% F |
Supplemental Data |
|
|
|
|
|
Net assets, end of period (000 omitted) | $ 1,008,988 | $ 657,366 | $ 183,157 | $ 205,920 | $ 76,309 |
Portfolio turnover rate D | 111% | 30% | 85% | 76% | 40% |
A Total returns would have been lower if certain expenses had not been reduced during the applicable periods shown.
B Calculated based on average shares outstanding during the period.
C Fees and expenses of any underlying Fidelity Central Funds are not included in the Fund's expense ratio. The Fund indirectly bears its proportionate share of the expenses of any underlying Fidelity Central Funds.
D Amount does not include the portfolio activity of any underlying Fidelity Central Funds.
E Investment income per share reflects a large, non-recurring dividend which amounted to $.12 per share. Excluding this non-recurring dividend, the ratio of net investment income (loss) to average net assets would have been .76%.
F Investment income per share reflects a large, non-recurring dividend which amounted to $.10 per share. Excluding this non-recurring dividend, the ratio of net investment income (loss) to average net assets would have been .10%.
G Expense ratios reflect operating expenses of the Fund. Expenses before reductions do not reflect amounts reimbursed by the investment adviser or reductions from brokerage service arrangements or reductions from other expense offset arrangements and do not represent the amount paid by the Fund during periods when reimbursements or reductions occur. Expenses net of fee waivers reflect expenses after reimbursement by the investment adviser but prior to reductions from brokerage service arrangements or other expense offset arrangements. Expenses net of all reductions represent the net expenses paid by the Fund.
H For the year ended February 29.
I Amount represents less than $.01 per share.
J Total distributions of $2.48 per share is comprised of distributions from net investment income of $.187 and distributions from net realized gain of $2.295 per share.
See accompanying notes which are an integral part of the financial statements.
Annual Report
Retailing Portfolio
Performance: The Bottom Line
Average annual total return reflects the change in the value of an investment, assuming reinvestment of the fund's distributions from dividend income and capital gains (the profits earned upon the sale of securities that have grown in value, if any) and assuming a constant rate of performance each year. The $10,000 table and the fund's returns do not reflect the deduction of taxes that a shareholder would pay on fund distributions or the redemption of fund shares. During periods of reimbursement by Fidelity, a fund's total return will be greater than it would be had the reimbursement not occurred. How a fund did yesterday is no guarantee of how it will do tomorrow.
Average Annual Total Returns
Periods ended February 28, 2014 | Past 1 | Past 5 | Past 10 |
Retailing Portfolio | 35.82% | 32.59% | 12.76% |
$10,000 Over 10 Years
Let's say hypothetically that $10,000 was invested in Retailing Portfolio on February 29, 2004. The chart shows how the value of your investment would have changed, and also shows how the S&P 500 Index performed over the same period.
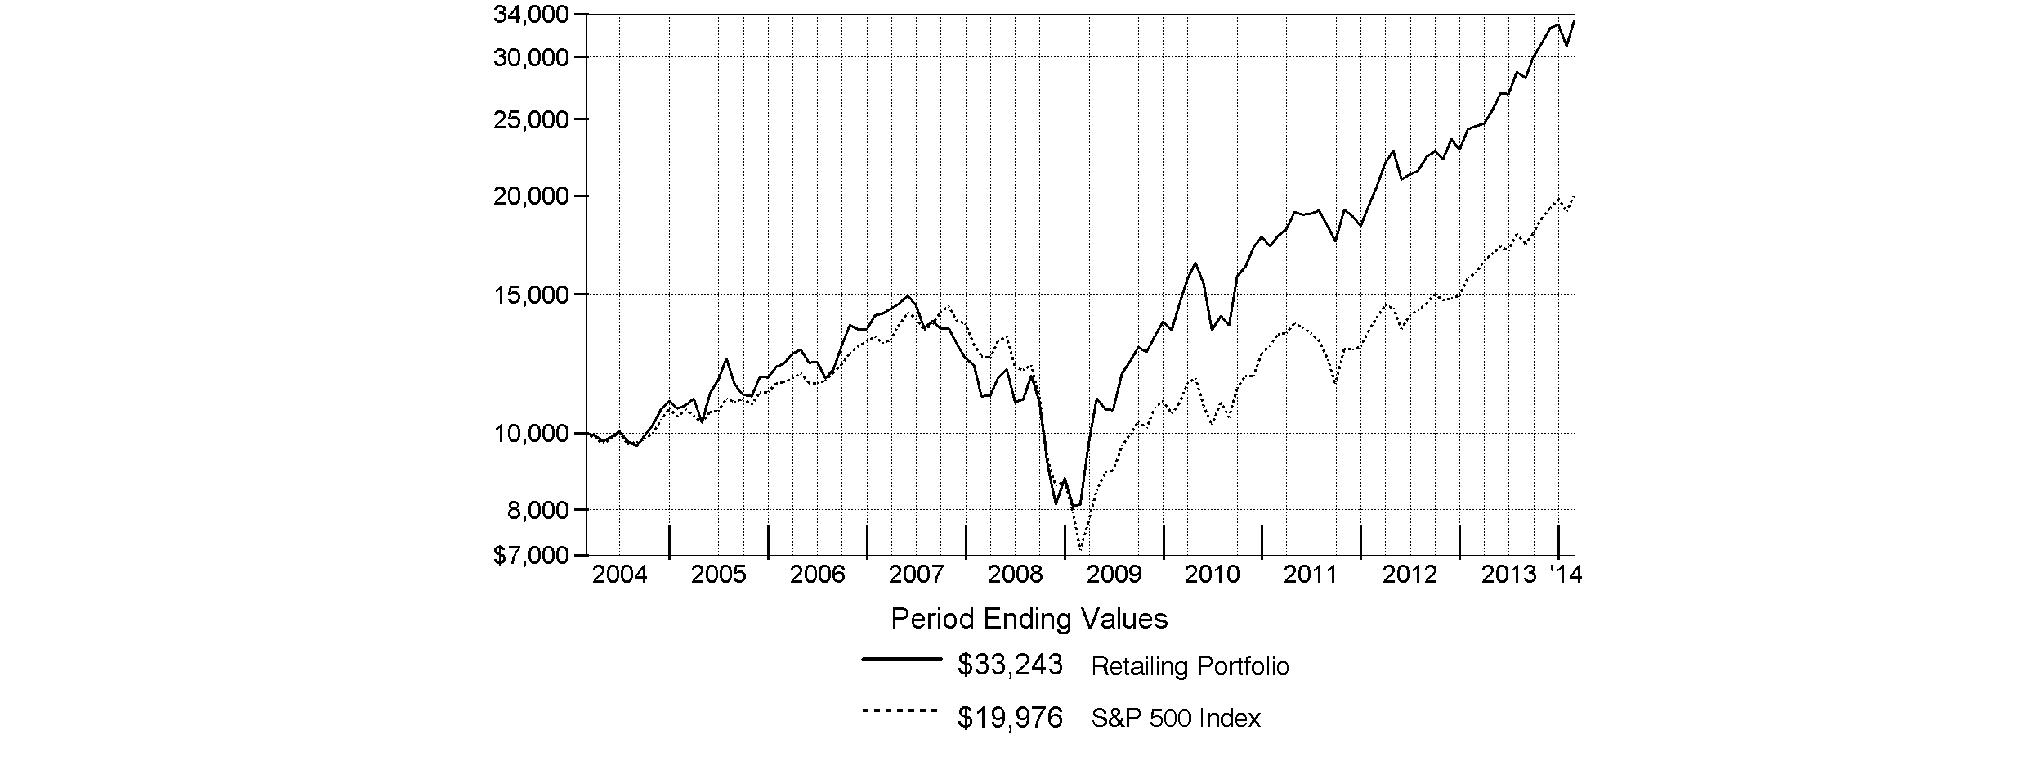
Annual Report
Retailing Portfolio
Management's Discussion of Fund Performance
Market Recap: Stocks overcame fears of higher interest rates - not to mention their worst January in four years - to finish sharply higher for the 12 months ending February 28, 2014. The broad S&P 500® Index and the blue-chip Dow Jones Industrial AverageSM gained 25.37% and 19.01%, respectively, amid generally favorable earnings reports and accommodative monetary policies worldwide. Performance generally increased along the risk spectrum, with smaller-cap and growth strategies leading the way. An ebullient market helped the growth-oriented Nasdaq Composite Index® to a 38.10% period gain, for example. On the other hand, both cyclical and defensive stocks had representation in the top-performing industry sectors: returns were highest in health care and consumer discretionary; lowest in utilities and telecommunication services. From a macroeconomic perspective, data still points to slow but steady improvement in the U.S., and Europe's recession may well be over. Reports from China have disappointed, but continue to suggest a relatively soft landing there. Mixed signals from the U.S. Federal Reserve as to when it might curtail its stimulative bond buying kept markets in flux during the spring and summer. Stocks regained momentum in October despite a federal budget impasse and brief government shutdown, and lower volatility prevailed through year-end. Shedding new-year concerns about China's economy, an emerging-markets sell-off and confirmation (at last) of Fed tapering - alongside confirmation of a presumably dovish Janet Yellen as new Fed chair - February saw stocks back in record territory, bearing down on the five-year anniversary of the market's bottom.
Comments from Peter Dixon, Portfolio Manager of Retailing Portfolio: For the year, the fund gained 35.82%, compared with 32.02% for the MSCI® U.S. IMI Retailing 25-50 Index and the broad-based S&P 500® Index. Consumers have been increasingly shopping online, which helped drive faster-than-expected revenue and earnings growth for Internet retailers as well as traditional retailers that have implemented leading-edge omni-channel capabilities to enhance consumers' shopping experiences. Some of our top contributors were the shares of retailers that benefited from the rapid growth of e-commerce, including online travel resource priceline.com and U.K.-based Ocado Group, an online retailer and distributor of groceries and non-index stock. Priceline saw consecutive quarters of better-than-expected earnings and sales, boosting its stock price 96% during the past year. Ocado's stock went up due to improving fundamentals, increasing industry focus on home grocery delivery, as well as improving sentiment following the announcement of its distribution deal with U.K. supermarket chain Morrison's. I shied away from broadline retailers in general. Broadline retail encompasses some general merchandisers, discount stores, and department and specialty stores. Big-box giant Target is one such example, where my decision to underweight and ultimately sell the large index component made it the fund's biggest relative contributor. Conversely, apparel retailer Urban Outfitters encountered a fashion misstep which dragged down its stock and detracted from performance. Elsewhere, a non-index stake in lululemon athletica also hurt after the brand encountered a number of challenges in 2013, dragging down shares.
The views expressed above reflect those of the portfolio manager(s) only through the end of the period as stated on the cover of this report and do not necessarily represent the views of Fidelity or any other person in the Fidelity organization. Any such views are subject to change at any time based upon market or other conditions and Fidelity disclaims any responsibility to update such views. These views may not be relied on as investment advice and, because investment decisions for a Fidelity fund are based on numerous factors, may not be relied on as an indication of trading intent on behalf of any Fidelity fund.
Annual Report
Retailing Portfolio
Investment Changes (Unaudited)
Top Ten Stocks as of February 28, 2014 | ||
| % of fund's | % of fund's net assets |
Home Depot, Inc. | 17.4 | 15.0 |
priceline.com, Inc. | 11.2 | 7.8 |
Amazon.com, Inc. | 10.9 | 9.8 |
TJX Companies, Inc. | 8.7 | 7.6 |
L Brands, Inc. | 4.9 | 3.6 |
AutoZone, Inc. | 4.4 | 4.0 |
Netflix, Inc. | 4.1 | 1.6 |
O'Reilly Automotive, Inc. | 3.9 | 3.5 |
G-III Apparel Group Ltd. | 3.6 | 1.7 |
Bed Bath & Beyond, Inc. | 2.7 | 0.0 |
| 71.8 | |
Top Industries (% of fund's net assets) | |||
As of February 28, 2014 | |||
| Specialty Retail | 51.3% |
|
| Internet & CatalogRetail | 27.1% |
|
| Textiles, Apparel & Luxury Goods | 14.0% |
|
| Food Products | 2.5% |
|
| Food & StaplesRetailing | 1.7% |
|
| All Others* | 3.4% |
|

As of August 31, 2013 | |||
| Specialty Retail | 59.9% |
|
| Internet & CatalogRetail | 21.4% |
|
| Textiles, Apparel & Luxury Goods | 13.6% |
|
| Software | 1.6% |
|
| Food Products | 1.3% |
|
| All Others* | 2.2% |
|

* Includes short-term investments and net other assets (liabilities). |
Annual Report
Retailing Portfolio
Investments February 28, 2014
Showing Percentage of Net Assets
Common Stocks - 99.2% | |||
Shares | Value | ||
BEVERAGES - 0.8% | |||
Distillers & Vintners - 0.8% | |||
Remy Cointreau SA | 99,200 | $ 8,420,934 | |
FOOD & STAPLES RETAILING - 1.7% | |||
Hypermarkets & Super Centers - 1.7% | |||
Costco Wholesale Corp. | 153,043 | 17,875,422 | |
FOOD PRODUCTS - 2.5% | |||
Packaged Foods & Meats - 2.5% | |||
Annie's, Inc. (a)(d) | 299,500 | 11,225,260 | |
Associated British Foods PLC | 314,200 | 15,773,785 | |
| 26,999,045 | ||
HOUSEHOLD DURABLES - 0.8% | |||
Household Appliances - 0.8% | |||
Techtronic Industries Co. Ltd. | 3,169,500 | 8,413,283 | |
INTERNET & CATALOG RETAIL - 27.1% | |||
Internet Retail - 27.1% | |||
Amazon.com, Inc. (a) | 318,740 | 115,415,754 | |
Netflix, Inc. (a) | 96,700 | 43,092,421 | |
Ocado Group PLC (a) | 1,042,700 | 9,821,550 | |
priceline.com, Inc. (a) | 88,600 | 119,507,224 | |
| 287,836,949 | ||
SOFTWARE - 1.0% | |||
Home Entertainment Software - 1.0% | |||
Take-Two Interactive Software, Inc. (a) | 527,750 | 10,433,618 | |
SPECIALTY RETAIL - 51.3% | |||
Apparel Retail - 21.6% | |||
H&M Hennes & Mauritz AB (B Shares) | 404,773 | 18,257,446 | |
Inditex SA | 164,262 | 23,648,026 | |
L Brands, Inc. | 933,393 | 52,578,028 | |
TJX Companies, Inc. | 1,498,200 | 92,079,372 | |
Urban Outfitters, Inc. (a) | 732,600 | 27,428,544 | |
Zumiez, Inc. (a) | 651,200 | 15,472,512 | |
| 229,463,928 | ||
Automotive Retail - 8.3% | |||
AutoZone, Inc. (a) | 87,983 | 47,373,567 | |
O'Reilly Automotive, Inc. (a) | 273,565 | 41,267,280 | |
| 88,640,847 | ||
Home Improvement Retail - 18.7% | |||
Home Depot, Inc. | 2,253,900 | 184,887,416 | |
Lowe's Companies, Inc. | 287,800 | 14,398,634 | |
| 199,286,050 | ||
Homefurnishing Retail - 2.7% | |||
Bed Bath & Beyond, Inc. (a) | 427,200 | 28,972,704 | |
TOTAL SPECIALTY RETAIL | 546,363,529 | ||
TEXTILES, APPAREL & LUXURY GOODS - 14.0% | |||
Apparel, Accessories & Luxury Goods - 12.9% | |||
adidas AG | 245,400 | 28,588,442 | |
| |||
Shares | Value | ||
Compagnie Financiere Richemont SA Series A | 156,100 | $ 15,547,879 | |
G-III Apparel Group Ltd. (a) | 555,344 | 38,590,855 | |
lululemon athletica, Inc. (a)(d) | 243,457 | 12,248,322 | |
Prada SpA | 1,117,000 | 8,391,300 | |
PVH Corp. | 184,700 | 23,351,621 | |
Swatch Group AG (Bearer) (Reg.) | 90,067 | 10,588,889 | |
| 137,307,308 | ||
Footwear - 1.1% | |||
NIKE, Inc. Class B | 144,000 | 11,275,200 | |
TOTAL TEXTILES, APPAREL & LUXURY GOODS | 148,582,508 | ||
TOTAL COMMON STOCKS (Cost $749,207,960) |
| ||
Convertible Bonds - 0.1% | ||||
| Principal Amount |
| ||
SOFTWARE - 0.1% | ||||
Home Entertainment Software - 0.1% | ||||
Take-Two Interactive Software, Inc. 1.75% 12/1/16 | $ 1,000,000 |
| ||
Money Market Funds - 1.9% | |||
Shares |
| ||
Fidelity Cash Central Fund, 0.10% (b) | 4,656,420 | 4,656,420 | |
Fidelity Securities Lending Cash Central Fund, 0.09% (b)(c) | 15,778,350 | 15,778,350 | |
TOTAL MONEY MARKET FUNDS (Cost $20,434,770) |
| ||
TOTAL INVESTMENT PORTFOLIO - 101.2% (Cost $770,642,730) | 1,076,595,058 | ||
NET OTHER ASSETS (LIABILITIES) - (1.2)% | (12,674,962) | ||
NET ASSETS - 100% | $ 1,063,920,096 | ||
Legend |
(a) Non-income producing |
(b) Affiliated fund that is generally available only to investment companies and other accounts managed by Fidelity Investments. The rate quoted is the annualized seven-day yield of the fund at period end. A complete unaudited listing of the fund's holdings as of its most recent quarter end is available upon request. In addition, each Fidelity Central Fund's financial statements, which are not covered by the Fund's Report of Independent Registered Public Accounting Firm, are available on the SEC's website or upon request. |
(c) Investment made with cash collateral received from securities on loan. |
(d) Security or a portion of the security is on loan at period end. |
Affiliated Central Funds |
Information regarding fiscal year to date income earned by the Fund from investments in Fidelity Central Funds is as follows: |
Fund | Income earned |
Fidelity Cash Central Fund | $ 13,253 |
Fidelity Securities Lending Cash Central Fund | 153,402 |
Total | $ 166,655 |
Other Information |
The following is a summary of the inputs used, as of February 28, 2014, involving the Fund's assets and liabilities carried at fair value. The inputs or methodology used for valuing securities may not be an indication of the risk associated with investing in those securities. For more information on valuation inputs, and their aggregation into the levels used in the table below, please refer to the Investment Valuation section in the accompanying Notes to Financial Statements. |
Valuation Inputs at Reporting Date: | ||||
Description | Total | Level 1 | Level 2 | Level 3 |
Investments in Securities: | ||||
Common Stocks | $ 1,054,925,288 | $ 1,054,925,288 | $ - | $ - |
Convertible Bonds | 1,235,000 | - | 1,235,000 | - |
Money Market Funds | 20,434,770 | 20,434,770 | - | - |
Total Investments in Securities: | $ 1,076,595,058 | $ 1,075,360,058 | $ 1,235,000 | $ - |
Distribution of investments by country or territory of incorporation, as a percentage of total net assets, is as follows (Unaudited): |
United States of America | 86.1% |
Germany | 2.7% |
Switzerland | 2.5% |
United Kingdom | 2.4% |
Spain | 2.2% |
Sweden | 1.7% |
Others (Individually Less Than 1%) | 2.4% |
| 100.0% |
See accompanying notes which are an integral part of the financial statements.
Annual Report
Retailing Portfolio
Financial Statements
Statement of Assets and Liabilities
| February 28, 2014 | |
|
|
|
Assets | ||
Investment in securities, at value (including securities loaned of $14,851,458) - See accompanying schedule: Unaffiliated issuers (cost $750,207,960) | $ 1,056,160,288 |
|
Fidelity Central Funds (cost $20,434,770) | 20,434,770 |
|
Total Investments (cost $770,642,730) |
| $ 1,076,595,058 |
Receivable for investments sold | 6,126,051 | |
Receivable for fund shares sold | 5,849,842 | |
Dividends receivable | 1,584,809 | |
Interest receivable | 4,375 | |
Distributions receivable from Fidelity Central Funds | 6,754 | |
Prepaid expenses | 4,246 | |
Other receivables | 20,754 | |
Total assets | 1,090,191,889 | |
|
|
|
Liabilities | ||
Payable for investments purchased | $ 6,746,024 | |
Payable for fund shares redeemed | 2,989,825 | |
Accrued management fee | 477,154 | |
Other affiliated payables | 216,953 | |
Other payables and accrued expenses | 63,487 | |
Collateral on securities loaned, at value | 15,778,350 | |
Total liabilities | 26,271,793 | |
|
|
|
Net Assets | $ 1,063,920,096 | |
Net Assets consist of: |
| |
Paid in capital | $ 720,376,460 | |
Undistributed net investment income | 261,980 | |
Accumulated undistributed net realized gain (loss) on investments and foreign currency transactions | 37,326,276 | |
Net unrealized appreciation (depreciation) on investments and assets and liabilities in foreign currencies | 305,955,380 | |
Net Assets, for 12,035,005 shares outstanding | $ 1,063,920,096 | |
Net Asset Value, offering price and redemption price per share ($1,063,920,096 ÷ 12,035,005 shares) | $ 88.40 | |
Statement of Operations
| Year ended February 28, 2014 | |
|
|
|
Investment Income |
|
|
Dividends |
| $ 7,696,693 |
Special dividends |
| 942,393 |
Interest |
| 17,501 |
Income from Fidelity Central Funds (including $153,402 from security lending) |
| 166,655 |
Total income |
| 8,823,242 |
|
|
|
Expenses | ||
Management fee | $ 4,865,118 | |
Transfer agent fees | 1,875,276 | |
Accounting and security lending fees | 302,417 | |
Custodian fees and expenses | 34,384 | |
Independent trustees' compensation | 17,369 | |
Registration fees | 120,616 | |
Audit | 40,490 | |
Legal | 12,378 | |
Interest | 1,846 | |
Miscellaneous | 9,202 | |
Total expenses before reductions | 7,279,096 | |
Expense reductions | (66,794) | 7,212,302 |
Net investment income (loss) | 1,610,940 | |
Realized and Unrealized Gain (Loss) Net realized gain (loss) on: | ||
Investment securities: |
|
|
Unaffiliated issuers | 76,290,590 | |
Foreign currency transactions | 17,087 | |
Total net realized gain (loss) |
| 76,307,677 |
Change in net unrealized appreciation (depreciation) on: Investment securities | 169,827,512 | |
Assets and liabilities in foreign currencies | 2,981 | |
Total change in net unrealized appreciation (depreciation) |
| 169,830,493 |
Net gain (loss) | 246,138,170 | |
Net increase (decrease) in net assets resulting from operations | $ 247,749,110 | |
See accompanying notes which are an integral part of the financial statements.
Annual Report
Statement of Changes in Net Assets
| Year ended | Year ended |
Increase (Decrease) in Net Assets |
|
|
Operations |
|
|
Net investment income (loss) | $ 1,610,940 | $ 4,496,391 |
Net realized gain (loss) | 76,307,677 | 10,467,967 |
Change in net unrealized appreciation (depreciation) | 169,830,493 | 68,227,805 |
Net increase (decrease) in net assets resulting from operations | 247,749,110 | 83,192,163 |
Distributions to shareholders from net investment income | (1,555,312) | (3,444,682) |
Distributions to shareholders from net realized gain | (24,769,437) | (12,259,653) |
Total distributions | (26,324,749) | (15,704,335) |
Share transactions | 684,002,303 | 545,350,604 |
Reinvestment of distributions | 25,621,938 | 15,326,898 |
Cost of shares redeemed | (510,290,185) | (329,889,159) |
Net increase (decrease) in net assets resulting from share transactions | 199,334,056 | 230,788,343 |
Redemption fees | 79,273 | 62,949 |
Total increase (decrease) in net assets | 420,837,690 | 298,339,120 |
|
|
|
Net Assets | ||
Beginning of period | 643,082,406 | 344,743,286 |
End of period (including undistributed net investment income of $261,980 and undistributed net investment income of $258,403, respectively) | $ 1,063,920,096 | $ 643,082,406 |
Other Information Shares | ||
Sold | 8,529,294 | 8,767,180 |
Issued in reinvestment of distributions | 297,691 | 246,579 |
Redeemed | (6,448,824) | (5,348,769) |
Net increase (decrease) | 2,378,161 | 3,664,990 |
Financial Highlights
Years ended February 28, | 2014 | 2013 | 2012 I | 2011 | 2010 |
Selected Per-Share Data |
|
|
|
|
|
Net asset value, beginning of period | $ 66.59 | $ 57.54 | $ 53.68 | $ 45.11 | $ 26.48 |
Income from Investment Operations |
|
|
|
|
|
Net investment income (loss) B | .15 E | .52 F | .49 G | .09 | .11 |
Net realized and unrealized gain (loss) | 23.64 | 10.27 | 7.46 | 9.81 | 20.74 |
Total from investment operations | 23.79 | 10.79 | 7.95 | 9.90 | 20.85 |
Distributions from net investment income | (.12) | (.38) | (.34) | (.01) | (.11) |
Distributions from net realized gain | (1.86) | (1.36) | (3.76) | (1.33) | (2.11) |
Total distributions | (1.99) K | (1.75) L | (4.10) | (1.34) | (2.22) |
Redemption fees added to paid in capital B | .01 | .01 | .01 | .01 | - J |
Net asset value, end of period | $ 88.40 | $ 66.59 | $ 57.54 | $ 53.68 | $ 45.11 |
Total Return A | 35.82% | 18.98% | 15.70% | 22.24% | 79.26% |
Ratios to Average Net Assets C, H |
|
|
|
|
|
Expenses before reductions | .83% | .86% | .90% | .93% | .96% |
Expenses net of fee waivers, if any | .83% | .86% | .90% | .93% | .96% |
Expenses net of all reductions | .82% | .84% | .88% | .93% | .94% |
Net investment income (loss) | .18% E | .83% F | .93% G | .18% | .27% |
Supplemental Data |
|
|
|
|
|
Net assets, end of period (000 omitted) | $ 1,063,920 | $ 643,082 | $ 344,743 | $ 167,094 | $ 137,409 |
Portfolio turnover rate D | 72% | 119% | 217% | 191% | 281% |
A Total returns would have been lower if certain expenses had not been reduced during the applicable periods shown.
B Calculated based on average shares outstanding during the period.
C Fees and expenses of any underlying Fidelity Central Funds are not included in the Fund's expense ratio. The Fund indirectly bears its proportionate share of the expenses of any underlying Fidelity Central Funds.
D Amount does not include the portfolio activity of any underlying Fidelity Central Funds.
E Investment income per share reflects large, non-recurring dividends which amounted to $.08 per share. Excluding these non-recurring dividends, the ratio of net investment income (loss) to average net assets would have been .08%.
F Investment income per share reflects a large, non-recurring dividend which amounted to $.19 per share. Excluding this non-recurring dividend, the ratio of net investment income (loss) to average net assets would have been .53%.
G Investment income per share reflects a large, non-recurring dividend which amounted to $.28 per share. Excluding this non-recurring dividend, the ratio of net investment income (loss) to average net assets would have been .40%.
H Expense ratios reflect operating expenses of the Fund. Expenses before reductions do not reflect amounts reimbursed by the investment adviser or reductions from brokerage service arrangements or reductions from other expense offset arrangements and do not represent the amount paid by the Fund during periods when reimbursements or reductions occur. Expenses net of fee waivers reflect expenses after reimbursement by the investment adviser but prior to reductions from brokerage service arrangements or other expense offset arrangements. Expenses net of all reductions represent the net expenses paid by the Fund.
I For the year ended February 29.
J Amount represents less than $.01 per share.
K Total distributions of $1.99 per share is comprised of distributions from net investment income of $.124 and distributions from net realized gain of $1.861 per share.
L Total distributions of $1.75 per share is comprised of distributions from net investment income of $.383 and distributions from net realized gain of $1.364 per share.
See accompanying notes which are an integral part of the financial statements.
Annual Report
Notes to Financial Statements
For the period ended February 28, 2014
1. Organization.
Automotive Portfolio, Construction and Housing Portfolio, Consumer Discretionary Portfolio, Leisure Portfolio, Multimedia Portfolio and Retailing Portfolio (the Funds) are non-diversified funds of Fidelity Select Portfolios (the Trust). The Trust is registered under the Investment Company Act of 1940, as amended (the 1940 Act), as an open-end management investment company organized as a Massachusetts business trust. The Funds invest primarily in securities of companies whose principal business activities fall within specific industries. Each Fund is authorized to issue an unlimited number of shares. Certain Funds investments in emerging markets can be subject to social, economic, regulatory, and political uncertainties and can be extremely volatile.
2. Investments in Fidelity Central Funds.
The Funds invests in Fidelity Central Funds, which are open-end investment companies generally available only to other investment companies and accounts managed by the investment adviser and its affiliates. The Funds' Schedules of Investments list each of the Fidelity Central Funds held as of period end, if any, as an investment of each Fund, but do not include the underlying holdings of each Fidelity Central Fund. As an Investing Fund, each Fund indirectly bears its proportionate share of the expenses of the underlying Fidelity Central Funds.
The Money Market Central Funds seek preservation of capital and current income and are managed by Fidelity Investments Money Management, Inc. (FIMM), an affiliate of the investment adviser. Annualized expenses of the Money Market Central Funds as of their most recent shareholder report date are less than .01%.
A complete unaudited list of holdings for each Fidelity Central Fund is available upon request or at the Securities and Exchange Commission (the SEC) website at www.sec.gov. In addition, the financial statements of the Fidelity Central Funds, which are not covered by the Funds' Report of Independent Registered Public Accounting Firm, are available on the SEC website or upon request.
3. Significant Accounting Policies.
The financial statements have been prepared in conformity with accounting principles generally accepted in the United States of America (GAAP), which require management to make certain estimates and assumptions at the date of the financial statements. Actual results could differ from those estimates. Subsequent events, if any, through the date that the financial statements were issued have been evaluated in the preparation of the financial statements. The following summarizes the significant accounting policies of the Funds:
Investment Valuation. Investments are valued as of 4:00 p.m. Eastern time on the last calendar day of the period. In accordance with valuation policies and procedures approved by the Board of Trustees (the Board), each Fund attempts to obtain prices from one or more third party pricing vendors or brokers to value its investments. When current market prices, quotations or currency exchange rates are not readily available or reliable, investments will be fair valued in good faith by the Fidelity SelectCo, LLC (SelectCo) Fair Value Committee (the Committee), in accordance with procedures adopted by the Board. Factors used in determining fair value vary by investment type and may include market or investment specific events, changes in interest rates and credit quality. The frequency with which these procedures are used cannot be predicted and they may be utilized to a significant extent. The Committee oversees each Fund's valuation policies and procedures and is responsible for approving and reporting to the Board all fair value determinations.
Each Fund categorizes the inputs to valuation techniques used to value their investments into a disclosure hierarchy consisting of three levels as shown below:
Level 1 - quoted prices in active markets for identical investments
Level 2 - other significant observable inputs (including quoted prices for similar investments, interest rates, prepayment speeds, etc.)
Level 3 - unobservable inputs (including the Fund's own assumptions based on the best information available)
Valuation techniques used to value each Fund's investments by major category are as follows:
Equity securities, including restricted securities, for which market quotations are readily available, are valued at the last reported sale price or official closing price as reported by a third party pricing vendor on the primary market or exchange on which they are traded and are categorized as Level 1 in the hierarchy. In the event there were no sales during the day or closing prices are not available, securities are valued at the last quoted bid price or may be valued using the last available price and are generally categorized as Level 2 in the hierarchy. For foreign equity securities, when market or security specific events arise, comparisons to the valuation of American Depositary Receipts (ADRs), futures contracts, Exchange-Traded Funds (ETFs) and certain indexes as well as quoted prices for similar securities may be used and would be categorized as Level 2 in the hierarchy. Utilizing these techniques may result in transfers between Level 1 and Level 2. For equity securities, including restricted securities, where observable inputs are limited, assumptions about market activity and risk are used and these securities may be categorized as Level 3 in the hierarchy.
Annual Report
3. Significant Accounting Policies - continued
Investment Valuation - continued
Debt securities, including restricted securities, are valued based on evaluated prices received from third party pricing vendors or from brokers who make markets in such securities. Corporate bonds are valued by pricing vendors who utilize matrix pricing which considers yield or price of bonds of comparable quality, coupon, maturity and type or by broker-supplied prices. When independent prices are unavailable or unreliable, debt securities may be valued utilizing pricing methodologies which consider similar factors that would be used by third party pricing vendors. Debt securities are generally categorized as Level 2 in the hierarchy but may be Level 3 depending on the circumstances.
Investments in open-end mutual funds, including the Fidelity Central Funds, are valued at their closing net asset value (NAV) each business day and are categorized as Level 1 in the hierarchy.
The following provides information on Level 3 securities held by Construction and Housing Portfolio that were valued at period end based on unobservable inputs. These amounts exclude valuations provided by a broker.
Asset Type | Fair Value at | Valuation | Unobservable | Amount or Range / | Impact to |
Convertible Preferred Stocks | $ 4,000,001 | Last transaction price | Transaction price | $ 4.62 | Increase |
* Represents the expected directional change in the fair value of the Level 3 investments that would result from an increase in the corresponding input. A decrease to the unobservable input would have the opposite effect. Significant changes in these inputs
could result in significantly higher or lower fair value measurements.
Changes in valuation techniques may result in transfers in or out of an assigned level within the disclosure hierarchy. The aggregate value of investments by input level, as of February 28, 2014, as well as a roll forward of Level 3 investments, is included at the end of each applicable Fund's Schedule of Investments.
Foreign Currency. The Funds may use foreign currency contracts to facilitate transactions in foreign-denominated securities. Gains and losses from these transactions may arise from changes in the value of the foreign currency or if the counterparties do not perform under the contracts' terms.
Foreign-denominated assets, including investment securities, and liabilities are translated into U.S. dollars at the exchange rates at period end. Purchases and sales of investment securities, income and dividends received and expenses denominated in foreign currencies are translated into U.S. dollars at the exchange rate in effect on the transaction date.
The effects of exchange rate fluctuations on investments are included with the net realized and unrealized gain (loss) on investment securities. Other foreign currency transactions resulting in realized and unrealized gain (loss) are disclosed separately.
Investment Transactions and Income. For financial reporting purposes, the Funds' investment holdings and NAV include trades executed through the end of the last business day of the period. The NAV per share for processing shareholder transactions is calculated as of the close of business of the New York Stock Exchange (NYSE), normally 4:00 p.m. Eastern time and includes trades executed through the end of the prior business day. Gains and losses on securities sold are determined on the basis of identified cost and may include proceeds received from litigation. Dividend income is recorded on the ex-dividend date, except for certain dividends from foreign securities where the ex-dividend date may have passed, which are recorded as soon as the Funds are informed of the ex-dividend date. Non-cash dividends included in dividend income, if any, are recorded at the fair market value of the securities received. Distributions received on securities that represent a return of capital or capital gain are recorded as a reduction of cost of investments and/or as a realized gain. Subsequent to ex-dividend date the Funds determine the components of these distributions, based upon receipt of tax filings or other correspondence relating to the underlying investment. Large, non-recurring dividends recognized by the Funds are presented separately on the Statement of Operations as "Special Dividends" and the impact of these dividends is presented in the Financial Highlights. Interest income and distributions from the Fidelity Central Funds are accrued as earned. Interest income includes coupon interest and amortization of premium and accretion of discount on debt securities. Investment income is recorded net of foreign taxes withheld where recovery of such taxes is uncertain.
Expenses. Expenses directly attributable to a fund are charged to that fund. Expenses attributable to more than one fund are allocated among the respective funds on the basis of relative net assets or other appropriate methods. Expense estimates are accrued in the period to which they relate and adjustments are made when actual amounts are known.
Income Tax Information and Distributions to Shareholders. Each year, each Fund intends to qualify as a regulated investment company under Subchapter M of the Internal Revenue Code, including distributing substantially all of its taxable income and realized gains. As a result, no provision for U.S. Federal income taxes is required. As of February 28, 2014, each Fund did not have any unrecognized tax benefits in the financial statements; nor is each Fund aware of any tax positions for which it is reasonably possible that the total amounts of unrecognized tax benefits will significantly change in the next twelve months. Each Fund files a U.S. federal tax return, in addition to state and local tax returns as required. The Fund's federal income tax returns are subject to examination by the Internal Revenue Service (IRS) for a period of three fiscal years after they are filed. State and local tax returns may be subject to examination for an additional fiscal year depending on the jurisdiction. Foreign taxes are provided for based on each Fund's understanding of the tax rules and rates that exist in the foreign markets in which it invests.
Annual Report
Notes to Financial Statements - continued
3. Significant Accounting Policies - continued
Income Tax Information and Distributions to Shareholders - continued
Distributions are declared and recorded on the ex-dividend date. Income and capital gain distributions are determined in accordance with income tax regulations, which may differ from GAAP. In addition, certain Funds claimed a portion of the payment made to redeeming shareholders as a distribution for income tax purposes.
Capital accounts within the financial statements are adjusted for permanent book-tax differences. These adjustments have no impact on net assets or the results of operations. Capital accounts are not adjusted for temporary book-tax differences which will reverse in a subsequent period.
Book-tax differences are primarily due to foreign currency transactions, partnerships, deferred trustees compensation, capital loss carryforwards and losses deferred due to wash sales and excise tax regulations.
The federal tax cost of investment securities and unrealized appreciation (depreciation) as of period end were as follows for each Fund:
| Tax cost | Gross unrealized | Gross unrealized | Net unrealized |
Automotive Portfolio | $ 171,274,899 | $ 73,299,525 | $ (1,173,428) | $ 72,126,097 |
Construction and Housing Portfolio | 270,046,928 | 113,789,507 | (151,490) | 113,638,017 |
Consumer Discretionary Portfolio | 454,464,229 | 110,972,043 | (3,575,710) | 107,396,333 |
Leisure Portfolio | 352,591,021 | 214,535,322 | (4,104,258) | 210,431,064 |
Multimedia Portfolio | 692,770,329 | 343,961,979 | (1,743,992) | 342,217,987 |
Retailing Portfolio | 771,934,075 | 317,550,105 | (12,889,122) | 304,660,983 |
The tax-based components of distributable earnings as of period end were as follows for each Fund:
| Undistributed | Undistributed | Net unrealized |
Automotive Portfolio | $ 3,768,086 | $ 12,537,248 | $ 72,125,327 |
Construction and Housing Portfolio | 294,003 | 15,633,936 | 113,638,228 |
Consumer Discretionary Portfolio | 11,100,212 | 26,737,915 | 107,396,333 |
Leisure Portfolio | 7,219,966 | 9,994,080 | 210,431,140 |
Multimedia Portfolio | 3,184,880 | 12,131,862 | 342,217,987 |
Retailing Portfolio | 15,745,195 | 23,134,630 | 304,664,035 |
Certain of the Funds intend to elect to defer to the next fiscal year capital losses recognized during the period November 1, 2013 to February 28, 2014. Loss deferrals were as follows:
| Capital losses |
Construction and Housing Portfolio | $ (443,034) |
The tax character of distributions paid was as follows:
February 28, 2014 |
|
|
|
| Ordinary Income | Long-term | Total |
Automotive Portfolio | $ 885,596 | $ 4,386,096 | $ 5,271,692 |
Construction and Housing Portfolio | 6,268,026 | 26,831,104 | 33,099,130 |
Consumer Discretionary Portfolio | 21,825,438 | 26,576,301 | 48,401,739 |
Leisure Portfolio | 15,699,008 | 21,524,989 | 37,223,997 |
Multimedia Portfolio | 12,876,180 | 16,936,016 | 29,812,196 |
Retailing Portfolio | 11,057,234 | 15,267,515 | 26,324,749 |
February 28, 2013 |
|
|
|
| Ordinary Income | Long-term | Total |
Automotive Portfolio | $ 740,892 | $ 99,972 | $ 840,864 |
Construction and Housing Portfolio | 1,172,487 | 4,637,838 | 5,810,325 |
Consumer Discretionary Portfolio | 5,808,610 | 24,440,710 | 30,249,320 |
Annual Report
3. Significant Accounting Policies - continued
Income Tax Information and Distributions to Shareholders - continued
February 28, 2013 |
|
|
|
| Ordinary Income | Long-term | Total |
Leisure Portfolio | $ 4,448,135 | $ 14,222,894 | $ 18,671,029 |
Multimedia Portfolio | 3,485,896 | - | 3,485,896 |
Retailing Portfolio | 3,444,682 | 12,259,653 | 15,704,335 |
Trading (Redemption) Fees. Shares held by investors in the Funds less than 30 days may be subject to a redemption fee equal to .75% of the NAV of shares redeemed. All redemption fees, which reduce the proceeds of the shareholder redemption, are retained by the Funds and accounted for as an addition to paid in capital.
Restricted Securities. The Funds may invest in securities that are subject to legal or contractual restrictions on resale. These securities generally may be resold in transactions exempt from registration or to the public if the securities are registered. Disposal of these securities may involve time-consuming negotiations and expense, and prompt sale at an acceptable price may be difficult. Information regarding restricted securities is included at the end of each applicable Fund's Schedule of Investments.
4. Purchases and Sales of Investments.
Purchases and sales of securities, other than short-term securities, are noted in the table below.
| Purchases ($) | Sales ($) |
Automotive Portfolio | 357,129,491 | 360,100,527 |
Construction and Housing Portfolio | 304,816,195 | 790,388,169 |
Consumer Discretionary Portfolio | 733,114,671 | 703,301,295 |
Leisure Portfolio | 380,542,829 | 283,682,760 |
Multimedia Portfolio | 1,096,784,046 | 982,296,506 |
Retailing Portfolio | 803,394,248 | 629,365,813 |
5. Fees and Other Transactions with Affiliates.
Management Fee. Effective August 1, 2013, SelectCo replaced Fidelity Management and Research Company (FMR), an affiliate of SelectCo, as investment adviser to the Funds. The investment adviser and its affiliates provide the Funds with investment management related services for which the Funds pay a monthly management fee. The management fee is the sum of an individual fund fee rate and an annualized group fee rate. The individual fund fee rate is applied to each Fund's average net assets. The group fee rate is based upon the average net assets of all the mutual funds advised by FMR and the investment adviser. The group fee rate decreases as assets under management increase and increases as assets under management decrease. For the reporting period, each Fund's annual management fee rate expressed as a percentage of each Fund's average net assets was as follows:
Fund Name | Individual Rate | Group Rate | Total |
Automotive Portfolio | .30% | .25% | .55% |
Construction and Housing Portfolio | .30% | .25% | .55% |
Consumer Discretionary Portfolio | .30% | .25% | .55% |
Leisure Portfolio | .30% | .25% | .55% |
Multimedia Portfolio | .30% | .25% | .55% |
Retailing Portfolio | .30% | .25% | .55% |
Transfer Agent Fees. Fidelity Investments Institutional Operations Company, Inc. (FIIOC), an affiliate of the investment adviser, is the Funds' transfer, dividend disbursing and shareholder servicing agent. FIIOC receives account fees and asset-based fees that vary according to account size and type of account. FIIOC pays for typesetting, printing and mailing of shareholder reports, except proxy statements. For the period, transfer agent fees were equivalent to the following annual rates expressed as a percentage of average net assets:
Automotive Portfolio | .19% |
Construction and Housing Portfolio | .20% |
Consumer Discretionary Portfolio | .20% |
Leisure Portfolio | .20% |
Multimedia Portfolio | .20% |
Retailing Portfolio | .21% |
Annual Report
Notes to Financial Statements - continued
5. Fees and Other Transactions with Affiliates - continued
Accounting and Security Lending Fees. Fidelity Service Company, Inc. (FSC), an affiliate of the investment adviser, maintains each Fund's accounting records. The accounting fee is based on the level of average net assets for each month. Under a separate contract, FSC administers the security lending program. The security lending fee is based on the number and duration of lending transactions.
Brokerage Commissions. Certain Funds placed a portion of their portfolio transactions with brokerage firms which are affiliates of the investment adviser. Brokerage commissions are included in net realized gain (loss) and change in net unrealized appreciation (depreciation) in the Statement of Operations. The commissions paid to these affiliated firms were as follows:
| Amount |
Automotive Portfolio | $ 13,539 |
Construction and Housing Portfolio | 46,325 |
Consumer Discretionary Portfolio | 14,316 |
Leisure Portfolio | 8,565 |
Multimedia Portfolio | 47,683 |
Retailing Portfolio | 12,740 |
Interfund Lending Program. Pursuant to an Exemptive Order issued by the SEC, the Funds, along with other registered investment companies having management contracts with FMR or other affiliated entities of FMR, may participate in an interfund lending program. This program provides an alternative credit facility allowing the funds to borrow from, or lend money to, other participating affiliated funds. At period end, there were no interfund loans outstanding. Each applicable fund's activity in this program during the period for which loans were outstanding was as follows:
| Borrower or | Average Loan | Weighted Average | Interest |
Automotive Portfolio | Borrower | $ 5,977,688 | .31% | $ 824 |
Construction and Housing Portfolio | Borrower | 4,827,250 | .33% | 1,221 |
Consumer Discretionary Portfolio | Borrower | 6,588,765 | .29% | 908 |
Multimedia Portfolio | Borrower | 20,747,000 | .31% | 6,680 |
Retailing Portfolio | Borrower | 17,990,333 | .31% | 1,846 |
Other. During the period, the investment adviser reimbursed Multimedia Portfolio for certain losses in the amount of $29,414.
6. Committed Line of Credit.
Certain Funds participate with other funds managed by the investment adviser or an affiliate in a $4.25 billion credit facility (the "line of credit") to be utilized for temporary or emergency purposes to fund shareholder redemptions or for other short-term liquidity purposes. The participating funds have agreed to pay commitment fees on their pro-rata portion of the line of credit, which are reflected in Miscellaneous expenses on the Statement of Operations, and are as follows:
Automotive Portfolio | $ 444 |
Construction and Housing Portfolio | 1,279 |
Consumer Discretionary Portfolio | 945 |
Leisure Portfolio | 793 |
Multimedia Portfolio | 1,645 |
Retailing Portfolio | 1,539 |
During the period, there were no borrowings on this line of credit.
7. Security Lending.
Certain Funds lend portfolio securities through a lending agent from time to time in order to earn additional income. For equity securities, a lending agent is used and may loan securities to certain qualified borrowers, which prior to August 1, 2013 included Fidelity Capital Markets (FCM), a broker-dealer affiliated with the Funds. On the settlement date of the loan, each applicable Fund receives collateral (in the form of U.S. Treasury obligations, letters of credit and/or cash) against the loaned securities and maintains collateral in an amount not less than 100% of the market value of the loaned securities during the period of the loan. The market value of the loaned securities is determined at the close of business of the Funds and any additional required collateral is delivered to the Funds on the next business day. If the borrower defaults on its obligation to return the securities loaned because of insolvency or other reasons, the Funds may apply collateral received from the borrower against the obligation. The Funds may experience delays and costs in recovering the securities loaned. Any cash collateral received is invested in the Fidelity Securities Lending Cash Central Fund. The value of loaned securities and cash collateral at period end are disclosed on each applicable Fund's Statement of Assets and Liabilities. At period end, there were no security loans outstanding with FCM. Security lending income represents the income earned on investing cash collateral, less rebates paid to borrowers and any lending agent fees associated with the loan, plus any premium payments received for lending certain types of securities.
Annual Report
7. Security Lending - continued
Security lending income is presented on each applicable Fund's Statement of Operations as a component of income from Fidelity Central Funds. FCM security lending activity was as follows:
| Security Lending |
Automotive Portfolio | $ 4,131 |
Multimedia Portfolio | 3,467 |
8. Bank Borrowings.
Each Fund is permitted to have bank borrowings for temporary or emergency purposes to fund shareholder redemptions or for other short-term liquidity requirements. Each Fund has established borrowing arrangements with certain banks. The interest rate on the borrowings is the bank's base rate, as revised from time to time. At period end, there were no bank borrowings outstanding. Each applicable Fund's activity in this program during the period for which loans were outstanding was as follows:
| Average Loan | Weighted Average | Interest |
Construction and Housing Portfolio | $ 6,767,536 | .60% | $ 3,135 |
9. Expense Reductions.
Commissions paid to certain brokers with whom the investment adviser, or its affiliates, places trades on behalf of Certain Funds include an amount in addition to trade execution, which may be rebated back to the Funds to offset certain expenses. In addition, through arrangements with each applicable Fund's custodian, credits realized as a result of uninvested cash balances were used to reduce each applicable Fund's expenses. All of the applicable expense reductions are noted in the table below.
| Brokerage Service | Custody expense |
Automotive Portfolio | $ 14,560 | $ - |
Construction and Housing Portfolio | 30,796 | - |
Consumer Discretionary Portfolio | 53,034 | 6 |
Leisure Portfolio | 31,249 | 37 |
Multimedia Portfolio | 130,861 | 43 |
Retailing Portfolio | 64,966 | - |
In addition, FMR reimbursed a portion of each Fund's operating expenses during the period as follows:
| Reimbursement |
Automotive Portfolio | $ 750 |
Construction and Housing Portfolio | 4,938 |
Consumer Discretionary Portfolio | 451 |
Leisure Portfolio | 3,598 |
Multimedia Portfolio | 2,367 |
Retailing Portfolio | 1,828 |
10. Other.
The Funds' organizational documents provide former and current trustees and officers with a limited indemnification against liabilities arising in connection with the performance of their duties to the Funds. In the normal course of business, the Funds may also enter into contracts that provide general indemnifications. The Funds' maximum exposure under these arrangements is unknown as this would be dependent on future claims that may be made against the Funds. The risk of material loss from such claims is considered remote.
At the end of the period, VIP FundsManager 60% Portfolio was the owner of record of approximately 12% and 31% of the total outstanding shares of Construction and Housing Portfolio and Consumer Discretionary Portfolio, respectively. VIP FundsManager 50% Portfolio was the owner of record of approximately 10% of the total outstanding shares of Automotive Portfolio. Strategic Advisers U.S. Opportunity Fund was the owner of record of approximately 13% and 18% of the total outstanding shares of Consumer Discretionary Portfolio and Leisure Portfolio, respectively. Mutual funds managed by the investment adviser or its affiliates, were the owners of record, in the aggregate, of approximately 65%, 26%, 21% and 20% of the total outstanding shares of Consumer Discretionary Portfolio, Leisure Portfolio, Automotive Portfolio and Construction and Housing Portfolio, respectively.
Annual Report
Report of Independent Registered Public Accounting Firm
To the Trustees of Fidelity Select Portfolios and the Shareholders of Automotive Portfolio, Construction and Housing Portfolio, Consumer Discretionary Portfolio, Leisure Portfolio, Multimedia Portfolio and Retailing Portfolio:
In our opinion, the accompanying statements of assets and liabilities, including the schedules of investments, and the related statements of operations and of changes in net assets and the financial highlights present fairly, in all material respects, the financial positions of Automotive Portfolio, Construction and Housing Portfolio, Consumer Discretionary Portfolio, Leisure Portfolio, Multimedia Portfolio and Retailing Portfolio (funds of Fidelity Select Portfolios) at February 28, 2014, the results of each of their operations for the year then ended, the changes in each of their net assets for each of the two years in the period then ended and the financial highlights for each of the five years in the period then ended, in conformity with accounting principles generally accepted in the United States of America. These financial statements and financial highlights (hereafter referred to as "financial statements") are the responsibility of the Fidelity Select Portfolios' management. Our responsibility is to express an opinion on these financial statements based on our audits. We conducted our audits of these financial statements in accordance with the standards of the Public Company Accounting Oversight Board (United States). Those standards require that we plan and perform the audit to obtain reasonable assurance about whether the financial statements are free of material misstatement. An audit includes examining, on a test basis, evidence supporting the amounts and disclosures in the financial statements, assessing the accounting principles used and significant estimates made by management, and evaluating the overall financial statement presentation. We believe that our audits, which included confirmation of securities at February 28, 2014 by correspondence with the custodian and brokers, provide a reasonable basis for our opinion.
PricewaterhouseCoopers LLP
Boston, Massachusetts
April 15, 2014
Annual Report
Trustees and Officers
The Trustees and officers of the trust and funds, as applicable, are listed below. The Board of Trustees governs each fund and is responsible for protecting the interests of shareholders. The Trustees are experienced executives who meet periodically throughout the year to oversee each fund's activities, review contractual arrangements with companies that provide services to each fund, oversee management of the risks associated with such activities and contractual arrangements, and review each fund's performance. Except for Ned C. Lautenbach and William S. Stavropoulos, each of the Trustees oversees 74 funds. Mr. Lautenbach and Mr. Stavropoulos each oversees 246 funds.
The Trustees hold office without limit in time except that (a) any Trustee may resign; (b) any Trustee may be removed by written instrument, signed by at least two-thirds of the number of Trustees prior to such removal; (c) any Trustee who requests to be retired or who has become incapacitated by illness or injury may be retired by written instrument signed by a majority of the other Trustees; and (d) any Trustee may be removed at any special meeting of shareholders by a two-thirds vote of the outstanding voting securities of the trust. The officers hold office without limit in time, except that any officer may resign or may be removed by a vote of a majority of the Trustees at any regular meeting or any special meeting of the Trustees. Except as indicated, each individual has held the office shown or other offices in the same company for the past five years.
Experience, Skills, Attributes, and Qualifications of the Funds' Trustees. The Governance and Nominating Committee has adopted a statement of policy that describes the experience, qualifications, attributes, and skills that are necessary and desirable for potential Independent Trustee candidates (Statement of Policy). The Board believes that each Trustee satisfied at the time he or she was initially elected or appointed a Trustee, and continues to satisfy, the standards contemplated by the Statement of Policy. The Governance and Nominating Committee also engages professional search firms to help identify potential Independent Trustee candidates who have the experience, qualifications, attributes, and skills consistent with the Statement of Policy. From time to time, additional criteria based on the composition and skills of the current Independent Trustees, as well as experience or skills that may be appropriate in light of future changes to board composition, business conditions, and regulatory or other developments, have also been considered by the professional search firms and the Governance and Nominating Committee. In addition, the Board takes into account the Trustees' commitment and participation in Board and committee meetings, as well as their leadership of standing and ad hoc committees throughout their tenure.
In determining that a particular Trustee was and continues to be qualified to serve as a Trustee, the Board has considered a variety of criteria, none of which, in isolation, was controlling. The Board believes that, collectively, the Trustees have balanced and diverse experience, qualifications, attributes, and skills, which allow the Board to operate effectively in governing each fund and protecting the interests of shareholders. Information about the specific experience, skills, attributes, and qualifications of each Trustee, which in each case led to the Board's conclusion that the Trustee should serve (or continue to serve) as a trustee of the funds, is provided below.
Board Structure and Oversight Function. Brian B. Hogan is an interested person (as defined in the 1940 Act) and currently serves as Chairman. The Trustees have determined that an interested Chairman is appropriate and benefits shareholders because an interested Chairman has a personal and professional stake in the quality and continuity of services provided to the funds. Independent Trustees exercise their informed business judgment to appoint an individual of their choosing to serve as Chairman, regardless of whether the Trustee happens to be independent or a member of management. The Independent Trustees have determined that they can act independently and effectively without having an Independent Trustee serve as Chairman and that a key structural component for assuring that they are in a position to do so is for the Independent Trustees to constitute a substantial majority for the Board. The Independent Trustees also regularly meet in executive session. Michael E. Wiley serves as Chairman of the Independent Trustees and as such (i) acts as a liaison between the Independent Trustees and management with respect to matters important to the Independent Trustees and (ii) with management prepares agendas for Board meetings.
Fidelity funds are overseen by different Boards of Trustees. The funds' Board oversees Fidelity's sector portfolios. Other Boards oversee Fidelity's equity and high income funds, and Fidelity's investment grade bond, money market, and asset allocation funds. The use of separate Boards, each with its own committee structure, allows the Trustees of each group of Fidelity funds to focus on the unique issues of the funds they oversee, including common research, investment, and operational issues. On occasion, the separate Boards establish joint committees to address issues of overlapping consequences for the Fidelity funds overseen by each Board.
The Trustees operate using a system of committees to facilitate the timely and efficient consideration of all matters of importance to the Trustees, each fund, and fund shareholders and to facilitate compliance with legal and regulatory requirements and oversight of the funds' activities and associated risks. The Board, acting through its committees, has charged SelectCo and its affiliates with (i) identifying events or circumstances the occurrence of which could have demonstrably adverse effects on the funds' business and/or reputation; (ii) implementing processes and controls to lessen the possibility that such events or circumstances occur or to mitigate the effects of such events or circumstances if they do occur; and (iii) creating and maintaining a system designed to evaluate continuously business and market conditions in order to facilitate the identification and implementation processes described in (i) and (ii) above. Because the day-to-day operations and activities of the funds are carried out by or through SelectCo, its affiliates, and other service providers, the funds' exposure to risks is mitigated but not eliminated by the processes overseen by the Trustees. While each of the Board's committees has responsibility for overseeing different aspects of the funds' activities, oversight is exercised primarily through the Operations and Audit Committees. Appropriate personnel, including but not limited to the funds' Chief Compliance Officer (CCO), SelectCo's internal auditor, the independent accountants, the funds' Treasurer and portfolio management personnel, make periodic reports to the Board's committees, as appropriate. The responsibilities of each standing committee, including their oversight responsibilities, are described further under "Standing Committees of the Funds' Trustees."
The funds' Statement of Additional Information (SAI) includes more information about the Trustees. To request a free copy, call Fidelity at 1-800-544-8544.
Annual Report
Interested Trustee*:
Correspondence intended for the Trustee who is an interested person may be sent to Fidelity Investments, 245 Summer Street, Boston, Massachusetts 02210.
Name, Year of Birth; Principal Occupations and Other Relevant Experience+ | |
Brian B. Hogan (1964) | |
Year of Election or Appointment: 2014 Trustee Chairman of the Board of Trustees | |
| Mr. Hogan also serves as Trustee or Vice President of other funds. Mr. Hogan serves as President of FMR's Equity Division (2009-present). Previously, Mr. Hogan served as Senior Vice President, Equity Research of FMR (2006-2009) and as a portfolio manager. |
* Trustee has been determined to be an "Interested Trustee" by virtue of, among other things, his affiliation with the trust or various entities under common control with SelectCo.
+ The information above includes the Trustee's principal occupation during the last five years and other information relating to the experience, attributes, and skills relevant to the Trustee's qualifications to serve as a Trustee, which led to the conclusion that the Trustee should serve as a Trustee for each fund.
Independent Trustees:
Correspondence intended for each Independent Trustee (that is, the Trustees other than the Interested Trustee) may be sent to Fidelity Investments, P.O. Box 55235, Boston, Massachusetts 02205-5235.
Name, Year of Birth; Principal Occupations and Other Relevant Experience+ | |
Ned C. Lautenbach (1944) | |
Year of Election or Appointment: 2000 Trustee | |
| Mr. Lautenbach also serves as Trustee of other Fidelity funds. Mr. Lautenbach currently serves as the Lead Director of the Eaton Corporation Board of Directors (diversified industrial, 1997-present). Mr. Lautenbach is Chairman of the Board of Directors of the Philharmonic Center for the Arts in Naples, Florida (2012-present) and a member of the Council on Foreign Relations (1994-present). Previously, Mr. Lautenbach was a Partner/Advisory Partner at Clayton, Dubilier & Rice, LLC (private equity investment, 1998-2010), as well as a Director of Sony Corporation (2006-2007). |
David A. Rosow (1942) | |
Year of Election or Appointment: 2013 Trustee | |
| Mr. Rosow also serves as Trustee of other Fidelity funds. Mr. Rosow is Chairman and Chief Executive Officer of International Golf Group, Inc. (golf course development, 1989-present). Previously, Mr. Rosow served as Chairman and Chief Executive Officer of Rosow & Company, Inc. (private investment company, 1989-2011), a Lead Director of Hudson United Bancorp (2001-2006) and as a Director of TD Banknorth (1996-2006). In addition, Mr. Rosow is a member (2008-present) and President (2009-present) of the Town Council of Palm Beach, Florida. Mr. Rosow served as a Member of the Advisory Board of other Fidelity funds (2012-2013). |
Garnett A. Smith (1947) | |
Year of Election or Appointment: 2013 Trustee | |
| Mr. Smith also serves as Trustee of other Fidelity funds. Prior to Mr. Smith's retirement, he served as Chairman and Chief Executive Officer of Inbrand Corp. (manufacturer of personal absorbent products, 1990-1997). He also served as President (1986-1990) of Inbrand Corp. Prior to his employment with Inbrand Corp., he was employed by a retail fabric chain and North Carolina National Bank. In addition, Mr. Smith is a board member of the Jackson Hole Land Trust (2009-present). Mr. Smith served as a Member of the Advisory Board of other Fidelity funds (2012-2013). |
William S. Stavropoulos (1939) | |
Year of Election or Appointment: 2001 Trustee | |
| Mr. Stavropoulos also serves as Trustee of other Fidelity funds. Mr. Stavropoulos serves as President and Founder of the Michigan Baseball Foundation, the Great Lakes Loons (2007-present). Mr. Stavropoulos is Chairman Emeritus of the Board of Directors of The Dow Chemical Company, where he previously served in numerous senior management positions, including President, CEO (1995-2000; 2002-2004), Chairman of the Executive Committee (2000-2006), and as a member of the Board of Directors (1990-2006). Currently, Mr. Stavropoulos is Chairman of the Board of Directors of Univar Inc. (global distributor of commodity and specialty chemicals), a Director of Teradata Corporation (data warehousing and technology solutions), and Maersk Inc. (industrial conglomerate), and a member of the Advisory Board for Metalmark Capital LLC (private equity investment, 2005-present). Mr. Stavropoulos is an operating advisor to Clayton, Dubilier & Rice, LLC (private equity investment). In addition, Mr. Stavropoulos is a member of the University of Notre Dame Advisory Council for the College of Science, a Trustee of the Rollin L. Gerstacker Foundation, and a Director of the Naples Philharmonic Center for the Arts. Previously, Mr. Stavropoulos served as a Director of Chemical Financial Corporation (bank holding company, 1993-2012) and Tyco International, Ltd. (multinational manufacturing and services, 2007-2012). |
Michael E. Wiley (1950) | |
Year of Election or Appointment: 2008 Trustee Chairman of the Independent Trustees | |
| Mr. Wiley also serves as Trustee of other Fidelity funds. Mr. Wiley serves as a Director of Asia Pacific Exploration Consolidated (international oil and gas exploration and production, 2008-present). Mr. Wiley serves as a Director of Tesoro Corporation (independent oil refiner and marketer, 2005-present), and a Director of Bill Barrett Corporation (exploration and production, 2005-present). In addition, Mr. Wiley also serves as a Director of Post Oak Bank (privately-held bank, 2004-present). Previously, Mr. Wiley served as a Trustee of other Fidelity funds (2008-2013), as a member of the Board of Trustees of the University of Tulsa (2000-2006; 2007-2010), as a Senior Energy Advisor of Katzenbach Partners, LLC (consulting, 2006-2007), as an Advisory Director of Riverstone Holdings (private investment), Chairman, President, and CEO of Baker Hughes, Inc. (oilfield services, 2000-2004), and as Director of Spinnaker Exploration Company (exploration and production, 2001-2005). |
+ The information above includes each Trustee's principal occupation during the last five years and other information relating to the experience, attributes, and skills relevant to each Trustee's qualifications to serve as a Trustee, which led to the conclusion that each Trustee should serve as a Trustee for each fund.
Officers:
Except for Anthony R. Rochte, correspondence intended for each officer may be sent to Fidelity Investments, 245 Summer Street, Boston, Massachusetts 02210. Correspondence intended for Mr. Rochte may be sent to SelectCo, 1225 17th Street, Denver, Colorado 80202-5541. Officers appear below in alphabetical order.
Name, Year of Birth; Principal Occupation | |
Christopher S. Bartel (1971) | |
Year of Election or Appointment: 2009 Vice President | |
| Mr. Bartel also serves as Vice President of other funds. Mr. Bartel serves as a Director, President, and Chief Executive Officer of Fidelity Management & Research (Japan) Inc. (2012-present), a Director of Fidelity Management & Research (Hong Kong) (2012-present), and Senior Vice President of Global Equity Research (2010-present). Previously, Mr. Bartel served as Senior Vice President of Equity Research (2009-2010), Managing Director of Research (2006-2009), and an analyst and portfolio manager (2000-2006). |
Elizabeth Paige Baumann (1968) | |
Year of Election or Appointment: 2012 Anti-Money Laundering (AML) Officer | |
| Ms. Baumann also serves as AML Officer of other funds. She is Chief AML Officer of FMR LLC (2012-present) and is an employee of Fidelity Investments. Previously, Ms. Baumann served as Vice President and Deputy Anti-Money Laundering Officer (2007-2012). |
Marc Bryant (1966) | |
Year of Election or Appointment: 2013 Secretary | |
| Mr. Bryant also serves as an officer of other funds. He is Senior Vice President and Deputy General Counsel of FMR LLC. Prior to joining Fidelity Investments, Mr. Bryant served as a Senior Vice President and the Head of Global Retail Legal for AllianceBernstein L.P. (2006-2010), and as the General Counsel for ProFund Advisors LLC (2001-2006). |
William C. Coffey (1969) | |
Year of Election or Appointment: 2009 Assistant Secretary | |
| Mr. Coffey also serves as Assistant Secretary of other funds. He is Senior Vice President and Deputy General Counsel of FMR LLC (2010-present), and is an employee of Fidelity Investments. Previously, Mr. Coffey served as Vice President and Associate General Counsel of FMR LLC (2005-2009). |
Jonathan Davis (1968) | |
Year of Election or Appointment: 2010 Assistant Treasurer | |
| Mr. Davis also serves as Assistant Treasurer of other funds. Mr. Davis is an employee of Fidelity Investments. Previously, Mr. Davis served as Vice President and Associate General Counsel of FMR LLC (2003-2010). |
Adrien E. Deberghes (1967) | |
Year of Election or Appointment: 2013 President and Treasurer | |
| Mr. Deberghes also serves as an officer of other funds. He is an employee of Fidelity Investments (2008-present). Prior to joining Fidelity Investments, Mr. Deberghes was Senior Vice President of Mutual Fund Administration at State Street Corporation (2007-2008), Senior Director of Mutual Fund Administration at Investors Bank & Trust (2005-2007), and Director of Finance for Dunkin' Brands (2000-2005). |
Stephanie J. Dorsey (1969) | |
Year of Election or Appointment: 2010 Assistant Treasurer | |
| Ms. Dorsey also serves as an officer of other funds. She is an employee of Fidelity Investments (2008-present) and has served in other fund officer roles. Prior to joining Fidelity Investments, Ms. Dorsey served as Treasurer (2004-2008) of the JPMorgan Mutual Funds and Vice President (2004-2008) of JPMorgan Chase Bank. |
Joseph A. Hanlon (1968) | |
Year of Election or Appointment: 2012 Chief Compliance Officer | |
| Mr. Hanlon also serves as Chief Compliance Officer of other funds. Mr. Hanlon serves as Compliance Officer of FMR, FMR Co., Inc., Fidelity Investments Money Management, Inc. (FIMM), Fidelity Research and Analysis Company (FRAC), and Fidelity Management & Research (Hong Kong) (2009-present), as Senior Vice President of the Fidelity Asset Management Division (2009-present), and is an employee of Fidelity Investments. Previously, Mr. Hanlon served as Compliance Officer of Fidelity Management & Research (Japan) Inc. (2009-2013), Strategic Advisers, Inc. (2009-2013), and Fidelity Management & Research (U.K.) Inc. (2009-2013). |
Brian B. Hogan (1964) | |
Year of Election or Appointment: 2009 Vice President | |
| Mr. Hogan also serves as Trustee or Vice President of other funds. Mr. Hogan serves as President of FMR's Equity Division (2009-present). Previously, Mr. Hogan served as Senior Vice President, Equity Research of FMR (2006-2009) and as a portfolio manager. |
Chris Maher (1972) | |
Year of Election or Appointment: 2013 Assistant Treasurer | |
| Mr. Maher serves as Assistant Treasurer of other funds. Mr. Maher is Vice President of Valuation Oversight and is an employee of Fidelity Investments. Previously, Mr. Maher served as Vice President of Asset Management Compliance (2013), Vice President of FMR's Program Management Group (2010-2013), and Vice President of Valuation Oversight (2008-2010). |
Christine Reynolds (1958) | |
Year of Election or Appointment: 2008 Chief Financial Officer | |
| Ms. Reynolds also serves as Chief Financial Officer of other funds. Ms. Reynolds became President of Fidelity Pricing and Cash Management Services (FPCMS) in August 2008. Ms. Reynolds served as Chief Operating Officer of FPCMS (2007-2008). Previously, Ms. Reynolds served as President, Treasurer, and Anti-Money Laundering officer of the Fidelity funds (2004-2007). |
Kenneth B. Robins (1969) | |
Year of Election or Appointment: 2013 Deputy Treasurer | |
| Mr. Robins also serves as an officer of other funds. Mr. Robins serves as Executive Vice President of Fidelity Investments Money Management, Inc. (FIMM) (2013-present) and is an employee of Fidelity Investments (2004-present). Previously, Mr. Robins served in other fund officer roles. |
Anthony R. Rochte (1968) | |
Year of Election or Appointment: 2013 Vice President | |
| Mr. Rochte also serves as Vice President of other funds. Mr. Rochte serves as President of Fidelity SelectCo, LLC (2012-present) and is an employee of Fidelity Investments (2012-present). Prior to joining Fidelity Investments, Mr. Rochte served as Senior Managing Director and head of State Street Global Advisors' North American Intermediary Business Group (2006-2012). |
Stacie M. Smith (1974) | |
Year of Election or Appointment: 2013 Assistant Treasurer | |
| Ms. Smith also serves as an officer of other funds. She is an employee of Fidelity Investments (2009-present) and has served in other fund officer roles. Prior to joining Fidelity Investments, Ms. Smith served as Senior Audit Manager of Ernst & Young LLP (1996-2009). |
Renee Stagnone (1975) | |
Year of Election or Appointment: 2013 Deputy Treasurer | |
| Ms. Stagnone also serves as Deputy Treasurer of other funds. Ms. Stagnone is an employee of Fidelity Investments. |
Joseph F. Zambello (1957) | |
Year of Election or Appointment: 2011 Deputy Treasurer | |
| Mr. Zambello also serves as Deputy Treasurer of other funds. Mr. Zambello is an employee of Fidelity Investments. Previously, Mr. Zambello served as Vice President of FMR's Program Management Group (2009-2011) and Vice President of the Transfer Agent Oversight Group (2005-2009). |
Annual Report
Distributions (Unaudited)
The Board of Trustees of each fund voted to pay to shareholders of record at the opening of business on record date, the following distributions per share derived from capital gains realized from sales of portfolio securities, and dividends derived from net investment income:
| Pay Date | Record Date | Dividends | Capital Gains |
Automotive Portfolio | 04/14/14 | 04/11/14 | $0.043 | $4.944 |
Construction and Housing Portfolio | 04/14/14 | 04/11/14 | $0.046 | $2.425 |
Consumer Discretionary Portfolio | 04/14/14 | 04/11/14 | $0.009 | $1.560 |
Leisure Portfolio | 04/14/14 | 04/11/14 | $0.374 | $3.734 |
Multimedia Portfolio | 04/14/14 | 04/11/14 | $0.006 | $1.353 |
Retailing Portfolio | 04/14/14 | 04/11/14 | $0.024 | $3.468 |
The funds hereby designate as capital gain dividend the amounts noted below for the taxable year ended February 28, 2014, or, if subsequently determined to be different, the net capital gain of such year.
Automotive Portfolio | $16,923,344 |
Construction and Housing Portfolio | $45,756,461 |
Consumer Discretionary Portfolio | $51,003,317 |
Leisure Portfolio | $20,352,892 |
Multimedia Portfolio | $29,067,879 |
Retailing Portfolio | $38,239,482 |
A percentage of the dividends distributed during the fiscal year for the following funds qualifies for the dividends-received deduction for corporate shareholders:
| April 2013 | December 2013 |
Automotive Portfolio | 0% | 100% |
Construction and Housing Portfolio | 45% | 100% |
Consumer Discretionary Portfolio | 65% | 17% |
Leisure Portfolio | 99% | 35% |
Multimedia Portfolio | 0% | 67% |
Retailing Portfolio | 100% | 49% |
A percentage of the dividends distributed during the fiscal year for the following funds may be taken into account as a dividend for purposes of the maximum rate under section 1(h)(11) of the Internal Revenue Code.
| April 2013 | December 2013 |
Automotive Portfolio | 0% | 100% |
Construction and Housing Portfolio | 46% | 100% |
Consumer Discretionary Portfolio | 66% | 18% |
Leisure Portfolio | 99% | 37% |
Multimedia Portfolio | 0% | 68% |
Retailing Portfolio | 100% | 56% |
The funds will notify shareholders in January 2015 of amounts for use in preparing 2014 income tax returns.
Annual Report
Proxy Voting Results
A special meeting of each fund's shareholders was held on June 18, 2013. The results of votes taken among shareholders on the proposals before them are reported below. Each vote reported represents one dollar of net asset value held on the record date for the meeting.
PROPOSAL 1 | ||
To elect a Board of Trustees.A | ||
| # of | % of |
Ned C. Lautenbach | ||
Affirmative | 25,828,395,115.78 | 94.160 |
Withheld | 1,602,101,684.27 | 5.840 |
TOTAL | 27,430,496,800.05 | 100.000 |
Ronald P. O'Hanley | ||
Affirmative | 25,907,936,922.24 | 94.450 |
Withheld | 1,522,559,877.81 | 5.550 |
TOTAL | 27,430,496,800.05 | 100.000 |
David A. Rosow | ||
Affirmative | 25,805,492,959.91 | 94.076 |
Withheld | 1,625,003,840.14 | 5.924 |
TOTAL | 27,430,496,800.05 | 100.000 |
Garnett A. Smith | ||
Affirmative | 25,892,258,831.97 | 94.393 |
Withheld | 1,538,237,968.08 | 5.607 |
TOTAL | 27,430,496,800.05 | 100.000 |
William S. Stavropoulos | ||
Affirmative | 25,738,476,030.34 | 93.832 |
Withheld | 1,692,020,769.71 | 6.168 |
TOTAL | 27,430,496,800.05 | 100.000 |
Michael E. Wiley | ||
Affirmative | 25,923,640,743.27 | 94.507 |
Withheld | 1,506,856,056.78 | 5.493 |
TOTAL | 27,430,496,800.05 | 100.000 |
PROPOSAL 2 | ||
To approve a management contract between Automotive Portfolio and Fidelity SelectCo, LLC. | ||
| # of | % of |
Affirmative | 59,456,073.62 | 83.407 |
Against | 2,968,798.96 | 4.165 |
Abstain | 3,388,551.92 | 4.753 |
Broker Non-Vote | 5,471,338.90 | 7.675 |
TOTAL | 71,284,763.40 | 100.000 |
PROPOSAL 2 | ||
To approve a management contract between Construction and Housing Portfolio and Fidelity SelectCo, LLC. | ||
| # of | % of |
Affirmative | 487,245,211.67 | 89.614 |
Against | 14,884,543.68 | 2.737 |
Abstain | 20,059,355.03 | 3.689 |
Broker Non-Vote | 21,532,222.06 | 3.960 |
TOTAL | 543,721,332.44 | 100.000 |
PROPOSAL 2 | ||
To approve a management contract between Consumer Discretionary Portfolio and Fidelity SelectCo, LLC. | ||
| # of | % of |
Affirmative | 308,362,872.34 | 88.908 |
Against | 18,608,944.26 | 5.366 |
Abstain | 17,176,740.05 | 4.952 |
Broker Non-Vote | 2,687,033.47 | 0.774 |
TOTAL | 346,835,590.12 | 100.000 |
PROPOSAL 2 | ||
To approve a management contract between Leisure Portfolio and Fidelity SelectCo, LLC. | ||
| # of | % of |
Affirmative | 165,686,480.59 | 81.571 |
Against | 14,092,417.40 | 6.938 |
Abstain | 7,517,529.30 | 3.701 |
Broker Non-Vote | 15,824,304.21 | 7.790 |
TOTAL | 203,120,731.50 | 100.000 |
PROPOSAL 2 | ||
To approve a management contract between Multimedia Portfolio and Fidelity SelectCo, LLC. | ||
| # of | % of |
Affirmative | 439,959,939.22 | 87.593 |
Against | 21,328,624.02 | 4.246 |
Abstain | 22,804,373.91 | 4.540 |
Broker Non-Vote | 18,189,658.12 | 3.621 |
TOTAL | 502,282,595.27 | 100.000 |
PROPOSAL 2 | ||
To approve a management contract between Retailing Portfolio and Fidelity SelectCo, LLC. | ||
| # of | % of |
Affirmative | 394,964,011.21 | 89.127 |
Against | 13,588,217.30 | 3.067 |
Abstain | 17,081,449.10 | 3.854 |
Broker Non-Vote | 17,514,657.46 | 3.952 |
TOTAL | 443,148,335.07 | 100.000 |
A Denotes trust-wide proposal and voting results. | ||
Annual Report
Investment Adviser
Fidelity SelectCo, LLC
Denver, CO
Investment Sub-Advisers
FMR Co., Inc.
Fidelity Management & Research
(U.K.) Inc.
Fidelity Management & Research
(Hong Kong) Limited
Fidelity Management & Research
(Japan) Inc.
General Distributor
Fidelity Distributors Corporation
Smithfield, RI
Transfer and Service Agents
Fidelity Investments Institutional Operations Company, Inc.
Boston, MA
Fidelity Service Company, Inc.
Boston, MA
Custodian
Brown Brothers Harriman & Co.
Boston, MA
Corporate Headquarters
245 Summer Street
Boston, MA 02210
1-800-544-8888
The Fidelity Telephone Connection
Mutual Fund 24-Hour Service
Exchanges/Redemptions
and Account Assistance 1-800-544-6666
Product Information 1-800-544-8888
Retirement Accounts 1-800-544-4774
(8 a.m. - 9 p.m.)
TDD Service 1-800-544-0118
for the deaf and hearing impaired
(9 a.m. - 9 p.m. Eastern time)
Fidelity Automated Service
Telephone (FAST®)
1-800-544-5555
Automated line for quickest service

SELCON-UANNPRO-0414
1.910417.104

Fidelity Advisor
Focus Funds®
Class A, Class T, Class B and Class C
Fidelity Advisor® Consumer Staples Fund
Fidelity Advisor Gold Fund
Fidelity Advisor Materials Fund
Fidelity Advisor Telecommunications Fund
Each Advisor fund listed above is a class
of the Fidelity® Select Portfolios®.
Annual Report
February 28, 2014
(Fidelity Cover Art)
Contents
Fidelity Advisor® Consumer Staples Fund | Performance | |
| Management's Discussion | |
| Shareholder Expense Example | |
| Investment Changes | |
| Investments | |
| Financial Statements | |
| Notes to the Financial Statements | |
Fidelity Advisor Gold Fund | Performance | |
| Management's Discussion | |
| Shareholder Expense Example | |
| Consolidated Investment Changes | |
| Consolidated Investments | |
| Consolidated Financial Statements | |
| Notes to the Consolidated Financial Statements | |
Fidelity Advisor Materials Fund | Performance | |
| Management's Discussion | |
| Shareholder Expense Example | |
| Investment Changes | |
| Investments | |
| Financial Statements | |
| Notes to the Financial Statements | |
Fidelity Advisor Telecommunications Fund | Performance | |
| Management's Discussion | |
| Shareholder Expense Example | |
| Investment Changes | |
| Investments | |
| Financial Statements | |
| Notes to the Financial Statements | |
Report of Independent Registered Public Accounting Firm |
| |
Trustees and Officers |
| |
Distributions |
| |
Proxy Voting Results |
|
To view a fund's proxy voting guidelines and proxy voting record for the 12-month period ended June 30, visit http://www.fidelity.com/proxyvotingresults or visit the Securities and Exchange Commission's (SEC) web site at http://www.sec.gov. You may also call 1-877-208-0098 to request a free copy of the proxy voting guidelines.
Standard & Poor's, S&P and S&P 500 are registered service marks of The McGraw-Hill Companies, Inc. and have been licensed for use by Fidelity Distributors Corporation.
Other third-party marks appearing herein are the property of their respective owners.
All other marks appearing herein are registered or unregistered trademarks or service marks of FMR LLC or an affiliated company. © 2014 FMR LLC. All rights reserved.
This report and the financial statements contained herein are submitted for the general information of the shareholders of the funds. This report is not authorized for distribution to prospective investors in the funds unless preceded or accompanied by an effective prospectus.
A fund files its complete schedule of portfolio holdings with the SEC for the first and third quarters of each fiscal year on Form N-Q. Forms N-Q are available on the SEC's web site at http://www.sec.gov. A fund's Forms N-Q may be reviewed and copied at the SEC's Public Reference Room in Washington, DC. Information regarding the operation of the SEC's Public Reference Room may be obtained by calling 1-800-SEC-0330. For a complete list of a fund's portfolio holdings, view the most recent holdings listing, semiannual report, or annual report on Fidelity's web site at http://www.fidelity.com, http://www.advisor.fidelity.com, or http://www.401k.com, as applicable.
NOT FDIC INSURED • MAY LOSE VALUE • NO BANK GUARANTEE
Neither the funds nor Fidelity Distributors Corporation is a bank.
Annual Report
Fidelity Advisor® Consumer Staples Fund - Class A, T, B and C
Performance: The Bottom Line
Average annual total return reflects the change in the value of an investment, assuming reinvestment of the class' distributions from dividend income and capital gains (the profits earned upon the sale of securities that have grown in value, if any) and assuming a constant rate of performance each year. The $10,000 table and the fund's returns do not reflect the deduction of taxes that a shareholder would pay on fund distributions or the redemption of fund shares. During periods of reimbursement by Fidelity, a fund's total return will be greater than it would be had the reimbursement not occurred. How a fund did yesterday is no guarantee of how it will do tomorrow. Returns reflect the conversion of Class B shares to Class A shares after a maximum of seven years.
Average Annual Total Returns
Periods ended February 28, 2014 | Past 1 | Past 5 | Past 10 |
Class A (incl. 5.75% sales charge) A | 4.17% | 17.55% | 9.79% |
Class T (incl. 3.50% sales charge) B | 6.37% | 17.77% | 9.82% |
Class B (incl. contingent deferred | 4.63% | 17.78% | 9.82% |
Class C (incl. contingent deferred sales charge) D | 8.70% | 18.06% | 9.84% |
A Class A shares bear a 0.25% 12b-1 fee. The initial offering of Class A shares took place on December 12, 2006. Returns prior to December 12, 2006, are those of Consumer Staples Portfolio, the original class of the fund, which has no 12b-1 fee. Had Class A's 12b-1 fee been reflected, returns prior to December 12, 2006, would have been lower.
B Class T shares bear a 0.50% 12b-1 fee. The initial offering of Class T shares took place on December 12, 2006. Returns prior to December 12, 2006, are those of Consumer Staples Portfolio, the original class of the fund, which has no 12b-1 fee. Had Class T's 12b-1 fee been reflected, returns prior to December 12, 2006, would have been lower.
C Class B shares bear a 1.00% 12b-1 fee. The initial offering of Class B shares took place on December 12, 2006. Returns prior to December 12, 2006, are those of Consumer Staples Portfolio, the original class of the fund, which has no 12b-1 fee. Had Class B's 12b-1 fee been reflected, returns prior to December 12, 2006, would have been lower. Class B shares' contingent deferred sales charges included in the past one year, past five years, and past ten years total return figures are 5%, 2%, and 0%, respectively.
D Class C shares bear a 1.00% 12b-1 fee. The initial offering of Class C shares took place on December 12, 2006. Returns prior to December 12, 2006, are those of Consumer Staples Portfolio, the original class of the fund, which has no 12b-1 fee. Had Class C's 12b-1 fee been reflected, returns prior to December 12, 2006, would have been lower. Class C shares' contingent deferred sales charges included in the past one year, past five years, and past ten years total return figures are 1%, 0%, and 0%, respectively.
Prior to October 1, 2006, the fund was named Food and Agriculture Portfolio, and the fund operated under certain different investment policies and compared its performance to a different additional index. The fund's historical performance may not represent its current investment policies.
$10,000 Over 10 Years
Let's say hypothetically that $10,000 was invested in Fidelity Advisor Consumer Staples Fund - Class A on February 29, 2004, and the current 5.75% sales charge was paid. The chart shows how the value of your investment would have changed, and also shows how the S&P 500® Index performed over the same period. See footnote A for additional information regarding the performance of Class A.
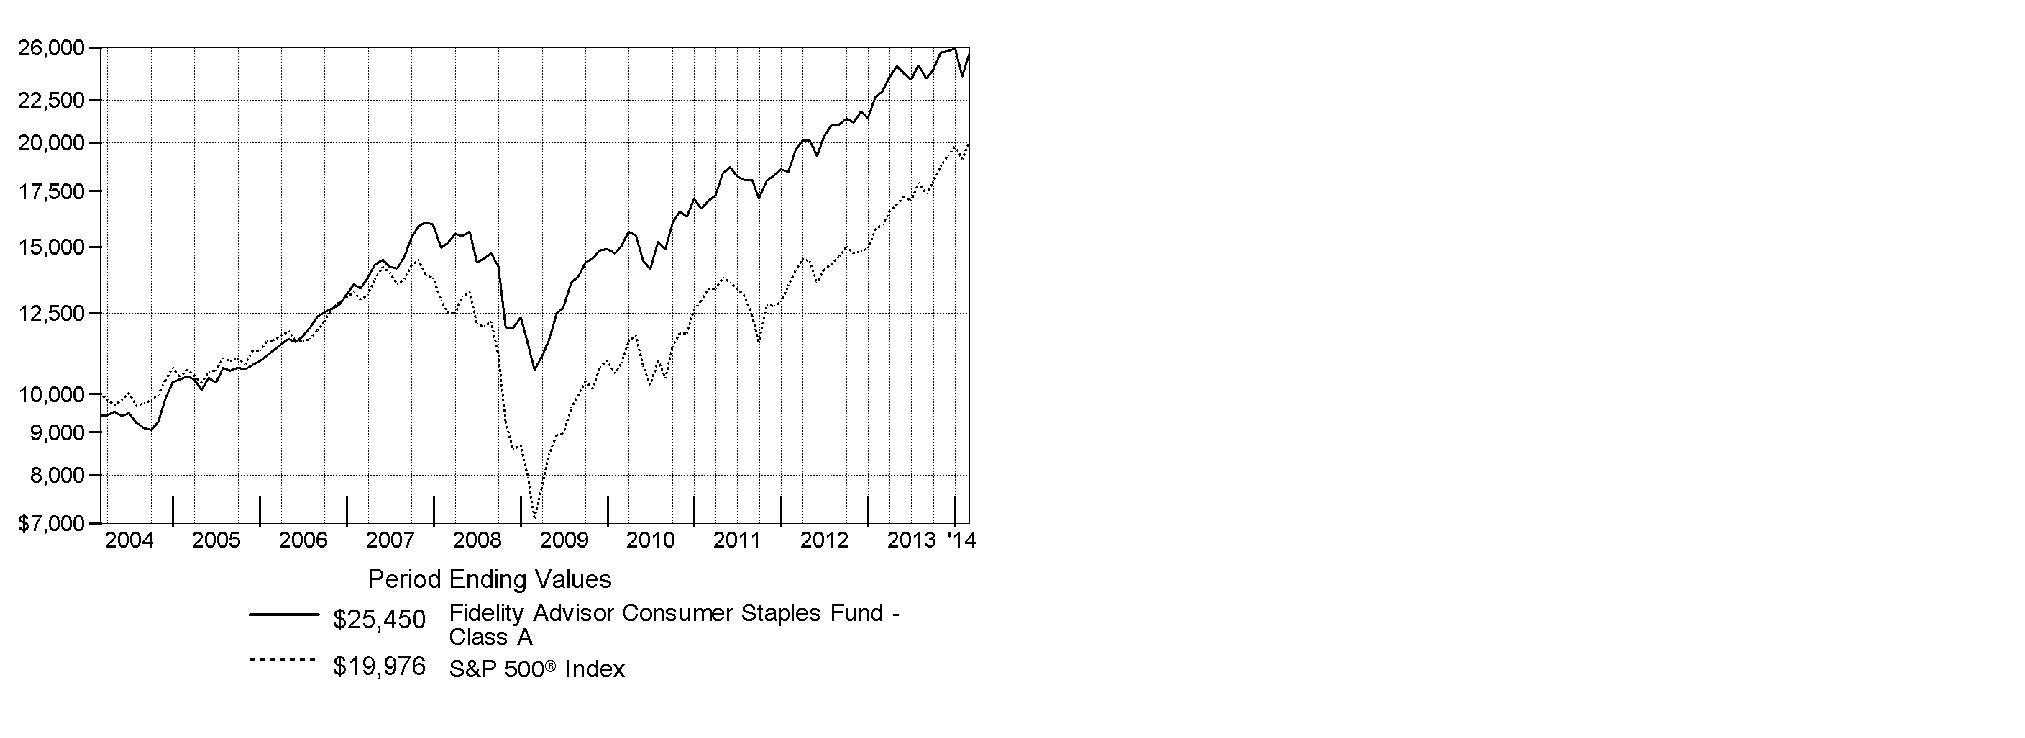
Annual Report
Fidelity Advisor Consumer Staples Fund
Management's Discussion of Fund Performance
Market Recap: Stocks overcame fears of higher interest rates - not to mention their worst January in four years - to finish sharply higher for the 12 months ending February 28, 2014. The broad S&P 500® Index and the blue-chip Dow Jones Industrial AverageSM gained 25.37% and 19.01%, respectively, amid generally favorable earnings reports and accommodative monetary policies worldwide. Performance generally increased along the risk spectrum, with smaller-cap and growth strategies leading the way. An ebullient market helped the growth-oriented Nasdaq Composite Index® to a 38.10% period gain, for example. On the other hand, both cyclical and defensive stocks had representation in the top-performing industry sectors: returns were highest in health care and consumer discretionary; lowest in utilities and telecommunication services. From a macroeconomic perspective, data still points to slow but steady improvement in the U.S., and Europe's recession may well be over. Reports from China have disappointed, but continue to suggest a relatively soft landing there. Mixed signals from the U.S. Federal Reserve as to when it might curtail its stimulative bond buying kept markets in flux during the spring and summer. Stocks regained momentum in October despite a federal budget impasse and brief government shutdown, and lower volatility prevailed through year-end. Shedding new-year concerns about China's economy, an emerging-markets sell-off and confirmation (at last) of Fed tapering - alongside confirmation of a presumably dovish Janet Yellen as new Fed chair - February saw stocks back in record territory, bearing down on the five-year anniversary of the market's bottom.
Comments from Robert Lee, Portfolio Manager of Fidelity Advisor® Consumer Staples Fund: For the year, the fund's Class A, Class T, Class B and Class C shares returned 10.53%, 10.23%, 9.63% and 9.70%, respectively (excluding sales charges), underperforming the 15.64% gain of the sector benchmark, the MSCI® U.S. IMI Consumer Staples 25-50 Index, and the broadly based S&P 500®. Consumer staples stocks delivered a strong absolute return but trailed many other sectors, which is not unusual in a year when the broader market is up as strong as it was. Additionally, investors' preference for U.S.-based companies didn't help staples stocks overall - given their global nature - or the fund since I tend to focus on owning large multinational companies regardless of where they're based. Versus the sector benchmark, French firms Remy Cointreau and Pernod Ricard detracted the most, largely due to a sudden slowdown in their sales in China following new restrictions on gifting high-end spirits to government officials. It also hurt to hold a sizable non-index position in British American Tobacco (BAT), our largest holding. The company continued to put up impressive earnings, despite its shares struggling amid currency headwinds, global regulatory concerns for the tobacco industry and a lot of media attention on the potential long-term competitive impact of electronic cigarettes. But my long-term view of BAT's earnings growth remained unchanged. On the plus side, the fund's underweighting in Philip Morris contributed to relative performance. A big overweighting in retail pharmacy operator CVS Caremark also added nice value. CVS is a great example of a U.S.-based company that I think is poised for long-term growth, especially given its pharmacy benefit management (PBM) division's position to serve an aging U.S. population. Consistent with my process, though, I did modestly trim our stake late in the period as the stock's outperformance caused its valuation to become relatively less attractive.
The views expressed above reflect those of the portfolio manager(s) only through the end of the period as stated on the cover of this report and do not necessarily represent the views of Fidelity or any other person in the Fidelity organization. Any such views are subject to change at any time based upon market or other conditions and Fidelity disclaims any responsibility to update such views. These views may not be relied on as investment advice and, because investment decisions for a Fidelity fund are based on numerous factors, may not be relied on as an indication of trading intent on behalf of any Fidelity fund.
Annual Report
Consumer Staples Portfolio
Shareholder Expense Example
As a shareholder of the Fund, you incur two types of costs: (1) transaction costs including sales charges (loads) on purchase payments or redemption proceeds, redemption fees and (2) ongoing costs, including management fees, distribution and/or service (12b-1) fees and other Fund expenses. This Example is intended to help you understand your ongoing costs (in dollars) of investing in the Fund and to compare these costs with the ongoing costs of investing in other mutual funds.
The Example is based on an investment of $1,000 invested at the beginning of the period and held for the entire period (September 1, 2013 to February 28, 2014).
Actual Expenses
The first line of the accompanying table for each class of the Fund provides information about actual account values and actual expenses. You may use the information in this line, together with the amount you invested, to estimate the expenses that you paid over the period. Simply divide your account value by $1,000.00 (for example, an $8,600 account value divided by $1,000.00 = 8.6), then multiply the result by the number in the first line for a class of the Fund under the heading entitled "Expenses Paid During Period" to estimate the expenses you paid on your account during this period. A small balance maintenance fee of $12.00 that is charged once a year may apply for certain accounts with a value of less than $2,000. This fee is not included in the table below. If it was, the estimate of expenses you paid during the period would be higher, and your ending account value lower, by this amount. In addition, the Fund, as a shareholder in the underlying Fidelity Central Funds, will indirectly bear its pro-rata share of the fees and expenses incurred by the underlying Fidelity Central Funds. These fees and expenses are not included in the Fund's annualized expense ratio used to calculate the expense estimate in the table below.
Hypothetical Example for Comparison Purposes
The second line of the accompanying table for each class of the Fund provides information about hypothetical account values and hypothetical expenses based on a Class' actual expense ratio and an assumed rate of return of 5% per year before expenses, which is not the Class' actual return. The hypothetical account values and expenses may not be used to estimate the actual ending account balance or expenses you paid for the period. You may use this information to compare the ongoing costs of investing in the Fund and other funds. To do so, compare this 5% hypothetical example with the 5% hypothetical examples that appear in the shareholder reports of the other funds. A small balance maintenance fee of $12.00 that is charged once a year may apply for certain accounts with a value of less than $2,000. This fee is not included in the table below. If it was, the estimate of expenses you paid during the period would be higher, and your ending account value lower, by this amount. In addition, the Fund, as a shareholder in the underlying Fidelity Central Funds, will indirectly bear its pro-rata share of the fees and expenses incurred by the underlying Fidelity Central Funds. These fees and expenses are not included in the Fund's annualized expense ratio used to calculate the expense estimate in the table below.
Please note that the expenses shown in the table are meant to highlight your ongoing costs only and do not reflect any transaction costs. Therefore, the second line of the table is useful in comparing ongoing costs only, and will not help you determine the relative total costs of owning different funds. In addition, if these transactional costs were included, your costs would have been higher.
| Annualized | Beginning | Ending | Expenses Paid |
Class A | 1.06% |
|
|
|
Actual |
| $ 1,000.00 | $ 1,067.30 | $ 5.43 |
HypotheticalA |
| $ 1,000.00 | $ 1,019.54 | $ 5.31 |
Class T | 1.33% |
|
|
|
Actual |
| $ 1,000.00 | $ 1,065.80 | $ 6.81 |
HypotheticalA |
| $ 1,000.00 | $ 1,018.20 | $ 6.66 |
Class B | 1.85% |
|
|
|
Actual |
| $ 1,000.00 | $ 1,063.00 | $ 9.46 |
HypotheticalA |
| $ 1,000.00 | $ 1,015.62 | $ 9.25 |
Class C | 1.81% |
|
|
|
Actual |
| $ 1,000.00 | $ 1,063.10 | $ 9.26 |
HypotheticalA |
| $ 1,000.00 | $ 1,015.82 | $ 9.05 |
Consumer Staples | .79% |
|
|
|
Actual |
| $ 1,000.00 | $ 1,068.70 | $ 4.05 |
HypotheticalA |
| $ 1,000.00 | $ 1,020.88 | $ 3.96 |
Institutional Class | .81% |
|
|
|
Actual |
| $ 1,000.00 | $ 1,068.70 | $ 4.15 |
HypotheticalA |
| $ 1,000.00 | $ 1,020.78 | $ 4.06 |
A 5% return per year before expenses
B Annualized expense ratio reflects expenses net of applicable fee waivers.
* Expenses are equal to each Class' annualized expense ratio, multiplied by the average account value over the period, multiplied by 181/365 (to reflect the one-half year period).
Annual Report
Consumer Staples Portfolio
Investment Changes (Unaudited)
Top Ten Stocks as of February 28, 2014 | ||
| % of fund's | % of fund's net assets |
British American Tobacco PLC sponsored ADR | 14.5 | 14.6 |
The Coca-Cola Co. | 11.4 | 12.0 |
Procter & Gamble Co. | 11.2 | 12.3 |
CVS Caremark Corp. | 8.2 | 8.8 |
Kroger Co. | 4.9 | 4.5 |
Altria Group, Inc. | 4.9 | 4.9 |
Wal-Mart Stores, Inc. | 4.9 | 3.3 |
Bunge Ltd. | 2.8 | 2.5 |
Mead Johnson Nutrition Co. | 2.7 | 1.8 |
PepsiCo, Inc. | 2.5 | 1.9 |
| 68.0 | |
Top Industries (% of fund's net assets) | |||
As of February 28, 2014 | |||
 | Beverages | 25.9% |
|
 | Tobacco | 24.3% |
|
 | Food & Staples Retailing | 19.3% |
|
 | Household Products | 13.3% |
|
 | Food Products | 13.1% |
|
 | All Others* | 4.1% |
|

As of August 31, 2013 | |||
| Beverages | 27.1% |
|
| Tobacco | 23.8% |
|
| Food & Staples Retailing | 18.9% |
|
| Household Products | 14.4% |
|
| Food Products | 11.2% |
|
| All Others* | 4.6% |
|

* Includes short-term investments and net other assets (liabilities). |
Annual Report
Consumer Staples Portfolio
Investments February 28, 2014
Showing Percentage of Net Assets
Common Stocks - 97.5% | |||
Shares | Value | ||
BEVERAGES - 25.6% | |||
Brewers - 3.5% | |||
Anadolu Efes Biracilik Ve Malt Sanayii A/S | 264,272 | $ 2,785,901 | |
Anheuser-Busch InBev SA NV | 239,590 | 25,059,691 | |
SABMiller PLC | 889,484 | 43,597,239 | |
| 71,442,831 | ||
Distillers & Vintners - 6.6% | |||
Diageo PLC sponsored ADR (d) | 349,126 | 43,888,629 | |
Pernod Ricard SA | 400,401 | 47,137,523 | |
Remy Cointreau SA (d) | 485,783 | 41,237,365 | |
Treasury Wine Estates Ltd. | 1,318,976 | 4,554,944 | |
| 136,818,461 | ||
Soft Drinks - 15.5% | |||
Coca-Cola Bottling Co. Consolidated | 69,562 | 5,261,670 | |
Coca-Cola Central Japan Co. Ltd. | 54,000 | 1,238,970 | |
Coca-Cola FEMSA S.A.B. de CV sponsored ADR (d) | 47,229 | 4,579,796 | |
Coca-Cola Icecek A/S | 388,162 | 7,498,933 | |
Embotelladora Andina SA: | |||
ADR | 266,112 | 4,859,205 | |
sponsored ADR | 197,000 | 4,540,850 | |
Fomento Economico Mexicano S.A.B. de CV sponsored ADR | 56,787 | 4,862,103 | |
PepsiCo, Inc. | 642,023 | 51,406,782 | |
The Coca-Cola Co. | 6,123,818 | 233,929,848 | |
| 318,178,157 | ||
TOTAL BEVERAGES | 526,439,449 | ||
FOOD & STAPLES RETAILING - 19.3% | |||
Drug Retail - 8.6% | |||
Clicks Group Ltd. | 331,249 | 1,729,419 | |
CVS Caremark Corp. | 2,320,776 | 169,741,557 | |
Drogasil SA | 812,600 | 5,728,661 | |
| 177,199,637 | ||
Food Retail - 5.6% | |||
Fresh Market, Inc. (a) | 186,046 | 6,232,541 | |
Kroger Co. | 2,428,818 | 101,864,627 | |
Whole Foods Market, Inc. | 135,200 | 7,307,560 | |
| 115,404,728 | ||
Hypermarkets & Super Centers - 5.1% | |||
Costco Wholesale Corp. | 32,350 | 3,778,480 | |
Wal-Mart Stores, Inc. | 1,352,356 | 101,020,993 | |
| 104,799,473 | ||
TOTAL FOOD & STAPLES RETAILING | 397,403,838 | ||
| |||
Shares | Value | ||
FOOD PRODUCTS - 13.1% | |||
Agricultural Products - 5.1% | |||
Archer Daniels Midland Co. | 1,076,616 | $ 43,710,610 | |
Bunge Ltd. | 712,413 | 56,715,199 | |
SLC Agricola SA | 658,600 | 5,069,935 | |
| 105,495,744 | ||
Packaged Foods & Meats - 8.0% | |||
Annie's, Inc. (a) | 154,114 | 5,776,193 | |
Danone SA | 76,131 | 5,368,431 | |
Green Mountain Coffee Roasters, Inc. (d) | 283,237 | 31,093,758 | |
Lindt & Spruengli AG | 126 | 7,315,736 | |
Mead Johnson Nutrition Co. Class A | 686,316 | 55,969,070 | |
Nestle SA | 326,295 | 24,650,014 | |
Orion Corp. | 6,025 | 5,045,034 | |
The Hain Celestial Group, Inc. (a) | 64,239 | 5,736,543 | |
Ulker Biskuvi Sanayi A/S | 784,525 | 4,348,120 | |
Unilever NV (NY Reg.) | 392,298 | 15,519,309 | |
Want Want China Holdings Ltd. | 1,511,000 | 2,297,492 | |
| 163,119,700 | ||
TOTAL FOOD PRODUCTS | 268,615,444 | ||
HOTELS, RESTAURANTS & LEISURE - 0.3% | |||
Restaurants - 0.3% | |||
ARAMARK Holdings Corp. | 192,500 | 5,420,800 | |
HOUSEHOLD DURABLES - 0.2% | |||
Housewares & Specialties - 0.2% | |||
Tupperware Brands Corp. | 59,500 | 4,676,700 | |
HOUSEHOLD PRODUCTS - 13.3% | |||
Household Products - 13.3% | |||
Colgate-Palmolive Co. | 599,575 | 37,671,297 | |
Procter & Gamble Co. | 2,918,165 | 229,542,859 | |
Svenska Cellulosa AB (SCA) (B Shares) | 173,300 | 5,262,532 | |
| 272,476,688 | ||
PERSONAL PRODUCTS - 1.2% | |||
Personal Products - 1.2% | |||
Hengan International Group Co. Ltd. | 468,500 | 5,086,125 | |
Herbalife Ltd. | 99,890 | 6,652,674 | |
L'Oreal SA | 32,800 | 5,557,364 | |
Nu Skin Enterprises, Inc. Class A | 99,267 | 8,290,780 | |
| 25,586,943 | ||
PHARMACEUTICALS - 0.2% | |||
Pharmaceuticals - 0.2% | |||
Perrigo Co. PLC | 31,306 | 5,147,959 | |
TOBACCO - 24.3% | |||
Tobacco - 24.3% | |||
Altria Group, Inc. | 2,793,645 | 101,297,568 | |
British American Tobacco PLC sponsored ADR | 2,740,345 | 298,122,129 | |
Imperial Tobacco Group PLC | 265,697 | 10,842,771 | |
Common Stocks - continued | |||
Shares | Value | ||
TOBACCO - CONTINUED | |||
Tobacco - continued | |||
ITC Ltd. | 1,620,070 | $ 8,595,514 | |
Japan Tobacco, Inc. | 209,400 | 6,669,335 | |
Lorillard, Inc. | 472,461 | 23,178,937 | |
Philip Morris International, Inc. | 493,292 | 39,912,256 | |
Souza Cruz SA | 1,145,800 | 9,939,470 | |
| 498,557,980 | ||
TOTAL COMMON STOCKS (Cost $1,428,851,891) |
| ||
Nonconvertible Preferred Stocks - 0.3% | |||
|
|
|
|
BEVERAGES - 0.3% | |||
Brewers - 0.3% | |||
Ambev SA sponsored ADR | 1,049,610 |
| |
Money Market Funds - 3.2% | |||
Shares | Value | ||
Fidelity Cash Central Fund, 0.10% (b) | 31,266,635 | $ 31,266,635 | |
Fidelity Securities Lending Cash Central Fund, 0.09% (b)(c) | 33,900,423 | 33,900,423 | |
TOTAL MONEY MARKET FUNDS (Cost $65,167,058) |
| ||
TOTAL INVESTMENT PORTFOLIO - 101.0% (Cost $1,496,678,335) | 2,077,050,051 | ||
NET OTHER ASSETS (LIABILITIES) - (1.0)% | (21,247,648) | ||
NET ASSETS - 100% | $ 2,055,802,403 | ||
Legend |
(a) Non-income producing |
(b) Affiliated fund that is generally available only to investment companies and other accounts managed by Fidelity Investments. The rate quoted is the annualized seven-day yield of the fund at period end. A complete unaudited listing of the fund's holdings as of its most recent quarter end is available upon request. In addition, each Fidelity Central Fund's financial statements, which are not covered by the Fund's Report of Independent Registered Public Accounting Firm, are available on the SEC's website or upon request. |
(c) Investment made with cash collateral received from securities on loan. |
(d) Security or a portion of the security is on loan at period end. |
Affiliated Central Funds |
Information regarding fiscal year to date income earned by the Fund from investments in Fidelity Central Funds is as follows: |
Fund | Income earned |
Fidelity Cash Central Fund | $ 64,577 |
Fidelity Securities Lending Cash Central Fund | 320,864 |
Total | $ 385,441 |
Other Information |
The following is a summary of the inputs used, as of February 28, 2014, involving the Fund's assets and liabilities carried at fair value. The inputs or methodology used for valuing securities may not be an indication of the risk associated with investing in those securities. For more information on valuation inputs, and their aggregation into the levels used in the table below, please refer to the Investment Valuation section in the accompanying Notes to Financial Statements. |
Valuation Inputs at Reporting Date: | ||||
Description | Total | Level 1 | Level 2 | Level 3 |
Investments in Securities: | ||||
Common Stocks | $ 2,004,325,801 | $ 1,942,578,330 | $ 61,747,471 | $ - |
Nonconvertible Preferred Stocks | 7,557,192 | 7,557,192 | - | - |
Money Market Funds | 65,167,058 | 65,167,058 | - | - |
Total Investments in Securities: | $ 2,077,050,051 | $ 2,015,302,580 | $ 61,747,471 | $ - |
Distribution of investments by country or territory of incorporation, as a percentage of total net assets, is as follows (Unaudited): |
United States of America | 64.2% |
United Kingdom | 19.2% |
France | 4.9% |
Bermuda | 2.8% |
Switzerland | 1.6% |
Brazil | 1.3% |
Belgium | 1.2% |
Others (Individually Less Than 1%) | 4.8% |
| 100.0% |
See accompanying notes which are an integral part of the financial statements.
Annual Report
Consumer Staples Portfolio
Financial Statements
Statement of Assets and Liabilities
| February 28, 2014 | |
|
|
|
Assets | ||
Investment in securities, at value (including securities loaned of $32,976,456) - See accompanying schedule: Unaffiliated issuers (cost $1,431,511,277) | $ 2,011,882,993 |
|
Fidelity Central Funds (cost $65,167,058) | 65,167,058 |
|
Total Investments (cost $1,496,678,335) |
| $ 2,077,050,051 |
Receivable for investments sold | 15,188,121 | |
Receivable for fund shares sold | 2,001,501 | |
Dividends receivable | 2,179,086 | |
Distributions receivable from Fidelity Central Funds | 7,995 | |
Prepaid expenses | 13,509 | |
Other receivables | 33,397 | |
Total assets | 2,096,473,660 | |
|
|
|
Liabilities | ||
Payable for investments purchased | $ 508,506 | |
Payable for fund shares redeemed | 4,578,554 | |
Accrued management fee | 921,833 | |
Distribution and service plan fees payable | 239,461 | |
Other affiliated payables | 389,292 | |
Other payables and accrued expenses | 133,188 | |
Collateral on securities loaned, at value | 33,900,423 | |
Total liabilities | 40,671,257 | |
|
|
|
Net Assets | $ 2,055,802,403 | |
Net Assets consist of: |
| |
Paid in capital | $ 1,406,494,316 | |
Undistributed net investment income | 5,732,152 | |
Accumulated undistributed net realized gain (loss) on investments and foreign currency transactions | 63,224,348 | |
Net unrealized appreciation (depreciation) on investments and assets and liabilities in foreign currencies | 580,351,587 | |
Net Assets | $ 2,055,802,403 | |
Statement of Assets and Liabilities - continued
| February 28, 2014 | |
|
|
|
Calculation of Maximum Offering Price Class A: | $ 87.93 | |
|
|
|
Maximum offering price per share (100/94.25 of $87.93) | $ 93.29 | |
Class T: | $ 87.37 | |
|
|
|
Maximum offering price per share (100/96.50 of $87.37) | $ 90.54 | |
Class B: | $ 86.90 | |
|
|
|
Class C: | $ 86.32 | |
|
|
|
Consumer Staples: | $ 88.51 | |
|
|
|
Institutional Class: | $ 88.33 | |
A Redemption price per share is equal to net asset value less any applicable contingent deferred sales charge.
See accompanying notes which are an integral part of the financial statements.
Annual Report
Statement of Operations
| Year ended February 28, 2014 | |
|
|
|
Investment Income |
|
|
Dividends |
| $ 63,498,283 |
Interest |
| 16 |
Income from Fidelity Central Funds |
| 385,441 |
Total income |
| 63,883,740 |
|
|
|
Expenses | ||
Management fee | $ 13,210,712 | |
Transfer agent fees | 4,800,332 | |
Distribution and service plan fees | 2,848,704 | |
Accounting and security lending fees | 719,655 | |
Custodian fees and expenses | 107,674 | |
Independent trustees' compensation | 45,426 | |
Registration fees | 193,601 | |
Audit | 66,278 | |
Legal | 40,201 | |
Interest | 4,952 | |
Miscellaneous | 28,736 | |
Total expenses before reductions | 22,066,271 | |
Expense reductions | (77,312) | 21,988,959 |
Net investment income (loss) | 41,894,781 | |
Realized and Unrealized Gain (Loss) Net realized gain (loss) on: | ||
Investment securities: |
|
|
Unaffiliated issuers (net of foreign taxes of $10,350) | 171,717,048 | |
Foreign currency transactions | (76,530) | |
Total net realized gain (loss) |
| 171,640,518 |
Change in net unrealized appreciation (depreciation) on: Investment securities (net of increase in deferred foreign taxes of $26,244) | 26,576,541 | |
Assets and liabilities in foreign currencies | 12,410 | |
Total change in net unrealized appreciation (depreciation) |
| 26,588,951 |
Net gain (loss) | 198,229,469 | |
Net increase (decrease) in net assets resulting from operations | $ 240,124,250 | |
Statement of Changes in Net Assets
| Year ended | Year ended |
Increase (Decrease) in Net Assets |
|
|
Operations |
|
|
Net investment income (loss) | $ 41,894,781 | $ 34,326,160 |
Net realized gain (loss) | 171,640,518 | 94,809,727 |
Change in net unrealized appreciation (depreciation) | 26,588,951 | 198,071,394 |
Net increase (decrease) in net assets resulting from operations | 240,124,250 | 327,207,281 |
Distributions to shareholders from net investment income | (38,989,125) | (31,344,671) |
Distributions to shareholders from net realized gain | (137,187,027) | (29,546,659) |
Total distributions | (176,176,152) | (60,891,330) |
Share transactions - net increase (decrease) | (294,831,730) | 287,768,850 |
Redemption fees | 32,907 | 35,035 |
Total increase (decrease) in net assets | (230,850,725) | 554,119,836 |
|
|
|
Net Assets | ||
Beginning of period | 2,286,653,128 | 1,732,533,292 |
End of period (including undistributed net investment income of $5,732,152 and undistributed net investment income of $5,461,626, respectively) | $ 2,055,802,403 | $ 2,286,653,128 |
See accompanying notes which are an integral part of the financial statements.
Annual Report
Financial Highlights - Class A
Years ended February 28, | 2014 | 2013 | 2012 G | 2011 | 2010 |
Selected Per-Share Data |
|
|
|
|
|
Net asset value, beginning of period | $ 85.67 | $ 74.90 | $ 67.65 | $ 61.06 | $ 43.94 |
Income from Investment Operations |
|
|
|
|
|
Net investment income (loss) C | 1.43 | 1.26 | 1.22 | .98 | .84 |
Net realized and unrealized gain (loss) | 7.51 | 11.73 | 8.73 | 7.10 | 17.02 |
Total from investment operations | 8.94 | 12.99 | 9.95 | 8.08 | 17.86 |
Distributions from net investment income | (1.44) | (1.08) | (1.06) | (.83) | (.74) |
Distributions from net realized gain | (5.24) | (1.14) | (1.64) | (.66) | - |
Total distributions | (6.68) | (2.22) | (2.70) | (1.49) | (.74) |
Redemption fees added to paid in capital C,H | - | - | - | - | - |
Net asset value, end of period | $ 87.93 | $ 85.67 | $ 74.90 | $ 67.65 | $ 61.06 |
Total Return A,B | 10.53% | 17.60% | 15.00% | 13.27% | 40.66% |
Ratios to Average Net Assets D,F |
|
|
|
|
|
Expenses before reductions | 1.06% | 1.08% | 1.10% | 1.11% | 1.13% |
Expenses net of fee waivers, if any | 1.06% | 1.08% | 1.10% | 1.11% | 1.13% |
Expenses net of all reductions | 1.06% | 1.08% | 1.09% | 1.11% | 1.13% |
Net investment income (loss) | 1.61% | 1.58% | 1.74% | 1.53% | 1.51% |
Supplemental Data |
|
|
|
|
|
Net assets, end of period (000 omitted) | $ 329,459 | $ 277,329 | $ 205,851 | $ 160,526 | $ 162,370 |
Portfolio turnover rate E | 31% | 28% | 35% | 57% | 69% |
A Total returns would have been lower if certain expenses had not been reduced during the applicable periods shown.
B Total returns do not include the effect of the sales charges.
C Calculated based on average shares outstanding during the period.
D Fees and expenses of any underlying Fidelity Central Funds are not included in the Fund's expense ratio. The Fund indirectly bears its proportionate share of the expenses of any underlying Fidelity Central Funds.
E Amount does not include the portfolio activity of any underlying Fidelity Central Funds.
F Expense ratios reflect operating expenses of the class. Expenses before reductions do not reflect amounts reimbursed by the investment adviser or reductions from brokerage service arrangements or reductions from other expense offset arrangements and do not represent the amount paid by the class during periods when reimbursements or reductions occur. Expenses net of fee waivers reflect expenses after reimbursement by the investment adviser but prior to reductions from brokerage service arrangements or other expense offset arrangements. Expenses net of all reductions represent the net expenses paid by the class.
G For the year ended February 29.
H Amount represents less than $.01 per share.
Financial Highlights - Class T
Years ended February 28, | 2014 | 2013 | 2012 G | 2011 | 2010 |
Selected Per-Share Data |
|
|
|
|
|
Net asset value, beginning of period | $ 85.18 | $ 74.49 | $ 67.30 | $ 60.77 | $ 43.75 |
Income from Investment Operations |
|
|
|
|
|
Net investment income (loss) C | 1.18 | 1.03 | 1.01 | .79 | .66 |
Net realized and unrealized gain (loss) | 7.46 | 11.68 | 8.68 | 7.05 | 16.95 |
Total from investment operations | 8.64 | 12.71 | 9.69 | 7.84 | 17.61 |
Distributions from net investment income | (1.21) | (.88) | (.86) | (.65) | (.59) |
Distributions from net realized gain | (5.24) | (1.14) | (1.64) | (.66) | - |
Total distributions | (6.45) | (2.02) | (2.50) | (1.31) | (.59) |
Redemption fees added to paid in capital C,H | - | - | - | - | - |
Net asset value, end of period | $ 87.37 | $ 85.18 | $ 74.49 | $ 67.30 | $ 60.77 |
Total Return A,B | 10.23% | 17.29% | 14.67% | 12.93% | 40.24% |
Ratios to Average Net Assets D,F |
|
|
|
|
|
Expenses before reductions | 1.33% | 1.36% | 1.38% | 1.40% | 1.44% |
Expenses net of fee waivers, if any | 1.33% | 1.36% | 1.38% | 1.40% | 1.44% |
Expenses net of all reductions | 1.33% | 1.35% | 1.38% | 1.40% | 1.44% |
Net investment income (loss) | 1.34% | 1.30% | 1.45% | 1.24% | 1.21% |
Supplemental Data |
|
|
|
|
|
Net assets, end of period (000 omitted) | $ 61,421 | $ 52,024 | $ 39,047 | $ 31,496 | $ 29,662 |
Portfolio turnover rate E | 31% | 28% | 35% | 57% | 69% |
A Total returns would have been lower if certain expenses had not been reduced during the applicable periods shown.
B Total returns do not include the effect of the sales charges.
C Calculated based on average shares outstanding during the period.
D Fees and expenses of any underlying Fidelity Central Funds are not included in the Fund's expense ratio. The Fund indirectly bears its proportionate share of the expenses of any underlying Fidelity Central Funds.
E Amount does not include the portfolio activity of any underlying Fidelity Central Funds.
F Expense ratios reflect operating expenses of the class. Expenses before reductions do not reflect amounts reimbursed by the investment adviser or reductions from brokerage service arrangements or reductions from other expense offset arrangements and do not represent the amount paid by the class during periods when reimbursements or reductions occur. Expenses net of fee waivers reflect expenses after reimbursement by the investment adviser but prior to reductions from brokerage service arrangements or other expense offset arrangements. Expenses net of all reductions represent the net expenses paid by the class.
G For the year ended February 29.
H Amount represents less than $.01 per share.
See accompanying notes which are an integral part of the financial statements.
Annual Report
Financial Highlights - Class B
Years ended February 28, | 2014 | 2013 | 2012 G | 2011 | 2010 |
Selected Per-Share Data |
|
|
|
|
|
Net asset value, beginning of period | $ 84.72 | $ 74.01 | $ 66.83 | $ 60.37 | $ 43.53 |
Income from Investment Operations |
|
|
|
|
|
Net investment income (loss) C | .71 | .61 | .64 | .46 | .37 |
Net realized and unrealized gain (loss) | 7.40 | 11.61 | 8.61 | 6.98 | 16.82 |
Total from investment operations | 8.11 | 12.22 | 9.25 | 7.44 | 17.19 |
Distributions from net investment income | (.69) | (.37) | (.43) | (.32) | (.35) |
Distributions from net realized gain | (5.24) | (1.14) | (1.64) | (.66) | - |
Total distributions | (5.93) | (1.51) | (2.07) | (.98) | (.35) |
Redemption fees added to paid in capital C,H | - | - | - | - | - |
Net asset value, end of period | $ 86.90 | $ 84.72 | $ 74.01 | $ 66.83 | $ 60.37 |
Total Return A,B | 9.63% | 16.68% | 14.06% | 12.35% | 39.48% |
Ratios to Average Net Assets D,F |
|
|
|
|
|
Expenses before reductions | 1.86% | 1.89% | 1.91% | 1.91% | 1.97% |
Expenses net of fee waivers, if any | 1.86% | 1.89% | 1.91% | 1.91% | 1.97% |
Expenses net of all reductions | 1.86% | 1.88% | 1.90% | 1.91% | 1.97% |
Net investment income (loss) | .81% | .78% | .93% | .73% | .68% |
Supplemental Data |
|
|
|
|
|
Net assets, end of period (000 omitted) | $ 17,388 | $ 18,548 | $ 19,330 | $ 20,033 | $ 21,099 |
Portfolio turnover rate E | 31% | 28% | 35% | 57% | 69% |
A Total returns would have been lower if certain expenses had not been reduced during the applicable periods shown.
B Total returns do not include the effect of the contingent deferred sales charge.
C Calculated based on average shares outstanding during the period.
D Fees and expenses of any underlying Fidelity Central Funds are not included in the Fund's expense ratio. The Fund indirectly bears its proportionate share of the expenses of any underlying Fidelity Central Funds.
E Amount does not include the portfolio activity of any underlying Fidelity Central Funds.
F Expense ratios reflect operating expenses of the class. Expenses before reductions do not reflect amounts reimbursed by the investment adviser or reductions from brokerage service arrangements or reductions from other expense offset arrangements and do not represent the amount paid by the class during periods when reimbursements or reductions occur. Expenses net of fee waivers reflect expenses after reimbursement by the investment adviser but prior to reductions from brokerage service arrangements or other expense offset arrangements. Expenses net of all reductions represent the net expenses paid by the class.
G For the year ended February 29.
H Amount represents less than $.01 per share.
Financial Highlights - Class C
Years ended February 28, | 2014 | 2013 | 2012 G | 2011 | 2010 |
Selected Per-Share Data |
|
|
|
|
|
Net asset value, beginning of period | $ 84.28 | $ 73.75 | $ 66.71 | $ 60.29 | $ 43.46 |
Income from Investment Operations |
|
|
|
|
|
Net investment income (loss) C | .75 | .65 | .68 | .49 | .41 |
Net realized and unrealized gain (loss) | 7.36 | 11.55 | 8.59 | 7.00 | 16.80 |
Total from investment operations | 8.11 | 12.20 | 9.27 | 7.49 | 17.21 |
Distributions from net investment income | (.84) | (.53) | (.59) | (.41) | (.38) |
Distributions from net realized gain | (5.24) | (1.14) | (1.64) | (.66) | - |
Total distributions | (6.07) I | (1.67) | (2.23) | (1.07) | (.38) |
Redemption fees added to paid in capital C,H | - | - | - | - | - |
Net asset value, end of period | $ 86.32 | $ 84.28 | $ 73.75 | $ 66.71 | $ 60.29 |
Total Return A,B | 9.70% | 16.73% | 14.14% | 12.44% | 39.59% |
Ratios to Average Net Assets D,F |
|
|
|
|
|
Expenses before reductions | 1.82% | 1.83% | 1.85% | 1.86% | 1.90% |
Expenses net of fee waivers, if any | 1.82% | 1.83% | 1.85% | 1.86% | 1.90% |
Expenses net of all reductions | 1.81% | 1.82% | 1.84% | 1.85% | 1.89% |
Net investment income (loss) | .85% | .83% | .99% | .79% | .75% |
Supplemental Data |
|
|
|
|
|
Net assets, end of period (000 omitted) | $ 164,669 | $ 134,966 | $ 102,321 | $ 81,239 | $ 73,829 |
Portfolio turnover rate E | 31% | 28% | 35% | 57% | 69% |
A Total returns would have been lower if certain expenses had not been reduced during the applicable periods shown.
B Total returns do not include the effect of the contingent deferred sales charge.
C Calculated based on average shares outstanding during the period.
D Fees and expenses of any underlying Fidelity Central Funds are not included in the Fund's expense ratio. The Fund indirectly bears its proportionate share of the expenses of any underlying Fidelity Central Funds.
E Amount does not include the portfolio activity of any underlying Fidelity Central Funds.
F Expense ratios reflect operating expenses of the class. Expenses before reductions do not reflect amounts reimbursed by the investment adviser or reductions from brokerage service arrangements or reductions from other expense offset arrangements and do not represent the amount paid by the class during periods when reimbursements or reductions occur. Expenses net of fee waivers reflect expenses after reimbursement by the investment adviser but prior to reductions from brokerage service arrangements or other expense offset arrangements. Expenses net of all reductions represent the net expenses paid by the class.
G For the year ended February 29.
H Amount represents less than $.01 per share.
I Total distributions of $6.07 per share is comprised of distributions from net investment income of $.837 and distributions from net realized gain of $5.237 per share.
See accompanying notes which are an integral part of the financial statements.
Annual Report
Financial Highlights - Consumer Staples
Years ended February 28, | 2014 | 2013 | 2012 F | 2011 | 2010 |
Selected Per-Share Data |
|
|
|
|
|
Net asset value, beginning of period | $ 86.17 | $ 75.29 | $ 67.98 | $ 61.34 | $ 44.14 |
Income from Investment Operations |
|
|
|
|
|
Net investment income (loss) B | 1.69 | 1.48 | 1.42 | 1.14 | .96 |
Net realized and unrealized gain (loss) | 7.55 | 11.82 | 8.76 | 7.14 | 17.11 |
Total from investment operations | 9.24 | 13.30 | 10.18 | 8.28 | 18.07 |
Distributions from net investment income | (1.66) | (1.28) | (1.24) | (.98) | (.87) |
Distributions from net realized gain | (5.24) | (1.14) | (1.64) | (.66) | - |
Total distributions | (6.90) | (2.42) | (2.87) H | (1.64) | (.87) |
Redemption fees added to paid in capital B,G | - | - | - | - | - |
Net asset value, end of period | $ 88.51 | $ 86.17 | $ 75.29 | $ 67.98 | $ 61.34 |
Total Return A | 10.82% | 17.94% | 15.30% | 13.55% | 40.96% |
Ratios to Average Net Assets C,E |
|
|
|
|
|
Expenses before reductions | .79% | .81% | .83% | .86% | .92% |
Expenses net of fee waivers, if any | .79% | .81% | .83% | .86% | .92% |
Expenses net of all reductions | .79% | .80% | .82% | .86% | .91% |
Net investment income (loss) | 1.88% | 1.85% | 2.01% | 1.78% | 1.73% |
Supplemental Data |
|
|
|
|
|
Net assets, end of period (000 omitted) | $ 1,328,594 | $ 1,425,055 | $ 1,202,440 | $ 877,548 | $ 946,455 |
Portfolio turnover rate D | 31% | 28% | 35% | 57% | 69% |
A Total returns would have been lower if certain expenses had not been reduced during the applicable periods shown.
B Calculated based on average shares outstanding during the period.
C Fees and expenses of any underlying Fidelity Central Funds are not included in the Fund's expense ratio. The Fund indirectly bears its proportionate share of the expenses of any underlying Fidelity Central Funds.
D Amount does not include the portfolio activity of any underlying Fidelity Central Funds.
E Expense ratios reflect operating expenses of the class. Expenses before reductions do not reflect amounts reimbursed by the investment adviser or reductions from brokerage service arrangements or reductions from other expense offset arrangements and do not represent the amount paid by the class during periods when reimbursements or reductions occur. Expenses net of fee waivers reflect expenses after reimbursement by the investment adviser but prior to reductions from brokerage service arrangements or other expense offset arrangements. Expenses net of all reductions represent the net expenses paid by the class.
F For the year ended February 29.
G Amount represents less than $.01 per share.
H Total distributions of $2.87 per share is comprised of distributions from net investment income of $1.236 and distributions from net realized gain of $1.637 per share.
Financial Highlights - Institutional Class
Years ended February 28, | 2014 | 2013 | 2012 F | 2011 | 2010 |
Selected Per-Share Data |
|
|
|
|
|
Net asset value, beginning of period | $ 85.92 | $ 75.14 | $ 67.84 | $ 61.26 | $ 44.07 |
Income from Investment Operations |
|
|
|
|
|
Net investment income (loss) B | 1.66 | 1.45 | 1.39 | 1.15 | .98 |
Net realized and unrealized gain (loss) | 7.53 | 11.79 | 8.73 | 7.13 | 17.09 |
Total from investment operations | 9.19 | 13.24 | 10.12 | 8.28 | 18.07 |
Distributions from net investment income | (1.54) | (1.32) | (1.19) | (1.04) | (.88) |
Distributions from net realized gain | (5.24) | (1.14) | (1.64) | (.66) | - |
Total distributions | (6.78) | (2.46) | (2.82) H | (1.70) | (.88) |
Redemption fees added to paid in capital B,G | - | - | - | - | - |
Net asset value, end of period | $ 88.33 | $ 85.92 | $ 75.14 | $ 67.84 | $ 61.26 |
Total Return A | 10.80% | 17.90% | 15.24% | 13.57% | 41.03% |
Ratios to Average Net Assets C,E |
|
|
|
|
|
Expenses before reductions | .82% | .85% | .87% | .87% | .86% |
Expenses net of fee waivers, if any | .82% | .85% | .87% | .87% | .86% |
Expenses net of all reductions | .82% | .84% | .87% | .87% | .86% |
Net investment income (loss) | 1.85% | 1.81% | 1.96% | 1.77% | 1.78% |
Supplemental Data |
|
|
|
|
|
Net assets, end of period (000 omitted) | $ 154,271 | $ 378,731 | $ 163,544 | $ 237,883 | $ 36,152 |
Portfolio turnover rate D | 31% | 28% | 35% | 57% | 69% |
A Total returns would have been lower if certain expenses had not been reduced during the applicable periods shown.
B Calculated based on average shares outstanding during the period.
C Fees and expenses of any underlying Fidelity Central Funds are not included in the Fund's expense ratio. The Fund indirectly bears its proportionate share of the expenses of any underlying Fidelity Central Funds.
D Amount does not include the portfolio activity of any underlying Fidelity Central Funds.
E Expense ratios reflect operating expenses of the class. Expenses before reductions do not reflect amounts reimbursed by the investment adviser or reductions from brokerage service arrangements or reductions from other expense offset arrangements and do not represent the amount paid by the class during periods when reimbursements or reductions occur. Expenses net of fee waivers reflect expenses after reimbursement by the investment adviser but prior to reductions from brokerage service arrangements or other expense offset arrangements. Expenses net of all reductions represent the net expenses paid by the class.
F For the year ended February 29.
G Amount represents less than $.01 per share.
H Total distributions of $2.82 per share is comprised of distributions from net investment income of $1.186 and distributions from net realized gain of $1.637 per share.
See accompanying notes which are an integral part of the financial statements.
Annual Report
Notes to Financial Statements
For the period ended February 28, 2014
1. Organization.
Consumer Staples Portfolio (the Fund) is a non-diversified fund of Fidelity Select Portfolios (the Trust) and is authorized to issue an unlimited number of shares. The Trust is registered under the Investment Company Act of 1940, as amended (the 1940 Act), as an open-end management investment company organized as a Massachusetts business trust. The Fund invests primarily in securities of companies whose principal business activities fall within specific industries. The Fund offers Class A, Class T, Class C, Consumer Staples and Institutional Class shares, each of which, along with Class B shares, has equal rights as to assets and voting privileges. Class B shares are closed to new accounts and additional purchases, except for exchanges and reinvestments. Each class has exclusive voting rights with respect to matters that affect that class. Class B shares will automatically convert to Class A shares after a holding period of seven years from the initial date of purchase.
2. Investments in Fidelity Central Funds.
The Fund invests in Fidelity Central Funds, which are open-end investment companies generally available only to other investment companies and accounts managed by the investment adviser and its affiliates. The Fund's Schedule of Investments lists each of the Fidelity Central Funds held as of period end, if any, as an investment of the Fund, but does not include the underlying holdings of each Fidelity Central Fund. As an Investing Fund, the Fund indirectly bears its proportionate share of the expenses of the underlying Fidelity Central Funds.
The Money Market Central Funds seek preservation of capital and current income and are managed by Fidelity Investments Money Management, Inc. (FIMM), an affiliate of the investment adviser. Annualized expenses of the Money Market Central Funds as of their most recent shareholder report date are less than .01%.
A complete unaudited list of holdings for each Fidelity Central Fund is available upon request or at the Securities and Exchange Commission (the SEC) website at www.sec.gov. In addition, the financial statements of the Fidelity Central Funds, which are not covered by the Fund's Report of Independent Registered Public Accounting Firm, are available on the SEC website or upon request.
3. Significant Accounting Policies.
The financial statements have been prepared in conformity with accounting principles generally accepted in the United States of America (GAAP), which require management to make certain estimates and assumptions at the date of the financial statements. Actual results could differ from those estimates. Subsequent events, if any, through the date that the financial statements were issued have been evaluated in the preparation of the financial statements. The following summarizes the significant accounting policies of the Fund:
Investment Valuation. Investments are valued as of 4:00 p.m. Eastern time on the last calendar day of the period. In accordance with valuation policies and procedures approved by the Board of Trustees (the Board), the Fund attempts to obtain prices from one or more third party pricing vendors or brokers to value its investments. When current market prices, quotations or currency exchange rates are not readily available or reliable, investments will be fair valued in good faith by the Fidelity SelectCo, LLC (SelectCo) Fair Value Committee (the Committee), in accordance with procedures adopted by the Board. Factors used in determining fair value vary by investment type and may include market or investment specific events. The frequency with which these procedures are used cannot be predicted and they may be utilized to a significant extent. The Committee oversees the Fund's valuation policies and procedures and is responsible for approving and reporting to the Board all fair value determinations.
The Fund categorizes the inputs to valuation techniques used to value its investments into a disclosure hierarchy consisting of three levels as shown below:
Level 1 - quoted prices in active markets for identical investments
Level 2 - other significant observable inputs (including quoted prices for similar investments, interest rates, prepayment speeds, etc.)
Level 3 - unobservable inputs (including the Fund's own assumptions based on the best information available)
Valuation techniques used to value the Fund's investments by major category are as follows:
Equity securities, including restricted securities, for which market quotations are readily available, are valued at the last reported sale price or official closing price as reported by a third party pricing vendor on the primary market or exchange on which they are traded and are categorized as Level 1 in the hierarchy. In the event there were no sales during the day or closing prices are not available, securities are valued at the last quoted bid price or may be valued using the last available price and are generally categorized as Level 2 in the hierarchy. For foreign equity securities, when market or security specific events arise, comparisons to the valuation of American Depositary Receipts (ADRs), futures contracts, Exchange-Traded Funds (ETFs) and certain indexes as well as quoted prices for similar securities may be used and would be categorized as Level 2 in the hierarchy. Utilizing these techniques may result in transfers between Level 1 and Level 2. For equity securities, including restricted securities, where observable inputs are limited, assumptions about market activity and risk are used and these securities may be categorized as Level 3 in the hierarchy.
Annual Report
3. Significant Accounting Policies - continued
Investment Valuation - continued
Investments in open-end mutual funds, including the Fidelity Central Funds, are valued at their closing net asset value (NAV) each business day and are categorized as Level 1 in the hierarchy.
Changes in valuation techniques may result in transfers in or out of an assigned level within the disclosure hierarchy. The aggregate value of investments by input level, as of February 28, 2014, is included at the end of the Fund's Schedule of Investments.
Foreign Currency. The Fund may use foreign currency contracts to facilitate transactions in foreign-denominated securities. Gains and losses from these transactions may arise from changes in the value of the foreign currency or if the counterparties do not perform under the contracts' terms.
Foreign-denominated assets, including investment securities, and liabilities are translated into U.S. dollars at the exchange rates at period end. Purchases and sales of investment securities, income and dividends received and expenses denominated in foreign currencies are translated into U.S. dollars at the exchange rate in effect on the transaction date.
The effects of exchange rate fluctuations on investments are included with the net realized and unrealized gain (loss) on investment securities. Other foreign currency transactions resulting in realized and unrealized gain (loss) are disclosed separately.
Investment Transactions and Income. For financial reporting purposes, the Fund's investment holdings and NAV include trades executed through the end of the last business day of the period. The NAV per share for processing shareholder transactions is calculated as of the close of business of the New York Stock Exchange (NYSE), normally 4:00 p.m. Eastern time and includes trades executed through the end of the prior business day. Gains and losses on securities sold are determined on the basis of identified cost and may include proceeds received from litigation. Dividend income is recorded on the ex-dividend date, except for certain dividends from foreign securities where the ex-dividend date may have passed, which are recorded as soon as the Fund is informed of the ex-dividend date. Non-cash dividends included in dividend income, if any, are recorded at the fair market value of the securities received. Interest income and distributions from the Fidelity Central Funds are accrued as earned. Interest income includes coupon interest and amortization of premium and accretion of discount on debt securities. Investment income is recorded net of foreign taxes withheld where recovery of such taxes is uncertain.
Class Allocations and Expenses. Investment income, realized and unrealized capital gains and losses, common expenses of the Fund, and certain fund-level expense reductions, if any, are allocated daily on a pro-rata basis to each class based on the relative net assets of each class to the total net assets of the Fund. Each class differs with respect to transfer agent and distribution and service plan fees incurred. Certain expense reductions may also differ by class. For the reporting period, the allocated portion of income and expenses to each class as a percent of its average net assets may vary due to the timing of recording these transactions in relation to fluctuating net assets of the classes. Expenses directly attributable to a fund are charged to that fund. Expenses attributable to more than one fund are allocated among the respective funds on the basis of relative net assets or other appropriate methods. Expense estimates are accrued in the period to which they relate and adjustments are made when actual amounts are known.
Deferred Trustee Compensation. Under a Deferred Compensation Plan (the Plan), independent Trustees may elect to defer receipt of a portion of their annual compensation. Deferred amounts are invested in a cross-section of Fidelity funds, are marked-to-market and remain in the Fund until distributed in accordance with the Plan. The investment of deferred amounts and the offsetting payable to the Trustees are included in the accompanying Statement of Assets and Liabilities.
Income Tax Information and Distributions to Shareholders. Each year, the Fund intends to qualify as a regulated investment company under Subchapter M of the Internal Revenue Code, including distributing substantially all of its taxable income and realized gains. As a result, no provision for U.S. Federal income taxes is required. As of February 28, 2014, the Fund did not have any unrecognized tax benefits in the financial statements; nor is the Fund aware of any tax positions for which it is reasonably possible that the total amounts of unrecognized tax benefits will significantly change in the next twelve months. The Fund files a U.S. federal tax return, in addition to state and local tax returns as required. The Fund's federal income tax returns are subject to examination by the Internal Revenue Service (IRS) for a period of three fiscal years after they are filed. State and local tax returns may be subject to examination for an additional fiscal year depending on the jurisdiction. Foreign taxes are provided for based on the Fund's understanding of the tax rules and rates that exist in the foreign markets in which it invests. The Fund is subject to a tax imposed on capital gains by certain countries in which it invests. An estimated deferred tax liability for net unrealized appreciation on the applicable securities is included in Other payables and accrued expenses on the Statement of Assets & Liabilities.
Distributions are declared and recorded on the ex-dividend date. Income dividends and capital gain distributions are declared separately for each class. Income and capital gain distributions are determined in accordance with income tax regulations, which may differ from GAAP. In addition, certain Funds claimed a portion of the payment made to redeeming shareholders as a distribution for income tax purposes.
Capital accounts within the financial statements are adjusted for permanent book-tax differences. These adjustments have no impact on net assets or the results of operations. Capital accounts are not adjusted for temporary book-tax differences which will reverse in a subsequent period.
Book-tax differences are primarily due to foreign currency transactions, certain foreign taxes, deferred trustees compensation and losses deferred due to wash sales.
Annual Report
Notes to Financial Statements - continued
3. Significant Accounting Policies - continued
Income Tax Information and Distributions to Shareholders - continued
The federal tax cost of investment securities and unrealized appreciation (depreciation) as of period end were as follows:
Gross unrealized appreciation | $ 593,130,470 |
Gross unrealized depreciation | (16,836,140) |
Net unrealized appreciation (depreciation) on securities and other investments | $ 576,294,330 |
|
|
Tax Cost | $ 1,500,755,721 |
The tax-based components of distributable earnings as of period end were as follows:
Undistributed ordinary income | $ 5,746,120 |
Undistributed long-term capital gain | $ 67,301,735 |
Net unrealized appreciation (depreciation) | $ 576,306,290 |
The tax character of distributions paid was as follows:
| February 28, 2014 | February 28, 2013 |
Ordinary Income | $ 40,643,236 | $ 31,344,671 |
Long-term Capital Gains | 135,532,916 | 29,546,659 |
Total | $ 176,176,152 | $ 60,891,330 |
Trading (Redemption) Fees. Shares held by investors in the Fund less than 30 days may be subject to a redemption fee equal to .75% of the NAV of shares redeemed. All redemption fees, which reduce the proceeds of the shareholder redemption, are retained by the Fund and accounted for as an addition to paid in capital.
4. Purchases and Sales of Investments.
Purchases and sales of securities, other than short-term securities, aggregated $723,925,161 and $1,068,680,050, respectively.
5. Fees and Other Transactions with Affiliates.
Management Fee. Effective August 1, 2013, SelectCo replaced Fidelity Management and Research Company (FMR), an affiliate of SelectCo, as an investment advisor to the Fund. The investment adviser and its affiliates provide the Fund with investment management related services for which the Fund pays a monthly management fee. The management fee is the sum of an individual fund fee rate that is based on an annual rate of ..30% of the Fund's average net assets and an annualized group fee rate that averaged .25% during the period. The group fee rate is based upon the average net assets of all the mutual funds advised by FMR and the investment adviser. The group fee rate decreases as assets under management increase and increases as assets under management decrease. For the reporting period, the total annual management fee rate was .55% of the Fund's average net assets.
Distribution and Service Plan Fees. In accordance with Rule 12b-1 of the 1940 Act, the Fund has adopted separate Distribution and Service Plans for each class of shares. Certain classes pay Fidelity Distributors Corporation (FDC), an affiliate of the investment adviser, separate Distribution and Service Fees, each of which is based on an annual percentage of each class' average net assets. In addition, FDC may pay financial intermediaries for selling shares of the Fund and providing shareholder support services. For the period, the Distribution and Service Fee rates, total fees and amounts retained by FDC were as follows:
| Distribution | Service | Total Fees | Retained |
Class A | -% | .25% | $ 797,394 | $ 19,980 |
Class T | .25% | .25% | 300,761 | 118 |
Class B | .75% | .25% | 182,844 | 137,554 |
Class C | .75% | .25% | 1,567,705 | 369,895 |
|
|
| $ 2,848,704 | $ 527,547 |
Annual Report
5. Fees and Other Transactions with Affiliates - continued
Sales Load. FDC may receive a front-end sales charge of up to 5.75% for selling Class A shares and 3.50% for selling Class T shares, some of which is paid to financial intermediaries for selling shares of the Fund. Depending on the holding period, FDC may receive contingent deferred sales charges levied on Class A, Class T, Class B, and Class C redemptions. The deferred sales charges range from 5.00% to 1.00% for Class B shares, 1.00% for Class C shares, 1.00% for certain purchases of Class A shares and .25% for certain purchases of Class T shares.
For the period, sales charge amounts retained by FDC were as follows:
| Retained |
Class A | $ 256,782 |
Class T | 27,091 |
Class B* | 20,190 |
Class C* | 17,772 |
| $ 321,835 |
* When Class B and Class C shares are initially sold, FDC pays commissions from its own resources to financial intermediaries through which the sales are made.
Transfer Agent Fees. Fidelity Investments Institutional Operations Company, Inc., (FIIOC), an affiliate of the investment adviser, is the transfer, dividend disbursing and shareholder servicing agent for each class of the Fund. FIIOC receives account fees and asset-based fees that vary according to the account size and type of account of the shareholders of the respective classes of the Fund. FIIOC pays for typesetting, printing and mailing of shareholder reports, except proxy statements.
For the period, transfer agent fees for each class were as follows:
| Amount | % of |
Class A | $ 677,863 | .21 |
Class T | 139,412 | .23 |
Class B | 47,387 | .26 |
Class C | 335,943 | .21 |
Consumer Staples | 2,763,747 | .19 |
Institutional Class | 835,980 | .22 |
| $ 4,800,332 |
|
Accounting and Security Lending Fees. Fidelity Service Company, Inc. (FSC), an affiliate of the investment adviser, maintains the Fund's accounting records. The accounting fee is based on the level of average net assets for each month. Under a separate contract, FSC administers the security lending program. The security lending fee is based on the number and duration of lending transactions.
Brokerage Commissions. The Fund placed a portion of its portfolio transactions with brokerage firms which are affiliates of the investment adviser. Brokerage commissions are included in net realized gain (loss) and change in net unrealized appreciation (depreciation) in the Statement of Operations. The commissions paid to these affiliated firms were $12,975 for the period.
Interfund Lending Program. Pursuant to an Exemptive Order issued by the SEC, the Fund, along with other registered investment companies having management contracts with FMR or other affiliated entities of FMR, may participate in an interfund lending program. This program provides an alternative credit facility allowing the funds to borrow from, or lend money to, other participating affiliated funds. At period end, there were no interfund loans outstanding. The Fund's activity in this program during the period for which loans were outstanding was as follows:
Borrower or Lender | Average Loan | Weighted Average Interest Rate | Interest |
Borrower | $ 19,104,440 | .31% | $ 4,091 |
6. Committed Line of Credit.
The Fund participates with other funds managed by the investment adviser or an affiliate in a $4.25 billion credit facility (the "line of credit") to be utilized for temporary or emergency purposes to fund shareholder redemptions or for other short-term liquidity purposes. The Fund has agreed to pay commitment fees on its pro-rata portion of the line of credit, which amounted to $4,774 and is reflected in Miscellaneous expenses on the Statement of Operations. During the period, there were no borrowings on this line of credit.
Annual Report
Notes to Financial Statements - continued
7. Security Lending.
The Fund lends portfolio securities through a lending agent from time to time in order to earn additional income. For equity securities, a lending agent is used and may loan securities to certain qualified borrowers, which prior to August 1, 2013 included Fidelity Capital Markets (FCM), a broker-dealer affiliated with the Fund. On the settlement date of the loan, the Fund receives collateral (in the form of U.S. Treasury obligations, letters of credit and/or cash) against the loaned securities and maintains collateral in an amount not less than 100% of the market value of the loaned securities during the period of the loan. The market value of the loaned securities is determined at the close of business of the Fund and any additional required collateral is delivered to the Fund on the next business day. If the borrower defaults on its obligation to return the securities loaned because of insolvency or other reasons, the Fund may apply collateral received from the borrower against the obligation. The Fund may experience delays and costs in recovering the securities loaned. Any cash collateral received is invested the Fidelity Securities Lending Cash Central Fund. The value of loaned securities and cash collateral at period end are disclosed on the Fund's Statement of Assets and Liabilities. Security lending income represents the income earned on investing cash collateral, less rebates paid to borrowers and any lending agent fees associated with the loan, plus any premium payments received for lending certain types of securities. Security lending income is presented in the Statement of Operations as a component of income from Fidelity Central Funds. Total security lending income during the period amounted to $320,864. During the period, there were no securities loaned to FCM.
8. Bank Borrowings.
The Fund is permitted to have bank borrowings for temporary or emergency purposes to fund shareholder redemptions or for other short-term liquidity requirements. The Fund has established borrowing arrangements with certain banks. The interest rate on the borrowings is the bank's base rate, as revised from time to time. The average loan balance during the period for which loans were outstanding amounted to $7,763,571. The weighted average interest rate was .57%. The interest expense amounted to $861 under the bank borrowing program. At period end, there were no bank borrowings outstanding.
9. Expense Reductions.
Commissions paid to certain brokers with whom the investment adviser, or its affiliates, places trades on behalf of the Fund include an amount in addition to trade execution, which may be rebated back to the Fund to offset certain expenses. This amount totaled $68,126 for the period. In addition, through arrangements with the Fund's custodian, credits realized as a result of uninvested cash balances were used to reduce the Fund's expenses. During the period, these credits reduced the Fund's custody expenses by $57.
In addition, FMR reimbursed a portion of the Fund's operating expenses during the period in the amount of $9,129.
10. Distributions to Shareholders.
Distributions to shareholders of each class were as follows:
Years ended February 28, | 2014 | 2013 |
From net investment income |
|
|
Class A | $ 5,205,524 | $ 3,290,973 |
Class T | 826,286 | 500,306 |
Class B | 138,623 | 82,480 |
Class C | 1,548,556 | 820,066 |
Consumer Staples | 26,141,452 | 20,759,081 |
Institutional Class | 5,128,684 | 5,891,765 |
Total | $ 38,989,125 | $ 31,344,671 |
From net realized gain |
|
|
Class A | $ 18,454,866 | $ 3,434,776 |
Class T | 3,478,167 | 646,006 |
Class B | 1,077,295 | 260,273 |
Class C | 9,334,082 | 1,739,884 |
Consumer Staples | 84,245,287 | 18,561,423 |
Institutional Class | 20,597,330 | 4,904,297 |
Total | $ 137,187,027 | $ 29,546,659 |
Annual Report
11. Share Transactions.
Transactions for each class of shares were as follows:
| Shares | Dollars | ||
Years ended February 28, | 2014 | 2013 | 2014 | 2013 |
Class A |
|
|
|
|
Shares sold | 1,297,946 | 1,172,691 | $ 115,706,038 | $ 93,404,427 |
Reinvestment of distributions | 234,768 | 72,806 | 20,739,532 | 5,768,631 |
Shares redeemed | (1,022,897) | (756,998) | (90,649,691) | (59,959,929) |
Net increase (decrease) | 509,817 | 488,499 | $ 45,795,879 | $ 39,213,129 |
Class T |
|
|
|
|
Shares sold | 171,739 | 146,374 | $ 15,157,502 | $ 11,640,258 |
Reinvestment of distributions | 46,535 | 13,628 | 4,086,883 | 1,073,877 |
Shares redeemed | (126,021) | (73,443) | (11,017,450) | (5,785,079) |
Net increase (decrease) | 92,253 | 86,559 | $ 8,226,935 | $ 6,929,056 |
Class B |
|
|
|
|
Shares sold | 16,325 | 11,096 | $ 1,431,261 | $ 868,729 |
Reinvestment of distributions | 11,472 | 3,553 | 1,003,061 | 278,056 |
Shares redeemed | (46,659) | (56,866) | (4,085,147) | (4,452,338) |
Net increase (decrease) | (18,862) | (42,217) | $ (1,650,825) | $ (3,305,553) |
Class C |
|
|
|
|
Shares sold | 622,483 | 479,940 | $ 54,501,354 | $ 37,531,069 |
Reinvestment of distributions | 101,164 | 25,332 | 8,787,354 | 1,978,186 |
Shares redeemed | (417,359) | (291,408) | (36,266,564) | (22,752,561) |
Net increase (decrease) | 306,288 | 213,864 | $ 27,022,144 | $ 16,756,694 |
Consumer Staples |
|
|
|
|
Shares sold | 3,438,166 | 5,353,585 | $ 309,005,043 | $ 425,841,967 |
Reinvestment of distributions | 1,188,981 | 474,945 | 105,681,529 | 37,790,378 |
Shares redeemed | (6,154,349) | (5,260,820) | (548,691,818) | (416,646,931) |
Net increase (decrease) | (1,527,202) | 567,710 | $ (134,005,246) | $ 46,985,414 |
Institutional Class |
|
|
|
|
Shares sold | 2,006,485 | 3,475,040 | $ 181,066,529 | $ 279,763,267 |
Reinvestment of distributions | 271,028 | 125,836 | 24,047,781 | 10,030,919 |
Shares redeemed | (4,939,085) | (1,369,230) | (445,334,927) | (108,604,076) |
Net increase (decrease) | (2,661,572) | 2,231,646 | $ (240,220,617) | $ 181,190,110 |
12. Other.
The Fund's organizational documents provide former and current trustees and officers with a limited indemnification against liabilities arising in connection with the performance of their duties to the Fund. In the normal course of business, the Fund may also enter into contracts that provide general indemnifications. The Fund's maximum exposure under these arrangements is unknown as this would be dependent on future claims that may be made against the Fund. The risk of material loss from such claims is considered remote.
Annual Report
Fidelity Advisor Gold Fund - Class A, T, B and C
Performance: The Bottom Line
Average annual total return reflects the change in the value of an investment, assuming reinvestment of the class' distributions from dividend income and capital gains (the profits earned upon the sale of securities that have grown in value, if any) and assuming a constant rate of performance each year. The $10,000 table and the fund's returns do not reflect the deduction of taxes that a shareholder would pay on fund distributions or the redemption of fund shares. During periods of reimbursement by Fidelity, a fund's total return will be greater than it would be had the reimbursement not occurred. How a fund did yesterday is no guarantee of how it will do tomorrow. Returns reflect the conversion of Class B shares to Class A shares after a maximum of seven years.
Average Annual Total Returns
Periods ended February 28, 2014 | Past 1 | Past 5 | Past 10 |
Class A (incl. 5.75% sales charge) A | -31.42% | -4.51% | 2.86% |
Class T (incl. 3.50% sales charge) B | -29.99% | -4.32% | 2.91% |
Class B (incl. contingent deferred sales charge) C | -31.39% | -4.44% | 2.92% |
Class C (incl. contingent deferred sales charge) D | -28.48% | -4.08% | 2.91% |
A Class A shares bear a 0.25% 12b-1 fee. The initial offering of Class A shares took place on December 12, 2006. Returns prior to December 12, 2006, are those of Gold Portfolio, the original class of the fund, which has no 12b-1 fee. Had Class A's 12b-1 fee been reflected, returns prior to December 12, 2006, would have been lower.
B Class T shares bear a 0.50% 12b-1 fee. The initial offering of Class T shares took place on December 12, 2006. Returns prior to December 12, 2006, are those of Gold Portfolio, the original class of the fund, which has no 12b-1 fee. Had Class T's 12b-1 fee been reflected, returns prior to December 12, 2006, would have been lower.
C Class B shares bear a 1.00% 12b-1 fee. The initial offering of Class B shares took place on December 12, 2006. Returns prior to December 12, 2006, are those of Gold Portfolio, the original class of the fund, which has no 12b-1 fee. Had Class B's 12b-1 fee been reflected, returns prior to December 12, 2006, would have been lower. Class B shares' contingent deferred sales charges included in the past one year, past five years, and past ten years total return figures are 5%, 2%, and 0%, respectively.
D Class C shares bear a 1.00% 12b-1 fee. The initial offering of Class C shares took place on December 12, 2006. Returns prior to December 12, 2006, are those of Gold Portfolio, the original class of the fund, which has no 12b-1 fee. Had Class C's 12b-1 fee been reflected, returns prior to December 12, 2006, would have been lower. Class C shares' contingent deferred sales charges included in the past one year, past five years, and past ten years total return figures are 1%, 0%, and 0%, respectively.
$10,000 Over 10 Years
Let's say hypothetically that $10,000 was invested in Fidelity Advisor Gold Fund - Class A on February 29, 2004, and the current 5.75% sales charge was paid. The chart shows how the value of your investment would have changed, and also shows how the S&P 500 Index performed over the same period. See footnote A for additional information regarding the performance of Class A.

Annual Report
Fidelity Advisor Gold Fund
Management's Discussion of Fund Performance
Market Recap: Stocks overcame fears of higher interest rates - not to mention their worst January in four years - to finish sharply higher for the 12 months ending February 28, 2014. The broad S&P 500® Index and the blue-chip Dow Jones Industrial AverageSM gained 25.37% and 19.01%, respectively, amid generally favorable earnings reports and accommodative monetary policies worldwide. Performance generally increased along the risk spectrum, with smaller-cap and growth strategies leading the way. An ebullient market helped the growth-oriented Nasdaq Composite Index® to a 38.10% period gain, for example. On the other hand, both cyclical and defensive stocks had representation in the top-performing industry sectors: returns were highest in health care and consumer discretionary; lowest in utilities and telecommunication services. From a macroeconomic perspective, data still points to slow but steady improvement in the U.S., and Europe's recession may well be over. Reports from China have disappointed, but continue to suggest a relatively soft landing there. Mixed signals from the U.S. Federal Reserve as to when it might curtail its stimulative bond buying kept markets in flux during the spring and summer. Stocks regained momentum in October despite a federal budget impasse and brief government shutdown, and lower volatility prevailed through year-end. Shedding new-year concerns about China's economy, an emerging-markets sell-off and confirmation (at last) of Fed tapering - alongside confirmation of a presumably dovish Janet Yellen as new Fed chair - February saw stocks back in record territory, bearing down on the five-year anniversary of the market's bottom.
Comments from S. Joseph Wickwire II, Portfolio Manager of Fidelity Advisor® Gold Fund: For the year, the fund's Class A, Class T, Class B and Class C shares returned -27.24%, -27.45%, -27.78% and -27.75%, resepectively (excluding sales charges), compared with -30.17% for the S&P® Global BMI Gold Capped Index and 25.37% for the broadly based S&P 500® Index. For much of the period, gold and gold stocks were in what I believed was a concluding phase of a two-year correction. An approximate 15% drop in the commodity price hurt gold-mining stocks for the year, along with concerns that a higher interest rate environment would hurt the group. At the same time, some investors sold gold and gold-related stocks to buy strong-performing equities. Versus the industry benchmark, the fund was helped by overweighting outperforming names such as Osisko Mining and Rainy River Resources, whose stock prices both rose on takeover bids. I sold Rainy River before period end. Underweighting weak performer and index heavyweight Newmont Mining also helped, as it struggled with low production growth, country risk and high costs. Non-benchmark positions in gold and silver bullion contributed as more-defensive components. Conversely, the fund was hurt by stakes in Colossus Minerals, Detour Gold and Persus Mining. I significantly reduced our stake in Colossus by period end.
The views expressed above reflect those of the portfolio manager(s) only through the end of the period as stated on the cover of this report and do not necessarily represent the views of Fidelity or any other person in the Fidelity organization. Any such views are subject to change at any time based upon market or other conditions and Fidelity disclaims any responsibility to update such views. These views may not be relied on as investment advice and, because investment decisions for a Fidelity fund are based on numerous factors, may not be relied on as an indication of trading intent on behalf of any Fidelity fund.
Annual Report
Gold Portfolio
Shareholder Expense Example
As a shareholder of the Fund, you incur two types of costs: (1) transaction costs, including sales charges (loads) on purchase payments or redemption proceeds, redemption fees and (2) ongoing costs, including management fees, distribution and/or service (12b-1) fees and other Fund expenses. This Example is intended to help you understand your ongoing costs (in dollars) of investing in the Fund and to compare these costs with the ongoing costs of investing in other mutual funds.
The Example is based on an investment of $1,000 invested at the beginning of the period and held for the entire period (September 1, 2013 to February 28, 2014).
Actual Expenses
The first line of the accompanying table for each class of the Fund provides information about actual account values and actual expenses. You may use the information in this line, together with the amount you invested, to estimate the expenses that you paid over the period. Simply divide your account value by $1,000.00 (for example, an $8,600 account value divided by $1,000.00 = 8.6), then multiply the result by the number in the first line for a class of the Fund under the heading entitled "Expenses Paid During Period" to estimate the expenses you paid on your account during this period. A small balance maintenance fee of $12.00 that is charged once a year may apply for certain accounts with a value of less than $2,000. This fee is not included in the table below. If it was, the estimate of expenses you paid during the period would be higher, and your ending account value lower, by this amount. In addition, the Fund, as a shareholder in the underlying Fidelity Central Funds, will indirectly bear its pro-rata share of the fees and expenses incurred by the underlying Fidelity Central Funds. These fees and expenses are not included in the Fund's annualized expense ratio used to calculate the expense estimate in the table below.
Hypothetical Example for Comparison Purposes
The second line of the accompanying table for each class of the Fund provides information about hypothetical account values and hypothetical expenses based on a Class' actual expense ratio and an assumed rate of return of 5% per year before expenses, which is not the Class' actual return. The hypothetical account values and expenses may not be used to estimate the actual ending account balance or expenses you paid for the period. You may use this information to compare the ongoing costs of investing in the Fund and other funds. To do so, compare this 5% hypothetical example with the 5% hypothetical examples that appear in the shareholder reports of the other funds. A small balance maintenance fee of $12.00 that is charged once a year may apply for certain accounts with a value of less than $2,000. This fee is not included in the table below. If it was, the estimate of expenses you paid during the period would be higher, and your ending account value lower, by this amount. In addition, the Fund, as a shareholder in the underlying Fidelity Central Funds, will indirectly bear its pro-rata share of the fees and expenses incurred by the underlying Fidelity Central Funds. These fees and expenses are not included in the Fund's annualized expense ratio used to calculate the expense estimate in the table below.
Please note that the expenses shown in the table are meant to highlight your ongoing costs only and do not reflect any transaction costs. Therefore, the second line of the table is useful in comparing ongoing costs only, and will not help you determine the relative total costs of owning different funds. In addition, if these transactional costs were included, your costs would have been higher.
| Annualized | Beginning | Ending | Expenses Paid |
Class A | 1.21% |
|
|
|
Actual |
| $ 1,000.00 | $ 948.70 | $ 5.85 |
HypotheticalA |
| $ 1,000.00 | $ 1,018.79 | $ 6.06 |
Class T | 1.49% |
|
|
|
Actual |
| $ 1,000.00 | $ 947.70 | $ 7.20 |
HypotheticalA |
| $ 1,000.00 | $ 1,017.41 | $ 7.45 |
Class B | 1.97% |
|
|
|
Actual |
| $ 1,000.00 | $ 945.00 | $ 9.50 |
HypotheticalA |
| $ 1,000.00 | $ 1,015.03 | $ 9.84 |
Class C | 1.96% |
|
|
|
Actual |
| $ 1,000.00 | $ 945.20 | $ 9.45 |
HypotheticalA |
| $ 1,000.00 | $ 1,015.08 | $ 9.79 |
Gold | .93% |
|
|
|
Actual |
| $ 1,000.00 | $ 950.00 | $ 4.50 |
HypotheticalA |
| $ 1,000.00 | $ 1,020.18 | $ 4.66 |
Institutional Class | .86% |
|
|
|
Actual |
| $ 1,000.00 | $ 950.40 | $ 4.16 |
HypotheticalA |
| $ 1,000.00 | $ 1,020.53 | $ 4.31 |
A 5% return per year before expenses
B Annualized expense ratio reflects consolidated expenses net of applicable fee waivers.
* Expenses are equal to each Class' annualized expense ratio, multiplied by the average account value over the period, multiplied by 181/365 (to reflect the one-half year period).
Annual Report
Gold Portfolio
Consolidated Investment Changes (Unaudited)
Top Ten Holdings as of February 28, 2014 | ||
| % of fund's | % of fund's net assets |
Gold Bullion | 10.1 | 5.2 |
Goldcorp, Inc. | 9.2 | 10.1 |
Barrick Gold Corp. | 6.4 | 9.5 |
Randgold Resources Ltd. sponsored ADR | 5.2 | 4.6 |
Silver Bullion | 5.0 | 3.8 |
Newcrest Mining Ltd. | 4.7 | 5.2 |
Yamana Gold, Inc. | 4.4 | 4.9 |
Franco-Nevada Corp. | 4.1 | 3.7 |
Eldorado Gold Corp. | 3.9 | 4.8 |
AngloGold Ashanti Ltd. sponsored ADR | 3.7 | 1.6 |
| 56.7 |
|
Top Industries (% of fund's net assets) | |||
As of February 28, 2014 | |||
| Gold | 83.2% |
|
 | Commodities & Related Investments** | 15.1% |
|
| Precious Metals & Minerals | 0.7% |
|
| Diversified Metals & Mining | 0.1% |
|
| Coal & Consumable Fuels | 0.1% |
|
| Construction & Engineering | 0.1% |
|
| All Others* | 0.7% |
|

As of August 31, 2013 | |||
| Gold | 89.4% |
|
| Commodities & Related Investments** | 9.0% |
|
| Precious Metals & Minerals | 0.9% |
|
| Diversified Metals & Mining | 0.2% |
|
| Construction & Engineering | 0.0%† |
|
| Coal & Consumable Fuels | 0.0%† |
|
| All Others* | 0.5% |
|

* Includes short-term investments and net other assets (liabilities). |
** Includes gold bullion and/or silver bullion. |
† Amount represents less than 0.1% |
Geographic Diversification (% of fund's net assets) | |||
As of February 28, 2014 | |||
| Canada | 57.3% |
|
| United States of America* | 20.4% |
|
 | Australia | 7.1% |
|
| South Africa | 6.7% |
|
 | Bailiwick of Jersey | 6.5% |
|
| Bermuda | 1.0% |
|
 | Peru | 0.5% |
|
| Cayman Islands | 0.4% |
|
| United Kingdom | 0.1% |
|

Percentages are based on country or territory of incorporation and are adjusted for the effect of futures contracts, if applicable. |
As of August 31, 2013 | |||
| Canada | 64.6% |
|
| United States of America* | 14.5% |
|
| Australia | 8.7% |
|
| Bailiwick of Jersey | 5.8% |
|
| South Africa | 5.0% |
|
| Bermuda | 0.8% |
|
| Cayman Islands | 0.4% |
|
| United Kingdom | 0.1% |
|
| Peru | 0.1% |
|

Percentages are based on country or territory of incorporation and are adjusted for the effect of futures contracts, if applicable. |
Annual Report
Gold Portfolio
Consolidated Investments February 28, 2014
Showing Percentage of Net Assets
Common Stocks - 84.2% | |||
Shares | Value | ||
Australia - 7.1% | |||
CONSTRUCTION & ENGINEERING - 0.1% | |||
Construction & Engineering - 0.1% | |||
Boart Longyear Ltd. (d) | 3,985,000 | $ 1,084,584 | |
METALS & MINING - 7.0% | |||
Gold - 7.0% | |||
Beadell Resources Ltd. (a) | 10,603,618 | 7,191,225 | |
Evolution Mining Ltd. (d) | 2,371,395 | 1,978,567 | |
Gryphon Minerals Ltd. (a) | 5,060,010 | 790,178 | |
Intrepid Mines Ltd.: | |||
(Australia) (a) | 8,469,798 | 1,965,086 | |
(Canada) (a) | 320,000 | 73,693 | |
Kingsgate Consolidated NL | 328,274 | 357,381 | |
Medusa Mining Ltd. (a) | 2,246,085 | 4,349,318 | |
Newcrest Mining Ltd. | 6,941,758 | 70,245,378 | |
Papillon Resources Ltd. (a) | 3,332,270 | 4,222,443 | |
Perseus Mining Ltd.: | |||
(Australia) (a) | 3,240,134 | 1,243,273 | |
(Canada) (a) | 1,300,000 | 504,832 | |
Ramelius Resources Ltd. (a) | 980,000 | 126,803 | |
Red 5 Ltd. (a) | 1,326,000 | 130,158 | |
Regis Resources Ltd. | 2,672,293 | 5,436,935 | |
Resolute Mining Ltd. (a) | 2,988,261 | 1,613,278 | |
Saracen Mineral Holdings Ltd. (a)(d) | 4,816,787 | 1,310,969 | |
Silver Lake Resources Ltd. (a)(d) | 4,346,985 | 2,249,839 | |
St Barbara Ltd. (a)(d) | 4,283,377 | 1,337,795 | |
Troy Resources NL (a)(d) | 195,000 | 200,980 | |
Troy Resources NL (f) | 734,826 | 769,799 | |
| 106,097,930 | ||
TOTAL AUSTRALIA | 107,182,514 | ||
Bailiwick of Jersey - 6.5% | |||
METALS & MINING - 6.5% | |||
Gold - 6.5% | |||
Centamin PLC (a) | 3,761,900 | 3,464,719 | |
Lydian International Ltd. (a) | 2,325,200 | 2,267,873 | |
Polyus Gold International Ltd. | 422,400 | 1,384,598 | |
Polyus Gold International Ltd. sponsored GDR | 3,919,931 | 12,543,779 | |
Randgold Resources Ltd. sponsored ADR (d) | 994,895 | 78,636,501 | |
| 98,297,470 | ||
Bermuda - 1.0% | |||
METALS & MINING - 1.0% | |||
Gold - 1.0% | |||
Continental Gold Ltd. (a) | 3,354,700 | 15,299,589 | |
Canada - 57.3% | |||
METALS & MINING - 57.3% | |||
Diversified Metals & Mining - 0.1% | |||
NovaCopper, Inc. (a)(d) | 488,333 | 620,182 | |
| |||
Shares | Value | ||
Rio Alto Mining Ltd. (a) | 396,500 | $ 845,065 | |
Sabina Gold & Silver Corp. (a) | 980,000 | 814,233 | |
True Gold Mining, Inc. (a) | 125,000 | 43,462 | |
| 2,322,942 | ||
Gold - 56.5% | |||
Agnico Eagle Mines Ltd. (Canada) (d) | 1,606,200 | 51,538,234 | |
Alacer Gold Corp. | 2,155,063 | 5,819,235 | |
Alamos Gold, Inc. | 1,113,300 | 10,667,491 | |
Argonaut Gold, Inc. (a) | 3,609,962 | 18,778,453 | |
ATAC Resources Ltd. (a) | 67,200 | 80,715 | |
B2Gold Corp. (a) | 14,237,858 | 41,146,162 | |
Banro Corp. (a)(d) | 2,326,482 | 1,365,676 | |
Barrick Gold Corp. (d) | 4,737,769 | 96,526,749 | |
Belo Sun Mining Corp. (a)(d) | 6,797,400 | 2,670,341 | |
Centerra Gold, Inc. | 1,422,400 | 6,371,448 | |
Colossus Minerals, Inc. (a)(d) | 802,600 | 28,993 | |
Detour Gold Corp. (a)(d) | 2,014,800 | 17,504,178 | |
Detour Gold Corp. (a)(f) | 785,900 | 6,827,741 | |
Eldorado Gold Corp. | 8,794,408 | 58,375,236 | |
Franco-Nevada Corp. (d) | 1,207,700 | 61,721,072 | |
Gabriel Resources Ltd. (a) | 1,040,600 | 1,127,716 | |
Goldcorp, Inc. | 5,119,400 | 137,636,176 | |
Golden Queen Mining Co. Ltd. (a) | 15,000 | 21,750 | |
GoldQuest Mining Corp. (a) | 2,318,500 | 764,249 | |
Guyana Goldfields, Inc. (a)(d) | 2,933,700 | 7,656,816 | |
Guyana Goldfields, Inc. (a)(f) | 155,000 | 404,543 | |
IAMGOLD Corp. | 3,279,400 | 12,172,251 | |
Kinross Gold Corp. | 9,990,691 | 52,150,451 | |
Kinross Gold Corp. warrants 9/17/14 (a) | 1,192,793 | 37,702 | |
Kirkland Lake Gold, Inc. (a)(d) | 501,000 | 1,827,906 | |
Lake Shore Gold Corp. (a)(d) | 3,226,600 | 2,651,681 | |
Midas Gold Corp. (a) | 100,500 | 88,946 | |
New Gold, Inc. (a) | 7,241,575 | 44,274,779 | |
NGEx Resources, Inc. (a) | 65,000 | 106,836 | |
Novagold Resources, Inc. (a)(d) | 2,346,200 | 8,666,087 | |
OceanaGold Corp. (a) | 2,892,300 | 6,921,878 | |
Orezone Gold Corp. (a) | 372,100 | 194,905 | |
Osisko Mining Corp. (a) | 1,094,331 | 6,967,429 | |
Osisko Mining Corp. (a)(f) | 3,000,000 | 19,100,515 | |
Pilot Gold, Inc. (a) | 1,418,150 | 1,959,514 | |
Premier Gold Mines Ltd. (a)(e) | 9,787,922 | 20,772,705 | |
Pretium Resources, Inc. (a)(d) | 914,538 | 5,740,124 | |
Pretium Resources, Inc. (a)(f) | 225,000 | 1,412,219 | |
Pretium Resources, Inc. (a)(g) | 225,000 | 1,412,219 | |
Primero Mining Corp. (a)(d) | 841,200 | 5,454,543 | |
Probe Mines Ltd. (a) | 85,000 | 253,319 | |
Richmont Mines, Inc. (a) | 240,900 | 402,479 | |
Romarco Minerals, Inc. (a) | 14,078,600 | 9,154,332 | |
Romarco Minerals, Inc. (a)(f) | 5,900,000 | 3,836,359 | |
Rubicon Minerals Corp. (a) | 5,302,102 | 7,182,474 | |
Sandstorm Gold Ltd. (a)(d) | 137,000 | 722,550 | |
Seabridge Gold, Inc. (a)(d) | 601,905 | 5,224,533 | |
Common Stocks - continued | |||
Shares | Value | ||
Canada - continued | |||
METALS & MINING - CONTINUED | |||
Gold - continued | |||
SEMAFO, Inc. (d) | 2,740,000 | $ 11,011,469 | |
Sulliden Gold Corp. Ltd. (a)(d) | 4,138,400 | 3,288,894 | |
Teranga Gold Corp. (a) | 85,000 | 86,743 | |
Teranga Gold Corp. CDI unit (a) | 3,430,974 | 3,459,642 | |
Timmins Gold Corp. (a) | 122,600 | 177,152 | |
Torex Gold Resources, Inc. (a) | 15,603,400 | 16,909,672 | |
Yamana Gold, Inc. | 6,670,100 | 66,743,166 | |
| 847,398,448 | ||
Precious Metals & Minerals - 0.7% | |||
Chesapeake Gold Corp. (a) | 12,000 | 37,930 | |
Dalradian Resources, Inc. (a)(d) | 56,000 | 43,493 | |
Gold Standard Ventures Corp. (a) | 425,400 | 284,291 | |
MAG Silver Corp. (a) | 191,000 | 1,564,499 | |
Pan American Silver Corp. warrants 12/7/14 (a) | 232,460 | 7,570 | |
Silver Wheaton Corp. | 11,200 | 285,740 | |
Tahoe Resources, Inc. (a) | 328,900 | 7,716,808 | |
Wildcat Silver Corp. (a) | 75,200 | 40,069 | |
| 9,980,400 | ||
TOTAL METALS & MINING | 859,701,790 | ||
Cayman Islands - 0.4% | |||
METALS & MINING - 0.4% | |||
Gold - 0.4% | |||
Endeavour Mining Corp. (a) | 8,117,400 | 5,864,644 | |
Peru - 0.5% | |||
METALS & MINING - 0.5% | |||
Gold - 0.5% | |||
Compania de Minas Buenaventura SA sponsored ADR | 589,700 | 7,430,220 | |
South Africa - 6.7% | |||
METALS & MINING - 6.7% | |||
Gold - 6.7% | |||
AngloGold Ashanti Ltd. | 22,700 | 399,866 | |
AngloGold Ashanti Ltd. sponsored ADR (d) | 3,133,008 | 55,078,281 | |
Gold Fields Ltd. | 55,000 | 208,519 | |
Gold Fields Ltd. sponsored ADR | 6,317,026 | 23,309,826 | |
Harmony Gold Mining Co. Ltd. | 1,484,000 | 4,770,533 | |
Harmony Gold Mining Co. Ltd. sponsored ADR (d) | 2,079,900 | 6,738,876 | |
Sibanye Gold Ltd. ADR (d) | 1,195,006 | 9,571,998 | |
| 100,077,899 | ||
| |||
Shares | Value | ||
United Kingdom - 0.1% | |||
METALS & MINING - 0.1% | |||
Gold - 0.1% | |||
Patagonia Gold PLC (a)(d) | 260,000 | $ 42,994 | |
Petropavlovsk PLC (d) | 391,970 | 610,427 | |
| 653,421 | ||
Precious Metals & Minerals - 0.0% | |||
Fresnillo PLC | 10,000 | 159,333 | |
TOTAL METALS & MINING | 812,754 | ||
United States of America - 4.6% | |||
METALS & MINING - 4.5% | |||
Gold - 4.5% | |||
Allied Nevada Gold Corp. (a)(d) | 281,800 | 1,473,814 | |
Allied Nevada Gold Corp. (Canada) (a) | 30,000 | 156,900 | |
Gold Resource Corp. (d) | 100,000 | 515,000 | |
McEwen Mining, Inc. (a)(d) | 679,110 | 1,976,210 | |
Newmont Mining Corp. | 898,500 | 20,899,110 | |
Royal Gold, Inc. | 612,513 | 42,085,768 | |
| 67,106,802 | ||
OIL, GAS & CONSUMABLE FUELS - 0.1% | |||
Coal & Consumable Fuels - 0.1% | |||
Peabody Energy Corp. | 97,400 | 1,710,342 | |
TOTAL UNITED STATES OF AMERICA | 68,817,144 | ||
TOTAL COMMON STOCKS (Cost $1,605,390,234) |
| ||
Commodities - 15.1% | |||
| Troy Ounces |
|
|
Gold Bullion (a) | 114,510 | 151,730,330 | |
Silver Bullion (a) | 3,500,000 | 74,139,100 | |
TOTAL COMMODITIES (Cost $225,370,573) |
| ||
Money Market Funds - 13.3% | |||
Shares | Value | ||
Fidelity Cash Central Fund, 0.10% (b) | 16,036,002 | $ 16,036,002 | |
Fidelity Securities Lending Cash Central Fund, 0.09% (b)(c) | 183,742,153 | 183,742,153 | |
TOTAL MONEY MARKET FUNDS (Cost $199,778,155) |
| ||
TOTAL INVESTMENT PORTFOLIO - 112.6% (Cost $2,030,538,962) | 1,689,131,609 | ||
NET OTHER ASSETS (LIABILITIES) - (12.6)% | (188,533,289) | ||
NET ASSETS - 100% | $ 1,500,598,320 | ||
Legend |
(a) Non-income producing |
(b) Affiliated fund that is generally available only to investment companies and other accounts managed by Fidelity Investments. The rate quoted is the annualized seven-day yield of the fund at period end. A complete unaudited listing of the fund's holdings as of its most recent quarter end is available upon request. In addition, each Fidelity Central Fund's financial statements, which are not covered by the Fund's Report of Independent Registered Public Accounting Firm, are available on the SEC's website or upon request. |
(c) Investment made with cash collateral received from securities on loan. |
(d) Security or a portion of the security is on loan at period end. |
(e) Affiliated company |
(f) Security exempt from registration under Rule 144A of the Securities Act of 1933. These securities may be resold in transactions exempt from registration, normally to qualified institutional buyers. At the end of the period, the value of these securities amounted to $32,351,176 or 2.2% of net assets. |
(g) Restricted securities - Investment in securities not registered under the Securities Act of 1933 (excluding 144A issues). At the end of the period, the value of restricted securities (excluding 144A issues) amounted to $1,412,219 or 0.1% of net assets. |
Additional information on each restricted holding is as follows: |
Security | Acquisition Date | Acquisition Cost |
Pretium Resources, Inc. | 3/31/11 | $ 2,172,293 |
Affiliated Central Funds |
Information regarding fiscal year to date income earned by the Fund from investments in Fidelity Central Funds is as follows: |
Fund | Income earned |
Fidelity Cash Central Fund | $ 9,917 |
Fidelity Securities Lending Cash Central Fund | 598,267 |
Total | $ 608,184 |
Consolidated Subsidiary | Value, | Purchases | Sales | Dividend | Value, |
Fidelity Select Gold Cayman Ltd. | $ 116,121,090 | $ 472,317,716 | $ 344,928,800 | $ - | $ 225,764,683 |
Other Affiliated Issuers |
An affiliated company is a company in which the Fund has ownership of at least 5% of the voting securities. Fiscal year to date transactions with companies which are or were affiliates are as follows: |
Affiliate | Value, | Purchases | Sales | Dividend | Value, |
Kimber Resources, Inc. | $ 3,981 | $ - | $ 2,315 | $ - | $ - |
Kimber Resources, Inc. (144A) | 1,379,164 | - | 774,753 | - | - |
Premier Gold Mines Ltd. | 13,711,119 | 7,618,238 | - | - | 20,772,705 |
Total | $ 15,094,264 | $ 7,618,238 | $ 777,068 | $ - | $ 20,772,705 |
Other Information |
The following is a summary of the inputs used, as of February 28, 2014, involving the Fund's assets and liabilities carried at fair value. The inputs or methodology used for valuing securities may not be an indication of the risk associated with investing in those securities. For more information on valuation inputs, and their aggregation into the levels used in the table below, please refer to the Investment Valuation section in the accompanying Notes to Consolidated Financial Statements. |
Valuation Inputs at Reporting Date: | ||||
Description | Total | Level 1 | Level 2 | Level 3 |
Investments in Securities: | ||||
Common Stocks | $ 1,263,484,024 | $ 1,258,068,543 | $ 5,386,488 | $ 28,993 |
Commodities | 225,869,430 | 225,869,430 | - | - |
Money Market Funds | 199,778,155 | 199,778,155 | - | - |
Total Investments in Securities: | $ 1,689,131,609 | $ 1,683,716,128 | $ 5,386,488 | $ 28,993 |
See accompanying notes which are an integral part of the Consolidated financial statements.
Annual Report
Gold Portfolio
Consolidated Financial Statements
Consolidated Statement of Assets and Liabilities
| February 28, 2014 | |
|
|
|
Assets | ||
Investment in securities, at value (including securities loaned of $173,215,187) - See accompanying schedule: Unaffiliated issuers (cost $1,574,084,452) | $ 1,242,711,319 |
|
Fidelity Central Funds (cost $199,778,155) | 199,778,155 |
|
Commodities (cost $225,370,573) | 225,869,430 |
|
Other affiliated issuers (cost $31,305,782) | 20,772,705 |
|
Total Investments (cost $2,030,538,962) |
| $ 1,689,131,609 |
Receivable for fund shares sold | 3,772,643 | |
Dividends receivable | 310,264 | |
Distributions receivable from Fidelity Central Funds | 58,886 | |
Prepaid expenses | 5,836 | |
Other receivables | 21,725 | |
Total assets | 1,693,300,963 | |
|
|
|
Liabilities | ||
Payable to custodian bank | $ 9,165 | |
Payable for investments purchased | 3,614,909 | |
Payable for fund shares redeemed | 4,122,024 | |
Accrued management fee | 655,535 | |
Distribution and service plan fees payable | 50,221 | |
Other affiliated payables | 328,265 | |
Other payables and accrued expenses | 180,371 | |
Collateral on securities loaned, at value | 183,742,153 | |
Total liabilities | 192,702,643 | |
|
|
|
Net Assets | $ 1,500,598,320 | |
Net Assets consist of: |
| |
Paid in capital | $ 2,719,446,235 | |
Accumulated net investment loss | (8,084) | |
Accumulated undistributed net realized gain (loss) on investments and foreign currency transactions | (877,435,473) | |
Net unrealized appreciation (depreciation) on investments and assets and liabilities in foreign currencies | (341,404,358) | |
Net Assets | $ 1,500,598,320 | |
Consolidated Statement of Assets and Liabilities -
continued
| February 28, 2014 | |
Calculation of Maximum Offering Price Class A: | $ 22.01 | |
|
|
|
Maximum offering price per share (100/94.25 of $22.01) | $ 23.35 | |
Class T: | $ 21.73 | |
|
|
|
Maximum offering price per share (100/96.50 of $21.73) | $ 22.52 | |
Class B: | $ 21.14 | |
|
|
|
Class C: | $ 21.06 | |
|
|
|
Gold: | $ 22.41 | |
|
|
|
Institutional Class: | $ 22.41 | |
A Redemption price per share is equal to net asset value less any applicable contingent deferred sales charge.
See accompanying notes which are an integral part of the Consolidated financial statements.
Annual Report
Gold Portfolio
Consolidated Financial Statements - continued
Consolidated Statement of Operations
| Year ended February 28, 2014 | |
|
|
|
Investment Income |
|
|
Dividends |
| $ 16,884,160 |
Interest |
| 308 |
Income from Fidelity Central Funds |
| 608,184 |
Total income |
| 17,492,652 |
|
|
|
Expenses | ||
Management fee | $ 8,556,432 | |
Transfer agent fees | 4,024,234 | |
Distribution and service plan fees | 572,954 | |
Accounting and security lending fees | 682,266 | |
Custodian fees and expenses | 354,790 | |
Independent trustees' compensation | 26,542 | |
Registration fees | 191,328 | |
Audit | 64,766 | |
Legal | 25,044 | |
Interest | 3,525 | |
Miscellaneous | 24,576 | |
Total expenses before reductions | 14,526,457 | |
Expense reductions | (446,858) | 14,079,599 |
Net investment income (loss) | 3,413,053 | |
Realized and Unrealized Gain (Loss) Net realized gain (loss) on: | ||
Investments: |
|
|
Unaffiliated issuers | (547,572,843) | |
Other affiliated issuers | (4,162,175) |
|
Commodities | (4,647,499) |
|
Foreign currency transactions | (225,772) | |
Total net realized gain (loss) |
| (556,608,289) |
Change in net unrealized appreciation (depreciation) on: Investments | (75,476,961) | |
Assets and liabilities in foreign currencies | 13,851 | |
Commodities | (12,614,823) | |
Total change in net unrealized appreciation (depreciation) |
| (88,077,933) |
Net gain (loss) | (644,686,222) | |
Net increase (decrease) in net assets resulting from operations | $ (641,273,169) | |
Consolidated Statement of Changes in Net Assets
| Year ended | Year ended |
Increase (Decrease) in Net Assets |
|
|
Operations |
|
|
Net investment income (loss) | $ 3,413,053 | $ 13,834,462 |
Net realized gain (loss) | (556,608,289) | (149,416,855) |
Change in net unrealized appreciation (depreciation) | (88,077,933) | (1,263,115,883) |
Net increase (decrease) in net assets resulting from operations | (641,273,169) | (1,398,698,276) |
Share transactions - net increase (decrease) | (461,130,558) | (374,414,799) |
Redemption fees | 396,348 | 209,222 |
Total increase (decrease) in net assets | (1,102,007,379) | (1,772,903,853) |
|
|
|
Net Assets | ||
Beginning of period | 2,602,605,699 | 4,375,509,552 |
End of period (including accumulated net investment loss of $8,084 and accumulated net investment loss of $129,693,237, respectively) | $ 1,500,598,320 | $ 2,602,605,699 |
See accompanying notes which are an integral part of the Consolidated financial statements.
Annual Report
Consolidated Financial Highlights - Class A
Years ended February 28, | 2014 | 2013 | 2012 H | 2011 | 2010 |
Selected Per-Share Data |
|
|
|
|
|
Net asset value, beginning of period | $ 30.25 | $ 45.37 | $ 50.92 | $ 40.50 | $ 30.45 |
Income from Investment Operations |
|
|
|
|
|
Net investment income (loss) C | - I | .07 | (.13) | (.30) | (.25) |
Net realized and unrealized gain (loss) | (8.25) | (15.19) | (2.83) | 15.28 | 11.00 |
Total from investment operations | (8.25) | (15.12) | (2.96) | 14.98 | 10.75 |
Distributions from net realized gain | - | - | (2.59) | (4.57) | (.71) |
Redemption fees added to paid in capital C | .01 | - I | - I | .01 | .01 |
Net asset value, end of period | $ 22.01 | $ 30.25 | $ 45.37 | $ 50.92 | $ 40.50 |
Total Return A, B | (27.24)% | (33.33)% | (6.24)% | 36.99% | 35.19% |
Ratios to Average Net Assets D, G |
|
|
|
|
|
Expenses before reductions | 1.21% | 1.18% | 1.14% | 1.16% | 1.21% |
Expenses net of fee waivers, if any | 1.19% | 1.17% | 1.14% | 1.15% | 1.19% |
Expenses net of all reductions | 1.18% | 1.17% | 1.14% | 1.14% | 1.17% |
Net investment income (loss) | -% F | .18% | (.28)% | (.63)% | (.63)% |
Supplemental Data |
|
|
|
|
|
Net assets, end of period (000 omitted) | $ 60,270 | $ 101,202 | $ 152,969 | $ 149,178 | $ 82,413 |
Portfolio turnover rate E | 56% | 18% | 22% | 35% | 46% |
ATotal returns would have been lower if certain expenses had not been reduced during the applicable periods shown. BTotal returns do not include the effect of the sales charges. CCalculated based on average shares outstanding during the period. DFees and expenses of any underlying Fidelity Central Funds are not included in the Fund's expense ratio. The Fund indirectly bears its proportionate share of the expenses of any underlying Fidelity Central Funds. EAmount does not include the portfolio activity of any underlying Fidelity Central Funds. FAmount represents less than .01%. GExpense ratios reflect operating expenses of the class. Expenses before reductions do not reflect amounts reimbursed by the investment adviser or reductions from brokerage service arrangements or reductions from other expense offset arrangements and do not represent the amount paid by the class during periods when reimbursements or reductions occur. Expenses net of fee waivers reflect expenses after reimbursement by the investment adviser but prior to reductions from brokerage service arrangements or other expense offset arrangements. Expenses net of all reductions represent the net expenses paid by the class. HFor the year ended February 29. IAmount represents less than $.01 per share. |
Consolidated Financial Highlights - Class T
Years ended February 28, | 2014 | 2013 | 2012 G | 2011 | 2010 |
Selected Per-Share Data |
|
|
|
|
|
Net asset value, beginning of period | $ 29.95 | $ 45.04 | $ 50.68 | $ 40.34 | $ 30.36 |
Income from Investment Operations |
|
|
|
|
|
Net investment income (loss) C | (.06) | (.03) | (.27) | (.43) | (.36) |
Net realized and unrealized gain (loss) | (8.17) | (15.06) | (2.80) | 15.21 | 10.96 |
Total from investment operations | (8.23) | (15.09) | (3.07) | 14.78 | 10.60 |
Distributions from net realized gain | - | - | (2.57) | (4.45) | (.63) |
Redemption fees added to paid in capital C | .01 | - H | - H | .01 | .01 |
Net asset value, end of period | $ 21.73 | $ 29.95 | $ 45.04 | $ 50.68 | $ 40.34 |
Total Return A, B | (27.45)% | (33.50)% | (6.49)% | 36.62% | 34.79% |
Ratios to Average Net Assets D, F |
|
|
|
|
|
Expenses before reductions | 1.49% | 1.45% | 1.43% | 1.44% | 1.51% |
Expenses net of fee waivers, if any | 1.47% | 1.44% | 1.42% | 1.42% | 1.49% |
Expenses net of all reductions | 1.46% | 1.44% | 1.42% | 1.42% | 1.47% |
Net investment income (loss) | (.28)% | (.09)% | (.57)% | (.90)% | (.93)% |
Supplemental Data |
|
|
|
|
|
Net assets, end of period (000 omitted) | $ 18,402 | $ 24,913 | $ 40,664 | $ 45,846 | $ 26,256 |
Portfolio turnover rate E | 56% | 18% | 22% | 35% | 46% |
ATotal returns would have been lower if certain expenses had not been reduced during the applicable periods shown. BTotal returns do not include the effect of the sales charges. CCalculated based on average shares outstanding during the period. DFees and expenses of any underlying Fidelity Central Funds are not included in the Fund's expense ratio. The Fund indirectly bears its proportionate share of the expenses of any underlying Fidelity Central Funds. EAmount does not include the portfolio activity of any underlying Fidelity Central Funds. FExpense ratios reflect operating expenses of the class. Expenses before reductions do not reflect amounts reimbursed by the investment adviser or reductions from brokerage service arrangements or reductions from other expense offset arrangements and do not represent the amount paid by the class during periods when reimbursements or reductions occur. Expenses net of fee waivers reflect expenses after reimbursement by the investment adviser but prior to reductions from brokerage service arrangements or other expense offset arrangements. Expenses net of all reductions represent the net expenses paid by the class. GFor the year ended February 29. HAmount represents less than $.01 per share. |
See accompanying notes which are an integral part of the Consolidated financial statements.
Annual Report
Consolidated Financial Highlights - Class B
Years ended February 28, | 2014 | 2013 | 2012 G | 2011 | 2010 |
Selected Per-Share Data |
|
|
|
|
|
Net asset value, beginning of period | $ 29.27 | $ 44.24 | $ 50.02 | $ 39.87 | $ 30.08 |
Income from Investment Operations |
|
|
|
|
|
Net investment income (loss) C | (.16) | (.21) | (.49) | (.66) | (.55) |
Net realized and unrealized gain (loss) | (7.98) | (14.76) | (2.76) | 15.02 | 10.84 |
Total from investment operations | (8.14) | (14.97) | (3.25) | 14.36 | 10.29 |
Distributions from net realized gain | - | - | (2.53) | (4.21) | (.51) |
Redemption fees added to paid in capital C | .01 | - H | - H | - H | .01 |
Net asset value, end of period | $ 21.14 | $ 29.27 | $ 44.24 | $ 50.02 | $ 39.87 |
Total Return A, B | (27.78)% | (33.84)% | (6.95)% | 35.97% | 34.12% |
Ratios to Average Net Assets D, F |
|
|
|
|
|
Expenses before reductions | 1.95% | 1.93% | 1.90% | 1.93% | 2.00% |
Expenses net of fee waivers, if any | 1.93% | 1.92% | 1.90% | 1.92% | 1.98% |
Expenses net of all reductions | 1.93% | 1.91% | 1.90% | 1.91% | 1.96% |
Net investment income (loss) | (.75)% | (.57)% | (1.04)% | (1.39)% | (1.42)% |
Supplemental Data |
|
|
|
|
|
Net assets, end of period (000 omitted) | $ 4,373 | $ 9,423 | $ 20,894 | $ 26,837 | $ 18,340 |
Portfolio turnover rate E | 56% | 18% | 22% | 35% | 46% |
ATotal returns would have been lower if certain expenses had not been reduced during the applicable periods shown. BTotal returns do not include the effect of the contingent deferred sales charge. CCalculated based on average shares outstanding during the period. DFees and expenses of any underlying Fidelity Central Funds are not included in the Fund's expense ratio. The Fund indirectly bears its proportionate share of the expenses of any underlying Fidelity Central Funds. EAmount does not include the portfolio activity of any underlying Fidelity Central Funds. FExpense ratios reflect operating expenses of the class. Expenses before reductions do not reflect amounts reimbursed by the investment adviser or reductions from brokerage service arrangements or reductions from other expense offset arrangements and do not represent the amount paid by the class during periods when reimbursements or reductions occur. Expenses net of fee waivers reflect expenses after reimbursement by the investment adviser but prior to reductions from brokerage service arrangements or other expense offset arrangements. Expenses net of all reductions represent the net expenses paid by the class. GFor the year ended February 29. HAmount represents less than $.01 per share. |
Consolidated Financial Highlights - Class C
Years ended February 28, | 2014 | 2013 | 2012 G | 2011 | 2010 |
Selected Per-Share Data |
|
|
|
|
|
Net asset value, beginning of period | $ 29.15 | $ 44.05 | $ 49.81 | $ 39.75 | $ 30.00 |
Income from Investment Operations |
|
|
|
|
|
Net investment income (loss) C | (.16) | (.20) | (.47) | (.64) | (.53) |
Net realized and unrealized gain (loss) | (7.94) | (14.70) | (2.76) | 14.98 | 10.80 |
Total from investment operations | (8.10) | (14.90) | (3.23) | 14.34 | 10.27 |
Distributions from net realized gain | - | - | (2.53) | (4.28) | (.53) |
Redemption fees added to paid in capital C | .01 | - H | - H | - H | .01 |
Net asset value, end of period | $ 21.06 | $ 29.15 | $ 44.05 | $ 49.81 | $ 39.75 |
Total Return A, B | (27.75)% | (33.83)% | (6.93)% | 36.01% | 34.15% |
Ratios to Average Net Assets D, F |
|
|
|
|
|
Expenses before reductions | 1.96% | 1.93% | 1.87% | 1.89% | 1.97% |
Expenses net of fee waivers, if any | 1.94% | 1.92% | 1.87% | 1.88% | 1.95% |
Expenses net of all reductions | 1.93% | 1.91% | 1.87% | 1.87% | 1.93% |
Net investment income (loss) | (.76)% | (.57)% | (1.01)% | (1.35)% | (1.39)% |
Supplemental Data |
|
|
|
|
|
Net assets, end of period (000 omitted) | $ 33,811 | $ 37,787 | $ 67,996 | $ 72,431 | $ 38,624 |
Portfolio turnover rate E | 56% | 18% | 22% | 35% | 46% |
ATotal returns would have been lower if certain expenses had not been reduced during the applicable periods shown. BTotal returns do not include the effect of the contingent deferred sales charge. CCalculated based on average shares outstanding during the period. DFees and expenses of any underlying Fidelity Central Funds are not included in the Fund's expense ratio. The Fund indirectly bears its proportionate share of the expenses of any underlying Fidelity Central Funds. EAmount does not include the portfolio activity of any underlying Fidelity Central Funds. FExpense ratios reflect operating expenses of the class. Expenses before reductions do not reflect amounts reimbursed by the investment adviser or reductions from brokerage service arrangements or reductions from other expense offset arrangements and do not represent the amount paid by the class during periods when reimbursements or reductions occur. Expenses net of fee waivers reflect expenses after reimbursement by the investment adviser but prior to reductions from brokerage service arrangements or other expense offset arrangements. Expenses net of all reductions represent the net expenses paid by the class. GFor the year ended February 29. HAmount represents less than $.01 per share. |
See accompanying notes which are an integral part of the Consolidated financial statements.
Annual Report
Consolidated Financial Highlights - Gold
Years ended February 28, | 2014 | 2013 | 2012 F | 2011 | 2010 |
Selected Per-Share Data |
|
|
|
|
|
Net asset value, beginning of period | $ 30.72 | $ 45.96 | $ 51.44 | $ 40.85 | $ 30.67 |
Income from Investment Operations |
|
|
|
|
|
Net investment income (loss) B | .06 | .16 | (.02) | (.18) | (.16) |
Net realized and unrealized gain (loss) | (8.38) | (15.40) | (2.85) | 15.43 | 11.10 |
Total from investment operations | (8.32) | (15.24) | (2.87) | 15.25 | 10.94 |
Distributions from net realized gain | - | - | (2.61) | (4.67) | (.77) |
Redemption fees added to paid in capital B | .01 | - G | - G | .01 | .01 |
Net asset value, end of period | $ 22.41 | $ 30.72 | $ 45.96 | $ 51.44 | $ 40.85 |
Total Return A | (27.05)% | (33.16)% | (6.00)% | 37.35% | 35.52% |
Ratios to Average Net Assets C, E |
|
|
|
|
|
Expenses before reductions | .94% | .93% | .89% | .91% | .98% |
Expenses net of fee waivers, if any | .92% | .92% | .89% | .90% | .96% |
Expenses net of all reductions | .91% | .92% | .89% | .89% | .94% |
Net investment income (loss) | .27% | .43% | (.03)% | (.37)% | (.40)% |
Supplemental Data |
|
|
|
|
|
Net assets, end of period (000 omitted) | $ 1,275,913 | $ 2,301,019 | $ 3,924,440 | $ 4,250,249 | $ 2,839,664 |
Portfolio turnover rate D | 56% | 18% | 22% | 35% | 46% |
ATotal returns would have been lower if certain expenses had not been reduced during the applicable periods shown. BCalculated based on average shares outstanding during the period. CFees and expenses of any underlying Fidelity Central Funds are not included in the Fund's expense ratio. The Fund indirectly bears its proportionate share of the expenses of any underlying Fidelity Central Funds. DAmount does not include the portfolio activity of any underlying Fidelity Central Funds. EExpense ratios reflect operating expenses of the class. Expenses before reductions do not reflect amounts reimbursed by the investment adviser or reductions from brokerage service arrangements or reductions from other expense offset arrangements and do not represent the amount paid by the class during periods when reimbursements or reductions occur. Expenses net of fee waivers reflect expenses after reimbursement by the investment adviser but prior to reductions from brokerage service arrangements or other expense offset arrangements. Expenses net of all reductions represent the net expenses paid by the class. FFor the year ended February 29. GAmount represents less than $.01 per share. |
Consolidated Financial Highlights - Institutional Class
Years ended February 28, | 2014 | 2013 | 2012 F | 2011 | 2010 |
Selected Per-Share Data |
|
|
|
|
|
Net asset value, beginning of period | $ 30.69 | $ 45.87 | $ 51.32 | $ 40.77 | $ 30.65 |
Income from Investment Operations |
|
|
|
|
|
Net investment income (loss) B | .07 | .20 | .02 | (.15) | (.15) |
Net realized and unrealized gain (loss) | (8.36) | (15.38) | (2.85) | 15.41 | 11.08 |
Total from investment operations | (8.29) | (15.18) | (2.83) | 15.26 | 10.93 |
Distributions from net realized gain | - | - | (2.62) | (4.72) | (.82) |
Redemption fees added to paid in capital B | .01 | - G | - G | .01 | .01 |
Net asset value, end of period | $ 22.41 | $ 30.69 | $ 45.87 | $ 51.32 | $ 40.77 |
Total Return A | (26.98)% | (33.09)% | (5.94)% | 37.45% | 35.50% |
Ratios to Average Net Assets C, E |
|
|
|
|
|
Expenses before reductions | .87% | .84% | .82% | .85% | .95% |
Expenses net of fee waivers, if any | .85% | .83% | .81% | .84% | .93% |
Expenses net of all reductions | .84% | .82% | .81% | .83% | .91% |
Net investment income (loss) | .34% | .52% | .04% | (.31)% | (.37)% |
Supplemental Data |
|
|
|
|
|
Net assets, end of period (000 omitted) | $ 107,830 | $ 128,262 | $ 168,548 | $ 137,246 | $ 38,037 |
Portfolio turnover rate D | 56% | 18% | 22% | 35% | 46% |
ATotal returns would have been lower if certain expenses had not been reduced during the applicable periods shown. BCalculated based on average shares outstanding during the period. CFees and expenses of any underlying Fidelity Central Funds are not included in the Fund's expense ratio. The Fund indirectly bears its proportionate share of the expenses of any underlying Fidelity Central Funds. DAmount does not include the portfolio activity of any underlying Fidelity Central Funds. EExpense ratios reflect operating expenses of the class. Expenses before reductions do not reflect amounts reimbursed by the investment adviser or reductions from brokerage service arrangements or reductions from other expense offset arrangements and do not represent the amount paid by the class during periods when reimbursements or reductions occur. Expenses net of fee waivers reflect expenses after reimbursement by the investment adviser but prior to reductions from brokerage service arrangements or other expense offset arrangements. Expenses net of all reductions represent the net expenses paid by the class. FFor the year ended February 29. GAmount represents less than $.01 per share. |
See accompanying notes which are an integral part of the Consolidated financial statements.
Annual Report
Notes to Consolidated Financial Statements
For the period ended February 28, 2014
1. Organization.
Gold Portfolio (the Fund) is a non-diversified fund of Fidelity Select Portfolios (the Trust) and is authorized to issue an unlimited number of shares. The Trust is registered under the Investment Company Act of 1940, as amended (the 1940 Act), as an open-end management investment company organized as a Massachusetts business trust. The Fund invests primarily in securities of companies whose principal business activities fall within specific industries. The Fund offers Class A, Class T, Class C, Gold and Institutional Class shares, each of which, along with Class B shares, has equal rights as to assets and voting privileges. Class B shares are closed to new accounts and additional purchases, except for exchanges and reinvestments. Each class has exclusive voting rights with respect to matters that affect that class. Class B shares will automatically convert to Class A shares after a holding period of seven years from the initial date of purchase.
2. Consolidated Subsidiary
The Fund invests in certain commodity-related investments through Fidelity Select Gold Cayman Ltd., a wholly owned subsidiary (the "Subsidiary"). As of February 28, 2014, the Fund held an investment of $225,764,683 in the Subsidiary, representing 15.0% of the Fund's net assets.
The financial statements have been consolidated and include accounts of the Fund and the Subsidiary. Accordingly, all inter-company transactions and balances have been eliminated.
3. Investments in Fidelity Central Funds.
The Fund invests in Fidelity Central Funds, which are open-end investment companies generally available only to other investment companies and accounts managed by the investment adviser and its affiliates. The Fund's Consolidated Schedule of Investments lists each of the Fidelity Central Funds held as of period end, if any, as an investment of the Fund, but does not include the underlying holdings of each Fidelity Central Fund. As an Investing Fund, the Fund indirectly bears its proportionate share of the expenses of the underlying Fidelity Central Funds.
The Money Market Central Funds seek preservation of capital and current income and are managed by Fidelity Investments Money Management, Inc. (FIMM), an affiliate of the investment adviser. Annualized expenses of the Money Market Central Funds as of their most recent shareholder report date are less than .01%.
A complete unaudited list of holdings for each Fidelity Central Fund is available upon request or at the Securities and Exchange Commission (the SEC) website at www.sec.gov. In addition, the financial statements of the Fidelity Central Funds, which are not covered by the Fund's Report of Independent Registered Public Accounting Firm, are available on the SEC website or upon request.
4. Significant Accounting Policies.
The consolidated financial statements have been prepared in conformity with accounting principles generally accepted in the United States of America (GAAP), which require management to make certain estimates and assumptions at the date of the financial statements. Actual results could differ from those estimates. Subsequent events, if any, through the date that the consolidated financial statements were issued have been evaluated in the preparation of the consolidated financial statements. The following summarizes the significant accounting policies of the Fund:
Investment Valuation. Investments are valued as of 4:00 p.m. Eastern time on the last calendar day of the period. In accordance with valuation policies and procedures approved by the Board of Trustees (the Board), the Fund attempts to obtain prices from one or more third party pricing vendors or brokers to value its investments. When current market prices, quotations or currency exchange rates are not readily available or reliable, investments will be fair valued in good faith by the Fidelity SelectCo, LLC (SelectCo) Fair Value Committee (the Committee), in accordance with procedures adopted by the Board. Factors used in determining fair value vary by investment type and may include market or investment specific events. The frequency with which these procedures are used cannot be predicted and they may be utilized to a significant extent. The Committee oversees the Fund's valuation policies and procedures and is responsible for approving and reporting to the Board all fair value determinations.
The Fund categorizes the inputs to valuation techniques used to value its investments into a disclosure hierarchy consisting of three levels as shown below:
Level 1 - quoted prices in active markets for identical investments
Level 2 - other significant observable inputs (including quoted prices for similar investments, interest rates, prepayment speeds, etc.)
Level 3 - unobservable inputs (including the Fund's own assumptions based on the best information available)
Valuation techniques used to value the Fund's investments by major category are as follows:
Equity securities, including restricted securities, for which market quotations are readily available, are valued at the last reported sale price or official closing price as reported by a third party pricing vendor on the primary market or exchange on which they are traded and are categorized as Level 1 in
Annual Report
Notes to Consolidated Financial Statements - continued
4. Significant Accounting Policies - continued
Investment Valuation - continued
the hierarchy. In the event there were no sales during the day or closing prices are not available, securities are valued at the last quoted bid price or may be valued using the last available price and are generally categorized as Level 2 in the hierarchy. For foreign equity securities, when market or security specific events arise, comparisons to the valuation of American Depositary Receipts (ADRs), futures contracts, Exchange-Traded Funds (ETFs) and certain indexes as well as quoted prices for similar securities may be used and would be categorized as Level 2 in the hierarchy. Utilizing these techniques may result in transfers between Level 1 and Level 2. For equity securities, including restricted securities, where observable inputs are limited, assumptions about market activity and risk are used and these securities may be categorized as Level 3 in the hierarchy.
Investments in commodities are valued at their last traded price at 4:00 p.m. Eastern time each business day and are categorized as Level 1 in the hierarchy.
Investments in open-end mutual funds, including the Fidelity Central Funds, are valued at their closing net asset value (NAV) each business day and are categorized as Level 1 in the hierarchy.
Changes in valuation techniques may result in transfers in or out of an assigned level within the disclosure hierarchy. The aggregate value of investments by input level, as of February 28, 2014, is included at the end of the Fund's Consolidated Schedule of Investments.
Foreign Currency. The Fund may use foreign currency contracts to facilitate transactions in foreign-denominated securities. Gains and losses from these transactions may arise from changes in the value of the foreign currency or if the counterparties do not perform under the contracts' terms.
Foreign-denominated assets, including investment securities, and liabilities are translated into U.S. dollars at the exchange rates at period end. Purchases and sales of investment securities, income and dividends received and expenses denominated in foreign currencies are translated into U.S. dollars at the exchange rate in effect on the transaction date.
The effects of exchange rate fluctuations on investments are included with the net realized and unrealized gain (loss) on investment securities. Other foreign currency transactions resulting in realized and unrealized gain (loss) are disclosed separately.
Investment Transactions and Income. For financial reporting purposes, the Fund's investment holdings and NAV include trades executed through the end of the last business day of the period. The NAV per share for processing shareholder transactions is calculated as of the close of business of the New York Stock Exchange (NYSE), normally 4:00 p.m. Eastern time and includes trades executed through the end of the prior business day. Gains and losses on securities sold are determined on the basis of identified cost and may include proceeds received from litigation. Dividend income is recorded on the ex-dividend date, except for certain dividends from foreign securities where the ex-dividend date may have passed, which are recorded as soon as the Fund is informed of the ex-dividend date. Non-cash dividends included in dividend income, if any, are recorded at the fair market value of the securities received. Distributions received on securities that represent a return of capital or capital gain are recorded as a reduction of cost of investments and/or as a realized gain. Subsequent to ex-dividend date the Fund determines the components of these distributions, based upon receipt of tax filings or other correspondence relating to the underlying investment. Interest income and distributions from the Fidelity Central Funds are accrued as earned. Interest income includes coupon interest and amortization of premium and accretion of discount on debt securities. Investment income is recorded net of foreign taxes withheld where recovery of such taxes is uncertain.
Class Allocations and Expenses. Investment income, realized and unrealized capital gains and losses, common expenses of the Fund, and certain fund-level expense reductions, if any, are allocated daily on a pro-rata basis to each class based on the relative net assets of each class to the total net assets of the Fund. Each class differs with respect to transfer agent and distribution and service plan fees incurred. Certain expense reductions may also differ by class. For the reporting period, the allocated portion of income and expenses to each class as a percent of its average net assets may vary due to the timing of recording these transactions in relation to fluctuating net assets of the classes. Expenses directly attributable to a fund are charged to that fund. Expenses attributable to more than one fund are allocated among the respective funds on the basis of relative net assets or other appropriate methods. Expense estimates are accrued in the period to which they relate and adjustments are made when actual amounts are known.
Deferred Trustee Compensation. Under a Deferred Compensation Plan (the Plan), independent Trustees may elect to defer receipt of a portion of their annual compensation. Deferred amounts are invested in a cross-section of Fidelity funds, are marked-to-market and remain in the Fund until distributed in accordance with the Plan. The investment of deferred amounts and the offsetting payable to the Trustees are included in the accompanying Consolidated Statement of Assets and Liabilities.
Income Tax Information and Distributions to Shareholders. Each year, the Fund intends to qualify as a regulated investment company under Subchapter M of the Internal Revenue Code, including distributing substantially all of its taxable income and realized gains. As a result, no provision for U.S. Federal income taxes is required. As of February 28, 2014, the Fund did not have any unrecognized tax benefits in the consolidated financial statements; nor is the Fund aware of any tax positions for which it is reasonably possible that the total amounts of unrecognized tax benefits will significantly change in the next twelve months. The Fund files a U.S. federal tax return, in addition to state and local tax returns as required. The Fund's federal income tax returns are subject to examination by the Internal Revenue Service (IRS) for a period of three fiscal years after they are filed. State and local tax returns may be subject to examination for an additional fiscal year depending on the jurisdiction. Foreign taxes are provided for based on the Fund's understanding of the tax rules and rates that exist in the foreign markets in which it invests.
Annual Report
4. Significant Accounting Policies - continued
Income Tax Information and Distributions to Shareholders - continued
The Subsidiary is classified as a controlled foreign corporation under Subchapter N of the Internal Revenue Code. Therefore, the Fund is required to increase its taxable income by its share of the Subsidiary's income. Net investment losses of the Subsidiary cannot be deducted by the Fund in the current period nor carried forward to offset taxable income in future periods.
Distributions are declared and recorded on the ex-dividend date. Income dividends and capital gain distributions are declared separately for each class. Income and capital gain distributions are determined in accordance with income tax regulations, which may differ from GAAP.
Capital accounts within the consolidated financial statements are adjusted for permanent book-tax differences. These adjustments have no impact on net assets or the results of operations. Capital accounts are not adjusted for temporary book-tax differences which will reverse in a subsequent period.
Book-tax differences are primarily due to foreign currency transactions, passive foreign investment companies (PFIC), controlled foreign corporation, deferred trustees compensation, net operating losses and losses deferred due to wash sales and excise tax regulations.
The federal tax cost of investment securities and unrealized appreciation (depreciation) as of period end on an unconsolidated basis were as follows:
Gross unrealized appreciation | $ 176,511,772 |
Gross unrealized depreciation | (654,568,628) |
Net unrealized appreciation (depreciation) on securities and other investments | $ (478,056,856) |
|
|
Tax Cost | $ 2,167,083,719 |
The tax-based components of distributable earnings as of period end were as follows:
Capital loss carryforward | (756,775,673) |
Net unrealized appreciation (depreciation) | $ (478,053,861) |
Capital loss carryforwards are only available to offset future capital gains of the Fund to the extent provided by regulations and may be limited. Under the Regulated Investment Company Modernization Act of 2010 (the Act), the Fund is permitted to carry forward capital losses incurred in taxable years beginning after December 22, 2010 for an unlimited period and such capital losses are required to be used prior to any losses that expire. The capital loss carryforward information presented below, including any applicable limitation, is estimated as of fiscal period end and is subject to adjustment.
No expiration |
|
Short-term | $ (124,603,254) |
Long-term | (632,172,419) |
Total capital loss carryforward | $ (756,775,673) |
Trading (Redemption) Fees. Shares held by investors in the Fund less than 30 days may be subject to a redemption fee equal to .75% of the NAV of shares redeemed. All redemption fees, which reduce the proceeds of the shareholder redemption, are retained by the Fund and accounted for as an addition to paid in capital.
Restricted Securities. The Fund may invest in securities that are subject to legal or contractual restrictions on resale. These securities generally may be resold in transactions exempt from registration or to the public if the securities are registered. Disposal of these securities may involve time-consuming negotiations and expense, and prompt sale at an acceptable price may be difficult. Information regarding restricted securities is included at the end of the Fund's Consolidated Schedule of Investments.
5. Purchases and Sales of Investments.
Purchases and sales of securities, other than short-term securities, aggregated $858,721,529 and $1,325,762,629, respectively.
Annual Report
Notes to Consolidated Financial Statements - continued
6. Fees and Other Transactions with Affiliates.
Management Fee. Effective August 1, 2013, SelectCo replaced Fidelity Management and Research Company (FMR), an affiliate of SelectCo, as investment adviser to the Fund. The investment adviser and its affiliates provide the Fund with investment management related services for which the Fund pays a monthly management fee. The management fee is the sum of an individual fund fee rate that is based on an annual rate of .30% of the Fund's average net assets and an annualized group fee rate that averaged .25% during the period. The group fee rate is based upon the average net assets of all the mutual funds advised by FMR and the investment adviser. The group fee rate decreases as assets under management increase and increases as assets under management decrease.
FMR, either through itself or through an affiliate provides investment management related services to the Subsidiary for which the Subsidiary pays a monthly management fee at the annual rate of .30% of its net assets. Under the management contract with the subsidiary, FMR pays all other expenses of the Subsidiary, except custodian fees.
For the reporting period, the total consolidated annual management fee rate which includes the management fee of the Fund and the Subsidiary was .58% of the Fund's average net assets.
During the period, the investment adviser waived a portion of the Fund's management fee representing the amount of the management fee paid by the Subsidiary to FMR as described in the Expense Reductions note.
Distribution and Service Plan Fees. In accordance with Rule 12b-1 of the 1940 Act, the Fund has adopted separate Distribution and Service Plans for each class of shares. Certain classes pay Fidelity Distributors Corporation (FDC), an affiliate of the investment adviser, separate Distribution and Service Fees, each of which is based on an annual percentage of each class' average net assets. In addition, FDC may pay financial intermediaries for selling shares of the Fund and providing shareholder support services. For the period, the Distribution and Service Fee rates, total fees and amounts retained by FDC were as follows:
| Distribution | Service | Total Fees | Retained |
Class A | -% | .25% | $ 161,900 | $ 1,074 |
Class T | .25% | .25% | 88,960 | 381 |
Class B | .75% | .25% | 54,419 | 40,947 |
Class C | .75% | .25% | 267,675 | 52,061 |
|
|
| $ 572,954 | $ 94,463 |
Sales Load. FDC may receive a front-end sales charge of up to 5.75% for selling Class A shares and 3.50% for selling Class T shares, some of which is paid to financial intermediaries for selling shares of the Fund. Depending on the holding period, FDC may receive contingent deferred sales charges levied on Class A, Class T, Class B, and Class C redemptions. The deferred sales charges range from 5.00% to 1.00% for Class B shares, 1.00% for Class C shares, 1.00% for certain purchases of Class A shares and .25% for certain purchases of Class T shares.
For the period, sales charge amounts retained by FDC were as follows:
| Retained |
Class A | $ 37,429 |
Class T | 9,708 |
Class B* | 26,333 |
Class C* | 6,034 |
| $ 79,504 |
* When Class B and Class C shares are initially sold, FDC pays commissions from its own resources to financial intermediaries through which the sales are made.
Transfer Agent Fees. Fidelity Investments Institutional Operations Company, Inc., (FIIOC), an affiliate of the investment adviser, is the transfer, dividend disbursing and shareholder servicing agent for each class of the Fund. FIIOC receives account fees and asset-based fees that vary according to the account size and type of account of the shareholders of the respective classes of the Fund. FIIOC pays for typesetting, printing and mailing of shareholder reports, except proxy statements.
Annual Report
6. Fees and Other Transactions with Affiliates - continued
Transfer Agent Fees - continued
For the period, transfer agent fees for each applicable class were as follows:
| Amount | % of |
Class A | $ 190,562 | .29 |
Class T | 57,622 | .32 |
Class B | 15,892 | .29 |
Class C | 78,281 | .29 |
Gold | 3,485,369 | .27 |
Institutional Class | 196,508 | .20 |
| $ 4,024,234 |
|
Accounting and Security Lending Fees. Fidelity Service Company, Inc. (FSC), an affiliate of the investment adviser, maintains the Fund's accounting records. The accounting fee is based on the level of average net assets for each month. Under a separate contract, FSC administers the security lending program. The security lending fee is based on the number and duration of lending transactions.
Brokerage Commissions. The Fund placed a portion of its portfolio transactions with brokerage firms which are affiliates of the investment adviser. Brokerage commissions are included in net realized gain (loss) and change in net unrealized appreciation (depreciation) in the Consolidated Statement of Operations. The commissions paid to these affiliated firms were $30,538 for the period.
Interfund Lending Program. Pursuant to an Exemptive Order issued by the SEC, the Fund, along with other registered investment companies having management contracts with FMR or other affiliated entities of FMR, may participate in an interfund lending program. This program provides an alternative credit facility allowing the funds to borrow from, or lend money to, other participating affiliated funds. At period end, there were no interfund loans outstanding. The Fund's activity in this program during the period for which loans were outstanding was as follows:
Borrower or Lender | Average Loan | Weighted Average | Interest |
Borrower | $ 11,641,313 | .34% | $ 3,525 |
7. Committed Line of Credit.
The Fund participates with other funds managed by the investment adviser or an affiliate in a $4.25 billion credit facility (the "line of credit") to be utilized for temporary or emergency purposes to fund shareholder redemptions or for other short-term liquidity purposes. The Fund has agreed to pay commitment fees on its pro-rata portion of the line of credit, which amounted to $3,662 and is reflected in Miscellaneous expenses on the Consolidated Statement of Operations. During the period, there were no borrowings on this line of credit.
8. Security Lending.
The Fund lends portfolio securities through a lending agent from time to time in order to earn additional income. For equity securities, a lending agent is used and may loan securities to certain qualified borrowers, which prior to August 1, 2013 included Fidelity Capital Markets (FCM), a broker-dealer affiliated with the Fund. On the settlement date of the loan, the Fund receives collateral (in the form of U.S. Treasury obligations, letters of credit and/or cash) against the loaned securities and maintains collateral in an amount not less than 100% of the market value of the loaned securities during the period of the loan. The market value of the loaned securities is determined at the close of business of the Fund and any additional required collateral is delivered to the Fund on the next business day. If the borrower defaults on its obligation to return the securities loaned because of insolvency or other reasons, the Fund may apply collateral received from the borrower against the obligation. The Fund may experience delays and costs in recovering the securities loaned. Any cash collateral received is invested in the Fidelity Securities Lending Cash Central Fund. The value of loaned securities and cash collateral at period end are disclosed on the Fund's Consolidated Statement of Assets and Liabilities. At period end, there were no security loans outstanding with FCM. Security lending income represents the income earned on investing cash collateral, less rebates paid to borrowers and any lending agent fees associated with the loan, plus any premium payments received for lending certain types of securities. Security lending income is presented in the Consolidated Statement of Operations as a component of income from Fidelity Central Funds. Total security lending income during the period amounted to $598,267 and includes $70 from securities loaned to FCM.
Annual Report
Notes to Consolidated Financial Statements - continued
9. Expense Reductions.
The investment adviser has contractually agreed to waive the Fund's management fee in an amount equal to the management fee paid by the Subsidiary to FMR. During the period, this waiver reduced the Fund's management fee by $344,911. Commissions paid to certain brokers with whom the investment adviser, or its affiliates, places trades on behalf of the Fund include an amount in addition to trade execution, which may be rebated back to the Fund to offset certain expenses. This amount totaled $79,125 for the period.
In addition, FMR reimbursed a portion of the Fund's operating expenses during the period in the amount of $22,822.
10. Share Transactions.
Transactions for each class of shares were as follows:
| Shares | Dollars | ||
Years ended February 28, | 2014 | 2013 | 2014 | 2013 |
Class A |
|
|
|
|
Shares sold | 1,443,614 | 1,412,697 | $ 31,671,750 | $ 53,420,103 |
Shares redeemed | (2,051,264) | (1,438,620) | (45,809,186) | (53,775,838) |
Net increase (decrease) | (607,650) | (25,923) | $ (14,137,436) | $ (355,735) |
Class T |
|
|
|
|
Shares sold | 364,459 | 284,748 | $ 7,796,316 | $ 10,411,769 |
Shares redeemed | (349,602) | (355,685) | (7,601,870) | (13,010,570) |
Net increase (decrease) | 14,857 | (70,937) | $ 194,446 | $ (2,598,801) |
Class B |
|
|
|
|
Shares sold | 23,041 | 16,804 | $ 484,615 | $ 624,661 |
Shares redeemed | (138,145) | (167,215) | (3,024,154) | (6,101,257) |
Net increase (decrease) | (115,104) | (150,411) | $ (2,539,539) | $ (5,476,596) |
Class C |
|
|
|
|
Shares sold | 877,429 | 311,882 | $ 17,346,606 | $ 11,372,831 |
Shares redeemed | (567,911) | (559,180) | (12,102,759) | (20,004,404) |
Net increase (decrease) | 309,518 | (247,298) | $ 5,243,847 | $ (8,631,573) |
Gold |
|
|
|
|
Shares sold | 32,449,288 | 22,313,552 | $ 718,341,081 | $ 848,495,476 |
Shares redeemed | (50,439,253) | (32,795,078) | (1,182,529,714) | (1,225,752,483) |
Net increase (decrease) | (17,989,965) | (10,481,526) | $ (464,188,633) | $ (377,257,007) |
Institutional Class |
|
|
|
|
Shares sold | 2,126,861 | 1,354,134 | $ 46,661,254 | $ 51,488,741 |
Shares redeemed | (1,494,359) | (849,045) | (32,364,497) | (31,583,828) |
Net increase (decrease) | 632,502 | 505,089 | $ 14,296,757 | $ 19,904,913 |
11. Other.
The Fund's organizational documents provide former and current trustees and officers with a limited indemnification against liabilities arising in connection with the performance of their duties to the Fund. In the normal course of business, the Fund may also enter into contracts that provide general indemnifications. The Fund's maximum exposure under these arrangements is unknown as this would be dependent on future claims that may be made against the Fund. The risk of material loss from such claims is considered remote.
Annual Report
Fidelity Advisor Materials Fund - Class A, T, B and C
Performance: The Bottom Line
Average annual total return reflects the change in the value of an investment, assuming reinvestment of the class' distributions from dividend income and capital gains (the profits earned upon the sale of securities that have grown in value, if any) and assuming a constant rate of performance each year. The $10,000 table and the fund's returns do not reflect the deduction of taxes that a shareholder would pay on fund distributions or the redemption of fund shares. During periods of reimbursement by Fidelity, a fund's total return will be greater than it would be had the reimbursement not occurred. How a fund did yesterday is no guarantee of how it will do tomorrow. Returns reflect the conversion of Class B shares to Class A shares after a maximum of seven years.
Average Annual Total Returns
Periods ended February 28, 2014 | Past 1 | Past 5 | Past 10 |
Class A (incl. 5.75% sales charge) A | 13.53% | 26.36% | 11.79% |
Class T (incl. 3.50% sales charge) B | 15.90% | 26.59% | 11.81% |
Class B (incl. contingent deferred sales charge) C | 14.50% | 26.72% | 11.82% |
Class C (incl. contingent deferred sales charge) D | 18.56% | 26.90% | 11.82% |
A Class A shares bear a 0.25% 12b-1 fee. The initial offering of Class A shares took place on December 12, 2006. Returns prior to December 12, 2006, are those of Materials Portfolio, the original class of the fund, which has no 12b-1 fee. Had Class A's 12b-1 fee been reflected, returns prior to December 12, 2006, would have been lower.
B Class T shares bear a 0.50% 12b-1 fee. The initial offering of Class T shares took place on December 12, 2006. Returns prior to December 12, 2006, are those of Materials Portfolio, the original class of the fund, which has no 12b-1 fee. Had Class T's 12b-1 fee been reflected, returns prior to December 12, 2006, would have been lower.
C Class B shares bear a 1.00% 12b-1 fee. The initial offering of Class B shares took place on December 12, 2006. Returns prior to December 12, 2006, are those of Materials Portfolio, the original class of the fund, which has no 12b-1 fee. Had Class B's 12b-1 fee been reflected, returns prior to December 12, 2006, would have been lower. Class B shares' contingent deferred sales charges included in the past one year, past five years, and past ten years total return figures are 5%, 2%, and 0%, respectively.
D Class C shares bear a 1.00% 12b-1 fee. The initial offering of Class C shares took place on December 12, 2006. Returns prior to December 12, 2006, are those of Materials Portfolio, the original class of the fund, which has no 12b-1 fee. Had Class C's 12b-1 fee been reflected, returns prior to December 12, 2006, would have been lower. Class C shares' contingent deferred sales charges included in the past one year, past five years, and past ten years total return figures are 1%, 0%, and 0%, respectively.
Prior to October 1, 2006, the fund was named Industrial Materials Portfolio, and the fund operated under certain different investment policies and compared its performance to a different additional index. The fund's historical performance may not represent its current investment policies.
$10,000 Over 10 Years
Let's say hypothetically that $10,000 was invested in Fidelity Advisor Materials Fund - Class A on February 29, 2004, and the current 5.75% sales charge was paid. The chart shows how the value of your investment would have changed, and also shows how the S&P 500 Index performed over the same period. See footnote A for additional information regarding the performance of Class A.
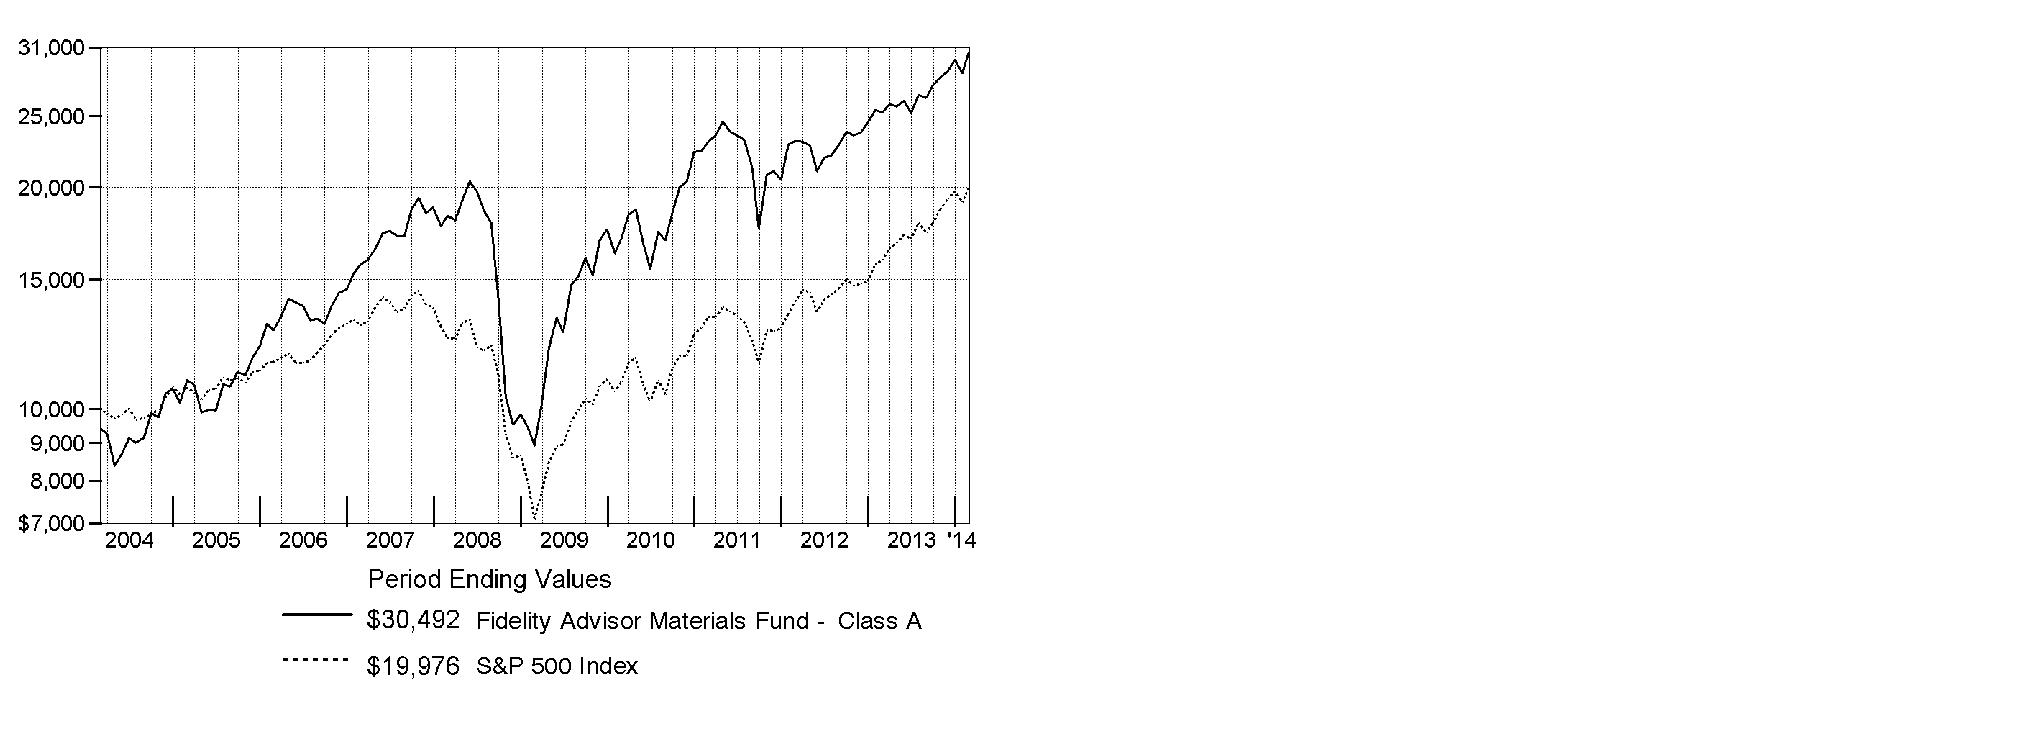
Annual Report
Fidelity Advisor Materials Fund
Management's Discussion of Fund Performance
Market Recap: Stocks overcame fears of higher interest rates - not to mention their worst January in four years - to finish sharply higher for the 12 months ending February 28, 2014. The broad S&P 500® Index and the blue-chip Dow Jones Industrial AverageSM gained 25.37% and 19.01%, respectively, amid generally favorable earnings reports and accommodative monetary policies worldwide. Performance generally increased along the risk spectrum, with smaller-cap and growth strategies leading the way. An ebullient market helped the growth-oriented Nasdaq Composite Index® to a 38.10% period gain, for example. On the other hand, both cyclical and defensive stocks had representation in the top-performing industry sectors: returns were highest in health care and consumer discretionary; lowest in utilities and telecommunication services. From a macroeconomic perspective, data still points to slow but steady improvement in the U.S., and Europe's recession may well be over. Reports from China have disappointed, but continue to suggest a relatively soft landing there. Mixed signals from the U.S. Federal Reserve as to when it might curtail its stimulative bond buying kept markets in flux during the spring and summer. Stocks regained momentum in October despite a federal budget impasse and brief government shutdown, and lower volatility prevailed through year-end. Shedding new-year concerns about China's economy, an emerging-markets sell-off and confirmation (at last) of Fed tapering - alongside confirmation of a presumably dovish Janet Yellen as new Fed chair - February saw stocks back in record territory, bearing down on the five-year anniversary of the market's bottom.
Comments from Tobias Welo, Portfolio Manager of Fidelity Advisor® Materials Fund: For the year, the fund's Class A, Class T, Class B and Class C shares returned 20.46%, 20.10%, 19.50% and 19.56%, respectively (excluding sales charges), trailing the 24.53% advance of the MSCI® U.S. IMI Materials 25-50 Index and also lagging the S&P 500®. Versus the broader market, extreme weakness in gold and other precious metals weighed on the materials sector, while diversified chemicals and specialty chemicals were some of the stronger groups in the MSCI index. The fund's performance versus the MSCI index was held back the most by avoiding two large, strong-performing benchmark constituents, DuPont and Dow Chemical, for nearly the entire period. Both stocks were sold from the fund early in April. Gold miner Goldcorp, based in Canada, also was a significant detractor. Amid a sizable decline in the price of gold and rising exploration and production costs, I sold Goldcorp. Further weighing on our results was commodity chemicals manufacturer Axiall. Coal miner Peabody Energy worked against us as well. Goldcorp and Peabody Energy were not in the index. On the positive side, largely avoiding gold miner and index stock Newmont Mining, which I sold, made this stock easily the fund's largest relative contributor. Within the diversified metals & mining segment, not owning copper producer Freeport-McMoRan Copper & Gold, another index component, worked in our favor, as demand in this market remained lackluster. Positioning in the fertilizers & agricultural chemicals group also aided performance versus the MSCI index. The main performance boost from this group came from not owning weak-performing index stock Mosaic, a phosphate producer. Meanwhile, positioning in CF Industries Holdings, primarily a manufacturer of nitrogen fertilizer products, paid off for the fund.
The views expressed above reflect those of the portfolio manager(s) only through the end of the period as stated on the cover of this report and do not necessarily represent the views of Fidelity or any other person in the Fidelity organization. Any such views are subject to change at any time based upon market or other conditions and Fidelity disclaims any responsibility to update such views. These views may not be relied on as investment advice and, because investment decisions for a Fidelity fund are based on numerous factors, may not be relied on as an indication of trading intent on behalf of any Fidelity fund.
Annual Report
Materials Portfolio
Shareholder Expense Example
As a shareholder of the Fund, you incur two types of costs: (1) transaction costs, including sales charges (loads) on purchase payments or redemption proceeds, redemption fees and (2) ongoing costs, including management fees, distribution and/or service (12b-1) fees and other Fund expenses. This Example is intended to help you understand your ongoing costs (in dollars) of investing in the Fund and to compare these costs with the ongoing costs of investing in other mutual funds.
The Example is based on an investment of $1,000 invested at the beginning of the period and held for the entire period (September 1, 2013 to February 28, 2014).
Actual Expenses
The first line of the accompanying table for each class of the Fund provides information about actual account values and actual expenses. You may use the information in this line, together with the amount you invested, to estimate the expenses that you paid over the period. Simply divide your account value by $1,000.00 (for example, an $8,600 account value divided by $1,000.00 = 8.6), then multiply the result by the number in the first line for a class of the Fund under the heading entitled "Expenses Paid During Period" to estimate the expenses you paid on your account during this period. A small balance maintenance fee of $12.00 that is charged once a year may apply for certain accounts with a value of less than $2,000. This fee is not included in the table below. If it was, the estimate of expenses you paid during the period would be higher, and your ending account value lower, by this amount. In addition, the Fund, as a shareholder in the underlying Fidelity Central Funds, will indirectly bear its pro-rata share of the fees and expenses incurred by the underlying Fidelity Central Funds. These fees and expenses are not included in the Fund's annualized expense ratio used to calculate the expense estimate in the table below.
Hypothetical Example for Comparison Purposes
The second line of the accompanying table for each class of the Fund provides information about hypothetical account values and hypothetical expenses based on a Class' actual expense ratio and an assumed rate of return of 5% per year before expenses, which is not the Class' actual return. The hypothetical account values and expenses may not be used to estimate the actual ending account balance or expenses you paid for the period. You may use this information to compare the ongoing costs of investing in the Fund and other funds. To do so, compare this 5% hypothetical example with the 5% hypothetical examples that appear in the shareholder reports of the other funds. A small balance maintenance fee of $12.00 that is charged once a year may apply for certain accounts with a value of less than $2,000. This fee is not included in the table below. If it was, the estimate of expenses you paid during the period would be higher, and your ending account value lower, by this amount. In addition, the Fund, as a shareholder in the underlying Fidelity Central Funds, will indirectly bear its pro-rata share of the fees and expenses incurred by the underlying Fidelity Central Funds. These fees and expenses are not included in the Fund's annualized expense ratio used to calculate the expense estimate in the table below.
Please note that the expenses shown in the table are meant to highlight your ongoing costs only and do not reflect any transaction costs. Therefore, the second line of the table is useful in comparing ongoing costs only, and will not help you determine the relative total costs of owning different funds. In addition, if these transactional costs were included, your costs would have been higher.
| Annualized | Beginning | Ending | Expenses Paid |
Class A | 1.08% |
|
|
|
Actual |
| $ 1,000.00 | $ 1,152.50 | $ 5.76 |
HypotheticalA |
| $ 1,000.00 | $ 1,019.44 | $ 5.41 |
Class T | 1.39% |
|
|
|
Actual |
| $ 1,000.00 | $ 1,150.80 | $ 7.41 |
HypotheticalA |
| $ 1,000.00 | $ 1,017.90 | $ 6.95 |
Class B | 1.91% |
|
|
|
Actual |
| $ 1,000.00 | $ 1,147.80 | $ 10.17 |
HypotheticalA |
| $ 1,000.00 | $ 1,015.32 | $ 9.54 |
Class C | 1.84% |
|
|
|
Actual |
| $ 1,000.00 | $ 1,148.30 | $ 9.80 |
HypotheticalA |
| $ 1,000.00 | $ 1,015.67 | $ 9.20 |
Materials | .81% |
|
|
|
Actual |
| $ 1,000.00 | $ 1,154.10 | $ 4.33 |
HypotheticalA |
| $ 1,000.00 | $ 1,020.78 | $ 4.06 |
Institutional Class | .80% |
|
|
|
Actual |
| $ 1,000.00 | $ 1,154.10 | $ 4.27 |
HypotheticalA |
| $ 1,000.00 | $ 1,020.83 | $ 4.01 |
A 5% return per year before expenses
B Annualized expense ratio reflects expenses net of applicable fee waivers.
* Expenses are equal to each Class' annualized expense ratio, multiplied by the average account value over the period, multiplied by 181/365 (to reflect the one-half year period).
Annual Report
Materials Portfolio
Investment Changes (Unaudited)
Top Ten Stocks as of February 28, 2014 | ||
| % of fund's | % of fund's net assets |
Monsanto Co. | 9.4 | 9.8 |
LyondellBasell Industries NV Class A | 6.8 | 6.0 |
Praxair, Inc. | 5.6 | 6.1 |
FMC Corp. | 5.4 | 4.8 |
Eastman Chemical Co. | 4.9 | 4.5 |
CF Industries Holdings, Inc. | 4.4 | 1.5 |
Vulcan Materials Co. | 3.9 | 2.9 |
Rock-Tenn Co. Class A | 3.6 | 3.2 |
International Paper Co. | 3.6 | 3.9 |
W.R. Grace & Co. | 3.2 | 2.6 |
| 50.8 | |
Top Industries (% of fund's net assets) | |||
As of February 28, 2014 | |||
| Chemicals | 69.7% |
|
| Containers & Packaging | 9.8% |
|
| Metals & Mining | 6.9% |
|
| Construction Materials | 5.7% |
|
| Paper & Forest Products | 4.7% |
|
| All Others* | 3.2% |
|

As of August 31, 2013 | |||
| Chemicals | 67.1% |
|
| Containers & Packaging | 10.3% |
|
| Metals & Mining | 9.7% |
|
| Paper & Forest Products | 4.7% |
|
| Construction Materials | 4.4% |
|
| All Others* | 3.8% |
|

* Includes short-term investments and net other assets (liabilities). |
Annual Report
Materials Portfolio
Investments February 28, 2014
Showing Percentage of Net Assets
Common Stocks - 99.1% | |||
Shares | Value | ||
CHEMICALS - 69.7% | |||
Commodity Chemicals - 11.7% | |||
Axiall Corp. | 1,153,057 | $ 46,664,217 | |
Cabot Corp. | 968,987 | 52,460,956 | |
LyondellBasell Industries NV Class A | 1,586,496 | 139,738,568 | |
Methanex Corp. | 29,500 | 2,067,371 | |
| 240,931,112 | ||
Diversified Chemicals - 11.5% | |||
Eastman Chemical Co. | 1,144,130 | 100,031,286 | |
FMC Corp. | 1,449,536 | 111,875,188 | |
Lanxess AG | 144,255 | 10,708,414 | |
Olin Corp. (d) | 564,517 | 14,784,700 | |
| 237,399,588 | ||
Fertilizers & Agricultural Chemicals - 16.9% | |||
CF Industries Holdings, Inc. | 360,262 | 90,389,736 | |
Intrepid Potash, Inc. (a)(d) | 719,334 | 10,653,337 | |
Monsanto Co. | 1,753,830 | 192,956,376 | |
Potash Corp. of Saskatchewan, Inc. (d) | 1,647,520 | 54,456,093 | |
| 348,455,542 | ||
Industrial Gases - 7.4% | |||
Airgas, Inc. | 345,096 | 37,201,349 | |
Praxair, Inc. | 886,374 | 115,556,578 | |
| 152,757,927 | ||
Specialty Chemicals - 22.2% | |||
Ashland, Inc. | 294,815 | 27,821,692 | |
Celanese Corp. Class A | 500,993 | 26,748,016 | |
Chemtura Corp. (a) | 635,609 | 15,731,323 | |
Cytec Industries, Inc. | 308,814 | 29,235,421 | |
Ecolab, Inc. | 506,820 | 54,609,855 | |
Ferro Corp. (a) | 119,604 | 1,569,204 | |
H.B. Fuller Co. | 235,851 | 11,434,056 | |
Innospec, Inc. | 175,792 | 7,648,710 | |
NewMarket Corp. | 85,676 | 31,671,847 | |
PPG Industries, Inc. | 234,483 | 46,385,427 | |
Royal DSM NV | 245,999 | 15,719,579 | |
RPM International, Inc. | 411,449 | 17,223,255 | |
Sherwin-Williams Co. | 289,154 | 57,969,594 | |
Sigma Aldrich Corp. | 528,721 | 49,916,550 | |
W.R. Grace & Co. (a) | 646,640 | 65,530,498 | |
| 459,215,027 | ||
TOTAL CHEMICALS | 1,438,759,196 | ||
CONSTRUCTION MATERIALS - 5.7% | |||
Construction Materials - 5.7% | |||
Eagle Materials, Inc. | 426,955 | 37,742,822 | |
Vulcan Materials Co. | 1,163,835 | 79,059,312 | |
| 116,802,134 | ||
| |||
Shares | Value | ||
CONTAINERS & PACKAGING - 9.8% | |||
Metal & Glass Containers - 2.7% | |||
Aptargroup, Inc. | 464,324 | $ 30,724,319 | |
Silgan Holdings, Inc. | 495,965 | 23,910,473 | |
| 54,634,792 | ||
Paper Packaging - 7.1% | |||
Graphic Packaging Holding Co. (a) | 5,033,595 | 51,544,013 | |
MeadWestvaco Corp. | 590,966 | 22,119,857 | |
Rock-Tenn Co. Class A | 659,271 | 73,587,829 | |
| 147,251,699 | ||
TOTAL CONTAINERS & PACKAGING | 201,886,491 | ||
METALS & MINING - 6.9% | |||
Diversified Metals & Mining - 1.4% | |||
Copper Mountain Mining Corp. (a) | 4,161,827 | 8,268,779 | |
First Quantum Minerals Ltd. | 1,065,500 | 20,669,141 | |
| 28,937,920 | ||
Gold - 1.6% | |||
Franco-Nevada Corp. | 199,900 | 10,216,148 | |
Royal Gold, Inc. | 339,504 | 23,327,320 | |
| 33,543,468 | ||
Steel - 3.9% | |||
Carpenter Technology Corp. | 578,733 | 34,232,057 | |
Haynes International, Inc. | 53,562 | 2,652,926 | |
Reliance Steel & Aluminum Co. | 479,827 | 33,242,415 | |
Worthington Industries, Inc. | 256,272 | 10,215,002 | |
| 80,342,400 | ||
TOTAL METALS & MINING | 142,823,788 | ||
OIL, GAS & CONSUMABLE FUELS - 2.3% | |||
Coal & Consumable Fuels - 2.3% | |||
Peabody Energy Corp. | 2,685,037 | 47,149,250 | |
PAPER & FOREST PRODUCTS - 4.7% | |||
Forest Products - 0.3% | |||
Boise Cascade Co. | 242,804 | 7,184,570 | |
Paper Products - 4.4% | |||
International Paper Co. | 1,504,502 | 73,555,103 | |
P.H. Glatfelter Co. | 568,979 | 17,268,513 | |
| 90,823,616 | ||
TOTAL PAPER & FOREST PRODUCTS | 98,008,186 | ||
TOTAL COMMON STOCKS (Cost $1,492,773,571) |
| ||
Convertible Bonds - 0.4% | ||||
| Principal | Value | ||
BUILDING PRODUCTS - 0.4% | ||||
Building Products - 0.4% | ||||
Aspen Aerogels, Inc. 8% 6/1/14 (e) | $ 7,861,200 | $ 7,861,200 | ||
Money Market Funds - 3.6% | |||
Shares |
| ||
Fidelity Cash Central Fund, 0.10% (b) | 8,860,056 | 8,860,056 | |
Fidelity Securities Lending Cash Central Fund, 0.09% (b)(c) | 64,829,475 | 64,829,475 | |
TOTAL MONEY MARKET FUNDS (Cost $73,689,531) |
| ||
TOTAL INVESTMENT PORTFOLIO - 103.1% (Cost $1,574,324,302) | 2,126,979,776 | ||
NET OTHER ASSETS (LIABILITIES) - (3.1)% | (63,524,892) | ||
NET ASSETS - 100% | $ 2,063,454,884 | ||
Legend |
(a) Non-income producing |
(b) Affiliated fund that is generally available only to investment companies and other accounts managed by Fidelity Investments. The rate quoted is the annualized seven-day yield of the fund at period end. A complete unaudited listing of the fund's holdings as of its most recent quarter end is available upon request. In addition, each Fidelity Central Fund's financial statements, which are not covered by the Fund's Report of Independent Registered Public Accounting Firm, are available on the SEC's website or upon request. |
(c) Investment made with cash collateral received from securities on loan. |
(d) Security or a portion of the security is on loan at period end. |
(e) Restricted securities - Investment in securities not registered under the Securities Act of 1933 (excluding 144A issues). At the end of the period, the value of restricted securities (excluding 144A issues) amounted to $7,861,200 or 0.4% of net assets. |
Additional information on each restricted holding is as follows: |
Security | Acquisition Date | Acquisition Cost |
Aspen Aerogels, Inc. 8% 6/1/14 | 6/1/11 | $ 7,861,200 |
Affiliated Central Funds |
Information regarding fiscal year to date income earned by the Fund from investments in Fidelity Central Funds is as follows: |
Fund | Income earned |
Fidelity Cash Central Fund | $ 34,198 |
Fidelity Securities Lending Cash Central Fund | 215,485 |
Total | $ 249,683 |
Other Information |
The following is a summary of the inputs used, as of February 28, 2014, involving the Fund's assets and liabilities carried at fair value. The inputs or methodology used for valuing securities may not be an indication of the risk associated with investing in those securities. For more information on valuation inputs, and their aggregation into the levels used in the table below, please refer to the Investment Valuation section in the accompanying Notes to Financial Statements. |
Valuation Inputs at Reporting Date: | ||||
Description | Total | Level 1 | Level 2 | Level 3 |
Investments in Securities: | ||||
Common Stocks | $ 2,045,429,045 | $ 2,045,429,045 | $ - | $ - |
Convertible Bonds | 7,861,200 | - | - | 7,861,200 |
Money Market Funds | 73,689,531 | 73,689,531 | - | - |
Total Investments in Securities: | $ 2,126,979,776 | $ 2,119,118,576 | $ - | $ 7,861,200 |
Distribution of investments by country or territory of incorporation, as a percentage of total net assets, is as follows (Unaudited): |
United States of America | 87.3% |
Netherlands | 7.6% |
Canada | 4.6% |
Others (Individually Less Than 1%) | 0.5% |
| 100.0% |
See accompanying notes which are an integral part of the financial statements.
Annual Report
Materials Portfolio
Financial Statements
Statement of Assets and Liabilities
| February 28, 2014 | |
|
|
|
Assets | ||
Investment in securities, at value (including securities loaned of $61,977,734) - See accompanying schedule: Unaffiliated issuers (cost $1,500,634,771) | $ 2,053,290,245 |
|
Fidelity Central Funds (cost $73,689,531) | 73,689,531 |
|
Total Investments (cost $1,574,324,302) |
| $ 2,126,979,776 |
Receivable for fund shares sold | 3,007,999 | |
Dividends receivable | 3,234,090 | |
Interest receivable | 1,894,269 | |
Distributions receivable from Fidelity Central Funds | 10,136 | |
Prepaid expenses | 9,111 | |
Other receivables | 34,983 | |
Total assets | 2,135,170,364 | |
|
|
|
Liabilities | ||
Payable for investments purchased | $ 2,070,473 | |
Payable for fund shares redeemed | 3,233,447 | |
Accrued management fee | 913,718 | |
Distribution and service plan fees payable | 177,975 | |
Other affiliated payables | 392,628 | |
Other payables and accrued expenses | 97,764 | |
Collateral on securities loaned, at value | 64,829,475 | |
Total liabilities | 71,715,480 | |
|
|
|
Net Assets | $ 2,063,454,884 | |
Net Assets consist of: |
| |
Paid in capital | $ 1,461,775,897 | |
Distributions in excess of net investment income | (815,927) | |
Accumulated undistributed net realized gain (loss) on investments and foreign currency transactions | 49,842,108 | |
Net unrealized appreciation (depreciation) on investments and assets and liabilities in foreign currencies | 552,652,806 | |
Net Assets | $ 2,063,454,884 | |
Statement of Assets and Liabilities - continued
| February 28, 2014 | |
|
|
|
Calculation of Maximum Offering Price Class A: | $ 86.46 | |
|
|
|
Maximum offering price per share (100/94.25 of $86.46) | $ 91.73 | |
Class T: | $ 85.99 | |
|
|
|
Maximum offering price per share (100/96.50 of $85.99) | $ 89.11 | |
Class B: | $ 84.63 | |
|
|
|
Class C: | $ 84.38 | |
|
|
|
Materials: | $ 86.81 | |
|
|
|
Institutional Class: | $ 86.66 | |
A Redemption price per share is equal to net asset value less any applicable contingent deferred sales charge.
See accompanying notes which are an integral part of the financial statements.
Annual Report
Statement of Operations
| Year ended February 28, 2014 | |
|
|
|
Investment Income |
|
|
Dividends |
| $ 26,740,023 |
Interest |
| 793,734 |
Income from Fidelity Central Funds |
| 249,683 |
Total income |
| 27,783,440 |
|
|
|
Expenses | ||
Management fee | $ 9,962,330 | |
Transfer agent fees | 4,003,115 | |
Distribution and service plan fees | 1,856,070 | |
Accounting and security lending fees | 557,577 | |
Custodian fees and expenses | 37,485 | |
Independent trustees' compensation | 34,172 | |
Registration fees | 190,648 | |
Audit | 48,214 | |
Legal | 28,005 | |
Miscellaneous | 19,389 | |
Total expenses before reductions | 16,737,005 | |
Expense reductions | (83,637) | 16,653,368 |
Net investment income (loss) | 11,130,072 | |
Realized and Unrealized Gain (Loss) Net realized gain (loss) on: | ||
Investment securities: |
|
|
Unaffiliated issuers | 105,183,777 | |
Foreign currency transactions | (3,123) | |
Futures contracts | 702,685 | |
Total net realized gain (loss) |
| 105,883,339 |
Change in net unrealized appreciation (depreciation) on: Investment securities | 227,782,826 | |
Assets and liabilities in foreign currencies | 315 | |
Futures contracts | (417,650) | |
Total change in net unrealized appreciation (depreciation) |
| 227,365,491 |
Net gain (loss) | 333,248,830 | |
Net increase (decrease) in net assets resulting from operations | $ 344,378,902 | |
Statement of Changes in Net Assets
| Year ended | Year ended |
Increase (Decrease) in Net Assets |
|
|
Operations |
|
|
Net investment income (loss) | $ 11,130,072 | $ 17,162,906 |
Net realized gain (loss) | 105,883,339 | 19,850,674 |
Change in net unrealized appreciation (depreciation) | 227,365,491 | 92,211,838 |
Net increase (decrease) in net assets resulting from operations | 344,378,902 | 129,225,418 |
Distributions to shareholders from net investment income | (9,652,596) | (15,064,080) |
Distributions to shareholders from net realized gain | (36,877,810) | (31,892,999) |
Total distributions | (46,530,406) | (46,957,079) |
Share transactions - net increase (decrease) | 29,379,358 | 219,532,050 |
Redemption fees | 36,980 | 63,898 |
Total increase (decrease) in net assets | 327,264,834 | 301,864,287 |
|
|
|
Net Assets | ||
Beginning of period | 1,736,190,050 | 1,434,325,763 |
End of period (including distributions in excess of net investment income of $815,927 and undistributed net investment income of $1,139,006, respectively) | $ 2,063,454,884 | $ 1,736,190,050 |
See accompanying notes which are an integral part of the financial statements.
Annual Report
Financial Highlights - Class A
Years ended February 28, | 2014 | 2013 | 2012 J | 2011 | 2010 |
Selected Per-Share Data |
|
|
|
|
|
Net asset value, beginning of period | $ 73.44 | $ 69.23 | $ 69.96 | $ 52.54 | $ 27.65 |
Income from Investment Operations |
|
|
|
|
|
Net investment income (loss) C | .36 | .70 | .40 | 1.08 F | .30 G |
Net realized and unrealized gain (loss) | 14.56 | 5.69 | (.35) | 17.40 | 24.90 |
Total from investment operations | 14.92 | 6.39 | .05 | 18.48 | 25.20 |
Distributions from net investment income | (.30) | (.63) | (.40) | (1.06) | (.32) |
Distributions from net realized gain | (1.60) | (1.55) | (.38) | (.01) | - |
Total distributions | (1.90) | (2.18) | (.78) | (1.07) | (.32) |
Redemption fees added to paid in capital C | - K | - K | - K | .01 | .01 |
Net asset value, end of period | $ 86.46 | $ 73.44 | $ 69.23 | $ 69.96 | $ 52.54 |
Total Return A, B | 20.46% | 9.40% | .21% | 35.33% | 91.25% |
Ratios to Average Net Assets D, H |
|
|
|
|
|
Expenses before reductions | 1.10% | 1.13% | 1.13% | 1.16% | 1.23% |
Expenses net of fee waivers, if any | 1.10% | 1.13% | 1.13% | 1.16% | 1.23% |
Expenses net of all reductions | 1.09% | 1.12% | 1.13% | 1.15% | 1.22% |
Net investment income (loss) | .45% | 1.02% | .61% | 1.81% F | .65% G |
Supplemental Data |
|
|
|
|
|
Net assets, end of period (000 omitted) | $ 336,777 | $ 219,627 | $ 157,781 | $ 124,160 | $ 52,352 |
Portfolio turnover rate E | 53% | 61% | 94% | 87% | 104% I |
ATotal returns would have been lower if certain expenses had not been reduced during the applicable periods shown. BTotal returns do not include the effect of the sales charges. CCalculated based on average shares outstanding during the period. DFees and expenses of any underlying Fidelity Central Funds are not included in the Fund's expense ratio. The Fund indirectly bears its proportionate share of the expenses of any underlying Fidelity Central Funds. EAmount does not include the portfolio activity of any underlying Fidelity Central Funds. FInvestment income per share reflects a large, non-recurring dividend which amounted to $.83 per share. Excluding this non-recurring dividend, the ratio of net investment income (loss) to average net assets would have been .41%. GInvestment income per share reflects a large, non-recurring dividend which amounted to $.10 per share. Excluding this non-recurring dividend, the ratio of net investment income (loss) to average net assets would have been .43%. HExpense ratios reflect operating expenses of the class. Expenses before reductions do not reflect amounts reimbursed by the investment adviser or reductions from brokerage service arrangements or reductions from other expense offset arrangements and do not represent the amount paid by the class during periods when reimbursements or reductions occur. Expenses net of fee waivers reflect expenses after reimbursement by the investment adviser but prior to reductions from brokerage service arrangements or other expense offset arrangements. Expenses net of all reductions represent the net expenses paid by the class. IThe portfolio turnover rate does not include the assets acquired in the merger. JFor the year ended February 29. KAmount represents less than $.01 per share. |
Financial Highlights - Class T
Years ended February 28, | 2014 | 2013 | 2012 J | 2011 | 2010 |
Selected Per-Share Data |
|
|
|
|
|
Net asset value, beginning of period | $ 73.05 | $ 68.91 | $ 69.68 | $ 52.35 | $ 27.56 |
Income from Investment Operations |
|
|
|
|
|
Net investment income (loss) C | .12 | .50 | .21 | .90 F | .16 G |
Net realized and unrealized gain (loss) | 14.48 | 5.66 | (.35) | 17.34 | 24.81 |
Total from investment operations | 14.60 | 6.16 | (.14) | 18.24 | 24.97 |
Distributions from net investment income | (.06) | (.46) | (.25) | (.92) | (.19) |
Distributions from net realized gain | (1.60) | (1.55) | (.38) | - | - |
Total distributions | (1.66) | (2.02) L | (.63) | (.92) | (.19) |
Redemption fees added to paid in capital C | - K | - K | - K | .01 | .01 |
Net asset value, end of period | $ 85.99 | $ 73.05 | $ 68.91 | $ 69.68 | $ 52.35 |
Total Return A, B | 20.10% | 9.10% | (.09)% | 34.98% | 90.70% |
Ratios to Average Net Assets D, H |
|
|
|
|
|
Expenses before reductions | 1.40% | 1.42% | 1.42% | 1.44% | 1.52% |
Expenses net of fee waivers, if any | 1.40% | 1.42% | 1.42% | 1.44% | 1.52% |
Expenses net of all reductions | 1.39% | 1.41% | 1.41% | 1.43% | 1.51% |
Net investment income (loss) | .15% | .73% | .33% | 1.54% F | .35% G |
Supplemental Data |
|
|
|
|
|
Net assets, end of period (000 omitted) | $ 45,223 | $ 37,860 | $ 28,290 | $ 25,570 | $ 14,712 |
Portfolio turnover rate E | 53% | 61% | 94% | 87% | 104% I |
ATotal returns would have been lower if certain expenses had not been reduced during the applicable periods shown. BTotal returns do not include the effect of the sales charges. CCalculated based on average shares outstanding during the period. DFees and expenses of any underlying Fidelity Central Funds are not included in the Fund's expense ratio. The Fund indirectly bears its proportionate share of the expenses of any underlying Fidelity Central Funds. EAmount does not include the portfolio activity of any underlying Fidelity Central Funds. FInvestment income per share reflects a large, non-recurring dividend which amounted to $.83 per share. Excluding this non-recurring dividend, the ratio of net investment income (loss) to average net assets would have been .14%. GInvestment income per share reflects a large, non-recurring dividend which amounted to $.10 per share. Excluding this non-recurring dividend, the ratio of net investment income (loss) to average net assets would have been .14%. HExpense ratios reflect operating expenses of the class. Expenses before reductions do not reflect amounts reimbursed by the investment adviser or reductions from brokerage service arrangements or reductions from other expense offset arrangements and do not represent the amount paid by the class during periods when reimbursements or reductions occur. Expenses net of fee waivers reflect expenses after reimbursement by the investment adviser but prior to reductions from brokerage service arrangements or other expense offset arrangements. Expenses net of all reductions represent the net expenses paid by the class. IThe portfolio turnover rate does not include the assets acquired in the merger. JFor the year ended February 29. KAmount represents less than $.01 per share. LTotal distributions of $2.02 per share is comprised of distributions from net investment income of $.463 and distributions from net realized gain of $1.552 per share. |
See accompanying notes which are an integral part of the financial statements.
Annual Report
Financial Highlights - Class B
Years ended February 28, | 2014 | 2013 | 2012 J | 2011 | 2010 |
Selected Per-Share Data |
|
|
|
|
|
Net asset value, beginning of period | $ 72.21 | $ 68.13 | $ 68.95 | $ 51.86 | $ 27.35 |
Income from Investment Operations |
|
|
|
|
|
Net investment income (loss) C | (.28) | .16 | (.11) | .60 F | (.07) G |
Net realized and unrealized gain (loss) | 14.28 | 5.57 | (.33) | 17.13 | 24.61 |
Total from investment operations | 14.00 | 5.73 | (.44) | 17.73 | 24.54 |
Distributions from net investment income | - | (.10) | - | (.65) | (.04) |
Distributions from net realized gain | (1.58) | (1.55) | (.38) | - | - |
Total distributions | (1.58) | (1.65) | (.38) | (.65) | (.04) |
Redemption fees added to paid in capital C | - K | - K | - K | .01 | .01 |
Net asset value, end of period | $ 84.63 | $ 72.21 | $ 68.13 | $ 68.95 | $ 51.86 |
Total Return A, B | 19.50% | 8.55% | (.57)% | 34.29% | 89.79% |
Ratios to Average Net Assets D, H |
|
|
|
|
|
Expenses before reductions | 1.90% | 1.92% | 1.91% | 1.93% | 2.02% |
Expenses net of fee waivers, if any | 1.90% | 1.92% | 1.91% | 1.93% | 2.02% |
Expenses net of all reductions | 1.90% | 1.91% | 1.91% | 1.92% | 2.01% |
Net investment income (loss) | (.36)% | .24% | (.17)% | 1.04% F | (.15)% G |
Supplemental Data |
|
|
|
|
|
Net assets, end of period (000 omitted) | $ 8,671 | $ 10,218 | $ 11,040 | $ 13,507 | $ 9,538 |
Portfolio turnover rate E | 53% | 61% | 94% | 87% | 104% I |
ATotal returns would have been lower if certain expenses had not been reduced during the applicable periods shown. BTotal returns do not include the effect of the contingent deferred sales charge. CCalculated based on average shares outstanding during the period. DFees and expenses of any underlying Fidelity Central Funds are not included in the Fund's expense ratio. The Fund indirectly bears its proportionate share of the expenses of any underlying Fidelity Central Funds. EAmount does not include the portfolio activity of any underlying Fidelity Central Funds. FInvestment income per share reflects a large, non-recurring dividend which amounted to $.83 per share. Excluding this non-recurring dividend, the ratio of net investment income (loss) to average net assets would have been (.35)%. GInvestment income per share reflects a large, non-recurring dividend which amounted to $.10 per share. Excluding this non-recurring dividend, the ratio of net investment income (loss) to average net assets would have been (.36)%. HExpense ratios reflect operating expenses of the class. Expenses before reductions do not reflect amounts reimbursed by the investment adviser or reductions from brokerage service arrangements or reductions from other expense offset arrangements and do not represent the amount paid by the class during periods when reimbursements or reductions occur. Expenses net of fee waivers reflect expenses after reimbursement by the investment adviser but prior to reductions from brokerage service arrangements or other expense offset arrangements. Expenses net of all reductions represent the net expenses paid by the class. IThe portfolio turnover rate does not include the assets acquired in the merger. JFor the year ended February 29. KAmount represents less than $.01 per share. |
Financial Highlights - Class C
Years ended February 28, | 2014 | 2013 | 2012 J | 2011 | 2010 |
Selected Per-Share Data |
|
|
|
|
|
Net asset value, beginning of period | $ 71.96 | $ 67.98 | $ 68.78 | $ 51.79 | $ 27.31 |
Income from Investment Operations |
|
|
|
|
|
Net investment income (loss) C | (.23) | .18 | (.10) | .61 F | (.06) G |
Net realized and unrealized gain (loss) | 14.23 | 5.55 | (.32) | 17.09 | 24.57 |
Total from investment operations | 14.00 | 5.73 | (.42) | 17.70 | 24.51 |
Distributions from net investment income | - | (.20) | - | (.72) | (.04) |
Distributions from net realized gain | (1.58) | (1.55) | (.38) | - | - |
Total distributions | (1.58) | (1.75) | (.38) | (.72) | (.04) |
Redemption fees added to paid in capital C | - K | - K | - K | .01 | .01 |
Net asset value, end of period | $ 84.38 | $ 71.96 | $ 67.98 | $ 68.78 | $ 51.79 |
Total Return A, B | 19.56% | 8.58% | (.55)% | 34.29% | 89.82% |
Ratios to Average Net Assets D, H |
|
|
|
|
|
Expenses before reductions | 1.85% | 1.89% | 1.89% | 1.93% | 2.01% |
Expenses net of fee waivers, if any | 1.85% | 1.89% | 1.89% | 1.93% | 2.01% |
Expenses net of all reductions | 1.84% | 1.88% | 1.89% | 1.92% | 2.00% |
Net investment income (loss) | (.30)% | .26% | (.15)% | 1.04% F | (.13)% G |
Supplemental Data |
|
|
|
|
|
Net assets, end of period (000 omitted) | $ 106,879 | $ 75,007 | $ 58,296 | $ 46,525 | $ 20,469 |
Portfolio turnover rate E | 53% | 61% | 94% | 87% | 104% I |
ATotal returns would have been lower if certain expenses had not been reduced during the applicable periods shown. BTotal returns do not include the effect of the contingent deferred sales charge. CCalculated based on average shares outstanding during the period. DFees and expenses of any underlying Fidelity Central Funds are not included in the Fund's expense ratio. The Fund indirectly bears its proportionate share of the expenses of any underlying Fidelity Central Funds. EAmount does not include the portfolio activity of any underlying Fidelity Central Funds. FInvestment income per share reflects a large, non-recurring dividend which amounted to $.83 per share. Excluding this non-recurring dividend, the ratio of net investment income (loss) to average net assets would have been (.35)%. GInvestment income per share reflects a large, non-recurring dividend which amounted to $.10 per share. Excluding this non-recurring dividend, the ratio of net investment income (loss) to average net assets would have been (.35)%. HExpense ratios reflect operating expenses of the class. Expenses before reductions do not reflect amounts reimbursed by the investment adviser or reductions from brokerage service arrangements or reductions from other expense offset arrangements and do not represent the amount paid by the class during periods when reimbursements or reductions occur. Expenses net of fee waivers reflect expenses after reimbursement by the investment adviser but prior to reductions from brokerage service arrangements or other expense offset arrangements. Expenses net of all reductions represent the net expenses paid by the class. IThe portfolio turnover rate does not include the assets acquired in the merger. JFor the year ended February 29. KAmount represents less than $.01 per share. |
See accompanying notes which are an integral part of the financial statements.
Annual Report
Financial Highlights - Materials
Years ended February 28, | 2014 | 2013 | 2012 I | 2011 | 2010 |
Selected Per-Share Data |
|
|
|
|
|
Net asset value, beginning of period | $ 73.68 | $ 69.41 | $ 70.11 | $ 52.61 | $ 27.66 |
Income from Investment Operations |
|
|
|
|
|
Net investment income (loss) B | .58 | .90 | .60 | 1.25 E | .43 F |
Net realized and unrealized gain (loss) | 14.63 | 5.71 | (.37) | 17.43 | 24.91 |
Total from investment operations | 15.21 | 6.61 | .23 | 18.68 | 25.34 |
Distributions from net investment income | (.48) | (.79) | (.55) | (1.16) | (.40) |
Distributions from net realized gain | (1.60) | (1.55) | (.38) | (.03) | - |
Total distributions | (2.08) | (2.34) | (.93) | (1.19) | (.40) |
Redemption fees added to paid in capital B | - J | - J | - J | .01 | .01 |
Net asset value, end of period | $ 86.81 | $ 73.68 | $ 69.41 | $ 70.11 | $ 52.61 |
Total Return A | 20.80% | 9.71% | .49% | 35.70% | 91.77% |
Ratios to Average Net Assets C, G |
|
|
|
|
|
Expenses before reductions | .82% | .85% | .85% | .88% | .96% |
Expenses net of fee waivers, if any | .82% | .85% | .85% | .88% | .96% |
Expenses net of all reductions | .82% | .84% | .84% | .87% | .94% |
Net investment income (loss) | .73% | 1.30% | .90% | 2.10% E | .92% F |
Supplemental Data |
|
|
|
|
|
Net assets, end of period (000 omitted) | $ 1,231,942 | $ 1,146,782 | $ 1,089,619 | $ 1,195,371 | $ 604,475 |
Portfolio turnover rate D | 53% | 61% | 94% | 87% | 104% H |
ATotal returns would have been lower if certain expenses had not been reduced during the applicable periods shown. BCalculated based on average shares outstanding during the period. CFees and expenses of any underlying Fidelity Central Funds are not included in the Fund's expense ratio. The Fund indirectly bears its proportionate share of the expenses of any underlying Fidelity Central Funds. DAmount does not include the portfolio activity of any underlying Fidelity Central Funds. EInvestment income per share reflects a large, non-recurring dividend which amounted to $.83 per share. Excluding this non-recurring dividend, the ratio of net investment income (loss) to average net assets would have been .70%. FInvestment income per share reflects a large, non-recurring dividend which amounted to $.10 per share. Excluding this non-recurring dividend, the ratio of net investment income (loss) to average net assets would have been .70%. GExpense ratios reflect operating expenses of the class. Expenses before reductions do not reflect amounts reimbursed by the investment adviser or reductions from brokerage service arrangements or reductions from other expense offset arrangements and do not represent the amount paid by the class during periods when reimbursements or reductions occur. Expenses net of fee waivers reflect expenses after reimbursement by the investment adviser but prior to reductions from brokerage service arrangements or other expense offset arrangements. Expenses net of all reductions represent the net expenses paid by the class. HThe portfolio turnover rate does not include the assets acquired in the merger. IFor the year ended February 29. JAmount represents less than $.01 per share. |
Financial Highlights - Institutional Class
Years ended February 28, | 2014 | 2013 | 2012 I | 2011 | 2010 |
Selected Per-Share Data |
|
|
|
|
|
Net asset value, beginning of period | $ 73.57 | $ 69.35 | $ 70.05 | $ 52.58 | $ 27.66 |
Income from Investment Operations |
|
|
|
|
|
Net investment income (loss) B | .59 | .90 | .60 | 1.28 E | .46 F |
Net realized and unrealized gain (loss) | 14.60 | 5.70 | (.36) | 17.40 | 24.89 |
Total from investment operations | 15.19 | 6.60 | .24 | 18.68 | 25.35 |
Distributions from net investment income | (.50) | (.83) | (.56) | (1.19) | (.44) |
Distributions from net realized gain | (1.60) | (1.55) | (.38) | (.03) | - |
Total distributions | (2.10) | (2.38) | (.94) | (1.22) | (.44) |
Redemption fees added to paid in capital B | - J | - J | - J | .01 | .01 |
Net asset value, end of period | $ 86.66 | $ 73.57 | $ 69.35 | $ 70.05 | $ 52.58 |
Total Return A | 20.81% | 9.71% | .50% | 35.73% | 91.79% |
Ratios to Average Net Assets C, G |
|
|
|
|
|
Expenses before reductions | .81% | .85% | .84% | .86% | .94% |
Expenses net of fee waivers, if any | .81% | .85% | .84% | .86% | .94% |
Expenses net of all reductions | .81% | .84% | .83% | .85% | .93% |
Net investment income (loss) | .74% | 1.30% | .91% | 2.11% E | .94% F |
Supplemental Data |
|
|
|
|
|
Net assets, end of period (000 omitted) | $ 333,963 | $ 246,696 | $ 89,299 | $ 85,130 | $ 13,670 |
Portfolio turnover rate D | 53% | 61% | 94% | 87% | 104% H |
ATotal returns would have been lower if certain expenses had not been reduced during the applicable periods shown. BCalculated based on average shares outstanding during the period. CFees and expenses of any underlying Fidelity Central Funds are not included in the Fund's expense ratio. The Fund indirectly bears its proportionate share of the expenses of any underlying Fidelity Central Funds. DAmount does not include the portfolio activity of any underlying Fidelity Central Funds. EInvestment income per share reflects a large, non-recurring dividend which amounted to $.83 per share. Excluding this non-recurring dividend, the ratio of net investment income (loss) to average net assets would have been .72%. FInvestment income per share reflects a large, non-recurring dividend which amounted to $.10 per share. Excluding this non-recurring dividend, the ratio of net investment income (loss) to average net assets would have been .72%. GExpense ratios reflect operating expenses of the class. Expenses before reductions do not reflect amounts reimbursed by the investment adviser or reductions from brokerage service arrangements or reductions from other expense offset arrangements and do not represent the amount paid by the class during periods when reimbursements or reductions occur. Expenses net of fee waivers reflect expenses after reimbursement by the investment adviser but prior to reductions from brokerage service arrangements or other expense offset arrangements. Expenses net of all reductions represent the net expenses paid by the class. HThe portfolio turnover rate does not include the assets acquired in the merger. IFor the year ended February 29. JAmount represents less than $.01 per share. |
See accompanying notes which are an integral part of the financial statements.
Annual Report
Notes to Financial Statements
For the period ended February 28, 2014
1. Organization.
Materials Portfolio (the Fund) is a non-diversified fund of Fidelity Select Portfolios (the Trust) and is authorized to issue an unlimited number of shares. The Trust is registered under the Investment Company Act of 1940, as amended (the 1940 Act), as an open-end management investment company organized as a Massachusetts business trust. The Fund invests primarily in securities of companies whose principal business activities fall within specific industries. The Fund offers Class A, Class T, Class C, Materials and Institutional Class shares, each of which, along with Class B shares, has equal rights as to assets and voting privileges. Class B shares are closed to new accounts and additional purchases, except for exchanges and reinvestments. Each class has exclusive voting rights with respect to matters that affect that class. Class B shares will automatically convert to Class A shares after a holding period of seven years from the initial date of purchase.
2. Investments in Fidelity Central Funds.
The Fund invests in Fidelity Central Funds, which are open-end investment companies generally available only to other investment companies and accounts managed by the investment adviser and its affiliates. The Fund's Schedule of Investments lists each of the Fidelity Central Funds held as of period end, if any, as an investment of the Fund, but does not include the underlying holdings of each Fidelity Central Fund. As an Investing Fund, the Fund indirectly bears its proportionate share of the expenses of the underlying Fidelity Central Funds.
The Money Market Central Funds seek preservation of capital and current income and are managed by Fidelity Investments Money Management, Inc. (FIMM), an affiliate of the investment adviser. Annualized expenses of the Money Market Central Funds as of their most recent shareholder report date are less than .01%.
A complete unaudited list of holdings for each Fidelity Central Fund is available upon request or at the Securities and Exchange Commission (the SEC) website at www.sec.gov. In addition, the financial statements of the Fidelity Central Funds, which are not covered by the Fund's Report of Independent Registered Public Accounting Firm, are available on the SEC website or upon request.
3. Significant Accounting Policies.
The financial statements have been prepared in conformity with accounting principles generally accepted in the United States of America (GAAP), which require management to make certain estimates and assumptions at the date of the financial statements. Actual results could differ from those estimates. Subsequent events, if any, through the date that the financial statements were issued have been evaluated in the preparation of the financial statements. The following summarizes the significant accounting policies of the Fund:
Investment Valuation. Investments are valued as of 4:00 p.m. Eastern time on the last calendar day of the period. In accordance with valuation policies and procedures approved by the Board of Trustees (the Board), the Fund attempts to obtain prices from one or more third party pricing vendors or brokers to value its investments. When current market prices, quotations or currency exchange rates are not readily available or reliable, investments will be fair valued in good faith by the Fidelity SelectCo, LLC (SelectCo) Fair Value Committee (the Committee), in accordance with procedures adopted by the Board. Factors used in determining fair value vary by investment type and may include market or investment specific events, changes in interest rates and credit quality. The frequency with which these procedures are used cannot be predicted and they may be utilized to a significant extent. The Committee oversees the Fund's valuation policies and procedures and is responsible for approving and reporting to the Board all fair value determinations.
The Fund categorizes the inputs to valuation techniques used to value its investments into a disclosure hierarchy consisting of three levels as shown below:
Level 1 - quoted prices in active markets for identical investments
Level 2 - other significant observable inputs (including quoted prices for similar investments, interest rates, prepayment speeds, etc.)
Level 3 - unobservable inputs (including the Fund's own assumptions based on the best information available)
Valuation techniques used to value the Fund's investments by major category are as follows:
Equity securities, including restricted securities, for which market quotations are readily available, are valued at the last reported sale price or official closing price as reported by a third party pricing vendor on the primary market or exchange on which they are traded and are categorized as Level 1 in the hierarchy. In the event there were no sales during the day or closing prices are not available, securities are valued at the last quoted bid price or may be valued using the last available price and are generally categorized as Level 2 in the hierarchy. For foreign equity securities, when market or security specific events arise, comparisons to the valuation of American Depositary Receipts (ADRs) and certain indexes as well as quoted prices for similar securities may be used and would be categorized as Level 2 in the hierarchy. Utilizing these techniques may result in transfers between Level 1 and Level 2. For equity securities, including restricted securities, where observable inputs are limited, assumptions about market activity and risk are used and these securities may be categorized as Level 3 in the hierarchy.
Annual Report
3. Significant Accounting Policies - continued
Investment Valuation - continued
Debt securities, including restricted securities, are valued based on evaluated prices received from third party pricing vendors or from brokers who make markets in such securities. Corporate bonds, are valued by pricing vendors who utilize matrix pricing which considers yield or price of bonds of comparable quality, coupon, maturity and type or by broker-supplied prices. When independent prices are unavailable or unreliable, debt securities may be valued utilizing pricing methodologies which consider similar factors that would be used by third party pricing vendors. Debt securities are generally categorized as Level 2 in the hierarchy but may be Level 3 depending on the circumstances.
Investments in open-end mutual funds, including the Fidelity Central Funds, are valued at their closing net asset value (NAV) each business day and are categorized as Level 1 in the hierarchy.
Changes in valuation techniques may result in transfers in or out of an assigned level within the disclosure hierarchy. The aggregate value of investments by input level, as of February 28, 2014, is included at the end of the Fund's Schedule of Investments.
Foreign Currency. The Fund may use foreign currency contracts to facilitate transactions in foreign-denominated securities. Gains and losses from these transactions may arise from changes in the value of the foreign currency or if the counterparties do not perform under the contracts' terms.
Foreign-denominated assets, including investment securities, and liabilities are translated into U.S. dollars at the exchange rates at period end. Purchases and sales of investment securities, income and dividends received and expenses denominated in foreign currencies are translated into U.S. dollars at the exchange rate in effect on the transaction date.
The effects of exchange rate fluctuations on investments are included with the net realized and unrealized gain (loss) on investment securities. Other foreign currency transactions resulting in realized and unrealized gain (loss) are disclosed separately.
Investment Transactions and Income. For financial reporting purposes, the Fund's investment holdings and NAV include trades executed through the end of the last business day of the period. The NAV per share for processing shareholder transactions is calculated as of the close of business of the New York Stock Exchange (NYSE), normally 4:00 p.m. Eastern time and includes trades executed through the end of the prior business day. Gains and losses on securities sold are determined on the basis of identified cost and may include proceeds received from litigation. Dividend income is recorded on the ex-dividend date, except for certain dividends from foreign securities where the ex-dividend date may have passed, which are recorded as soon as the Fund is informed of the ex-dividend date. Non-cash dividends included in dividend income, if any, are recorded at the fair market value of the securities received. Distributions received on securities that represent a return of capital or capital gain are recorded as a reduction of cost of investments and/or as a realized gain. Subsequent to ex-dividend date the Fund determines the components of these distributions, based upon receipt of tax filings or other correspondence relating to the underlying investment. Interest income and distributions from the Fidelity Central Funds are accrued as earned. Interest income includes coupon interest and amortization of premium and accretion of discount on debt securities. Investment income is recorded net of foreign taxes withheld where recovery of such taxes is uncertain.
Class Allocations and Expenses. Investment income, realized and unrealized capital gains and losses, common expenses of the Fund, and certain fund-level expense reductions, if any, are allocated daily on a pro-rata basis to each class based on the relative net assets of each class to the total net assets of the Fund. Each class differs with respect to transfer agent and distribution and service plan fees incurred. Certain expense reductions may also differ by class. For the reporting period, the allocated portion of income and expenses to each class as a percent of its average net assets may vary due to the timing of recording these transactions in relation to fluctuating net assets of the classes. Expenses directly attributable to a fund are charged to that fund. Expenses attributable to more than one fund are allocated among the respective funds on the basis of relative net assets or other appropriate methods. Expense estimates are accrued in the period to which they relate and adjustments are made when actual amounts are known.
Deferred Trustee Compensation. Under a Deferred Compensation Plan (the Plan), independent Trustees may elect to defer receipt of a portion of their annual compensation. Deferred amounts are invested in a cross-section of Fidelity funds, are marked-to-market and remain in the Fund until distributed in accordance with the Plan. The investment of deferred amounts and the offsetting payable to the Trustees are included in the accompanying Statement of Assets and Liabilities.
Income Tax Information and Distributions to Shareholders. Each year, the Fund intends to qualify as a regulated investment company under Subchapter M of the Internal Revenue Code, including distributing substantially all of its taxable income and realized gains. As a result, no provision for U.S. Federal income taxes is required. As of February 28, 2014, the Fund did not have any unrecognized tax benefits in the financial statements; nor is the Fund aware of any tax positions for which it is reasonably possible that the total amounts of unrecognized tax benefits will significantly change in the next twelve months. The Fund files a U.S. federal tax return, in addition to state and local tax returns as required. The Fund's federal income tax returns are subject to examination by the Internal Revenue Service (IRS) for a period of three fiscal years after they are filed. State and local tax returns may be subject to examination for an additional fiscal year depending on the jurisdiction. Foreign taxes are provided for based on the Fund's understanding of the tax rules and rates that exist in the foreign markets in which it invests.
Distributions are declared and recorded on the ex-dividend date. Income dividends and capital gain distributions are declared separately for each class. Income and capital gain distributions are determined in accordance with income tax regulations, which may differ from GAAP. In addition, the Fund claimed a portion of the payment made to redeeming shareholders as a distribution for income tax purposes.
Annual Report
Notes to Financial Statements - continued
3. Significant Accounting Policies - continued
Income Tax Information and Distributions to Shareholders - continued
Capital accounts within the financial statements are adjusted for permanent book-tax differences. These adjustments have no impact on net assets or the results of operations. Capital accounts are not adjusted for temporary book-tax differences which will reverse in a subsequent period.
Book-tax differences are primarily due to futures contracts, foreign currency transactions, passive foreign investment companies (PFIC), original issue discount, deferred trustees compensation, capital loss carryforwards and losses deferred due to wash sales and excise tax regulations.
The federal tax cost of investment securities and unrealized appreciation (depreciation) as of period end were as follows:
Gross unrealized appreciation | $ 569,706,695 |
Gross unrealized depreciation | (24,615,148) |
Net unrealized appreciation (depreciation) on securities and other investments | $ 545,091,547 |
|
|
Tax Cost | $ 1,581,888,229 |
The tax-based components of distributable earnings as of period end were as follows:
Undistributed ordinary income | $ 2,483,951 |
Undistributed long-term capital gain | $ 56,642,887 |
Net unrealized appreciation (depreciation) | $ 545,088,879 |
The tax character of distributions paid was as follows:
| February 28, 2014 | February 28, 2013 |
Ordinary Income | $ 10,087,395 | $ 15,064,080 |
Long-term Capital Gains | 36,443,011 | 31,892,999 |
Total | $ 46,530,406 | $ 46,957,079 |
Capital loss carryforwards are only available to offset future capital gains of the Fund to the extent provided by regulations and may be limited. Under the Regulated Investment Company Modernization Act of 2010 (the Act), the Fund is permitted to carry forward capital losses incurred in taxable years beginning after December 22, 2010 for an unlimited period and such capital losses are required to be used prior to any losses that expire. The capital loss carryforward information presented below, including any applicable limitation, is estimated as of prior fiscal period end and is subject to adjustment.
Fiscal year of expiration: |
|
2017 | $ (1,422,248) |
2018 | (1,022,988) |
2019 | (80,787) |
Total with expiration | $ (2,526,023) |
The Fund acquired $2,526,023 of capital loss carryforwards as part of a merger in a prior period. The losses acquired that will be available to offset future capital gains of the Fund will be limited to approximately $611,309 per year.
Trading (Redemption) Fees. Shares held by investors in the Fund less than 30 days may be subject to a redemption fee equal to .75% of the NAV of shares redeemed. All redemption fees, which reduce the proceeds of the shareholder redemption, are retained by the Fund and accounted for as an addition to paid in capital.
Restricted Securities. The Fund may invest in securities that are subject to legal or contractual restrictions on resale. These securities generally may be resold in transactions exempt from registration or to the public if the securities are registered. Disposal of these securities may involve time-consuming negotiations and expense, and prompt sale at an acceptable price may be difficult. Information regarding restricted securities is included at the end of the Fund's Schedule of Investments.
Annual Report
4. Derivative Instruments.
Risk Exposures and the Use of Derivative Instruments. The Fund's investment objective allows the Fund to enter into various types of derivative contracts, including futures contracts. Derivatives are investments whose value is primarily derived from underlying assets, indices or reference rates and may be transacted on an exchange or over-the-counter (OTC). Derivatives may involve a future commitment to buy or sell a specified asset based on specified terms, to exchange future cash flows at periodic intervals based on a notional principal amount, or for one party to make one or more payments upon the occurrence of specified events in exchange for periodic payments from the other party.
The Fund used derivatives to increase returns, to gain exposure to certain types of assets and to manage exposure to certain risks as defined below. The success of any strategy involving derivatives depends on analysis of numerous economic factors, and if the strategies for investment do not work as intended, the Fund may not achieve its objectives.
The Fund's use of derivatives increased or decreased its exposure to the following risk:
Equity Risk | Equity risk relates to the fluctuations in the value of financial instruments as a result of changes in market prices (other than those arising from interest rate risk or foreign exchange risk), whether caused by factors specific to an individual investment, its issuer, or all factors affecting all instruments traded in a market or market segment. |
The Fund is also exposed to additional risks from investing in derivatives, such as liquidity risk and counterparty credit risk. Liquidity risk is the risk that the Fund will be unable to close out the derivative in the open market in a timely manner. Counterparty credit risk is the risk that the counterparty will not be able to fulfill its obligation to the Fund. Counterparty credit risk related to exchange-traded futures contracts may be mitigated by the protection provided by the exchange on which they trade.
Investing in derivatives may involve greater risks than investing in the underlying assets directly and, to varying degrees, may involve risk of loss in excess of any initial investment and collateral received and amounts recognized in the Statement of Assets and Liabilities. In addition, there may be the risk that the change in value of the derivative contract does not correspond to the change in value of the underlying instrument.
Futures Contracts. A futures contract is an agreement between two parties to buy or sell a specified underlying instrument for a fixed price at a specified future date. The Fund used futures contracts to manage its exposure to the stock market.
Upon entering into a futures contract, a fund is required to deposit either cash or securities (initial margin) with a clearing broker in an amount equal to a certain percentage of the face value of the contract. Futures contracts are marked-to-market daily and subsequent daily payments (variation margin) are made or received by a fund depending on the daily fluctuations in the value of the futures contracts and are recorded as unrealized appreciation or (depreciation). This receivable and/or payable, if any, is included in daily variation margin for derivative instruments in the Statement of Assets and Liabilities. Realized gain or (loss) is recorded upon the expiration or closing of a futures contract. The net realized gain (loss) and change in net unrealized appreciation (depreciation) on futures contracts during the period is included in the Statement of Operations.
Any open futures contracts at period end are presented in the Schedule of Investments under the caption "Futures Contracts." The underlying face amount at value reflects each contract's exposure to the underlying instrument or index at period end.
During the period the Fund recognized net realized gain (loss) of $702,685 and a change in net unrealized appreciation (depreciation) of $(417,650) related to its investment in futures contracts. These amounts are included in the Statement of Operations.
5. Purchases and Sales of Investments.
Purchases and sales of securities, other than short-term securities, aggregated $974,328,461 and $946,309,029, respectively.
6. Fees and Other Transactions with Affiliates.
Management Fee. Effective August 1, 2013, SelectCo replaced Fidelity Management and Research Company (FMR), an affiliate of SelectCo, as investment adviser to the Fund. The investment adviser and its affiliates provide the Fund with investment management related services for which the Fund pays a monthly management fee. The management fee is the sum of an individual fund fee rate that is based on an annual rate of .30% of the Fund's average net assets and an annualized group fee rate that averaged .25% during the period. The group fee rate is based upon the average net assets of all the mutual funds advised by FMR and the investment adviser. The group fee rate decreases as assets under management increase and increases as assets under management decrease. For the reporting period, the total annual management fee rate was .55% of the Fund's average net assets.
Annual Report
Notes to Financial Statements - continued
6. Fees and Other Transactions with Affiliates - continued
Distribution and Service Plan Fees. In accordance with Rule 12b-1 of the 1940 Act, the Fund has adopted separate Distribution and Service Plans for each class of shares. Certain classes pay Fidelity Distributors Corporation (FDC), an affiliate of the investment adviser, separate Distribution and Service Fees, each of which is based on an annual percentage of each class' average net assets. In addition, FDC may pay financial intermediaries for selling shares of the Fund and providing shareholder support services. For the period, the Distribution and Service Fee rates, total fees and amounts retained by FDC were as follows:
| Distribution | Service | Total Fees | Retained |
Class A | -% | .25% | $ 668,160 | $ 11,911 |
Class T | .25% | .25% | 197,474 | 1,042 |
Class B | .75% | .25% | 90,429 | 68,170 |
Class C | .75% | .25% | 900,007 | 325,396 |
|
|
| $ 1,856,070 | $ 406,519 |
Sales Load. FDC may receive a front-end sales charge of up to 5.75% for selling Class A shares and 3.50% for selling Class T shares, some of which is paid to financial intermediaries for selling shares of the Fund. Depending on the holding period, FDC may receive contingent deferred sales charges levied on Class A, Class T, Class B, and Class C redemptions. The deferred sales charges range from 5.00% to 1.00% for Class B shares, 1.00% for Class C shares, 1.00% for certain purchases of Class A shares and .25% for certain purchases of Class T shares.
For the period, sales charge amounts retained by FDC were as follows:
| Retained |
Class A | $ 166,569 |
Class T | 13,304 |
Class B* | 19,379 |
Class C* | 16,753 |
| $ 216,005 |
* When Class B and Class C shares are initially sold, FDC pays commissions from its own resources to financial intermediaries through which the sales are made.
Transfer Agent Fees. Fidelity Investments Institutional Operations Company, Inc., (FIIOC), an affiliate of the investment adviser, is the transfer, dividend disbursing and shareholder servicing agent for each class of the Fund. FIIOC receives account fees and asset-based fees that vary according to the account size and type of account of the shareholders of the respective classes of the Fund. FIIOC pays for typesetting, printing and mailing of shareholder reports, except proxy statements.
For the period, transfer agent fees for each class were as follows:
|
| % of |
Class A | $ 648,808 | .24 |
Class T | 115,141 | .29 |
Class B | 27,231 | .30 |
Class C | 218,786 | .24 |
Materials | 2,491,421 | .22 |
Institutional Class | 501,728 | .21 |
| $ 4,003,115 |
|
Accounting and Security Lending Fees. Fidelity Service Company, Inc. (FSC), an affiliate of the investment adviser, maintains the Fund's accounting records. The accounting fee is based on the level of average net assets for each month. Under a separate contract, FSC administers the security lending program. The security lending fee is based on the number and duration of lending transactions.
Brokerage Commissions. The Fund placed a portion of its portfolio transactions with brokerage firms which are affiliates of the investment adviser. Brokerage commissions are included in net realized gain (loss) and change in net unrealized appreciation (depreciation) in the Statement of Operations. The commissions paid to these affiliated firms were $19,613 for the period.
Annual Report
7. Committed Line of Credit.
The Fund participates with other funds managed by the investment adviser or an affiliate in a $4.25 billion credit facility (the "line of credit") to be utilized for temporary or emergency purposes to fund shareholder redemptions or for other short-term liquidity purposes. The Fund has agreed to pay commitment fees on its pro-rata portion of the line of credit, which amounted to $3,473 and is reflected in Miscellaneous expenses on the Statement of Operations. During the period, there were no borrowings on this line of credit.
8. Security Lending.
The Fund lends portfolio securities through a lending agent from time to time in order to earn additional income. For equity securities, a lending agent is used and may loan securities to certain qualified borrowers, which prior to August 1, 2013 included Fidelity Capital Markets (FCM), a broker-dealer affiliated with the Fund. On the settlement date of the loan, the Fund receives collateral (in the form of U.S. Treasury obligations, letters of credit and/or cash) against the loaned securities and maintains collateral in an amount not less than 100% of the market value of the loaned securities during the period of the loan. The market value of the loaned securities is determined at the close of business of the Fund and any additional required collateral is delivered to the Fund on the next business day. If the borrower defaults on its obligation to return the securities loaned because of insolvency or other reasons, the Fund may apply collateral received from the borrower against the obligation. The Fund may experience delays and costs in recovering the securities loaned. Any cash collateral received is invested in the Fidelity Securities Lending Cash Central Fund. The value of loaned securities and cash collateral at period end are disclosed on the Fund's Statement of Assets and Liabilities. Security lending income represents the income earned on investing cash collateral, less rebates paid to borrowers and any lending agent fees associated with the loan, plus any premium payments received for lending certain types of securities. Security lending income is presented in the Statement of Operations as a component of income from Fidelity Central Funds. Total security lending income during the period amounted to $215,485. During the period, there were no securities loaned to FCM.
9. Expense Reductions.
Commissions paid to certain brokers with whom the investment adviser, or its affiliates, places trades on behalf of the Fund include an amount in addition to trade execution, which may be rebated back to the Fund to offset certain expenses. This amount totaled $76,091 for the period. Through arrangements with the Fund's custodian, credits realized as a result of uninvested cash balances were used to reduce the Fund's expenses. During the period, these credits reduced the Fund's custody expenses by $122.
In addition, FMR reimbursed a portion of the Fund's operating expenses during the period in the amount of $7,424.
10. Distributions to Shareholders.
Distributions to shareholders of each class were as follows:
Years ended February 28, | 2014 | 2013 |
From net investment income |
|
|
Class A | $ 1,076,918 | $ 1,631,593 |
Class T | 29,833 | 221,281 |
Class B | - | 14,451 |
Class C | - | 183,511 |
Materials | 6,872,385 | 11,420,509 |
Institutional Class | 1,673,460 | 1,592,735 |
Total | $ 9,652,596 | $ 15,064,080 |
From net realized gain |
|
|
Class A | $ 5,762,988 | $ 3,967,803 |
Class T | 809,850 | 717,303 |
Class B | 165,553 | 228,009 |
Class C | 1,915,182 | 1,411,838 |
Materials | 22,724,072 | 22,783,457 |
Institutional Class | 5,500,165 | 2,784,589 |
Total | $ 36,877,810 | $ 31,892,999 |
Annual Report
Notes to Financial Statements - continued
11. Share Transactions.
Transactions for each class of shares were as follows:
| Shares | Dollars | ||
Years ended February 28, | 2014 | 2013 | 2014 | 2013 |
Class A |
|
|
|
|
Shares sold | 1,797,224 | 1,611,922 | $ 142,257,752 | $ 112,576,195 |
Reinvestment of distributions | 72,401 | 68,775 | 5,951,034 | 4,804,595 |
Shares redeemed | (965,142) | (969,159) | (75,392,440) | (66,285,158) |
Net increase (decrease) | 904,483 | 711,538 | $ 72,816,346 | $ 51,095,632 |
Class T |
|
|
|
|
Shares sold | 170,035 | 205,283 | $ 13,444,901 | $ 14,234,477 |
Reinvestment of distributions | 9,678 | 12,892 | 792,607 | 896,667 |
Shares redeemed | (172,106) | (110,407) | (13,187,903) | (7,498,384) |
Net increase (decrease) | 7,607 | 107,768 | $ 1,049,605 | $ 7,632,760 |
Class B |
|
|
|
|
Shares sold | 7,873 | 21,997 | $ 603,147 | $ 1,493,049 |
Reinvestment of distributions | 1,836 | 3,022 | 148,096 | 207,121 |
Shares redeemed | (48,755) | (45,545) | (3,688,524) | (3,081,508) |
Net increase (decrease) | (39,046) | (20,526) | $ (2,937,281) | $ (1,381,338) |
Class C |
|
|
|
|
Shares sold | 450,706 | 423,105 | $ 34,616,884 | $ 29,248,360 |
Reinvestment of distributions | 19,891 | 19,249 | 1,600,154 | 1,317,196 |
Shares redeemed | (246,286) | (257,585) | (18,989,979) | (17,263,032) |
Net increase (decrease) | 224,311 | 184,769 | $ 17,227,059 | $ 13,302,524 |
Materials |
|
|
|
|
Shares sold | 3,222,449 | 5,306,846 | $ 254,476,294 | $ 372,534,797 |
Reinvestment of distributions | 341,183 | 464,930 | 28,082,183 | 32,543,457 |
Shares redeemed | (4,936,489) | (5,905,812) | (386,209,902) | (406,043,890) |
Net increase (decrease) | (1,372,857) | (134,036) | $ (103,651,425) | $ (965,636) |
Institutional Class |
|
|
|
|
Shares sold | 2,646,562 | 2,986,457 | $ 209,408,784 | $ 212,651,449 |
Reinvestment of distributions | 73,103 | 54,139 | 6,019,071 | 3,797,777 |
Shares redeemed | (2,219,316) | (975,090) | (170,552,801) | (66,601,118) |
Net increase (decrease) | 500,349 | 2,065,506 | $ 44,875,054 | $ 149,848,108 |
12. Other.
The Fund's organizational documents provide former and current trustees and officers with a limited indemnification against liabilities arising in connection with the performance of their duties to the Fund. In the normal course of business, the Fund may also enter into contracts that provide general indemnifications. The Fund's maximum exposure under these arrangements is unknown as this would be dependent on future claims that may be made against the Fund. The risk of material loss from such claims is considered remote.
Annual Report
Fidelity Advisor Telecommunications Fund - Class A, T, B and C
Performance: The Bottom Line
Average annual total return reflects the change in the value of an investment, assuming reinvestment of the class' distributions from dividend income and capital gains (the profits earned upon the sale of securities that have grown in value, if any) and assuming a constant rate of performance each year. The $10,000 table and the fund's returns do not reflect the deduction of taxes that a shareholder would pay on fund distributions or the redemption of fund shares. During periods of reimbursement by Fidelity, a fund's total return will be greater than it would be had the reimbursement not occurred. How a fund did yesterday is no guarantee of how it will do tomorrow. Returns reflect the conversion of Class B shares to Class A shares after a maximum of seven years.
Average Annual Total Returns
Periods ended February 28, 2014 | Past 1 | Past 5 | Past 10 |
Class A (incl. 5.75% sales charge) A | 9.33% | 17.44% | 5.88% |
Class T (incl. 3.50% sales charge) B | 11.60% | 17.65% | 5.91% |
Class B (incl. contingent deferred sales charge) C | 10.13% | 17.74% | 5.94% |
Class C (incl. contingent deferred sales charge) D | 14.20% | 17.98% | 5.94% |
A Class A shares bear a 0.25% 12b-1 fee. The initial offering of Class A shares took place on December 12, 2006. Returns prior to December 12, 2006, are those of Telecommunications Portfolio, the original class of the fund, which has no 12b-1 fee. Had Class A's 12b-1 fee been reflected, returns prior to December 12, 2006, would have been lower.
B Class T shares bear a 0.50% 12b-1 fee. The initial offering of Class T shares took place on December 12, 2006. Returns prior to December 12, 2006, are those of Telecommunications Portfolio, the original class of the fund, which has no 12b-1 fee. Had Class T's shares' 12b-1 fee been reflected, returns prior to December 12, 2006, would have been lower.
C Class B shares bear a 1.00% 12b-1 fee. The initial offering of Class B shares took place on December 12, 2006. Returns prior to December 12, 2006, are those of Telecommunications Portfolio, the original class of the fund, which has no 12b-1 fee. Had Class B's 12b-1 fee been reflected, returns prior to December 12, 2006, would have been lower. Class B shares' contingent deferred sales charges included in the past one year, past five years, and past ten years total return figures are 5%, 2%, and 0%, respectively.
D Class C shares bear a 1.00% 12b-1 fee. The initial offering of Class C shares took place on December 12, 2006. Returns prior to December 12, 2006, are those of Telecommunications Portfolio, the original class of the fund, which has no 12b-1 fee. Had Class C's 12b-1 fee been reflected, returns prior to December 12, 2006, would have been lower. Class C shares' contingent deferred sales charges included in the past one year, past five years, and past ten years total return figures are 1%, 0%, and 0%, respectively.
$10,000 Over 10 Years
Let's say hypothetically that $10,000 was invested in Fidelity Advisor Telecommunications Fund - Class A on February 29, 2004, and the current 5.75% sales charge was paid. The chart shows how the value of your investment would have changed, and also shows how the S&P 500 Index performed over the same period. See footnote A for additional information regarding the performance of Class A.
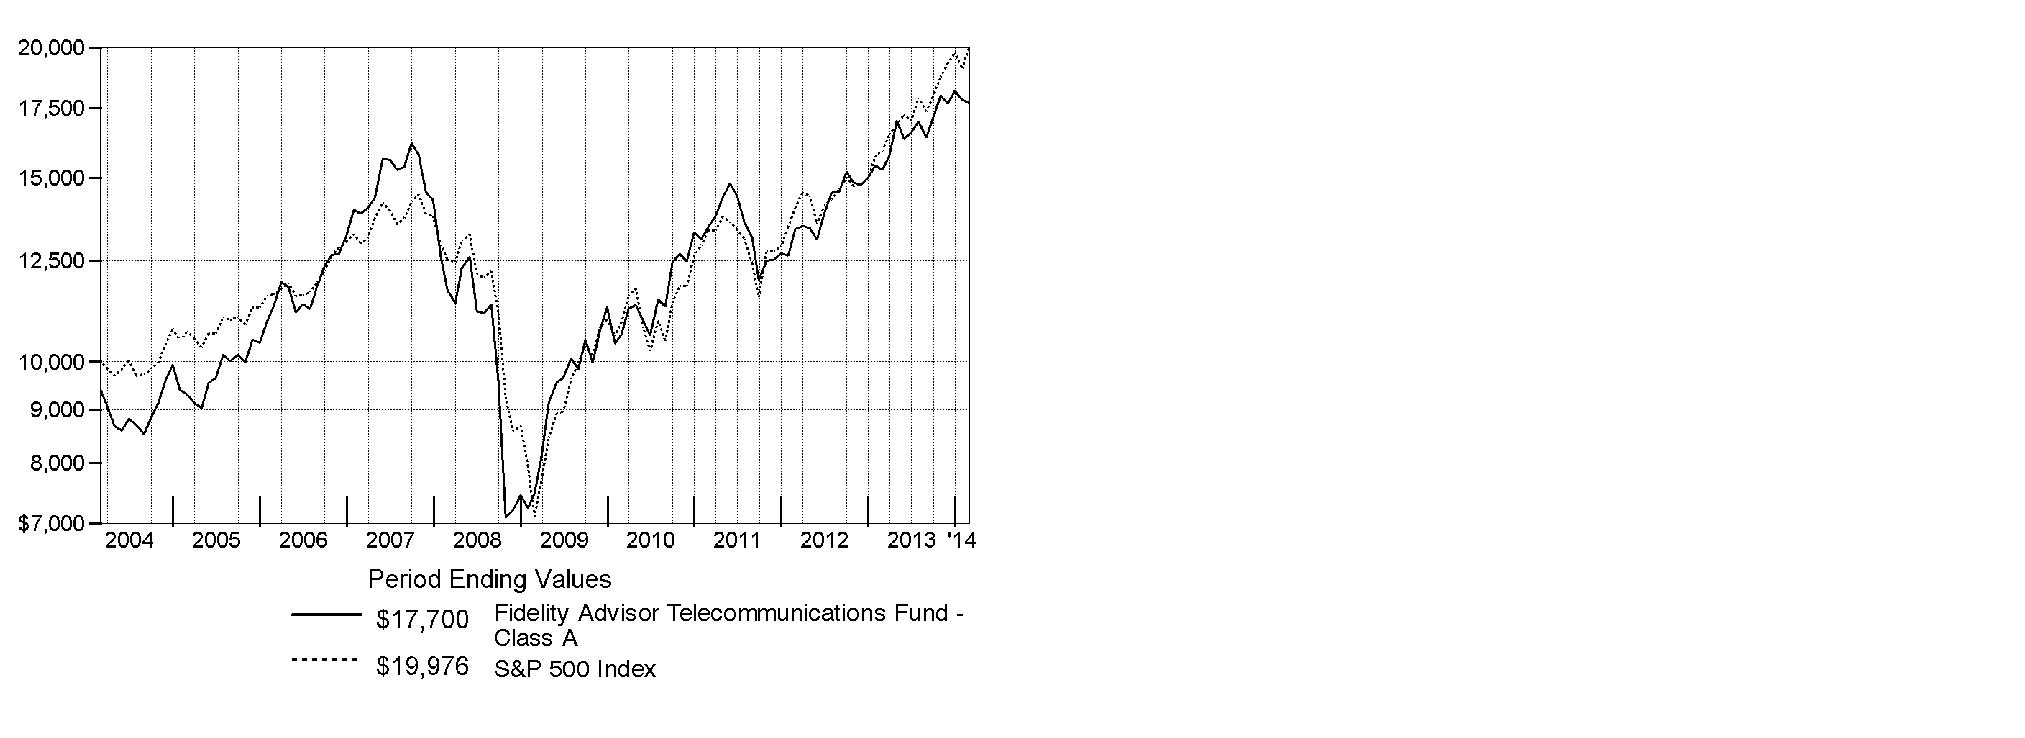
Annual Report
Fidelity Advisor Telecommunications Fund
Management's Discussion of Fund Performance
Market Recap: Stocks overcame fears of higher interest rates - not to mention their worst January in four years - to finish sharply higher for the 12 months ending February 28, 2014. The broad S&P 500® Index and the blue-chip Dow Jones Industrial AverageSM gained 25.37% and 19.01%, respectively, amid generally favorable earnings reports and accommodative monetary policies worldwide. Performance generally increased along the risk spectrum, with smaller-cap and growth strategies leading the way. An ebullient market helped the growth-oriented Nasdaq Composite Index® to a 38.10% period gain, for example. On the other hand, both cyclical and defensive stocks had representation in the top-performing industry sectors: returns were highest in health care and consumer discretionary; lowest in utilities and telecommunication services. From a macroeconomic perspective, data still points to slow but steady improvement in the U.S., and Europe's recession may well be over. Reports from China have disappointed, but continue to suggest a relatively soft landing there. Mixed signals from the U.S. Federal Reserve as to when it might curtail its stimulative bond buying kept markets in flux during the spring and summer. Stocks regained momentum in October despite a federal budget impasse and brief government shutdown, and lower volatility prevailed through year-end. Shedding new-year concerns about China's economy, an emerging-markets sell-off and confirmation (at last) of Fed tapering - alongside confirmation of a presumably dovish Janet Yellen as new Fed chair - February saw stocks back in record territory, bearing down on the five-year anniversary of the market's bottom.
Comments from Matthew Drukker, Portfolio Manager of Fidelity Advisor® Telecommunications Fund: For the year, the fund's Class A, Class T, Class B and Class C shares gained 16.00%, 15.64%, 15.13% and 15.20%, respectively (excluding sales charges), underperforming the 17.26% result of the MSCI® U.S. IMI Telecommunications Services 25-50 Index and the broad-based S&P 500®. Versus the MSCI sector benchmark, underweighting Sprint - which dropped Nextel from its name in July after SoftBank became majority owner of the firm - was the biggest individual detractor. The stock outperformed later in the period amid reports of SoftBank's potential bid for T-Mobile. I held an underweighting, on average, in Sprint Nextel before the SoftBank deal was closed, and that position was one of the biggest contributors, as the stock underperformed. A smaller-than-index position in Leap Wireless International was detrimental. The stock surged in July when AT&T agreed to purchase the prepaid wireless carrier in a cash bid worth $1.2 billion. With smartphone penetration in the U.S. already above 70%, revenue growth slowed from new data-plan customers that historically helped support earnings. I thought AT&T would be most adversely affected, and underweighting the telecom stalwart was by far the fund's biggest relative contributor. Investors' renewed concern that competitive threats, predominantly from T-Mobile, could hinder future profit margins and growth, weighed on the stock for most of the year. Consequently, an overweighting, on average, in T-Mobile, where I saw greater growth prospects, also was the right call. I added the stock to the fund in May and shares took off in December amid reports that Japan-based SoftBank - the parent company of Sprint - was preparing a bid for the firm.
The views expressed above reflect those of the portfolio manager(s) only through the end of the period as stated on the cover of this report and do not necessarily represent the views of Fidelity or any other person in the Fidelity organization. Any such views are subject to change at any time based upon market or other conditions and Fidelity disclaims any responsibility to update such views. These views may not be relied on as investment advice and, because investment decisions for a Fidelity fund are based on numerous factors, may not be relied on as an indication of trading intent on behalf of any Fidelity fund.
Annual Report
Telecommunications Portfolio
Shareholder Expense Example
As a shareholder of the Fund, you incur two types of costs: (1) transaction costs, including sales charges (loads) on purchase payments or redemption proceeds, redemption fees and (2) ongoing costs, including management fees, distribution and/or service (12b-1) fees and other Fund expenses. This Example is intended to help you understand your ongoing costs (in dollars) of investing in the Fund and to compare these costs with the ongoing costs of investing in other mutual funds.
The Example is based on an investment of $1,000 invested at the beginning of the period and held for the entire period (September 1, 2013 to February 28, 2014).
Actual Expenses
The first line of the accompanying table for each class of the Fund provides information about actual account values and actual expenses. You may use the information in this line, together with the amount you invested, to estimate the expenses that you paid over the period. Simply divide your account value by $1,000.00 (for example, an $8,600 account value divided by $1,000.00 = 8.6), then multiply the result by the number in the first line for a class of the Fund under the heading entitled "Expenses Paid During Period" to estimate the expenses you paid on your account during this period. A small balance maintenance fee of $12.00 that is charged once a year may apply for certain accounts with a value of less than $2,000. This fee is not included in the table below. If it was, the estimate of expenses you paid during the period would be higher, and your ending account value lower, by this amount. In addition, the Fund, as a shareholder in the underlying Fidelity Central Funds, will indirectly bear its pro-rata share of the fees and expenses incurred by the underlying Fidelity Central Funds. These fees and expenses are not included in the Fund's annualized expense ratio used to calculate the expense estimate in the table below.
Hypothetical Example for Comparison Purposes
The second line of the accompanying table for each class of the Fund provides information about hypothetical account values and hypothetical expenses based on a Class' actual expense ratio and an assumed rate of return of 5% per year before expenses, which is not the Class' actual return. The hypothetical account values and expenses may not be used to estimate the actual ending account balance or expenses you paid for the period. You may use this information to compare the ongoing costs of investing in the Fund and other funds. To do so, compare this 5% hypothetical example with the 5% hypothetical examples that appear in the shareholder reports of the other funds. A small balance maintenance fee of $12.00 that is charged once a year may apply for certain accounts with a value of less than $2,000. This fee is not included in the table below. If it was, the estimate of expenses you paid during the period would be higher, and your ending account value lower, by this amount. In addition, the Fund, as a shareholder in the underlying Fidelity Central Funds, will indirectly bear its pro-rata share of the fees and expenses incurred by the underlying Fidelity Central Funds. These fees and expenses are not included in the Fund's annualized expense ratio used to calculate the expense estimate in the table below.
Please note that the expenses shown in the table are meant to highlight your ongoing costs only and do not reflect any transaction costs. Therefore, the second line of the table is useful in comparing ongoing costs only, and will not help you determine the relative total costs of owning different funds. In addition, if these transactional costs were included, your costs would have been higher.
| Annualized | Beginning | Ending | Expenses Paid |
Class A | 1.17% |
|
|
|
Actual |
| $ 1,000.00 | $ 1,079.80 | $ 6.03 |
Hypothetical A |
| $ 1,000.00 | $ 1,018.99 | $ 5.86 |
Class T | 1.48% |
|
|
|
Actual |
| $ 1,000.00 | $ 1,078.10 | $ 7.63 |
Hypothetical A |
| $ 1,000.00 | $ 1,017.46 | $ 7.40 |
Class B | 1.93% |
|
|
|
Actual |
| $ 1,000.00 | $ 1,075.60 | $ 9.93 |
Hypothetical A |
| $ 1,000.00 | $ 1,015.22 | $ 9.64 |
Class C | 1.86% |
|
|
|
Actual |
| $ 1,000.00 | $ 1,076.10 | $ 9.57 |
Hypothetical A |
| $ 1,000.00 | $ 1,015.57 | $ 9.30 |
Telecommunications | .84% |
|
|
|
Actual |
| $ 1,000.00 | $ 1,081.60 | $ 4.34 |
Hypothetical A |
| $ 1,000.00 | $ 1,020.63 | $ 4.21 |
Institutional Class | .91% |
|
|
|
Actual |
| $ 1,000.00 | $ 1,081.20 | $ 4.70 |
Hypothetical A |
| $ 1,000.00 | $ 1,020.28 | $ 4.56 |
A 5% return per year before expenses
B Annualized expense ratio reflects expenses net of applicable fee waivers.
* Expenses are equal to each Class' annualized expense ratio, multiplied by the average account value over the period, multiplied by 181/365 (to reflect the one-half year period).
Annual Report
Telecommunications Portfolio
Investment Changes (Unaudited)
Top Ten Stocks as of February 28, 2014 | ||
| % of fund's | % of fund's net assets |
Verizon Communications, Inc. | 23.9 | 22.7 |
AT&T, Inc. | 9.7 | 9.6 |
American Tower Corp. | 6.4 | 7.7 |
T-Mobile U.S., Inc. | 5.9 | 3.1 |
CenturyLink, Inc. | 4.3 | 3.7 |
SBA Communications Corp. Class A | 4.3 | 5.7 |
Telephone & Data Systems, Inc. | 3.5 | 2.5 |
Vodafone Group PLC sponsored ADR | 2.9 | 4.6 |
Level 3 Communications, Inc. | 2.4 | 2.7 |
Sprint Corp. | 2.1 | 0.1 |
| 65.4 | |
Top Industries (% of fund's net assets) | |||
As of February 28, 2014 | |||
| Diversified Telecommunication Services | 61.2% |
|
| Wireless Telecommunication Services | 22.8% |
|
| Real Estate Investment Trusts | 7.1% |
|
| Media | 2.7% |
|
| Internet Software & Services | 1.2% |
|
| All Others* | 5.0% |
|

As of August 31, 2013 | |||
| Diversified Telecommunication Services | 58.2% |
|
| Wireless Telecommunication Services | 26.4% |
|
| Real Estate Investment Trusts | 8.0% |
|
| Media | 2.7% |
|
| Internet Software & Services | 0.8% |
|
| All Others* | 3.9% |
|

* Includes short-term investments and net other assets (liabilities). |
Annual Report
Telecommunications Portfolio
Investments February 28, 2014
Showing Percentage of Net Assets
Common Stocks - 96.3% | |||
Shares | Value | ||
DIVERSIFIED TELECOMMUNICATION SERVICES - 61.0% | |||
Alternative Carriers - 14.9% | |||
8x8, Inc. (a) | 724,386 | $ 7,664,004 | |
Cogent Communications Group, Inc. | 171,768 | 6,585,585 | |
inContact, Inc. (a) | 427,823 | 3,858,963 | |
Iridium Communications, Inc. (a)(d) | 548,976 | 3,579,324 | |
Level 3 Communications, Inc. (a) | 230,216 | 8,476,553 | |
Lumos Networks Corp. | 428,878 | 6,227,309 | |
Premiere Global Services, Inc. (a) | 413,383 | 4,675,362 | |
Towerstream Corp. (a)(d) | 830,224 | 2,191,791 | |
TW Telecom, Inc. (a) | 201,917 | 6,180,679 | |
Vonage Holdings Corp. (a) | 954,671 | 4,401,033 | |
| 53,840,603 | ||
Integrated Telecommunication Services - 46.1% | |||
AT&T, Inc. | 1,105,550 | 35,300,212 | |
Atlantic Tele-Network, Inc. | 98,900 | 6,481,906 | |
Bezeq The Israeli Telecommunication Corp. Ltd. | 1,170,300 | 1,897,802 | |
BT Group PLC | 2,709 | 18,632 | |
CenturyLink, Inc. | 501,078 | 15,663,698 | |
Cincinnati Bell, Inc. (a) | 1,058,914 | 3,547,362 | |
Consolidated Communications Holdings, Inc. (d) | 99,498 | 1,896,432 | |
Frontier Communications Corp. (d) | 1,562,083 | 7,622,965 | |
General Communications, Inc. Class A (a) | 161,996 | 1,686,378 | |
Hawaiian Telcom Holdco, Inc. (a) | 78,265 | 2,254,032 | |
IDT Corp. Class B | 109,565 | 1,966,692 | |
Telenor ASA | 41,800 | 923,472 | |
Verizon Communications, Inc. | 1,826,997 | 86,928,518 | |
Windstream Holdings, Inc. (d) | 169,082 | 1,356,038 | |
| 167,544,139 | ||
TOTAL DIVERSIFIED TELECOMMUNICATION SERVICES | 221,384,742 | ||
INTERNET SOFTWARE & SERVICES - 1.2% | |||
Internet Software & Services - 1.2% | |||
Earthlink Holdings Corp. | 221,000 | 866,320 | |
Equinix, Inc. (a) | 10,101 | 1,918,786 | |
Rackspace Hosting, Inc. (a) | 43,500 | 1,599,495 | |
| 4,384,601 | ||
IT SERVICES - 0.5% | |||
IT Consulting & Other Services - 0.5% | |||
InterXion Holding N.V. (a) | 81,100 | 1,945,589 | |
| |||
Shares | Value | ||
MEDIA - 2.7% | |||
Cable & Satellite - 2.7% | |||
Altice S.A. | 5,500 | $ 239,137 | |
DISH Network Corp. Class A (a) | 86,004 | 5,060,475 | |
Liberty Global PLC Class C | 38,318 | 3,244,002 | |
Shaw Communications, Inc. Class B (d) | 53,700 | 1,241,991 | |
| 9,785,605 | ||
REAL ESTATE INVESTMENT TRUSTS - 7.1% | |||
Office REITs - 0.7% | |||
CyrusOne, Inc. | 121,300 | 2,695,286 | |
Specialized REITs - 6.4% | |||
American Tower Corp. | 284,390 | 23,169,253 | |
TOTAL REAL ESTATE INVESTMENT TRUSTS | 25,864,539 | ||
SEMICONDUCTORS & SEMICONDUCTOR EQUIPMENT - 0.7% | |||
Semiconductors - 0.7% | |||
Broadcom Corp. Class A | 79,831 | 2,372,577 | |
SOFTWARE - 0.3% | |||
Application Software - 0.3% | |||
Interactive Intelligence Group, Inc. (a) | 12,600 | 1,003,338 | |
Synchronoss Technologies, Inc. (a) | 203 | 6,979 | |
| 1,010,317 | ||
WIRELESS TELECOMMUNICATION SERVICES - 22.8% | |||
Wireless Telecommunication Services - 22.8% | |||
Boingo Wireless, Inc. (a)(d) | 464,745 | 2,700,168 | |
Crown Castle International Corp. | 189 | 14,345 | |
KDDI Corp. | 32,400 | 1,981,443 | |
Leap Wireless International, Inc. (a) | 400 | 7,008 | |
NII Holdings, Inc. (a)(d) | 1,381,963 | 1,589,257 | |
NTELOS Holdings Corp. (d) | 103,288 | 1,443,966 | |
RingCentral, Inc. (d) | 27,700 | 599,705 | |
SBA Communications Corp. Class A (a) | 163,256 | 15,537,074 | |
Shenandoah Telecommunications Co. | 100,526 | 2,656,902 | |
Sprint Corp. (a) | 884,185 | 7,727,777 | |
T-Mobile U.S., Inc. (a) | 703,797 | 21,465,809 | |
Tele2 AB (B Shares) | 139,750 | 1,733,893 | |
Telephone & Data Systems, Inc. | 557,964 | 12,716,000 | |
U.S. Cellular Corp. | 64,300 | 2,320,587 | |
Vodafone Group PLC sponsored ADR | 251,641 | 10,460,716 | |
| 82,954,650 | ||
TOTAL COMMON STOCKS (Cost $314,097,848) |
| ||
Nonconvertible Preferred Stocks - 0.2% | |||
|
|
|
|
DIVERSIFIED TELECOMMUNICATION SERVICES - 0.2% | |||
Integrated Telecommunication Services - 0.2% | |||
Oi SA sponsored ADR (d) | 543,500 |
| |
Money Market Funds - 4.6% | |||
Shares | Value | ||
Fidelity Securities Lending Cash Central Fund, 0.09% (b)(c) | 16,873,475 | $ 16,873,475 | |
TOTAL INVESTMENT PORTFOLIO - 101.1% (Cost $331,893,915) | 367,402,215 | ||
NET OTHER ASSETS (LIABILITIES) - (1.1)% | (4,124,630) | ||
NET ASSETS - 100% | $ 363,277,585 | ||
Legend |
(a) Non-income producing |
(b) Affiliated fund that is generally available only to investment companies and other accounts managed by Fidelity Investments. The rate quoted is the annualized seven-day yield of the fund at period end. A complete unaudited listing of the fund's holdings as of its most recent quarter end is available upon request. In addition, each Fidelity Central Fund's financial statements, which are not covered by the Fund's Report of Independent Registered Public Accounting Firm, are available on the SEC's website or upon request. |
(c) Investment made with cash collateral received from securities on loan. |
(d) Security or a portion of the security is on loan at period end. |
Affiliated Central Funds |
Information regarding fiscal year to date income earned by the Fund from investments in Fidelity Central Funds is as follows: |
Fund | Income earned |
Fidelity Cash Central Fund | $ 10,528 |
Fidelity Securities Lending Cash Central Fund | 228,474 |
Total | $ 239,002 |
Other Information |
The following is a summary of the inputs used, as of February 28, 2014, involving the Fund's assets and liabilities carried at fair value. The inputs or methodology used for valuing securities may not be an indication of the risk associated with investing in those securities. For more information on valuation inputs, and their aggregation into the levels used in the table below, please refer to the Investment Valuation section in the accompanying Notes to Financial Statements. |
Valuation Inputs at Reporting Date: | ||||
Description | Total | Level 1 | Level 2 | Level 3 |
Investments in Securities: | ||||
Common Stocks | $ 349,702,620 | $ 347,702,545 | $ 2,000,075 | $ - |
Nonconvertible Preferred Stocks | 826,120 | 826,120 | - | - |
Money Market Funds | 16,873,475 | 16,873,475 | - | - |
Total Investments in Securities: | $ 367,402,215 | $ 365,402,140 | $ 2,000,075 | $ - |
See accompanying notes which are an integral part of the financial statements.
Annual Report
Telecommunications Portfolio
Financial Statements
Statement of Assets and Liabilities
| February 28, 2014 | |
|
|
|
Assets | ||
Investment in securities, at value (including securities loaned of $15,320,193) - See accompanying schedule: Unaffiliated issuers (cost $315,020,440) | $ 350,528,740 |
|
Fidelity Central Funds (cost $16,873,475) | 16,873,475 |
|
Total Investments (cost $331,893,915) |
| $ 367,402,215 |
Receivable for investments sold | 26,858,175 | |
Receivable for fund shares sold | 443,447 | |
Dividends receivable | 2,103,947 | |
Distributions receivable from Fidelity Central Funds | 15,077 | |
Prepaid expenses | 2,594 | |
Other receivables | 39,916 | |
Total assets | 396,865,371 | |
|
|
|
Liabilities | ||
Payable to custodian bank | $ 870,746 | |
Payable for investments purchased | 14,311,597 | |
Payable for fund shares redeemed | 1,235,864 | |
Accrued management fee | 169,374 | |
Distribution and service plan fees payable | 8,467 | |
Other affiliated payables | 77,245 | |
Other payables and accrued expenses | 41,018 | |
Collateral on securities loaned, at value | 16,873,475 | |
Total liabilities | 33,587,786 | |
|
|
|
Net Assets | $ 363,277,585 | |
Net Assets consist of: |
| |
Paid in capital | $ 331,298,766 | |
Undistributed net investment income | 7,778,471 | |
Accumulated undistributed net realized gain (loss) on investments and foreign currency transactions | (11,303,806) | |
Net unrealized appreciation (depreciation) on investments and assets and liabilities in foreign currencies | 35,504,154 | |
Net Assets | $ 363,277,585 | |
Statement of Assets and Liabilities - continued
| February 28, 2014 | |
|
|
|
Calculation of Maximum Offering Price Class A: | $ 58.71 | |
|
|
|
Maximum offering price per share (100/94.25 of $58.71) | $ 62.29 | |
Class T: | $ 58.50 | |
|
|
|
Maximum offering price per share (100/96.50 of $58.50) | $ 60.62 | |
Class B: | $ 58.77 | |
|
|
|
Class C: | $ 58.54 | |
|
|
|
Telecommunications: | $ 58.94 | |
|
|
|
Institutional Class: | $ 58.80 | |
A Redemption price per share is equal to net asset value less any applicable contingent deferred sales charge.
See accompanying notes which are an integral part of the financial statements.
Annual Report
Telecommunications Portfolio
Financial Statements - continued
Statement of Operations
| Year ended February 28, 2014 | |
|
|
|
Investment Income |
|
|
Dividends |
| $ 11,161,992 |
Special dividends |
| 7,304,521 |
Interest |
| 23 |
Income from Fidelity Central Funds |
| 239,002 |
Total income |
| 18,705,538 |
|
|
|
Expenses | ||
Management fee | $ 2,436,046 | |
Transfer agent fees | 952,642 | |
Distribution and service plan fees | 98,511 | |
Accounting and security lending fees | 174,567 | |
Custodian fees and expenses | 27,761 | |
Independent trustees' compensation | 8,414 | |
Registration fees | 81,316 | |
Audit | 56,946 | |
Legal | 8,437 | |
Interest | 1,149 | |
Miscellaneous | 5,478 | |
Total expenses before reductions | 3,851,267 | |
Expense reductions | (114,701) | 3,736,566 |
Net investment income (loss) | 14,968,972 | |
Realized and Unrealized Gain (Loss) Net realized gain (loss) on: | ||
Investment securities: |
|
|
Unaffiliated issuers | 2,147,371 | |
Foreign currency transactions | 12,166 | |
Total net realized gain (loss) |
| 2,159,537 |
Change in net unrealized appreciation (depreciation) on: Investment securities | 48,831,064 | |
Assets and liabilities in foreign currencies | (2,016) | |
Total change in net unrealized appreciation (depreciation) |
| 48,829,048 |
Net gain (loss) | 50,988,585 | |
Net increase (decrease) in net assets resulting from operations | $ 65,957,557 | |
Statement of Changes in Net Assets
| Year ended | Year ended |
Increase (Decrease) in Net Assets |
|
|
Operations |
|
|
Net investment income (loss) | $ 14,968,972 | $ 9,261,556 |
Net realized gain (loss) | 2,159,537 | 44,357,084 |
Change in net unrealized appreciation (depreciation) | 48,829,048 | 3,165,741 |
Net increase (decrease) in net assets resulting from operations | 65,957,557 | 56,784,381 |
Distributions to shareholders from net investment income | (8,506,759) | (8,401,078) |
Distributions to shareholders from net realized gain | (32,511) | - |
Total distributions | (8,539,270) | (8,401,078) |
Share transactions - net increase (decrease) | (90,264,976) | (7,060,825) |
Redemption fees | 26,413 | 3,280 |
Total increase (decrease) in net assets | (32,820,276) | 41,325,758 |
|
|
|
Net Assets | ||
Beginning of period | 396,097,861 | 354,772,103 |
End of period (including undistributed net investment income of $7,778,471 and undistributed net investment income of $1,584,319, respectively) | $ 363,277,585 | $ 396,097,861 |
See accompanying notes which are an integral part of the financial statements.
Annual Report
Financial Highlights - Class A
Years ended February 28, | 2014 | 2013 | 2012 G | 2011 | 2010 |
Selected Per-Share Data |
|
|
|
|
|
Net asset value, beginning of period | $ 51.58 | $ 46.12 | $ 46.93 | $ 37.64 | $ 26.66 |
Income from Investment Operations |
|
|
|
|
|
Net investment income (loss) C | 1.76 K | .99 | .56 | .57 | .67 |
Net realized and unrealized gain (loss) | 6.48 | 5.43 | (.86) | 9.49 | 10.55 |
Total from investment operations | 8.24 | 6.42 | (.30) | 10.06 | 11.22 |
Distributions from net investment income | (1.11) | (.96) | (.51) | (.77) | (.19) |
Distributions from net realized gain | (.01) | - | - | - | (.05) |
Total distributions | (1.11) J | (.96) | (.51) | (.77) | (.24) I |
Redemption fees added to paid in capital C,H | - | - | - | - | - |
Net asset value, end of period | $ 58.71 | $ 51.58 | $ 46.12 | $ 46.93 | $ 37.64 |
Total Return A, B | 16.00% | 13.97% | (.54)% | 26.87% | 42.07% |
Ratios to Average Net Assets D, F |
|
|
|
|
|
Expenses before reductions | 1.18% | 1.18% | 1.20% | 1.20% | 1.26% |
Expenses net of fee waivers, if any | 1.18% | 1.18% | 1.20% | 1.20% | 1.26% |
Expenses net of all reductions | 1.15% | 1.17% | 1.18% | 1.18% | 1.24% |
Net investment income (loss) | 3.08% K | 2.01% | 1.21% | 1.35% | 1.89% |
Supplemental Data |
|
|
|
|
|
Net assets, end of period (000 omitted) | $ 7,712 | $ 6,449 | $ 4,677 | $ 4,305 | $ 3,343 |
Portfolio turnover rate E | 111% | 76% | 72% | 72% | 90% |
A Total returns would have been lower if certain expenses had not been reduced during the applicable periods shown. B Total returns do not include the effect of the sales charges. C Calculated based on average shares outstanding during the period. D Fees and expenses of any underlying Fidelity Central Funds are not included in the Fund's expense ratio. The Fund indirectly bears its proportionate share of the expenses of any underlying Fidelity Central Funds. E Amount does not include the portfolio activity of any underlying Fidelity Central Funds. F Expense ratios reflect operating expenses of the class. Expenses before reductions do not reflect amounts reimbursed by the investment adviser or reductions from brokerage service arrangements or reductions from other expense offset arrangements and do not represent the amount paid by the class during periods when reimbursements or reductions occur. Expenses net of fee waivers reflect expenses after reimbursement by the investment adviser but prior to reductions from brokerage service arrangements or other expense offset arrangements. Expenses net of all reductions represent the net expenses paid by the class. G For the year ended February 29. H Amount represents less than $.01 per share. I Total distributions of $.24 per share is comprised of distributions from net investment income of $.187 and distributions from net realized gain of $.048 per share. J Total distributions of $1.11 per share is comprised of distributions from net investment income of $1.106 and distributions from net realized gain of $.005 per share. K Investment income per share reflects large, non-recurring dividends which amounted to $.95 per share. Excluding these non-recurring dividends, the ratio of net investment income (loss) to average net assets would have been 1.43%. |
Financial Highlights - Class T
Years ended February 28, | 2014 | 2013 | 2012 G | 2011 | 2010 |
Selected Per-Share Data |
|
|
|
|
|
Net asset value, beginning of period | $ 51.41 | $ 46.01 | $ 46.81 | $ 37.55 | $ 26.68 |
Income from Investment Operations |
|
|
|
|
|
Net investment income (loss) C | 1.59 K | .85 | .42 | .45 | .57 |
Net realized and unrealized gain (loss) | 6.44 | 5.39 | (.84) | 9.47 | 10.54 |
Total from investment operations | 8.03 | 6.24 | (.42) | 9.92 | 11.11 |
Distributions from net investment income | (.94) | (.84) | (.38) | (.66) | (.22) |
Distributions from net realized gain | (.01) | - | - | - | (.03) |
Total distributions | (.94) J | (.84) | (.38) | (.66) | (.24) I |
Redemption fees added to paid in capital C,H | - | - | - | - | - |
Net asset value, end of period | $ 58.50 | $ 51.41 | $ 46.01 | $ 46.81 | $ 37.55 |
Total Return A, B | 15.64% | 13.61% | (.82)% | 26.54% | 41.64% |
Ratios to Average Net Assets D, F |
|
|
|
|
|
Expenses before reductions | 1.48% | 1.48% | 1.49% | 1.48% | 1.55% |
Expenses net of fee waivers, if any | 1.48% | 1.48% | 1.49% | 1.48% | 1.55% |
Expenses net of all reductions | 1.45% | 1.46% | 1.47% | 1.46% | 1.53% |
Net investment income (loss) | 2.78% K | 1.72% | .92% | 1.06% | 1.60% |
Supplemental Data |
|
|
|
|
|
Net assets, end of period (000 omitted) | $ 4,344 | $ 4,237 | $ 2,702 | $ 2,882 | $ 2,051 |
Portfolio turnover rate E | 111% | 76% | 72% | 72% | 90% |
A Total returns would have been lower if certain expenses had not been reduced during the applicable periods shown. B Total returns do not include the effect of the sales charges. C Calculated based on average shares outstanding during the period. D Fees and expenses of any underlying Fidelity Central Funds are not included in the Fund's expense ratio. The Fund indirectly bears its proportionate share of the expenses of any underlying Fidelity Central Funds. E Amount does not include the portfolio activity of any underlying Fidelity Central Funds. F Expense ratios reflect operating expenses of the class. Expenses before reductions do not reflect amounts reimbursed by the investment adviser or reductions from brokerage service arrangements or reductions from other expense offset arrangements and do not represent the amount paid by the class during periods when reimbursements or reductions occur. Expenses net of fee waivers reflect expenses after reimbursement by the investment adviser but prior to reductions from brokerage service arrangements or other expense offset arrangements. Expenses net of all reductions represent the net expenses paid by the class. G For the year ended February 29. H Amount represents less than $.01 per share. I Total distributions of $.24 per share is comprised of distributions from net investment income of $.216 and distributions from net realized gain of $.028 per share. J Total distributions of $.94 per share is comprised of distributions from net investment income of $.939 and distributions from net realized gain of $.005 per share. K Investment income per share reflects large, non-recurring dividends which amounted to $.94 per share. Excluding these non-recurring dividends, the ratio of net investment income (loss) to average net assets would have been 1.13%. |
See accompanying notes which are an integral part of the financial statements.
Annual Report
Financial Highlights - Class B
Years ended February 28, | 2014 | 2013 | 2012 G | 2011 | 2010 |
Selected Per-Share Data |
|
|
|
|
|
Net asset value, beginning of period | $ 51.63 | $ 46.14 | $ 46.93 | $ 37.60 | $ 26.71 |
Income from Investment Operations |
|
|
|
|
|
Net investment income (loss) C | 1.33 J | .62 | .21 | .25 | .40 |
Net realized and unrealized gain (loss) | 6.48 | 5.42 | (.83) | 9.48 | 10.54 |
Total from investment operations | 7.81 | 6.04 | (.62) | 9.73 | 10.94 |
Distributions from net investment income | (.66) | (.55) | (.17) | (.40) | (.04) |
Distributions from net realized gain | (.01) | - | - | - | (.01) |
Total distributions | (.67) | (.55) | (.17) | (.40) | (.05) I |
Redemption fees added to paid in capital C,H | - | - | - | - | - |
Net asset value, end of period | $ 58.77 | $ 51.63 | $ 46.14 | $ 46.93 | $ 37.60 |
Total Return A, B | 15.13% | 13.11% | (1.29)% | 25.96% | 40.97% |
Ratios to Average Net Assets D, F |
|
|
|
|
|
Expenses before reductions | 1.93% | 1.93% | 1.95% | 1.95% | 2.01% |
Expenses net of fee waivers, if any | 1.93% | 1.93% | 1.95% | 1.95% | 2.01% |
Expenses net of all reductions | 1.91% | 1.92% | 1.93% | 1.93% | 2.00% |
Net investment income (loss) | 2.32% J | 1.26% | .47% | .60% | 1.13% |
Supplemental Data |
|
|
|
|
|
Net assets, end of period (000 omitted) | $ 546 | $ 576 | $ 596 | $ 706 | $ 641 |
Portfolio turnover rate E | 111% | 76% | 72% | 72% | 90% |
A Total returns would have been lower if certain expenses had not been reduced during the applicable periods shown. B Total returns do not include the effect of the contingent deferred sales charge. C Calculated based on average shares outstanding during the period. D Fees and expenses of any underlying Fidelity Central Funds are not included in the Fund's expense ratio. The Fund indirectly bears its proportionate share of the expenses of any underlying Fidelity Central Funds. E Amount does not include the portfolio activity of any underlying Fidelity Central Funds. F Expense ratios reflect operating expenses of the class. Expenses before reductions do not reflect amounts reimbursed by the investment adviser or reductions from brokerage service arrangements or reductions from other expense offset arrangements and do not represent the amount paid by the class during periods when reimbursements or reductions occur. Expenses net of fee waivers reflect expenses after reimbursement by the investment adviser but prior to reductions from brokerage service arrangements or other expense offset arrangements. Expenses net of all reductions represent the net expenses paid by the class. G For the year ended February 29. H Amount represents less than $.01 per share. I Total distributions of $.05 per share is comprised of distributions from net investment income of $.044 and distributions from net realized gain of $.009 per share. J Investment income per share reflects large, non-recurring dividends which amounted to $.95 per share. Excluding these non-recurring dividends, the ratio of net investment income (loss) to average net assets would have been .67%. |
Financial Highlights - Class C
Years ended February 28, | 2014 | 2013 | 2012 G | 2011 | 2010 |
Selected Per-Share Data |
|
|
|
|
|
Net asset value, beginning of period | $ 51.47 | $ 46.02 | $ 46.89 | $ 37.61 | $ 26.76 |
Income from Investment Operations |
|
|
|
|
|
Net investment income (loss) C | 1.36 J | .63 | .22 | .26 | .41 |
Net realized and unrealized gain (loss) | 6.46 | 5.41 | (.84) | 9.46 | 10.56 |
Total from investment operations | 7.82 | 6.04 | (.62) | 9.72 | 10.97 |
Distributions from net investment income | (.74) | (.59) | (.25) | (.44) | (.10) |
Distributions from net realized gain | (.01) | - | - | - | (.02) |
Total distributions | (.75) | (.59) | (.25) | (.44) | (.12) I |
Redemption fees added to paid in capital C,H | - | - | - | - | - |
Net asset value, end of period | $ 58.54 | $ 51.47 | $ 46.02 | $ 46.89 | $ 37.61 |
Total Return A, B | 15.20% | 13.14% | (1.27)% | 25.95% | 41.00% |
Ratios to Average Net Assets D, F |
|
|
|
|
|
Expenses before reductions | 1.88% | 1.90% | 1.93% | 1.94% | 2.01% |
Expenses net of fee waivers, if any | 1.88% | 1.90% | 1.93% | 1.94% | 2.01% |
Expenses net of all reductions | 1.85% | 1.89% | 1.91% | 1.92% | 2.00% |
Net investment income (loss) | 2.38% J | 1.29% | .48% | .61% | 1.13% |
Supplemental Data |
|
|
|
|
|
Net assets, end of period (000 omitted) | $ 5,523 | $ 4,353 | $ 3,514 | $ 3,035 | $ 2,151 |
Portfolio turnover rate E | 111% | 76% | 72% | 72% | 90% |
A Total returns would have been lower if certain expenses had not been reduced during the applicable periods shown. B Total returns do not include the effect of the contingent deferred sales charge. C Calculated based on average shares outstanding during the period. D Fees and expenses of any underlying Fidelity Central Funds are not included in the Fund's expense ratio. The Fund indirectly bears its proportionate share of the expenses of any underlying Fidelity Central Funds. E Amount does not include the portfolio activity of any underlying Fidelity Central Funds. F Expense ratios reflect operating expenses of the class. Expenses before reductions do not reflect amounts reimbursed by the investment adviser or reductions from brokerage service arrangements or reductions from other expense offset arrangements and do not represent the amount paid by the class during periods when reimbursements or reductions occur. Expenses net of fee waivers reflect expenses after reimbursement by the investment adviser but prior to reductions from brokerage service arrangements or other expense offset arrangements. Expenses net of all reductions represent the net expenses paid by the class. G For the year ended February 29. H Amount represents less than $.01 per share. I Total distributions of $.12 per share is comprised of distributions from net investment income of $.098 and distributions from net realized gain of $.023 per share. J Investment income per share reflects large, non-recurring dividends which amounted to $.94 per share. Excluding these non-recurring dividends, the ratio of net investment income (loss) to average net assets would have been .73%. |
See accompanying notes which are an integral part of the financial statements.
Annual Report
Financial Highlights - Telecommunications
Years ended February 28, | 2014 | 2013 | 2012 F | 2011 | 2010 |
Selected Per-Share Data |
|
|
|
|
|
Net asset value, beginning of period | $ 51.75 | $ 46.26 | $ 47.07 | $ 37.73 | $ 26.74 |
Income from Investment Operations |
|
|
|
|
|
Net investment income (loss) B | 1.96 J | 1.15 | .70 | .69 | .76 |
Net realized and unrealized gain (loss) | 6.51 | 5.43 | (.86) | 9.52 | 10.59 |
Total from investment operations | 8.47 | 6.58 | (.16) | 10.21 | 11.35 |
Distributions from net investment income | (1.28) | (1.09) | (.65) | (.87) | (.31) |
Distributions from net realized gain | (.01) | - | - | - | (.05) |
Total distributions | (1.28) I | (1.09) | (.65) | (.87) | (.36) H |
Redemption fees added to paid in capital B,G | - | - | - | - | - |
Net asset value, end of period | $ 58.94 | $ 51.75 | $ 46.26 | $ 47.07 | $ 37.73 |
Total Return A | 16.40% | 14.30% | (.23)% | 27.24% | 42.43% |
Ratios to Average Net Assets C, E |
|
|
|
|
|
Expenses before reductions | .85% | .87% | .90% | .92% | .99% |
Expenses net of fee waivers, if any | .85% | .87% | .90% | .92% | .99% |
Expenses net of all reductions | .82% | .85% | .88% | .91% | .98% |
Net investment income (loss) | 3.41% J | 2.33% | 1.52% | 1.62% | 2.15% |
Supplemental Data |
|
|
|
|
|
Net assets, end of period (000 omitted) | $ 343,548 | $ 377,841 | $ 342,262 | $ 354,938 | $ 279,704 |
Portfolio turnover rate D | 111% | 76% | 72% | 72% | 90% |
A Total returns would have been lower if certain expenses had not been reduced during the applicable periods shown. B Calculated based on average shares outstanding during the period. C Fees and expenses of any underlying Fidelity Central Funds are not included in the Fund's expense ratio. The Fund indirectly bears its proportionate share of the expenses of any underlying Fidelity Central Funds. D Amount does not include the portfolio activity of any underlying Fidelity Central Funds. E Expense ratios reflect operating expenses of the class. Expenses before reductions do not reflect amounts reimbursed by the investment adviser or reductions from brokerage service arrangements or reductions from other expense offset arrangements and do not represent the amount paid by the class during periods when reimbursements or reductions occur. Expenses net of fee waivers reflect expenses after reimbursement by the investment adviser but prior to reductions from brokerage service arrangements or other expense offset arrangements. Expenses net of all reductions represent the net expenses paid by the class. F For the year ended February 29. G Amount represents less than $.01 per share. H Total distributions of $.36 per share is comprised of distributions from net investment income of $.310 and distributions from net realized gain of $.048 per share. I Total distributions of $1.28 per share is comprised of distributions from net investment income of $1.275 and distributions from net realized gain of $.005 per share. J Investment income per share reflects large, non-recurring dividends which amounted to $.95 per share. Excluding these non-recurring dividends, the ratio of net investment income (loss) to average net assets would have been 1.76%. |
Financial Highlights - Institutional Class
Years ended February 28, | 2014 | 2013 | 2012 F | 2011 | 2010 |
Selected Per-Share Data |
|
|
|
|
|
Net asset value, beginning of period | $ 51.65 | $ 46.20 | $ 47.02 | $ 37.69 | $ 26.73 |
Income from Investment Operations |
|
|
|
|
|
Net investment income (loss) B | 1.93 I | 1.17 | .70 | .71 | .84 |
Net realized and unrealized gain (loss) | 6.48 | 5.42 | (.88) | 9.50 | 10.55 |
Total from investment operations | 8.41 | 6.59 | (.18) | 10.21 | 11.39 |
Distributions from net investment income | (1.25) | (1.14) | (.64) | (.88) | (.38) |
Distributions from net realized gain | (.01) | - | - | - | (.05) |
Total distributions | (1.26) | (1.14) | (.64) | (.88) | (.43) H |
Redemption fees added to paid in capital B,G | - | - | - | - | - |
Net asset value, end of period | $ 58.80 | $ 51.65 | $ 46.20 | $ 47.02 | $ 37.69 |
Total Return A | 16.30% | 14.33% | (.26)% | 27.27% | 42.59% |
Ratios to Average Net Assets C, E |
|
|
|
|
|
Expenses before reductions | .91% | .85% | .89% | .91% | .86% |
Expenses net of fee waivers, if any | .91% | .85% | .89% | .91% | .86% |
Expenses net of all reductions | .88% | .83% | .87% | .89% | .84% |
Net investment income (loss) | 3.35% I | 2.35% | 1.52% | 1.64% | 2.29% |
Supplemental Data |
|
|
|
|
|
Net assets, end of period (000 omitted) | $ 1,604 | $ 2,641 | $ 1,022 | $ 1,743 | $ 1,101 |
Portfolio turnover rate D | 111% | 76% | 72% | 72% | 90% |
A Total returns would have been lower if certain expenses had not been reduced during the applicable periods shown. B Calculated based on average shares outstanding during the period. C Fees and expenses of any underlying Fidelity Central Funds are not included in the Fund's expense ratio. The Fund indirectly bears its proportionate share of the expenses of any underlying Fidelity Central Funds. D Amount does not include the portfolio activity of any underlying Fidelity Central Funds. E Expense ratios reflect operating expenses of the class. Expenses before reductions do not reflect amounts reimbursed by the investment adviser or reductions from brokerage service arrangements or reductions from other expense offset arrangements and do not represent the amount paid by the class during periods when reimbursements or reductions occur. Expenses net of fee waivers reflect expenses after reimbursement by the investment adviser but prior to reductions from brokerage service arrangements or other expense offset arrangements. Expenses net of all reductions represent the net expenses paid by the class. F For the year ended February 29. G Amount represents less than $.01 per share. H Total distributions of $.43 per share is comprised of distributions from net investment income of $.379 and distributions from net realized gain of $.057 per share. I Investment income per share reflects large, non-recurring dividends which amounted to $.95 per share. Excluding these non-recurring dividends, the ratio of net investment income (loss) to average net assets would have been 1.70%. |
See accompanying notes which are an integral part of the financial statements.
Annual Report
Notes to Financial Statements
For the period ended February 28, 2014
1. Organization.
Telecommunications Portfolio (the Fund) is a non-diversified fund of Fidelity Select Portfolios (the Trust) and is authorized to issue an unlimited number of shares. The Trust is registered under the Investment Company Act of 1940, as amended (the 1940 Act), as an open-end management investment company organized as a Massachusetts business trust. The Fund invests primarily in securities of companies whose principal business activities fall within specific industries. The Fund offers Class A, Class T, Class C, Telecommunications and Institutional Class shares, each of which, along with Class B shares, has equal rights as to assets and voting privileges. Class B shares are closed to new accounts and additional purchases, except for exchanges and reinvestments. Each class has exclusive voting rights with respect to matters that affect that class. Class B shares will automatically convert to Class A shares after a holding period of seven years from the initial date of purchase.
2. Investments in Fidelity Central Funds.
The Fund invests in Fidelity Central Funds, which are open-end investment companies generally available only to other investment companies and accounts managed by the investment adviser and its affiliates. The Fund's Schedule of Investments lists each of the Fidelity Central Funds held as of period end, if any, as an investment of the Fund, but does not include the underlying holdings of each Fidelity Central Fund. As an Investing Fund, the Fund indirectly bears its proportionate share of the expenses of the underlying Fidelity Central Funds.
The Money Market Central Funds seek preservation of capital and current income and are managed by Fidelity Investments Money Management, Inc. (FIMM), an affiliate of the investment adviser. Annualized expenses of the Money Market Central Funds as of their most recent shareholder report date are less than .01%.
A complete unaudited list of holdings for each Fidelity Central Fund is available upon request or at the Securities and Exchange Commission (the SEC) website at www.sec.gov. In addition, the financial statements of the Fidelity Central Funds, which are not covered by the Fund's Report of Independent Registered Public Accounting Firm, are available on the SEC website or upon request.
3. Significant Accounting Policies.
The financial statements have been prepared in conformity with accounting principles generally accepted in the United States of America (GAAP), which require management to make certain estimates and assumptions at the date of the financial statements. Actual results could differ from those estimates. Subsequent events, if any, through the date that the financial statements were issued have been evaluated in the preparation of the financial statements. The following summarizes the significant accounting policies of the Fund:
Investment Valuation. Investments are valued as of 4:00 p.m. Eastern time on the last calendar day of the period. In accordance with valuation policies and procedures approved by the Board of Trustees (the Board), the Fund attempts to obtain prices from one or more third party pricing vendors or brokers to value its investments. When current market prices, quotations or currency exchange rates are not readily available or reliable, investments will be fair valued in good faith by the Fidelity SelectCo, LLC (SelectCo) Fair Value Committee (the Committee), in accordance with procedures adopted by the Board. Factors used in determining fair value vary by investment type and may include market or investment specific events. The frequency with which these procedures are used cannot be predicted and they may be utilized to a significant extent. The Committee oversees the Fund's valuation policies and procedures and is responsible for approving and reporting to the Board all fair value determinations.
The Fund categorizes the inputs to valuation techniques used to value its investments into a disclosure hierarchy consisting of three levels as shown below:
Level 1 - quoted prices in active markets for identical investments
Level 2 - other significant observable inputs (including quoted prices for similar investments, interest rates, prepayment speeds, etc.)
Level 3 - unobservable inputs (including the Fund's own assumptions based on the best information available)
Valuation techniques used to value the Fund's investments by major category are as follows:
Equity securities, including restricted securities, for which market quotations are readily available, are valued at the last reported sale price or official closing price as reported by a third party pricing vendor on the primary market or exchange on which they are traded and are categorized as Level 1 in the hierarchy. In the event there were no sales during the day or closing prices are not available, securities are valued at the last quoted bid price or may be valued using the last available price and are generally categorized as Level 2 in the hierarchy. For foreign equity securities, when market or security specific events arise, comparisons to the valuation of American Depositary Receipts (ADRs), futures contracts, Exchange-Traded Funds (ETFs) and certain indexes as well as quoted prices for similar securities may be used and would be categorized as Level 2 in the hierarchy. Utilizing these techniques may result in transfers between Level 1 and Level 2. For equity securities, including restricted securities, where observable inputs are limited, assumptions about market activity and risk are used and these securities may be categorized as Level 3 in the hierarchy.
Annual Report
3. Significant Accounting Policies - continued
Investment Valuation - continued
Investments in open-end mutual funds, including the Fidelity Central Funds, are valued at their closing net asset value (NAV) each business day and are categorized as Level 1 in the hierarchy.
Changes in valuation techniques may result in transfers in or out of an assigned level within the disclosure hierarchy. The aggregate value of investments by input level, as of February 28, 2014, is included at the end of the Fund's Schedule of Investments.
Foreign Currency. The Fund may use foreign currency contracts to facilitate transactions in foreign-denominated securities. Gains and losses from these transactions may arise from changes in the value of the foreign currency or if the counterparties do not perform under the contracts' terms.
Foreign-denominated assets, including investment securities, and liabilities are translated into U.S. dollars at the exchange rates at period end. Purchases and sales of investment securities, income and dividends received and expenses denominated in foreign currencies are translated into U.S. dollars at the exchange rate in effect on the transaction date.
The effects of exchange rate fluctuations on investments are included with the net realized and unrealized gain (loss) on investment securities. Other foreign currency transactions resulting in realized and unrealized gain (loss) are disclosed separately.
Investment Transactions and Income. For financial reporting purposes, the Fund's investment holdings and NAV include trades executed through the end of the last business day of the period. The NAV per share for processing shareholder transactions is calculated as of the close of business of the New York Stock Exchange (NYSE), normally 4:00 p.m. Eastern time and includes trades executed through the end of the prior business day. Gains and losses on securities sold are determined on the basis of identified cost and may include proceeds received from litigation. Dividend income is recorded on the ex-dividend date, except for certain dividends from foreign securities where the ex-dividend date may have passed, which are recorded as soon as the Fund is informed of the ex-dividend date. Non-cash dividends included in dividend income, if any, are recorded at the fair market value of the securities received. Distributions received on securities that represent a return of capital or capital gain are recorded as a reduction of cost of investments and/or as a realized gain. Subsequent to ex-dividend date the Fund determines the components of these distributions, based upon receipt of tax filings or other correspondence relating to the underlying investment. Large, non-recurring dividends recognized by the Fund are presented separately on the Statement of Operations as "Special Dividends" and the impact of these dividends is presented in the Financial Highlights. Interest income and distributions from the Fidelity Central Funds are accrued as earned. Interest income includes coupon interest and amortization of premium and accretion of discount on debt securities. Investment income is recorded net of foreign taxes withheld where recovery of such taxes is uncertain.
Class Allocations and Expenses. Investment income, realized and unrealized capital gains and losses, common expenses of the Fund, and certain fund-level expense reductions, if any, are allocated daily on a pro-rata basis to each class based on the relative net assets of each class to the total net assets of the Fund. Each class differs with respect to transfer agent and distribution and service plan fees incurred. Certain expense reductions may also differ by class. For the reporting period, the allocated portion of income and expenses to each class as a percent of its average net assets may vary due to the timing of recording these transactions in relation to fluctuating net assets of the classes. Expenses directly attributable to a fund are charged to that fund. Expenses attributable to more than one fund are allocated among the respective funds on the basis of relative net assets or other appropriate methods. Expense estimates are accrued in the period to which they relate and adjustments are made when actual amounts are known.
Income Tax Information and Distributions to Shareholders. Each year, the Fund intends to qualify as a regulated investment company under Subchapter M of the Internal Revenue Code, including distributing substantially all of its taxable income and realized gains. As a result, no provision for U.S. Federal income taxes is required. As of February 28, 2014, the Fund did not have any unrecognized tax benefits in the financial statements; nor is the Fund aware of any tax positions for which it is reasonably possible that the total amounts of unrecognized tax benefits will significantly change in the next twelve months. The Fund files a U.S. federal tax return, in addition to state and local tax returns as required. The Fund's federal income tax returns are subject to examination by the Internal Revenue Service (IRS) for a period of three fiscal years after they are filed. State and local tax returns may be subject to examination for an additional fiscal year depending on the jurisdiction. Foreign taxes are provided for based on the Fund's understanding of the tax rules and rates that exist in the foreign markets in which it invests.
Distributions are declared and recorded on the ex-dividend date. Income dividends and capital gain distributions are declared separately for each class. Income and capital gain distributions are determined in accordance with income tax regulations, which may differ from GAAP.
Capital accounts within the financial statements are adjusted for permanent book-tax differences. These adjustments have no impact on net assets or the results of operations. Capital accounts are not adjusted for temporary book-tax differences which will reverse in a subsequent period.
Book-tax differences are primarily due to foreign currency transactions, deferred trustees compensation, capital loss carryforwards and losses deferred due to wash sales and excise tax regulations.
Annual Report
Notes to Financial Statements - continued
3. Significant Accounting Policies - continued
Income Tax Information and Distributions to Shareholders - continued
The federal tax cost of investment securities and unrealized appreciation (depreciation) as of period end were as follows:
Gross unrealized appreciation | $ 50,421,115 |
Gross unrealized depreciation | (17,845,454) |
Net unrealized appreciation (depreciation) on securities and other investments | $ 32,575,661 |
|
|
Tax Cost | $ 334,826,554 |
The tax-based components of distributable earnings as of period end were as follows:
Undistributed ordinary income | $ 7,778,810 |
Capital loss carryforward | $ (4,297,851) |
Net unrealized appreciation (depreciation) | $ 32,571,515 |
Capital loss carryforwards are only available to offset future capital gains of the Fund to the extent provided by regulations and may be limited. Under the Regulated Investment Company Modernization Act of 2010 (the Act), the Fund is permitted to carry forward capital losses incurred in taxable years beginning after December 22, 2010 for an unlimited period and such capital losses are required to be used prior to any losses that expire. The capital loss carryforward information presented below, including any applicable limitation, is estimated as of fiscal period end and is subject to adjustment.
Fiscal year of expiration |
|
2018 | $ (4,297,851) |
The Fund intends to elect to defer to its next fiscal year $4,073,316 of capital losses recognized during the period November 1, 2013 to February 28, 2014.
The tax character of distributions paid was as follows:
| February 28, 2014 | February 28, 2013 |
Ordinary Income | $ 8,539,270 | $ 8,401,078 |
Trading (Redemption) Fees. Shares held by investors in the Fund less than 30 days may be subject to a redemption fee equal to .75% of the NAV of shares redeemed. All redemption fees, which reduce the proceeds of the shareholder redemption, are retained by the Fund and accounted for as an addition to paid in capital.
4. Purchases and Sales of Investments.
Purchases and sales of securities, other than short-term securities, aggregated $468,948,325 and $554,795,163, respectively.
5. Fees and Other Transactions with Affiliates.
Management Fee. Effective August 1, 2013, SelectCo replaced Fidelity Management and Research Company (FMR), an affiliate of SelectCo, as investment adviser to the Fund. The investment adviser and its affiliates provide the Fund with investment management related services for which the Fund pays a monthly management fee. The management fee is the sum of an individual fund fee rate that is based on an annual rate of .30% of the Fund's average net assets and an annualized group fee rate that averaged .25% during the period. The group fee rate is based upon the average net assets of all the mutual funds advised by FMR and the investment adviser. The group fee rate decreases as assets under management increase and increases as assets under management decrease. For the reporting period, the total annual management fee rate was .55% of the Fund's average net assets.
Distribution and Service Plan Fees. In accordance with Rule 12b-1 of the 1940 Act, the Fund has adopted separate Distribution and Service Plans for each class of shares. Certain classes pay Fidelity Distributors Corporation (FDC), an affiliate of the investment adviser, separate Distribution and Service Fees, each of which is based on an annual percentage of each class' average net assets. In addition, FDC may pay financial intermediaries for
Annual Report
5. Fees and Other Transactions with Affiliates - continued
Distribution and Service Plan Fees - continued
selling shares of the Fund and providing shareholder support services. For the period, the Distribution and Service Fee rates, total fees and amounts retained by FDC were as follows:
| Distribution | Service | Total Fees | Retained |
Class A | -% | .25% | $ 18,291 | $ 583 |
Class T | .25% | .25% | 21,936 | - |
Class B | .75% | .25% | 5,661 | 4,246 |
Class C | .75% | .25% | 52,623 | 12,851 |
|
|
| $ 98,511 | $ 17,680 |
Sales Load. FDC may receive a front-end sales charge of up to 5.75% for selling Class A shares and 3.50% for selling Class T shares, some of which is paid to financial intermediaries for selling shares of the Fund. Depending on the holding period, FDC may receive contingent deferred sales charges levied on Class A, Class T, Class B, and Class C redemptions. The deferred sales charges range from 5.00% to 1.00% for Class B shares, 1.00% for Class C shares, 1.00% for certain purchases of Class A shares and .25% for certain purchases of Class T shares.
For the period, sales charge amounts retained by FDC were as follows:
| Retained |
Class A | $ 8,371 |
Class T | 2,798 |
Class B* | 370 |
Class C* | 621 |
| $ 12,160 |
* When Class B and Class C shares are initially sold, FDC pays commissions from its own resources to financial intermediaries through which the sales are made.
Transfer Agent Fees. Fidelity Investments Institutional Operations Company, Inc., (FIIOC), an affiliate of the investment adviser, is the transfer, dividend disbursing and shareholder servicing agent for each class of the Fund. FIIOC receives account fees and asset-based fees that vary according to the account size and type of account of the shareholders of the respective classes of the Fund. FIIOC pays for typesetting, printing and mailing of shareholder reports, except proxy statements.
For the period, transfer agent fees for each class were as follows:
| Amount | % of |
Class A | $ 21,689 | .30 |
Class T | 15,148 | .35 |
Class B | 1,702 | .30 |
Class C | 12,956 | .25 |
Telecommunications | 897,426 | .21 |
Institutional Class | 3,721 | .27 |
| $ 952,642 |
|
Accounting and Security Lending Fees. Fidelity Service Company, Inc. (FSC), an affiliate of the investment adviser, maintains the Fund's accounting records. The accounting fee is based on the level of average net assets for each month. Under a separate contract, FSC administers the security lending program. The security lending fee is based on the number and duration of lending transactions.
Brokerage Commissions. The Fund placed a portion of its portfolio transactions with brokerage firms which are affiliates of the investment adviser. Brokerage commissions are included in net realized gain (loss) and change in net unrealized appreciation (depreciation) in the Statement of Operations. The commissions paid to these affiliated firms were $29,221 for the period.
Interfund Lending Program. Pursuant to an Exemptive Order issued by the SEC, the Fund, along with other registered investment companies having management contracts with FMR or other affiliated entities of FMR, may participate in an interfund lending program. This program provides an
Annual Report
Notes to Financial Statements - continued
5. Fees and Other Transactions with Affiliates - continued
Interfund Lending Program - continued
alternative credit facility allowing the funds to borrow from, or lend money to, other participating affiliated funds. At period end, there were no interfund loans outstanding. The Fund's activity in this program during the period for which loans were outstanding was as follows:
Borrower or Lender | Average Loan | Weighted Average | Interest |
Borrower | $ 10,090,231 | .32% | $ 1,149 |
6. Committed Line of Credit.
The Fund participates with other funds managed by the investment adviser or an affiliate in a $4.25 billion credit facility (the "line of credit") to be utilized for temporary or emergency purposes to fund shareholder redemptions or for other short-term liquidity purposes. The Fund has agreed to pay commitment fees on its pro-rata portion of the line of credit, which amounted to $879 and is reflected in Miscellaneous expenses on the Statement of Operations. During the period, there were no borrowings on this line of credit.
7. Security Lending.
The Fund lends portfolio securities through a lending agent from time to time in order to earn additional income. For equity securities, a lending agent is used and may loan securities to certain qualified borrowers, which prior to August 1, 2013 included Fidelity Capital Markets (FCM), a broker-dealer affiliated with the Fund. On the settlement date of the loan, the Fund receives collateral (in the form of U.S. Treasury obligations, letters of credit and/or cash) against the loaned securities and maintains collateral in an amount not less than 100% of the market value of the loaned securities during the period of the loan. The market value of the loaned securities is determined at the close of business of the Fund and any additional required collateral is delivered to the Fund on the next business day. If the borrower defaults on its obligation to return the securities loaned because of insolvency or other reasons, the Fund may apply collateral received from the borrower against the obligation. The Fund may experience delays and costs in recovering the securities loaned. Any cash collateral received is invested in the Fidelity Securities Lending Cash Central Fund. The value of loaned securities and cash collateral at period end are disclosed on the Fund's Statement of Assets and Liabilities. At period end, there were no security loans outstanding with FCM. Security lending income represents the income earned on investing cash collateral, less rebates paid to borrowers and any lending agent fees associated with the loan, plus any premium payments received for lending certain types of securities. Security lending income is presented in the Statement of Operations as a component of income from Fidelity Central Funds. Total security lending income during the period amounted to $228,474, including $38,531 from securities loaned to FCM.
8. Expense Reductions.
Commissions paid to certain brokers with whom the investment adviser, or its affiliates, places trades on behalf of the Fund include an amount in addition to trade execution, which may be rebated back to the Fund to offset certain expenses. This amount totaled $112,854 for the period.
In addition, FMR reimbursed a portion of the Fund's operating expenses during the period in the amount of $1,847.
9. Distributions to Shareholders.
Distributions to shareholders of each class were as follows:
Years ended February 28, | 2014 | 2013 |
From net investment income |
|
|
Class A | $ 137,021 | $ 115,461 |
Class T | 71,145 | 65,641 |
Class B | 6,457 | 6,964 |
Class C | 68,251 | 43,780 |
Telecommunications | 8,194,747 | 8,113,006 |
Institutional Class | 29,138 | 56,226 |
Total | $ 8,506,759 | $ 8,401,078 |
From net realized gain |
|
|
Class A | $ 617 | $ - |
Class T | 373 | - |
Class B | 48 | - |
Class C | 466 | - |
Telecommunications | 30,889 | - |
Institutional Class | 118 | - |
Total | $ 32,511 | $ - |
Annual Report
10. Share Transactions.
Transactions for each class of shares were as follows:
| Shares | Dollars | ||
Years ended February 28, | 2014 | 2013 | 2014 | 2013 |
Class A |
|
|
|
|
Shares sold | 62,389 | 76,572 | $ 3,565,235 | $ 3,760,739 |
Reinvestment of distributions | 2,113 | 1,839 | 123,157 | 92,540 |
Shares redeemed | (58,169) | (54,776) | (3,308,571) | (2,738,397) |
Net increase (decrease) | 6,333 | 23,635 | $ 379,821 | $ 1,114,882 |
Class T |
|
|
|
|
Shares sold | 23,341 | 48,620 | $ 1,331,922 | $ 2,392,044 |
Reinvestment of distributions | 1,193 | 1,268 | 69,243 | 63,823 |
Shares redeemed | (32,706) | (26,195) | (1,852,992) | (1,317,712) |
Net increase (decrease) | (8,172) | 23,693 | $ (451,827) | $ 1,138,155 |
Class B |
|
|
|
|
Shares sold | 135 | 3,053 | $ 7,819 | $ 144,445 |
Reinvestment of distributions | 103 | 133 | 6,030 | 6,751 |
Shares redeemed | (2,095) | (4,941) | (116,496) | (248,673) |
Net increase (decrease) | (1,857) | (1,755) | $ (102,647) | $ (97,477) |
Class C |
|
|
|
|
Shares sold | 31,217 | 26,248 | $ 1,769,477 | $ 1,304,972 |
Reinvestment of distributions | 819 | 594 | 47,679 | 29,972 |
Shares redeemed | (22,263) | (18,620) | (1,264,412) | (912,596) |
Net increase (decrease) | 9,773 | 8,222 | $ 552,744 | $ 422,348 |
Telecommunications |
|
|
|
|
Shares sold | 3,045,047 | 3,283,802 | $ 171,993,078 | $ 158,174,294 |
Reinvestment of distributions | 136,279 | 156,090 | 7,951,397 | 7,859,416 |
Shares redeemed | (4,653,020) | (3,538,446) | (269,388,514) | (177,183,415) |
Net increase (decrease) | (1,471,694) | (98,554) | $ (89,444,039) | $ (11,149,705) |
Institutional Class |
|
|
|
|
Shares sold | 22,305 | 41,031 | $ 1,294,531 | $ 2,107,286 |
Reinvestment of distributions | 405 | 986 | 23,701 | 49,926 |
Shares redeemed | (46,560) | (13,014) | (2,517,260) | (646,240) |
Net increase (decrease) | (23,850) | 29,003 | $ (1,199,028) | $ 1,510,972 |
11. Other.
The Fund's organizational documents provide former and current trustees and officers with a limited indemnification against liabilities arising in connection with the performance of their duties to the Fund. In the normal course of business, the Fund may also enter into contracts that provide general indemnifications. The Fund's maximum exposure under these arrangements is unknown as this would be dependent on future claims that may be made against the Fund. The risk of material loss from such claims is considered remote.
At the end of the period, Fidelity VIP FundsManager 60% Portfolio was the owner of record of approximately 11% of the total outstanding shares of the Fund.
Annual Report
Report of Independent Registered Public Accounting Firm
To the Trustees of Fidelity Select Portfolios and the Shareholders of Consumer Staples Portfolio, Gold Portfolio, Materials Portfolio and Telecommunications Portfolio:
In our opinion, the accompanying statements of assets and liabilities (consolidated statement of assets and liabilities for Gold Portfolio), including the schedules of investments (consolidated schedule of investments for Gold Portfolio), and the related statements of operations (consolidated statement of operations for Gold Portfolio) and of changes in net assets (consolidated changes in net assets for Gold Portfolio) and the financial highlights present fairly, in all material respects, the financial positions of Consumer Staples Portfolio, Gold Portfolio, Materials Portfolio and Telecommunications Portfolio (funds of Fidelity Select Portfolios) at February 28, 2014, the results of each of their operations for the year then ended, the changes in each of their net assets for each of the two years in the period then ended and the financial highlights for each of the five years in the period then ended, in conformity with accounting principles generally accepted in the United States of America. These financial statements and financial highlights (hereafter referred to as "financial statements") are the responsibility of the Fidelity Select Portfolios' management. Our responsibility is to express an opinion on these financial statements based on our audits. We conducted our audits of these financial statements in accordance with the standards of the Public Company Accounting Oversight Board (United States). Those standards require that we plan and perform the audit to obtain reasonable assurance about whether the financial statements are free of material misstatement. An audit includes examining, on a test basis, evidence supporting the amounts and disclosures in the financial statements, assessing the accounting principles used and significant estimates made by management, and evaluating the overall financial statement presentation. We believe that our audits, which included confirmation of securities at February 28, 2014 by correspondence with the custodian and brokers, provide a reasonable basis for our opinion.
PricewaterhouseCoopers LLP
Boston, Massachusetts
April 17, 2014
Annual Report
Trustees and Officers
The Trustees and officers of the trust and funds, as applicable, are listed below. The Board of Trustees governs each fund and is responsible for protecting the interests of shareholders. The Trustees are experienced executives who meet periodically throughout the year to oversee each fund's activities, review contractual arrangements with companies that provide services to each fund, oversee management of the risks associated with such activities and contractual arrangements, and review each fund's performance. Except for Ned C. Lautenbach and William S. Stavropoulos, each of the Trustees oversees 74 funds. Mr. Lautenbach and Mr. Stavropoulos each oversees 246 funds.
The Trustees hold office without limit in time except that (a) any Trustee may resign; (b) any Trustee may be removed by written instrument, signed by at least two-thirds of the number of Trustees prior to such removal; (c) any Trustee who requests to be retired or who has become incapacitated by illness or injury may be retired by written instrument signed by a majority of the other Trustees; and (d) any Trustee may be removed at any special meeting of shareholders by a two-thirds vote of the outstanding voting securities of the trust. The officers hold office without limit in time, except that any officer may resign or may be removed by a vote of a majority of the Trustees at any regular meeting or any special meeting of the Trustees. Except as indicated, each individual has held the office shown or other offices in the same company for the past five years.
Experience, Skills, Attributes, and Qualifications of the Funds' Trustees. The Governance and Nominating Committee has adopted a statement of policy that describes the experience, qualifications, attributes, and skills that are necessary and desirable for potential Independent Trustee candidates (Statement of Policy). The Board believes that each Trustee satisfied at the time he or she was initially elected or appointed a Trustee, and continues to satisfy, the standards contemplated by the Statement of Policy. The Governance and Nominating Committee also engages professional search firms to help identify potential Independent Trustee candidates who have the experience, qualifications, attributes, and skills consistent with the Statement of Policy. From time to time, additional criteria based on the composition and skills of the current Independent Trustees, as well as experience or skills that may be appropriate in light of future changes to board composition, business conditions, and regulatory or other developments, have also been considered by the professional search firms and the Governance and Nominating Committee. In addition, the Board takes into account the Trustees' commitment and participation in Board and committee meetings, as well as their leadership of standing and ad hoc committees throughout their tenure.
In determining that a particular Trustee was and continues to be qualified to serve as a Trustee, the Board has considered a variety of criteria, none of which, in isolation, was controlling. The Board believes that, collectively, the Trustees have balanced and diverse experience, qualifications, attributes, and skills, which allow the Board to operate effectively in governing each fund and protecting the interests of shareholders. Information about the specific experience, skills, attributes, and qualifications of each Trustee, which in each case led to the Board's conclusion that the Trustee should serve (or continue to serve) as a trustee of the funds, is provided below.
Board Structure and Oversight Function. Brian B. Hogan is an interested person (as defined in the 1940 Act) and currently serves as Chairman. The Trustees have determined that an interested Chairman is appropriate and benefits shareholders because an interested Chairman has a personal and professional stake in the quality and continuity of services provided to the funds. Independent Trustees exercise their informed business judgment to appoint an individual of their choosing to serve as Chairman, regardless of whether the Trustee happens to be independent or a member of management. The Independent Trustees have determined that they can act independently and effectively without having an Independent Trustee serve as Chairman and that a key structural component for assuring that they are in a position to do so is for the Independent Trustees to constitute a substantial majority for the Board. The Independent Trustees also regularly meet in executive session. Michael E. Wiley serves as Chairman of the Independent Trustees and as such (i) acts as a liaison between the Independent Trustees and management with respect to matters important to the Independent Trustees and (ii) with management prepares agendas for Board meetings.
Fidelity funds are overseen by different Boards of Trustees. The funds' Board oversees Fidelity's sector portfolios. Other Boards oversee Fidelity's equity and high income funds, and Fidelity's investment grade bond, money market, and asset allocation funds. The use of separate Boards, each with its own committee structure, allows the Trustees of each group of Fidelity funds to focus on the unique issues of the funds they oversee, including common research, investment, and operational issues. On occasion, the separate Boards establish joint committees to address issues of overlapping consequences for the Fidelity funds overseen by each Board.
The Trustees operate using a system of committees to facilitate the timely and efficient consideration of all matters of importance to the Trustees, each fund, and fund shareholders and to facilitate compliance with legal and regulatory requirements and oversight of the funds' activities and associated risks. The Board, acting through its committees, has charged SelectCo and its affiliates with (i) identifying events or circumstances the occurrence of which could have demonstrably adverse effects on the funds' business and/or reputation; (ii) implementing processes and controls to lessen the possibility that such events or circumstances occur or to mitigate the effects of such events or circumstances if they do occur; and (iii) creating and maintaining a system designed to evaluate continuously business and market conditions in order to facilitate the identification and implementation processes described in (i) and (ii) above. Because the day-to-day operations and activities of the funds are carried out by or through SelectCo, its affiliates, and other service providers, the funds' exposure to risks is mitigated but not eliminated by the processes overseen by the Trustees. While each of the Board's committees has responsibility for overseeing different aspects of the funds' activities, oversight is exercised primarily through the Operations and Audit Committees. Appropriate personnel, including but not limited to the funds' Chief Compliance Officer (CCO), SelectCo's internal auditor, the independent accountants, the funds' Treasurer and portfolio management personnel, make periodic reports to the Board's committees, as appropriate. The responsibilities of each standing committee, including their oversight responsibilities, are described further under "Standing Committees of the Funds' Trustees."
The funds' Statement of Additional Information (SAI) includes more information about the Trustees. To request a free copy, call Fidelity at 1-877-208-0098.
Annual Report
Interested Trustee*:
Correspondence intended for the Trustee who is an interested person may be sent to Fidelity Investments, 245 Summer Street, Boston, Massachusetts 02210.
Name, Year of Birth; Principal Occupations and Other Relevant Experience+ | |
Brian B. Hogan (1964) | |
Year of Election or Appointment: 2014 Trustee Chairman of the Board of Trustees | |
| Mr. Hogan also serves as Trustee or Vice President of other funds. Mr. Hogan serves as President of FMR's Equity Division (2009-present). Previously, Mr. Hogan served as Senior Vice President, Equity Research of FMR (2006-2009) and as a portfolio manager. |
* Trustee has been determined to be an "Interested Trustee" by virtue of, among other things, his affiliation with the trust or various entities under common control with SelectCo.
+ The information above includes the Trustee's principal occupation during the last five years and other information relating to the experience, attributes, and skills relevant to the Trustee's qualifications to serve as a Trustee, which led to the conclusion that the Trustee should serve as a Trustee for each fund.
Independent Trustees:
Correspondence intended for each Independent Trustee (that is, the Trustees other than the Interested Trustee) may be sent to Fidelity Investments, P.O. Box 55235, Boston, Massachusetts 02205-5235.
Name, Year of Birth; Principal Occupations and Other Relevant Experience+ | |
Ned C. Lautenbach (1944) | |
Year of Election or Appointment: 2000 Trustee | |
| Mr. Lautenbach also serves as Trustee of other Fidelity funds. Mr. Lautenbach currently serves as the Lead Director of the Eaton Corporation Board of Directors (diversified industrial, 1997-present). Mr. Lautenbach is Chairman of the Board of Directors of the Philharmonic Center for the Arts in Naples, Florida (2012-present) and a member of the Council on Foreign Relations (1994-present). Previously, Mr. Lautenbach was a Partner/Advisory Partner at Clayton, Dubilier & Rice, LLC (private equity investment, 1998-2010), as well as a Director of Sony Corporation (2006-2007). |
David A. Rosow (1942) | |
Year of Election or Appointment: 2013 Trustee | |
| Mr. Rosow also serves as Trustee of other Fidelity funds. Mr. Rosow is Chairman and Chief Executive Officer of International Golf Group, Inc. (golf course development, 1989-present). Previously, Mr. Rosow served as Chairman and Chief Executive Officer of Rosow & Company, Inc. (private investment company, 1989-2011), a Lead Director of Hudson United Bancorp (2001-2006) and as a Director of TD Banknorth (1996-2006). In addition, Mr. Rosow is a member (2008-present) and President (2009-present) of the Town Council of Palm Beach, Florida. Mr. Rosow served as a Member of the Advisory Board of other Fidelity funds (2012-2013). |
Garnett A. Smith (1947) | |
Year of Election or Appointment: 2013 Trustee | |
| Mr. Smith also serves as Trustee of other Fidelity funds. Prior to Mr. Smith's retirement, he served as Chairman and Chief Executive Officer of Inbrand Corp. (manufacturer of personal absorbent products, 1990-1997). He also served as President (1986-1990) of Inbrand Corp. Prior to his employment with Inbrand Corp., he was employed by a retail fabric chain and North Carolina National Bank. In addition, Mr. Smith is a board member of the Jackson Hole Land Trust (2009-present). Mr. Smith served as a Member of the Advisory Board of other Fidelity funds (2012-2013). |
William S. Stavropoulos (1939) | |
Year of Election or Appointment: 2001 Trustee | |
| Mr. Stavropoulos also serves as Trustee of other Fidelity funds. Mr. Stavropoulos serves as President and Founder of the Michigan Baseball Foundation, the Great Lakes Loons (2007-present). Mr. Stavropoulos is Chairman Emeritus of the Board of Directors of The Dow Chemical Company, where he previously served in numerous senior management positions, including President, CEO (1995-2000; 2002-2004), Chairman of the Executive Committee (2000-2006), and as a member of the Board of Directors (1990-2006). Currently, Mr. Stavropoulos is Chairman of the Board of Directors of Univar Inc. (global distributor of commodity and specialty chemicals), a Director of Teradata Corporation (data warehousing and technology solutions), and Maersk Inc. (industrial conglomerate), and a member of the Advisory Board for Metalmark Capital LLC (private equity investment, 2005-present). Mr. Stavropoulos is an operating advisor to Clayton, Dubilier & Rice, LLC (private equity investment). In addition, Mr. Stavropoulos is a member of the University of Notre Dame Advisory Council for the College of Science, a Trustee of the Rollin L. Gerstacker Foundation, and a Director of the Naples Philharmonic Center for the Arts. Previously, Mr. Stavropoulos served as a Director of Chemical Financial Corporation (bank holding company, 1993-2012) and Tyco International, Ltd. (multinational manufacturing and services, 2007-2012). |
Michael E. Wiley (1950) | |
Year of Election or Appointment: 2008 Trustee Chairman of the Independent Trustees | |
| Mr. Wiley also serves as Trustee of other Fidelity funds. Mr. Wiley serves as a Director of Asia Pacific Exploration Consolidated (international oil and gas exploration and production, 2008-present). Mr. Wiley serves as a Director of Tesoro Corporation (independent oil refiner and marketer, 2005-present), and a Director of Bill Barrett Corporation (exploration and production, 2005-present). In addition, Mr. Wiley also serves as a Director of Post Oak Bank (privately-held bank, 2004-present). Previously, Mr. Wiley served as a Trustee of other Fidelity funds (2008-2013), as a member of the Board of Trustees of the University of Tulsa (2000-2006; 2007-2010), as a Senior Energy Advisor of Katzenbach Partners, LLC (consulting, 2006-2007), as an Advisory Director of Riverstone Holdings (private investment), Chairman, President, and CEO of Baker Hughes, Inc. (oilfield services, 2000-2004), and as Director of Spinnaker Exploration Company (exploration and production, 2001-2005). |
+ The information above includes each Trustee's principal occupation during the last five years and other information relating to the experience, attributes, and skills relevant to each Trustee's qualifications to serve as a Trustee, which led to the conclusion that each Trustee should serve as a Trustee for each fund.
Officers:
Except for Anthony R. Rochte, correspondence intended for each officer may be sent to Fidelity Investments, 245 Summer Street, Boston, Massachusetts 02210. Correspondence intended for Mr. Rochte may be sent to SelectCo, 1225 17th Street, Denver, Colorado 80202-5541. Officers appear below in alphabetical order.
Name, Year of Birth; Principal Occupation | |
Christopher S. Bartel (1971) | |
Year of Election or Appointment: 2009 Vice President | |
| Mr. Bartel also serves as Vice President of other funds. Mr. Bartel serves as a Director, President, and Chief Executive Officer of Fidelity Management & Research (Japan) Inc. (2012-present), a Director of Fidelity Management & Research (Hong Kong) (2012-present), and Senior Vice President of Global Equity Research (2010-present). Previously, Mr. Bartel served as Senior Vice President of Equity Research (2009-2010), Managing Director of Research (2006-2009), and an analyst and portfolio manager (2000-2006). |
Elizabeth Paige Baumann (1968) | |
Year of Election or Appointment: 2012 Anti-Money Laundering (AML) Officer | |
| Ms. Baumann also serves as AML Officer of other funds. She is Chief AML Officer of FMR LLC (2012-present) and is an employee of Fidelity Investments. Previously, Ms. Baumann served as Vice President and Deputy Anti-Money Laundering Officer (2007-2012). |
Marc Bryant (1966) | |
Year of Election or Appointment: 2013 Secretary | |
| Mr. Bryant also serves as an officer of other funds. He is Senior Vice President and Deputy General Counsel of FMR LLC. Prior to joining Fidelity Investments, Mr. Bryant served as a Senior Vice President and the Head of Global Retail Legal for AllianceBernstein L.P. (2006-2010), and as the General Counsel for ProFund Advisors LLC (2001-2006). |
William C. Coffey (1969) | |
Year of Election or Appointment: 2009 Assistant Secretary | |
| Mr. Coffey also serves as Assistant Secretary of other funds. He is Senior Vice President and Deputy General Counsel of FMR LLC (2010-present), and is an employee of Fidelity Investments. Previously, Mr. Coffey served as Vice President and Associate General Counsel of FMR LLC (2005-2009). |
Jonathan Davis (1968) | |
Year of Election or Appointment: 2010 Assistant Treasurer | |
| Mr. Davis also serves as Assistant Treasurer of other funds. Mr. Davis is an employee of Fidelity Investments. Previously, Mr. Davis served as Vice President and Associate General Counsel of FMR LLC (2003-2010). |
Adrien E. Deberghes (1967) | |
Year of Election or Appointment: 2013 President and Treasurer | |
| Mr. Deberghes also serves as an officer of other funds. He is an employee of Fidelity Investments (2008-present). Prior to joining Fidelity Investments, Mr. Deberghes was Senior Vice President of Mutual Fund Administration at State Street Corporation (2007-2008), Senior Director of Mutual Fund Administration at Investors Bank & Trust (2005-2007), and Director of Finance for Dunkin' Brands (2000-2005). |
Stephanie J. Dorsey (1969) | |
Year of Election or Appointment: 2010 Assistant Treasurer | |
| Ms. Dorsey also serves as an officer of other funds. She is an employee of Fidelity Investments (2008-present) and has served in other fund officer roles. Prior to joining Fidelity Investments, Ms. Dorsey served as Treasurer (2004-2008) of the JPMorgan Mutual Funds and Vice President (2004-2008) of JPMorgan Chase Bank. |
Joseph A. Hanlon (1968) | |
Year of Election or Appointment: 2012 Chief Compliance Officer | |
| Mr. Hanlon also serves as Chief Compliance Officer of other funds. Mr. Hanlon serves as Compliance Officer of FMR, FMR Co., Inc., Fidelity Investments Money Management, Inc. (FIMM), Fidelity Research and Analysis Company (FRAC), and Fidelity Management & Research (Hong Kong) (2009-present), as Senior Vice President of the Fidelity Asset Management Division (2009-present), and is an employee of Fidelity Investments. Previously, Mr. Hanlon served as Compliance Officer of Fidelity Management & Research (Japan) Inc. (2009-2013), Strategic Advisers, Inc. (2009-2013), and Fidelity Management & Research (U.K.) Inc. (2009-2013). |
Brian B. Hogan (1964) | |
Year of Election or Appointment: 2009 Vice President | |
| Mr. Hogan also serves as Trustee or Vice President of other funds. Mr. Hogan serves as President of FMR's Equity Division (2009-present). Previously, Mr. Hogan served as Senior Vice President, Equity Research of FMR (2006-2009) and as a portfolio manager. |
Chris Maher (1972) | |
Year of Election or Appointment: 2013 Assistant Treasurer | |
| Mr. Maher serves as Assistant Treasurer of other funds. Mr. Maher is Vice President of Valuation Oversight and is an employee of Fidelity Investments. Previously, Mr. Maher served as Vice President of Asset Management Compliance (2013), Vice President of FMR's Program Management Group (2010-2013), and Vice President of Valuation Oversight (2008-2010). |
Christine Reynolds (1958) | |
Year of Election or Appointment: 2008 Chief Financial Officer | |
| Ms. Reynolds also serves as Chief Financial Officer of other funds. Ms. Reynolds became President of Fidelity Pricing and Cash Management Services (FPCMS) in August 2008. Ms. Reynolds served as Chief Operating Officer of FPCMS (2007-2008). Previously, Ms. Reynolds served as President, Treasurer, and Anti-Money Laundering officer of the Fidelity funds (2004-2007). |
Kenneth B. Robins (1969) | |
Year of Election or Appointment: 2013 Deputy Treasurer | |
| Mr. Robins also serves as an officer of other funds. Mr. Robins serves as Executive Vice President of Fidelity Investments Money Management, Inc. (FIMM) (2013-present) and is an employee of Fidelity Investments (2004-present). Previously, Mr. Robins served in other fund officer roles. |
Anthony R. Rochte (1968) | |
Year of Election or Appointment: 2013 Vice President | |
| Mr. Rochte also serves as Vice President of other funds. Mr. Rochte serves as President of Fidelity SelectCo, LLC (2012-present) and is an employee of Fidelity Investments (2012-present). Prior to joining Fidelity Investments, Mr. Rochte served as Senior Managing Director and head of State Street Global Advisors' North American Intermediary Business Group (2006-2012). |
Stacie M. Smith (1974) | |
Year of Election or Appointment: 2013 Assistant Treasurer | |
| Ms. Smith also serves as an officer of other funds. She is an employee of Fidelity Investments (2009-present) and has served in other fund officer roles. Prior to joining Fidelity Investments, Ms. Smith served as Senior Audit Manager of Ernst & Young LLP (1996-2009). |
Renee Stagnone (1975) | |
Year of Election or Appointment: 2013 Deputy Treasurer | |
| Ms. Stagnone also serves as Deputy Treasurer of other funds. Ms. Stagnone is an employee of Fidelity Investments. |
Joseph F. Zambello (1957) | |
Year of Election or Appointment: 2011 Deputy Treasurer | |
| Mr. Zambello also serves as Deputy Treasurer of other funds. Mr. Zambello is an employee of Fidelity Investments. Previously, Mr. Zambello served as Vice President of FMR's Program Management Group (2009-2011) and Vice President of the Transfer Agent Oversight Group (2005-2009). |
Annual Report
Distributions (Unaudited)
The Board of Trustees of each fund voted to pay to shareholders of record at the opening of business on record date, the following distributions per share derived from capital gains realized from sales of portfolio securities and dividends derived from net investment income:
Consumer Staples Portfolio | Pay Date | Record Date | Dividends | Capital Gains |
Class A | 04/14/14 | 04/11/14 | $0.216 | $2.753 |
Class T | 04/14/14 | 04/11/14 | $0.176 | $2.753 |
Class B | 04/14/14 | 04/11/14 | $0.100 | $2.753 |
Class C | 04/14/14 | 04/11/14 | $0.110 | $2.753 |
Gold Portfolio | Pay Date | Record Date | Dividends | Capital Gains |
Class A | 04/14/14 | 04/11/14 | $0.000 | $0.000 |
Class T | 04/14/14 | 04/11/14 | $0.000 | $0.000 |
Class B | 04/14/14 | 04/11/14 | $0.000 | $0.000 |
Class C | 04/14/14 | 04/11/14 | $0.000 | $0.000 |
Materials Portfolio | Pay Date | Record Date | Dividends | Capital Gains |
Class A | 04/14/14 | 04/11/14 | $0.082 | $2.337 |
Class T | 04/14/14 | 04/11/14 | $0.039 | $2.337 |
Class B | 04/14/14 | 04/11/14 | $0.000 | $2.337 |
Class C | 04/14/14 | 04/11/14 | $0.000 | $2.337 |
Telecommunications Portfolio | Pay Date | Record Date | Dividends | Capital Gains |
Class A | 04/14/14 | 04/11/14 | $1.242 | $0.000 |
Class T | 04/14/14 | 04/11/14 | $1.203 | $0.000 |
Class B | 04/14/14 | 04/11/14 | $1.147 | $0.000 |
Class C | 04/14/14 | 04/11/14 | $1.165 | $0.000 |
The funds hereby designate as capital gain dividend the amounts noted below for the taxable year ended February 28, 2014, or, if subsequently determined to be different, the net capital gain of such year.
Fund | |
Consumer Staples Portfolio | $154,311,669 |
Materials Portfolio | $93,576,128 |
A percentage of the dividends distributed during the fiscal year for the following funds qualifies for the dividends-received deduction for corporate shareholders:
| April 2013 | December 2013 |
Consumer Staples Portfolio |
|
|
Class A | 84% | 100% |
Class T | 100% | 100% |
Class B | 100% | 100% |
Class C | 100% | 100% |
Materials Portfolio |
|
|
Class A | 100% | 100% |
Class T | 0% | 100% |
Class B | 0% | 0% |
Class C | 0% | 0% |
Telecommunications Portfolio |
|
|
Class A | 100% | 100% |
Class T | 100% | 100% |
Class B | 100% | 100% |
Class C | 100% | 100% |
Annual Report
Distributions (Unaudited) - continued
A percentage of the dividends distributed during the fiscal year for the following funds may be taken into account as a dividend for purposes of the maximum rate under section 1(h)(11) of the Internal Revenue Code.
| April 2013 | December 2013 |
Consumer Staples Portfolio |
|
|
Class A | 100% | 100% |
Class T | 100% | 100% |
Class B | 100% | 100% |
Class C | 100% | 100% |
Materials Portfolio |
|
|
Class A | 100% | 100% |
Class T | 0% | 100% |
Class B | 0% | 0% |
Class C | 0% | 0% |
Telecommunications Portfolio |
|
|
Class A | 100% | 100% |
Class T | 100% | 100% |
Class B | 100% | 100% |
Class C | 100% | 100% |
The fund will notify shareholders in January 2015 of amounts for use in preparing 2014 income tax returns.
Annual Report
Proxy Voting Results
A special meeting of each fund's shareholders was held on June 18, 2013. The results of votes taken among shareholders on the proposals before them are reported below. Each vote reported represents one dollar of net asset value held on the record date for the meeting.
PROPOSAL 1 | ||
To elect a Board of Trustees.A | ||
| # of | % of |
Ned C. Lautenbach | ||
Affirmative | 25,828,395,115.78 | 94.160 |
Withheld | 1,602,101,684.27 | 5.840 |
TOTAL | 27,430,496,800.05 | 100.000 |
Ronald P. O'Hanley | ||
Affirmative | 25,907,936,922.24 | 94.450 |
Withheld | 1,522,559,877.81 | 5.550 |
TOTAL | 27,430,496,800.05 | 100.000 |
David A. Rosow | ||
Affirmative | 25,805,492,959.91 | 94.076 |
Withheld | 1,625,003,840.14 | 5.924 |
TOTAL | 27,430,496,800.05 | 100.000 |
Garnett A. Smith | ||
Affirmative | 25,892,258,831.97 | 94.393 |
Withheld | 1,538,237,968.08 | 5.607 |
TOTAL | 27,430,496,800.05 | 100.000 |
William S. Stavropoulos | ||
Affirmative | 25,738,476,030.34 | 93.832 |
Withheld | 1,692,020,769.71 | 6.168 |
TOTAL | 27,430,496,800.05 | 100.000 |
Michael E. Wiley | ||
Affirmative | 25,923,640,743.27 | 94.507 |
Withheld | 1,506,856,056.78 | 5.493 |
TOTAL | 27,430,496,800.05 | 100.000 |
PROPOSAL 2 | ||
To approve a management contract between Consumer Staples Portfolio and Fidelity SelectCo, LLC. | ||
| # of | % of |
Affirmative | 1,231,896,932.45 | 72.402 |
Against | 59,201,079.18 | 3.479 |
Abstain | 62,956,309.82 | 3.700 |
Broker Non-Vote | 347,429,518.32 | 20.419 |
TOTAL | 1,701,483,839.77 | 100.000 |
PROPOSAL 2 | ||
To approve a management contract between Gold Portfolio and Fidelity SelectCo, LLC. | ||
| # of | % of |
Affirmative | 1,324,132,405.74 | 82.001 |
Against | 87,695,443.27 | 5.431 |
Abstain | 81,563,532.56 | 5.051 |
Broker Non-Vote | 121,395,496.57 | 7.517 |
TOTAL | 1,614,786,878.14 | 100.000 |
PROPOSAL 2 | ||
To approve a management contract between Materials Portfolio and Fidelity SelectCo, LLC. | ||
| # of | % of |
Affirmative | 782,680,671.91 | 69.186 |
Against | 33,398,286.37 | 2.953 |
Abstain | 38,711,653.50 | 3.421 |
Broker Non-Vote | 276,491,097.39 | 24.440 |
TOTAL | 1,131,281,709.17 | 100.000 |
PROPOSAL 2 | ||
To approve a management contract between Telecommunications Portfolio and Fidelity SelectCo, LLC. | ||
| # of | % of |
Affirmative | 208,420,238.27 | 81.880 |
Against | 18,588,167.85 | 7.302 |
Abstain | 11,559,235.71 | 4.541 |
Broker Non-Vote | 15,977,976.37 | 6.277 |
TOTAL | 254,545,618.20 | 100.000 |
A Denotes trust-wide proposal and voting results.
Annual Report
Investment Adviser
Fidelity SelectCo, LLC
Denver, CO
Investment Sub-Advisers
FMR Co., Inc.
Fidelity Management & Research
(U.K.) Inc.
Fidelity Management & Research
(Hong Kong) Limited
Fidelity Management & Research
(Japan) Inc.
General Distributor
Fidelity Distributors Corporation
Smithfield, RI
Transfer and Service Agents
Fidelity Investments Institutional
Operations Company, Inc.
Boston, MA
Fidelity Service Company, Inc.
Boston, MA
Custodian
Brown Brothers Harriman & Co.
Boston, MA
(Fidelity Investment logo)(registered trademark)
Corporate Headquarters
245 Summer St., Boston, MA 02210
www.fidelity.com
ASGMT-UANN-0414
1.845779.107
Fidelity Advisor
Focus Funds®
Institutional Class
Fidelity Advisor® Consumer Staples Fund
Fidelity Advisor Gold Fund
Fidelity Advisor Materials Fund
Fidelity Advisor Telecommunications Fund
Each Advisor fund listed above is a class
of the Fidelity® Select Portfolios®.
Annual Report
February 28, 2014
(Fidelity Cover Art)
Contents
Fidelity Advisor® Consumer Staples Fund | Performance | |
| Management's Discussion | |
| Shareholder Expense Example | |
| Investment Changes | |
| Investments | |
| Financial Statements | |
| Notes to the Financial Statements | |
Fidelity Advisor Gold Fund | Performance | |
| Management's Discussion | |
| Shareholder Expense Example | |
| Consolidated Investment Changes | |
| Consolidated Investments | |
| Consolidated Financial Statements | |
| Notes to the Consolidated Financial Statements | |
Fidelity Advisor Materials Fund | Performance | |
| Management's Discussion | |
| Shareholder Expense Example | |
| Investment Changes | |
| Investments | |
| Financial Statements | |
| Notes to the Financial Statements | |
Fidelity Advisor Telecommunications Fund | Performance | |
| Management's Discussion | |
| Shareholder Expense Example | |
| Investment Changes | |
| Investments | |
| Financial Statements | |
| Notes to the Financial Statements | |
Report of Independent Registered Public Accounting Firm |
| |
Trustees and Officers |
| |
Distributions |
| |
Proxy Voting Results |
|
To view a fund's proxy voting guidelines and proxy voting record for the 12-month period ended June 30, visit http://www.fidelity.com/proxyvotingresults or visit the Securities and Exchange Commission's (SEC) web site at http://www.sec.gov. You may also call 1-877-208-0098 to request a free copy of the proxy voting guidelines.
Standard & Poor's, S&P and S&P 500 are registered service marks of The McGraw-Hill Companies, Inc. and have been licensed for use by Fidelity Distributors Corporation.
Other third-party marks appearing herein are the property of their respective owners.
All other marks appearing herein are registered or unregistered trademarks or service marks of FMR LLC or an affiliated company. © 2014 FMR LLC. All rights reserved.
This report and the financial statements contained herein are submitted for the general information of the shareholders of the funds. This report is not authorized for distribution to prospective investors in the funds unless preceded or accompanied by an effective prospectus.
A fund files its complete schedule of portfolio holdings with the SEC for the first and third quarters of each fiscal year on Form N-Q. Forms N-Q are available on the SEC's web site at http://www.sec.gov. A fund's Forms N-Q may be reviewed and copied at the SEC's Public Reference Room in Washington, DC. Information regarding the operation of the SEC's Public Reference Room may be obtained by calling 1-800-SEC-0330. For a complete list of a fund's portfolio holdings, view the most recent holdings listing, semiannual report, or annual report on Fidelity's web site at http://www.fidelity.com, http://www.advisor.fidelity.com, or http://www.401k.com, as applicable.
NOT FDIC INSURED • MAY LOSE VALUE • NO BANK GUARANTEE
Neither the funds nor Fidelity Distributors Corporation is a bank.
Annual Report
Fidelity Advisor® Consumer Staples Fund - Institutional Class
Performance: The Bottom Line
Average annual total return reflects the change in the value of an investment, assuming reinvestment of the class' distributions from dividend income and capital gains (the profits earned upon the sale of securities that have grown in value, if any) and assuming a constant rate of performance each year. The $10,000 table and the fund's returns do not reflect the deduction of taxes that a shareholder would pay on fund distributions or the redemption of fund shares. During periods of reimbursement by Fidelity, a fund's total return will be greater than it would be had the reimbursement not occurred. How a fund did yesterday is no guarantee of how it will do tomorrow.
Average Annual Total Returns
Periods ended February 28, 2014 | Past 1 | Past 5 | Past 10 |
Institutional Class A | 10.80% | 19.25% | 10.64% |
A The initial offering of Institutional Class shares took place on December 12, 2006. Returns prior to December 12, 2006, are those of Consumer Staples Portfolio, the original class of the fund.
Prior to October 1, 2006, the fund was named Food and Agriculture Portfolio, and the fund operated under certain different investment policies and compared its performance to a different additional index. The fund's historical performance may not represent its current investment policies.
$10,000 Over 10 Years
Let's say hypothetically that $10,000 was invested in Fidelity Advisor Consumer Staples Fund - Institutional Class on February 29, 2004. The chart shows how the value of your investment would have changed, and also shows how the S&P 500® Index performed over the same period. See footnote A for additional information regarding the performance of Institutional Class.
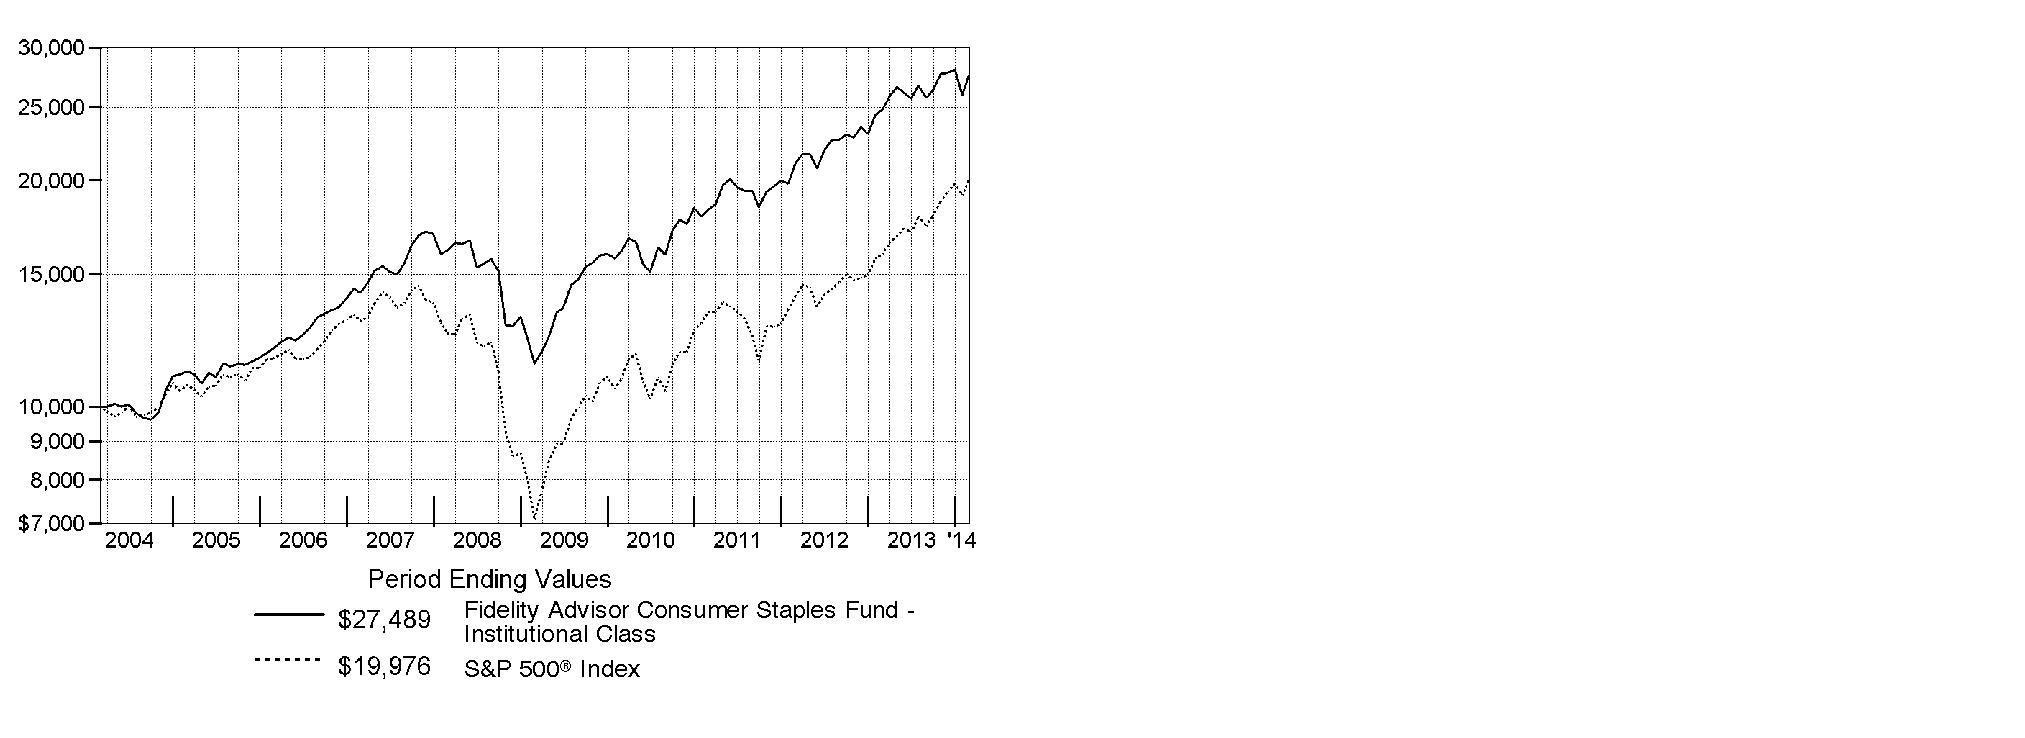
Annual Report
Fidelity Advisor Consumer Staples Fund
Management's Discussion of Fund Performance
Market Recap: Stocks overcame fears of higher interest rates - not to mention their worst January in four years - to finish sharply higher for the 12 months ending February 28, 2014. The broad S&P 500® Index and the blue-chip Dow Jones Industrial AverageSM gained 25.37% and 19.01%, respectively, amid generally favorable earnings reports and accommodative monetary policies worldwide. Performance generally increased along the risk spectrum, with smaller-cap and growth strategies leading the way. An ebullient market helped the growth-oriented Nasdaq Composite Index® to a 38.10% period gain, for example. On the other hand, both cyclical and defensive stocks had representation in the top-performing industry sectors: returns were highest in health care and consumer discretionary; lowest in utilities and telecommunication services. From a macroeconomic perspective, data still points to slow but steady improvement in the U.S., and Europe's recession may well be over. Reports from China have disappointed, but continue to suggest a relatively soft landing there. Mixed signals from the U.S. Federal Reserve as to when it might curtail its stimulative bond buying kept markets in flux during the spring and summer. Stocks regained momentum in October despite a federal budget impasse and brief government shutdown, and lower volatility prevailed through year-end. Shedding new-year concerns about China's economy, an emerging-markets sell-off and confirmation (at last) of Fed tapering - alongside confirmation of a presumably dovish Janet Yellen as new Fed chair - February saw stocks back in record territory, bearing down on the five-year anniversary of the market's bottom.
Comments from Robert Lee, Portfolio Manager of Fidelity Advisor® Consumer Staples Fund: For the year, the fund's Institutional Class shares returned 10.80%, underperforming the 15.64% gain of the sector benchmark, the MSCI® U.S. IMI Consumer Staples 25-50 Index, and the broadly based S&P 500®. Consumer staples stocks delivered a strong absolute return but trailed many other sectors, which is not unusual in a year when the broader market is up as strong as it was. Additionally, investors' preference for U.S.-based companies didn't help staples stocks overall - given their global nature - or the fund since I tend to focus on owning large multinational companies regardless of where they're based. Versus the sector benchmark, French firms Remy Cointreau and Pernod Ricard detracted the most, largely due to a sudden slowdown in their sales in China following new restrictions on gifting high-end spirits to government officials. It also hurt to hold a sizable non-index position in British American Tobacco (BAT), our largest holding. The company continued to put up impressive earnings, despite its shares struggling amid currency headwinds, global regulatory concerns for the tobacco industry and a lot of media attention on the potential long-term competitive impact of electronic cigarettes. But my long-term view of BAT's earnings growth remained unchanged. On the plus side, the fund's underweighting in Philip Morris contributed to relative performance. A big overweighting in retail pharmacy operator CVS Caremark also added nice value. CVS is a great example of a U.S.-based company that I think is poised for long-term growth, especially given its pharmacy benefit management (PBM) division's position to serve an aging U.S. population. Consistent with my process, though, I did modestly trim our stake late in the period as the stock's outperformance caused its valuation to become relatively less attractive.
The views expressed above reflect those of the portfolio manager(s) only through the end of the period as stated on the cover of this report and do not necessarily represent the views of Fidelity or any other person in the Fidelity organization. Any such views are subject to change at any time based upon market or other conditions and Fidelity disclaims any responsibility to update such views. These views may not be relied on as investment advice and, because investment decisions for a Fidelity fund are based on numerous factors, may not be relied on as an indication of trading intent on behalf of any Fidelity fund.
Annual Report
Consumer Staples Portfolio
Shareholder Expense Example
As a shareholder of the Fund, you incur two types of costs: (1) transaction costs including sales charges (loads) on purchase payments or redemption proceeds, redemption fees and (2) ongoing costs, including management fees, distribution and/or service (12b-1) fees and other Fund expenses. This Example is intended to help you understand your ongoing costs (in dollars) of investing in the Fund and to compare these costs with the ongoing costs of investing in other mutual funds.
The Example is based on an investment of $1,000 invested at the beginning of the period and held for the entire period (September 1, 2013 to February 28, 2014).
Actual Expenses
The first line of the accompanying table for each class of the Fund provides information about actual account values and actual expenses. You may use the information in this line, together with the amount you invested, to estimate the expenses that you paid over the period. Simply divide your account value by $1,000.00 (for example, an $8,600 account value divided by $1,000.00 = 8.6), then multiply the result by the number in the first line for a class of the Fund under the heading entitled "Expenses Paid During Period" to estimate the expenses you paid on your account during this period. A small balance maintenance fee of $12.00 that is charged once a year may apply for certain accounts with a value of less than $2,000. This fee is not included in the table below. If it was, the estimate of expenses you paid during the period would be higher, and your ending account value lower, by this amount. In addition, the Fund, as a shareholder in the underlying Fidelity Central Funds, will indirectly bear its pro-rata share of the fees and expenses incurred by the underlying Fidelity Central Funds. These fees and expenses are not included in the Fund's annualized expense ratio used to calculate the expense estimate in the table below.
Hypothetical Example for Comparison Purposes
The second line of the accompanying table for each class of the Fund provides information about hypothetical account values and hypothetical expenses based on a Class' actual expense ratio and an assumed rate of return of 5% per year before expenses, which is not the Class' actual return. The hypothetical account values and expenses may not be used to estimate the actual ending account balance or expenses you paid for the period. You may use this information to compare the ongoing costs of investing in the Fund and other funds. To do so, compare this 5% hypothetical example with the 5% hypothetical examples that appear in the shareholder reports of the other funds. A small balance maintenance fee of $12.00 that is charged once a year may apply for certain accounts with a value of less than $2,000. This fee is not included in the table below. If it was, the estimate of expenses you paid during the period would be higher, and your ending account value lower, by this amount. In addition, the Fund, as a shareholder in the underlying Fidelity Central Funds, will indirectly bear its pro-rata share of the fees and expenses incurred by the underlying Fidelity Central Funds. These fees and expenses are not included in the Fund's annualized expense ratio used to calculate the expense estimate in the table below.
Please note that the expenses shown in the table are meant to highlight your ongoing costs only and do not reflect any transaction costs. Therefore, the second line of the table is useful in comparing ongoing costs only, and will not help you determine the relative total costs of owning different funds. In addition, if these transactional costs were included, your costs would have been higher.
| Annualized | Beginning | Ending | Expenses Paid |
Class A | 1.06% |
|
|
|
Actual |
| $ 1,000.00 | $ 1,067.30 | $ 5.43 |
HypotheticalA |
| $ 1,000.00 | $ 1,019.54 | $ 5.31 |
Class T | 1.33% |
|
|
|
Actual |
| $ 1,000.00 | $ 1,065.80 | $ 6.81 |
HypotheticalA |
| $ 1,000.00 | $ 1,018.20 | $ 6.66 |
Class B | 1.85% |
|
|
|
Actual |
| $ 1,000.00 | $ 1,063.00 | $ 9.46 |
HypotheticalA |
| $ 1,000.00 | $ 1,015.62 | $ 9.25 |
Class C | 1.81% |
|
|
|
Actual |
| $ 1,000.00 | $ 1,063.10 | $ 9.26 |
HypotheticalA |
| $ 1,000.00 | $ 1,015.82 | $ 9.05 |
Consumer Staples | .79% |
|
|
|
Actual |
| $ 1,000.00 | $ 1,068.70 | $ 4.05 |
HypotheticalA |
| $ 1,000.00 | $ 1,020.88 | $ 3.96 |
Institutional Class | .81% |
|
|
|
Actual |
| $ 1,000.00 | $ 1,068.70 | $ 4.15 |
HypotheticalA |
| $ 1,000.00 | $ 1,020.78 | $ 4.06 |
A 5% return per year before expenses
B Annualized expense ratio reflects expenses net of applicable fee waivers.
* Expenses are equal to each Class' annualized expense ratio, multiplied by the average account value over the period, multiplied by 181/365 (to reflect the one-half year period).
Annual Report
Consumer Staples Portfolio
Investment Changes (Unaudited)
Top Ten Stocks as of February 28, 2014 | ||
| % of fund's | % of fund's net assets |
British American Tobacco PLC sponsored ADR | 14.5 | 14.6 |
The Coca-Cola Co. | 11.4 | 12.0 |
Procter & Gamble Co. | 11.2 | 12.3 |
CVS Caremark Corp. | 8.2 | 8.8 |
Kroger Co. | 4.9 | 4.5 |
Altria Group, Inc. | 4.9 | 4.9 |
Wal-Mart Stores, Inc. | 4.9 | 3.3 |
Bunge Ltd. | 2.8 | 2.5 |
Mead Johnson Nutrition Co. | 2.7 | 1.8 |
PepsiCo, Inc. | 2.5 | 1.9 |
| 68.0 | |
Top Industries (% of fund's net assets) | |||
As of February 28, 2014 | |||
 | Beverages | 25.9% |
|
 | Tobacco | 24.3% |
|
 | Food & Staples Retailing | 19.3% |
|
 | Household Products | 13.3% |
|
 | Food Products | 13.1% |
|
 | All Others* | 4.1% |
|

As of August 31, 2013 | |||
| Beverages | 27.1% |
|
| Tobacco | 23.8% |
|
| Food & Staples Retailing | 18.9% |
|
| Household Products | 14.4% |
|
| Food Products | 11.2% |
|
| All Others* | 4.6% |
|

* Includes short-term investments and net other assets (liabilities). |
Annual Report
Consumer Staples Portfolio
Investments February 28, 2014
Showing Percentage of Net Assets
Common Stocks - 97.5% | |||
Shares | Value | ||
BEVERAGES - 25.6% | |||
Brewers - 3.5% | |||
Anadolu Efes Biracilik Ve Malt Sanayii A/S | 264,272 | $ 2,785,901 | |
Anheuser-Busch InBev SA NV | 239,590 | 25,059,691 | |
SABMiller PLC | 889,484 | 43,597,239 | |
| 71,442,831 | ||
Distillers & Vintners - 6.6% | |||
Diageo PLC sponsored ADR (d) | 349,126 | 43,888,629 | |
Pernod Ricard SA | 400,401 | 47,137,523 | |
Remy Cointreau SA (d) | 485,783 | 41,237,365 | |
Treasury Wine Estates Ltd. | 1,318,976 | 4,554,944 | |
| 136,818,461 | ||
Soft Drinks - 15.5% | |||
Coca-Cola Bottling Co. Consolidated | 69,562 | 5,261,670 | |
Coca-Cola Central Japan Co. Ltd. | 54,000 | 1,238,970 | |
Coca-Cola FEMSA S.A.B. de CV sponsored ADR (d) | 47,229 | 4,579,796 | |
Coca-Cola Icecek A/S | 388,162 | 7,498,933 | |
Embotelladora Andina SA: | |||
ADR | 266,112 | 4,859,205 | |
sponsored ADR | 197,000 | 4,540,850 | |
Fomento Economico Mexicano S.A.B. de CV sponsored ADR | 56,787 | 4,862,103 | |
PepsiCo, Inc. | 642,023 | 51,406,782 | |
The Coca-Cola Co. | 6,123,818 | 233,929,848 | |
| 318,178,157 | ||
TOTAL BEVERAGES | 526,439,449 | ||
FOOD & STAPLES RETAILING - 19.3% | |||
Drug Retail - 8.6% | |||
Clicks Group Ltd. | 331,249 | 1,729,419 | |
CVS Caremark Corp. | 2,320,776 | 169,741,557 | |
Drogasil SA | 812,600 | 5,728,661 | |
| 177,199,637 | ||
Food Retail - 5.6% | |||
Fresh Market, Inc. (a) | 186,046 | 6,232,541 | |
Kroger Co. | 2,428,818 | 101,864,627 | |
Whole Foods Market, Inc. | 135,200 | 7,307,560 | |
| 115,404,728 | ||
Hypermarkets & Super Centers - 5.1% | |||
Costco Wholesale Corp. | 32,350 | 3,778,480 | |
Wal-Mart Stores, Inc. | 1,352,356 | 101,020,993 | |
| 104,799,473 | ||
TOTAL FOOD & STAPLES RETAILING | 397,403,838 | ||
| |||
Shares | Value | ||
FOOD PRODUCTS - 13.1% | |||
Agricultural Products - 5.1% | |||
Archer Daniels Midland Co. | 1,076,616 | $ 43,710,610 | |
Bunge Ltd. | 712,413 | 56,715,199 | |
SLC Agricola SA | 658,600 | 5,069,935 | |
| 105,495,744 | ||
Packaged Foods & Meats - 8.0% | |||
Annie's, Inc. (a) | 154,114 | 5,776,193 | |
Danone SA | 76,131 | 5,368,431 | |
Green Mountain Coffee Roasters, Inc. (d) | 283,237 | 31,093,758 | |
Lindt & Spruengli AG | 126 | 7,315,736 | |
Mead Johnson Nutrition Co. Class A | 686,316 | 55,969,070 | |
Nestle SA | 326,295 | 24,650,014 | |
Orion Corp. | 6,025 | 5,045,034 | |
The Hain Celestial Group, Inc. (a) | 64,239 | 5,736,543 | |
Ulker Biskuvi Sanayi A/S | 784,525 | 4,348,120 | |
Unilever NV (NY Reg.) | 392,298 | 15,519,309 | |
Want Want China Holdings Ltd. | 1,511,000 | 2,297,492 | |
| 163,119,700 | ||
TOTAL FOOD PRODUCTS | 268,615,444 | ||
HOTELS, RESTAURANTS & LEISURE - 0.3% | |||
Restaurants - 0.3% | |||
ARAMARK Holdings Corp. | 192,500 | 5,420,800 | |
HOUSEHOLD DURABLES - 0.2% | |||
Housewares & Specialties - 0.2% | |||
Tupperware Brands Corp. | 59,500 | 4,676,700 | |
HOUSEHOLD PRODUCTS - 13.3% | |||
Household Products - 13.3% | |||
Colgate-Palmolive Co. | 599,575 | 37,671,297 | |
Procter & Gamble Co. | 2,918,165 | 229,542,859 | |
Svenska Cellulosa AB (SCA) (B Shares) | 173,300 | 5,262,532 | |
| 272,476,688 | ||
PERSONAL PRODUCTS - 1.2% | |||
Personal Products - 1.2% | |||
Hengan International Group Co. Ltd. | 468,500 | 5,086,125 | |
Herbalife Ltd. | 99,890 | 6,652,674 | |
L'Oreal SA | 32,800 | 5,557,364 | |
Nu Skin Enterprises, Inc. Class A | 99,267 | 8,290,780 | |
| 25,586,943 | ||
PHARMACEUTICALS - 0.2% | |||
Pharmaceuticals - 0.2% | |||
Perrigo Co. PLC | 31,306 | 5,147,959 | |
TOBACCO - 24.3% | |||
Tobacco - 24.3% | |||
Altria Group, Inc. | 2,793,645 | 101,297,568 | |
British American Tobacco PLC sponsored ADR | 2,740,345 | 298,122,129 | |
Imperial Tobacco Group PLC | 265,697 | 10,842,771 | |
Common Stocks - continued | |||
Shares | Value | ||
TOBACCO - CONTINUED | |||
Tobacco - continued | |||
ITC Ltd. | 1,620,070 | $ 8,595,514 | |
Japan Tobacco, Inc. | 209,400 | 6,669,335 | |
Lorillard, Inc. | 472,461 | 23,178,937 | |
Philip Morris International, Inc. | 493,292 | 39,912,256 | |
Souza Cruz SA | 1,145,800 | 9,939,470 | |
| 498,557,980 | ||
TOTAL COMMON STOCKS (Cost $1,428,851,891) |
| ||
Nonconvertible Preferred Stocks - 0.3% | |||
|
|
|
|
BEVERAGES - 0.3% | |||
Brewers - 0.3% | |||
Ambev SA sponsored ADR | 1,049,610 |
| |
Money Market Funds - 3.2% | |||
Shares | Value | ||
Fidelity Cash Central Fund, 0.10% (b) | 31,266,635 | $ 31,266,635 | |
Fidelity Securities Lending Cash Central Fund, 0.09% (b)(c) | 33,900,423 | 33,900,423 | |
TOTAL MONEY MARKET FUNDS (Cost $65,167,058) |
| ||
TOTAL INVESTMENT PORTFOLIO - 101.0% (Cost $1,496,678,335) | 2,077,050,051 | ||
NET OTHER ASSETS (LIABILITIES) - (1.0)% | (21,247,648) | ||
NET ASSETS - 100% | $ 2,055,802,403 | ||
Legend |
(a) Non-income producing |
(b) Affiliated fund that is generally available only to investment companies and other accounts managed by Fidelity Investments. The rate quoted is the annualized seven-day yield of the fund at period end. A complete unaudited listing of the fund's holdings as of its most recent quarter end is available upon request. In addition, each Fidelity Central Fund's financial statements, which are not covered by the Fund's Report of Independent Registered Public Accounting Firm, are available on the SEC's website or upon request. |
(c) Investment made with cash collateral received from securities on loan. |
(d) Security or a portion of the security is on loan at period end. |
Affiliated Central Funds |
Information regarding fiscal year to date income earned by the Fund from investments in Fidelity Central Funds is as follows: |
Fund | Income earned |
Fidelity Cash Central Fund | $ 64,577 |
Fidelity Securities Lending Cash Central Fund | 320,864 |
Total | $ 385,441 |
Other Information |
The following is a summary of the inputs used, as of February 28, 2014, involving the Fund's assets and liabilities carried at fair value. The inputs or methodology used for valuing securities may not be an indication of the risk associated with investing in those securities. For more information on valuation inputs, and their aggregation into the levels used in the table below, please refer to the Investment Valuation section in the accompanying Notes to Financial Statements. |
Valuation Inputs at Reporting Date: | ||||
Description | Total | Level 1 | Level 2 | Level 3 |
Investments in Securities: | ||||
Common Stocks | $ 2,004,325,801 | $ 1,942,578,330 | $ 61,747,471 | $ - |
Nonconvertible Preferred Stocks | 7,557,192 | 7,557,192 | - | - |
Money Market Funds | 65,167,058 | 65,167,058 | - | - |
Total Investments in Securities: | $ 2,077,050,051 | $ 2,015,302,580 | $ 61,747,471 | $ - |
Distribution of investments by country or territory of incorporation, as a percentage of total net assets, is as follows (Unaudited): |
United States of America | 64.2% |
United Kingdom | 19.2% |
France | 4.9% |
Bermuda | 2.8% |
Switzerland | 1.6% |
Brazil | 1.3% |
Belgium | 1.2% |
Others (Individually Less Than 1%) | 4.8% |
| 100.0% |
See accompanying notes which are an integral part of the financial statements.
Annual Report
Consumer Staples Portfolio
Financial Statements
Statement of Assets and Liabilities
| February 28, 2014 | |
|
|
|
Assets | ||
Investment in securities, at value (including securities loaned of $32,976,456) - See accompanying schedule: Unaffiliated issuers (cost $1,431,511,277) | $ 2,011,882,993 |
|
Fidelity Central Funds (cost $65,167,058) | 65,167,058 |
|
Total Investments (cost $1,496,678,335) |
| $ 2,077,050,051 |
Receivable for investments sold | 15,188,121 | |
Receivable for fund shares sold | 2,001,501 | |
Dividends receivable | 2,179,086 | |
Distributions receivable from Fidelity Central Funds | 7,995 | |
Prepaid expenses | 13,509 | |
Other receivables | 33,397 | |
Total assets | 2,096,473,660 | |
|
|
|
Liabilities | ||
Payable for investments purchased | $ 508,506 | |
Payable for fund shares redeemed | 4,578,554 | |
Accrued management fee | 921,833 | |
Distribution and service plan fees payable | 239,461 | |
Other affiliated payables | 389,292 | |
Other payables and accrued expenses | 133,188 | |
Collateral on securities loaned, at value | 33,900,423 | |
Total liabilities | 40,671,257 | |
|
|
|
Net Assets | $ 2,055,802,403 | |
Net Assets consist of: |
| |
Paid in capital | $ 1,406,494,316 | |
Undistributed net investment income | 5,732,152 | |
Accumulated undistributed net realized gain (loss) on investments and foreign currency transactions | 63,224,348 | |
Net unrealized appreciation (depreciation) on investments and assets and liabilities in foreign currencies | 580,351,587 | |
Net Assets | $ 2,055,802,403 | |
Statement of Assets and Liabilities - continued
| February 28, 2014 | |
|
|
|
Calculation of Maximum Offering Price Class A: | $ 87.93 | |
|
|
|
Maximum offering price per share (100/94.25 of $87.93) | $ 93.29 | |
Class T: | $ 87.37 | |
|
|
|
Maximum offering price per share (100/96.50 of $87.37) | $ 90.54 | |
Class B: | $ 86.90 | |
|
|
|
Class C: | $ 86.32 | |
|
|
|
Consumer Staples: | $ 88.51 | |
|
|
|
Institutional Class: | $ 88.33 | |
A Redemption price per share is equal to net asset value less any applicable contingent deferred sales charge.
See accompanying notes which are an integral part of the financial statements.
Annual Report
Statement of Operations
| Year ended February 28, 2014 | |
|
|
|
Investment Income |
|
|
Dividends |
| $ 63,498,283 |
Interest |
| 16 |
Income from Fidelity Central Funds |
| 385,441 |
Total income |
| 63,883,740 |
|
|
|
Expenses | ||
Management fee | $ 13,210,712 | |
Transfer agent fees | 4,800,332 | |
Distribution and service plan fees | 2,848,704 | |
Accounting and security lending fees | 719,655 | |
Custodian fees and expenses | 107,674 | |
Independent trustees' compensation | 45,426 | |
Registration fees | 193,601 | |
Audit | 66,278 | |
Legal | 40,201 | |
Interest | 4,952 | |
Miscellaneous | 28,736 | |
Total expenses before reductions | 22,066,271 | |
Expense reductions | (77,312) | 21,988,959 |
Net investment income (loss) | 41,894,781 | |
Realized and Unrealized Gain (Loss) Net realized gain (loss) on: | ||
Investment securities: |
|
|
Unaffiliated issuers (net of foreign taxes of $10,350) | 171,717,048 | |
Foreign currency transactions | (76,530) | |
Total net realized gain (loss) |
| 171,640,518 |
Change in net unrealized appreciation (depreciation) on: Investment securities (net of increase in deferred foreign taxes of $26,244) | 26,576,541 | |
Assets and liabilities in foreign currencies | 12,410 | |
Total change in net unrealized appreciation (depreciation) |
| 26,588,951 |
Net gain (loss) | 198,229,469 | |
Net increase (decrease) in net assets resulting from operations | $ 240,124,250 | |
Statement of Changes in Net Assets
| Year ended | Year ended |
Increase (Decrease) in Net Assets |
|
|
Operations |
|
|
Net investment income (loss) | $ 41,894,781 | $ 34,326,160 |
Net realized gain (loss) | 171,640,518 | 94,809,727 |
Change in net unrealized appreciation (depreciation) | 26,588,951 | 198,071,394 |
Net increase (decrease) in net assets resulting from operations | 240,124,250 | 327,207,281 |
Distributions to shareholders from net investment income | (38,989,125) | (31,344,671) |
Distributions to shareholders from net realized gain | (137,187,027) | (29,546,659) |
Total distributions | (176,176,152) | (60,891,330) |
Share transactions - net increase (decrease) | (294,831,730) | 287,768,850 |
Redemption fees | 32,907 | 35,035 |
Total increase (decrease) in net assets | (230,850,725) | 554,119,836 |
|
|
|
Net Assets | ||
Beginning of period | 2,286,653,128 | 1,732,533,292 |
End of period (including undistributed net investment income of $5,732,152 and undistributed net investment income of $5,461,626, respectively) | $ 2,055,802,403 | $ 2,286,653,128 |
See accompanying notes which are an integral part of the financial statements.
Annual Report
Financial Highlights - Class A
Years ended February 28, | 2014 | 2013 | 2012 G | 2011 | 2010 |
Selected Per-Share Data |
|
|
|
|
|
Net asset value, beginning of period | $ 85.67 | $ 74.90 | $ 67.65 | $ 61.06 | $ 43.94 |
Income from Investment Operations |
|
|
|
|
|
Net investment income (loss) C | 1.43 | 1.26 | 1.22 | .98 | .84 |
Net realized and unrealized gain (loss) | 7.51 | 11.73 | 8.73 | 7.10 | 17.02 |
Total from investment operations | 8.94 | 12.99 | 9.95 | 8.08 | 17.86 |
Distributions from net investment income | (1.44) | (1.08) | (1.06) | (.83) | (.74) |
Distributions from net realized gain | (5.24) | (1.14) | (1.64) | (.66) | - |
Total distributions | (6.68) | (2.22) | (2.70) | (1.49) | (.74) |
Redemption fees added to paid in capital C,H | - | - | - | - | - |
Net asset value, end of period | $ 87.93 | $ 85.67 | $ 74.90 | $ 67.65 | $ 61.06 |
Total Return A,B | 10.53% | 17.60% | 15.00% | 13.27% | 40.66% |
Ratios to Average Net Assets D,F |
|
|
|
|
|
Expenses before reductions | 1.06% | 1.08% | 1.10% | 1.11% | 1.13% |
Expenses net of fee waivers, if any | 1.06% | 1.08% | 1.10% | 1.11% | 1.13% |
Expenses net of all reductions | 1.06% | 1.08% | 1.09% | 1.11% | 1.13% |
Net investment income (loss) | 1.61% | 1.58% | 1.74% | 1.53% | 1.51% |
Supplemental Data |
|
|
|
|
|
Net assets, end of period (000 omitted) | $ 329,459 | $ 277,329 | $ 205,851 | $ 160,526 | $ 162,370 |
Portfolio turnover rate E | 31% | 28% | 35% | 57% | 69% |
A Total returns would have been lower if certain expenses had not been reduced during the applicable periods shown.
B Total returns do not include the effect of the sales charges.
C Calculated based on average shares outstanding during the period.
D Fees and expenses of any underlying Fidelity Central Funds are not included in the Fund's expense ratio. The Fund indirectly bears its proportionate share of the expenses of any underlying Fidelity Central Funds.
E Amount does not include the portfolio activity of any underlying Fidelity Central Funds.
F Expense ratios reflect operating expenses of the class. Expenses before reductions do not reflect amounts reimbursed by the investment adviser or reductions from brokerage service arrangements or reductions from other expense offset arrangements and do not represent the amount paid by the class during periods when reimbursements or reductions occur. Expenses net of fee waivers reflect expenses after reimbursement by the investment adviser but prior to reductions from brokerage service arrangements or other expense offset arrangements. Expenses net of all reductions represent the net expenses paid by the class.
G For the year ended February 29.
H Amount represents less than $.01 per share.
Financial Highlights - Class T
Years ended February 28, | 2014 | 2013 | 2012 G | 2011 | 2010 |
Selected Per-Share Data |
|
|
|
|
|
Net asset value, beginning of period | $ 85.18 | $ 74.49 | $ 67.30 | $ 60.77 | $ 43.75 |
Income from Investment Operations |
|
|
|
|
|
Net investment income (loss) C | 1.18 | 1.03 | 1.01 | .79 | .66 |
Net realized and unrealized gain (loss) | 7.46 | 11.68 | 8.68 | 7.05 | 16.95 |
Total from investment operations | 8.64 | 12.71 | 9.69 | 7.84 | 17.61 |
Distributions from net investment income | (1.21) | (.88) | (.86) | (.65) | (.59) |
Distributions from net realized gain | (5.24) | (1.14) | (1.64) | (.66) | - |
Total distributions | (6.45) | (2.02) | (2.50) | (1.31) | (.59) |
Redemption fees added to paid in capital C,H | - | - | - | - | - |
Net asset value, end of period | $ 87.37 | $ 85.18 | $ 74.49 | $ 67.30 | $ 60.77 |
Total Return A,B | 10.23% | 17.29% | 14.67% | 12.93% | 40.24% |
Ratios to Average Net Assets D,F |
|
|
|
|
|
Expenses before reductions | 1.33% | 1.36% | 1.38% | 1.40% | 1.44% |
Expenses net of fee waivers, if any | 1.33% | 1.36% | 1.38% | 1.40% | 1.44% |
Expenses net of all reductions | 1.33% | 1.35% | 1.38% | 1.40% | 1.44% |
Net investment income (loss) | 1.34% | 1.30% | 1.45% | 1.24% | 1.21% |
Supplemental Data |
|
|
|
|
|
Net assets, end of period (000 omitted) | $ 61,421 | $ 52,024 | $ 39,047 | $ 31,496 | $ 29,662 |
Portfolio turnover rate E | 31% | 28% | 35% | 57% | 69% |
A Total returns would have been lower if certain expenses had not been reduced during the applicable periods shown.
B Total returns do not include the effect of the sales charges.
C Calculated based on average shares outstanding during the period.
D Fees and expenses of any underlying Fidelity Central Funds are not included in the Fund's expense ratio. The Fund indirectly bears its proportionate share of the expenses of any underlying Fidelity Central Funds.
E Amount does not include the portfolio activity of any underlying Fidelity Central Funds.
F Expense ratios reflect operating expenses of the class. Expenses before reductions do not reflect amounts reimbursed by the investment adviser or reductions from brokerage service arrangements or reductions from other expense offset arrangements and do not represent the amount paid by the class during periods when reimbursements or reductions occur. Expenses net of fee waivers reflect expenses after reimbursement by the investment adviser but prior to reductions from brokerage service arrangements or other expense offset arrangements. Expenses net of all reductions represent the net expenses paid by the class.
G For the year ended February 29.
H Amount represents less than $.01 per share.
See accompanying notes which are an integral part of the financial statements.
Annual Report
Financial Highlights - Class B
Years ended February 28, | 2014 | 2013 | 2012 G | 2011 | 2010 |
Selected Per-Share Data |
|
|
|
|
|
Net asset value, beginning of period | $ 84.72 | $ 74.01 | $ 66.83 | $ 60.37 | $ 43.53 |
Income from Investment Operations |
|
|
|
|
|
Net investment income (loss) C | .71 | .61 | .64 | .46 | .37 |
Net realized and unrealized gain (loss) | 7.40 | 11.61 | 8.61 | 6.98 | 16.82 |
Total from investment operations | 8.11 | 12.22 | 9.25 | 7.44 | 17.19 |
Distributions from net investment income | (.69) | (.37) | (.43) | (.32) | (.35) |
Distributions from net realized gain | (5.24) | (1.14) | (1.64) | (.66) | - |
Total distributions | (5.93) | (1.51) | (2.07) | (.98) | (.35) |
Redemption fees added to paid in capital C,H | - | - | - | - | - |
Net asset value, end of period | $ 86.90 | $ 84.72 | $ 74.01 | $ 66.83 | $ 60.37 |
Total Return A,B | 9.63% | 16.68% | 14.06% | 12.35% | 39.48% |
Ratios to Average Net Assets D,F |
|
|
|
|
|
Expenses before reductions | 1.86% | 1.89% | 1.91% | 1.91% | 1.97% |
Expenses net of fee waivers, if any | 1.86% | 1.89% | 1.91% | 1.91% | 1.97% |
Expenses net of all reductions | 1.86% | 1.88% | 1.90% | 1.91% | 1.97% |
Net investment income (loss) | .81% | .78% | .93% | .73% | .68% |
Supplemental Data |
|
|
|
|
|
Net assets, end of period (000 omitted) | $ 17,388 | $ 18,548 | $ 19,330 | $ 20,033 | $ 21,099 |
Portfolio turnover rate E | 31% | 28% | 35% | 57% | 69% |
A Total returns would have been lower if certain expenses had not been reduced during the applicable periods shown.
B Total returns do not include the effect of the contingent deferred sales charge.
C Calculated based on average shares outstanding during the period.
D Fees and expenses of any underlying Fidelity Central Funds are not included in the Fund's expense ratio. The Fund indirectly bears its proportionate share of the expenses of any underlying Fidelity Central Funds.
E Amount does not include the portfolio activity of any underlying Fidelity Central Funds.
F Expense ratios reflect operating expenses of the class. Expenses before reductions do not reflect amounts reimbursed by the investment adviser or reductions from brokerage service arrangements or reductions from other expense offset arrangements and do not represent the amount paid by the class during periods when reimbursements or reductions occur. Expenses net of fee waivers reflect expenses after reimbursement by the investment adviser but prior to reductions from brokerage service arrangements or other expense offset arrangements. Expenses net of all reductions represent the net expenses paid by the class.
G For the year ended February 29.
H Amount represents less than $.01 per share.
Financial Highlights - Class C
Years ended February 28, | 2014 | 2013 | 2012 G | 2011 | 2010 |
Selected Per-Share Data |
|
|
|
|
|
Net asset value, beginning of period | $ 84.28 | $ 73.75 | $ 66.71 | $ 60.29 | $ 43.46 |
Income from Investment Operations |
|
|
|
|
|
Net investment income (loss) C | .75 | .65 | .68 | .49 | .41 |
Net realized and unrealized gain (loss) | 7.36 | 11.55 | 8.59 | 7.00 | 16.80 |
Total from investment operations | 8.11 | 12.20 | 9.27 | 7.49 | 17.21 |
Distributions from net investment income | (.84) | (.53) | (.59) | (.41) | (.38) |
Distributions from net realized gain | (5.24) | (1.14) | (1.64) | (.66) | - |
Total distributions | (6.07) I | (1.67) | (2.23) | (1.07) | (.38) |
Redemption fees added to paid in capital C,H | - | - | - | - | - |
Net asset value, end of period | $ 86.32 | $ 84.28 | $ 73.75 | $ 66.71 | $ 60.29 |
Total Return A,B | 9.70% | 16.73% | 14.14% | 12.44% | 39.59% |
Ratios to Average Net Assets D,F |
|
|
|
|
|
Expenses before reductions | 1.82% | 1.83% | 1.85% | 1.86% | 1.90% |
Expenses net of fee waivers, if any | 1.82% | 1.83% | 1.85% | 1.86% | 1.90% |
Expenses net of all reductions | 1.81% | 1.82% | 1.84% | 1.85% | 1.89% |
Net investment income (loss) | .85% | .83% | .99% | .79% | .75% |
Supplemental Data |
|
|
|
|
|
Net assets, end of period (000 omitted) | $ 164,669 | $ 134,966 | $ 102,321 | $ 81,239 | $ 73,829 |
Portfolio turnover rate E | 31% | 28% | 35% | 57% | 69% |
A Total returns would have been lower if certain expenses had not been reduced during the applicable periods shown.
B Total returns do not include the effect of the contingent deferred sales charge.
C Calculated based on average shares outstanding during the period.
D Fees and expenses of any underlying Fidelity Central Funds are not included in the Fund's expense ratio. The Fund indirectly bears its proportionate share of the expenses of any underlying Fidelity Central Funds.
E Amount does not include the portfolio activity of any underlying Fidelity Central Funds.
F Expense ratios reflect operating expenses of the class. Expenses before reductions do not reflect amounts reimbursed by the investment adviser or reductions from brokerage service arrangements or reductions from other expense offset arrangements and do not represent the amount paid by the class during periods when reimbursements or reductions occur. Expenses net of fee waivers reflect expenses after reimbursement by the investment adviser but prior to reductions from brokerage service arrangements or other expense offset arrangements. Expenses net of all reductions represent the net expenses paid by the class.
G For the year ended February 29.
H Amount represents less than $.01 per share.
I Total distributions of $6.07 per share is comprised of distributions from net investment income of $.837 and distributions from net realized gain of $5.237 per share.
See accompanying notes which are an integral part of the financial statements.
Annual Report
Financial Highlights - Consumer Staples
Years ended February 28, | 2014 | 2013 | 2012 F | 2011 | 2010 |
Selected Per-Share Data |
|
|
|
|
|
Net asset value, beginning of period | $ 86.17 | $ 75.29 | $ 67.98 | $ 61.34 | $ 44.14 |
Income from Investment Operations |
|
|
|
|
|
Net investment income (loss) B | 1.69 | 1.48 | 1.42 | 1.14 | .96 |
Net realized and unrealized gain (loss) | 7.55 | 11.82 | 8.76 | 7.14 | 17.11 |
Total from investment operations | 9.24 | 13.30 | 10.18 | 8.28 | 18.07 |
Distributions from net investment income | (1.66) | (1.28) | (1.24) | (.98) | (.87) |
Distributions from net realized gain | (5.24) | (1.14) | (1.64) | (.66) | - |
Total distributions | (6.90) | (2.42) | (2.87) H | (1.64) | (.87) |
Redemption fees added to paid in capital B,G | - | - | - | - | - |
Net asset value, end of period | $ 88.51 | $ 86.17 | $ 75.29 | $ 67.98 | $ 61.34 |
Total Return A | 10.82% | 17.94% | 15.30% | 13.55% | 40.96% |
Ratios to Average Net Assets C,E |
|
|
|
|
|
Expenses before reductions | .79% | .81% | .83% | .86% | .92% |
Expenses net of fee waivers, if any | .79% | .81% | .83% | .86% | .92% |
Expenses net of all reductions | .79% | .80% | .82% | .86% | .91% |
Net investment income (loss) | 1.88% | 1.85% | 2.01% | 1.78% | 1.73% |
Supplemental Data |
|
|
|
|
|
Net assets, end of period (000 omitted) | $ 1,328,594 | $ 1,425,055 | $ 1,202,440 | $ 877,548 | $ 946,455 |
Portfolio turnover rate D | 31% | 28% | 35% | 57% | 69% |
A Total returns would have been lower if certain expenses had not been reduced during the applicable periods shown.
B Calculated based on average shares outstanding during the period.
C Fees and expenses of any underlying Fidelity Central Funds are not included in the Fund's expense ratio. The Fund indirectly bears its proportionate share of the expenses of any underlying Fidelity Central Funds.
D Amount does not include the portfolio activity of any underlying Fidelity Central Funds.
E Expense ratios reflect operating expenses of the class. Expenses before reductions do not reflect amounts reimbursed by the investment adviser or reductions from brokerage service arrangements or reductions from other expense offset arrangements and do not represent the amount paid by the class during periods when reimbursements or reductions occur. Expenses net of fee waivers reflect expenses after reimbursement by the investment adviser but prior to reductions from brokerage service arrangements or other expense offset arrangements. Expenses net of all reductions represent the net expenses paid by the class.
F For the year ended February 29.
G Amount represents less than $.01 per share.
H Total distributions of $2.87 per share is comprised of distributions from net investment income of $1.236 and distributions from net realized gain of $1.637 per share.
Financial Highlights - Institutional Class
Years ended February 28, | 2014 | 2013 | 2012 F | 2011 | 2010 |
Selected Per-Share Data |
|
|
|
|
|
Net asset value, beginning of period | $ 85.92 | $ 75.14 | $ 67.84 | $ 61.26 | $ 44.07 |
Income from Investment Operations |
|
|
|
|
|
Net investment income (loss) B | 1.66 | 1.45 | 1.39 | 1.15 | .98 |
Net realized and unrealized gain (loss) | 7.53 | 11.79 | 8.73 | 7.13 | 17.09 |
Total from investment operations | 9.19 | 13.24 | 10.12 | 8.28 | 18.07 |
Distributions from net investment income | (1.54) | (1.32) | (1.19) | (1.04) | (.88) |
Distributions from net realized gain | (5.24) | (1.14) | (1.64) | (.66) | - |
Total distributions | (6.78) | (2.46) | (2.82) H | (1.70) | (.88) |
Redemption fees added to paid in capital B,G | - | - | - | - | - |
Net asset value, end of period | $ 88.33 | $ 85.92 | $ 75.14 | $ 67.84 | $ 61.26 |
Total Return A | 10.80% | 17.90% | 15.24% | 13.57% | 41.03% |
Ratios to Average Net Assets C,E |
|
|
|
|
|
Expenses before reductions | .82% | .85% | .87% | .87% | .86% |
Expenses net of fee waivers, if any | .82% | .85% | .87% | .87% | .86% |
Expenses net of all reductions | .82% | .84% | .87% | .87% | .86% |
Net investment income (loss) | 1.85% | 1.81% | 1.96% | 1.77% | 1.78% |
Supplemental Data |
|
|
|
|
|
Net assets, end of period (000 omitted) | $ 154,271 | $ 378,731 | $ 163,544 | $ 237,883 | $ 36,152 |
Portfolio turnover rate D | 31% | 28% | 35% | 57% | 69% |
A Total returns would have been lower if certain expenses had not been reduced during the applicable periods shown.
B Calculated based on average shares outstanding during the period.
C Fees and expenses of any underlying Fidelity Central Funds are not included in the Fund's expense ratio. The Fund indirectly bears its proportionate share of the expenses of any underlying Fidelity Central Funds.
D Amount does not include the portfolio activity of any underlying Fidelity Central Funds.
E Expense ratios reflect operating expenses of the class. Expenses before reductions do not reflect amounts reimbursed by the investment adviser or reductions from brokerage service arrangements or reductions from other expense offset arrangements and do not represent the amount paid by the class during periods when reimbursements or reductions occur. Expenses net of fee waivers reflect expenses after reimbursement by the investment adviser but prior to reductions from brokerage service arrangements or other expense offset arrangements. Expenses net of all reductions represent the net expenses paid by the class.
F For the year ended February 29.
G Amount represents less than $.01 per share.
H Total distributions of $2.82 per share is comprised of distributions from net investment income of $1.186 and distributions from net realized gain of $1.637 per share.
See accompanying notes which are an integral part of the financial statements.
Annual Report
Notes to Financial Statements
For the period ended February 28, 2014
1. Organization.
Consumer Staples Portfolio (the Fund) is a non-diversified fund of Fidelity Select Portfolios (the Trust) and is authorized to issue an unlimited number of shares. The Trust is registered under the Investment Company Act of 1940, as amended (the 1940 Act), as an open-end management investment company organized as a Massachusetts business trust. The Fund invests primarily in securities of companies whose principal business activities fall within specific industries. The Fund offers Class A, Class T, Class C, Consumer Staples and Institutional Class shares, each of which, along with Class B shares, has equal rights as to assets and voting privileges. Class B shares are closed to new accounts and additional purchases, except for exchanges and reinvestments. Each class has exclusive voting rights with respect to matters that affect that class. Class B shares will automatically convert to Class A shares after a holding period of seven years from the initial date of purchase.
2. Investments in Fidelity Central Funds.
The Fund invests in Fidelity Central Funds, which are open-end investment companies generally available only to other investment companies and accounts managed by the investment adviser and its affiliates. The Fund's Schedule of Investments lists each of the Fidelity Central Funds held as of period end, if any, as an investment of the Fund, but does not include the underlying holdings of each Fidelity Central Fund. As an Investing Fund, the Fund indirectly bears its proportionate share of the expenses of the underlying Fidelity Central Funds.
The Money Market Central Funds seek preservation of capital and current income and are managed by Fidelity Investments Money Management, Inc. (FIMM), an affiliate of the investment adviser. Annualized expenses of the Money Market Central Funds as of their most recent shareholder report date are less than .01%.
A complete unaudited list of holdings for each Fidelity Central Fund is available upon request or at the Securities and Exchange Commission (the SEC) website at www.sec.gov. In addition, the financial statements of the Fidelity Central Funds, which are not covered by the Fund's Report of Independent Registered Public Accounting Firm, are available on the SEC website or upon request.
3. Significant Accounting Policies.
The financial statements have been prepared in conformity with accounting principles generally accepted in the United States of America (GAAP), which require management to make certain estimates and assumptions at the date of the financial statements. Actual results could differ from those estimates. Subsequent events, if any, through the date that the financial statements were issued have been evaluated in the preparation of the financial statements. The following summarizes the significant accounting policies of the Fund:
Investment Valuation. Investments are valued as of 4:00 p.m. Eastern time on the last calendar day of the period. In accordance with valuation policies and procedures approved by the Board of Trustees (the Board), the Fund attempts to obtain prices from one or more third party pricing vendors or brokers to value its investments. When current market prices, quotations or currency exchange rates are not readily available or reliable, investments will be fair valued in good faith by the Fidelity SelectCo, LLC (SelectCo) Fair Value Committee (the Committee), in accordance with procedures adopted by the Board. Factors used in determining fair value vary by investment type and may include market or investment specific events. The frequency with which these procedures are used cannot be predicted and they may be utilized to a significant extent. The Committee oversees the Fund's valuation policies and procedures and is responsible for approving and reporting to the Board all fair value determinations.
The Fund categorizes the inputs to valuation techniques used to value its investments into a disclosure hierarchy consisting of three levels as shown below:
Level 1 - quoted prices in active markets for identical investments
Level 2 - other significant observable inputs (including quoted prices for similar investments, interest rates, prepayment speeds, etc.)
Level 3 - unobservable inputs (including the Fund's own assumptions based on the best information available)
Valuation techniques used to value the Fund's investments by major category are as follows:
Equity securities, including restricted securities, for which market quotations are readily available, are valued at the last reported sale price or official closing price as reported by a third party pricing vendor on the primary market or exchange on which they are traded and are categorized as Level 1 in the hierarchy. In the event there were no sales during the day or closing prices are not available, securities are valued at the last quoted bid price or may be valued using the last available price and are generally categorized as Level 2 in the hierarchy. For foreign equity securities, when market or security specific events arise, comparisons to the valuation of American Depositary Receipts (ADRs), futures contracts, Exchange-Traded Funds (ETFs) and certain indexes as well as quoted prices for similar securities may be used and would be categorized as Level 2 in the hierarchy. Utilizing these techniques may result in transfers between Level 1 and Level 2. For equity securities, including restricted securities, where observable inputs are limited, assumptions about market activity and risk are used and these securities may be categorized as Level 3 in the hierarchy.
Annual Report
3. Significant Accounting Policies - continued
Investment Valuation - continued
Investments in open-end mutual funds, including the Fidelity Central Funds, are valued at their closing net asset value (NAV) each business day and are categorized as Level 1 in the hierarchy.
Changes in valuation techniques may result in transfers in or out of an assigned level within the disclosure hierarchy. The aggregate value of investments by input level, as of February 28, 2014, is included at the end of the Fund's Schedule of Investments.
Foreign Currency. The Fund may use foreign currency contracts to facilitate transactions in foreign-denominated securities. Gains and losses from these transactions may arise from changes in the value of the foreign currency or if the counterparties do not perform under the contracts' terms.
Foreign-denominated assets, including investment securities, and liabilities are translated into U.S. dollars at the exchange rates at period end. Purchases and sales of investment securities, income and dividends received and expenses denominated in foreign currencies are translated into U.S. dollars at the exchange rate in effect on the transaction date.
The effects of exchange rate fluctuations on investments are included with the net realized and unrealized gain (loss) on investment securities. Other foreign currency transactions resulting in realized and unrealized gain (loss) are disclosed separately.
Investment Transactions and Income. For financial reporting purposes, the Fund's investment holdings and NAV include trades executed through the end of the last business day of the period. The NAV per share for processing shareholder transactions is calculated as of the close of business of the New York Stock Exchange (NYSE), normally 4:00 p.m. Eastern time and includes trades executed through the end of the prior business day. Gains and losses on securities sold are determined on the basis of identified cost and may include proceeds received from litigation. Dividend income is recorded on the ex-dividend date, except for certain dividends from foreign securities where the ex-dividend date may have passed, which are recorded as soon as the Fund is informed of the ex-dividend date. Non-cash dividends included in dividend income, if any, are recorded at the fair market value of the securities received. Interest income and distributions from the Fidelity Central Funds are accrued as earned. Interest income includes coupon interest and amortization of premium and accretion of discount on debt securities. Investment income is recorded net of foreign taxes withheld where recovery of such taxes is uncertain.
Class Allocations and Expenses. Investment income, realized and unrealized capital gains and losses, common expenses of the Fund, and certain fund-level expense reductions, if any, are allocated daily on a pro-rata basis to each class based on the relative net assets of each class to the total net assets of the Fund. Each class differs with respect to transfer agent and distribution and service plan fees incurred. Certain expense reductions may also differ by class. For the reporting period, the allocated portion of income and expenses to each class as a percent of its average net assets may vary due to the timing of recording these transactions in relation to fluctuating net assets of the classes. Expenses directly attributable to a fund are charged to that fund. Expenses attributable to more than one fund are allocated among the respective funds on the basis of relative net assets or other appropriate methods. Expense estimates are accrued in the period to which they relate and adjustments are made when actual amounts are known.
Deferred Trustee Compensation. Under a Deferred Compensation Plan (the Plan), independent Trustees may elect to defer receipt of a portion of their annual compensation. Deferred amounts are invested in a cross-section of Fidelity funds, are marked-to-market and remain in the Fund until distributed in accordance with the Plan. The investment of deferred amounts and the offsetting payable to the Trustees are included in the accompanying Statement of Assets and Liabilities.
Income Tax Information and Distributions to Shareholders. Each year, the Fund intends to qualify as a regulated investment company under Subchapter M of the Internal Revenue Code, including distributing substantially all of its taxable income and realized gains. As a result, no provision for U.S. Federal income taxes is required. As of February 28, 2014, the Fund did not have any unrecognized tax benefits in the financial statements; nor is the Fund aware of any tax positions for which it is reasonably possible that the total amounts of unrecognized tax benefits will significantly change in the next twelve months. The Fund files a U.S. federal tax return, in addition to state and local tax returns as required. The Fund's federal income tax returns are subject to examination by the Internal Revenue Service (IRS) for a period of three fiscal years after they are filed. State and local tax returns may be subject to examination for an additional fiscal year depending on the jurisdiction. Foreign taxes are provided for based on the Fund's understanding of the tax rules and rates that exist in the foreign markets in which it invests. The Fund is subject to a tax imposed on capital gains by certain countries in which it invests. An estimated deferred tax liability for net unrealized appreciation on the applicable securities is included in Other payables and accrued expenses on the Statement of Assets & Liabilities.
Distributions are declared and recorded on the ex-dividend date. Income dividends and capital gain distributions are declared separately for each class. Income and capital gain distributions are determined in accordance with income tax regulations, which may differ from GAAP. In addition, certain Funds claimed a portion of the payment made to redeeming shareholders as a distribution for income tax purposes.
Capital accounts within the financial statements are adjusted for permanent book-tax differences. These adjustments have no impact on net assets or the results of operations. Capital accounts are not adjusted for temporary book-tax differences which will reverse in a subsequent period.
Book-tax differences are primarily due to foreign currency transactions, certain foreign taxes, deferred trustees compensation and losses deferred due to wash sales.
Annual Report
Notes to Financial Statements - continued
3. Significant Accounting Policies - continued
Income Tax Information and Distributions to Shareholders - continued
The federal tax cost of investment securities and unrealized appreciation (depreciation) as of period end were as follows:
Gross unrealized appreciation | $ 593,130,470 |
Gross unrealized depreciation | (16,836,140) |
Net unrealized appreciation (depreciation) on securities and other investments | $ 576,294,330 |
|
|
Tax Cost | $ 1,500,755,721 |
The tax-based components of distributable earnings as of period end were as follows:
Undistributed ordinary income | $ 5,746,120 |
Undistributed long-term capital gain | $ 67,301,735 |
Net unrealized appreciation (depreciation) | $ 576,306,290 |
The tax character of distributions paid was as follows:
| February 28, 2014 | February 28, 2013 |
Ordinary Income | $ 40,643,236 | $ 31,344,671 |
Long-term Capital Gains | 135,532,916 | 29,546,659 |
Total | $ 176,176,152 | $ 60,891,330 |
Trading (Redemption) Fees. Shares held by investors in the Fund less than 30 days may be subject to a redemption fee equal to .75% of the NAV of shares redeemed. All redemption fees, which reduce the proceeds of the shareholder redemption, are retained by the Fund and accounted for as an addition to paid in capital.
4. Purchases and Sales of Investments.
Purchases and sales of securities, other than short-term securities, aggregated $723,925,161 and $1,068,680,050, respectively.
5. Fees and Other Transactions with Affiliates.
Management Fee. Effective August 1, 2013, SelectCo replaced Fidelity Management and Research Company (FMR), an affiliate of SelectCo, as an investment advisor to the Fund. The investment adviser and its affiliates provide the Fund with investment management related services for which the Fund pays a monthly management fee. The management fee is the sum of an individual fund fee rate that is based on an annual rate of ..30% of the Fund's average net assets and an annualized group fee rate that averaged .25% during the period. The group fee rate is based upon the average net assets of all the mutual funds advised by FMR and the investment adviser. The group fee rate decreases as assets under management increase and increases as assets under management decrease. For the reporting period, the total annual management fee rate was .55% of the Fund's average net assets.
Distribution and Service Plan Fees. In accordance with Rule 12b-1 of the 1940 Act, the Fund has adopted separate Distribution and Service Plans for each class of shares. Certain classes pay Fidelity Distributors Corporation (FDC), an affiliate of the investment adviser, separate Distribution and Service Fees, each of which is based on an annual percentage of each class' average net assets. In addition, FDC may pay financial intermediaries for selling shares of the Fund and providing shareholder support services. For the period, the Distribution and Service Fee rates, total fees and amounts retained by FDC were as follows:
| Distribution | Service | Total Fees | Retained |
Class A | -% | .25% | $ 797,394 | $ 19,980 |
Class T | .25% | .25% | 300,761 | 118 |
Class B | .75% | .25% | 182,844 | 137,554 |
Class C | .75% | .25% | 1,567,705 | 369,895 |
|
|
| $ 2,848,704 | $ 527,547 |
Annual Report
5. Fees and Other Transactions with Affiliates - continued
Sales Load. FDC may receive a front-end sales charge of up to 5.75% for selling Class A shares and 3.50% for selling Class T shares, some of which is paid to financial intermediaries for selling shares of the Fund. Depending on the holding period, FDC may receive contingent deferred sales charges levied on Class A, Class T, Class B, and Class C redemptions. The deferred sales charges range from 5.00% to 1.00% for Class B shares, 1.00% for Class C shares, 1.00% for certain purchases of Class A shares and .25% for certain purchases of Class T shares.
For the period, sales charge amounts retained by FDC were as follows:
| Retained |
Class A | $ 256,782 |
Class T | 27,091 |
Class B* | 20,190 |
Class C* | 17,772 |
| $ 321,835 |
* When Class B and Class C shares are initially sold, FDC pays commissions from its own resources to financial intermediaries through which the sales are made.
Transfer Agent Fees. Fidelity Investments Institutional Operations Company, Inc., (FIIOC), an affiliate of the investment adviser, is the transfer, dividend disbursing and shareholder servicing agent for each class of the Fund. FIIOC receives account fees and asset-based fees that vary according to the account size and type of account of the shareholders of the respective classes of the Fund. FIIOC pays for typesetting, printing and mailing of shareholder reports, except proxy statements.
For the period, transfer agent fees for each class were as follows:
| Amount | % of |
Class A | $ 677,863 | .21 |
Class T | 139,412 | .23 |
Class B | 47,387 | .26 |
Class C | 335,943 | .21 |
Consumer Staples | 2,763,747 | .19 |
Institutional Class | 835,980 | .22 |
| $ 4,800,332 |
|
Accounting and Security Lending Fees. Fidelity Service Company, Inc. (FSC), an affiliate of the investment adviser, maintains the Fund's accounting records. The accounting fee is based on the level of average net assets for each month. Under a separate contract, FSC administers the security lending program. The security lending fee is based on the number and duration of lending transactions.
Brokerage Commissions. The Fund placed a portion of its portfolio transactions with brokerage firms which are affiliates of the investment adviser. Brokerage commissions are included in net realized gain (loss) and change in net unrealized appreciation (depreciation) in the Statement of Operations. The commissions paid to these affiliated firms were $12,975 for the period.
Interfund Lending Program. Pursuant to an Exemptive Order issued by the SEC, the Fund, along with other registered investment companies having management contracts with FMR or other affiliated entities of FMR, may participate in an interfund lending program. This program provides an alternative credit facility allowing the funds to borrow from, or lend money to, other participating affiliated funds. At period end, there were no interfund loans outstanding. The Fund's activity in this program during the period for which loans were outstanding was as follows:
Borrower or Lender | Average Loan | Weighted Average Interest Rate | Interest |
Borrower | $ 19,104,440 | .31% | $ 4,091 |
6. Committed Line of Credit.
The Fund participates with other funds managed by the investment adviser or an affiliate in a $4.25 billion credit facility (the "line of credit") to be utilized for temporary or emergency purposes to fund shareholder redemptions or for other short-term liquidity purposes. The Fund has agreed to pay commitment fees on its pro-rata portion of the line of credit, which amounted to $4,774 and is reflected in Miscellaneous expenses on the Statement of Operations. During the period, there were no borrowings on this line of credit.
Annual Report
Notes to Financial Statements - continued
7. Security Lending.
The Fund lends portfolio securities through a lending agent from time to time in order to earn additional income. For equity securities, a lending agent is used and may loan securities to certain qualified borrowers, which prior to August 1, 2013 included Fidelity Capital Markets (FCM), a broker-dealer affiliated with the Fund. On the settlement date of the loan, the Fund receives collateral (in the form of U.S. Treasury obligations, letters of credit and/or cash) against the loaned securities and maintains collateral in an amount not less than 100% of the market value of the loaned securities during the period of the loan. The market value of the loaned securities is determined at the close of business of the Fund and any additional required collateral is delivered to the Fund on the next business day. If the borrower defaults on its obligation to return the securities loaned because of insolvency or other reasons, the Fund may apply collateral received from the borrower against the obligation. The Fund may experience delays and costs in recovering the securities loaned. Any cash collateral received is invested the Fidelity Securities Lending Cash Central Fund. The value of loaned securities and cash collateral at period end are disclosed on the Fund's Statement of Assets and Liabilities. Security lending income represents the income earned on investing cash collateral, less rebates paid to borrowers and any lending agent fees associated with the loan, plus any premium payments received for lending certain types of securities. Security lending income is presented in the Statement of Operations as a component of income from Fidelity Central Funds. Total security lending income during the period amounted to $320,864. During the period, there were no securities loaned to FCM.
8. Bank Borrowings.
The Fund is permitted to have bank borrowings for temporary or emergency purposes to fund shareholder redemptions or for other short-term liquidity requirements. The Fund has established borrowing arrangements with certain banks. The interest rate on the borrowings is the bank's base rate, as revised from time to time. The average loan balance during the period for which loans were outstanding amounted to $7,763,571. The weighted average interest rate was .57%. The interest expense amounted to $861 under the bank borrowing program. At period end, there were no bank borrowings outstanding.
9. Expense Reductions.
Commissions paid to certain brokers with whom the investment adviser, or its affiliates, places trades on behalf of the Fund include an amount in addition to trade execution, which may be rebated back to the Fund to offset certain expenses. This amount totaled $68,126 for the period. In addition, through arrangements with the Fund's custodian, credits realized as a result of uninvested cash balances were used to reduce the Fund's expenses. During the period, these credits reduced the Fund's custody expenses by $57.
In addition, FMR reimbursed a portion of the Fund's operating expenses during the period in the amount of $9,129.
10. Distributions to Shareholders.
Distributions to shareholders of each class were as follows:
Years ended February 28, | 2014 | 2013 |
From net investment income |
|
|
Class A | $ 5,205,524 | $ 3,290,973 |
Class T | 826,286 | 500,306 |
Class B | 138,623 | 82,480 |
Class C | 1,548,556 | 820,066 |
Consumer Staples | 26,141,452 | 20,759,081 |
Institutional Class | 5,128,684 | 5,891,765 |
Total | $ 38,989,125 | $ 31,344,671 |
From net realized gain |
|
|
Class A | $ 18,454,866 | $ 3,434,776 |
Class T | 3,478,167 | 646,006 |
Class B | 1,077,295 | 260,273 |
Class C | 9,334,082 | 1,739,884 |
Consumer Staples | 84,245,287 | 18,561,423 |
Institutional Class | 20,597,330 | 4,904,297 |
Total | $ 137,187,027 | $ 29,546,659 |
Annual Report
11. Share Transactions.
Transactions for each class of shares were as follows:
| Shares | Dollars | ||
Years ended February 28, | 2014 | 2013 | 2014 | 2013 |
Class A |
|
|
|
|
Shares sold | 1,297,946 | 1,172,691 | $ 115,706,038 | $ 93,404,427 |
Reinvestment of distributions | 234,768 | 72,806 | 20,739,532 | 5,768,631 |
Shares redeemed | (1,022,897) | (756,998) | (90,649,691) | (59,959,929) |
Net increase (decrease) | 509,817 | 488,499 | $ 45,795,879 | $ 39,213,129 |
Class T |
|
|
|
|
Shares sold | 171,739 | 146,374 | $ 15,157,502 | $ 11,640,258 |
Reinvestment of distributions | 46,535 | 13,628 | 4,086,883 | 1,073,877 |
Shares redeemed | (126,021) | (73,443) | (11,017,450) | (5,785,079) |
Net increase (decrease) | 92,253 | 86,559 | $ 8,226,935 | $ 6,929,056 |
Class B |
|
|
|
|
Shares sold | 16,325 | 11,096 | $ 1,431,261 | $ 868,729 |
Reinvestment of distributions | 11,472 | 3,553 | 1,003,061 | 278,056 |
Shares redeemed | (46,659) | (56,866) | (4,085,147) | (4,452,338) |
Net increase (decrease) | (18,862) | (42,217) | $ (1,650,825) | $ (3,305,553) |
Class C |
|
|
|
|
Shares sold | 622,483 | 479,940 | $ 54,501,354 | $ 37,531,069 |
Reinvestment of distributions | 101,164 | 25,332 | 8,787,354 | 1,978,186 |
Shares redeemed | (417,359) | (291,408) | (36,266,564) | (22,752,561) |
Net increase (decrease) | 306,288 | 213,864 | $ 27,022,144 | $ 16,756,694 |
Consumer Staples |
|
|
|
|
Shares sold | 3,438,166 | 5,353,585 | $ 309,005,043 | $ 425,841,967 |
Reinvestment of distributions | 1,188,981 | 474,945 | 105,681,529 | 37,790,378 |
Shares redeemed | (6,154,349) | (5,260,820) | (548,691,818) | (416,646,931) |
Net increase (decrease) | (1,527,202) | 567,710 | $ (134,005,246) | $ 46,985,414 |
Institutional Class |
|
|
|
|
Shares sold | 2,006,485 | 3,475,040 | $ 181,066,529 | $ 279,763,267 |
Reinvestment of distributions | 271,028 | 125,836 | 24,047,781 | 10,030,919 |
Shares redeemed | (4,939,085) | (1,369,230) | (445,334,927) | (108,604,076) |
Net increase (decrease) | (2,661,572) | 2,231,646 | $ (240,220,617) | $ 181,190,110 |
12. Other.
The Fund's organizational documents provide former and current trustees and officers with a limited indemnification against liabilities arising in connection with the performance of their duties to the Fund. In the normal course of business, the Fund may also enter into contracts that provide general indemnifications. The Fund's maximum exposure under these arrangements is unknown as this would be dependent on future claims that may be made against the Fund. The risk of material loss from such claims is considered remote.
Annual Report
Fidelity Advisor Gold Fund - Institutional Class
Performance: The Bottom Line
Average annual total return reflects the change in the value of an investment, assuming reinvestment of the class' distributions from dividend income and capital gains (the profits earned upon the sale of securities that have grown in value, if any) and assuming a constant rate of performance each year. The $10,000 table and the fund's returns do not reflect the deduction of taxes that a shareholder would pay on fund distributions or the redemption of fund shares. During periods of reimbursement by Fidelity, a fund's total return will be greater than it would be had the reimbursement not occurred. How a fund did yesterday is no guarantee of how it will do tomorrow.
Average Annual Total Returns
Periods ended February 28, 2014 | Past 1 | Past 5 | Past 10 |
Institutional Class A | -26.98% | -3.07% | 3.71% |
A The initial offering of Institutional Class shares took place on December 12, 2006. Returns prior to December 12, 2006, are those of Gold Portfolio, the original class of the fund.
$10,000 Over 10 Years
Let's say hypothetically that $10,000 was invested in Fidelity Advisor Gold Fund - Institutional Class on February 29, 2004. The chart shows how the value of your investment would have changed, and also shows how the S&P 500 Index performed over the same period. See footnote A for additional information regarding the performance of Institutional Class.
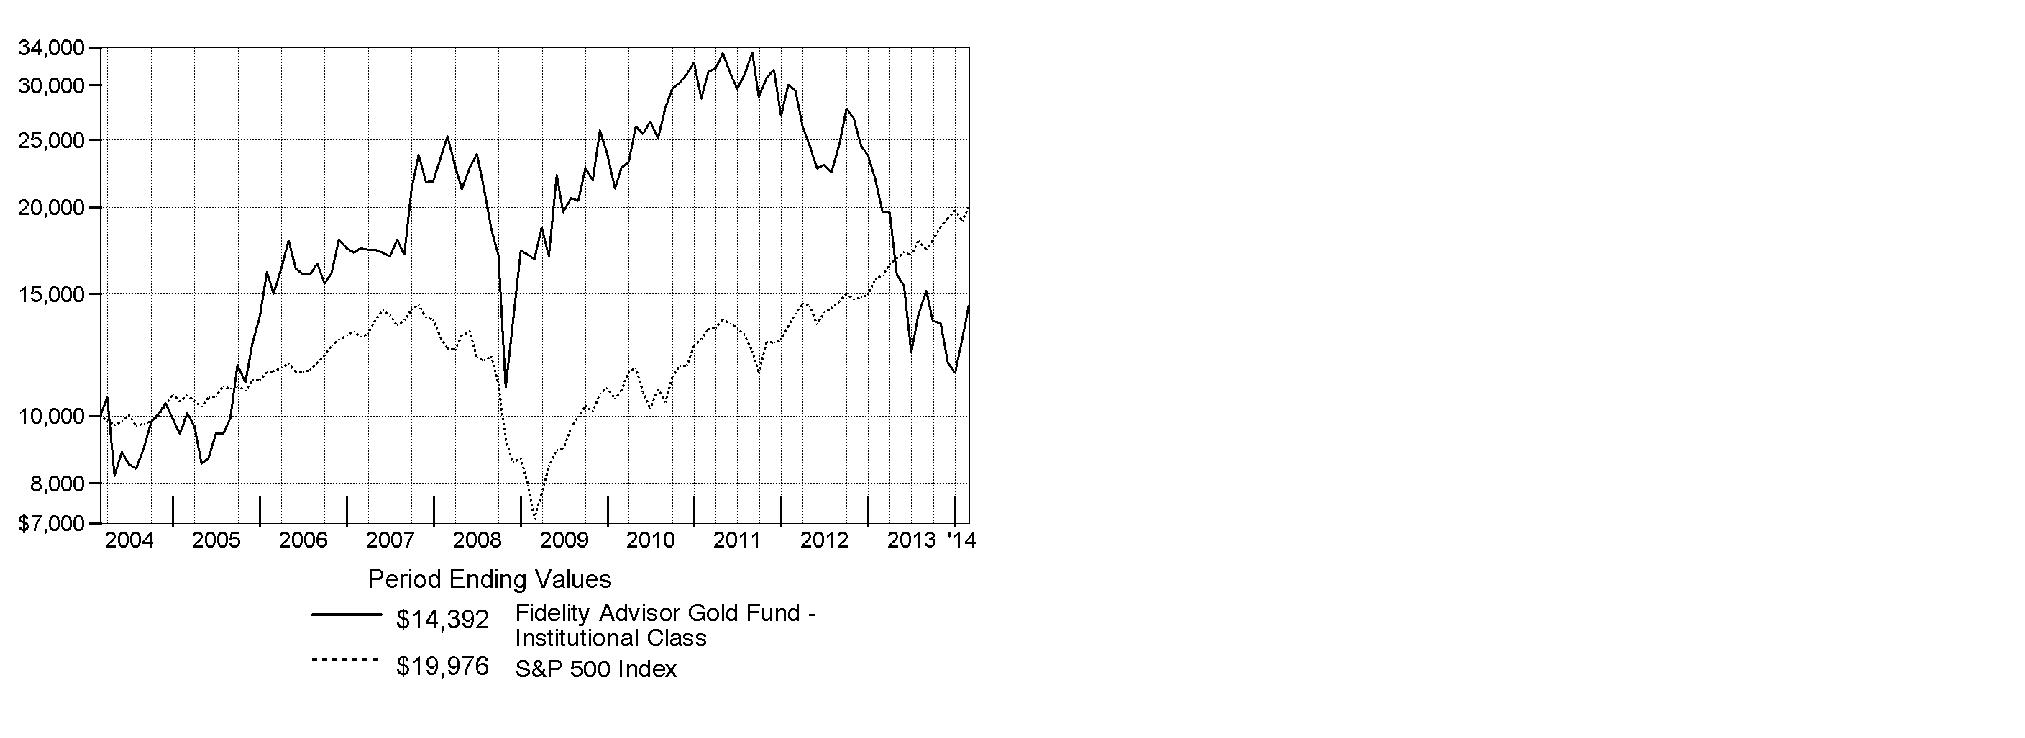
Annual Report
Fidelity Advisor Gold Fund
Management's Discussion of Fund Performance
Market Recap: Stocks overcame fears of higher interest rates - not to mention their worst January in four years - to finish sharply higher for the 12 months ending February 28, 2014. The broad S&P 500® Index and the blue-chip Dow Jones Industrial AverageSM gained 25.37% and 19.01%, respectively, amid generally favorable earnings reports and accommodative monetary policies worldwide. Performance generally increased along the risk spectrum, with smaller-cap and growth strategies leading the way. An ebullient market helped the growth-oriented Nasdaq Composite Index® to a 38.10% period gain, for example. On the other hand, both cyclical and defensive stocks had representation in the top-performing industry sectors: returns were highest in health care and consumer discretionary; lowest in utilities and telecommunication services. From a macroeconomic perspective, data still points to slow but steady improvement in the U.S., and Europe's recession may well be over. Reports from China have disappointed, but continue to suggest a relatively soft landing there. Mixed signals from the U.S. Federal Reserve as to when it might curtail its stimulative bond buying kept markets in flux during the spring and summer. Stocks regained momentum in October despite a federal budget impasse and brief government shutdown, and lower volatility prevailed through year-end. Shedding new-year concerns about China's economy, an emerging-markets sell-off and confirmation (at last) of Fed tapering - alongside confirmation of a presumably dovish Janet Yellen as new Fed chair - February saw stocks back in record territory, bearing down on the five-year anniversary of the market's bottom.
Comments from S. Joseph Wickwire II, Portfolio Manager of Fidelity Advisor® Gold Fund: For the year, the fund's Institutional Class shares returned -26.98%, compared with -30.17% for the S&P® Global BMI Gold Capped Index and 25.37% for the broadly based S&P 500® Index. For much of the period, gold and gold stocks were in what I believed was a concluding phase of a two-year correction. An approximate 15% drop in the commodity price hurt gold-mining stocks for the year, along with concerns that a higher interest rate environment would hurt the group. At the same time, some investors sold gold and gold-related stocks to buy strong-performing equities. Versus the industry benchmark, the fund was helped by overweighting outperforming names such as Osisko Mining and Rainy River Resources, whose stock prices both rose on takeover bids. I sold Rainy River before period end. Underweighting weak performer and index heavyweight Newmont Mining also helped, as it struggled with low production growth, country risk and high costs. Non-benchmark positions in gold and silver bullion contributed as more-defensive components. Conversely, the fund was hurt by stakes in Colossus Minerals, Detour Gold and Persus Mining. I significantly reduced our stake in Colossus by period end.
The views expressed above reflect those of the portfolio manager(s) only through the end of the period as stated on the cover of this report and do not necessarily represent the views of Fidelity or any other person in the Fidelity organization. Any such views are subject to change at any time based upon market or other conditions and Fidelity disclaims any responsibility to update such views. These views may not be relied on as investment advice and, because investment decisions for a Fidelity fund are based on numerous factors, may not be relied on as an indication of trading intent on behalf of any Fidelity fund.
Annual Report
Gold Portfolio
Shareholder Expense Example
As a shareholder of the Fund, you incur two types of costs: (1) transaction costs, including sales charges (loads) on purchase payments or redemption proceeds, redemption fees and (2) ongoing costs, including management fees, distribution and/or service (12b-1) fees and other Fund expenses. This Example is intended to help you understand your ongoing costs (in dollars) of investing in the Fund and to compare these costs with the ongoing costs of investing in other mutual funds.
The Example is based on an investment of $1,000 invested at the beginning of the period and held for the entire period (September 1, 2013 to February 28, 2014).
Actual Expenses
The first line of the accompanying table for each class of the Fund provides information about actual account values and actual expenses. You may use the information in this line, together with the amount you invested, to estimate the expenses that you paid over the period. Simply divide your account value by $1,000.00 (for example, an $8,600 account value divided by $1,000.00 = 8.6), then multiply the result by the number in the first line for a class of the Fund under the heading entitled "Expenses Paid During Period" to estimate the expenses you paid on your account during this period. A small balance maintenance fee of $12.00 that is charged once a year may apply for certain accounts with a value of less than $2,000. This fee is not included in the table below. If it was, the estimate of expenses you paid during the period would be higher, and your ending account value lower, by this amount. In addition, the Fund, as a shareholder in the underlying Fidelity Central Funds, will indirectly bear its pro-rata share of the fees and expenses incurred by the underlying Fidelity Central Funds. These fees and expenses are not included in the Fund's annualized expense ratio used to calculate the expense estimate in the table below.
Hypothetical Example for Comparison Purposes
The second line of the accompanying table for each class of the Fund provides information about hypothetical account values and hypothetical expenses based on a Class' actual expense ratio and an assumed rate of return of 5% per year before expenses, which is not the Class' actual return. The hypothetical account values and expenses may not be used to estimate the actual ending account balance or expenses you paid for the period. You may use this information to compare the ongoing costs of investing in the Fund and other funds. To do so, compare this 5% hypothetical example with the 5% hypothetical examples that appear in the shareholder reports of the other funds. A small balance maintenance fee of $12.00 that is charged once a year may apply for certain accounts with a value of less than $2,000. This fee is not included in the table below. If it was, the estimate of expenses you paid during the period would be higher, and your ending account value lower, by this amount. In addition, the Fund, as a shareholder in the underlying Fidelity Central Funds, will indirectly bear its pro-rata share of the fees and expenses incurred by the underlying Fidelity Central Funds. These fees and expenses are not included in the Fund's annualized expense ratio used to calculate the expense estimate in the table below.
Please note that the expenses shown in the table are meant to highlight your ongoing costs only and do not reflect any transaction costs. Therefore, the second line of the table is useful in comparing ongoing costs only, and will not help you determine the relative total costs of owning different funds. In addition, if these transactional costs were included, your costs would have been higher.
| Annualized | Beginning | Ending | Expenses Paid |
Class A | 1.21% |
|
|
|
Actual |
| $ 1,000.00 | $ 948.70 | $ 5.85 |
HypotheticalA |
| $ 1,000.00 | $ 1,018.79 | $ 6.06 |
Class T | 1.49% |
|
|
|
Actual |
| $ 1,000.00 | $ 947.70 | $ 7.20 |
HypotheticalA |
| $ 1,000.00 | $ 1,017.41 | $ 7.45 |
Class B | 1.97% |
|
|
|
Actual |
| $ 1,000.00 | $ 945.00 | $ 9.50 |
HypotheticalA |
| $ 1,000.00 | $ 1,015.03 | $ 9.84 |
Class C | 1.96% |
|
|
|
Actual |
| $ 1,000.00 | $ 945.20 | $ 9.45 |
HypotheticalA |
| $ 1,000.00 | $ 1,015.08 | $ 9.79 |
Gold | .93% |
|
|
|
Actual |
| $ 1,000.00 | $ 950.00 | $ 4.50 |
HypotheticalA |
| $ 1,000.00 | $ 1,020.18 | $ 4.66 |
Institutional Class | .86% |
|
|
|
Actual |
| $ 1,000.00 | $ 950.40 | $ 4.16 |
HypotheticalA |
| $ 1,000.00 | $ 1,020.53 | $ 4.31 |
A 5% return per year before expenses
B Annualized expense ratio reflects consolidated expenses net of applicable fee waivers.
* Expenses are equal to each Class' annualized expense ratio, multiplied by the average account value over the period, multiplied by 181/365 (to reflect the one-half year period).
Annual Report
Gold Portfolio
Consolidated Investment Changes (Unaudited)
Top Ten Holdings as of February 28, 2014 | ||
| % of fund's | % of fund's net assets |
Gold Bullion | 10.1 | 5.2 |
Goldcorp, Inc. | 9.2 | 10.1 |
Barrick Gold Corp. | 6.4 | 9.5 |
Randgold Resources Ltd. sponsored ADR | 5.2 | 4.6 |
Silver Bullion | 5.0 | 3.8 |
Newcrest Mining Ltd. | 4.7 | 5.2 |
Yamana Gold, Inc. | 4.4 | 4.9 |
Franco-Nevada Corp. | 4.1 | 3.7 |
Eldorado Gold Corp. | 3.9 | 4.8 |
AngloGold Ashanti Ltd. sponsored ADR | 3.7 | 1.6 |
| 56.7 |
|
Top Industries (% of fund's net assets) | |||
As of February 28, 2014 | |||
| Gold | 83.2% |
|
 | Commodities & Related Investments** | 15.1% |
|
| Precious Metals & Minerals | 0.7% |
|
| Diversified Metals & Mining | 0.1% |
|
| Coal & Consumable Fuels | 0.1% |
|
| Construction & Engineering | 0.1% |
|
| All Others* | 0.7% |
|

As of August 31, 2013 | |||
| Gold | 89.4% |
|
| Commodities & Related Investments** | 9.0% |
|
| Precious Metals & Minerals | 0.9% |
|
| Diversified Metals & Mining | 0.2% |
|
| Construction & Engineering | 0.0%† |
|
| Coal & Consumable Fuels | 0.0%† |
|
| All Others* | 0.5% |
|

* Includes short-term investments and net other assets (liabilities). |
** Includes gold bullion and/or silver bullion. |
† Amount represents less than 0.1% |
Geographic Diversification (% of fund's net assets) | |||
As of February 28, 2014 | |||
| Canada | 57.3% |
|
| United States of America* | 20.4% |
|
 | Australia | 7.1% |
|
| South Africa | 6.7% |
|
 | Bailiwick of Jersey | 6.5% |
|
| Bermuda | 1.0% |
|
 | Peru | 0.5% |
|
| Cayman Islands | 0.4% |
|
| United Kingdom | 0.1% |
|

Percentages are based on country or territory of incorporation and are adjusted for the effect of futures contracts, if applicable. |
As of August 31, 2013 | |||
| Canada | 64.6% |
|
| United States of America* | 14.5% |
|
| Australia | 8.7% |
|
| Bailiwick of Jersey | 5.8% |
|
| South Africa | 5.0% |
|
| Bermuda | 0.8% |
|
| Cayman Islands | 0.4% |
|
| United Kingdom | 0.1% |
|
| Peru | 0.1% |
|

Percentages are based on country or territory of incorporation and are adjusted for the effect of futures contracts, if applicable. |
Annual Report
Gold Portfolio
Consolidated Investments February 28, 2014
Showing Percentage of Net Assets
Common Stocks - 84.2% | |||
Shares | Value | ||
Australia - 7.1% | |||
CONSTRUCTION & ENGINEERING - 0.1% | |||
Construction & Engineering - 0.1% | |||
Boart Longyear Ltd. (d) | 3,985,000 | $ 1,084,584 | |
METALS & MINING - 7.0% | |||
Gold - 7.0% | |||
Beadell Resources Ltd. (a) | 10,603,618 | 7,191,225 | |
Evolution Mining Ltd. (d) | 2,371,395 | 1,978,567 | |
Gryphon Minerals Ltd. (a) | 5,060,010 | 790,178 | |
Intrepid Mines Ltd.: | |||
(Australia) (a) | 8,469,798 | 1,965,086 | |
(Canada) (a) | 320,000 | 73,693 | |
Kingsgate Consolidated NL | 328,274 | 357,381 | |
Medusa Mining Ltd. (a) | 2,246,085 | 4,349,318 | |
Newcrest Mining Ltd. | 6,941,758 | 70,245,378 | |
Papillon Resources Ltd. (a) | 3,332,270 | 4,222,443 | |
Perseus Mining Ltd.: | |||
(Australia) (a) | 3,240,134 | 1,243,273 | |
(Canada) (a) | 1,300,000 | 504,832 | |
Ramelius Resources Ltd. (a) | 980,000 | 126,803 | |
Red 5 Ltd. (a) | 1,326,000 | 130,158 | |
Regis Resources Ltd. | 2,672,293 | 5,436,935 | |
Resolute Mining Ltd. (a) | 2,988,261 | 1,613,278 | |
Saracen Mineral Holdings Ltd. (a)(d) | 4,816,787 | 1,310,969 | |
Silver Lake Resources Ltd. (a)(d) | 4,346,985 | 2,249,839 | |
St Barbara Ltd. (a)(d) | 4,283,377 | 1,337,795 | |
Troy Resources NL (a)(d) | 195,000 | 200,980 | |
Troy Resources NL (f) | 734,826 | 769,799 | |
| 106,097,930 | ||
TOTAL AUSTRALIA | 107,182,514 | ||
Bailiwick of Jersey - 6.5% | |||
METALS & MINING - 6.5% | |||
Gold - 6.5% | |||
Centamin PLC (a) | 3,761,900 | 3,464,719 | |
Lydian International Ltd. (a) | 2,325,200 | 2,267,873 | |
Polyus Gold International Ltd. | 422,400 | 1,384,598 | |
Polyus Gold International Ltd. sponsored GDR | 3,919,931 | 12,543,779 | |
Randgold Resources Ltd. sponsored ADR (d) | 994,895 | 78,636,501 | |
| 98,297,470 | ||
Bermuda - 1.0% | |||
METALS & MINING - 1.0% | |||
Gold - 1.0% | |||
Continental Gold Ltd. (a) | 3,354,700 | 15,299,589 | |
Canada - 57.3% | |||
METALS & MINING - 57.3% | |||
Diversified Metals & Mining - 0.1% | |||
NovaCopper, Inc. (a)(d) | 488,333 | 620,182 | |
| |||
Shares | Value | ||
Rio Alto Mining Ltd. (a) | 396,500 | $ 845,065 | |
Sabina Gold & Silver Corp. (a) | 980,000 | 814,233 | |
True Gold Mining, Inc. (a) | 125,000 | 43,462 | |
| 2,322,942 | ||
Gold - 56.5% | |||
Agnico Eagle Mines Ltd. (Canada) (d) | 1,606,200 | 51,538,234 | |
Alacer Gold Corp. | 2,155,063 | 5,819,235 | |
Alamos Gold, Inc. | 1,113,300 | 10,667,491 | |
Argonaut Gold, Inc. (a) | 3,609,962 | 18,778,453 | |
ATAC Resources Ltd. (a) | 67,200 | 80,715 | |
B2Gold Corp. (a) | 14,237,858 | 41,146,162 | |
Banro Corp. (a)(d) | 2,326,482 | 1,365,676 | |
Barrick Gold Corp. (d) | 4,737,769 | 96,526,749 | |
Belo Sun Mining Corp. (a)(d) | 6,797,400 | 2,670,341 | |
Centerra Gold, Inc. | 1,422,400 | 6,371,448 | |
Colossus Minerals, Inc. (a)(d) | 802,600 | 28,993 | |
Detour Gold Corp. (a)(d) | 2,014,800 | 17,504,178 | |
Detour Gold Corp. (a)(f) | 785,900 | 6,827,741 | |
Eldorado Gold Corp. | 8,794,408 | 58,375,236 | |
Franco-Nevada Corp. (d) | 1,207,700 | 61,721,072 | |
Gabriel Resources Ltd. (a) | 1,040,600 | 1,127,716 | |
Goldcorp, Inc. | 5,119,400 | 137,636,176 | |
Golden Queen Mining Co. Ltd. (a) | 15,000 | 21,750 | |
GoldQuest Mining Corp. (a) | 2,318,500 | 764,249 | |
Guyana Goldfields, Inc. (a)(d) | 2,933,700 | 7,656,816 | |
Guyana Goldfields, Inc. (a)(f) | 155,000 | 404,543 | |
IAMGOLD Corp. | 3,279,400 | 12,172,251 | |
Kinross Gold Corp. | 9,990,691 | 52,150,451 | |
Kinross Gold Corp. warrants 9/17/14 (a) | 1,192,793 | 37,702 | |
Kirkland Lake Gold, Inc. (a)(d) | 501,000 | 1,827,906 | |
Lake Shore Gold Corp. (a)(d) | 3,226,600 | 2,651,681 | |
Midas Gold Corp. (a) | 100,500 | 88,946 | |
New Gold, Inc. (a) | 7,241,575 | 44,274,779 | |
NGEx Resources, Inc. (a) | 65,000 | 106,836 | |
Novagold Resources, Inc. (a)(d) | 2,346,200 | 8,666,087 | |
OceanaGold Corp. (a) | 2,892,300 | 6,921,878 | |
Orezone Gold Corp. (a) | 372,100 | 194,905 | |
Osisko Mining Corp. (a) | 1,094,331 | 6,967,429 | |
Osisko Mining Corp. (a)(f) | 3,000,000 | 19,100,515 | |
Pilot Gold, Inc. (a) | 1,418,150 | 1,959,514 | |
Premier Gold Mines Ltd. (a)(e) | 9,787,922 | 20,772,705 | |
Pretium Resources, Inc. (a)(d) | 914,538 | 5,740,124 | |
Pretium Resources, Inc. (a)(f) | 225,000 | 1,412,219 | |
Pretium Resources, Inc. (a)(g) | 225,000 | 1,412,219 | |
Primero Mining Corp. (a)(d) | 841,200 | 5,454,543 | |
Probe Mines Ltd. (a) | 85,000 | 253,319 | |
Richmont Mines, Inc. (a) | 240,900 | 402,479 | |
Romarco Minerals, Inc. (a) | 14,078,600 | 9,154,332 | |
Romarco Minerals, Inc. (a)(f) | 5,900,000 | 3,836,359 | |
Rubicon Minerals Corp. (a) | 5,302,102 | 7,182,474 | |
Sandstorm Gold Ltd. (a)(d) | 137,000 | 722,550 | |
Seabridge Gold, Inc. (a)(d) | 601,905 | 5,224,533 | |
Common Stocks - continued | |||
Shares | Value | ||
Canada - continued | |||
METALS & MINING - CONTINUED | |||
Gold - continued | |||
SEMAFO, Inc. (d) | 2,740,000 | $ 11,011,469 | |
Sulliden Gold Corp. Ltd. (a)(d) | 4,138,400 | 3,288,894 | |
Teranga Gold Corp. (a) | 85,000 | 86,743 | |
Teranga Gold Corp. CDI unit (a) | 3,430,974 | 3,459,642 | |
Timmins Gold Corp. (a) | 122,600 | 177,152 | |
Torex Gold Resources, Inc. (a) | 15,603,400 | 16,909,672 | |
Yamana Gold, Inc. | 6,670,100 | 66,743,166 | |
| 847,398,448 | ||
Precious Metals & Minerals - 0.7% | |||
Chesapeake Gold Corp. (a) | 12,000 | 37,930 | |
Dalradian Resources, Inc. (a)(d) | 56,000 | 43,493 | |
Gold Standard Ventures Corp. (a) | 425,400 | 284,291 | |
MAG Silver Corp. (a) | 191,000 | 1,564,499 | |
Pan American Silver Corp. warrants 12/7/14 (a) | 232,460 | 7,570 | |
Silver Wheaton Corp. | 11,200 | 285,740 | |
Tahoe Resources, Inc. (a) | 328,900 | 7,716,808 | |
Wildcat Silver Corp. (a) | 75,200 | 40,069 | |
| 9,980,400 | ||
TOTAL METALS & MINING | 859,701,790 | ||
Cayman Islands - 0.4% | |||
METALS & MINING - 0.4% | |||
Gold - 0.4% | |||
Endeavour Mining Corp. (a) | 8,117,400 | 5,864,644 | |
Peru - 0.5% | |||
METALS & MINING - 0.5% | |||
Gold - 0.5% | |||
Compania de Minas Buenaventura SA sponsored ADR | 589,700 | 7,430,220 | |
South Africa - 6.7% | |||
METALS & MINING - 6.7% | |||
Gold - 6.7% | |||
AngloGold Ashanti Ltd. | 22,700 | 399,866 | |
AngloGold Ashanti Ltd. sponsored ADR (d) | 3,133,008 | 55,078,281 | |
Gold Fields Ltd. | 55,000 | 208,519 | |
Gold Fields Ltd. sponsored ADR | 6,317,026 | 23,309,826 | |
Harmony Gold Mining Co. Ltd. | 1,484,000 | 4,770,533 | |
Harmony Gold Mining Co. Ltd. sponsored ADR (d) | 2,079,900 | 6,738,876 | |
Sibanye Gold Ltd. ADR (d) | 1,195,006 | 9,571,998 | |
| 100,077,899 | ||
| |||
Shares | Value | ||
United Kingdom - 0.1% | |||
METALS & MINING - 0.1% | |||
Gold - 0.1% | |||
Patagonia Gold PLC (a)(d) | 260,000 | $ 42,994 | |
Petropavlovsk PLC (d) | 391,970 | 610,427 | |
| 653,421 | ||
Precious Metals & Minerals - 0.0% | |||
Fresnillo PLC | 10,000 | 159,333 | |
TOTAL METALS & MINING | 812,754 | ||
United States of America - 4.6% | |||
METALS & MINING - 4.5% | |||
Gold - 4.5% | |||
Allied Nevada Gold Corp. (a)(d) | 281,800 | 1,473,814 | |
Allied Nevada Gold Corp. (Canada) (a) | 30,000 | 156,900 | |
Gold Resource Corp. (d) | 100,000 | 515,000 | |
McEwen Mining, Inc. (a)(d) | 679,110 | 1,976,210 | |
Newmont Mining Corp. | 898,500 | 20,899,110 | |
Royal Gold, Inc. | 612,513 | 42,085,768 | |
| 67,106,802 | ||
OIL, GAS & CONSUMABLE FUELS - 0.1% | |||
Coal & Consumable Fuels - 0.1% | |||
Peabody Energy Corp. | 97,400 | 1,710,342 | |
TOTAL UNITED STATES OF AMERICA | 68,817,144 | ||
TOTAL COMMON STOCKS (Cost $1,605,390,234) |
| ||
Commodities - 15.1% | |||
| Troy Ounces |
|
|
Gold Bullion (a) | 114,510 | 151,730,330 | |
Silver Bullion (a) | 3,500,000 | 74,139,100 | |
TOTAL COMMODITIES (Cost $225,370,573) |
| ||
Money Market Funds - 13.3% | |||
Shares | Value | ||
Fidelity Cash Central Fund, 0.10% (b) | 16,036,002 | $ 16,036,002 | |
Fidelity Securities Lending Cash Central Fund, 0.09% (b)(c) | 183,742,153 | 183,742,153 | |
TOTAL MONEY MARKET FUNDS (Cost $199,778,155) |
| ||
TOTAL INVESTMENT PORTFOLIO - 112.6% (Cost $2,030,538,962) | 1,689,131,609 | ||
NET OTHER ASSETS (LIABILITIES) - (12.6)% | (188,533,289) | ||
NET ASSETS - 100% | $ 1,500,598,320 | ||
Legend |
(a) Non-income producing |
(b) Affiliated fund that is generally available only to investment companies and other accounts managed by Fidelity Investments. The rate quoted is the annualized seven-day yield of the fund at period end. A complete unaudited listing of the fund's holdings as of its most recent quarter end is available upon request. In addition, each Fidelity Central Fund's financial statements, which are not covered by the Fund's Report of Independent Registered Public Accounting Firm, are available on the SEC's website or upon request. |
(c) Investment made with cash collateral received from securities on loan. |
(d) Security or a portion of the security is on loan at period end. |
(e) Affiliated company |
(f) Security exempt from registration under Rule 144A of the Securities Act of 1933. These securities may be resold in transactions exempt from registration, normally to qualified institutional buyers. At the end of the period, the value of these securities amounted to $32,351,176 or 2.2% of net assets. |
(g) Restricted securities - Investment in securities not registered under the Securities Act of 1933 (excluding 144A issues). At the end of the period, the value of restricted securities (excluding 144A issues) amounted to $1,412,219 or 0.1% of net assets. |
Additional information on each restricted holding is as follows: |
Security | Acquisition Date | Acquisition Cost |
Pretium Resources, Inc. | 3/31/11 | $ 2,172,293 |
Affiliated Central Funds |
Information regarding fiscal year to date income earned by the Fund from investments in Fidelity Central Funds is as follows: |
Fund | Income earned |
Fidelity Cash Central Fund | $ 9,917 |
Fidelity Securities Lending Cash Central Fund | 598,267 |
Total | $ 608,184 |
Consolidated Subsidiary | Value, | Purchases | Sales | Dividend | Value, |
Fidelity Select Gold Cayman Ltd. | $ 116,121,090 | $ 472,317,716 | $ 344,928,800 | $ - | $ 225,764,683 |
Other Affiliated Issuers |
An affiliated company is a company in which the Fund has ownership of at least 5% of the voting securities. Fiscal year to date transactions with companies which are or were affiliates are as follows: |
Affiliate | Value, | Purchases | Sales | Dividend | Value, |
Kimber Resources, Inc. | $ 3,981 | $ - | $ 2,315 | $ - | $ - |
Kimber Resources, Inc. (144A) | 1,379,164 | - | 774,753 | - | - |
Premier Gold Mines Ltd. | 13,711,119 | 7,618,238 | - | - | 20,772,705 |
Total | $ 15,094,264 | $ 7,618,238 | $ 777,068 | $ - | $ 20,772,705 |
Other Information |
The following is a summary of the inputs used, as of February 28, 2014, involving the Fund's assets and liabilities carried at fair value. The inputs or methodology used for valuing securities may not be an indication of the risk associated with investing in those securities. For more information on valuation inputs, and their aggregation into the levels used in the table below, please refer to the Investment Valuation section in the accompanying Notes to Consolidated Financial Statements. |
Valuation Inputs at Reporting Date: | ||||
Description | Total | Level 1 | Level 2 | Level 3 |
Investments in Securities: | ||||
Common Stocks | $ 1,263,484,024 | $ 1,258,068,543 | $ 5,386,488 | $ 28,993 |
Commodities | 225,869,430 | 225,869,430 | - | - |
Money Market Funds | 199,778,155 | 199,778,155 | - | - |
Total Investments in Securities: | $ 1,689,131,609 | $ 1,683,716,128 | $ 5,386,488 | $ 28,993 |
See accompanying notes which are an integral part of the Consolidated financial statements.
Annual Report
Gold Portfolio
Consolidated Financial Statements
Consolidated Statement of Assets and Liabilities
| February 28, 2014 | |
|
|
|
Assets | ||
Investment in securities, at value (including securities loaned of $173,215,187) - See accompanying schedule: Unaffiliated issuers (cost $1,574,084,452) | $ 1,242,711,319 |
|
Fidelity Central Funds (cost $199,778,155) | 199,778,155 |
|
Commodities (cost $225,370,573) | 225,869,430 | �� |
Other affiliated issuers (cost $31,305,782) | 20,772,705 |
|
Total Investments (cost $2,030,538,962) |
| $ 1,689,131,609 |
Receivable for fund shares sold | 3,772,643 | |
Dividends receivable | 310,264 | |
Distributions receivable from Fidelity Central Funds | 58,886 | |
Prepaid expenses | 5,836 | |
Other receivables | 21,725 | |
Total assets | 1,693,300,963 | |
|
|
|
Liabilities | ||
Payable to custodian bank | $ 9,165 | |
Payable for investments purchased | 3,614,909 | |
Payable for fund shares redeemed | 4,122,024 | |
Accrued management fee | 655,535 | |
Distribution and service plan fees payable | 50,221 | |
Other affiliated payables | 328,265 | |
Other payables and accrued expenses | 180,371 | |
Collateral on securities loaned, at value | 183,742,153 | |
Total liabilities | 192,702,643 | |
|
|
|
Net Assets | $ 1,500,598,320 | |
Net Assets consist of: |
| |
Paid in capital | $ 2,719,446,235 | |
Accumulated net investment loss | (8,084) | |
Accumulated undistributed net realized gain (loss) on investments and foreign currency transactions | (877,435,473) | |
Net unrealized appreciation (depreciation) on investments and assets and liabilities in foreign currencies | (341,404,358) | |
Net Assets | $ 1,500,598,320 | |
Consolidated Statement of Assets and Liabilities -
continued
| February 28, 2014 | |
Calculation of Maximum Offering Price Class A: | $ 22.01 | |
|
|
|
Maximum offering price per share (100/94.25 of $22.01) | $ 23.35 | |
Class T: | $ 21.73 | |
|
|
|
Maximum offering price per share (100/96.50 of $21.73) | $ 22.52 | |
Class B: | $ 21.14 | |
|
|
|
Class C: | $ 21.06 | |
|
|
|
Gold: | $ 22.41 | |
|
|
|
Institutional Class: | $ 22.41 | |
A Redemption price per share is equal to net asset value less any applicable contingent deferred sales charge.
See accompanying notes which are an integral part of the Consolidated financial statements.
Annual Report
Gold Portfolio
Consolidated Financial Statements - continued
Consolidated Statement of Operations
| Year ended February 28, 2014 | |
|
|
|
Investment Income |
|
|
Dividends |
| $ 16,884,160 |
Interest |
| 308 |
Income from Fidelity Central Funds |
| 608,184 |
Total income |
| 17,492,652 |
|
|
|
Expenses | ||
Management fee | $ 8,556,432 | |
Transfer agent fees | 4,024,234 | |
Distribution and service plan fees | 572,954 | |
Accounting and security lending fees | 682,266 | |
Custodian fees and expenses | 354,790 | |
Independent trustees' compensation | 26,542 | |
Registration fees | 191,328 | |
Audit | 64,766 | |
Legal | 25,044 | |
Interest | 3,525 | |
Miscellaneous | 24,576 | |
Total expenses before reductions | 14,526,457 | |
Expense reductions | (446,858) | 14,079,599 |
Net investment income (loss) | 3,413,053 | |
Realized and Unrealized Gain (Loss) Net realized gain (loss) on: | ||
Investments: |
|
|
Unaffiliated issuers | (547,572,843) | |
Other affiliated issuers | (4,162,175) |
|
Commodities | (4,647,499) |
|
Foreign currency transactions | (225,772) | |
Total net realized gain (loss) |
| (556,608,289) |
Change in net unrealized appreciation (depreciation) on: Investments | (75,476,961) | |
Assets and liabilities in foreign currencies | 13,851 | |
Commodities | (12,614,823) | |
Total change in net unrealized appreciation (depreciation) |
| (88,077,933) |
Net gain (loss) | (644,686,222) | |
Net increase (decrease) in net assets resulting from operations | $ (641,273,169) | |
Consolidated Statement of Changes in Net Assets
| Year ended | Year ended |
Increase (Decrease) in Net Assets |
|
|
Operations |
|
|
Net investment income (loss) | $ 3,413,053 | $ 13,834,462 |
Net realized gain (loss) | (556,608,289) | (149,416,855) |
Change in net unrealized appreciation (depreciation) | (88,077,933) | (1,263,115,883) |
Net increase (decrease) in net assets resulting from operations | (641,273,169) | (1,398,698,276) |
Share transactions - net increase (decrease) | (461,130,558) | (374,414,799) |
Redemption fees | 396,348 | 209,222 |
Total increase (decrease) in net assets | (1,102,007,379) | (1,772,903,853) |
|
|
|
Net Assets | ||
Beginning of period | 2,602,605,699 | 4,375,509,552 |
End of period (including accumulated net investment loss of $8,084 and accumulated net investment loss of $129,693,237, respectively) | $ 1,500,598,320 | $ 2,602,605,699 |
See accompanying notes which are an integral part of the Consolidated financial statements.
Annual Report
Consolidated Financial Highlights - Class A
Years ended February 28, | 2014 | 2013 | 2012 H | 2011 | 2010 |
Selected Per-Share Data |
|
|
|
|
|
Net asset value, beginning of period | $ 30.25 | $ 45.37 | $ 50.92 | $ 40.50 | $ 30.45 |
Income from Investment Operations |
|
|
|
|
|
Net investment income (loss) C | - I | .07 | (.13) | (.30) | (.25) |
Net realized and unrealized gain (loss) | (8.25) | (15.19) | (2.83) | 15.28 | 11.00 |
Total from investment operations | (8.25) | (15.12) | (2.96) | 14.98 | 10.75 |
Distributions from net realized gain | - | - | (2.59) | (4.57) | (.71) |
Redemption fees added to paid in capital C | .01 | - I | - I | .01 | .01 |
Net asset value, end of period | $ 22.01 | $ 30.25 | $ 45.37 | $ 50.92 | $ 40.50 |
Total Return A, B | (27.24)% | (33.33)% | (6.24)% | 36.99% | 35.19% |
Ratios to Average Net Assets D, G |
|
|
|
|
|
Expenses before reductions | 1.21% | 1.18% | 1.14% | 1.16% | 1.21% |
Expenses net of fee waivers, if any | 1.19% | 1.17% | 1.14% | 1.15% | 1.19% |
Expenses net of all reductions | 1.18% | 1.17% | 1.14% | 1.14% | 1.17% |
Net investment income (loss) | -% F | .18% | (.28)% | (.63)% | (.63)% |
Supplemental Data |
|
|
|
|
|
Net assets, end of period (000 omitted) | $ 60,270 | $ 101,202 | $ 152,969 | $ 149,178 | $ 82,413 |
Portfolio turnover rate E | 56% | 18% | 22% | 35% | 46% |
ATotal returns would have been lower if certain expenses had not been reduced during the applicable periods shown. BTotal returns do not include the effect of the sales charges. CCalculated based on average shares outstanding during the period. DFees and expenses of any underlying Fidelity Central Funds are not included in the Fund's expense ratio. The Fund indirectly bears its proportionate share of the expenses of any underlying Fidelity Central Funds. EAmount does not include the portfolio activity of any underlying Fidelity Central Funds. FAmount represents less than .01%. GExpense ratios reflect operating expenses of the class. Expenses before reductions do not reflect amounts reimbursed by the investment adviser or reductions from brokerage service arrangements or reductions from other expense offset arrangements and do not represent the amount paid by the class during periods when reimbursements or reductions occur. Expenses net of fee waivers reflect expenses after reimbursement by the investment adviser but prior to reductions from brokerage service arrangements or other expense offset arrangements. Expenses net of all reductions represent the net expenses paid by the class. HFor the year ended February 29. IAmount represents less than $.01 per share. |
Consolidated Financial Highlights - Class T
Years ended February 28, | 2014 | 2013 | 2012 G | 2011 | 2010 |
Selected Per-Share Data |
|
|
|
|
|
Net asset value, beginning of period | $ 29.95 | $ 45.04 | $ 50.68 | $ 40.34 | $ 30.36 |
Income from Investment Operations |
|
|
|
|
|
Net investment income (loss) C | (.06) | (.03) | (.27) | (.43) | (.36) |
Net realized and unrealized gain (loss) | (8.17) | (15.06) | (2.80) | 15.21 | 10.96 |
Total from investment operations | (8.23) | (15.09) | (3.07) | 14.78 | 10.60 |
Distributions from net realized gain | - | - | (2.57) | (4.45) | (.63) |
Redemption fees added to paid in capital C | .01 | - H | - H | .01 | .01 |
Net asset value, end of period | $ 21.73 | $ 29.95 | $ 45.04 | $ 50.68 | $ 40.34 |
Total Return A, B | (27.45)% | (33.50)% | (6.49)% | 36.62% | 34.79% |
Ratios to Average Net Assets D, F |
|
|
|
|
|
Expenses before reductions | 1.49% | 1.45% | 1.43% | 1.44% | 1.51% |
Expenses net of fee waivers, if any | 1.47% | 1.44% | 1.42% | 1.42% | 1.49% |
Expenses net of all reductions | 1.46% | 1.44% | 1.42% | 1.42% | 1.47% |
Net investment income (loss) | (.28)% | (.09)% | (.57)% | (.90)% | (.93)% |
Supplemental Data |
|
|
|
|
|
Net assets, end of period (000 omitted) | $ 18,402 | $ 24,913 | $ 40,664 | $ 45,846 | $ 26,256 |
Portfolio turnover rate E | 56% | 18% | 22% | 35% | 46% |
ATotal returns would have been lower if certain expenses had not been reduced during the applicable periods shown. BTotal returns do not include the effect of the sales charges. CCalculated based on average shares outstanding during the period. DFees and expenses of any underlying Fidelity Central Funds are not included in the Fund's expense ratio. The Fund indirectly bears its proportionate share of the expenses of any underlying Fidelity Central Funds. EAmount does not include the portfolio activity of any underlying Fidelity Central Funds. FExpense ratios reflect operating expenses of the class. Expenses before reductions do not reflect amounts reimbursed by the investment adviser or reductions from brokerage service arrangements or reductions from other expense offset arrangements and do not represent the amount paid by the class during periods when reimbursements or reductions occur. Expenses net of fee waivers reflect expenses after reimbursement by the investment adviser but prior to reductions from brokerage service arrangements or other expense offset arrangements. Expenses net of all reductions represent the net expenses paid by the class. GFor the year ended February 29. HAmount represents less than $.01 per share. |
See accompanying notes which are an integral part of the Consolidated financial statements.
Annual Report
Consolidated Financial Highlights - Class B
Years ended February 28, | 2014 | 2013 | 2012 G | 2011 | 2010 |
Selected Per-Share Data |
|
|
|
|
|
Net asset value, beginning of period | $ 29.27 | $ 44.24 | $ 50.02 | $ 39.87 | $ 30.08 |
Income from Investment Operations |
|
|
|
|
|
Net investment income (loss) C | (.16) | (.21) | (.49) | (.66) | (.55) |
Net realized and unrealized gain (loss) | (7.98) | (14.76) | (2.76) | 15.02 | 10.84 |
Total from investment operations | (8.14) | (14.97) | (3.25) | 14.36 | 10.29 |
Distributions from net realized gain | - | - | (2.53) | (4.21) | (.51) |
Redemption fees added to paid in capital C | .01 | - H | - H | - H | .01 |
Net asset value, end of period | $ 21.14 | $ 29.27 | $ 44.24 | $ 50.02 | $ 39.87 |
Total Return A, B | (27.78)% | (33.84)% | (6.95)% | 35.97% | 34.12% |
Ratios to Average Net Assets D, F |
|
|
|
|
|
Expenses before reductions | 1.95% | 1.93% | 1.90% | 1.93% | 2.00% |
Expenses net of fee waivers, if any | 1.93% | 1.92% | 1.90% | 1.92% | 1.98% |
Expenses net of all reductions | 1.93% | 1.91% | 1.90% | 1.91% | 1.96% |
Net investment income (loss) | (.75)% | (.57)% | (1.04)% | (1.39)% | (1.42)% |
Supplemental Data |
|
|
|
|
|
Net assets, end of period (000 omitted) | $ 4,373 | $ 9,423 | $ 20,894 | $ 26,837 | $ 18,340 |
Portfolio turnover rate E | 56% | 18% | 22% | 35% | 46% |
ATotal returns would have been lower if certain expenses had not been reduced during the applicable periods shown. BTotal returns do not include the effect of the contingent deferred sales charge. CCalculated based on average shares outstanding during the period. DFees and expenses of any underlying Fidelity Central Funds are not included in the Fund's expense ratio. The Fund indirectly bears its proportionate share of the expenses of any underlying Fidelity Central Funds. EAmount does not include the portfolio activity of any underlying Fidelity Central Funds. FExpense ratios reflect operating expenses of the class. Expenses before reductions do not reflect amounts reimbursed by the investment adviser or reductions from brokerage service arrangements or reductions from other expense offset arrangements and do not represent the amount paid by the class during periods when reimbursements or reductions occur. Expenses net of fee waivers reflect expenses after reimbursement by the investment adviser but prior to reductions from brokerage service arrangements or other expense offset arrangements. Expenses net of all reductions represent the net expenses paid by the class. GFor the year ended February 29. HAmount represents less than $.01 per share. |
Consolidated Financial Highlights - Class C
Years ended February 28, | 2014 | 2013 | 2012 G | 2011 | 2010 |
Selected Per-Share Data |
|
|
|
|
|
Net asset value, beginning of period | $ 29.15 | $ 44.05 | $ 49.81 | $ 39.75 | $ 30.00 |
Income from Investment Operations |
|
|
|
|
|
Net investment income (loss) C | (.16) | (.20) | (.47) | (.64) | (.53) |
Net realized and unrealized gain (loss) | (7.94) | (14.70) | (2.76) | 14.98 | 10.80 |
Total from investment operations | (8.10) | (14.90) | (3.23) | 14.34 | 10.27 |
Distributions from net realized gain | - | - | (2.53) | (4.28) | (.53) |
Redemption fees added to paid in capital C | .01 | - H | - H | - H | .01 |
Net asset value, end of period | $ 21.06 | $ 29.15 | $ 44.05 | $ 49.81 | $ 39.75 |
Total Return A, B | (27.75)% | (33.83)% | (6.93)% | 36.01% | 34.15% |
Ratios to Average Net Assets D, F |
|
|
|
|
|
Expenses before reductions | 1.96% | 1.93% | 1.87% | 1.89% | 1.97% |
Expenses net of fee waivers, if any | 1.94% | 1.92% | 1.87% | 1.88% | 1.95% |
Expenses net of all reductions | 1.93% | 1.91% | 1.87% | 1.87% | 1.93% |
Net investment income (loss) | (.76)% | (.57)% | (1.01)% | (1.35)% | (1.39)% |
Supplemental Data |
|
|
|
|
|
Net assets, end of period (000 omitted) | $ 33,811 | $ 37,787 | $ 67,996 | $ 72,431 | $ 38,624 |
Portfolio turnover rate E | 56% | 18% | 22% | 35% | 46% |
ATotal returns would have been lower if certain expenses had not been reduced during the applicable periods shown. BTotal returns do not include the effect of the contingent deferred sales charge. CCalculated based on average shares outstanding during the period. DFees and expenses of any underlying Fidelity Central Funds are not included in the Fund's expense ratio. The Fund indirectly bears its proportionate share of the expenses of any underlying Fidelity Central Funds. EAmount does not include the portfolio activity of any underlying Fidelity Central Funds. FExpense ratios reflect operating expenses of the class. Expenses before reductions do not reflect amounts reimbursed by the investment adviser or reductions from brokerage service arrangements or reductions from other expense offset arrangements and do not represent the amount paid by the class during periods when reimbursements or reductions occur. Expenses net of fee waivers reflect expenses after reimbursement by the investment adviser but prior to reductions from brokerage service arrangements or other expense offset arrangements. Expenses net of all reductions represent the net expenses paid by the class. GFor the year ended February 29. HAmount represents less than $.01 per share. |
See accompanying notes which are an integral part of the Consolidated financial statements.
Annual Report
Consolidated Financial Highlights - Gold
Years ended February 28, | 2014 | 2013 | 2012 F | 2011 | 2010 |
Selected Per-Share Data |
|
|
|
|
|
Net asset value, beginning of period | $ 30.72 | $ 45.96 | $ 51.44 | $ 40.85 | $ 30.67 |
Income from Investment Operations |
|
|
|
|
|
Net investment income (loss) B | .06 | .16 | (.02) | (.18) | (.16) |
Net realized and unrealized gain (loss) | (8.38) | (15.40) | (2.85) | 15.43 | 11.10 |
Total from investment operations | (8.32) | (15.24) | (2.87) | 15.25 | 10.94 |
Distributions from net realized gain | - | - | (2.61) | (4.67) | (.77) |
Redemption fees added to paid in capital B | .01 | - G | - G | .01 | .01 |
Net asset value, end of period | $ 22.41 | $ 30.72 | $ 45.96 | $ 51.44 | $ 40.85 |
Total Return A | (27.05)% | (33.16)% | (6.00)% | 37.35% | 35.52% |
Ratios to Average Net Assets C, E |
|
|
|
|
|
Expenses before reductions | .94% | .93% | .89% | .91% | .98% |
Expenses net of fee waivers, if any | .92% | .92% | .89% | .90% | .96% |
Expenses net of all reductions | .91% | .92% | .89% | .89% | .94% |
Net investment income (loss) | .27% | .43% | (.03)% | (.37)% | (.40)% |
Supplemental Data |
|
|
|
|
|
Net assets, end of period (000 omitted) | $ 1,275,913 | $ 2,301,019 | $ 3,924,440 | $ 4,250,249 | $ 2,839,664 |
Portfolio turnover rate D | 56% | 18% | 22% | 35% | 46% |
ATotal returns would have been lower if certain expenses had not been reduced during the applicable periods shown. BCalculated based on average shares outstanding during the period. CFees and expenses of any underlying Fidelity Central Funds are not included in the Fund's expense ratio. The Fund indirectly bears its proportionate share of the expenses of any underlying Fidelity Central Funds. DAmount does not include the portfolio activity of any underlying Fidelity Central Funds. EExpense ratios reflect operating expenses of the class. Expenses before reductions do not reflect amounts reimbursed by the investment adviser or reductions from brokerage service arrangements or reductions from other expense offset arrangements and do not represent the amount paid by the class during periods when reimbursements or reductions occur. Expenses net of fee waivers reflect expenses after reimbursement by the investment adviser but prior to reductions from brokerage service arrangements or other expense offset arrangements. Expenses net of all reductions represent the net expenses paid by the class. FFor the year ended February 29. GAmount represents less than $.01 per share. |
Consolidated Financial Highlights - Institutional Class
Years ended February 28, | 2014 | 2013 | 2012 F | 2011 | 2010 |
Selected Per-Share Data |
|
|
|
|
|
Net asset value, beginning of period | $ 30.69 | $ 45.87 | $ 51.32 | $ 40.77 | $ 30.65 |
Income from Investment Operations |
|
|
|
|
|
Net investment income (loss) B | .07 | .20 | .02 | (.15) | (.15) |
Net realized and unrealized gain (loss) | (8.36) | (15.38) | (2.85) | 15.41 | 11.08 |
Total from investment operations | (8.29) | (15.18) | (2.83) | 15.26 | 10.93 |
Distributions from net realized gain | - | - | (2.62) | (4.72) | (.82) |
Redemption fees added to paid in capital B | .01 | - G | - G | .01 | .01 |
Net asset value, end of period | $ 22.41 | $ 30.69 | $ 45.87 | $ 51.32 | $ 40.77 |
Total Return A | (26.98)% | (33.09)% | (5.94)% | 37.45% | 35.50% |
Ratios to Average Net Assets C, E |
|
|
|
|
|
Expenses before reductions | .87% | .84% | .82% | .85% | .95% |
Expenses net of fee waivers, if any | .85% | .83% | .81% | .84% | .93% |
Expenses net of all reductions | .84% | .82% | .81% | .83% | .91% |
Net investment income (loss) | .34% | .52% | .04% | (.31)% | (.37)% |
Supplemental Data |
|
|
|
|
|
Net assets, end of period (000 omitted) | $ 107,830 | $ 128,262 | $ 168,548 | $ 137,246 | $ 38,037 |
Portfolio turnover rate D | 56% | 18% | 22% | 35% | 46% |
ATotal returns would have been lower if certain expenses had not been reduced during the applicable periods shown. BCalculated based on average shares outstanding during the period. CFees and expenses of any underlying Fidelity Central Funds are not included in the Fund's expense ratio. The Fund indirectly bears its proportionate share of the expenses of any underlying Fidelity Central Funds. DAmount does not include the portfolio activity of any underlying Fidelity Central Funds. EExpense ratios reflect operating expenses of the class. Expenses before reductions do not reflect amounts reimbursed by the investment adviser or reductions from brokerage service arrangements or reductions from other expense offset arrangements and do not represent the amount paid by the class during periods when reimbursements or reductions occur. Expenses net of fee waivers reflect expenses after reimbursement by the investment adviser but prior to reductions from brokerage service arrangements or other expense offset arrangements. Expenses net of all reductions represent the net expenses paid by the class. FFor the year ended February 29. GAmount represents less than $.01 per share. |
See accompanying notes which are an integral part of the Consolidated financial statements.
Annual Report
Notes to Consolidated Financial Statements
For the period ended February 28, 2014
1. Organization.
Gold Portfolio (the Fund) is a non-diversified fund of Fidelity Select Portfolios (the Trust) and is authorized to issue an unlimited number of shares. The Trust is registered under the Investment Company Act of 1940, as amended (the 1940 Act), as an open-end management investment company organized as a Massachusetts business trust. The Fund invests primarily in securities of companies whose principal business activities fall within specific industries. The Fund offers Class A, Class T, Class C, Gold and Institutional Class shares, each of which, along with Class B shares, has equal rights as to assets and voting privileges. Class B shares are closed to new accounts and additional purchases, except for exchanges and reinvestments. Each class has exclusive voting rights with respect to matters that affect that class. Class B shares will automatically convert to Class A shares after a holding period of seven years from the initial date of purchase.
2. Consolidated Subsidiary
The Fund invests in certain commodity-related investments through Fidelity Select Gold Cayman Ltd., a wholly owned subsidiary (the "Subsidiary"). As of February 28, 2014, the Fund held an investment of $225,764,683 in the Subsidiary, representing 15.0% of the Fund's net assets.
The financial statements have been consolidated and include accounts of the Fund and the Subsidiary. Accordingly, all inter-company transactions and balances have been eliminated.
3. Investments in Fidelity Central Funds.
The Fund invests in Fidelity Central Funds, which are open-end investment companies generally available only to other investment companies and accounts managed by the investment adviser and its affiliates. The Fund's Consolidated Schedule of Investments lists each of the Fidelity Central Funds held as of period end, if any, as an investment of the Fund, but does not include the underlying holdings of each Fidelity Central Fund. As an Investing Fund, the Fund indirectly bears its proportionate share of the expenses of the underlying Fidelity Central Funds.
The Money Market Central Funds seek preservation of capital and current income and are managed by Fidelity Investments Money Management, Inc. (FIMM), an affiliate of the investment adviser. Annualized expenses of the Money Market Central Funds as of their most recent shareholder report date are less than .01%.
A complete unaudited list of holdings for each Fidelity Central Fund is available upon request or at the Securities and Exchange Commission (the SEC) website at www.sec.gov. In addition, the financial statements of the Fidelity Central Funds, which are not covered by the Fund's Report of Independent Registered Public Accounting Firm, are available on the SEC website or upon request.
4. Significant Accounting Policies.
The consolidated financial statements have been prepared in conformity with accounting principles generally accepted in the United States of America (GAAP), which require management to make certain estimates and assumptions at the date of the financial statements. Actual results could differ from those estimates. Subsequent events, if any, through the date that the consolidated financial statements were issued have been evaluated in the preparation of the consolidated financial statements. The following summarizes the significant accounting policies of the Fund:
Investment Valuation. Investments are valued as of 4:00 p.m. Eastern time on the last calendar day of the period. In accordance with valuation policies and procedures approved by the Board of Trustees (the Board), the Fund attempts to obtain prices from one or more third party pricing vendors or brokers to value its investments. When current market prices, quotations or currency exchange rates are not readily available or reliable, investments will be fair valued in good faith by the Fidelity SelectCo, LLC (SelectCo) Fair Value Committee (the Committee), in accordance with procedures adopted by the Board. Factors used in determining fair value vary by investment type and may include market or investment specific events. The frequency with which these procedures are used cannot be predicted and they may be utilized to a significant extent. The Committee oversees the Fund's valuation policies and procedures and is responsible for approving and reporting to the Board all fair value determinations.
The Fund categorizes the inputs to valuation techniques used to value its investments into a disclosure hierarchy consisting of three levels as shown below:
Level 1 - quoted prices in active markets for identical investments
Level 2 - other significant observable inputs (including quoted prices for similar investments, interest rates, prepayment speeds, etc.)
Level 3 - unobservable inputs (including the Fund's own assumptions based on the best information available)
Valuation techniques used to value the Fund's investments by major category are as follows:
Equity securities, including restricted securities, for which market quotations are readily available, are valued at the last reported sale price or official closing price as reported by a third party pricing vendor on the primary market or exchange on which they are traded and are categorized as Level 1 in
Annual Report
Notes to Consolidated Financial Statements - continued
4. Significant Accounting Policies - continued
Investment Valuation - continued
the hierarchy. In the event there were no sales during the day or closing prices are not available, securities are valued at the last quoted bid price or may be valued using the last available price and are generally categorized as Level 2 in the hierarchy. For foreign equity securities, when market or security specific events arise, comparisons to the valuation of American Depositary Receipts (ADRs), futures contracts, Exchange-Traded Funds (ETFs) and certain indexes as well as quoted prices for similar securities may be used and would be categorized as Level 2 in the hierarchy. Utilizing these techniques may result in transfers between Level 1 and Level 2. For equity securities, including restricted securities, where observable inputs are limited, assumptions about market activity and risk are used and these securities may be categorized as Level 3 in the hierarchy.
Investments in commodities are valued at their last traded price at 4:00 p.m. Eastern time each business day and are categorized as Level 1 in the hierarchy.
Investments in open-end mutual funds, including the Fidelity Central Funds, are valued at their closing net asset value (NAV) each business day and are categorized as Level 1 in the hierarchy.
Changes in valuation techniques may result in transfers in or out of an assigned level within the disclosure hierarchy. The aggregate value of investments by input level, as of February 28, 2014, is included at the end of the Fund's Consolidated Schedule of Investments.
Foreign Currency. The Fund may use foreign currency contracts to facilitate transactions in foreign-denominated securities. Gains and losses from these transactions may arise from changes in the value of the foreign currency or if the counterparties do not perform under the contracts' terms.
Foreign-denominated assets, including investment securities, and liabilities are translated into U.S. dollars at the exchange rates at period end. Purchases and sales of investment securities, income and dividends received and expenses denominated in foreign currencies are translated into U.S. dollars at the exchange rate in effect on the transaction date.
The effects of exchange rate fluctuations on investments are included with the net realized and unrealized gain (loss) on investment securities. Other foreign currency transactions resulting in realized and unrealized gain (loss) are disclosed separately.
Investment Transactions and Income. For financial reporting purposes, the Fund's investment holdings and NAV include trades executed through the end of the last business day of the period. The NAV per share for processing shareholder transactions is calculated as of the close of business of the New York Stock Exchange (NYSE), normally 4:00 p.m. Eastern time and includes trades executed through the end of the prior business day. Gains and losses on securities sold are determined on the basis of identified cost and may include proceeds received from litigation. Dividend income is recorded on the ex-dividend date, except for certain dividends from foreign securities where the ex-dividend date may have passed, which are recorded as soon as the Fund is informed of the ex-dividend date. Non-cash dividends included in dividend income, if any, are recorded at the fair market value of the securities received. Distributions received on securities that represent a return of capital or capital gain are recorded as a reduction of cost of investments and/or as a realized gain. Subsequent to ex-dividend date the Fund determines the components of these distributions, based upon receipt of tax filings or other correspondence relating to the underlying investment. Interest income and distributions from the Fidelity Central Funds are accrued as earned. Interest income includes coupon interest and amortization of premium and accretion of discount on debt securities. Investment income is recorded net of foreign taxes withheld where recovery of such taxes is uncertain.
Class Allocations and Expenses. Investment income, realized and unrealized capital gains and losses, common expenses of the Fund, and certain fund-level expense reductions, if any, are allocated daily on a pro-rata basis to each class based on the relative net assets of each class to the total net assets of the Fund. Each class differs with respect to transfer agent and distribution and service plan fees incurred. Certain expense reductions may also differ by class. For the reporting period, the allocated portion of income and expenses to each class as a percent of its average net assets may vary due to the timing of recording these transactions in relation to fluctuating net assets of the classes. Expenses directly attributable to a fund are charged to that fund. Expenses attributable to more than one fund are allocated among the respective funds on the basis of relative net assets or other appropriate methods. Expense estimates are accrued in the period to which they relate and adjustments are made when actual amounts are known.
Deferred Trustee Compensation. Under a Deferred Compensation Plan (the Plan), independent Trustees may elect to defer receipt of a portion of their annual compensation. Deferred amounts are invested in a cross-section of Fidelity funds, are marked-to-market and remain in the Fund until distributed in accordance with the Plan. The investment of deferred amounts and the offsetting payable to the Trustees are included in the accompanying Consolidated Statement of Assets and Liabilities.
Income Tax Information and Distributions to Shareholders. Each year, the Fund intends to qualify as a regulated investment company under Subchapter M of the Internal Revenue Code, including distributing substantially all of its taxable income and realized gains. As a result, no provision for U.S. Federal income taxes is required. As of February 28, 2014, the Fund did not have any unrecognized tax benefits in the consolidated financial statements; nor is the Fund aware of any tax positions for which it is reasonably possible that the total amounts of unrecognized tax benefits will significantly change in the next twelve months. The Fund files a U.S. federal tax return, in addition to state and local tax returns as required. The Fund's federal income tax returns are subject to examination by the Internal Revenue Service (IRS) for a period of three fiscal years after they are filed. State and local tax returns may be subject to examination for an additional fiscal year depending on the jurisdiction. Foreign taxes are provided for based on the Fund's understanding of the tax rules and rates that exist in the foreign markets in which it invests.
Annual Report
4. Significant Accounting Policies - continued
Income Tax Information and Distributions to Shareholders - continued
The Subsidiary is classified as a controlled foreign corporation under Subchapter N of the Internal Revenue Code. Therefore, the Fund is required to increase its taxable income by its share of the Subsidiary's income. Net investment losses of the Subsidiary cannot be deducted by the Fund in the current period nor carried forward to offset taxable income in future periods.
Distributions are declared and recorded on the ex-dividend date. Income dividends and capital gain distributions are declared separately for each class. Income and capital gain distributions are determined in accordance with income tax regulations, which may differ from GAAP.
Capital accounts within the consolidated financial statements are adjusted for permanent book-tax differences. These adjustments have no impact on net assets or the results of operations. Capital accounts are not adjusted for temporary book-tax differences which will reverse in a subsequent period.
Book-tax differences are primarily due to foreign currency transactions, passive foreign investment companies (PFIC), controlled foreign corporation, deferred trustees compensation, net operating losses and losses deferred due to wash sales and excise tax regulations.
The federal tax cost of investment securities and unrealized appreciation (depreciation) as of period end on an unconsolidated basis were as follows:
Gross unrealized appreciation | $ 176,511,772 |
Gross unrealized depreciation | (654,568,628) |
Net unrealized appreciation (depreciation) on securities and other investments | $ (478,056,856) |
|
|
Tax Cost | $ 2,167,083,719 |
The tax-based components of distributable earnings as of period end were as follows:
Capital loss carryforward | (756,775,673) |
Net unrealized appreciation (depreciation) | $ (478,053,861) |
Capital loss carryforwards are only available to offset future capital gains of the Fund to the extent provided by regulations and may be limited. Under the Regulated Investment Company Modernization Act of 2010 (the Act), the Fund is permitted to carry forward capital losses incurred in taxable years beginning after December 22, 2010 for an unlimited period and such capital losses are required to be used prior to any losses that expire. The capital loss carryforward information presented below, including any applicable limitation, is estimated as of fiscal period end and is subject to adjustment.
No expiration |
|
Short-term | $ (124,603,254) |
Long-term | (632,172,419) |
Total capital loss carryforward | $ (756,775,673) |
Trading (Redemption) Fees. Shares held by investors in the Fund less than 30 days may be subject to a redemption fee equal to .75% of the NAV of shares redeemed. All redemption fees, which reduce the proceeds of the shareholder redemption, are retained by the Fund and accounted for as an addition to paid in capital.
Restricted Securities. The Fund may invest in securities that are subject to legal or contractual restrictions on resale. These securities generally may be resold in transactions exempt from registration or to the public if the securities are registered. Disposal of these securities may involve time-consuming negotiations and expense, and prompt sale at an acceptable price may be difficult. Information regarding restricted securities is included at the end of the Fund's Consolidated Schedule of Investments.
5. Purchases and Sales of Investments.
Purchases and sales of securities, other than short-term securities, aggregated $858,721,529 and $1,325,762,629, respectively.
Annual Report
Notes to Consolidated Financial Statements - continued
6. Fees and Other Transactions with Affiliates.
Management Fee. Effective August 1, 2013, SelectCo replaced Fidelity Management and Research Company (FMR), an affiliate of SelectCo, as investment adviser to the Fund. The investment adviser and its affiliates provide the Fund with investment management related services for which the Fund pays a monthly management fee. The management fee is the sum of an individual fund fee rate that is based on an annual rate of .30% of the Fund's average net assets and an annualized group fee rate that averaged .25% during the period. The group fee rate is based upon the average net assets of all the mutual funds advised by FMR and the investment adviser. The group fee rate decreases as assets under management increase and increases as assets under management decrease.
FMR, either through itself or through an affiliate provides investment management related services to the Subsidiary for which the Subsidiary pays a monthly management fee at the annual rate of .30% of its net assets. Under the management contract with the subsidiary, FMR pays all other expenses of the Subsidiary, except custodian fees.
For the reporting period, the total consolidated annual management fee rate which includes the management fee of the Fund and the Subsidiary was .58% of the Fund's average net assets.
During the period, the investment adviser waived a portion of the Fund's management fee representing the amount of the management fee paid by the Subsidiary to FMR as described in the Expense Reductions note.
Distribution and Service Plan Fees. In accordance with Rule 12b-1 of the 1940 Act, the Fund has adopted separate Distribution and Service Plans for each class of shares. Certain classes pay Fidelity Distributors Corporation (FDC), an affiliate of the investment adviser, separate Distribution and Service Fees, each of which is based on an annual percentage of each class' average net assets. In addition, FDC may pay financial intermediaries for selling shares of the Fund and providing shareholder support services. For the period, the Distribution and Service Fee rates, total fees and amounts retained by FDC were as follows:
| Distribution | Service | Total Fees | Retained |
Class A | -% | .25% | $ 161,900 | $ 1,074 |
Class T | .25% | .25% | 88,960 | 381 |
Class B | .75% | .25% | 54,419 | 40,947 |
Class C | .75% | .25% | 267,675 | 52,061 |
|
|
| $ 572,954 | $ 94,463 |
Sales Load. FDC may receive a front-end sales charge of up to 5.75% for selling Class A shares and 3.50% for selling Class T shares, some of which is paid to financial intermediaries for selling shares of the Fund. Depending on the holding period, FDC may receive contingent deferred sales charges levied on Class A, Class T, Class B, and Class C redemptions. The deferred sales charges range from 5.00% to 1.00% for Class B shares, 1.00% for Class C shares, 1.00% for certain purchases of Class A shares and .25% for certain purchases of Class T shares.
For the period, sales charge amounts retained by FDC were as follows:
| Retained |
Class A | $ 37,429 |
Class T | 9,708 |
Class B* | 26,333 |
Class C* | 6,034 |
| $ 79,504 |
* When Class B and Class C shares are initially sold, FDC pays commissions from its own resources to financial intermediaries through which the sales are made.
Transfer Agent Fees. Fidelity Investments Institutional Operations Company, Inc., (FIIOC), an affiliate of the investment adviser, is the transfer, dividend disbursing and shareholder servicing agent for each class of the Fund. FIIOC receives account fees and asset-based fees that vary according to the account size and type of account of the shareholders of the respective classes of the Fund. FIIOC pays for typesetting, printing and mailing of shareholder reports, except proxy statements.
Annual Report
6. Fees and Other Transactions with Affiliates - continued
Transfer Agent Fees - continued
For the period, transfer agent fees for each applicable class were as follows:
| Amount | % of |
Class A | $ 190,562 | .29 |
Class T | 57,622 | .32 |
Class B | 15,892 | .29 |
Class C | 78,281 | .29 |
Gold | 3,485,369 | .27 |
Institutional Class | 196,508 | .20 |
| $ 4,024,234 |
|
Accounting and Security Lending Fees. Fidelity Service Company, Inc. (FSC), an affiliate of the investment adviser, maintains the Fund's accounting records. The accounting fee is based on the level of average net assets for each month. Under a separate contract, FSC administers the security lending program. The security lending fee is based on the number and duration of lending transactions.
Brokerage Commissions. The Fund placed a portion of its portfolio transactions with brokerage firms which are affiliates of the investment adviser. Brokerage commissions are included in net realized gain (loss) and change in net unrealized appreciation (depreciation) in the Consolidated Statement of Operations. The commissions paid to these affiliated firms were $30,538 for the period.
Interfund Lending Program. Pursuant to an Exemptive Order issued by the SEC, the Fund, along with other registered investment companies having management contracts with FMR or other affiliated entities of FMR, may participate in an interfund lending program. This program provides an alternative credit facility allowing the funds to borrow from, or lend money to, other participating affiliated funds. At period end, there were no interfund loans outstanding. The Fund's activity in this program during the period for which loans were outstanding was as follows:
Borrower or Lender | Average Loan | Weighted Average | Interest |
Borrower | $ 11,641,313 | .34% | $ 3,525 |
7. Committed Line of Credit.
The Fund participates with other funds managed by the investment adviser or an affiliate in a $4.25 billion credit facility (the "line of credit") to be utilized for temporary or emergency purposes to fund shareholder redemptions or for other short-term liquidity purposes. The Fund has agreed to pay commitment fees on its pro-rata portion of the line of credit, which amounted to $3,662 and is reflected in Miscellaneous expenses on the Consolidated Statement of Operations. During the period, there were no borrowings on this line of credit.
8. Security Lending.
The Fund lends portfolio securities through a lending agent from time to time in order to earn additional income. For equity securities, a lending agent is used and may loan securities to certain qualified borrowers, which prior to August 1, 2013 included Fidelity Capital Markets (FCM), a broker-dealer affiliated with the Fund. On the settlement date of the loan, the Fund receives collateral (in the form of U.S. Treasury obligations, letters of credit and/or cash) against the loaned securities and maintains collateral in an amount not less than 100% of the market value of the loaned securities during the period of the loan. The market value of the loaned securities is determined at the close of business of the Fund and any additional required collateral is delivered to the Fund on the next business day. If the borrower defaults on its obligation to return the securities loaned because of insolvency or other reasons, the Fund may apply collateral received from the borrower against the obligation. The Fund may experience delays and costs in recovering the securities loaned. Any cash collateral received is invested in the Fidelity Securities Lending Cash Central Fund. The value of loaned securities and cash collateral at period end are disclosed on the Fund's Consolidated Statement of Assets and Liabilities. At period end, there were no security loans outstanding with FCM. Security lending income represents the income earned on investing cash collateral, less rebates paid to borrowers and any lending agent fees associated with the loan, plus any premium payments received for lending certain types of securities. Security lending income is presented in the Consolidated Statement of Operations as a component of income from Fidelity Central Funds. Total security lending income during the period amounted to $598,267 and includes $70 from securities loaned to FCM.
Annual Report
Notes to Consolidated Financial Statements - continued
9. Expense Reductions.
The investment adviser has contractually agreed to waive the Fund's management fee in an amount equal to the management fee paid by the Subsidiary to FMR. During the period, this waiver reduced the Fund's management fee by $344,911. Commissions paid to certain brokers with whom the investment adviser, or its affiliates, places trades on behalf of the Fund include an amount in addition to trade execution, which may be rebated back to the Fund to offset certain expenses. This amount totaled $79,125 for the period.
In addition, FMR reimbursed a portion of the Fund's operating expenses during the period in the amount of $22,822.
10. Share Transactions.
Transactions for each class of shares were as follows:
| Shares | Dollars | ||
Years ended February 28, | 2014 | 2013 | 2014 | 2013 |
Class A |
|
|
|
|
Shares sold | 1,443,614 | 1,412,697 | $ 31,671,750 | $ 53,420,103 |
Shares redeemed | (2,051,264) | (1,438,620) | (45,809,186) | (53,775,838) |
Net increase (decrease) | (607,650) | (25,923) | $ (14,137,436) | $ (355,735) |
Class T |
|
|
|
|
Shares sold | 364,459 | 284,748 | $ 7,796,316 | $ 10,411,769 |
Shares redeemed | (349,602) | (355,685) | (7,601,870) | (13,010,570) |
Net increase (decrease) | 14,857 | (70,937) | $ 194,446 | $ (2,598,801) |
Class B |
|
|
|
|
Shares sold | 23,041 | 16,804 | $ 484,615 | $ 624,661 |
Shares redeemed | (138,145) | (167,215) | (3,024,154) | (6,101,257) |
Net increase (decrease) | (115,104) | (150,411) | $ (2,539,539) | $ (5,476,596) |
Class C |
|
|
|
|
Shares sold | 877,429 | 311,882 | $ 17,346,606 | $ 11,372,831 |
Shares redeemed | (567,911) | (559,180) | (12,102,759) | (20,004,404) |
Net increase (decrease) | 309,518 | (247,298) | $ 5,243,847 | $ (8,631,573) |
Gold |
|
|
|
|
Shares sold | 32,449,288 | 22,313,552 | $ 718,341,081 | $ 848,495,476 |
Shares redeemed | (50,439,253) | (32,795,078) | (1,182,529,714) | (1,225,752,483) |
Net increase (decrease) | (17,989,965) | (10,481,526) | $ (464,188,633) | $ (377,257,007) |
Institutional Class |
|
|
|
|
Shares sold | 2,126,861 | 1,354,134 | $ 46,661,254 | $ 51,488,741 |
Shares redeemed | (1,494,359) | (849,045) | (32,364,497) | (31,583,828) |
Net increase (decrease) | 632,502 | 505,089 | $ 14,296,757 | $ 19,904,913 |
11. Other.
The Fund's organizational documents provide former and current trustees and officers with a limited indemnification against liabilities arising in connection with the performance of their duties to the Fund. In the normal course of business, the Fund may also enter into contracts that provide general indemnifications. The Fund's maximum exposure under these arrangements is unknown as this would be dependent on future claims that may be made against the Fund. The risk of material loss from such claims is considered remote.
Annual Report
Fidelity Advisor Materials Fund - Institutional Class
Performance: The Bottom Line
Average annual total return reflects the change in the value of an investment, assuming reinvestment of the class' distributions from dividend income and capital gains (the profits earned upon the sale of securities that have grown in value, if any) and assuming a constant rate of performance each year. The $10,000 table and the fund's returns do not reflect the deduction of taxes that a shareholder would pay on fund distributions or the redemption of fund shares. During periods of reimbursement by Fidelity, a fund's total return will be greater than it would be had the reimbursement not occurred. How a fund did yesterday is no guarantee of how it will do tomorrow.
Average Annual Total Returns
Periods ended February 28, 2014 | Past 1 | Past 5 | Past 10 |
Institutional Class A | 20.81% | 28.23% | 12.66% |
A The initial offering of Institutional Class shares took place on December 12, 2006. Returns prior to December 12, 2006, are those of Materials Portfolio, the original class of the fund.
Prior to October 1, 2006, the fund was named Industrial Materials Portfolio, and the fund operated under certain different investment policies and compared its performance to a different additional index. The fund's historical performance may not represent its current investment policies.
$10,000 Over 10 Years
Let's say hypothetically that $10,000 was invested in Fidelity Advisor Materials Fund - Institutional Class on February 29, 2004. The chart shows how the value of your investment would have changed, and also shows how the S&P 500 Index performed over the same period. See footnote A for additional information regarding the performance of Institutional Class.
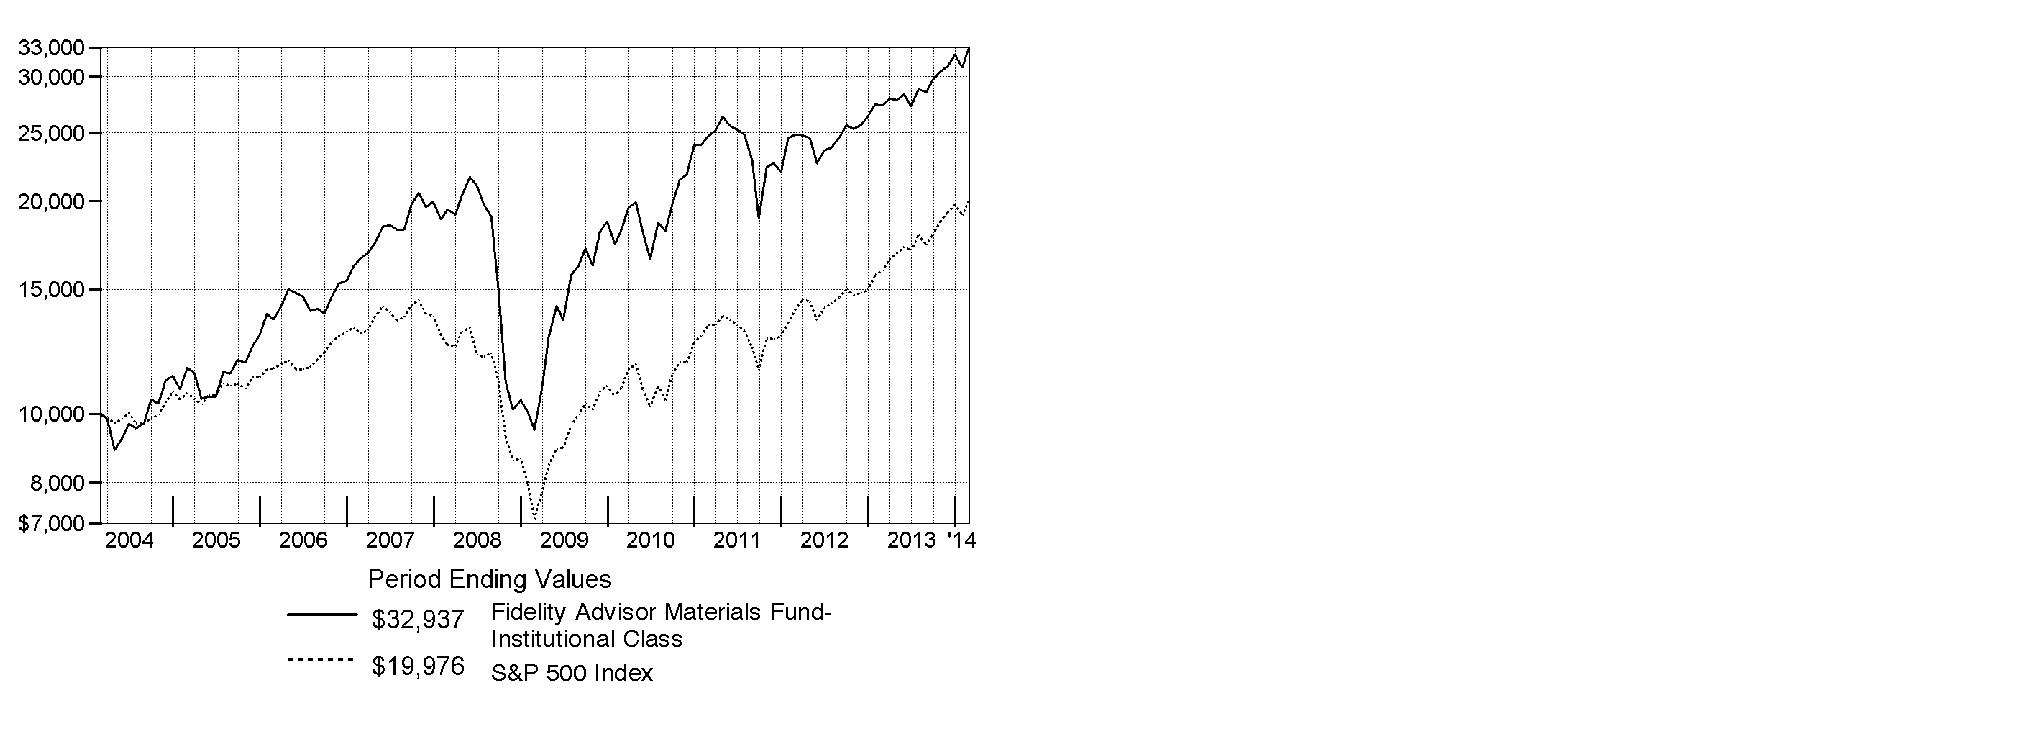
Annual Report
Fidelity Advisor Materials Fund
Management's Discussion of Fund Performance
Market Recap: Stocks overcame fears of higher interest rates - not to mention their worst January in four years - to finish sharply higher for the 12 months ending February 28, 2014. The broad S&P 500® Index and the blue-chip Dow Jones Industrial AverageSM gained 25.37% and 19.01%, respectively, amid generally favorable earnings reports and accommodative monetary policies worldwide. Performance generally increased along the risk spectrum, with smaller-cap and growth strategies leading the way. An ebullient market helped the growth-oriented Nasdaq Composite Index® to a 38.10% period gain, for example. On the other hand, both cyclical and defensive stocks had representation in the top-performing industry sectors: returns were highest in health care and consumer discretionary; lowest in utilities and telecommunication services. From a macroeconomic perspective, data still points to slow but steady improvement in the U.S., and Europe's recession may well be over. Reports from China have disappointed, but continue to suggest a relatively soft landing there. Mixed signals from the U.S. Federal Reserve as to when it might curtail its stimulative bond buying kept markets in flux during the spring and summer. Stocks regained momentum in October despite a federal budget impasse and brief government shutdown, and lower volatility prevailed through year-end. Shedding new-year concerns about China's economy, an emerging-markets sell-off and confirmation (at last) of Fed tapering - alongside confirmation of a presumably dovish Janet Yellen as new Fed chair - February saw stocks back in record territory, bearing down on the five-year anniversary of the market's bottom.
Comments from Tobias Welo, Portfolio Manager of Fidelity Advisor® Materials Fund: For the year, the fund's Institutional Class shares returned 20.81%, trailing the 24.53% advance of the MSCI® U.S. IMI Materials 25-50 Index and also lagging the S&P 500®. Versus the broader market, extreme weakness in gold and other precious metals weighed on the materials sector, while diversified chemicals and specialty chemicals were some of the stronger groups in the MSCI index. The fund's performance versus the MSCI index was held back the most by avoiding two large, strong-performing benchmark constituents, DuPont and Dow Chemical, for nearly the entire period. Both stocks were sold from the fund early in April. Gold miner Goldcorp, based in Canada, also was a significant detractor. Amid a sizable decline in the price of gold and rising exploration and production costs, I sold Goldcorp. Further weighing on our results was commodity chemicals manufacturer Axiall. Coal miner Peabody Energy worked against us as well. Goldcorp and Peabody Energy were not in the index. On the positive side, largely avoiding gold miner and index stock Newmont Mining, which I sold, made this stock easily the fund's largest relative contributor. Within the diversified metals & mining segment, not owning copper producer Freeport-McMoRan Copper & Gold, another index component, worked in our favor, as demand in this market remained lackluster. Positioning in the fertilizers & agricultural chemicals group also aided performance versus the MSCI index. The main performance boost from this group came from not owning weak-performing index stock Mosaic, a phosphate producer. Meanwhile, positioning in CF Industries Holdings, primarily a manufacturer of nitrogen fertilizer products, paid off for the fund.
The views expressed above reflect those of the portfolio manager(s) only through the end of the period as stated on the cover of this report and do not necessarily represent the views of Fidelity or any other person in the Fidelity organization. Any such views are subject to change at any time based upon market or other conditions and Fidelity disclaims any responsibility to update such views. These views may not be relied on as investment advice and, because investment decisions for a Fidelity fund are based on numerous factors, may not be relied on as an indication of trading intent on behalf of any Fidelity fund.
Annual Report
Materials Portfolio
Shareholder Expense Example
As a shareholder of the Fund, you incur two types of costs: (1) transaction costs, including sales charges (loads) on purchase payments or redemption proceeds, redemption fees and (2) ongoing costs, including management fees, distribution and/or service (12b-1) fees and other Fund expenses. This Example is intended to help you understand your ongoing costs (in dollars) of investing in the Fund and to compare these costs with the ongoing costs of investing in other mutual funds.
The Example is based on an investment of $1,000 invested at the beginning of the period and held for the entire period (September 1, 2013 to February 28, 2014).
Actual Expenses
The first line of the accompanying table for each class of the Fund provides information about actual account values and actual expenses. You may use the information in this line, together with the amount you invested, to estimate the expenses that you paid over the period. Simply divide your account value by $1,000.00 (for example, an $8,600 account value divided by $1,000.00 = 8.6), then multiply the result by the number in the first line for a class of the Fund under the heading entitled "Expenses Paid During Period" to estimate the expenses you paid on your account during this period. A small balance maintenance fee of $12.00 that is charged once a year may apply for certain accounts with a value of less than $2,000. This fee is not included in the table below. If it was, the estimate of expenses you paid during the period would be higher, and your ending account value lower, by this amount. In addition, the Fund, as a shareholder in the underlying Fidelity Central Funds, will indirectly bear its pro-rata share of the fees and expenses incurred by the underlying Fidelity Central Funds. These fees and expenses are not included in the Fund's annualized expense ratio used to calculate the expense estimate in the table below.
Hypothetical Example for Comparison Purposes
The second line of the accompanying table for each class of the Fund provides information about hypothetical account values and hypothetical expenses based on a Class' actual expense ratio and an assumed rate of return of 5% per year before expenses, which is not the Class' actual return. The hypothetical account values and expenses may not be used to estimate the actual ending account balance or expenses you paid for the period. You may use this information to compare the ongoing costs of investing in the Fund and other funds. To do so, compare this 5% hypothetical example with the 5% hypothetical examples that appear in the shareholder reports of the other funds. A small balance maintenance fee of $12.00 that is charged once a year may apply for certain accounts with a value of less than $2,000. This fee is not included in the table below. If it was, the estimate of expenses you paid during the period would be higher, and your ending account value lower, by this amount. In addition, the Fund, as a shareholder in the underlying Fidelity Central Funds, will indirectly bear its pro-rata share of the fees and expenses incurred by the underlying Fidelity Central Funds. These fees and expenses are not included in the Fund's annualized expense ratio used to calculate the expense estimate in the table below.
Please note that the expenses shown in the table are meant to highlight your ongoing costs only and do not reflect any transaction costs. Therefore, the second line of the table is useful in comparing ongoing costs only, and will not help you determine the relative total costs of owning different funds. In addition, if these transactional costs were included, your costs would have been higher.
| Annualized | Beginning | Ending | Expenses Paid |
Class A | 1.08% |
|
|
|
Actual |
| $ 1,000.00 | $ 1,152.50 | $ 5.76 |
HypotheticalA |
| $ 1,000.00 | $ 1,019.44 | $ 5.41 |
Class T | 1.39% |
|
|
|
Actual |
| $ 1,000.00 | $ 1,150.80 | $ 7.41 |
HypotheticalA |
| $ 1,000.00 | $ 1,017.90 | $ 6.95 |
Class B | 1.91% |
|
|
|
Actual |
| $ 1,000.00 | $ 1,147.80 | $ 10.17 |
HypotheticalA |
| $ 1,000.00 | $ 1,015.32 | $ 9.54 |
Class C | 1.84% |
|
|
|
Actual |
| $ 1,000.00 | $ 1,148.30 | $ 9.80 |
HypotheticalA |
| $ 1,000.00 | $ 1,015.67 | $ 9.20 |
Materials | .81% |
|
|
|
Actual |
| $ 1,000.00 | $ 1,154.10 | $ 4.33 |
HypotheticalA |
| $ 1,000.00 | $ 1,020.78 | $ 4.06 |
Institutional Class | .80% |
|
|
|
Actual |
| $ 1,000.00 | $ 1,154.10 | $ 4.27 |
HypotheticalA |
| $ 1,000.00 | $ 1,020.83 | $ 4.01 |
A 5% return per year before expenses
B Annualized expense ratio reflects expenses net of applicable fee waivers.
* Expenses are equal to each Class' annualized expense ratio, multiplied by the average account value over the period, multiplied by 181/365 (to reflect the one-half year period).
Annual Report
Materials Portfolio
Investment Changes (Unaudited)
Top Ten Stocks as of February 28, 2014 | ||
| % of fund's | % of fund's net assets |
Monsanto Co. | 9.4 | 9.8 |
LyondellBasell Industries NV Class A | 6.8 | 6.0 |
Praxair, Inc. | 5.6 | 6.1 |
FMC Corp. | 5.4 | 4.8 |
Eastman Chemical Co. | 4.9 | 4.5 |
CF Industries Holdings, Inc. | 4.4 | 1.5 |
Vulcan Materials Co. | 3.9 | 2.9 |
Rock-Tenn Co. Class A | 3.6 | 3.2 |
International Paper Co. | 3.6 | 3.9 |
W.R. Grace & Co. | 3.2 | 2.6 |
| 50.8 | |
Top Industries (% of fund's net assets) | |||
As of February 28, 2014 | |||
| Chemicals | 69.7% |
|
| Containers & Packaging | 9.8% |
|
| Metals & Mining | 6.9% |
|
| Construction Materials | 5.7% |
|
| Paper & Forest Products | 4.7% |
|
| All Others* | 3.2% |
|

As of August 31, 2013 | |||
| Chemicals | 67.1% |
|
| Containers & Packaging | 10.3% |
|
| Metals & Mining | 9.7% |
|
| Paper & Forest Products | 4.7% |
|
| Construction Materials | 4.4% |
|
| All Others* | 3.8% |
|

* Includes short-term investments and net other assets (liabilities). |
Annual Report
Materials Portfolio
Investments February 28, 2014
Showing Percentage of Net Assets
Common Stocks - 99.1% | |||
Shares | Value | ||
CHEMICALS - 69.7% | |||
Commodity Chemicals - 11.7% | |||
Axiall Corp. | 1,153,057 | $ 46,664,217 | |
Cabot Corp. | 968,987 | 52,460,956 | |
LyondellBasell Industries NV Class A | 1,586,496 | 139,738,568 | |
Methanex Corp. | 29,500 | 2,067,371 | |
| 240,931,112 | ||
Diversified Chemicals - 11.5% | |||
Eastman Chemical Co. | 1,144,130 | 100,031,286 | |
FMC Corp. | 1,449,536 | 111,875,188 | |
Lanxess AG | 144,255 | 10,708,414 | |
Olin Corp. (d) | 564,517 | 14,784,700 | |
| 237,399,588 | ||
Fertilizers & Agricultural Chemicals - 16.9% | |||
CF Industries Holdings, Inc. | 360,262 | 90,389,736 | |
Intrepid Potash, Inc. (a)(d) | 719,334 | 10,653,337 | |
Monsanto Co. | 1,753,830 | 192,956,376 | |
Potash Corp. of Saskatchewan, Inc. (d) | 1,647,520 | 54,456,093 | |
| 348,455,542 | ||
Industrial Gases - 7.4% | |||
Airgas, Inc. | 345,096 | 37,201,349 | |
Praxair, Inc. | 886,374 | 115,556,578 | |
| 152,757,927 | ||
Specialty Chemicals - 22.2% | |||
Ashland, Inc. | 294,815 | 27,821,692 | |
Celanese Corp. Class A | 500,993 | 26,748,016 | |
Chemtura Corp. (a) | 635,609 | 15,731,323 | |
Cytec Industries, Inc. | 308,814 | 29,235,421 | |
Ecolab, Inc. | 506,820 | 54,609,855 | |
Ferro Corp. (a) | 119,604 | 1,569,204 | |
H.B. Fuller Co. | 235,851 | 11,434,056 | |
Innospec, Inc. | 175,792 | 7,648,710 | |
NewMarket Corp. | 85,676 | 31,671,847 | |
PPG Industries, Inc. | 234,483 | 46,385,427 | |
Royal DSM NV | 245,999 | 15,719,579 | |
RPM International, Inc. | 411,449 | 17,223,255 | |
Sherwin-Williams Co. | 289,154 | 57,969,594 | |
Sigma Aldrich Corp. | 528,721 | 49,916,550 | |
W.R. Grace & Co. (a) | 646,640 | 65,530,498 | |
| 459,215,027 | ||
TOTAL CHEMICALS | 1,438,759,196 | ||
CONSTRUCTION MATERIALS - 5.7% | |||
Construction Materials - 5.7% | |||
Eagle Materials, Inc. | 426,955 | 37,742,822 | |
Vulcan Materials Co. | 1,163,835 | 79,059,312 | |
| 116,802,134 | ||
| |||
Shares | Value | ||
CONTAINERS & PACKAGING - 9.8% | |||
Metal & Glass Containers - 2.7% | |||
Aptargroup, Inc. | 464,324 | $ 30,724,319 | |
Silgan Holdings, Inc. | 495,965 | 23,910,473 | |
| 54,634,792 | ||
Paper Packaging - 7.1% | |||
Graphic Packaging Holding Co. (a) | 5,033,595 | 51,544,013 | |
MeadWestvaco Corp. | 590,966 | 22,119,857 | |
Rock-Tenn Co. Class A | 659,271 | 73,587,829 | |
| 147,251,699 | ||
TOTAL CONTAINERS & PACKAGING | 201,886,491 | ||
METALS & MINING - 6.9% | |||
Diversified Metals & Mining - 1.4% | |||
Copper Mountain Mining Corp. (a) | 4,161,827 | 8,268,779 | |
First Quantum Minerals Ltd. | 1,065,500 | 20,669,141 | |
| 28,937,920 | ||
Gold - 1.6% | |||
Franco-Nevada Corp. | 199,900 | 10,216,148 | |
Royal Gold, Inc. | 339,504 | 23,327,320 | |
| 33,543,468 | ||
Steel - 3.9% | |||
Carpenter Technology Corp. | 578,733 | 34,232,057 | |
Haynes International, Inc. | 53,562 | 2,652,926 | |
Reliance Steel & Aluminum Co. | 479,827 | 33,242,415 | |
Worthington Industries, Inc. | 256,272 | 10,215,002 | |
| 80,342,400 | ||
TOTAL METALS & MINING | 142,823,788 | ||
OIL, GAS & CONSUMABLE FUELS - 2.3% | |||
Coal & Consumable Fuels - 2.3% | |||
Peabody Energy Corp. | 2,685,037 | 47,149,250 | |
PAPER & FOREST PRODUCTS - 4.7% | |||
Forest Products - 0.3% | |||
Boise Cascade Co. | 242,804 | 7,184,570 | |
Paper Products - 4.4% | |||
International Paper Co. | 1,504,502 | 73,555,103 | |
P.H. Glatfelter Co. | 568,979 | 17,268,513 | |
| 90,823,616 | ||
TOTAL PAPER & FOREST PRODUCTS | 98,008,186 | ||
TOTAL COMMON STOCKS (Cost $1,492,773,571) |
| ||
Convertible Bonds - 0.4% | ||||
| Principal | Value | ||
BUILDING PRODUCTS - 0.4% | ||||
Building Products - 0.4% | ||||
Aspen Aerogels, Inc. 8% 6/1/14 (e) | $ 7,861,200 | $ 7,861,200 | ||
Money Market Funds - 3.6% | |||
Shares |
| ||
Fidelity Cash Central Fund, 0.10% (b) | 8,860,056 | 8,860,056 | |
Fidelity Securities Lending Cash Central Fund, 0.09% (b)(c) | 64,829,475 | 64,829,475 | |
TOTAL MONEY MARKET FUNDS (Cost $73,689,531) |
| ||
TOTAL INVESTMENT PORTFOLIO - 103.1% (Cost $1,574,324,302) | 2,126,979,776 | ||
NET OTHER ASSETS (LIABILITIES) - (3.1)% | (63,524,892) | ||
NET ASSETS - 100% | $ 2,063,454,884 | ||
Legend |
(a) Non-income producing |
(b) Affiliated fund that is generally available only to investment companies and other accounts managed by Fidelity Investments. The rate quoted is the annualized seven-day yield of the fund at period end. A complete unaudited listing of the fund's holdings as of its most recent quarter end is available upon request. In addition, each Fidelity Central Fund's financial statements, which are not covered by the Fund's Report of Independent Registered Public Accounting Firm, are available on the SEC's website or upon request. |
(c) Investment made with cash collateral received from securities on loan. |
(d) Security or a portion of the security is on loan at period end. |
(e) Restricted securities - Investment in securities not registered under the Securities Act of 1933 (excluding 144A issues). At the end of the period, the value of restricted securities (excluding 144A issues) amounted to $7,861,200 or 0.4% of net assets. |
Additional information on each restricted holding is as follows: |
Security | Acquisition Date | Acquisition Cost |
Aspen Aerogels, Inc. 8% 6/1/14 | 6/1/11 | $ 7,861,200 |
Affiliated Central Funds |
Information regarding fiscal year to date income earned by the Fund from investments in Fidelity Central Funds is as follows: |
Fund | Income earned |
Fidelity Cash Central Fund | $ 34,198 |
Fidelity Securities Lending Cash Central Fund | 215,485 |
Total | $ 249,683 |
Other Information |
The following is a summary of the inputs used, as of February 28, 2014, involving the Fund's assets and liabilities carried at fair value. The inputs or methodology used for valuing securities may not be an indication of the risk associated with investing in those securities. For more information on valuation inputs, and their aggregation into the levels used in the table below, please refer to the Investment Valuation section in the accompanying Notes to Financial Statements. |
Valuation Inputs at Reporting Date: | ||||
Description | Total | Level 1 | Level 2 | Level 3 |
Investments in Securities: | ||||
Common Stocks | $ 2,045,429,045 | $ 2,045,429,045 | $ - | $ - |
Convertible Bonds | 7,861,200 | - | - | 7,861,200 |
Money Market Funds | 73,689,531 | 73,689,531 | - | - |
Total Investments in Securities: | $ 2,126,979,776 | $ 2,119,118,576 | $ - | $ 7,861,200 |
Distribution of investments by country or territory of incorporation, as a percentage of total net assets, is as follows (Unaudited): |
United States of America | 87.3% |
Netherlands | 7.6% |
Canada | 4.6% |
Others (Individually Less Than 1%) | 0.5% |
| 100.0% |
See accompanying notes which are an integral part of the financial statements.
Annual Report
Materials Portfolio
Financial Statements
Statement of Assets and Liabilities
| February 28, 2014 | |
|
|
|
Assets | ||
Investment in securities, at value (including securities loaned of $61,977,734) - See accompanying schedule: Unaffiliated issuers (cost $1,500,634,771) | $ 2,053,290,245 |
|
Fidelity Central Funds (cost $73,689,531) | 73,689,531 |
|
Total Investments (cost $1,574,324,302) |
| $ 2,126,979,776 |
Receivable for fund shares sold | 3,007,999 | |
Dividends receivable | 3,234,090 | |
Interest receivable | 1,894,269 | |
Distributions receivable from Fidelity Central Funds | 10,136 | |
Prepaid expenses | 9,111 | |
Other receivables | 34,983 | |
Total assets | 2,135,170,364 | |
|
|
|
Liabilities | ||
Payable for investments purchased | $ 2,070,473 | |
Payable for fund shares redeemed | 3,233,447 | |
Accrued management fee | 913,718 | |
Distribution and service plan fees payable | 177,975 | |
Other affiliated payables | 392,628 | |
Other payables and accrued expenses | 97,764 | |
Collateral on securities loaned, at value | 64,829,475 | |
Total liabilities | 71,715,480 | |
|
|
|
Net Assets | $ 2,063,454,884 | |
Net Assets consist of: |
| |
Paid in capital | $ 1,461,775,897 | |
Distributions in excess of net investment income | (815,927) | |
Accumulated undistributed net realized gain (loss) on investments and foreign currency transactions | 49,842,108 | |
Net unrealized appreciation (depreciation) on investments and assets and liabilities in foreign currencies | 552,652,806 | |
Net Assets | $ 2,063,454,884 | |
Statement of Assets and Liabilities - continued
| February 28, 2014 | |
|
|
|
Calculation of Maximum Offering Price Class A: | $ 86.46 | |
|
|
|
Maximum offering price per share (100/94.25 of $86.46) | $ 91.73 | |
Class T: | $ 85.99 | |
|
|
|
Maximum offering price per share (100/96.50 of $85.99) | $ 89.11 | |
Class B: | $ 84.63 | |
|
|
|
Class C: | $ 84.38 | |
|
|
|
Materials: | $ 86.81 | |
|
|
|
Institutional Class: | $ 86.66 | |
A Redemption price per share is equal to net asset value less any applicable contingent deferred sales charge.
See accompanying notes which are an integral part of the financial statements.
Annual Report
Statement of Operations
| Year ended February 28, 2014 | |
|
|
|
Investment Income |
|
|
Dividends |
| $ 26,740,023 |
Interest |
| 793,734 |
Income from Fidelity Central Funds |
| 249,683 |
Total income |
| 27,783,440 |
|
|
|
Expenses | ||
Management fee | $ 9,962,330 | |
Transfer agent fees | 4,003,115 | |
Distribution and service plan fees | 1,856,070 | |
Accounting and security lending fees | 557,577 | |
Custodian fees and expenses | 37,485 | |
Independent trustees' compensation | 34,172 | |
Registration fees | 190,648 | |
Audit | 48,214 | |
Legal | 28,005 | |
Miscellaneous | 19,389 | |
Total expenses before reductions | 16,737,005 | |
Expense reductions | (83,637) | 16,653,368 |
Net investment income (loss) | 11,130,072 | |
Realized and Unrealized Gain (Loss) Net realized gain (loss) on: | ||
Investment securities: |
|
|
Unaffiliated issuers | 105,183,777 | |
Foreign currency transactions | (3,123) | |
Futures contracts | 702,685 | |
Total net realized gain (loss) |
| 105,883,339 |
Change in net unrealized appreciation (depreciation) on: Investment securities | 227,782,826 | |
Assets and liabilities in foreign currencies | 315 | |
Futures contracts | (417,650) | |
Total change in net unrealized appreciation (depreciation) |
| 227,365,491 |
Net gain (loss) | 333,248,830 | |
Net increase (decrease) in net assets resulting from operations | $ 344,378,902 | |
Statement of Changes in Net Assets
| Year ended | Year ended |
Increase (Decrease) in Net Assets |
|
|
Operations |
|
|
Net investment income (loss) | $ 11,130,072 | $ 17,162,906 |
Net realized gain (loss) | 105,883,339 | 19,850,674 |
Change in net unrealized appreciation (depreciation) | 227,365,491 | 92,211,838 |
Net increase (decrease) in net assets resulting from operations | 344,378,902 | 129,225,418 |
Distributions to shareholders from net investment income | (9,652,596) | (15,064,080) |
Distributions to shareholders from net realized gain | (36,877,810) | (31,892,999) |
Total distributions | (46,530,406) | (46,957,079) |
Share transactions - net increase (decrease) | 29,379,358 | 219,532,050 |
Redemption fees | 36,980 | 63,898 |
Total increase (decrease) in net assets | 327,264,834 | 301,864,287 |
|
|
|
Net Assets | ||
Beginning of period | 1,736,190,050 | 1,434,325,763 |
End of period (including distributions in excess of net investment income of $815,927 and undistributed net investment income of $1,139,006, respectively) | $ 2,063,454,884 | $ 1,736,190,050 |
See accompanying notes which are an integral part of the financial statements.
Annual Report
Financial Highlights - Class A
Years ended February 28, | 2014 | 2013 | 2012 J | 2011 | 2010 |
Selected Per-Share Data |
|
|
|
|
|
Net asset value, beginning of period | $ 73.44 | $ 69.23 | $ 69.96 | $ 52.54 | $ 27.65 |
Income from Investment Operations |
|
|
|
|
|
Net investment income (loss) C | .36 | .70 | .40 | 1.08 F | .30 G |
Net realized and unrealized gain (loss) | 14.56 | 5.69 | (.35) | 17.40 | 24.90 |
Total from investment operations | 14.92 | 6.39 | .05 | 18.48 | 25.20 |
Distributions from net investment income | (.30) | (.63) | (.40) | (1.06) | (.32) |
Distributions from net realized gain | (1.60) | (1.55) | (.38) | (.01) | - |
Total distributions | (1.90) | (2.18) | (.78) | (1.07) | (.32) |
Redemption fees added to paid in capital C | - K | - K | - K | .01 | .01 |
Net asset value, end of period | $ 86.46 | $ 73.44 | $ 69.23 | $ 69.96 | $ 52.54 |
Total Return A, B | 20.46% | 9.40% | .21% | 35.33% | 91.25% |
Ratios to Average Net Assets D, H |
|
|
|
|
|
Expenses before reductions | 1.10% | 1.13% | 1.13% | 1.16% | 1.23% |
Expenses net of fee waivers, if any | 1.10% | 1.13% | 1.13% | 1.16% | 1.23% |
Expenses net of all reductions | 1.09% | 1.12% | 1.13% | 1.15% | 1.22% |
Net investment income (loss) | .45% | 1.02% | .61% | 1.81% F | .65% G |
Supplemental Data |
|
|
|
|
|
Net assets, end of period (000 omitted) | $ 336,777 | $ 219,627 | $ 157,781 | $ 124,160 | $ 52,352 |
Portfolio turnover rate E | 53% | 61% | 94% | 87% | 104% I |
ATotal returns would have been lower if certain expenses had not been reduced during the applicable periods shown. BTotal returns do not include the effect of the sales charges. CCalculated based on average shares outstanding during the period. DFees and expenses of any underlying Fidelity Central Funds are not included in the Fund's expense ratio. The Fund indirectly bears its proportionate share of the expenses of any underlying Fidelity Central Funds. EAmount does not include the portfolio activity of any underlying Fidelity Central Funds. FInvestment income per share reflects a large, non-recurring dividend which amounted to $.83 per share. Excluding this non-recurring dividend, the ratio of net investment income (loss) to average net assets would have been .41%. GInvestment income per share reflects a large, non-recurring dividend which amounted to $.10 per share. Excluding this non-recurring dividend, the ratio of net investment income (loss) to average net assets would have been .43%. HExpense ratios reflect operating expenses of the class. Expenses before reductions do not reflect amounts reimbursed by the investment adviser or reductions from brokerage service arrangements or reductions from other expense offset arrangements and do not represent the amount paid by the class during periods when reimbursements or reductions occur. Expenses net of fee waivers reflect expenses after reimbursement by the investment adviser but prior to reductions from brokerage service arrangements or other expense offset arrangements. Expenses net of all reductions represent the net expenses paid by the class. IThe portfolio turnover rate does not include the assets acquired in the merger. JFor the year ended February 29. KAmount represents less than $.01 per share. |
Financial Highlights - Class T
Years ended February 28, | 2014 | 2013 | 2012 J | 2011 | 2010 |
Selected Per-Share Data |
|
|
|
|
|
Net asset value, beginning of period | $ 73.05 | $ 68.91 | $ 69.68 | $ 52.35 | $ 27.56 |
Income from Investment Operations |
|
|
|
|
|
Net investment income (loss) C | .12 | .50 | .21 | .90 F | .16 G |
Net realized and unrealized gain (loss) | 14.48 | 5.66 | (.35) | 17.34 | 24.81 |
Total from investment operations | 14.60 | 6.16 | (.14) | 18.24 | 24.97 |
Distributions from net investment income | (.06) | (.46) | (.25) | (.92) | (.19) |
Distributions from net realized gain | (1.60) | (1.55) | (.38) | - | - |
Total distributions | (1.66) | (2.02) L | (.63) | (.92) | (.19) |
Redemption fees added to paid in capital C | - K | - K | - K | .01 | .01 |
Net asset value, end of period | $ 85.99 | $ 73.05 | $ 68.91 | $ 69.68 | $ 52.35 |
Total Return A, B | 20.10% | 9.10% | (.09)% | 34.98% | 90.70% |
Ratios to Average Net Assets D, H |
|
|
|
|
|
Expenses before reductions | 1.40% | 1.42% | 1.42% | 1.44% | 1.52% |
Expenses net of fee waivers, if any | 1.40% | 1.42% | 1.42% | 1.44% | 1.52% |
Expenses net of all reductions | 1.39% | 1.41% | 1.41% | 1.43% | 1.51% |
Net investment income (loss) | .15% | .73% | .33% | 1.54% F | .35% G |
Supplemental Data |
|
|
|
|
|
Net assets, end of period (000 omitted) | $ 45,223 | $ 37,860 | $ 28,290 | $ 25,570 | $ 14,712 |
Portfolio turnover rate E | 53% | 61% | 94% | 87% | 104% I |
ATotal returns would have been lower if certain expenses had not been reduced during the applicable periods shown. BTotal returns do not include the effect of the sales charges. CCalculated based on average shares outstanding during the period. DFees and expenses of any underlying Fidelity Central Funds are not included in the Fund's expense ratio. The Fund indirectly bears its proportionate share of the expenses of any underlying Fidelity Central Funds. EAmount does not include the portfolio activity of any underlying Fidelity Central Funds. FInvestment income per share reflects a large, non-recurring dividend which amounted to $.83 per share. Excluding this non-recurring dividend, the ratio of net investment income (loss) to average net assets would have been .14%. GInvestment income per share reflects a large, non-recurring dividend which amounted to $.10 per share. Excluding this non-recurring dividend, the ratio of net investment income (loss) to average net assets would have been .14%. HExpense ratios reflect operating expenses of the class. Expenses before reductions do not reflect amounts reimbursed by the investment adviser or reductions from brokerage service arrangements or reductions from other expense offset arrangements and do not represent the amount paid by the class during periods when reimbursements or reductions occur. Expenses net of fee waivers reflect expenses after reimbursement by the investment adviser but prior to reductions from brokerage service arrangements or other expense offset arrangements. Expenses net of all reductions represent the net expenses paid by the class. IThe portfolio turnover rate does not include the assets acquired in the merger. JFor the year ended February 29. KAmount represents less than $.01 per share. LTotal distributions of $2.02 per share is comprised of distributions from net investment income of $.463 and distributions from net realized gain of $1.552 per share. |
See accompanying notes which are an integral part of the financial statements.
Annual Report
Financial Highlights - Class B
Years ended February 28, | 2014 | 2013 | 2012 J | 2011 | 2010 |
Selected Per-Share Data |
|
|
|
|
|
Net asset value, beginning of period | $ 72.21 | $ 68.13 | $ 68.95 | $ 51.86 | $ 27.35 |
Income from Investment Operations |
|
|
|
|
|
Net investment income (loss) C | (.28) | .16 | (.11) | .60 F | (.07) G |
Net realized and unrealized gain (loss) | 14.28 | 5.57 | (.33) | 17.13 | 24.61 |
Total from investment operations | 14.00 | 5.73 | (.44) | 17.73 | 24.54 |
Distributions from net investment income | - | (.10) | - | (.65) | (.04) |
Distributions from net realized gain | (1.58) | (1.55) | (.38) | - | - |
Total distributions | (1.58) | (1.65) | (.38) | (.65) | (.04) |
Redemption fees added to paid in capital C | - K | - K | - K | .01 | .01 |
Net asset value, end of period | $ 84.63 | $ 72.21 | $ 68.13 | $ 68.95 | $ 51.86 |
Total Return A, B | 19.50% | 8.55% | (.57)% | 34.29% | 89.79% |
Ratios to Average Net Assets D, H |
|
|
|
|
|
Expenses before reductions | 1.90% | 1.92% | 1.91% | 1.93% | 2.02% |
Expenses net of fee waivers, if any | 1.90% | 1.92% | 1.91% | 1.93% | 2.02% |
Expenses net of all reductions | 1.90% | 1.91% | 1.91% | 1.92% | 2.01% |
Net investment income (loss) | (.36)% | .24% | (.17)% | 1.04% F | (.15)% G |
Supplemental Data |
|
|
|
|
|
Net assets, end of period (000 omitted) | $ 8,671 | $ 10,218 | $ 11,040 | $ 13,507 | $ 9,538 |
Portfolio turnover rate E | 53% | 61% | 94% | 87% | 104% I |
ATotal returns would have been lower if certain expenses had not been reduced during the applicable periods shown. BTotal returns do not include the effect of the contingent deferred sales charge. CCalculated based on average shares outstanding during the period. DFees and expenses of any underlying Fidelity Central Funds are not included in the Fund's expense ratio. The Fund indirectly bears its proportionate share of the expenses of any underlying Fidelity Central Funds. EAmount does not include the portfolio activity of any underlying Fidelity Central Funds. FInvestment income per share reflects a large, non-recurring dividend which amounted to $.83 per share. Excluding this non-recurring dividend, the ratio of net investment income (loss) to average net assets would have been (.35)%. GInvestment income per share reflects a large, non-recurring dividend which amounted to $.10 per share. Excluding this non-recurring dividend, the ratio of net investment income (loss) to average net assets would have been (.36)%. HExpense ratios reflect operating expenses of the class. Expenses before reductions do not reflect amounts reimbursed by the investment adviser or reductions from brokerage service arrangements or reductions from other expense offset arrangements and do not represent the amount paid by the class during periods when reimbursements or reductions occur. Expenses net of fee waivers reflect expenses after reimbursement by the investment adviser but prior to reductions from brokerage service arrangements or other expense offset arrangements. Expenses net of all reductions represent the net expenses paid by the class. IThe portfolio turnover rate does not include the assets acquired in the merger. JFor the year ended February 29. KAmount represents less than $.01 per share. |
Financial Highlights - Class C
Years ended February 28, | 2014 | 2013 | 2012 J | 2011 | 2010 |
Selected Per-Share Data |
|
|
|
|
|
Net asset value, beginning of period | $ 71.96 | $ 67.98 | $ 68.78 | $ 51.79 | $ 27.31 |
Income from Investment Operations |
|
|
|
|
|
Net investment income (loss) C | (.23) | .18 | (.10) | .61 F | (.06) G |
Net realized and unrealized gain (loss) | 14.23 | 5.55 | (.32) | 17.09 | 24.57 |
Total from investment operations | 14.00 | 5.73 | (.42) | 17.70 | 24.51 |
Distributions from net investment income | - | (.20) | - | (.72) | (.04) |
Distributions from net realized gain | (1.58) | (1.55) | (.38) | - | - |
Total distributions | (1.58) | (1.75) | (.38) | (.72) | (.04) |
Redemption fees added to paid in capital C | - K | - K | - K | .01 | .01 |
Net asset value, end of period | $ 84.38 | $ 71.96 | $ 67.98 | $ 68.78 | $ 51.79 |
Total Return A, B | 19.56% | 8.58% | (.55)% | 34.29% | 89.82% |
Ratios to Average Net Assets D, H |
|
|
|
|
|
Expenses before reductions | 1.85% | 1.89% | 1.89% | 1.93% | 2.01% |
Expenses net of fee waivers, if any | 1.85% | 1.89% | 1.89% | 1.93% | 2.01% |
Expenses net of all reductions | 1.84% | 1.88% | 1.89% | 1.92% | 2.00% |
Net investment income (loss) | (.30)% | .26% | (.15)% | 1.04% F | (.13)% G |
Supplemental Data |
|
|
|
|
|
Net assets, end of period (000 omitted) | $ 106,879 | $ 75,007 | $ 58,296 | $ 46,525 | $ 20,469 |
Portfolio turnover rate E | 53% | 61% | 94% | 87% | 104% I |
ATotal returns would have been lower if certain expenses had not been reduced during the applicable periods shown. BTotal returns do not include the effect of the contingent deferred sales charge. CCalculated based on average shares outstanding during the period. DFees and expenses of any underlying Fidelity Central Funds are not included in the Fund's expense ratio. The Fund indirectly bears its proportionate share of the expenses of any underlying Fidelity Central Funds. EAmount does not include the portfolio activity of any underlying Fidelity Central Funds. FInvestment income per share reflects a large, non-recurring dividend which amounted to $.83 per share. Excluding this non-recurring dividend, the ratio of net investment income (loss) to average net assets would have been (.35)%. GInvestment income per share reflects a large, non-recurring dividend which amounted to $.10 per share. Excluding this non-recurring dividend, the ratio of net investment income (loss) to average net assets would have been (.35)%. HExpense ratios reflect operating expenses of the class. Expenses before reductions do not reflect amounts reimbursed by the investment adviser or reductions from brokerage service arrangements or reductions from other expense offset arrangements and do not represent the amount paid by the class during periods when reimbursements or reductions occur. Expenses net of fee waivers reflect expenses after reimbursement by the investment adviser but prior to reductions from brokerage service arrangements or other expense offset arrangements. Expenses net of all reductions represent the net expenses paid by the class. IThe portfolio turnover rate does not include the assets acquired in the merger. JFor the year ended February 29. KAmount represents less than $.01 per share. |
See accompanying notes which are an integral part of the financial statements.
Annual Report
Financial Highlights - Materials
Years ended February 28, | 2014 | 2013 | 2012 I | 2011 | 2010 |
Selected Per-Share Data |
|
|
|
|
|
Net asset value, beginning of period | $ 73.68 | $ 69.41 | $ 70.11 | $ 52.61 | $ 27.66 |
Income from Investment Operations |
|
|
|
|
|
Net investment income (loss) B | .58 | .90 | .60 | 1.25 E | .43 F |
Net realized and unrealized gain (loss) | 14.63 | 5.71 | (.37) | 17.43 | 24.91 |
Total from investment operations | 15.21 | 6.61 | .23 | 18.68 | 25.34 |
Distributions from net investment income | (.48) | (.79) | (.55) | (1.16) | (.40) |
Distributions from net realized gain | (1.60) | (1.55) | (.38) | (.03) | - |
Total distributions | (2.08) | (2.34) | (.93) | (1.19) | (.40) |
Redemption fees added to paid in capital B | - J | - J | - J | .01 | .01 |
Net asset value, end of period | $ 86.81 | $ 73.68 | $ 69.41 | $ 70.11 | $ 52.61 |
Total Return A | 20.80% | 9.71% | .49% | 35.70% | 91.77% |
Ratios to Average Net Assets C, G |
|
|
|
|
|
Expenses before reductions | .82% | .85% | .85% | .88% | .96% |
Expenses net of fee waivers, if any | .82% | .85% | .85% | .88% | .96% |
Expenses net of all reductions | .82% | .84% | .84% | .87% | .94% |
Net investment income (loss) | .73% | 1.30% | .90% | 2.10% E | .92% F |
Supplemental Data |
|
|
|
|
|
Net assets, end of period (000 omitted) | $ 1,231,942 | $ 1,146,782 | $ 1,089,619 | $ 1,195,371 | $ 604,475 |
Portfolio turnover rate D | 53% | 61% | 94% | 87% | 104% H |
ATotal returns would have been lower if certain expenses had not been reduced during the applicable periods shown. BCalculated based on average shares outstanding during the period. CFees and expenses of any underlying Fidelity Central Funds are not included in the Fund's expense ratio. The Fund indirectly bears its proportionate share of the expenses of any underlying Fidelity Central Funds. DAmount does not include the portfolio activity of any underlying Fidelity Central Funds. EInvestment income per share reflects a large, non-recurring dividend which amounted to $.83 per share. Excluding this non-recurring dividend, the ratio of net investment income (loss) to average net assets would have been .70%. FInvestment income per share reflects a large, non-recurring dividend which amounted to $.10 per share. Excluding this non-recurring dividend, the ratio of net investment income (loss) to average net assets would have been .70%. GExpense ratios reflect operating expenses of the class. Expenses before reductions do not reflect amounts reimbursed by the investment adviser or reductions from brokerage service arrangements or reductions from other expense offset arrangements and do not represent the amount paid by the class during periods when reimbursements or reductions occur. Expenses net of fee waivers reflect expenses after reimbursement by the investment adviser but prior to reductions from brokerage service arrangements or other expense offset arrangements. Expenses net of all reductions represent the net expenses paid by the class. HThe portfolio turnover rate does not include the assets acquired in the merger. IFor the year ended February 29. JAmount represents less than $.01 per share. |
Financial Highlights - Institutional Class
Years ended February 28, | 2014 | 2013 | 2012 I | 2011 | 2010 |
Selected Per-Share Data |
|
|
|
|
|
Net asset value, beginning of period | $ 73.57 | $ 69.35 | $ 70.05 | $ 52.58 | $ 27.66 |
Income from Investment Operations |
|
|
|
|
|
Net investment income (loss) B | .59 | .90 | .60 | 1.28 E | .46 F |
Net realized and unrealized gain (loss) | 14.60 | 5.70 | (.36) | 17.40 | 24.89 |
Total from investment operations | 15.19 | 6.60 | .24 | 18.68 | 25.35 |
Distributions from net investment income | (.50) | (.83) | (.56) | (1.19) | (.44) |
Distributions from net realized gain | (1.60) | (1.55) | (.38) | (.03) | - |
Total distributions | (2.10) | (2.38) | (.94) | (1.22) | (.44) |
Redemption fees added to paid in capital B | - J | - J | - J | .01 | .01 |
Net asset value, end of period | $ 86.66 | $ 73.57 | $ 69.35 | $ 70.05 | $ 52.58 |
Total Return A | 20.81% | 9.71% | .50% | 35.73% | 91.79% |
Ratios to Average Net Assets C, G |
|
|
|
|
|
Expenses before reductions | .81% | .85% | .84% | .86% | .94% |
Expenses net of fee waivers, if any | .81% | .85% | .84% | .86% | .94% |
Expenses net of all reductions | .81% | .84% | .83% | .85% | .93% |
Net investment income (loss) | .74% | 1.30% | .91% | 2.11% E | .94% F |
Supplemental Data |
|
|
|
|
|
Net assets, end of period (000 omitted) | $ 333,963 | $ 246,696 | $ 89,299 | $ 85,130 | $ 13,670 |
Portfolio turnover rate D | 53% | 61% | 94% | 87% | 104% H |
ATotal returns would have been lower if certain expenses had not been reduced during the applicable periods shown. BCalculated based on average shares outstanding during the period. CFees and expenses of any underlying Fidelity Central Funds are not included in the Fund's expense ratio. The Fund indirectly bears its proportionate share of the expenses of any underlying Fidelity Central Funds. DAmount does not include the portfolio activity of any underlying Fidelity Central Funds. EInvestment income per share reflects a large, non-recurring dividend which amounted to $.83 per share. Excluding this non-recurring dividend, the ratio of net investment income (loss) to average net assets would have been .72%. FInvestment income per share reflects a large, non-recurring dividend which amounted to $.10 per share. Excluding this non-recurring dividend, the ratio of net investment income (loss) to average net assets would have been .72%. GExpense ratios reflect operating expenses of the class. Expenses before reductions do not reflect amounts reimbursed by the investment adviser or reductions from brokerage service arrangements or reductions from other expense offset arrangements and do not represent the amount paid by the class during periods when reimbursements or reductions occur. Expenses net of fee waivers reflect expenses after reimbursement by the investment adviser but prior to reductions from brokerage service arrangements or other expense offset arrangements. Expenses net of all reductions represent the net expenses paid by the class. HThe portfolio turnover rate does not include the assets acquired in the merger. IFor the year ended February 29. JAmount represents less than $.01 per share. |
See accompanying notes which are an integral part of the financial statements.
Annual Report
Notes to Financial Statements
For the period ended February 28, 2014
1. Organization.
Materials Portfolio (the Fund) is a non-diversified fund of Fidelity Select Portfolios (the Trust) and is authorized to issue an unlimited number of shares. The Trust is registered under the Investment Company Act of 1940, as amended (the 1940 Act), as an open-end management investment company organized as a Massachusetts business trust. The Fund invests primarily in securities of companies whose principal business activities fall within specific industries. The Fund offers Class A, Class T, Class C, Materials and Institutional Class shares, each of which, along with Class B shares, has equal rights as to assets and voting privileges. Class B shares are closed to new accounts and additional purchases, except for exchanges and reinvestments. Each class has exclusive voting rights with respect to matters that affect that class. Class B shares will automatically convert to Class A shares after a holding period of seven years from the initial date of purchase.
2. Investments in Fidelity Central Funds.
The Fund invests in Fidelity Central Funds, which are open-end investment companies generally available only to other investment companies and accounts managed by the investment adviser and its affiliates. The Fund's Schedule of Investments lists each of the Fidelity Central Funds held as of period end, if any, as an investment of the Fund, but does not include the underlying holdings of each Fidelity Central Fund. As an Investing Fund, the Fund indirectly bears its proportionate share of the expenses of the underlying Fidelity Central Funds.
The Money Market Central Funds seek preservation of capital and current income and are managed by Fidelity Investments Money Management, Inc. (FIMM), an affiliate of the investment adviser. Annualized expenses of the Money Market Central Funds as of their most recent shareholder report date are less than .01%.
A complete unaudited list of holdings for each Fidelity Central Fund is available upon request or at the Securities and Exchange Commission (the SEC) website at www.sec.gov. In addition, the financial statements of the Fidelity Central Funds, which are not covered by the Fund's Report of Independent Registered Public Accounting Firm, are available on the SEC website or upon request.
3. Significant Accounting Policies.
The financial statements have been prepared in conformity with accounting principles generally accepted in the United States of America (GAAP), which require management to make certain estimates and assumptions at the date of the financial statements. Actual results could differ from those estimates. Subsequent events, if any, through the date that the financial statements were issued have been evaluated in the preparation of the financial statements. The following summarizes the significant accounting policies of the Fund:
Investment Valuation. Investments are valued as of 4:00 p.m. Eastern time on the last calendar day of the period. In accordance with valuation policies and procedures approved by the Board of Trustees (the Board), the Fund attempts to obtain prices from one or more third party pricing vendors or brokers to value its investments. When current market prices, quotations or currency exchange rates are not readily available or reliable, investments will be fair valued in good faith by the Fidelity SelectCo, LLC (SelectCo) Fair Value Committee (the Committee), in accordance with procedures adopted by the Board. Factors used in determining fair value vary by investment type and may include market or investment specific events, changes in interest rates and credit quality. The frequency with which these procedures are used cannot be predicted and they may be utilized to a significant extent. The Committee oversees the Fund's valuation policies and procedures and is responsible for approving and reporting to the Board all fair value determinations.
The Fund categorizes the inputs to valuation techniques used to value its investments into a disclosure hierarchy consisting of three levels as shown below:
Level 1 - quoted prices in active markets for identical investments
Level 2 - other significant observable inputs (including quoted prices for similar investments, interest rates, prepayment speeds, etc.)
Level 3 - unobservable inputs (including the Fund's own assumptions based on the best information available)
Valuation techniques used to value the Fund's investments by major category are as follows:
Equity securities, including restricted securities, for which market quotations are readily available, are valued at the last reported sale price or official closing price as reported by a third party pricing vendor on the primary market or exchange on which they are traded and are categorized as Level 1 in the hierarchy. In the event there were no sales during the day or closing prices are not available, securities are valued at the last quoted bid price or may be valued using the last available price and are generally categorized as Level 2 in the hierarchy. For foreign equity securities, when market or security specific events arise, comparisons to the valuation of American Depositary Receipts (ADRs) and certain indexes as well as quoted prices for similar securities may be used and would be categorized as Level 2 in the hierarchy. Utilizing these techniques may result in transfers between Level 1 and Level 2. For equity securities, including restricted securities, where observable inputs are limited, assumptions about market activity and risk are used and these securities may be categorized as Level 3 in the hierarchy.
Annual Report
3. Significant Accounting Policies - continued
Investment Valuation - continued
Debt securities, including restricted securities, are valued based on evaluated prices received from third party pricing vendors or from brokers who make markets in such securities. Corporate bonds, are valued by pricing vendors who utilize matrix pricing which considers yield or price of bonds of comparable quality, coupon, maturity and type or by broker-supplied prices. When independent prices are unavailable or unreliable, debt securities may be valued utilizing pricing methodologies which consider similar factors that would be used by third party pricing vendors. Debt securities are generally categorized as Level 2 in the hierarchy but may be Level 3 depending on the circumstances.
Investments in open-end mutual funds, including the Fidelity Central Funds, are valued at their closing net asset value (NAV) each business day and are categorized as Level 1 in the hierarchy.
Changes in valuation techniques may result in transfers in or out of an assigned level within the disclosure hierarchy. The aggregate value of investments by input level, as of February 28, 2014, is included at the end of the Fund's Schedule of Investments.
Foreign Currency. The Fund may use foreign currency contracts to facilitate transactions in foreign-denominated securities. Gains and losses from these transactions may arise from changes in the value of the foreign currency or if the counterparties do not perform under the contracts' terms.
Foreign-denominated assets, including investment securities, and liabilities are translated into U.S. dollars at the exchange rates at period end. Purchases and sales of investment securities, income and dividends received and expenses denominated in foreign currencies are translated into U.S. dollars at the exchange rate in effect on the transaction date.
The effects of exchange rate fluctuations on investments are included with the net realized and unrealized gain (loss) on investment securities. Other foreign currency transactions resulting in realized and unrealized gain (loss) are disclosed separately.
Investment Transactions and Income. For financial reporting purposes, the Fund's investment holdings and NAV include trades executed through the end of the last business day of the period. The NAV per share for processing shareholder transactions is calculated as of the close of business of the New York Stock Exchange (NYSE), normally 4:00 p.m. Eastern time and includes trades executed through the end of the prior business day. Gains and losses on securities sold are determined on the basis of identified cost and may include proceeds received from litigation. Dividend income is recorded on the ex-dividend date, except for certain dividends from foreign securities where the ex-dividend date may have passed, which are recorded as soon as the Fund is informed of the ex-dividend date. Non-cash dividends included in dividend income, if any, are recorded at the fair market value of the securities received. Distributions received on securities that represent a return of capital or capital gain are recorded as a reduction of cost of investments and/or as a realized gain. Subsequent to ex-dividend date the Fund determines the components of these distributions, based upon receipt of tax filings or other correspondence relating to the underlying investment. Interest income and distributions from the Fidelity Central Funds are accrued as earned. Interest income includes coupon interest and amortization of premium and accretion of discount on debt securities. Investment income is recorded net of foreign taxes withheld where recovery of such taxes is uncertain.
Class Allocations and Expenses. Investment income, realized and unrealized capital gains and losses, common expenses of the Fund, and certain fund-level expense reductions, if any, are allocated daily on a pro-rata basis to each class based on the relative net assets of each class to the total net assets of the Fund. Each class differs with respect to transfer agent and distribution and service plan fees incurred. Certain expense reductions may also differ by class. For the reporting period, the allocated portion of income and expenses to each class as a percent of its average net assets may vary due to the timing of recording these transactions in relation to fluctuating net assets of the classes. Expenses directly attributable to a fund are charged to that fund. Expenses attributable to more than one fund are allocated among the respective funds on the basis of relative net assets or other appropriate methods. Expense estimates are accrued in the period to which they relate and adjustments are made when actual amounts are known.
Deferred Trustee Compensation. Under a Deferred Compensation Plan (the Plan), independent Trustees may elect to defer receipt of a portion of their annual compensation. Deferred amounts are invested in a cross-section of Fidelity funds, are marked-to-market and remain in the Fund until distributed in accordance with the Plan. The investment of deferred amounts and the offsetting payable to the Trustees are included in the accompanying Statement of Assets and Liabilities.
Income Tax Information and Distributions to Shareholders. Each year, the Fund intends to qualify as a regulated investment company under Subchapter M of the Internal Revenue Code, including distributing substantially all of its taxable income and realized gains. As a result, no provision for U.S. Federal income taxes is required. As of February 28, 2014, the Fund did not have any unrecognized tax benefits in the financial statements; nor is the Fund aware of any tax positions for which it is reasonably possible that the total amounts of unrecognized tax benefits will significantly change in the next twelve months. The Fund files a U.S. federal tax return, in addition to state and local tax returns as required. The Fund's federal income tax returns are subject to examination by the Internal Revenue Service (IRS) for a period of three fiscal years after they are filed. State and local tax returns may be subject to examination for an additional fiscal year depending on the jurisdiction. Foreign taxes are provided for based on the Fund's understanding of the tax rules and rates that exist in the foreign markets in which it invests.
Distributions are declared and recorded on the ex-dividend date. Income dividends and capital gain distributions are declared separately for each class. Income and capital gain distributions are determined in accordance with income tax regulations, which may differ from GAAP. In addition, the Fund claimed a portion of the payment made to redeeming shareholders as a distribution for income tax purposes.
Annual Report
Notes to Financial Statements - continued
3. Significant Accounting Policies - continued
Income Tax Information and Distributions to Shareholders - continued
Capital accounts within the financial statements are adjusted for permanent book-tax differences. These adjustments have no impact on net assets or the results of operations. Capital accounts are not adjusted for temporary book-tax differences which will reverse in a subsequent period.
Book-tax differences are primarily due to futures contracts, foreign currency transactions, passive foreign investment companies (PFIC), original issue discount, deferred trustees compensation, capital loss carryforwards and losses deferred due to wash sales and excise tax regulations.
The federal tax cost of investment securities and unrealized appreciation (depreciation) as of period end were as follows:
Gross unrealized appreciation | $ 569,706,695 |
Gross unrealized depreciation | (24,615,148) |
Net unrealized appreciation (depreciation) on securities and other investments | $ 545,091,547 |
|
|
Tax Cost | $ 1,581,888,229 |
The tax-based components of distributable earnings as of period end were as follows:
Undistributed ordinary income | $ 2,483,951 |
Undistributed long-term capital gain | $ 56,642,887 |
Net unrealized appreciation (depreciation) | $ 545,088,879 |
The tax character of distributions paid was as follows:
| February 28, 2014 | February 28, 2013 |
Ordinary Income | $ 10,087,395 | $ 15,064,080 |
Long-term Capital Gains | 36,443,011 | 31,892,999 |
Total | $ 46,530,406 | $ 46,957,079 |
Capital loss carryforwards are only available to offset future capital gains of the Fund to the extent provided by regulations and may be limited. Under the Regulated Investment Company Modernization Act of 2010 (the Act), the Fund is permitted to carry forward capital losses incurred in taxable years beginning after December 22, 2010 for an unlimited period and such capital losses are required to be used prior to any losses that expire. The capital loss carryforward information presented below, including any applicable limitation, is estimated as of prior fiscal period end and is subject to adjustment.
Fiscal year of expiration: |
|
2017 | $ (1,422,248) |
2018 | (1,022,988) |
2019 | (80,787) |
Total with expiration | $ (2,526,023) |
The Fund acquired $2,526,023 of capital loss carryforwards as part of a merger in a prior period. The losses acquired that will be available to offset future capital gains of the Fund will be limited to approximately $611,309 per year.
Trading (Redemption) Fees. Shares held by investors in the Fund less than 30 days may be subject to a redemption fee equal to .75% of the NAV of shares redeemed. All redemption fees, which reduce the proceeds of the shareholder redemption, are retained by the Fund and accounted for as an addition to paid in capital.
Restricted Securities. The Fund may invest in securities that are subject to legal or contractual restrictions on resale. These securities generally may be resold in transactions exempt from registration or to the public if the securities are registered. Disposal of these securities may involve time-consuming negotiations and expense, and prompt sale at an acceptable price may be difficult. Information regarding restricted securities is included at the end of the Fund's Schedule of Investments.
Annual Report
4. Derivative Instruments.
Risk Exposures and the Use of Derivative Instruments. The Fund's investment objective allows the Fund to enter into various types of derivative contracts, including futures contracts. Derivatives are investments whose value is primarily derived from underlying assets, indices or reference rates and may be transacted on an exchange or over-the-counter (OTC). Derivatives may involve a future commitment to buy or sell a specified asset based on specified terms, to exchange future cash flows at periodic intervals based on a notional principal amount, or for one party to make one or more payments upon the occurrence of specified events in exchange for periodic payments from the other party.
The Fund used derivatives to increase returns, to gain exposure to certain types of assets and to manage exposure to certain risks as defined below. The success of any strategy involving derivatives depends on analysis of numerous economic factors, and if the strategies for investment do not work as intended, the Fund may not achieve its objectives.
The Fund's use of derivatives increased or decreased its exposure to the following risk:
Equity Risk | Equity risk relates to the fluctuations in the value of financial instruments as a result of changes in market prices (other than those arising from interest rate risk or foreign exchange risk), whether caused by factors specific to an individual investment, its issuer, or all factors affecting all instruments traded in a market or market segment. |
The Fund is also exposed to additional risks from investing in derivatives, such as liquidity risk and counterparty credit risk. Liquidity risk is the risk that the Fund will be unable to close out the derivative in the open market in a timely manner. Counterparty credit risk is the risk that the counterparty will not be able to fulfill its obligation to the Fund. Counterparty credit risk related to exchange-traded futures contracts may be mitigated by the protection provided by the exchange on which they trade.
Investing in derivatives may involve greater risks than investing in the underlying assets directly and, to varying degrees, may involve risk of loss in excess of any initial investment and collateral received and amounts recognized in the Statement of Assets and Liabilities. In addition, there may be the risk that the change in value of the derivative contract does not correspond to the change in value of the underlying instrument.
Futures Contracts. A futures contract is an agreement between two parties to buy or sell a specified underlying instrument for a fixed price at a specified future date. The Fund used futures contracts to manage its exposure to the stock market.
Upon entering into a futures contract, a fund is required to deposit either cash or securities (initial margin) with a clearing broker in an amount equal to a certain percentage of the face value of the contract. Futures contracts are marked-to-market daily and subsequent daily payments (variation margin) are made or received by a fund depending on the daily fluctuations in the value of the futures contracts and are recorded as unrealized appreciation or (depreciation). This receivable and/or payable, if any, is included in daily variation margin for derivative instruments in the Statement of Assets and Liabilities. Realized gain or (loss) is recorded upon the expiration or closing of a futures contract. The net realized gain (loss) and change in net unrealized appreciation (depreciation) on futures contracts during the period is included in the Statement of Operations.
Any open futures contracts at period end are presented in the Schedule of Investments under the caption "Futures Contracts." The underlying face amount at value reflects each contract's exposure to the underlying instrument or index at period end.
During the period the Fund recognized net realized gain (loss) of $702,685 and a change in net unrealized appreciation (depreciation) of $(417,650) related to its investment in futures contracts. These amounts are included in the Statement of Operations.
5. Purchases and Sales of Investments.
Purchases and sales of securities, other than short-term securities, aggregated $974,328,461 and $946,309,029, respectively.
6. Fees and Other Transactions with Affiliates.
Management Fee. Effective August 1, 2013, SelectCo replaced Fidelity Management and Research Company (FMR), an affiliate of SelectCo, as investment adviser to the Fund. The investment adviser and its affiliates provide the Fund with investment management related services for which the Fund pays a monthly management fee. The management fee is the sum of an individual fund fee rate that is based on an annual rate of .30% of the Fund's average net assets and an annualized group fee rate that averaged .25% during the period. The group fee rate is based upon the average net assets of all the mutual funds advised by FMR and the investment adviser. The group fee rate decreases as assets under management increase and increases as assets under management decrease. For the reporting period, the total annual management fee rate was .55% of the Fund's average net assets.
Annual Report
Notes to Financial Statements - continued
6. Fees and Other Transactions with Affiliates - continued
Distribution and Service Plan Fees. In accordance with Rule 12b-1 of the 1940 Act, the Fund has adopted separate Distribution and Service Plans for each class of shares. Certain classes pay Fidelity Distributors Corporation (FDC), an affiliate of the investment adviser, separate Distribution and Service Fees, each of which is based on an annual percentage of each class' average net assets. In addition, FDC may pay financial intermediaries for selling shares of the Fund and providing shareholder support services. For the period, the Distribution and Service Fee rates, total fees and amounts retained by FDC were as follows:
| Distribution | Service | Total Fees | Retained |
Class A | -% | .25% | $ 668,160 | $ 11,911 |
Class T | .25% | .25% | 197,474 | 1,042 |
Class B | .75% | .25% | 90,429 | 68,170 |
Class C | .75% | .25% | 900,007 | 325,396 |
|
|
| $ 1,856,070 | $ 406,519 |
Sales Load. FDC may receive a front-end sales charge of up to 5.75% for selling Class A shares and 3.50% for selling Class T shares, some of which is paid to financial intermediaries for selling shares of the Fund. Depending on the holding period, FDC may receive contingent deferred sales charges levied on Class A, Class T, Class B, and Class C redemptions. The deferred sales charges range from 5.00% to 1.00% for Class B shares, 1.00% for Class C shares, 1.00% for certain purchases of Class A shares and .25% for certain purchases of Class T shares.
For the period, sales charge amounts retained by FDC were as follows:
| Retained |
Class A | $ 166,569 |
Class T | 13,304 |
Class B* | 19,379 |
Class C* | 16,753 |
| $ 216,005 |
* When Class B and Class C shares are initially sold, FDC pays commissions from its own resources to financial intermediaries through which the sales are made.
Transfer Agent Fees. Fidelity Investments Institutional Operations Company, Inc., (FIIOC), an affiliate of the investment adviser, is the transfer, dividend disbursing and shareholder servicing agent for each class of the Fund. FIIOC receives account fees and asset-based fees that vary according to the account size and type of account of the shareholders of the respective classes of the Fund. FIIOC pays for typesetting, printing and mailing of shareholder reports, except proxy statements.
For the period, transfer agent fees for each class were as follows:
|
| % of |
Class A | $ 648,808 | .24 |
Class T | 115,141 | .29 |
Class B | 27,231 | .30 |
Class C | 218,786 | .24 |
Materials | 2,491,421 | .22 |
Institutional Class | 501,728 | .21 |
| $ 4,003,115 |
|
Accounting and Security Lending Fees. Fidelity Service Company, Inc. (FSC), an affiliate of the investment adviser, maintains the Fund's accounting records. The accounting fee is based on the level of average net assets for each month. Under a separate contract, FSC administers the security lending program. The security lending fee is based on the number and duration of lending transactions.
Brokerage Commissions. The Fund placed a portion of its portfolio transactions with brokerage firms which are affiliates of the investment adviser. Brokerage commissions are included in net realized gain (loss) and change in net unrealized appreciation (depreciation) in the Statement of Operations. The commissions paid to these affiliated firms were $19,613 for the period.
Annual Report
7. Committed Line of Credit.
The Fund participates with other funds managed by the investment adviser or an affiliate in a $4.25 billion credit facility (the "line of credit") to be utilized for temporary or emergency purposes to fund shareholder redemptions or for other short-term liquidity purposes. The Fund has agreed to pay commitment fees on its pro-rata portion of the line of credit, which amounted to $3,473 and is reflected in Miscellaneous expenses on the Statement of Operations. During the period, there were no borrowings on this line of credit.
8. Security Lending.
The Fund lends portfolio securities through a lending agent from time to time in order to earn additional income. For equity securities, a lending agent is used and may loan securities to certain qualified borrowers, which prior to August 1, 2013 included Fidelity Capital Markets (FCM), a broker-dealer affiliated with the Fund. On the settlement date of the loan, the Fund receives collateral (in the form of U.S. Treasury obligations, letters of credit and/or cash) against the loaned securities and maintains collateral in an amount not less than 100% of the market value of the loaned securities during the period of the loan. The market value of the loaned securities is determined at the close of business of the Fund and any additional required collateral is delivered to the Fund on the next business day. If the borrower defaults on its obligation to return the securities loaned because of insolvency or other reasons, the Fund may apply collateral received from the borrower against the obligation. The Fund may experience delays and costs in recovering the securities loaned. Any cash collateral received is invested in the Fidelity Securities Lending Cash Central Fund. The value of loaned securities and cash collateral at period end are disclosed on the Fund's Statement of Assets and Liabilities. Security lending income represents the income earned on investing cash collateral, less rebates paid to borrowers and any lending agent fees associated with the loan, plus any premium payments received for lending certain types of securities. Security lending income is presented in the Statement of Operations as a component of income from Fidelity Central Funds. Total security lending income during the period amounted to $215,485. During the period, there were no securities loaned to FCM.
9. Expense Reductions.
Commissions paid to certain brokers with whom the investment adviser, or its affiliates, places trades on behalf of the Fund include an amount in addition to trade execution, which may be rebated back to the Fund to offset certain expenses. This amount totaled $76,091 for the period. Through arrangements with the Fund's custodian, credits realized as a result of uninvested cash balances were used to reduce the Fund's expenses. During the period, these credits reduced the Fund's custody expenses by $122.
In addition, FMR reimbursed a portion of the Fund's operating expenses during the period in the amount of $7,424.
10. Distributions to Shareholders.
Distributions to shareholders of each class were as follows:
Years ended February 28, | 2014 | 2013 |
From net investment income |
|
|
Class A | $ 1,076,918 | $ 1,631,593 |
Class T | 29,833 | 221,281 |
Class B | - | 14,451 |
Class C | - | 183,511 |
Materials | 6,872,385 | 11,420,509 |
Institutional Class | 1,673,460 | 1,592,735 |
Total | $ 9,652,596 | $ 15,064,080 |
From net realized gain |
|
|
Class A | $ 5,762,988 | $ 3,967,803 |
Class T | 809,850 | 717,303 |
Class B | 165,553 | 228,009 |
Class C | 1,915,182 | 1,411,838 |
Materials | 22,724,072 | 22,783,457 |
Institutional Class | 5,500,165 | 2,784,589 |
Total | $ 36,877,810 | $ 31,892,999 |
Annual Report
Notes to Financial Statements - continued
11. Share Transactions.
Transactions for each class of shares were as follows:
| Shares | Dollars | ||
Years ended February 28, | 2014 | 2013 | 2014 | 2013 |
Class A |
|
|
|
|
Shares sold | 1,797,224 | 1,611,922 | $ 142,257,752 | $ 112,576,195 |
Reinvestment of distributions | 72,401 | 68,775 | 5,951,034 | 4,804,595 |
Shares redeemed | (965,142) | (969,159) | (75,392,440) | (66,285,158) |
Net increase (decrease) | 904,483 | 711,538 | $ 72,816,346 | $ 51,095,632 |
Class T |
|
|
|
|
Shares sold | 170,035 | 205,283 | $ 13,444,901 | $ 14,234,477 |
Reinvestment of distributions | 9,678 | 12,892 | 792,607 | 896,667 |
Shares redeemed | (172,106) | (110,407) | (13,187,903) | (7,498,384) |
Net increase (decrease) | 7,607 | 107,768 | $ 1,049,605 | $ 7,632,760 |
Class B |
|
|
|
|
Shares sold | 7,873 | 21,997 | $ 603,147 | $ 1,493,049 |
Reinvestment of distributions | 1,836 | 3,022 | 148,096 | 207,121 |
Shares redeemed | (48,755) | (45,545) | (3,688,524) | (3,081,508) |
Net increase (decrease) | (39,046) | (20,526) | $ (2,937,281) | $ (1,381,338) |
Class C |
|
|
|
|
Shares sold | 450,706 | 423,105 | $ 34,616,884 | $ 29,248,360 |
Reinvestment of distributions | 19,891 | 19,249 | 1,600,154 | 1,317,196 |
Shares redeemed | (246,286) | (257,585) | (18,989,979) | (17,263,032) |
Net increase (decrease) | 224,311 | 184,769 | $ 17,227,059 | $ 13,302,524 |
Materials |
|
|
|
|
Shares sold | 3,222,449 | 5,306,846 | $ 254,476,294 | $ 372,534,797 |
Reinvestment of distributions | 341,183 | 464,930 | 28,082,183 | 32,543,457 |
Shares redeemed | (4,936,489) | (5,905,812) | (386,209,902) | (406,043,890) |
Net increase (decrease) | (1,372,857) | (134,036) | $ (103,651,425) | $ (965,636) |
Institutional Class |
|
|
|
|
Shares sold | 2,646,562 | 2,986,457 | $ 209,408,784 | $ 212,651,449 |
Reinvestment of distributions | 73,103 | 54,139 | 6,019,071 | 3,797,777 |
Shares redeemed | (2,219,316) | (975,090) | (170,552,801) | (66,601,118) |
Net increase (decrease) | 500,349 | 2,065,506 | $ 44,875,054 | $ 149,848,108 |
12. Other.
The Fund's organizational documents provide former and current trustees and officers with a limited indemnification against liabilities arising in connection with the performance of their duties to the Fund. In the normal course of business, the Fund may also enter into contracts that provide general indemnifications. The Fund's maximum exposure under these arrangements is unknown as this would be dependent on future claims that may be made against the Fund. The risk of material loss from such claims is considered remote.
Annual Report
Fidelity Advisor Telecommunications Fund - Institutional Class
Performance: The Bottom Line
Average annual total return reflects the change in the value of an investment, assuming reinvestment of the class' distributions from dividend income and capital gains (the profits earned upon the sale of securities that have grown in value, if any) and assuming a constant rate of performance each year. The $10,000 table and the fund's returns do not reflect the deduction of taxes that a shareholder would pay on fund distributions or the redemption of fund shares. During periods of reimbursement by Fidelity, a fund's total return will be greater than it would be had the reimbursement not occurred. How a fund did yesterday is no guarantee of how it will do tomorrow.
Average Annual Total Returns
Periods ended February 28, 2014 | Past 1 | Past 5 | Past 10 |
Institutional Class A | 16.30% | 19.20% | 6.74% |
A The initial offering of Institutional Class shares took place on December 12, 2006. Returns prior to December 12, 2006, are those of Telecommunications Portfolio, the original class of the fund.
$10,000 Over 10 Years
Let's say hypothetically that $10,000 was invested in Fidelity Advisor Telecommunications Fund - Institutional Class on February 29, 2004. The chart shows how the value of your investment would have changed, and also shows how the S&P 500 Index performed over the same period. See footnote A for additional information regarding the performance of Institutional Class.
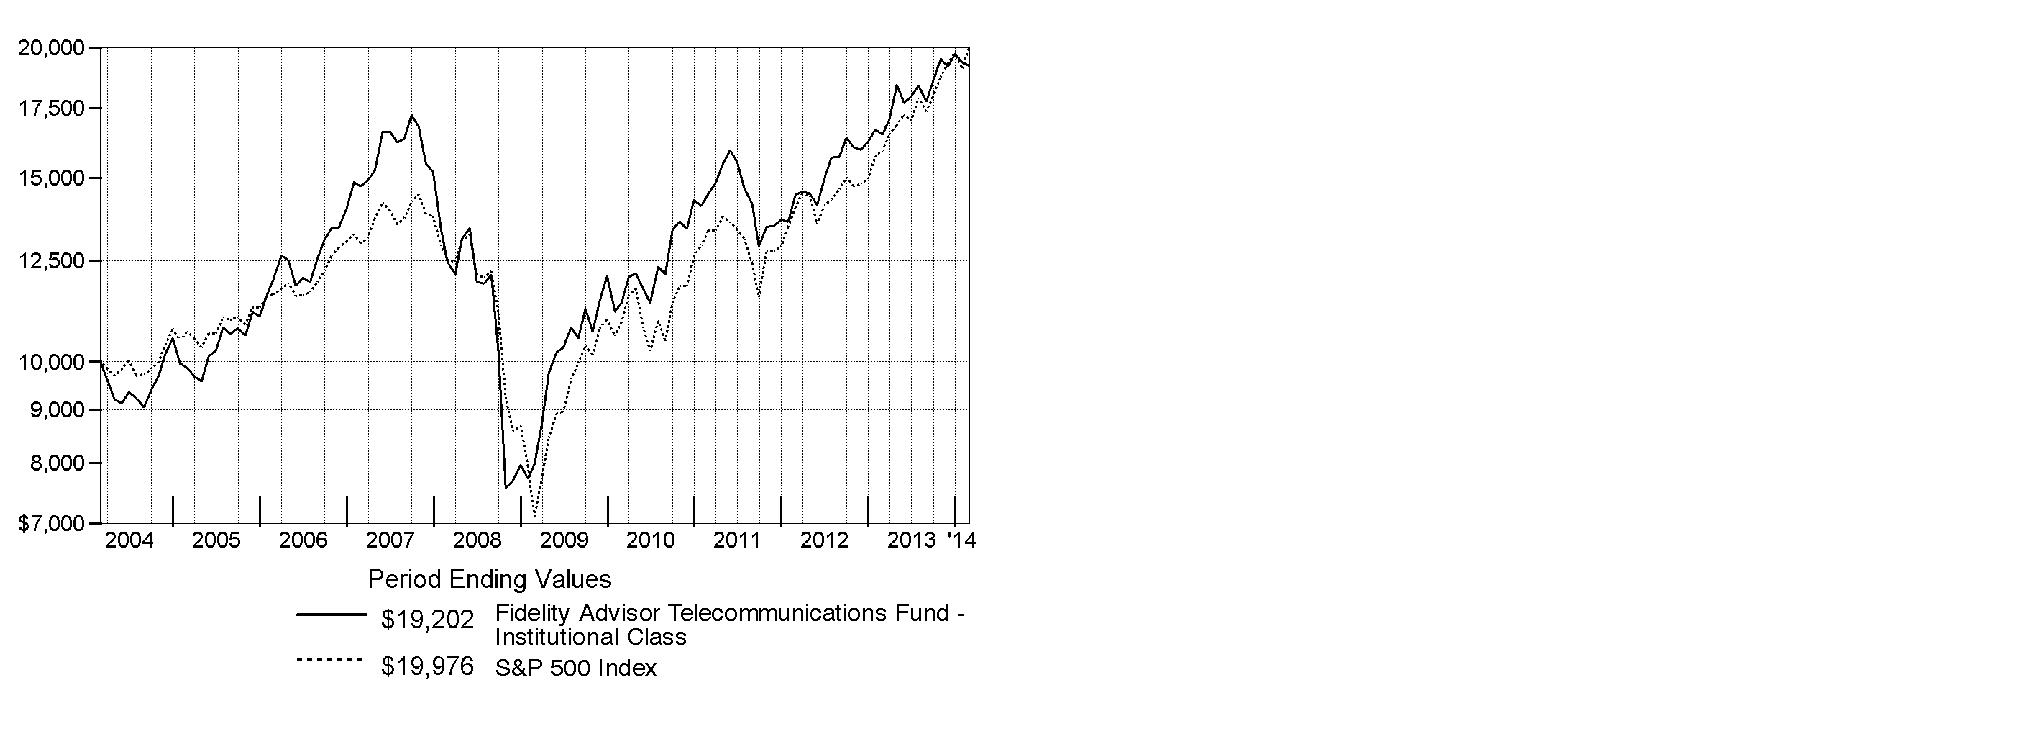
Annual Report
Fidelity Advisor Telecommunications Fund
Management's Discussion of Fund Performance
Market Recap: Stocks overcame fears of higher interest rates - not to mention their worst January in four years - to finish sharply higher for the 12 months ending February 28, 2014. The broad S&P 500® Index and the blue-chip Dow Jones Industrial AverageSM gained 25.37% and 19.01%, respectively, amid generally favorable earnings reports and accommodative monetary policies worldwide. Performance generally increased along the risk spectrum, with smaller-cap and growth strategies leading the way. An ebullient market helped the growth-oriented Nasdaq Composite Index® to a 38.10% period gain, for example. On the other hand, both cyclical and defensive stocks had representation in the top-performing industry sectors: returns were highest in health care and consumer discretionary; lowest in utilities and telecommunication services. From a macroeconomic perspective, data still points to slow but steady improvement in the U.S., and Europe's recession may well be over. Reports from China have disappointed, but continue to suggest a relatively soft landing there. Mixed signals from the U.S. Federal Reserve as to when it might curtail its stimulative bond buying kept markets in flux during the spring and summer. Stocks regained momentum in October despite a federal budget impasse and brief government shutdown, and lower volatility prevailed through year-end. Shedding new-year concerns about China's economy, an emerging-markets sell-off and confirmation (at last) of Fed tapering - alongside confirmation of a presumably dovish Janet Yellen as new Fed chair - February saw stocks back in record territory, bearing down on the five-year anniversary of the market's bottom.
Comments from Matthew Drukker, Portfolio Manager of Fidelity Advisor® Telecommunications Fund: For the year, the fund's Institutional Class shares gained 16.30%, underperforming the 17.26% result of the MSCI® U.S. IMI Telecommunications Services 25-50 Index and the broad-based S&P 500®. Versus the MSCI sector benchmark, underweighting Sprint - which dropped Nextel from its name in July after SoftBank became majority owner of the firm - was the biggest individual detractor. The stock outperformed later in the period amid reports of SoftBank's potential bid for T-Mobile. I held an underweighting, on average, in Sprint Nextel before the SoftBank deal was closed, and that position was one of the biggest contributors, as the stock underperformed. A smaller-than-index position in Leap Wireless International was detrimental. The stock surged in July when AT&T agreed to purchase the prepaid wireless carrier in a cash bid worth $1.2 billion. With smartphone penetration in the U.S. already above 70%, revenue growth slowed from new data-plan customers that historically helped support earnings. I thought AT&T would be most adversely affected, and underweighting the telecom stalwart was by far the fund's biggest relative contributor. Investors' renewed concern that competitive threats, predominantly from T-Mobile, could hinder future profit margins and growth, weighed on the stock for most of the year. Consequently, an overweighting, on average, in T-Mobile, where I saw greater growth prospects, also was the right call. I added the stock to the fund in May and shares took off in December amid reports that Japan-based SoftBank - the parent company of Sprint - was preparing a bid for the firm.
The views expressed above reflect those of the portfolio manager(s) only through the end of the period as stated on the cover of this report and do not necessarily represent the views of Fidelity or any other person in the Fidelity organization. Any such views are subject to change at any time based upon market or other conditions and Fidelity disclaims any responsibility to update such views. These views may not be relied on as investment advice and, because investment decisions for a Fidelity fund are based on numerous factors, may not be relied on as an indication of trading intent on behalf of any Fidelity fund.
Annual Report
Telecommunications Portfolio
Shareholder Expense Example
As a shareholder of the Fund, you incur two types of costs: (1) transaction costs, including sales charges (loads) on purchase payments or redemption proceeds, redemption fees and (2) ongoing costs, including management fees, distribution and/or service (12b-1) fees and other Fund expenses. This Example is intended to help you understand your ongoing costs (in dollars) of investing in the Fund and to compare these costs with the ongoing costs of investing in other mutual funds.
The Example is based on an investment of $1,000 invested at the beginning of the period and held for the entire period (September 1, 2013 to February 28, 2014).
Actual Expenses
The first line of the accompanying table for each class of the Fund provides information about actual account values and actual expenses. You may use the information in this line, together with the amount you invested, to estimate the expenses that you paid over the period. Simply divide your account value by $1,000.00 (for example, an $8,600 account value divided by $1,000.00 = 8.6), then multiply the result by the number in the first line for a class of the Fund under the heading entitled "Expenses Paid During Period" to estimate the expenses you paid on your account during this period. A small balance maintenance fee of $12.00 that is charged once a year may apply for certain accounts with a value of less than $2,000. This fee is not included in the table below. If it was, the estimate of expenses you paid during the period would be higher, and your ending account value lower, by this amount. In addition, the Fund, as a shareholder in the underlying Fidelity Central Funds, will indirectly bear its pro-rata share of the fees and expenses incurred by the underlying Fidelity Central Funds. These fees and expenses are not included in the Fund's annualized expense ratio used to calculate the expense estimate in the table below.
Hypothetical Example for Comparison Purposes
The second line of the accompanying table for each class of the Fund provides information about hypothetical account values and hypothetical expenses based on a Class' actual expense ratio and an assumed rate of return of 5% per year before expenses, which is not the Class' actual return. The hypothetical account values and expenses may not be used to estimate the actual ending account balance or expenses you paid for the period. You may use this information to compare the ongoing costs of investing in the Fund and other funds. To do so, compare this 5% hypothetical example with the 5% hypothetical examples that appear in the shareholder reports of the other funds. A small balance maintenance fee of $12.00 that is charged once a year may apply for certain accounts with a value of less than $2,000. This fee is not included in the table below. If it was, the estimate of expenses you paid during the period would be higher, and your ending account value lower, by this amount. In addition, the Fund, as a shareholder in the underlying Fidelity Central Funds, will indirectly bear its pro-rata share of the fees and expenses incurred by the underlying Fidelity Central Funds. These fees and expenses are not included in the Fund's annualized expense ratio used to calculate the expense estimate in the table below.
Please note that the expenses shown in the table are meant to highlight your ongoing costs only and do not reflect any transaction costs. Therefore, the second line of the table is useful in comparing ongoing costs only, and will not help you determine the relative total costs of owning different funds. In addition, if these transactional costs were included, your costs would have been higher.
| Annualized | Beginning | Ending | Expenses Paid |
Class A | 1.17% |
|
|
|
Actual |
| $ 1,000.00 | $ 1,079.80 | $ 6.03 |
Hypothetical A |
| $ 1,000.00 | $ 1,018.99 | $ 5.86 |
Class T | 1.48% |
|
|
|
Actual |
| $ 1,000.00 | $ 1,078.10 | $ 7.63 |
Hypothetical A |
| $ 1,000.00 | $ 1,017.46 | $ 7.40 |
Class B | 1.93% |
|
|
|
Actual |
| $ 1,000.00 | $ 1,075.60 | $ 9.93 |
Hypothetical A |
| $ 1,000.00 | $ 1,015.22 | $ 9.64 |
Class C | 1.86% |
|
|
|
Actual |
| $ 1,000.00 | $ 1,076.10 | $ 9.57 |
Hypothetical A |
| $ 1,000.00 | $ 1,015.57 | $ 9.30 |
Telecommunications | .84% |
|
|
|
Actual |
| $ 1,000.00 | $ 1,081.60 | $ 4.34 |
Hypothetical A |
| $ 1,000.00 | $ 1,020.63 | $ 4.21 |
Institutional Class | .91% |
|
|
|
Actual |
| $ 1,000.00 | $ 1,081.20 | $ 4.70 |
Hypothetical A |
| $ 1,000.00 | $ 1,020.28 | $ 4.56 |
A 5% return per year before expenses
B Annualized expense ratio reflects expenses net of applicable fee waivers.
* Expenses are equal to each Class' annualized expense ratio, multiplied by the average account value over the period, multiplied by 181/365 (to reflect the one-half year period).
Annual Report
Telecommunications Portfolio
Investment Changes (Unaudited)
Top Ten Stocks as of February 28, 2014 | ||
| % of fund's | % of fund's net assets |
Verizon Communications, Inc. | 23.9 | 22.7 |
AT&T, Inc. | 9.7 | 9.6 |
American Tower Corp. | 6.4 | 7.7 |
T-Mobile U.S., Inc. | 5.9 | 3.1 |
CenturyLink, Inc. | 4.3 | 3.7 |
SBA Communications Corp. Class A | 4.3 | 5.7 |
Telephone & Data Systems, Inc. | 3.5 | 2.5 |
Vodafone Group PLC sponsored ADR | 2.9 | 4.6 |
Level 3 Communications, Inc. | 2.4 | 2.7 |
Sprint Corp. | 2.1 | 0.1 |
| 65.4 | |
Top Industries (% of fund's net assets) | |||
As of February 28, 2014 | |||
| Diversified Telecommunication Services | 61.2% |
|
| Wireless Telecommunication Services | 22.8% |
|
| Real Estate Investment Trusts | 7.1% |
|
| Media | 2.7% |
|
| Internet Software & Services | 1.2% |
|
| All Others* | 5.0% |
|

As of August 31, 2013 | |||
| Diversified Telecommunication Services | 58.2% |
|
| Wireless Telecommunication Services | 26.4% |
|
| Real Estate Investment Trusts | 8.0% |
|
| Media | 2.7% |
|
| Internet Software & Services | 0.8% |
|
| All Others* | 3.9% |
|

* Includes short-term investments and net other assets (liabilities). |
Annual Report
Telecommunications Portfolio
Investments February 28, 2014
Showing Percentage of Net Assets
Common Stocks - 96.3% | |||
Shares | Value | ||
DIVERSIFIED TELECOMMUNICATION SERVICES - 61.0% | |||
Alternative Carriers - 14.9% | |||
8x8, Inc. (a) | 724,386 | $ 7,664,004 | |
Cogent Communications Group, Inc. | 171,768 | 6,585,585 | |
inContact, Inc. (a) | 427,823 | 3,858,963 | |
Iridium Communications, Inc. (a)(d) | 548,976 | 3,579,324 | |
Level 3 Communications, Inc. (a) | 230,216 | 8,476,553 | |
Lumos Networks Corp. | 428,878 | 6,227,309 | |
Premiere Global Services, Inc. (a) | 413,383 | 4,675,362 | |
Towerstream Corp. (a)(d) | 830,224 | 2,191,791 | |
TW Telecom, Inc. (a) | 201,917 | 6,180,679 | |
Vonage Holdings Corp. (a) | 954,671 | 4,401,033 | |
| 53,840,603 | ||
Integrated Telecommunication Services - 46.1% | |||
AT&T, Inc. | 1,105,550 | 35,300,212 | |
Atlantic Tele-Network, Inc. | 98,900 | 6,481,906 | |
Bezeq The Israeli Telecommunication Corp. Ltd. | 1,170,300 | 1,897,802 | |
BT Group PLC | 2,709 | 18,632 | |
CenturyLink, Inc. | 501,078 | 15,663,698 | |
Cincinnati Bell, Inc. (a) | 1,058,914 | 3,547,362 | |
Consolidated Communications Holdings, Inc. (d) | 99,498 | 1,896,432 | |
Frontier Communications Corp. (d) | 1,562,083 | 7,622,965 | |
General Communications, Inc. Class A (a) | 161,996 | 1,686,378 | |
Hawaiian Telcom Holdco, Inc. (a) | 78,265 | 2,254,032 | |
IDT Corp. Class B | 109,565 | 1,966,692 | |
Telenor ASA | 41,800 | 923,472 | |
Verizon Communications, Inc. | 1,826,997 | 86,928,518 | |
Windstream Holdings, Inc. (d) | 169,082 | 1,356,038 | |
| 167,544,139 | ||
TOTAL DIVERSIFIED TELECOMMUNICATION SERVICES | 221,384,742 | ||
INTERNET SOFTWARE & SERVICES - 1.2% | |||
Internet Software & Services - 1.2% | |||
Earthlink Holdings Corp. | 221,000 | 866,320 | |
Equinix, Inc. (a) | 10,101 | 1,918,786 | |
Rackspace Hosting, Inc. (a) | 43,500 | 1,599,495 | |
| 4,384,601 | ||
IT SERVICES - 0.5% | |||
IT Consulting & Other Services - 0.5% | |||
InterXion Holding N.V. (a) | 81,100 | 1,945,589 | |
| |||
Shares | Value | ||
MEDIA - 2.7% | |||
Cable & Satellite - 2.7% | |||
Altice S.A. | 5,500 | $ 239,137 | |
DISH Network Corp. Class A (a) | 86,004 | 5,060,475 | |
Liberty Global PLC Class C | 38,318 | 3,244,002 | |
Shaw Communications, Inc. Class B (d) | 53,700 | 1,241,991 | |
| 9,785,605 | ||
REAL ESTATE INVESTMENT TRUSTS - 7.1% | |||
Office REITs - 0.7% | |||
CyrusOne, Inc. | 121,300 | 2,695,286 | |
Specialized REITs - 6.4% | |||
American Tower Corp. | 284,390 | 23,169,253 | |
TOTAL REAL ESTATE INVESTMENT TRUSTS | 25,864,539 | ||
SEMICONDUCTORS & SEMICONDUCTOR EQUIPMENT - 0.7% | |||
Semiconductors - 0.7% | |||
Broadcom Corp. Class A | 79,831 | 2,372,577 | |
SOFTWARE - 0.3% | |||
Application Software - 0.3% | |||
Interactive Intelligence Group, Inc. (a) | 12,600 | 1,003,338 | |
Synchronoss Technologies, Inc. (a) | 203 | 6,979 | |
| 1,010,317 | ||
WIRELESS TELECOMMUNICATION SERVICES - 22.8% | |||
Wireless Telecommunication Services - 22.8% | |||
Boingo Wireless, Inc. (a)(d) | 464,745 | 2,700,168 | |
Crown Castle International Corp. | 189 | 14,345 | |
KDDI Corp. | 32,400 | 1,981,443 | |
Leap Wireless International, Inc. (a) | 400 | 7,008 | |
NII Holdings, Inc. (a)(d) | 1,381,963 | 1,589,257 | |
NTELOS Holdings Corp. (d) | 103,288 | 1,443,966 | |
RingCentral, Inc. (d) | 27,700 | 599,705 | |
SBA Communications Corp. Class A (a) | 163,256 | 15,537,074 | |
Shenandoah Telecommunications Co. | 100,526 | 2,656,902 | |
Sprint Corp. (a) | 884,185 | 7,727,777 | |
T-Mobile U.S., Inc. (a) | 703,797 | 21,465,809 | |
Tele2 AB (B Shares) | 139,750 | 1,733,893 | |
Telephone & Data Systems, Inc. | 557,964 | 12,716,000 | |
U.S. Cellular Corp. | 64,300 | 2,320,587 | |
Vodafone Group PLC sponsored ADR | 251,641 | 10,460,716 | |
| 82,954,650 | ||
TOTAL COMMON STOCKS (Cost $314,097,848) |
| ||
Nonconvertible Preferred Stocks - 0.2% | |||
|
|
|
|
DIVERSIFIED TELECOMMUNICATION SERVICES - 0.2% | |||
Integrated Telecommunication Services - 0.2% | |||
Oi SA sponsored ADR (d) | 543,500 |
| |
Money Market Funds - 4.6% | |||
Shares | Value | ||
Fidelity Securities Lending Cash Central Fund, 0.09% (b)(c) | 16,873,475 | $ 16,873,475 | |
TOTAL INVESTMENT PORTFOLIO - 101.1% (Cost $331,893,915) | 367,402,215 | ||
NET OTHER ASSETS (LIABILITIES) - (1.1)% | (4,124,630) | ||
NET ASSETS - 100% | $ 363,277,585 | ||
Legend |
(a) Non-income producing |
(b) Affiliated fund that is generally available only to investment companies and other accounts managed by Fidelity Investments. The rate quoted is the annualized seven-day yield of the fund at period end. A complete unaudited listing of the fund's holdings as of its most recent quarter end is available upon request. In addition, each Fidelity Central Fund's financial statements, which are not covered by the Fund's Report of Independent Registered Public Accounting Firm, are available on the SEC's website or upon request. |
(c) Investment made with cash collateral received from securities on loan. |
(d) Security or a portion of the security is on loan at period end. |
Affiliated Central Funds |
Information regarding fiscal year to date income earned by the Fund from investments in Fidelity Central Funds is as follows: |
Fund | Income earned |
Fidelity Cash Central Fund | $ 10,528 |
Fidelity Securities Lending Cash Central Fund | 228,474 |
Total | $ 239,002 |
Other Information |
The following is a summary of the inputs used, as of February 28, 2014, involving the Fund's assets and liabilities carried at fair value. The inputs or methodology used for valuing securities may not be an indication of the risk associated with investing in those securities. For more information on valuation inputs, and their aggregation into the levels used in the table below, please refer to the Investment Valuation section in the accompanying Notes to Financial Statements. |
Valuation Inputs at Reporting Date: | ||||
Description | Total | Level 1 | Level 2 | Level 3 |
Investments in Securities: | ||||
Common Stocks | $ 349,702,620 | $ 347,702,545 | $ 2,000,075 | $ - |
Nonconvertible Preferred Stocks | 826,120 | 826,120 | - | - |
Money Market Funds | 16,873,475 | 16,873,475 | - | - |
Total Investments in Securities: | $ 367,402,215 | $ 365,402,140 | $ 2,000,075 | $ - |
See accompanying notes which are an integral part of the financial statements.
Annual Report
Telecommunications Portfolio
Financial Statements
Statement of Assets and Liabilities
| February 28, 2014 | |
|
|
|
Assets | ||
Investment in securities, at value (including securities loaned of $15,320,193) - See accompanying schedule: Unaffiliated issuers (cost $315,020,440) | $ 350,528,740 |
|
Fidelity Central Funds (cost $16,873,475) | 16,873,475 |
|
Total Investments (cost $331,893,915) |
| $ 367,402,215 |
Receivable for investments sold | 26,858,175 | |
Receivable for fund shares sold | 443,447 | |
Dividends receivable | 2,103,947 | |
Distributions receivable from Fidelity Central Funds | 15,077 | |
Prepaid expenses | 2,594 | |
Other receivables | 39,916 | |
Total assets | 396,865,371 | |
|
|
|
Liabilities | ||
Payable to custodian bank | $ 870,746 | |
Payable for investments purchased | 14,311,597 | |
Payable for fund shares redeemed | 1,235,864 | |
Accrued management fee | 169,374 | |
Distribution and service plan fees payable | 8,467 | |
Other affiliated payables | 77,245 | |
Other payables and accrued expenses | 41,018 | |
Collateral on securities loaned, at value | 16,873,475 | |
Total liabilities | 33,587,786 | |
|
|
|
Net Assets | $ 363,277,585 | |
Net Assets consist of: |
| |
Paid in capital | $ 331,298,766 | |
Undistributed net investment income | 7,778,471 | |
Accumulated undistributed net realized gain (loss) on investments and foreign currency transactions | (11,303,806) | |
Net unrealized appreciation (depreciation) on investments and assets and liabilities in foreign currencies | 35,504,154 | |
Net Assets | $ 363,277,585 | |
Statement of Assets and Liabilities - continued
| February 28, 2014 | |
|
|
|
Calculation of Maximum Offering Price Class A: | $ 58.71 | |
|
|
|
Maximum offering price per share (100/94.25 of $58.71) | $ 62.29 | |
Class T: | $ 58.50 | |
|
|
|
Maximum offering price per share (100/96.50 of $58.50) | $ 60.62 | |
Class B: | $ 58.77 | |
|
|
|
Class C: | $ 58.54 | |
|
|
|
Telecommunications: | $ 58.94 | |
|
|
|
Institutional Class: | $ 58.80 | |
A Redemption price per share is equal to net asset value less any applicable contingent deferred sales charge.
See accompanying notes which are an integral part of the financial statements.
Annual Report
Telecommunications Portfolio
Financial Statements - continued
Statement of Operations
| Year ended February 28, 2014 | |
|
|
|
Investment Income |
|
|
Dividends |
| $ 11,161,992 |
Special dividends |
| 7,304,521 |
Interest |
| 23 |
Income from Fidelity Central Funds |
| 239,002 |
Total income |
| 18,705,538 |
|
|
|
Expenses | ||
Management fee | $ 2,436,046 | |
Transfer agent fees | 952,642 | |
Distribution and service plan fees | 98,511 | |
Accounting and security lending fees | 174,567 | |
Custodian fees and expenses | 27,761 | |
Independent trustees' compensation | 8,414 | |
Registration fees | 81,316 | |
Audit | 56,946 | |
Legal | 8,437 | |
Interest | 1,149 | |
Miscellaneous | 5,478 | |
Total expenses before reductions | 3,851,267 | |
Expense reductions | (114,701) | 3,736,566 |
Net investment income (loss) | 14,968,972 | |
Realized and Unrealized Gain (Loss) Net realized gain (loss) on: | ||
Investment securities: |
|
|
Unaffiliated issuers | 2,147,371 | |
Foreign currency transactions | 12,166 | |
Total net realized gain (loss) |
| 2,159,537 |
Change in net unrealized appreciation (depreciation) on: Investment securities | 48,831,064 | |
Assets and liabilities in foreign currencies | (2,016) | |
Total change in net unrealized appreciation (depreciation) |
| 48,829,048 |
Net gain (loss) | 50,988,585 | |
Net increase (decrease) in net assets resulting from operations | $ 65,957,557 | |
Statement of Changes in Net Assets
| Year ended | Year ended |
Increase (Decrease) in Net Assets |
|
|
Operations |
|
|
Net investment income (loss) | $ 14,968,972 | $ 9,261,556 |
Net realized gain (loss) | 2,159,537 | 44,357,084 |
Change in net unrealized appreciation (depreciation) | 48,829,048 | 3,165,741 |
Net increase (decrease) in net assets resulting from operations | 65,957,557 | 56,784,381 |
Distributions to shareholders from net investment income | (8,506,759) | (8,401,078) |
Distributions to shareholders from net realized gain | (32,511) | - |
Total distributions | (8,539,270) | (8,401,078) |
Share transactions - net increase (decrease) | (90,264,976) | (7,060,825) |
Redemption fees | 26,413 | 3,280 |
Total increase (decrease) in net assets | (32,820,276) | 41,325,758 |
|
|
|
Net Assets | ||
Beginning of period | 396,097,861 | 354,772,103 |
End of period (including undistributed net investment income of $7,778,471 and undistributed net investment income of $1,584,319, respectively) | $ 363,277,585 | $ 396,097,861 |
See accompanying notes which are an integral part of the financial statements.
Annual Report
Financial Highlights - Class A
Years ended February 28, | 2014 | 2013 | 2012 G | 2011 | 2010 |
Selected Per-Share Data |
|
|
|
|
|
Net asset value, beginning of period | $ 51.58 | $ 46.12 | $ 46.93 | $ 37.64 | $ 26.66 |
Income from Investment Operations |
|
|
|
|
|
Net investment income (loss) C | 1.76 K | .99 | .56 | .57 | .67 |
Net realized and unrealized gain (loss) | 6.48 | 5.43 | (.86) | 9.49 | 10.55 |
Total from investment operations | 8.24 | 6.42 | (.30) | 10.06 | 11.22 |
Distributions from net investment income | (1.11) | (.96) | (.51) | (.77) | (.19) |
Distributions from net realized gain | (.01) | - | - | - | (.05) |
Total distributions | (1.11) J | (.96) | (.51) | (.77) | (.24) I |
Redemption fees added to paid in capital C,H | - | - | - | - | - |
Net asset value, end of period | $ 58.71 | $ 51.58 | $ 46.12 | $ 46.93 | $ 37.64 |
Total Return A, B | 16.00% | 13.97% | (.54)% | 26.87% | 42.07% |
Ratios to Average Net Assets D, F |
|
|
|
|
|
Expenses before reductions | 1.18% | 1.18% | 1.20% | 1.20% | 1.26% |
Expenses net of fee waivers, if any | 1.18% | 1.18% | 1.20% | 1.20% | 1.26% |
Expenses net of all reductions | 1.15% | 1.17% | 1.18% | 1.18% | 1.24% |
Net investment income (loss) | 3.08% K | 2.01% | 1.21% | 1.35% | 1.89% |
Supplemental Data |
|
|
|
|
|
Net assets, end of period (000 omitted) | $ 7,712 | $ 6,449 | $ 4,677 | $ 4,305 | $ 3,343 |
Portfolio turnover rate E | 111% | 76% | 72% | 72% | 90% |
A Total returns would have been lower if certain expenses had not been reduced during the applicable periods shown. B Total returns do not include the effect of the sales charges. C Calculated based on average shares outstanding during the period. D Fees and expenses of any underlying Fidelity Central Funds are not included in the Fund's expense ratio. The Fund indirectly bears its proportionate share of the expenses of any underlying Fidelity Central Funds. E Amount does not include the portfolio activity of any underlying Fidelity Central Funds. F Expense ratios reflect operating expenses of the class. Expenses before reductions do not reflect amounts reimbursed by the investment adviser or reductions from brokerage service arrangements or reductions from other expense offset arrangements and do not represent the amount paid by the class during periods when reimbursements or reductions occur. Expenses net of fee waivers reflect expenses after reimbursement by the investment adviser but prior to reductions from brokerage service arrangements or other expense offset arrangements. Expenses net of all reductions represent the net expenses paid by the class. G For the year ended February 29. H Amount represents less than $.01 per share. I Total distributions of $.24 per share is comprised of distributions from net investment income of $.187 and distributions from net realized gain of $.048 per share. J Total distributions of $1.11 per share is comprised of distributions from net investment income of $1.106 and distributions from net realized gain of $.005 per share. K Investment income per share reflects large, non-recurring dividends which amounted to $.95 per share. Excluding these non-recurring dividends, the ratio of net investment income (loss) to average net assets would have been 1.43%. |
Financial Highlights - Class T
Years ended February 28, | 2014 | 2013 | 2012 G | 2011 | 2010 |
Selected Per-Share Data |
|
|
|
|
|
Net asset value, beginning of period | $ 51.41 | $ 46.01 | $ 46.81 | $ 37.55 | $ 26.68 |
Income from Investment Operations |
|
|
|
|
|
Net investment income (loss) C | 1.59 K | .85 | .42 | .45 | .57 |
Net realized and unrealized gain (loss) | 6.44 | 5.39 | (.84) | 9.47 | 10.54 |
Total from investment operations | 8.03 | 6.24 | (.42) | 9.92 | 11.11 |
Distributions from net investment income | (.94) | (.84) | (.38) | (.66) | (.22) |
Distributions from net realized gain | (.01) | - | - | - | (.03) |
Total distributions | (.94) J | (.84) | (.38) | (.66) | (.24) I |
Redemption fees added to paid in capital C,H | - | - | - | - | - |
Net asset value, end of period | $ 58.50 | $ 51.41 | $ 46.01 | $ 46.81 | $ 37.55 |
Total Return A, B | 15.64% | 13.61% | (.82)% | 26.54% | 41.64% |
Ratios to Average Net Assets D, F |
|
|
|
|
|
Expenses before reductions | 1.48% | 1.48% | 1.49% | 1.48% | 1.55% |
Expenses net of fee waivers, if any | 1.48% | 1.48% | 1.49% | 1.48% | 1.55% |
Expenses net of all reductions | 1.45% | 1.46% | 1.47% | 1.46% | 1.53% |
Net investment income (loss) | 2.78% K | 1.72% | .92% | 1.06% | 1.60% |
Supplemental Data |
|
|
|
|
|
Net assets, end of period (000 omitted) | $ 4,344 | $ 4,237 | $ 2,702 | $ 2,882 | $ 2,051 |
Portfolio turnover rate E | 111% | 76% | 72% | 72% | 90% |
A Total returns would have been lower if certain expenses had not been reduced during the applicable periods shown. B Total returns do not include the effect of the sales charges. C Calculated based on average shares outstanding during the period. D Fees and expenses of any underlying Fidelity Central Funds are not included in the Fund's expense ratio. The Fund indirectly bears its proportionate share of the expenses of any underlying Fidelity Central Funds. E Amount does not include the portfolio activity of any underlying Fidelity Central Funds. F Expense ratios reflect operating expenses of the class. Expenses before reductions do not reflect amounts reimbursed by the investment adviser or reductions from brokerage service arrangements or reductions from other expense offset arrangements and do not represent the amount paid by the class during periods when reimbursements or reductions occur. Expenses net of fee waivers reflect expenses after reimbursement by the investment adviser but prior to reductions from brokerage service arrangements or other expense offset arrangements. Expenses net of all reductions represent the net expenses paid by the class. G For the year ended February 29. H Amount represents less than $.01 per share. I Total distributions of $.24 per share is comprised of distributions from net investment income of $.216 and distributions from net realized gain of $.028 per share. J Total distributions of $.94 per share is comprised of distributions from net investment income of $.939 and distributions from net realized gain of $.005 per share. K Investment income per share reflects large, non-recurring dividends which amounted to $.94 per share. Excluding these non-recurring dividends, the ratio of net investment income (loss) to average net assets would have been 1.13%. |
See accompanying notes which are an integral part of the financial statements.
Annual Report
Financial Highlights - Class B
Years ended February 28, | 2014 | 2013 | 2012 G | 2011 | 2010 |
Selected Per-Share Data |
|
|
|
|
|
Net asset value, beginning of period | $ 51.63 | $ 46.14 | $ 46.93 | $ 37.60 | $ 26.71 |
Income from Investment Operations |
|
|
|
|
|
Net investment income (loss) C | 1.33 J | .62 | .21 | .25 | .40 |
Net realized and unrealized gain (loss) | 6.48 | 5.42 | (.83) | 9.48 | 10.54 |
Total from investment operations | 7.81 | 6.04 | (.62) | 9.73 | 10.94 |
Distributions from net investment income | (.66) | (.55) | (.17) | (.40) | (.04) |
Distributions from net realized gain | (.01) | - | - | - | (.01) |
Total distributions | (.67) | (.55) | (.17) | (.40) | (.05) I |
Redemption fees added to paid in capital C,H | - | - | - | - | - |
Net asset value, end of period | $ 58.77 | $ 51.63 | $ 46.14 | $ 46.93 | $ 37.60 |
Total Return A, B | 15.13% | 13.11% | (1.29)% | 25.96% | 40.97% |
Ratios to Average Net Assets D, F |
|
|
|
|
|
Expenses before reductions | 1.93% | 1.93% | 1.95% | 1.95% | 2.01% |
Expenses net of fee waivers, if any | 1.93% | 1.93% | 1.95% | 1.95% | 2.01% |
Expenses net of all reductions | 1.91% | 1.92% | 1.93% | 1.93% | 2.00% |
Net investment income (loss) | 2.32% J | 1.26% | .47% | .60% | 1.13% |
Supplemental Data |
|
|
|
|
|
Net assets, end of period (000 omitted) | $ 546 | $ 576 | $ 596 | $ 706 | $ 641 |
Portfolio turnover rate E | 111% | 76% | 72% | 72% | 90% |
A Total returns would have been lower if certain expenses had not been reduced during the applicable periods shown. B Total returns do not include the effect of the contingent deferred sales charge. C Calculated based on average shares outstanding during the period. D Fees and expenses of any underlying Fidelity Central Funds are not included in the Fund's expense ratio. The Fund indirectly bears its proportionate share of the expenses of any underlying Fidelity Central Funds. E Amount does not include the portfolio activity of any underlying Fidelity Central Funds. F Expense ratios reflect operating expenses of the class. Expenses before reductions do not reflect amounts reimbursed by the investment adviser or reductions from brokerage service arrangements or reductions from other expense offset arrangements and do not represent the amount paid by the class during periods when reimbursements or reductions occur. Expenses net of fee waivers reflect expenses after reimbursement by the investment adviser but prior to reductions from brokerage service arrangements or other expense offset arrangements. Expenses net of all reductions represent the net expenses paid by the class. G For the year ended February 29. H Amount represents less than $.01 per share. I Total distributions of $.05 per share is comprised of distributions from net investment income of $.044 and distributions from net realized gain of $.009 per share. J Investment income per share reflects large, non-recurring dividends which amounted to $.95 per share. Excluding these non-recurring dividends, the ratio of net investment income (loss) to average net assets would have been .67%. |
Financial Highlights - Class C
Years ended February 28, | 2014 | 2013 | 2012 G | 2011 | 2010 |
Selected Per-Share Data |
|
|
|
|
|
Net asset value, beginning of period | $ 51.47 | $ 46.02 | $ 46.89 | $ 37.61 | $ 26.76 |
Income from Investment Operations |
|
|
|
|
|
Net investment income (loss) C | 1.36 J | .63 | .22 | .26 | .41 |
Net realized and unrealized gain (loss) | 6.46 | 5.41 | (.84) | 9.46 | 10.56 |
Total from investment operations | 7.82 | 6.04 | (.62) | 9.72 | 10.97 |
Distributions from net investment income | (.74) | (.59) | (.25) | (.44) | (.10) |
Distributions from net realized gain | (.01) | - | - | - | (.02) |
Total distributions | (.75) | (.59) | (.25) | (.44) | (.12) I |
Redemption fees added to paid in capital C,H | - | - | - | - | - |
Net asset value, end of period | $ 58.54 | $ 51.47 | $ 46.02 | $ 46.89 | $ 37.61 |
Total Return A, B | 15.20% | 13.14% | (1.27)% | 25.95% | 41.00% |
Ratios to Average Net Assets D, F |
|
|
|
|
|
Expenses before reductions | 1.88% | 1.90% | 1.93% | 1.94% | 2.01% |
Expenses net of fee waivers, if any | 1.88% | 1.90% | 1.93% | 1.94% | 2.01% |
Expenses net of all reductions | 1.85% | 1.89% | 1.91% | 1.92% | 2.00% |
Net investment income (loss) | 2.38% J | 1.29% | .48% | .61% | 1.13% |
Supplemental Data |
|
|
|
|
|
Net assets, end of period (000 omitted) | $ 5,523 | $ 4,353 | $ 3,514 | $ 3,035 | $ 2,151 |
Portfolio turnover rate E | 111% | 76% | 72% | 72% | 90% |
A Total returns would have been lower if certain expenses had not been reduced during the applicable periods shown. B Total returns do not include the effect of the contingent deferred sales charge. C Calculated based on average shares outstanding during the period. D Fees and expenses of any underlying Fidelity Central Funds are not included in the Fund's expense ratio. The Fund indirectly bears its proportionate share of the expenses of any underlying Fidelity Central Funds. E Amount does not include the portfolio activity of any underlying Fidelity Central Funds. F Expense ratios reflect operating expenses of the class. Expenses before reductions do not reflect amounts reimbursed by the investment adviser or reductions from brokerage service arrangements or reductions from other expense offset arrangements and do not represent the amount paid by the class during periods when reimbursements or reductions occur. Expenses net of fee waivers reflect expenses after reimbursement by the investment adviser but prior to reductions from brokerage service arrangements or other expense offset arrangements. Expenses net of all reductions represent the net expenses paid by the class. G For the year ended February 29. H Amount represents less than $.01 per share. I Total distributions of $.12 per share is comprised of distributions from net investment income of $.098 and distributions from net realized gain of $.023 per share. J Investment income per share reflects large, non-recurring dividends which amounted to $.94 per share. Excluding these non-recurring dividends, the ratio of net investment income (loss) to average net assets would have been .73%. |
See accompanying notes which are an integral part of the financial statements.
Annual Report
Financial Highlights - Telecommunications
Years ended February 28, | 2014 | 2013 | 2012 F | 2011 | 2010 |
Selected Per-Share Data |
|
|
|
|
|
Net asset value, beginning of period | $ 51.75 | $ 46.26 | $ 47.07 | $ 37.73 | $ 26.74 |
Income from Investment Operations |
|
|
|
|
|
Net investment income (loss) B | 1.96 J | 1.15 | .70 | .69 | .76 |
Net realized and unrealized gain (loss) | 6.51 | 5.43 | (.86) | 9.52 | 10.59 |
Total from investment operations | 8.47 | 6.58 | (.16) | 10.21 | 11.35 |
Distributions from net investment income | (1.28) | (1.09) | (.65) | (.87) | (.31) |
Distributions from net realized gain | (.01) | - | - | - | (.05) |
Total distributions | (1.28) I | (1.09) | (.65) | (.87) | (.36) H |
Redemption fees added to paid in capital B,G | - | - | - | - | - |
Net asset value, end of period | $ 58.94 | $ 51.75 | $ 46.26 | $ 47.07 | $ 37.73 |
Total Return A | 16.40% | 14.30% | (.23)% | 27.24% | 42.43% |
Ratios to Average Net Assets C, E |
|
|
|
|
|
Expenses before reductions | .85% | .87% | .90% | .92% | .99% |
Expenses net of fee waivers, if any | .85% | .87% | .90% | .92% | .99% |
Expenses net of all reductions | .82% | .85% | .88% | .91% | .98% |
Net investment income (loss) | 3.41% J | 2.33% | 1.52% | 1.62% | 2.15% |
Supplemental Data |
|
|
|
|
|
Net assets, end of period (000 omitted) | $ 343,548 | $ 377,841 | $ 342,262 | $ 354,938 | $ 279,704 |
Portfolio turnover rate D | 111% | 76% | 72% | 72% | 90% |
A Total returns would have been lower if certain expenses had not been reduced during the applicable periods shown. B Calculated based on average shares outstanding during the period. C Fees and expenses of any underlying Fidelity Central Funds are not included in the Fund's expense ratio. The Fund indirectly bears its proportionate share of the expenses of any underlying Fidelity Central Funds. D Amount does not include the portfolio activity of any underlying Fidelity Central Funds. E Expense ratios reflect operating expenses of the class. Expenses before reductions do not reflect amounts reimbursed by the investment adviser or reductions from brokerage service arrangements or reductions from other expense offset arrangements and do not represent the amount paid by the class during periods when reimbursements or reductions occur. Expenses net of fee waivers reflect expenses after reimbursement by the investment adviser but prior to reductions from brokerage service arrangements or other expense offset arrangements. Expenses net of all reductions represent the net expenses paid by the class. F For the year ended February 29. G Amount represents less than $.01 per share. H Total distributions of $.36 per share is comprised of distributions from net investment income of $.310 and distributions from net realized gain of $.048 per share. I Total distributions of $1.28 per share is comprised of distributions from net investment income of $1.275 and distributions from net realized gain of $.005 per share. J Investment income per share reflects large, non-recurring dividends which amounted to $.95 per share. Excluding these non-recurring dividends, the ratio of net investment income (loss) to average net assets would have been 1.76%. |
Financial Highlights - Institutional Class
Years ended February 28, | 2014 | 2013 | 2012 F | 2011 | 2010 |
Selected Per-Share Data |
|
|
|
|
|
Net asset value, beginning of period | $ 51.65 | $ 46.20 | $ 47.02 | $ 37.69 | $ 26.73 |
Income from Investment Operations |
|
|
|
|
|
Net investment income (loss) B | 1.93 I | 1.17 | .70 | .71 | .84 |
Net realized and unrealized gain (loss) | 6.48 | 5.42 | (.88) | 9.50 | 10.55 |
Total from investment operations | 8.41 | 6.59 | (.18) | 10.21 | 11.39 |
Distributions from net investment income | (1.25) | (1.14) | (.64) | (.88) | (.38) |
Distributions from net realized gain | (.01) | - | - | - | (.05) |
Total distributions | (1.26) | (1.14) | (.64) | (.88) | (.43) H |
Redemption fees added to paid in capital B,G | - | - | - | - | - |
Net asset value, end of period | $ 58.80 | $ 51.65 | $ 46.20 | $ 47.02 | $ 37.69 |
Total Return A | 16.30% | 14.33% | (.26)% | 27.27% | 42.59% |
Ratios to Average Net Assets C, E |
|
|
|
|
|
Expenses before reductions | .91% | .85% | .89% | .91% | .86% |
Expenses net of fee waivers, if any | .91% | .85% | .89% | .91% | .86% |
Expenses net of all reductions | .88% | .83% | .87% | .89% | .84% |
Net investment income (loss) | 3.35% I | 2.35% | 1.52% | 1.64% | 2.29% |
Supplemental Data |
|
|
|
|
|
Net assets, end of period (000 omitted) | $ 1,604 | $ 2,641 | $ 1,022 | $ 1,743 | $ 1,101 |
Portfolio turnover rate D | 111% | 76% | 72% | 72% | 90% |
A Total returns would have been lower if certain expenses had not been reduced during the applicable periods shown. B Calculated based on average shares outstanding during the period. C Fees and expenses of any underlying Fidelity Central Funds are not included in the Fund's expense ratio. The Fund indirectly bears its proportionate share of the expenses of any underlying Fidelity Central Funds. D Amount does not include the portfolio activity of any underlying Fidelity Central Funds. E Expense ratios reflect operating expenses of the class. Expenses before reductions do not reflect amounts reimbursed by the investment adviser or reductions from brokerage service arrangements or reductions from other expense offset arrangements and do not represent the amount paid by the class during periods when reimbursements or reductions occur. Expenses net of fee waivers reflect expenses after reimbursement by the investment adviser but prior to reductions from brokerage service arrangements or other expense offset arrangements. Expenses net of all reductions represent the net expenses paid by the class. F For the year ended February 29. G Amount represents less than $.01 per share. H Total distributions of $.43 per share is comprised of distributions from net investment income of $.379 and distributions from net realized gain of $.057 per share. I Investment income per share reflects large, non-recurring dividends which amounted to $.95 per share. Excluding these non-recurring dividends, the ratio of net investment income (loss) to average net assets would have been 1.70%. |
See accompanying notes which are an integral part of the financial statements.
Annual Report
Notes to Financial Statements
For the period ended February 28, 2014
1. Organization.
Telecommunications Portfolio (the Fund) is a non-diversified fund of Fidelity Select Portfolios (the Trust) and is authorized to issue an unlimited number of shares. The Trust is registered under the Investment Company Act of 1940, as amended (the 1940 Act), as an open-end management investment company organized as a Massachusetts business trust. The Fund invests primarily in securities of companies whose principal business activities fall within specific industries. The Fund offers Class A, Class T, Class C, Telecommunications and Institutional Class shares, each of which, along with Class B shares, has equal rights as to assets and voting privileges. Class B shares are closed to new accounts and additional purchases, except for exchanges and reinvestments. Each class has exclusive voting rights with respect to matters that affect that class. Class B shares will automatically convert to Class A shares after a holding period of seven years from the initial date of purchase.
2. Investments in Fidelity Central Funds.
The Fund invests in Fidelity Central Funds, which are open-end investment companies generally available only to other investment companies and accounts managed by the investment adviser and its affiliates. The Fund's Schedule of Investments lists each of the Fidelity Central Funds held as of period end, if any, as an investment of the Fund, but does not include the underlying holdings of each Fidelity Central Fund. As an Investing Fund, the Fund indirectly bears its proportionate share of the expenses of the underlying Fidelity Central Funds.
The Money Market Central Funds seek preservation of capital and current income and are managed by Fidelity Investments Money Management, Inc. (FIMM), an affiliate of the investment adviser. Annualized expenses of the Money Market Central Funds as of their most recent shareholder report date are less than .01%.
A complete unaudited list of holdings for each Fidelity Central Fund is available upon request or at the Securities and Exchange Commission (the SEC) website at www.sec.gov. In addition, the financial statements of the Fidelity Central Funds, which are not covered by the Fund's Report of Independent Registered Public Accounting Firm, are available on the SEC website or upon request.
3. Significant Accounting Policies.
The financial statements have been prepared in conformity with accounting principles generally accepted in the United States of America (GAAP), which require management to make certain estimates and assumptions at the date of the financial statements. Actual results could differ from those estimates. Subsequent events, if any, through the date that the financial statements were issued have been evaluated in the preparation of the financial statements. The following summarizes the significant accounting policies of the Fund:
Investment Valuation. Investments are valued as of 4:00 p.m. Eastern time on the last calendar day of the period. In accordance with valuation policies and procedures approved by the Board of Trustees (the Board), the Fund attempts to obtain prices from one or more third party pricing vendors or brokers to value its investments. When current market prices, quotations or currency exchange rates are not readily available or reliable, investments will be fair valued in good faith by the Fidelity SelectCo, LLC (SelectCo) Fair Value Committee (the Committee), in accordance with procedures adopted by the Board. Factors used in determining fair value vary by investment type and may include market or investment specific events. The frequency with which these procedures are used cannot be predicted and they may be utilized to a significant extent. The Committee oversees the Fund's valuation policies and procedures and is responsible for approving and reporting to the Board all fair value determinations.
The Fund categorizes the inputs to valuation techniques used to value its investments into a disclosure hierarchy consisting of three levels as shown below:
Level 1 - quoted prices in active markets for identical investments
Level 2 - other significant observable inputs (including quoted prices for similar investments, interest rates, prepayment speeds, etc.)
Level 3 - unobservable inputs (including the Fund's own assumptions based on the best information available)
Valuation techniques used to value the Fund's investments by major category are as follows:
Equity securities, including restricted securities, for which market quotations are readily available, are valued at the last reported sale price or official closing price as reported by a third party pricing vendor on the primary market or exchange on which they are traded and are categorized as Level 1 in the hierarchy. In the event there were no sales during the day or closing prices are not available, securities are valued at the last quoted bid price or may be valued using the last available price and are generally categorized as Level 2 in the hierarchy. For foreign equity securities, when market or security specific events arise, comparisons to the valuation of American Depositary Receipts (ADRs), futures contracts, Exchange-Traded Funds (ETFs) and certain indexes as well as quoted prices for similar securities may be used and would be categorized as Level 2 in the hierarchy. Utilizing these techniques may result in transfers between Level 1 and Level 2. For equity securities, including restricted securities, where observable inputs are limited, assumptions about market activity and risk are used and these securities may be categorized as Level 3 in the hierarchy.
Annual Report
3. Significant Accounting Policies - continued
Investment Valuation - continued
Investments in open-end mutual funds, including the Fidelity Central Funds, are valued at their closing net asset value (NAV) each business day and are categorized as Level 1 in the hierarchy.
Changes in valuation techniques may result in transfers in or out of an assigned level within the disclosure hierarchy. The aggregate value of investments by input level, as of February 28, 2014, is included at the end of the Fund's Schedule of Investments.
Foreign Currency. The Fund may use foreign currency contracts to facilitate transactions in foreign-denominated securities. Gains and losses from these transactions may arise from changes in the value of the foreign currency or if the counterparties do not perform under the contracts' terms.
Foreign-denominated assets, including investment securities, and liabilities are translated into U.S. dollars at the exchange rates at period end. Purchases and sales of investment securities, income and dividends received and expenses denominated in foreign currencies are translated into U.S. dollars at the exchange rate in effect on the transaction date.
The effects of exchange rate fluctuations on investments are included with the net realized and unrealized gain (loss) on investment securities. Other foreign currency transactions resulting in realized and unrealized gain (loss) are disclosed separately.
Investment Transactions and Income. For financial reporting purposes, the Fund's investment holdings and NAV include trades executed through the end of the last business day of the period. The NAV per share for processing shareholder transactions is calculated as of the close of business of the New York Stock Exchange (NYSE), normally 4:00 p.m. Eastern time and includes trades executed through the end of the prior business day. Gains and losses on securities sold are determined on the basis of identified cost and may include proceeds received from litigation. Dividend income is recorded on the ex-dividend date, except for certain dividends from foreign securities where the ex-dividend date may have passed, which are recorded as soon as the Fund is informed of the ex-dividend date. Non-cash dividends included in dividend income, if any, are recorded at the fair market value of the securities received. Distributions received on securities that represent a return of capital or capital gain are recorded as a reduction of cost of investments and/or as a realized gain. Subsequent to ex-dividend date the Fund determines the components of these distributions, based upon receipt of tax filings or other correspondence relating to the underlying investment. Large, non-recurring dividends recognized by the Fund are presented separately on the Statement of Operations as "Special Dividends" and the impact of these dividends is presented in the Financial Highlights. Interest income and distributions from the Fidelity Central Funds are accrued as earned. Interest income includes coupon interest and amortization of premium and accretion of discount on debt securities. Investment income is recorded net of foreign taxes withheld where recovery of such taxes is uncertain.
Class Allocations and Expenses. Investment income, realized and unrealized capital gains and losses, common expenses of the Fund, and certain fund-level expense reductions, if any, are allocated daily on a pro-rata basis to each class based on the relative net assets of each class to the total net assets of the Fund. Each class differs with respect to transfer agent and distribution and service plan fees incurred. Certain expense reductions may also differ by class. For the reporting period, the allocated portion of income and expenses to each class as a percent of its average net assets may vary due to the timing of recording these transactions in relation to fluctuating net assets of the classes. Expenses directly attributable to a fund are charged to that fund. Expenses attributable to more than one fund are allocated among the respective funds on the basis of relative net assets or other appropriate methods. Expense estimates are accrued in the period to which they relate and adjustments are made when actual amounts are known.
Income Tax Information and Distributions to Shareholders. Each year, the Fund intends to qualify as a regulated investment company under Subchapter M of the Internal Revenue Code, including distributing substantially all of its taxable income and realized gains. As a result, no provision for U.S. Federal income taxes is required. As of February 28, 2014, the Fund did not have any unrecognized tax benefits in the financial statements; nor is the Fund aware of any tax positions for which it is reasonably possible that the total amounts of unrecognized tax benefits will significantly change in the next twelve months. The Fund files a U.S. federal tax return, in addition to state and local tax returns as required. The Fund's federal income tax returns are subject to examination by the Internal Revenue Service (IRS) for a period of three fiscal years after they are filed. State and local tax returns may be subject to examination for an additional fiscal year depending on the jurisdiction. Foreign taxes are provided for based on the Fund's understanding of the tax rules and rates that exist in the foreign markets in which it invests.
Distributions are declared and recorded on the ex-dividend date. Income dividends and capital gain distributions are declared separately for each class. Income and capital gain distributions are determined in accordance with income tax regulations, which may differ from GAAP.
Capital accounts within the financial statements are adjusted for permanent book-tax differences. These adjustments have no impact on net assets or the results of operations. Capital accounts are not adjusted for temporary book-tax differences which will reverse in a subsequent period.
Book-tax differences are primarily due to foreign currency transactions, deferred trustees compensation, capital loss carryforwards and losses deferred due to wash sales and excise tax regulations.
Annual Report
Notes to Financial Statements - continued
3. Significant Accounting Policies - continued
Income Tax Information and Distributions to Shareholders - continued
The federal tax cost of investment securities and unrealized appreciation (depreciation) as of period end were as follows:
Gross unrealized appreciation | $ 50,421,115 |
Gross unrealized depreciation | (17,845,454) |
Net unrealized appreciation (depreciation) on securities and other investments | $ 32,575,661 |
|
|
Tax Cost | $ 334,826,554 |
The tax-based components of distributable earnings as of period end were as follows:
Undistributed ordinary income | $ 7,778,810 |
Capital loss carryforward | $ (4,297,851) |
Net unrealized appreciation (depreciation) | $ 32,571,515 |
Capital loss carryforwards are only available to offset future capital gains of the Fund to the extent provided by regulations and may be limited. Under the Regulated Investment Company Modernization Act of 2010 (the Act), the Fund is permitted to carry forward capital losses incurred in taxable years beginning after December 22, 2010 for an unlimited period and such capital losses are required to be used prior to any losses that expire. The capital loss carryforward information presented below, including any applicable limitation, is estimated as of fiscal period end and is subject to adjustment.
Fiscal year of expiration |
|
2018 | $ (4,297,851) |
The Fund intends to elect to defer to its next fiscal year $4,073,316 of capital losses recognized during the period November 1, 2013 to February 28, 2014.
The tax character of distributions paid was as follows:
| February 28, 2014 | February 28, 2013 |
Ordinary Income | $ 8,539,270 | $ 8,401,078 |
Trading (Redemption) Fees. Shares held by investors in the Fund less than 30 days may be subject to a redemption fee equal to .75% of the NAV of shares redeemed. All redemption fees, which reduce the proceeds of the shareholder redemption, are retained by the Fund and accounted for as an addition to paid in capital.
4. Purchases and Sales of Investments.
Purchases and sales of securities, other than short-term securities, aggregated $468,948,325 and $554,795,163, respectively.
5. Fees and Other Transactions with Affiliates.
Management Fee. Effective August 1, 2013, SelectCo replaced Fidelity Management and Research Company (FMR), an affiliate of SelectCo, as investment adviser to the Fund. The investment adviser and its affiliates provide the Fund with investment management related services for which the Fund pays a monthly management fee. The management fee is the sum of an individual fund fee rate that is based on an annual rate of .30% of the Fund's average net assets and an annualized group fee rate that averaged .25% during the period. The group fee rate is based upon the average net assets of all the mutual funds advised by FMR and the investment adviser. The group fee rate decreases as assets under management increase and increases as assets under management decrease. For the reporting period, the total annual management fee rate was .55% of the Fund's average net assets.
Distribution and Service Plan Fees. In accordance with Rule 12b-1 of the 1940 Act, the Fund has adopted separate Distribution and Service Plans for each class of shares. Certain classes pay Fidelity Distributors Corporation (FDC), an affiliate of the investment adviser, separate Distribution and Service Fees, each of which is based on an annual percentage of each class' average net assets. In addition, FDC may pay financial intermediaries for
Annual Report
5. Fees and Other Transactions with Affiliates - continued
Distribution and Service Plan Fees - continued
selling shares of the Fund and providing shareholder support services. For the period, the Distribution and Service Fee rates, total fees and amounts retained by FDC were as follows:
| Distribution | Service | Total Fees | Retained |
Class A | -% | .25% | $ 18,291 | $ 583 |
Class T | .25% | .25% | 21,936 | - |
Class B | .75% | .25% | 5,661 | 4,246 |
Class C | .75% | .25% | 52,623 | 12,851 |
|
|
| $ 98,511 | $ 17,680 |
Sales Load. FDC may receive a front-end sales charge of up to 5.75% for selling Class A shares and 3.50% for selling Class T shares, some of which is paid to financial intermediaries for selling shares of the Fund. Depending on the holding period, FDC may receive contingent deferred sales charges levied on Class A, Class T, Class B, and Class C redemptions. The deferred sales charges range from 5.00% to 1.00% for Class B shares, 1.00% for Class C shares, 1.00% for certain purchases of Class A shares and .25% for certain purchases of Class T shares.
For the period, sales charge amounts retained by FDC were as follows:
| Retained |
Class A | $ 8,371 |
Class T | 2,798 |
Class B* | 370 |
Class C* | 621 |
| $ 12,160 |
* When Class B and Class C shares are initially sold, FDC pays commissions from its own resources to financial intermediaries through which the sales are made.
Transfer Agent Fees. Fidelity Investments Institutional Operations Company, Inc., (FIIOC), an affiliate of the investment adviser, is the transfer, dividend disbursing and shareholder servicing agent for each class of the Fund. FIIOC receives account fees and asset-based fees that vary according to the account size and type of account of the shareholders of the respective classes of the Fund. FIIOC pays for typesetting, printing and mailing of shareholder reports, except proxy statements.
For the period, transfer agent fees for each class were as follows:
| Amount | % of |
Class A | $ 21,689 | .30 |
Class T | 15,148 | .35 |
Class B | 1,702 | .30 |
Class C | 12,956 | .25 |
Telecommunications | 897,426 | .21 |
Institutional Class | 3,721 | .27 |
| $ 952,642 |
|
Accounting and Security Lending Fees. Fidelity Service Company, Inc. (FSC), an affiliate of the investment adviser, maintains the Fund's accounting records. The accounting fee is based on the level of average net assets for each month. Under a separate contract, FSC administers the security lending program. The security lending fee is based on the number and duration of lending transactions.
Brokerage Commissions. The Fund placed a portion of its portfolio transactions with brokerage firms which are affiliates of the investment adviser. Brokerage commissions are included in net realized gain (loss) and change in net unrealized appreciation (depreciation) in the Statement of Operations. The commissions paid to these affiliated firms were $29,221 for the period.
Interfund Lending Program. Pursuant to an Exemptive Order issued by the SEC, the Fund, along with other registered investment companies having management contracts with FMR or other affiliated entities of FMR, may participate in an interfund lending program. This program provides an
Annual Report
Notes to Financial Statements - continued
5. Fees and Other Transactions with Affiliates - continued
Interfund Lending Program - continued
alternative credit facility allowing the funds to borrow from, or lend money to, other participating affiliated funds. At period end, there were no interfund loans outstanding. The Fund's activity in this program during the period for which loans were outstanding was as follows:
Borrower or Lender | Average Loan | Weighted Average | Interest |
Borrower | $ 10,090,231 | .32% | $ 1,149 |
6. Committed Line of Credit.
The Fund participates with other funds managed by the investment adviser or an affiliate in a $4.25 billion credit facility (the "line of credit") to be utilized for temporary or emergency purposes to fund shareholder redemptions or for other short-term liquidity purposes. The Fund has agreed to pay commitment fees on its pro-rata portion of the line of credit, which amounted to $879 and is reflected in Miscellaneous expenses on the Statement of Operations. During the period, there were no borrowings on this line of credit.
7. Security Lending.
The Fund lends portfolio securities through a lending agent from time to time in order to earn additional income. For equity securities, a lending agent is used and may loan securities to certain qualified borrowers, which prior to August 1, 2013 included Fidelity Capital Markets (FCM), a broker-dealer affiliated with the Fund. On the settlement date of the loan, the Fund receives collateral (in the form of U.S. Treasury obligations, letters of credit and/or cash) against the loaned securities and maintains collateral in an amount not less than 100% of the market value of the loaned securities during the period of the loan. The market value of the loaned securities is determined at the close of business of the Fund and any additional required collateral is delivered to the Fund on the next business day. If the borrower defaults on its obligation to return the securities loaned because of insolvency or other reasons, the Fund may apply collateral received from the borrower against the obligation. The Fund may experience delays and costs in recovering the securities loaned. Any cash collateral received is invested in the Fidelity Securities Lending Cash Central Fund. The value of loaned securities and cash collateral at period end are disclosed on the Fund's Statement of Assets and Liabilities. At period end, there were no security loans outstanding with FCM. Security lending income represents the income earned on investing cash collateral, less rebates paid to borrowers and any lending agent fees associated with the loan, plus any premium payments received for lending certain types of securities. Security lending income is presented in the Statement of Operations as a component of income from Fidelity Central Funds. Total security lending income during the period amounted to $228,474, including $38,531 from securities loaned to FCM.
8. Expense Reductions.
Commissions paid to certain brokers with whom the investment adviser, or its affiliates, places trades on behalf of the Fund include an amount in addition to trade execution, which may be rebated back to the Fund to offset certain expenses. This amount totaled $112,854 for the period.
In addition, FMR reimbursed a portion of the Fund's operating expenses during the period in the amount of $1,847.
9. Distributions to Shareholders.
Distributions to shareholders of each class were as follows:
Years ended February 28, | 2014 | 2013 |
From net investment income |
|
|
Class A | $ 137,021 | $ 115,461 |
Class T | 71,145 | 65,641 |
Class B | 6,457 | 6,964 |
Class C | 68,251 | 43,780 |
Telecommunications | 8,194,747 | 8,113,006 |
Institutional Class | 29,138 | 56,226 |
Total | $ 8,506,759 | $ 8,401,078 |
From net realized gain |
|
|
Class A | $ 617 | $ - |
Class T | 373 | - |
Class B | 48 | - |
Class C | 466 | - |
Telecommunications | 30,889 | - |
Institutional Class | 118 | - |
Total | $ 32,511 | $ - |
Annual Report
10. Share Transactions.
Transactions for each class of shares were as follows:
| Shares | Dollars | ||
Years ended February 28, | 2014 | 2013 | 2014 | 2013 |
Class A |
|
|
|
|
Shares sold | 62,389 | 76,572 | $ 3,565,235 | $ 3,760,739 |
Reinvestment of distributions | 2,113 | 1,839 | 123,157 | 92,540 |
Shares redeemed | (58,169) | (54,776) | (3,308,571) | (2,738,397) |
Net increase (decrease) | 6,333 | 23,635 | $ 379,821 | $ 1,114,882 |
Class T |
|
|
|
|
Shares sold | 23,341 | 48,620 | $ 1,331,922 | $ 2,392,044 |
Reinvestment of distributions | 1,193 | 1,268 | 69,243 | 63,823 |
Shares redeemed | (32,706) | (26,195) | (1,852,992) | (1,317,712) |
Net increase (decrease) | (8,172) | 23,693 | $ (451,827) | $ 1,138,155 |
Class B |
|
|
|
|
Shares sold | 135 | 3,053 | $ 7,819 | $ 144,445 |
Reinvestment of distributions | 103 | 133 | 6,030 | 6,751 |
Shares redeemed | (2,095) | (4,941) | (116,496) | (248,673) |
Net increase (decrease) | (1,857) | (1,755) | $ (102,647) | $ (97,477) |
Class C |
|
|
|
|
Shares sold | 31,217 | 26,248 | $ 1,769,477 | $ 1,304,972 |
Reinvestment of distributions | 819 | 594 | 47,679 | 29,972 |
Shares redeemed | (22,263) | (18,620) | (1,264,412) | (912,596) |
Net increase (decrease) | 9,773 | 8,222 | $ 552,744 | $ 422,348 |
Telecommunications |
|
|
|
|
Shares sold | 3,045,047 | 3,283,802 | $ 171,993,078 | $ 158,174,294 |
Reinvestment of distributions | 136,279 | 156,090 | 7,951,397 | 7,859,416 |
Shares redeemed | (4,653,020) | (3,538,446) | (269,388,514) | (177,183,415) |
Net increase (decrease) | (1,471,694) | (98,554) | $ (89,444,039) | $ (11,149,705) |
Institutional Class |
|
|
|
|
Shares sold | 22,305 | 41,031 | $ 1,294,531 | $ 2,107,286 |
Reinvestment of distributions | 405 | 986 | 23,701 | 49,926 |
Shares redeemed | (46,560) | (13,014) | (2,517,260) | (646,240) |
Net increase (decrease) | (23,850) | 29,003 | $ (1,199,028) | $ 1,510,972 |
11. Other.
The Fund's organizational documents provide former and current trustees and officers with a limited indemnification against liabilities arising in connection with the performance of their duties to the Fund. In the normal course of business, the Fund may also enter into contracts that provide general indemnifications. The Fund's maximum exposure under these arrangements is unknown as this would be dependent on future claims that may be made against the Fund. The risk of material loss from such claims is considered remote.
At the end of the period, Fidelity VIP FundsManager 60% Portfolio was the owner of record of approximately 11% of the total outstanding shares of the Fund.
Annual Report
Report of Independent Registered Public Accounting Firm
To the Trustees of Fidelity Select Portfolios and the Shareholders of Consumer Staples Portfolio, Gold Portfolio, Materials Portfolio and Telecommunications Portfolio:
In our opinion, the accompanying statements of assets and liabilities (consolidated statement of assets and liabilities for Gold Portfolio), including the schedules of investments (consolidated schedule of investments for Gold Portfolio), and the related statements of operations (consolidated statement of operations for Gold Portfolio) and of changes in net assets (consolidated changes in net assets for Gold Portfolio) and the financial highlights present fairly, in all material respects, the financial positions of Consumer Staples Portfolio, Gold Portfolio, Materials Portfolio and Telecommunications Portfolio (funds of Fidelity Select Portfolios) at February 28, 2014, the results of each of their operations for the year then ended, the changes in each of their net assets for each of the two years in the period then ended and the financial highlights for each of the five years in the period then ended, in conformity with accounting principles generally accepted in the United States of America. These financial statements and financial highlights (hereafter referred to as "financial statements") are the responsibility of the Fidelity Select Portfolios' management. Our responsibility is to express an opinion on these financial statements based on our audits. We conducted our audits of these financial statements in accordance with the standards of the Public Company Accounting Oversight Board (United States). Those standards require that we plan and perform the audit to obtain reasonable assurance about whether the financial statements are free of material misstatement. An audit includes examining, on a test basis, evidence supporting the amounts and disclosures in the financial statements, assessing the accounting principles used and significant estimates made by management, and evaluating the overall financial statement presentation. We believe that our audits, which included confirmation of securities at February 28, 2014 by correspondence with the custodian and brokers, provide a reasonable basis for our opinion.
PricewaterhouseCoopers LLP
Boston, Massachusetts
April 17, 2014
Annual Report
Trustees and Officers
The Trustees and officers of the trust and funds, as applicable, are listed below. The Board of Trustees governs each fund and is responsible for protecting the interests of shareholders. The Trustees are experienced executives who meet periodically throughout the year to oversee each fund's activities, review contractual arrangements with companies that provide services to each fund, oversee management of the risks associated with such activities and contractual arrangements, and review each fund's performance. Except for Ned C. Lautenbach and William S. Stavropoulos, each of the Trustees oversees 74 funds. Mr. Lautenbach and Mr. Stavropoulos each oversees 246 funds.
The Trustees hold office without limit in time except that (a) any Trustee may resign; (b) any Trustee may be removed by written instrument, signed by at least two-thirds of the number of Trustees prior to such removal; (c) any Trustee who requests to be retired or who has become incapacitated by illness or injury may be retired by written instrument signed by a majority of the other Trustees; and (d) any Trustee may be removed at any special meeting of shareholders by a two-thirds vote of the outstanding voting securities of the trust. The officers hold office without limit in time, except that any officer may resign or may be removed by a vote of a majority of the Trustees at any regular meeting or any special meeting of the Trustees. Except as indicated, each individual has held the office shown or other offices in the same company for the past five years.
Experience, Skills, Attributes, and Qualifications of the Funds' Trustees. The Governance and Nominating Committee has adopted a statement of policy that describes the experience, qualifications, attributes, and skills that are necessary and desirable for potential Independent Trustee candidates (Statement of Policy). The Board believes that each Trustee satisfied at the time he or she was initially elected or appointed a Trustee, and continues to satisfy, the standards contemplated by the Statement of Policy. The Governance and Nominating Committee also engages professional search firms to help identify potential Independent Trustee candidates who have the experience, qualifications, attributes, and skills consistent with the Statement of Policy. From time to time, additional criteria based on the composition and skills of the current Independent Trustees, as well as experience or skills that may be appropriate in light of future changes to board composition, business conditions, and regulatory or other developments, have also been considered by the professional search firms and the Governance and Nominating Committee. In addition, the Board takes into account the Trustees' commitment and participation in Board and committee meetings, as well as their leadership of standing and ad hoc committees throughout their tenure.
In determining that a particular Trustee was and continues to be qualified to serve as a Trustee, the Board has considered a variety of criteria, none of which, in isolation, was controlling. The Board believes that, collectively, the Trustees have balanced and diverse experience, qualifications, attributes, and skills, which allow the Board to operate effectively in governing each fund and protecting the interests of shareholders. Information about the specific experience, skills, attributes, and qualifications of each Trustee, which in each case led to the Board's conclusion that the Trustee should serve (or continue to serve) as a trustee of the funds, is provided below.
Board Structure and Oversight Function. Brian B. Hogan is an interested person (as defined in the 1940 Act) and currently serves as Chairman. The Trustees have determined that an interested Chairman is appropriate and benefits shareholders because an interested Chairman has a personal and professional stake in the quality and continuity of services provided to the funds. Independent Trustees exercise their informed business judgment to appoint an individual of their choosing to serve as Chairman, regardless of whether the Trustee happens to be independent or a member of management. The Independent Trustees have determined that they can act independently and effectively without having an Independent Trustee serve as Chairman and that a key structural component for assuring that they are in a position to do so is for the Independent Trustees to constitute a substantial majority for the Board. The Independent Trustees also regularly meet in executive session. Michael E. Wiley serves as Chairman of the Independent Trustees and as such (i) acts as a liaison between the Independent Trustees and management with respect to matters important to the Independent Trustees and (ii) with management prepares agendas for Board meetings.
Fidelity funds are overseen by different Boards of Trustees. The funds' Board oversees Fidelity's sector portfolios. Other Boards oversee Fidelity's equity and high income funds, and Fidelity's investment grade bond, money market, and asset allocation funds. The use of separate Boards, each with its own committee structure, allows the Trustees of each group of Fidelity funds to focus on the unique issues of the funds they oversee, including common research, investment, and operational issues. On occasion, the separate Boards establish joint committees to address issues of overlapping consequences for the Fidelity funds overseen by each Board.
The Trustees operate using a system of committees to facilitate the timely and efficient consideration of all matters of importance to the Trustees, each fund, and fund shareholders and to facilitate compliance with legal and regulatory requirements and oversight of the funds' activities and associated risks. The Board, acting through its committees, has charged SelectCo and its affiliates with (i) identifying events or circumstances the occurrence of which could have demonstrably adverse effects on the funds' business and/or reputation; (ii) implementing processes and controls to lessen the possibility that such events or circumstances occur or to mitigate the effects of such events or circumstances if they do occur; and (iii) creating and maintaining a system designed to evaluate continuously business and market conditions in order to facilitate the identification and implementation processes described in (i) and (ii) above. Because the day-to-day operations and activities of the funds are carried out by or through SelectCo, its affiliates, and other service providers, the funds' exposure to risks is mitigated but not eliminated by the processes overseen by the Trustees. While each of the Board's committees has responsibility for overseeing different aspects of the funds' activities, oversight is exercised primarily through the Operations and Audit Committees. Appropriate personnel, including but not limited to the funds' Chief Compliance Officer (CCO), SelectCo's internal auditor, the independent accountants, the funds' Treasurer and portfolio management personnel, make periodic reports to the Board's committees, as appropriate. The responsibilities of each standing committee, including their oversight responsibilities, are described further under "Standing Committees of the Funds' Trustees."
The funds' Statement of Additional Information (SAI) includes more information about the Trustees. To request a free copy, call Fidelity at 1-877-208-0098.
Annual Report
Interested Trustee*:
Correspondence intended for the Trustee who is an interested person may be sent to Fidelity Investments, 245 Summer Street, Boston, Massachusetts 02210.
Name, Year of Birth; Principal Occupations and Other Relevant Experience+ | |
Brian B. Hogan (1964) | |
Year of Election or Appointment: 2014 Trustee Chairman of the Board of Trustees | |
| Mr. Hogan also serves as Trustee or Vice President of other funds. Mr. Hogan serves as President of FMR's Equity Division (2009-present). Previously, Mr. Hogan served as Senior Vice President, Equity Research of FMR (2006-2009) and as a portfolio manager. |
* Trustee has been determined to be an "Interested Trustee" by virtue of, among other things, his affiliation with the trust or various entities under common control with SelectCo.
+ The information above includes the Trustee's principal occupation during the last five years and other information relating to the experience, attributes, and skills relevant to the Trustee's qualifications to serve as a Trustee, which led to the conclusion that the Trustee should serve as a Trustee for each fund.
Independent Trustees:
Correspondence intended for each Independent Trustee (that is, the Trustees other than the Interested Trustee) may be sent to Fidelity Investments, P.O. Box 55235, Boston, Massachusetts 02205-5235.
Name, Year of Birth; Principal Occupations and Other Relevant Experience+ | |
Ned C. Lautenbach (1944) | |
Year of Election or Appointment: 2000 Trustee | |
| Mr. Lautenbach also serves as Trustee of other Fidelity funds. Mr. Lautenbach currently serves as the Lead Director of the Eaton Corporation Board of Directors (diversified industrial, 1997-present). Mr. Lautenbach is Chairman of the Board of Directors of the Philharmonic Center for the Arts in Naples, Florida (2012-present) and a member of the Council on Foreign Relations (1994-present). Previously, Mr. Lautenbach was a Partner/Advisory Partner at Clayton, Dubilier & Rice, LLC (private equity investment, 1998-2010), as well as a Director of Sony Corporation (2006-2007). |
David A. Rosow (1942) | |
Year of Election or Appointment: 2013 Trustee | |
| Mr. Rosow also serves as Trustee of other Fidelity funds. Mr. Rosow is Chairman and Chief Executive Officer of International Golf Group, Inc. (golf course development, 1989-present). Previously, Mr. Rosow served as Chairman and Chief Executive Officer of Rosow & Company, Inc. (private investment company, 1989-2011), a Lead Director of Hudson United Bancorp (2001-2006) and as a Director of TD Banknorth (1996-2006). In addition, Mr. Rosow is a member (2008-present) and President (2009-present) of the Town Council of Palm Beach, Florida. Mr. Rosow served as a Member of the Advisory Board of other Fidelity funds (2012-2013). |
Garnett A. Smith (1947) | |
Year of Election or Appointment: 2013 Trustee | |
| Mr. Smith also serves as Trustee of other Fidelity funds. Prior to Mr. Smith's retirement, he served as Chairman and Chief Executive Officer of Inbrand Corp. (manufacturer of personal absorbent products, 1990-1997). He also served as President (1986-1990) of Inbrand Corp. Prior to his employment with Inbrand Corp., he was employed by a retail fabric chain and North Carolina National Bank. In addition, Mr. Smith is a board member of the Jackson Hole Land Trust (2009-present). Mr. Smith served as a Member of the Advisory Board of other Fidelity funds (2012-2013). |
William S. Stavropoulos (1939) | |
Year of Election or Appointment: 2001 Trustee | |
| Mr. Stavropoulos also serves as Trustee of other Fidelity funds. Mr. Stavropoulos serves as President and Founder of the Michigan Baseball Foundation, the Great Lakes Loons (2007-present). Mr. Stavropoulos is Chairman Emeritus of the Board of Directors of The Dow Chemical Company, where he previously served in numerous senior management positions, including President, CEO (1995-2000; 2002-2004), Chairman of the Executive Committee (2000-2006), and as a member of the Board of Directors (1990-2006). Currently, Mr. Stavropoulos is Chairman of the Board of Directors of Univar Inc. (global distributor of commodity and specialty chemicals), a Director of Teradata Corporation (data warehousing and technology solutions), and Maersk Inc. (industrial conglomerate), and a member of the Advisory Board for Metalmark Capital LLC (private equity investment, 2005-present). Mr. Stavropoulos is an operating advisor to Clayton, Dubilier & Rice, LLC (private equity investment). In addition, Mr. Stavropoulos is a member of the University of Notre Dame Advisory Council for the College of Science, a Trustee of the Rollin L. Gerstacker Foundation, and a Director of the Naples Philharmonic Center for the Arts. Previously, Mr. Stavropoulos served as a Director of Chemical Financial Corporation (bank holding company, 1993-2012) and Tyco International, Ltd. (multinational manufacturing and services, 2007-2012). |
Michael E. Wiley (1950) | |
Year of Election or Appointment: 2008 Trustee Chairman of the Independent Trustees | |
| Mr. Wiley also serves as Trustee of other Fidelity funds. Mr. Wiley serves as a Director of Asia Pacific Exploration Consolidated (international oil and gas exploration and production, 2008-present). Mr. Wiley serves as a Director of Tesoro Corporation (independent oil refiner and marketer, 2005-present), and a Director of Bill Barrett Corporation (exploration and production, 2005-present). In addition, Mr. Wiley also serves as a Director of Post Oak Bank (privately-held bank, 2004-present). Previously, Mr. Wiley served as a Trustee of other Fidelity funds (2008-2013), as a member of the Board of Trustees of the University of Tulsa (2000-2006; 2007-2010), as a Senior Energy Advisor of Katzenbach Partners, LLC (consulting, 2006-2007), as an Advisory Director of Riverstone Holdings (private investment), Chairman, President, and CEO of Baker Hughes, Inc. (oilfield services, 2000-2004), and as Director of Spinnaker Exploration Company (exploration and production, 2001-2005). |
+ The information above includes each Trustee's principal occupation during the last five years and other information relating to the experience, attributes, and skills relevant to each Trustee's qualifications to serve as a Trustee, which led to the conclusion that each Trustee should serve as a Trustee for each fund.
Officers:
Except for Anthony R. Rochte, correspondence intended for each officer may be sent to Fidelity Investments, 245 Summer Street, Boston, Massachusetts 02210. Correspondence intended for Mr. Rochte may be sent to SelectCo, 1225 17th Street, Denver, Colorado 80202-5541. Officers appear below in alphabetical order.
Name, Year of Birth; Principal Occupation | |
Christopher S. Bartel (1971) | |
Year of Election or Appointment: 2009 Vice President | |
| Mr. Bartel also serves as Vice President of other funds. Mr. Bartel serves as a Director, President, and Chief Executive Officer of Fidelity Management & Research (Japan) Inc. (2012-present), a Director of Fidelity Management & Research (Hong Kong) (2012-present), and Senior Vice President of Global Equity Research (2010-present). Previously, Mr. Bartel served as Senior Vice President of Equity Research (2009-2010), Managing Director of Research (2006-2009), and an analyst and portfolio manager (2000-2006). |
Elizabeth Paige Baumann (1968) | |
Year of Election or Appointment: 2012 Anti-Money Laundering (AML) Officer | |
| Ms. Baumann also serves as AML Officer of other funds. She is Chief AML Officer of FMR LLC (2012-present) and is an employee of Fidelity Investments. Previously, Ms. Baumann served as Vice President and Deputy Anti-Money Laundering Officer (2007-2012). |
Marc Bryant (1966) | |
Year of Election or Appointment: 2013 Secretary | |
| Mr. Bryant also serves as an officer of other funds. He is Senior Vice President and Deputy General Counsel of FMR LLC. Prior to joining Fidelity Investments, Mr. Bryant served as a Senior Vice President and the Head of Global Retail Legal for AllianceBernstein L.P. (2006-2010), and as the General Counsel for ProFund Advisors LLC (2001-2006). |
William C. Coffey (1969) | |
Year of Election or Appointment: 2009 Assistant Secretary | |
| Mr. Coffey also serves as Assistant Secretary of other funds. He is Senior Vice President and Deputy General Counsel of FMR LLC (2010-present), and is an employee of Fidelity Investments. Previously, Mr. Coffey served as Vice President and Associate General Counsel of FMR LLC (2005-2009). |
Jonathan Davis (1968) | |
Year of Election or Appointment: 2010 Assistant Treasurer | |
| Mr. Davis also serves as Assistant Treasurer of other funds. Mr. Davis is an employee of Fidelity Investments. Previously, Mr. Davis served as Vice President and Associate General Counsel of FMR LLC (2003-2010). |
Adrien E. Deberghes (1967) | |
Year of Election or Appointment: 2013 President and Treasurer | |
| Mr. Deberghes also serves as an officer of other funds. He is an employee of Fidelity Investments (2008-present). Prior to joining Fidelity Investments, Mr. Deberghes was Senior Vice President of Mutual Fund Administration at State Street Corporation (2007-2008), Senior Director of Mutual Fund Administration at Investors Bank & Trust (2005-2007), and Director of Finance for Dunkin' Brands (2000-2005). |
Stephanie J. Dorsey (1969) | |
Year of Election or Appointment: 2010 Assistant Treasurer | |
| Ms. Dorsey also serves as an officer of other funds. She is an employee of Fidelity Investments (2008-present) and has served in other fund officer roles. Prior to joining Fidelity Investments, Ms. Dorsey served as Treasurer (2004-2008) of the JPMorgan Mutual Funds and Vice President (2004-2008) of JPMorgan Chase Bank. |
Joseph A. Hanlon (1968) | |
Year of Election or Appointment: 2012 Chief Compliance Officer | |
| Mr. Hanlon also serves as Chief Compliance Officer of other funds. Mr. Hanlon serves as Compliance Officer of FMR, FMR Co., Inc., Fidelity Investments Money Management, Inc. (FIMM), Fidelity Research and Analysis Company (FRAC), and Fidelity Management & Research (Hong Kong) (2009-present), as Senior Vice President of the Fidelity Asset Management Division (2009-present), and is an employee of Fidelity Investments. Previously, Mr. Hanlon served as Compliance Officer of Fidelity Management & Research (Japan) Inc. (2009-2013), Strategic Advisers, Inc. (2009-2013), and Fidelity Management & Research (U.K.) Inc. (2009-2013). |
Brian B. Hogan (1964) | |
Year of Election or Appointment: 2009 Vice President | |
| Mr. Hogan also serves as Trustee or Vice President of other funds. Mr. Hogan serves as President of FMR's Equity Division (2009-present). Previously, Mr. Hogan served as Senior Vice President, Equity Research of FMR (2006-2009) and as a portfolio manager. |
Chris Maher (1972) | |
Year of Election or Appointment: 2013 Assistant Treasurer | |
| Mr. Maher serves as Assistant Treasurer of other funds. Mr. Maher is Vice President of Valuation Oversight and is an employee of Fidelity Investments. Previously, Mr. Maher served as Vice President of Asset Management Compliance (2013), Vice President of FMR's Program Management Group (2010-2013), and Vice President of Valuation Oversight (2008-2010). |
Christine Reynolds (1958) | |
Year of Election or Appointment: 2008 Chief Financial Officer | |
| Ms. Reynolds also serves as Chief Financial Officer of other funds. Ms. Reynolds became President of Fidelity Pricing and Cash Management Services (FPCMS) in August 2008. Ms. Reynolds served as Chief Operating Officer of FPCMS (2007-2008). Previously, Ms. Reynolds served as President, Treasurer, and Anti-Money Laundering officer of the Fidelity funds (2004-2007). |
Kenneth B. Robins (1969) | |
Year of Election or Appointment: 2013 Deputy Treasurer | |
| Mr. Robins also serves as an officer of other funds. Mr. Robins serves as Executive Vice President of Fidelity Investments Money Management, Inc. (FIMM) (2013-present) and is an employee of Fidelity Investments (2004-present). Previously, Mr. Robins served in other fund officer roles. |
Anthony R. Rochte (1968) | |
Year of Election or Appointment: 2013 Vice President | |
| Mr. Rochte also serves as Vice President of other funds. Mr. Rochte serves as President of Fidelity SelectCo, LLC (2012-present) and is an employee of Fidelity Investments (2012-present). Prior to joining Fidelity Investments, Mr. Rochte served as Senior Managing Director and head of State Street Global Advisors' North American Intermediary Business Group (2006-2012). |
Stacie M. Smith (1974) | |
Year of Election or Appointment: 2013 Assistant Treasurer | |
| Ms. Smith also serves as an officer of other funds. She is an employee of Fidelity Investments (2009-present) and has served in other fund officer roles. Prior to joining Fidelity Investments, Ms. Smith served as Senior Audit Manager of Ernst & Young LLP (1996-2009). |
Renee Stagnone (1975) | |
Year of Election or Appointment: 2013 Deputy Treasurer | |
| Ms. Stagnone also serves as Deputy Treasurer of other funds. Ms. Stagnone is an employee of Fidelity Investments. |
Joseph F. Zambello (1957) | |
Year of Election or Appointment: 2011 Deputy Treasurer | |
| Mr. Zambello also serves as Deputy Treasurer of other funds. Mr. Zambello is an employee of Fidelity Investments. Previously, Mr. Zambello served as Vice President of FMR's Program Management Group (2009-2011) and Vice President of the Transfer Agent Oversight Group (2005-2009). |
Annual Report
Distributions (Unaudited)
The Board of Trustees of each fund voted to pay to shareholders of record at the opening of business on record date, the following distributions per share derived from capital gains realized from sales of portfolio securities and dividends derived from net investment income:
Consumer Staples Portfolio | Pay Date | Record Date | Dividends | Capital Gains |
Institutional Class | 04/14/14 | 04/11/14 | $0.273 | $2.753 |
Gold Portfolio | Pay Date | Record Date | Dividends | Capital Gains |
Institutional Class | 04/14/14 | 04/11/14 | $0.000 | $0.000 |
Materials Portfolio | Pay Date | Record Date | Dividends | Capital Gains |
Institutional Class | 04/14/14 | 04/11/14 | $0.120 | $2.337 |
Telecommunications Portfolio | Pay Date | Record Date | Dividends | Capital Gains |
Institutional Class | 04/14/14 | 04/11/14 | $1.263 | $0.000 |
The funds hereby designate as capital gain dividend the amounts noted below for the taxable year ended February 28, 2014, or, if subsequently determined to be different, the net capital gain of such year.
Fund | |
Consumer Staples Portfolio | $154,311,669 |
Materials Portfolio | $93,576,128 |
A percentage of the dividends distributed during the fiscal year for the following funds qualifies for the dividends-received deduction for corporate shareholders:
Fund | April 2013 | December 2013 |
Consumer Staples Portfolio |
|
|
Institutional Class | 75% | 100% |
Materials Portfolio |
|
|
Institutional Class | 100% | 100% |
Telecommunications Portfolio |
|
|
Institutional Class | 100% | 96% |
A percentage of the dividends distributed during the fiscal year for the following funds may be taken into account as a dividend for purposes of the maximum rate under section 1(h)(11) of the Internal Revenue Code.
| April 2013 | December 2013 |
Consumers Staples Portfolio |
|
|
Institutional Class | 100% | 100% |
Materials Portfolio |
|
|
Institutional Class | 100% | 100% |
Telecommunications Portfolio |
|
|
Institutional Class | 100% | 100% |
The fund will notify shareholders in January 2015 of amounts for use in preparing 2014 income tax returns.
Annual Report
Proxy Voting Results
A special meeting of each fund's shareholders was held on June 18, 2013. The results of votes taken among shareholders on the proposals before them are reported below. Each vote reported represents one dollar of net asset value held on the record date for the meeting.
PROPOSAL 1 | ||
To elect a Board of Trustees.A | ||
| # of | % of |
Ned C. Lautenbach | ||
Affirmative | 25,828,395,115.78 | 94.160 |
Withheld | 1,602,101,684.27 | 5.840 |
TOTAL | 27,430,496,800.05 | 100.000 |
Ronald P. O'Hanley | ||
Affirmative | 25,907,936,922.24 | 94.450 |
Withheld | 1,522,559,877.81 | 5.550 |
TOTAL | 27,430,496,800.05 | 100.000 |
David A. Rosow | ||
Affirmative | 25,805,492,959.91 | 94.076 |
Withheld | 1,625,003,840.14 | 5.924 |
TOTAL | 27,430,496,800.05 | 100.000 |
Garnett A. Smith | ||
Affirmative | 25,892,258,831.97 | 94.393 |
Withheld | 1,538,237,968.08 | 5.607 |
TOTAL | 27,430,496,800.05 | 100.000 |
William S. Stavropoulos | ||
Affirmative | 25,738,476,030.34 | 93.832 |
Withheld | 1,692,020,769.71 | 6.168 |
TOTAL | 27,430,496,800.05 | 100.000 |
Michael E. Wiley | ||
Affirmative | 25,923,640,743.27 | 94.507 |
Withheld | 1,506,856,056.78 | 5.493 |
TOTAL | 27,430,496,800.05 | 100.000 |
PROPOSAL 2 | ||
To approve a management contract between Consumer Staples Portfolio and Fidelity SelectCo, LLC. | ||
| # of | % of |
Affirmative | 1,231,896,932.45 | 72.402 |
Against | 59,201,079.18 | 3.479 |
Abstain | 62,956,309.82 | 3.700 |
Broker Non-Vote | 347,429,518.32 | 20.419 |
TOTAL | 1,701,483,839.77 | 100.000 |
PROPOSAL 2 | ||
To approve a management contract between Gold Portfolio and Fidelity SelectCo, LLC. | ||
| # of | % of |
Affirmative | 1,324,132,405.74 | 82.001 |
Against | 87,695,443.27 | 5.431 |
Abstain | 81,563,532.56 | 5.051 |
Broker Non-Vote | 121,395,496.57 | 7.517 |
TOTAL | 1,614,786,878.14 | 100.000 |
PROPOSAL 2 | ||
To approve a management contract between Materials Portfolio and Fidelity SelectCo, LLC. | ||
| # of | % of |
Affirmative | 782,680,671.91 | 69.186 |
Against | 33,398,286.37 | 2.953 |
Abstain | 38,711,653.50 | 3.421 |
Broker Non-Vote | 276,491,097.39 | 24.440 |
TOTAL | 1,131,281,709.17 | 100.000 |
PROPOSAL 2 | ||
To approve a management contract between Telecommunications Portfolio and Fidelity SelectCo, LLC. | ||
| # of | % of |
Affirmative | 208,420,238.27 | 81.880 |
Against | 18,588,167.85 | 7.302 |
Abstain | 11,559,235.71 | 4.541 |
Broker Non-Vote | 15,977,976.37 | 6.277 |
TOTAL | 254,545,618.20 | 100.000 |
A Denotes trust-wide proposal and voting results.
Annual Report
Investment Adviser
Fidelity SelectCo, LLC
Denver, CO
Investment Sub-Advisers
FMR Co., Inc.
Fidelity Management & Research
(U.K.) Inc.
Fidelity Management & Research
(Hong Kong) Limited
Fidelity Management & Research
(Japan) Inc.
General Distributor
Fidelity Distributors Corporation
Smithfield, RI
Transfer and Service Agents
Fidelity Investments Institutional
Operations Company, Inc.
Boston, MA
Fidelity Service Company, Inc.
Boston, MA
Custodian
Brown Brothers Harriman & Co.
Boston, MA
(Fidelity Investment logo)(registered trademark)
Corporate Headquarters
245 Summer St., Boston, MA 02210
www.fidelity.com
ASGMTI-UANN-0414
1.845768.107
Fidelity®
Select Portfolios®
Industrials Sector
Air Transportation Portfolio
Defense and Aerospace Portfolio
Environment and Alternative Energy Portfolio
Industrial Equipment Portfolio
Industrials Portfolio
Transportation Portfolio
Annual Report
February 28, 2014
(Fidelity Cover Art)
Contents
Shareholder Expense Example |
| |
Air Transportation Portfolio | Performance | |
| Management's Discussion | |
| Investment Changes | |
| Investments | |
| Financial Statements | |
Defense and Aerospace Portfolio | Performance | |
| Management's Discussion | |
| Investment Changes | |
| Investments | |
| Financial Statements | |
Environment and Alternative Energy Portfolio | Performance | |
| Management's Discussion | |
| Investment Changes | |
| Investments | |
| Financial Statements | |
Industrial Equipment Portfolio | Performance | |
| Management's Discussion | |
| Investment Changes | |
| Investments | |
| Financial Statements | |
Industrials Portfolio | Performance | |
| Management's Discussion | |
| Investment Changes | |
| Investments | |
| Financial Statements | |
Transportation Portfolio | Performance | |
| Management's Discussion | |
| Investment Changes | |
| Investments | |
| Financial Statements | |
Notes to Financial Statements |
| |
Report of Independent Registered Public Accounting Firm |
| |
Trustees and Officers |
| |
Distributions |
| |
Proxy Voting Results |
|
To view a fund's proxy voting guidelines and proxy voting record for the 12-month period ended June 30, visit http://www.fidelity.com/proxyvotingresults or visit the Securities and Exchange Commission's (SEC) web site at http://www.sec.gov. You may also call 1-800-544-8544 to request a free copy of the proxy voting guidelines.
Standard & Poor's, S&P and S&P 500 are registered service marks of The McGraw-Hill Companies, Inc. and have been licensed for use by Fidelity Distributors Corporation.
Other third-party marks appearing herein are the property of their respective owners.
All other marks appearing herein are registered or unregistered trademarks or service marks of FMR LLC or an affiliated company. © 2014 FMR LLC. All rights reserved.
Annual Report
This report and the financial statements contained herein are submitted for the general information of the shareholders of the funds. This report is not authorized for distribution to prospective investors in the funds unless preceded or accompanied by an effective prospectus.
A fund files its complete schedule of portfolio holdings with the SEC for the first and third quarters of each fiscal year on Form N-Q. Forms N-Q are available on the SEC's web site at http://www.sec.gov. A fund's Forms N-Q may be reviewed and copied at the SEC's Public Reference Room in Washington, DC. Information regarding the operation of the SEC's Public Reference Room may be obtained by calling 1-800-SEC-0330. For a complete list of a fund's portfolio holdings, view the most recent holdings listing, semiannual report, or annual report on Fidelity's web site at http://www.fidelity.com, http://www.advisor.fidelity.com, or http://www.401k.com, as applicable.
NOT FDIC INSURED • MAY LOSE VALUE • NO BANK GUARANTEE
Neither the funds nor Fidelity Distributors Corporation is a bank.
Annual Report
Select Portfolios
Shareholder Expense Example
As a shareholder of a Fund, you incur two types of costs: (1) transaction costs, including redemption fees and (2) ongoing costs, including management fees and other Fund expenses. This Example is intended to help you understand your ongoing costs (in dollars) of investing in the Funds and to compare these costs with the ongoing costs of investing in other mutual funds.
The Example is based on an investment of $1,000 invested at the beginning of the period and held for the entire period (September 1, 2013 to February 28, 2014).
Actual Expenses
The first line of the accompanying table for each fund provides information about actual account values and actual expenses. You may use the information in this line, together with the amount you invested, to estimate the expenses that you paid over the period. Simply divide your account value by $1,000.00 (for example, an $8,600 account value divided by $1,000.00 = 8.6), then multiply the result by the number in the first line for a fund under the heading entitled "Expenses Paid During Period" to estimate the expenses you paid on your account during this period. A small balance maintenance fee of $12.00 that is charged once a year may apply for certain accounts with a value of less than $2,000. This fee is not included in the table below. If it was, the estimate of expenses you paid during the period would be higher, and your ending account value lower, by this amount. In addition, each Fund, as a shareholder in the underlying Fidelity Central Funds, will indirectly bear its pro-rata share of the fees and expenses incurred by the underlying Fidelity Central Funds. These fees and expenses are not included in the Fund's annualized expense ratio used to calculate the expense estimate in the table below.
Hypothetical Example for Comparison Purposes
The second line of the accompanying table for each fund provides information about hypothetical account values and hypothetical expenses based on a fund's actual expense ratio and an assumed rate of return of 5% per year before expenses, which is not the Fund's actual return. The hypothetical account values and expenses may not be used to estimate the actual ending account balance or expenses you paid for the period. You may use this information to compare the ongoing costs of investing in the Fund and other funds. To do so, compare this 5% hypothetical example with the 5% hypothetical examples that appear in the shareholder reports of the other funds. A small balance maintenance fee of $12.00 that is charged once a year may apply for certain accounts with a value of less than $2,000. This fee is not included in the table below. If it was, the estimate of expenses you paid during the period would be higher, and your ending account value lower, by this amount. In addition, each Fund, as a shareholder in the underlying Fidelity Central Funds, will indirectly bear its pro-rata share of the fees and expenses incurred by the underlying Fidelity Central Funds. These fees and expenses are not included in the Fund's annualized expense ratio used to calculate the expense estimate in the table below.
Please note that the expenses shown in the table are meant to highlight your ongoing costs only and do not reflect any transaction costs. Therefore, the second line of the table is useful in comparing ongoing costs only, and will not help you determine the relative total costs of owning different funds. In addition, if these transactional costs were included, your costs would have been higher.
| Annualized | Beginning | Ending | Expenses Paid |
Air Transportation Portfolio | .86% |
|
|
|
Actual |
| $ 1,000.00 | $ 1,275.40 | $ 4.85 |
HypotheticalA |
| $ 1,000.00 | $ 1,020.53 | $ 4.31 |
Defense and Aerospace Portfolio | .80% |
|
|
|
Actual |
| $ 1,000.00 | $ 1,213.50 | $ 4.39 |
HypotheticalA |
| $ 1,000.00 | $ 1,020.83 | $ 4.01 |
Environment and Alternative Energy Portfolio | .94% |
|
|
|
Actual |
| $ 1,000.00 | $ 1,186.30 | $ 5.10 |
HypotheticalA |
| $ 1,000.00 | $ 1,020.13 | $ 4.71 |
Industrial Equipment Portfolio | .77% |
|
|
|
Actual |
| $ 1,000.00 | $ 1,186.10 | $ 4.17 |
HypotheticalA |
| $ 1,000.00 | $ 1,020.98 | $ 3.86 |
Industrials Portfolio | .80% |
|
|
|
Actual |
| $ 1,000.00 | $ 1,185.40 | $ 4.33 |
HypotheticalA |
| $ 1,000.00 | $ 1,020.83 | $ 4.01 |
Transportation Portfolio | .83% |
|
|
|
Actual |
| $ 1,000.00 | $ 1,242.30 | $ 4.61 |
HypotheticalA |
| $ 1,000.00 | $ 1,020.68 | $ 4.16 |
A 5% return per year before expenses
B Annualized expense ratio reflects expenses net of applicable fee waivers.
* Expenses are equal to each Fund's annualized expense ratio, multiplied by the average account value over the period, multiplied by 181/365 (to reflect the one-half year period).
Annual Report
Air Transportation Portfolio
Performance: The Bottom Line
Average annual total return reflects the change in the value of an investment, assuming reinvestment of the fund's distributions from dividend income and capital gains (the profits earned upon the sale of securities that have grown in value, if any) and assuming a constant rate of performance each year. The $10,000 table and the fund's returns do not reflect the deduction of taxes that a shareholder would pay on fund distributions or the redemption of fund shares. During periods of reimbursement by Fidelity, a fund's total return will be greater than it would be had the reimbursement not occurred. How a fund did yesterday is no guarantee of how it will do tomorrow.
Average Annual Total Returns
Periods ended February 28, 2014 | Past 1 | Past 5 | Past 10 |
Air Transportation Portfolio | 42.26% | 33.55% | 12.26% |
$10,000 Over 10 Years
Let's say hypothetically that $10,000 was invested in Air Transportation Portfolio on February 29, 2004. The chart shows how the value of your investment would have changed, and also shows how the S&P 500® Index performed over the same period.
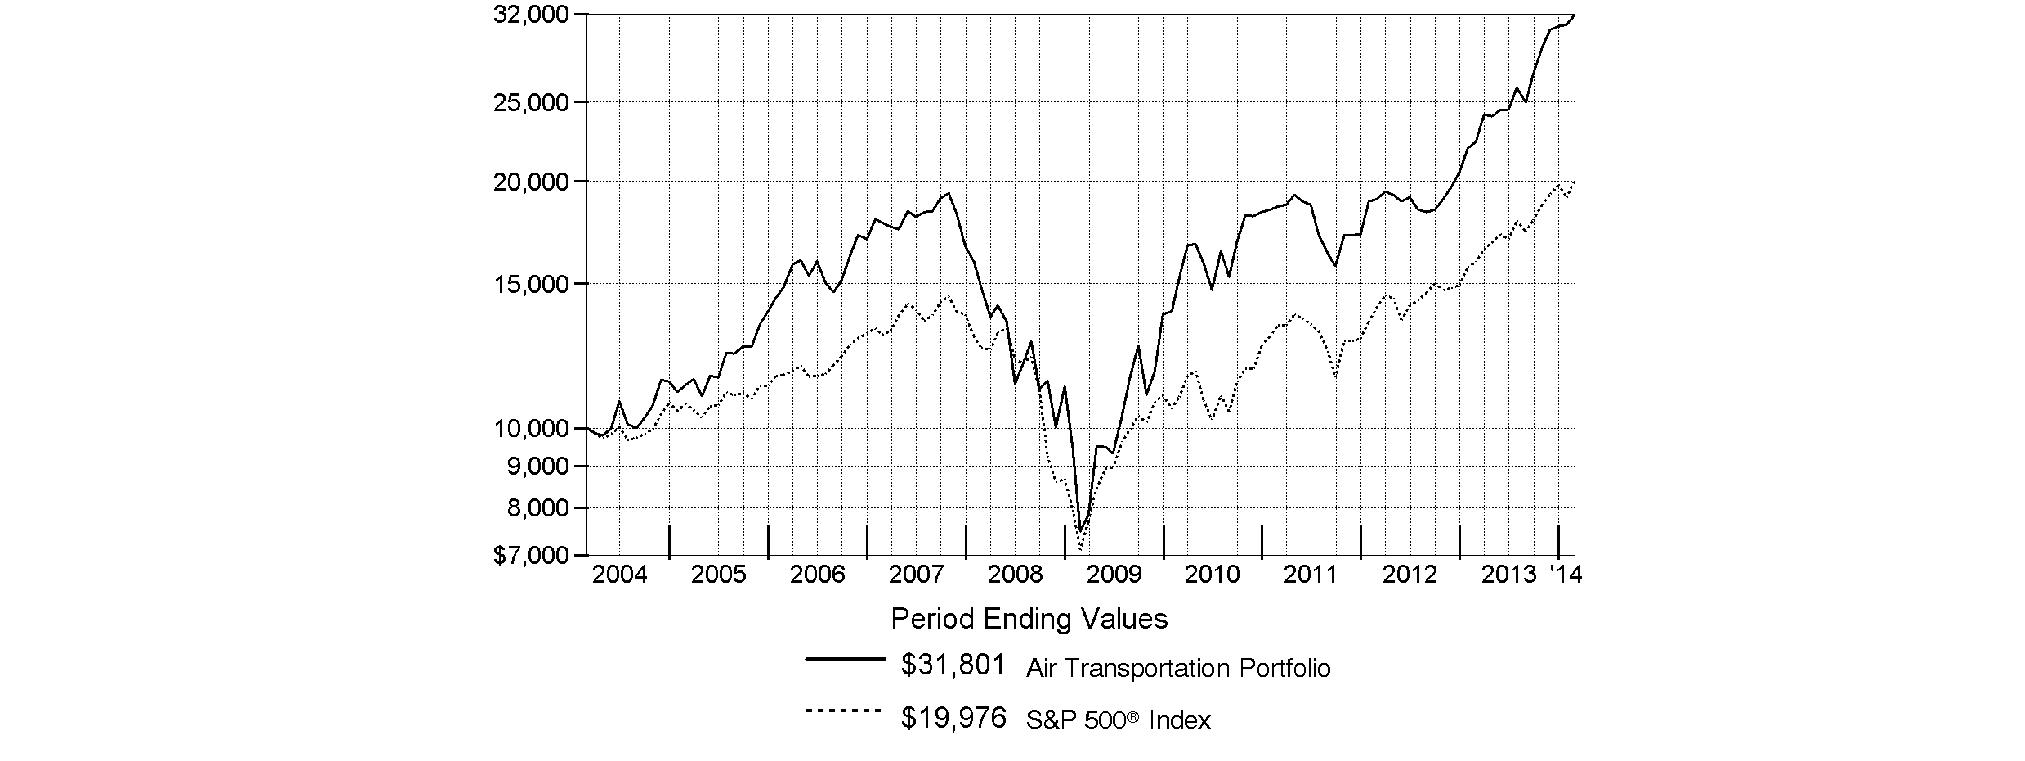
Annual Report
Air Transportation Portfolio
Management's Discussion of Fund Performance
Market Recap: Stocks overcame fears of higher interest rates - not to mention their worst January in four years - to finish sharply higher for the 12 months ending February 28, 2014. The broad S&P 500® Index and the blue-chip Dow Jones Industrial AverageSM gained 25.37% and 19.01%, respectively, amid generally favorable earnings reports and accommodative monetary policies worldwide. Performance generally increased along the risk spectrum, with smaller-cap and growth strategies leading the way. An ebullient market helped the growth-oriented Nasdaq Composite Index® to a 38.10% period gain, for example. On the other hand, both cyclical and defensive stocks had representation in the top-performing industry sectors: returns were highest in health care and consumer discretionary; lowest in utilities and telecommunication services. From a macroeconomic perspective, data still points to slow but steady improvement in the U.S., and Europe's recession may well be over. Reports from China have disappointed, but continue to suggest a relatively soft landing there. Mixed signals from the U.S. Federal Reserve as to when it might curtail its stimulative bond buying kept markets in flux during the spring and summer. Stocks regained momentum in October despite a federal budget impasse and brief government shutdown, and lower volatility prevailed through year-end. Shedding new-year concerns about China's economy, an emerging-markets sell-off and confirmation (at last) of Fed tapering - alongside confirmation of a presumably dovish Janet Yellen as new Fed chair - February saw stocks back in record territory, bearing down on the five-year anniversary of the market's bottom.
Comments from Matthew Moulis, Portfolio Manager of Air Transportation Portfolio: For the year, the fund returned 42.26%, modestly trailing the 43.64% gain of the S&P® Custom Air Transportation Index but well ahead of the broadly based S&P 500®. Versus the broader market, stocks in the fund's investment universe were lifted by outstanding performance in the airlines group. A position in cash and cash equivalents averaging 5% meaningfully dampened the fund's performance compared with its industry benchmark. I put most of this cash to work by period end. An underweighting and subpar stock selection in aerospace & defense also had a negative impact on relative performance. Specifically, an underweighting in Boeing, a strong-performing major index component, was the fund's largest relative detractor. Overweighting business jet maker Textron earlier in the period also worked against the fund's results, as did avoiding strong-performing truck broker and index component XPO Logistics. Conversely, the fund's overweighting in airlines and its underweighting in the lagging air freight & logistics segment were the two biggest factors lifting performance during the period. The largest relative contributor was Canada-based Bombardier, a manufacturer of regional jets and rail equipment. The fund didn't own this weak-performing index component for most of the period, as I was skeptical of the company's costly effort to begin competing with two established players in the market for large commercial jets. With that said, Bombardier's positive announcements on orders and commitments at the Dubai airshow in November prompted me to establish an underweighted position here. Other noteworthy contributors included major air carriers Delta Air Lines and American Airlines Group, the latter a company formed from the December 2013 merger of American Airlines and US Airways Group. At period end, Delta was the fund's largest position, and American Airlines Group was its fourth-largest holding. Underweighting freight forwarder and index component UTi Worldwide also aided our results.
The views expressed above reflect those of the portfolio manager(s) only through the end of the period as stated on the cover of this report and do not necessarily represent the views of Fidelity or any other person in the Fidelity organization. Any such views are subject to change at any time based upon market or other conditions and Fidelity disclaims any responsibility to update such views. These views may not be relied on as investment advice and, because investment decisions for a Fidelity fund are based on numerous factors, may not be relied on as an indication of trading intent on behalf of any Fidelity fund.
Annual Report
Air Transportation Portfolio
Investment Changes (Unaudited)
Top Ten Stocks as of February 28, 2014 | ||
| % of fund's | % of fund's net assets |
Delta Air Lines, Inc. | 10.3 | 8.4 |
The Boeing Co. | 9.5 | 10.9 |
United Parcel Service, Inc. Class B | 9.2 | 11.3 |
American Airlines Group, Inc. | 7.6 | 3.1 |
FedEx Corp. | 7.0 | 6.4 |
United Continental Holdings, Inc. | 6.6 | 3.9 |
Precision Castparts Corp. | 5.0 | 4.7 |
Ryanair Holdings PLC sponsored ADR | 4.9 | 5.1 |
Southwest Airlines Co. | 3.7 | 2.1 |
Rockwell Collins, Inc. | 3.5 | 5.7 |
| 67.3 | |
Top Industries (% of fund's net assets) | |||
As of February 28, 2014 | |||
 | Airlines | 43.9% |
|
 | Air Freight & Logistics | 27.4% |
|
 | Aerospace & Defense | 25.6% |
|
 | Road & Rail | 1.2% |
|
 | Transportation Infrastructure | 1.1% |
|
 | All Others* | 0.8% |
|

As of August 31, 2013 | |||
| Airlines | 35.2% |
|
| Aerospace & Defense | 28.8% |
|
| Air Freight & Logistics | 28.1% |
|
| Industrial Conglomerates | 0.9% |
|
| Transportation Infrastructure | 0.9% |
|
| All Others* | 6.1% |
|

* Includes short-term investments and net other assets (liabilities). |
Annual Report
Air Transportation Portfolio
Investments February 28, 2014
Showing Percentage of Net Assets
Common Stocks - 98.8% | |||
Shares | Value | ||
AEROSPACE & DEFENSE - 25.6% | |||
Aerospace & Defense - 25.6% | |||
Bombardier, Inc. Class B (sub. vtg.) | 775,000 | $ 2,526,641 | |
Honeywell International, Inc. | 19,700 | 1,860,468 | |
Precision Castparts Corp. | 68,479 | 17,659,365 | |
Rockwell Collins, Inc. | 146,800 | 12,116,872 | |
Spirit AeroSystems Holdings, Inc. | 337,400 | 9,727,242 | |
Textron, Inc. | 273,000 | 10,838,100 | |
The Boeing Co. | 258,800 | 33,364,496 | |
United Technologies Corp. | 16,300 | 1,907,426 | |
| 90,000,610 | ||
AIR FREIGHT & LOGISTICS - 27.0% | |||
Air Freight & Logistics - 27.0% | |||
Atlas Air Worldwide Holdings, Inc. (a) | 64,900 | 1,955,437 | |
C.H. Robinson Worldwide, Inc. (d) | 197,100 | 10,221,606 | |
Expeditors International of Washington, Inc. | 265,607 | 10,494,133 | |
FedEx Corp. | 184,700 | 24,626,051 | |
Hub Group, Inc. Class A (a) | 189,500 | 7,403,765 | |
Park-Ohio Holdings Corp. (a) | 116,800 | 6,148,352 | |
United Parcel Service, Inc. Class B | 338,400 | 32,408,568 | |
UTi Worldwide, Inc. | 138,000 | 1,357,920 | |
| 94,615,832 | ||
AIRLINES - 43.9% | |||
Airlines - 43.9% | |||
Air Canada Class A (a) | 1,419,500 | 7,627,585 | |
Alaska Air Group, Inc. | 68,200 | 5,908,848 | |
American Airlines Group, Inc. (a)(d) | 720,000 | 26,589,600 | |
Copa Holdings SA Class A | 5,900 | 799,214 | |
Dart Group PLC | 592,386 | 2,844,503 | |
Delta Air Lines, Inc. | 1,090,702 | 36,222,212 | |
Republic Airways Holdings, Inc. (a) | 220,400 | 2,111,432 | |
Ryanair Holdings PLC sponsored ADR (a) | 299,500 | 16,999,620 | |
Southwest Airlines Co. | 580,200 | 13,019,688 | |
Spirit Airlines, Inc. (a) | 139,500 | 7,878,960 | |
United Continental Holdings, Inc. (a) | 517,085 | 23,248,142 | |
WestJet Airlines Ltd. | 462,200 | 10,639,825 | |
| 153,889,629 | ||
MACHINERY - 0.0% | |||
Construction & Farm Machinery & Heavy Trucks - 0.0% | |||
ASL Marine Holdings Ltd. | 281,000 | 155,169 | |
ROAD & RAIL - 1.2% | |||
Trucking - 1.2% | |||
J.B. Hunt Transport Services, Inc. | 21,800 | 1,566,766 | |
Universal Truckload Services, Inc. | 98,564 | 2,562,664 | |
| 4,129,430 | ||
| |||
Shares | Value | ||
TRANSPORTATION INFRASTRUCTURE - 1.1% | |||
Airport Services - 1.1% | |||
BBA Aviation PLC | 711,700 | $ 4,007,947 | |
TOTAL COMMON STOCKS (Cost $267,558,837) |
| ||
Convertible Bonds - 0.4% | ||||
| Principal Amount |
| ||
AIR FREIGHT & LOGISTICS - 0.4% | ||||
Air Freight & Logistics - 0.4% | ||||
UTi Worldwide, Inc. 4.5% 3/1/19 (e) | $ 1,400,000 |
| ||
Money Market Funds - 12.2% | |||
Shares |
| ||
Fidelity Cash Central Fund, 0.10% (b) | 5,165,066 | 5,165,066 | |
Fidelity Securities Lending Cash Central Fund, 0.09% (b)(c) | 37,525,050 | 37,525,050 | |
TOTAL MONEY MARKET FUNDS (Cost $42,690,116) |
| ||
TOTAL INVESTMENT PORTFOLIO - 111.4% (Cost $311,648,953) | 390,902,173 | ||
NET OTHER ASSETS (LIABILITIES) - (11.4)% | (39,942,504) | ||
NET ASSETS - 100% | $ 350,959,669 | ||
Legend |
(a) Non-income producing |
(b) Affiliated fund that is generally available only to investment companies and other accounts managed by Fidelity Investments. The rate quoted is the annualized seven-day yield of the fund at period end. A complete unaudited listing of the fund's holdings as of its most recent quarter end is available upon request. In addition, each Fidelity Central Fund's financial statements, which are not covered by the Fund's Report of Independent Registered Public Accounting Firm, are available on the SEC's website or upon request. |
(c) Investment made with cash collateral received from securities on loan. |
(d) Security or a portion of the security is on loan at period end. |
(e) Security exempt from registration under Rule 144A of the Securities Act of 1933. These securities may be resold in transactions exempt from registration, normally to qualified institutional buyers. At the end of the period, the value of these securities amounted to $1,413,440 or 0.4% of net assets. |
Affiliated Central Funds |
Information regarding fiscal year to date income earned by the Fund from investments in Fidelity Central Funds is as follows: |
Fund | Income earned |
Fidelity Cash Central Fund | $ 12,980 |
Fidelity Securities Lending Cash Central Fund | 192,578 |
Total | $ 205,558 |
Other Information |
The following is a summary of the inputs used, as of February 28, 2014, involving the Fund's assets and liabilities carried at fair value. The inputs or methodology used for valuing securities may not be an indication of the risk associated with investing in those securities. For more information on valuation inputs, and their aggregation into the levels used in the table below, please refer to the Investment Valuation section in the accompanying Notes to Financial Statements. |
Valuation Inputs at Reporting Date: | ||||
Description | Total | Level 1 | Level 2 | Level 3 |
Investments in Securities: | ||||
Common Stocks | $ 346,798,617 | $ 346,798,617 | $ - | $ - |
Convertible Bonds | 1,413,440 | - | 1,413,440 | - |
Money Market Funds | 42,690,116 | 42,690,116 | - | - |
Total Investments in Securities: | $ 390,902,173 | $ 389,488,733 | $ 1,413,440 | $ - |
Distribution of investments by country or territory of incorporation, as a percentage of total net assets, is as follows (Unaudited): |
United States of America | 86.3% |
Canada | 5.9% |
Ireland | 4.9% |
United Kingdom | 1.9% |
Others (Individually Less Than 1%) | 1.0% |
| 100.0% |
See accompanying notes which are an integral part of the financial statements.
Annual Report
Air Transportation Portfolio
Financial Statements
Statement of Assets and Liabilities
| February 28, 2014 | |
|
|
|
Assets | ||
Investment in securities, at value (including securities loaned of $36,791,955) - See accompanying schedule: Unaffiliated issuers (cost $268,958,837) | $ 348,212,057 |
|
Fidelity Central Funds (cost $42,690,116) | 42,690,116 |
|
Total Investments (cost $311,648,953) |
| $ 390,902,173 |
Receivable for investments sold | 1,736,019 | |
Receivable for fund shares sold | 872,068 | |
Dividends receivable | 651,301 | |
Distributions receivable from Fidelity Central Funds | 33,403 | |
Prepaid expenses | 761 | |
Other receivables | 15,226 | |
Total assets | 394,210,951 | |
|
|
|
Liabilities | ||
Payable for investments purchased | $ 2,946,021 | |
Payable for fund shares redeemed | 2,476,140 | |
Accrued management fee | 179,710 | |
Other affiliated payables | 80,516 | |
Other payables and accrued expenses | 43,845 | |
Collateral on securities loaned, at value | 37,525,050 | |
Total liabilities | 43,251,282 | |
|
|
|
Net Assets | $ 350,959,669 | |
Net Assets consist of: |
| |
Paid in capital | $ 271,351,079 | |
Undistributed net investment income | 146,694 | |
Accumulated undistributed net realized gain (loss) on investments and foreign currency transactions | 208,676 | |
Net unrealized appreciation (depreciation) on investments | 79,253,220 | |
Net Assets, for 5,751,303 shares outstanding | $ 350,959,669 | |
Net Asset Value, offering price and redemption price per share ($350,959,669 ÷ 5,751,303 shares) | $ 61.02 | |
Statement of Operations
| Year ended February 28, 2014 | |
|
|
|
Investment Income |
|
|
Dividends |
| $ 2,136,666 |
Income from Fidelity Central Funds (including $192,578 from security lending) |
| 205,558 |
Total income |
| 2,342,224 |
|
|
|
Expenses | ||
Management fee | $ 1,211,223 | |
Transfer agent fees | 465,951 | |
Accounting and security lending fees | 86,196 | |
Custodian fees and expenses | 27,165 | |
Independent trustees' compensation | 4,178 | |
Registration fees | 59,985 | |
Audit | 39,449 | |
Legal | 2,221 | |
Interest | 1,368 | |
Miscellaneous | 1,660 | |
Total expenses before reductions | 1,899,396 | |
Expense reductions | (39,107) | 1,860,289 |
Net investment income (loss) | 481,935 | |
Realized and Unrealized Gain (Loss) Net realized gain (loss) on: | ||
Investment securities: |
|
|
Unaffiliated issuers | 7,547,911 | |
Foreign currency transactions | (971) | |
Total net realized gain (loss) |
| 7,546,940 |
Change in net unrealized appreciation (depreciation) on investment securities | 58,042,588 | |
Net gain (loss) | 65,589,528 | |
Net increase (decrease) in net assets resulting from operations | $ 66,071,463 | |
See accompanying notes which are an integral part of the financial statements.
Annual Report
Statement of Changes in Net Assets
| Year ended | Year ended |
Increase (Decrease) in Net Assets |
|
|
Operations |
|
|
Net investment income (loss) | $ 481,935 | $ 382,757 |
Net realized gain (loss) | 7,546,940 | 3,383,436 |
Change in net unrealized appreciation (depreciation) | 58,042,588 | 8,701,316 |
Net increase (decrease) in net assets resulting from operations | 66,071,463 | 12,467,509 |
Distributions to shareholders from net investment income | (283,510) | (278,547) |
Distributions to shareholders from net realized gain | (6,866,621) | (1,241,145) |
Total distributions | (7,150,131) | (1,519,692) |
Share transactions | 455,387,601 | 54,589,719 |
Reinvestment of distributions | 6,829,818 | 1,484,377 |
Cost of shares redeemed | (261,051,115) | (48,841,974) |
Net increase (decrease) in net assets resulting from share transactions | 201,166,304 | 7,232,122 |
Redemption fees | 35,151 | 4,540 |
Total increase (decrease) in net assets | 260,122,787 | 18,184,479 |
|
|
|
Net Assets | ||
Beginning of period | 90,836,882 | 72,652,403 |
End of period (including undistributed net investment income of $146,694 and undistributed net investment income of $77,786, respectively) | $ 350,959,669 | $ 90,836,882 |
Other Information Shares | ||
Sold | 8,314,236 | 1,356,924 |
Issued in reinvestment of distributions | 121,717 | 36,507 |
Redeemed | (4,750,627) | (1,233,402) |
Net increase (decrease) | 3,685,326 | 160,029 |
Financial Highlights
Years ended February 28, | 2014 | 2013 | 2012 H | 2011 | 2010 |
Selected Per-Share Data |
|
|
|
|
|
Net asset value, beginning of period | $ 43.97 | $ 38.12 | $ 43.05 | $ 35.32 | $ 17.35 |
Income from Investment Operations |
|
|
|
|
|
Net investment income (loss)B | .12 | .21 E | .05 | .17 F | (.07) |
Net realized and unrealized gain (loss) | 18.28 | 6.44 | .46 | 7.68 | 18.04 |
Total from investment operations | 18.40 | 6.65 | .51 | 7.85 | 17.97 |
Distributions from net investment income | (.06) | (.15) | (.05) | (.13) | - |
Distributions from net realized gain | (1.30) | (.66) | (5.39) | - | - |
Total distributions | (1.36) | (.80) J | (5.44) | (.13) | - |
Redemption fees added to paid in capital B | .01 | - I | - I | .01 | - I |
Net asset value, end of period | $ 61.02 | $ 43.97 | $ 38.12 | $ 43.05 | $ 35.32 |
Total Return A | 42.26% | 17.62% | 2.01% | 22.26% | 103.57% |
Ratios to Average Net Assets C,G |
|
|
|
|
|
Expenses before reductions | .87% | .94% | .96% | .92% | 1.05% |
Expenses net of fee waivers, if any | .87% | .94% | .96% | .92% | 1.05% |
Expenses net of all reductions | .86% | .92% | .95% | .91% | 1.01% |
Net investment income (loss) | .22% | .54% E | .12% | .43% F | (.28)% |
Supplemental Data |
|
|
|
|
|
Net assets, end of period (000 omitted) | $ 350,960 | $ 90,837 | $ 72,652 | $ 113,471 | $ 94,425 |
Portfolio turnover rate D | 125% | 74% | 102% | 161% | 165% |
A Total returns would have been lower if certain expenses had not been reduced during the applicable periods shown. B Calculated based on average shares outstanding during the period. C Fees and expenses of any underlying Fidelity Central Funds are not included in the Fund's expense ratio. The Fund indirectly bears its proportionate share of the expenses of any underlying Fidelity Central Funds. D Amount does not include the portfolio activity of any underlying Fidelity Central Funds. E Investment income per share reflects a large, non-recurring dividend which amounted to $.07 per share. Excluding this non-recurring dividend, the ratio of net investment income (loss) to average net assets would have been ..35%. F Investment income per share reflects a large, non-recurring dividend which amounted to $.12 per share. Excluding this non-recurring dividend, the ratio of net investment income (loss) to average net assets would have been .14%. G Expense ratios reflect operating expenses of the Fund. Expenses before reductions do not reflect amounts reimbursed by the investment adviser or reductions from brokerage service arrangements or reductions from other expense offset arrangements and do not represent the amount paid by the Fund during periods when reimbursements or reductions occur. Expenses net of fee waivers reflect expenses after reimbursement by the investment adviser but prior to reductions from brokerage service arrangements or other expense offset arrangements. Expenses net of all reductions represent the net expenses paid by the Fund. H For the year ended February 29. I Amount represents less than $.01 per share. J Total distributions of $.80 per share is comprised of distributions from net investment income of $.147 and distributions from net realized gain of $.655 per share. |
See accompanying notes which are an integral part of the financial statements.
Annual Report
Defense and Aerospace Portfolio
Performance: The Bottom Line
Average annual total return reflects the change in the value of an investment, assuming reinvestment of the fund's distributions from dividend income and capital gains (the profits earned upon the sale of securities that have grown in value, if any) and assuming a constant rate of performance each year. The $10,000 table and the fund's returns do not reflect the deduction of taxes that a shareholder would pay on fund distributions or the redemption of fund shares. During periods of reimbursement by Fidelity, a fund's total return will be greater than it would be had the reimbursement not occurred. How a fund did yesterday is no guarantee of how it will do tomorrow.
Average Annual Total Returns
Periods ended February 28, 2014 | Past 1 | Past 5 | Past 10 |
Defense and Aerospace Portfolio | 40.85% | 28.30% | 12.61% |
$10,000 Over 10 Years
Let's say hypothetically that $10,000 was invested in Defense and Aerospace Portfolio on February 29, 2004. The chart shows how the value of your investment would have changed, and also shows how the S&P 500 Index performed over the same period.
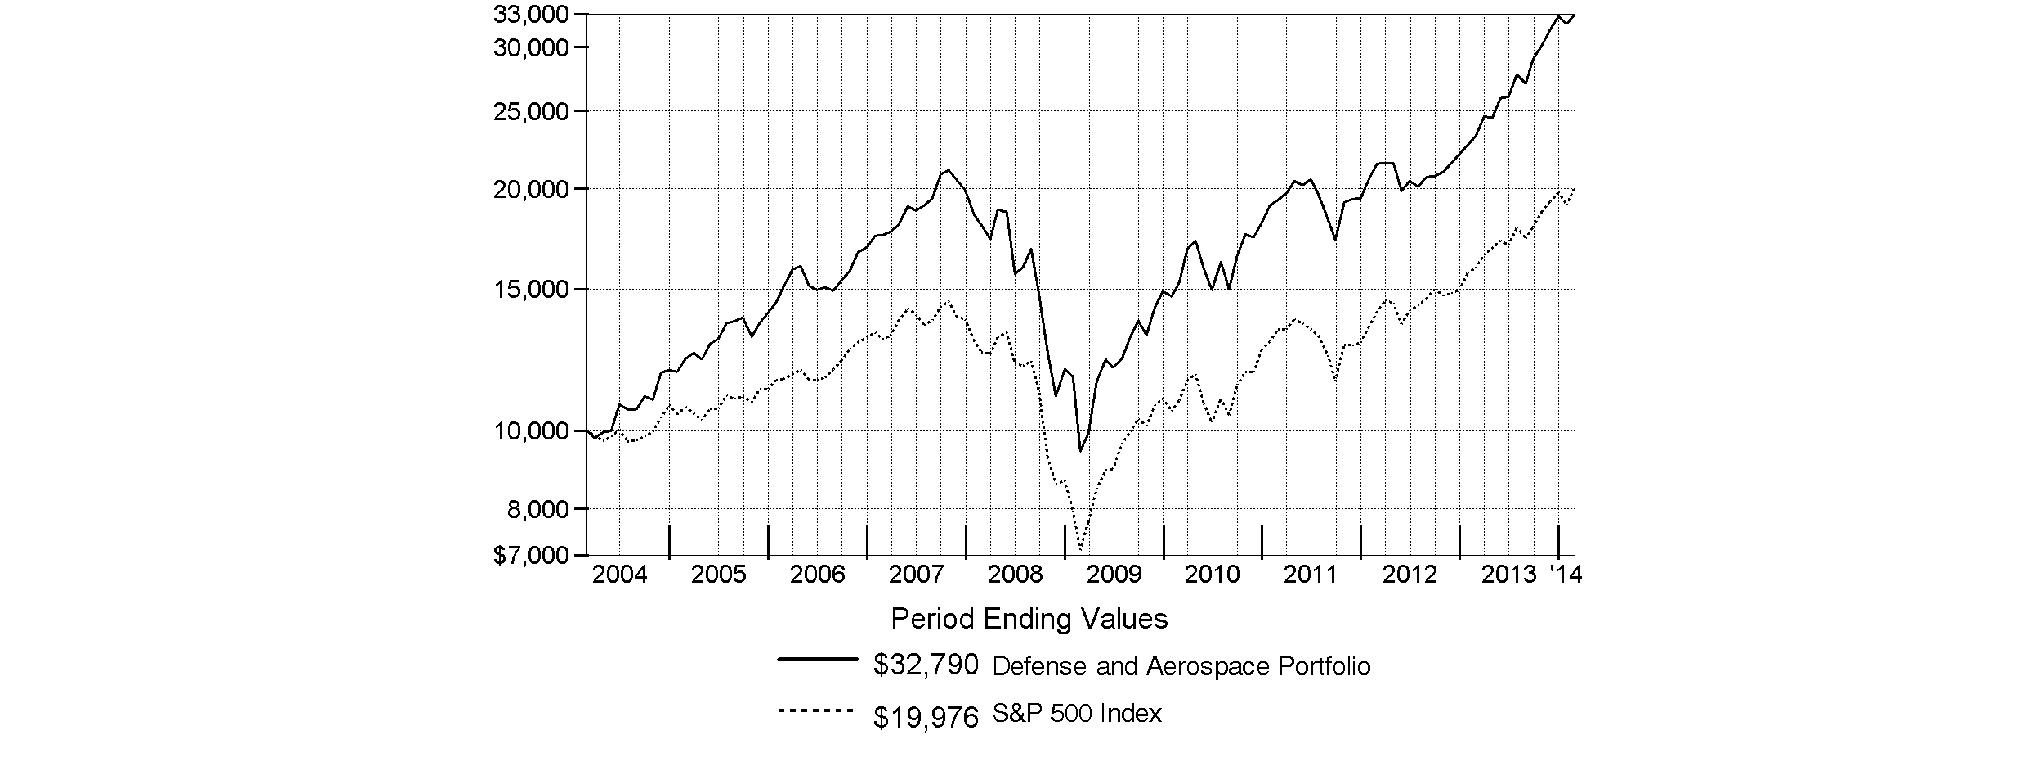
Annual Report
Defense and Aerospace Portfolio
Management's Discussion of Fund Performance
Market Recap: Stocks overcame fears of higher interest rates - not to mention their worst January in four years - to finish sharply higher for the 12 months ending February 28, 2014. The broad S&P 500® Index and the blue-chip Dow Jones Industrial AverageSM gained 25.37% and 19.01%, respectively, amid generally favorable earnings reports and accommodative monetary policies worldwide. Performance generally increased along the risk spectrum, with smaller-cap and growth strategies leading the way. An ebullient market helped the growth-oriented Nasdaq Composite Index® to a 38.10% period gain, for example. On the other hand, both cyclical and defensive stocks had representation in the top-performing industry sectors: returns were highest in health care and consumer discretionary; lowest in utilities and telecommunication services. From a macroeconomic perspective, data still points to slow but steady improvement in the U.S., and Europe's recession may well be over. Reports from China have disappointed, but continue to suggest a relatively soft landing there. Mixed signals from the U.S. Federal Reserve as to when it might curtail its stimulative bond buying kept markets in flux during the spring and summer. Stocks regained momentum in October despite a federal budget impasse and brief government shutdown, and lower volatility prevailed through year-end. Shedding new-year concerns about China's economy, an emerging-markets sell-off and confirmation (at last) of Fed tapering - alongside confirmation of a presumably dovish Janet Yellen as new Fed chair - February saw stocks back in record territory, bearing down on the five-year anniversary of the market's bottom.
Comments from Douglas Scott, Portfolio Manager of Defense and Aerospace Portfolio: For the year, the fund returned 40.85%, significantly trailing the 54.80% gain of the MSCI® U.S. IMI Aerospace & Defense 25-50 Index but handily beating the S&P 500®. Versus the broader market, defense & aerospace stocks benefited from surprising strength on the defense side and robust fundamentals in the aerospace industry. Compared with the MSCI industry index, significantly underweighting the strong-performing shares of four major defense firms in the index - Northrop Grumman, Lockheed Martin, Raytheon and General Dynamics - and ultimately selling all but Raytheon - hurt the fund's results. Additionally, several key picks on the aerospace side issued disappointing financial forecasts near the end of the period. Two of these were non-index positions in U.K. stocks, including Rolls-Royce Holdings, the fund's biggest relative detractor. The company, primarily known as a maker of engines for large commercial airliners and advanced military aircraft, suffered a sell-off in its shares after issuing disappointing 2014 financial guidance in mid-February, and I sold this stock. Another U.K.-based detractor was aerospace components supplier Meggitt. A strengthening British pound versus the U.S. dollar was partly to blame for the misfortunes of Rolls-Royce and Meggitt, as both firms' costs are recorded in British pounds, while their revenues are primarily booked in dollars. I'll also mention a large overweighting that I built in Triumph Group, another aerospace components supplier. Lastly, a cash position averaging roughly 3% held back the portfolio's results in a strongly rising market. Conversely, underweighting major benchmark component Honeywell International was a timely decision, as this stock posted a double-digit gain but lagged our industry benchmark. The firm makes aerospace components but also has exposure to building sensing and security systems. An overweighting in shipbuilder Huntington Ingalls Industries paid off nicely, as did an overweighting in HEICO, a manufacturer of jet engine and aircraft replacement parts.
The views expressed above reflect those of the portfolio manager(s) only through the end of the period as stated on the cover of this report and do not necessarily represent the views of Fidelity or any other person in the Fidelity organization. Any such views are subject to change at any time based upon market or other conditions and Fidelity disclaims any responsibility to update such views. These views may not be relied on as investment advice and, because investment decisions for a Fidelity fund are based on numerous factors, may not be relied on as an indication of trading intent on behalf of any Fidelity fund.
Annual Report
Defense and Aerospace Portfolio
Investment Changes (Unaudited)
Top Ten Stocks as of February 28, 2014 | ||
| % of fund's | % of fund's net assets |
United Technologies Corp. | 22.3 | 18.9 |
The Boeing Co. | 16.5 | 15.5 |
Huntington Ingalls Industries, Inc. | 5.8 | 2.2 |
Textron, Inc. | 5.0 | 4.6 |
Safran SA | 4.6 | 2.2 |
Meggitt PLC | 4.4 | 4.3 |
Triumph Group, Inc. | 4.4 | 3.3 |
Honeywell International, Inc. | 4.3 | 4.4 |
Exelis, Inc. | 4.0 | 0.0 |
Teledyne Technologies, Inc. | 3.9 | 4.3 |
| 75.2 | |
Top Industries (% of fund's net assets) | |||
As of February 28, 2014 | |||
| Aerospace & Defense | 97.4% |
|
 | Chemicals | 1.4% |
|
 | Metals & Mining | 0.8% |
|
| Electrical Equipment | 0.0%† |
|
| All Others* | 0.4% |
|

As of August 31, 2013 | |||
| Aerospace & Defense | 90.9% |
|
| Electrical Equipment | 2.7% |
|
| Metals & Mining | 1.6% |
|
| Chemicals | 0.9% |
|
| IT Services | 0.5% |
|
| All Others* | 3.4% |
|

* Includes short-term investments and net other assets (liabilities). |
† Amount represents less than 0.1% |
Annual Report
Defense and Aerospace Portfolio
Investments February 28, 2014
Showing Percentage of Net Assets
Common Stocks - 99.6% | |||
Shares | Value | ||
AEROSPACE & DEFENSE - 97.4% | |||
Aerospace & Defense - 97.4% | |||
Alliant Techsystems, Inc. | 271,843 | $ 36,641,718 | |
BAE Systems PLC | 3,838,697 | 26,413,022 | |
Esterline Technologies Corp. (a) | 300,934 | 32,410,592 | |
Exelis, Inc. | 2,027,415 | 41,420,088 | |
HEICO Corp. | 275,425 | 17,128,681 | |
Honeywell International, Inc. | 464,676 | 43,884,001 | |
Huntington Ingalls Industries, Inc. | 591,876 | 59,974,795 | |
L-3 Communications Holdings, Inc. | 337,418 | 38,938,037 | |
Meggitt PLC | 5,351,087 | 45,161,740 | |
Precision Castparts Corp. | 66,494 | 17,147,473 | |
Raytheon Co. | 186,756 | 18,285,280 | |
Safran SA | 674,000 | 47,455,735 | |
SIFCO Industries, Inc. | 8,145 | 215,843 | |
Teledyne Technologies, Inc. (a) | 409,326 | 40,105,761 | |
Textron, Inc. | 1,287,300 | 51,105,810 | |
The Boeing Co. | 1,310,031 | 168,889,197 | |
TransDigm Group, Inc. | 217,933 | 38,822,585 | |
Triumph Group, Inc. | 690,535 | 45,022,882 | |
United Technologies Corp. | 1,948,001 | 227,955,076 | |
| 996,978,316 | ||
CHEMICALS - 1.4% | |||
Specialty Chemicals - 1.4% | |||
Cytec Industries, Inc. | 144,716 | 13,700,264 | |
| |||
Shares | Value | ||
ELECTRICAL EQUIPMENT - 0.0% | |||
Electrical Components & Equipment - 0.0% | |||
AMETEK, Inc. | 599 | $ 31,891 | |
METALS & MINING - 0.8% | |||
Steel - 0.8% | |||
Carpenter Technology Corp. | 135,200 | 7,997,080 | |
TOTAL COMMON STOCKS (Cost $724,076,037) |
| ||
Nonconvertible Preferred Stocks - 0.0% | |||
|
|
|
|
AEROSPACE & DEFENSE - 0.0% | |||
Aerospace & Defense - 0.0% | |||
Rolls-Royce Group PLC | 177,567,124 |
| |
TOTAL INVESTMENT PORTFOLIO - 99.6% (Cost $724,364,282) | 1,019,004,896 | ||
NET OTHER ASSETS (LIABILITIES) - 0.4% | 4,388,235 | ||
NET ASSETS - 100% | $ 1,023,393,131 | ||
Legend |
(a) Non-income producing |
Affiliated Central Funds |
Information regarding fiscal year to date income earned by the Fund from investments in Fidelity Central Funds is as follows: |
Fund | Income earned |
Fidelity Cash Central Fund | $ 26,426 |
Fidelity Securities Lending Cash Central Fund | 39,485 |
Total | $ 65,911 |
Other Information |
All investments are categorized as Level 1 under the Fair Value Hierarchy. The inputs or methodology used for valuing securities may not be an indication of the risk associated with investing in those securities. For more information on valuation inputs, please refer to the Investment Valuation section in the accompanying Notes to Financial Statements. |
Distribution of investments by country or territory of incorporation, as a percentage of total net assets, is as follows (Unaudited): |
United States of America | 88.4% |
United Kingdom | 7.0% |
France | 4.6% |
| 100.0% |
See accompanying notes which are an integral part of the financial statements.
Annual Report
Defense and Aerospace Portfolio
Financial Statements
Statement of Assets and Liabilities
| February 28, 2014 | |
|
|
|
Assets | ||
Investment in securities, at value - See accompanying schedule: Unaffiliated issuers (cost $724,364,282) |
| $ 1,019,004,896 |
Cash |
| 267 |
Receivable for investments sold | 11,847,538 | |
Receivable for fund shares sold | 1,530,159 | |
Dividends receivable | 2,714,326 | |
Distributions receivable from Fidelity Central Funds | 406 | |
Prepaid expenses | 3,981 | |
Other receivables | 10,000 | |
Total assets | 1,035,111,573 | |
|
|
|
Liabilities | ||
Payable for fund shares redeemed | $ 5,158,666 | |
Accrued management fee | 466,697 | |
Notes payable to affiliates | 5,847,000 | |
Other affiliated payables | 191,564 | |
Other payables and accrued expenses | 54,515 | |
Total liabilities | 11,718,442 | |
|
|
|
Net Assets | $ 1,023,393,131 | |
Net Assets consist of: |
| |
Paid in capital | $ 692,383,370 | |
Undistributed net investment income | 1,569,587 | |
Accumulated undistributed net realized gain (loss) on investments and foreign currency transactions | 34,799,560 | |
Net unrealized appreciation (depreciation) on investments | 294,640,614 | |
Net Assets, for 8,350,631 shares outstanding | $ 1,023,393,131 | |
Net Asset Value, offering price and redemption price per share ($1,023,393,131 ÷ 8,350,631 shares) | $ 122.55 | |
Statement of Operations
| Year ended February 28, 2014 | |
|
|
|
Investment Income |
|
|
Dividends |
| $ 11,974,848 |
Income from Fidelity Central Funds (including $39,485 from security lending) |
| 65,911 |
Total income |
| 12,040,759 |
|
|
|
Expenses | ||
Management fee | $ 4,426,180 | |
Transfer agent fees | 1,633,013 | |
Accounting and security lending fees | 277,665 | |
Custodian fees and expenses | 17,165 | |
Independent compensation | 15,473 | |
Registration fees | 75,168 | |
Audit | 40,358 | |
Legal | 11,726 | |
Interest | 213 | |
Miscellaneous | 8,784 | |
Total expenses before reductions | 6,505,745 | |
Expense reductions | (18,621) | 6,487,124 |
Net investment income (loss) | 5,553,635 | |
Realized and Unrealized Gain (Loss) Net realized gain (loss) on: | ||
Investment securities: |
|
|
Unaffiliated issuers | 82,240,513 | |
Foreign currency transactions | 28,070 | |
Total net realized gain (loss) |
| 82,268,583 |
Change in net unrealized appreciation (depreciation) on investment securities | 174,135,772 | |
Net gain (loss) | 256,404,355 | |
Net in net assets resulting from operations | $ 261,957,990 | |
See accompanying notes which are an integral part of the financial statements.
Annual Report
Defense and Aerospace Portfolio
Financial Statements - continued
Statement of Changes in Net Assets
| Year ended | Year ended |
Increase (Decrease) in Net Assets |
|
|
Operations |
|
|
Net investment income (loss) | $ 5,553,635 | $ 8,732,231 |
Net realized gain (loss) | 82,268,583 | 6,400,550 |
Change in net unrealized appreciation (depreciation) | 174,135,772 | 32,785,011 |
Net in net assets resulting from operations | 261,957,990 | 47,917,792 |
Distributions to from net investment income | (4,764,402) | (8,717,067) |
Distributions to from net realized gain | (42,855,160) | (1,406,058) |
Total distributions | (47,619,562) | (10,123,125) |
Share transactions | 401,810,559 | 121,232,601 |
Reinvestment of distributions | 45,690,950 | 9,789,696 |
Cost of shares redeemed | (245,341,421) | (243,116,903) |
Net increase (decrease) in net assets resulting from share transactions | 202,160,088 | (112,094,606) |
Redemption fees | 35,338 | 4,868 |
Total increase (decrease) in net assets | 416,533,854 | (74,295,071) |
|
|
|
Net Assets | ||
Beginning of period | 606,859,277 | 681,154,348 |
End of period (including undistributed net investment income of $1,569,587 and undistributed net investment income of $1,049,954, respectively) | $ 1,023,393,131 | $ 606,859,277 |
Other Information Shares | ||
Sold | 3,564,948 | 1,438,094 |
Issued in reinvestment of distributions | 390,076 | 113,226 |
Redeemed | (2,219,786) | (2,854,335) |
Net increase (decrease) | 1,735,238 | (1,303,015) |
Financial Highlights
Years ended February 28, | 2014 | 2013 | 2012 H | 2011 | 2010 |
Selected Per-Share Data |
|
|
|
|
|
Net asset value, beginning of period | $ 91.73 | $ 86.02 | $ 78.21 | $ 62.05 | $ 38.96 |
Income from Investment Operations |
|
|
|
|
|
Net investment income (loss) B | .77 | 1.17 E | .56 | .42 | .73 F |
Net realized and unrealized gain (loss) | 36.34 | 5.94 | 7.87 | 16.17 | 23.32 |
Total from investment operations | 37.11 | 7.11 | 8.43 | 16.59 | 24.05 |
Distributions from net investment income | (.64) | (1.21) | (.51) | (.43) | (.96) |
Distributions from net realized gain | (5.65) | (.19) | (.12) | - | - |
Total distributions | (6.29) | (1.40) | (.62) J | (.43) | (.96) |
Redemption fees added to paid in capital B,I | - | - | - | - | - |
Net asset value, end of period | $ 122.55 | $ 91.73 | $ 86.02 | $ 78.21 | $ 62.05 |
Total Return A | 40.85% | 8.37% | 10.87% | 26.79% | 62.05% |
Ratios to Average Net Assets C,G |
|
|
|
|
|
Expenses before reductions | .81% | .84% | .86% | .88% | .95% |
Expenses net of fee waivers, if any | .81% | .84% | .86% | .88% | .95% |
Expenses net of all reductions | .81% | .83% | .86% | .88% | .94% |
Net investment income (loss) | .70% | 1.39% E | .72% | .62% | 1.39% F |
Supplemental Data |
|
|
|
|
|
Net assets, end of period (000 omitted) | $ 1,023,393 | $ 606,859 | $ 681,154 | $ 677,961 | $ 609,095 |
Portfolio turnover rate D | 48% | 56% | 56% | 43% | 70% |
A Total returns would have been lower if certain expenses had not been reduced during the applicable periods shown. B Calculated based on average shares outstanding during the period. C Fees and expenses of any underlying Fidelity Central Funds are not included in the Fund's expense ratio. The Fund indirectly bears its proportionate share of the expenses of any underlying Fidelity Central Funds. D Amount does not include the portfolio activity of any underlying Fidelity Central Funds. E Investment income per share reflects a large, non-recurring dividend which amounted to $.34 per share. Excluding this non-recurring dividend, the ratio of net investment income (loss) to average net assets would have been ..99%. F Investment income per share reflects a large, non-recurring dividend which amounted to $.20 per share. Excluding this non-recurring dividend, the ratio of net investment income (loss) to average net assets would have been 1.01%. G Expense ratios reflect operating expenses of the Fund. Expenses before reductions do not reflect amounts reimbursed by the investment adviser or reductions from brokerage service arrangements or reductions from other expense offset arrangements and do not represent the amount paid by the Fund during periods when reimbursements or reductions occur. Expenses net of fee waivers reflect expenses after reimbursement by the investment adviser but prior to reductions from brokerage service arrangements or other expense offset arrangements. Expenses net of all reductions represent the net expenses paid by the Fund. H For the year ended February 29. I Amount represents less than $.01 per share. J Total distributions of $.623 per share is comprised of distributions from net investment income of $.508 and distributions from net realized gain of $.115 per share. |
See accompanying notes which are an integral part of the financial statements.
Annual Report
Environment and Alternative Energy Portfolio
Performance: The Bottom Line
Average annual total return reflects the change in the value of an investment, assuming reinvestment of the fund's distributions from dividend income and capital gains (the profits earned upon the sale of securities that have grown in value, if any) and assuming a constant rate of performance each year. The $10,000 table and the fund's returns do not reflect the deduction of taxes that a shareholder would pay on fund distributions or the redemption of fund shares. During periods of reimbursement by Fidelity, a fund's total return will be greater than it would be had the reimbursement not occurred. How a fund did yesterday is no guarantee of how it will do tomorrow.
Average Annual Total Returns
Periods ended February 28, 2014 | Past 1 | Past 5 | Past 10 |
Environment and Alternative Energy Portfolio A | 29.97% | 17.36% | 6.34% |
A Prior to July 1, 2010, Environment and Alternative Energy Portfolio was named Environmental Portfolio, and the fund operated under certain different investment policies and compared its performance to a different additional index. The fund's historical performance may not represent its current investment policies.
$10,000 Over 10 Years
Let's say hypothetically that $10,000 was invested in Environment and Alternative Energy Portfolio on February 29, 2004. The chart shows how the value of your investment would have changed, and also shows how the S&P 500 Index performed over the same period.
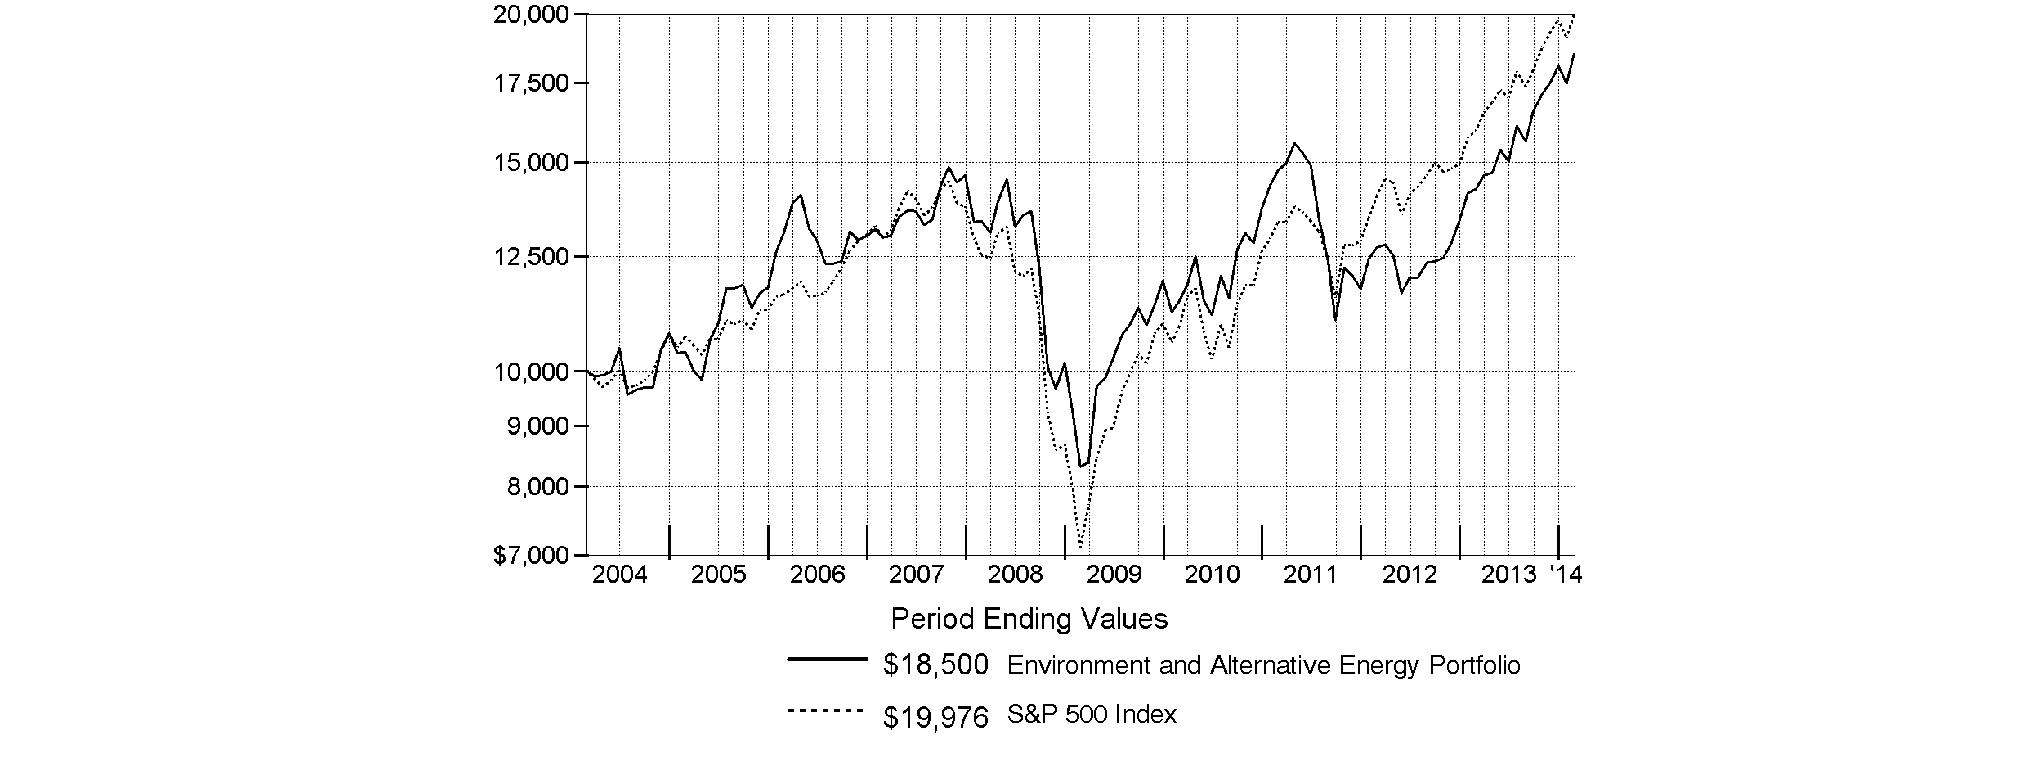
Annual Report
Environment and Alternative Energy Portfolio
Management's Discussion of Fund Performance
Market Recap: Stocks overcame fears of higher interest rates - not to mention their worst January in four years - to finish sharply higher for the 12 months ending February 28, 2014. The broad S&P 500® Index and the blue-chip Dow Jones Industrial AverageSM gained 25.37% and 19.01%, respectively, amid generally favorable earnings reports and accommodative monetary policies worldwide. Performance generally increased along the risk spectrum, with smaller-cap and growth strategies leading the way. An ebullient market helped the growth-oriented Nasdaq Composite Index® to a 38.10% period gain, for example. On the other hand, both cyclical and defensive stocks had representation in the top-performing industry sectors: returns were highest in health care and consumer discretionary; lowest in utilities and telecommunication services. From a macroeconomic perspective, data still points to slow but steady improvement in the U.S., and Europe's recession may well be over. Reports from China have disappointed, but continue to suggest a relatively soft landing there. Mixed signals from the U.S. Federal Reserve as to when it might curtail its stimulative bond buying kept markets in flux during the spring and summer. Stocks regained momentum in October despite a federal budget impasse and brief government shutdown, and lower volatility prevailed through year-end. Shedding new-year concerns about China's economy, an emerging-markets sell-off and confirmation (at last) of Fed tapering - alongside confirmation of a presumably dovish Janet Yellen as new Fed chair - February saw stocks back in record territory, bearing down on the five-year anniversary of the market's bottom.
Comments from Anna Davydova, Portfolio Manager of Environment and Alternative Energy Portfolio: For the year, the fund returned 29.97%, underperforming the 31.87% gain of its industry benchmark - the FTSE® Environmental Opportunities & Alternative Energy Index - but topping the S&P 500®. The 450-stock FTSE® index outperformed the S&P 500 because it has significant industrials exposure, and industrials outpaced the broader market due largely to an improving U.S. economy and sector valuations. The fund slightly lagged its benchmark due mostly to an overweighted position in the underperforming environmental & facility services sector. It also missed a rally in electric car manufacturer Tesla Motors. In life sciences tools & services, not owning laboratory instruments and technology provider Thermo Fisher Scientific also hurt performance versus the index. On the plus side, positioning in the industrial machinery and semiconductor equipment segments - more specifically companies involved in solar - helped the most. In the former, owning flow-control equipment companies Xylem and Pentair proved beneficial. An overweighting in solar semiconductor equipment company GT Advanced Technologies was by far the biggest contributor.
The views expressed above reflect those of the portfolio manager(s) only through the end of the period as stated on the cover of this report and do not necessarily represent the views of Fidelity or any other person in the Fidelity organization. Any such views are subject to change at any time based upon market or other conditions and Fidelity disclaims any responsibility to update such views. These views may not be relied on as investment advice and, because investment decisions for a Fidelity fund are based on numerous factors, may not be relied on as an indication of trading intent on behalf of any Fidelity fund.
Annual Report
Environment and Alternative Energy Portfolio
Investment Changes (Unaudited)
Top Ten Stocks as of February 28, 2014 | ||
| % of fund's | % of fund's net assets |
Danaher Corp. | 8.1 | 8.3 |
Emerson Electric Co. | 6.5 | 7.2 |
Air Products & Chemicals, Inc. | 5.3 | 5.4 |
Ecolab, Inc. | 4.8 | 4.9 |
Eaton Corp. PLC | 4.5 | 4.6 |
Iberdrola SA | 4.5 | 4.3 |
Pentair Ltd. | 4.2 | 3.3 |
Johnson Controls, Inc. | 4.1 | 3.6 |
Ashland, Inc. | 4.0 | 4.5 |
Stericycle, Inc. | 3.6 | 4.2 |
| 49.6 | |
Top Industries (% of fund's net assets) | |||
As of February 28, 2014 | |||
| Energy Efficiency | 32.2% |
|
| Water Infrastructure & Technologies | 24.2% |
|
| Environmental Support Services | 14.2% |
|
| Renewable & Alternative Energy | 14.0% |
|
| Waste Management & Technologies | 11.7% |
|
| All Others* | 3.7% |
|

As of August 31, 2013 | |||
| Energy Efficiency | 29.8% |
|
| Water Infrastructure & Technologies | 20.4% |
|
| Waste Management & Technologies | 16.1% |
|
| Renewable & Alternative Energy | 14.3% |
|
| Environmental Support Services | 12.7% |
|
| All Others* | 6.7% |
|

* Includes short-term investments and net other assets (liabilities). |
Annual Report
Environment and Alternative Energy Portfolio
Investments February 28, 2014
Showing Percentage of Net Assets
Common Stocks - 98.7% | |||
Shares | Value | ||
Energy Efficiency - 31.9% | |||
Buildings Energy Efficiency - 11.7% | |||
Allegion Plc | 19,000 | $ 1,032,650 | |
Cree, Inc. (a) | 26,600 | 1,634,038 | |
Ingersoll-Rand PLC | 48,300 | 2,953,062 | |
Johnson Controls, Inc. | 86,500 | 4,273,100 | |
Owens Corning | 29,500 | 1,349,920 | |
Zumtobel AG | 30,600 | 776,319 | |
TOTAL BUILDINGS ENERGY EFFICIENCY | 12,019,089 | ||
Diversified Energy Efficiency - 1.1% | |||
Corning, Inc. | 57,800 | 1,113,806 | |
Industrial Energy Efficiency - 1.3% | |||
ON Semiconductor Corp. (a) | 146,400 | 1,367,376 | |
Power Network Efficiency - 16.2% | |||
Eaton Corp. PLC | 62,100 | 4,639,491 | |
Emerson Electric Co. | 102,700 | 6,702,202 | |
Hubbell, Inc. Class B | 30,600 | 3,657,924 | |
Itron, Inc. (a) | 15,000 | 525,000 | |
Quanta Services, Inc. (a) | 32,100 | 1,130,241 | |
TOTAL POWER NETWORK EFFICIENCY | 16,654,858 | ||
Transport Energy Efficiency - 1.6% | |||
Curtiss-Wright Corp. | 16,700 | 1,138,272 | |
Delphi Automotive PLC | 8,000 | 532,560 | |
TOTAL TRANSPORT ENERGY EFFICIENCY | 1,670,832 | ||
TOTAL ENERGY EFFICIENCY | 32,825,961 | ||
Environmental Support Services - 14.2% | |||
Diversified Environmental - 10.8% | |||
3M Co. | 15,300 | 2,061,369 | |
Air Products & Chemicals, Inc. | 45,000 | 5,459,400 | |
Parker Hannifin Corp. | 29,700 | 3,580,335 | |
TOTAL DIVERSIFIED ENVIRONMENTAL | 11,101,104 | ||
Environmental Consultancies - 3.4% | |||
AECOM Technology Corp. (a) | 20,700 | 661,158 | |
Jacobs Engineering Group, Inc. (a) | 40,100 | 2,432,065 | |
Tetra Tech, Inc. (a) | 14,200 | 410,096 | |
TOTAL ENVIRONMENTAL CONSULTANCIES | 3,503,319 | ||
TOTAL ENVIRONMENTAL SUPPORT SERVICES | 14,604,423 | ||
| |||
Shares | Value | ||
Pollution Control - 2.7% | |||
Pollution Control Solutions - 2.7% | |||
Cummins, Inc. | 7,200 | $ 1,050,624 | |
Tenneco, Inc. (a) | 28,500 | 1,716,840 | |
TOTAL POLLUTION CONTROL SOLUTIONS | 2,767,464 | ||
Renewable & Alternative Energy - 14.0% | |||
Biofuels - 0.5% | |||
Amyris, Inc. (a)(d) | 116,600 | 532,862 | |
Renewable Energy Developers and Independent Power | |||
Bunge Ltd. | 20,400 | 1,624,044 | |
Covanta Holding Corp. | 111,200 | 2,001,600 | |
EDP Renovaveis SA | 165,675 | 1,070,457 | |
Empresa Nacional de Electricidad SA sponsored ADR (d) | 13,400 | 547,524 | |
Iberdrola SA (d) | 691,720 | 4,599,181 | |
RENEWABLE ENERGY DEVELOPERS AND INDEPENDENT POWER PRODUCERS | 9,842,806 | ||
Solar Energy Generation Equipment - 3.9% | |||
First Solar, Inc. (a) | 11,800 | 673,426 | |
GT Advanced Technologies, Inc. (a)(d) | 97,500 | 1,397,175 | |
SolarCity Corp. (a)(d) | 9,600 | 815,616 | |
SunEdison, Inc. (a) | 63,900 | 1,173,204 | |
TOTAL SOLAR ENERGY GENERATION EQUIPMENT | 4,059,421 | ||
TOTAL RENEWABLE & ALTERNATIVE ENERGY | 14,435,089 | ||
Waste Management & Technologies - 11.7% | |||
General Waste Management - 3.9% | |||
Progressive Waste Solution Ltd. (Canada) (d) | 37,900 | 958,367 | |
Republic Services, Inc. | 53,000 | 1,807,830 | |
Waste Connections, Inc. | 27,500 | 1,189,925 | |
TOTAL GENERAL WASTE MANAGEMENT | 3,956,122 | ||
Hazardous Waste Management - 5.5% | |||
Clean Harbors, Inc. (a) | 26,300 | 1,242,938 | |
Stericycle, Inc. (a) | 32,100 | 3,659,400 | |
U.S. Ecology, Inc. | 21,100 | 758,123 | |
TOTAL HAZARDOUS WASTE MANAGEMENT | 5,660,461 | ||
Recycling and Value Added Waste Processing - 2.3% | |||
Commercial Metals Co. | 64,900 | 1,255,815 | |
Common Stocks - continued | |||
Shares | Value | ||
Waste Management & Technologies - continued | |||
Recycling and Value Added Waste Processing - continued | |||
Interface, Inc. | 32,100 | $ 618,246 | |
Schnitzer Steel Industries, Inc. Class A | 20,900 | 530,233 | |
TOTAL RECYCLING AND VALUE ADDED WASTE PROCESSING | 2,404,294 | ||
TOTAL WASTE MANAGEMENT & TECHNOLOGIES | 12,020,877 | ||
Water Infrastructure & Technologies - 24.2% | |||
Water Infrastructure - 7.3% | |||
Aegion Corp. (a) | 52,400 | 1,213,060 | |
Pentair Ltd. | 53,700 | 4,339,497 | |
Xylem, Inc. | 49,500 | 1,947,825 | |
TOTAL WATER INFRASTRUCTURE | 7,500,382 | ||
Water Treatment Equipment - 16.9% | |||
Ashland, Inc. | 43,700 | 4,123,969 | |
Danaher Corp. | 109,300 | 8,360,357 | |
Ecolab, Inc. | 46,000 | 4,956,500 | |
TOTAL WATER TREATMENT EQUIPMENT | 17,440,826 | ||
TOTAL WATER INFRASTRUCTURE & TECHNOLOGIES | 24,941,208 | ||
TOTAL COMMON STOCKS (Cost $75,920,303) |
| ||
Convertible Bonds - 0.3% | |||
|
|
|
|
Energy Efficiency - 0.3% | |||
Buildings Energy Efficiency - 0.3% | |||
Aspen Aerogels, Inc. 8% 6/1/14 (e) | 275,800 |
| |
Cash Equivalents - 8.2% | |||
Shares | Value | ||
Fidelity Cash Central Fund, 0.10% (b) | 978,762 | $ 978,762 | |
Fidelity Securities Lending Cash Central Fund, 0.09% (b)(c) | 7,421,580 | 7,421,580 | |
TOTAL CASH EQUIVALENTS (Cost $8,400,342) |
| ||
TOTAL INVESTMENT PORTFOLIO - 107.2% (Cost $84,596,445) | 110,271,164 | ||
NET OTHER ASSETS (LIABILITIES) - (7.2)% | (7,402,144) | ||
NET ASSETS - 100% | $ 102,869,020 | ||
Legend |
(a) Non-income producing |
(b) Affiliated fund that is generally available only to investment companies and other accounts managed by Fidelity Investments. The rate quoted is the annualized seven-day yield of the fund at period end. A complete unaudited listing of the fund's holdings as of its most recent quarter end is available upon request. In addition, each Fidelity Central Fund's financial statements, which are not covered by the Fund's Report of Independent Registered Public Accounting Firm, are available on the SEC's website or upon request. |
(c) Investment made with cash collateral received from securities on loan. |
(d) Security or a portion of the security is on loan at period end. |
(e) Restricted securities - Investment in securities not registered under the Securities Act of 1933 (excluding 144A issues). At the end of the period, the value of restricted securities (excluding 144A issues) amounted to $275,800 or 0.3% of net assets. |
Additional information on each restricted holding is as follows: |
Security | Acquisition Date | Acquisition Cost |
Aspen Aerogels, Inc. 8% 6/1/14 | 6/1/11 | $ 275,800 |
Affiliated Central Funds |
Information regarding fiscal year to date income earned by the Fund from investments in Fidelity Central Funds is as follows: |
Fund | Income earned |
Fidelity Cash Central Fund | $ 2,220 |
Fidelity Securities Lending Cash Central Fund | 36,992 |
Total | $ 39,212 |
Other Information |
The following is a summary of the inputs used, as of February 28, 2014, involving the Fund's assets and liabilities carried at fair value. The inputs or methodology used for valuing securities may not be an indication of the risk associated with investing in those securities. For more information on valuation inputs, and their aggregation into the levels used in the table below, please refer to the Investment Valuation section in the accompanying Notes to Financial Statements. |
Valuation Inputs at Reporting Date: | ||||
Description | Total | Level 1 | Level 2 | Level 3 |
Investments in Securities: | ||||
Common Stocks | $ 101,595,022 | $ 101,595,022 | $ - | $ - |
Convertible Bonds | 275,800 | - | - | 275,800 |
Money Market Funds | 8,400,342 | 8,400,342 | - | - |
Total Investments in Securities: | $ 110,271,164 | $ 109,995,364 | $ - | $ 275,800 |
Distribution of investments by country or territory of incorporation, as a percentage of total net assets, is as follows (Unaudited): |
United States of America | 77.6% |
Ireland | 8.4% |
Spain | 5.5% |
Switzerland | 4.2% |
Bermuda | 1.6% |
Others (Individually Less Than 1%) | 2.7% |
| 100.0% |
See accompanying notes which are an integral part of the financial statements.
Annual Report
Environment and Alternative Energy Portfolio
Financial Statements
Statement of Assets and Liabilities
| February 28, 2014 | |
|
|
|
Assets | ||
Investment in securities, at value (including securities loaned of $7,099,823) - See accompanying schedule: Unaffiliated issuers (cost $76,196,103) | $ 101,870,822 |
|
Fidelity Central Funds (cost $8,400,342) | 8,400,342 |
|
Total Investments (cost $84,596,445) |
| $ 110,271,164 |
Receivable for fund shares sold | 245,668 | |
Dividends receivable | 126,841 | |
Interest receivable | 66,458 | |
Distributions receivable from Fidelity Central Funds | 4,605 | |
Prepaid expenses | 406 | |
Other receivables | 276 | |
Total assets | 110,715,418 | |
|
|
|
Liabilities | ||
Payable for investments purchased | $ 200,882 | |
Payable for fund shares redeemed | 123,432 | |
Accrued management fee | 45,852 | |
Other affiliated payables | 24,845 | |
Other payables and accrued expenses | 29,807 | |
Collateral on securities loaned, at value | 7,421,580 | |
Total liabilities | 7,846,398 | |
|
|
|
Net Assets | $ 102,869,020 | |
Net Assets consist of: |
| |
Paid in capital | $ 83,204,759 | |
Distributions in excess of net investment income | (105,356) | |
Accumulated undistributed net realized gain (loss) on investments and foreign currency transactions | (5,905,156) | |
Net unrealized appreciation (depreciation) on investments and assets and liabilities in foreign currencies | 25,674,773 | |
Net Assets, for 4,404,018 shares outstanding | $ 102,869,020 | |
Net Asset Value, offering price and redemption price per share ($102,869,020 ÷ 4,404,018 shares) | $ 23.36 | |
Statement of Operations
| Year ended February 28, 2014 | |
|
|
|
Investment Income |
|
|
Dividends |
| $ 1,343,537 |
Interest |
| 27,863 |
Income from Fidelity Central Funds (including $36,992 from security lending) |
| 39,212 |
Total income |
| 1,410,612 |
|
|
|
Expenses | ||
Management fee | $ 468,462 | |
Transfer agent fees | 240,977 | |
Accounting and security lending fees | 33,297 | |
Custodian fees and expenses | 4,550 | |
Independent trustees' compensation | 1,613 | |
Registration fees | 19,932 | |
Audit | 52,200 | |
Legal | 1,303 | |
Miscellaneous | 1,087 | |
Total expenses before reductions | 823,421 | |
Expense reductions | (2,210) | 821,211 |
Net investment income (loss) | 589,401 | |
Realized and Unrealized Gain (Loss) Net realized gain (loss) on: | ||
Investment securities: |
|
|
Unaffiliated issuers | 5,379,101 | |
Foreign currency transactions | 219 | |
Total net realized gain (loss) |
| 5,379,320 |
Change in net unrealized appreciation (depreciation) on: Investment securities | 15,625,821 | |
Assets and liabilities in foreign currencies | 142 | |
Total change in net unrealized appreciation (depreciation) |
| 15,625,963 |
Net gain (loss) | 21,005,283 | |
Net increase (decrease) in net assets resulting from operations | $ 21,594,684 | |
See accompanying notes which are an integral part of the financial statements.
Annual Report
Fund Name
Financial Statements - continued
Statement of Changes in Net Assets
| Year ended | Year ended |
Increase (Decrease) in Net Assets |
|
|
Operations |
|
|
Net investment income (loss) | $ 589,401 | $ 763,729 |
Net realized gain (loss) | 5,379,320 | 179,273 |
Change in net unrealized appreciation (depreciation) | 15,625,963 | 7,347,724 |
Net increase (decrease) in net assets resulting from operations | 21,594,684 | 8,290,726 |
Distributions to shareholders from net investment income | (701,353) | (630,649) |
Share transactions | 41,113,758 | 25,657,131 |
Reinvestment of distributions | 672,436 | 608,268 |
Cost of shares redeemed | (41,831,872) | (29,853,602) |
Net increase (decrease) in net assets resulting from share transactions | (45,678) | (3,588,203) |
Redemption fees | 3,514 | 2,483 |
Total increase (decrease) in net assets | 20,851,167 | 4,074,357 |
|
|
|
Net Assets | ||
Beginning of period | 82,017,853 | 77,943,496 |
End of period (including distributions in excess of net investment income of $105,356 and undistributed net investment income of $122,028, respectively) | $ 102,869,020 | $ 82,017,853 |
Other Information Shares | ||
Sold | 1,933,973 | 1,538,263 |
Issued in reinvestment of distributions | 31,610 | 36,928 |
Redeemed | (2,087,703) | (1,825,673) |
Net increase (decrease) | (122,120) | (250,482) |
Financial Highlights
Years ended February 28, | 2014 | 2013 | 2012 F | 2011 | 2010 |
Selected Per-Share Data |
|
|
|
|
|
Net asset value, beginning of period | $ 18.12 | $ 16.32 | $ 19.19 | $ 14.94 | $ 10.94 |
Income from Investment Operations |
|
|
|
|
|
Net investment income (loss) B | .14 | .18 | .20 | .10 | .11 |
Net realized and unrealized gain (loss) | 5.27 | 1.77 | (2.88) | 4.22 | 4.03 |
Total from investment operations | 5.41 | 1.95 | (2.68) | 4.32 | 4.14 |
Distributions from net investment income | (.17) | (.15) | (.19) | (.07) | (.14) |
Redemption fees added to paid in capital B,G | - | - | - | - | - |
Net asset value, end of period | $ 23.36 | $ 18.12 | $ 16.32 | $ 19.19 | $ 14.94 |
Total Return A | 29.97% | 12.02% | (13.92)% | 28.96% | 37.77% |
Ratios to Average Net Assets C,E |
|
|
|
|
|
Expenses before reductions | .97% | .99% | 1.01% | 1.08% | 1.08% |
Expenses net of fee waivers, if any | .97% | .99% | 1.01% | 1.08% | 1.08% |
Expenses net of all reductions | .97% | .97% | 1.00% | 1.07% | 1.08% |
Net investment income (loss) | .70% | 1.10% | 1.15% | .59% | .82% |
Supplemental Data |
|
|
|
|
|
Net assets, end of period (000 omitted) | $ 102,869 | $ 82,018 | $ 77,943 | $ 96,864 | $ 47,186 |
Portfolio turnover rate D | 28% | 54% | 183% | 190% | 132% |
A Total returns would have been lower if certain expenses had not been reduced during the applicable periods shown. B Calculated based on average shares outstanding during the period. C Fees and expenses of any underlying Fidelity Central Funds are not included in the Fund's expense ratio. The Fund indirectly bears its proportionate share of the expenses of any underlying Fidelity Central Funds. D Amount does not include the portfolio activity of any underlying Fidelity Central Funds. E Expense ratios reflect operating expenses of the Fund. Expenses before reductions do not reflect amounts reimbursed by the investment adviser or reductions from brokerage service arrangements or reductions from other expense offset arrangements and do not represent the amount paid by the Fund during periods when reimbursements or reductions occur. Expenses net of fee waivers reflect expenses after reimbursement by the investment adviser but prior to reductions from brokerage service arrangements or other expense offset arrangements. Expenses net of all reductions represent the net expenses paid by the Fund. F For the year ended February 29. G Amount represents less than $.01 per share. |
See accompanying notes which are an integral part of the financial statements.
Annual Report
Industrial Equipment Portfolio
Performance: The Bottom Line
Average annual total return reflects the change in the value of an investment, assuming reinvestment of the fund's distributions from dividend income and capital gains (the profits earned upon the sale of securities that have grown in value, if any) and assuming a constant rate of performance each year. The $10,000 table and the fund's returns do not reflect the deduction of taxes that a shareholder would pay on fund distributions or the redemption of fund shares. During periods of reimbursement by Fidelity, a fund's total return will be greater than it would be had the reimbursement not occurred. How a fund did yesterday is no guarantee of how it will do tomorrow.
Average Annual Total Returns
Periods ended February 28, 2014 | Past 1 | Past 5 | Past 10 |
Industrial Equipment Portfolio | 24.37% | 29.61% | 9.89% |
$10,000 Over 10 Years
Let's say hypothetically that $10,000 was invested in Industrial Equipment Portfolio on February 29, 2004. The chart shows how the value of your investment would have changed, and also shows how the S&P 500 Index performed over the same period.
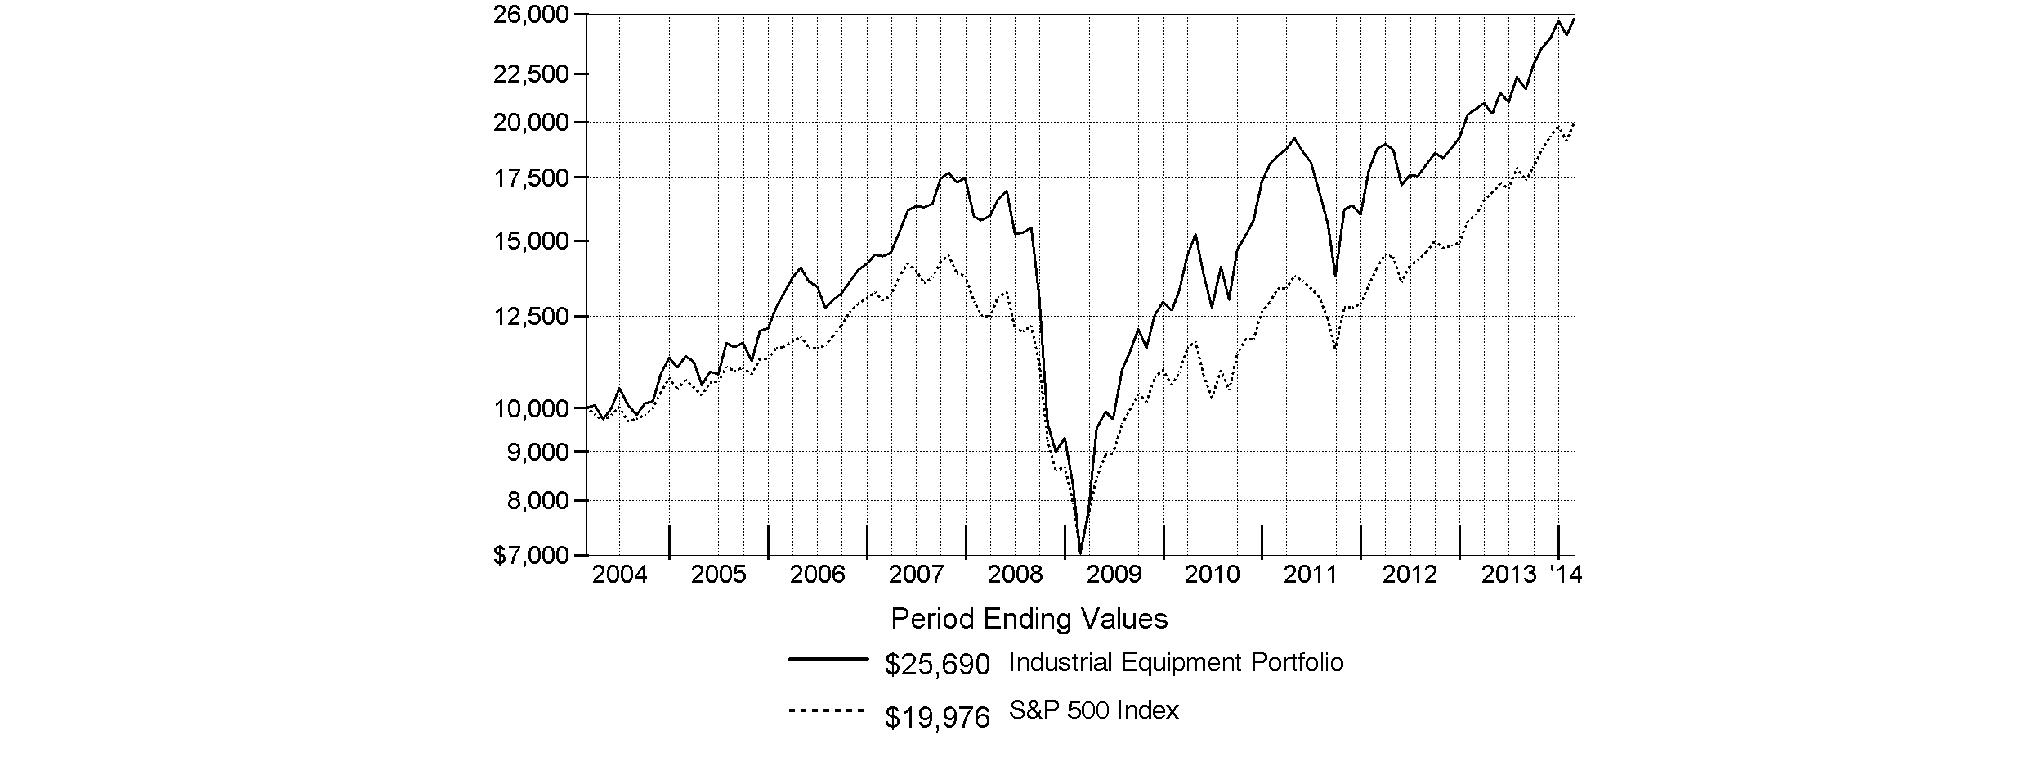
Annual Report
Industrial Equipment Portfolio
Management's Discussion of Fund Performance
Market Recap: Stocks overcame fears of higher interest rates - not to mention their worst January in four years - to finish sharply higher for the 12 months ending February 28, 2014. The broad S&P 500® Index and the blue-chip Dow Jones Industrial AverageSM gained 25.37% and 19.01%, respectively, amid generally favorable earnings reports and accommodative monetary policies worldwide. Performance generally increased along the risk spectrum, with smaller-cap and growth strategies leading the way. An ebullient market helped the growth-oriented Nasdaq Composite Index® to a 38.10% period gain, for example. On the other hand, both cyclical and defensive stocks had representation in the top-performing industry sectors: returns were highest in health care and consumer discretionary; lowest in utilities and telecommunication services. From a macroeconomic perspective, data still points to slow but steady improvement in the U.S., and Europe's recession may well be over. Reports from China have disappointed, but continue to suggest a relatively soft landing there. Mixed signals from the U.S. Federal Reserve as to when it might curtail its stimulative bond buying kept markets in flux during the spring and summer. Stocks regained momentum in October despite a federal budget impasse and brief government shutdown, and lower volatility prevailed through year-end. Shedding new-year concerns about China's economy, an emerging-markets sell-off and confirmation (at last) of Fed tapering - alongside confirmation of a presumably dovish Janet Yellen as new Fed chair - February saw stocks back in record territory, bearing down on the five-year anniversary of the market's bottom.
Boris Shepov, Portfolio Manager of Industrial Equipment Portfolio: For the year, the fund returned 24.37%, lagging the 31.10% gain of the MSCI® U.S. IMI Capital Goods 25-50 Index and slightly behind the S&P 500®. At the beginning of the period, valuations in the industry were undemanding, which, combined with rising expectations for earnings-power improvement, strength in the ISM® Manufacturing Index, and signs of stabilization in Europe and China, propelled industrial equipment stocks higher. Growth remained strong for industrial end-markets tied to residential construction and aerospace, and during the second half of the period, shares of companies tied to non-residential construction spending performed strongly on improving orders. Versus the MSCI industry index, the fund lagged largely because we did not have enough exposure to aerospace & defense, by far the best-performing segment in the index. A slew of stocks here were among our largest detractors, most notably an average underweighting in Boeing, whose shares rallied sharply. On the defense side, it hurt to avoid index stocks Lockheed Martin, Raytheon and Northrop Grumman, as all three enjoyed strong gains the past 12 months. During the second half of the period, though, I increased exposure to aerospace stocks and I modestly reduced the fund's underweighting in defense. On the positive side, an overweighting in crane manufacturer Manitowoc was the fund's top relative contributor. It also was a good decision to avoid poor-performing agricultural machinery stock Deere and underweight benchmark heavyweight General Electric, whose shares slid on weaker-than-expected financial results. Elsewhere, I avoided index component Fastenal since its share price seemed expensive to me. As the industrial supply company's organic growth disappointed investors and its stock fell, the fund got a nice boost.
The views expressed above reflect those of the portfolio manager(s) only through the end of the period as stated on the cover of this report and do not necessarily represent the views of Fidelity or any other person in the Fidelity organization. Any such views are subject to change at any time based upon market or other conditions and Fidelity disclaims any responsibility to update such views. These views may not be relied on as investment advice and, because investment decisions for a Fidelity fund are based on numerous factors, may not be relied on as an indication of trading intent on behalf of any Fidelity fund.
Annual Report
Industrial Equipment Portfolio
Investment Changes (Unaudited)
Top Ten Stocks as of February 28, 2014 | ||
| % of fund's | % of fund's net assets |
United Technologies Corp. | 9.6 | 7.7 |
General Electric Co. | 8.1 | 14.2 |
Honeywell International, Inc. | 6.8 | 2.2 |
The Boeing Co. | 6.8 | 2.5 |
Caterpillar, Inc. | 6.1 | 5.1 |
Danaher Corp. | 5.6 | 4.7 |
Eaton Corp. PLC | 3.4 | 3.4 |
Illinois Tool Works, Inc. | 3.0 | 3.0 |
Johnson Controls, Inc. | 2.8 | 1.2 |
Cummins, Inc. | 2.5 | 2.7 |
| 54.7 | |
Top Industries (% of fund's net assets) | |||
As of February 28, 2014 | |||
| Aerospace & Defense | 26.3% |
|
| Machinery | 24.4% |
|
| Industrial Conglomerates | 14.7% |
|
| Electrical Equipment | 10.4% |
|
| Professional Services | 4.8% |
|
| All Others* | 19.4% |
|

As of August 31, 2013 | |||
| Machinery | 27.3% |
|
| Aerospace & Defense | 21.9% |
|
| Industrial Conglomerates | 20.9% |
|
| Electrical Equipment | 13.8% |
|
| Trading Companies & Distributors | 4.8% |
|
| All Others* | 11.3% |
|

* Includes short-term investments and net other assets (liabilities). |
Annual Report
Industrial Equipment Portfolio
Investments February 28, 2014
Showing Percentage of Net Assets
Common Stocks - 98.5% | |||
Shares | Value | ||
AEROSPACE & DEFENSE - 26.3% | |||
Aerospace & Defense - 26.3% | |||
Alliant Techsystems, Inc. | 9,852 | $ 1,327,951 | |
Honeywell International, Inc. | 305,500 | 28,851,420 | |
Meggitt PLC | 395,000 | 3,333,694 | |
Teledyne Technologies, Inc. (a) | 88,800 | 8,700,624 | |
The Boeing Co. | 223,200 | 28,774,944 | |
United Technologies Corp. | 349,000 | 40,839,978 | |
| 111,828,611 | ||
AIR FREIGHT & LOGISTICS - 0.4% | |||
Air Freight & Logistics - 0.4% | |||
Atlas Air Worldwide Holdings, Inc. (a) | 61,300 | 1,846,969 | |
AUTO COMPONENTS - 3.8% | |||
Auto Parts & Equipment - 3.8% | |||
Allison Transmission Holdings, Inc. | 150,000 | 4,467,000 | |
Johnson Controls, Inc. | 238,900 | 11,801,660 | |
| 16,268,660 | ||
AUTOMOBILES - 1.5% | |||
Automobile Manufacturers - 1.5% | |||
Hyundai Motor Co. | 27,499 | 6,317,401 | |
BUILDING PRODUCTS - 2.3% | |||
Building Products - 2.3% | |||
American Woodmark Corp. (a) | 65,400 | 2,099,994 | |
Lennox International, Inc. | 35,000 | 3,215,800 | |
Sung Kwang Bend Co. Ltd. | 201,666 | 4,368,176 | |
| 9,683,970 | ||
CONSTRUCTION & ENGINEERING - 4.6% | |||
Construction & Engineering - 4.6% | |||
AECOM Technology Corp. (a) | 126,000 | 4,024,440 | |
MasTec, Inc. (a) | 143,900 | 5,891,266 | |
URS Corp. | 209,000 | 9,718,500 | |
| 19,634,206 | ||
DIVERSIFIED CONSUMER SERVICES - 0.8% | |||
Specialized Consumer Services - 0.8% | |||
H&R Block, Inc. | 104,500 | 3,306,380 | |
ELECTRICAL EQUIPMENT - 10.4% | |||
Electrical Components & Equipment - 9.3% | |||
Eaton Corp. PLC | 190,622 | 14,241,370 | |
Generac Holdings, Inc. | 61,700 | 3,515,049 | |
Hubbell, Inc. Class B | 78,600 | 9,395,844 | |
Regal-Beloit Corp. | 69,228 | 5,101,411 | |
Rockwell Automation, Inc. | 60,500 | 7,431,820 | |
| 39,685,494 | ||
| |||
Shares | Value | ||
Heavy Electrical Equipment - 1.1% | |||
AZZ, Inc. | 101,000 | $ 4,481,370 | |
TOTAL ELECTRICAL EQUIPMENT | 44,166,864 | ||
INDUSTRIAL CONGLOMERATES - 14.7% | |||
Industrial Conglomerates - 14.7% | |||
3M Co. | 33,100 | 4,459,563 | |
Danaher Corp. | 308,600 | 23,604,814 | |
General Electric Co. | 1,347,855 | 34,329,867 | |
| 62,394,244 | ||
MACHINERY - 24.4% | |||
Construction & Farm Machinery & Heavy Trucks - 13.9% | |||
Caterpillar, Inc. | 267,200 | 25,910,384 | |
Cummins, Inc. | 72,500 | 10,579,200 | |
Manitowoc Co., Inc. | 236,600 | 7,320,404 | |
Navistar International Corp. (a) | 73,200 | 2,745,000 | |
Terex Corp. | 75,900 | 3,379,827 | |
Toro Co. | 50,100 | 3,318,123 | |
Wabtec Corp. | 76,800 | 6,095,616 | |
| 59,348,554 | ||
Industrial Machinery - 10.5% | |||
Global Brass & Copper Holdings, Inc. | 515,200 | 8,722,336 | |
Hy-Lok Corp. | 34,588 | 917,841 | |
Illinois Tool Works, Inc. | 155,300 | 12,812,250 | |
Luxfer Holdings PLC sponsored ADR | 101,100 | 2,016,945 | |
Metka SA | 92,299 | 1,680,410 | |
Parker Hannifin Corp. | 72,000 | 8,679,600 | |
Standex International Corp. | 55,600 | 3,075,236 | |
Timken Co. | 61,100 | 3,687,996 | |
Valmont Industries, Inc. | 20,600 | 2,999,978 | |
| 44,592,592 | ||
TOTAL MACHINERY | 103,941,146 | ||
PROFESSIONAL SERVICES - 4.8% | |||
Human Resource & Employment Services - 1.1% | |||
Towers Watson & Co. | 43,600 | 4,756,760 | |
Research & Consulting Services - 3.7% | |||
CBIZ, Inc. (a) | 718,900 | 6,563,557 | |
CRA International, Inc. (a) | 102,600 | 2,397,762 | |
Dun & Bradstreet Corp. | 67,600 | 6,706,596 | |
| 15,667,915 | ||
TOTAL PROFESSIONAL SERVICES | 20,424,675 | ||
ROAD & RAIL - 0.4% | |||
Trucking - 0.4% | |||
Localiza Rent A Car SA | 128,600 | 1,708,999 | |
TRADING COMPANIES & DISTRIBUTORS - 3.7% | |||
Trading Companies & Distributors - 3.7% | |||
Houston Wire & Cable Co. | 239,034 | 3,324,963 | |
Common Stocks - continued | |||
Shares | Value | ||
TRADING COMPANIES & DISTRIBUTORS - CONTINUED | |||
Trading Companies & Distributors - continued | |||
Watsco, Inc. | 39,000 | $ 3,836,820 | |
WESCO International, Inc. (a)(d) | 98,400 | 8,483,064 | |
| 15,644,847 | ||
TRANSPORTATION INFRASTRUCTURE - 0.4% | |||
Marine Ports & Services - 0.4% | |||
Mundra Port and SEZ Ltd. | 701,345 | 1,899,441 | |
TOTAL COMMON STOCKS (Cost $331,297,556) |
| ||
Nonconvertible Preferred Stocks - 0.0% | |||
|
|
|
|
AEROSPACE & DEFENSE - 0.0% | |||
Aerospace & Defense - 0.0% | |||
Rolls-Royce Group PLC (C Shares) (a) | 17,956,800 |
| |
Money Market Funds - 0.7% | |||
Shares | Value | ||
Fidelity Securities Lending Cash Central Fund, 0.09% (b)(c) | 2,701,600 | $ 2,701,600 | |
TOTAL INVESTMENT PORTFOLIO - 99.2% (Cost $334,028,305) | 421,798,083 | ||
NET OTHER ASSETS (LIABILITIES) - 0.8% | 3,588,148 | ||
NET ASSETS - 100% | $ 425,386,231 | ||
Legend |
(a) Non-income producing |
(b) Affiliated fund that is generally available only to investment companies and other accounts managed by Fidelity Investments. The rate quoted is the annualized seven-day yield of the fund at period end. A complete unaudited listing of the fund's holdings as of its most recent quarter end is available upon request. In addition, each Fidelity Central Fund's financial statements, which are not covered by the Fund's Report of Independent Registered Public Accounting Firm, are available on the SEC's website or upon request. |
(c) Investment made with cash collateral received from securities on loan. |
(d) Security or a portion of the security is on loan at period end. |
Affiliated Central Funds |
Information regarding fiscal year to date income earned by the Fund from investments in Fidelity Central Funds is as follows: |
Fund | Income earned |
Fidelity Cash Central Fund | $ 7,714 |
Fidelity Securities Lending Cash Central Fund | 6,475 |
Total | $ 14,189 |
Other Information |
All investments are categorized as Level 1 under the Fair Value Hierarchy. The inputs or methodology used for valuing securities may not be an indication of the risk associated with investing in those securities. For more information on valuation inputs, please refer to the Investment Valuation section in the accompanying Notes to Financial Statements. |
See accompanying notes which are an integral part of the financial statements.
Annual Report
Industrial Equipment Portfolio
Financial Statements
Statement of Assets and Liabilities
| February 28, 2014 | |
|
|
|
Assets | ||
Investment in securities, at value (including securities loaned of $2,646,647) - See accompanying schedule: Unaffiliated issuers (cost $331,326,705) | $ 419,096,483 |
|
Fidelity Central Funds (cost $2,701,600) | 2,701,600 |
|
Total Investments (cost $334,028,305) |
| $ 421,798,083 |
Receivable for investments sold | 17,360,496 | |
Receivable for fund shares sold | 159,414 | |
Dividends receivable | 1,100,421 | |
Distributions receivable from Fidelity Central Funds | 493 | |
Prepaid expenses | 1,967 | |
Other receivables | 17,345 | |
Total assets | 440,438,219 | |
|
|
|
Liabilities | ||
Payable to custodian bank | $ 2,304,996 | |
Payable for investments purchased | 9,590,477 | |
Payable for fund shares redeemed | 156,497 | |
Accrued management fee | 190,071 | |
Other affiliated payables | 65,577 | |
Other payables and accrued expenses | 42,770 | |
Collateral on securities loaned, at value | 2,701,600 | |
Total liabilities | 15,051,988 | |
|
|
|
Net Assets | $ 425,386,231 | |
Net Assets consist of: |
| |
Paid in capital | $ 302,829,765 | |
Undistributed net investment income | 940,238 | |
Accumulated undistributed net realized gain (loss) on investments and foreign currency transactions | 33,848,713 | |
Net unrealized appreciation (depreciation) on investments and assets and liabilities in foreign currencies | 87,767,515 | |
Net Assets, for 9,241,765 shares outstanding | $ 425,386,231 | |
Net Asset Value, offering price and redemption price per share ($425,386,231 ÷ 9,241,765 shares) | $ 46.03 | |
Statement of Operations
| Year ended February 28, 2014 | |
|
|
|
Investment Income |
|
|
Dividends |
| $ 6,332,733 |
Income from Fidelity Central Funds (including $6,475 from security lending) |
| 14,189 |
Total income |
| 6,346,922 |
|
|
|
Expenses | ||
Management fee | $ 2,133,228 | |
Transfer agent fees | 632,085 | |
Accounting and security lending fees | 150,686 | |
Custodian fees and expenses | 18,370 | |
Independent trustees' compensation | 7,391 | |
Registration fees | 25,471 | |
Audit | 50,138 | |
Legal | 5,902 | |
Interest | 627 | |
Miscellaneous | 4,103 | |
Total expenses before reductions | 3,028,001 | |
Expense reductions | (23,180) | 3,004,821 |
Net investment income (loss) | 3,342,101 | |
Realized and Unrealized Gain (Loss) Net realized gain (loss) on: | ||
Investment securities: |
|
|
Unaffiliated issuers | 66,379,036 | |
Foreign currency transactions | 15,079 | |
Total net realized gain (loss) |
| 66,394,115 |
Change in net unrealized appreciation (depreciation) on: Investment securities (net of increase in deferred foreign taxes of $947) | 15,205,160 | |
Assets and liabilities in foreign currencies | (1,469) | |
Total change in net unrealized appreciation (depreciation) |
| 15,203,691 |
Net gain (loss) | 81,597,806 | |
Net increase (decrease) in net assets resulting from operations | $ 84,939,907 | |
See accompanying notes which are an integral part of the financial statements.
Annual Report
Statement of Changes in Net Assets
| Year ended | Year ended |
Increase (Decrease) in Net Assets |
|
|
Operations |
|
|
Net investment income (loss) | $ 3,342,101 | $ 3,932,990 |
Net realized gain (loss) | 66,394,115 | 2,856,090 |
Change in net unrealized appreciation (depreciation) | 15,203,691 | 21,839,938 |
Net increase (decrease) in net assets resulting from operations | 84,939,907 | 28,629,018 |
Distributions to shareholders from net investment income | (2,819,050) | (3,820,438) |
Distributions to shareholders from net realized gain | (24,347,487) | (33,809) |
Total distributions | (27,166,537) | (3,854,247) |
Share transactions | 99,971,134 | 107,872,573 |
Reinvestment of distributions | 26,665,074 | 3,805,295 |
Cost of shares redeemed | (128,975,271) | (118,178,190) |
Net increase (decrease) in net assets resulting from share transactions | (2,339,063) | (6,500,322) |
Redemption fees | 1,005 | 2,455 |
Total increase (decrease) in net assets | 55,435,312 | 18,276,904 |
|
|
|
Net Assets | ||
Beginning of period | 369,950,919 | 351,674,015 |
End of period (including undistributed net investment income of $940,238 and undistributed net investment income of $548,351, respectively) | $ 425,386,231 | $ 369,950,919 |
Other Information Shares | ||
Sold | 2,339,925 | 2,933,692 |
Issued in reinvestment of distributions | 595,207 | 103,978 |
Redeemed | (3,038,979) | (3,361,719) |
Net increase (decrease) | (103,847) | (324,049) |
Financial Highlights
Years ended February 28, | 2014 | 2013 | 2012 F | 2011 | 2010 |
Selected Per-Share Data |
|
|
|
|
|
Net asset value, beginning of period | $ 39.59 | $ 36.37 | $ 36.16 | $ 26.16 | $ 13.98 |
Income from Investment Operations |
|
|
|
|
|
Net investment income (loss) B | .37 | .45 | .28 | .26 | .19 |
Net realized and unrealized gain (loss) | 9.19 | 3.22 | .29 | 9.89 | 12.22 |
Total from investment operations | 9.56 | 3.67 | .57 | 10.15 | 12.41 |
Distributions from net investment income | (.32) | (.45) | (.26) | (.15) | (.23) |
Distributions from net realized gain | (2.80) | - | (.10) | - | - |
Total distributions | (3.12) | (.45) | (.36) | (.15) | (.23) |
Redemption fees added to paid in capital B,G | - | - | - | - | - |
Net asset value, end of period | $ 46.03 | $ 39.59 | $ 36.37 | $ 36.16 | $ 26.16 |
Total Return A | 24.37% | 10.19% | 1.66% | 38.87% | 89.06% |
Ratios to Average Net Assets C,E |
|
|
|
|
|
Expenses before reductions | .79% | .82% | .84% | .89% | .95% |
Expenses net of fee waivers, if any | .78% | .82% | .84% | .89% | .95% |
Expenses net of all reductions | .78% | .81% | .84% | .88% | .94% |
Net investment income (loss) | .87% | 1.25% | .85% | .85% | .87% |
Supplemental Data |
|
|
|
|
|
Net assets, end of period (000 omitted) | $ 425,386 | $ 369,951 | $ 351,674 | $ 362,671 | $ 120,368 |
Portfolio turnover rate D | 100% | 69% | 101% | 82% | 74% |
A Total returns would have been lower if certain expenses had not been reduced during the applicable periods shown. B Calculated based on average shares outstanding during the period. C Fees and expenses of any underlying Fidelity Central Funds are not included in the Fund's expense ratio. The Fund indirectly bears its proportionate share of the expenses of any underlying Fidelity Central Funds. D Amount does not include the portfolio activity of any underlying Fidelity Central Funds. E Expense ratios reflect operating expenses of the Fund. Expenses before reductions do not reflect amounts reimbursed by the investment adviser or reductions from brokerage service arrangements or reductions from other expense offset arrangements and do not represent the amount paid by the Fund during periods when reimbursements or reductions occur. Expenses net of fee waivers reflect expenses after reimbursement by the investment adviser but prior to reductions from brokerage service arrangements or other expense offset arrangements. Expenses net of all reductions represent the net expenses paid by the Fund. F For the year ended February 29. G Amount represents less than $.01 per share. |
See accompanying notes which are an integral part of the financial statements.
Annual Report
Industrials Portfolio
Performance: The Bottom Line
Average annual total return reflects the change in the value of an investment, assuming reinvestment of the fund's distributions from dividend income and capital gains (the profits earned upon the sale of securities that have grown in value, if any) and assuming a constant rate of performance each year. The $10,000 table and the fund's returns do not reflect the deduction of taxes that a shareholder would pay on fund distributions or the redemption of fund shares. During periods of reimbursement by Fidelity, a fund's total return will be greater than it would be had the reimbursement not occurred. How a fund did yesterday is no guarantee of how it will do tomorrow.
Average Annual Total Returns
Periods ended February 28, 2014 | Past 1 | Past 5 | Past 10 |
Industrials Portfolio A | 27.80% | 30.36% | 12.42% |
A Prior to October 1, 2006, Industrials Portfolio was named Cyclical Industries Portfolio, and the fund operated under certain different investment policies and compared its performance to a different additional index. The fund's historical performance may not represent its current investment policies.
$10,000 Over 10 Years
Let's say hypothetically that $10,000 was invested in Industrials Portfolio on February 29, 2004. The chart shows how the value of your investment would have changed, and also shows how the S&P 500 Index performed over the same period.
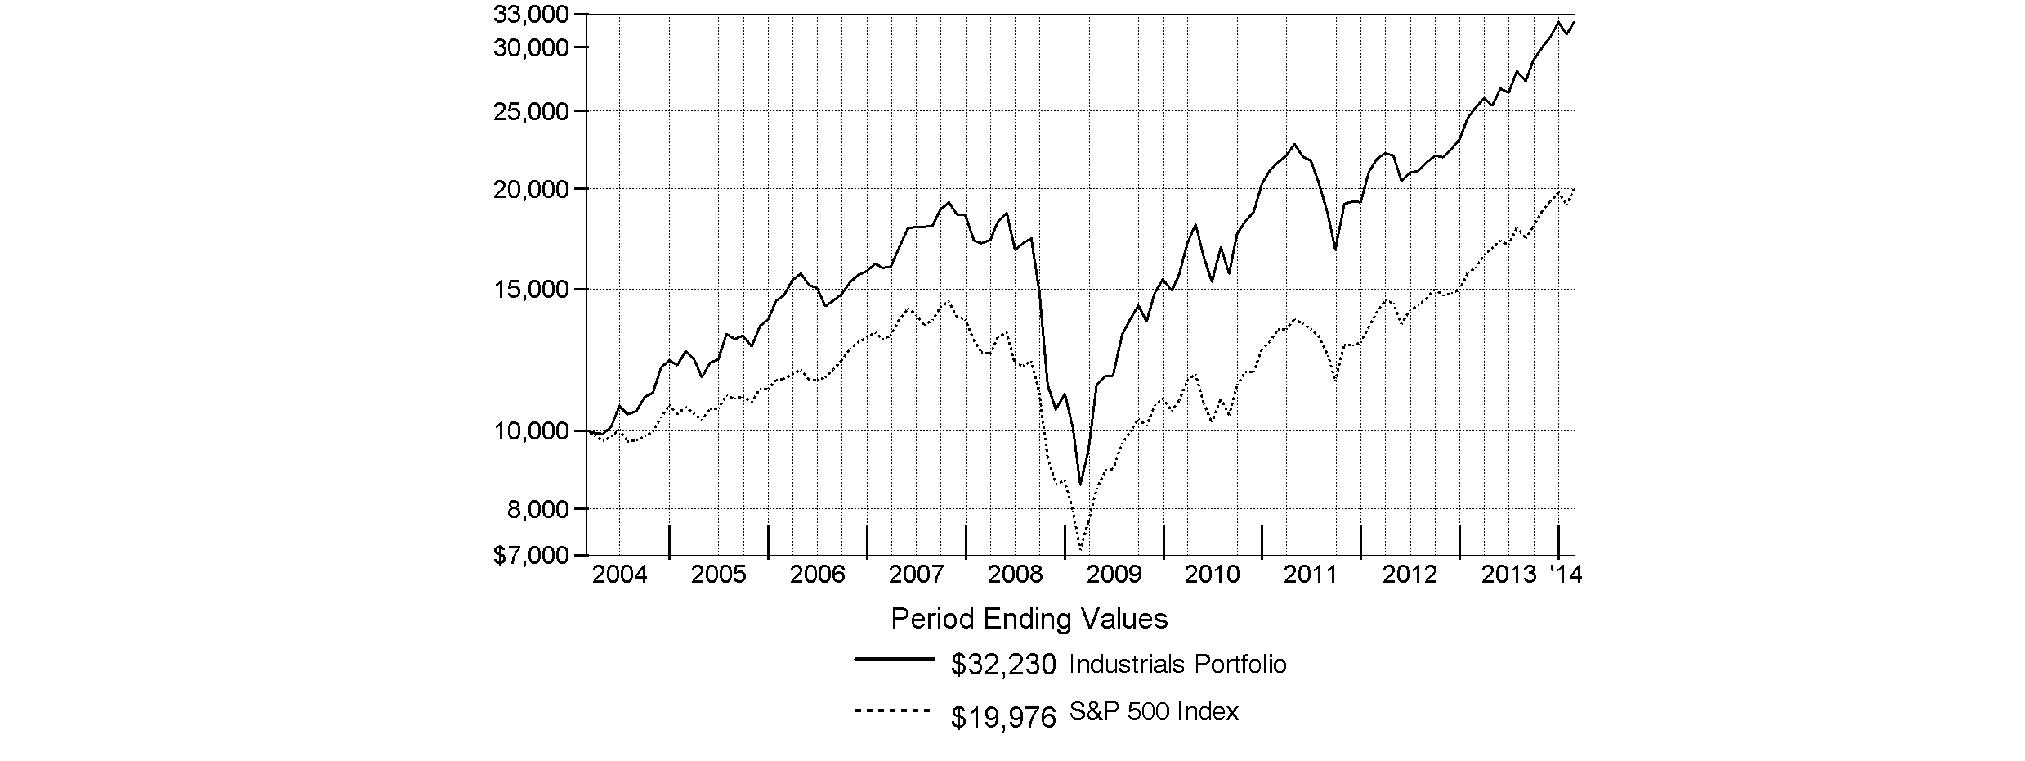
Annual Report
Industrials Portfolio
Management's Discussion of Fund Performance
Market Recap: Stocks overcame fears of higher interest rates - not to mention their worst January in four years - to finish sharply higher for the 12 months ending February 28, 2014. The broad S&P 500® Index and the blue-chip Dow Jones Industrial AverageSM gained 25.37% and 19.01%, respectively, amid generally favorable earnings reports and accommodative monetary policies worldwide. Performance generally increased along the risk spectrum, with smaller-cap and growth strategies leading the way. An ebullient market helped the growth-oriented Nasdaq Composite Index® to a 38.10% period gain, for example. On the other hand, both cyclical and defensive stocks had representation in the top-performing industry sectors: returns were highest in health care and consumer discretionary; lowest in utilities and telecommunication services. From a macroeconomic perspective, data still points to slow but steady improvement in the U.S., and Europe's recession may well be over. Reports from China have disappointed, but continue to suggest a relatively soft landing there. Mixed signals from the U.S. Federal Reserve as to when it might curtail its stimulative bond buying kept markets in flux during the spring and summer. Stocks regained momentum in October despite a federal budget impasse and brief government shutdown, and lower volatility prevailed through year-end. Shedding new-year concerns about China's economy, an emerging-markets sell-off and confirmation (at last) of Fed tapering - alongside confirmation of a presumably dovish Janet Yellen as new Fed chair - February saw stocks back in record territory, bearing down on the five-year anniversary of the market's bottom.
Comments from Tobias Welo, Portfolio Manager of Industrials Portfolio: For the year, the fund returned 27.80%, trailing the 30.56% gain of the MSCI® U.S. IMI Industrials 25-50 Index but outpacing the S&P 500®. Versus the broader market, industrials stocks, as measured by the MSCI index, were particularly helped by robust outperformance in the aerospace & defense and airlines groups. Compared with the MSCI index, positioning in aerospace & defense stocks had by far the most negative impact on the fund's relative performance. A lot of the performance shortfall in this group came down to not owning index component Boeing - the fund's biggest relative detractor - for much of the period. A hybrid play on commercial aerospace and defense, Boeing was a standout performer based largely on initiatives to rein in costs and shareholder-friendly decisions about dividends and stock repurchases. Continued solid execution by the company, a stabilizing defense outlook and strong aerospace fundamentals led me to establish a modest overweighting in Boeing early in 2014, making it the fund's fifth-largest position at period end. Additionally, I was surprised by the strong performance of the pure-play defense contracting group, which I thought was in cyclical decline. Noteworthy detractors in this group included index stocks Lockheed Martin, Raytheon and Northrop Grumman, all of which delivered outstanding performance but weren't in the portfolio. Lastly, our lack of presence in airlines for most of the period held back the fund's results, as this group delivered the best performance in the index, roughly doubling in value. For example, having light exposure, on average, to Delta Air Lines weighed on relative performance. Conversely, stock selection in the construction & farm machinery & heavy trucks segment - a group I liked for its leverage to the gradually improving residential and nonresidential construction markets - provided a meaningful boost to relative performance. In particular, a large overweighting in Manitowoc was easily the fund's largest contributor during the period, as this manufacturer of cranes and food service equipment delivered a positive surprise in its quarterly earnings call on January 30. Negligible exposure to Deere, a manufacturer of farm equipment, also paid off. Lastly, I'll mention a sizable overweighting in human resources consultant Towers Watson, which bolstered the portfolio's relative results.
The views expressed above reflect those of the portfolio manager(s) only through the end of the period as stated on the cover of this report and do not necessarily represent the views of Fidelity or any other person in the Fidelity organization. Any such views are subject to change at any time based upon market or other conditions and Fidelity disclaims any responsibility to update such views. These views may not be relied on as investment advice and, because investment decisions for a Fidelity fund are based on numerous factors, may not be relied on as an indication of trading intent on behalf of any Fidelity fund.
Annual Report
Industrials Portfolio
Investment Changes (Unaudited)
Top Ten Stocks as of February 28, 2014 | ||
| % of fund's | % of fund's net assets |
United Technologies Corp. | 7.4 | 6.8 |
General Electric Co. | 5.5 | 11.9 |
Danaher Corp. | 5.1 | 5.7 |
Union Pacific Corp. | 4.6 | 4.5 |
The Boeing Co. | 4.4 | 0.0 |
Honeywell International, Inc. | 4.3 | 4.0 |
Caterpillar, Inc. | 3.9 | 3.5 |
FedEx Corp. | 3.6 | 0.0 |
Manitowoc Co., Inc. | 2.6 | 1.6 |
Cummins, Inc. | 2.6 | 2.4 |
| 44.0 | |
Top Industries (% of fund's net assets) | |||
As of February 28, 2014 | |||
| Machinery | 24.2% |
|
| Aerospace & Defense | 21.4% |
|
| Industrial Conglomerates | 10.6% |
|
| Electrical Equipment | 9.1% |
|
| Professional Services | 8.5% |
|
| All Others* | 26.2% |
|

As of August 31, 2013 | |||
| Machinery | 30.5% |
|
| Industrial Conglomerates | 17.6% |
|
| Aerospace & Defense | 16.2% |
|
| Electrical Equipment | 7.9% |
|
| Professional Services | 6.8% |
|
| All Others* | 21.0% |
|

* Includes short-term investments and net other assets (liabilities). |
Annual Report
Industrials Portfolio
Investments February 28, 2014
Showing Percentage of Net Assets
Common Stocks - 98.8% | |||
Shares | Value | ||
AEROSPACE & DEFENSE - 21.4% | |||
Aerospace & Defense - 21.4% | |||
Alliant Techsystems, Inc. | 60,400 | $ 8,141,316 | |
Curtiss-Wright Corp. | 72,499 | 4,941,532 | |
Exelis, Inc. | 247,761 | 5,061,757 | |
General Dynamics Corp. | 95,298 | 10,438,943 | |
Honeywell International, Inc. | 551,434 | 52,077,427 | |
Teledyne Technologies, Inc. (a) | 142,553 | 13,967,343 | |
Textron, Inc. | 222,700 | 8,841,190 | |
The Boeing Co. | 411,698 | 53,076,106 | |
Triumph Group, Inc. | 212,017 | 13,823,508 | |
United Technologies Corp. | 768,671 | 89,949,884 | |
| 260,319,006 | ||
AIR FREIGHT & LOGISTICS - 3.6% | |||
Air Freight & Logistics - 3.6% | |||
FedEx Corp. | 331,475 | 44,195,562 | |
AIRLINES - 2.7% | |||
Airlines - 2.7% | |||
American Airlines Group, Inc. (a) | 425,459 | 15,712,201 | |
Delta Air Lines, Inc. | 535,273 | 17,776,416 | |
| 33,488,617 | ||
AUTO COMPONENTS - 1.6% | |||
Auto Parts & Equipment - 1.6% | |||
Johnson Controls, Inc. | 387,377 | 19,136,424 | |
BUILDING PRODUCTS - 2.2% | |||
Building Products - 2.2% | |||
A.O. Smith Corp. | 372,044 | 18,490,587 | |
Aspen Aerogels, Inc. warrants 3/28/23 (a)(b) | 4,617,874 | 46 | |
Lennox International, Inc. | 96,272 | 8,845,471 | |
| 27,336,104 | ||
COMMERCIAL SERVICES & SUPPLIES - 1.7% | |||
Diversified Support Services - 0.7% | |||
Iron Mountain, Inc. | 299,119 | 8,136,037 | |
Environmental & Facility Services - 1.0% | |||
Waste Connections, Inc. | 291,813 | 12,626,749 | |
TOTAL COMMERCIAL SERVICES & SUPPLIES | 20,762,786 | ||
CONSTRUCTION & ENGINEERING - 3.6% | |||
Construction & Engineering - 3.6% | |||
EMCOR Group, Inc. | 384,388 | 17,981,671 | |
MasTec, Inc. (a) | 238,379 | 9,759,236 | |
Tutor Perini Corp. (a) | 193,693 | 4,774,532 | |
URS Corp. | 234,307 | 10,895,276 | |
| 43,410,715 | ||
| |||
Shares | Value | ||
ELECTRICAL EQUIPMENT - 9.1% | |||
Electrical Components & Equipment - 9.1% | |||
Eaton Corp. PLC | 365,223 | $ 27,285,810 | |
Emerson Electric Co. | 399,578 | 26,076,460 | |
Generac Holdings, Inc. | 245,210 | 13,969,614 | |
Hubbell, Inc. Class B | 192,093 | 22,962,797 | |
Rockwell Automation, Inc. | 171,535 | 21,071,359 | |
| 111,366,040 | ||
INDUSTRIAL CONGLOMERATES - 10.6% | |||
Industrial Conglomerates - 10.6% | |||
Danaher Corp. | 816,641 | 62,464,870 | |
General Electric Co. | 2,602,484 | 66,285,267 | |
| 128,750,137 | ||
MACHINERY - 24.2% | |||
Construction & Farm Machinery & Heavy Trucks - 12.6% | |||
Caterpillar, Inc. | 484,196 | 46,952,486 | |
Cummins, Inc. | 216,978 | 31,661,430 | |
Deere & Co. | 116,450 | 10,006,549 | |
Manitowoc Co., Inc. | 1,025,592 | 31,731,816 | |
Oshkosh Truck Corp. | 146,382 | 8,465,271 | |
Toro Co. | 119,748 | 7,930,910 | |
Wabtec Corp. | 209,987 | 16,666,668 | |
| 153,415,130 | ||
Industrial Machinery - 11.6% | |||
Andritz AG | 52,478 | 3,298,345 | |
Crane Co. | 27,000 | 1,928,340 | |
Dover Corp. | 155,792 | 14,691,186 | |
GEA Group AG | 254,022 | 12,321,017 | |
Global Brass & Copper Holdings, Inc. | 188,677 | 3,194,302 | |
Harsco Corp. | 8,085 | 203,095 | |
IDEX Corp. | 198,298 | 14,886,231 | |
ITT Corp. | 277,865 | 12,198,274 | |
Mueller Industries, Inc. | 34,147 | 2,133,505 | |
Pall Corp. | 191,329 | 16,454,294 | |
Parker Hannifin Corp. | 127,002 | 15,310,091 | |
Timken Co. | 245,369 | 14,810,473 | |
TriMas Corp. (a) | 138,418 | 4,652,229 | |
Valmont Industries, Inc. | 168,038 | 24,471,374 | |
| 140,552,756 | ||
TOTAL MACHINERY | 293,967,886 | ||
OIL, GAS & CONSUMABLE FUELS - 0.7% | |||
Oil & Gas Storage & Transport - 0.7% | |||
Navigator Holdings Ltd. (a) | 127,975 | 3,090,596 | |
Scorpio Tankers, Inc. | 547,308 | 5,358,145 | |
| 8,448,741 | ||
PROFESSIONAL SERVICES - 8.5% | |||
Human Resource & Employment Services - 2.3% | |||
Towers Watson & Co. | 250,474 | 27,326,713 | |
Common Stocks - continued | |||
Shares | Value | ||
PROFESSIONAL SERVICES - CONTINUED | |||
Research & Consulting Services - 6.2% | |||
CRA International, Inc. (a) | 141,244 | $ 3,300,872 | |
Dun & Bradstreet Corp. | 173,417 | 17,204,701 | |
Huron Consulting Group, Inc. (a) | 149,808 | 9,912,795 | |
Nielsen Holdings B.V. | 556,351 | 26,337,656 | |
Verisk Analytics, Inc. (a) | 301,950 | 19,238,744 | |
| 75,994,768 | ||
TOTAL PROFESSIONAL SERVICES | 103,321,481 | ||
ROAD & RAIL - 6.2% | |||
Railroads - 4.6% | |||
Union Pacific Corp. | 309,956 | 55,909,863 | |
Trucking - 1.6% | |||
J.B. Hunt Transport Services, Inc. | 270,420 | 19,435,085 | |
TOTAL ROAD & RAIL | 75,344,948 | ||
TRADING COMPANIES & DISTRIBUTORS - 2.7% | |||
Trading Companies & Distributors - 2.7% | |||
Houston Wire & Cable Co. | 155,198 | 2,158,804 | |
W.W. Grainger, Inc. | 42,850 | 10,927,607 | |
WESCO International, Inc. (a) | 228,166 | 19,670,191 | |
| 32,756,602 | ||
TOTAL COMMON STOCKS (Cost $899,425,544) |
| ||
Convertible Bonds - 0.3% | ||||
| Principal Amount |
| ||
BUILDING PRODUCTS - 0.3% | ||||
Building Products - 0.3% | ||||
Aspen Aerogels, Inc.: | ||||
8% 6/1/14 (b) | $ 1,444,680 | 1,444,680 | ||
| ||||
| Principal Amount | Value | ||
8% 12/6/14 (b) | $ 1,574,640 | $ 1,574,640 | ||
8% 3/28/16 (b) | 125,744 | 125,744 | ||
TOTAL CONVERTIBLE BONDS (Cost $3,145,018) | 3,145,064 | ||
TOTAL INVESTMENT PORTFOLIO - 99.1% (Cost $902,570,562) | 1,205,750,113 | ||
NET OTHER ASSETS (LIABILITIES) - 0.9% | 11,367,153 | ||
NET ASSETS - 100% | $ 1,217,117,266 | ||
Legend |
(a) Non-income producing |
(b) Restricted securities - Investment in securities not registered under the Securities Act of 1933 (excluding 144A issues). At the end of the period, the value of restricted securities (excluding 144A issues) amounted to $3,145,110 or 0.3% of net assets. |
Additional information on each restricted holding is as follows: |
Security | Acquisition Date | Acquisition Cost |
Aspen Aerogels, Inc. warrants 3/28/23 | 5/6/13 | $ 46 |
Aspen Aerogels, Inc. 8% 6/1/14 | 6/14/11 | $ 1,444,681 |
Aspen Aerogels, Inc. 8% 12/6/14 | 12/6/11 | $ 1,574,640 |
Aspen Aerogels, Inc. 8% 3/28/16 | 5/6/13 | $ 125,699 |
Affiliated Central Funds |
Information regarding fiscal year to date income earned by the Fund from investments in Fidelity Central Funds is as follows: |
Fund | Income earned |
Fidelity Cash Central Fund | $ 21,448 |
Fidelity Securities Lending Cash Central Fund | 13,810 |
Total | $ 35,258 |
Other Information |
The following is a summary of the inputs used, as of February 28, 2014, involving the Fund's assets and liabilities carried at fair value. The inputs or methodology used for valuing securities may not be an indication of the risk associated with investing in those securities. For more information on valuation inputs, and their aggregation into the levels used in the table below, please refer to the Investment Valuation section in the accompanying Notes to Financial Statements. |
Valuation Inputs at Reporting Date: | ||||
Description | Total | Level 1 | Level 2 | Level 3 |
Investments in Securities: | ||||
Common Stocks | $ 1,202,605,049 | $ 1,202,605,003 | $ - | $ 46 |
Convertible Bonds | 3,145,064 | - | - | 3,145,064 |
Total Investments in Securities: | $ 1,205,750,113 | $ 1,202,605,003 | $ - | $ 3,145,110 |
See accompanying notes which are an integral part of the financial statements.
Annual Report
Industrials Portfolio
Financial Statements
Statement of Assets and Liabilities
| February 28, 2014 | |
|
|
|
Assets | ||
Investment in securities, at value - See accompanying schedule: Unaffiliated issuers (cost $902,570,562) |
| $ 1,205,750,113 |
Receivable for investments sold | 20,258,274 | |
Receivable for fund shares sold | 934,426 | |
Dividends receivable | 2,705,440 | |
Interest receivable | 41,934 | |
Distributions receivable from Fidelity Central Funds | 632 | |
Prepaid expenses | 5,536 | |
Other receivables | 22,370 | |
Total assets | 1,229,718,725 | |
|
|
|
Liabilities | ||
Payable to custodian bank | $ 1,541,901 | |
Payable for investments purchased | 7,874,601 | |
Payable for fund shares redeemed | 2,317,350 | |
Accrued management fee | 550,622 | |
Other affiliated payables | 239,639 | |
Other payables and accrued expenses | 77,346 | |
Total liabilities | 12,601,459 | |
|
|
|
Net Assets | $ 1,217,117,266 | |
Net Assets consist of: |
| |
Paid in capital | $ 852,111,372 | |
Undistributed net investment income | 639,853 | |
Accumulated undistributed net realized gain (loss) on investments and foreign currency transactions | 61,187,131 | |
Net unrealized appreciation (depreciation) on investments and assets and liabilities in foreign currencies | 303,178,910 | |
Net Assets, for 36,124,659 shares outstanding | $ 1,217,117,266 | |
Net Asset Value, offering price and redemption price per share ($1,217,117,266 ÷ 36,124,659 shares) | $ 33.69 | |
Statement of Operations
| Year ended February 28, 2014 | |
|
|
|
Investment Income |
|
|
Dividends |
| $ 16,244,924 |
Interest |
| 254,177 |
Income from Fidelity Central Funds (including $13,810 from security lending) |
| 35,258 |
Total income |
| 16,534,359 |
|
|
|
Expenses | ||
Management fee | $ 5,925,131 | |
Transfer agent fees | 2,216,428 | |
Accounting and security lending fees | 352,157 | |
Custodian fees and expenses | 27,806 | |
Independent trustees' compensation | 20,707 | |
Registration fees | 92,081 | |
Audit | 43,149 | |
Legal | 15,845 | |
Interest | 2,303 | |
Miscellaneous | 10,746 | |
Total expenses before reductions | 8,706,353 | |
Expense reductions | (44,956) | 8,661,397 |
Net investment income (loss) | 7,872,962 | |
Realized and Unrealized Gain (Loss) Net realized gain (loss) on: | ||
Investment securities: |
|
|
Unaffiliated issuers | 110,347,334 | |
Foreign currency transactions | (1,733) | |
Futures contracts | 231,285 | |
Total net realized gain (loss) |
| 110,576,886 |
Change in net unrealized appreciation (depreciation) on: Investment securities | 138,541,051 | |
Assets and liabilities in foreign currencies | (641) | |
Futures contracts | (304,345) | |
Total change in net unrealized appreciation (depreciation) |
| 138,236,065 |
Net gain (loss) | 248,812,951 | |
Net increase (decrease) in net assets resulting from operations | $ 256,685,913 | |
See accompanying notes which are an integral part of the financial statements.
Annual Report
Industrials Portfolio
Financial Statements - continued
Statement of Changes in Net Assets
| Year ended | Year ended |
Increase (Decrease) in Net Assets |
|
|
Operations |
|
|
Net investment income (loss) | $ 7,872,962 | $ 6,795,068 |
Net realized gain (loss) | 110,576,886 | 26,422,065 |
Change in net unrealized appreciation (depreciation) | 138,236,065 | 69,168,250 |
Net increase (decrease) in net assets resulting from operations | 256,685,913 | 102,385,383 |
Distributions to shareholders from net investment income | (7,417,543) | (6,549,531) |
Distributions to shareholders from net realized gain | (61,874,525) | (4,823,532) |
Total distributions | (69,292,068) | (11,373,063) |
Share transactions | 483,173,850 | 353,142,093 |
Reinvestment of distributions | 67,875,440 | 11,164,393 |
Cost of shares redeemed | (394,620,245) | (133,203,317) |
Net increase (decrease) in net assets resulting from share transactions | 156,429,045 | 231,103,169 |
Redemption fees | 28,132 | 6,726 |
Total increase (decrease) in net assets | 343,851,022 | 322,122,215 |
|
|
|
Net Assets | ||
Beginning of period | 873,266,244 | 551,144,029 |
End of period (including undistributed net investment income of $639,853 and undistributed net investment income of $1,394,833, respectively) | $ 1,217,117,266 | $ 873,266,244 |
Other Information Shares | ||
Sold | 15,662,826 | 13,820,565 |
Issued in reinvestment of distributions | 2,184,292 | 446,984 |
Redeemed | (12,867,011) | (5,442,107) |
Net increase (decrease) | 4,980,107 | 8,825,442 |
Financial Highlights
Years ended February 28, | 2014 | 2013 | 2012 F | 2011 | 2010 |
Selected Per-Share Data |
|
|
|
|
|
Net asset value, beginning of period | $ 28.04 | $ 24.69 | $ 25.24 | $ 18.39 | $ 10.12 |
Income from Investment Operations |
|
|
|
|
|
Net investment income (loss) B | .23 | .28 | .19 | .15 | .11 |
Net realized and unrealized gain (loss) | 7.36 | 3.54 | .01 | 6.80 | 8.27 |
Total from investment operations | 7.59 | 3.82 | .20 | 6.95 | 8.38 |
Distributions from net investment income | (.20) | (.26) | (.13) | (.10) | (.11) |
Distributions from net realized gain | (1.74) | (.21) | (.62) | - | - |
Total distributions | (1.94) | (.47) | (.75) | (.10) | (.11) |
Redemption fees added to paid in capital B,G | - | - | - | - | - |
Net asset value, end of period | $ 33.69 | $ 28.04 | $ 24.69 | $ 25.24 | $ 18.39 |
Total Return A | 27.80% | 15.71% | .94% | 37.85% | 82.95% |
Ratios to Average Net AssetsC,E |
|
|
|
|
|
Expenses before reductions | .81% | .85% | .87% | .90% | .97% |
Expenses net of fee waivers, if any | .81% | .85% | .87% | .90% | .97% |
Expenses net of all reductions | .81% | .84% | .86% | .90% | .97% |
Net investment income (loss) | .74% | 1.13% | .83% | .69% | .71% |
Supplemental Data |
|
|
|
|
|
Net assets, end of period (000 omitted) | $ 1,217,117 | $ 873,266 | $ 551,144 | $ 572,451 | $ 253,287 |
Portfolio turnover rate D | 58% | 75% | 102% | 80% | 106% |
A Total returns would have been lower if certain expenses had not been reduced during the applicable periods shown. B Calculated based on average shares outstanding during the period. C Fees and expenses of any underlying Fidelity Central Funds are not included in the Fund's expense ratio. The Fund indirectly bears its proportionate share of the expenses of any underlying Fidelity Central Funds. D Amount does not include the portfolio activity of any underlying Fidelity Central Funds. E Expense ratios reflect operating expenses of the Fund. Expenses before reductions do not reflect amounts reimbursed by the investment adviser or reductions from brokerage service arrangements or reductions from other expense offset arrangements and do not represent the amount paid by the Fund during periods when reimbursements or reductions occur. Expenses net of fee waivers reflect expenses after reimbursement by the investment adviser but prior to reductions from brokerage service arrangements or other expense offset arrangements. Expenses net of all reductions represent the net expenses paid by the Fund. F For the year ended February 29. G Amount represents less than $.01 per share. |
See accompanying notes which are an integral part of the financial statements.
Annual Report
Transportation Portfolio
Performance: The Bottom Line
Average annual total return reflects the change in the value of an investment, assuming reinvestment of the fund's distributions from dividend income and capital gains (the profits earned upon the sale of securities that have grown in value, if any) and assuming a constant rate of performance each year. The $10,000 table and the fund's returns do not reflect the deduction of taxes that a shareholder would pay on fund distributions or the redemption of fund shares. During periods of reimbursement by Fidelity, a fund's total return will be greater than it would be had the reimbursement not occurred. How a fund did yesterday is no guarantee of how it will do tomorrow.
Average Annual Total Returns
Periods ended February 28, 2014 | Past 1 | Past 5 | Past 10 |
Transportation Portfolio | 36.60% | 30.53% | 12.57% |
$10,000 Over 10 Years
Let's say hypothetically that $10,000 was invested in Transportation Portfolio on February 29, 2004. The chart shows how the value of your investment would have changed, and also shows how the S&P 500 Index performed over the same period.
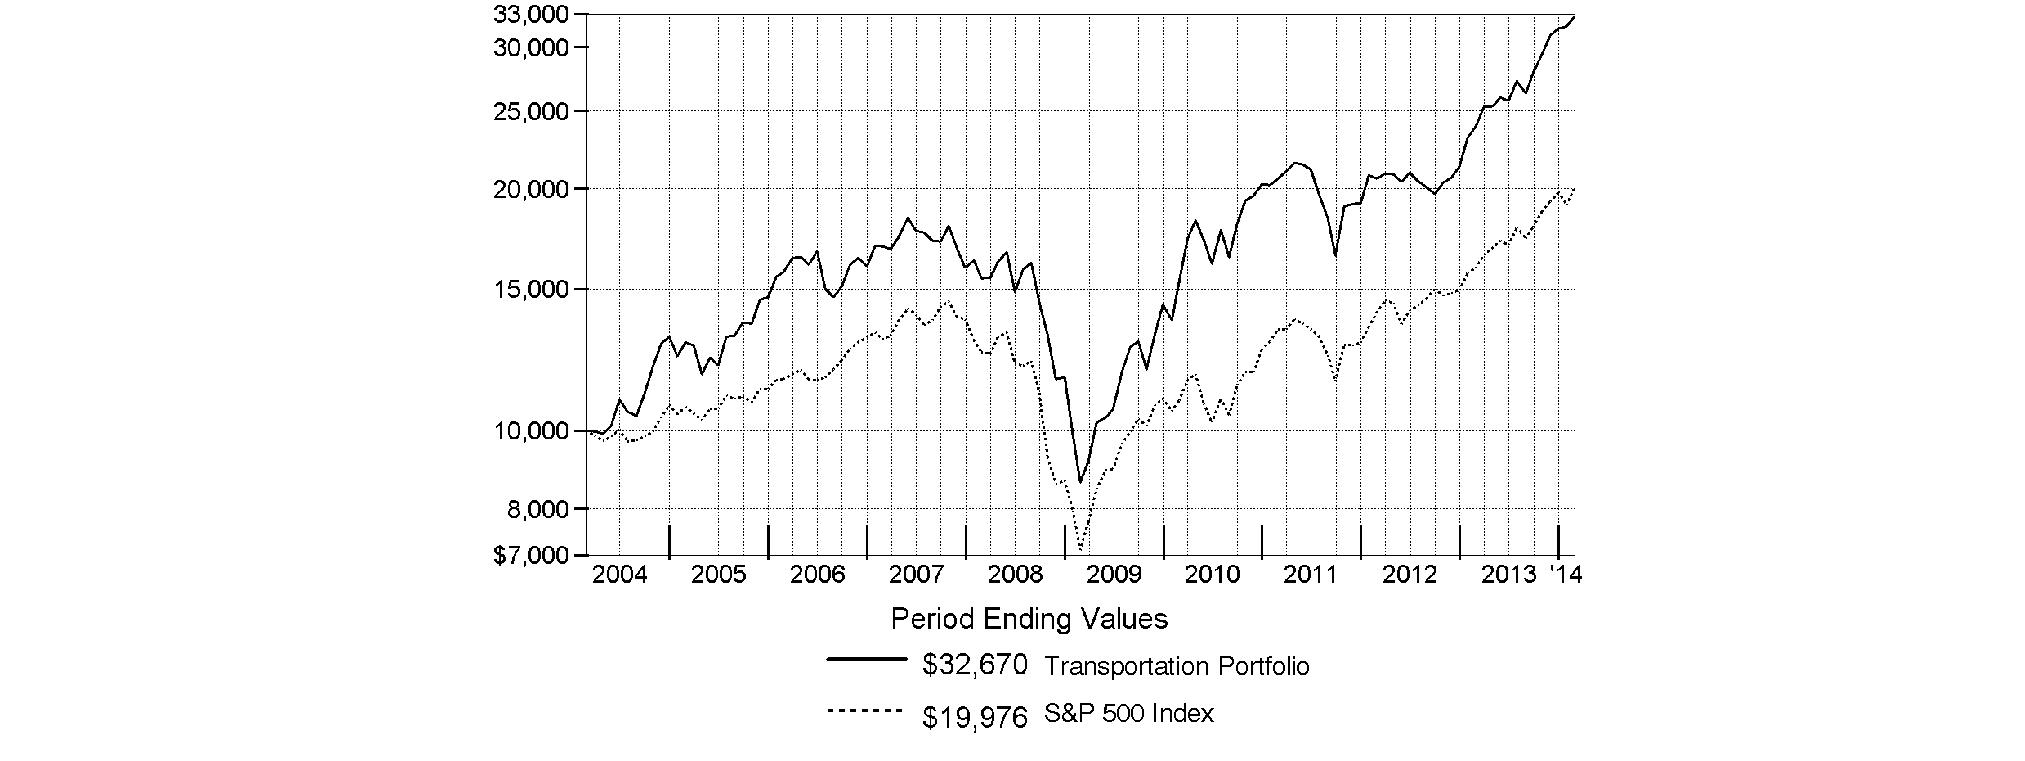
Annual Report
Transportation Portfolio
Management's Discussion of Fund Performance
Market Recap: Stocks overcame fears of higher interest rates - not to mention their worst January in four years - to finish sharply higher for the 12 months ending February 28, 2014. The broad S&P 500® Index and the blue-chip Dow Jones Industrial AverageSM gained 25.37% and 19.01%, respectively, amid generally favorable earnings reports and accommodative monetary policies worldwide. Performance generally increased along the risk spectrum, with smaller-cap and growth strategies leading the way. An ebullient market helped the growth-oriented Nasdaq Composite Index® to a 38.10% period gain, for example. On the other hand, both cyclical and defensive stocks had representation in the top-performing industry sectors: returns were highest in health care and consumer discretionary; lowest in utilities and telecommunication services. From a macroeconomic perspective, data still points to slow but steady improvement in the U.S., and Europe's recession may well be over. Reports from China have disappointed, but continue to suggest a relatively soft landing there. Mixed signals from the U.S. Federal Reserve as to when it might curtail its stimulative bond buying kept markets in flux during the spring and summer. Stocks regained momentum in October despite a federal budget impasse and brief government shutdown, and lower volatility prevailed through year-end. Shedding new-year concerns about China's economy, an emerging-markets sell-off and confirmation (at last) of Fed tapering - alongside confirmation of a presumably dovish Janet Yellen as new Fed chair - February saw stocks back in record territory, bearing down on the five-year anniversary of the market's bottom.
Comments from Matthew Moulis, Portfolio Manager of Transportation Portfolio: For the year, the fund returned 36.60%, topping the 34.54% gain of the MSCI® U.S. IMI Transportation 25-50 Index and also outpacing the S&P 500®. Versus the broader market, transportation stocks were particularly bolstered by outstanding performance in airlines. Meanwhile, the air freight & logistics group considerably lagged both indexes. During the period, my approach met with considerable success, with both stock selection and market selection adding meaningfully to the fund's performance versus the MSCI industry index. Airlines headed the list of groups that bolstered the portfolio's relative performance. One good example was an overweighting in Spirit Airlines, a smaller carrier with super-low fares. Among the major carriers, the fund significantly benefited from overweighted exposure to Delta Air Lines and American Airlines Group, the latter a company formed by the December 2013 merger of American Airlines and US Airways Group. The fund's holdings in Spirit, Delta and American Airlines Group meaningfully increased during the period. The fund's largest relative contributor was my decision to largely avoid rail carrier Kansas City Southern, an index stock that recorded a single-digit loss. I chose not to own this stock for nearly the entire period, mainly because of its rich valuation. With that said, the stock fell sharply in January, after the firm issued a tepid 2014 financial outlook, and I established a stake here. I'll also mention a non-benchmark stake in Ducommun, a supplier of contoured aerospace structural components for the commercial and military aircraft markets. As our position here rallied to a healthy gain, I sold it to nail down profits. Conversely, Southwest Airlines was one major air carrier I misjudged, as my decision to underweight this index component detracted given the stock's robust advance. Not owning strong-performing index stock Avis Budget Group, an automobile rental provider, also worked against us, as did a lagging non-index stake in Canadian trucker Contrans Group. Lastly, the fund's holdings in cash and cash equivalents were a big drawback in a rising market.
The views expressed above reflect those of the portfolio manager(s) only through the end of the period as stated on the cover of this report and do not necessarily represent the views of Fidelity or any other person in the Fidelity organization. Any such views are subject to change at any time based upon market or other conditions and Fidelity disclaims any responsibility to update such views. These views may not be relied on as investment advice and, because investment decisions for a Fidelity fund are based on numerous factors, may not be relied on as an indication of trading intent on behalf of any Fidelity fund.
Annual Report
Transportation Portfolio
Investment Changes (Unaudited)
Top Ten Stocks as of February 28, 2014 | ||
| % of fund's | % of fund's net assets |
Union Pacific Corp. | 19.5 | 20.0 |
United Parcel Service, Inc. Class B | 14.4 | 16.7 |
Delta Air Lines, Inc. | 7.3 | 6.9 |
FedEx Corp. | 6.6 | 6.0 |
American Airlines Group, Inc. | 5.0 | 1.3 |
Norfolk Southern Corp. | 4.9 | 3.7 |
United Continental Holdings, Inc. | 4.7 | 2.5 |
CSX Corp. | 4.7 | 4.2 |
Spirit Airlines, Inc. | 3.7 | 3.3 |
J.B. Hunt Transport Services, Inc. | 2.7 | 2.9 |
| 73.5 | |
Top Industries (% of fund's net assets) | |||
As of February 28, 2014 | |||
| Road & Rail | 43.7% |
|
| Air Freight & Logistics | 25.4% |
|
| Airlines | 22.9% |
|
| Oil, Gas & Consumable Fuels | 1.5% |
|
| Machinery | 1.3% |
|
| All Others* | 5.2% |
|

As of August 31, 2013 | |||
| Road & Rail | 42.4% |
|
| Air Freight & Logistics | 27.2% |
|
| Airlines | 17.9% |
|
| Machinery | 2.1% |
|
| Oil, Gas & Consumable Fuels | 2.0% |
|
| All Others* | 8.4% |
|

* Includes short-term investments and net other assets (liabilities). |
Annual Report
Transportation Portfolio
Investments February 28, 2014
Showing Percentage of Net Assets
Common Stocks - 97.4% | |||
Shares | Value | ||
AIR FREIGHT & LOGISTICS - 25.1% | |||
Air Freight & Logistics - 25.1% | |||
C.H. Robinson Worldwide, Inc. (d) | 116,096 | $ 6,020,739 | |
Expeditors International of Washington, Inc. | 113,500 | 4,484,385 | |
FedEx Corp. | 222,200 | 29,625,926 | |
Hub Group, Inc. Class A (a) | 121,900 | 4,762,633 | |
Park-Ohio Holdings Corp. (a) | 52,370 | 2,756,757 | |
United Parcel Service, Inc. Class B | 675,500 | 64,692,635 | |
UTi Worldwide, Inc. | 73,500 | 723,240 | |
| 113,066,315 | ||
AIRLINES - 22.9% | |||
Airlines - 22.9% | |||
Air Canada Class A (a) | 160,700 | 863,510 | |
Alaska Air Group, Inc. | 9,700 | 840,408 | |
American Airlines Group, Inc. (a)(d) | 608,400 | 22,468,212 | |
Dart Group PLC | 690,817 | 3,317,146 | |
Delta Air Lines, Inc. | 984,002 | 32,678,706 | |
Southwest Airlines Co. | 219,400 | 4,923,336 | |
Spirit Airlines, Inc. (a) | 293,359 | 16,568,916 | |
United Continental Holdings, Inc. (a) | 475,636 | 21,384,595 | |
| 103,044,829 | ||
CONSTRUCTION & ENGINEERING - 0.3% | |||
Construction & Engineering - 0.3% | |||
Cosco International Holdings Ltd. | 24,000 | 9,927 | |
MasTec, Inc. (a) | 34,900 | 1,428,806 | |
| 1,438,733 | ||
DIVERSIFIED FINANCIAL SERVICES - 0.8% | |||
Multi-Sector Holdings - 0.8% | |||
Berkshire Hathaway, Inc. Class B (a) | 30,800 | 3,566,024 | |
MACHINERY - 1.3% | |||
Construction & Farm Machinery & Heavy Trucks - 1.0% | |||
ASL Marine Holdings Ltd. | 1,403,200 | 774,851 | |
Conrad Industries, Inc. | 42,500 | 1,615,000 | |
Wabtec Corp. | 24,100 | 1,912,817 | |
| 4,302,668 | ||
Industrial Machinery - 0.3% | |||
Global Brass & Copper Holdings, Inc. | 89,700 | 1,518,621 | |
TOTAL MACHINERY | 5,821,289 | ||
MARINE - 0.9% | |||
Marine - 0.9% | |||
Diana Shipping, Inc. (a) | 25,100 | 326,802 | |
| |||
Shares | Value | ||
Kirby Corp. (a) | 31,500 | $ 3,295,215 | |
Matson, Inc. | 18,600 | 448,632 | |
| 4,070,649 | ||
OIL, GAS & CONSUMABLE FUELS - 1.5% | |||
Oil & Gas Storage & Transport - 1.5% | |||
Golar LNG Ltd. (NASDAQ) | 32,800 | 1,200,480 | |
Scorpio Tankers, Inc. | 574,333 | 5,622,720 | |
| 6,823,200 | ||
ROAD & RAIL - 43.7% | |||
Railroads - 31.5% | |||
CSX Corp. | 769,919 | 21,334,455 | |
Genesee & Wyoming, Inc. Class A (a) | 46,900 | 4,639,348 | |
Kansas City Southern | 62,500 | 5,870,000 | |
Norfolk Southern Corp. | 241,400 | 22,187,074 | |
Union Pacific Corp. | 487,168 | 87,875,363 | |
| 141,906,240 | ||
Trucking - 12.2% | |||
AMERCO | 19,900 | 4,635,506 | |
Contrans Group, Inc.: | |||
(sub. vtg.) (a)(e) | 12,800 | 148,195 | |
Class A | 259,300 | 3,002,101 | |
J.B. Hunt Transport Services, Inc. | 168,500 | 12,110,095 | |
Landstar System, Inc. | 135,400 | 7,813,934 | |
Marten Transport Ltd. | 237,300 | 4,624,977 | |
Quality Distribution, Inc. (a) | 454,126 | 5,821,895 | |
Ryder System, Inc. | 61,900 | 4,662,308 | |
Swift Transporation Co. (a)(d) | 305,400 | 7,439,544 | |
Universal Truckload Services, Inc. | 172,089 | 4,474,314 | |
| 54,732,869 | ||
TOTAL ROAD & RAIL | 196,639,109 | ||
TRANSPORTATION INFRASTRUCTURE - 0.9% | |||
Airport Services - 0.9% | |||
BBA Aviation PLC | 412,700 | 2,324,125 | |
Macquarie Infrastructure Co. LLC | 37,000 | 2,004,660 | |
| 4,328,785 | ||
TOTAL COMMON STOCKS (Cost $304,892,794) |
| ||
Convertible Bonds - 0.5% | ||||
| Principal Amount |
| ||
AIR FREIGHT & LOGISTICS - 0.3% | ||||
Air Freight & Logistics - 0.3% | ||||
UTi Worldwide, Inc. 4.5% 3/1/19 (e) | $ 1,100,000 | 1,110,560 | ||
Convertible Bonds - continued | ||||
| Principal Amount | Value | ||
MARINE - 0.2% | ||||
Marine - 0.2% | ||||
DryShips, Inc. 5% 12/1/14 | $ 1,020,000 | $ 1,004,700 | ||
TOTAL CONVERTIBLE BONDS (Cost $2,020,643) |
| |||
Money Market Funds - 8.5% | |||
Shares |
| ||
Fidelity Cash Central Fund, 0.10% (b) | 10,185,349 | 10,185,349 | |
Fidelity Securities Lending Cash Central Fund, 0.09% (b)(c) | 27,967,850 | 27,967,850 | |
TOTAL MONEY MARKET FUNDS (Cost $38,153,199) |
| ||
TOTAL INVESTMENT PORTFOLIO - 106.4% (Cost $345,066,636) | 479,067,392 | ||
NET OTHER ASSETS (LIABILITIES) - (6.4)% | (28,830,827) | ||
NET ASSETS - 100% | $ 450,236,565 | ||
Legend |
(a) Non-income producing |
(b) Affiliated fund that is generally available only to investment companies and other accounts managed by Fidelity Investments. The rate quoted is the annualized seven-day yield of the fund at period end. A complete unaudited listing of the fund's holdings as of its most recent quarter end is available upon request. In addition, each Fidelity Central Fund's financial statements, which are not covered by the Fund's Report of Independent Registered Public Accounting Firm, are available on the SEC's website or upon request. |
(c) Investment made with cash collateral received from securities on loan. |
(d) Security or a portion of the security is on loan at period end. |
(e) Security exempt from registration under Rule 144A of the Securities Act of 1933. These securities may be resold in transactions exempt from registration, normally to qualified institutional buyers. At the end of the period, the value of these securities amounted to $1,258,755 or 0.3% of net assets. |
Affiliated Central Funds |
Information regarding fiscal year to date income earned by the Fund from investments in Fidelity Central Funds is as follows: |
Fund | Income earned |
Fidelity Cash Central Fund | $ 19,770 |
Fidelity Securities Lending Cash Central Fund | 192,536 |
Total | $ 212,306 |
Other Information |
The following is a summary of the inputs used, as of February 28, 2014, involving the Fund's assets and liabilities carried at fair value. The inputs or methodology used for valuing securities may not be an indication of the risk associated with investing in those securities. For more information on valuation inputs, and their aggregation into the levels used in the table below, please refer to the Investment Valuation section in the accompanying Notes to Financial Statements. |
Valuation Inputs at Reporting Date: | ||||
Description | Total | Level 1 | Level 2 | Level 3 |
Investments in Securities: | ||||
Common Stocks | $ 438,798,933 | $ 438,798,933 | $ - | $ - |
Convertible Bonds | 2,115,260 | - | 2,115,260 | - |
Money Market Funds | 38,153,199 | 38,153,199 | - | - |
Total Investments in Securities: | $ 479,067,392 | $ 476,952,132 | $ 2,115,260 | $ - |
See accompanying notes which are an integral part of the financial statements.
Annual Report
Transportation Portfolio
Financial Statements
Statement of Assets and Liabilities
| February 28, 2014 | |
|
|
|
Assets | ||
Investment in securities, at value (including securities loaned of $27,526,315) - See accompanying schedule: Unaffiliated issuers (cost $306,913,437) | $ 440,914,193 |
|
Fidelity Central Funds (cost $38,153,199) | 38,153,199 |
|
Total Investments (cost $345,066,636) |
| $ 479,067,392 |
Receivable for investments sold | 671,291 | |
Receivable for fund shares sold | 828,160 | |
Dividends receivable | 1,328,034 | |
Interest receivable | 12,750 | |
Distributions receivable from Fidelity Central Funds | 34,676 | |
Prepaid expenses | 1,869 | |
Other receivables | 11,019 | |
Total assets | 481,955,191 | |
|
|
|
Liabilities | ||
Payable for investments purchased | $ 1,922,059 | |
Payable for fund shares redeemed | 1,473,263 | |
Accrued management fee | 214,820 | |
Other affiliated payables | 95,336 | |
Other payables and accrued expenses | 45,298 | |
Collateral on securities loaned, at value | 27,967,850 | |
Total liabilities | 31,718,626 | |
|
|
|
Net Assets | $ 450,236,565 | |
Net Assets consist of: |
| |
Paid in capital | $ 309,953,013 | |
Undistributed net investment income | 997,113 | |
Accumulated undistributed net realized gain (loss) on investments and foreign currency transactions | 5,285,683 | |
Net unrealized appreciation (depreciation) on investments | 134,000,756 | |
Net Assets, for 5,902,274 shares outstanding | $ 450,236,565 | |
Net Asset Value, offering price and redemption price per share ($450,236,565 ÷ 5,902,274 shares) | $ 76.28 | |
Statement of Operations
| Year ended February 28, 2014 | |
|
|
|
Investment Income |
|
|
Dividends |
| $ 5,155,184 |
Interest |
| 163,207 |
Income from Fidelity Central Funds (including $192,536 from security lending) |
| 212,306 |
Total income |
| 5,530,697 |
|
|
|
Expenses | ||
Management fee | $ 2,020,240 | |
Transfer agent fees | 784,958 | |
Accounting and security lending fees | 143,093 | |
Custodian fees and expenses | 22,356 | |
Independent trustees' compensation | 6,833 | |
Registration fees | 54,766 | |
Audit | 52,813 | |
Legal | 5,262 | |
Interest | 1,083 | |
Miscellaneous | 3,511 | |
Total expenses before reductions | 3,094,915 | |
Expense reductions | (30,287) | 3,064,628 |
Net investment income (loss) | 2,466,069 | |
Realized and Unrealized Gain (Loss) Net realized gain (loss) on: | ||
Investment securities: |
|
|
Unaffiliated issuers | 18,927,032 | |
Foreign currency transactions | 4,961 | |
Total net realized gain (loss) |
| 18,931,993 |
Change in net unrealized appreciation (depreciation) on: Investment securities | 85,963,373 | |
Assets and liabilities in foreign currencies | (19) | |
Total change in net unrealized appreciation (depreciation) |
| 85,963,354 |
Net gain (loss) | 104,895,347 | |
Net increase (decrease) in net assets resulting from operations | $ 107,361,416 | |
See accompanying notes which are an integral part of the financial statements.
Annual Report
Fund Name
Financial Statements - continued
Statement of Changes in Net Assets
| Year ended | Year ended |
Increase (Decrease) in Net Assets |
|
|
Operations |
|
|
Net investment income (loss) | $ 2,466,069 | $ 1,828,416 |
Net realized gain (loss) | 18,931,993 | 10,688,301 |
Change in net unrealized appreciation (depreciation) | 85,963,354 | 13,212,492 |
Net increase (decrease) in net assets resulting from operations | 107,361,416 | 25,729,209 |
Distributions to shareholders from net investment income | (1,648,470) | (1,327,915) |
Distributions to shareholders from net realized gain | (13,096,986) | (9,827,441) |
Total distributions | (14,745,456) | (11,155,356) |
Share transactions | 409,730,442 | 92,391,282 |
Reinvestment of distributions | 14,261,816 | 10,805,999 |
Cost of shares redeemed | (279,348,974) | (117,466,819) |
Net increase (decrease) in net assets resulting from share transactions | 144,643,284 | (14,269,538) |
Redemption fees | 21,284 | 4,424 |
Total increase (decrease) in net assets | 237,280,528 | 308,739 |
|
|
|
Net Assets | ||
Beginning of period | 212,956,037 | 212,647,298 |
End of period (including undistributed net investment income of $997,113 and undistributed net investment income of $516,572, respectively) | $ 450,236,565 | $ 212,956,037 |
Other Information Shares | ||
Sold | 6,177,345 | 1,719,810 |
Issued in reinvestment of distributions | 204,327 | 208,394 |
Redeemed | (4,167,235) | (2,251,011) |
Net increase (decrease) | 2,214,437 | (322,807) |
Financial Highlights
Years ended February 28, | 2014 | 2013 | 2012 F | 2011 | 2010 |
Selected Per-Share Data |
|
|
|
|
|
Net asset value, beginning of period | $ 57.75 | $ 53.02 | $ 56.26 | $ 42.01 | $ 23.89 |
Income from Investment Operations |
|
|
|
|
|
Net investment income (loss) B | .45 | .51 | .26 | .27 | .29 |
Net realized and unrealized gain (loss) | 20.44 | 7.59 | (.34) | 14.13 | 18.21 |
Total from investment operations | 20.89 | 8.10 | (.08) | 14.40 | 18.50 |
Distributions from net investment income | (.27) | (.41) | (.17) | (.17) | (.36) |
Distributions from net realized gain | (2.09) | (2.96) | (2.99) | - | (.02) |
Total distributions | (2.36) | (3.37) | (3.16) | (.17) | (.38) |
Redemption fees added to paid in capital B | - G | - G | - G | .02 | - G |
Net asset value, end of period | $ 76.28 | $ 57.75 | $ 53.02 | $ 56.26 | $ 42.01 |
Total Return A | 36.60% | 16.10% | .16% | 34.32% | 77.62% |
Ratios to Average Net Assets C,E |
|
|
|
|
|
Expenses before reductions | .85% | .89% | .88% | .90% | 1.03% |
Expenses net of fee waivers, if any | .85% | .89% | .88% | .90% | 1.03% |
Expenses net of all reductions | .84% | .86% | .87% | .90% | 1.00% |
Net investment income (loss) | .68% | .98% | .49% | .53% | .90% |
Supplemental Data |
|
|
|
|
|
Net assets, end of period (000 omitted) | $ 450,237 | $ 212,956 | $ 212,647 | $ 467,230 | $ 107,842 |
Portfolio turnover rate D | 78% | 47% | 82% | 114% | 265% |
A Total returns would have been lower if certain expenses had not been reduced during the applicable periods shown. B Calculated based on average shares outstanding during the period. C Fees and expenses of any underlying Fidelity Central Funds are not included in the Fund's expense ratio. The Fund indirectly bears its proportionate share of the expenses of any underlying Fidelity Central Funds. D Amount does not include the portfolio activity of any underlying Fidelity Central Funds. E Expense ratios reflect operating expenses of the Fund. Expenses before reductions do not reflect amounts reimbursed by the investment adviser or reductions from brokerage service arrangements or reductions from other expense offset arrangements and do not represent the amount paid by the Fund during periods when reimbursements or reductions occur. Expenses net of fee waivers reflect expenses after reimbursement by the investment adviser but prior to reductions from brokerage service arrangements or other expense offset arrangements. Expenses net of all reductions represent the net expenses paid by the Fund. F For the year ended February 29. G Amount represents less than $.01 per share. |
See accompanying notes which are an integral part of the financial statements.
Annual Report
Notes to Financial Statements
For the period ended February 28, 2014
1. Organization.
Air Transportation Portfolio, Defense and Aerospace Portfolio, Environment and Alternative Energy Portfolio, Industrial Equipment Portfolio, Industrials Portfolio and Transportation Portfolio (the Funds) are non-diversified funds of Fidelity Select Portfolios (the Trust). The Trust is registered under the Investment Company Act of 1940, as amended (the 1940 Act), as an open-end management investment company organized as a Massachusetts business trust. The Funds invest primarily in securities of companies whose principal business activities fall within specific industries. Each Fund is authorized to issue an unlimited number of shares.
2. Investments in Fidelity Central Funds.
The Funds invest in Fidelity Central Funds, which are open-end investment companies generally available only to other investment companies and accounts managed by the investment adviser and its affiliates. The Funds' Schedules of Investments list each of the Fidelity Central Funds held as of period end, if any, as an investment of each Fund, but do not include the underlying holdings of each Fidelity Central Fund. As an Investing Fund, each Fund indirectly bears its proportionate share of the expenses of the underlying Fidelity Central Funds.
Based on its investment objective, each Fidelity Central Fund may invest or participate in various investment vehicles or strategies that are similar to those of each Fund. These strategies are consistent with the investment objectives of each Fund and may involve certain economic risks which may cause a decline in value of each of the Fidelity Central Funds and thus a decline in the value of each Fund. The Money Market Central Funds seek preservation of capital and current income and are managed by Fidelity Investments Money Management, Inc. (FIMM), an affiliate of the investment adviser. Annualized expenses of the Money Market Central Funds as of their most recent shareholder report date are less than .01%.
A complete unaudited list of holdings for each Fidelity Central Fund is available upon request or at the Securities and Exchange Commission (the SEC) website at www.sec.gov. In addition, the financial statements of the Fidelity Central Funds, which are not covered by the Funds' Report of Independent Registered Public Accounting Firm, are available on the SEC website or upon request.
3. Significant Accounting Policies.
The financial statements have been prepared in conformity with accounting principles generally accepted in the United States of America (GAAP), which require management to make certain estimates and assumptions at the date of the financial statements. Actual results could differ from those estimates. Subsequent events, if any, through the date that the financial statements were issued have been evaluated in the preparation of the financial statements. The following summarizes the significant accounting policies of the Funds:
Investment Valuation. Investments are valued as of 4:00 p.m. Eastern time on the last calendar day of the period. In accordance with valuation policies and procedures approved by the Board of Trustees (the Board), each Fund attempts to obtain prices from one or more third party pricing vendors or brokers to value its investments. When current market prices, quotations or currency exchange rates are not readily available or reliable, investments will be fair valued in good faith by the Fidelity SelectCo, LLC (SelectCo) Fair Value Committee (the Committee), in accordance with procedures adopted by the Board. Factors used in determining fair value vary by investment type and may include market or investment specific events, changes in interest rates and credit quality. The frequency with which these procedures are used cannot be predicted and they may be utilized to a significant extent. The Committee oversees each Fund's valuation policies and procedures and is responsible for approving and reporting to the Board all fair value determinations.
Each Fund categorizes the inputs to valuation techniques used to value their investments into a disclosure hierarchy consisting of three levels as shown below:
Level 1 - quoted prices in active markets for identical investments
Level 2 - other significant observable inputs (including quoted prices for similar investments, interest rates, prepayment speeds, etc.)
Level 3 - unobservable inputs (including the Fund's own assumptions based on the best information available)
Valuation techniques used to value each Fund's investments by major category are as follows:
Equity securities, including restricted securities, for which market quotations are readily available, are valued at the last reported sale price or official closing price as reported by a third party pricing vendor on the primary market or exchange on which they are traded and are categorized as Level 1 in the hierarchy. In the event there were no sales during the day or closing prices are not available, securities are valued at the last quoted bid price or may be valued using the last available price and are generally categorized as Level 2 in the hierarchy. For foreign equity securities, when market or security specific events arise, comparisons to the valuation of American Depositary Receipts (ADRs), futures contracts, Exchange-Traded Funds (ETFs) and certain indexes as well as quoted prices for similar securities may be used and would be categorized as Level 2 in the hierarchy. Utilizing these techniques may result in transfers between Level 1 and Level 2. For equity securities, including restricted securities, where observable inputs are limited, assumptions about market activity and risk are used and these securities may be categorized as Level 3 in the hierarchy.
Annual Report
3. Significant Accounting Policies - continued
Investment Valuation - continued
Debt securities, including restricted securities, are valued based on evaluated prices received from third party pricing vendors or from brokers who make markets in such securities. Corporate bonds are valued by pricing vendors who utilize matrix pricing which considers yield or price of bonds of comparable quality, coupon, maturity and type or by broker-supplied prices. When independent prices are unavailable or unreliable, debt securities may be valued utilizing pricing methodologies which consider similar factors that would be used by third party pricing vendors. Debt securities are generally categorized as Level 2 in the hierarchy but may be Level 3 depending on the circumstances.
Investments in open-end mutual funds, including the Fidelity Central Funds, are valued at their closing net asset value (NAV) each business day and are categorized as Level 1 in the hierarchy.
Changes in valuation techniques may result in transfers in or out of an assigned level within the disclosure hierarchy. The aggregate value of investments by input level, as of February 28, 2014, is included at the end of each applicable Fund's Schedule of Investments.
Foreign Currency. The Funds may use foreign currency contracts to facilitate transactions in foreign-denominated securities. Gains and losses from these transactions may arise from changes in the value of the foreign currency or if the counterparties do not perform under the contracts' terms.
Foreign-denominated assets, including investment securities, and liabilities are translated into U.S. dollars at the exchange rates at period end. Purchases and sales of investment securities, income and dividends received and expenses denominated in foreign currencies are translated into U.S. dollars at the exchange rate in effect on the transaction date.
The effects of exchange rate fluctuations on investments are included with the net realized and unrealized gain (loss) on investment securities. Other foreign currency transactions resulting in realized and unrealized gain (loss) are disclosed separately.
Investment Transactions and Income. For financial reporting purposes, the Funds' investment holdings and NAV include trades executed through the end of the last business day of the period. The NAV per share for processing shareholder transactions is calculated as of the close of business of the New York Stock Exchange (NYSE), normally 4:00 p.m. Eastern time and includes trades executed through the end of the prior business day. Gains and losses on securities sold are determined on the basis of identified cost and may include proceeds received from litigation. Dividend income is recorded on the ex-dividend date, except for certain dividends from foreign securities where the ex-dividend date may have passed, which are recorded as soon as the Funds are informed of the ex-dividend date. Non-cash dividends included in dividend income, if any, are recorded at the fair market value of the securities received. Distributions received on securities that represent a return of capital or capital gain are recorded as a reduction of cost of investments and/or as a realized gain. Subsequent to ex-dividend date the Funds determine the components of these distributions, based upon receipt of tax filings or other correspondence relating to the underlying investment. Interest income and distributions from the Fidelity Central Funds are accrued as earned. Interest income includes coupon interest and amortization of premium and accretion of discount on debt securities. Investment income is recorded net of foreign taxes withheld where recovery of such taxes is uncertain.
Expenses. Expenses directly attributable to a fund are charged to that fund. Expenses attributable to more than one fund are allocated among the respective funds on the basis of relative net assets or other appropriate methods. Expense estimates are accrued in the period to which they relate and adjustments are made when actual amounts are known.
Deferred Trustee Compensation. Under a Deferred Compensation Plan (the Plan) for Defense and Aerospace Portfolio and Industrials Portfolio, independent Trustees may elect to defer receipt of a portion of their annual compensation. Deferred amounts are invested in a cross-section of Fidelity funds, are marked-to-market and remain in the Fund until distributed in accordance with the Plan. The investment of deferred amounts and the offsetting payable to the Trustees are included in the accompanying Statement of Assets and Liabilities.
Income Tax Information and Distributions to Shareholders. Each year, each Fund intends to qualify as a regulated investment company under Subchapter M of the Internal Revenue Code, including distributing substantially all of its taxable income and realized gains. As a result, no provision for U.S. Federal income taxes is required. As of February 28, 2014, each Fund did not have any unrecognized tax benefits in the financial statements; nor is each Fund aware of any tax positions for which it is reasonably possible that the total amounts of unrecognized tax benefits will significantly change in the next twelve months. Each Fund files a U.S. federal tax return, in addition to state and local tax returns as required. The Fund's federal income tax returns are subject to examination by the Internal Revenue Service (IRS) for a period of three fiscal years after they are filed. State and local tax returns may be subject to examination for an additional fiscal year depending on the jurisdiction. Foreign taxes are provided for based on each Fund's understanding of the tax rules and rates that exist in the foreign markets in which it invests.
Distributions are declared and recorded on the ex-dividend date. Income and capital gain distributions are determined in accordance with income tax regulations, which may differ from GAAP. In addition, certain Funds claimed a portion of the payment made to redeeming shareholders as a distribution for income tax purposes.
Capital accounts within the financial statements are adjusted for permanent book-tax differences. These adjustments have no impact on net assets or the results of operations. Capital accounts are not adjusted for temporary book-tax differences which will reverse in a subsequent period.
Book-tax differences are primarily due to futures contracts, foreign currency transactions, certain foreign taxes, market discount, passive foreign investment companies (PFIC), equity-debt classifications, original issue discount, deferred trustees compensation, capital loss carryforwards and losses deferred due to wash sales and excise tax regulations.
Annual Report
Notes to Financial Statements - continued
3. Significant Accounting Policies - continued
Income Tax Information and Distributions to Shareholders - continued
The federal tax cost of investment securities and unrealized appreciation (depreciation) as of period end were as follows for each Fund:
| Tax cost | Gross unrealized | Gross unrealized | Net unrealized |
Air Transportation Portfolio | ||||
Defense and Aerospace Portfolio | 725,005,100 | 301,681,062 | (7,681,266) | 293,999,796 |
Environment and Alternative Energy Portfolio | 85,498,726 | 28,189,401 | (3,416,963) | 24,772,438 |
Industrial Equipment Portfolio | 334,832,947 | 89,303,669 | (2,338,533) | 86,965,136 |
Industrials Portfolio | 905,233,033 | 306,039,011 | (5,521,931) | 300,517,080 |
Transportation Portfolio | 345,861,226 | 136,157,311 | (2,951,145) | 133,206,166 |
The tax-based components of distributable earnings as of period end were as follows for each Fund:
| Undistributed | Undistributed long-term capital gain | Capital loss | Net unrealized appreciation |
Air Transportation Portfolio | $ 777,664 | $ 1,085,077 | $ - | $ 77,745,851 |
Defense and Aerospace Portfolio | 1,574,646 | 35,440,379 | - | 293,999,796 |
Environment and Alternative Energy Portfolio | 125,739 | - | (5,233,886) | 24,772,492 |
Industrial Equipment Portfolio | 9,884,888 | 25,708,706 | - | 86,963,820 |
Industrials Portfolio | 7,792,890 | 56,703,249 | - | 300,516,439 |
Transportation Portfolio | 3,257,575 | 3,819,813 | - | 133,206,166 |
Capital loss carryforwards are only available to offset future capital gains of the Funds to the extent provided by regulations and may be limited. Under the Regulated Investment Company Modernization Act of 2010 (the Act), the Funds are permitted to carry forward capital losses incurred in taxable years beginning after December 22, 2010 for an unlimited period and such capital losses are required to be used prior to any losses that expire. The capital loss carryforward information presented below, including any applicable limitation, is estimated as of fiscal period end and is subject to adjustment.
| Fiscal year of |
|
| 2018 | Total with |
Environment and Alternative Energy Portfolio | (5,233,886) | (5,233,886) |
The tax character of distributions paid was as follows:
February 28, 2014 |
|
|
|
| Ordinary Income | Long-term | Total |
Air Transportation Portfolio | $ 2,624,982 | $ 4,525,149 | $ 7,150,131 |
Defense and Aerospace Portfolio | 18,368,747 | 29,250,815 | 47,619,562 |
Environment and Alternative Energy Portfolio | 701,353 | - | 701,353 |
Industrial Equipment Portfolio | 5,151,118 | 22,015,419 | 27,166,537 |
Industrials Portfolio | 30,761,814 | 38,530,254 | 69,292,068 |
Transportation Portfolio | 8,618,771 | 6,126,685 | 14,745,456 |
February 28, 2013 |
|
|
|
| Ordinary Income | Long-term | Total |
Air Transportation Portfolio | $ 278,547 | $ 1,241,145 | $ 1,519,692 |
Defense and Aerospace Portfolio | 8,717,067 | 1,406,058 | 10,123,125 |
Environment and Alternative Energy Portfolio | 630,649 | - | 630,649 |
Industrial Equipment Portfolio | 3,854,247 | - | 3,854,247 |
Industrials Portfolio | 6,549,531 | 4,823,532 | 11,373,063 |
Transportation Portfolio | 1,327,915 | 9,827,441 | 11,155,356 |
Annual Report
3. Significant Accounting Policies - continued
Trading (Redemption) Fees. Shares held by investors in the Funds less than 30 days may be subject to a redemption fee equal to .75% of the NAV of shares redeemed. All redemption fees, which reduce the proceeds of the shareholder redemption, are retained by the Funds and accounted for as an addition to paid in capital.
Restricted Securities. The Funds may invest in securities that are subject to legal or contractual restrictions on resale. These securities generally may be resold in transactions exempt from registration or to the public if the securities are registered. Disposal of these securities may involve time-consuming negotiations and expense, and prompt sale at an acceptable price may be difficult. Information regarding restricted securities is included at the end of each applicable Fund's Schedule of Investments.
4. Derivative Instruments.
Risk Exposures and the Use of Derivative Instruments. Industrials Portfolio's (The Fund) investment objective allows the Fund to enter into various types of derivative contracts, including futures contracts. Derivatives are investments whose value is primarily derived from underlying assets, indices or reference rates and may be transacted on an exchange or over-the-counter (OTC). Derivatives may involve a future commitment to buy or sell a specified asset based on specified terms, to exchange future cash flows at periodic intervals based on a notional principal amount, or for one party to make one or more payments upon the occurrence of specified events in exchange for periodic payments from the other party.
The Fund used derivatives to increase returns and to manage exposure to certain risks as defined below. The success of any strategy involving derivatives depends on analysis of numerous economic factors, and if the strategies for investment do not work as intended, the Fund may not achieve its objectives.
The Fund's use of derivatives increased or decreased its exposure to the following risk:
Equity Risk | Equity risk relates to the fluctuations in the value of financial instruments as a result of changes in market prices (other than those arising from interest rate risk or foreign exchange risk), whether caused by factors specific to an individual investment, its issuer, or all factors affecting all instruments traded in a market or market segment. |
The Fund is also exposed to additional risks from investing in derivatives, such as liquidity risk and counterparty credit risk. Liquidity risk is the risk that the Fund will be unable to close out the derivative in the open market in a timely manner. Counterparty credit risk is the risk that the counterparty will not be able to fulfill its obligation to the Fund. Counterparty credit risk related to exchange-traded futures contracts may be mitigated by the protection provided by the exchange on which they trade.
Investing in derivatives may involve greater risks than investing in the underlying assets directly and, to varying degrees, may involve risk of loss in excess of any initial investment and collateral received and amounts recognized in the Statement of Assets and Liabilities. In addition, there may be the risk that the change in value of the derivative contract does not correspond to the change in value of the underlying instrument.
Futures Contracts. A futures contract is an agreement between two parties to buy or sell a specified underlying instrument for a fixed price at a specified future date. The Fund used futures contracts to manage its exposure to the stock market.
Upon entering into a futures contract, a fund is required to deposit either cash or securities (initial margin) with a clearing broker in an amount equal to a certain percentage of the face value of the contract. Futures contracts are marked-to-market daily and subsequent daily payments (variation margin) are made or received by a fund depending on the daily fluctuations in the value of the futures contracts and are recorded as unrealized appreciation or (depreciation). This receivable and/or payable, if any, is included in daily variation margin for derivative instruments in the Statement of Assets and Liabilities. Realized gain or (loss) is recorded upon the expiration or closing of a futures contract.
Any open futures contracts at period end are presented in the Schedule of Investments under the caption "Futures Contracts." The underlying face amount at value reflects each contract's exposure to the underlying instrument or index at period end.
During the period the Fund recognized recognized net realized gain (loss) of $231,285 and a change in net unrealized appreciation (depreciation) of $(304,345) related to its investment in futures contracts. This amount is included in the Statement of Operations.
Annual Report
Notes to Financial Statements - continued
5. Purchases and Sales of Investments.
Purchases and sales of securities, other than short-term securities, are noted in the table below.
| Purchases ($) | Sales ($) |
Air Transportation Portfolio | 461,478,928 | 263,597,857 |
Defense and Aerospace Portfolio | 533,757,914 | 372,802,345 |
Environment and Alternative Energy Portfolio | 23,634,549 | 24,563,299 |
Industrial Equipment Portfolio | 380,607,724 | 401,583,968 |
Industrials Portfolio | 613,263,153 | 809,408,989 |
Transportation Portfolio | 407,899,839 | 269,298,038 |
6. Fees and Other Transactions with Affiliates.
Management Fee. Effective August 1, 2013, SelectCo replaced Fidelity Management and Research Company (FMR), an affiliate of SelectCo, as investment adviser to the Funds. The investment adviser and its affiliates provide the Funds with investment management related services for which the Funds pay a monthly management fee. The management fee is the sum of an individual fund fee rate and an annualized group fee rate. The individual fund fee rate is applied to each Fund's average net assets. The group fee rate is based upon the average net assets of all the mutual funds advised by FMR and the investment adviser. The group fee rate decreases as assets under management increase and increases as assets under management decrease. For the reporting period, each Fund's annual management fee rate expressed as a percentage of each Fund's average net assets was as follows.
| Individual Rate | Group Rate | Total |
Air Transportation Portfolio | .30% | .25% | .56% |
Defense and Aerospace Portfolio | .30% | .25% | .55% |
Environment and Alternative Energy Portfolio | .30% | .25% | .55% |
Industrial Equipment Portfolio | .30% | .25% | .55% |
Industrials Portfolio | .30% | .25% | .55% |
Transportation Portfolio | .30% | .25% | .55% |
Transfer Agent Fees. Fidelity Investments Institutional Operations Company, Inc. (FIIOC), an affiliate of the investment adviser, is the Funds' transfer, dividend disbursing and shareholder servicing agent. FIIOC receives account fees and asset-based fees that vary according to account size and type of account. FIIOC pays for typesetting, printing and mailing of shareholder reports, except proxy statements. For the period, transfer agent fees were equivalent to the following annual rates expressed as a percentage of average net assets:
Air Transportation Portfolio | .21% |
Defense and Aerospace Portfolio | .20% |
Environment and Alternative Energy Portfolio | .28% |
Industrial Equipment Portfolio | .16% |
Industrials Portfolio | .21% |
Transportation Portfolio | .22% |
Accounting and Security Lending Fees. Fidelity Service Company, Inc. (FSC), an affiliate of the investment adviser, maintains each Fund's accounting records. The accounting fee is based on the level of average net assets for each month. Under a separate contract, FSC administers the security lending program. The security lending fee is based on the number and duration of lending transactions.
Brokerage Commissions. Certain Funds placed a portion of their portfolio transactions with brokerage firms which are affiliates of the investment adviser. Brokerage commissions are included in net realized gain (loss) and change in net unrealized appreciation (depreciation) in the Statement of Operations. The commissions paid to these affiliated firms were as follows:
| Amount |
Air Transportation Portfolio | $ 20,381 |
Defense and Aerospace Portfolio | 8,482 |
Environment and Alternative Energy Portfolio | 886 |
Industrial Equipment Portfolio | 11,112 |
Industrials Portfolio | 19,935 |
Transportation Portfolio | 18,703 |
Annual Report
6. Fees and Other Transactions with Affiliates - continued
Interfund Lending Program. Pursuant to an Exemptive Order issued by the SEC, the Funds, along with other registered investment companies having management contracts with FMR or other affiliated entities of FMR, may participate in an interfund lending program. This program provides an alternative credit facility allowing the funds to borrow from, or lend money to, other participating affiliated funds. At period end, Air Transportation Portfolio, Industrial Equipment Portfolio, Industrials Portfolio and Transportation Portfolio had no interfund loans outstanding. Defense and Aerospace Portfolio's open loans, including accrued interest, at period end are presented under the caption "Notes payable to affiliates" in the Statement of Assets and Liabilities. Each applicable fund's activity in this program during the period for which loans were outstanding was as follows:
| Borrower or | Average Loan Balance | Weighted | Interest |
Air Transportation Portfolio | Borrower | $ 23,076,857 | .30% | $ 1,368 |
Defense and Aerospace Portfolio | Borrower | 6,257,000 | .31% | 213 |
Industrial Equipment Portfolio | Borrower | 14,138,200 | .32% | 627 |
Industrials Portfolio | Borrower | 10,783,833 | .31% | 1,649 |
Transportation Portfolio | Borrower | 25,493,000 | .31% | 1,083 |
7. Committed Line of Credit.
Certain Funds participate with other funds managed by the investment adviser or an affiliate in a $4.25 billion credit facility (the "line of credit") to be utilized for temporary or emergency purposes to fund shareholder redemptions or for other short-term liquidity purposes. The participating funds have agreed to pay commitment fees on their pro-rata portion of the line of credit, which are reflected in Miscellaneous expenses on the Statement of Operations, and are as follows:
Air Transportation Portfolio | $ 310 |
Defense and Aerospace Portfolio | 1,433 |
Environment and Alternative Energy Portfolio | 162 |
Industrial Equipment Portfolio | 741 |
Industrials Portfolio | 1,911 |
Transportation Portfolio | 600 |
During the period, there were no borrowings on this line of credit.
8. Security Lending.
Certain Funds lend portfolio securities through a lending agent from time to time in order to earn additional income. For equity securities, a lending agent is used and may loan securities to certain qualified borrowers, which prior to August 1, 2013 included Fidelity Capital Markets (FCM), a broker-dealer affiliated with the Funds. On the settlement date of the loan, each applicable Fund receives collateral (in the form of U.S. Treasury obligations, letters of credit and/or cash) against the loaned securities and maintains collateral in an amount not less than 100% of the market value of the loaned securities during the period of the loan. The market value of the loaned securities is determined at the close of business of the Funds and any additional required collateral is delivered to the Funds on the next business day. If the borrower defaults on its obligation to return the securities loaned because of insolvency or other reasons, the Funds may apply collateral received from the borrower against the obligation. The Funds may experience delays and costs in recovering the securities loaned. Any cash collateral received is invested in the Fidelity Securities Lending Cash Central Fund. The value of loaned securities and cash collateral at period end are disclosed on each applicable Fund's Statement of Assets and Liabilities. Security lending income represents the income earned on investing cash collateral, less rebates paid to borrowers and any lending agent fees associated with the loan, plus any premium payments received for lending certain types of securities.
Security lending income is presented on each applicable Fund's Statement of Operations as a component of income from Fidelity Central Funds. During the period, there were no securities loaned to FCM.
Annual Report
Notes to Financial Statements - continued
9. Bank Borrowings.
Each Fund is permitted to have bank borrowings for temporary or emergency purposes to fund shareholder redemptions or for other short-term liquidity requirements. Each Fund has established borrowing arrangements with certain banks. The interest rate on the borrowings is the bank's base rate, as revised from time to time. At period end, there were no bank borrowings outstanding. Each applicable Fund's activity in this program during the period for which loans were outstanding was as follows:
| Average Loan | Weighted | Interest |
Industrials Portfolio | $ 8,320,800 | .57% | $ 654 |
10. Expense Reductions.
Commissions paid to certain brokers with whom the investment adviser, or its affiliates, places trades on behalf of Certain Funds include an amount in addition to trade execution, which may be rebated back to the Funds to offset certain expenses. In addition, through arrangements with each applicable Fund's custodian, credits realized as a result of uninvested cash balances were used to reduce each applicable Fund's expenses. All of the applicable expense reductions are noted in the table below.
| Brokerage Service | Custody expense |
Air Transportation Portfolio | $ 38,366 | $ 29 |
Defense and Aerospace Portfolio | 14,144 | 9 |
Environment and Alternative Energy Portfolio | 1,135 | - |
Industrial Equipment Portfolio | 22,090 | - |
Industrials Portfolio | 43,046 | - |
Transportation Portfolio | 28,347 | 8 |
In addition, FMR reimbursed a portion of each Fund's operating expenses during the period as follows:
| Reimbursement |
Air Transportation Portfolio | $ 712 |
Defense and Aerospace Portfolio | 4,468 |
Environment and Alternative Energy Portfolio | 1,075 |
Industrial Equipment Portfolio | 1,090 |
Industrials Portfolio | 1,910 |
Transportation Portfolio | 1,932 |
11. Other.
The Funds' organizational documents provide former and current trustees and officers with a limited indemnification against liabilities arising in connection with the performance of their duties to the Funds. In the normal course of business, the Funds may also enter into contracts that provide general indemnifications. The Funds' maximum exposure under these arrangements is unknown as this would be dependent on future claims that may be made against the Funds. The risk of material loss from such claims is considered remote.
At the end of the period, Fidelity VIP Funds Manager 60% Portfolio was the owner of record of approximately 30% and 18% of the total outstanding shares of the Industrial Equipment Portfolio and Industrials Portfolio, respectively. Strategic Advisers U.S. Opportunities Fund was the owner of record of approximately 16%, 15% and 12% of the total outstanding shares of the Air Transportation Portfolio, Industrials Portfolio and Transportation Portfolio, respectively. Mutual funds managed by the investment adviser or its affiliates were the owners of record in the aggregate, of approximately 27%, 43%, 48% and 23% of the total outstanding shares of Air Transportation Portfolio, Industrial Equipment Portfolio, Industrials Portfolio and Transportation Portfolio, respectively.
Annual Report
Report of Independent Registered Public Accounting Firm
To the Trustees of Fidelity Select Portfolios and the Shareholders of Air Transportation Portfolio, Defense and Aerospace Portfolio, Environment and Alternative Energy Portfolio, Industrial Equipment Portfolio, Industrials Portfolio and Transportation Portfolio:
In our opinion, the accompanying statements of assets and liabilities, including the schedules of investments, and the related statements of operations and of changes in net assets and the financial highlights present fairly, in all material respects, the financial positions of Air Transportation Portfolio, Defense and Aerospace Portfolio, Environment and Alternative Energy Portfolio, Industrial Equipment Portfolio, Industrials Portfolio and Transportation Portfolio (funds of Fidelity Select Portfolios) at February 28, 2014, the results of each of their operations for the year then ended, the changes in each of their net assets for each of the two years in the period then ended and the financial highlights for each of the five years in the period then ended, in conformity with accounting principles generally accepted in the United States of America. These financial statements and financial highlights (hereafter referred to as "financial statements") are the responsibility of the Fidelity Select Portfolios' management. Our responsibility is to express an opinion on these financial statements based on our audits. We conducted our audits of these financial statements in accordance with the standards of the Public Company Accounting Oversight Board (United States). Those standards require that we plan and perform the audit to obtain reasonable assurance about whether the financial statements are free of material misstatement. An audit includes examining, on a test basis, evidence supporting the amounts and disclosures in the financial statements, assessing the accounting principles used and significant estimates made by management, and evaluating the overall financial statement presentation. We believe that our audits, which included confirmation of securities at February 28, 2014 by correspondence with the custodian and brokers, provide a reasonable basis for our opinion.
PricewaterhouseCoopers LLP
Boston, Massachusetts
April 17, 2014
Annual Report
Trustees and Officers
The Trustees and officers of the trust and funds, as applicable, are listed below. The Board of Trustees governs each fund and is responsible for protecting the interests of shareholders. The Trustees are experienced executives who meet periodically throughout the year to oversee each fund's activities, review contractual arrangements with companies that provide services to each fund, oversee management of the risks associated with such activities and contractual arrangements, and review each fund's performance. Except for Ned C. Lautenbach and William S. Stavropoulos, each of the Trustees oversees 74 funds. Mr. Lautenbach and Mr. Stavropoulos each oversees 246 funds.
The Trustees hold office without limit in time except that (a) any Trustee may resign; (b) any Trustee may be removed by written instrument, signed by at least two-thirds of the number of Trustees prior to such removal; (c) any Trustee who requests to be retired or who has become incapacitated by illness or injury may be retired by written instrument signed by a majority of the other Trustees; and (d) any Trustee may be removed at any special meeting of shareholders by a two-thirds vote of the outstanding voting securities of the trust. The officers hold office without limit in time, except that any officer may resign or may be removed by a vote of a majority of the Trustees at any regular meeting or any special meeting of the Trustees. Except as indicated, each individual has held the office shown or other offices in the same company for the past five years.
Experience, Skills, Attributes, and Qualifications of the Funds' Trustees. The Governance and Nominating Committee has adopted a statement of policy that describes the experience, qualifications, attributes, and skills that are necessary and desirable for potential Independent Trustee candidates (Statement of Policy). The Board believes that each Trustee satisfied at the time he or she was initially elected or appointed a Trustee, and continues to satisfy, the standards contemplated by the Statement of Policy. The Governance and Nominating Committee also engages professional search firms to help identify potential Independent Trustee candidates who have the experience, qualifications, attributes, and skills consistent with the Statement of Policy. From time to time, additional criteria based on the composition and skills of the current Independent Trustees, as well as experience or skills that may be appropriate in light of future changes to board composition, business conditions, and regulatory or other developments, have also been considered by the professional search firms and the Governance and Nominating Committee. In addition, the Board takes into account the Trustees' commitment and participation in Board and committee meetings, as well as their leadership of standing and ad hoc committees throughout their tenure.
In determining that a particular Trustee was and continues to be qualified to serve as a Trustee, the Board has considered a variety of criteria, none of which, in isolation, was controlling. The Board believes that, collectively, the Trustees have balanced and diverse experience, qualifications, attributes, and skills, which allow the Board to operate effectively in governing each fund and protecting the interests of shareholders. Information about the specific experience, skills, attributes, and qualifications of each Trustee, which in each case led to the Board's conclusion that the Trustee should serve (or continue to serve) as a trustee of the funds, is provided below.
Board Structure and Oversight Function. Brian B. Hogan is an interested person (as defined in the 1940 Act) and currently serves as Chairman. The Trustees have determined that an interested Chairman is appropriate and benefits shareholders because an interested Chairman has a personal and professional stake in the quality and continuity of services provided to the funds. Independent Trustees exercise their informed business judgment to appoint an individual of their choosing to serve as Chairman, regardless of whether the Trustee happens to be independent or a member of management. The Independent Trustees have determined that they can act independently and effectively without having an Independent Trustee serve as Chairman and that a key structural component for assuring that they are in a position to do so is for the Independent Trustees to constitute a substantial majority for the Board. The Independent Trustees also regularly meet in executive session. Michael E. Wiley serves as Chairman of the Independent Trustees and as such (i) acts as a liaison between the Independent Trustees and management with respect to matters important to the Independent Trustees and (ii) with management prepares agendas for Board meetings.
Fidelity funds are overseen by different Boards of Trustees. The funds' Board oversees Fidelity's sector portfolios. Other Boards oversee Fidelity's equity and high income funds, and Fidelity's investment grade bond, money market, and asset allocation funds. The use of separate Boards, each with its own committee structure, allows the Trustees of each group of Fidelity funds to focus on the unique issues of the funds they oversee, including common research, investment, and operational issues. On occasion, the separate Boards establish joint committees to address issues of overlapping consequences for the Fidelity funds overseen by each Board.
The Trustees operate using a system of committees to facilitate the timely and efficient consideration of all matters of importance to the Trustees, each fund, and fund shareholders and to facilitate compliance with legal and regulatory requirements and oversight of the funds' activities and associated risks. The Board, acting through its committees, has charged SelectCo and its affiliates with (i) identifying events or circumstances the occurrence of which could have demonstrably adverse effects on the funds' business and/or reputation; (ii) implementing processes and controls to lessen the possibility that such events or circumstances occur or to mitigate the effects of such events or circumstances if they do occur; and (iii) creating and maintaining a system designed to evaluate continuously business and market conditions in order to facilitate the identification and implementation processes described in (i) and (ii) above. Because the day-to-day operations and activities of the funds are carried out by or through SelectCo, its affiliates, and other service providers, the funds' exposure to risks is mitigated but not eliminated by the processes overseen by the Trustees. While each of the Board's committees has responsibility for overseeing different aspects of the funds' activities, oversight is exercised primarily through the Operations and Audit Committees. Appropriate personnel, including but not limited to the funds' Chief Compliance Officer (CCO), SelectCo's internal auditor, the independent accountants, the funds' Treasurer and portfolio management personnel, make periodic reports to the Board's committees, as appropriate. The responsibilities of each standing committee, including their oversight responsibilities, are described further under "Standing Committees of the Funds' Trustees."
The funds' Statement of Additional Information (SAI) includes more information about the Trustees. To request a free copy, call Fidelity at 1-800-544-8544.
Annual Report
Interested Trustee*:
Correspondence intended for the Trustee who is an interested person may be sent to Fidelity Investments, 245 Summer Street, Boston, Massachusetts 02210.
Name, Year of Birth; Principal Occupations and Other Relevant Experience+ | |
Brian B. Hogan (1964) | |
Year of Election or Appointment: 2014 Trustee Chairman of the Board of Trustees | |
| Mr. Hogan also serves as Trustee or Vice President of other funds. Mr. Hogan serves as President of FMR's Equity Division (2009-present). Previously, Mr. Hogan served as Senior Vice President, Equity Research of FMR (2006-2009) and as a portfolio manager. |
* Trustee has been determined to be an "Interested Trustee" by virtue of, among other things, his affiliation with the trust or various entities under common control with SelectCo.
+ The information above includes the Trustee's principal occupation during the last five years and other information relating to the experience, attributes, and skills relevant to the Trustee's qualifications to serve as a Trustee, which led to the conclusion that the Trustee should serve as a Trustee for each fund.
Independent Trustees:
Correspondence intended for each Independent Trustee (that is, the Trustees other than the Interested Trustee) may be sent to Fidelity Investments, P.O. Box 55235, Boston, Massachusetts 02205-5235.
Name, Year of Birth; Principal Occupations and Other Relevant Experience+ | |
Ned C. Lautenbach (1944) | |
Year of Election or Appointment: 2000 Trustee | |
| Mr. Lautenbach also serves as Trustee of other Fidelity funds. Mr. Lautenbach currently serves as the Lead Director of the Eaton Corporation Board of Directors (diversified industrial, 1997-present). Mr. Lautenbach is Chairman of the Board of Directors of the Philharmonic Center for the Arts in Naples, Florida (2012-present) and a member of the Council on Foreign Relations (1994-present). Previously, Mr. Lautenbach was a Partner/Advisory Partner at Clayton, Dubilier & Rice, LLC (private equity investment, 1998-2010), as well as a Director of Sony Corporation (2006-2007). |
David A. Rosow (1942) | |
Year of Election or Appointment: 2013 Trustee | |
| Mr. Rosow also serves as Trustee of other Fidelity funds. Mr. Rosow is Chairman and Chief Executive Officer of International Golf Group, Inc. (golf course development, 1989-present). Previously, Mr. Rosow served as Chairman and Chief Executive Officer of Rosow & Company, Inc. (private investment company, 1989-2011), a Lead Director of Hudson United Bancorp (2001-2006) and as a Director of TD Banknorth (1996-2006). In addition, Mr. Rosow is a member (2008-present) and President (2009-present) of the Town Council of Palm Beach, Florida. Mr. Rosow served as a Member of the Advisory Board of other Fidelity funds (2012-2013). |
Garnett A. Smith (1947) | |
Year of Election or Appointment: 2013 Trustee | |
| Mr. Smith also serves as Trustee of other Fidelity funds. Prior to Mr. Smith's retirement, he served as Chairman and Chief Executive Officer of Inbrand Corp. (manufacturer of personal absorbent products, 1990-1997). He also served as President (1986-1990) of Inbrand Corp. Prior to his employment with Inbrand Corp., he was employed by a retail fabric chain and North Carolina National Bank. In addition, Mr. Smith is a board member of the Jackson Hole Land Trust (2009-present). Mr. Smith served as a Member of the Advisory Board of other Fidelity funds (2012-2013). |
William S. Stavropoulos (1939) | |
Year of Election or Appointment: 2001 Trustee | |
| Mr. Stavropoulos also serves as Trustee of other Fidelity funds. Mr. Stavropoulos serves as President and Founder of the Michigan Baseball Foundation, the Great Lakes Loons (2007-present). Mr. Stavropoulos is Chairman Emeritus of the Board of Directors of The Dow Chemical Company, where he previously served in numerous senior management positions, including President, CEO (1995-2000; 2002-2004), Chairman of the Executive Committee (2000-2006), and as a member of the Board of Directors (1990-2006). Currently, Mr. Stavropoulos is Chairman of the Board of Directors of Univar Inc. (global distributor of commodity and specialty chemicals), a Director of Teradata Corporation (data warehousing and technology solutions), and Maersk Inc. (industrial conglomerate), and a member of the Advisory Board for Metalmark Capital LLC (private equity investment, 2005-present). Mr. Stavropoulos is an operating advisor to Clayton, Dubilier & Rice, LLC (private equity investment). In addition, Mr. Stavropoulos is a member of the University of Notre Dame Advisory Council for the College of Science, a Trustee of the Rollin L. Gerstacker Foundation, and a Director of the Naples Philharmonic Center for the Arts. Previously, Mr. Stavropoulos served as a Director of Chemical Financial Corporation (bank holding company, 1993-2012) and Tyco International, Ltd. (multinational manufacturing and services, 2007-2012). |
Michael E. Wiley (1950) | |
Year of Election or Appointment: 2008 Trustee Chairman of the Independent Trustees | |
| Mr. Wiley also serves as Trustee of other Fidelity funds. Mr. Wiley serves as a Director of Asia Pacific Exploration Consolidated (international oil and gas exploration and production, 2008-present). Mr. Wiley serves as a Director of Tesoro Corporation (independent oil refiner and marketer, 2005-present), and a Director of Bill Barrett Corporation (exploration and production, 2005-present). In addition, Mr. Wiley also serves as a Director of Post Oak Bank (privately-held bank, 2004-present). Previously, Mr. Wiley served as a Trustee of other Fidelity funds (2008-2013), as a member of the Board of Trustees of the University of Tulsa (2000-2006; 2007-2010), as a Senior Energy Advisor of Katzenbach Partners, LLC (consulting, 2006-2007), as an Advisory Director of Riverstone Holdings (private investment), Chairman, President, and CEO of Baker Hughes, Inc. (oilfield services, 2000-2004), and as Director of Spinnaker Exploration Company (exploration and production, 2001-2005). |
+ The information above includes each Trustee's principal occupation during the last five years and other information relating to the experience, attributes, and skills relevant to each Trustee's qualifications to serve as a Trustee, which led to the conclusion that each Trustee should serve as a Trustee for each fund.
Officers:
Except for Anthony R. Rochte, correspondence intended for each officer may be sent to Fidelity Investments, 245 Summer Street, Boston, Massachusetts 02210. Correspondence intended for Mr. Rochte may be sent to SelectCo, 1225 17th Street, Denver, Colorado 80202-5541. Officers appear below in alphabetical order.
Name, Year of Birth; Principal Occupation | |
Christopher S. Bartel (1971) | |
Year of Election or Appointment: 2009 Vice President | |
| Mr. Bartel also serves as Vice President of other funds. Mr. Bartel serves as a Director, President, and Chief Executive Officer of Fidelity Management & Research (Japan) Inc. (2012-present), a Director of Fidelity Management & Research (Hong Kong) (2012-present), and Senior Vice President of Global Equity Research (2010-present). Previously, Mr. Bartel served as Senior Vice President of Equity Research (2009-2010), Managing Director of Research (2006-2009), and an analyst and portfolio manager (2000-2006). |
Elizabeth Paige Baumann (1968) | |
Year of Election or Appointment: 2012 Anti-Money Laundering (AML) Officer | |
| Ms. Baumann also serves as AML Officer of other funds. She is Chief AML Officer of FMR LLC (2012-present) and is an employee of Fidelity Investments. Previously, Ms. Baumann served as Vice President and Deputy Anti-Money Laundering Officer (2007-2012). |
Marc Bryant (1966) | |
Year of Election or Appointment: 2013 Secretary | |
| Mr. Bryant also serves as an officer of other funds. He is Senior Vice President and Deputy General Counsel of FMR LLC. Prior to joining Fidelity Investments, Mr. Bryant served as a Senior Vice President and the Head of Global Retail Legal for AllianceBernstein L.P. (2006-2010), and as the General Counsel for ProFund Advisors LLC (2001-2006). |
William C. Coffey (1969) | |
Year of Election or Appointment: 2009 Assistant Secretary | |
| Mr. Coffey also serves as Assistant Secretary of other funds. He is Senior Vice President and Deputy General Counsel of FMR LLC (2010-present), and is an employee of Fidelity Investments. Previously, Mr. Coffey served as Vice President and Associate General Counsel of FMR LLC (2005-2009). |
Jonathan Davis (1968) | |
Year of Election or Appointment: 2010 Assistant Treasurer | |
| Mr. Davis also serves as Assistant Treasurer of other funds. Mr. Davis is an employee of Fidelity Investments. Previously, Mr. Davis served as Vice President and Associate General Counsel of FMR LLC (2003-2010). |
Adrien E. Deberghes (1967) | |
Year of Election or Appointment: 2013 President and Treasurer | |
| Mr. Deberghes also serves as an officer of other funds. He is an employee of Fidelity Investments (2008-present). Prior to joining Fidelity Investments, Mr. Deberghes was Senior Vice President of Mutual Fund Administration at State Street Corporation (2007-2008), Senior Director of Mutual Fund Administration at Investors Bank & Trust (2005-2007), and Director of Finance for Dunkin' Brands (2000-2005). |
Stephanie J. Dorsey (1969) | |
Year of Election or Appointment: 2010 Assistant Treasurer | |
| Ms. Dorsey also serves as an officer of other funds. She is an employee of Fidelity Investments (2008-present) and has served in other fund officer roles. Prior to joining Fidelity Investments, Ms. Dorsey served as Treasurer (2004-2008) of the JPMorgan Mutual Funds and Vice President (2004-2008) of JPMorgan Chase Bank. |
Joseph A. Hanlon (1968) | |
Year of Election or Appointment: 2012 Chief Compliance Officer | |
| Mr. Hanlon also serves as Chief Compliance Officer of other funds. Mr. Hanlon serves as Compliance Officer of FMR, FMR Co., Inc., Fidelity Investments Money Management, Inc. (FIMM), Fidelity Research and Analysis Company (FRAC), and Fidelity Management & Research (Hong Kong) (2009-present), as Senior Vice President of the Fidelity Asset Management Division (2009-present), and is an employee of Fidelity Investments. Previously, Mr. Hanlon served as Compliance Officer of Fidelity Management & Research (Japan) Inc. (2009-2013), Strategic Advisers, Inc. (2009-2013), and Fidelity Management & Research (U.K.) Inc. (2009-2013). |
Brian B. Hogan (1964) | |
Year of Election or Appointment: 2009 Vice President | |
| Mr. Hogan also serves as Trustee or Vice President of other funds. Mr. Hogan serves as President of FMR's Equity Division (2009-present). Previously, Mr. Hogan served as Senior Vice President, Equity Research of FMR (2006-2009) and as a portfolio manager. |
Chris Maher (1972) | |
Year of Election or Appointment: 2013 Assistant Treasurer | |
| Mr. Maher serves as Assistant Treasurer of other funds. Mr. Maher is Vice President of Valuation Oversight and is an employee of Fidelity Investments. Previously, Mr. Maher served as Vice President of Asset Management Compliance (2013), Vice President of FMR's Program Management Group (2010-2013), and Vice President of Valuation Oversight (2008-2010). |
Christine Reynolds (1958) | |
Year of Election or Appointment: 2008 Chief Financial Officer | |
| Ms. Reynolds also serves as Chief Financial Officer of other funds. Ms. Reynolds became President of Fidelity Pricing and Cash Management Services (FPCMS) in August 2008. Ms. Reynolds served as Chief Operating Officer of FPCMS (2007-2008). Previously, Ms. Reynolds served as President, Treasurer, and Anti-Money Laundering officer of the Fidelity funds (2004-2007). |
Kenneth B. Robins (1969) | |
Year of Election or Appointment: 2013 Deputy Treasurer | |
| Mr. Robins also serves as an officer of other funds. Mr. Robins serves as Executive Vice President of Fidelity Investments Money Management, Inc. (FIMM) (2013-present) and is an employee of Fidelity Investments (2004-present). Previously, Mr. Robins served in other fund officer roles. |
Anthony R. Rochte (1968) | |
Year of Election or Appointment: 2013 Vice President | |
| Mr. Rochte also serves as Vice President of other funds. Mr. Rochte serves as President of Fidelity SelectCo, LLC (2012-present) and is an employee of Fidelity Investments (2012-present). Prior to joining Fidelity Investments, Mr. Rochte served as Senior Managing Director and head of State Street Global Advisors' North American Intermediary Business Group (2006-2012). |
Stacie M. Smith (1974) | |
Year of Election or Appointment: 2013 Assistant Treasurer | |
| Ms. Smith also serves as an officer of other funds. She is an employee of Fidelity Investments (2009-present) and has served in other fund officer roles. Prior to joining Fidelity Investments, Ms. Smith served as Senior Audit Manager of Ernst & Young LLP (1996-2009). |
Renee Stagnone (1975) | |
Year of Election or Appointment: 2013 Deputy Treasurer | |
| Ms. Stagnone also serves as Deputy Treasurer of other funds. Ms. Stagnone is an employee of Fidelity Investments. |
Joseph F. Zambello (1957) | |
Year of Election or Appointment: 2011 Deputy Treasurer | |
| Mr. Zambello also serves as Deputy Treasurer of other funds. Mr. Zambello is an employee of Fidelity Investments. Previously, Mr. Zambello served as Vice President of FMR's Program Management Group (2009-2011) and Vice President of the Transfer Agent Oversight Group (2005-2009). |
Annual Report
Distributions (Unaudited)
The Board of Trustees of each fund voted to pay to shareholders of record at the opening of business on record date the following distributions per share derived from capital gains realized from sales of portfolio securities and dividends derived from net investment income:
| Pay Date | Record Date | Dividends | Capital Gains |
Air Transportation Portfolio | 04/14/14 | 04/11/14 | $0.027 | $0.310 |
Defense and Aerospace Portfolio | 04/14/14 | 04/11/14 | $0.209 | $4.704 |
Environment and Alternative Energy Portfolio | 04/14/14 | 04/11/14 | $0.003 | $0.026 |
Industrial Equipment Portfolio | 04/14/14 | 04/11/14 | $0.102 | $3.755 |
Industrials Portfolio | 04/14/14 | 04/11/14 | $0.044 | $1.749 |
Transportation Portfolio | 04/14/14 | 04/11/14 | $0.122 | $1.007 |
The funds hereby designate as capital gain dividend the amounts noted below for the taxable year ended February 28, 2014, or, if subsequently determined to be different, the net capital gain of such year.
Air Transportation Portfolio | $4,466,748 |
Defense and Aerospace Portfolio | $62,618,443 |
Industrial Equipment Portfolio | $47,724,125 |
Industrials Portfolio | $80,956,563 |
Transportation Portfolio | $8,022,343 |
A percentage of the dividends distributed during the fiscal year for the following funds qualifies for the dividends-received deduction for corporate shareholders:
| April 2013 | December 2013 |
Air Transportation Portfolio | 99% | 50% |
Defense and Aerospace Portfolio | 100% | 40% |
Environment and Alternative Energy Portfolio | 100% | 100% |
Industrial Equipment Portfolio | 100% | 97% |
Industrials Portfolio | 55% | 56% |
Transportation Portfolio | 100% | 46% |
A percentage of the dividends distributed during the fiscal year for the following funds may be taken into account as a dividend for purposes of the maximum rate under section 1(h) (11) of the Internal Revenue Code:
| April 2013 | December 2013 |
Air Transportation Portfolio | 100% | 57% |
Defense and Aerospace Portfolio | 100% | 52% |
Environment and Alternative Energy Portfolio | 100% | 100% |
Industrial Equipment Portfolio | 100% | 100% |
Industrials Portfolio | 57% | 64% |
Transportation Portfolio | 100% | 49% |
The funds will notify shareholders in January 2015 of amounts for use in preparing 2014 income tax returns.
Annual Report
Proxy Voting Results
A special meeting of each fund's shareholders was held on June 18, 2013. The results of votes taken among shareholders on the proposals before them are reported below. Each vote reported represents one dollar of net asset value held on the record date for the meeting.
PROPOSAL 1 | ||
To elect a Board of Trustees. A | ||
| # of | % of |
Ned C. Lautenbach | ||
Affirmative | 25,828,395,115.78 | 94.160 |
Withheld | 1,602,101,684.27 | 5.840 |
TOTAL | 27,430,496,800.05 | 100.000 |
Ronald P. O'Hanley | ||
Affirmative | 25,907,936,922.24 | 94.450 |
Withheld | 1,522,559,877.81 | 5.550 |
TOTAL | 27,430,496,800.05 | 100.000 |
David A. Rosow | ||
Affirmative | 25,805,492,959.91 | 94.076 |
Withheld | 1,625,003,840.14 | 5.924 |
TOTAL | 27,430,496,800.05 | 100.000 |
Garnett A. Smith | ||
Affirmative | 25,892,258,831.97 | 94.393 |
Withheld | 1,538,237,968.08 | 5.607 |
TOTAL | 27,430,496,800.05 | 100.000 |
William S. Stavropoulos | ||
Affirmative | 25,738,476,030.34 | 93.832 |
Withheld | 1,692,020,769.71 | 6.168 |
TOTAL | 27,430,496,800.05 | 100.000 |
Michael E. Wiley | ||
Affirmative | 25,923,640,743.27 | 94.507 |
Withheld | 1,506,856,056.78 | 5.493 |
TOTAL | 27,430,496,800.05 | 100.000 |
PROPOSAL 2 | ||
To approve a management contract between Air Transportation Portfolio and Fidelity SelectCo, LLC. | ||
| # of | % of |
Affirmative | 55,316,766.02 | 90.453 |
Against | 1,628,854.61 | 2.664 |
Abstain | 1,903,174.83 | 3.112 |
Broker Non-Vote | 2,306,645.47 | 3.771 |
TOTAL | 61,155,440.93 | 100.000 |
PROPOSAL 2 | ||
To approve a management contract between Defense and Aerospace Portfolio and Fidelity SelectCo, LLC. | ||
| # of | % of |
Affirmative | 305,817,075.83 | 80.535 |
Against | 17,549,994.84 | 4.622 |
Abstain | 14,514,560.33 | 3.822 |
Broker Non-Vote | 41,853,305.49 | 11.021 |
TOTAL | 379,734,936.49 | 100.000 |
PROPOSAL 2 | ||
To approve a management contract between Environment and Alternative Energy Portfolio and Fidelity SelectCo, LLC. | ||
| # of | % of |
Affirmative | 37,430,207.10 | 83.901 |
Against | 2,289,770.43 | 5.133 |
Abstain | 1,700,537.58 | 3.811 |
Broker Non-Vote | 3,192,202.88 | 7.155 |
TOTAL | 44,612,717.99 | 100.000 |
PROPOSAL 2 | ||
To approve a management contract between Industrial Equipment Portfolio and Fidelity SelectCo, LLC. | ||
| # of | % of |
Affirmative | 222,542,145.45 | 91.336 |
Against | 9,702,625.20 | 3.983 |
Abstain | 6,984,206.39 | 2.866 |
Broker Non-Vote | 4,423,803.62 | 1.815 |
TOTAL | 243,652,780.66 | 100.000 |
PROPOSAL 2 | ||
To approve a management contract between Industrials Portfolio and Fidelity SelectCo, LLC. | ||
| # of | % of |
Affirmative | 641,085,875.04 | 88.030 |
Against | 26,487,337.79 | 3.637 |
Abstain | 47,527,320.01 | 6.526 |
Broker Non-Vote | 13,162,861.50 | 1.807 |
TOTAL | 728,263,394.34 | 100.000 |
PROPOSAL 2 | ||
To approve a management contract between Transportation Portfolio and Fidelity SelectCo, LLC. | ||
| # of | % of |
Affirmative | 145,045,410.68 | 85.770 |
Against | 6,258,662.18 | 3.701 |
Abstain | 6,478,036.99 | 3.831 |
Broker Non-Vote | 11,327,685.63 | 6.698 |
TOTAL | 169,109,795.48 | 100.000 |
A Denotes trust-wide proposal and voting results.
| ||
Annual Report
Investment Adviser
Fidelity SelectCo, LLC
Denver, CO
Investment Sub-Advisers
FMR Co., Inc.
Fidelity Management & Research
(U.K.) Inc.
Fidelity Management & Research
(Hong Kong) Limited
Fidelity Management & Research
(Japan) Inc.
General Distributor
Fidelity Distributors Corporation
Smithfield, RI
Transfer and Service Agents
Fidelity Investments Institutional Operations Company, Inc.
Boston, MA
Fidelity Service Company, Inc.
Boston, MA
Custodian
Brown Brothers Harriman & Co.
Boston, MA
Corporate Headquarters
245 Summer Street
Boston, MA 02210
1-800-544-8888
The Fidelity Telephone Connection
Mutual Fund 24-Hour Service
Exchanges/Redemptions
and Account Assistance 1-800-544-6666
Product Information 1-800-544-8888
Retirement Accounts 1-800-544-4774
(8 a.m. - 9 p.m.)
TDD Service 1-800-544-0118
for the deaf and hearing impaired
(9 a.m. - 9 p.m. Eastern time)
Fidelity Automated Service
Telephone (FAST®)
1-800-544-5555
Automated line for quickest service

SELCI-UANNPRO-0414
1.910422.104
Fidelity®
Select Portfolios®
Consumer Staples Sector
Consumer Staples Portfolio
Annual Report
February 28, 2014
(Fidelity Cover Art)
Contents
Performance | How the fund has done over time. | |
Management's Discussion of Fund Performance | The Portfolio Manager's review of fund performance and strategy. | |
Shareholder Expense Example |
| |
Investment Changes |
| |
Investments |
| |
Financial Statements |
| |
Notes to Financial Statements |
| |
Report of Independent Registered Public Accounting Firm |
| |
Trustees and Officers |
| |
Distributions |
| |
Proxy Voting Results |
|
To view a fund's proxy voting guidelines and proxy voting record for the 12-month period ended June 30, visit http://www.fidelity.com/proxyvotingresults or visit the Securities and Exchange Commission's (SEC) web site at http://www.sec.gov. You may also call 1-800-544-8544 to request a free copy of the proxy voting guidelines.
Standard & Poor's, S&P and S&P 500 are registered service marks of The McGraw-Hill Companies, Inc. and have been licensed for use by Fidelity Distributors Corporation.
Other third-party marks appearing herein are the property of their respective owners.
All other marks appearing herein are registered or unregistered trademarks or service marks of FMR LLC or an affiliated company. © 2014 FMR LLC. All rights reserved.
This report and the financial statements contained herein are submitted for the general information of the shareholders of the fund. This report is not authorized for distribution to prospective investors in the fund unless preceded or accompanied by an effective prospectus.
A fund files its complete schedule of portfolio holdings with the SEC for the first and third quarters of each fiscal year on Form N-Q. Forms N-Q are available on the SEC's web site at http://www.sec.gov. A fund's Forms N-Q may be reviewed and copied at the SEC's Public Reference Room in Washington, DC. Information regarding the operation of the SEC's Public Reference Room may be obtained by calling 1-800-SEC-0330. For a complete list of a fund's portfolio holdings, view the most recent holdings listing, semiannual report, or annual report on Fidelity's web site at http://www.fidelity.com, http://www.advisor.fidelity.com, or http://www.401k.com, as applicable.
NOT FDIC INSURED • MAY LOSE VALUE • NO BANK GUARANTEE
Neither the fund nor Fidelity Distributors Corporation is a bank.
Annual Report
Consumer Staples Portfolio
Performance: The Bottom Line
Average annual total return reflects the change in the value of an investment, assuming reinvestment of the class' distributions from dividend income and capital gains (the profits earned upon the sale of securities that have grown in value, if any) and assuming a constant rate of performance each year. The $10,000 table and the fund's returns do not reflect the deduction of taxes that a shareholder would pay on fund distributions or the redemption of fund shares. During periods of reimbursement by Fidelity, a fund's total return will be greater than it would be had the reimbursement not occurred. How a fund did yesterday is no guarantee of how it will do tomorrow.
Average Annual Total Returns
Periods ended February 28, 2014 | Past 1 | Past 5 | Past 10 |
Consumer Staples Portfolio A | 10.82% | 19.26% | 10.64% |
A Prior to October 1, 2006, Consumer Staples Portfolio was named Food and Agriculture Portfolio, and the fund operated under certain different investment policies and compared its performance to a different additional index. The fund's historical performance may not represent its current investment policies.
$10,000 Over 10 Years
Let's say hypothetically that $10,000 was invested in Consumer Staples Portfolio, a class of the fund, on February 29, 2004. The chart shows how the value of your investment would have changed, and also shows how the S&P 500® Index performed over the same period.
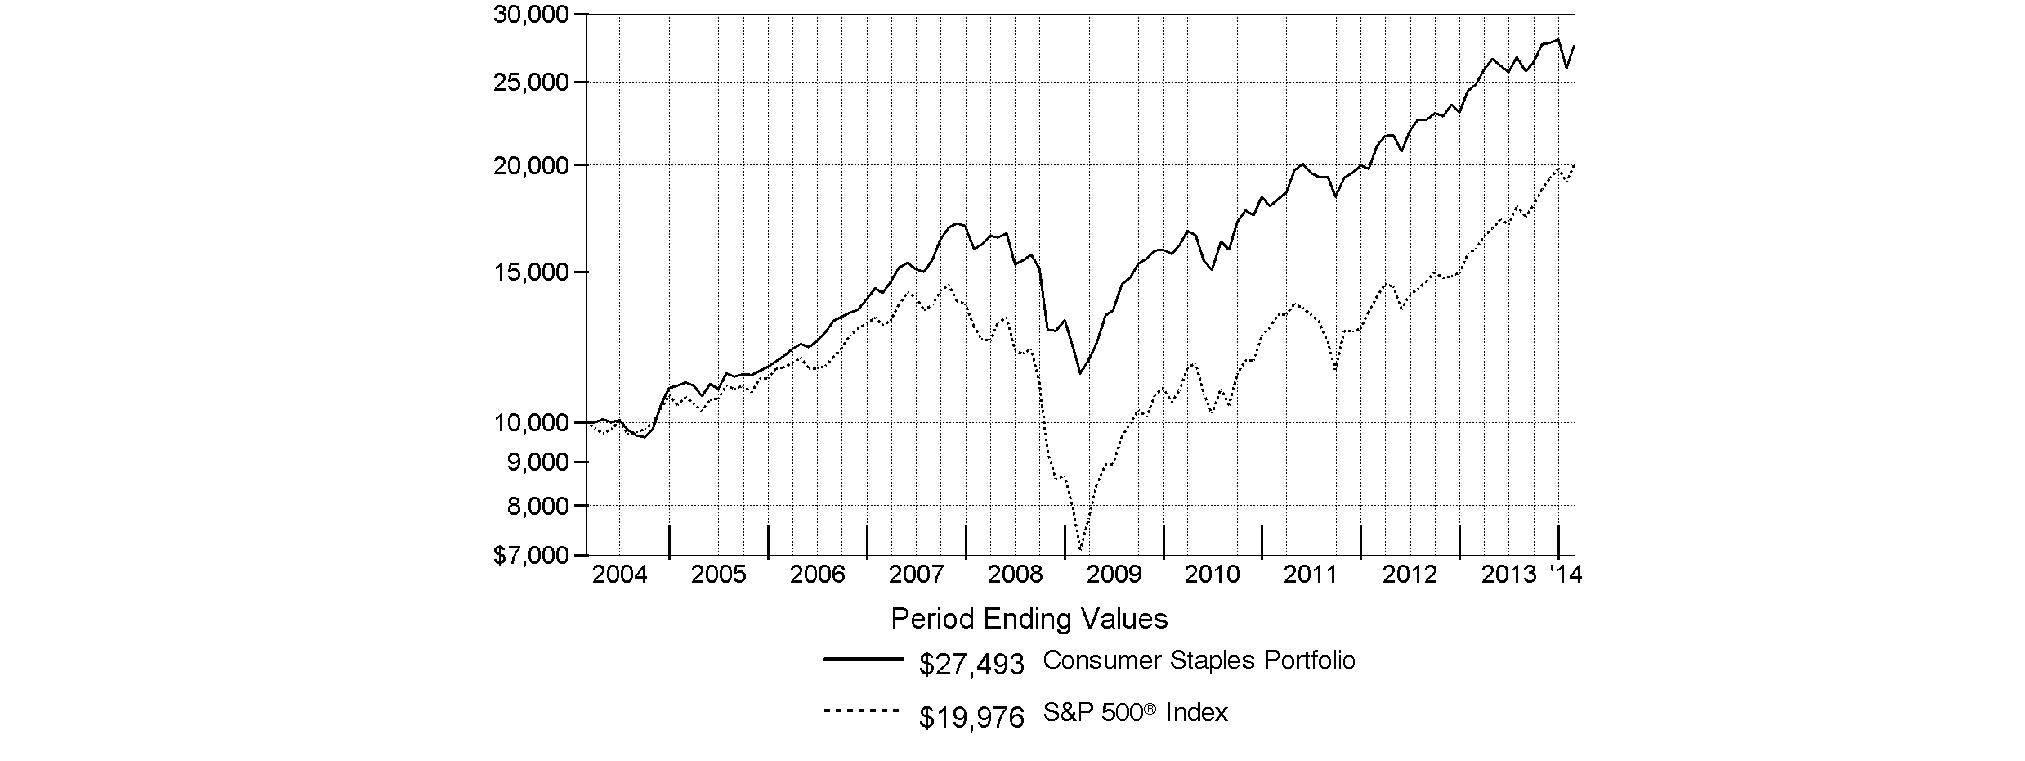
Annual Report
Consumer Staples Portfolio
Management's Discussion of Fund Performance
Market Recap: Stocks overcame fears of higher interest rates - not to mention their worst January in four years - to finish sharply higher for the 12 months ending February 28, 2014. The broad S&P 500® Index and the blue-chip Dow Jones Industrial AverageSM gained 25.37% and 19.01%, respectively, amid generally favorable earnings reports and accommodative monetary policies worldwide. Performance generally increased along the risk spectrum, with smaller-cap and growth strategies leading the way. An ebullient market helped the growth-oriented Nasdaq Composite Index® to a 38.10% period gain, for example. On the other hand, both cyclical and defensive stocks had representation in the top-performing industry sectors: returns were highest in health care and consumer discretionary; lowest in utilities and telecommunication services. From a macroeconomic perspective, data still points to slow but steady improvement in the U.S., and Europe's recession may well be over. Reports from China have disappointed, but continue to suggest a relatively soft landing there. Mixed signals from the U.S. Federal Reserve as to when it might curtail its stimulative bond buying kept markets in flux during the spring and summer. Stocks regained momentum in October despite a federal budget impasse and brief government shutdown, and lower volatility prevailed through year-end. Shedding new-year concerns about China's economy, an emerging-markets sell-off and confirmation (at last) of Fed tapering - alongside confirmation of a presumably dovish Janet Yellen as new Fed chair - February saw stocks back in record territory, bearing down on the five-year anniversary of the market's bottom.
Comments from Robert Lee, Portfolio Manager of Consumer Staples Portfolio: For the year, the fund returned 10.82%, underperforming the 15.64% gain of the sector benchmark, the MSCI® U.S. IMI Consumer Staples 25-50 Index, and the broadly based S&P 500®. Consumer staples stocks delivered a strong absolute return but trailed many other sectors, which is not unusual in a year when the broader market is up as strong as it was. Additionally, investors' preference for U.S.-based companies didn't help staples stocks overall - given their global nature - or the fund since I tend to focus on owning large multinational companies regardless of where they're based. Versus the sector benchmark, French firms Remy Cointreau and Pernod Ricard detracted the most, largely due to a sudden slowdown in their sales in China following new restrictions on gifting high-end spirits to government officials. It also hurt to hold a sizable non-index position in British American Tobacco (BAT), our largest holding. The company continued to put up impressive earnings, despite its shares struggling amid currency headwinds, global regulatory concerns for the tobacco industry and a lot of media attention on the potential long-term competitive impact of electronic cigarettes. But my long-term view of BAT's earnings growth remained unchanged. On the plus side, the fund's underweighting in Philip Morris contributed to relative performance. A big overweighting in retail pharmacy operator CVS Caremark also added nice value. CVS is a great example of a U.S.-based company that I think is poised for long-term growth, especially given its pharmacy benefit management (PBM) division's position to serve an aging U.S. population. Consistent with my process, though, I did modestly trim our stake late in the period as the stock's outperformance caused its valuation to become relatively less attractive.
The views expressed above reflect those of the portfolio manager(s) only through the end of the period as stated on the cover of this report and do not necessarily represent the views of Fidelity or any other person in the Fidelity organization. Any such views are subject to change at any time based upon market or other conditions and Fidelity disclaims any responsibility to update such views. These views may not be relied on as investment advice and, because investment decisions for a Fidelity fund are based on numerous factors, may not be relied on as an indication of trading intent on behalf of any Fidelity fund.
Annual Report
Consumer Staples Portfolio
Shareholder Expense Example
As a shareholder of the Fund, you incur two types of costs: (1) transaction costs including sales charges (loads) on purchase payments or redemption proceeds, redemption fees and (2) ongoing costs, including management fees, distribution and/or service (12b-1) fees and other Fund expenses. This Example is intended to help you understand your ongoing costs (in dollars) of investing in the Fund and to compare these costs with the ongoing costs of investing in other mutual funds.
The Example is based on an investment of $1,000 invested at the beginning of the period and held for the entire period (September 1, 2013 to February 28, 2014).
Actual Expenses
The first line of the accompanying table for each class of the Fund provides information about actual account values and actual expenses. You may use the information in this line, together with the amount you invested, to estimate the expenses that you paid over the period. Simply divide your account value by $1,000.00 (for example, an $8,600 account value divided by $1,000.00 = 8.6), then multiply the result by the number in the first line for a class of the Fund under the heading entitled "Expenses Paid During Period" to estimate the expenses you paid on your account during this period. A small balance maintenance fee of $12.00 that is charged once a year may apply for certain accounts with a value of less than $2,000. This fee is not included in the table below. If it was, the estimate of expenses you paid during the period would be higher, and your ending account value lower, by this amount. In addition, the Fund, as a shareholder in the underlying Fidelity Central Funds, will indirectly bear its pro-rata share of the fees and expenses incurred by the underlying Fidelity Central Funds. These fees and expenses are not included in the Fund's annualized expense ratio used to calculate the expense estimate in the table below.
Hypothetical Example for Comparison Purposes
The second line of the accompanying table for each class of the Fund provides information about hypothetical account values and hypothetical expenses based on a Class' actual expense ratio and an assumed rate of return of 5% per year before expenses, which is not the Class' actual return. The hypothetical account values and expenses may not be used to estimate the actual ending account balance or expenses you paid for the period. You may use this information to compare the ongoing costs of investing in the Fund and other funds. To do so, compare this 5% hypothetical example with the 5% hypothetical examples that appear in the shareholder reports of the other funds. A small balance maintenance fee of $12.00 that is charged once a year may apply for certain accounts with a value of less than $2,000. This fee is not included in the table below. If it was, the estimate of expenses you paid during the period would be higher, and your ending account value lower, by this amount. In addition, the Fund, as a shareholder in the underlying Fidelity Central Funds, will indirectly bear its pro-rata share of the fees and expenses incurred by the underlying Fidelity Central Funds. These fees and expenses are not included in the Fund's annualized expense ratio used to calculate the expense estimate in the table below.
Please note that the expenses shown in the table are meant to highlight your ongoing costs only and do not reflect any transaction costs. Therefore, the second line of the table is useful in comparing ongoing costs only, and will not help you determine the relative total costs of owning different funds. In addition, if these transactional costs were included, your costs would have been higher.
| Annualized | Beginning | Ending | Expenses Paid |
Class A | 1.06% |
|
|
|
Actual |
| $ 1,000.00 | $ 1,067.30 | $ 5.43 |
HypotheticalA |
| $ 1,000.00 | $ 1,019.54 | $ 5.31 |
Class T | 1.33% |
|
|
|
Actual |
| $ 1,000.00 | $ 1,065.80 | $ 6.81 |
HypotheticalA |
| $ 1,000.00 | $ 1,018.20 | $ 6.66 |
Class B | 1.85% |
|
|
|
Actual |
| $ 1,000.00 | $ 1,063.00 | $ 9.46 |
HypotheticalA |
| $ 1,000.00 | $ 1,015.62 | $ 9.25 |
Class C | 1.81% |
|
|
|
Actual |
| $ 1,000.00 | $ 1,063.10 | $ 9.26 |
HypotheticalA |
| $ 1,000.00 | $ 1,015.82 | $ 9.05 |
Consumer Staples | .79% |
|
|
|
Actual |
| $ 1,000.00 | $ 1,068.70 | $ 4.05 |
HypotheticalA |
| $ 1,000.00 | $ 1,020.88 | $ 3.96 |
Institutional Class | .81% |
|
|
|
Actual |
| $ 1,000.00 | $ 1,068.70 | $ 4.15 |
HypotheticalA |
| $ 1,000.00 | $ 1,020.78 | $ 4.06 |
A 5% return per year before expenses
B Annualized expense ratio reflects expenses net of applicable fee waivers.
* Expenses are equal to each Class' annualized expense ratio, multiplied by the average account value over the period, multiplied by 181/365 (to reflect the one-half year period).
Annual Report
Consumer Staples Portfolio
Investment Changes (Unaudited)
Top Ten Stocks as of February 28, 2014 | ||
| % of fund's | % of fund's net assets |
British American Tobacco PLC sponsored ADR | 14.5 | 14.6 |
The Coca-Cola Co. | 11.4 | 12.0 |
Procter & Gamble Co. | 11.2 | 12.3 |
CVS Caremark Corp. | 8.2 | 8.8 |
Kroger Co. | 4.9 | 4.5 |
Altria Group, Inc. | 4.9 | 4.9 |
Wal-Mart Stores, Inc. | 4.9 | 3.3 |
Bunge Ltd. | 2.8 | 2.5 |
Mead Johnson Nutrition Co. | 2.7 | 1.8 |
PepsiCo, Inc. | 2.5 | 1.9 |
| 68.0 | |
Top Industries (% of fund's net assets) | |||
As of February 28, 2014 | |||
 | Beverages | 25.9% |
|
 | Tobacco | 24.3% |
|
 | Food & Staples Retailing | 19.3% |
|
 | Household Products | 13.3% |
|
 | Food Products | 13.1% |
|
 | All Others* | 4.1% |
|

As of August 31, 2013 | |||
| Beverages | 27.1% |
|
| Tobacco | 23.8% |
|
| Food & Staples Retailing | 18.9% |
|
| Household Products | 14.4% |
|
| Food Products | 11.2% |
|
| All Others* | 4.6% |
|

* Includes short-term investments and net other assets (liabilities). |
Annual Report
Consumer Staples Portfolio
Investments February 28, 2014
Showing Percentage of Net Assets
Common Stocks - 97.5% | |||
Shares | Value | ||
BEVERAGES - 25.6% | |||
Brewers - 3.5% | |||
Anadolu Efes Biracilik Ve Malt Sanayii A/S | 264,272 | $ 2,785,901 | |
Anheuser-Busch InBev SA NV | 239,590 | 25,059,691 | |
SABMiller PLC | 889,484 | 43,597,239 | |
| 71,442,831 | ||
Distillers & Vintners - 6.6% | |||
Diageo PLC sponsored ADR (d) | 349,126 | 43,888,629 | |
Pernod Ricard SA | 400,401 | 47,137,523 | |
Remy Cointreau SA (d) | 485,783 | 41,237,365 | |
Treasury Wine Estates Ltd. | 1,318,976 | 4,554,944 | |
| 136,818,461 | ||
Soft Drinks - 15.5% | |||
Coca-Cola Bottling Co. Consolidated | 69,562 | 5,261,670 | |
Coca-Cola Central Japan Co. Ltd. | 54,000 | 1,238,970 | |
Coca-Cola FEMSA S.A.B. de CV sponsored ADR (d) | 47,229 | 4,579,796 | |
Coca-Cola Icecek A/S | 388,162 | 7,498,933 | |
Embotelladora Andina SA: | |||
ADR | 266,112 | 4,859,205 | |
sponsored ADR | 197,000 | 4,540,850 | |
Fomento Economico Mexicano S.A.B. de CV sponsored ADR | 56,787 | 4,862,103 | |
PepsiCo, Inc. | 642,023 | 51,406,782 | |
The Coca-Cola Co. | 6,123,818 | 233,929,848 | |
| 318,178,157 | ||
TOTAL BEVERAGES | 526,439,449 | ||
FOOD & STAPLES RETAILING - 19.3% | |||
Drug Retail - 8.6% | |||
Clicks Group Ltd. | 331,249 | 1,729,419 | |
CVS Caremark Corp. | 2,320,776 | 169,741,557 | |
Drogasil SA | 812,600 | 5,728,661 | |
| 177,199,637 | ||
Food Retail - 5.6% | |||
Fresh Market, Inc. (a) | 186,046 | 6,232,541 | |
Kroger Co. | 2,428,818 | 101,864,627 | |
Whole Foods Market, Inc. | 135,200 | 7,307,560 | |
| 115,404,728 | ||
Hypermarkets & Super Centers - 5.1% | |||
Costco Wholesale Corp. | 32,350 | 3,778,480 | |
Wal-Mart Stores, Inc. | 1,352,356 | 101,020,993 | |
| 104,799,473 | ||
TOTAL FOOD & STAPLES RETAILING | 397,403,838 | ||
| |||
Shares | Value | ||
FOOD PRODUCTS - 13.1% | |||
Agricultural Products - 5.1% | |||
Archer Daniels Midland Co. | 1,076,616 | $ 43,710,610 | |
Bunge Ltd. | 712,413 | 56,715,199 | |
SLC Agricola SA | 658,600 | 5,069,935 | |
| 105,495,744 | ||
Packaged Foods & Meats - 8.0% | |||
Annie's, Inc. (a) | 154,114 | 5,776,193 | |
Danone SA | 76,131 | 5,368,431 | |
Green Mountain Coffee Roasters, Inc. (d) | 283,237 | 31,093,758 | |
Lindt & Spruengli AG | 126 | 7,315,736 | |
Mead Johnson Nutrition Co. Class A | 686,316 | 55,969,070 | |
Nestle SA | 326,295 | 24,650,014 | |
Orion Corp. | 6,025 | 5,045,034 | |
The Hain Celestial Group, Inc. (a) | 64,239 | 5,736,543 | |
Ulker Biskuvi Sanayi A/S | 784,525 | 4,348,120 | |
Unilever NV (NY Reg.) | 392,298 | 15,519,309 | |
Want Want China Holdings Ltd. | 1,511,000 | 2,297,492 | |
| 163,119,700 | ||
TOTAL FOOD PRODUCTS | 268,615,444 | ||
HOTELS, RESTAURANTS & LEISURE - 0.3% | |||
Restaurants - 0.3% | |||
ARAMARK Holdings Corp. | 192,500 | 5,420,800 | |
HOUSEHOLD DURABLES - 0.2% | |||
Housewares & Specialties - 0.2% | |||
Tupperware Brands Corp. | 59,500 | 4,676,700 | |
HOUSEHOLD PRODUCTS - 13.3% | |||
Household Products - 13.3% | |||
Colgate-Palmolive Co. | 599,575 | 37,671,297 | |
Procter & Gamble Co. | 2,918,165 | 229,542,859 | |
Svenska Cellulosa AB (SCA) (B Shares) | 173,300 | 5,262,532 | |
| 272,476,688 | ||
PERSONAL PRODUCTS - 1.2% | |||
Personal Products - 1.2% | |||
Hengan International Group Co. Ltd. | 468,500 | 5,086,125 | |
Herbalife Ltd. | 99,890 | 6,652,674 | |
L'Oreal SA | 32,800 | 5,557,364 | |
Nu Skin Enterprises, Inc. Class A | 99,267 | 8,290,780 | |
| 25,586,943 | ||
PHARMACEUTICALS - 0.2% | |||
Pharmaceuticals - 0.2% | |||
Perrigo Co. PLC | 31,306 | 5,147,959 | |
TOBACCO - 24.3% | |||
Tobacco - 24.3% | |||
Altria Group, Inc. | 2,793,645 | 101,297,568 | |
British American Tobacco PLC sponsored ADR | 2,740,345 | 298,122,129 | |
Imperial Tobacco Group PLC | 265,697 | 10,842,771 | |
Common Stocks - continued | |||
Shares | Value | ||
TOBACCO - CONTINUED | |||
Tobacco - continued | |||
ITC Ltd. | 1,620,070 | $ 8,595,514 | |
Japan Tobacco, Inc. | 209,400 | 6,669,335 | |
Lorillard, Inc. | 472,461 | 23,178,937 | |
Philip Morris International, Inc. | 493,292 | 39,912,256 | |
Souza Cruz SA | 1,145,800 | 9,939,470 | |
| 498,557,980 | ||
TOTAL COMMON STOCKS (Cost $1,428,851,891) |
| ||
Nonconvertible Preferred Stocks - 0.3% | |||
|
|
|
|
BEVERAGES - 0.3% | |||
Brewers - 0.3% | |||
Ambev SA sponsored ADR | 1,049,610 |
| |
Money Market Funds - 3.2% | |||
Shares | Value | ||
Fidelity Cash Central Fund, 0.10% (b) | 31,266,635 | $ 31,266,635 | |
Fidelity Securities Lending Cash Central Fund, 0.09% (b)(c) | 33,900,423 | 33,900,423 | |
TOTAL MONEY MARKET FUNDS (Cost $65,167,058) |
| ||
TOTAL INVESTMENT PORTFOLIO - 101.0% (Cost $1,496,678,335) | 2,077,050,051 | ||
NET OTHER ASSETS (LIABILITIES) - (1.0)% | (21,247,648) | ||
NET ASSETS - 100% | $ 2,055,802,403 | ||
Legend |
(a) Non-income producing |
(b) Affiliated fund that is generally available only to investment companies and other accounts managed by Fidelity Investments. The rate quoted is the annualized seven-day yield of the fund at period end. A complete unaudited listing of the fund's holdings as of its most recent quarter end is available upon request. In addition, each Fidelity Central Fund's financial statements, which are not covered by the Fund's Report of Independent Registered Public Accounting Firm, are available on the SEC's website or upon request. |
(c) Investment made with cash collateral received from securities on loan. |
(d) Security or a portion of the security is on loan at period end. |
Affiliated Central Funds |
Information regarding fiscal year to date income earned by the Fund from investments in Fidelity Central Funds is as follows: |
Fund | Income earned |
Fidelity Cash Central Fund | $ 64,577 |
Fidelity Securities Lending Cash Central Fund | 320,864 |
Total | $ 385,441 |
Other Information |
The following is a summary of the inputs used, as of February 28, 2014, involving the Fund's assets and liabilities carried at fair value. The inputs or methodology used for valuing securities may not be an indication of the risk associated with investing in those securities. For more information on valuation inputs, and their aggregation into the levels used in the table below, please refer to the Investment Valuation section in the accompanying Notes to Financial Statements. |
Valuation Inputs at Reporting Date: | ||||
Description | Total | Level 1 | Level 2 | Level 3 |
Investments in Securities: | ||||
Common Stocks | $ 2,004,325,801 | $ 1,942,578,330 | $ 61,747,471 | $ - |
Nonconvertible Preferred Stocks | 7,557,192 | 7,557,192 | - | - |
Money Market Funds | 65,167,058 | 65,167,058 | - | - |
Total Investments in Securities: | $ 2,077,050,051 | $ 2,015,302,580 | $ 61,747,471 | $ - |
Distribution of investments by country or territory of incorporation, as a percentage of total net assets, is as follows (Unaudited): |
United States of America | 64.2% |
United Kingdom | 19.2% |
France | 4.9% |
Bermuda | 2.8% |
Switzerland | 1.6% |
Brazil | 1.3% |
Belgium | 1.2% |
Others (Individually Less Than 1%) | 4.8% |
| 100.0% |
See accompanying notes which are an integral part of the financial statements.
Annual Report
Consumer Staples Portfolio
Financial Statements
Statement of Assets and Liabilities
| February 28, 2014 | |
|
|
|
Assets | ||
Investment in securities, at value (including securities loaned of $32,976,456) - See accompanying schedule: Unaffiliated issuers (cost $1,431,511,277) | $ 2,011,882,993 |
|
Fidelity Central Funds (cost $65,167,058) | 65,167,058 |
|
Total Investments (cost $1,496,678,335) |
| $ 2,077,050,051 |
Receivable for investments sold | 15,188,121 | |
Receivable for fund shares sold | 2,001,501 | |
Dividends receivable | 2,179,086 | |
Distributions receivable from Fidelity Central Funds | 7,995 | |
Prepaid expenses | 13,509 | |
Other receivables | 33,397 | |
Total assets | 2,096,473,660 | |
|
|
|
Liabilities | ||
Payable for investments purchased | $ 508,506 | |
Payable for fund shares redeemed | 4,578,554 | |
Accrued management fee | 921,833 | |
Distribution and service plan fees payable | 239,461 | |
Other affiliated payables | 389,292 | |
Other payables and accrued expenses | 133,188 | |
Collateral on securities loaned, at value | 33,900,423 | |
Total liabilities | 40,671,257 | |
|
|
|
Net Assets | $ 2,055,802,403 | |
Net Assets consist of: |
| |
Paid in capital | $ 1,406,494,316 | |
Undistributed net investment income | 5,732,152 | |
Accumulated undistributed net realized gain (loss) on investments and foreign currency transactions | 63,224,348 | |
Net unrealized appreciation (depreciation) on investments and assets and liabilities in foreign currencies | 580,351,587 | |
Net Assets | $ 2,055,802,403 | |
Statement of Assets and Liabilities - continued
| February 28, 2014 | |
|
|
|
Calculation of Maximum Offering Price Class A: | $ 87.93 | |
|
|
|
Maximum offering price per share (100/94.25 of $87.93) | $ 93.29 | |
Class T: | $ 87.37 | |
|
|
|
Maximum offering price per share (100/96.50 of $87.37) | $ 90.54 | |
Class B: | $ 86.90 | |
|
|
|
Class C: | $ 86.32 | |
|
|
|
Consumer Staples: | $ 88.51 | |
|
|
|
Institutional Class: | $ 88.33 | |
A Redemption price per share is equal to net asset value less any applicable contingent deferred sales charge.
See accompanying notes which are an integral part of the financial statements.
Annual Report
Statement of Operations
| Year ended February 28, 2014 | |
|
|
|
Investment Income |
|
|
Dividends |
| $ 63,498,283 |
Interest |
| 16 |
Income from Fidelity Central Funds |
| 385,441 |
Total income |
| 63,883,740 |
|
|
|
Expenses | ||
Management fee | $ 13,210,712 | |
Transfer agent fees | 4,800,332 | |
Distribution and service plan fees | 2,848,704 | |
Accounting and security lending fees | 719,655 | |
Custodian fees and expenses | 107,674 | |
Independent trustees' compensation | 45,426 | |
Registration fees | 193,601 | |
Audit | 66,278 | |
Legal | 40,201 | |
Interest | 4,952 | |
Miscellaneous | 28,736 | |
Total expenses before reductions | 22,066,271 | |
Expense reductions | (77,312) | 21,988,959 |
Net investment income (loss) | 41,894,781 | |
Realized and Unrealized Gain (Loss) Net realized gain (loss) on: | ||
Investment securities: |
|
|
Unaffiliated issuers (net of foreign taxes of $10,350) | 171,717,048 | |
Foreign currency transactions | (76,530) | |
Total net realized gain (loss) |
| 171,640,518 |
Change in net unrealized appreciation (depreciation) on: Investment securities (net of increase in deferred foreign taxes of $26,244) | 26,576,541 | |
Assets and liabilities in foreign currencies | 12,410 | |
Total change in net unrealized appreciation (depreciation) |
| 26,588,951 |
Net gain (loss) | 198,229,469 | |
Net increase (decrease) in net assets resulting from operations | $ 240,124,250 | |
Statement of Changes in Net Assets
| Year ended | Year ended |
Increase (Decrease) in Net Assets |
|
|
Operations |
|
|
Net investment income (loss) | $ 41,894,781 | $ 34,326,160 |
Net realized gain (loss) | 171,640,518 | 94,809,727 |
Change in net unrealized appreciation (depreciation) | 26,588,951 | 198,071,394 |
Net increase (decrease) in net assets resulting from operations | 240,124,250 | 327,207,281 |
Distributions to shareholders from net investment income | (38,989,125) | (31,344,671) |
Distributions to shareholders from net realized gain | (137,187,027) | (29,546,659) |
Total distributions | (176,176,152) | (60,891,330) |
Share transactions - net increase (decrease) | (294,831,730) | 287,768,850 |
Redemption fees | 32,907 | 35,035 |
Total increase (decrease) in net assets | (230,850,725) | 554,119,836 |
|
|
|
Net Assets | ||
Beginning of period | 2,286,653,128 | 1,732,533,292 |
End of period (including undistributed net investment income of $5,732,152 and undistributed net investment income of $5,461,626, respectively) | $ 2,055,802,403 | $ 2,286,653,128 |
See accompanying notes which are an integral part of the financial statements.
Annual Report
Financial Highlights - Class A
Years ended February 28, | 2014 | 2013 | 2012 G | 2011 | 2010 |
Selected Per-Share Data |
|
|
|
|
|
Net asset value, beginning of period | $ 85.67 | $ 74.90 | $ 67.65 | $ 61.06 | $ 43.94 |
Income from Investment Operations |
|
|
|
|
|
Net investment income (loss) C | 1.43 | 1.26 | 1.22 | .98 | .84 |
Net realized and unrealized gain (loss) | 7.51 | 11.73 | 8.73 | 7.10 | 17.02 |
Total from investment operations | 8.94 | 12.99 | 9.95 | 8.08 | 17.86 |
Distributions from net investment income | (1.44) | (1.08) | (1.06) | (.83) | (.74) |
Distributions from net realized gain | (5.24) | (1.14) | (1.64) | (.66) | - |
Total distributions | (6.68) | (2.22) | (2.70) | (1.49) | (.74) |
Redemption fees added to paid in capital C,H | - | - | - | - | - |
Net asset value, end of period | $ 87.93 | $ 85.67 | $ 74.90 | $ 67.65 | $ 61.06 |
Total Return A,B | 10.53% | 17.60% | 15.00% | 13.27% | 40.66% |
Ratios to Average Net Assets D,F |
|
|
|
|
|
Expenses before reductions | 1.06% | 1.08% | 1.10% | 1.11% | 1.13% |
Expenses net of fee waivers, if any | 1.06% | 1.08% | 1.10% | 1.11% | 1.13% |
Expenses net of all reductions | 1.06% | 1.08% | 1.09% | 1.11% | 1.13% |
Net investment income (loss) | 1.61% | 1.58% | 1.74% | 1.53% | 1.51% |
Supplemental Data |
|
|
|
|
|
Net assets, end of period (000 omitted) | $ 329,459 | $ 277,329 | $ 205,851 | $ 160,526 | $ 162,370 |
Portfolio turnover rate E | 31% | 28% | 35% | 57% | 69% |
A Total returns would have been lower if certain expenses had not been reduced during the applicable periods shown.
B Total returns do not include the effect of the sales charges.
C Calculated based on average shares outstanding during the period.
D Fees and expenses of any underlying Fidelity Central Funds are not included in the Fund's expense ratio. The Fund indirectly bears its proportionate share of the expenses of any underlying Fidelity Central Funds.
E Amount does not include the portfolio activity of any underlying Fidelity Central Funds.
F Expense ratios reflect operating expenses of the class. Expenses before reductions do not reflect amounts reimbursed by the investment adviser or reductions from brokerage service arrangements or reductions from other expense offset arrangements and do not represent the amount paid by the class during periods when reimbursements or reductions occur. Expenses net of fee waivers reflect expenses after reimbursement by the investment adviser but prior to reductions from brokerage service arrangements or other expense offset arrangements. Expenses net of all reductions represent the net expenses paid by the class.
G For the year ended February 29.
H Amount represents less than $.01 per share.
Financial Highlights - Class T
Years ended February 28, | 2014 | 2013 | 2012 G | 2011 | 2010 |
Selected Per-Share Data |
|
|
|
|
|
Net asset value, beginning of period | $ 85.18 | $ 74.49 | $ 67.30 | $ 60.77 | $ 43.75 |
Income from Investment Operations |
|
|
|
|
|
Net investment income (loss) C | 1.18 | 1.03 | 1.01 | .79 | .66 |
Net realized and unrealized gain (loss) | 7.46 | 11.68 | 8.68 | 7.05 | 16.95 |
Total from investment operations | 8.64 | 12.71 | 9.69 | 7.84 | 17.61 |
Distributions from net investment income | (1.21) | (.88) | (.86) | (.65) | (.59) |
Distributions from net realized gain | (5.24) | (1.14) | (1.64) | (.66) | - |
Total distributions | (6.45) | (2.02) | (2.50) | (1.31) | (.59) |
Redemption fees added to paid in capital C,H | - | - | - | - | - |
Net asset value, end of period | $ 87.37 | $ 85.18 | $ 74.49 | $ 67.30 | $ 60.77 |
Total Return A,B | 10.23% | 17.29% | 14.67% | 12.93% | 40.24% |
Ratios to Average Net Assets D,F |
|
|
|
|
|
Expenses before reductions | 1.33% | 1.36% | 1.38% | 1.40% | 1.44% |
Expenses net of fee waivers, if any | 1.33% | 1.36% | 1.38% | 1.40% | 1.44% |
Expenses net of all reductions | 1.33% | 1.35% | 1.38% | 1.40% | 1.44% |
Net investment income (loss) | 1.34% | 1.30% | 1.45% | 1.24% | 1.21% |
Supplemental Data |
|
|
|
|
|
Net assets, end of period (000 omitted) | $ 61,421 | $ 52,024 | $ 39,047 | $ 31,496 | $ 29,662 |
Portfolio turnover rate E | 31% | 28% | 35% | 57% | 69% |
A Total returns would have been lower if certain expenses had not been reduced during the applicable periods shown.
B Total returns do not include the effect of the sales charges.
C Calculated based on average shares outstanding during the period.
D Fees and expenses of any underlying Fidelity Central Funds are not included in the Fund's expense ratio. The Fund indirectly bears its proportionate share of the expenses of any underlying Fidelity Central Funds.
E Amount does not include the portfolio activity of any underlying Fidelity Central Funds.
F Expense ratios reflect operating expenses of the class. Expenses before reductions do not reflect amounts reimbursed by the investment adviser or reductions from brokerage service arrangements or reductions from other expense offset arrangements and do not represent the amount paid by the class during periods when reimbursements or reductions occur. Expenses net of fee waivers reflect expenses after reimbursement by the investment adviser but prior to reductions from brokerage service arrangements or other expense offset arrangements. Expenses net of all reductions represent the net expenses paid by the class.
G For the year ended February 29.
H Amount represents less than $.01 per share.
See accompanying notes which are an integral part of the financial statements.
Annual Report
Financial Highlights - Class B
Years ended February 28, | 2014 | 2013 | 2012 G | 2011 | 2010 |
Selected Per-Share Data |
|
|
|
|
|
Net asset value, beginning of period | $ 84.72 | $ 74.01 | $ 66.83 | $ 60.37 | $ 43.53 |
Income from Investment Operations |
|
|
|
|
|
Net investment income (loss) C | .71 | .61 | .64 | .46 | .37 |
Net realized and unrealized gain (loss) | 7.40 | 11.61 | 8.61 | 6.98 | 16.82 |
Total from investment operations | 8.11 | 12.22 | 9.25 | 7.44 | 17.19 |
Distributions from net investment income | (.69) | (.37) | (.43) | (.32) | (.35) |
Distributions from net realized gain | (5.24) | (1.14) | (1.64) | (.66) | - |
Total distributions | (5.93) | (1.51) | (2.07) | (.98) | (.35) |
Redemption fees added to paid in capital C,H | - | - | - | - | - |
Net asset value, end of period | $ 86.90 | $ 84.72 | $ 74.01 | $ 66.83 | $ 60.37 |
Total Return A,B | 9.63% | 16.68% | 14.06% | 12.35% | 39.48% |
Ratios to Average Net Assets D,F |
|
|
|
|
|
Expenses before reductions | 1.86% | 1.89% | 1.91% | 1.91% | 1.97% |
Expenses net of fee waivers, if any | 1.86% | 1.89% | 1.91% | 1.91% | 1.97% |
Expenses net of all reductions | 1.86% | 1.88% | 1.90% | 1.91% | 1.97% |
Net investment income (loss) | .81% | .78% | .93% | .73% | .68% |
Supplemental Data |
|
|
|
|
|
Net assets, end of period (000 omitted) | $ 17,388 | $ 18,548 | $ 19,330 | $ 20,033 | $ 21,099 |
Portfolio turnover rate E | 31% | 28% | 35% | 57% | 69% |
A Total returns would have been lower if certain expenses had not been reduced during the applicable periods shown.
B Total returns do not include the effect of the contingent deferred sales charge.
C Calculated based on average shares outstanding during the period.
D Fees and expenses of any underlying Fidelity Central Funds are not included in the Fund's expense ratio. The Fund indirectly bears its proportionate share of the expenses of any underlying Fidelity Central Funds.
E Amount does not include the portfolio activity of any underlying Fidelity Central Funds.
F Expense ratios reflect operating expenses of the class. Expenses before reductions do not reflect amounts reimbursed by the investment adviser or reductions from brokerage service arrangements or reductions from other expense offset arrangements and do not represent the amount paid by the class during periods when reimbursements or reductions occur. Expenses net of fee waivers reflect expenses after reimbursement by the investment adviser but prior to reductions from brokerage service arrangements or other expense offset arrangements. Expenses net of all reductions represent the net expenses paid by the class.
G For the year ended February 29.
H Amount represents less than $.01 per share.
Financial Highlights - Class C
Years ended February 28, | 2014 | 2013 | 2012 G | 2011 | 2010 |
Selected Per-Share Data |
|
|
|
|
|
Net asset value, beginning of period | $ 84.28 | $ 73.75 | $ 66.71 | $ 60.29 | $ 43.46 |
Income from Investment Operations |
|
|
|
|
|
Net investment income (loss) C | .75 | .65 | .68 | .49 | .41 |
Net realized and unrealized gain (loss) | 7.36 | 11.55 | 8.59 | 7.00 | 16.80 |
Total from investment operations | 8.11 | 12.20 | 9.27 | 7.49 | 17.21 |
Distributions from net investment income | (.84) | (.53) | (.59) | (.41) | (.38) |
Distributions from net realized gain | (5.24) | (1.14) | (1.64) | (.66) | - |
Total distributions | (6.07) I | (1.67) | (2.23) | (1.07) | (.38) |
Redemption fees added to paid in capital C,H | - | - | - | - | - |
Net asset value, end of period | $ 86.32 | $ 84.28 | $ 73.75 | $ 66.71 | $ 60.29 |
Total Return A,B | 9.70% | 16.73% | 14.14% | 12.44% | 39.59% |
Ratios to Average Net Assets D,F |
|
|
|
|
|
Expenses before reductions | 1.82% | 1.83% | 1.85% | 1.86% | 1.90% |
Expenses net of fee waivers, if any | 1.82% | 1.83% | 1.85% | 1.86% | 1.90% |
Expenses net of all reductions | 1.81% | 1.82% | 1.84% | 1.85% | 1.89% |
Net investment income (loss) | .85% | .83% | .99% | .79% | .75% |
Supplemental Data |
|
|
|
|
|
Net assets, end of period (000 omitted) | $ 164,669 | $ 134,966 | $ 102,321 | $ 81,239 | $ 73,829 |
Portfolio turnover rate E | 31% | 28% | 35% | 57% | 69% |
A Total returns would have been lower if certain expenses had not been reduced during the applicable periods shown.
B Total returns do not include the effect of the contingent deferred sales charge.
C Calculated based on average shares outstanding during the period.
D Fees and expenses of any underlying Fidelity Central Funds are not included in the Fund's expense ratio. The Fund indirectly bears its proportionate share of the expenses of any underlying Fidelity Central Funds.
E Amount does not include the portfolio activity of any underlying Fidelity Central Funds.
F Expense ratios reflect operating expenses of the class. Expenses before reductions do not reflect amounts reimbursed by the investment adviser or reductions from brokerage service arrangements or reductions from other expense offset arrangements and do not represent the amount paid by the class during periods when reimbursements or reductions occur. Expenses net of fee waivers reflect expenses after reimbursement by the investment adviser but prior to reductions from brokerage service arrangements or other expense offset arrangements. Expenses net of all reductions represent the net expenses paid by the class.
G For the year ended February 29.
H Amount represents less than $.01 per share.
I Total distributions of $6.07 per share is comprised of distributions from net investment income of $.837 and distributions from net realized gain of $5.237 per share.
See accompanying notes which are an integral part of the financial statements.
Annual Report
Financial Highlights - Consumer Staples
Years ended February 28, | 2014 | 2013 | 2012 F | 2011 | 2010 |
Selected Per-Share Data |
|
|
|
|
|
Net asset value, beginning of period | $ 86.17 | $ 75.29 | $ 67.98 | $ 61.34 | $ 44.14 |
Income from Investment Operations |
|
|
|
|
|
Net investment income (loss) B | 1.69 | 1.48 | 1.42 | 1.14 | .96 |
Net realized and unrealized gain (loss) | 7.55 | 11.82 | 8.76 | 7.14 | 17.11 |
Total from investment operations | 9.24 | 13.30 | 10.18 | 8.28 | 18.07 |
Distributions from net investment income | (1.66) | (1.28) | (1.24) | (.98) | (.87) |
Distributions from net realized gain | (5.24) | (1.14) | (1.64) | (.66) | - |
Total distributions | (6.90) | (2.42) | (2.87) H | (1.64) | (.87) |
Redemption fees added to paid in capital B,G | - | - | - | - | - |
Net asset value, end of period | $ 88.51 | $ 86.17 | $ 75.29 | $ 67.98 | $ 61.34 |
Total Return A | 10.82% | 17.94% | 15.30% | 13.55% | 40.96% |
Ratios to Average Net Assets C,E |
|
|
|
|
|
Expenses before reductions | .79% | .81% | .83% | .86% | .92% |
Expenses net of fee waivers, if any | .79% | .81% | .83% | .86% | .92% |
Expenses net of all reductions | .79% | .80% | .82% | .86% | .91% |
Net investment income (loss) | 1.88% | 1.85% | 2.01% | 1.78% | 1.73% |
Supplemental Data |
|
|
|
|
|
Net assets, end of period (000 omitted) | $ 1,328,594 | $ 1,425,055 | $ 1,202,440 | $ 877,548 | $ 946,455 |
Portfolio turnover rate D | 31% | 28% | 35% | 57% | 69% |
A Total returns would have been lower if certain expenses had not been reduced during the applicable periods shown.
B Calculated based on average shares outstanding during the period.
C Fees and expenses of any underlying Fidelity Central Funds are not included in the Fund's expense ratio. The Fund indirectly bears its proportionate share of the expenses of any underlying Fidelity Central Funds.
D Amount does not include the portfolio activity of any underlying Fidelity Central Funds.
E Expense ratios reflect operating expenses of the class. Expenses before reductions do not reflect amounts reimbursed by the investment adviser or reductions from brokerage service arrangements or reductions from other expense offset arrangements and do not represent the amount paid by the class during periods when reimbursements or reductions occur. Expenses net of fee waivers reflect expenses after reimbursement by the investment adviser but prior to reductions from brokerage service arrangements or other expense offset arrangements. Expenses net of all reductions represent the net expenses paid by the class.
F For the year ended February 29.
G Amount represents less than $.01 per share.
H Total distributions of $2.87 per share is comprised of distributions from net investment income of $1.236 and distributions from net realized gain of $1.637 per share.
Financial Highlights - Institutional Class
Years ended February 28, | 2014 | 2013 | 2012 F | 2011 | 2010 |
Selected Per-Share Data |
|
|
|
|
|
Net asset value, beginning of period | $ 85.92 | $ 75.14 | $ 67.84 | $ 61.26 | $ 44.07 |
Income from Investment Operations |
|
|
|
|
|
Net investment income (loss) B | 1.66 | 1.45 | 1.39 | 1.15 | .98 |
Net realized and unrealized gain (loss) | 7.53 | 11.79 | 8.73 | 7.13 | 17.09 |
Total from investment operations | 9.19 | 13.24 | 10.12 | 8.28 | 18.07 |
Distributions from net investment income | (1.54) | (1.32) | (1.19) | (1.04) | (.88) |
Distributions from net realized gain | (5.24) | (1.14) | (1.64) | (.66) | - |
Total distributions | (6.78) | (2.46) | (2.82) H | (1.70) | (.88) |
Redemption fees added to paid in capital B,G | - | - | - | - | - |
Net asset value, end of period | $ 88.33 | $ 85.92 | $ 75.14 | $ 67.84 | $ 61.26 |
Total Return A | 10.80% | 17.90% | 15.24% | 13.57% | 41.03% |
Ratios to Average Net Assets C,E |
|
|
|
|
|
Expenses before reductions | .82% | .85% | .87% | .87% | .86% |
Expenses net of fee waivers, if any | .82% | .85% | .87% | .87% | .86% |
Expenses net of all reductions | .82% | .84% | .87% | .87% | .86% |
Net investment income (loss) | 1.85% | 1.81% | 1.96% | 1.77% | 1.78% |
Supplemental Data |
|
|
|
|
|
Net assets, end of period (000 omitted) | $ 154,271 | $ 378,731 | $ 163,544 | $ 237,883 | $ 36,152 |
Portfolio turnover rate D | 31% | 28% | 35% | 57% | 69% |
A Total returns would have been lower if certain expenses had not been reduced during the applicable periods shown.
B Calculated based on average shares outstanding during the period.
C Fees and expenses of any underlying Fidelity Central Funds are not included in the Fund's expense ratio. The Fund indirectly bears its proportionate share of the expenses of any underlying Fidelity Central Funds.
D Amount does not include the portfolio activity of any underlying Fidelity Central Funds.
E Expense ratios reflect operating expenses of the class. Expenses before reductions do not reflect amounts reimbursed by the investment adviser or reductions from brokerage service arrangements or reductions from other expense offset arrangements and do not represent the amount paid by the class during periods when reimbursements or reductions occur. Expenses net of fee waivers reflect expenses after reimbursement by the investment adviser but prior to reductions from brokerage service arrangements or other expense offset arrangements. Expenses net of all reductions represent the net expenses paid by the class.
F For the year ended February 29.
G Amount represents less than $.01 per share.
H Total distributions of $2.82 per share is comprised of distributions from net investment income of $1.186 and distributions from net realized gain of $1.637 per share.
See accompanying notes which are an integral part of the financial statements.
Annual Report
Notes to Financial Statements
For the period ended February 28, 2014
1. Organization.
Consumer Staples Portfolio (the Fund) is a non-diversified fund of Fidelity Select Portfolios (the Trust) and is authorized to issue an unlimited number of shares. The Trust is registered under the Investment Company Act of 1940, as amended (the 1940 Act), as an open-end management investment company organized as a Massachusetts business trust. The Fund invests primarily in securities of companies whose principal business activities fall within specific industries. The Fund offers Class A, Class T, Class C, Consumer Staples and Institutional Class shares, each of which, along with Class B shares, has equal rights as to assets and voting privileges. Class B shares are closed to new accounts and additional purchases, except for exchanges and reinvestments. Each class has exclusive voting rights with respect to matters that affect that class. Class B shares will automatically convert to Class A shares after a holding period of seven years from the initial date of purchase.
2. Investments in Fidelity Central Funds.
The Fund invests in Fidelity Central Funds, which are open-end investment companies generally available only to other investment companies and accounts managed by the investment adviser and its affiliates. The Fund's Schedule of Investments lists each of the Fidelity Central Funds held as of period end, if any, as an investment of the Fund, but does not include the underlying holdings of each Fidelity Central Fund. As an Investing Fund, the Fund indirectly bears its proportionate share of the expenses of the underlying Fidelity Central Funds.
The Money Market Central Funds seek preservation of capital and current income and are managed by Fidelity Investments Money Management, Inc. (FIMM), an affiliate of the investment adviser. Annualized expenses of the Money Market Central Funds as of their most recent shareholder report date are less than .01%.
A complete unaudited list of holdings for each Fidelity Central Fund is available upon request or at the Securities and Exchange Commission (the SEC) website at www.sec.gov. In addition, the financial statements of the Fidelity Central Funds, which are not covered by the Fund's Report of Independent Registered Public Accounting Firm, are available on the SEC website or upon request.
3. Significant Accounting Policies.
The financial statements have been prepared in conformity with accounting principles generally accepted in the United States of America (GAAP), which require management to make certain estimates and assumptions at the date of the financial statements. Actual results could differ from those estimates. Subsequent events, if any, through the date that the financial statements were issued have been evaluated in the preparation of the financial statements. The following summarizes the significant accounting policies of the Fund:
Investment Valuation. Investments are valued as of 4:00 p.m. Eastern time on the last calendar day of the period. In accordance with valuation policies and procedures approved by the Board of Trustees (the Board), the Fund attempts to obtain prices from one or more third party pricing vendors or brokers to value its investments. When current market prices, quotations or currency exchange rates are not readily available or reliable, investments will be fair valued in good faith by the Fidelity SelectCo, LLC (SelectCo) Fair Value Committee (the Committee), in accordance with procedures adopted by the Board. Factors used in determining fair value vary by investment type and may include market or investment specific events. The frequency with which these procedures are used cannot be predicted and they may be utilized to a significant extent. The Committee oversees the Fund's valuation policies and procedures and is responsible for approving and reporting to the Board all fair value determinations.
The Fund categorizes the inputs to valuation techniques used to value its investments into a disclosure hierarchy consisting of three levels as shown below:
Level 1 - quoted prices in active markets for identical investments
Level 2 - other significant observable inputs (including quoted prices for similar investments, interest rates, prepayment speeds, etc.)
Level 3 - unobservable inputs (including the Fund's own assumptions based on the best information available)
Valuation techniques used to value the Fund's investments by major category are as follows:
Equity securities, including restricted securities, for which market quotations are readily available, are valued at the last reported sale price or official closing price as reported by a third party pricing vendor on the primary market or exchange on which they are traded and are categorized as Level 1 in the hierarchy. In the event there were no sales during the day or closing prices are not available, securities are valued at the last quoted bid price or may be valued using the last available price and are generally categorized as Level 2 in the hierarchy. For foreign equity securities, when market or security specific events arise, comparisons to the valuation of American Depositary Receipts (ADRs), futures contracts, Exchange-Traded Funds (ETFs) and certain indexes as well as quoted prices for similar securities may be used and would be categorized as Level 2 in the hierarchy. Utilizing these techniques may result in transfers between Level 1 and Level 2. For equity securities, including restricted securities, where observable inputs are limited, assumptions about market activity and risk are used and these securities may be categorized as Level 3 in the hierarchy.
Annual Report
3. Significant Accounting Policies - continued
Investment Valuation - continued
Investments in open-end mutual funds, including the Fidelity Central Funds, are valued at their closing net asset value (NAV) each business day and are categorized as Level 1 in the hierarchy.
Changes in valuation techniques may result in transfers in or out of an assigned level within the disclosure hierarchy. The aggregate value of investments by input level, as of February 28, 2014, is included at the end of the Fund's Schedule of Investments.
Foreign Currency. The Fund may use foreign currency contracts to facilitate transactions in foreign-denominated securities. Gains and losses from these transactions may arise from changes in the value of the foreign currency or if the counterparties do not perform under the contracts' terms.
Foreign-denominated assets, including investment securities, and liabilities are translated into U.S. dollars at the exchange rates at period end. Purchases and sales of investment securities, income and dividends received and expenses denominated in foreign currencies are translated into U.S. dollars at the exchange rate in effect on the transaction date.
The effects of exchange rate fluctuations on investments are included with the net realized and unrealized gain (loss) on investment securities. Other foreign currency transactions resulting in realized and unrealized gain (loss) are disclosed separately.
Investment Transactions and Income. For financial reporting purposes, the Fund's investment holdings and NAV include trades executed through the end of the last business day of the period. The NAV per share for processing shareholder transactions is calculated as of the close of business of the New York Stock Exchange (NYSE), normally 4:00 p.m. Eastern time and includes trades executed through the end of the prior business day. Gains and losses on securities sold are determined on the basis of identified cost and may include proceeds received from litigation. Dividend income is recorded on the ex-dividend date, except for certain dividends from foreign securities where the ex-dividend date may have passed, which are recorded as soon as the Fund is informed of the ex-dividend date. Non-cash dividends included in dividend income, if any, are recorded at the fair market value of the securities received. Interest income and distributions from the Fidelity Central Funds are accrued as earned. Interest income includes coupon interest and amortization of premium and accretion of discount on debt securities. Investment income is recorded net of foreign taxes withheld where recovery of such taxes is uncertain.
Class Allocations and Expenses. Investment income, realized and unrealized capital gains and losses, common expenses of the Fund, and certain fund-level expense reductions, if any, are allocated daily on a pro-rata basis to each class based on the relative net assets of each class to the total net assets of the Fund. Each class differs with respect to transfer agent and distribution and service plan fees incurred. Certain expense reductions may also differ by class. For the reporting period, the allocated portion of income and expenses to each class as a percent of its average net assets may vary due to the timing of recording these transactions in relation to fluctuating net assets of the classes. Expenses directly attributable to a fund are charged to that fund. Expenses attributable to more than one fund are allocated among the respective funds on the basis of relative net assets or other appropriate methods. Expense estimates are accrued in the period to which they relate and adjustments are made when actual amounts are known.
Deferred Trustee Compensation. Under a Deferred Compensation Plan (the Plan), independent Trustees may elect to defer receipt of a portion of their annual compensation. Deferred amounts are invested in a cross-section of Fidelity funds, are marked-to-market and remain in the Fund until distributed in accordance with the Plan. The investment of deferred amounts and the offsetting payable to the Trustees are included in the accompanying Statement of Assets and Liabilities.
Income Tax Information and Distributions to Shareholders. Each year, the Fund intends to qualify as a regulated investment company under Subchapter M of the Internal Revenue Code, including distributing substantially all of its taxable income and realized gains. As a result, no provision for U.S. Federal income taxes is required. As of February 28, 2014, the Fund did not have any unrecognized tax benefits in the financial statements; nor is the Fund aware of any tax positions for which it is reasonably possible that the total amounts of unrecognized tax benefits will significantly change in the next twelve months. The Fund files a U.S. federal tax return, in addition to state and local tax returns as required. The Fund's federal income tax returns are subject to examination by the Internal Revenue Service (IRS) for a period of three fiscal years after they are filed. State and local tax returns may be subject to examination for an additional fiscal year depending on the jurisdiction. Foreign taxes are provided for based on the Fund's understanding of the tax rules and rates that exist in the foreign markets in which it invests. The Fund is subject to a tax imposed on capital gains by certain countries in which it invests. An estimated deferred tax liability for net unrealized appreciation on the applicable securities is included in Other payables and accrued expenses on the Statement of Assets & Liabilities.
Distributions are declared and recorded on the ex-dividend date. Income dividends and capital gain distributions are declared separately for each class. Income and capital gain distributions are determined in accordance with income tax regulations, which may differ from GAAP. In addition, certain Funds claimed a portion of the payment made to redeeming shareholders as a distribution for income tax purposes.
Capital accounts within the financial statements are adjusted for permanent book-tax differences. These adjustments have no impact on net assets or the results of operations. Capital accounts are not adjusted for temporary book-tax differences which will reverse in a subsequent period.
Book-tax differences are primarily due to foreign currency transactions, certain foreign taxes, deferred trustees compensation and losses deferred due to wash sales.
Annual Report
Notes to Financial Statements - continued
3. Significant Accounting Policies - continued
Income Tax Information and Distributions to Shareholders - continued
The federal tax cost of investment securities and unrealized appreciation (depreciation) as of period end were as follows:
Gross unrealized appreciation | $ 593,130,470 |
Gross unrealized depreciation | (16,836,140) |
Net unrealized appreciation (depreciation) on securities and other investments | $ 576,294,330 |
|
|
Tax Cost | $ 1,500,755,721 |
The tax-based components of distributable earnings as of period end were as follows:
Undistributed ordinary income | $ 5,746,120 |
Undistributed long-term capital gain | $ 67,301,735 |
Net unrealized appreciation (depreciation) | $ 576,306,290 |
The tax character of distributions paid was as follows:
| February 28, 2014 | February 28, 2013 |
Ordinary Income | $ 40,643,236 | $ 31,344,671 |
Long-term Capital Gains | 135,532,916 | 29,546,659 |
Total | $ 176,176,152 | $ 60,891,330 |
Trading (Redemption) Fees. Shares held by investors in the Fund less than 30 days may be subject to a redemption fee equal to .75% of the NAV of shares redeemed. All redemption fees, which reduce the proceeds of the shareholder redemption, are retained by the Fund and accounted for as an addition to paid in capital.
4. Purchases and Sales of Investments.
Purchases and sales of securities, other than short-term securities, aggregated $723,925,161 and $1,068,680,050, respectively.
5. Fees and Other Transactions with Affiliates.
Management Fee. Effective August 1, 2013, SelectCo replaced Fidelity Management and Research Company (FMR), an affiliate of SelectCo, as an investment advisor to the Fund. The investment adviser and its affiliates provide the Fund with investment management related services for which the Fund pays a monthly management fee. The management fee is the sum of an individual fund fee rate that is based on an annual rate of ..30% of the Fund's average net assets and an annualized group fee rate that averaged .25% during the period. The group fee rate is based upon the average net assets of all the mutual funds advised by FMR and the investment adviser. The group fee rate decreases as assets under management increase and increases as assets under management decrease. For the reporting period, the total annual management fee rate was .55% of the Fund's average net assets.
Distribution and Service Plan Fees. In accordance with Rule 12b-1 of the 1940 Act, the Fund has adopted separate Distribution and Service Plans for each class of shares. Certain classes pay Fidelity Distributors Corporation (FDC), an affiliate of the investment adviser, separate Distribution and Service Fees, each of which is based on an annual percentage of each class' average net assets. In addition, FDC may pay financial intermediaries for selling shares of the Fund and providing shareholder support services. For the period, the Distribution and Service Fee rates, total fees and amounts retained by FDC were as follows:
| Distribution | Service | Total Fees | Retained |
Class A | -% | .25% | $ 797,394 | $ 19,980 |
Class T | .25% | .25% | 300,761 | 118 |
Class B | .75% | .25% | 182,844 | 137,554 |
Class C | .75% | .25% | 1,567,705 | 369,895 |
|
|
| $ 2,848,704 | $ 527,547 |
Annual Report
5. Fees and Other Transactions with Affiliates - continued
Sales Load. FDC may receive a front-end sales charge of up to 5.75% for selling Class A shares and 3.50% for selling Class T shares, some of which is paid to financial intermediaries for selling shares of the Fund. Depending on the holding period, FDC may receive contingent deferred sales charges levied on Class A, Class T, Class B, and Class C redemptions. The deferred sales charges range from 5.00% to 1.00% for Class B shares, 1.00% for Class C shares, 1.00% for certain purchases of Class A shares and .25% for certain purchases of Class T shares.
For the period, sales charge amounts retained by FDC were as follows:
| Retained |
Class A | $ 256,782 |
Class T | 27,091 |
Class B* | 20,190 |
Class C* | 17,772 |
| $ 321,835 |
* When Class B and Class C shares are initially sold, FDC pays commissions from its own resources to financial intermediaries through which the sales are made.
Transfer Agent Fees. Fidelity Investments Institutional Operations Company, Inc., (FIIOC), an affiliate of the investment adviser, is the transfer, dividend disbursing and shareholder servicing agent for each class of the Fund. FIIOC receives account fees and asset-based fees that vary according to the account size and type of account of the shareholders of the respective classes of the Fund. FIIOC pays for typesetting, printing and mailing of shareholder reports, except proxy statements.
For the period, transfer agent fees for each class were as follows:
| Amount | % of |
Class A | $ 677,863 | .21 |
Class T | 139,412 | .23 |
Class B | 47,387 | .26 |
Class C | 335,943 | .21 |
Consumer Staples | 2,763,747 | .19 |
Institutional Class | 835,980 | .22 |
| $ 4,800,332 |
|
Accounting and Security Lending Fees. Fidelity Service Company, Inc. (FSC), an affiliate of the investment adviser, maintains the Fund's accounting records. The accounting fee is based on the level of average net assets for each month. Under a separate contract, FSC administers the security lending program. The security lending fee is based on the number and duration of lending transactions.
Brokerage Commissions. The Fund placed a portion of its portfolio transactions with brokerage firms which are affiliates of the investment adviser. Brokerage commissions are included in net realized gain (loss) and change in net unrealized appreciation (depreciation) in the Statement of Operations. The commissions paid to these affiliated firms were $12,975 for the period.
Interfund Lending Program. Pursuant to an Exemptive Order issued by the SEC, the Fund, along with other registered investment companies having management contracts with FMR or other affiliated entities of FMR, may participate in an interfund lending program. This program provides an alternative credit facility allowing the funds to borrow from, or lend money to, other participating affiliated funds. At period end, there were no interfund loans outstanding. The Fund's activity in this program during the period for which loans were outstanding was as follows:
Borrower or Lender | Average Loan | Weighted Average Interest Rate | Interest |
Borrower | $ 19,104,440 | .31% | $ 4,091 |
6. Committed Line of Credit.
The Fund participates with other funds managed by the investment adviser or an affiliate in a $4.25 billion credit facility (the "line of credit") to be utilized for temporary or emergency purposes to fund shareholder redemptions or for other short-term liquidity purposes. The Fund has agreed to pay commitment fees on its pro-rata portion of the line of credit, which amounted to $4,774 and is reflected in Miscellaneous expenses on the Statement of Operations. During the period, there were no borrowings on this line of credit.
Annual Report
Notes to Financial Statements - continued
7. Security Lending.
The Fund lends portfolio securities through a lending agent from time to time in order to earn additional income. For equity securities, a lending agent is used and may loan securities to certain qualified borrowers, which prior to August 1, 2013 included Fidelity Capital Markets (FCM), a broker-dealer affiliated with the Fund. On the settlement date of the loan, the Fund receives collateral (in the form of U.S. Treasury obligations, letters of credit and/or cash) against the loaned securities and maintains collateral in an amount not less than 100% of the market value of the loaned securities during the period of the loan. The market value of the loaned securities is determined at the close of business of the Fund and any additional required collateral is delivered to the Fund on the next business day. If the borrower defaults on its obligation to return the securities loaned because of insolvency or other reasons, the Fund may apply collateral received from the borrower against the obligation. The Fund may experience delays and costs in recovering the securities loaned. Any cash collateral received is invested the Fidelity Securities Lending Cash Central Fund. The value of loaned securities and cash collateral at period end are disclosed on the Fund's Statement of Assets and Liabilities. Security lending income represents the income earned on investing cash collateral, less rebates paid to borrowers and any lending agent fees associated with the loan, plus any premium payments received for lending certain types of securities. Security lending income is presented in the Statement of Operations as a component of income from Fidelity Central Funds. Total security lending income during the period amounted to $320,864. During the period, there were no securities loaned to FCM.
8. Bank Borrowings.
The Fund is permitted to have bank borrowings for temporary or emergency purposes to fund shareholder redemptions or for other short-term liquidity requirements. The Fund has established borrowing arrangements with certain banks. The interest rate on the borrowings is the bank's base rate, as revised from time to time. The average loan balance during the period for which loans were outstanding amounted to $7,763,571. The weighted average interest rate was .57%. The interest expense amounted to $861 under the bank borrowing program. At period end, there were no bank borrowings outstanding.
9. Expense Reductions.
Commissions paid to certain brokers with whom the investment adviser, or its affiliates, places trades on behalf of the Fund include an amount in addition to trade execution, which may be rebated back to the Fund to offset certain expenses. This amount totaled $68,126 for the period. In addition, through arrangements with the Fund's custodian, credits realized as a result of uninvested cash balances were used to reduce the Fund's expenses. During the period, these credits reduced the Fund's custody expenses by $57.
In addition, FMR reimbursed a portion of the Fund's operating expenses during the period in the amount of $9,129.
10. Distributions to Shareholders.
Distributions to shareholders of each class were as follows:
Years ended February 28, | 2014 | 2013 |
From net investment income |
|
|
Class A | $ 5,205,524 | $ 3,290,973 |
Class T | 826,286 | 500,306 |
Class B | 138,623 | 82,480 |
Class C | 1,548,556 | 820,066 |
Consumer Staples | 26,141,452 | 20,759,081 |
Institutional Class | 5,128,684 | 5,891,765 |
Total | $ 38,989,125 | $ 31,344,671 |
From net realized gain |
|
|
Class A | $ 18,454,866 | $ 3,434,776 |
Class T | 3,478,167 | 646,006 |
Class B | 1,077,295 | 260,273 |
Class C | 9,334,082 | 1,739,884 |
Consumer Staples | 84,245,287 | 18,561,423 |
Institutional Class | 20,597,330 | 4,904,297 |
Total | $ 137,187,027 | $ 29,546,659 |
Annual Report
11. Share Transactions.
Transactions for each class of shares were as follows:
| Shares | Dollars | ||
Years ended February 28, | 2014 | 2013 | 2014 | 2013 |
Class A |
|
|
|
|
Shares sold | 1,297,946 | 1,172,691 | $ 115,706,038 | $ 93,404,427 |
Reinvestment of distributions | 234,768 | 72,806 | 20,739,532 | 5,768,631 |
Shares redeemed | (1,022,897) | (756,998) | (90,649,691) | (59,959,929) |
Net increase (decrease) | 509,817 | 488,499 | $ 45,795,879 | $ 39,213,129 |
Class T |
|
|
|
|
Shares sold | 171,739 | 146,374 | $ 15,157,502 | $ 11,640,258 |
Reinvestment of distributions | 46,535 | 13,628 | 4,086,883 | 1,073,877 |
Shares redeemed | (126,021) | (73,443) | (11,017,450) | (5,785,079) |
Net increase (decrease) | 92,253 | 86,559 | $ 8,226,935 | $ 6,929,056 |
Class B |
|
|
|
|
Shares sold | 16,325 | 11,096 | $ 1,431,261 | $ 868,729 |
Reinvestment of distributions | 11,472 | 3,553 | 1,003,061 | 278,056 |
Shares redeemed | (46,659) | (56,866) | (4,085,147) | (4,452,338) |
Net increase (decrease) | (18,862) | (42,217) | $ (1,650,825) | $ (3,305,553) |
Class C |
|
|
|
|
Shares sold | 622,483 | 479,940 | $ 54,501,354 | $ 37,531,069 |
Reinvestment of distributions | 101,164 | 25,332 | 8,787,354 | 1,978,186 |
Shares redeemed | (417,359) | (291,408) | (36,266,564) | (22,752,561) |
Net increase (decrease) | 306,288 | 213,864 | $ 27,022,144 | $ 16,756,694 |
Consumer Staples |
|
|
|
|
Shares sold | 3,438,166 | 5,353,585 | $ 309,005,043 | $ 425,841,967 |
Reinvestment of distributions | 1,188,981 | 474,945 | 105,681,529 | 37,790,378 |
Shares redeemed | (6,154,349) | (5,260,820) | (548,691,818) | (416,646,931) |
Net increase (decrease) | (1,527,202) | 567,710 | $ (134,005,246) | $ 46,985,414 |
Institutional Class |
|
|
|
|
Shares sold | 2,006,485 | 3,475,040 | $ 181,066,529 | $ 279,763,267 |
Reinvestment of distributions | 271,028 | 125,836 | 24,047,781 | 10,030,919 |
Shares redeemed | (4,939,085) | (1,369,230) | (445,334,927) | (108,604,076) |
Net increase (decrease) | (2,661,572) | 2,231,646 | $ (240,220,617) | $ 181,190,110 |
12. Other.
The Fund's organizational documents provide former and current trustees and officers with a limited indemnification against liabilities arising in connection with the performance of their duties to the Fund. In the normal course of business, the Fund may also enter into contracts that provide general indemnifications. The Fund's maximum exposure under these arrangements is unknown as this would be dependent on future claims that may be made against the Fund. The risk of material loss from such claims is considered remote.
Annual Report
Report of Independent Registered Public Accounting Firm
To the Trustees of Fidelity Select Portfolios and the Shareholders of Consumer Staples Portfolio:
In our opinion, the accompanying statement of assets and liabilities, including the schedule of investments, and the related statements of operations and of changes in net assets and the financial highlights present fairly, in all material respects, the financial position of Consumer Staples Portfolio (a fund of Fidelity Select Portfolios) at February 28, 2014, the results of its operations for the year then ended, the changes in its net assets for each of the two years in the period then ended and the financial highlights for each of the five years in the period then ended, in conformity with accounting principles generally accepted in the United States of America. These financial statements and financial highlights (hereafter referred to as "financial statements") are the responsibility of the Consumer Staples Portfolio's management. Our responsibility is to express an opinion on these financial statements based on our audits. We conducted our audits of these financial statements in accordance with the standards of the Public Company Accounting Oversight Board (United States). Those standards require that we plan and perform the audit to obtain reasonable assurance about whether the financial statements are free of material misstatement. An audit includes examining, on a test basis, evidence supporting the amounts and disclosures in the financial statements, assessing the accounting principles used and significant estimates made by management, and evaluating the overall financial statement presentation. We believe that our audits, which included confirmation of securities at February 28, 2014 by correspondence with the custodian and brokers, provide a reasonable basis for our opinion.
PricewaterhouseCoopers LLP
Boston, Massachusetts
April 17, 2014
Annual Report
Trustees and Officers
The Trustees and officers of the trust and fund, as applicable, are listed below. The Board of Trustees governs the fund and is responsible for protecting the interests of shareholders. The Trustees are experienced executives who meet periodically throughout the year to oversee the fund's activities, review contractual arrangements with companies that provide services to the fund, oversee management of the risks associated with such activities and contractual arrangements, and review the fund's performance. Except for Ned C. Lautenbach and William S. Stavropoulos, each of the Trustees oversees 74 funds. Mr. Lautenbach and Mr. Stavropoulos each oversees 246 funds.
The Trustees hold office without limit in time except that (a) any Trustee may resign; (b) any Trustee may be removed by written instrument, signed by at least two-thirds of the number of Trustees prior to such removal; (c) any Trustee who requests to be retired or who has become incapacitated by illness or injury may be retired by written instrument signed by a majority of the other Trustees; and (d) any Trustee may be removed at any special meeting of shareholders by a two-thirds vote of the outstanding voting securities of the trust. The officers hold office without limit in time, except that any officer may resign or may be removed by a vote of a majority of the Trustees at any regular meeting or any special meeting of the Trustees. Except as indicated, each individual has held the office shown or other offices in the same company for the past five years.
Experience, Skills, Attributes, and Qualifications of the Fund's Trustees. The Governance and Nominating Committee has adopted a statement of policy that describes the experience, qualifications, attributes, and skills that are necessary and desirable for potential Independent Trustee candidates (Statement of Policy). The Board believes that each Trustee satisfied at the time he or she was initially elected or appointed a Trustee, and continues to satisfy, the standards contemplated by the Statement of Policy. The Governance and Nominating Committee also engages professional search firms to help identify potential Independent Trustee candidates who have the experience, qualifications, attributes, and skills consistent with the Statement of Policy. From time to time, additional criteria based on the composition and skills of the current Independent Trustees, as well as experience or skills that may be appropriate in light of future changes to board composition, business conditions, and regulatory or other developments, have also been considered by the professional search firms and the Governance and Nominating Committee. In addition, the Board takes into account the Trustees' commitment and participation in Board and committee meetings, as well as their leadership of standing and ad hoc committees throughout their tenure.
In determining that a particular Trustee was and continues to be qualified to serve as a Trustee, the Board has considered a variety of criteria, none of which, in isolation, was controlling. The Board believes that, collectively, the Trustees have balanced and diverse experience, qualifications, attributes, and skills, which allow the Board to operate effectively in governing the fund and protecting the interests of shareholders. Information about the specific experience, skills, attributes, and qualifications of each Trustee, which in each case led to the Board's conclusion that the Trustee should serve (or continue to serve) as a trustee of the fund, is provided below.
Board Structure and Oversight Function. Brian B. Hogan is an interested person (as defined in the 1940 Act) and currently serves as Chairman. The Trustees have determined that an interested Chairman is appropriate and benefits shareholders because an interested Chairman has a personal and professional stake in the quality and continuity of services provided to the fund. Independent Trustees exercise their informed business judgment to appoint an individual of their choosing to serve as Chairman, regardless of whether the Trustee happens to be independent or a member of management. The Independent Trustees have determined that they can act independently and effectively without having an Independent Trustee serve as Chairman and that a key structural component for assuring that they are in a position to do so is for the Independent Trustees to constitute a substantial majority for the Board. The Independent Trustees also regularly meet in executive session. Michael E. Wiley serves as Chairman of the Independent Trustees and as such (i) acts as a liaison between the Independent Trustees and management with respect to matters important to the Independent Trustees and (ii) with management prepares agendas for Board meetings.
Fidelity funds are overseen by different Boards of Trustees. The fund's Board oversees Fidelity's sector portfolios. Other Boards oversee Fidelity's equity and high income funds, and Fidelity's investment grade bond, money market, and asset allocation funds. The use of separate Boards, each with its own committee structure, allows the Trustees of each group of Fidelity funds to focus on the unique issues of the funds they oversee, including common research, investment, and operational issues. On occasion, the separate Boards establish joint committees to address issues of overlapping consequences for the Fidelity funds overseen by each Board.
The Trustees operate using a system of committees to facilitate the timely and efficient consideration of all matters of importance to the Trustees, the fund, and fund shareholders and to facilitate compliance with legal and regulatory requirements and oversight of the fund's activities and associated risks. The Board, acting through its committees, has charged SelectCo and its affiliates with (i) identifying events or circumstances the occurrence of which could have demonstrably adverse effects on the fund's business and/or reputation; (ii) implementing processes and controls to lessen the possibility that such events or circumstances occur or to mitigate the effects of such events or circumstances if they do occur; and (iii) creating and maintaining a system designed to evaluate continuously business and market conditions in order to facilitate the identification and implementation processes described in (i) and (ii) above. Because the day-to-day operations and activities of the funds are carried out by or through SelectCo, its affiliates, and other service providers, the fund's exposure to risks is mitigated but not eliminated by the processes overseen by the Trustees. While each of the Board's committees has responsibility for overseeing different aspects of the fund's activities, oversight is exercised primarily through the Operations and Audit Committees. Appropriate personnel, including but not limited to the fund's Chief Compliance Officer (CCO), SelectCo's internal auditor, the independent accountants, the fund's Treasurer and portfolio management personnel, make periodic reports to the Board's committees, as appropriate. The responsibilities of each standing committee, including their oversight responsibilities, are described further under "Standing Committees of the Fund's Trustees."
The funds' Statement of Additional Information (SAI) includes more information about the Trustees. To request a free copy, call Fidelity at 1-800-544-8544.
Annual Report
Trustees and Officers - continued
Interested Trustee*:
Correspondence intended for the Trustee who is an interested person may be sent to Fidelity Investments, 245 Summer Street, Boston, Massachusetts 02210.
Name, Year of Birth; Principal Occupations and Other Relevant Experience+ | |
Brian B. Hogan (1964) | |
Year of Election or Appointment: 2014 Trustee Chairman of the Board of Trustees | |
| Mr. Hogan also serves as Trustee or Vice President of other funds. Mr. Hogan serves as President of FMR's Equity Division (2009-present). Previously, Mr. Hogan served as Senior Vice President, Equity Research of FMR (2006-2009) and as a portfolio manager. |
* Trustee has been determined to be an "Interested Trustee" by virtue of, among other things, his affiliation with the trust or various entities under common control with SelectCo.
+ The information above includes the Trustee's principal occupation during the last five years and other information relating to the experience, attributes, and skills relevant to the Trustee's qualifications to serve as a Trustee, which led to the conclusion that the Trustee should serve as a Trustee for the fund.
Independent Trustees:
Correspondence intended for each Independent Trustee (that is, the Trustees other than the Interested Trustee) may be sent to Fidelity Investments, P.O. Box 55235, Boston, Massachusetts 02205-5235.
Name, Year of Birth; Principal Occupations and Other Relevant Experience+ | |
Ned C. Lautenbach (1944) | |
Year of Election or Appointment: 2000 Trustee | |
| Mr. Lautenbach also serves as Trustee of other Fidelity funds. Mr. Lautenbach currently serves as the Lead Director of the Eaton Corporation Board of Directors (diversified industrial, 1997-present). Mr. Lautenbach is Chairman of the Board of Directors of the Philharmonic Center for the Arts in Naples, Florida (2012-present) and a member of the Council on Foreign Relations (1994-present). Previously, Mr. Lautenbach was a Partner/Advisory Partner at Clayton, Dubilier & Rice, LLC (private equity investment, 1998-2010), as well as a Director of Sony Corporation (2006-2007). |
David A. Rosow (1942) | |
Year of Election or Appointment: 2013 Trustee | |
| Mr. Rosow also serves as Trustee of other Fidelity funds. Mr. Rosow is Chairman and Chief Executive Officer of International Golf Group, Inc. (golf course development, 1989-present). Previously, Mr. Rosow served as Chairman and Chief Executive Officer of Rosow & Company, Inc. (private investment company, 1989-2011), a Lead Director of Hudson United Bancorp (2001-2006) and as a Director of TD Banknorth (1996-2006). In addition, Mr. Rosow is a member (2008-present) and President (2009-present) of the Town Council of Palm Beach, Florida. Mr. Rosow served as a Member of the Advisory Board of other Fidelity funds (2012-2013). |
Garnett A. Smith (1947) | |
Year of Election or Appointment: 2013 Trustee | |
| Mr. Smith also serves as Trustee of other Fidelity funds. Prior to Mr. Smith's retirement, he served as Chairman and Chief Executive Officer of Inbrand Corp. (manufacturer of personal absorbent products, 1990-1997). He also served as President (1986-1990) of Inbrand Corp. Prior to his employment with Inbrand Corp., he was employed by a retail fabric chain and North Carolina National Bank. In addition, Mr. Smith is a board member of the Jackson Hole Land Trust (2009-present). Mr. Smith served as a Member of the Advisory Board of other Fidelity funds (2012-2013). |
William S. Stavropoulos (1939) | |
Year of Election or Appointment: 2001 Trustee | |
| Mr. Stavropoulos also serves as Trustee of other Fidelity funds. Mr. Stavropoulos serves as President and Founder of the Michigan Baseball Foundation, the Great Lakes Loons (2007-present). Mr. Stavropoulos is Chairman Emeritus of the Board of Directors of The Dow Chemical Company, where he previously served in numerous senior management positions, including President, CEO (1995-2000; 2002-2004), Chairman of the Executive Committee (2000-2006), and as a member of the Board of Directors (1990-2006). Currently, Mr. Stavropoulos is Chairman of the Board of Directors of Univar Inc. (global distributor of commodity and specialty chemicals), a Director of Teradata Corporation (data warehousing and technology solutions), and Maersk Inc. (industrial conglomerate), and a member of the Advisory Board for Metalmark Capital LLC (private equity investment, 2005-present). Mr. Stavropoulos is an operating advisor to Clayton, Dubilier & Rice, LLC (private equity investment). In addition, Mr. Stavropoulos is a member of the University of Notre Dame Advisory Council for the College of Science, a Trustee of the Rollin L. Gerstacker Foundation, and a Director of the Naples Philharmonic Center for the Arts. Previously, Mr. Stavropoulos served as a Director of Chemical Financial Corporation (bank holding company, 1993-2012) and Tyco International, Ltd. (multinational manufacturing and services, 2007-2012). |
Michael E. Wiley (1950) | |
Year of Election or Appointment: 2008 Trustee Chairman of the Independent Trustees | |
| Mr. Wiley also serves as Trustee of other Fidelity funds. Mr. Wiley serves as a Director of Asia Pacific Exploration Consolidated (international oil and gas exploration and production, 2008-present). Mr. Wiley serves as a Director of Tesoro Corporation (independent oil refiner and marketer, 2005-present), and a Director of Bill Barrett Corporation (exploration and production, 2005-present). In addition, Mr. Wiley also serves as a Director of Post Oak Bank (privately-held bank, 2004-present). Previously, Mr. Wiley served as a Trustee of other Fidelity funds (2008-2013), as a member of the Board of Trustees of the University of Tulsa (2000-2006; 2007-2010), as a Senior Energy Advisor of Katzenbach Partners, LLC (consulting, 2006-2007), as an Advisory Director of Riverstone Holdings (private investment), Chairman, President, and CEO of Baker Hughes, Inc. (oilfield services, 2000-2004), and as Director of Spinnaker Exploration Company (exploration and production, 2001-2005). |
+ The information above includes each Trustee's principal occupation during the last five years and other information relating to the experience, attributes, and skills relevant to each Trustee's qualifications to serve as a Trustee, which led to the conclusion that each Trustee should serve as a Trustee for the fund.
Officers:
Except for Anthony R. Rochte, correspondence intended for each officer may be sent to Fidelity Investments, 245 Summer Street, Boston, Massachusetts 02210. Correspondence intended for Mr. Rochte may be sent to SelectCo, 1225 17th Street, Denver, Colorado 80202-5541. Officers appear below in alphabetical order.
Name, Year of Birth; Principal Occupation | |
Christopher S. Bartel (1971) | |
Year of Election or Appointment: 2009 Vice President | |
| Mr. Bartel also serves as Vice President of other funds. Mr. Bartel serves as a Director, President, and Chief Executive Officer of Fidelity Management & Research (Japan) Inc. (2012-present), a Director of Fidelity Management & Research (Hong Kong) (2012-present), and Senior Vice President of Global Equity Research (2010-present). Previously, Mr. Bartel served as Senior Vice President of Equity Research (2009-2010), Managing Director of Research (2006-2009), and an analyst and portfolio manager (2000-2006). |
Elizabeth Paige Baumann (1968) | |
Year of Election or Appointment: 2012 Anti-Money Laundering (AML) Officer | |
| Ms. Baumann also serves as AML Officer of other funds. She is Chief AML Officer of FMR LLC (2012-present) and is an employee of Fidelity Investments. Previously, Ms. Baumann served as Vice President and Deputy Anti-Money Laundering Officer (2007-2012). |
Marc Bryant (1966) | |
Year of Election or Appointment: 2013 Secretary | |
| Mr. Bryant also serves as an officer of other funds. He is Senior Vice President and Deputy General Counsel of FMR LLC. Prior to joining Fidelity Investments, Mr. Bryant served as a Senior Vice President and the Head of Global Retail Legal for AllianceBernstein L.P. (2006-2010), and as the General Counsel for ProFund Advisors LLC (2001-2006). |
William C. Coffey (1969) | |
Year of Election or Appointment: 2009 Assistant Secretary | |
| Mr. Coffey also serves as Assistant Secretary of other funds. He is Senior Vice President and Deputy General Counsel of FMR LLC (2010-present), and is an employee of Fidelity Investments. Previously, Mr. Coffey served as Vice President and Associate General Counsel of FMR LLC (2005-2009). |
Jonathan Davis (1968) | |
Year of Election or Appointment: 2010 Assistant Treasurer | |
| Mr. Davis also serves as Assistant Treasurer of other funds. Mr. Davis is an employee of Fidelity Investments. Previously, Mr. Davis served as Vice President and Associate General Counsel of FMR LLC (2003-2010). |
Adrien E. Deberghes (1967) | |
Year of Election or Appointment: 2013 President and Treasurer | |
| Mr. Deberghes also serves as an officer of other funds. He is an employee of Fidelity Investments (2008-present). Prior to joining Fidelity Investments, Mr. Deberghes was Senior Vice President of Mutual Fund Administration at State Street Corporation (2007-2008), Senior Director of Mutual Fund Administration at Investors Bank & Trust (2005-2007), and Director of Finance for Dunkin' Brands (2000-2005). |
Stephanie J. Dorsey (1969) | |
Year of Election or Appointment: 2010 Assistant Treasurer | |
| Ms. Dorsey also serves as an officer of other funds. She is an employee of Fidelity Investments (2008-present) and has served in other fund officer roles. Prior to joining Fidelity Investments, Ms. Dorsey served as Treasurer (2004-2008) of the JPMorgan Mutual Funds and Vice President (2004-2008) of JPMorgan Chase Bank. |
Joseph A. Hanlon (1968) | |
Year of Election or Appointment: 2012 Chief Compliance Officer | |
| Mr. Hanlon also serves as Chief Compliance Officer of other funds. Mr. Hanlon serves as Compliance Officer of FMR, FMR Co., Inc., Fidelity Investments Money Management, Inc. (FIMM), Fidelity Research and Analysis Company (FRAC), and Fidelity Management & Research (Hong Kong) (2009-present), as Senior Vice President of the Fidelity Asset Management Division (2009-present), and is an employee of Fidelity Investments. Previously, Mr. Hanlon served as Compliance Officer of Fidelity Management & Research (Japan) Inc. (2009-2013), Strategic Advisers, Inc. (2009-2013), and Fidelity Management & Research (U.K.) Inc. (2009-2013). |
Brian B. Hogan (1964) | |
Year of Election or Appointment: 2009 Vice President | |
| Mr. Hogan also serves as Trustee or Vice President of other funds. Mr. Hogan serves as President of FMR's Equity Division (2009-present). Previously, Mr. Hogan served as Senior Vice President, Equity Research of FMR (2006-2009) and as a portfolio manager. |
Chris Maher (1972) | |
Year of Election or Appointment: 2013 Assistant Treasurer | |
| Mr. Maher serves as Assistant Treasurer of other funds. Mr. Maher is Vice President of Valuation Oversight and is an employee of Fidelity Investments. Previously, Mr. Maher served as Vice President of Asset Management Compliance (2013), Vice President of FMR's Program Management Group (2010-2013), and Vice President of Valuation Oversight (2008-2010). |
Christine Reynolds (1958) | |
Year of Election or Appointment: 2008 Chief Financial Officer | |
| Ms. Reynolds also serves as Chief Financial Officer of other funds. Ms. Reynolds became President of Fidelity Pricing and Cash Management Services (FPCMS) in August 2008. Ms. Reynolds served as Chief Operating Officer of FPCMS (2007-2008). Previously, Ms. Reynolds served as President, Treasurer, and Anti-Money Laundering officer of the Fidelity funds (2004-2007). |
Kenneth B. Robins (1969) | |
Year of Election or Appointment: 2013 Deputy Treasurer | |
| Mr. Robins also serves as an officer of other funds. Mr. Robins serves as Executive Vice President of Fidelity Investments Money Management, Inc. (FIMM) (2013-present) and is an employee of Fidelity Investments (2004-present). Previously, Mr. Robins served in other fund officer roles. |
Anthony R. Rochte (1968) | |
Year of Election or Appointment: 2013 Vice President | |
| Mr. Rochte also serves as Vice President of other funds. Mr. Rochte serves as President of Fidelity SelectCo, LLC (2012-present) and is an employee of Fidelity Investments (2012-present). Prior to joining Fidelity Investments, Mr. Rochte served as Senior Managing Director and head of State Street Global Advisors' North American Intermediary Business Group (2006-2012). |
Stacie M. Smith (1974) | |
Year of Election or Appointment: 2013 Assistant Treasurer | |
| Ms. Smith also serves as an officer of other funds. She is an employee of Fidelity Investments (2009-present) and has served in other fund officer roles. Prior to joining Fidelity Investments, Ms. Smith served as Senior Audit Manager of Ernst & Young LLP (1996-2009). |
Renee Stagnone (1975) | |
Year of Election or Appointment: 2013 Deputy Treasurer | |
| Ms. Stagnone also serves as Deputy Treasurer of other funds. Ms. Stagnone is an employee of Fidelity Investments. |
Joseph F. Zambello (1957) | |
Year of Election or Appointment: 2011 Deputy Treasurer | |
| Mr. Zambello also serves as Deputy Treasurer of other funds. Mr. Zambello is an employee of Fidelity Investments. Previously, Mr. Zambello served as Vice President of FMR's Program Management Group (2009-2011) and Vice President of the Transfer Agent Oversight Group (2005-2009). |
Annual Report
Distributions (Unaudited)
The Board of Trustees of Consumer Staples Portfolio voted to pay on April 14, 2014 to shareholders of record at the opening of business on April 11, 2014, a distribution of $2.753 per share derived from capital gains realized from sales of portfolio securities and a dividend of $0.256 per share from net investment income.
Consumer Staples hereby designates as a capital gain dividend with respect to the taxable year ended February 28, 2014, $154,311,669 or, if subsequently determined to be different, the net capital gain of such year.
Consumer Staples designates 73% and 100% of the dividends distributed in April and December, respectively during the fiscal year as qualifying for the dividends-received deduction for corporate shareholders.
Consumer Staples designates 100% of the dividends distributed during the fiscal year as amounts which may be taken into account as a dividend for the purposes of the maximum rate under section 1(h)(11) of the Internal Revenue Code.
The fund will notify shareholders in January 2015 of amounts for use in preparing 2014 income tax returns.
Annual Report
Proxy Voting Results
A special meeting of Consumer Staples Portfolio's shareholders was held on June 18, 2013. The results of votes taken among shareholders on the proposals before them are reported below. Each vote reported represents one dollar of net asset value held on the record date for the meeting.
PROPOSAL 1 | ||
To elect a Board of Trustees. A | ||
| # of | % of |
Ned C. Lautenbach | ||
Affirmative | 25,828,395,115.78 | 94.160 |
Withheld | 1,602,101,684.27 | 5.840 |
TOTAL | 27,430,496,800.05 | 100.000 |
Ronald P. O'Hanley | ||
Affirmative | 25,907,936,922.24 | 94.450 |
Withheld | 1,522,559,877.81 | 5.550 |
TOTAL | 27,430,496,800.05 | 100.000 |
David A. Rosow | ||
Affirmative | 25,805,492,959.91 | 94.076 |
Withheld | 1,625,003,840.14 | 5.924 |
TOTAL | 27,430,496,800.05 | 100.000 |
Garnett A. Smith | ||
Affirmative | 25,892,258,831.97 | 94.393 |
Withheld | 1,538,237,968.08 | 5.607 |
TOTAL | 27,430,496,800.05 | 100.000 |
William S. Stavropoulos | ||
Affirmative | 25,738,476,030.34 | 93.832 |
Withheld | 1,692,020,769.71 | 6.168 |
TOTAL | 27,430,496,800.05 | 100.000 |
Michael E. Wiley | ||
Affirmative | 25,923,640,743.27 | 94.507 |
Withheld | 1,506,856,056.78 | 5.493 |
TOTAL | 27,430,496,800.05 | 100.000 |
PROPOSAL 2 | ||
To approve a management contract between the fund and Fidelity SelectCo, LLC. | ||
| # of | % of |
Affirmative | 1,231,896,932.45 | 72.402 |
Against | 59,201,079.18 | 3.479 |
Abstain | 62,956,309.82 | 3.700 |
Broker Non-Vote | 347,429,518.32 | 20.419 |
TOTAL | 1,701,483,839.77 | 100.000 |
A Denotes trust-wide proposal and voting results.
Annual Report
Investment Adviser
Fidelity SelectCo, LLC
Denver, CO
Investment Sub-Advisers
FMR Co., Inc.
Fidelity Management & Research
(U.K.) Inc.
Fidelity Management & Research
(Hong Kong) Limited
Fidelity Management & Research
(Japan) Inc.
General Distributor
Fidelity Distributors Corporation
Smithfield, RI
Transfer and Service Agents
Fidelity Investments Institutional
Operations Company, Inc.
Boston, MA
Fidelity Service Company, Inc.
Boston, MA
Custodian
Brown Brothers Harriman & Co.
Boston, MA
Corporate Headquarters
245 Summer Street
Boston, MA 02210
1-800-544-8888
The Fidelity Telephone Connection
Mutual Fund 24-Hour Service
Exchanges/Redemptions
and Account Assistance 1-800-544-6666
Product Information 1-800-544-8888
Retirement Accounts 1-800-544-4774
(8 a.m. - 9 p.m.)
TDD Service 1-800-544-0118
for the deaf and hearing impaired
(9 a.m. - 9 p.m. Eastern time)
Fidelity Automated Service
Telephone (FAST®)
1-800-544-5555
Automated line for quickest service

SELCS-UANNPRO-0414
1.910418.104
Fidelity®
Select Portfolios®
Telecommunications Services Sector
Telecommunications Portfolio
Wireless Portfolio
Annual Report
February 28, 2014
(Fidelity Cover Art)
Contents
Telecommunications Portfolio | Performance | |
| Management's Discussion | |
| Shareholder Expense Example | |
| Investment Changes | |
| Investments | |
| Financial Statements | |
| Notes to the Financial Statements | |
Wireless Portfolio | Performance | |
| Management's Discussion | |
| Shareholder Expense Example | |
| Investment Changes | |
| Investments | |
| Financial Statements | |
| Notes to the Financial Statements | |
Report of Independent Registered Public Accounting Firm |
| |
Trustees and Officers |
| |
Distributions |
| |
Proxy Voting Results |
|
To view a fund's proxy voting guidelines and proxy voting record for the 12-month period ended June 30, visit http://www.fidelity.com/proxyvotingresults or visit the Securities and Exchange Commission's (SEC) web site at http://www.sec.gov. You may also call 1-800-544-8544 to request a free copy of the proxy voting guidelines.
Standard & Poor's, S&P and S&P 500 are registered service marks of The McGraw-Hill Companies, Inc. and have been licensed for use by Fidelity Distributors Corporation.
Other third-party marks appearing herein are the property of their respective owners.
All other marks appearing herein are registered or unregistered trademarks or service marks of FMR LLC or an affiliated company. © 2014 FMR LLC. All rights reserved.
This report and the financial statements contained herein are submitted for the general information of the shareholders of the funds. This report is not authorized for distribution to prospective investors in the funds unless preceded or accompanied by an effective prospectus.
A fund files its complete schedule of portfolio holdings with the SEC for the first and third quarters of each fiscal year on Form N-Q. Forms N-Q are available on the SEC's web site at http://www.sec.gov. A fund's Forms N-Q may be reviewed and copied at the SEC's Public Reference Room in Washington, DC. Information regarding the operation of the SEC's Public Reference Room may be obtained by calling 1-800-SEC-0330. For a complete list of a fund's portfolio holdings, view the most recent holdings listing, semiannual report, or annual report on Fidelity's web site at http://www.fidelity.com, http://www.advisor.fidelity.com, or http://www.401k.com, as applicable.
NOT FDIC INSURED • MAY LOSE VALUE • NO BANK GUARANTEE
Neither the funds nor Fidelity Distributors Corporation is a bank.
Annual Report
Performance: The Bottom Line
Average annual total return reflects the change in the value of an investment, assuming reinvestment of the class' distributions from dividend income and capital gains (the profits earned upon the sale of securities that have grown in value, if any) and assuming a constant rate of performance each year. The $10,000 table and the fund's returns do not reflect the deduction of taxes that a shareholder would pay on fund distributions or the redemption of fund shares. During periods of reimbursement by Fidelity, a fund's total returns will be greater than it would be had the reimbursement not occurred. How a fund did yesterday is no guarantee of how it will do tomorrow.
Average Annual Total Returns
Periods ended February 28, 2014 | Past 1 | Past 5 | Past 10 |
Telecommunications Portfolio | 16.40% | 19.19% | 6.73% |
$10,000 Over 10 Years
Let's say hypothetically that $10,000 was invested in Telecommunications Portfolio, a class of the fund, on February 29, 2004. The chart shows how the value of your investment would have changed, and also shows how the S&P 500® Index performed over the same period.
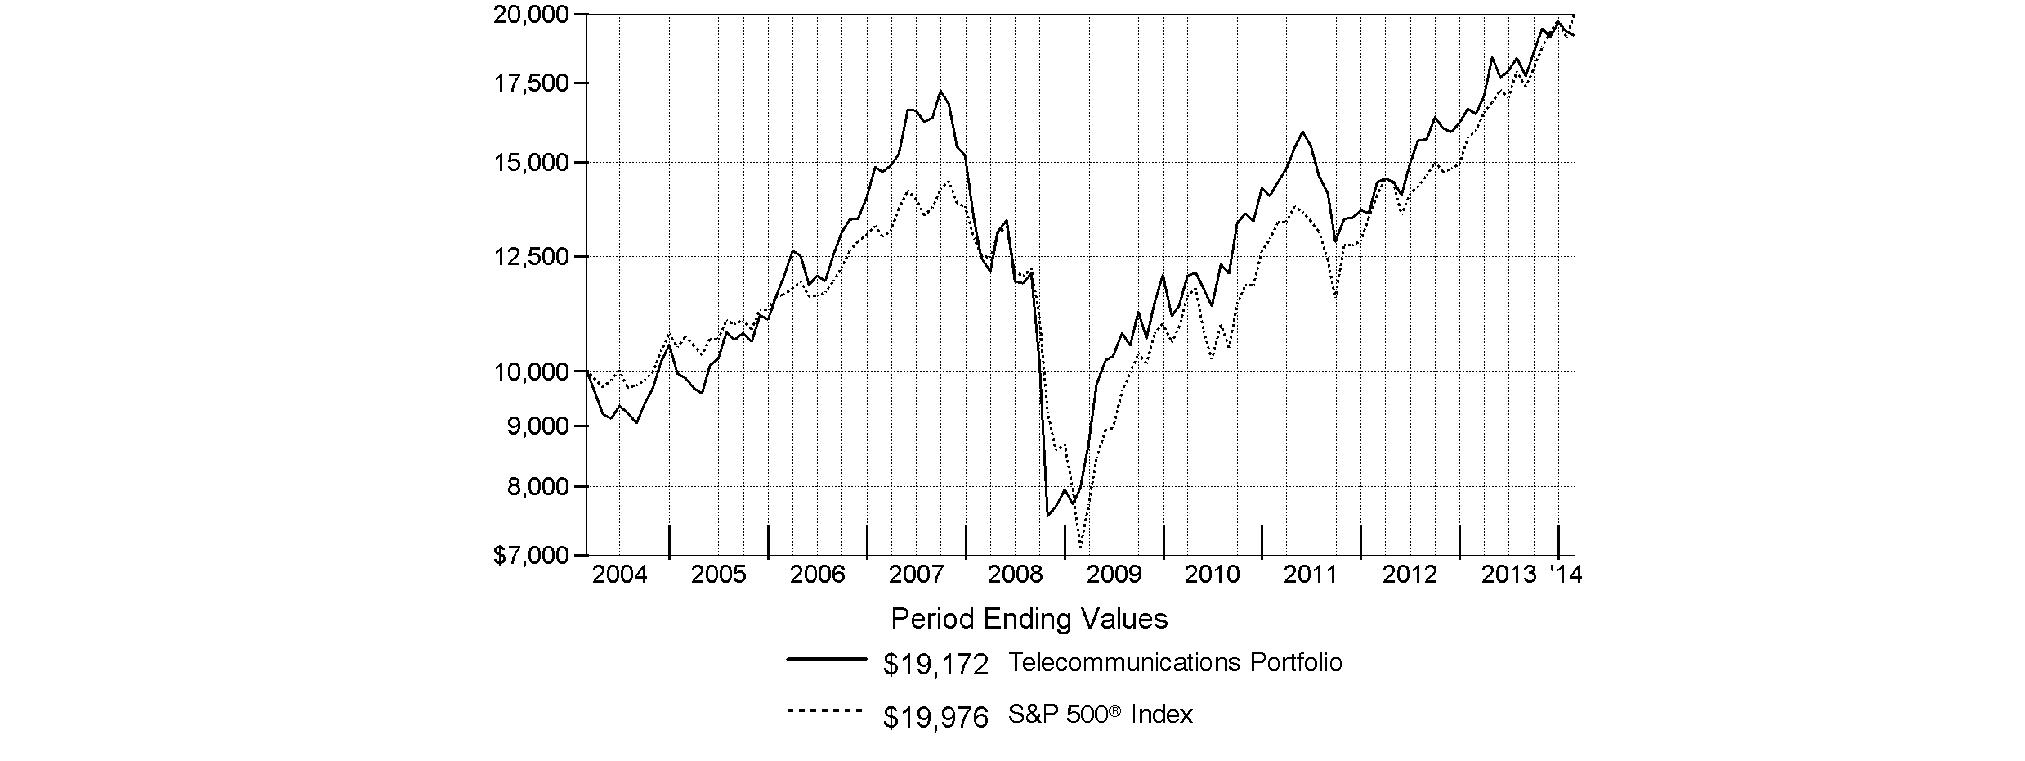
Annual Report
Telecommunications Portfolio
Management's Discussion of Fund Performance
Market Recap: Stocks overcame fears of higher interest rates - not to mention their worst January in four years - to finish sharply higher for the 12 months ending February 28, 2014. The broad S&P 500® Index and the blue-chip Dow Jones Industrial AverageSM gained 25.37% and 19.01%, respectively, amid generally favorable earnings reports and accommodative monetary policies worldwide. Performance generally increased along the risk spectrum, with smaller-cap and growth strategies leading the way. An ebullient market helped the growth-oriented Nasdaq Composite Index® to a 38.10% period gain, for example. On the other hand, both cyclical and defensive stocks had representation in the top-performing industry sectors: returns were highest in health care and consumer discretionary; lowest in utilities and telecommunication services. From a macroeconomic perspective, data still points to slow but steady improvement in the U.S., and Europe's recession may well be over. Reports from China have disappointed, but continue to suggest a relatively soft landing there. Mixed signals from the U.S. Federal Reserve as to when it might curtail its stimulative bond buying kept markets in flux during the spring and summer. Stocks regained momentum in October despite a federal budget impasse and brief government shutdown, and lower volatility prevailed through year-end. Shedding new-year concerns about China's economy, an emerging-markets sell-off and confirmation (at last) of Fed tapering - alongside confirmation of a presumably dovish Janet Yellen as new Fed chair - February saw stocks back in record territory, bearing down on the five-year anniversary of the market's bottom.
Comments from Matthew Drukker, Portfolio Manager of Telecommunications Portfolio: For the year, the fund's Retail Class shares gained 16.40%, underperforming the 17.26% result of the MSCI® U.S. IMI Telecommunications Services 25-50 Index and the broad-based S&P 500®. Versus the MSCI sector benchmark, underweighting Sprint - which dropped Nextel from its name in July after SoftBank became majority owner of the firm - was the biggest individual detractor. The stock outperformed later in the period amid reports of SoftBank's potential bid for T-Mobile. I held an underweighting, on average, in Sprint Nextel before the SoftBank deal was closed, and that position was one of the biggest contributors, as the stock underperformed. A smaller-than-index position in Leap Wireless International was detrimental. The stock surged in July when AT&T agreed to purchase the prepaid wireless carrier in a cash bid worth $1.2 billion. With smartphone penetration in the U.S. already above 70%, revenue growth slowed from new data-plan customers that historically helped support earnings. I thought AT&T would be most adversely affected, and underweighting the telecom stalwart was by far the fund's biggest relative contributor. Investors' renewed concern that competitive threats, predominantly from T-Mobile, could hinder future profit margins and growth, weighed on the stock for most of the year. Consequently, an overweighting, on average, in T-Mobile, where I saw greater growth prospects, also was the right call. I added the stock to the fund in May and shares took off in December amid reports that Japan-based SoftBank - the parent company of Sprint - was preparing a bid for the firm.
The views expressed above reflect those of the portfolio manager(s) only through the end of the period as stated on the cover of this report and do not necessarily represent the views of Fidelity or any other person in the Fidelity organization. Any such views are subject to change at any time based upon market or other conditions and Fidelity disclaims any responsibility to update such views. These views may not be relied on as investment advice and, because investment decisions for a Fidelity fund are based on numerous factors, may not be relied on as an indication of trading intent on behalf of any Fidelity fund.
Annual Report
Telecommunications Portfolio
Shareholder Expense Example
As a shareholder of the Fund, you incur two types of costs: (1) transaction costs, including sales charges (loads) on purchase payments or redemption proceeds, redemption fees and (2) ongoing costs, including management fees, distribution and/or service (12b-1) fees and other Fund expenses. This Example is intended to help you understand your ongoing costs (in dollars) of investing in the Fund and to compare these costs with the ongoing costs of investing in other mutual funds.
The Example is based on an investment of $1,000 invested at the beginning of the period and held for the entire period (September 1, 2013 to February 28, 2014).
Actual Expenses
The first line of the accompanying table for each class of the Fund provides information about actual account values and actual expenses. You may use the information in this line, together with the amount you invested, to estimate the expenses that you paid over the period. Simply divide your account value by $1,000.00 (for example, an $8,600 account value divided by $1,000.00 = 8.6), then multiply the result by the number in the first line for a class of the Fund under the heading entitled "Expenses Paid During Period" to estimate the expenses you paid on your account during this period. A small balance maintenance fee of $12.00 that is charged once a year may apply for certain accounts with a value of less than $2,000. This fee is not included in the table below. If it was, the estimate of expenses you paid during the period would be higher, and your ending account value lower, by this amount. In addition, the Fund, as a shareholder in the underlying Fidelity Central Funds, will indirectly bear its pro-rata share of the fees and expenses incurred by the underlying Fidelity Central Funds. These fees and expenses are not included in the Fund's annualized expense ratio used to calculate the expense estimate in the table below.
Hypothetical Example for Comparison Purposes
The second line of the accompanying table for each class of the Fund provides information about hypothetical account values and hypothetical expenses based on a Class' actual expense ratio and an assumed rate of return of 5% per year before expenses, which is not the Class' actual return. The hypothetical account values and expenses may not be used to estimate the actual ending account balance or expenses you paid for the period. You may use this information to compare the ongoing costs of investing in the Fund and other funds. To do so, compare this 5% hypothetical example with the 5% hypothetical examples that appear in the shareholder reports of the other funds. A small balance maintenance fee of $12.00 that is charged once a year may apply for certain accounts with a value of less than $2,000. This fee is not included in the table below. If it was, the estimate of expenses you paid during the period would be higher, and your ending account value lower, by this amount. In addition, the Fund, as a shareholder in the underlying Fidelity Central Funds, will indirectly bear its pro-rata share of the fees and expenses incurred by the underlying Fidelity Central Funds. These fees and expenses are not included in the Fund's annualized expense ratio used to calculate the expense estimate in the table below.
Please note that the expenses shown in the table are meant to highlight your ongoing costs only and do not reflect any transaction costs. Therefore, the second line of the table is useful in comparing ongoing costs only, and will not help you determine the relative total costs of owning different funds. In addition, if these transactional costs were included, your costs would have been higher.
| Annualized | Beginning | Ending | Expenses Paid |
Class A | 1.17% |
|
|
|
Actual |
| $ 1,000.00 | $ 1,079.80 | $ 6.03 |
Hypothetical A |
| $ 1,000.00 | $ 1,018.99 | $ 5.86 |
Class T | 1.48% |
|
|
|
Actual |
| $ 1,000.00 | $ 1,078.10 | $ 7.63 |
Hypothetical A |
| $ 1,000.00 | $ 1,017.46 | $ 7.40 |
Class B | 1.93% |
|
|
|
Actual |
| $ 1,000.00 | $ 1,075.60 | $ 9.93 |
Hypothetical A |
| $ 1,000.00 | $ 1,015.22 | $ 9.64 |
Class C | 1.86% |
|
|
|
Actual |
| $ 1,000.00 | $ 1,076.10 | $ 9.57 |
Hypothetical A |
| $ 1,000.00 | $ 1,015.57 | $ 9.30 |
Telecommunications | .84% |
|
|
|
Actual |
| $ 1,000.00 | $ 1,081.60 | $ 4.34 |
Hypothetical A |
| $ 1,000.00 | $ 1,020.63 | $ 4.21 |
Institutional Class | .91% |
|
|
|
Actual |
| $ 1,000.00 | $ 1,081.20 | $ 4.70 |
Hypothetical A |
| $ 1,000.00 | $ 1,020.28 | $ 4.56 |
A 5% return per year before expenses
B Annualized expense ratio reflects expenses net of applicable fee waivers.
* Expenses are equal to each Class' annualized expense ratio, multiplied by the average account value over the period, multiplied by 181/365 (to reflect the one-half year period).
Annual Report
Telecommunications Portfolio
Investment Changes (Unaudited)
Top Ten Stocks as of February 28, 2014 | ||
| % of fund's | % of fund's net assets |
Verizon Communications, Inc. | 23.9 | 22.7 |
AT&T, Inc. | 9.7 | 9.6 |
American Tower Corp. | 6.4 | 7.7 |
T-Mobile U.S., Inc. | 5.9 | 3.1 |
CenturyLink, Inc. | 4.3 | 3.7 |
SBA Communications Corp. Class A | 4.3 | 5.7 |
Telephone & Data Systems, Inc. | 3.5 | 2.5 |
Vodafone Group PLC sponsored ADR | 2.9 | 4.6 |
Level 3 Communications, Inc. | 2.4 | 2.7 |
Sprint Corp. | 2.1 | 0.1 |
| 65.4 | |
Top Industries (% of fund's net assets) | |||
As of February 28, 2014 | |||
| Diversified Telecommunication Services | 61.2% |
|
| Wireless Telecommunication Services | 22.8% |
|
| Real Estate Investment Trusts | 7.1% |
|
| Media | 2.7% |
|
| Internet Software & Services | 1.2% |
|
| All Others* | 5.0% |
|

As of August 31, 2013 | |||
| Diversified Telecommunication Services | 58.2% |
|
| Wireless Telecommunication Services | 26.4% |
|
| Real Estate Investment Trusts | 8.0% |
|
| Media | 2.7% |
|
| Internet Software & Services | 0.8% |
|
| All Others* | 3.9% |
|

* Includes short-term investments and net other assets (liabilities). |
Annual Report
Telecommunications Portfolio
Investments February 28, 2014
Showing Percentage of Net Assets
Common Stocks - 96.3% | |||
Shares | Value | ||
DIVERSIFIED TELECOMMUNICATION SERVICES - 61.0% | |||
Alternative Carriers - 14.9% | |||
8x8, Inc. (a) | 724,386 | $ 7,664,004 | |
Cogent Communications Group, Inc. | 171,768 | 6,585,585 | |
inContact, Inc. (a) | 427,823 | 3,858,963 | |
Iridium Communications, Inc. (a)(d) | 548,976 | 3,579,324 | |
Level 3 Communications, Inc. (a) | 230,216 | 8,476,553 | |
Lumos Networks Corp. | 428,878 | 6,227,309 | |
Premiere Global Services, Inc. (a) | 413,383 | 4,675,362 | |
Towerstream Corp. (a)(d) | 830,224 | 2,191,791 | |
TW Telecom, Inc. (a) | 201,917 | 6,180,679 | |
Vonage Holdings Corp. (a) | 954,671 | 4,401,033 | |
| 53,840,603 | ||
Integrated Telecommunication Services - 46.1% | |||
AT&T, Inc. | 1,105,550 | 35,300,212 | |
Atlantic Tele-Network, Inc. | 98,900 | 6,481,906 | |
Bezeq The Israeli Telecommunication Corp. Ltd. | 1,170,300 | 1,897,802 | |
BT Group PLC | 2,709 | 18,632 | |
CenturyLink, Inc. | 501,078 | 15,663,698 | |
Cincinnati Bell, Inc. (a) | 1,058,914 | 3,547,362 | |
Consolidated Communications Holdings, Inc. (d) | 99,498 | 1,896,432 | |
Frontier Communications Corp. (d) | 1,562,083 | 7,622,965 | |
General Communications, Inc. Class A (a) | 161,996 | 1,686,378 | |
Hawaiian Telcom Holdco, Inc. (a) | 78,265 | 2,254,032 | |
IDT Corp. Class B | 109,565 | 1,966,692 | |
Telenor ASA | 41,800 | 923,472 | |
Verizon Communications, Inc. | 1,826,997 | 86,928,518 | |
Windstream Holdings, Inc. (d) | 169,082 | 1,356,038 | |
| 167,544,139 | ||
TOTAL DIVERSIFIED TELECOMMUNICATION SERVICES | 221,384,742 | ||
INTERNET SOFTWARE & SERVICES - 1.2% | |||
Internet Software & Services - 1.2% | |||
Earthlink Holdings Corp. | 221,000 | 866,320 | |
Equinix, Inc. (a) | 10,101 | 1,918,786 | |
Rackspace Hosting, Inc. (a) | 43,500 | 1,599,495 | |
| 4,384,601 | ||
IT SERVICES - 0.5% | |||
IT Consulting & Other Services - 0.5% | |||
InterXion Holding N.V. (a) | 81,100 | 1,945,589 | |
| |||
Shares | Value | ||
MEDIA - 2.7% | |||
Cable & Satellite - 2.7% | |||
Altice S.A. | 5,500 | $ 239,137 | |
DISH Network Corp. Class A (a) | 86,004 | 5,060,475 | |
Liberty Global PLC Class C | 38,318 | 3,244,002 | |
Shaw Communications, Inc. Class B (d) | 53,700 | 1,241,991 | |
| 9,785,605 | ||
REAL ESTATE INVESTMENT TRUSTS - 7.1% | |||
Office REITs - 0.7% | |||
CyrusOne, Inc. | 121,300 | 2,695,286 | |
Specialized REITs - 6.4% | |||
American Tower Corp. | 284,390 | 23,169,253 | |
TOTAL REAL ESTATE INVESTMENT TRUSTS | 25,864,539 | ||
SEMICONDUCTORS & SEMICONDUCTOR EQUIPMENT - 0.7% | |||
Semiconductors - 0.7% | |||
Broadcom Corp. Class A | 79,831 | 2,372,577 | |
SOFTWARE - 0.3% | |||
Application Software - 0.3% | |||
Interactive Intelligence Group, Inc. (a) | 12,600 | 1,003,338 | |
Synchronoss Technologies, Inc. (a) | 203 | 6,979 | |
| 1,010,317 | ||
WIRELESS TELECOMMUNICATION SERVICES - 22.8% | |||
Wireless Telecommunication Services - 22.8% | |||
Boingo Wireless, Inc. (a)(d) | 464,745 | 2,700,168 | |
Crown Castle International Corp. | 189 | 14,345 | |
KDDI Corp. | 32,400 | 1,981,443 | |
Leap Wireless International, Inc. (a) | 400 | 7,008 | |
NII Holdings, Inc. (a)(d) | 1,381,963 | 1,589,257 | |
NTELOS Holdings Corp. (d) | 103,288 | 1,443,966 | |
RingCentral, Inc. (d) | 27,700 | 599,705 | |
SBA Communications Corp. Class A (a) | 163,256 | 15,537,074 | |
Shenandoah Telecommunications Co. | 100,526 | 2,656,902 | |
Sprint Corp. (a) | 884,185 | 7,727,777 | |
T-Mobile U.S., Inc. (a) | 703,797 | 21,465,809 | |
Tele2 AB (B Shares) | 139,750 | 1,733,893 | |
Telephone & Data Systems, Inc. | 557,964 | 12,716,000 | |
U.S. Cellular Corp. | 64,300 | 2,320,587 | |
Vodafone Group PLC sponsored ADR | 251,641 | 10,460,716 | |
| 82,954,650 | ||
TOTAL COMMON STOCKS (Cost $314,097,848) |
| ||
Nonconvertible Preferred Stocks - 0.2% | |||
|
|
|
|
DIVERSIFIED TELECOMMUNICATION SERVICES - 0.2% | |||
Integrated Telecommunication Services - 0.2% | |||
Oi SA sponsored ADR (d) | 543,500 |
| |
Money Market Funds - 4.6% | |||
Shares | Value | ||
Fidelity Securities Lending Cash Central Fund, 0.09% (b)(c) | 16,873,475 | $ 16,873,475 | |
TOTAL INVESTMENT PORTFOLIO - 101.1% (Cost $331,893,915) | 367,402,215 | ||
NET OTHER ASSETS (LIABILITIES) - (1.1)% | (4,124,630) | ||
NET ASSETS - 100% | $ 363,277,585 | ||
Legend |
(a) Non-income producing |
(b) Affiliated fund that is generally available only to investment companies and other accounts managed by Fidelity Investments. The rate quoted is the annualized seven-day yield of the fund at period end. A complete unaudited listing of the fund's holdings as of its most recent quarter end is available upon request. In addition, each Fidelity Central Fund's financial statements, which are not covered by the Fund's Report of Independent Registered Public Accounting Firm, are available on the SEC's website or upon request. |
(c) Investment made with cash collateral received from securities on loan. |
(d) Security or a portion of the security is on loan at period end. |
Affiliated Central Funds |
Information regarding fiscal year to date income earned by the Fund from investments in Fidelity Central Funds is as follows: |
Fund | Income earned |
Fidelity Cash Central Fund | $ 10,528 |
Fidelity Securities Lending Cash Central Fund | 228,474 |
Total | $ 239,002 |
Other Information |
The following is a summary of the inputs used, as of February 28, 2014, involving the Fund's assets and liabilities carried at fair value. The inputs or methodology used for valuing securities may not be an indication of the risk associated with investing in those securities. For more information on valuation inputs, and their aggregation into the levels used in the table below, please refer to the Investment Valuation section in the accompanying Notes to Financial Statements. |
Valuation Inputs at Reporting Date: | ||||
Description | Total | Level 1 | Level 2 | Level 3 |
Investments in Securities: | ||||
Common Stocks | $ 349,702,620 | $ 347,702,545 | $ 2,000,075 | $ - |
Nonconvertible Preferred Stocks | 826,120 | 826,120 | - | - |
Money Market Funds | 16,873,475 | 16,873,475 | - | - |
Total Investments in Securities: | $ 367,402,215 | $ 365,402,140 | $ 2,000,075 | $ - |
See accompanying notes which are an integral part of the financial statements.
Annual Report
Telecommunications Portfolio
Financial Statements
Statement of Assets and Liabilities
| February 28, 2014 | |
|
|
|
Assets | ||
Investment in securities, at value (including securities loaned of $15,320,193) - See accompanying schedule: Unaffiliated issuers (cost $315,020,440) | $ 350,528,740 |
|
Fidelity Central Funds (cost $16,873,475) | 16,873,475 |
|
Total Investments (cost $331,893,915) |
| $ 367,402,215 |
Receivable for investments sold | 26,858,175 | |
Receivable for fund shares sold | 443,447 | |
Dividends receivable | 2,103,947 | |
Distributions receivable from Fidelity Central Funds | 15,077 | |
Prepaid expenses | 2,594 | |
Other receivables | 39,916 | |
Total assets | 396,865,371 | |
|
|
|
Liabilities | ||
Payable to custodian bank | $ 870,746 | |
Payable for investments purchased | 14,311,597 | |
Payable for fund shares redeemed | 1,235,864 | |
Accrued management fee | 169,374 | |
Distribution and service plan fees payable | 8,467 | |
Other affiliated payables | 77,245 | |
Other payables and accrued expenses | 41,018 | |
Collateral on securities loaned, at value | 16,873,475 | |
Total liabilities | 33,587,786 | |
|
|
|
Net Assets | $ 363,277,585 | |
Net Assets consist of: |
| |
Paid in capital | $ 331,298,766 | |
Undistributed net investment income | 7,778,471 | |
Accumulated undistributed net realized gain (loss) on investments and foreign currency transactions | (11,303,806) | |
Net unrealized appreciation (depreciation) on investments and assets and liabilities in foreign currencies | 35,504,154 | |
Net Assets | $ 363,277,585 | |
Statement of Assets and Liabilities - continued
| February 28, 2014 | |
|
|
|
Calculation of Maximum Offering Price Class A: | $ 58.71 | |
|
|
|
Maximum offering price per share (100/94.25 of $58.71) | $ 62.29 | |
Class T: | $ 58.50 | |
|
|
|
Maximum offering price per share (100/96.50 of $58.50) | $ 60.62 | |
Class B: | $ 58.77 | |
|
|
|
Class C: | $ 58.54 | |
|
|
|
Telecommunications: | $ 58.94 | |
|
|
|
Institutional Class: | $ 58.80 | |
A Redemption price per share is equal to net asset value less any applicable contingent deferred sales charge.
See accompanying notes which are an integral part of the financial statements.
Annual Report
Statement of Operations
| Year ended February 28, 2014 | |
|
|
|
Investment Income |
|
|
Dividends |
| $ 11,161,992 |
Special dividends |
| 7,304,521 |
Interest |
| 23 |
Income from Fidelity Central Funds |
| 239,002 |
Total income |
| 18,705,538 |
|
|
|
Expenses | ||
Management fee | $ 2,436,046 | |
Transfer agent fees | 952,642 | |
Distribution and service plan fees | 98,511 | |
Accounting and security lending fees | 174,567 | |
Custodian fees and expenses | 27,761 | |
Independent trustees' compensation | 8,414 | |
Registration fees | 81,316 | |
Audit | 56,946 | |
Legal | 8,437 | |
Interest | 1,149 | |
Miscellaneous | 5,478 | |
Total expenses before reductions | 3,851,267 | |
Expense reductions | (114,701) | 3,736,566 |
Net investment income (loss) | 14,968,972 | |
Realized and Unrealized Gain (Loss) Net realized gain (loss) on: | ||
Investment securities: |
|
|
Unaffiliated issuers | 2,147,371 | |
Foreign currency transactions | 12,166 | |
Total net realized gain (loss) |
| 2,159,537 |
Change in net unrealized appreciation (depreciation) on: Investment securities | 48,831,064 | |
Assets and liabilities in foreign currencies | (2,016) | |
Total change in net unrealized appreciation (depreciation) |
| 48,829,048 |
Net gain (loss) | 50,988,585 | |
Net increase (decrease) in net assets resulting from operations | $ 65,957,557 | |
Statement of Changes in Net Assets
| Year ended | Year ended |
Increase (Decrease) in Net Assets |
|
|
Operations |
|
|
Net investment income (loss) | $ 14,968,972 | $ 9,261,556 |
Net realized gain (loss) | 2,159,537 | 44,357,084 |
Change in net unrealized appreciation (depreciation) | 48,829,048 | 3,165,741 |
Net increase (decrease) in net assets resulting from operations | 65,957,557 | 56,784,381 |
Distributions to shareholders from net investment income | (8,506,759) | (8,401,078) |
Distributions to shareholders from net realized gain | (32,511) | - |
Total distributions | (8,539,270) | (8,401,078) |
Share transactions - net increase (decrease) | (90,264,976) | (7,060,825) |
Redemption fees | 26,413 | 3,280 |
Total increase (decrease) in net assets | (32,820,276) | 41,325,758 |
|
|
|
Net Assets | ||
Beginning of period | 396,097,861 | 354,772,103 |
End of period (including undistributed net investment income of $7,778,471 and undistributed net investment income of $1,584,319, respectively) | $ 363,277,585 | $ 396,097,861 |
See accompanying notes which are an integral part of the financial statements.
Annual Report
Financial Highlights - Class A
Years ended February 28, | 2014 | 2013 | 2012 G | 2011 | 2010 |
Selected Per-Share Data |
|
|
|
|
|
Net asset value, beginning of period | $ 51.58 | $ 46.12 | $ 46.93 | $ 37.64 | $ 26.66 |
Income from Investment Operations |
|
|
|
|
|
Net investment income (loss) C | 1.76 K | .99 | .56 | .57 | .67 |
Net realized and unrealized gain (loss) | 6.48 | 5.43 | (.86) | 9.49 | 10.55 |
Total from investment operations | 8.24 | 6.42 | (.30) | 10.06 | 11.22 |
Distributions from net investment income | (1.11) | (.96) | (.51) | (.77) | (.19) |
Distributions from net realized gain | (.01) | - | - | - | (.05) |
Total distributions | (1.11) J | (.96) | (.51) | (.77) | (.24) I |
Redemption fees added to paid in capital C,H | - | - | - | - | - |
Net asset value, end of period | $ 58.71 | $ 51.58 | $ 46.12 | $ 46.93 | $ 37.64 |
Total Return A, B | 16.00% | 13.97% | (.54)% | 26.87% | 42.07% |
Ratios to Average Net Assets D, F |
|
|
|
|
|
Expenses before reductions | 1.18% | 1.18% | 1.20% | 1.20% | 1.26% |
Expenses net of fee waivers, if any | 1.18% | 1.18% | 1.20% | 1.20% | 1.26% |
Expenses net of all reductions | 1.15% | 1.17% | 1.18% | 1.18% | 1.24% |
Net investment income (loss) | 3.08% K | 2.01% | 1.21% | 1.35% | 1.89% |
Supplemental Data |
|
|
|
|
|
Net assets, end of period (000 omitted) | $ 7,712 | $ 6,449 | $ 4,677 | $ 4,305 | $ 3,343 |
Portfolio turnover rate E | 111% | 76% | 72% | 72% | 90% |
A Total returns would have been lower if certain expenses had not been reduced during the applicable periods shown. B Total returns do not include the effect of the sales charges. C Calculated based on average shares outstanding during the period. D Fees and expenses of any underlying Fidelity Central Funds are not included in the Fund's expense ratio. The Fund indirectly bears its proportionate share of the expenses of any underlying Fidelity Central Funds. E Amount does not include the portfolio activity of any underlying Fidelity Central Funds. F Expense ratios reflect operating expenses of the class. Expenses before reductions do not reflect amounts reimbursed by the investment adviser or reductions from brokerage service arrangements or reductions from other expense offset arrangements and do not represent the amount paid by the class during periods when reimbursements or reductions occur. Expenses net of fee waivers reflect expenses after reimbursement by the investment adviser but prior to reductions from brokerage service arrangements or other expense offset arrangements. Expenses net of all reductions represent the net expenses paid by the class. G For the year ended February 29. H Amount represents less than $.01 per share. I Total distributions of $.24 per share is comprised of distributions from net investment income of $.187 and distributions from net realized gain of $.048 per share. J Total distributions of $1.11 per share is comprised of distributions from net investment income of $1.106 and distributions from net realized gain of $.005 per share. K Investment income per share reflects large, non-recurring dividends which amounted to $.95 per share. Excluding these non-recurring dividends, the ratio of net investment income (loss) to average net assets would have been 1.43%. |
Financial Highlights - Class T
Years ended February 28, | 2014 | 2013 | 2012 G | 2011 | 2010 |
Selected Per-Share Data |
|
|
|
|
|
Net asset value, beginning of period | $ 51.41 | $ 46.01 | $ 46.81 | $ 37.55 | $ 26.68 |
Income from Investment Operations |
|
|
|
|
|
Net investment income (loss) C | 1.59 K | .85 | .42 | .45 | .57 |
Net realized and unrealized gain (loss) | 6.44 | 5.39 | (.84) | 9.47 | 10.54 |
Total from investment operations | 8.03 | 6.24 | (.42) | 9.92 | 11.11 |
Distributions from net investment income | (.94) | (.84) | (.38) | (.66) | (.22) |
Distributions from net realized gain | (.01) | - | - | - | (.03) |
Total distributions | (.94) J | (.84) | (.38) | (.66) | (.24) I |
Redemption fees added to paid in capital C,H | - | - | - | - | - |
Net asset value, end of period | $ 58.50 | $ 51.41 | $ 46.01 | $ 46.81 | $ 37.55 |
Total Return A, B | 15.64% | 13.61% | (.82)% | 26.54% | 41.64% |
Ratios to Average Net Assets D, F |
|
|
|
|
|
Expenses before reductions | 1.48% | 1.48% | 1.49% | 1.48% | 1.55% |
Expenses net of fee waivers, if any | 1.48% | 1.48% | 1.49% | 1.48% | 1.55% |
Expenses net of all reductions | 1.45% | 1.46% | 1.47% | 1.46% | 1.53% |
Net investment income (loss) | 2.78% K | 1.72% | .92% | 1.06% | 1.60% |
Supplemental Data |
|
|
|
|
|
Net assets, end of period (000 omitted) | $ 4,344 | $ 4,237 | $ 2,702 | $ 2,882 | $ 2,051 |
Portfolio turnover rate E | 111% | 76% | 72% | 72% | 90% |
A Total returns would have been lower if certain expenses had not been reduced during the applicable periods shown. B Total returns do not include the effect of the sales charges. C Calculated based on average shares outstanding during the period. D Fees and expenses of any underlying Fidelity Central Funds are not included in the Fund's expense ratio. The Fund indirectly bears its proportionate share of the expenses of any underlying Fidelity Central Funds. E Amount does not include the portfolio activity of any underlying Fidelity Central Funds. F Expense ratios reflect operating expenses of the class. Expenses before reductions do not reflect amounts reimbursed by the investment adviser or reductions from brokerage service arrangements or reductions from other expense offset arrangements and do not represent the amount paid by the class during periods when reimbursements or reductions occur. Expenses net of fee waivers reflect expenses after reimbursement by the investment adviser but prior to reductions from brokerage service arrangements or other expense offset arrangements. Expenses net of all reductions represent the net expenses paid by the class. G For the year ended February 29. H Amount represents less than $.01 per share. I Total distributions of $.24 per share is comprised of distributions from net investment income of $.216 and distributions from net realized gain of $.028 per share. J Total distributions of $.94 per share is comprised of distributions from net investment income of $.939 and distributions from net realized gain of $.005 per share. K Investment income per share reflects large, non-recurring dividends which amounted to $.94 per share. Excluding these non-recurring dividends, the ratio of net investment income (loss) to average net assets would have been 1.13%. |
See accompanying notes which are an integral part of the financial statements.
Annual Report
Financial Highlights - Class B
Years ended February 28, | 2014 | 2013 | 2012 G | 2011 | 2010 |
Selected Per-Share Data |
|
|
|
|
|
Net asset value, beginning of period | $ 51.63 | $ 46.14 | $ 46.93 | $ 37.60 | $ 26.71 |
Income from Investment Operations |
|
|
|
|
|
Net investment income (loss) C | 1.33 J | .62 | .21 | .25 | .40 |
Net realized and unrealized gain (loss) | 6.48 | 5.42 | (.83) | 9.48 | 10.54 |
Total from investment operations | 7.81 | 6.04 | (.62) | 9.73 | 10.94 |
Distributions from net investment income | (.66) | (.55) | (.17) | (.40) | (.04) |
Distributions from net realized gain | (.01) | - | - | - | (.01) |
Total distributions | (.67) | (.55) | (.17) | (.40) | (.05) I |
Redemption fees added to paid in capital C,H | - | - | - | - | - |
Net asset value, end of period | $ 58.77 | $ 51.63 | $ 46.14 | $ 46.93 | $ 37.60 |
Total Return A, B | 15.13% | 13.11% | (1.29)% | 25.96% | 40.97% |
Ratios to Average Net Assets D, F |
|
|
|
|
|
Expenses before reductions | 1.93% | 1.93% | 1.95% | 1.95% | 2.01% |
Expenses net of fee waivers, if any | 1.93% | 1.93% | 1.95% | 1.95% | 2.01% |
Expenses net of all reductions | 1.91% | 1.92% | 1.93% | 1.93% | 2.00% |
Net investment income (loss) | 2.32% J | 1.26% | .47% | .60% | 1.13% |
Supplemental Data |
|
|
|
|
|
Net assets, end of period (000 omitted) | $ 546 | $ 576 | $ 596 | $ 706 | $ 641 |
Portfolio turnover rate E | 111% | 76% | 72% | 72% | 90% |
A Total returns would have been lower if certain expenses had not been reduced during the applicable periods shown. B Total returns do not include the effect of the contingent deferred sales charge. C Calculated based on average shares outstanding during the period. D Fees and expenses of any underlying Fidelity Central Funds are not included in the Fund's expense ratio. The Fund indirectly bears its proportionate share of the expenses of any underlying Fidelity Central Funds. E Amount does not include the portfolio activity of any underlying Fidelity Central Funds. F Expense ratios reflect operating expenses of the class. Expenses before reductions do not reflect amounts reimbursed by the investment adviser or reductions from brokerage service arrangements or reductions from other expense offset arrangements and do not represent the amount paid by the class during periods when reimbursements or reductions occur. Expenses net of fee waivers reflect expenses after reimbursement by the investment adviser but prior to reductions from brokerage service arrangements or other expense offset arrangements. Expenses net of all reductions represent the net expenses paid by the class. G For the year ended February 29. H Amount represents less than $.01 per share. I Total distributions of $.05 per share is comprised of distributions from net investment income of $.044 and distributions from net realized gain of $.009 per share. J Investment income per share reflects large, non-recurring dividends which amounted to $.95 per share. Excluding these non-recurring dividends, the ratio of net investment income (loss) to average net assets would have been .67%. |
Financial Highlights - Class C
Years ended February 28, | 2014 | 2013 | 2012 G | 2011 | 2010 |
Selected Per-Share Data |
|
|
|
|
|
Net asset value, beginning of period | $ 51.47 | $ 46.02 | $ 46.89 | $ 37.61 | $ 26.76 |
Income from Investment Operations |
|
|
|
|
|
Net investment income (loss) C | 1.36 J | .63 | .22 | .26 | .41 |
Net realized and unrealized gain (loss) | 6.46 | 5.41 | (.84) | 9.46 | 10.56 |
Total from investment operations | 7.82 | 6.04 | (.62) | 9.72 | 10.97 |
Distributions from net investment income | (.74) | (.59) | (.25) | (.44) | (.10) |
Distributions from net realized gain | (.01) | - | - | - | (.02) |
Total distributions | (.75) | (.59) | (.25) | (.44) | (.12) I |
Redemption fees added to paid in capital C,H | - | - | - | - | - |
Net asset value, end of period | $ 58.54 | $ 51.47 | $ 46.02 | $ 46.89 | $ 37.61 |
Total Return A, B | 15.20% | 13.14% | (1.27)% | 25.95% | 41.00% |
Ratios to Average Net Assets D, F |
|
|
|
|
|
Expenses before reductions | 1.88% | 1.90% | 1.93% | 1.94% | 2.01% |
Expenses net of fee waivers, if any | 1.88% | 1.90% | 1.93% | 1.94% | 2.01% |
Expenses net of all reductions | 1.85% | 1.89% | 1.91% | 1.92% | 2.00% |
Net investment income (loss) | 2.38% J | 1.29% | .48% | .61% | 1.13% |
Supplemental Data |
|
|
|
|
|
Net assets, end of period (000 omitted) | $ 5,523 | $ 4,353 | $ 3,514 | $ 3,035 | $ 2,151 |
Portfolio turnover rate E | 111% | 76% | 72% | 72% | 90% |
A Total returns would have been lower if certain expenses had not been reduced during the applicable periods shown. B Total returns do not include the effect of the contingent deferred sales charge. C Calculated based on average shares outstanding during the period. D Fees and expenses of any underlying Fidelity Central Funds are not included in the Fund's expense ratio. The Fund indirectly bears its proportionate share of the expenses of any underlying Fidelity Central Funds. E Amount does not include the portfolio activity of any underlying Fidelity Central Funds. F Expense ratios reflect operating expenses of the class. Expenses before reductions do not reflect amounts reimbursed by the investment adviser or reductions from brokerage service arrangements or reductions from other expense offset arrangements and do not represent the amount paid by the class during periods when reimbursements or reductions occur. Expenses net of fee waivers reflect expenses after reimbursement by the investment adviser but prior to reductions from brokerage service arrangements or other expense offset arrangements. Expenses net of all reductions represent the net expenses paid by the class. G For the year ended February 29. H Amount represents less than $.01 per share. I Total distributions of $.12 per share is comprised of distributions from net investment income of $.098 and distributions from net realized gain of $.023 per share. J Investment income per share reflects large, non-recurring dividends which amounted to $.94 per share. Excluding these non-recurring dividends, the ratio of net investment income (loss) to average net assets would have been .73%. |
See accompanying notes which are an integral part of the financial statements.
Annual Report
Financial Highlights - Telecommunications
Years ended February 28, | 2014 | 2013 | 2012 F | 2011 | 2010 |
Selected Per-Share Data |
|
|
|
|
|
Net asset value, beginning of period | $ 51.75 | $ 46.26 | $ 47.07 | $ 37.73 | $ 26.74 |
Income from Investment Operations |
|
|
|
|
|
Net investment income (loss) B | 1.96 J | 1.15 | .70 | .69 | .76 |
Net realized and unrealized gain (loss) | 6.51 | 5.43 | (.86) | 9.52 | 10.59 |
Total from investment operations | 8.47 | 6.58 | (.16) | 10.21 | 11.35 |
Distributions from net investment income | (1.28) | (1.09) | (.65) | (.87) | (.31) |
Distributions from net realized gain | (.01) | - | - | - | (.05) |
Total distributions | (1.28) I | (1.09) | (.65) | (.87) | (.36) H |
Redemption fees added to paid in capital B,G | - | - | - | - | - |
Net asset value, end of period | $ 58.94 | $ 51.75 | $ 46.26 | $ 47.07 | $ 37.73 |
Total Return A | 16.40% | 14.30% | (.23)% | 27.24% | 42.43% |
Ratios to Average Net Assets C, E |
|
|
|
|
|
Expenses before reductions | .85% | .87% | .90% | .92% | .99% |
Expenses net of fee waivers, if any | .85% | .87% | .90% | .92% | .99% |
Expenses net of all reductions | .82% | .85% | .88% | .91% | .98% |
Net investment income (loss) | 3.41% J | 2.33% | 1.52% | 1.62% | 2.15% |
Supplemental Data |
|
|
|
|
|
Net assets, end of period (000 omitted) | $ 343,548 | $ 377,841 | $ 342,262 | $ 354,938 | $ 279,704 |
Portfolio turnover rate D | 111% | 76% | 72% | 72% | 90% |
A Total returns would have been lower if certain expenses had not been reduced during the applicable periods shown. B Calculated based on average shares outstanding during the period. C Fees and expenses of any underlying Fidelity Central Funds are not included in the Fund's expense ratio. The Fund indirectly bears its proportionate share of the expenses of any underlying Fidelity Central Funds. D Amount does not include the portfolio activity of any underlying Fidelity Central Funds. E Expense ratios reflect operating expenses of the class. Expenses before reductions do not reflect amounts reimbursed by the investment adviser or reductions from brokerage service arrangements or reductions from other expense offset arrangements and do not represent the amount paid by the class during periods when reimbursements or reductions occur. Expenses net of fee waivers reflect expenses after reimbursement by the investment adviser but prior to reductions from brokerage service arrangements or other expense offset arrangements. Expenses net of all reductions represent the net expenses paid by the class. F For the year ended February 29. G Amount represents less than $.01 per share. H Total distributions of $.36 per share is comprised of distributions from net investment income of $.310 and distributions from net realized gain of $.048 per share. I Total distributions of $1.28 per share is comprised of distributions from net investment income of $1.275 and distributions from net realized gain of $.005 per share. J Investment income per share reflects large, non-recurring dividends which amounted to $.95 per share. Excluding these non-recurring dividends, the ratio of net investment income (loss) to average net assets would have been 1.76%. |
Financial Highlights - Institutional Class
Years ended February 28, | 2014 | 2013 | 2012 F | 2011 | 2010 |
Selected Per-Share Data |
|
|
|
|
|
Net asset value, beginning of period | $ 51.65 | $ 46.20 | $ 47.02 | $ 37.69 | $ 26.73 |
Income from Investment Operations |
|
|
|
|
|
Net investment income (loss) B | 1.93 I | 1.17 | .70 | .71 | .84 |
Net realized and unrealized gain (loss) | 6.48 | 5.42 | (.88) | 9.50 | 10.55 |
Total from investment operations | 8.41 | 6.59 | (.18) | 10.21 | 11.39 |
Distributions from net investment income | (1.25) | (1.14) | (.64) | (.88) | (.38) |
Distributions from net realized gain | (.01) | - | - | - | (.05) |
Total distributions | (1.26) | (1.14) | (.64) | (.88) | (.43) H |
Redemption fees added to paid in capital B,G | - | - | - | - | - |
Net asset value, end of period | $ 58.80 | $ 51.65 | $ 46.20 | $ 47.02 | $ 37.69 |
Total Return A | 16.30% | 14.33% | (.26)% | 27.27% | 42.59% |
Ratios to Average Net Assets C, E |
|
|
|
|
|
Expenses before reductions | .91% | .85% | .89% | .91% | .86% |
Expenses net of fee waivers, if any | .91% | .85% | .89% | .91% | .86% |
Expenses net of all reductions | .88% | .83% | .87% | .89% | .84% |
Net investment income (loss) | 3.35% I | 2.35% | 1.52% | 1.64% | 2.29% |
Supplemental Data |
|
|
|
|
|
Net assets, end of period (000 omitted) | $ 1,604 | $ 2,641 | $ 1,022 | $ 1,743 | $ 1,101 |
Portfolio turnover rate D | 111% | 76% | 72% | 72% | 90% |
A Total returns would have been lower if certain expenses had not been reduced during the applicable periods shown. B Calculated based on average shares outstanding during the period. C Fees and expenses of any underlying Fidelity Central Funds are not included in the Fund's expense ratio. The Fund indirectly bears its proportionate share of the expenses of any underlying Fidelity Central Funds. D Amount does not include the portfolio activity of any underlying Fidelity Central Funds. E Expense ratios reflect operating expenses of the class. Expenses before reductions do not reflect amounts reimbursed by the investment adviser or reductions from brokerage service arrangements or reductions from other expense offset arrangements and do not represent the amount paid by the class during periods when reimbursements or reductions occur. Expenses net of fee waivers reflect expenses after reimbursement by the investment adviser but prior to reductions from brokerage service arrangements or other expense offset arrangements. Expenses net of all reductions represent the net expenses paid by the class. F For the year ended February 29. G Amount represents less than $.01 per share. H Total distributions of $.43 per share is comprised of distributions from net investment income of $.379 and distributions from net realized gain of $.057 per share. I Investment income per share reflects large, non-recurring dividends which amounted to $.95 per share. Excluding these non-recurring dividends, the ratio of net investment income (loss) to average net assets would have been 1.70%. |
See accompanying notes which are an integral part of the financial statements.
Annual Report
Notes to Financial Statements
For the period ended February 28, 2014
1. Organization.
Telecommunications Portfolio (the Fund) is a non-diversified fund of Fidelity Select Portfolios (the Trust) and is authorized to issue an unlimited number of shares. The Trust is registered under the Investment Company Act of 1940, as amended (the 1940 Act), as an open-end management investment company organized as a Massachusetts business trust. The Fund invests primarily in securities of companies whose principal business activities fall within specific industries. The Fund offers Class A, Class T, Class C, Telecommunications and Institutional Class shares, each of which, along with Class B shares, has equal rights as to assets and voting privileges. Class B shares are closed to new accounts and additional purchases, except for exchanges and reinvestments. Each class has exclusive voting rights with respect to matters that affect that class. Class B shares will automatically convert to Class A shares after a holding period of seven years from the initial date of purchase.
2. Investments in Fidelity Central Funds.
The Fund invests in Fidelity Central Funds, which are open-end investment companies generally available only to other investment companies and accounts managed by the investment adviser and its affiliates. The Fund's Schedule of Investments lists each of the Fidelity Central Funds held as of period end, if any, as an investment of the Fund, but does not include the underlying holdings of each Fidelity Central Fund. As an Investing Fund, the Fund indirectly bears its proportionate share of the expenses of the underlying Fidelity Central Funds.
The Money Market Central Funds seek preservation of capital and current income and are managed by Fidelity Investments Money Management, Inc. (FIMM), an affiliate of the investment adviser. Annualized expenses of the Money Market Central Funds as of their most recent shareholder report date are less than .01%.
A complete unaudited list of holdings for each Fidelity Central Fund is available upon request or at the Securities and Exchange Commission (the SEC) website at www.sec.gov. In addition, the financial statements of the Fidelity Central Funds, which are not covered by the Fund's Report of Independent Registered Public Accounting Firm, are available on the SEC website or upon request.
3. Significant Accounting Policies.
The financial statements have been prepared in conformity with accounting principles generally accepted in the United States of America (GAAP), which require management to make certain estimates and assumptions at the date of the financial statements. Actual results could differ from those estimates. Subsequent events, if any, through the date that the financial statements were issued have been evaluated in the preparation of the financial statements. The following summarizes the significant accounting policies of the Fund:
Investment Valuation. Investments are valued as of 4:00 p.m. Eastern time on the last calendar day of the period. In accordance with valuation policies and procedures approved by the Board of Trustees (the Board), the Fund attempts to obtain prices from one or more third party pricing vendors or brokers to value its investments. When current market prices, quotations or currency exchange rates are not readily available or reliable, investments will be fair valued in good faith by the Fidelity SelectCo, LLC (SelectCo) Fair Value Committee (the Committee), in accordance with procedures adopted by the Board. Factors used in determining fair value vary by investment type and may include market or investment specific events. The frequency with which these procedures are used cannot be predicted and they may be utilized to a significant extent. The Committee oversees the Fund's valuation policies and procedures and is responsible for approving and reporting to the Board all fair value determinations.
The Fund categorizes the inputs to valuation techniques used to value its investments into a disclosure hierarchy consisting of three levels as shown below:
Level 1 - quoted prices in active markets for identical investments
Level 2 - other significant observable inputs (including quoted prices for similar investments, interest rates, prepayment speeds, etc.)
Level 3 - unobservable inputs (including the Fund's own assumptions based on the best information available)
Valuation techniques used to value the Fund's investments by major category are as follows:
Equity securities, including restricted securities, for which market quotations are readily available, are valued at the last reported sale price or official closing price as reported by a third party pricing vendor on the primary market or exchange on which they are traded and are categorized as Level 1 in the hierarchy. In the event there were no sales during the day or closing prices are not available, securities are valued at the last quoted bid price or may be valued using the last available price and are generally categorized as Level 2 in the hierarchy. For foreign equity securities, when market or security specific events arise, comparisons to the valuation of American Depositary Receipts (ADRs), futures contracts, Exchange-Traded Funds (ETFs) and certain indexes as well as quoted prices for similar securities may be used and would be categorized as Level 2 in the hierarchy. Utilizing these techniques may result in transfers between Level 1 and Level 2. For equity securities, including restricted securities, where observable inputs are limited, assumptions about market activity and risk are used and these securities may be categorized as Level 3 in the hierarchy.
Annual Report
3. Significant Accounting Policies - continued
Investment Valuation - continued
Investments in open-end mutual funds, including the Fidelity Central Funds, are valued at their closing net asset value (NAV) each business day and are categorized as Level 1 in the hierarchy.
Changes in valuation techniques may result in transfers in or out of an assigned level within the disclosure hierarchy. The aggregate value of investments by input level, as of February 28, 2014, is included at the end of the Fund's Schedule of Investments.
Foreign Currency. The Fund may use foreign currency contracts to facilitate transactions in foreign-denominated securities. Gains and losses from these transactions may arise from changes in the value of the foreign currency or if the counterparties do not perform under the contracts' terms.
Foreign-denominated assets, including investment securities, and liabilities are translated into U.S. dollars at the exchange rates at period end. Purchases and sales of investment securities, income and dividends received and expenses denominated in foreign currencies are translated into U.S. dollars at the exchange rate in effect on the transaction date.
The effects of exchange rate fluctuations on investments are included with the net realized and unrealized gain (loss) on investment securities. Other foreign currency transactions resulting in realized and unrealized gain (loss) are disclosed separately.
Investment Transactions and Income. For financial reporting purposes, the Fund's investment holdings and NAV include trades executed through the end of the last business day of the period. The NAV per share for processing shareholder transactions is calculated as of the close of business of the New York Stock Exchange (NYSE), normally 4:00 p.m. Eastern time and includes trades executed through the end of the prior business day. Gains and losses on securities sold are determined on the basis of identified cost and may include proceeds received from litigation. Dividend income is recorded on the ex-dividend date, except for certain dividends from foreign securities where the ex-dividend date may have passed, which are recorded as soon as the Fund is informed of the ex-dividend date. Non-cash dividends included in dividend income, if any, are recorded at the fair market value of the securities received. Distributions received on securities that represent a return of capital or capital gain are recorded as a reduction of cost of investments and/or as a realized gain. Subsequent to ex-dividend date the Fund determines the components of these distributions, based upon receipt of tax filings or other correspondence relating to the underlying investment. Large, non-recurring dividends recognized by the Fund are presented separately on the Statement of Operations as "Special Dividends" and the impact of these dividends is presented in the Financial Highlights. Interest income and distributions from the Fidelity Central Funds are accrued as earned. Interest income includes coupon interest and amortization of premium and accretion of discount on debt securities. Investment income is recorded net of foreign taxes withheld where recovery of such taxes is uncertain.
Class Allocations and Expenses. Investment income, realized and unrealized capital gains and losses, common expenses of the Fund, and certain fund-level expense reductions, if any, are allocated daily on a pro-rata basis to each class based on the relative net assets of each class to the total net assets of the Fund. Each class differs with respect to transfer agent and distribution and service plan fees incurred. Certain expense reductions may also differ by class. For the reporting period, the allocated portion of income and expenses to each class as a percent of its average net assets may vary due to the timing of recording these transactions in relation to fluctuating net assets of the classes. Expenses directly attributable to a fund are charged to that fund. Expenses attributable to more than one fund are allocated among the respective funds on the basis of relative net assets or other appropriate methods. Expense estimates are accrued in the period to which they relate and adjustments are made when actual amounts are known.
Income Tax Information and Distributions to Shareholders. Each year, the Fund intends to qualify as a regulated investment company under Subchapter M of the Internal Revenue Code, including distributing substantially all of its taxable income and realized gains. As a result, no provision for U.S. Federal income taxes is required. As of February 28, 2014, the Fund did not have any unrecognized tax benefits in the financial statements; nor is the Fund aware of any tax positions for which it is reasonably possible that the total amounts of unrecognized tax benefits will significantly change in the next twelve months. The Fund files a U.S. federal tax return, in addition to state and local tax returns as required. The Fund's federal income tax returns are subject to examination by the Internal Revenue Service (IRS) for a period of three fiscal years after they are filed. State and local tax returns may be subject to examination for an additional fiscal year depending on the jurisdiction. Foreign taxes are provided for based on the Fund's understanding of the tax rules and rates that exist in the foreign markets in which it invests.
Distributions are declared and recorded on the ex-dividend date. Income dividends and capital gain distributions are declared separately for each class. Income and capital gain distributions are determined in accordance with income tax regulations, which may differ from GAAP.
Capital accounts within the financial statements are adjusted for permanent book-tax differences. These adjustments have no impact on net assets or the results of operations. Capital accounts are not adjusted for temporary book-tax differences which will reverse in a subsequent period.
Book-tax differences are primarily due to foreign currency transactions, deferred trustees compensation, capital loss carryforwards and losses deferred due to wash sales and excise tax regulations.
Annual Report
Notes to Financial Statements - continued
3. Significant Accounting Policies - continued
Income Tax Information and Distributions to Shareholders - continued
The federal tax cost of investment securities and unrealized appreciation (depreciation) as of period end were as follows:
Gross unrealized appreciation | $ 50,421,115 |
Gross unrealized depreciation | (17,845,454) |
Net unrealized appreciation (depreciation) on securities and other investments | $ 32,575,661 |
|
|
Tax Cost | $ 334,826,554 |
The tax-based components of distributable earnings as of period end were as follows:
Undistributed ordinary income | $ 7,778,810 |
Capital loss carryforward | $ (4,297,851) |
Net unrealized appreciation (depreciation) | $ 32,571,515 |
Capital loss carryforwards are only available to offset future capital gains of the Fund to the extent provided by regulations and may be limited. Under the Regulated Investment Company Modernization Act of 2010 (the Act), the Fund is permitted to carry forward capital losses incurred in taxable years beginning after December 22, 2010 for an unlimited period and such capital losses are required to be used prior to any losses that expire. The capital loss carryforward information presented below, including any applicable limitation, is estimated as of fiscal period end and is subject to adjustment.
Fiscal year of expiration |
|
2018 | $ (4,297,851) |
The Fund intends to elect to defer to its next fiscal year $4,073,316 of capital losses recognized during the period November 1, 2013 to February 28, 2014.
The tax character of distributions paid was as follows:
| February 28, 2014 | February 28, 2013 |
Ordinary Income | $ 8,539,270 | $ 8,401,078 |
Trading (Redemption) Fees. Shares held by investors in the Fund less than 30 days may be subject to a redemption fee equal to .75% of the NAV of shares redeemed. All redemption fees, which reduce the proceeds of the shareholder redemption, are retained by the Fund and accounted for as an addition to paid in capital.
4. Purchases and Sales of Investments.
Purchases and sales of securities, other than short-term securities, aggregated $468,948,325 and $554,795,163, respectively.
5. Fees and Other Transactions with Affiliates.
Management Fee. Effective August 1, 2013, SelectCo replaced Fidelity Management and Research Company (FMR), an affiliate of SelectCo, as investment adviser to the Fund. The investment adviser and its affiliates provide the Fund with investment management related services for which the Fund pays a monthly management fee. The management fee is the sum of an individual fund fee rate that is based on an annual rate of .30% of the Fund's average net assets and an annualized group fee rate that averaged .25% during the period. The group fee rate is based upon the average net assets of all the mutual funds advised by FMR and the investment adviser. The group fee rate decreases as assets under management increase and increases as assets under management decrease. For the reporting period, the total annual management fee rate was .55% of the Fund's average net assets.
Distribution and Service Plan Fees. In accordance with Rule 12b-1 of the 1940 Act, the Fund has adopted separate Distribution and Service Plans for each class of shares. Certain classes pay Fidelity Distributors Corporation (FDC), an affiliate of the investment adviser, separate Distribution and Service Fees, each of which is based on an annual percentage of each class' average net assets. In addition, FDC may pay financial intermediaries for
Annual Report
5. Fees and Other Transactions with Affiliates - continued
Distribution and Service Plan Fees - continued
selling shares of the Fund and providing shareholder support services. For the period, the Distribution and Service Fee rates, total fees and amounts retained by FDC were as follows:
| Distribution | Service | Total Fees | Retained |
Class A | -% | .25% | $ 18,291 | $ 583 |
Class T | .25% | .25% | 21,936 | - |
Class B | .75% | .25% | 5,661 | 4,246 |
Class C | .75% | .25% | 52,623 | 12,851 |
|
|
| $ 98,511 | $ 17,680 |
Sales Load. FDC may receive a front-end sales charge of up to 5.75% for selling Class A shares and 3.50% for selling Class T shares, some of which is paid to financial intermediaries for selling shares of the Fund. Depending on the holding period, FDC may receive contingent deferred sales charges levied on Class A, Class T, Class B, and Class C redemptions. The deferred sales charges range from 5.00% to 1.00% for Class B shares, 1.00% for Class C shares, 1.00% for certain purchases of Class A shares and .25% for certain purchases of Class T shares.
For the period, sales charge amounts retained by FDC were as follows:
| Retained |
Class A | $ 8,371 |
Class T | 2,798 |
Class B* | 370 |
Class C* | 621 |
| $ 12,160 |
* When Class B and Class C shares are initially sold, FDC pays commissions from its own resources to financial intermediaries through which the sales are made.
Transfer Agent Fees. Fidelity Investments Institutional Operations Company, Inc., (FIIOC), an affiliate of the investment adviser, is the transfer, dividend disbursing and shareholder servicing agent for each class of the Fund. FIIOC receives account fees and asset-based fees that vary according to the account size and type of account of the shareholders of the respective classes of the Fund. FIIOC pays for typesetting, printing and mailing of shareholder reports, except proxy statements.
For the period, transfer agent fees for each class were as follows:
| Amount | % of |
Class A | $ 21,689 | .30 |
Class T | 15,148 | .35 |
Class B | 1,702 | .30 |
Class C | 12,956 | .25 |
Telecommunications | 897,426 | .21 |
Institutional Class | 3,721 | .27 |
| $ 952,642 |
|
Accounting and Security Lending Fees. Fidelity Service Company, Inc. (FSC), an affiliate of the investment adviser, maintains the Fund's accounting records. The accounting fee is based on the level of average net assets for each month. Under a separate contract, FSC administers the security lending program. The security lending fee is based on the number and duration of lending transactions.
Brokerage Commissions. The Fund placed a portion of its portfolio transactions with brokerage firms which are affiliates of the investment adviser. Brokerage commissions are included in net realized gain (loss) and change in net unrealized appreciation (depreciation) in the Statement of Operations. The commissions paid to these affiliated firms were $29,221 for the period.
Interfund Lending Program. Pursuant to an Exemptive Order issued by the SEC, the Fund, along with other registered investment companies having management contracts with FMR or other affiliated entities of FMR, may participate in an interfund lending program. This program provides an
Annual Report
Notes to Financial Statements - continued
5. Fees and Other Transactions with Affiliates - continued
Interfund Lending Program - continued
alternative credit facility allowing the funds to borrow from, or lend money to, other participating affiliated funds. At period end, there were no interfund loans outstanding. The Fund's activity in this program during the period for which loans were outstanding was as follows:
Borrower or Lender | Average Loan | Weighted Average | Interest |
Borrower | $ 10,090,231 | .32% | $ 1,149 |
6. Committed Line of Credit.
The Fund participates with other funds managed by the investment adviser or an affiliate in a $4.25 billion credit facility (the "line of credit") to be utilized for temporary or emergency purposes to fund shareholder redemptions or for other short-term liquidity purposes. The Fund has agreed to pay commitment fees on its pro-rata portion of the line of credit, which amounted to $879 and is reflected in Miscellaneous expenses on the Statement of Operations. During the period, there were no borrowings on this line of credit.
7. Security Lending.
The Fund lends portfolio securities through a lending agent from time to time in order to earn additional income. For equity securities, a lending agent is used and may loan securities to certain qualified borrowers, which prior to August 1, 2013 included Fidelity Capital Markets (FCM), a broker-dealer affiliated with the Fund. On the settlement date of the loan, the Fund receives collateral (in the form of U.S. Treasury obligations, letters of credit and/or cash) against the loaned securities and maintains collateral in an amount not less than 100% of the market value of the loaned securities during the period of the loan. The market value of the loaned securities is determined at the close of business of the Fund and any additional required collateral is delivered to the Fund on the next business day. If the borrower defaults on its obligation to return the securities loaned because of insolvency or other reasons, the Fund may apply collateral received from the borrower against the obligation. The Fund may experience delays and costs in recovering the securities loaned. Any cash collateral received is invested in the Fidelity Securities Lending Cash Central Fund. The value of loaned securities and cash collateral at period end are disclosed on the Fund's Statement of Assets and Liabilities. At period end, there were no security loans outstanding with FCM. Security lending income represents the income earned on investing cash collateral, less rebates paid to borrowers and any lending agent fees associated with the loan, plus any premium payments received for lending certain types of securities. Security lending income is presented in the Statement of Operations as a component of income from Fidelity Central Funds. Total security lending income during the period amounted to $228,474, including $38,531 from securities loaned to FCM.
8. Expense Reductions.
Commissions paid to certain brokers with whom the investment adviser, or its affiliates, places trades on behalf of the Fund include an amount in addition to trade execution, which may be rebated back to the Fund to offset certain expenses. This amount totaled $112,854 for the period.
In addition, FMR reimbursed a portion of the Fund's operating expenses during the period in the amount of $1,847.
9. Distributions to Shareholders.
Distributions to shareholders of each class were as follows:
Years ended February 28, | 2014 | 2013 |
From net investment income |
|
|
Class A | $ 137,021 | $ 115,461 |
Class T | 71,145 | 65,641 |
Class B | 6,457 | 6,964 |
Class C | 68,251 | 43,780 |
Telecommunications | 8,194,747 | 8,113,006 |
Institutional Class | 29,138 | 56,226 |
Total | $ 8,506,759 | $ 8,401,078 |
From net realized gain |
|
|
Class A | $ 617 | $ - |
Class T | 373 | - |
Class B | 48 | - |
Class C | 466 | - |
Telecommunications | 30,889 | - |
Institutional Class | 118 | - |
Total | $ 32,511 | $ - |
Annual Report
10. Share Transactions.
Transactions for each class of shares were as follows:
| Shares | Dollars | ||
Years ended February 28, | 2014 | 2013 | 2014 | 2013 |
Class A |
|
|
|
|
Shares sold | 62,389 | 76,572 | $ 3,565,235 | $ 3,760,739 |
Reinvestment of distributions | 2,113 | 1,839 | 123,157 | 92,540 |
Shares redeemed | (58,169) | (54,776) | (3,308,571) | (2,738,397) |
Net increase (decrease) | 6,333 | 23,635 | $ 379,821 | $ 1,114,882 |
Class T |
|
|
|
|
Shares sold | 23,341 | 48,620 | $ 1,331,922 | $ 2,392,044 |
Reinvestment of distributions | 1,193 | 1,268 | 69,243 | 63,823 |
Shares redeemed | (32,706) | (26,195) | (1,852,992) | (1,317,712) |
Net increase (decrease) | (8,172) | 23,693 | $ (451,827) | $ 1,138,155 |
Class B |
|
|
|
|
Shares sold | 135 | 3,053 | $ 7,819 | $ 144,445 |
Reinvestment of distributions | 103 | 133 | 6,030 | 6,751 |
Shares redeemed | (2,095) | (4,941) | (116,496) | (248,673) |
Net increase (decrease) | (1,857) | (1,755) | $ (102,647) | $ (97,477) |
Class C |
|
|
|
|
Shares sold | 31,217 | 26,248 | $ 1,769,477 | $ 1,304,972 |
Reinvestment of distributions | 819 | 594 | 47,679 | 29,972 |
Shares redeemed | (22,263) | (18,620) | (1,264,412) | (912,596) |
Net increase (decrease) | 9,773 | 8,222 | $ 552,744 | $ 422,348 |
Telecommunications |
|
|
|
|
Shares sold | 3,045,047 | 3,283,802 | $ 171,993,078 | $ 158,174,294 |
Reinvestment of distributions | 136,279 | 156,090 | 7,951,397 | 7,859,416 |
Shares redeemed | (4,653,020) | (3,538,446) | (269,388,514) | (177,183,415) |
Net increase (decrease) | (1,471,694) | (98,554) | $ (89,444,039) | $ (11,149,705) |
Institutional Class |
|
|
|
|
Shares sold | 22,305 | 41,031 | $ 1,294,531 | $ 2,107,286 |
Reinvestment of distributions | 405 | 986 | 23,701 | 49,926 |
Shares redeemed | (46,560) | (13,014) | (2,517,260) | (646,240) |
Net increase (decrease) | (23,850) | 29,003 | $ (1,199,028) | $ 1,510,972 |
11. Other.
The Fund's organizational documents provide former and current trustees and officers with a limited indemnification against liabilities arising in connection with the performance of their duties to the Fund. In the normal course of business, the Fund may also enter into contracts that provide general indemnifications. The Fund's maximum exposure under these arrangements is unknown as this would be dependent on future claims that may be made against the Fund. The risk of material loss from such claims is considered remote.
At the end of the period, Fidelity VIP FundsManager 60% Portfolio was the owner of record of approximately 11% of the total outstanding shares of the Fund.
Annual Report
Performance: The Bottom Line
Average annual total return reflects the change in the value of an investment, assuming reinvestment of the fund's distributions from dividend income and capital gains (the profits earned upon the sale of securities that have grown in value, if any) and assuming a constant rate of performance each year. The $10,000 table and the fund's returns do not reflect the deduction of taxes that a shareholder would pay on fund distributions or the redemption of fund shares. During periods of reimbursement by Fidelity, a fund's total returns will be greater than it would be had the reimbursement not occurred. How a fund did yesterday is no guarantee of how it will do tomorrow.
Average Annual Total Returns
Periods ended February 28, 2014 | Past 1 | Past 5 | Past 10 |
Wireless Portfolio | 24.11% | 21.28% | 10.33% |
$10,000 Over 10 Years
Let's say hypothetically that $10,000 was invested in Wireless Portfolio on February 29, 2004. The chart shows how the value of your investment would have changed, and also shows how the S&P 500 Index performed over the same period.
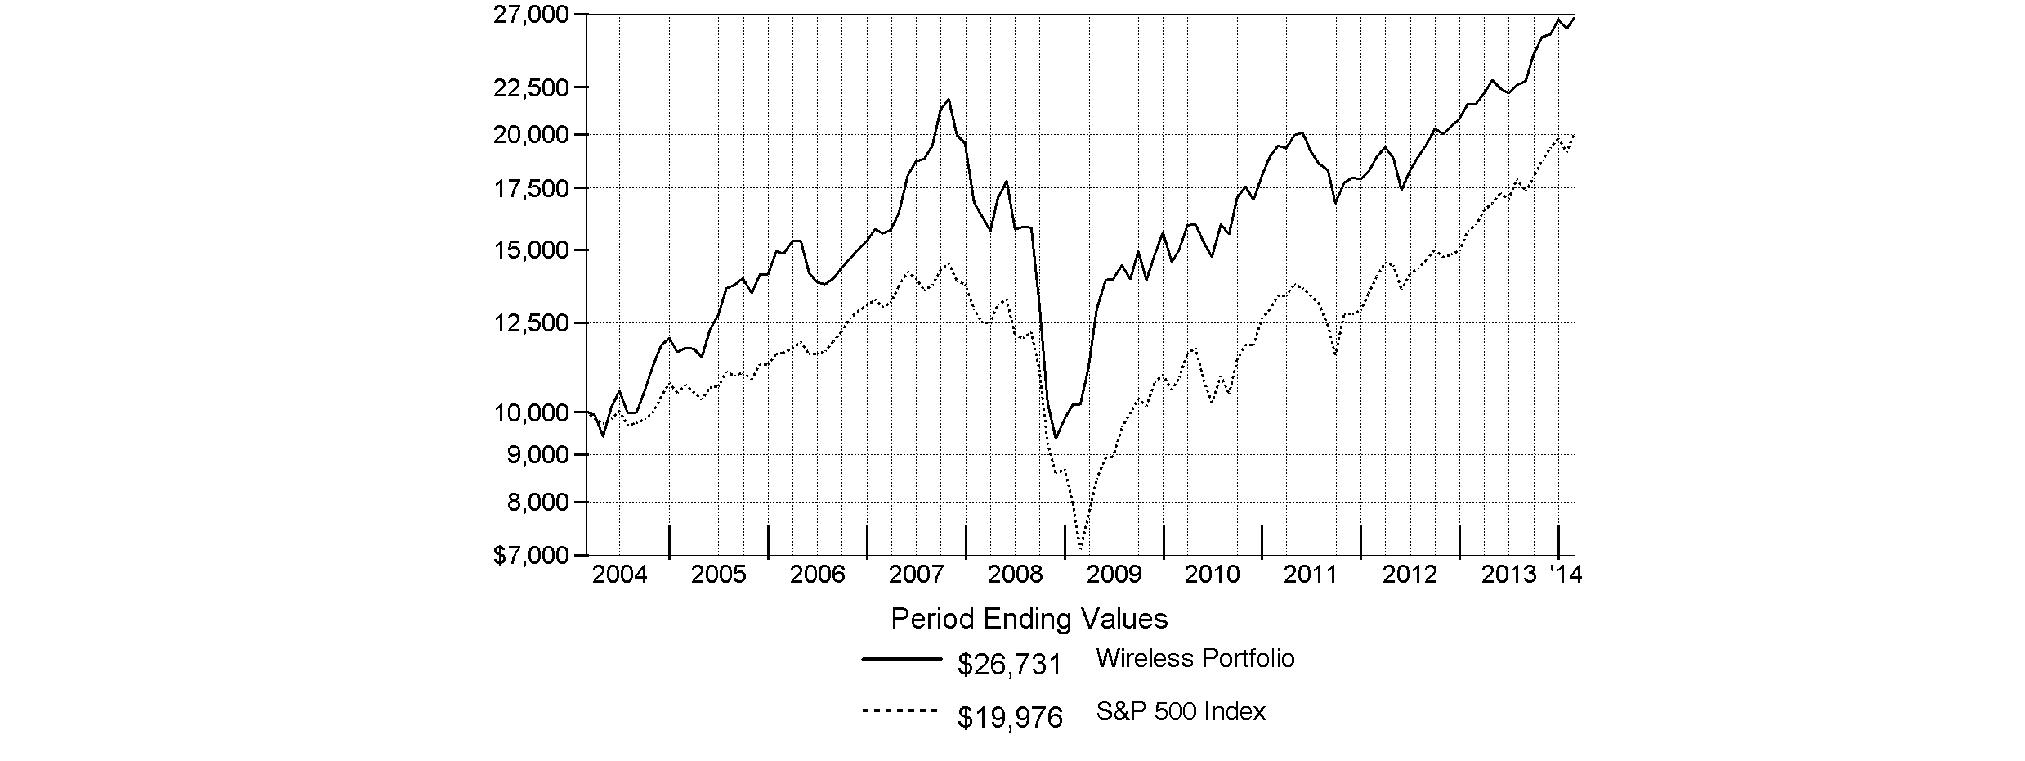
Annual Report
Wireless Portfolio
Management's Discussion of Fund Performance
Market Recap: Stocks overcame fears of higher interest rates - not to mention their worst January in four years - to finish sharply higher for the 12 months ending February 28, 2014. The broad S&P 500® Index and the blue-chip Dow Jones Industrial AverageSM gained 25.37% and 19.01%, respectively, amid generally favorable earnings reports and accommodative monetary policies worldwide. Performance generally increased along the risk spectrum, with smaller-cap and growth strategies leading the way. An ebullient market helped the growth-oriented Nasdaq Composite Index® to a 38.10% period gain, for example. On the other hand, both cyclical and defensive stocks had representation in the top-performing industry sectors: returns were highest in health care and consumer discretionary; lowest in utilities and telecommunication services. From a macroeconomic perspective, data still points to slow but steady improvement in the U.S., and Europe's recession may well be over. Reports from China have disappointed, but continue to suggest a relatively soft landing there. Mixed signals from the U.S. Federal Reserve as to when it might curtail its stimulative bond buying kept markets in flux during the spring and summer. Stocks regained momentum in October despite a federal budget impasse and brief government shutdown, and lower volatility prevailed through year-end. Shedding new-year concerns about China's economy, an emerging-markets sell-off and confirmation (at last) of Fed tapering - alongside confirmation of a presumably dovish Janet Yellen as new Fed chair - February saw stocks back in record territory, bearing down on the five-year anniversary of the market's bottom.
Comments from Kyle Weaver, Portfolio Manager of Wireless Portfolio: For the year, the fund returned 24.11%, outpacing the 20.77% gain of the S&P® Custom Wireless Index but modestly trailing the S&P 500®. Versus the custom index, stock selection in the mega-cap category - firms with market capitalizations of $100 billion or more - was a noteworthy positive during the year. In fact, the fund's two biggest relative contributors were weak-performing index components AT&T, a heavyweight in the integrated telecom services area, and mobile services provider China Mobile, both of which I significantly underweighted. An out-of-benchmark stake in Google - another mega-cap holding - further added value, given this stock's outstanding performance. Also beneficial were a large overweighting in U.K.-based Vodafone Group and a considerable underweighting in Verizon Communications, the parent company of Verizon Wireless. Conversely, I underestimated potential synergies from the merger of T-Mobile USA and MetroPCS Communications. This deal was finalized in May, with the resulting entity renamed T-Mobile U.S. Both the new stock and MetroPCS Communications were detractors from the fund's relative performance because I underweighted these strong-performing index components. Also weighing on our results versus the industry index was not owning prepaid wireless provider Leap Wireless International when integrated carrier AT&T announced plans to buy the company, causing the value of Leap's shares to more than double in mid-July. The possibility of well-funded competitors engaged in a bidding war for a distressed asset prompted me to build a position in Leap Wireless and eliminate this underweighting by the end of August. Lastly, not owning enough of index constituent Harris, which mainly provides communications equipment to the U.S. Department of Defense, also worked against the fund. Broad-based strength in defense stocks, renewed focus by the company's top management on efficient capital allocation and a more stable outlook for defense spending bolstered the shares, which hurt the fund's relative results.
The views expressed above reflect those of the portfolio manager(s) only through the end of the period as stated on the cover of this report and do not necessarily represent the views of Fidelity or any other person in the Fidelity organization. Any such views are subject to change at any time based upon market or other conditions and Fidelity disclaims any responsibility to update such views. These views may not be relied on as investment advice and, because investment decisions for a Fidelity fund are based on numerous factors, may not be relied on as an indication of trading intent on behalf of any Fidelity fund.
Annual Report
Wireless Portfolio
Shareholder Expense Example
As a shareholder of the Fund, you incur two types of costs: (1) transaction costs, including redemption fees and (2) ongoing costs, including management fees and other Fund expenses. This Example is intended to help you understand your ongoing costs (in dollars) of investing in the Fund and to compare these costs with the ongoing costs of investing in other mutual funds.
The Example is based on an investment of $1,000 invested at the beginning of the period and held for the entire period (September 1, 2013 to February 28, 2014).
Actual Expenses
The first line of the accompanying table provides information about actual account values and actual expenses. You may use the information in this line, together with the amount you invested, to estimate the expenses that you paid over the period. Simply divide your account value by $1,000.00 (for example, an $8,600 account value divided by $1,000.00 = 8.6), then multiply the result by the number in the first line under the heading entitled "Expenses Paid During Period" to estimate the expenses you paid on your account during this period. A small balance maintenance fee of $12.00 that is charged once a year may apply for certain accounts with a value of less than $2,000. This fee is not included in the table below. If it was, the estimate of expenses you paid during the period would be higher, and your ending account value lower, by this amount. In addition, the Fund, as a shareholder in the underlying Fidelity Central Funds, will indirectly bear its pro-rata share of the fees and expenses incurred by the underlying Fidelity Central Funds. These fees and expenses are not included in the Fund's annualized expense ratio used to calculate the expense estimate in the table below.
Hypothetical Example for Comparison Purposes
The second line of the accompanying table provides information about hypothetical account values and hypothetical expenses based on the Fund's actual expense ratio and an assumed rate of return of 5% per year before expenses, which is not the Fund's actual return. The hypothetical account values and expenses may not be used to estimate the actual ending account balance or expenses you paid for the period. You may use this information to compare the ongoing costs of investing in the Fund and other funds. To do so, compare this 5% hypothetical example with the 5% hypothetical examples that appear in the shareholder reports of the other funds. A small balance maintenance fee of $12.00 that is charged once a year may apply for certain accounts with a value of less than $2,000. This fee is not included in the table below. If it was, the estimate of expenses you paid during the period would be higher, and your ending account value lower, by this amount. In addition, the Fund, as a shareholder in the underlying Fidelity Central Funds, will indirectly bear its pro-rata share of the fees and expenses incurred by the underlying Fidelity Central Funds. These fees and expenses are not included in the Fund's annualized expense ratio used to calculate the expense estimate in the table below.
Please note that the expenses shown in the table are meant to highlight your ongoing costs only and do not reflect any transaction costs. Therefore, the second line of the table is useful in comparing ongoing costs only, and will not help you determine the relative total costs of owning different funds. In addition, if these transactional costs were included, your costs would have been higher.
| Annualized | Beginning | Ending | Expenses Paid |
Actual | .85% | $ 1,000.00 | $ 1,171.60 | $ 4.58 |
Hypothetical A |
| $ 1,000.00 | $ 1,020.58 | $ 4.26 |
A 5% return per year before expenses
B Annualized expense ratio reflects expenses net of applicable fee waivers.
* Expenses are equal to the Fund's annualized expense ratio, multiplied by the average account value over the period, multiplied by 181/365 (to reflect the one-half year period).
Annual Report
Wireless Portfolio
Investment Changes (Unaudited)
Top Ten Stocks as of February 28, 2014 | ||
| % of fund's | % of fund's net assets |
Verizon Communications, Inc. | 17.2 | 1.0 |
QUALCOMM, Inc. | 9.3 | 11.9 |
American Tower Corp. | 8.6 | 10.8 |
Vodafone Group PLC sponsored ADR | 8.1 | 13.8 |
SBA Communications Corp. Class A | 4.0 | 5.3 |
BT Group PLC sponsored ADR | 4.0 | 0.0 |
Google, Inc. Class A | 4.0 | 4.1 |
Crown Castle International Corp. | 3.8 | 5.4 |
Telefonaktiebolaget LM Ericsson (B Shares) sponsored ADR | 3.1 | 1.5 |
AT&T, Inc. | 2.8 | 4.5 |
| 64.9 | |
Top Industries (% of fund's net assets) | |||
As of February 28, 2014 | |||
| Diversified Telecommunication Services | 29.7% |
|
| Wireless Telecommunication Services | 24.4% |
|
| Communications Equipment | 19.1% |
|
| Real Estate Investment Trusts | 8.6% |
|
| Internet Software & Services | 5.9% |
|
| All Others* | 12.3% |
|

As of August 31, 2013 | |||
| Wireless Telecommunication Services | 41.5% |
|
| Communications Equipment | 23.4% |
|
| Real Estate Investment Trusts | 10.8% |
|
| Diversified Telecommunication Services | 6.6% |
|
| Internet Software & Services | 5.2% |
|
| All Others* | 12.5% |
|

* Includes short-term investments and net other assets (liabilities). |
Annual Report
Wireless Portfolio
Investments February 28, 2014
Showing Percentage of Net Assets
Common Stocks - 100.3% | |||
Shares | Value | ||
AEROSPACE & DEFENSE - 0.8% | |||
Aerospace & Defense - 0.8% | |||
Kratos Defense & Security Solutions, Inc. (a) | 287,349 | $ 2,241,322 | |
COMMUNICATIONS EQUIPMENT - 19.1% | |||
Communications Equipment - 19.1% | |||
Alcatel-Lucent SA sponsored ADR | 690,400 | 2,954,912 | |
Aruba Networks, Inc. (a)(d) | 139,784 | 2,866,970 | |
Harris Corp. | 22,100 | 1,631,422 | |
InterDigital, Inc. | 85,207 | 2,598,814 | |
Motorola Solutions, Inc. | 29,268 | 1,937,542 | |
Nokia Corp. sponsored ADR (a) | 569,600 | 4,317,568 | |
QUALCOMM, Inc. | 357,150 | 26,889,824 | |
Sierra Wireless, Inc. (a) | 65,700 | 1,349,244 | |
Telefonaktiebolaget LM Ericsson (B Shares) sponsored ADR | 708,300 | 9,144,153 | |
ViaSat, Inc. (a) | 23,700 | 1,581,027 | |
| 55,271,476 | ||
COMPUTERS & PERIPHERALS - 1.2% | |||
Computer Hardware - 1.2% | |||
Apple, Inc. | 6,700 | 3,525,808 | |
DIVERSIFIED TELECOMMUNICATION SERVICES - 29.6% | |||
Alternative Carriers - 0.8% | |||
Intelsat SA | 69,700 | 1,382,848 | |
Towerstream Corp. (a) | 334,423 | 882,877 | |
| 2,265,725 | ||
Integrated Telecommunication Services - 28.8% | |||
AT&T, Inc. | 251,600 | 8,033,588 | |
BCE, Inc. | 134,700 | 5,875,562 | |
BT Group PLC sponsored ADR | 169,700 | 11,704,209 | |
Chunghwa Telecom Co. Ltd. sponsored ADR | 56,400 | 1,706,100 | |
Koninklijke KPN NV (a) | 79,905 | 284,785 | |
Telefonica SA sponsored ADR (d) | 18,411 | 280,215 | |
TELUS Corp. | 167,200 | 5,923,649 | |
Verizon Communications, Inc. | 1,045,197 | 49,730,471 | |
| 83,538,579 | ||
TOTAL DIVERSIFIED TELECOMMUNICATION SERVICES | 85,804,304 | ||
ELECTRONIC EQUIPMENT & COMPONENTS - 0.7% | |||
Electronic Manufacturing Services - 0.7% | |||
Neonode, Inc. (a)(d) | 261,900 | 1,890,918 | |
INTERNET SOFTWARE & SERVICES - 5.9% | |||
Internet Software & Services - 5.9% | |||
Global Eagle Entertainment, Inc. (a) | 69,100 | 1,214,778 | |
| |||
Shares | Value | ||
Google, Inc. Class A (a) | 9,600 | $ 11,670,240 | |
Web.com Group, Inc. (a) | 119,700 | 4,363,065 | |
| 17,248,083 | ||
IT SERVICES - 3.1% | |||
IT Consulting & Other Services - 3.1% | |||
Amdocs Ltd. | 71,100 | 3,162,528 | |
Cognizant Technology Solutions Corp. Class A (a) | 56,600 | 5,889,796 | |
| 9,052,324 | ||
REAL ESTATE INVESTMENT TRUSTS - 8.6% | |||
Specialized REITs - 8.6% | |||
American Tower Corp. | 306,792 | 24,994,344 | |
SEMICONDUCTORS & SEMICONDUCTOR EQUIPMENT - 2.6% | |||
Semiconductors - 2.6% | |||
RF Micro Devices, Inc. (a) | 417,200 | 2,953,776 | |
Samsung Electronics Co. Ltd. | 3,709 | 4,691,637 | |
| 7,645,413 | ||
SOFTWARE - 4.3% | |||
Application Software - 4.3% | |||
Gameloft Se (a) | 346,462 | 3,816,208 | |
Synchronoss Technologies, Inc. (a) | 134,500 | 4,624,110 | |
Tangoe, Inc. (a) | 209,000 | 3,975,180 | |
| 12,415,498 | ||
WIRELESS TELECOMMUNICATION SERVICES - 24.4% | |||
Wireless Telecommunication Services - 24.4% | |||
America Movil S.A.B. de CV Series L sponsored ADR | 67,800 | 1,313,286 | |
China Mobile Ltd. sponsored ADR (d) | 60,900 | 2,895,795 | |
Crown Castle International Corp. | 143,200 | 10,868,880 | |
Leap Wireless International, Inc. (a) | 16,600 | 290,832 | |
NII Holdings, Inc. (a)(d) | 534,700 | 614,905 | |
NTELOS Holdings Corp. | 45,600 | 637,488 | |
NTT DoCoMo, Inc. sponsored ADR (d) | 88,800 | 1,481,184 | |
Rogers Communications, Inc. Class B (non-vtg.) (d) | 189,600 | 7,328,529 | |
SBA Communications Corp. Class A (a) | 123,100 | 11,715,427 | |
Shenandoah Telecommunications Co. | 1,300 | 34,359 | |
Sprint Corp. (a) | 3,333 | 29,130 | |
T-Mobile U.S., Inc. (a) | 157,975 | 4,818,238 | |
Telephone & Data Systems, Inc. | 155,814 | 3,551,001 | |
U.S. Cellular Corp. | 26,237 | 946,893 | |
U.S.A. Mobility, Inc. | 49,205 | 711,012 | |
Vodafone Group PLC sponsored ADR | 566,281 | 23,540,301 | |
| 70,777,260 | ||
TOTAL COMMON STOCKS (Cost $241,605,437) |
| ||
Nonconvertible Preferred Stocks - 0.1% | |||
Shares | Value | ||
DIVERSIFIED TELECOMMUNICATION SERVICES - 0.1% | |||
Integrated Telecommunication Services - 0.1% | |||
Oi SA (PN) | 158,800 | $ 243,136 | |
Money Market Funds - 5.0% | |||
|
|
|
|
Fidelity Cash Central Fund, 0.10% (b) | 5,290,178 | 5,290,178 | |
Fidelity Securities Lending Cash Central Fund, 0.09% (b)(c) | 9,404,885 | 9,404,885 | |
TOTAL MONEY MARKET FUNDS (Cost $14,695,063) |
| ||
TOTAL INVESTMENT PORTFOLIO - 105.4% (Cost $256,601,107) | 305,804,949 | ||
NET OTHER ASSETS (LIABILITIES) - (5.4)% | (15,748,297) | ||
NET ASSETS - 100% | $ 290,056,652 | ||
Legend |
(a) Non-income producing |
(b) Affiliated fund that is generally available only to investment companies and other accounts managed by Fidelity Investments. The rate quoted is the annualized seven-day yield of the fund at period end. A complete unaudited listing of the fund's holdings as of its most recent quarter end is available upon request. In addition, each Fidelity Central Fund's financial statements, which are not covered by the Fund's Report of Independent Registered Public Accounting Firm, are available on the SEC's website or upon request. |
(c) Investment made with cash collateral received from securities on loan. |
(d) Security or a portion of the security is on loan at period end. |
Affiliated Central Funds |
Information regarding fiscal year to date income earned by the Fund from investments in Fidelity Central Funds is as follows: |
Fund | Income earned |
Fidelity Cash Central Fund | $ 4,322 |
Fidelity Securities Lending Cash Central Fund | 197,427 |
Total | $ 201,749 |
Other Information |
The following is a summary of the inputs used, as of February 28, 2014, involving the Fund's assets and liabilities carried at fair value. The inputs or methodology used for valuing securities may not be an indication of the risk associated with investing in those securities. For more information on valuation inputs, and their aggregation into the levels used in the table below, please refer to the Investment Valuation section in the accompanying Notes to Financial Statements. |
Valuation Inputs at Reporting Date: | ||||
Description | Total | Level 1 | Level 2 | Level 3 |
Investments in Securities: | ||||
Common Stocks | $ 290,866,750 | $ 290,581,965 | $ 284,785 | $ - |
Nonconvertible Preferred Stocks | 243,136 | 243,136 | - | - |
Money Market Funds | 14,695,063 | 14,695,063 | - | - |
Total Investments in Securities: | $ 305,804,949 | $ 305,520,164 | $ 284,785 | $ - |
Distribution of investments by country or territory of incorporation, as a percentage of total net assets, is as follows (Unaudited): |
United States of America | 69.0% |
United Kingdom | 12.1% |
Canada | 7.0% |
Sweden | 3.1% |
France | 2.3% |
Korea (South) | 1.6% |
Finland | 1.5% |
Hong Kong | 1.0% |
Others (Individually Less Than 1%) | 2.4% |
| 100.0% |
See accompanying notes which are an integral part of the financial statements.
Annual Report
Wireless Portfolio
Financial Statements
Statement of Assets and Liabilities
| February 28, 2014 | |
|
|
|
Assets | ||
Investment in securities, at value (including securities loaned of $8,713,566) - See accompanying schedule: Unaffiliated issuers (cost $241,906,044) | $ 291,109,886 |
|
Fidelity Central Funds (cost $14,695,063) | 14,695,063 |
|
Total Investments (cost $256,601,107) |
| $ 305,804,949 |
Receivable for investments sold | 40,055,778 | |
Receivable for fund shares sold | 230,139 | |
Dividends receivable | 3,719,156 | |
Distributions receivable from Fidelity Central Funds | 5,064 | |
Prepaid expenses | 1,349 | |
Other receivables | 25,067 | |
Total assets | 349,841,502 | |
|
|
|
Liabilities | ||
Payable for investments purchased | $ 49,355,522 | |
Payable for fund shares redeemed | 795,157 | |
Accrued management fee | 131,709 | |
Other affiliated payables | 62,523 | |
Other payables and accrued expenses | 35,054 | |
Collateral on securities loaned, at value | 9,404,885 | |
Total liabilities | 59,784,850 | |
|
|
|
Net Assets | $ 290,056,652 | |
Net Assets consist of: |
| |
Paid in capital | $ 210,278,402 | |
Undistributed net investment income | 12,634,450 | |
Accumulated undistributed net realized gain (loss) on investments and foreign currency transactions | 17,958,981 | |
Net unrealized appreciation (depreciation) on investments and assets and liabilities in foreign currencies | 49,184,819 | |
Net Assets, for 27,439,446 shares outstanding | $ 290,056,652 | |
Net Asset Value, offering price and redemption price per share ($290,056,652 ÷ 27,439,446 shares) | $ 10.57 | |
Statement of Operations
| Year ended February 28, 2014 | |
|
|
|
Investment Income |
|
|
Dividends |
| $ 5,588,308 |
Special dividends |
| 12,975,156 |
Interest |
| 2 |
Income from Fidelity Central Funds |
| 201,749 |
Total income |
| 18,765,215 |
|
|
|
Expenses | ||
Management fee | $ 1,531,779 | |
Transfer agent fees | 658,825 | |
Accounting and security lending fees | 111,552 | |
Custodian fees and expenses | 37,913 | |
Independent trustees' compensation | 5,296 | |
Registration fees | 27,287 | |
Audit | 52,107 | |
Legal | 4,629 | |
Interest | 885 | |
Miscellaneous | 3,031 | |
Total expenses before reductions | 2,433,304 | |
Expense reductions | (51,729) | 2,381,575 |
Net investment income (loss) | 16,383,640 | |
Realized and Unrealized Gain (Loss) Net realized gain (loss) on: | ||
Investment securities: |
|
|
Unaffiliated issuers | 36,578,425 | |
Foreign currency transactions | 1,024 | |
Total net realized gain (loss) |
| 36,579,449 |
Change in net unrealized appreciation (depreciation) on: Investment securities | 6,981,802 | |
Assets and liabilities in foreign currencies | (12,618) | |
Total change in net unrealized appreciation (depreciation) |
| 6,969,184 |
Net gain (loss) | 43,548,633 | |
Net increase (decrease) in net assets resulting from operations | $ 59,932,273 | |
See accompanying notes which are an integral part of the financial statements.
Annual Report
Wireless Portfolio
Financial Statements - continued
Statement of Changes in Net Assets
| Year ended | Year ended |
Increase (Decrease) in Net Assets |
|
|
Operations |
|
|
Net investment income (loss) | $ 16,383,640 | $ 3,687,797 |
Net realized gain (loss) | 36,579,449 | (212,525) |
Change in net unrealized appreciation (depreciation) | 6,969,184 | 27,750,174 |
Net increase (decrease) in net assets resulting from operations | 59,932,273 | 31,225,446 |
Distributions to shareholders from net investment income | (2,744,292) | (4,135,652) |
Share transactions | 117,927,758 | 47,598,521 |
Reinvestment of distributions | 2,633,352 | 3,963,751 |
Cost of shares redeemed | (141,492,075) | (87,559,651) |
Net increase (decrease) in net assets resulting from share transactions | (20,930,965) | (35,997,379) |
Redemption fees | 5,399 | 6,317 |
Total increase (decrease) in net assets | 36,262,415 | (8,901,268) |
|
|
|
Net Assets | ||
Beginning of period | 253,794,237 | 262,695,505 |
End of period (including undistributed net investment income of $12,634,450 and distributions in excess of net investment income of $689,955, respectively) | $ 290,056,652 | $ 253,794,237 |
Other Information Shares | ||
Sold | 12,229,697 | 5,878,305 |
Issued in reinvestment of distributions | 259,699 | 483,848 |
Redeemed | (14,564,406) | (11,054,527) |
Net increase (decrease) | (2,075,010) | (4,692,374) |
Financial Highlights
Years ended February 28, | 2014 | 2013 | 2012 G | 2011 | 2010 |
Selected Per-Share Data |
|
|
|
|
|
Net asset value, beginning of period | $ 8.60 | $ 7.68 | $ 8.29 | $ 6.47 | $ 4.44 |
Income from Investment Operations |
|
|
|
|
|
Net investment income (loss) B | .56 I | .12 | .10 E | .08 | .06 |
Net realized and unrealized gain (loss) | 1.51 | .94 | (.33) | 1.82 | 2.03 |
Total from investment operations | 2.07 | 1.06 | (.23) | 1.90 | 2.09 |
Distributions from net investment income | (.10) | (.14) | (.08) | (.08) | (.06) |
Distributions from net realized gain | - | - | (.30) | - | - |
Total distributions | (.10) | (.14) | (.38) | (.08) | (.06) |
Redemption fees added to paid in capital B,H | - | - | - | - | - |
Net asset value, end of period | $ 10.57 | $ 8.60 | $ 7.68 | $ 8.29 | $ 6.47 |
Total Return A | 24.11% | 13.89% | (2.55)% | 29.55% | 47.06% |
Ratios to Average Net Assets C, F |
|
|
|
|
|
Expenses before reductions | .88% | .90% | .90% | .92% | .96% |
Expenses net of fee waivers, if any | .88% | .90% | .90% | .92% | .96% |
Expenses net of all reductions | .86% | .87% | .89% | .91% | .94% |
Net investment income (loss) | 5.91% I | 1.50% | 1.23% E | 1.08% | .90% |
Supplemental Data |
|
|
|
|
|
Net assets, end of period (000 omitted) | $ 290,057 | $ 253,794 | $ 262,696 | $ 361,082 | $ 304,896 |
Portfolio turnover rate D | 120% | 100% | 114% | 111% | 154% |
A Total returns would have been lower if certain expenses had not been reduced during the applicable periods shown. B Calculated based on average shares outstanding during the period. C Fees and expenses of any underlying Fidelity Central Funds are not included in the Fund's expense ratio. The Fund indirectly bears its proportionate share of the expenses of any underlying Fidelity Central Funds. D Amount does not include the portfolio activity of any underlying Fidelity Central Funds. E Investment income per share reflects a large, non-recurring dividend which amounted to $.03 per share. Excluding this non-recurring dividend, the ratio of net investment income (loss) to average net assets would have been ..90%. F Expense ratios reflect operating expenses of the Fund. Expenses before reductions do not reflect amounts reimbursed by the investment adviser or reductions from brokerage service arrangements or reductions from other expense offset arrangements and do not represent the amount paid by the Fund during periods when reimbursements or reductions occur. Expenses net of fee waivers reflect expenses after reimbursement by the investment adviser but prior to reductions from brokerage service arrangements or other expense offset arrangements. Expenses net of all reductions represent the net expenses paid by the Fund. G For the year ended February 29. H Amount represents less than $.01 per share. I Investment income per share reflects large, non-recurring dividends which amounted to $.45 per share. Excluding these non-recurring dividends, the ratio of net investment income (loss) to average net assets would have been 1.23%. |
See accompanying notes which are an integral part of the financial statements.
Annual Report
Notes to Financial Statements
For the period ended February 28, 2014
1. Organization.
Wireless Portfolio (the Fund) is a non-diversified fund of Fidelity Select Portfolios (the Trust) and is authorized to issue an unlimited number of shares. The Trust is registered under the Investment Company Act of 1940, as amended (the 1940 Act), as an open-end management investment company organized as a Massachusetts business trust. The Fund invests primarily in securities of companies whose principal business activities fall within specific industries.
2. Investments in Fidelity Central Funds.
The Fund invests in Fidelity Central Funds, which are open-end investment companies generally available only to other investment companies and accounts managed by the investment adviser and its affiliates. The Fund's Schedule of Investments lists each of the Fidelity Central Funds held as of period end, if any, as an investment of the Fund, but does not include the underlying holdings of each Fidelity Central Fund. As an Investing Fund, the Fund indirectly bears its proportionate share of the expenses of the underlying Fidelity Central Funds.
The Money Market Central Funds seek preservation of capital and current income and are managed by Fidelity Investments Money Management, Inc. (FIMM), an affiliate of the investment adviser. Annualized expenses of the Money Market Central Funds as of their most recent shareholder report date are less than .01%.
A complete unaudited list of holdings for each Fidelity Central Fund is available upon request or at the Securities and Exchange Commission (the SEC) website at www.sec.gov. In addition, the financial statements of the Fidelity Central Funds, which are not covered by the Fund's Report of Independent Registered Public Accounting Firm, are available on the SEC website or upon request.
3. Significant Accounting Policies.
The financial statements have been prepared in conformity with accounting principles generally accepted in the United States of America (GAAP), which require management to make certain estimates and assumptions at the date of the financial statements. Actual results could differ from those estimates. Subsequent events, if any, through the date that the financial statements were issued have been evaluated in the preparation of the financial statements. The following summarizes the significant accounting policies of the Fund:
Investment Valuation. Investments are valued as of 4:00 p.m. Eastern time on the last calendar day of the period. In accordance with valuation policies and procedures approved by the Board of Trustees (the Board), the Fund attempts to obtain prices from one or more third party pricing vendors or brokers to value its investments. When current market prices, quotations or currency exchange rates are not readily available or reliable, investments will be fair valued in good faith by the Fidelity SelectCo, LLC (SelectCo) Fair Value Committee (the Committee), in accordance with procedures adopted by the Board. Factors used in determining fair value vary by investment type and may include market or investment specific events. The frequency with which these procedures are used cannot be predicted and they may be utilized to a significant extent. The Committee oversees the Fund's valuation policies and procedures and is responsible for approving and reporting to the Board all fair value determinations.
The Fund categorizes the inputs to valuation techniques used to value its investments into a disclosure hierarchy consisting of three levels as shown below:
Level 1 - quoted prices in active markets for identical investments
Level 2 - other significant observable inputs (including quoted prices for similar investments, interest rates, prepayment speeds, etc.)
Level 3 - unobservable inputs (including the Fund's own assumptions based on the best information available)
Valuation techniques used to value the Fund's investments by major category are as follows:
Equity securities, including restricted securities, for which market quotations are readily available, are valued at the last reported sale price or official closing price as reported by a third party pricing vendor on the primary market or exchange on which they are traded and are categorized as Level 1 in the hierarchy. In the event there were no sales during the day or closing prices are not available, securities are valued at the last quoted bid price or may be valued using the last available price and are generally categorized as Level 2 in the hierarchy. For foreign equity securities, when market or security specific events arise, comparisons to the valuation of American Depositary Receipts (ADRs), futures contracts, Exchange-Traded Funds (ETFs) and certain indexes as well as quoted prices for similar securities may be used and would be categorized as Level 2 in the hierarchy. Utilizing these techniques may result in transfers between Level 1 and Level 2. For equity securities, including restricted securities, where observable inputs are limited, assumptions about market activity and risk are used and these securities may be categorized as Level 3 in the hierarchy.
Investments in open-end mutual funds , including the Fidelity Central Funds, are valued at their closing net asset value (NAV) each business day and are categorized as Level 1 in the hierarchy.
Annual Report
3. Significant Accounting Policies - continued
Investment Valuation - continued
Changes in valuation techniques may result in transfers in or out of an assigned level within the disclosure hierarchy. The aggregate value of investments by input level, as of February 28, 2014, is included at the end of the Fund's Schedule of Investments.
Foreign Currency. The Fund may use foreign currency contracts to facilitate transactions in foreign-denominated securities. Gains and losses from these transactions may arise from changes in the value of the foreign currency or if the counterparties do not perform under the contracts' terms.
Foreign-denominated assets, including investment securities, and liabilities are translated into U.S. dollars at the exchange rates at period end. Purchases and sales of investment securities, income and dividends received and expenses denominated in foreign currencies are translated into U.S. dollars at the exchange rate in effect on the transaction date.
The effects of exchange rate fluctuations on investments are included with the net realized and unrealized gain (loss) on investment securities. Other foreign currency transactions resulting in realized and unrealized gain (loss) are disclosed separately.
Investment Transactions and Income. For financial reporting purposes, the Fund's investment holdings and NAV include trades executed through the end of the last business day of the period. The NAV per share for processing shareholder transactions is calculated as of the close of business of the New York Stock Exchange (NYSE), normally 4:00 p.m. Eastern time and includes trades executed through the end of the prior business day. Gains and losses on securities sold are determined on the basis of identified cost and may include proceeds received from litigation. Dividend income is recorded on the ex-dividend date, except for certain dividends from foreign securities where the ex-dividend date may have passed, which are recorded as soon as the Fund is informed of the ex-dividend date. Non-cash dividends included in dividend income, if any, are recorded at the fair market value of the securities received. Distributions received on securities that represent a return of capital or capital gain are recorded as a reduction of cost of investments and/or as a realized gain. Subsequent to ex-dividend date the Fund determines the components of these distributions, based upon receipt of tax filings or other correspondence relating to the underlying investment. Large, non-recurring dividends recognized by the Fund are presented separately on the Statement of Operations as "Special Dividends" and the impact of these dividends is presented in the Financial Highlights. Interest income and distributions from the Fidelity Central Funds are accrued as earned. Interest income includes coupon interest and amortization of premium and accretion of discount on debt securities. Investment income is recorded net of foreign taxes withheld where recovery of such taxes is uncertain.
Expenses. Expenses directly attributable to a fund are charged to that fund. Expenses attributable to more than one fund are allocated among the respective funds on the basis of relative net assets or other appropriate methods. Expense estimates are accrued in the period to which they relate and adjustments are made when actual amounts are known.
Income Tax Information and Distributions to Shareholders. Each year, the Fund intends to qualify as a regulated investment company under Subchapter M of the Internal Revenue Code, including distributing substantially all of its taxable income and realized gains. As a result, no provision for U.S. Federal income taxes is required. As of February 28, 2014, the Fund did not have any unrecognized tax benefits in the financial statements; nor is the Fund aware of any tax positions for which it is reasonably possible that the total amounts of unrecognized tax benefits will significantly change in the next twelve months. The Fund files a U.S. federal tax return, in addition to state and local tax returns as required. The Fund's federal income tax returns are subject to examination by the Internal Revenue Service (IRS) for a period of three fiscal years after they are filed. State and local tax returns may be subject to examination for an additional fiscal year depending on the jurisdiction. Foreign taxes are provided for based on the Fund's understanding of the tax rules and rates that exist in the foreign markets in which it invests.
Distributions are declared and recorded on the ex-dividend date. Income and capital gain distributions are determined in accordance with income tax regulations, which may differ from GAAP. In addition, the Fund claimed a portion of the payment made to redeeming shareholders as a distribution for income tax purposes.
Capital accounts within the financial statements are adjusted for permanent book-tax differences. These adjustments have no impact on net assets or the results of operations. Capital accounts are not adjusted for temporary book-tax differences which will reverse in a subsequent period.
Book-tax differences are primarily due to foreign currency transactions and losses deferred due to wash sales and excise tax regulations.
The federal tax cost of investment securities and unrealized appreciation (depreciation) as of period end were as follows:
Gross unrealized appreciation | $ 53,842,323 |
Gross unrealized depreciation | (6,006,843) |
Net unrealized appreciation (depreciation) on securities and other investments | $ 47,835,480 |
|
|
Tax Cost | $ 257,969,469 |
Annual Report
Notes to Financial Statements - continued
3. Significant Accounting Policies - continued
Income Tax Information and Distributions to Shareholders - continued
The tax-based components of distributable earnings as of period end were as follows:
Undistributed ordinary income | $ 14,517,353 |
Undistributed long-term capital gain | $ 17,444,439 |
Net unrealized appreciation (depreciation) | $ 47,816,457 |
The tax character of distributions paid was as follows:
| February 28, 2014 | February 28, 2013 |
Ordinary Income | $ 2,744,292 | $ 4,135,652 |
Trading (Redemption) Fees. Shares held by investors in the Fund less than 30 days may be subject to a redemption fee equal to .75% of the NAV of shares redeemed. All redemption fees, which reduce the proceeds of the shareholder redemption, are retained by the Fund and accounted for as an addition to paid in capital.
4. Purchases and Sales of Investments.
Purchases and sales of securities, other than short-term securities, aggregated $328,366,336 and $330,806,574, respectively.
5. Fees and Other Transactions with Affiliates.
Management Fee. Effective August 1, 2013, SelectCo replaced Fidelity Management and Research Company (FMR), an affiliate of SelectCo, as investment adviser to the Fund. The investment adviser and its affiliates provide the Fund with investment management related services for which the Fund pays a monthly management fee. The management fee is the sum of an individual fund fee rate that is based on an annual rate of .30% of the Fund's average net assets and an annualized group fee rate that averaged .25% during the period. The group fee rate is based upon the average net assets of all the mutual funds advised by FMR and the investment adviser. The group fee rate decreases as assets under management increase and increases as assets under management decrease. For the reporting period, the total annual management fee rate was .55% of the Fund's average net assets.
Transfer Agent Fees. Fidelity Investments Institutional Operations Company, Inc. (FIIOC), an affiliate of the investment adviser, is the Fund's transfer, dividend disbursing and shareholder servicing agent. FIIOC receives account fees and asset-based fees that vary according to account size and type of account. FIIOC pays for typesetting, printing and mailing of shareholder reports, except proxy statements. For the period, the transfer agent fees were equivalent to an annual rate of .24% of average net assets.
Accounting and Security Lending Fees. Fidelity Service Company, Inc. (FSC), an affiliate of the investment adviser, maintains the Fund's accounting records. The accounting fee is based on the level of average net assets for each month. Under a separate contract, FSC administers the security lending program. The security lending fee is based on the number and duration of lending transactions.
Brokerage Commissions. The Fund placed a portion of its portfolio transactions with brokerage firms which are affiliates of the investment adviser. Brokerage commissions are included in net realized gain (loss) and change in net unrealized appreciation (depreciation) in the Statement of Operations. The commissions paid to these affiliated firms were $14,676 for the period.
Interfund Lending Program. Pursuant to an Exemptive Order issued by the SEC, the Fund, along with other registered investment companies having management contracts with FMR or other affiliated entities of FMR, may participate in an interfund lending program. This program provides an alternative credit facility allowing the funds to borrow from, or lend money to, other participating affiliated funds. At period end, there were no interfund loans outstanding. The Fund's activity in this program during the period for which loans were outstanding was as follows:
Borrower or Lender | Average Loan | Weighted Average | Interest |
Borrower | $ 13,925,571 | .33% | $ 885 |
Annual Report
6. Committed Line of Credit.
The Fund participates with other funds managed by the investment adviser or an affiliate in a $4.25 billion credit facility (the "line of credit") to be utilized for temporary or emergency purposes to fund shareholder redemptions or for other short-term liquidity purposes. The Fund has agreed to pay commitment fees on its pro-rata portion of the line of credit, which amounted to $537 and is reflected in Miscellaneous expenses on the Statement of Operations. During the period, there were no borrowings on this line of credit.
7. Security Lending.
The Fund lends portfolio securities through a lending agent from time to time in order to earn additional income. For equity securities, a lending agent is used and may loan securities to certain qualified borrowers, which prior to August 1, 2013 included Fidelity Capital Markets (FCM), a broker-dealer affiliated with the Fund. On the settlement date of the loan, the Fund receives collateral (in the form of U.S. Treasury obligations, letters of credit and/or cash) against the loaned securities and maintains collateral in an amount not less than 100% of the market value of the loaned securities during the period of the loan. The market value of the loaned securities is determined at the close of business of the Fund and any additional required collateral is delivered to the Fund on the next business day. If the borrower defaults on its obligation to return the securities loaned because of insolvency or other reasons, the Fund may apply collateral received from the borrower against the obligation. The Fund may experience delays and costs in recovering the securities loaned. Any cash collateral received is invested in the Fidelity Securities Lending Cash Central Fund. The value of loaned securities and cash collateral at period end are disclosed on the Fund's Statement of Assets and Liabilities. At period end, there were no security loans outstanding with FCM. Security lending income represents the income earned on investing cash collateral, less rebates paid to borrowers and any lending agent fees associated with the loan, plus any premium payments received for lending certain types of securities. Security lending income is presented in the Statement of Operations as a component of income from Fidelity Central Funds. Total security lending income during the period amounted to $197,427, including $1,312 from securities loaned to FCM.
8. Expense Reductions.
Commissions paid to certain brokers with whom the investment adviser, or its affiliates, places trades on behalf of the Fund include an amount to the Fund in addition to trade execution, which may be rebated back to the Fund to offset certain expenses. This amount totaled $49,972 for the period.
In addition, FMR reimbursed a portion of the Fund's operating expenses during the period in the amount of $1,757.
9. Other.
The Fund's organizational documents provide former and current trustees and officers with a limited indemnification against liabilities arising in connection with the performance of their duties to the Fund. In the normal course of business, the Fund may also enter into contracts that provide general indemnifications. The Fund's maximum exposure under these arrangements is unknown as this would be dependent on future claims that may be made against the Fund. The risk of material loss from such claims is considered remote.
Annual Report
Report of Independent Registered Public Accounting Firm
To the Trustees of Fidelity Select Portfolios and the Shareholders of Telecommunications Portfolio and Wireless Portfolio:
In our opinion, the accompanying statements of assets and liabilities, including the schedules of investments, and the related statements of operations and of changes in net assets and the financial highlights present fairly, in all material respects, the financial positions of Telecommunications Portfolio and Wireless Portfolio (funds of Fidelity Select Portfolios) at February 28, 2014, the results of each of their operations for the year then ended, the changes in each of their net assets for each of the two years in the period then ended and the financial highlights for each of the five years in the period then ended, in conformity with accounting principles generally accepted in the United States of America. These financial statements and financial highlights (hereafter referred to as "financial statements") are the responsibility of the Fidelity Select Portfolios' management. Our responsibility is to express an opinion on these financial statements based on our audits. We conducted our audits of these financial statements in accordance with the standards of the Public Company Accounting Oversight Board (United States). Those standards require that we plan and perform the audit to obtain reasonable assurance about whether the financial statements are free of material misstatement. An audit includes examining, on a test basis, evidence supporting the amounts and disclosures in the financial statements, assessing the accounting principles used and significant estimates made by management, and evaluating the overall financial statement presentation. We believe that our audits, which included confirmation of securities at February 28, 2014 by correspondence with the custodian and brokers, provide a reasonable basis for our opinion.
PricewaterhouseCoopers LLP
Boston, Massachusetts
April 17, 2014
Annual Report
Trustees and Officers
The Trustees and officers of the trust and funds, as applicable, are listed below. The Board of Trustees governs each fund and is responsible for protecting the interests of shareholders. The Trustees are experienced executives who meet periodically throughout the year to oversee each fund's activities, review contractual arrangements with companies that provide services to each fund, oversee management of the risks associated with such activities and contractual arrangements, and review each fund's performance. Except for Ned C. Lautenbach and William S. Stavropoulos, each of the Trustees oversees 74 funds. Mr. Lautenbach and Mr. Stavropoulos each oversees 246 funds.
The Trustees hold office without limit in time except that (a) any Trustee may resign; (b) any Trustee may be removed by written instrument, signed by at least two-thirds of the number of Trustees prior to such removal; (c) any Trustee who requests to be retired or who has become incapacitated by illness or injury may be retired by written instrument signed by a majority of the other Trustees; and (d) any Trustee may be removed at any special meeting of shareholders by a two-thirds vote of the outstanding voting securities of the trust. The officers hold office without limit in time, except that any officer may resign or may be removed by a vote of a majority of the Trustees at any regular meeting or any special meeting of the Trustees. Except as indicated, each individual has held the office shown or other offices in the same company for the past five years.
Experience, Skills, Attributes, and Qualifications of the Funds' Trustees. The Governance and Nominating Committee has adopted a statement of policy that describes the experience, qualifications, attributes, and skills that are necessary and desirable for potential Independent Trustee candidates (Statement of Policy). The Board believes that each Trustee satisfied at the time he or she was initially elected or appointed a Trustee, and continues to satisfy, the standards contemplated by the Statement of Policy. The Governance and Nominating Committee also engages professional search firms to help identify potential Independent Trustee candidates who have the experience, qualifications, attributes, and skills consistent with the Statement of Policy. From time to time, additional criteria based on the composition and skills of the current Independent Trustees, as well as experience or skills that may be appropriate in light of future changes to board composition, business conditions, and regulatory or other developments, have also been considered by the professional search firms and the Governance and Nominating Committee. In addition, the Board takes into account the Trustees' commitment and participation in Board and committee meetings, as well as their leadership of standing and ad hoc committees throughout their tenure.
In determining that a particular Trustee was and continues to be qualified to serve as a Trustee, the Board has considered a variety of criteria, none of which, in isolation, was controlling. The Board believes that, collectively, the Trustees have balanced and diverse experience, qualifications, attributes, and skills, which allow the Board to operate effectively in governing each fund and protecting the interests of shareholders. Information about the specific experience, skills, attributes, and qualifications of each Trustee, which in each case led to the Board's conclusion that the Trustee should serve (or continue to serve) as a trustee of the funds, is provided below.
Board Structure and Oversight Function. Brian B. Hogan is an interested person (as defined in the 1940 Act) and currently serves as Chairman. The Trustees have determined that an interested Chairman is appropriate and benefits shareholders because an interested Chairman has a personal and professional stake in the quality and continuity of services provided to the funds. Independent Trustees exercise their informed business judgment to appoint an individual of their choosing to serve as Chairman, regardless of whether the Trustee happens to be independent or a member of management. The Independent Trustees have determined that they can act independently and effectively without having an Independent Trustee serve as Chairman and that a key structural component for assuring that they are in a position to do so is for the Independent Trustees to constitute a substantial majority for the Board. The Independent Trustees also regularly meet in executive session. Michael E. Wiley serves as Chairman of the Independent Trustees and as such (i) acts as a liaison between the Independent Trustees and management with respect to matters important to the Independent Trustees and (ii) with management prepares agendas for Board meetings.
Fidelity funds are overseen by different Boards of Trustees. The funds' Board oversees Fidelity's sector portfolios. Other Boards oversee Fidelity's equity and high income funds, and Fidelity's investment grade bond, money market, and asset allocation funds. The use of separate Boards, each with its own committee structure, allows the Trustees of each group of Fidelity funds to focus on the unique issues of the funds they oversee, including common research, investment, and operational issues. On occasion, the separate Boards establish joint committees to address issues of overlapping consequences for the Fidelity funds overseen by each Board.
The Trustees operate using a system of committees to facilitate the timely and efficient consideration of all matters of importance to the Trustees, each fund, and fund shareholders and to facilitate compliance with legal and regulatory requirements and oversight of the funds' activities and associated risks. The Board, acting through its committees, has charged SelectCo and its affiliates with (i) identifying events or circumstances the occurrence of which could have demonstrably adverse effects on the funds' business and/or reputation; (ii) implementing processes and controls to lessen the possibility that such events or circumstances occur or to mitigate the effects of such events or circumstances if they do occur; and (iii) creating and maintaining a system designed to evaluate continuously business and market conditions in order to facilitate the identification and implementation processes described in (i) and (ii) above. Because the day-to-day operations and activities of the funds are carried out by or through SelectCo, its affiliates, and other service providers, the funds' exposure to risks is mitigated but not eliminated by the processes overseen by the Trustees. While each of the Board's committees has responsibility for overseeing different aspects of the funds' activities, oversight is exercised primarily through the Operations and Audit Committees. Appropriate personnel, including but not limited to the funds' Chief Compliance Officer (CCO), SelectCo's internal auditor, the independent accountants, the funds' Treasurer and portfolio management personnel, make periodic reports to the Board's committees, as appropriate. The responsibilities of each standing committee, including their oversight responsibilities, are described further under "Standing Committees of the Funds' Trustees."
The funds' Statement of Additional Information (SAI) includes more information about the Trustees. To request a free copy, call Fidelity at 1-800-544-8544.
Annual Report
Interested Trustee*:
Correspondence intended for the Trustee who is an interested person may be sent to Fidelity Investments, 245 Summer Street, Boston, Massachusetts 02210.
Name, Year of Birth; Principal Occupations and Other Relevant Experience+ | |
Brian B. Hogan (1964) | |
Year of Election or Appointment: 2014 Trustee Chairman of the Board of Trustees | |
| Mr. Hogan also serves as Trustee or Vice President of other funds. Mr. Hogan serves as President of FMR's Equity Division (2009-present). Previously, Mr. Hogan served as Senior Vice President, Equity Research of FMR (2006-2009) and as a portfolio manager. |
* Trustee has been determined to be an "Interested Trustee" by virtue of, among other things, his affiliation with the trust or various entities under common control with SelectCo.
+ The information above includes the Trustee's principal occupation during the last five years and other information relating to the experience, attributes, and skills relevant to the Trustee's qualifications to serve as a Trustee, which led to the conclusion that the Trustee should serve as a Trustee for each fund.
Independent Trustees:
Correspondence intended for each Independent Trustee (that is, the Trustees other than the Interested Trustee) may be sent to Fidelity Investments, P.O. Box 55235, Boston, Massachusetts 02205-5235.
Name, Year of Birth; Principal Occupations and Other Relevant Experience+ | |
Ned C. Lautenbach (1944) | |
Year of Election or Appointment: 2000 Trustee | |
| Mr. Lautenbach also serves as Trustee of other Fidelity funds. Mr. Lautenbach currently serves as the Lead Director of the Eaton Corporation Board of Directors (diversified industrial, 1997-present). Mr. Lautenbach is Chairman of the Board of Directors of the Philharmonic Center for the Arts in Naples, Florida (2012-present) and a member of the Council on Foreign Relations (1994-present). Previously, Mr. Lautenbach was a Partner/Advisory Partner at Clayton, Dubilier & Rice, LLC (private equity investment, 1998-2010), as well as a Director of Sony Corporation (2006-2007). |
David A. Rosow (1942) | |
Year of Election or Appointment: 2013 Trustee | |
| Mr. Rosow also serves as Trustee of other Fidelity funds. Mr. Rosow is Chairman and Chief Executive Officer of International Golf Group, Inc. (golf course development, 1989-present). Previously, Mr. Rosow served as Chairman and Chief Executive Officer of Rosow & Company, Inc. (private investment company, 1989-2011), a Lead Director of Hudson United Bancorp (2001-2006) and as a Director of TD Banknorth (1996-2006). In addition, Mr. Rosow is a member (2008-present) and President (2009-present) of the Town Council of Palm Beach, Florida. Mr. Rosow served as a Member of the Advisory Board of other Fidelity funds (2012-2013). |
Garnett A. Smith (1947) | |
Year of Election or Appointment: 2013 Trustee | |
| Mr. Smith also serves as Trustee of other Fidelity funds. Prior to Mr. Smith's retirement, he served as Chairman and Chief Executive Officer of Inbrand Corp. (manufacturer of personal absorbent products, 1990-1997). He also served as President (1986-1990) of Inbrand Corp. Prior to his employment with Inbrand Corp., he was employed by a retail fabric chain and North Carolina National Bank. In addition, Mr. Smith is a board member of the Jackson Hole Land Trust (2009-present). Mr. Smith served as a Member of the Advisory Board of other Fidelity funds (2012-2013). |
William S. Stavropoulos (1939) | |
Year of Election or Appointment: 2001 Trustee | |
| Mr. Stavropoulos also serves as Trustee of other Fidelity funds. Mr. Stavropoulos serves as President and Founder of the Michigan Baseball Foundation, the Great Lakes Loons (2007-present). Mr. Stavropoulos is Chairman Emeritus of the Board of Directors of The Dow Chemical Company, where he previously served in numerous senior management positions, including President, CEO (1995-2000; 2002-2004), Chairman of the Executive Committee (2000-2006), and as a member of the Board of Directors (1990-2006). Currently, Mr. Stavropoulos is Chairman of the Board of Directors of Univar Inc. (global distributor of commodity and specialty chemicals), a Director of Teradata Corporation (data warehousing and technology solutions), and Maersk Inc. (industrial conglomerate), and a member of the Advisory Board for Metalmark Capital LLC (private equity investment, 2005-present). Mr. Stavropoulos is an operating advisor to Clayton, Dubilier & Rice, LLC (private equity investment). In addition, Mr. Stavropoulos is a member of the University of Notre Dame Advisory Council for the College of Science, a Trustee of the Rollin L. Gerstacker Foundation, and a Director of the Naples Philharmonic Center for the Arts. Previously, Mr. Stavropoulos served as a Director of Chemical Financial Corporation (bank holding company, 1993-2012) and Tyco International, Ltd. (multinational manufacturing and services, 2007-2012). |
Michael E. Wiley (1950) | |
Year of Election or Appointment: 2008 Trustee Chairman of the Independent Trustees | |
| Mr. Wiley also serves as Trustee of other Fidelity funds. Mr. Wiley serves as a Director of Asia Pacific Exploration Consolidated (international oil and gas exploration and production, 2008-present). Mr. Wiley serves as a Director of Tesoro Corporation (independent oil refiner and marketer, 2005-present), and a Director of Bill Barrett Corporation (exploration and production, 2005-present). In addition, Mr. Wiley also serves as a Director of Post Oak Bank (privately-held bank, 2004-present). Previously, Mr. Wiley served as a Trustee of other Fidelity funds (2008-2013), as a member of the Board of Trustees of the University of Tulsa (2000-2006; 2007-2010), as a Senior Energy Advisor of Katzenbach Partners, LLC (consulting, 2006-2007), as an Advisory Director of Riverstone Holdings (private investment), Chairman, President, and CEO of Baker Hughes, Inc. (oilfield services, 2000-2004), and as Director of Spinnaker Exploration Company (exploration and production, 2001-2005). |
+ The information above includes each Trustee's principal occupation during the last five years and other information relating to the experience, attributes, and skills relevant to each Trustee's qualifications to serve as a Trustee, which led to the conclusion that each Trustee should serve as a Trustee for each fund.
Officers:
Except for Anthony R. Rochte, correspondence intended for each officer may be sent to Fidelity Investments, 245 Summer Street, Boston, Massachusetts 02210. Correspondence intended for Mr. Rochte may be sent to SelectCo, 1225 17th Street, Denver, Colorado 80202-5541. Officers appear below in alphabetical order.
Name, Year of Birth; Principal Occupation | |
Christopher S. Bartel (1971) | |
Year of Election or Appointment: 2009 Vice President | |
| Mr. Bartel also serves as Vice President of other funds. Mr. Bartel serves as a Director, President, and Chief Executive Officer of Fidelity Management & Research (Japan) Inc. (2012-present), a Director of Fidelity Management & Research (Hong Kong) (2012-present), and Senior Vice President of Global Equity Research (2010-present). Previously, Mr. Bartel served as Senior Vice President of Equity Research (2009-2010), Managing Director of Research (2006-2009), and an analyst and portfolio manager (2000-2006). |
Elizabeth Paige Baumann (1968) | |
Year of Election or Appointment: 2012 Anti-Money Laundering (AML) Officer | |
| Ms. Baumann also serves as AML Officer of other funds. She is Chief AML Officer of FMR LLC (2012-present) and is an employee of Fidelity Investments. Previously, Ms. Baumann served as Vice President and Deputy Anti-Money Laundering Officer (2007-2012). |
Marc Bryant (1966) | |
Year of Election or Appointment: 2013 Secretary | |
| Mr. Bryant also serves as an officer of other funds. He is Senior Vice President and Deputy General Counsel of FMR LLC. Prior to joining Fidelity Investments, Mr. Bryant served as a Senior Vice President and the Head of Global Retail Legal for AllianceBernstein L.P. (2006-2010), and as the General Counsel for ProFund Advisors LLC (2001-2006). |
William C. Coffey (1969) | |
Year of Election or Appointment: 2009 Assistant Secretary | |
| Mr. Coffey also serves as Assistant Secretary of other funds. He is Senior Vice President and Deputy General Counsel of FMR LLC (2010-present), and is an employee of Fidelity Investments. Previously, Mr. Coffey served as Vice President and Associate General Counsel of FMR LLC (2005-2009). |
Jonathan Davis (1968) | |
Year of Election or Appointment: 2010 Assistant Treasurer | |
| Mr. Davis also serves as Assistant Treasurer of other funds. Mr. Davis is an employee of Fidelity Investments. Previously, Mr. Davis served as Vice President and Associate General Counsel of FMR LLC (2003-2010). |
Adrien E. Deberghes (1967) | |
Year of Election or Appointment: 2013 President and Treasurer | |
| Mr. Deberghes also serves as an officer of other funds. He is an employee of Fidelity Investments (2008-present). Prior to joining Fidelity Investments, Mr. Deberghes was Senior Vice President of Mutual Fund Administration at State Street Corporation (2007-2008), Senior Director of Mutual Fund Administration at Investors Bank & Trust (2005-2007), and Director of Finance for Dunkin' Brands (2000-2005). |
Stephanie J. Dorsey (1969) | |
Year of Election or Appointment: 2010 Assistant Treasurer | |
| Ms. Dorsey also serves as an officer of other funds. She is an employee of Fidelity Investments (2008-present) and has served in other fund officer roles. Prior to joining Fidelity Investments, Ms. Dorsey served as Treasurer (2004-2008) of the JPMorgan Mutual Funds and Vice President (2004-2008) of JPMorgan Chase Bank. |
Joseph A. Hanlon (1968) | |
Year of Election or Appointment: 2012 Chief Compliance Officer | |
| Mr. Hanlon also serves as Chief Compliance Officer of other funds. Mr. Hanlon serves as Compliance Officer of FMR, FMR Co., Inc., Fidelity Investments Money Management, Inc. (FIMM), Fidelity Research and Analysis Company (FRAC), and Fidelity Management & Research (Hong Kong) (2009-present), as Senior Vice President of the Fidelity Asset Management Division (2009-present), and is an employee of Fidelity Investments. Previously, Mr. Hanlon served as Compliance Officer of Fidelity Management & Research (Japan) Inc. (2009-2013), Strategic Advisers, Inc. (2009-2013), and Fidelity Management & Research (U.K.) Inc. (2009-2013). |
Brian B. Hogan (1964) | |
Year of Election or Appointment: 2009 Vice President | |
| Mr. Hogan also serves as Trustee or Vice President of other funds. Mr. Hogan serves as President of FMR's Equity Division (2009-present). Previously, Mr. Hogan served as Senior Vice President, Equity Research of FMR (2006-2009) and as a portfolio manager. |
Chris Maher (1972) | |
Year of Election or Appointment: 2013 Assistant Treasurer | |
| Mr. Maher serves as Assistant Treasurer of other funds. Mr. Maher is Vice President of Valuation Oversight and is an employee of Fidelity Investments. Previously, Mr. Maher served as Vice President of Asset Management Compliance (2013), Vice President of FMR's Program Management Group (2010-2013), and Vice President of Valuation Oversight (2008-2010). |
Christine Reynolds (1958) | |
Year of Election or Appointment: 2008 Chief Financial Officer | |
| Ms. Reynolds also serves as Chief Financial Officer of other funds. Ms. Reynolds became President of Fidelity Pricing and Cash Management Services (FPCMS) in August 2008. Ms. Reynolds served as Chief Operating Officer of FPCMS (2007-2008). Previously, Ms. Reynolds served as President, Treasurer, and Anti-Money Laundering officer of the Fidelity funds (2004-2007). |
Kenneth B. Robins (1969) | |
Year of Election or Appointment: 2013 Deputy Treasurer | |
| Mr. Robins also serves as an officer of other funds. Mr. Robins serves as Executive Vice President of Fidelity Investments Money Management, Inc. (FIMM) (2013-present) and is an employee of Fidelity Investments (2004-present). Previously, Mr. Robins served in other fund officer roles. |
Anthony R. Rochte (1968) | |
Year of Election or Appointment: 2013 Vice President | |
| Mr. Rochte also serves as Vice President of other funds. Mr. Rochte serves as President of Fidelity SelectCo, LLC (2012-present) and is an employee of Fidelity Investments (2012-present). Prior to joining Fidelity Investments, Mr. Rochte served as Senior Managing Director and head of State Street Global Advisors' North American Intermediary Business Group (2006-2012). |
Stacie M. Smith (1974) | |
Year of Election or Appointment: 2013 Assistant Treasurer | |
| Ms. Smith also serves as an officer of other funds. She is an employee of Fidelity Investments (2009-present) and has served in other fund officer roles. Prior to joining Fidelity Investments, Ms. Smith served as Senior Audit Manager of Ernst & Young LLP (1996-2009). |
Renee Stagnone (1975) | |
Year of Election or Appointment: 2013 Deputy Treasurer | |
| Ms. Stagnone also serves as Deputy Treasurer of other funds. Ms. Stagnone is an employee of Fidelity Investments. |
Joseph F. Zambello (1957) | |
Year of Election or Appointment: 2011 Deputy Treasurer | |
| Mr. Zambello also serves as Deputy Treasurer of other funds. Mr. Zambello is an employee of Fidelity Investments. Previously, Mr. Zambello served as Vice President of FMR's Program Management Group (2009-2011) and Vice President of the Transfer Agent Oversight Group (2005-2009). |
Annual Report
Distributions (Unaudited)
Telecommunications Portfolio designates 99% and 96% of the dividends distributed in April and December, respectively during the fiscal year as qualifying for the dividends-received deduction for corporate shareholders.
Telecommunications Portfolio designates 100% and 100% of the dividends distributed in April and December, during the fiscal year as amounts which may be taken into account as a dividend for the purposes of the maximum rate under section 1(h)(11) of the Internal Revenue Code.
The fund will notify shareholders in January 2015 of amounts for use in preparing 2014 income tax returns.
Annual Report
Distributions (Unaudited)
The Board of Trustees of Select Wireless Portfolio voted to pay on April 14, 2014 to shareholders of record at the opening of business on April 11, 2014 a distribution of $0.723 per share derived from capital gains realized from sales of portfolio securities and a dividend of $0.472 per share from net investment income.
Wireless Portfolio hereby designates as a capital gain dividend with respect to the taxable year ended February 28, 2014, $17,444,439, or, if subsequently determined to be different, the net capital gain of such year.
Wireless Portfolio designates 66% of the dividends distributed during the fiscal year as qualifying for the dividends-received deduction for corporate shareholders.
Wireless Portfolio designates 100% of the dividends distributed, during the fiscal year as amounts which may be taken into account as a dividend for the purposes of the maximum rate under section 1(h)(11) of the Internal Revenue Code.
The fund will notify shareholders in January 2015 of amounts for use in preparing 2014 income tax returns.
Annual Report
Proxy Voting Results
A special meeting of each fund's shareholders was held on June 18, 2013. The results of votes taken among shareholders on the proposals before them are reported below. Each vote reported represents one dollar of net asset value held on the record date for the meeting.
PROPOSAL 1 | ||
To elect a Board of Trustees.A | ||
| # of | % of |
Ned C. Lautenbach | ||
Affirmative | 25,828,395,115.78 | 94.160 |
Withheld | 1,602,101,684.27 | 5.840 |
TOTAL | 27,430,496,800.05 | 100.000 |
Ronald P. O'Hanley | ||
Affirmative | 25,907,936,922.24 | 94.450 |
Withheld | 1,522,559,877.81 | 5.550 |
TOTAL | 27,430,496,800.05 | 100.000 |
David A. Rosow | ||
Affirmative | 25,805,492,959.91 | 94.076 |
Withheld | 1,625,003,840.14 | 5.924 |
TOTAL | 27,430,496,800.05 | 100.000 |
Garnett A. Smith | ||
Affirmative | 25,892,258,831.97 | 94.393 |
Withheld | 1,538,237,968.08 | 5.607 |
TOTAL | 27,430,496,800.05 | 100.000 |
William S. Stavropoulos | ||
Affirmative | 25,738,476,030.34 | 93.832 |
Withheld | 1,692,020,769.71 | 6.168 |
TOTAL | 27,430,496,800.05 | 100.000 |
Michael E. Wiley | ||
Affirmative | 25,923,640,743.27 | 94.507 |
Withheld | 1,506,856,056.78 | 5.493 |
TOTAL | 27,430,496,800.05 | 100.000 |
PROPOSAL 2 | ||
To approve a management contract between Telecommunications Portfolio and Fidelity SelectCo, LLC. | ||
| # of | % of |
Affirmative | 208,420,238.27 | 81.880 |
Against | 18,588,167.85 | 7.302 |
Abstain | 11,559,235.71 | 4.541 |
Broker Non-Vote | 15,977,976.37 | 6.277 |
TOTAL | 254,545,618.20 | 100.000 |
PROPOSAL 2 | ||
To approve a management contract between Wireless Portfolio and Fidelity SelectCo, LLC. | ||
| # of | % of |
Affirmative | 116,732,866.32 | 85.558 |
Against | 6,812,323.22 | 4.993 |
Abstain | 6,212,494.28 | 4.554 |
Broker Non-Vote | 6,679,851.60 | 4.895 |
TOTAL | 136,437,535.42 | 100.000 |
A Denotes trust-wide proposal and voting results. | ||
Annual Report
Fidelity®
Select Portfolios®
Materials Sector
Chemicals Portfolio
Gold Portfolio
Materials Portfolio
Annual Report
February 28, 2014
(Fidelity Cover Art)
Contents
Chemicals | Performance | |
| Management's Discussion | |
| Shareholder Expense Example | |
| Investment Changes | |
| Investments | |
| Financial Statements | |
| Notes to the Financial Statements | |
Gold | Performance | |
| Management's Discussion | |
| Shareholder Expense Example | |
| Consolidated Investment Changes | |
| Consolidated Investments | |
| Consolidated Financial Statements | |
| Notes to the Consolidated Financial Statements | |
Materials | Performance | |
| Management's Discussion | |
| Shareholder Expense Example | |
| Investment Changes | |
| Investments | |
| Financial Statements | |
| Notes to the Financial Statements | |
Report of Independent Registered Public Accounting Firm |
| |
Trustees and Officers |
| |
Distributions |
| |
Proxy Voting Results |
|
To view a fund's proxy voting guidelines and proxy voting record for the 12-month period ended June 30, visit http://www.fidelity.com/proxyvotingresults or visit the Securities and Exchange Commission's (SEC) web site at http://www.sec.gov. You may also call 1-800-544-8544 to request a free copy of the proxy voting guidelines.
Standard & Poor's, S&P and S&P 500 are registered service marks of The McGraw-Hill Companies, Inc. and have been licensed for use by Fidelity Distributors Corporation.
Other third-party marks appearing herein are the property of their respective owners.
All other marks appearing herein are registered or unregistered trademarks or service marks of FMR LLC or an affiliated company. © 2014 FMR LLC. All rights reserved.
This report and the financial statements contained herein are submitted for the general information of the shareholders of the funds. This report is not authorized for distribution to prospective investors in the funds unless preceded or accompanied by an effective prospectus.
A fund files its complete schedule of portfolio holdings with the SEC for the first and third quarters of each fiscal year on Form N-Q. Forms N-Q are available on the SEC's web site at http://www.sec.gov. A fund's Forms N-Q may be reviewed and copied at the SEC's Public Reference Room in Washington, DC. Information regarding the operation of the SEC's Public Reference Room may be obtained by calling 1-800-SEC-0330. For a complete list of a fund's portfolio holdings, view the most recent holdings listing, semiannual report, or annual report on Fidelity's web site at http://www.fidelity.com, http://www.advisor.fidelity.com, or http://www.401k.com, as applicable.
NOT FDIC INSURED • MAY LOSE VALUE • NO BANK GUARANTEE
Neither the funds nor Fidelity Distributors Corporation is a bank.
Annual Report
Chemicals Portfolio
Performance: The Bottom Line
Average annual total return reflects the change in the value of an investment, assuming reinvestment of the fund's distributions from dividend income and capital gains (the profits earned upon the sale of securities that have grown in value, if any) and assuming a constant rate of performance each year. The $10,000 table and the fund's returns do not reflect the deduction of taxes that a shareholder would pay on fund distributions or the redemption of fund shares. During periods of reimbursement by Fidelity, a fund's total return will be greater than it would be had the reimbursement not occurred. How a fund did yesterday is no guarantee of how it will do tomorrow.
Average Annual Total Returns
Periods ended February 28, 2014 | Past 1 | Past 5 | Past 10 |
Chemicals Portfolio | 27.77% | 32.09% | 15.57% |
$10,000 Over 10 Years
Let's say hypothetically that $10,000 was invested in Chemicals Portfolio on February 29, 2004. The chart shows how the value of your investment would have changed, and also shows how the S&P 500® Index performed over the same period.
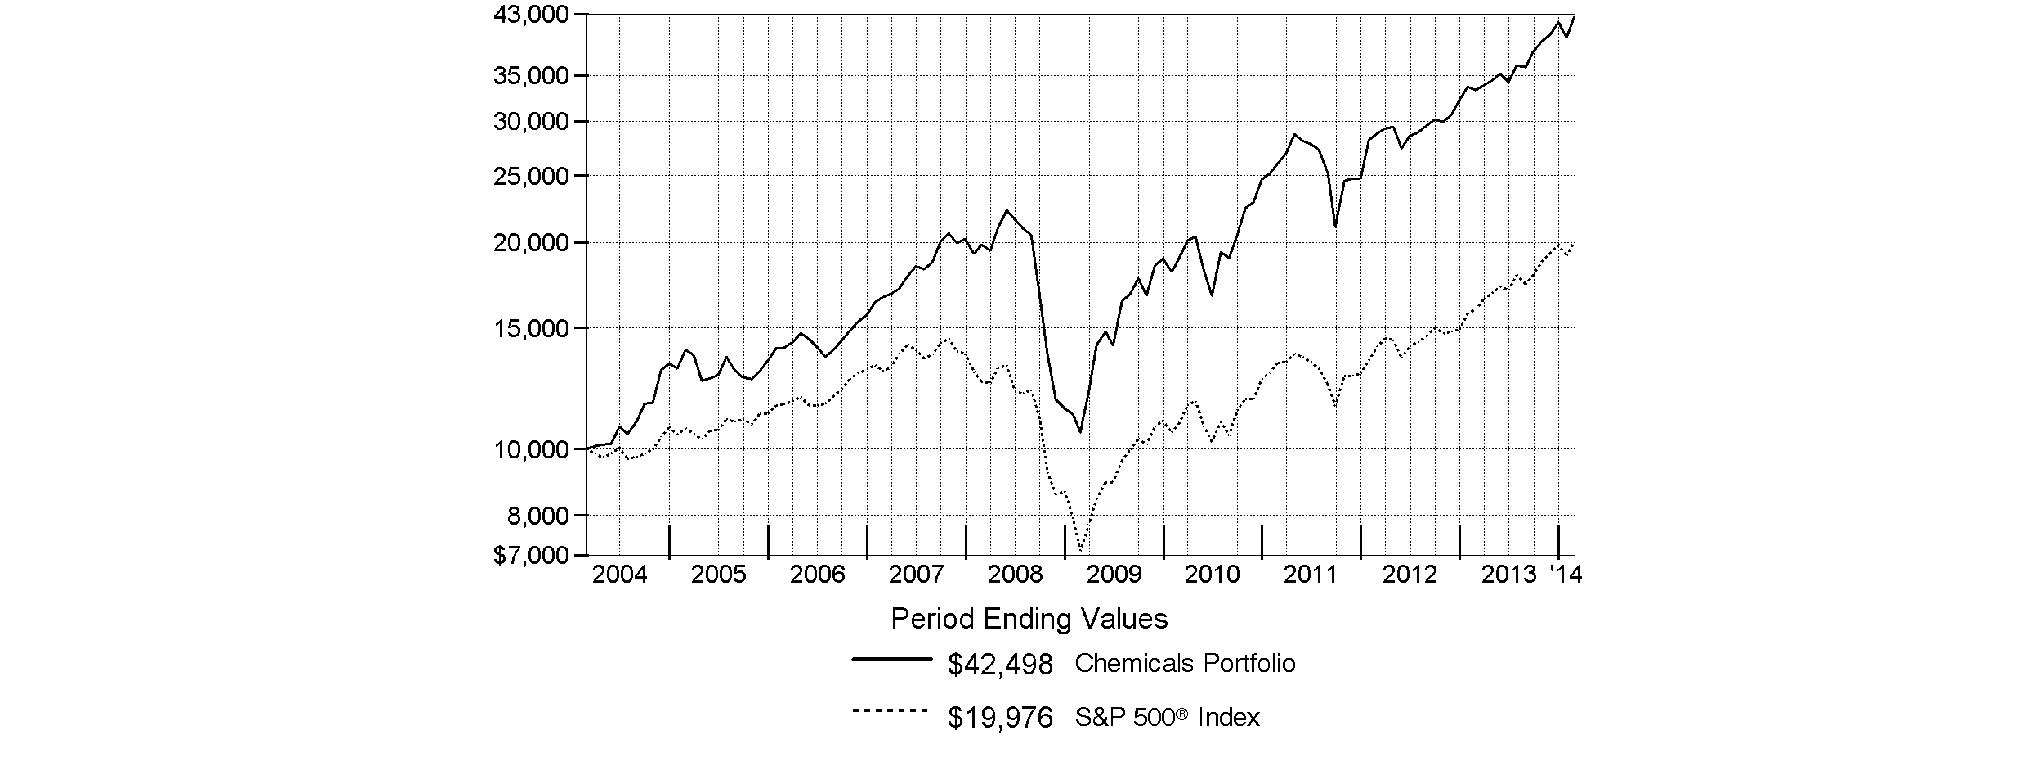
Annual Report
Chemicals Portfolio
Management's Discussion of Fund Performance
Market Recap: Stocks overcame fears of higher interest rates - not to mention their worst January in four years - to finish sharply higher for the 12 months ending February 28, 2014. The broad S&P 500® Index and the blue-chip Dow Jones Industrial AverageSM gained 25.37% and 19.01%, respectively, amid generally favorable earnings reports and accommodative monetary policies worldwide. Performance generally increased along the risk spectrum, with smaller-cap and growth strategies leading the way. An ebullient market helped the growth-oriented Nasdaq Composite Index® to a 38.10% period gain, for example. On the other hand, both cyclical and defensive stocks had representation in the top-performing industry sectors: returns were highest in health care and consumer discretionary; lowest in utilities and telecommunication services. From a macroeconomic perspective, data still points to slow but steady improvement in the U.S., and Europe's recession may well be over. Reports from China have disappointed, but continue to suggest a relatively soft landing there. Mixed signals from the U.S. Federal Reserve as to when it might curtail its stimulative bond buying kept markets in flux during the spring and summer. Stocks regained momentum in October despite a federal budget impasse and brief government shutdown, and lower volatility prevailed through year-end. Shedding new-year concerns about China's economy, an emerging-markets sell-off and confirmation (at last) of Fed tapering - alongside confirmation of a presumably dovish Janet Yellen as new Fed chair - February saw stocks back in record territory, bearing down on the five-year anniversary of the market's bottom.
Comments from Mahmoud Sharaf, Portfolio Manager of Chemicals Portfolio: For the year, the fund returned 27.77%, underperforming the 29.90% gain of the MSCI® U.S. IMI Chemicals 25-50 Index, but outpacing the broad-based S&P 500®. Last summer, activist hedge fund managers announced they would take large stakes in industry benchmark names DuPont and Air Products & Chemicals, which bolstered shares of each firm. Consequently, underweighting DuPont and largely avoiding Air Products were costly to performance. I continued to be wary of Air Products, so I sold it from the fund. Speculation that Dow Chemical also would be a target of activist investors pushed its share price up, to the detriment of the fund. This speculation was realized in January 2014, and our sizable underweighting in this major benchmark component was the biggest relative detractor for the year. The fund's cash position - which was high at times due to strong periodic inflows into the fund over the past year - was another drag on performance in an up market. Conversely, largely avoiding Mosaic, one of the world's largest publicly traded potash companies, was easily the fund's biggest relative contributor. Shares of Mosaic plummeted in late July, when Russian potash giant Uralkali exited from Belarusian Potash - a game-changer for the potash industry. I sold Mosaic before period end because I was bearish on agricultural fundamentals. Elsewhere, I continued to look for investments based on my belief that U.S. chemicals companies have an advantage over global producers due to cheap domestic natural gas prices relative to high international Brent crude oil prices. Netherlands-based LyondellBasell, one of the largest commodity chemicals firms in the world, fit this thesis and an overweighted position was helpful this period.
The views expressed above reflect those of the portfolio manager(s) only through the end of the period as stated on the cover of this report and do not necessarily represent the views of Fidelity or any other person in the Fidelity organization. Any such views are subject to change at any time based upon market or other conditions and Fidelity disclaims any responsibility to update such views. These views may not be relied on as investment advice and, because investment decisions for a Fidelity fund are based on numerous factors, may not be relied on as an indication of trading intent on behalf of any Fidelity fund.
Annual Report
Chemicals Portfolio
Shareholder Expense Example
As a shareholder of the Fund, you incur two types of costs: (1) transaction costs, including redemption fees and (2) ongoing costs, including management fees and other Fund expenses. This Example is intended to help you understand your ongoing costs (in dollars) of investing in the Fund and to compare these costs with the ongoing costs of investing in other mutual funds.
The Example is based on an investment of $1,000 invested at the beginning of the period and held for the entire period (September 1, 2013 to February 28, 2014).
Actual Expenses
The first line of the accompanying table provides information about actual account values and actual expenses. You may use the information in this line, together with the amount you invested, to estimate the expenses that you paid over the period. Simply divide your account value by $1,000.00 (for example, an $8,600 account value divided by $1,000.00 = 8.6), then multiply the result by the number in the first line under the heading entitled "Expenses Paid During Period" to estimate the expenses you paid on your account during this period. A small balance maintenance fee of $12.00 that is charged once a year may apply for certain accounts with a value of less than $2,000. This fee is not included in the table below. If it was, the estimate of expenses you paid during the period would be higher, and your ending account value lower, by this amount. In addition, the Fund, as a shareholder in the underlying Fidelity Central Funds, will indirectly bear its pro-rata share of the fees and expenses incurred by the underlying Fidelity Central Funds. These fees and expenses are not included in the Fund's annualized expense ratio used to calculate the expense estimate in the table below.
Hypothetical Example for Comparison Purposes
The second line of the accompanying table provides information about hypothetical account values and hypothetical expenses based on the Fund's actual expense ratio and an assumed rate of return of 5% per year before expenses, which is not the Fund's actual return. The hypothetical account values and expenses may not be used to estimate the actual ending account balance or expenses you paid for the period. You may use this information to compare the ongoing costs of investing in the Fund and other funds. To do so, compare this 5% hypothetical example with the 5% hypothetical examples that appear in the shareholder reports of the other funds. A small balance maintenance fee of $12.00 that is charged once a year may apply for certain accounts with a value of less than $2,000. This fee is not included in the table below. If it was, the estimate of expenses you paid during the period would be higher, and your ending account value lower, by this amount. In addition, the Fund, as a shareholder in the underlying Fidelity Central Funds, will indirectly bear its pro-rata share of the fees and expenses incurred by the underlying Fidelity Central Funds. These fees and expenses are not included in the Fund's annualized expense ratio used to calculate the expense estimate in the table below.
Please note that the expenses shown in the table are meant to highlight your ongoing costs only and do not reflect any transaction costs. Therefore, the second line of the table is useful in comparing ongoing costs only, and will not help you determine the relative total costs of owning different funds. In addition, if these transactional costs were included, your costs would have been higher.
| Annualized | Beginning | Ending | Expenses Paid |
Actual | .80% | $ 1,000.00 | $ 1,183.40 | $ 4.33 |
HypotheticalA |
| $ 1,000.00 | $ 1,020.83 | $ 4.01 |
A 5% return per year before expenses
B Annualized expense ratio reflects expenses net of applicable fee waivers.
* Expenses are equal to the Fund's annualized expense ratio, multiplied by the average account value over the period, multiplied by 181/365 (to reflect the one-half year period).
Annual Report
Chemicals Portfolio
Investment Changes (Unaudited)
Top Ten Stocks as of February 28, 2014 | ||
| % of fund's | % of fund's net assets |
E.I. du Pont de Nemours & Co. | 9.8 | 5.7 |
LyondellBasell Industries NV Class A | 9.5 | 9.4 |
Monsanto Co. | 8.2 | 9.1 |
Eastman Chemical Co. | 6.5 | 7.5 |
Praxair, Inc. | 6.5 | 9.2 |
The Dow Chemical Co. | 5.7 | 2.7 |
CF Industries Holdings, Inc. | 4.9 | 4.3 |
Ecolab, Inc. | 4.7 | 7.6 |
Celanese Corp. Class A | 4.3 | 1.6 |
PPG Industries, Inc. | 3.5 | 4.4 |
| 63.6 | |
Top Industries (% of fund's net assets) | |||
As of February 28, 2014 | |||
| Chemicals | 91.8% |
|
| Marine | 1.0% |
|
| Oil, Gas & Consumable Fuels | 0.8% |
|
| Diversified Financial Services | 0.1% |
|
| Commercial Services & Supplies** | 0.0% |
|
| All Others* | 6.3% |
|

As of August 31, 2013 | |||
| Chemicals | 95.9% |
|
| Oil, Gas & Consumable Fuels | 0.5% |
|
| Diversified Financial Services | 0.1% |
|
| Commercial Services & Supplies | 0.1% |
|
| Machinery | 0.1% |
|
| All Others* | 3.3% |
|

* Includes short-term investments and net other assets (liabilities). |
** Amount represents less than 0.1%. |
Annual Report
Chemicals Portfolio
Investments February 28, 2014
Showing Percentage of Net Assets
Common Stocks - 93.7% | |||
Shares | Value | ||
BUILDING PRODUCTS - 0.0% | |||
Building Products - 0.0% | |||
Ply Gem Holdings, Inc. | 13 | $ 167 | |
CHEMICALS - 91.8% | |||
Commodity Chemicals - 15.9% | |||
Axiall Corp. | 680,636 | 27,545,339 | |
Cabot Corp. | 579,288 | 31,362,652 | |
Koppers Holdings, Inc. | 383,505 | 15,163,788 | |
Kronos Worldwide, Inc. | 353,919 | 5,407,882 | |
LyondellBasell Industries NV Class A | 1,542,022 | 135,821,298 | |
Methanex Corp. | 100,400 | 7,036,070 | |
OCI Partners LP | 157,665 | 3,903,785 | |
Tronox Ltd. Class A | 41,500 | 983,135 | |
| 227,223,949 | ||
Diversified Chemicals - 25.8% | |||
Arkema SA | 22,639 | 2,462,391 | |
E.I. du Pont de Nemours & Co. | 2,091,300 | 139,322,404 | |
Eastman Chemical Co. | 1,070,051 | 93,554,559 | |
FMC Corp. | 119,200 | 9,199,856 | |
Huntsman Corp. | 1,747,600 | 42,571,536 | |
The Dow Chemical Co. | 1,660,630 | 80,889,287 | |
| 368,000,033 | ||
Fertilizers & Agricultural Chemicals - 13.1% | |||
CF Industries Holdings, Inc. | 281,230 | 70,560,607 | |
Monsanto Co. | 1,062,349 | 116,879,637 | |
| 187,440,244 | ||
Industrial Gases - 8.0% | |||
Airgas, Inc. | 202,300 | 21,807,940 | |
Praxair, Inc. | 713,821 | 93,060,844 | |
| 114,868,784 | ||
Specialty Chemicals - 29.0% | |||
Albemarle Corp. | 67,839 | 4,476,696 | |
Ashland, Inc. | 433,550 | 40,914,114 | |
Celanese Corp. Class A | 1,145,979 | 61,183,819 | |
Chemtura Corp. (a) | 42,485 | 1,051,504 | |
Cytec Industries, Inc. | 32,580 | 3,084,349 | |
Ecolab, Inc. | 618,899 | 66,686,367 | |
Ferro Corp. (a) | 2,347,853 | 30,803,831 | |
Innophos Holdings, Inc. | 72,547 | 3,984,281 | |
PPG Industries, Inc. | 254,804 | 50,405,327 | |
RPM International, Inc. | 1,054,279 | 44,132,119 | |
Sigma Aldrich Corp. | 489,905 | 46,251,931 | |
W.R. Grace & Co. (a) | 496,484 | 50,313,689 | |
Wacker Chemie AG | 82,429 | 11,133,055 | |
| 414,421,082 | ||
TOTAL CHEMICALS | 1,311,954,092 | ||
| |||
Shares | Value | ||
COMMERCIAL SERVICES & SUPPLIES - 0.0% | |||
Environmental & Facility Services - 0.0% | |||
Swisher Hygiene, Inc. (Canada) (a) | 1,500 | $ 735 | |
DIVERSIFIED FINANCIAL SERVICES - 0.1% | |||
Other Diversified Financial Services - 0.1% | |||
Quinpario Acquisition Corp. unit | 150,000 | 1,525,500 | |
MARINE - 1.0% | |||
Marine - 1.0% | |||
DryShips, Inc. (a)(d) | 3,751,468 | 13,805,402 | |
OIL, GAS & CONSUMABLE FUELS - 0.8% | |||
Oil & Gas Storage & Transport - 0.8% | |||
BW LPG Ltd. (a) | 1 | 11 | |
Golar LNG Ltd. (NASDAQ) | 201,500 | 7,374,900 | |
Hoegh LNG Holdings Ltd. (a) | 539,270 | 4,420,541 | |
StealthGas, Inc. (a) | 39 | 410 | |
Valero Energy Partners LP | 6,100 | 225,639 | |
| 12,021,501 | ||
TOTAL COMMON STOCKS (Cost $932,162,865) |
| ||
Money Market Funds - 3.0% | |||
|
|
|
|
Fidelity Cash Central Fund, 0.10% (b) | 37,428,038 | 37,428,038 | |
Fidelity Securities Lending Cash Central Fund, 0.09% (b)(c) | 6,029,625 | 6,029,625 | |
TOTAL MONEY MARKET FUNDS (Cost $43,457,663) |
| ||
TOTAL INVESTMENT PORTFOLIO - 96.7% (Cost $975,620,528) | 1,382,765,060 | ||
NET OTHER ASSETS (LIABILITIES) - 3.3% | 46,668,680 | ||
NET ASSETS - 100% | $ 1,429,433,740 | ||
Legend |
(a) Non-income producing |
(b) Affiliated fund that is generally available only to investment companies and other accounts managed by Fidelity Investments. The rate quoted is the annualized seven-day yield of the fund at period end. A complete unaudited listing of the fund's holdings as of its most recent quarter end is available upon request. In addition, each Fidelity Central Fund's financial statements, which are not covered by the Fund's Report of Independent Registered Public Accounting Firm, are available on the SEC's website or upon request. |
(c) Investment made with cash collateral received from securities on loan. |
(d) Security or a portion of the security is on loan at period end. |
Affiliated Central Funds |
Information regarding fiscal year to date income earned by the Fund from investments in Fidelity Central Funds is as follows: |
Fund | Income earned |
Fidelity Cash Central Fund | $ 31,421 |
Fidelity Securities Lending Cash Central Fund | 247,915 |
Total | $ 279,336 |
Other Information |
All investments are categorized as Level 1 under the Fair Value Hierarchy. The inputs or methodology used for valuing securities may not be an indication of the risk associated with investing in those securities. For more information on valuation inputs, please refer to the Investment Valuation section in the accompanying Notes to Financial Statements. |
Distribution of investments by country or territory of incorporation, as a percentage of total net assets, is as follows (Unaudited): |
United States of America | 87.1% |
Netherlands | 9.5% |
Marshall Islands | 1.0% |
Others (Individually Less Than 1%) | 2.4% |
| 100.0% |
See accompanying notes which are an integral part of the financial statements.
Annual Report
Chemicals Portfolio
Financial Statements
Statement of Assets and Liabilities
| February 28, 2014 | |
|
|
|
Assets | ||
Investment in securities, at value (including securities loaned of $5,917,072) - See accompanying schedule: Unaffiliated issuers (cost $932,162,865) | $ 1,339,307,397 |
|
Fidelity Central Funds (cost $43,457,663) | 43,457,663 |
|
Total Investments (cost $975,620,528) |
| $ 1,382,765,060 |
Receivable for investments sold | 51,183,997 | |
Receivable for fund shares sold | 27,383,177 | |
Dividends receivable | 2,525,593 | |
Distributions receivable from Fidelity Central Funds | 2,742 | |
Prepaid expenses | 6,200 | |
Other receivables | 47,101 | |
Total assets | 1,463,913,870 | |
|
|
|
Liabilities | ||
Payable for investments purchased | $ 23,470,043 | |
Payable for fund shares redeemed | 4,010,483 | |
Accrued management fee | 628,625 | |
Other affiliated payables | 268,295 | |
Other payables and accrued expenses | 73,059 | |
Collateral on securities loaned, at value | 6,029,625 | |
Total liabilities | 34,480,130 | |
|
|
|
Net Assets | $ 1,429,433,740 | |
Net Assets consist of: |
| |
Paid in capital | $ 989,791,502 | |
Undistributed net investment income | 2,509,218 | |
Accumulated undistributed net realized gain (loss) on investments and foreign currency transactions | 29,998,847 | |
Net unrealized appreciation (depreciation) on investments and assets and liabilities in foreign currencies | 407,134,173 | |
Net Assets, for 9,643,472 shares outstanding | $ 1,429,433,740 | |
Net Asset Value, offering price and redemption price per share ($1,429,433,740 ÷ 9,643,472 shares) | $ 148.23 | |
Statement of Operations
| Year ended February 28, 2014 | |
|
|
|
Investment Income |
|
|
Dividends |
| $ 20,894,382 |
Interest |
| 46,960 |
Income from Fidelity Central Funds |
| 279,336 |
Total income |
| 21,220,678 |
|
|
|
Expenses | ||
Management fee | $ 6,849,444 | |
Transfer agent fees | 2,527,976 | |
Accounting and security lending fees | 401,422 | |
Custodian fees and expenses | 31,350 | |
Independent trustees' compensation | 23,712 | |
Registration fees | 128,096 | |
Audit | 52,431 | |
Legal | 18,914 | |
Interest | 1,245 | |
Miscellaneous | 13,255 | |
Total expenses before reductions | 10,047,845 | |
Expense reductions | (148,198) | 9,899,647 |
Net investment income (loss) | 11,321,031 | |
Realized and Unrealized Gain (Loss) Net realized gain (loss) on: | ||
Investment securities: |
|
|
Unaffiliated issuers | 106,729,339 | |
Foreign currency transactions | (292,574) | |
Total net realized gain (loss) |
| 106,436,765 |
Change in net unrealized appreciation (depreciation) on: Investment securities | 180,552,850 | |
Assets and liabilities in foreign currencies | 6,367 | |
Total change in net unrealized appreciation (depreciation) |
| 180,559,217 |
Net gain (loss) | 286,995,982 | |
Net increase (decrease) in net assets resulting from operations | $ 298,317,013 | |
See accompanying notes which are an integral part of the financial statements.
Annual Report
Chemicals Portfolio
Financial Statements - continued
Statement of Changes in Net Assets
| Year ended | Year ended |
Increase (Decrease) in Net Assets |
|
|
Operations |
|
|
Net investment income (loss) | $ 11,321,031 | $ 14,446,667 |
Net realized gain (loss) | 106,436,765 | 32,143,140 |
Change in net unrealized appreciation (depreciation) | 180,559,217 | 74,637,127 |
Net increase (decrease) in net assets resulting from operations | 298,317,013 | 121,226,934 |
Distributions to shareholders from net investment income | (11,058,506) | (11,402,559) |
Distributions to shareholders from net realized gain | (65,324,116) | (21,839,025) |
Total distributions | (76,382,622) | (33,241,584) |
Share transactions | 719,398,651 | 548,680,903 |
Reinvestment of distributions | 73,918,871 | 32,252,680 |
Cost of shares redeemed | (720,642,710) | (395,723,811) |
Net increase (decrease) in net assets resulting from share transactions | 72,674,812 | 185,209,772 |
Redemption fees | 47,042 | 43,229 |
Total increase (decrease) in net assets | 294,656,245 | 273,238,351 |
|
|
|
Net Assets | ||
Beginning of period | 1,134,777,495 | 861,539,144 |
End of period (including undistributed net investment income of $2,509,218 and undistributed net investment income of $3,006,684, respectively) | $ 1,429,433,740 | $ 1,134,777,495 |
Other Information Shares | ||
Sold | 5,317,546 | 4,641,695 |
Issued in reinvestment of distributions | 540,024 | 277,790 |
Redeemed | (5,441,546) | (3,487,085) |
Net increase (decrease) | 416,024 | 1,432,400 |
Financial Highlights
Years ended February 28, | 2014 | 2013 | 2012 H | 2011 | 2010 |
Selected Per-Share Data |
|
|
|
|
|
Net asset value, beginning of period | $ 122.98 | $ 110.52 | $ 100.85 | $ 75.43 | $ 42.74 |
Income from Investment Operations |
|
|
|
|
|
Net investment income (loss) B | 1.23 | 1.84 E | .76 | .69 | 1.00 F |
Net realized and unrealized gain (loss) | 32.11 | 15.10 | 9.52 | 27.20 | 32.77 |
Total from investment operations | 33.34 | 16.94 | 10.28 | 27.89 | 33.77 |
Distributions from net investment income | (1.18) | (1.55) | (.62) | (.57) | (1.08) |
Distributions from net realized gain | (6.92) | (2.95) | - | (1.91) | - |
Total distributions | (8.10) | (4.49) J | (.62) | (2.47) K | (1.08) |
Redemption fees added to paid in capital B | .01 | .01 | .01 | - I | - I |
Net asset value, end of period | $ 148.23 | $ 122.98 | $ 110.52 | $ 100.85 | $ 75.43 |
Total Return A | 27.77% | 15.61% | 10.31% | 37.74% | 79.15% |
Ratios to Average Net Assets C, G |
|
|
|
|
|
Expenses before reductions | .81% | .83% | .85% | .90% | .96% |
Expenses net of fee waivers, if any | .81% | .83% | .85% | .90% | .96% |
Expenses net of all reductions | .80% | .81% | .84% | .89% | .95% |
Net investment income (loss) | .91% | 1.62% E | .77% | .84% | 1.53% F |
Supplemental Data |
|
|
|
|
|
Net assets, end of period (000 omitted) | $ 1,429,434 | $ 1,134,777 | $ 861,539 | $ 692,332 | $ 417,761 |
Portfolio turnover rate D | 109% | 60% | 119% | 108% | 228% |
ATotal returns would have been lower if certain expenses had not been reduced during the applicable periods shown. BCalculated based on average shares outstanding during the period. CFees and expenses of any underlying Fidelity Central Funds are not included in the Fund's expense ratio. The Fund indirectly bears its proportionate share of the expenses of any underlying Fidelity Central Funds. DAmount does not include the portfolio activity of any underlying Fidelity Central Funds. EInvestment income per share reflects a large, non-recurring dividend which amounted to $.30 per share. Excluding this non-recurring dividend, the ratio of net investment income (loss) to average net assets would have been 1.35%. FInvestment income per share reflects a large, non-recurring dividend which amounted to $.18 per share. Excluding this non-recurring dividend, the ratio of net investment income (loss) to average net assets would have been 1.25%. GExpense ratios reflect operating expenses of the Fund. Expenses before reductions do not reflect amounts reimbursed by the investment adviser or reductions from brokerage service arrangements or reductions from other expense offset arrangements and do not represent the amount paid by the Fund during periods when reimbursements or reductions occur. Expenses net of fee waivers reflect expenses after reimbursement by the investment adviser but prior to reductions from brokerage service arrangements or other expense offset arrangements. Expenses net of all reductions represent the net expenses paid by the Fund. HFor the year ended February 29. IAmount represents less than $.01 per share. JTotal distributions of $4.49 per share is comprised of distributions from net investment income of $1.547 and distributions from net realized gain of $2.947 per share. KTotal distributions of $2.47 per share is comprised of distributions from net investment income of $.565 and distributions from net realized gain of $1.905 per share. |
See accompanying notes which are an integral part of the financial statements.
Annual Report
Notes to Financial Statements
For the period ended February 28, 2014
1. Organization.
Chemicals Portfolio (the Fund) is a non-diversified fund of Fidelity Select Portfolios (the Trust) and is authorized to issue an unlimited number of shares. The Trust is registered under the Investment Company Act of 1940, as amended (the 1940 Act), as an open-end management investment company organized as a Massachusetts business trust. The Fund invests primarily in securities of companies whose principal business activities fall within specific industries.
2. Investments in Fidelity Central Funds.
The Fund invests in Fidelity Central Funds, which are open-end investment companies generally available only to other investment companies and accounts managed by the investment adviser and its affiliates. The Fund's Schedule of Investments lists each of the Fidelity Central Funds held as of period end, if any, as an investment of the Fund, but does not include the underlying holdings of each Fidelity Central Fund. As an Investing Fund, the Fund indirectly bears its proportionate share of the expenses of the underlying Fidelity Central Funds.
The Money Market Central Funds seek preservation of capital and current income and are managed by Fidelity Investments Money Management, Inc. (FIMM), an affiliate of the investment adviser. Annualized expenses of the Money Market Central Funds as of their most recent shareholder report date are less than .01%.
A complete unaudited list of holdings for each Fidelity Central Fund is available upon request or at the Securities and Exchange Commission (the SEC) website at www.sec.gov. In addition, the financial statements of the Fidelity Central Funds, which are not covered by the Fund's Report of Independent Registered Public Accounting Firm, are available on the SEC website or upon request.
3. Significant Accounting Policies.
The financial statements have been prepared in conformity with accounting principles generally accepted in the United States of America (GAAP), which require management to make certain estimates and assumptions at the date of the financial statements. Actual results could differ from those estimates. Subsequent events, if any, through the date that the financial statements were issued have been evaluated in the preparation of the financial statements. The following summarizes the significant accounting policies of the Fund:
Investment Valuation. Investments are valued as of 4:00 p.m. Eastern time on the last calendar day of the period. In accordance with valuation policies and procedures approved by the Board of Trustees (the Board), the Fund attempts to obtain prices from one or more third party pricing vendors or brokers to value its investments. When current market prices, quotations or currency exchange rates are not readily available or reliable, investments will be fair valued in good faith by the Fidelity SelectCo, LLC (SelectCo) Fair Value Committee (the Committee), in accordance with procedures adopted by the Board. Factors used in determining fair value vary by investment type and may include market or investment specific events. The frequency with which these procedures are used cannot be predicted and they may be utilized to a significant extent. The Committee oversees the Fund's valuation policies and procedures and is responsible for approving and reporting to the Board all fair value determinations.
The Fund categorizes the inputs to valuation techniques used to value its investments into a disclosure hierarchy consisting of three levels as shown below:
Level 1 - quoted prices in active markets for identical investments
Level 2 - other significant observable inputs (including quoted prices for similar investments, interest rates, prepayment speeds, etc.)
Level 3 - unobservable inputs (including the Fund's own assumptions based on the best information available)
Valuation techniques used to value the Fund's investments by major category are as follows:
Equity securities, including restricted securities, for which market quotations are readily available, are valued at the last reported sale price or official closing price as reported by a third party pricing vendor on the primary market or exchange on which they are traded and are categorized as Level 1 in the hierarchy. In the event there were no sales during the day or closing prices are not available, securities are valued at the last quoted bid price or may be valued using the last available price and are generally categorized as Level 2 in the hierarchy. For foreign equity securities, when market or security specific events arise, comparisons to the valuation of American Depositary Receipts (ADRs), futures contracts, Exchange-Traded Funds (ETFs) and certain indexes as well as quoted prices for similar securities may be used and would be categorized as Level 2 in the hierarchy. Utilizing these techniques may result in transfers between Level 1 and Level 2. For equity securities, including restricted securities, where observable inputs are limited, assumptions about market activity and risk are used and these securities may be categorized as Level 3 in the hierarchy.
Investments in open-end mutual funds, including the Fidelity Central Funds, are valued at their closing net asset value (NAV) each business day and are categorized as Level 1 in the hierarchy.
Changes in valuation techniques may result in transfers in or out of an assigned level within the disclosure hierarchy.
Annual Report
Notes to Financial Statements - continued
3. Significant Accounting Policies - continued
Foreign Currency. The Fund may use foreign currency contracts to facilitate transactions in foreign-denominated securities. Gains and losses from these transactions may arise from changes in the value of the foreign currency or if the counterparties do not perform under the contracts' terms.
Foreign-denominated assets, including investment securities, and liabilities are translated into U.S. dollars at the exchange rates at period end. Purchases and sales of investment securities, income and dividends received and expenses denominated in foreign currencies are translated into U.S. dollars at the exchange rate in effect on the transaction date.
The effects of exchange rate fluctuations on investments are included with the net realized and unrealized gain (loss) on investment securities. Other foreign currency transactions resulting in realized and unrealized gain (loss) are disclosed separately.
Investment Transactions and Income. For financial reporting purposes, the Fund's investment holdings and NAV include trades executed through the end of the last business day of the period. The NAV per share for processing shareholder transactions is calculated as of the close of business of the New York Stock Exchange (NYSE), normally 4:00 p.m. Eastern time and includes trades executed through the end of the prior business day. Gains and losses on securities sold are determined on the basis of identified cost and may include proceeds received from litigation. Dividend income is recorded on the ex-dividend date, except for certain dividends from foreign securities where the ex-dividend date may have passed, which are recorded as soon as the Fund is informed of the ex-dividend date. Non-cash dividends included in dividend income, if any, are recorded at the fair market value of the securities received. Distributions received on securities that represent a return of capital or capital gain are recorded as a reduction of cost of investments and/or as a realized gain. Subsequent to ex-dividend date the Fund determines the components of these distributions, based upon receipt of tax filings or other correspondence relating to the underlying investment. Interest income and distributions from the Fidelity Central Funds are accrued as earned. Interest income includes coupon interest and amortization of premium and accretion of discount on debt securities. Investment income is recorded net of foreign taxes withheld where recovery of such taxes is uncertain.
Expenses. Expenses directly attributable to a fund are charged to that fund. Expenses attributable to more than one fund are allocated among the respective funds on the basis of relative net assets or other appropriate methods. Expense estimates are accrued in the period to which they relate and adjustments are made when actual amounts are known.
Deferred Trustee Compensation. Under a Deferred Compensation Plan (the Plan), independent Trustees may elect to defer receipt of a portion of their annual compensation. Deferred amounts are invested in a cross-section of Fidelity funds, are marked-to-market and remain in the Fund until distributed in accordance with the Plan. The investment of deferred amounts and the offsetting payable to the Trustees are included in the accompanying Statement of Assets and Liabilities.
Income Tax Information and Distributions to Shareholders. Each year, the Fund intends to qualify as a regulated investment company under Subchapter M of the Internal Revenue Code, including distributing substantially all of its taxable income and realized gains. As a result, no provision for U.S. Federal income taxes is required. As of February 28, 2014, the Fund did not have any unrecognized tax benefits in the financial statements; nor is the Fund aware of any tax positions for which it is reasonably possible that the total amounts of unrecognized tax benefits will significantly change in the next twelve months. The Fund files a U.S. federal tax return, in addition to state and local tax returns as required. The Fund's federal income tax returns are subject to examination by the Internal Revenue Service (IRS) for a period of three fiscal years after they are filed. State and local tax returns may be subject to examination for an additional fiscal year depending on the jurisdiction. Foreign taxes are provided for based on the Fund's understanding of the tax rules and rates that exist in the foreign markets in which it invests.
Distributions are declared and recorded on the ex-dividend date. Income and capital gain distributions are determined in accordance with income tax regulations, which may differ from GAAP. In addition, the Fund claimed a portion of the payment made to redeeming shareholders as a distribution for income tax purposes.
Capital accounts within the financial statements are adjusted for permanent book-tax differences. These adjustments have no impact on net assets or the results of operations. Capital accounts are not adjusted for temporary book-tax differences which will reverse in a subsequent period.
Book-tax differences are primarily due to foreign currency transactions, partnerships, market discount, deferred trustees compensation, and losses deferred due to wash sales and excise tax regulations.
The federal tax cost of investment securities and unrealized appreciation (depreciation) as of period end were as follows:
Gross unrealized appreciation | $ 406,589,058 |
Gross unrealized depreciation | (5,038,737) |
Net unrealized appreciation (depreciation) on securities and other investments | $ 401,550,321 |
|
|
Tax Cost | $ 981,214,739 |
The tax-based components of distributable earnings as of period end were as follows:
Undistributed ordinary income | $ 26,117,116 |
Undistributed long-term capital gain | $ 11,992,885 |
Net unrealized appreciation (depreciation) | $ 401,539,962 |
Annual Report
3. Significant Accounting Policies - continued
Income Tax Information and Distributions to Shareholders - continued
The tax character of distributions paid was as follows:
| February 28, 2014 | February 28, 2013 |
Ordinary Income | $ 23,947,481 | $ 17,990,233 |
Long-term Capital Gains | 52,435,141 | 15,251,351 |
Total | $ 76,382,622 | $ 33,241,584 |
Trading (Redemption) Fees. Shares held by investors in the Fund less than 30 days may be subject to a redemption fee equal to .75% of the NAV of shares redeemed. All redemption fees, which reduce the proceeds of the shareholder redemption, are retained by the Fund and accounted for as an addition to paid in capital.
4. Purchases and Sales of Investments.
Purchases and sales of securities, other than short-term securities, aggregated $1,317,048,092 and $1,351,042,337, respectively.
5. Fees and Other Transactions with Affiliates.
Management Fee. Effective August 1, 2013, SelectCo replaced Fidelity Management and Research Company (FMR), an affiliate of SelectCo, as investment adviser to the Fund. The investment adviser and its affiliates provide the Fund with investment management related services for which the Fund pays a monthly management fee. The management fee is the sum of an individual fund fee rate that is based on an annual rate of .30% of the Fund's average net assets and an annualized group fee rate that averaged .25% during the period. The group fee rate is based upon the average net assets of all the mutual funds advised by FMR and the investment adviser. The group fee rate decreases as assets under management increase and increases as assets under management decrease. For the reporting period, the total annual management fee rate was .55% of the Fund's average net assets.
Transfer Agent Fees. Fidelity Investments Institutional Operations Company, Inc. (FIIOC), an affiliate of the investment adviser, is the Fund's transfer, dividend disbursing and shareholder servicing agent. FIIOC receives account fees and asset-based fees that vary according to account size and type of account. FIIOC pays for typesetting, printing and mailing of shareholder reports, except proxy statements. For the period, the transfer agent fees were equivalent to an annual rate of .20% of average net assets.
Accounting and Security Lending Fees. Fidelity Service Company, Inc. (FSC), an affiliate of the investment adviser, maintains the Fund's accounting records. The accounting fee is based on the level of average net assets for each month. Under a separate contract, FSC administers the security lending program. The security lending fee is based on the number and duration of lending transactions.
Brokerage Commissions. The Fund placed a portion of its portfolio transactions with brokerage firms which are affiliates of the investment adviser. Brokerage commissions are included in net realized gain (loss) and change in net unrealized appreciation (depreciation) in the Statement of Operations. The commissions paid to these affiliated firms were $35,852 for the period.
Interfund Lending Program. Pursuant to an Exemptive Order issued by the SEC, the Fund, along with other registered investment companies having management contracts with FMR or other affiliated entities of FMR, may participate in an interfund lending program. This program provides an alternative credit facility allowing the funds to borrow from, or lend money to, other participating affiliated funds. At period end, there were no interfund loans outstanding. The Fund's activity in this program during the period for which loans were outstanding was as follows:
Borrower or Lender | Average Loan | Weighted Average | Interest |
Borrower | $ 6,981,750 | .32% | $ 1,245 |
6. Committed Line of Credit.
The Fund participates with other funds managed by the investment adviser or an affiliate in a $4.25 billion credit facility (the "line of credit") to be utilized for temporary or emergency purposes to fund shareholder redemptions or for other short-term liquidity purposes. The Fund has agreed to pay commitment fees on its pro-rata portion of the line of credit, which amounted to $2,327 and is reflected in Miscellaneous expenses on the Statement of Operations. During the period, there were no borrowings on this line of credit.
Annual Report
Notes to Financial Statements - continued
7. Security Lending.
The Fund lends portfolio securities through a lending agent from time to time in order to earn additional income. For equity securities, a lending agent is used and may loan securities to certain qualified borrowers, which prior to August 1, 2013 included Fidelity Capital Markets (FCM), a broker-dealer affiliated with the Fund. On the settlement date of the loan, the Fund receives collateral (in the form of U.S. Treasury obligations, letters of credit and/or cash) against the loaned securities and maintains collateral in an amount not less than 100% of the market value of the loaned securities during the period of the loan. The market value of the loaned securities is determined at the close of business of the Fund and any additional required collateral is delivered to the Fund on the next business day. If the borrower defaults on its obligation to return the securities loaned because of insolvency or other reasons, the Fund may apply collateral received from the borrower against the obligation. The Fund may experience delays and costs in recovering the securities loaned. Any cash collateral received is invested in the Fidelity Securities Lending Cash Central Fund. The value of loaned securities and cash collateral at period end are disclosed on the Fund's Statement of Assets and Liabilities. At period end, there were no security loans outstanding with FCM. Security lending income represents the income earned on investing cash collateral, less rebates paid to borrowers and any lending agent fees associated with the loan, plus any premium payments received for lending certain types of securities. Security lending income is presented in the Statement of Operations as a component of income from Fidelity Central Funds. Total security lending income during the period amounted to $247,915, including $70 from securities loaned to FCM.
8. Expense Reductions.
Commissions paid to certain brokers with whom the investment adviser, or its affiliates, places trades on behalf of the Fund include an amount to the Fund in addition to trade execution, which may be rebated back to the Fund to offset certain expenses. This amount totaled $141,479 for the period.
In addition, FMR reimbursed a portion of the Fund's operating expenses during the period in the amount of $6,719.
9. Other.
The Fund's organizational documents provide former and current trustees and officers with a limited indemnification against liabilities arising in connection with the performance of their duties to the Fund. In the normal course of business, the Fund may also enter into contracts that provide general indemnifications. The Fund's maximum exposure under these arrangements is unknown as this would be dependent on future claims that may be made against the Fund. The risk of material loss from such claims is considered remote.
Annual Report
Gold Portfolio
Performance: The Bottom Line
Average annual total return reflects the change in the value of an investment, assuming reinvestment of the class' distributions from dividend income and capital gains (the profits earned upon the sale of securities that have grown in value, if any) and assuming a constant rate of performance each year. The $10,000 table and the fund's returns do not reflect the deduction of taxes that a shareholder would pay on fund distributions or the redemption of fund shares. During periods of reimbursement by Fidelity, a fund's total return will be greater than it would be had the reimbursement not occurred. How a fund did yesterday is no guarantee of how it will do tomorrow.
Average Annual Total Returns
Periods ended February 28, 2014 | Past 1 | Past 5 | Past 10 |
Gold Portfolio | -27.05% | -3.13% | 3.68% |
$10,000 Over 10 Years
Let's say hypothetically that $10,000 was invested in Gold Portfolio, a class of the fund, on February 29, 2004. The chart shows how the value of your investment would have changed, and also shows how the S&P 500 Index performed over the same period.
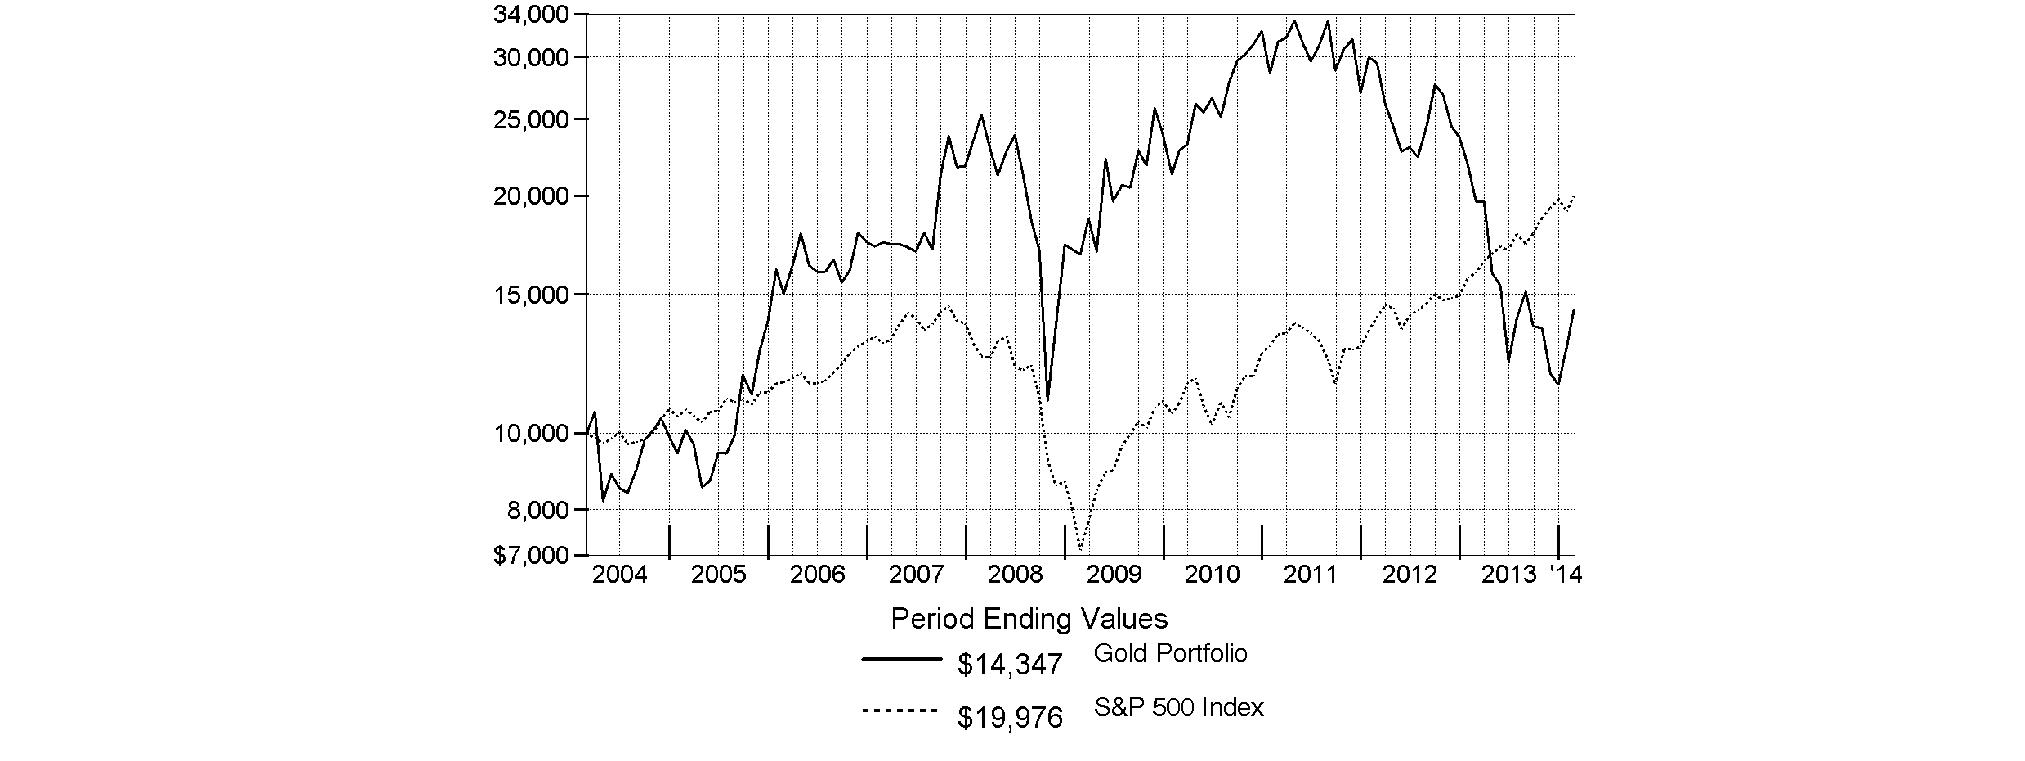
Annual Report
Gold Portfolio
Management's Discussion of Fund Performance
Market Recap: Stocks overcame fears of higher interest rates - not to mention their worst January in four years - to finish sharply higher for the 12 months ending February 28, 2014. The broad S&P 500® Index and the blue-chip Dow Jones Industrial AverageSM gained 25.37% and 19.01%, respectively, amid generally favorable earnings reports and accommodative monetary policies worldwide. Performance generally increased along the risk spectrum, with smaller-cap and growth strategies leading the way. An ebullient market helped the growth-oriented Nasdaq Composite Index® to a 38.10% period gain, for example. On the other hand, both cyclical and defensive stocks had representation in the top-performing industry sectors: returns were highest in health care and consumer discretionary; lowest in utilities and telecommunication services. From a macroeconomic perspective, data still points to slow but steady improvement in the U.S., and Europe's recession may well be over. Reports from China have disappointed, but continue to suggest a relatively soft landing there. Mixed signals from the U.S. Federal Reserve as to when it might curtail its stimulative bond buying kept markets in flux during the spring and summer. Stocks regained momentum in October despite a federal budget impasse and brief government shutdown, and lower volatility prevailed through year-end. Shedding new-year concerns about China's economy, an emerging-markets sell-off and confirmation (at last) of Fed tapering - alongside confirmation of a presumably dovish Janet Yellen as new Fed chair - February saw stocks back in record territory, bearing down on the five-year anniversary of the market's bottom.
Comments from S. Joseph Wickwire, II, Portfolio Manager of Gold Portfolio: For the year, the fund's Retail shares returned -27.05%, compared with -30.17% for the S&P® Global BMI Gold Capped Index and 25.37% for the broadly based S&P 500® Index. For much of the period, gold and gold stocks were in what I believed was a concluding phase of a two-year correction. An approximate 15% drop in the commodity price hurt gold-mining stocks for the year, along with concerns that a higher interest rate environment would hurt the group. At the same time, some investors sold gold and gold-related stocks to buy strong-performing equities. Versus the industry benchmark, the fund was helped by overweighting outperforming names such as Osisko Mining and Rainy River Resources, whose stock prices both rose on takeover bids. I sold Rainy River before period end. Underweighting weak performer and index heavyweight Newmont Mining also helped, as it struggled with low production growth, country risk and high costs. Non-benchmark positions in gold and silver bullion contributed as more-defensive components. Conversely, the fund was hurt by stakes in Colossus Minerals, Detour Gold and Persus Mining. I significantly reduced our stake in Colossus by period end.
The views expressed above reflect those of the portfolio manager(s) only through the end of the period as stated on the cover of this report and do not necessarily represent the views of Fidelity or any other person in the Fidelity organization. Any such views are subject to change at any time based upon market or other conditions and Fidelity disclaims any responsibility to update such views. These views may not be relied on as investment advice and, because investment decisions for a Fidelity fund are based on numerous factors, may not be relied on as an indication of trading intent on behalf of any Fidelity fund.
Annual Report
Gold Portfolio
Shareholder Expense Example
As a shareholder of the Fund, you incur two types of costs: (1) transaction costs, including sales charges (loads) on purchase payments or redemption proceeds, redemption fees and (2) ongoing costs, including management fees, distribution and/or service (12b-1) fees and other Fund expenses. This Example is intended to help you understand your ongoing costs (in dollars) of investing in the Fund and to compare these costs with the ongoing costs of investing in other mutual funds.
The Example is based on an investment of $1,000 invested at the beginning of the period and held for the entire period (September 1, 2013 to February 28, 2014).
Actual Expenses
The first line of the accompanying table for each class of the Fund provides information about actual account values and actual expenses. You may use the information in this line, together with the amount you invested, to estimate the expenses that you paid over the period. Simply divide your account value by $1,000.00 (for example, an $8,600 account value divided by $1,000.00 = 8.6), then multiply the result by the number in the first line for a class of the Fund under the heading entitled "Expenses Paid During Period" to estimate the expenses you paid on your account during this period. A small balance maintenance fee of $12.00 that is charged once a year may apply for certain accounts with a value of less than $2,000. This fee is not included in the table below. If it was, the estimate of expenses you paid during the period would be higher, and your ending account value lower, by this amount. In addition, the Fund, as a shareholder in the underlying Fidelity Central Funds, will indirectly bear its pro-rata share of the fees and expenses incurred by the underlying Fidelity Central Funds. These fees and expenses are not included in the Fund's annualized expense ratio used to calculate the expense estimate in the table below.
Hypothetical Example for Comparison Purposes
The second line of the accompanying table for each class of the Fund provides information about hypothetical account values and hypothetical expenses based on a Class' actual expense ratio and an assumed rate of return of 5% per year before expenses, which is not the Class' actual return. The hypothetical account values and expenses may not be used to estimate the actual ending account balance or expenses you paid for the period. You may use this information to compare the ongoing costs of investing in the Fund and other funds. To do so, compare this 5% hypothetical example with the 5% hypothetical examples that appear in the shareholder reports of the other funds. A small balance maintenance fee of $12.00 that is charged once a year may apply for certain accounts with a value of less than $2,000. This fee is not included in the table below. If it was, the estimate of expenses you paid during the period would be higher, and your ending account value lower, by this amount. In addition, the Fund, as a shareholder in the underlying Fidelity Central Funds, will indirectly bear its pro-rata share of the fees and expenses incurred by the underlying Fidelity Central Funds. These fees and expenses are not included in the Fund's annualized expense ratio used to calculate the expense estimate in the table below.
Please note that the expenses shown in the table are meant to highlight your ongoing costs only and do not reflect any transaction costs. Therefore, the second line of the table is useful in comparing ongoing costs only, and will not help you determine the relative total costs of owning different funds. In addition, if these transactional costs were included, your costs would have been higher.
| Annualized | Beginning | Ending | Expenses Paid |
Class A | 1.21% |
|
|
|
Actual |
| $ 1,000.00 | $ 948.70 | $ 5.85 |
HypotheticalA |
| $ 1,000.00 | $ 1,018.79 | $ 6.06 |
Class T | 1.49% |
|
|
|
Actual |
| $ 1,000.00 | $ 947.70 | $ 7.20 |
HypotheticalA |
| $ 1,000.00 | $ 1,017.41 | $ 7.45 |
Class B | 1.97% |
|
|
|
Actual |
| $ 1,000.00 | $ 945.00 | $ 9.50 |
HypotheticalA |
| $ 1,000.00 | $ 1,015.03 | $ 9.84 |
Class C | 1.96% |
|
|
|
Actual |
| $ 1,000.00 | $ 945.20 | $ 9.45 |
HypotheticalA |
| $ 1,000.00 | $ 1,015.08 | $ 9.79 |
Gold | .93% |
|
|
|
Actual |
| $ 1,000.00 | $ 950.00 | $ 4.50 |
HypotheticalA |
| $ 1,000.00 | $ 1,020.18 | $ 4.66 |
Institutional Class | .86% |
|
|
|
Actual |
| $ 1,000.00 | $ 950.40 | $ 4.16 |
HypotheticalA |
| $ 1,000.00 | $ 1,020.53 | $ 4.31 |
A 5% return per year before expenses
B Annualized expense ratio reflects consolidated expenses net of applicable fee waivers.
* Expenses are equal to each Class' annualized expense ratio, multiplied by the average account value over the period, multiplied by 181/365 (to reflect the one-half year period).
Annual Report
Gold Portfolio
Consolidated Investment Changes (Unaudited)
Top Ten Holdings as of February 28, 2014 | ||
| % of fund's | % of fund's net assets |
Gold Bullion | 10.1 | 5.2 |
Goldcorp, Inc. | 9.2 | 10.1 |
Barrick Gold Corp. | 6.4 | 9.5 |
Randgold Resources Ltd. sponsored ADR | 5.2 | 4.6 |
Silver Bullion | 5.0 | 3.8 |
Newcrest Mining Ltd. | 4.7 | 5.2 |
Yamana Gold, Inc. | 4.4 | 4.9 |
Franco-Nevada Corp. | 4.1 | 3.7 |
Eldorado Gold Corp. | 3.9 | 4.8 |
AngloGold Ashanti Ltd. sponsored ADR | 3.7 | 1.6 |
| 56.7 |
|
Top Industries (% of fund's net assets) | |||
As of February 28, 2014 | |||
| Gold | 83.2% |
|
 | Commodities & Related Investments** | 15.1% |
|
| Precious Metals & Minerals | 0.7% |
|
| Diversified Metals & Mining | 0.1% |
|
| Coal & Consumable Fuels | 0.1% |
|
| Construction & Engineering | 0.1% |
|
| All Others* | 0.7% |
|

As of August 31, 2013 | |||
| Gold | 89.4% |
|
| Commodities & Related Investments** | 9.0% |
|
| Precious Metals & Minerals | 0.9% |
|
| Diversified Metals & Mining | 0.2% |
|
| Construction & Engineering | 0.0%† |
|
| Coal & Consumable Fuels | 0.0%† |
|
| All Others* | 0.5% |
|

* Includes short-term investments and net other assets (liabilities). |
** Includes gold bullion and/or silver bullion. |
† Amount represents less than 0.1% |
Geographic Diversification (% of fund's net assets) | |||
As of February 28, 2014 | |||
| Canada | 57.3% |
|
| United States of America* | 20.4% |
|
 | Australia | 7.1% |
|
| South Africa | 6.7% |
|
 | Bailiwick of Jersey | 6.5% |
|
| Bermuda | 1.0% |
|
 | Peru | 0.5% |
|
| Cayman Islands | 0.4% |
|
| United Kingdom | 0.1% |
|

Percentages are based on country or territory of incorporation and are adjusted for the effect of futures contracts, if applicable. |
As of August 31, 2013 | |||
| Canada | 64.6% |
|
| United States of America* | 14.5% |
|
| Australia | 8.7% |
|
| Bailiwick of Jersey | 5.8% |
|
| South Africa | 5.0% |
|
| Bermuda | 0.8% |
|
| Cayman Islands | 0.4% |
|
| United Kingdom | 0.1% |
|
| Peru | 0.1% |
|

Percentages are based on country or territory of incorporation and are adjusted for the effect of futures contracts, if applicable. |
Annual Report
Gold Portfolio
Consolidated Investments February 28, 2014
Showing Percentage of Net Assets
Common Stocks - 84.2% | |||
Shares | Value | ||
Australia - 7.1% | |||
CONSTRUCTION & ENGINEERING - 0.1% | |||
Construction & Engineering - 0.1% | |||
Boart Longyear Ltd. (d) | 3,985,000 | $ 1,084,584 | |
METALS & MINING - 7.0% | |||
Gold - 7.0% | |||
Beadell Resources Ltd. (a) | 10,603,618 | 7,191,225 | |
Evolution Mining Ltd. (d) | 2,371,395 | 1,978,567 | |
Gryphon Minerals Ltd. (a) | 5,060,010 | 790,178 | |
Intrepid Mines Ltd.: | |||
(Australia) (a) | 8,469,798 | 1,965,086 | |
(Canada) (a) | 320,000 | 73,693 | |
Kingsgate Consolidated NL | 328,274 | 357,381 | |
Medusa Mining Ltd. (a) | 2,246,085 | 4,349,318 | |
Newcrest Mining Ltd. | 6,941,758 | 70,245,378 | |
Papillon Resources Ltd. (a) | 3,332,270 | 4,222,443 | |
Perseus Mining Ltd.: | |||
(Australia) (a) | 3,240,134 | 1,243,273 | |
(Canada) (a) | 1,300,000 | 504,832 | |
Ramelius Resources Ltd. (a) | 980,000 | 126,803 | |
Red 5 Ltd. (a) | 1,326,000 | 130,158 | |
Regis Resources Ltd. | 2,672,293 | 5,436,935 | |
Resolute Mining Ltd. (a) | 2,988,261 | 1,613,278 | |
Saracen Mineral Holdings Ltd. (a)(d) | 4,816,787 | 1,310,969 | |
Silver Lake Resources Ltd. (a)(d) | 4,346,985 | 2,249,839 | |
St Barbara Ltd. (a)(d) | 4,283,377 | 1,337,795 | |
Troy Resources NL (a)(d) | 195,000 | 200,980 | |
Troy Resources NL (f) | 734,826 | 769,799 | |
| 106,097,930 | ||
TOTAL AUSTRALIA | 107,182,514 | ||
Bailiwick of Jersey - 6.5% | |||
METALS & MINING - 6.5% | |||
Gold - 6.5% | |||
Centamin PLC (a) | 3,761,900 | 3,464,719 | |
Lydian International Ltd. (a) | 2,325,200 | 2,267,873 | |
Polyus Gold International Ltd. | 422,400 | 1,384,598 | |
Polyus Gold International Ltd. sponsored GDR | 3,919,931 | 12,543,779 | |
Randgold Resources Ltd. sponsored ADR (d) | 994,895 | 78,636,501 | |
| 98,297,470 | ||
Bermuda - 1.0% | |||
METALS & MINING - 1.0% | |||
Gold - 1.0% | |||
Continental Gold Ltd. (a) | 3,354,700 | 15,299,589 | |
Canada - 57.3% | |||
METALS & MINING - 57.3% | |||
Diversified Metals & Mining - 0.1% | |||
NovaCopper, Inc. (a)(d) | 488,333 | 620,182 | |
| |||
Shares | Value | ||
Rio Alto Mining Ltd. (a) | 396,500 | $ 845,065 | |
Sabina Gold & Silver Corp. (a) | 980,000 | 814,233 | |
True Gold Mining, Inc. (a) | 125,000 | 43,462 | |
| 2,322,942 | ||
Gold - 56.5% | |||
Agnico Eagle Mines Ltd. (Canada) (d) | 1,606,200 | 51,538,234 | |
Alacer Gold Corp. | 2,155,063 | 5,819,235 | |
Alamos Gold, Inc. | 1,113,300 | 10,667,491 | |
Argonaut Gold, Inc. (a) | 3,609,962 | 18,778,453 | |
ATAC Resources Ltd. (a) | 67,200 | 80,715 | |
B2Gold Corp. (a) | 14,237,858 | 41,146,162 | |
Banro Corp. (a)(d) | 2,326,482 | 1,365,676 | |
Barrick Gold Corp. (d) | 4,737,769 | 96,526,749 | |
Belo Sun Mining Corp. (a)(d) | 6,797,400 | 2,670,341 | |
Centerra Gold, Inc. | 1,422,400 | 6,371,448 | |
Colossus Minerals, Inc. (a)(d) | 802,600 | 28,993 | |
Detour Gold Corp. (a)(d) | 2,014,800 | 17,504,178 | |
Detour Gold Corp. (a)(f) | 785,900 | 6,827,741 | |
Eldorado Gold Corp. | 8,794,408 | 58,375,236 | |
Franco-Nevada Corp. (d) | 1,207,700 | 61,721,072 | |
Gabriel Resources Ltd. (a) | 1,040,600 | 1,127,716 | |
Goldcorp, Inc. | 5,119,400 | 137,636,176 | |
Golden Queen Mining Co. Ltd. (a) | 15,000 | 21,750 | |
GoldQuest Mining Corp. (a) | 2,318,500 | 764,249 | |
Guyana Goldfields, Inc. (a)(d) | 2,933,700 | 7,656,816 | |
Guyana Goldfields, Inc. (a)(f) | 155,000 | 404,543 | |
IAMGOLD Corp. | 3,279,400 | 12,172,251 | |
Kinross Gold Corp. | 9,990,691 | 52,150,451 | |
Kinross Gold Corp. warrants 9/17/14 (a) | 1,192,793 | 37,702 | |
Kirkland Lake Gold, Inc. (a)(d) | 501,000 | 1,827,906 | |
Lake Shore Gold Corp. (a)(d) | 3,226,600 | 2,651,681 | |
Midas Gold Corp. (a) | 100,500 | 88,946 | |
New Gold, Inc. (a) | 7,241,575 | 44,274,779 | |
NGEx Resources, Inc. (a) | 65,000 | 106,836 | |
Novagold Resources, Inc. (a)(d) | 2,346,200 | 8,666,087 | |
OceanaGold Corp. (a) | 2,892,300 | 6,921,878 | |
Orezone Gold Corp. (a) | 372,100 | 194,905 | |
Osisko Mining Corp. (a) | 1,094,331 | 6,967,429 | |
Osisko Mining Corp. (a)(f) | 3,000,000 | 19,100,515 | |
Pilot Gold, Inc. (a) | 1,418,150 | 1,959,514 | |
Premier Gold Mines Ltd. (a)(e) | 9,787,922 | 20,772,705 | |
Pretium Resources, Inc. (a)(d) | 914,538 | 5,740,124 | |
Pretium Resources, Inc. (a)(f) | 225,000 | 1,412,219 | |
Pretium Resources, Inc. (a)(g) | 225,000 | 1,412,219 | |
Primero Mining Corp. (a)(d) | 841,200 | 5,454,543 | |
Probe Mines Ltd. (a) | 85,000 | 253,319 | |
Richmont Mines, Inc. (a) | 240,900 | 402,479 | |
Romarco Minerals, Inc. (a) | 14,078,600 | 9,154,332 | |
Romarco Minerals, Inc. (a)(f) | 5,900,000 | 3,836,359 | |
Rubicon Minerals Corp. (a) | 5,302,102 | 7,182,474 | |
Sandstorm Gold Ltd. (a)(d) | 137,000 | 722,550 | |
Seabridge Gold, Inc. (a)(d) | 601,905 | 5,224,533 | |
Common Stocks - continued | |||
Shares | Value | ||
Canada - continued | |||
METALS & MINING - CONTINUED | |||
Gold - continued | |||
SEMAFO, Inc. (d) | 2,740,000 | $ 11,011,469 | |
Sulliden Gold Corp. Ltd. (a)(d) | 4,138,400 | 3,288,894 | |
Teranga Gold Corp. (a) | 85,000 | 86,743 | |
Teranga Gold Corp. CDI unit (a) | 3,430,974 | 3,459,642 | |
Timmins Gold Corp. (a) | 122,600 | 177,152 | |
Torex Gold Resources, Inc. (a) | 15,603,400 | 16,909,672 | |
Yamana Gold, Inc. | 6,670,100 | 66,743,166 | |
| 847,398,448 | ||
Precious Metals & Minerals - 0.7% | |||
Chesapeake Gold Corp. (a) | 12,000 | 37,930 | |
Dalradian Resources, Inc. (a)(d) | 56,000 | 43,493 | |
Gold Standard Ventures Corp. (a) | 425,400 | 284,291 | |
MAG Silver Corp. (a) | 191,000 | 1,564,499 | |
Pan American Silver Corp. warrants 12/7/14 (a) | 232,460 | 7,570 | |
Silver Wheaton Corp. | 11,200 | 285,740 | |
Tahoe Resources, Inc. (a) | 328,900 | 7,716,808 | |
Wildcat Silver Corp. (a) | 75,200 | 40,069 | |
| 9,980,400 | ||
TOTAL METALS & MINING | 859,701,790 | ||
Cayman Islands - 0.4% | |||
METALS & MINING - 0.4% | |||
Gold - 0.4% | |||
Endeavour Mining Corp. (a) | 8,117,400 | 5,864,644 | |
Peru - 0.5% | |||
METALS & MINING - 0.5% | |||
Gold - 0.5% | |||
Compania de Minas Buenaventura SA sponsored ADR | 589,700 | 7,430,220 | |
South Africa - 6.7% | |||
METALS & MINING - 6.7% | |||
Gold - 6.7% | |||
AngloGold Ashanti Ltd. | 22,700 | 399,866 | |
AngloGold Ashanti Ltd. sponsored ADR (d) | 3,133,008 | 55,078,281 | |
Gold Fields Ltd. | 55,000 | 208,519 | |
Gold Fields Ltd. sponsored ADR | 6,317,026 | 23,309,826 | |
Harmony Gold Mining Co. Ltd. | 1,484,000 | 4,770,533 | |
Harmony Gold Mining Co. Ltd. sponsored ADR (d) | 2,079,900 | 6,738,876 | |
Sibanye Gold Ltd. ADR (d) | 1,195,006 | 9,571,998 | |
| 100,077,899 | ||
| |||
Shares | Value | ||
United Kingdom - 0.1% | |||
METALS & MINING - 0.1% | |||
Gold - 0.1% | |||
Patagonia Gold PLC (a)(d) | 260,000 | $ 42,994 | |
Petropavlovsk PLC (d) | 391,970 | 610,427 | |
| 653,421 | ||
Precious Metals & Minerals - 0.0% | |||
Fresnillo PLC | 10,000 | 159,333 | |
TOTAL METALS & MINING | 812,754 | ||
United States of America - 4.6% | |||
METALS & MINING - 4.5% | |||
Gold - 4.5% | |||
Allied Nevada Gold Corp. (a)(d) | 281,800 | 1,473,814 | |
Allied Nevada Gold Corp. (Canada) (a) | 30,000 | 156,900 | |
Gold Resource Corp. (d) | 100,000 | 515,000 | |
McEwen Mining, Inc. (a)(d) | 679,110 | 1,976,210 | |
Newmont Mining Corp. | 898,500 | 20,899,110 | |
Royal Gold, Inc. | 612,513 | 42,085,768 | |
| 67,106,802 | ||
OIL, GAS & CONSUMABLE FUELS - 0.1% | |||
Coal & Consumable Fuels - 0.1% | |||
Peabody Energy Corp. | 97,400 | 1,710,342 | |
TOTAL UNITED STATES OF AMERICA | 68,817,144 | ||
TOTAL COMMON STOCKS (Cost $1,605,390,234) |
| ||
Commodities - 15.1% | |||
| Troy Ounces |
|
|
Gold Bullion (a) | 114,510 | 151,730,330 | |
Silver Bullion (a) | 3,500,000 | 74,139,100 | |
TOTAL COMMODITIES (Cost $225,370,573) |
| ||
Money Market Funds - 13.3% | |||
Shares | Value | ||
Fidelity Cash Central Fund, 0.10% (b) | 16,036,002 | $ 16,036,002 | |
Fidelity Securities Lending Cash Central Fund, 0.09% (b)(c) | 183,742,153 | 183,742,153 | |
TOTAL MONEY MARKET FUNDS (Cost $199,778,155) |
| ||
TOTAL INVESTMENT PORTFOLIO - 112.6% (Cost $2,030,538,962) | 1,689,131,609 | ||
NET OTHER ASSETS (LIABILITIES) - (12.6)% | (188,533,289) | ||
NET ASSETS - 100% | $ 1,500,598,320 | ||
Legend |
(a) Non-income producing |
(b) Affiliated fund that is generally available only to investment companies and other accounts managed by Fidelity Investments. The rate quoted is the annualized seven-day yield of the fund at period end. A complete unaudited listing of the fund's holdings as of its most recent quarter end is available upon request. In addition, each Fidelity Central Fund's financial statements, which are not covered by the Fund's Report of Independent Registered Public Accounting Firm, are available on the SEC's website or upon request. |
(c) Investment made with cash collateral received from securities on loan. |
(d) Security or a portion of the security is on loan at period end. |
(e) Affiliated company |
(f) Security exempt from registration under Rule 144A of the Securities Act of 1933. These securities may be resold in transactions exempt from registration, normally to qualified institutional buyers. At the end of the period, the value of these securities amounted to $32,351,176 or 2.2% of net assets. |
(g) Restricted securities - Investment in securities not registered under the Securities Act of 1933 (excluding 144A issues). At the end of the period, the value of restricted securities (excluding 144A issues) amounted to $1,412,219 or 0.1% of net assets. |
Additional information on each restricted holding is as follows: |
Security | Acquisition Date | Acquisition Cost |
Pretium Resources, Inc. | 3/31/11 | $ 2,172,293 |
Affiliated Central Funds |
Information regarding fiscal year to date income earned by the Fund from investments in Fidelity Central Funds is as follows: |
Fund | Income earned |
Fidelity Cash Central Fund | $ 9,917 |
Fidelity Securities Lending Cash Central Fund | 598,267 |
Total | $ 608,184 |
Consolidated Subsidiary | Value, | Purchases | Sales | Dividend | Value, |
Fidelity Select Gold Cayman Ltd. | $ 116,121,090 | $ 472,317,716 | $ 344,928,800 | $ - | $ 225,764,683 |
Other Affiliated Issuers |
An affiliated company is a company in which the Fund has ownership of at least 5% of the voting securities. Fiscal year to date transactions with companies which are or were affiliates are as follows: |
Affiliate | Value, | Purchases | Sales | Dividend | Value, |
Kimber Resources, Inc. | $ 3,981 | $ - | $ 2,315 | $ - | $ - |
Kimber Resources, Inc. (144A) | 1,379,164 | - | 774,753 | - | - |
Premier Gold Mines Ltd. | 13,711,119 | 7,618,238 | - | - | 20,772,705 |
Total | $ 15,094,264 | $ 7,618,238 | $ 777,068 | $ - | $ 20,772,705 |
Other Information |
The following is a summary of the inputs used, as of February 28, 2014, involving the Fund's assets and liabilities carried at fair value. The inputs or methodology used for valuing securities may not be an indication of the risk associated with investing in those securities. For more information on valuation inputs, and their aggregation into the levels used in the table below, please refer to the Investment Valuation section in the accompanying Notes to Consolidated Financial Statements. |
Valuation Inputs at Reporting Date: | ||||
Description | Total | Level 1 | Level 2 | Level 3 |
Investments in Securities: | ||||
Common Stocks | $ 1,263,484,024 | $ 1,258,068,543 | $ 5,386,488 | $ 28,993 |
Commodities | 225,869,430 | 225,869,430 | - | - |
Money Market Funds | 199,778,155 | 199,778,155 | - | - |
Total Investments in Securities: | $ 1,689,131,609 | $ 1,683,716,128 | $ 5,386,488 | $ 28,993 |
See accompanying notes which are an integral part of the Consolidated financial statements.
Annual Report
Gold Portfolio
Consolidated Financial Statements
Consolidated Statement of Assets and Liabilities
| February 28, 2014 | |
|
|
|
Assets | ||
Investment in securities, at value (including securities loaned of $173,215,187) - See accompanying schedule: Unaffiliated issuers (cost $1,574,084,452) | $ 1,242,711,319 |
|
Fidelity Central Funds (cost $199,778,155) | 199,778,155 |
|
Commodities (cost $225,370,573) | 225,869,430 |
|
Other affiliated issuers (cost $31,305,782) | 20,772,705 |
|
Total Investments (cost $2,030,538,962) |
| $ 1,689,131,609 |
Receivable for fund shares sold | 3,772,643 | |
Dividends receivable | 310,264 | |
Distributions receivable from Fidelity Central Funds | 58,886 | |
Prepaid expenses | 5,836 | |
Other receivables | 21,725 | |
Total assets | 1,693,300,963 | |
|
|
|
Liabilities | ||
Payable to custodian bank | $ 9,165 | |
Payable for investments purchased | 3,614,909 | |
Payable for fund shares redeemed | 4,122,024 | |
Accrued management fee | 655,535 | |
Distribution and service plan fees payable | 50,221 | |
Other affiliated payables | 328,265 | |
Other payables and accrued expenses | 180,371 | |
Collateral on securities loaned, at value | 183,742,153 | |
Total liabilities | 192,702,643 | |
|
|
|
Net Assets | $ 1,500,598,320 | |
Net Assets consist of: |
| |
Paid in capital | $ 2,719,446,235 | |
Accumulated net investment loss | (8,084) | |
Accumulated undistributed net realized gain (loss) on investments and foreign currency transactions | (877,435,473) | |
Net unrealized appreciation (depreciation) on investments and assets and liabilities in foreign currencies | (341,404,358) | |
Net Assets | $ 1,500,598,320 | |
Consolidated Statement of Assets and Liabilities -
continued
| February 28, 2014 | |
Calculation of Maximum Offering Price Class A: | $ 22.01 | |
|
|
|
Maximum offering price per share (100/94.25 of $22.01) | $ 23.35 | |
Class T: | $ 21.73 | |
|
|
|
Maximum offering price per share (100/96.50 of $21.73) | $ 22.52 | |
Class B: | $ 21.14 | |
|
|
|
Class C: | $ 21.06 | |
|
|
|
Gold: | $ 22.41 | |
|
|
|
Institutional Class: | $ 22.41 | |
A Redemption price per share is equal to net asset value less any applicable contingent deferred sales charge.
See accompanying notes which are an integral part of the Consolidated financial statements.
Annual Report
Consolidated Statement of Operations
| Year ended February 28, 2014 | |
|
|
|
Investment Income |
|
|
Dividends |
| $ 16,884,160 |
Interest |
| 308 |
Income from Fidelity Central Funds |
| 608,184 |
Total income |
| 17,492,652 |
|
|
|
Expenses | ||
Management fee | $ 8,556,432 | |
Transfer agent fees | 4,024,234 | |
Distribution and service plan fees | 572,954 | |
Accounting and security lending fees | 682,266 | |
Custodian fees and expenses | 354,790 | |
Independent trustees' compensation | 26,542 | |
Registration fees | 191,328 | |
Audit | 64,766 | |
Legal | 25,044 | |
Interest | 3,525 | |
Miscellaneous | 24,576 | |
Total expenses before reductions | 14,526,457 | |
Expense reductions | (446,858) | 14,079,599 |
Net investment income (loss) | 3,413,053 | |
Realized and Unrealized Gain (Loss) Net realized gain (loss) on: | ||
Investments: |
|
|
Unaffiliated issuers | (547,572,843) | |
Other affiliated issuers | (4,162,175) |
|
Commodities | (4,647,499) |
|
Foreign currency transactions | (225,772) | |
Total net realized gain (loss) |
| (556,608,289) |
Change in net unrealized appreciation (depreciation) on: Investments | (75,476,961) | |
Assets and liabilities in foreign currencies | 13,851 | |
Commodities | (12,614,823) | |
Total change in net unrealized appreciation (depreciation) |
| (88,077,933) |
Net gain (loss) | (644,686,222) | |
Net increase (decrease) in net assets resulting from operations | $ (641,273,169) | |
Consolidated Statement of Changes in Net Assets
| Year ended | Year ended |
Increase (Decrease) in Net Assets |
|
|
Operations |
|
|
Net investment income (loss) | $ 3,413,053 | $ 13,834,462 |
Net realized gain (loss) | (556,608,289) | (149,416,855) |
Change in net unrealized appreciation (depreciation) | (88,077,933) | (1,263,115,883) |
Net increase (decrease) in net assets resulting from operations | (641,273,169) | (1,398,698,276) |
Share transactions - net increase (decrease) | (461,130,558) | (374,414,799) |
Redemption fees | 396,348 | 209,222 |
Total increase (decrease) in net assets | (1,102,007,379) | (1,772,903,853) |
|
|
|
Net Assets | ||
Beginning of period | 2,602,605,699 | 4,375,509,552 |
End of period (including accumulated net investment loss of $8,084 and accumulated net investment loss of $129,693,237, respectively) | $ 1,500,598,320 | $ 2,602,605,699 |
See accompanying notes which are an integral part of the Consolidated financial statements.
Annual Report
Consolidated Financial Highlights - Class A
Years ended February 28, | 2014 | 2013 | 2012 H | 2011 | 2010 |
Selected Per-Share Data |
|
|
|
|
|
Net asset value, beginning of period | $ 30.25 | $ 45.37 | $ 50.92 | $ 40.50 | $ 30.45 |
Income from Investment Operations |
|
|
|
|
|
Net investment income (loss) C | - I | .07 | (.13) | (.30) | (.25) |
Net realized and unrealized gain (loss) | (8.25) | (15.19) | (2.83) | 15.28 | 11.00 |
Total from investment operations | (8.25) | (15.12) | (2.96) | 14.98 | 10.75 |
Distributions from net realized gain | - | - | (2.59) | (4.57) | (.71) |
Redemption fees added to paid in capital C | .01 | - I | - I | .01 | .01 |
Net asset value, end of period | $ 22.01 | $ 30.25 | $ 45.37 | $ 50.92 | $ 40.50 |
Total Return A, B | (27.24)% | (33.33)% | (6.24)% | 36.99% | 35.19% |
Ratios to Average Net Assets D, G |
|
|
|
|
|
Expenses before reductions | 1.21% | 1.18% | 1.14% | 1.16% | 1.21% |
Expenses net of fee waivers, if any | 1.19% | 1.17% | 1.14% | 1.15% | 1.19% |
Expenses net of all reductions | 1.18% | 1.17% | 1.14% | 1.14% | 1.17% |
Net investment income (loss) | -% F | .18% | (.28)% | (.63)% | (.63)% |
Supplemental Data |
|
|
|
|
|
Net assets, end of period (000 omitted) | $ 60,270 | $ 101,202 | $ 152,969 | $ 149,178 | $ 82,413 |
Portfolio turnover rate E | 56% | 18% | 22% | 35% | 46% |
ATotal returns would have been lower if certain expenses had not been reduced during the applicable periods shown. BTotal returns do not include the effect of the sales charges. CCalculated based on average shares outstanding during the period. DFees and expenses of any underlying Fidelity Central Funds are not included in the Fund's expense ratio. The Fund indirectly bears its proportionate share of the expenses of any underlying Fidelity Central Funds. EAmount does not include the portfolio activity of any underlying Fidelity Central Funds. FAmount represents less than .01%. GExpense ratios reflect operating expenses of the class. Expenses before reductions do not reflect amounts reimbursed by the investment adviser or reductions from brokerage service arrangements or reductions from other expense offset arrangements and do not represent the amount paid by the class during periods when reimbursements or reductions occur. Expenses net of fee waivers reflect expenses after reimbursement by the investment adviser but prior to reductions from brokerage service arrangements or other expense offset arrangements. Expenses net of all reductions represent the net expenses paid by the class. HFor the year ended February 29. IAmount represents less than $.01 per share. |
Consolidated Financial Highlights - Class T
Years ended February 28, | 2014 | 2013 | 2012 G | 2011 | 2010 |
Selected Per-Share Data |
|
|
|
|
|
Net asset value, beginning of period | $ 29.95 | $ 45.04 | $ 50.68 | $ 40.34 | $ 30.36 |
Income from Investment Operations |
|
|
|
|
|
Net investment income (loss) C | (.06) | (.03) | (.27) | (.43) | (.36) |
Net realized and unrealized gain (loss) | (8.17) | (15.06) | (2.80) | 15.21 | 10.96 |
Total from investment operations | (8.23) | (15.09) | (3.07) | 14.78 | 10.60 |
Distributions from net realized gain | - | - | (2.57) | (4.45) | (.63) |
Redemption fees added to paid in capital C | .01 | - H | - H | .01 | .01 |
Net asset value, end of period | $ 21.73 | $ 29.95 | $ 45.04 | $ 50.68 | $ 40.34 |
Total Return A, B | (27.45)% | (33.50)% | (6.49)% | 36.62% | 34.79% |
Ratios to Average Net Assets D, F |
|
|
|
|
|
Expenses before reductions | 1.49% | 1.45% | 1.43% | 1.44% | 1.51% |
Expenses net of fee waivers, if any | 1.47% | 1.44% | 1.42% | 1.42% | 1.49% |
Expenses net of all reductions | 1.46% | 1.44% | 1.42% | 1.42% | 1.47% |
Net investment income (loss) | (.28)% | (.09)% | (.57)% | (.90)% | (.93)% |
Supplemental Data |
|
|
|
|
|
Net assets, end of period (000 omitted) | $ 18,402 | $ 24,913 | $ 40,664 | $ 45,846 | $ 26,256 |
Portfolio turnover rate E | 56% | 18% | 22% | 35% | 46% |
ATotal returns would have been lower if certain expenses had not been reduced during the applicable periods shown. BTotal returns do not include the effect of the sales charges. CCalculated based on average shares outstanding during the period. DFees and expenses of any underlying Fidelity Central Funds are not included in the Fund's expense ratio. The Fund indirectly bears its proportionate share of the expenses of any underlying Fidelity Central Funds. EAmount does not include the portfolio activity of any underlying Fidelity Central Funds. FExpense ratios reflect operating expenses of the class. Expenses before reductions do not reflect amounts reimbursed by the investment adviser or reductions from brokerage service arrangements or reductions from other expense offset arrangements and do not represent the amount paid by the class during periods when reimbursements or reductions occur. Expenses net of fee waivers reflect expenses after reimbursement by the investment adviser but prior to reductions from brokerage service arrangements or other expense offset arrangements. Expenses net of all reductions represent the net expenses paid by the class. GFor the year ended February 29. HAmount represents less than $.01 per share. |
See accompanying notes which are an integral part of the Consolidated financial statements.
Annual Report
Consolidated Financial Highlights - Class B
Years ended February 28, | 2014 | 2013 | 2012 G | 2011 | 2010 |
Selected Per-Share Data |
|
|
|
|
|
Net asset value, beginning of period | $ 29.27 | $ 44.24 | $ 50.02 | $ 39.87 | $ 30.08 |
Income from Investment Operations |
|
|
|
|
|
Net investment income (loss) C | (.16) | (.21) | (.49) | (.66) | (.55) |
Net realized and unrealized gain (loss) | (7.98) | (14.76) | (2.76) | 15.02 | 10.84 |
Total from investment operations | (8.14) | (14.97) | (3.25) | 14.36 | 10.29 |
Distributions from net realized gain | - | - | (2.53) | (4.21) | (.51) |
Redemption fees added to paid in capital C | .01 | - H | - H | - H | .01 |
Net asset value, end of period | $ 21.14 | $ 29.27 | $ 44.24 | $ 50.02 | $ 39.87 |
Total Return A, B | (27.78)% | (33.84)% | (6.95)% | 35.97% | 34.12% |
Ratios to Average Net Assets D, F |
|
|
|
|
|
Expenses before reductions | 1.95% | 1.93% | 1.90% | 1.93% | 2.00% |
Expenses net of fee waivers, if any | 1.93% | 1.92% | 1.90% | 1.92% | 1.98% |
Expenses net of all reductions | 1.93% | 1.91% | 1.90% | 1.91% | 1.96% |
Net investment income (loss) | (.75)% | (.57)% | (1.04)% | (1.39)% | (1.42)% |
Supplemental Data |
|
|
|
|
|
Net assets, end of period (000 omitted) | $ 4,373 | $ 9,423 | $ 20,894 | $ 26,837 | $ 18,340 |
Portfolio turnover rate E | 56% | 18% | 22% | 35% | 46% |
ATotal returns would have been lower if certain expenses had not been reduced during the applicable periods shown. BTotal returns do not include the effect of the contingent deferred sales charge. CCalculated based on average shares outstanding during the period. DFees and expenses of any underlying Fidelity Central Funds are not included in the Fund's expense ratio. The Fund indirectly bears its proportionate share of the expenses of any underlying Fidelity Central Funds. EAmount does not include the portfolio activity of any underlying Fidelity Central Funds. FExpense ratios reflect operating expenses of the class. Expenses before reductions do not reflect amounts reimbursed by the investment adviser or reductions from brokerage service arrangements or reductions from other expense offset arrangements and do not represent the amount paid by the class during periods when reimbursements or reductions occur. Expenses net of fee waivers reflect expenses after reimbursement by the investment adviser but prior to reductions from brokerage service arrangements or other expense offset arrangements. Expenses net of all reductions represent the net expenses paid by the class. GFor the year ended February 29. HAmount represents less than $.01 per share. |
Consolidated Financial Highlights - Class C
Years ended February 28, | 2014 | 2013 | 2012 G | 2011 | 2010 |
Selected Per-Share Data |
|
|
|
|
|
Net asset value, beginning of period | $ 29.15 | $ 44.05 | $ 49.81 | $ 39.75 | $ 30.00 |
Income from Investment Operations |
|
|
|
|
|
Net investment income (loss) C | (.16) | (.20) | (.47) | (.64) | (.53) |
Net realized and unrealized gain (loss) | (7.94) | (14.70) | (2.76) | 14.98 | 10.80 |
Total from investment operations | (8.10) | (14.90) | (3.23) | 14.34 | 10.27 |
Distributions from net realized gain | - | - | (2.53) | (4.28) | (.53) |
Redemption fees added to paid in capital C | .01 | - H | - H | - H | .01 |
Net asset value, end of period | $ 21.06 | $ 29.15 | $ 44.05 | $ 49.81 | $ 39.75 |
Total Return A, B | (27.75)% | (33.83)% | (6.93)% | 36.01% | 34.15% |
Ratios to Average Net Assets D, F |
|
|
|
|
|
Expenses before reductions | 1.96% | 1.93% | 1.87% | 1.89% | 1.97% |
Expenses net of fee waivers, if any | 1.94% | 1.92% | 1.87% | 1.88% | 1.95% |
Expenses net of all reductions | 1.93% | 1.91% | 1.87% | 1.87% | 1.93% |
Net investment income (loss) | (.76)% | (.57)% | (1.01)% | (1.35)% | (1.39)% |
Supplemental Data |
|
|
|
|
|
Net assets, end of period (000 omitted) | $ 33,811 | $ 37,787 | $ 67,996 | $ 72,431 | $ 38,624 |
Portfolio turnover rate E | 56% | 18% | 22% | 35% | 46% |
ATotal returns would have been lower if certain expenses had not been reduced during the applicable periods shown. BTotal returns do not include the effect of the contingent deferred sales charge. CCalculated based on average shares outstanding during the period. DFees and expenses of any underlying Fidelity Central Funds are not included in the Fund's expense ratio. The Fund indirectly bears its proportionate share of the expenses of any underlying Fidelity Central Funds. EAmount does not include the portfolio activity of any underlying Fidelity Central Funds. FExpense ratios reflect operating expenses of the class. Expenses before reductions do not reflect amounts reimbursed by the investment adviser or reductions from brokerage service arrangements or reductions from other expense offset arrangements and do not represent the amount paid by the class during periods when reimbursements or reductions occur. Expenses net of fee waivers reflect expenses after reimbursement by the investment adviser but prior to reductions from brokerage service arrangements or other expense offset arrangements. Expenses net of all reductions represent the net expenses paid by the class. GFor the year ended February 29. HAmount represents less than $.01 per share. |
See accompanying notes which are an integral part of the Consolidated financial statements.
Annual Report
Consolidated Financial Highlights - Gold
Years ended February 28, | 2014 | 2013 | 2012 F | 2011 | 2010 |
Selected Per-Share Data |
|
|
|
|
|
Net asset value, beginning of period | $ 30.72 | $ 45.96 | $ 51.44 | $ 40.85 | $ 30.67 |
Income from Investment Operations |
|
|
|
|
|
Net investment income (loss) B | .06 | .16 | (.02) | (.18) | (.16) |
Net realized and unrealized gain (loss) | (8.38) | (15.40) | (2.85) | 15.43 | 11.10 |
Total from investment operations | (8.32) | (15.24) | (2.87) | 15.25 | 10.94 |
Distributions from net realized gain | - | - | (2.61) | (4.67) | (.77) |
Redemption fees added to paid in capital B | .01 | - G | - G | .01 | .01 |
Net asset value, end of period | $ 22.41 | $ 30.72 | $ 45.96 | $ 51.44 | $ 40.85 |
Total Return A | (27.05)% | (33.16)% | (6.00)% | 37.35% | 35.52% |
Ratios to Average Net Assets C, E |
|
|
|
|
|
Expenses before reductions | .94% | .93% | .89% | .91% | .98% |
Expenses net of fee waivers, if any | .92% | .92% | .89% | .90% | .96% |
Expenses net of all reductions | .91% | .92% | .89% | .89% | .94% |
Net investment income (loss) | .27% | .43% | (.03)% | (.37)% | (.40)% |
Supplemental Data |
|
|
|
|
|
Net assets, end of period (000 omitted) | $ 1,275,913 | $ 2,301,019 | $ 3,924,440 | $ 4,250,249 | $ 2,839,664 |
Portfolio turnover rate D | 56% | 18% | 22% | 35% | 46% |
ATotal returns would have been lower if certain expenses had not been reduced during the applicable periods shown. BCalculated based on average shares outstanding during the period. CFees and expenses of any underlying Fidelity Central Funds are not included in the Fund's expense ratio. The Fund indirectly bears its proportionate share of the expenses of any underlying Fidelity Central Funds. DAmount does not include the portfolio activity of any underlying Fidelity Central Funds. EExpense ratios reflect operating expenses of the class. Expenses before reductions do not reflect amounts reimbursed by the investment adviser or reductions from brokerage service arrangements or reductions from other expense offset arrangements and do not represent the amount paid by the class during periods when reimbursements or reductions occur. Expenses net of fee waivers reflect expenses after reimbursement by the investment adviser but prior to reductions from brokerage service arrangements or other expense offset arrangements. Expenses net of all reductions represent the net expenses paid by the class. FFor the year ended February 29. GAmount represents less than $.01 per share. |
Consolidated Financial Highlights - Institutional Class
Years ended February 28, | 2014 | 2013 | 2012 F | 2011 | 2010 |
Selected Per-Share Data |
|
|
|
|
|
Net asset value, beginning of period | $ 30.69 | $ 45.87 | $ 51.32 | $ 40.77 | $ 30.65 |
Income from Investment Operations |
|
|
|
|
|
Net investment income (loss) B | .07 | .20 | .02 | (.15) | (.15) |
Net realized and unrealized gain (loss) | (8.36) | (15.38) | (2.85) | 15.41 | 11.08 |
Total from investment operations | (8.29) | (15.18) | (2.83) | 15.26 | 10.93 |
Distributions from net realized gain | - | - | (2.62) | (4.72) | (.82) |
Redemption fees added to paid in capital B | .01 | - G | - G | .01 | .01 |
Net asset value, end of period | $ 22.41 | $ 30.69 | $ 45.87 | $ 51.32 | $ 40.77 |
Total Return A | (26.98)% | (33.09)% | (5.94)% | 37.45% | 35.50% |
Ratios to Average Net Assets C, E |
|
|
|
|
|
Expenses before reductions | .87% | .84% | .82% | .85% | .95% |
Expenses net of fee waivers, if any | .85% | .83% | .81% | .84% | .93% |
Expenses net of all reductions | .84% | .82% | .81% | .83% | .91% |
Net investment income (loss) | .34% | .52% | .04% | (.31)% | (.37)% |
Supplemental Data |
|
|
|
|
|
Net assets, end of period (000 omitted) | $ 107,830 | $ 128,262 | $ 168,548 | $ 137,246 | $ 38,037 |
Portfolio turnover rate D | 56% | 18% | 22% | 35% | 46% |
ATotal returns would have been lower if certain expenses had not been reduced during the applicable periods shown. BCalculated based on average shares outstanding during the period. CFees and expenses of any underlying Fidelity Central Funds are not included in the Fund's expense ratio. The Fund indirectly bears its proportionate share of the expenses of any underlying Fidelity Central Funds. DAmount does not include the portfolio activity of any underlying Fidelity Central Funds. EExpense ratios reflect operating expenses of the class. Expenses before reductions do not reflect amounts reimbursed by the investment adviser or reductions from brokerage service arrangements or reductions from other expense offset arrangements and do not represent the amount paid by the class during periods when reimbursements or reductions occur. Expenses net of fee waivers reflect expenses after reimbursement by the investment adviser but prior to reductions from brokerage service arrangements or other expense offset arrangements. Expenses net of all reductions represent the net expenses paid by the class. FFor the year ended February 29. GAmount represents less than $.01 per share. |
See accompanying notes which are an integral part of the Consolidated financial statements.
Annual Report
Notes to Consolidated Financial Statements
For the period ended February 28, 2014
1. Organization.
Gold Portfolio (the Fund) is a non-diversified fund of Fidelity Select Portfolios (the Trust) and is authorized to issue an unlimited number of shares. The Trust is registered under the Investment Company Act of 1940, as amended (the 1940 Act), as an open-end management investment company organized as a Massachusetts business trust. The Fund invests primarily in securities of companies whose principal business activities fall within specific industries. The Fund offers Class A, Class T, Class C, Gold and Institutional Class shares, each of which, along with Class B shares, has equal rights as to assets and voting privileges. Class B shares are closed to new accounts and additional purchases, except for exchanges and reinvestments. Each class has exclusive voting rights with respect to matters that affect that class. Class B shares will automatically convert to Class A shares after a holding period of seven years from the initial date of purchase.
2. Consolidated Subsidiary
The Fund invests in certain commodity-related investments through Fidelity Select Gold Cayman Ltd., a wholly owned subsidiary (the "Subsidiary"). As of February 28, 2014, the Fund held an investment of $225,764,683 in the Subsidiary, representing 15.0% of the Fund's net assets.
The financial statements have been consolidated and include accounts of the Fund and the Subsidiary. Accordingly, all inter-company transactions and balances have been eliminated.
3. Investments in Fidelity Central Funds.
The Fund invests in Fidelity Central Funds, which are open-end investment companies generally available only to other investment companies and accounts managed by the investment adviser and its affiliates. The Fund's Consolidated Schedule of Investments lists each of the Fidelity Central Funds held as of period end, if any, as an investment of the Fund, but does not include the underlying holdings of each Fidelity Central Fund. As an Investing Fund, the Fund indirectly bears its proportionate share of the expenses of the underlying Fidelity Central Funds.
The Money Market Central Funds seek preservation of capital and current income and are managed by Fidelity Investments Money Management, Inc. (FIMM), an affiliate of the investment adviser. Annualized expenses of the Money Market Central Funds as of their most recent shareholder report date are less than .01%.
A complete unaudited list of holdings for each Fidelity Central Fund is available upon request or at the Securities and Exchange Commission (the SEC) website at www.sec.gov. In addition, the financial statements of the Fidelity Central Funds, which are not covered by the Fund's Report of Independent Registered Public Accounting Firm, are available on the SEC website or upon request.
4. Significant Accounting Policies.
The consolidated financial statements have been prepared in conformity with accounting principles generally accepted in the United States of America (GAAP), which require management to make certain estimates and assumptions at the date of the financial statements. Actual results could differ from those estimates. Subsequent events, if any, through the date that the consolidated financial statements were issued have been evaluated in the preparation of the consolidated financial statements. The following summarizes the significant accounting policies of the Fund:
Investment Valuation. Investments are valued as of 4:00 p.m. Eastern time on the last calendar day of the period. In accordance with valuation policies and procedures approved by the Board of Trustees (the Board), the Fund attempts to obtain prices from one or more third party pricing vendors or brokers to value its investments. When current market prices, quotations or currency exchange rates are not readily available or reliable, investments will be fair valued in good faith by the Fidelity SelectCo, LLC (SelectCo) Fair Value Committee (the Committee), in accordance with procedures adopted by the Board. Factors used in determining fair value vary by investment type and may include market or investment specific events. The frequency with which these procedures are used cannot be predicted and they may be utilized to a significant extent. The Committee oversees the Fund's valuation policies and procedures and is responsible for approving and reporting to the Board all fair value determinations.
The Fund categorizes the inputs to valuation techniques used to value its investments into a disclosure hierarchy consisting of three levels as shown below:
Level 1 - quoted prices in active markets for identical investments
Level 2 - other significant observable inputs (including quoted prices for similar investments, interest rates, prepayment speeds, etc.)
Level 3 - unobservable inputs (including the Fund's own assumptions based on the best information available)
Valuation techniques used to value the Fund's investments by major category are as follows:
Equity securities, including restricted securities, for which market quotations are readily available, are valued at the last reported sale price or official closing price as reported by a third party pricing vendor on the primary market or exchange on which they are traded and are categorized as Level 1 in
Annual Report
Notes to Consolidated Financial Statements - continued
4. Significant Accounting Policies - continued
Investment Valuation - continued
the hierarchy. In the event there were no sales during the day or closing prices are not available, securities are valued at the last quoted bid price or may be valued using the last available price and are generally categorized as Level 2 in the hierarchy. For foreign equity securities, when market or security specific events arise, comparisons to the valuation of American Depositary Receipts (ADRs), futures contracts, Exchange-Traded Funds (ETFs) and certain indexes as well as quoted prices for similar securities may be used and would be categorized as Level 2 in the hierarchy. Utilizing these techniques may result in transfers between Level 1 and Level 2. For equity securities, including restricted securities, where observable inputs are limited, assumptions about market activity and risk are used and these securities may be categorized as Level 3 in the hierarchy.
Investments in commodities are valued at their last traded price at 4:00 p.m. Eastern time each business day and are categorized as Level 1 in the hierarchy.
Investments in open-end mutual funds, including the Fidelity Central Funds, are valued at their closing net asset value (NAV) each business day and are categorized as Level 1 in the hierarchy.
Changes in valuation techniques may result in transfers in or out of an assigned level within the disclosure hierarchy. The aggregate value of investments by input level, as of February 28, 2014, is included at the end of the Fund's Consolidated Schedule of Investments.
Foreign Currency. The Fund may use foreign currency contracts to facilitate transactions in foreign-denominated securities. Gains and losses from these transactions may arise from changes in the value of the foreign currency or if the counterparties do not perform under the contracts' terms.
Foreign-denominated assets, including investment securities, and liabilities are translated into U.S. dollars at the exchange rates at period end. Purchases and sales of investment securities, income and dividends received and expenses denominated in foreign currencies are translated into U.S. dollars at the exchange rate in effect on the transaction date.
The effects of exchange rate fluctuations on investments are included with the net realized and unrealized gain (loss) on investment securities. Other foreign currency transactions resulting in realized and unrealized gain (loss) are disclosed separately.
Investment Transactions and Income. For financial reporting purposes, the Fund's investment holdings and NAV include trades executed through the end of the last business day of the period. The NAV per share for processing shareholder transactions is calculated as of the close of business of the New York Stock Exchange (NYSE), normally 4:00 p.m. Eastern time and includes trades executed through the end of the prior business day. Gains and losses on securities sold are determined on the basis of identified cost and may include proceeds received from litigation. Dividend income is recorded on the ex-dividend date, except for certain dividends from foreign securities where the ex-dividend date may have passed, which are recorded as soon as the Fund is informed of the ex-dividend date. Non-cash dividends included in dividend income, if any, are recorded at the fair market value of the securities received. Distributions received on securities that represent a return of capital or capital gain are recorded as a reduction of cost of investments and/or as a realized gain. Subsequent to ex-dividend date the Fund determines the components of these distributions, based upon receipt of tax filings or other correspondence relating to the underlying investment. Interest income and distributions from the Fidelity Central Funds are accrued as earned. Interest income includes coupon interest and amortization of premium and accretion of discount on debt securities. Investment income is recorded net of foreign taxes withheld where recovery of such taxes is uncertain.
Class Allocations and Expenses. Investment income, realized and unrealized capital gains and losses, common expenses of the Fund, and certain fund-level expense reductions, if any, are allocated daily on a pro-rata basis to each class based on the relative net assets of each class to the total net assets of the Fund. Each class differs with respect to transfer agent and distribution and service plan fees incurred. Certain expense reductions may also differ by class. For the reporting period, the allocated portion of income and expenses to each class as a percent of its average net assets may vary due to the timing of recording these transactions in relation to fluctuating net assets of the classes. Expenses directly attributable to a fund are charged to that fund. Expenses attributable to more than one fund are allocated among the respective funds on the basis of relative net assets or other appropriate methods. Expense estimates are accrued in the period to which they relate and adjustments are made when actual amounts are known.
Deferred Trustee Compensation. Under a Deferred Compensation Plan (the Plan), independent Trustees may elect to defer receipt of a portion of their annual compensation. Deferred amounts are invested in a cross-section of Fidelity funds, are marked-to-market and remain in the Fund until distributed in accordance with the Plan. The investment of deferred amounts and the offsetting payable to the Trustees are included in the accompanying Consolidated Statement of Assets and Liabilities.
Income Tax Information and Distributions to Shareholders. Each year, the Fund intends to qualify as a regulated investment company under Subchapter M of the Internal Revenue Code, including distributing substantially all of its taxable income and realized gains. As a result, no provision for U.S. Federal income taxes is required. As of February 28, 2014, the Fund did not have any unrecognized tax benefits in the consolidated financial statements; nor is the Fund aware of any tax positions for which it is reasonably possible that the total amounts of unrecognized tax benefits will significantly change in the next twelve months. The Fund files a U.S. federal tax return, in addition to state and local tax returns as required. The Fund's federal income tax returns are subject to examination by the Internal Revenue Service (IRS) for a period of three fiscal years after they are filed. State and local tax returns may be subject to examination for an additional fiscal year depending on the jurisdiction. Foreign taxes are provided for based on the Fund's understanding of the tax rules and rates that exist in the foreign markets in which it invests.
Annual Report
4. Significant Accounting Policies - continued
Income Tax Information and Distributions to Shareholders - continued
The Subsidiary is classified as a controlled foreign corporation under Subchapter N of the Internal Revenue Code. Therefore, the Fund is required to increase its taxable income by its share of the Subsidiary's income. Net investment losses of the Subsidiary cannot be deducted by the Fund in the current period nor carried forward to offset taxable income in future periods.
Distributions are declared and recorded on the ex-dividend date. Income dividends and capital gain distributions are declared separately for each class. Income and capital gain distributions are determined in accordance with income tax regulations, which may differ from GAAP.
Capital accounts within the consolidated financial statements are adjusted for permanent book-tax differences. These adjustments have no impact on net assets or the results of operations. Capital accounts are not adjusted for temporary book-tax differences which will reverse in a subsequent period.
Book-tax differences are primarily due to foreign currency transactions, passive foreign investment companies (PFIC), controlled foreign corporation, deferred trustees compensation, net operating losses and losses deferred due to wash sales and excise tax regulations.
The federal tax cost of investment securities and unrealized appreciation (depreciation) as of period end on an unconsolidated basis were as follows:
Gross unrealized appreciation | $ 176,511,772 |
Gross unrealized depreciation | (654,568,628) |
Net unrealized appreciation (depreciation) on securities and other investments | $ (478,056,856) |
|
|
Tax Cost | $ 2,167,083,719 |
The tax-based components of distributable earnings as of period end were as follows:
Capital loss carryforward | (756,775,673) |
Net unrealized appreciation (depreciation) | $ (478,053,861) |
Capital loss carryforwards are only available to offset future capital gains of the Fund to the extent provided by regulations and may be limited. Under the Regulated Investment Company Modernization Act of 2010 (the Act), the Fund is permitted to carry forward capital losses incurred in taxable years beginning after December 22, 2010 for an unlimited period and such capital losses are required to be used prior to any losses that expire. The capital loss carryforward information presented below, including any applicable limitation, is estimated as of fiscal period end and is subject to adjustment.
No expiration |
|
Short-term | $ (124,603,254) |
Long-term | (632,172,419) |
Total capital loss carryforward | $ (756,775,673) |
Trading (Redemption) Fees. Shares held by investors in the Fund less than 30 days may be subject to a redemption fee equal to .75% of the NAV of shares redeemed. All redemption fees, which reduce the proceeds of the shareholder redemption, are retained by the Fund and accounted for as an addition to paid in capital.
Restricted Securities. The Fund may invest in securities that are subject to legal or contractual restrictions on resale. These securities generally may be resold in transactions exempt from registration or to the public if the securities are registered. Disposal of these securities may involve time-consuming negotiations and expense, and prompt sale at an acceptable price may be difficult. Information regarding restricted securities is included at the end of the Fund's Consolidated Schedule of Investments.
5. Purchases and Sales of Investments.
Purchases and sales of securities, other than short-term securities, aggregated $858,721,529 and $1,325,762,629, respectively.
Annual Report
Notes to Consolidated Financial Statements - continued
6. Fees and Other Transactions with Affiliates.
Management Fee. Effective August 1, 2013, SelectCo replaced Fidelity Management and Research Company (FMR), an affiliate of SelectCo, as investment adviser to the Fund. The investment adviser and its affiliates provide the Fund with investment management related services for which the Fund pays a monthly management fee. The management fee is the sum of an individual fund fee rate that is based on an annual rate of .30% of the Fund's average net assets and an annualized group fee rate that averaged .25% during the period. The group fee rate is based upon the average net assets of all the mutual funds advised by FMR and the investment adviser. The group fee rate decreases as assets under management increase and increases as assets under management decrease.
FMR, either through itself or through an affiliate provides investment management related services to the Subsidiary for which the Subsidiary pays a monthly management fee at the annual rate of .30% of its net assets. Under the management contract with the subsidiary, FMR pays all other expenses of the Subsidiary, except custodian fees.
For the reporting period, the total consolidated annual management fee rate which includes the management fee of the Fund and the Subsidiary was .58% of the Fund's average net assets.
During the period, the investment adviser waived a portion of the Fund's management fee representing the amount of the management fee paid by the Subsidiary to FMR as described in the Expense Reductions note.
Distribution and Service Plan Fees. In accordance with Rule 12b-1 of the 1940 Act, the Fund has adopted separate Distribution and Service Plans for each class of shares. Certain classes pay Fidelity Distributors Corporation (FDC), an affiliate of the investment adviser, separate Distribution and Service Fees, each of which is based on an annual percentage of each class' average net assets. In addition, FDC may pay financial intermediaries for selling shares of the Fund and providing shareholder support services. For the period, the Distribution and Service Fee rates, total fees and amounts retained by FDC were as follows:
| Distribution | Service | Total Fees | Retained |
Class A | -% | .25% | $ 161,900 | $ 1,074 |
Class T | .25% | .25% | 88,960 | 381 |
Class B | .75% | .25% | 54,419 | 40,947 |
Class C | .75% | .25% | 267,675 | 52,061 |
|
|
| $ 572,954 | $ 94,463 |
Sales Load. FDC may receive a front-end sales charge of up to 5.75% for selling Class A shares and 3.50% for selling Class T shares, some of which is paid to financial intermediaries for selling shares of the Fund. Depending on the holding period, FDC may receive contingent deferred sales charges levied on Class A, Class T, Class B, and Class C redemptions. The deferred sales charges range from 5.00% to 1.00% for Class B shares, 1.00% for Class C shares, 1.00% for certain purchases of Class A shares and .25% for certain purchases of Class T shares.
For the period, sales charge amounts retained by FDC were as follows:
| Retained |
Class A | $ 37,429 |
Class T | 9,708 |
Class B* | 26,333 |
Class C* | 6,034 |
| $ 79,504 |
* When Class B and Class C shares are initially sold, FDC pays commissions from its own resources to financial intermediaries through which the sales are made.
Transfer Agent Fees. Fidelity Investments Institutional Operations Company, Inc., (FIIOC), an affiliate of the investment adviser, is the transfer, dividend disbursing and shareholder servicing agent for each class of the Fund. FIIOC receives account fees and asset-based fees that vary according to the account size and type of account of the shareholders of the respective classes of the Fund. FIIOC pays for typesetting, printing and mailing of shareholder reports, except proxy statements.
Annual Report
6. Fees and Other Transactions with Affiliates - continued
Transfer Agent Fees - continued
For the period, transfer agent fees for each applicable class were as follows:
| Amount | % of |
Class A | $ 190,562 | .29 |
Class T | 57,622 | .32 |
Class B | 15,892 | .29 |
Class C | 78,281 | .29 |
Gold | 3,485,369 | .27 |
Institutional Class | 196,508 | .20 |
| $ 4,024,234 |
|
Accounting and Security Lending Fees. Fidelity Service Company, Inc. (FSC), an affiliate of the investment adviser, maintains the Fund's accounting records. The accounting fee is based on the level of average net assets for each month. Under a separate contract, FSC administers the security lending program. The security lending fee is based on the number and duration of lending transactions.
Brokerage Commissions. The Fund placed a portion of its portfolio transactions with brokerage firms which are affiliates of the investment adviser. Brokerage commissions are included in net realized gain (loss) and change in net unrealized appreciation (depreciation) in the Consolidated Statement of Operations. The commissions paid to these affiliated firms were $30,538 for the period.
Interfund Lending Program. Pursuant to an Exemptive Order issued by the SEC, the Fund, along with other registered investment companies having management contracts with FMR or other affiliated entities of FMR, may participate in an interfund lending program. This program provides an alternative credit facility allowing the funds to borrow from, or lend money to, other participating affiliated funds. At period end, there were no interfund loans outstanding. The Fund's activity in this program during the period for which loans were outstanding was as follows:
Borrower or Lender | Average Loan | Weighted Average | Interest |
Borrower | $ 11,641,313 | .34% | $ 3,525 |
7. Committed Line of Credit.
The Fund participates with other funds managed by the investment adviser or an affiliate in a $4.25 billion credit facility (the "line of credit") to be utilized for temporary or emergency purposes to fund shareholder redemptions or for other short-term liquidity purposes. The Fund has agreed to pay commitment fees on its pro-rata portion of the line of credit, which amounted to $3,662 and is reflected in Miscellaneous expenses on the Consolidated Statement of Operations. During the period, there were no borrowings on this line of credit.
8. Security Lending.
The Fund lends portfolio securities through a lending agent from time to time in order to earn additional income. For equity securities, a lending agent is used and may loan securities to certain qualified borrowers, which prior to August 1, 2013 included Fidelity Capital Markets (FCM), a broker-dealer affiliated with the Fund. On the settlement date of the loan, the Fund receives collateral (in the form of U.S. Treasury obligations, letters of credit and/or cash) against the loaned securities and maintains collateral in an amount not less than 100% of the market value of the loaned securities during the period of the loan. The market value of the loaned securities is determined at the close of business of the Fund and any additional required collateral is delivered to the Fund on the next business day. If the borrower defaults on its obligation to return the securities loaned because of insolvency or other reasons, the Fund may apply collateral received from the borrower against the obligation. The Fund may experience delays and costs in recovering the securities loaned. Any cash collateral received is invested in the Fidelity Securities Lending Cash Central Fund. The value of loaned securities and cash collateral at period end are disclosed on the Fund's Consolidated Statement of Assets and Liabilities. At period end, there were no security loans outstanding with FCM. Security lending income represents the income earned on investing cash collateral, less rebates paid to borrowers and any lending agent fees associated with the loan, plus any premium payments received for lending certain types of securities. Security lending income is presented in the Consolidated Statement of Operations as a component of income from Fidelity Central Funds. Total security lending income during the period amounted to $598,267 and includes $70 from securities loaned to FCM.
Annual Report
Notes to Consolidated Financial Statements - continued
9. Expense Reductions.
The investment adviser has contractually agreed to waive the Fund's management fee in an amount equal to the management fee paid by the Subsidiary to FMR. During the period, this waiver reduced the Fund's management fee by $344,911. Commissions paid to certain brokers with whom the investment adviser, or its affiliates, places trades on behalf of the Fund include an amount in addition to trade execution, which may be rebated back to the Fund to offset certain expenses. This amount totaled $79,125 for the period.
In addition, FMR reimbursed a portion of the Fund's operating expenses during the period in the amount of $22,822.
10. Share Transactions.
Transactions for each class of shares were as follows:
| Shares | Dollars | ||
Years ended February 28, | 2014 | 2013 | 2014 | 2013 |
Class A |
|
|
|
|
Shares sold | 1,443,614 | 1,412,697 | $ 31,671,750 | $ 53,420,103 |
Shares redeemed | (2,051,264) | (1,438,620) | (45,809,186) | (53,775,838) |
Net increase (decrease) | (607,650) | (25,923) | $ (14,137,436) | $ (355,735) |
Class T |
|
|
|
|
Shares sold | 364,459 | 284,748 | $ 7,796,316 | $ 10,411,769 |
Shares redeemed | (349,602) | (355,685) | (7,601,870) | (13,010,570) |
Net increase (decrease) | 14,857 | (70,937) | $ 194,446 | $ (2,598,801) |
Class B |
|
|
|
|
Shares sold | 23,041 | 16,804 | $ 484,615 | $ 624,661 |
Shares redeemed | (138,145) | (167,215) | (3,024,154) | (6,101,257) |
Net increase (decrease) | (115,104) | (150,411) | $ (2,539,539) | $ (5,476,596) |
Class C |
|
|
|
|
Shares sold | 877,429 | 311,882 | $ 17,346,606 | $ 11,372,831 |
Shares redeemed | (567,911) | (559,180) | (12,102,759) | (20,004,404) |
Net increase (decrease) | 309,518 | (247,298) | $ 5,243,847 | $ (8,631,573) |
Gold |
|
|
|
|
Shares sold | 32,449,288 | 22,313,552 | $ 718,341,081 | $ 848,495,476 |
Shares redeemed | (50,439,253) | (32,795,078) | (1,182,529,714) | (1,225,752,483) |
Net increase (decrease) | (17,989,965) | (10,481,526) | $ (464,188,633) | $ (377,257,007) |
Institutional Class |
|
|
|
|
Shares sold | 2,126,861 | 1,354,134 | $ 46,661,254 | $ 51,488,741 |
Shares redeemed | (1,494,359) | (849,045) | (32,364,497) | (31,583,828) |
Net increase (decrease) | 632,502 | 505,089 | $ 14,296,757 | $ 19,904,913 |
11. Other.
The Fund's organizational documents provide former and current trustees and officers with a limited indemnification against liabilities arising in connection with the performance of their duties to the Fund. In the normal course of business, the Fund may also enter into contracts that provide general indemnifications. The Fund's maximum exposure under these arrangements is unknown as this would be dependent on future claims that may be made against the Fund. The risk of material loss from such claims is considered remote.
Annual Report
Materials Portfolio
Performance: The Bottom Line
Average annual total return reflects the change in the value of an investment, assuming reinvestment of the class' distributions from dividend income and capital gains (the profits earned upon the sale of securities that have grown in value, if any) and assuming a constant rate of performance each year. The $10,000 table and the fund's returns do not reflect the deduction of taxes that a shareholder would pay on fund distributions or the redemption of fund shares. During periods of reimbursement by Fidelity, a fund's total return will be greater than it would be had the reimbursement not occurred. How a fund did yesterday is no guarantee of how it will do tomorrow.
Average Annual Total Returns
Periods ended February 28, 2014 | Past 1 | Past 5 | Past 10 |
Materials Portfolio A | 20.80% | 28.22% | 12.66% |
A Prior to October 1, 2006, Materials Portfolio was named Industrial Materials Portfolio, and the fund operated under certain different investment policies and compared its performance to a different additional index. The fund's historical performance may not represent its current investment policies.
$10,000 Over 10 Years
Let's say hypothetically that $10,000 was invested in Materials Portfolio, a class of the fund, on February 29, 2004. The chart shows how the value of your investment would have changed, and also shows how the S&P 500 Index performed over the same period.
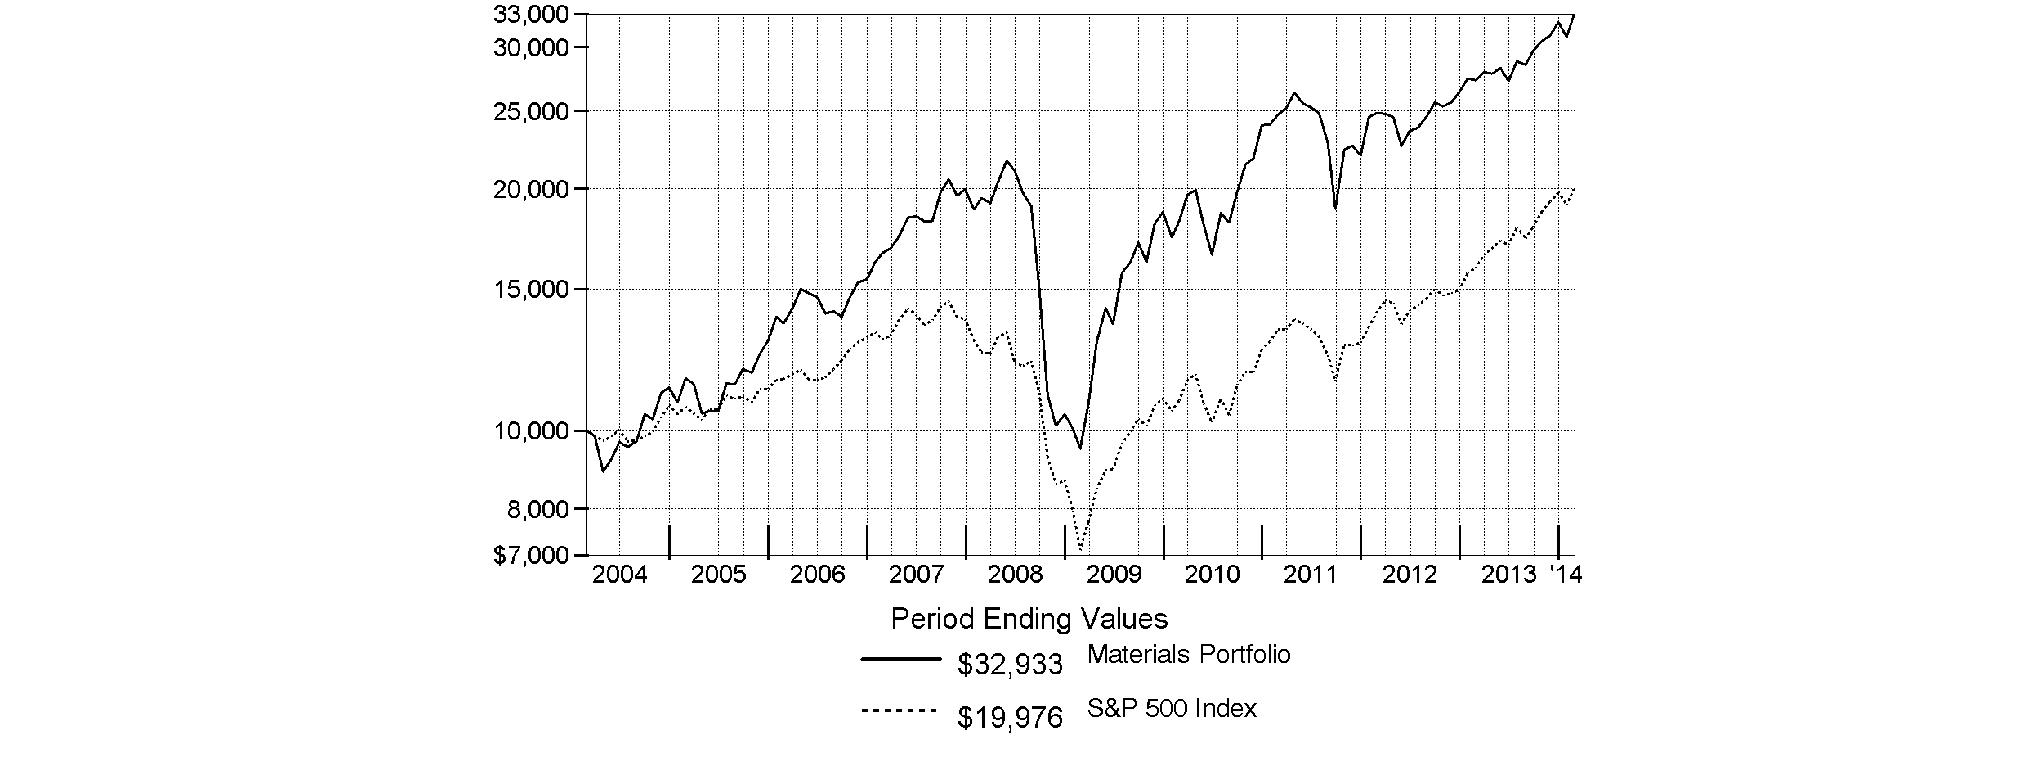
Annual Report
Materials Portfolio
Management's Discussion of Fund Performance
Market Recap: Stocks overcame fears of higher interest rates - not to mention their worst January in four years - to finish sharply higher for the 12 months ending February 28, 2014. The broad S&P 500® Index and the blue-chip Dow Jones Industrial AverageSM gained 25.37% and 19.01%, respectively, amid generally favorable earnings reports and accommodative monetary policies worldwide. Performance generally increased along the risk spectrum, with smaller-cap and growth strategies leading the way. An ebullient market helped the growth-oriented Nasdaq Composite Index® to a 38.10% period gain, for example. On the other hand, both cyclical and defensive stocks had representation in the top-performing industry sectors: returns were highest in health care and consumer discretionary; lowest in utilities and telecommunication services. From a macroeconomic perspective, data still points to slow but steady improvement in the U.S., and Europe's recession may well be over. Reports from China have disappointed, but continue to suggest a relatively soft landing there. Mixed signals from the U.S. Federal Reserve as to when it might curtail its stimulative bond buying kept markets in flux during the spring and summer. Stocks regained momentum in October despite a federal budget impasse and brief government shutdown, and lower volatility prevailed through year-end. Shedding new-year concerns about China's economy, an emerging-markets sell-off and confirmation (at last) of Fed tapering - alongside confirmation of a presumably dovish Janet Yellen as new Fed chair - February saw stocks back in record territory, bearing down on the five-year anniversary of the market's bottom.
Comments from Tobias Welo, Portfolio Manager of Materials Portfolio: For the year, the fund's Retail Class shares returned 20.80%, trailing the 24.53% advance of the MSCI® U.S. IMI Materials 25-50 Index and also lagging the S&P 500®. Versus the broader market, extreme weakness in gold and other precious metals weighed on the materials sector, while diversified chemicals and specialty chemicals were some of the stronger groups in the MSCI index. The fund's performance versus the MSCI index was held back the most by avoiding two large, strong-performing benchmark constituents, DuPont and Dow Chemical, for nearly the entire period. Both stocks were sold from the fund early in April. Gold miner Goldcorp, based in Canada, also was a significant detractor. Amid a sizable decline in the price of gold and rising exploration and production costs, I sold Goldcorp. Further weighing on our results was commodity chemicals manufacturer Axiall. Coal miner Peabody Energy worked against us as well. Goldcorp and Peabody Energy were not in the index. On the positive side, largely avoiding gold miner and index stock Newmont Mining, which I sold, made this stock easily the fund's largest relative contributor. Within the diversified metals & mining segment, not owning copper producer Freeport-McMoRan Copper & Gold, another index component, worked in our favor, as demand in this market remained lackluster. Positioning in the fertilizers & agricultural chemicals group also aided performance versus the MSCI index. The main performance boost from this group came from not owning weak-performing index stock Mosaic, a phosphate producer. Meanwhile, positioning in CF Industries Holdings, primarily a manufacturer of nitrogen fertilizer products, paid off for the fund.
The views expressed above reflect those of the portfolio manager(s) only through the end of the period as stated on the cover of this report and do not necessarily represent the views of Fidelity or any other person in the Fidelity organization. Any such views are subject to change at any time based upon market or other conditions and Fidelity disclaims any responsibility to update such views. These views may not be relied on as investment advice and, because investment decisions for a Fidelity fund are based on numerous factors, may not be relied on as an indication of trading intent on behalf of any Fidelity fund.
Annual Report
Materials Portfolio
Shareholder Expense Example
As a shareholder of the Fund, you incur two types of costs: (1) transaction costs, including sales charges (loads) on purchase payments or redemption proceeds, redemption fees and (2) ongoing costs, including management fees, distribution and/or service (12b-1) fees and other Fund expenses. This Example is intended to help you understand your ongoing costs (in dollars) of investing in the Fund and to compare these costs with the ongoing costs of investing in other mutual funds.
The Example is based on an investment of $1,000 invested at the beginning of the period and held for the entire period (September 1, 2013 to February 28, 2014).
Actual Expenses
The first line of the accompanying table for each class of the Fund provides information about actual account values and actual expenses. You may use the information in this line, together with the amount you invested, to estimate the expenses that you paid over the period. Simply divide your account value by $1,000.00 (for example, an $8,600 account value divided by $1,000.00 = 8.6), then multiply the result by the number in the first line for a class of the Fund under the heading entitled "Expenses Paid During Period" to estimate the expenses you paid on your account during this period. A small balance maintenance fee of $12.00 that is charged once a year may apply for certain accounts with a value of less than $2,000. This fee is not included in the table below. If it was, the estimate of expenses you paid during the period would be higher, and your ending account value lower, by this amount. In addition, the Fund, as a shareholder in the underlying Fidelity Central Funds, will indirectly bear its pro-rata share of the fees and expenses incurred by the underlying Fidelity Central Funds. These fees and expenses are not included in the Fund's annualized expense ratio used to calculate the expense estimate in the table below.
Hypothetical Example for Comparison Purposes
The second line of the accompanying table for each class of the Fund provides information about hypothetical account values and hypothetical expenses based on a Class' actual expense ratio and an assumed rate of return of 5% per year before expenses, which is not the Class' actual return. The hypothetical account values and expenses may not be used to estimate the actual ending account balance or expenses you paid for the period. You may use this information to compare the ongoing costs of investing in the Fund and other funds. To do so, compare this 5% hypothetical example with the 5% hypothetical examples that appear in the shareholder reports of the other funds. A small balance maintenance fee of $12.00 that is charged once a year may apply for certain accounts with a value of less than $2,000. This fee is not included in the table below. If it was, the estimate of expenses you paid during the period would be higher, and your ending account value lower, by this amount. In addition, the Fund, as a shareholder in the underlying Fidelity Central Funds, will indirectly bear its pro-rata share of the fees and expenses incurred by the underlying Fidelity Central Funds. These fees and expenses are not included in the Fund's annualized expense ratio used to calculate the expense estimate in the table below.
Please note that the expenses shown in the table are meant to highlight your ongoing costs only and do not reflect any transaction costs. Therefore, the second line of the table is useful in comparing ongoing costs only, and will not help you determine the relative total costs of owning different funds. In addition, if these transactional costs were included, your costs would have been higher.
| Annualized | Beginning | Ending | Expenses Paid |
Class A | 1.08% |
|
|
|
Actual |
| $ 1,000.00 | $ 1,152.50 | $ 5.76 |
HypotheticalA |
| $ 1,000.00 | $ 1,019.44 | $ 5.41 |
Class T | 1.39% |
|
|
|
Actual |
| $ 1,000.00 | $ 1,150.80 | $ 7.41 |
HypotheticalA |
| $ 1,000.00 | $ 1,017.90 | $ 6.95 |
Class B | 1.91% |
|
|
|
Actual |
| $ 1,000.00 | $ 1,147.80 | $ 10.17 |
HypotheticalA |
| $ 1,000.00 | $ 1,015.32 | $ 9.54 |
Class C | 1.84% |
|
|
|
Actual |
| $ 1,000.00 | $ 1,148.30 | $ 9.80 |
HypotheticalA |
| $ 1,000.00 | $ 1,015.67 | $ 9.20 |
Materials | .81% |
|
|
|
Actual |
| $ 1,000.00 | $ 1,154.10 | $ 4.33 |
HypotheticalA |
| $ 1,000.00 | $ 1,020.78 | $ 4.06 |
Institutional Class | .80% |
|
|
|
Actual |
| $ 1,000.00 | $ 1,154.10 | $ 4.27 |
HypotheticalA |
| $ 1,000.00 | $ 1,020.83 | $ 4.01 |
A 5% return per year before expenses
B Annualized expense ratio reflects expenses net of applicable fee waivers.
* Expenses are equal to each Class' annualized expense ratio, multiplied by the average account value over the period, multiplied by 181/365 (to reflect the one-half year period).
Annual Report
Materials Portfolio
Investment Changes (Unaudited)
Top Ten Stocks as of February 28, 2014 | ||
| % of fund's | % of fund's net assets |
Monsanto Co. | 9.4 | 9.8 |
LyondellBasell Industries NV Class A | 6.8 | 6.0 |
Praxair, Inc. | 5.6 | 6.1 |
FMC Corp. | 5.4 | 4.8 |
Eastman Chemical Co. | 4.9 | 4.5 |
CF Industries Holdings, Inc. | 4.4 | 1.5 |
Vulcan Materials Co. | 3.9 | 2.9 |
Rock-Tenn Co. Class A | 3.6 | 3.2 |
International Paper Co. | 3.6 | 3.9 |
W.R. Grace & Co. | 3.2 | 2.6 |
| 50.8 | |
Top Industries (% of fund's net assets) | |||
As of February 28, 2014 | |||
| Chemicals | 69.7% |
|
| Containers & Packaging | 9.8% |
|
| Metals & Mining | 6.9% |
|
| Construction Materials | 5.7% |
|
| Paper & Forest Products | 4.7% |
|
| All Others* | 3.2% |
|

As of August 31, 2013 | |||
| Chemicals | 67.1% |
|
| Containers & Packaging | 10.3% |
|
| Metals & Mining | 9.7% |
|
| Paper & Forest Products | 4.7% |
|
| Construction Materials | 4.4% |
|
| All Others* | 3.8% |
|

* Includes short-term investments and net other assets (liabilities). |
Annual Report
Materials Portfolio
Investments February 28, 2014
Showing Percentage of Net Assets
Common Stocks - 99.1% | |||
Shares | Value | ||
CHEMICALS - 69.7% | |||
Commodity Chemicals - 11.7% | |||
Axiall Corp. | 1,153,057 | $ 46,664,217 | |
Cabot Corp. | 968,987 | 52,460,956 | |
LyondellBasell Industries NV Class A | 1,586,496 | 139,738,568 | |
Methanex Corp. | 29,500 | 2,067,371 | |
| 240,931,112 | ||
Diversified Chemicals - 11.5% | |||
Eastman Chemical Co. | 1,144,130 | 100,031,286 | |
FMC Corp. | 1,449,536 | 111,875,188 | |
Lanxess AG | 144,255 | 10,708,414 | |
Olin Corp. (d) | 564,517 | 14,784,700 | |
| 237,399,588 | ||
Fertilizers & Agricultural Chemicals - 16.9% | |||
CF Industries Holdings, Inc. | 360,262 | 90,389,736 | |
Intrepid Potash, Inc. (a)(d) | 719,334 | 10,653,337 | |
Monsanto Co. | 1,753,830 | 192,956,376 | |
Potash Corp. of Saskatchewan, Inc. (d) | 1,647,520 | 54,456,093 | |
| 348,455,542 | ||
Industrial Gases - 7.4% | |||
Airgas, Inc. | 345,096 | 37,201,349 | |
Praxair, Inc. | 886,374 | 115,556,578 | |
| 152,757,927 | ||
Specialty Chemicals - 22.2% | |||
Ashland, Inc. | 294,815 | 27,821,692 | |
Celanese Corp. Class A | 500,993 | 26,748,016 | |
Chemtura Corp. (a) | 635,609 | 15,731,323 | |
Cytec Industries, Inc. | 308,814 | 29,235,421 | |
Ecolab, Inc. | 506,820 | 54,609,855 | |
Ferro Corp. (a) | 119,604 | 1,569,204 | |
H.B. Fuller Co. | 235,851 | 11,434,056 | |
Innospec, Inc. | 175,792 | 7,648,710 | |
NewMarket Corp. | 85,676 | 31,671,847 | |
PPG Industries, Inc. | 234,483 | 46,385,427 | |
Royal DSM NV | 245,999 | 15,719,579 | |
RPM International, Inc. | 411,449 | 17,223,255 | |
Sherwin-Williams Co. | 289,154 | 57,969,594 | |
Sigma Aldrich Corp. | 528,721 | 49,916,550 | |
W.R. Grace & Co. (a) | 646,640 | 65,530,498 | |
| 459,215,027 | ||
TOTAL CHEMICALS | 1,438,759,196 | ||
CONSTRUCTION MATERIALS - 5.7% | |||
Construction Materials - 5.7% | |||
Eagle Materials, Inc. | 426,955 | 37,742,822 | |
Vulcan Materials Co. | 1,163,835 | 79,059,312 | |
| 116,802,134 | ||
| |||
Shares | Value | ||
CONTAINERS & PACKAGING - 9.8% | |||
Metal & Glass Containers - 2.7% | |||
Aptargroup, Inc. | 464,324 | $ 30,724,319 | |
Silgan Holdings, Inc. | 495,965 | 23,910,473 | |
| 54,634,792 | ||
Paper Packaging - 7.1% | |||
Graphic Packaging Holding Co. (a) | 5,033,595 | 51,544,013 | |
MeadWestvaco Corp. | 590,966 | 22,119,857 | |
Rock-Tenn Co. Class A | 659,271 | 73,587,829 | |
| 147,251,699 | ||
TOTAL CONTAINERS & PACKAGING | 201,886,491 | ||
METALS & MINING - 6.9% | |||
Diversified Metals & Mining - 1.4% | |||
Copper Mountain Mining Corp. (a) | 4,161,827 | 8,268,779 | |
First Quantum Minerals Ltd. | 1,065,500 | 20,669,141 | |
| 28,937,920 | ||
Gold - 1.6% | |||
Franco-Nevada Corp. | 199,900 | 10,216,148 | |
Royal Gold, Inc. | 339,504 | 23,327,320 | |
| 33,543,468 | ||
Steel - 3.9% | |||
Carpenter Technology Corp. | 578,733 | 34,232,057 | |
Haynes International, Inc. | 53,562 | 2,652,926 | |
Reliance Steel & Aluminum Co. | 479,827 | 33,242,415 | |
Worthington Industries, Inc. | 256,272 | 10,215,002 | |
| 80,342,400 | ||
TOTAL METALS & MINING | 142,823,788 | ||
OIL, GAS & CONSUMABLE FUELS - 2.3% | |||
Coal & Consumable Fuels - 2.3% | |||
Peabody Energy Corp. | 2,685,037 | 47,149,250 | |
PAPER & FOREST PRODUCTS - 4.7% | |||
Forest Products - 0.3% | |||
Boise Cascade Co. | 242,804 | 7,184,570 | |
Paper Products - 4.4% | |||
International Paper Co. | 1,504,502 | 73,555,103 | |
P.H. Glatfelter Co. | 568,979 | 17,268,513 | |
| 90,823,616 | ||
TOTAL PAPER & FOREST PRODUCTS | 98,008,186 | ||
TOTAL COMMON STOCKS (Cost $1,492,773,571) |
| ||
Convertible Bonds - 0.4% | ||||
| Principal | Value | ||
BUILDING PRODUCTS - 0.4% | ||||
Building Products - 0.4% | ||||
Aspen Aerogels, Inc. 8% 6/1/14 (e) | $ 7,861,200 | $ 7,861,200 | ||
Money Market Funds - 3.6% | |||
Shares |
| ||
Fidelity Cash Central Fund, 0.10% (b) | 8,860,056 | 8,860,056 | |
Fidelity Securities Lending Cash Central Fund, 0.09% (b)(c) | 64,829,475 | 64,829,475 | |
TOTAL MONEY MARKET FUNDS (Cost $73,689,531) |
| ||
TOTAL INVESTMENT PORTFOLIO - 103.1% (Cost $1,574,324,302) | 2,126,979,776 | ||
NET OTHER ASSETS (LIABILITIES) - (3.1)% | (63,524,892) | ||
NET ASSETS - 100% | $ 2,063,454,884 | ||
Legend |
(a) Non-income producing |
(b) Affiliated fund that is generally available only to investment companies and other accounts managed by Fidelity Investments. The rate quoted is the annualized seven-day yield of the fund at period end. A complete unaudited listing of the fund's holdings as of its most recent quarter end is available upon request. In addition, each Fidelity Central Fund's financial statements, which are not covered by the Fund's Report of Independent Registered Public Accounting Firm, are available on the SEC's website or upon request. |
(c) Investment made with cash collateral received from securities on loan. |
(d) Security or a portion of the security is on loan at period end. |
(e) Restricted securities - Investment in securities not registered under the Securities Act of 1933 (excluding 144A issues). At the end of the period, the value of restricted securities (excluding 144A issues) amounted to $7,861,200 or 0.4% of net assets. |
Additional information on each restricted holding is as follows: |
Security | Acquisition Date | Acquisition Cost |
Aspen Aerogels, Inc. 8% 6/1/14 | 6/1/11 | $ 7,861,200 |
Affiliated Central Funds |
Information regarding fiscal year to date income earned by the Fund from investments in Fidelity Central Funds is as follows: |
Fund | Income earned |
Fidelity Cash Central Fund | $ 34,198 |
Fidelity Securities Lending Cash Central Fund | 215,485 |
Total | $ 249,683 |
Other Information |
The following is a summary of the inputs used, as of February 28, 2014, involving the Fund's assets and liabilities carried at fair value. The inputs or methodology used for valuing securities may not be an indication of the risk associated with investing in those securities. For more information on valuation inputs, and their aggregation into the levels used in the table below, please refer to the Investment Valuation section in the accompanying Notes to Financial Statements. |
Valuation Inputs at Reporting Date: | ||||
Description | Total | Level 1 | Level 2 | Level 3 |
Investments in Securities: | ||||
Common Stocks | $ 2,045,429,045 | $ 2,045,429,045 | $ - | $ - |
Convertible Bonds | 7,861,200 | - | - | 7,861,200 |
Money Market Funds | 73,689,531 | 73,689,531 | - | - |
Total Investments in Securities: | $ 2,126,979,776 | $ 2,119,118,576 | $ - | $ 7,861,200 |
Distribution of investments by country or territory of incorporation, as a percentage of total net assets, is as follows (Unaudited): |
United States of America | 87.3% |
Netherlands | 7.6% |
Canada | 4.6% |
Others (Individually Less Than 1%) | 0.5% |
| 100.0% |
See accompanying notes which are an integral part of the financial statements.
Annual Report
Materials Portfolio
Financial Statements
Statement of Assets and Liabilities
| February 28, 2014 | |
|
|
|
Assets | ||
Investment in securities, at value (including securities loaned of $61,977,734) - See accompanying schedule: Unaffiliated issuers (cost $1,500,634,771) | $ 2,053,290,245 |
|
Fidelity Central Funds (cost $73,689,531) | 73,689,531 |
|
Total Investments (cost $1,574,324,302) |
| $ 2,126,979,776 |
Receivable for fund shares sold | 3,007,999 | |
Dividends receivable | 3,234,090 | |
Interest receivable | 1,894,269 | |
Distributions receivable from Fidelity Central Funds | 10,136 | |
Prepaid expenses | 9,111 | |
Other receivables | 34,983 | |
Total assets | 2,135,170,364 | |
|
|
|
Liabilities | ||
Payable for investments purchased | $ 2,070,473 | |
Payable for fund shares redeemed | 3,233,447 | |
Accrued management fee | 913,718 | |
Distribution and service plan fees payable | 177,975 | |
Other affiliated payables | 392,628 | |
Other payables and accrued expenses | 97,764 | |
Collateral on securities loaned, at value | 64,829,475 | |
Total liabilities | 71,715,480 | |
|
|
|
Net Assets | $ 2,063,454,884 | |
Net Assets consist of: |
| |
Paid in capital | $ 1,461,775,897 | |
Distributions in excess of net investment income | (815,927) | |
Accumulated undistributed net realized gain (loss) on investments and foreign currency transactions | 49,842,108 | |
Net unrealized appreciation (depreciation) on investments and assets and liabilities in foreign currencies | 552,652,806 | |
Net Assets | $ 2,063,454,884 | |
Statement of Assets and Liabilities - continued
| February 28, 2014 | |
|
|
|
Calculation of Maximum Offering Price Class A: | $ 86.46 | |
|
|
|
Maximum offering price per share (100/94.25 of $86.46) | $ 91.73 | |
Class T: | $ 85.99 | |
|
|
|
Maximum offering price per share (100/96.50 of $85.99) | $ 89.11 | |
Class B: | $ 84.63 | |
|
|
|
Class C: | $ 84.38 | |
|
|
|
Materials: | $ 86.81 | |
|
|
|
Institutional Class: | $ 86.66 | |
A Redemption price per share is equal to net asset value less any applicable contingent deferred sales charge.
See accompanying notes which are an integral part of the financial statements.
Annual Report
Statement of Operations
| Year ended February 28, 2014 | |
|
|
|
Investment Income |
|
|
Dividends |
| $ 26,740,023 |
Interest |
| 793,734 |
Income from Fidelity Central Funds |
| 249,683 |
Total income |
| 27,783,440 |
|
|
|
Expenses | ||
Management fee | $ 9,962,330 | |
Transfer agent fees | 4,003,115 | |
Distribution and service plan fees | 1,856,070 | |
Accounting and security lending fees | 557,577 | |
Custodian fees and expenses | 37,485 | |
Independent trustees' compensation | 34,172 | |
Registration fees | 190,648 | |
Audit | 48,214 | |
Legal | 28,005 | |
Miscellaneous | 19,389 | |
Total expenses before reductions | 16,737,005 | |
Expense reductions | (83,637) | 16,653,368 |
Net investment income (loss) | 11,130,072 | |
Realized and Unrealized Gain (Loss) Net realized gain (loss) on: | ||
Investment securities: |
|
|
Unaffiliated issuers | 105,183,777 | |
Foreign currency transactions | (3,123) | |
Futures contracts | 702,685 | |
Total net realized gain (loss) |
| 105,883,339 |
Change in net unrealized appreciation (depreciation) on: Investment securities | 227,782,826 | |
Assets and liabilities in foreign currencies | 315 | |
Futures contracts | (417,650) | |
Total change in net unrealized appreciation (depreciation) |
| 227,365,491 |
Net gain (loss) | 333,248,830 | |
Net increase (decrease) in net assets resulting from operations | $ 344,378,902 | |
Statement of Changes in Net Assets
| Year ended | Year ended |
Increase (Decrease) in Net Assets |
|
|
Operations |
|
|
Net investment income (loss) | $ 11,130,072 | $ 17,162,906 |
Net realized gain (loss) | 105,883,339 | 19,850,674 |
Change in net unrealized appreciation (depreciation) | 227,365,491 | 92,211,838 |
Net increase (decrease) in net assets resulting from operations | 344,378,902 | 129,225,418 |
Distributions to shareholders from net investment income | (9,652,596) | (15,064,080) |
Distributions to shareholders from net realized gain | (36,877,810) | (31,892,999) |
Total distributions | (46,530,406) | (46,957,079) |
Share transactions - net increase (decrease) | 29,379,358 | 219,532,050 |
Redemption fees | 36,980 | 63,898 |
Total increase (decrease) in net assets | 327,264,834 | 301,864,287 |
|
|
|
Net Assets | ||
Beginning of period | 1,736,190,050 | 1,434,325,763 |
End of period (including distributions in excess of net investment income of $815,927 and undistributed net investment income of $1,139,006, respectively) | $ 2,063,454,884 | $ 1,736,190,050 |
See accompanying notes which are an integral part of the financial statements.
Annual Report
Financial Highlights - Class A
Years ended February 28, | 2014 | 2013 | 2012 J | 2011 | 2010 |
Selected Per-Share Data |
|
|
|
|
|
Net asset value, beginning of period | $ 73.44 | $ 69.23 | $ 69.96 | $ 52.54 | $ 27.65 |
Income from Investment Operations |
|
|
|
|
|
Net investment income (loss) C | .36 | .70 | .40 | 1.08 F | .30 G |
Net realized and unrealized gain (loss) | 14.56 | 5.69 | (.35) | 17.40 | 24.90 |
Total from investment operations | 14.92 | 6.39 | .05 | 18.48 | 25.20 |
Distributions from net investment income | (.30) | (.63) | (.40) | (1.06) | (.32) |
Distributions from net realized gain | (1.60) | (1.55) | (.38) | (.01) | - |
Total distributions | (1.90) | (2.18) | (.78) | (1.07) | (.32) |
Redemption fees added to paid in capital C | - K | - K | - K | .01 | .01 |
Net asset value, end of period | $ 86.46 | $ 73.44 | $ 69.23 | $ 69.96 | $ 52.54 |
Total Return A, B | 20.46% | 9.40% | .21% | 35.33% | 91.25% |
Ratios to Average Net Assets D, H |
|
|
|
|
|
Expenses before reductions | 1.10% | 1.13% | 1.13% | 1.16% | 1.23% |
Expenses net of fee waivers, if any | 1.10% | 1.13% | 1.13% | 1.16% | 1.23% |
Expenses net of all reductions | 1.09% | 1.12% | 1.13% | 1.15% | 1.22% |
Net investment income (loss) | .45% | 1.02% | .61% | 1.81% F | .65% G |
Supplemental Data |
|
|
|
|
|
Net assets, end of period (000 omitted) | $ 336,777 | $ 219,627 | $ 157,781 | $ 124,160 | $ 52,352 |
Portfolio turnover rate E | 53% | 61% | 94% | 87% | 104% I |
ATotal returns would have been lower if certain expenses had not been reduced during the applicable periods shown. BTotal returns do not include the effect of the sales charges. CCalculated based on average shares outstanding during the period. DFees and expenses of any underlying Fidelity Central Funds are not included in the Fund's expense ratio. The Fund indirectly bears its proportionate share of the expenses of any underlying Fidelity Central Funds. EAmount does not include the portfolio activity of any underlying Fidelity Central Funds. FInvestment income per share reflects a large, non-recurring dividend which amounted to $.83 per share. Excluding this non-recurring dividend, the ratio of net investment income (loss) to average net assets would have been .41%. GInvestment income per share reflects a large, non-recurring dividend which amounted to $.10 per share. Excluding this non-recurring dividend, the ratio of net investment income (loss) to average net assets would have been .43%. HExpense ratios reflect operating expenses of the class. Expenses before reductions do not reflect amounts reimbursed by the investment adviser or reductions from brokerage service arrangements or reductions from other expense offset arrangements and do not represent the amount paid by the class during periods when reimbursements or reductions occur. Expenses net of fee waivers reflect expenses after reimbursement by the investment adviser but prior to reductions from brokerage service arrangements or other expense offset arrangements. Expenses net of all reductions represent the net expenses paid by the class. IThe portfolio turnover rate does not include the assets acquired in the merger. JFor the year ended February 29. KAmount represents less than $.01 per share. |
Financial Highlights - Class T
Years ended February 28, | 2014 | 2013 | 2012 J | 2011 | 2010 |
Selected Per-Share Data |
|
|
|
|
|
Net asset value, beginning of period | $ 73.05 | $ 68.91 | $ 69.68 | $ 52.35 | $ 27.56 |
Income from Investment Operations |
|
|
|
|
|
Net investment income (loss) C | .12 | .50 | .21 | .90 F | .16 G |
Net realized and unrealized gain (loss) | 14.48 | 5.66 | (.35) | 17.34 | 24.81 |
Total from investment operations | 14.60 | 6.16 | (.14) | 18.24 | 24.97 |
Distributions from net investment income | (.06) | (.46) | (.25) | (.92) | (.19) |
Distributions from net realized gain | (1.60) | (1.55) | (.38) | - | - |
Total distributions | (1.66) | (2.02) L | (.63) | (.92) | (.19) |
Redemption fees added to paid in capital C | - K | - K | - K | .01 | .01 |
Net asset value, end of period | $ 85.99 | $ 73.05 | $ 68.91 | $ 69.68 | $ 52.35 |
Total Return A, B | 20.10% | 9.10% | (.09)% | 34.98% | 90.70% |
Ratios to Average Net Assets D, H |
|
|
|
|
|
Expenses before reductions | 1.40% | 1.42% | 1.42% | 1.44% | 1.52% |
Expenses net of fee waivers, if any | 1.40% | 1.42% | 1.42% | 1.44% | 1.52% |
Expenses net of all reductions | 1.39% | 1.41% | 1.41% | 1.43% | 1.51% |
Net investment income (loss) | .15% | .73% | .33% | 1.54% F | .35% G |
Supplemental Data |
|
|
|
|
|
Net assets, end of period (000 omitted) | $ 45,223 | $ 37,860 | $ 28,290 | $ 25,570 | $ 14,712 |
Portfolio turnover rate E | 53% | 61% | 94% | 87% | 104% I |
ATotal returns would have been lower if certain expenses had not been reduced during the applicable periods shown. BTotal returns do not include the effect of the sales charges. CCalculated based on average shares outstanding during the period. DFees and expenses of any underlying Fidelity Central Funds are not included in the Fund's expense ratio. The Fund indirectly bears its proportionate share of the expenses of any underlying Fidelity Central Funds. EAmount does not include the portfolio activity of any underlying Fidelity Central Funds. FInvestment income per share reflects a large, non-recurring dividend which amounted to $.83 per share. Excluding this non-recurring dividend, the ratio of net investment income (loss) to average net assets would have been .14%. GInvestment income per share reflects a large, non-recurring dividend which amounted to $.10 per share. Excluding this non-recurring dividend, the ratio of net investment income (loss) to average net assets would have been .14%. HExpense ratios reflect operating expenses of the class. Expenses before reductions do not reflect amounts reimbursed by the investment adviser or reductions from brokerage service arrangements or reductions from other expense offset arrangements and do not represent the amount paid by the class during periods when reimbursements or reductions occur. Expenses net of fee waivers reflect expenses after reimbursement by the investment adviser but prior to reductions from brokerage service arrangements or other expense offset arrangements. Expenses net of all reductions represent the net expenses paid by the class. IThe portfolio turnover rate does not include the assets acquired in the merger. JFor the year ended February 29. KAmount represents less than $.01 per share. LTotal distributions of $2.02 per share is comprised of distributions from net investment income of $.463 and distributions from net realized gain of $1.552 per share. |
See accompanying notes which are an integral part of the financial statements.
Annual Report
Financial Highlights - Class B
Years ended February 28, | 2014 | 2013 | 2012 J | 2011 | 2010 |
Selected Per-Share Data |
|
|
|
|
|
Net asset value, beginning of period | $ 72.21 | $ 68.13 | $ 68.95 | $ 51.86 | $ 27.35 |
Income from Investment Operations |
|
|
|
|
|
Net investment income (loss) C | (.28) | .16 | (.11) | .60 F | (.07) G |
Net realized and unrealized gain (loss) | 14.28 | 5.57 | (.33) | 17.13 | 24.61 |
Total from investment operations | 14.00 | 5.73 | (.44) | 17.73 | 24.54 |
Distributions from net investment income | - | (.10) | - | (.65) | (.04) |
Distributions from net realized gain | (1.58) | (1.55) | (.38) | - | - |
Total distributions | (1.58) | (1.65) | (.38) | (.65) | (.04) |
Redemption fees added to paid in capital C | - K | - K | - K | .01 | .01 |
Net asset value, end of period | $ 84.63 | $ 72.21 | $ 68.13 | $ 68.95 | $ 51.86 |
Total Return A, B | 19.50% | 8.55% | (.57)% | 34.29% | 89.79% |
Ratios to Average Net Assets D, H |
|
|
|
|
|
Expenses before reductions | 1.90% | 1.92% | 1.91% | 1.93% | 2.02% |
Expenses net of fee waivers, if any | 1.90% | 1.92% | 1.91% | 1.93% | 2.02% |
Expenses net of all reductions | 1.90% | 1.91% | 1.91% | 1.92% | 2.01% |
Net investment income (loss) | (.36)% | .24% | (.17)% | 1.04% F | (.15)% G |
Supplemental Data |
|
|
|
|
|
Net assets, end of period (000 omitted) | $ 8,671 | $ 10,218 | $ 11,040 | $ 13,507 | $ 9,538 |
Portfolio turnover rate E | 53% | 61% | 94% | 87% | 104% I |
ATotal returns would have been lower if certain expenses had not been reduced during the applicable periods shown. BTotal returns do not include the effect of the contingent deferred sales charge. CCalculated based on average shares outstanding during the period. DFees and expenses of any underlying Fidelity Central Funds are not included in the Fund's expense ratio. The Fund indirectly bears its proportionate share of the expenses of any underlying Fidelity Central Funds. EAmount does not include the portfolio activity of any underlying Fidelity Central Funds. FInvestment income per share reflects a large, non-recurring dividend which amounted to $.83 per share. Excluding this non-recurring dividend, the ratio of net investment income (loss) to average net assets would have been (.35)%. GInvestment income per share reflects a large, non-recurring dividend which amounted to $.10 per share. Excluding this non-recurring dividend, the ratio of net investment income (loss) to average net assets would have been (.36)%. HExpense ratios reflect operating expenses of the class. Expenses before reductions do not reflect amounts reimbursed by the investment adviser or reductions from brokerage service arrangements or reductions from other expense offset arrangements and do not represent the amount paid by the class during periods when reimbursements or reductions occur. Expenses net of fee waivers reflect expenses after reimbursement by the investment adviser but prior to reductions from brokerage service arrangements or other expense offset arrangements. Expenses net of all reductions represent the net expenses paid by the class. IThe portfolio turnover rate does not include the assets acquired in the merger. JFor the year ended February 29. KAmount represents less than $.01 per share. |
Financial Highlights - Class C
Years ended February 28, | 2014 | 2013 | 2012 J | 2011 | 2010 |
Selected Per-Share Data |
|
|
|
|
|
Net asset value, beginning of period | $ 71.96 | $ 67.98 | $ 68.78 | $ 51.79 | $ 27.31 |
Income from Investment Operations |
|
|
|
|
|
Net investment income (loss) C | (.23) | .18 | (.10) | .61 F | (.06) G |
Net realized and unrealized gain (loss) | 14.23 | 5.55 | (.32) | 17.09 | 24.57 |
Total from investment operations | 14.00 | 5.73 | (.42) | 17.70 | 24.51 |
Distributions from net investment income | - | (.20) | - | (.72) | (.04) |
Distributions from net realized gain | (1.58) | (1.55) | (.38) | - | - |
Total distributions | (1.58) | (1.75) | (.38) | (.72) | (.04) |
Redemption fees added to paid in capital C | - K | - K | - K | .01 | .01 |
Net asset value, end of period | $ 84.38 | $ 71.96 | $ 67.98 | $ 68.78 | $ 51.79 |
Total Return A, B | 19.56% | 8.58% | (.55)% | 34.29% | 89.82% |
Ratios to Average Net Assets D, H |
|
|
|
|
|
Expenses before reductions | 1.85% | 1.89% | 1.89% | 1.93% | 2.01% |
Expenses net of fee waivers, if any | 1.85% | 1.89% | 1.89% | 1.93% | 2.01% |
Expenses net of all reductions | 1.84% | 1.88% | 1.89% | 1.92% | 2.00% |
Net investment income (loss) | (.30)% | .26% | (.15)% | 1.04% F | (.13)% G |
Supplemental Data |
|
|
|
|
|
Net assets, end of period (000 omitted) | $ 106,879 | $ 75,007 | $ 58,296 | $ 46,525 | $ 20,469 |
Portfolio turnover rate E | 53% | 61% | 94% | 87% | 104% I |
ATotal returns would have been lower if certain expenses had not been reduced during the applicable periods shown. BTotal returns do not include the effect of the contingent deferred sales charge. CCalculated based on average shares outstanding during the period. DFees and expenses of any underlying Fidelity Central Funds are not included in the Fund's expense ratio. The Fund indirectly bears its proportionate share of the expenses of any underlying Fidelity Central Funds. EAmount does not include the portfolio activity of any underlying Fidelity Central Funds. FInvestment income per share reflects a large, non-recurring dividend which amounted to $.83 per share. Excluding this non-recurring dividend, the ratio of net investment income (loss) to average net assets would have been (.35)%. GInvestment income per share reflects a large, non-recurring dividend which amounted to $.10 per share. Excluding this non-recurring dividend, the ratio of net investment income (loss) to average net assets would have been (.35)%. HExpense ratios reflect operating expenses of the class. Expenses before reductions do not reflect amounts reimbursed by the investment adviser or reductions from brokerage service arrangements or reductions from other expense offset arrangements and do not represent the amount paid by the class during periods when reimbursements or reductions occur. Expenses net of fee waivers reflect expenses after reimbursement by the investment adviser but prior to reductions from brokerage service arrangements or other expense offset arrangements. Expenses net of all reductions represent the net expenses paid by the class. IThe portfolio turnover rate does not include the assets acquired in the merger. JFor the year ended February 29. KAmount represents less than $.01 per share. |
See accompanying notes which are an integral part of the financial statements.
Annual Report
Financial Highlights - Materials
Years ended February 28, | 2014 | 2013 | 2012 I | 2011 | 2010 |
Selected Per-Share Data |
|
|
|
|
|
Net asset value, beginning of period | $ 73.68 | $ 69.41 | $ 70.11 | $ 52.61 | $ 27.66 |
Income from Investment Operations |
|
|
|
|
|
Net investment income (loss) B | .58 | .90 | .60 | 1.25 E | .43 F |
Net realized and unrealized gain (loss) | 14.63 | 5.71 | (.37) | 17.43 | 24.91 |
Total from investment operations | 15.21 | 6.61 | .23 | 18.68 | 25.34 |
Distributions from net investment income | (.48) | (.79) | (.55) | (1.16) | (.40) |
Distributions from net realized gain | (1.60) | (1.55) | (.38) | (.03) | - |
Total distributions | (2.08) | (2.34) | (.93) | (1.19) | (.40) |
Redemption fees added to paid in capital B | - J | - J | - J | .01 | .01 |
Net asset value, end of period | $ 86.81 | $ 73.68 | $ 69.41 | $ 70.11 | $ 52.61 |
Total Return A | 20.80% | 9.71% | .49% | 35.70% | 91.77% |
Ratios to Average Net Assets C, G |
|
|
|
|
|
Expenses before reductions | .82% | .85% | .85% | .88% | .96% |
Expenses net of fee waivers, if any | .82% | .85% | .85% | .88% | .96% |
Expenses net of all reductions | .82% | .84% | .84% | .87% | .94% |
Net investment income (loss) | .73% | 1.30% | .90% | 2.10% E | .92% F |
Supplemental Data |
|
|
|
|
|
Net assets, end of period (000 omitted) | $ 1,231,942 | $ 1,146,782 | $ 1,089,619 | $ 1,195,371 | $ 604,475 |
Portfolio turnover rate D | 53% | 61% | 94% | 87% | 104% H |
ATotal returns would have been lower if certain expenses had not been reduced during the applicable periods shown. BCalculated based on average shares outstanding during the period. CFees and expenses of any underlying Fidelity Central Funds are not included in the Fund's expense ratio. The Fund indirectly bears its proportionate share of the expenses of any underlying Fidelity Central Funds. DAmount does not include the portfolio activity of any underlying Fidelity Central Funds. EInvestment income per share reflects a large, non-recurring dividend which amounted to $.83 per share. Excluding this non-recurring dividend, the ratio of net investment income (loss) to average net assets would have been .70%. FInvestment income per share reflects a large, non-recurring dividend which amounted to $.10 per share. Excluding this non-recurring dividend, the ratio of net investment income (loss) to average net assets would have been .70%. GExpense ratios reflect operating expenses of the class. Expenses before reductions do not reflect amounts reimbursed by the investment adviser or reductions from brokerage service arrangements or reductions from other expense offset arrangements and do not represent the amount paid by the class during periods when reimbursements or reductions occur. Expenses net of fee waivers reflect expenses after reimbursement by the investment adviser but prior to reductions from brokerage service arrangements or other expense offset arrangements. Expenses net of all reductions represent the net expenses paid by the class. HThe portfolio turnover rate does not include the assets acquired in the merger. IFor the year ended February 29. JAmount represents less than $.01 per share. |
Financial Highlights - Institutional Class
Years ended February 28, | 2014 | 2013 | 2012 I | 2011 | 2010 |
Selected Per-Share Data |
|
|
|
|
|
Net asset value, beginning of period | $ 73.57 | $ 69.35 | $ 70.05 | $ 52.58 | $ 27.66 |
Income from Investment Operations |
|
|
|
|
|
Net investment income (loss) B | .59 | .90 | .60 | 1.28 E | .46 F |
Net realized and unrealized gain (loss) | 14.60 | 5.70 | (.36) | 17.40 | 24.89 |
Total from investment operations | 15.19 | 6.60 | .24 | 18.68 | 25.35 |
Distributions from net investment income | (.50) | (.83) | (.56) | (1.19) | (.44) |
Distributions from net realized gain | (1.60) | (1.55) | (.38) | (.03) | - |
Total distributions | (2.10) | (2.38) | (.94) | (1.22) | (.44) |
Redemption fees added to paid in capital B | - J | - J | - J | .01 | .01 |
Net asset value, end of period | $ 86.66 | $ 73.57 | $ 69.35 | $ 70.05 | $ 52.58 |
Total Return A | 20.81% | 9.71% | .50% | 35.73% | 91.79% |
Ratios to Average Net Assets C, G |
|
|
|
|
|
Expenses before reductions | .81% | .85% | .84% | .86% | .94% |
Expenses net of fee waivers, if any | .81% | .85% | .84% | .86% | .94% |
Expenses net of all reductions | .81% | .84% | .83% | .85% | .93% |
Net investment income (loss) | .74% | 1.30% | .91% | 2.11% E | .94% F |
Supplemental Data |
|
|
|
|
|
Net assets, end of period (000 omitted) | $ 333,963 | $ 246,696 | $ 89,299 | $ 85,130 | $ 13,670 |
Portfolio turnover rate D | 53% | 61% | 94% | 87% | 104% H |
ATotal returns would have been lower if certain expenses had not been reduced during the applicable periods shown. BCalculated based on average shares outstanding during the period. CFees and expenses of any underlying Fidelity Central Funds are not included in the Fund's expense ratio. The Fund indirectly bears its proportionate share of the expenses of any underlying Fidelity Central Funds. DAmount does not include the portfolio activity of any underlying Fidelity Central Funds. EInvestment income per share reflects a large, non-recurring dividend which amounted to $.83 per share. Excluding this non-recurring dividend, the ratio of net investment income (loss) to average net assets would have been .72%. FInvestment income per share reflects a large, non-recurring dividend which amounted to $.10 per share. Excluding this non-recurring dividend, the ratio of net investment income (loss) to average net assets would have been .72%. GExpense ratios reflect operating expenses of the class. Expenses before reductions do not reflect amounts reimbursed by the investment adviser or reductions from brokerage service arrangements or reductions from other expense offset arrangements and do not represent the amount paid by the class during periods when reimbursements or reductions occur. Expenses net of fee waivers reflect expenses after reimbursement by the investment adviser but prior to reductions from brokerage service arrangements or other expense offset arrangements. Expenses net of all reductions represent the net expenses paid by the class. HThe portfolio turnover rate does not include the assets acquired in the merger. IFor the year ended February 29. JAmount represents less than $.01 per share. |
See accompanying notes which are an integral part of the financial statements.
Annual Report
Notes to Financial Statements
For the period ended February 28, 2014
1. Organization.
Materials Portfolio (the Fund) is a non-diversified fund of Fidelity Select Portfolios (the Trust) and is authorized to issue an unlimited number of shares. The Trust is registered under the Investment Company Act of 1940, as amended (the 1940 Act), as an open-end management investment company organized as a Massachusetts business trust. The Fund invests primarily in securities of companies whose principal business activities fall within specific industries. The Fund offers Class A, Class T, Class C, Materials and Institutional Class shares, each of which, along with Class B shares, has equal rights as to assets and voting privileges. Class B shares are closed to new accounts and additional purchases, except for exchanges and reinvestments. Each class has exclusive voting rights with respect to matters that affect that class. Class B shares will automatically convert to Class A shares after a holding period of seven years from the initial date of purchase.
2. Investments in Fidelity Central Funds.
The Fund invests in Fidelity Central Funds, which are open-end investment companies generally available only to other investment companies and accounts managed by the investment adviser and its affiliates. The Fund's Schedule of Investments lists each of the Fidelity Central Funds held as of period end, if any, as an investment of the Fund, but does not include the underlying holdings of each Fidelity Central Fund. As an Investing Fund, the Fund indirectly bears its proportionate share of the expenses of the underlying Fidelity Central Funds.
The Money Market Central Funds seek preservation of capital and current income and are managed by Fidelity Investments Money Management, Inc. (FIMM), an affiliate of the investment adviser. Annualized expenses of the Money Market Central Funds as of their most recent shareholder report date are less than .01%.
A complete unaudited list of holdings for each Fidelity Central Fund is available upon request or at the Securities and Exchange Commission (the SEC) website at www.sec.gov. In addition, the financial statements of the Fidelity Central Funds, which are not covered by the Fund's Report of Independent Registered Public Accounting Firm, are available on the SEC website or upon request.
3. Significant Accounting Policies.
The financial statements have been prepared in conformity with accounting principles generally accepted in the United States of America (GAAP), which require management to make certain estimates and assumptions at the date of the financial statements. Actual results could differ from those estimates. Subsequent events, if any, through the date that the financial statements were issued have been evaluated in the preparation of the financial statements. The following summarizes the significant accounting policies of the Fund:
Investment Valuation. Investments are valued as of 4:00 p.m. Eastern time on the last calendar day of the period. In accordance with valuation policies and procedures approved by the Board of Trustees (the Board), the Fund attempts to obtain prices from one or more third party pricing vendors or brokers to value its investments. When current market prices, quotations or currency exchange rates are not readily available or reliable, investments will be fair valued in good faith by the Fidelity SelectCo, LLC (SelectCo) Fair Value Committee (the Committee), in accordance with procedures adopted by the Board. Factors used in determining fair value vary by investment type and may include market or investment specific events, changes in interest rates and credit quality. The frequency with which these procedures are used cannot be predicted and they may be utilized to a significant extent. The Committee oversees the Fund's valuation policies and procedures and is responsible for approving and reporting to the Board all fair value determinations.
The Fund categorizes the inputs to valuation techniques used to value its investments into a disclosure hierarchy consisting of three levels as shown below:
Level 1 - quoted prices in active markets for identical investments
Level 2 - other significant observable inputs (including quoted prices for similar investments, interest rates, prepayment speeds, etc.)
Level 3 - unobservable inputs (including the Fund's own assumptions based on the best information available)
Valuation techniques used to value the Fund's investments by major category are as follows:
Equity securities, including restricted securities, for which market quotations are readily available, are valued at the last reported sale price or official closing price as reported by a third party pricing vendor on the primary market or exchange on which they are traded and are categorized as Level 1 in the hierarchy. In the event there were no sales during the day or closing prices are not available, securities are valued at the last quoted bid price or may be valued using the last available price and are generally categorized as Level 2 in the hierarchy. For foreign equity securities, when market or security specific events arise, comparisons to the valuation of American Depositary Receipts (ADRs) and certain indexes as well as quoted prices for similar securities may be used and would be categorized as Level 2 in the hierarchy. Utilizing these techniques may result in transfers between Level 1 and Level 2. For equity securities, including restricted securities, where observable inputs are limited, assumptions about market activity and risk are used and these securities may be categorized as Level 3 in the hierarchy.
Annual Report
3. Significant Accounting Policies - continued
Investment Valuation - continued
Debt securities, including restricted securities, are valued based on evaluated prices received from third party pricing vendors or from brokers who make markets in such securities. Corporate bonds, are valued by pricing vendors who utilize matrix pricing which considers yield or price of bonds of comparable quality, coupon, maturity and type or by broker-supplied prices. When independent prices are unavailable or unreliable, debt securities may be valued utilizing pricing methodologies which consider similar factors that would be used by third party pricing vendors. Debt securities are generally categorized as Level 2 in the hierarchy but may be Level 3 depending on the circumstances.
Investments in open-end mutual funds, including the Fidelity Central Funds, are valued at their closing net asset value (NAV) each business day and are categorized as Level 1 in the hierarchy.
Changes in valuation techniques may result in transfers in or out of an assigned level within the disclosure hierarchy. The aggregate value of investments by input level, as of February 28, 2014, is included at the end of the Fund's Schedule of Investments.
Foreign Currency. The Fund may use foreign currency contracts to facilitate transactions in foreign-denominated securities. Gains and losses from these transactions may arise from changes in the value of the foreign currency or if the counterparties do not perform under the contracts' terms.
Foreign-denominated assets, including investment securities, and liabilities are translated into U.S. dollars at the exchange rates at period end. Purchases and sales of investment securities, income and dividends received and expenses denominated in foreign currencies are translated into U.S. dollars at the exchange rate in effect on the transaction date.
The effects of exchange rate fluctuations on investments are included with the net realized and unrealized gain (loss) on investment securities. Other foreign currency transactions resulting in realized and unrealized gain (loss) are disclosed separately.
Investment Transactions and Income. For financial reporting purposes, the Fund's investment holdings and NAV include trades executed through the end of the last business day of the period. The NAV per share for processing shareholder transactions is calculated as of the close of business of the New York Stock Exchange (NYSE), normally 4:00 p.m. Eastern time and includes trades executed through the end of the prior business day. Gains and losses on securities sold are determined on the basis of identified cost and may include proceeds received from litigation. Dividend income is recorded on the ex-dividend date, except for certain dividends from foreign securities where the ex-dividend date may have passed, which are recorded as soon as the Fund is informed of the ex-dividend date. Non-cash dividends included in dividend income, if any, are recorded at the fair market value of the securities received. Distributions received on securities that represent a return of capital or capital gain are recorded as a reduction of cost of investments and/or as a realized gain. Subsequent to ex-dividend date the Fund determines the components of these distributions, based upon receipt of tax filings or other correspondence relating to the underlying investment. Interest income and distributions from the Fidelity Central Funds are accrued as earned. Interest income includes coupon interest and amortization of premium and accretion of discount on debt securities. Investment income is recorded net of foreign taxes withheld where recovery of such taxes is uncertain.
Class Allocations and Expenses. Investment income, realized and unrealized capital gains and losses, common expenses of the Fund, and certain fund-level expense reductions, if any, are allocated daily on a pro-rata basis to each class based on the relative net assets of each class to the total net assets of the Fund. Each class differs with respect to transfer agent and distribution and service plan fees incurred. Certain expense reductions may also differ by class. For the reporting period, the allocated portion of income and expenses to each class as a percent of its average net assets may vary due to the timing of recording these transactions in relation to fluctuating net assets of the classes. Expenses directly attributable to a fund are charged to that fund. Expenses attributable to more than one fund are allocated among the respective funds on the basis of relative net assets or other appropriate methods. Expense estimates are accrued in the period to which they relate and adjustments are made when actual amounts are known.
Deferred Trustee Compensation. Under a Deferred Compensation Plan (the Plan), independent Trustees may elect to defer receipt of a portion of their annual compensation. Deferred amounts are invested in a cross-section of Fidelity funds, are marked-to-market and remain in the Fund until distributed in accordance with the Plan. The investment of deferred amounts and the offsetting payable to the Trustees are included in the accompanying Statement of Assets and Liabilities.
Income Tax Information and Distributions to Shareholders. Each year, the Fund intends to qualify as a regulated investment company under Subchapter M of the Internal Revenue Code, including distributing substantially all of its taxable income and realized gains. As a result, no provision for U.S. Federal income taxes is required. As of February 28, 2014, the Fund did not have any unrecognized tax benefits in the financial statements; nor is the Fund aware of any tax positions for which it is reasonably possible that the total amounts of unrecognized tax benefits will significantly change in the next twelve months. The Fund files a U.S. federal tax return, in addition to state and local tax returns as required. The Fund's federal income tax returns are subject to examination by the Internal Revenue Service (IRS) for a period of three fiscal years after they are filed. State and local tax returns may be subject to examination for an additional fiscal year depending on the jurisdiction. Foreign taxes are provided for based on the Fund's understanding of the tax rules and rates that exist in the foreign markets in which it invests.
Distributions are declared and recorded on the ex-dividend date. Income dividends and capital gain distributions are declared separately for each class. Income and capital gain distributions are determined in accordance with income tax regulations, which may differ from GAAP. In addition, the Fund claimed a portion of the payment made to redeeming shareholders as a distribution for income tax purposes.
Annual Report
Notes to Financial Statements - continued
3. Significant Accounting Policies - continued
Income Tax Information and Distributions to Shareholders - continued
Capital accounts within the financial statements are adjusted for permanent book-tax differences. These adjustments have no impact on net assets or the results of operations. Capital accounts are not adjusted for temporary book-tax differences which will reverse in a subsequent period.
Book-tax differences are primarily due to futures contracts, foreign currency transactions, passive foreign investment companies (PFIC), original issue discount, deferred trustees compensation, capital loss carryforwards and losses deferred due to wash sales and excise tax regulations.
The federal tax cost of investment securities and unrealized appreciation (depreciation) as of period end were as follows:
Gross unrealized appreciation | $ 569,706,695 |
Gross unrealized depreciation | (24,615,148) |
Net unrealized appreciation (depreciation) on securities and other investments | $ 545,091,547 |
|
|
Tax Cost | $ 1,581,888,229 |
The tax-based components of distributable earnings as of period end were as follows:
Undistributed ordinary income | $ 2,483,951 |
Undistributed long-term capital gain | $ 56,642,887 |
Net unrealized appreciation (depreciation) | $ 545,088,879 |
The tax character of distributions paid was as follows:
| February 28, 2014 | February 28, 2013 |
Ordinary Income | $ 10,087,395 | $ 15,064,080 |
Long-term Capital Gains | 36,443,011 | 31,892,999 |
Total | $ 46,530,406 | $ 46,957,079 |
Capital loss carryforwards are only available to offset future capital gains of the Fund to the extent provided by regulations and may be limited. Under the Regulated Investment Company Modernization Act of 2010 (the Act), the Fund is permitted to carry forward capital losses incurred in taxable years beginning after December 22, 2010 for an unlimited period and such capital losses are required to be used prior to any losses that expire. The capital loss carryforward information presented below, including any applicable limitation, is estimated as of prior fiscal period end and is subject to adjustment.
Fiscal year of expiration: |
|
2017 | $ (1,422,248) |
2018 | (1,022,988) |
2019 | (80,787) |
Total with expiration | $ (2,526,023) |
The Fund acquired $2,526,023 of capital loss carryforwards as part of a merger in a prior period. The losses acquired that will be available to offset future capital gains of the Fund will be limited to approximately $611,309 per year.
Trading (Redemption) Fees. Shares held by investors in the Fund less than 30 days may be subject to a redemption fee equal to .75% of the NAV of shares redeemed. All redemption fees, which reduce the proceeds of the shareholder redemption, are retained by the Fund and accounted for as an addition to paid in capital.
Restricted Securities. The Fund may invest in securities that are subject to legal or contractual restrictions on resale. These securities generally may be resold in transactions exempt from registration or to the public if the securities are registered. Disposal of these securities may involve time-consuming negotiations and expense, and prompt sale at an acceptable price may be difficult. Information regarding restricted securities is included at the end of the Fund's Schedule of Investments.
Annual Report
4. Derivative Instruments.
Risk Exposures and the Use of Derivative Instruments. The Fund's investment objective allows the Fund to enter into various types of derivative contracts, including futures contracts. Derivatives are investments whose value is primarily derived from underlying assets, indices or reference rates and may be transacted on an exchange or over-the-counter (OTC). Derivatives may involve a future commitment to buy or sell a specified asset based on specified terms, to exchange future cash flows at periodic intervals based on a notional principal amount, or for one party to make one or more payments upon the occurrence of specified events in exchange for periodic payments from the other party.
The Fund used derivatives to increase returns, to gain exposure to certain types of assets and to manage exposure to certain risks as defined below. The success of any strategy involving derivatives depends on analysis of numerous economic factors, and if the strategies for investment do not work as intended, the Fund may not achieve its objectives.
The Fund's use of derivatives increased or decreased its exposure to the following risk:
Equity Risk | Equity risk relates to the fluctuations in the value of financial instruments as a result of changes in market prices (other than those arising from interest rate risk or foreign exchange risk), whether caused by factors specific to an individual investment, its issuer, or all factors affecting all instruments traded in a market or market segment. |
The Fund is also exposed to additional risks from investing in derivatives, such as liquidity risk and counterparty credit risk. Liquidity risk is the risk that the Fund will be unable to close out the derivative in the open market in a timely manner. Counterparty credit risk is the risk that the counterparty will not be able to fulfill its obligation to the Fund. Counterparty credit risk related to exchange-traded futures contracts may be mitigated by the protection provided by the exchange on which they trade.
Investing in derivatives may involve greater risks than investing in the underlying assets directly and, to varying degrees, may involve risk of loss in excess of any initial investment and collateral received and amounts recognized in the Statement of Assets and Liabilities. In addition, there may be the risk that the change in value of the derivative contract does not correspond to the change in value of the underlying instrument.
Futures Contracts. A futures contract is an agreement between two parties to buy or sell a specified underlying instrument for a fixed price at a specified future date. The Fund used futures contracts to manage its exposure to the stock market.
Upon entering into a futures contract, a fund is required to deposit either cash or securities (initial margin) with a clearing broker in an amount equal to a certain percentage of the face value of the contract. Futures contracts are marked-to-market daily and subsequent daily payments (variation margin) are made or received by a fund depending on the daily fluctuations in the value of the futures contracts and are recorded as unrealized appreciation or (depreciation). This receivable and/or payable, if any, is included in daily variation margin for derivative instruments in the Statement of Assets and Liabilities. Realized gain or (loss) is recorded upon the expiration or closing of a futures contract. The net realized gain (loss) and change in net unrealized appreciation (depreciation) on futures contracts during the period is included in the Statement of Operations.
Any open futures contracts at period end are presented in the Schedule of Investments under the caption "Futures Contracts." The underlying face amount at value reflects each contract's exposure to the underlying instrument or index at period end.
During the period the Fund recognized net realized gain (loss) of $702,685 and a change in net unrealized appreciation (depreciation) of $(417,650) related to its investment in futures contracts. These amounts are included in the Statement of Operations.
5. Purchases and Sales of Investments.
Purchases and sales of securities, other than short-term securities, aggregated $974,328,461 and $946,309,029, respectively.
6. Fees and Other Transactions with Affiliates.
Management Fee. Effective August 1, 2013, SelectCo replaced Fidelity Management and Research Company (FMR), an affiliate of SelectCo, as investment adviser to the Fund. The investment adviser and its affiliates provide the Fund with investment management related services for which the Fund pays a monthly management fee. The management fee is the sum of an individual fund fee rate that is based on an annual rate of .30% of the Fund's average net assets and an annualized group fee rate that averaged .25% during the period. The group fee rate is based upon the average net assets of all the mutual funds advised by FMR and the investment adviser. The group fee rate decreases as assets under management increase and increases as assets under management decrease. For the reporting period, the total annual management fee rate was .55% of the Fund's average net assets.
Annual Report
Notes to Financial Statements - continued
6. Fees and Other Transactions with Affiliates - continued
Distribution and Service Plan Fees. In accordance with Rule 12b-1 of the 1940 Act, the Fund has adopted separate Distribution and Service Plans for each class of shares. Certain classes pay Fidelity Distributors Corporation (FDC), an affiliate of the investment adviser, separate Distribution and Service Fees, each of which is based on an annual percentage of each class' average net assets. In addition, FDC may pay financial intermediaries for selling shares of the Fund and providing shareholder support services. For the period, the Distribution and Service Fee rates, total fees and amounts retained by FDC were as follows:
| Distribution | Service | Total Fees | Retained |
Class A | -% | .25% | $ 668,160 | $ 11,911 |
Class T | .25% | .25% | 197,474 | 1,042 |
Class B | .75% | .25% | 90,429 | 68,170 |
Class C | .75% | .25% | 900,007 | 325,396 |
|
|
| $ 1,856,070 | $ 406,519 |
Sales Load. FDC may receive a front-end sales charge of up to 5.75% for selling Class A shares and 3.50% for selling Class T shares, some of which is paid to financial intermediaries for selling shares of the Fund. Depending on the holding period, FDC may receive contingent deferred sales charges levied on Class A, Class T, Class B, and Class C redemptions. The deferred sales charges range from 5.00% to 1.00% for Class B shares, 1.00% for Class C shares, 1.00% for certain purchases of Class A shares and .25% for certain purchases of Class T shares.
For the period, sales charge amounts retained by FDC were as follows:
| Retained |
Class A | $ 166,569 |
Class T | 13,304 |
Class B* | 19,379 |
Class C* | 16,753 |
| $ 216,005 |
* When Class B and Class C shares are initially sold, FDC pays commissions from its own resources to financial intermediaries through which the sales are made.
Transfer Agent Fees. Fidelity Investments Institutional Operations Company, Inc., (FIIOC), an affiliate of the investment adviser, is the transfer, dividend disbursing and shareholder servicing agent for each class of the Fund. FIIOC receives account fees and asset-based fees that vary according to the account size and type of account of the shareholders of the respective classes of the Fund. FIIOC pays for typesetting, printing and mailing of shareholder reports, except proxy statements.
For the period, transfer agent fees for each class were as follows:
|
| % of |
Class A | $ 648,808 | .24 |
Class T | 115,141 | .29 |
Class B | 27,231 | .30 |
Class C | 218,786 | .24 |
Materials | 2,491,421 | .22 |
Institutional Class | 501,728 | .21 |
| $ 4,003,115 |
|
Accounting and Security Lending Fees. Fidelity Service Company, Inc. (FSC), an affiliate of the investment adviser, maintains the Fund's accounting records. The accounting fee is based on the level of average net assets for each month. Under a separate contract, FSC administers the security lending program. The security lending fee is based on the number and duration of lending transactions.
Brokerage Commissions. The Fund placed a portion of its portfolio transactions with brokerage firms which are affiliates of the investment adviser. Brokerage commissions are included in net realized gain (loss) and change in net unrealized appreciation (depreciation) in the Statement of Operations. The commissions paid to these affiliated firms were $19,613 for the period.
Annual Report
7. Committed Line of Credit.
The Fund participates with other funds managed by the investment adviser or an affiliate in a $4.25 billion credit facility (the "line of credit") to be utilized for temporary or emergency purposes to fund shareholder redemptions or for other short-term liquidity purposes. The Fund has agreed to pay commitment fees on its pro-rata portion of the line of credit, which amounted to $3,473 and is reflected in Miscellaneous expenses on the Statement of Operations. During the period, there were no borrowings on this line of credit.
8. Security Lending.
The Fund lends portfolio securities through a lending agent from time to time in order to earn additional income. For equity securities, a lending agent is used and may loan securities to certain qualified borrowers, which prior to August 1, 2013 included Fidelity Capital Markets (FCM), a broker-dealer affiliated with the Fund. On the settlement date of the loan, the Fund receives collateral (in the form of U.S. Treasury obligations, letters of credit and/or cash) against the loaned securities and maintains collateral in an amount not less than 100% of the market value of the loaned securities during the period of the loan. The market value of the loaned securities is determined at the close of business of the Fund and any additional required collateral is delivered to the Fund on the next business day. If the borrower defaults on its obligation to return the securities loaned because of insolvency or other reasons, the Fund may apply collateral received from the borrower against the obligation. The Fund may experience delays and costs in recovering the securities loaned. Any cash collateral received is invested in the Fidelity Securities Lending Cash Central Fund. The value of loaned securities and cash collateral at period end are disclosed on the Fund's Statement of Assets and Liabilities. Security lending income represents the income earned on investing cash collateral, less rebates paid to borrowers and any lending agent fees associated with the loan, plus any premium payments received for lending certain types of securities. Security lending income is presented in the Statement of Operations as a component of income from Fidelity Central Funds. Total security lending income during the period amounted to $215,485. During the period, there were no securities loaned to FCM.
9. Expense Reductions.
Commissions paid to certain brokers with whom the investment adviser, or its affiliates, places trades on behalf of the Fund include an amount in addition to trade execution, which may be rebated back to the Fund to offset certain expenses. This amount totaled $76,091 for the period. Through arrangements with the Fund's custodian, credits realized as a result of uninvested cash balances were used to reduce the Fund's expenses. During the period, these credits reduced the Fund's custody expenses by $122.
In addition, FMR reimbursed a portion of the Fund's operating expenses during the period in the amount of $7,424.
10. Distributions to Shareholders.
Distributions to shareholders of each class were as follows:
Years ended February 28, | 2014 | 2013 |
From net investment income |
|
|
Class A | $ 1,076,918 | $ 1,631,593 |
Class T | 29,833 | 221,281 |
Class B | - | 14,451 |
Class C | - | 183,511 |
Materials | 6,872,385 | 11,420,509 |
Institutional Class | 1,673,460 | 1,592,735 |
Total | $ 9,652,596 | $ 15,064,080 |
From net realized gain |
|
|
Class A | $ 5,762,988 | $ 3,967,803 |
Class T | 809,850 | 717,303 |
Class B | 165,553 | 228,009 |
Class C | 1,915,182 | 1,411,838 |
Materials | 22,724,072 | 22,783,457 |
Institutional Class | 5,500,165 | 2,784,589 |
Total | $ 36,877,810 | $ 31,892,999 |
Annual Report
Notes to Financial Statements - continued
11. Share Transactions.
Transactions for each class of shares were as follows:
| Shares | Dollars | ||
Years ended February 28, | 2014 | 2013 | 2014 | 2013 |
Class A |
|
|
|
|
Shares sold | 1,797,224 | 1,611,922 | $ 142,257,752 | $ 112,576,195 |
Reinvestment of distributions | 72,401 | 68,775 | 5,951,034 | 4,804,595 |
Shares redeemed | (965,142) | (969,159) | (75,392,440) | (66,285,158) |
Net increase (decrease) | 904,483 | 711,538 | $ 72,816,346 | $ 51,095,632 |
Class T |
|
|
|
|
Shares sold | 170,035 | 205,283 | $ 13,444,901 | $ 14,234,477 |
Reinvestment of distributions | 9,678 | 12,892 | 792,607 | 896,667 |
Shares redeemed | (172,106) | (110,407) | (13,187,903) | (7,498,384) |
Net increase (decrease) | 7,607 | 107,768 | $ 1,049,605 | $ 7,632,760 |
Class B |
|
|
|
|
Shares sold | 7,873 | 21,997 | $ 603,147 | $ 1,493,049 |
Reinvestment of distributions | 1,836 | 3,022 | 148,096 | 207,121 |
Shares redeemed | (48,755) | (45,545) | (3,688,524) | (3,081,508) |
Net increase (decrease) | (39,046) | (20,526) | $ (2,937,281) | $ (1,381,338) |
Class C |
|
|
|
|
Shares sold | 450,706 | 423,105 | $ 34,616,884 | $ 29,248,360 |
Reinvestment of distributions | 19,891 | 19,249 | 1,600,154 | 1,317,196 |
Shares redeemed | (246,286) | (257,585) | (18,989,979) | (17,263,032) |
Net increase (decrease) | 224,311 | 184,769 | $ 17,227,059 | $ 13,302,524 |
Materials |
|
|
|
|
Shares sold | 3,222,449 | 5,306,846 | $ 254,476,294 | $ 372,534,797 |
Reinvestment of distributions | 341,183 | 464,930 | 28,082,183 | 32,543,457 |
Shares redeemed | (4,936,489) | (5,905,812) | (386,209,902) | (406,043,890) |
Net increase (decrease) | (1,372,857) | (134,036) | $ (103,651,425) | $ (965,636) |
Institutional Class |
|
|
|
|
Shares sold | 2,646,562 | 2,986,457 | $ 209,408,784 | $ 212,651,449 |
Reinvestment of distributions | 73,103 | 54,139 | 6,019,071 | 3,797,777 |
Shares redeemed | (2,219,316) | (975,090) | (170,552,801) | (66,601,118) |
Net increase (decrease) | 500,349 | 2,065,506 | $ 44,875,054 | $ 149,848,108 |
12. Other.
The Fund's organizational documents provide former and current trustees and officers with a limited indemnification against liabilities arising in connection with the performance of their duties to the Fund. In the normal course of business, the Fund may also enter into contracts that provide general indemnifications. The Fund's maximum exposure under these arrangements is unknown as this would be dependent on future claims that may be made against the Fund. The risk of material loss from such claims is considered remote.
Annual Report
Report of Independent Registered Public Accounting Firm
To the Trustees of Fidelity Select Portfolios and the Shareholders of Chemicals Portfolio, Gold Portfolio and Materials Portfolio:
In our opinion, the accompanying statements of assets and liabilities (consolidated statement of assets and liabilities for Gold Portfolio), including the schedules of investments (consolidated schedule of investments for Gold Portfolio), and the related statements of operations (consolidated statement of operations for Gold Portfolio) and of changes in net assets (consolidated changes in net assets for Gold Portfolio) and the financial highlights present fairly, in all material respects, the financial positions of Chemicals Portfolio, Gold Portfolio and Materials Portfolio (funds of Fidelity Select Portfolios) at February 28, 2014, the results of each of their operations for the year then ended, the changes in each of their net assets for each of the two years in the period then ended and the financial highlights for each of the five years in the period then ended, in conformity with accounting principles generally accepted in the United States of America. These financial statements and financial highlights (hereafter referred to as "financial statements") are the responsibility of the Fidelity Select Portfolios' management. Our responsibility is to express an opinion on these financial statements based on our audits. We conducted our audits of these financial statements in accordance with the standards of the Public Company Accounting Oversight Board (United States). Those standards require that we plan and perform the audit to obtain reasonable assurance about whether the financial statements are free of material misstatement. An audit includes examining, on a test basis, evidence supporting the amounts and disclosures in the financial statements, assessing the accounting principles used and significant estimates made by management, and evaluating the overall financial statement presentation. We believe that our audits, which included confirmation of securities at February 28, 2014 by correspondence with the custodian and brokers, provide a reasonable basis for our opinion.
PricewaterhouseCoopers LLP
Boston, Massachusetts
April 17, 2014
Annual Report
Trustees and Officers
The Trustees and officers of the trust and funds, as applicable, are listed below. The Board of Trustees governs each fund and is responsible for protecting the interests of shareholders. The Trustees are experienced executives who meet periodically throughout the year to oversee each fund's activities, review contractual arrangements with companies that provide services to each fund, oversee management of the risks associated with such activities and contractual arrangements, and review each fund's performance. Except for Ned C. Lautenbach and William S. Stavropoulos, each of the Trustees oversees 74 funds. Mr. Lautenbach and Mr. Stavropoulos each oversees 246 funds.
The Trustees hold office without limit in time except that (a) any Trustee may resign; (b) any Trustee may be removed by written instrument, signed by at least two-thirds of the number of Trustees prior to such removal; (c) any Trustee who requests to be retired or who has become incapacitated by illness or injury may be retired by written instrument signed by a majority of the other Trustees; and (d) any Trustee may be removed at any special meeting of shareholders by a two-thirds vote of the outstanding voting securities of the trust. The officers hold office without limit in time, except that any officer may resign or may be removed by a vote of a majority of the Trustees at any regular meeting or any special meeting of the Trustees. Except as indicated, each individual has held the office shown or other offices in the same company for the past five years.
Experience, Skills, Attributes, and Qualifications of the Funds' Trustees. The Governance and Nominating Committee has adopted a statement of policy that describes the experience, qualifications, attributes, and skills that are necessary and desirable for potential Independent Trustee candidates (Statement of Policy). The Board believes that each Trustee satisfied at the time he or she was initially elected or appointed a Trustee, and continues to satisfy, the standards contemplated by the Statement of Policy. The Governance and Nominating Committee also engages professional search firms to help identify potential Independent Trustee candidates who have the experience, qualifications, attributes, and skills consistent with the Statement of Policy. From time to time, additional criteria based on the composition and skills of the current Independent Trustees, as well as experience or skills that may be appropriate in light of future changes to board composition, business conditions, and regulatory or other developments, have also been considered by the professional search firms and the Governance and Nominating Committee. In addition, the Board takes into account the Trustees' commitment and participation in Board and committee meetings, as well as their leadership of standing and ad hoc committees throughout their tenure.
In determining that a particular Trustee was and continues to be qualified to serve as a Trustee, the Board has considered a variety of criteria, none of which, in isolation, was controlling. The Board believes that, collectively, the Trustees have balanced and diverse experience, qualifications, attributes, and skills, which allow the Board to operate effectively in governing each fund and protecting the interests of shareholders. Information about the specific experience, skills, attributes, and qualifications of each Trustee, which in each case led to the Board's conclusion that the Trustee should serve (or continue to serve) as a trustee of the funds, is provided below.
Board Structure and Oversight Function. Brian B. Hogan is an interested person (as defined in the 1940 Act) and currently serves as Chairman. The Trustees have determined that an interested Chairman is appropriate and benefits shareholders because an interested Chairman has a personal and professional stake in the quality and continuity of services provided to the funds. Independent Trustees exercise their informed business judgment to appoint an individual of their choosing to serve as Chairman, regardless of whether the Trustee happens to be independent or a member of management. The Independent Trustees have determined that they can act independently and effectively without having an Independent Trustee serve as Chairman and that a key structural component for assuring that they are in a position to do so is for the Independent Trustees to constitute a substantial majority for the Board. The Independent Trustees also regularly meet in executive session. Michael E. Wiley serves as Chairman of the Independent Trustees and as such (i) acts as a liaison between the Independent Trustees and management with respect to matters important to the Independent Trustees and (ii) with management prepares agendas for Board meetings.
Fidelity funds are overseen by different Boards of Trustees. The funds' Board oversees Fidelity's sector portfolios. Other Boards oversee Fidelity's equity and high income funds, and Fidelity's investment grade bond, money market, and asset allocation funds. The use of separate Boards, each with its own committee structure, allows the Trustees of each group of Fidelity funds to focus on the unique issues of the funds they oversee, including common research, investment, and operational issues. On occasion, the separate Boards establish joint committees to address issues of overlapping consequences for the Fidelity funds overseen by each Board.
The Trustees operate using a system of committees to facilitate the timely and efficient consideration of all matters of importance to the Trustees, each fund, and fund shareholders and to facilitate compliance with legal and regulatory requirements and oversight of the funds' activities and associated risks. The Board, acting through its committees, has charged SelectCo and its affiliates with (i) identifying events or circumstances the occurrence of which could have demonstrably adverse effects on the funds' business and/or reputation; (ii) implementing processes and controls to lessen the possibility that such events or circumstances occur or to mitigate the effects of such events or circumstances if they do occur; and (iii) creating and maintaining a system designed to evaluate continuously business and market conditions in order to facilitate the identification and implementation processes described in (i) and (ii) above. Because the day-to-day operations and activities of the funds are carried out by or through SelectCo, its affiliates, and other service providers, the funds' exposure to risks is mitigated but not eliminated by the processes overseen by the Trustees. While each of the Board's committees has responsibility for overseeing different aspects of the funds' activities, oversight is exercised primarily through the Operations and Audit Committees. Appropriate personnel, including but not limited to the funds' Chief Compliance Officer (CCO), SelectCo's internal auditor, the independent accountants, the funds' Treasurer and portfolio management personnel, make periodic reports to the Board's committees, as appropriate. The responsibilities of each standing committee, including their oversight responsibilities, are described further under "Standing Committees of the Funds' Trustees."
The funds' Statement of Additional Information (SAI) includes more information about the Trustees. To request a free copy, call Fidelity at 1-800-544-8544.
Annual Report
Interested Trustee*:
Correspondence intended for the Trustee who is an interested person may be sent to Fidelity Investments, 245 Summer Street, Boston, Massachusetts 02210.
Name, Year of Birth; Principal Occupations and Other Relevant Experience+ | |
Brian B. Hogan (1964) | |
Year of Election or Appointment: 2014 Trustee Chairman of the Board of Trustees | |
| Mr. Hogan also serves as Trustee or Vice President of other funds. Mr. Hogan serves as President of FMR's Equity Division (2009-present). Previously, Mr. Hogan served as Senior Vice President, Equity Research of FMR (2006-2009) and as a portfolio manager. |
* Trustee has been determined to be an "Interested Trustee" by virtue of, among other things, his affiliation with the trust or various entities under common control with SelectCo.
+ The information above includes the Trustee's principal occupation during the last five years and other information relating to the experience, attributes, and skills relevant to the Trustee's qualifications to serve as a Trustee, which led to the conclusion that the Trustee should serve as a Trustee for each fund.
Independent Trustees:
Correspondence intended for each Independent Trustee (that is, the Trustees other than the Interested Trustee) may be sent to Fidelity Investments, P.O. Box 55235, Boston, Massachusetts 02205-5235.
Name, Year of Birth; Principal Occupations and Other Relevant Experience+ | |
Ned C. Lautenbach (1944) | |
Year of Election or Appointment: 2000 Trustee | |
| Mr. Lautenbach also serves as Trustee of other Fidelity funds. Mr. Lautenbach currently serves as the Lead Director of the Eaton Corporation Board of Directors (diversified industrial, 1997-present). Mr. Lautenbach is Chairman of the Board of Directors of the Philharmonic Center for the Arts in Naples, Florida (2012-present) and a member of the Council on Foreign Relations (1994-present). Previously, Mr. Lautenbach was a Partner/Advisory Partner at Clayton, Dubilier & Rice, LLC (private equity investment, 1998-2010), as well as a Director of Sony Corporation (2006-2007). |
David A. Rosow (1942) | |
Year of Election or Appointment: 2013 Trustee | |
| Mr. Rosow also serves as Trustee of other Fidelity funds. Mr. Rosow is Chairman and Chief Executive Officer of International Golf Group, Inc. (golf course development, 1989-present). Previously, Mr. Rosow served as Chairman and Chief Executive Officer of Rosow & Company, Inc. (private investment company, 1989-2011), a Lead Director of Hudson United Bancorp (2001-2006) and as a Director of TD Banknorth (1996-2006). In addition, Mr. Rosow is a member (2008-present) and President (2009-present) of the Town Council of Palm Beach, Florida. Mr. Rosow served as a Member of the Advisory Board of other Fidelity funds (2012-2013). |
Garnett A. Smith (1947) | |
Year of Election or Appointment: 2013 Trustee | |
| Mr. Smith also serves as Trustee of other Fidelity funds. Prior to Mr. Smith's retirement, he served as Chairman and Chief Executive Officer of Inbrand Corp. (manufacturer of personal absorbent products, 1990-1997). He also served as President (1986-1990) of Inbrand Corp. Prior to his employment with Inbrand Corp., he was employed by a retail fabric chain and North Carolina National Bank. In addition, Mr. Smith is a board member of the Jackson Hole Land Trust (2009-present). Mr. Smith served as a Member of the Advisory Board of other Fidelity funds (2012-2013). |
William S. Stavropoulos (1939) | |
Year of Election or Appointment: 2001 Trustee | |
| Mr. Stavropoulos also serves as Trustee of other Fidelity funds. Mr. Stavropoulos serves as President and Founder of the Michigan Baseball Foundation, the Great Lakes Loons (2007-present). Mr. Stavropoulos is Chairman Emeritus of the Board of Directors of The Dow Chemical Company, where he previously served in numerous senior management positions, including President, CEO (1995-2000; 2002-2004), Chairman of the Executive Committee (2000-2006), and as a member of the Board of Directors (1990-2006). Currently, Mr. Stavropoulos is Chairman of the Board of Directors of Univar Inc. (global distributor of commodity and specialty chemicals), a Director of Teradata Corporation (data warehousing and technology solutions), and Maersk Inc. (industrial conglomerate), and a member of the Advisory Board for Metalmark Capital LLC (private equity investment, 2005-present). Mr. Stavropoulos is an operating advisor to Clayton, Dubilier & Rice, LLC (private equity investment). In addition, Mr. Stavropoulos is a member of the University of Notre Dame Advisory Council for the College of Science, a Trustee of the Rollin L. Gerstacker Foundation, and a Director of the Naples Philharmonic Center for the Arts. Previously, Mr. Stavropoulos served as a Director of Chemical Financial Corporation (bank holding company, 1993-2012) and Tyco International, Ltd. (multinational manufacturing and services, 2007-2012). |
Michael E. Wiley (1950) | |
Year of Election or Appointment: 2008 Trustee Chairman of the Independent Trustees | |
| Mr. Wiley also serves as Trustee of other Fidelity funds. Mr. Wiley serves as a Director of Asia Pacific Exploration Consolidated (international oil and gas exploration and production, 2008-present). Mr. Wiley serves as a Director of Tesoro Corporation (independent oil refiner and marketer, 2005-present), and a Director of Bill Barrett Corporation (exploration and production, 2005-present). In addition, Mr. Wiley also serves as a Director of Post Oak Bank (privately-held bank, 2004-present). Previously, Mr. Wiley served as a Trustee of other Fidelity funds (2008-2013), as a member of the Board of Trustees of the University of Tulsa (2000-2006; 2007-2010), as a Senior Energy Advisor of Katzenbach Partners, LLC (consulting, 2006-2007), as an Advisory Director of Riverstone Holdings (private investment), Chairman, President, and CEO of Baker Hughes, Inc. (oilfield services, 2000-2004), and as Director of Spinnaker Exploration Company (exploration and production, 2001-2005). |
+ The information above includes each Trustee's principal occupation during the last five years and other information relating to the experience, attributes, and skills relevant to each Trustee's qualifications to serve as a Trustee, which led to the conclusion that each Trustee should serve as a Trustee for each fund.
Officers:
Except for Anthony R. Rochte, correspondence intended for each officer may be sent to Fidelity Investments, 245 Summer Street, Boston, Massachusetts 02210. Correspondence intended for Mr. Rochte may be sent to SelectCo, 1225 17th Street, Denver, Colorado 80202-5541. Officers appear below in alphabetical order.
Name, Year of Birth; Principal Occupation | |
Christopher S. Bartel (1971) | |
Year of Election or Appointment: 2009 Vice President | |
| Mr. Bartel also serves as Vice President of other funds. Mr. Bartel serves as a Director, President, and Chief Executive Officer of Fidelity Management & Research (Japan) Inc. (2012-present), a Director of Fidelity Management & Research (Hong Kong) (2012-present), and Senior Vice President of Global Equity Research (2010-present). Previously, Mr. Bartel served as Senior Vice President of Equity Research (2009-2010), Managing Director of Research (2006-2009), and an analyst and portfolio manager (2000-2006). |
Elizabeth Paige Baumann (1968) | |
Year of Election or Appointment: 2012 Anti-Money Laundering (AML) Officer | |
| Ms. Baumann also serves as AML Officer of other funds. She is Chief AML Officer of FMR LLC (2012-present) and is an employee of Fidelity Investments. Previously, Ms. Baumann served as Vice President and Deputy Anti-Money Laundering Officer (2007-2012). |
Marc Bryant (1966) | |
Year of Election or Appointment: 2013 Secretary | |
| Mr. Bryant also serves as an officer of other funds. He is Senior Vice President and Deputy General Counsel of FMR LLC. Prior to joining Fidelity Investments, Mr. Bryant served as a Senior Vice President and the Head of Global Retail Legal for AllianceBernstein L.P. (2006-2010), and as the General Counsel for ProFund Advisors LLC (2001-2006). |
William C. Coffey (1969) | |
Year of Election or Appointment: 2009 Assistant Secretary | |
| Mr. Coffey also serves as Assistant Secretary of other funds. He is Senior Vice President and Deputy General Counsel of FMR LLC (2010-present), and is an employee of Fidelity Investments. Previously, Mr. Coffey served as Vice President and Associate General Counsel of FMR LLC (2005-2009). |
Jonathan Davis (1968) | |
Year of Election or Appointment: 2010 Assistant Treasurer | |
| Mr. Davis also serves as Assistant Treasurer of other funds. Mr. Davis is an employee of Fidelity Investments. Previously, Mr. Davis served as Vice President and Associate General Counsel of FMR LLC (2003-2010). |
Adrien E. Deberghes (1967) | |
Year of Election or Appointment: 2013 President and Treasurer | |
| Mr. Deberghes also serves as an officer of other funds. He is an employee of Fidelity Investments (2008-present). Prior to joining Fidelity Investments, Mr. Deberghes was Senior Vice President of Mutual Fund Administration at State Street Corporation (2007-2008), Senior Director of Mutual Fund Administration at Investors Bank & Trust (2005-2007), and Director of Finance for Dunkin' Brands (2000-2005). |
Stephanie J. Dorsey (1969) | |
Year of Election or Appointment: 2010 Assistant Treasurer | |
| Ms. Dorsey also serves as an officer of other funds. She is an employee of Fidelity Investments (2008-present) and has served in other fund officer roles. Prior to joining Fidelity Investments, Ms. Dorsey served as Treasurer (2004-2008) of the JPMorgan Mutual Funds and Vice President (2004-2008) of JPMorgan Chase Bank. |
Joseph A. Hanlon (1968) | |
Year of Election or Appointment: 2012 Chief Compliance Officer | |
| Mr. Hanlon also serves as Chief Compliance Officer of other funds. Mr. Hanlon serves as Compliance Officer of FMR, FMR Co., Inc., Fidelity Investments Money Management, Inc. (FIMM), Fidelity Research and Analysis Company (FRAC), and Fidelity Management & Research (Hong Kong) (2009-present), as Senior Vice President of the Fidelity Asset Management Division (2009-present), and is an employee of Fidelity Investments. Previously, Mr. Hanlon served as Compliance Officer of Fidelity Management & Research (Japan) Inc. (2009-2013), Strategic Advisers, Inc. (2009-2013), and Fidelity Management & Research (U.K.) Inc. (2009-2013). |
Brian B. Hogan (1964) | |
Year of Election or Appointment: 2009 Vice President | |
| Mr. Hogan also serves as Trustee or Vice President of other funds. Mr. Hogan serves as President of FMR's Equity Division (2009-present). Previously, Mr. Hogan served as Senior Vice President, Equity Research of FMR (2006-2009) and as a portfolio manager. |
Chris Maher (1972) | |
Year of Election or Appointment: 2013 Assistant Treasurer | |
| Mr. Maher serves as Assistant Treasurer of other funds. Mr. Maher is Vice President of Valuation Oversight and is an employee of Fidelity Investments. Previously, Mr. Maher served as Vice President of Asset Management Compliance (2013), Vice President of FMR's Program Management Group (2010-2013), and Vice President of Valuation Oversight (2008-2010). |
Christine Reynolds (1958) | |
Year of Election or Appointment: 2008 Chief Financial Officer | |
| Ms. Reynolds also serves as Chief Financial Officer of other funds. Ms. Reynolds became President of Fidelity Pricing and Cash Management Services (FPCMS) in August 2008. Ms. Reynolds served as Chief Operating Officer of FPCMS (2007-2008). Previously, Ms. Reynolds served as President, Treasurer, and Anti-Money Laundering officer of the Fidelity funds (2004-2007). |
Kenneth B. Robins (1969) | |
Year of Election or Appointment: 2013 Deputy Treasurer | |
| Mr. Robins also serves as an officer of other funds. Mr. Robins serves as Executive Vice President of Fidelity Investments Money Management, Inc. (FIMM) (2013-present) and is an employee of Fidelity Investments (2004-present). Previously, Mr. Robins served in other fund officer roles. |
Anthony R. Rochte (1968) | |
Year of Election or Appointment: 2013 Vice President | |
| Mr. Rochte also serves as Vice President of other funds. Mr. Rochte serves as President of Fidelity SelectCo, LLC (2012-present) and is an employee of Fidelity Investments (2012-present). Prior to joining Fidelity Investments, Mr. Rochte served as Senior Managing Director and head of State Street Global Advisors' North American Intermediary Business Group (2006-2012). |
Stacie M. Smith (1974) | |
Year of Election or Appointment: 2013 Assistant Treasurer | |
| Ms. Smith also serves as an officer of other funds. She is an employee of Fidelity Investments (2009-present) and has served in other fund officer roles. Prior to joining Fidelity Investments, Ms. Smith served as Senior Audit Manager of Ernst & Young LLP (1996-2009). |
Renee Stagnone (1975) | |
Year of Election or Appointment: 2013 Deputy Treasurer | |
| Ms. Stagnone also serves as Deputy Treasurer of other funds. Ms. Stagnone is an employee of Fidelity Investments. |
Joseph F. Zambello (1957) | |
Year of Election or Appointment: 2011 Deputy Treasurer | |
| Mr. Zambello also serves as Deputy Treasurer of other funds. Mr. Zambello is an employee of Fidelity Investments. Previously, Mr. Zambello served as Vice President of FMR's Program Management Group (2009-2011) and Vice President of the Transfer Agent Oversight Group (2005-2009). |
Annual Report
Distributions (Unaudited)
The Board of Trustees of each fund voted to pay to shareholders of record at the opening of business on record date the following distributions per share derived from capital gains realized from sales of portfolio securities and dividends derived from net investment income:
| Pay Date | Record Date | Dividends | Capital Gains |
Chemicals Portfolio | 04/14/14 | 04/11/14 | $0.220 | $3.110 |
Gold Portfolio | 04/14/14 | 04/11/14 | $0.000 | $0.000 |
Materials Portfolio | 04/14/14 | 04/11/14 | $0.118 | $2.337 |
The funds hereby designate as capital gain dividend the amounts noted below for the taxable year ended February 28, 2014, or, if subsequently determined to be different, the net capital gain of such year.
Chemicals Portfolio | $51,351,367 |
Materials Portfolio | $93,576,128 |
A percentage of the dividends distributed during the fiscal year for the following funds qualify for the dividends-received deduction for corporate shareholders:
| April 2013 | December 2013 |
Chemicals Portfolio | 58% | 65% |
Materials Portfolio | 100% | 100% |
A percentage of the dividends distributed during the fiscal year for the following funds may be taken into account as a dividend for purposes of the maximum rate under section 1(h) (11) of the Internal Revenue Code:
| April 2013 | December 2013 |
Chemicals Portfolio | 64% | 73% |
Materials Portfolio | 100% | 100% |
The funds will notify shareholders in January 2015 of amounts for use in preparing 2014 income tax returns.
Annual Report
Proxy Voting Results
A special meeting of each fund's shareholders was held on June 18, 2013. The results of votes taken among shareholders on the proposals before them are reported below. Each vote reported represents one dollar of net asset value held on the record date for the meeting.
PROPOSAL 1 | ||
To elect a Board of Trustees.A | ||
Ned C. Lautenbach | # of | % of |
Affirmative | 25,828,395,115.78 | 94.160 |
Withheld | 1,602,101,684.27 | 5.840 |
TOTAL | 27,430,496,800.05 | 100.000 |
Ronald P. O'Hanley | ||
Affirmative | 25,907,936,922.24 | 94.450 |
Withheld | 1,522,559,877.81 | 5.550 |
TOTAL | 27,430,496,800.05 | 100.000 |
David A. Rosow | ||
Affirmative | 25,805,492,959.91 | 94.076 |
Withheld | 1,625,003,840.14 | 5.924 |
TOTAL | 27,430,496,800.05 | 100.000 |
Garnett A. Smith | ||
Affirmative | 25,892,258,831.97 | 94.393 |
Withheld | 1,538,237,968.08 | 5.607 |
TOTAL | 27,430,496,800.05 | 100.000 |
William S. Stavropoulos | ||
Affirmative | 25,738,476,030.34 | 93.832 |
Withheld | 1,692,020,769.71 | 6.168 |
TOTAL | 27,430,496,800.05 | 100.000 |
Michael E. Wiley | ||
Affirmative | 25,923,640,743.27 | 94.507 |
Withheld | 1,506,856,056.78 | 5.493 |
TOTAL | 27,430,496,800.05 | 100.000 |
PROPOSAL 2 | ||
To approve a management contract between Chemicals Portfolio and Fidelity SelectCo, LLC. | ||
| # of | % of |
Affirmative | 600,773,276.46 | 85.043 |
Against | 29,286,169.06 | 4.146 |
Abstain | 34,902,434.23 | 4.941 |
Broker Non-Vote | 41,473,452.59 | 5.870 |
TOTAL | 706,435,332.34 | 100.000 |
PROPOSAL 2 | ||
To approve a management contract between Gold Portfolio and Fidelity SelectCo, LLC. | ||
| # of | % of |
Affirmative | 1,324,132,405.74 | 82.001 |
Against | 87,695,443.27 | 5.431 |
Abstain | 81,563,532.56 | 5.051 |
Broker Non-Vote | 121,395,496.57 | 7.517 |
TOTAL | 1,614,786,878.14 | 100.000 |
PROPOSAL 2 | ||
To approve a management contract between Materials Portfolio and Fidelity SelectCo, LLC. | ||
| # of | % of |
Affirmative | 782,680,671.91 | 69.186 |
Against | 33,398,286.37 | 2.953 |
Abstain | 38,711,653.50 | 3.421 |
Broker Non-Vote | 276,491,097.39 | 24.440 |
TOTAL | 1,131,281,709.17 | 100.000 |
PROPOSAL 3 | ||
For Chemicals Portfolio, a shareholder proposal requesting that the Board of Trustees institute "Procedures to prevent holding investments in companies that, in management's judgment, substantially contribute to genocide or crimes against humanity."B | ||
| # of | % of |
Affirmative | 200,053,273.64 | 28.319 |
Against | 426,082,436.76 | 60.315 |
Abstain | 38,826,169.26 | 5.496 |
Broker Non-Vote | 41,473,452.68 | 5.870 |
TOTAL | 706,435,332.34 | 100.000 |
A Denotes trust-wide proposal and voting results. | ||
B Proposal was not approved by shareholders. | ||
Annual Report
Fidelity®
Select Portfolios®
Information Technology Sector
Communications Equipment Portfolio
Computers Portfolio
Electronics Portfolio
IT Services Portfolio
Software and Computer Services Portfolio
Technology Portfolio
Annual Report
February 28, 2014
(Fidelity Cover Art)
Contents
Shareholder Expense Example |
| |
Communications Equipment Portfolio | Performance | |
| Management's Discussion | |
| Investment Changes | |
| Investments | |
| Financial Statements | |
Computers Portfolio | Performance | |
| Management's Discussion | |
| Investment Changes | |
| Investments | |
| Financial Statements | |
Electronics Portfolio | Performance | |
| Management's Discussion | |
| Investment Changes | |
| Investments | |
| Financial Statements | |
IT Services Portfolio | Performance | |
| Management's Discussion | |
| Investment Changes | |
| Investments | |
| Financial Statements | |
Software and Computer Services Portfolio | Performance | |
| Management's Discussion | |
| Investment Changes | |
| Investments | |
| Financial Statements | |
Technology Portfolio | Performance | |
| Management's Discussion | |
| Investment Changes | |
| Investments | |
| Financial Statements | |
Notes to Financial Statements |
| |
Report of Independent Registered Public Accounting Firm |
| |
Trustees and Officers |
| |
Distributions |
| |
Proxy Voting Results |
|
Annual Report
To view a fund's proxy voting guidelines and proxy voting record for the 12-month period ended June 30, visit http://www.fidelity.com/proxyvotingresults or visit the Securities and Exchange Commission's (SEC) web site at http://www.sec.gov. You may also call 1-800-544-8544 to request a free copy of the proxy voting guidelines.
Standard & Poor's, S&P and S&P 500 are registered service marks of The McGraw-Hill Companies, Inc. and have been licensed for use by Fidelity Distributors Corporation.
Other third-party marks appearing herein are the property of their respective owners.
All other marks appearing herein are registered or unregistered trademarks or service marks of FMR LLC or an affiliated company. © 2014 FMR LLC. All rights reserved.
This report and the financial statements contained herein are submitted for the general information of the shareholders of the funds. This report is not authorized for distribution to prospective investors in the funds unless preceded or accompanied by an effective prospectus.
A fund files its complete schedule of portfolio holdings with the SEC for the first and third quarters of each fiscal year on Form N-Q. Forms N-Q are available on the SEC's web site at http://www.sec.gov. A fund's Forms N-Q may be reviewed and copied at the SEC's Public Reference Room in Washington, DC. Information regarding the operation of the SEC's Public Reference Room may be obtained by calling 1-800-SEC-0330. For a complete list of a fund's portfolio holdings, view the most recent holdings listing, semiannual report, or annual report on Fidelity's web site at http://www.fidelity.com, http://www.advisor.fidelity.com, or http://www.401k.com, as applicable.
NOT FDIC INSURED • MAY LOSE VALUE • NO BANK GUARANTEE
Neither the funds nor Fidelity Distributors Corporation is a bank.
Annual Report
Shareholder Expense Example
As a shareholder of a Fund, you incur two types of costs: (1) transaction costs, including redemption fees and (2) ongoing costs, including management fees and other Fund expenses. This Example is intended to help you understand your ongoing costs (in dollars) of investing in the Funds and to compare these costs with the ongoing costs of investing in other mutual funds.
The Example is based on an investment of $1,000 invested at the beginning of the period and held for the entire period (September 1, 2013 to February 28, 2014).
Actual Expenses
The first line of the accompanying table for each fund provides information about actual account values and actual expenses. You may use the information in this line, together with the amount you invested, to estimate the expenses that you paid over the period. Simply divide your account value by $1,000.00 (for example, an $8,600 account value divided by $1,000.00 = 8.6), then multiply the result by the number in the first line for a fund under the heading entitled "Expenses Paid During Period" to estimate the expenses you paid on your account during this period. A small balance maintenance fee of $12.00 that is charged once a year may apply for certain accounts with a value of less than $2,000. This fee is not included in the table below. If it was, the estimate of expenses you paid during the period would be higher, and your ending account value lower, by this amount. In addition, each Fund, as a shareholder in the underlying Fidelity Central Funds, will indirectly bear its pro-rata share of the fees and expenses incurred by the underlying Fidelity Central Funds. These fees and expenses are not included in the Fund's annualized expense ratio used to calculate the expense estimate in the table below.
Hypothetical Example for Comparison Purposes
The second line of the accompanying table for each fund provides information about hypothetical account values and hypothetical expenses based on a fund's actual expense ratio and an assumed rate of return of 5% per year before expenses, which is not the Fund's actual return. The hypothetical account values and expenses may not be used to estimate the actual ending account balance or expenses you paid for the period. You may use this information to compare the ongoing costs of investing in the Fund and other funds. To do so, compare this 5% hypothetical example with the 5% hypothetical examples that appear in the shareholder reports of the other funds. A small balance maintenance fee of $12.00 that is charged once a year may apply for certain accounts with a value of less than $2,000. This fee is not included in the table below. If it was, the estimate of expenses you paid during the period would be higher, and your ending account value lower, by this amount. In addition, each Fund, as a shareholder in the underlying Fidelity Central Funds, will indirectly bear its pro-rata share of the fees and expenses incurred by the underlying Fidelity Central Funds. These fees and expenses are not included in the Fund's annualized expense ratio used to calculate the expense estimate in the table below.
Please note that the expenses shown in the table are meant to highlight your ongoing costs only and do not reflect any transaction costs. Therefore, the second line of the table is useful in comparing ongoing costs only, and will not help you determine the relative total costs of owning different funds. In addition, if these transactional costs were included, your costs would have been higher.
| Annualized | Beginning | Ending | Expenses Paid |
Communications Equipment Portfolio | .86% |
|
|
|
Actual |
| $ 1,000.00 | $ 1,198.50 | $ 4.69 |
HypotheticalA |
| $ 1,000.00 | $ 1,020.53 | $ 4.31 |
Computers Portfolio | .81% |
|
|
|
Actual |
| $ 1,000.00 | $ 1,143.90 | $ 4.31 |
HypotheticalA |
| $ 1,000.00 | $ 1,020.78 | $ 4.06 |
Electronics Portfolio | .81% |
|
|
|
Actual |
| $ 1,000.00 | $ 1,234.40 | $ 4.49 |
HypotheticalA |
| $ 1,000.00 | $ 1,020.78 | $ 4.06 |
IT Services Portfolio | .83% |
|
|
|
Actual |
| $ 1,000.00 | $ 1,223.00 | $ 4.57 |
HypotheticalA |
| $ 1,000.00 | $ 1,020.68 | $ 4.16 |
Software and Computer Services Portfolio | .78% |
|
|
|
Actual |
| $ 1,000.00 | $ 1,278.00 | $ 4.41 |
HypotheticalA |
| $ 1,000.00 | $ 1,020.93 | $ 3.91 |
Technology Portfolio | .79% |
|
|
|
Actual |
| $ 1,000.00 | $ 1,223.60 | $ 4.36 |
HypotheticalA |
| $ 1,000.00 | $ 1,020.88 | $ 3.96 |
A 5% return per year before expenses
B Annualized expense ratio reflects expenses net of applicable fee waivers.
* Expenses are equal to each Fund's annualized expense ratio, multiplied by the average account value over the period, multiplied by 181/365 (to reflect the one-half year period).
Annual Report
Communications Equipment Portfolio
Performance: The Bottom Line
Average annual total return reflects the change in the value of an investment, assuming reinvestment of the fund's distributions from dividend income and capital gains (the profits earned upon the sale of securities that have grown in value, if any) and assuming a constant rate of performance each year. The $10,000 table and the fund's returns do not reflect the deduction of taxes that a shareholder would pay on fund distributions or the redemption of fund shares. During periods of reimbursement by Fidelity, a fund's total return will be greater than it would be had the reimbursement not occurred. How a fund did yesterday is no guarantee of how it will do tomorrow.
Average Annual Total Returns
Periods ended February 28, 2014 | Past 1 | Past 5 | Past 10 |
Communications Equipment Portfolio A | 29.41% | 24.33% | 4.68% |
A Prior to October 1, 2006, Communications Equipment Portfolio was named Developing Communications Portfolio, and the fund operated under certain different investment policies and compared its performance to a different additional index. The fund's historical performance may not represent its current investment policies.
$10,000 Over 10 Years
Let's say hypothetically that $10,000 was invested in Communications Equipment Portfolio on February 29, 2004. The chart shows how the value of your investment would have changed, and also shows how the S&P 500® Index performed over the same period.
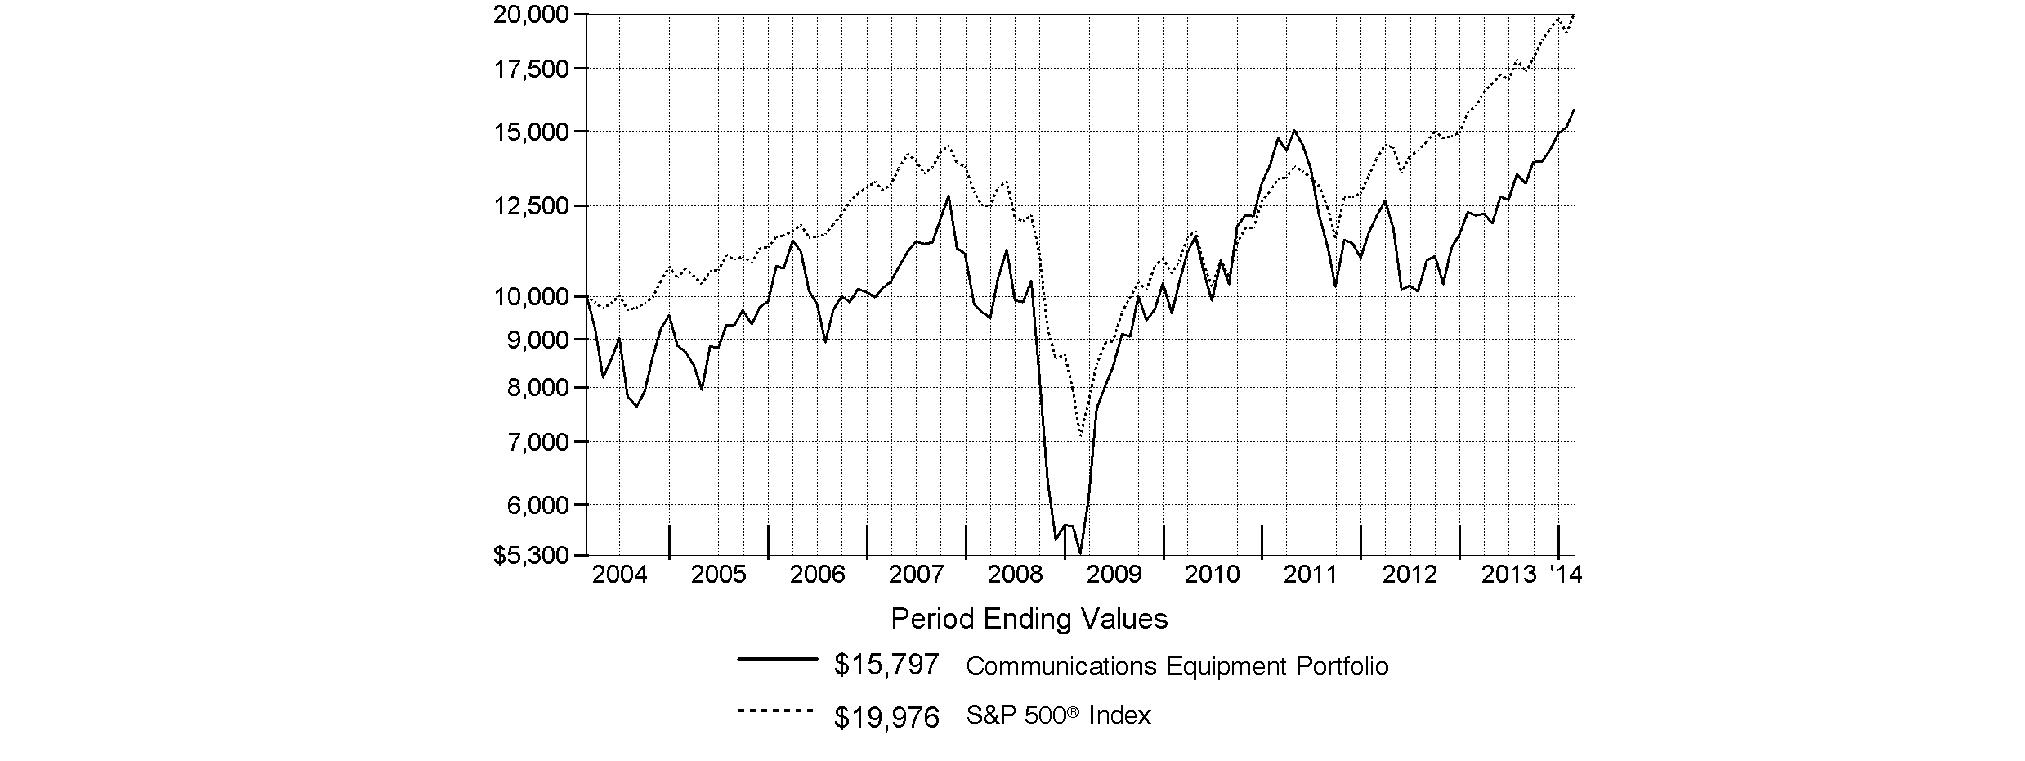
Annual Report
Communications Equipment Portfolio
Management's Discussion of Fund Performance
Market Recap: Stocks overcame fears of higher interest rates - not to mention their worst January in four years - to finish sharply higher for the 12 months ending February 28, 2014. The broad S&P 500® Index and the blue-chip Dow Jones Industrial AverageSM gained 25.37% and 19.01%, respectively, amid generally favorable earnings reports and accommodative monetary policies worldwide. Performance generally increased along the risk spectrum, with smaller-cap and growth strategies leading the way. An ebullient market helped the growth-oriented Nasdaq Composite Index® to a 38.10% period gain. Data still points to slow but steady improvement in the U.S., and Europe's recession may well be over. Reports from China have disappointed, but continue to suggest a relatively soft landing there. Mixed signals from the U.S. Federal Reserve as to when it might curtail its stimulative bond buying kept markets in flux during the spring and summer. Stocks regained momentum in October despite a federal budget impasse and brief government shutdown, and lower volatility prevailed through year-end. Shedding new-year concerns about China's economy, an emerging-markets sell-off and confirmation (at last) of Fed tapering - alongside confirmation of a presumably dovish Janet Yellen as new Fed chair - February saw stocks back in record territory, bearing down on the five-year anniversary of the market's bottom.
Comments from Ali Khan, Portfolio Manager of Communications Equipment Portfolio: For the year, the fund returned 29.41%, easily eclipsing the 26.23% gain of the S&P® Custom Communications Equipment Index and also topping the S&P 500®. Versus the broader market, the communications equipment group benefited from a cyclical rebound in the shares of companies supplying gear to telecom services providers. Solid stock picking enabled the fund to fare quite well versus its industry benchmark during the reporting period. The largest relative contributor was Aruba Networks, a provider of network access solutions for mobile enterprise networks. Two other noteworthy contributors were French communications equipment provider Alcatel-Lucent and optical networking equipment maker Infinera. Conversely, a sizable underweighting in Finland-based wireless handset maker Nokia, a key index component, was by far the fund's largest relative detractor. Nokia's stock posted a significant gain, most of which occurred in September, the month Microsoft announced plans to buy the company's handset business and license many of its patents in a deal valued at $7.2 billion. Not enough exposure to strong-performing index constituent Harris, which primarily serves the communications needs of governments, also worked against the fund. In July, I sold the fund's underweighted stake here for a profit but missed the stock's subsequent gains. Additionally, network equipment supplier Cisco Systems was a relative detractor. Cisco's shares declined in November after the firm's revenue came up short for its fiscal first quarter ending in October, and management shocked the market with extremely weak revenue guidance for the next quarter. I remained convinced that Cisco's problems were temporary. Consequently, I added to our modestly overweighted position here. The fund's cash position further dampened its gain.
The views expressed above reflect those of the portfolio manager(s) only through the end of the period as stated on the cover of this report and do not necessarily represent the views of Fidelity or any other person in the Fidelity organization. Any such views are subject to change at any time based upon market or other conditions and Fidelity disclaims any responsibility to update such views. These views may not be relied on as investment advice and, because investment decisions for a Fidelity fund are based on numerous factors, may not be relied on as an indication of trading intent on behalf of any Fidelity fund.
Annual Report
Communications Equipment Portfolio
Investment Changes (Unaudited)
Top Ten Stocks as of February 28, 2014 | ||
| % of fund's | % of fund's net assets |
Cisco Systems, Inc. | 17.7 | 20.9 |
QUALCOMM, Inc. | 16.5 | 15.6 |
Nokia Corp. sponsored ADR | 4.9 | 2.9 |
Juniper Networks, Inc. | 4.8 | 5.2 |
Telefonaktiebolaget LM Ericsson (B Shares) sponsored ADR | 4.6 | 4.4 |
F5 Networks, Inc. | 4.0 | 4.3 |
Alcatel-Lucent SA sponsored ADR | 4.0 | 3.0 |
Riverbed Technology, Inc. | 3.0 | 2.3 |
Motorola Solutions, Inc. | 2.6 | 3.0 |
Polycom, Inc. | 2.5 | 2.4 |
| 64.6 | |
Top Industries (% of fund's net assets) | |||
As of February 28, 2014 | |||
 | Communications Equipment | 83.0% |
|
| Semiconductors & Semiconductor Equipment | 4.0% |
|
| Software | 3.3% |
|
| Computers & Peripherals | 2.9% |
|
| Internet Software & Services | 2.4% |
|
| All Others* | 4.4% |
|

As of August 31, 2013 | |||
| Communications Equipment | 81.8% |
|
| Semiconductors & Semiconductor Equipment | 2.9% |
|
| Computers & Peripherals | 2.7% |
|
| IT Services | 1.7% |
|
| Electronic Equipment & Components | 1.5% |
|
| All Others* | 9.4% |
|

* Includes short-term investments and net other assets (liabilities). |
Annual Report
Communications Equipment Portfolio
Investments February 28, 2014
Showing Percentage of Net Assets
Common Stocks - 97.8% | |||
Shares | Value | ||
COMMUNICATIONS EQUIPMENT - 83.0% | |||
Communications Equipment - 83.0% | |||
ADVA Optical Networking SE (a) | 347,329 | $ 1,692,346 | |
Alcatel-Lucent SA sponsored ADR (d) | 3,218,143 | 13,773,652 | |
Aruba Networks, Inc. (a)(d) | 242,523 | 4,974,147 | |
BlackBerry Ltd. (a)(d) | 765,900 | 7,659,000 | |
Brocade Communications Systems, Inc. (a) | 318,641 | 3,049,394 | |
Calix Networks, Inc. (a) | 81,100 | 644,745 | |
Cisco Systems, Inc. | 2,818,876 | 61,451,496 | |
Comtech Telecommunications Corp. | 41,900 | 1,341,219 | |
F5 Networks, Inc. (a) | 123,935 | 13,922,858 | |
Infinera Corp. (a)(d) | 185,400 | 1,542,528 | |
InterDigital, Inc. | 78,100 | 2,382,050 | |
Ixia (a) | 127,200 | 1,572,192 | |
JDS Uniphase Corp. (a) | 246,600 | 3,398,148 | |
Juniper Networks, Inc. (a) | 620,412 | 16,589,817 | |
Motorola Solutions, Inc. | 139,181 | 9,213,782 | |
NETGEAR, Inc. (a) | 119,750 | 4,093,055 | |
Nokia Corp. sponsored ADR (a) | 2,273,320 | 17,231,766 | |
Oclaro, Inc. (a) | 117,700 | 331,914 | |
Palo Alto Networks, Inc. (a) | 105,900 | 7,534,785 | |
Plantronics, Inc. | 176,500 | 7,833,070 | |
Polycom, Inc. (a) | 643,063 | 8,591,322 | |
QUALCOMM, Inc. | 759,419 | 57,176,657 | |
Radware Ltd. (a) | 341,600 | 5,998,496 | |
Riverbed Technology, Inc. (a) | 462,442 | 10,303,208 | |
Sonus Networks, Inc. (a) | 1,084,700 | 4,045,931 | |
Spirent Communications PLC | 1,067,700 | 1,877,313 | |
Telefonaktiebolaget LM Ericsson (B Shares) sponsored ADR (d) | 1,249,980 | 16,137,242 | |
ViaSat, Inc. (a) | 40,596 | 2,708,159 | |
Wi-Lan, Inc. (d) | 405,400 | 1,255,777 | |
| 288,326,069 | ||
COMPUTERS & PERIPHERALS - 2.9% | |||
Computer Hardware - 1.6% | |||
Apple, Inc. | 9,100 | 4,788,784 | |
Super Micro Computer, Inc. (a) | 32,800 | 662,232 | |
| 5,451,016 | ||
Computer Storage & Peripherals - 1.3% | |||
EMC Corp. | 99,500 | 2,623,815 | |
QLogic Corp. (a) | 185,600 | 2,119,552 | |
| 4,743,367 | ||
TOTAL COMPUTERS & PERIPHERALS | 10,194,383 | ||
ELECTRONIC EQUIPMENT & COMPONENTS - 0.7% | |||
Electronic Manufacturing Services - 0.3% | |||
Jabil Circuit, Inc. | 49,800 | 921,798 | |
| |||
Shares | Value | ||
Technology Distributors - 0.4% | |||
Arrow Electronics, Inc. (a) | 26,000 | $ 1,472,380 | |
TOTAL ELECTRONIC EQUIPMENT & COMPONENTS | 2,394,178 | ||
HEALTH CARE TECHNOLOGY - 0.3% | |||
Health Care Technology - 0.3% | |||
Vocera Communications, Inc. (a) | 60,300 | 1,026,306 | |
INTERNET SOFTWARE & SERVICES - 2.4% | |||
Internet Software & Services - 2.4% | |||
Equinix, Inc. (a) | 10,300 | 1,956,588 | |
Google, Inc. Class A (a) | 4,700 | 5,713,555 | |
Rackspace Hosting, Inc. (a) | 14,900 | 547,873 | |
| 8,218,016 | ||
IT SERVICES - 1.2% | |||
IT Consulting & Other Services - 1.2% | |||
Amdocs Ltd. | 94,600 | 4,207,808 | |
SEMICONDUCTORS & SEMICONDUCTOR EQUIPMENT - 4.0% | |||
Semiconductors - 4.0% | |||
Altera Corp. | 205,700 | 7,468,967 | |
Broadcom Corp. Class A | 159,900 | 4,752,228 | |
Semtech Corp. (a) | 75,100 | 1,873,745 | |
| 14,094,940 | ||
SOFTWARE - 3.3% | |||
Application Software - 0.9% | |||
BroadSoft, Inc. (a) | 27,900 | 837,279 | |
Citrix Systems, Inc. (a) | 35,600 | 2,137,780 | |
| 2,975,059 | ||
Systems Software - 2.4% | |||
Infoblox, Inc. (a) | 112,400 | 2,594,192 | |
Oracle Corp. | 68,600 | 2,682,946 | |
Rovi Corp. (a) | 51,500 | 1,279,260 | |
Symantec Corp. | 84,500 | 1,815,060 | |
| 8,371,458 | ||
TOTAL SOFTWARE | 11,346,517 | ||
TOTAL COMMON STOCKS (Cost $310,753,642) |
| ||
Money Market Funds - 6.3% | |||
Shares | Value | ||
Fidelity Cash Central Fund, 0.10% (b) | 6,437,325 | $ 6,437,325 | |
Fidelity Securities Lending Cash Central Fund, 0.09% (b)(c) | 15,341,294 | 15,341,294 | |
TOTAL MONEY MARKET FUNDS (Cost $21,778,619) |
| ||
TOTAL INVESTMENT PORTFOLIO - 104.1% (Cost $332,532,261) | 361,586,836 | ||
NET OTHER ASSETS (LIABILITIES) - (4.1)% | (14,241,770) | ||
NET ASSETS - 100% | $ 347,345,066 | ||
Legend |
(a) Non-income producing |
(b) Affiliated fund that is generally available only to investment companies and other accounts managed by Fidelity Investments. The rate quoted is the annualized seven-day yield of the fund at period end. A complete unaudited listing of the fund's holdings as of its most recent quarter end is available upon request. In addition, each Fidelity Central Fund's financial statements, which are not covered by the Fund's Report of Independent Registered Public Accounting Firm, are available on the SEC's website or upon request. |
(c) Investment made with cash collateral received from securities on loan. |
(d) Security or a portion of the security is on loan at period end. |
Affiliated Central Funds |
Information regarding fiscal year to date income earned by the Fund from investments in Fidelity Central Funds is as follows: |
Fund | Income earned |
Fidelity Cash Central Fund | $ 10,077 |
Fidelity Securities Lending Cash Central Fund | 300,921 |
Total | $ 310,998 |
Other Information |
All investments are categorized as Level 1 under the Fair Value Hierarchy. The inputs or methodology used for valuing securities may not be an indication of the risk associated with investing in those securities. For more information on valuation inputs, please refer to the Investment Valuation section in the accompanying Notes to Financial Statements. |
Distribution of investments by country or territory of incorporation, as a percentage of total net assets, is as follows (Unaudited): |
United States of America | 81.2% |
Finland | 4.9% |
Sweden | 4.6% |
France | 4.0% |
Canada | 2.6% |
Israel | 1.7% |
Others (Individually Less Than 1%) | 1.0% |
| 100.0% |
See accompanying notes which are an integral part of the financial statements.
Annual Report
Communications Equipment Portfolio
Financial Statements
Statement of Assets and Liabilities
| February 28, 2014 (Unaudited) | |
|
|
|
Assets | ||
Investment in securities, at value securities loaned of $14,420,526 - See accompanying schedule: Unaffiliated issuers (cost $310,753,642) | $ 339,808,217 |
|
Fidelity Central Funds (cost $21,778,619) | 21,778,619 |
|
Total Investments (cost $332,532,261) |
| $ 361,586,836 |
Receivable for investments sold | 3,652,910 | |
Receivable for fund shares sold | 214,383 | |
Dividends receivable | 71,814 | |
Distributions receivable from Fidelity Central Funds | 3,374 | |
Prepaid expenses | 1,613 | |
Other receivables | 10,652 | |
Total assets | 365,541,582 | |
|
|
|
Liabilities | ||
Payable for investments purchased | $ 2,039,721 | |
Payable for fund shares redeemed | 567,068 | |
Accrued management fee | 150,235 | |
Other affiliated payables | 66,954 | |
Other payables and accrued expenses | 31,244 | |
Collateral on securities loaned, at value | 15,341,294 | |
Total liabilities | 18,196,516 | |
|
|
|
Net Assets | $ 347,345,066 | |
Net Assets consist of: |
| |
Paid in capital | $ 324,861,567 | |
Undistributed net investment income | 34,132 | |
Accumulated undistributed net realized gain (loss) on investments and foreign currency transactions | (6,605,589) | |
Net unrealized appreciation (depreciation) on investments and assets and liabilities in foreign currencies | 29,054,956 | |
Net Assets, for 11,119,754 shares outstanding | $ 347,345,066 | |
Net Asset Value, offering price and redemption price per share ($347,345,066 ÷ 11,119,754 shares) | $ 31.24 | |
Statement of Operations
| Year ended February 28, 2014 (Unaudited) | |
|
|
|
Investment Income |
|
|
Dividends |
| $ 4,344,403 |
Income from Fidelity Central Funds (including $300,921 from security lending) |
| 310,998 |
Total income |
| 4,655,401 |
|
|
|
Expenses | ||
Management fee | $ 1,617,923 | |
Transfer agent fees | 749,530 | |
Accounting and security lending fees | 118,883 | |
Custodian fees and expenses | 115,517 | |
Independent trustees' compensation | 5,594 | |
Registration fees | 23,224 | |
Audit | 39,419 | |
Legal | 7,368 | |
Interest | 1,559 | |
Miscellaneous | 3,148 | |
Total expenses before reductions | 2,682,165 | |
Expense reductions | (35,768) | 2,646,397 |
2,009,004 | ||
Realized and Unrealized Gain (Loss) Net realized gain (loss) on: | ||
Investment securities: |
|
|
Unaffiliated issuers | 40,148,753 | |
Foreign currency transactions | (1,585) | |
Total net realized gain (loss) |
| 40,147,168 |
Change in net unrealized appreciation (depreciation) on: Investment securities | 30,888,390 | |
Assets and liabilities in foreign currencies | 412 | |
Total change in net unrealized appreciation (depreciation) |
| 30,888,802 |
Net gain (loss) | 71,035,970 | |
Net increase (decrease) in net assets resulting from operations | $ 73,044,974 | |
See accompanying notes which are an integral part of the financial statements.
Annual Report
Fund Name
Financial Statements - continued
Statement of Changes in Net Assets
| Year ended | Year ended |
Increase (Decrease) in Net Assets |
|
|
Operations |
|
|
Net investment income (loss) | $ 2,009,004 | $ 1,607,121 |
Net realized gain (loss) | 40,147,168 | 16,260,891 |
Change in net unrealized appreciation (depreciation) | 30,888,802 | (20,632,050) |
Net increase (decrease) in net assets resulting from operations | 73,044,974 | (2,764,038) |
Distributions to shareholders from net investment income | (1,754,259) | (1,920,292) |
Distributions to shareholders from return of capital | - | (253,959) |
Total distributions | (1,754,259) | (2,174,251) |
Share transactions | 174,276,179 | 167,243,187 |
Reinvestment of distributions | 1,683,914 | 2,090,968 |
Cost of shares redeemed | (215,924,882) | (180,990,018) |
Net increase (decrease) in net assets resulting from share transactions | (39,964,789) | (11,655,863) |
Redemption fees | 6,805 | 8,319 |
Total increase (decrease) in net assets | 31,332,731 | (16,585,833) |
|
|
|
Net Assets | ||
Beginning of period | 316,012,335 | 332,598,168 |
End of period (including undistributed net investment income of $34,132 and distributions in excess of net investment income of $161, respectively) | $ 347,345,066 | $ 316,012,335 |
Other Information Shares | ||
Sold | 6,118,023 | 7,302,222 |
Issued in reinvestment of distributions | 59,126 | 91,852 |
Redeemed | (8,054,099) | (7,970,510) |
Net increase (decrease) | (1,876,950) | (576,436) |
Financial Highlights
Years ended February 28, | 2014 | 2013 | 2012 H | 2011 | 2010 |
Selected Per-Share Data |
|
|
|
|
|
Net asset value, beginning of period | $ 24.31 | $ 24.50 | $ 29.60 | $ 20.79 | $ 10.72 |
Income from Investment Operations |
|
|
|
|
|
Net investment income (loss) B | .18 | .14 E, J | .03 | (.10) | (.07) F |
Net realized and unrealized gain (loss) | 6.95 | (.14) J | (5.10) | 8.91 | 10.20 |
Total from investment operations | 7.13 | - | (5.07) | 8.81 | 10.13 |
Distributions from net investment income | (.20) | (.17) | (.03) | - | (.06) |
Distributions from return of capital | - | (.02) | - | - | - |
Total distributions | (.20) | (.19) | (.03) | - | (.06) |
Redemption fees added to paid in capital B, I | - | - | - | - | - |
Net asset value, end of period | $ 31.24 | $ 24.31 | $ 24.50 | $ 29.60 | $ 20.79 |
Total Return A | 29.41% | .07% | (17.13)% | 42.38% | 94.47% |
Ratios to Average Net Assets C, G |
|
|
|
|
|
Expenses before reductions | .92% | .93% | .90% | .91% | .97% |
Expenses net of fee waivers, if any | .92% | .93% | .90% | .91% | .97% |
Expenses net of all reductions | .90% | .89% | .89% | .90% | .95% |
Net investment income (loss) | .69% | .61% E | .12% | (.43)% | (.41)% F |
Supplemental Data |
|
|
|
|
|
Net assets, end of period (000 omitted) | $ 347,345 | $ 316,012 | $ 332,598 | $ 586,795 | $ 336,910 |
Portfolio turnover rate D | 65% | 54% | 91% | 85% | 143% K |
A Total returns would have been lower if certain expenses had not been reduced during the applicable periods shown.
B Calculated based on average shares outstanding during the period.
C Fees and expenses of any underlying Fidelity Central Funds are not included in the Fund's expense ratio. The Fund indirectly bears its proportionate share of the expenses of any underlying Fidelity Central Funds.
D Amount does not include the portfolio activity of any underlying Fidelity Central Funds.
E Investment income per share reflects a large, non-recurring dividend which amounted to $.10 per share. Excluding this non-recurring dividend, the ratio of net investment income (loss) to average net assets would have been .18%.
F Investment income per share reflects a large, non-recurring dividend which amounted to $.04 per share. Excluding this non-recurring dividend, the ratio of net investment income (loss) to average net assets would have been (.63)%.
G Expense ratios reflect operating expenses of the Fund. Expenses before reductions do not reflect amounts reimbursed by the investment adviser or reductions from brokerage service arrangements or reductions from other expense offset arrangements and do not represent the amount paid by the Fund during periods when reimbursements or reductions occur. Expenses net of fee waivers reflect expenses after reimbursement by the investment adviser but prior to reductions from brokerage service arrangements or other expense offset arrangements. Expenses net of all reductions represent the net expenses paid by the Fund.
H For the year ended February 29.
I Amount represents less than $.01 per share.
J Net realized and unrealized gain (loss) per share reflects proceeds from litigation which amounted to $.06 per share. Excluding these litigation proceeds, the total return would have been (.19)%.
K The portfolio turnover rate does not include the assets in the merger.
See accompanying notes which are an integral part of the financial statements.
Annual Report
Computers Portfolio
Performance: The Bottom Line
Average annual total return reflects the change in the value of an investment, assuming reinvestment of the fund's distributions from dividend income and capital gains (the profits earned upon the sale of securities that have grown in value, if any) and assuming a constant rate of performance each year. The $10,000 table and the fund's returns do not reflect the deduction of taxes that a shareholder would pay on fund distributions or the redemption of fund shares. During periods of reimbursement by Fidelity, a fund's total return will be greater than it would be had the reimbursement not occurred. How a fund did yesterday is no guarantee of how it will do tomorrow.
Average Annual Total Returns
Periods ended February 28, 2014 | Past 1 | Past 5 | Past 10 |
Computers Portfolio | 27.13% | 28.52% | 8.16% |
$10,000 Over 10 Years
Let's say hypothetically that $10,000 was invested in Computers Portfolio on February 29, 2004. The chart shows how the value of your investment would have changed, and also shows how the S&P 500 Index performed over the same period.
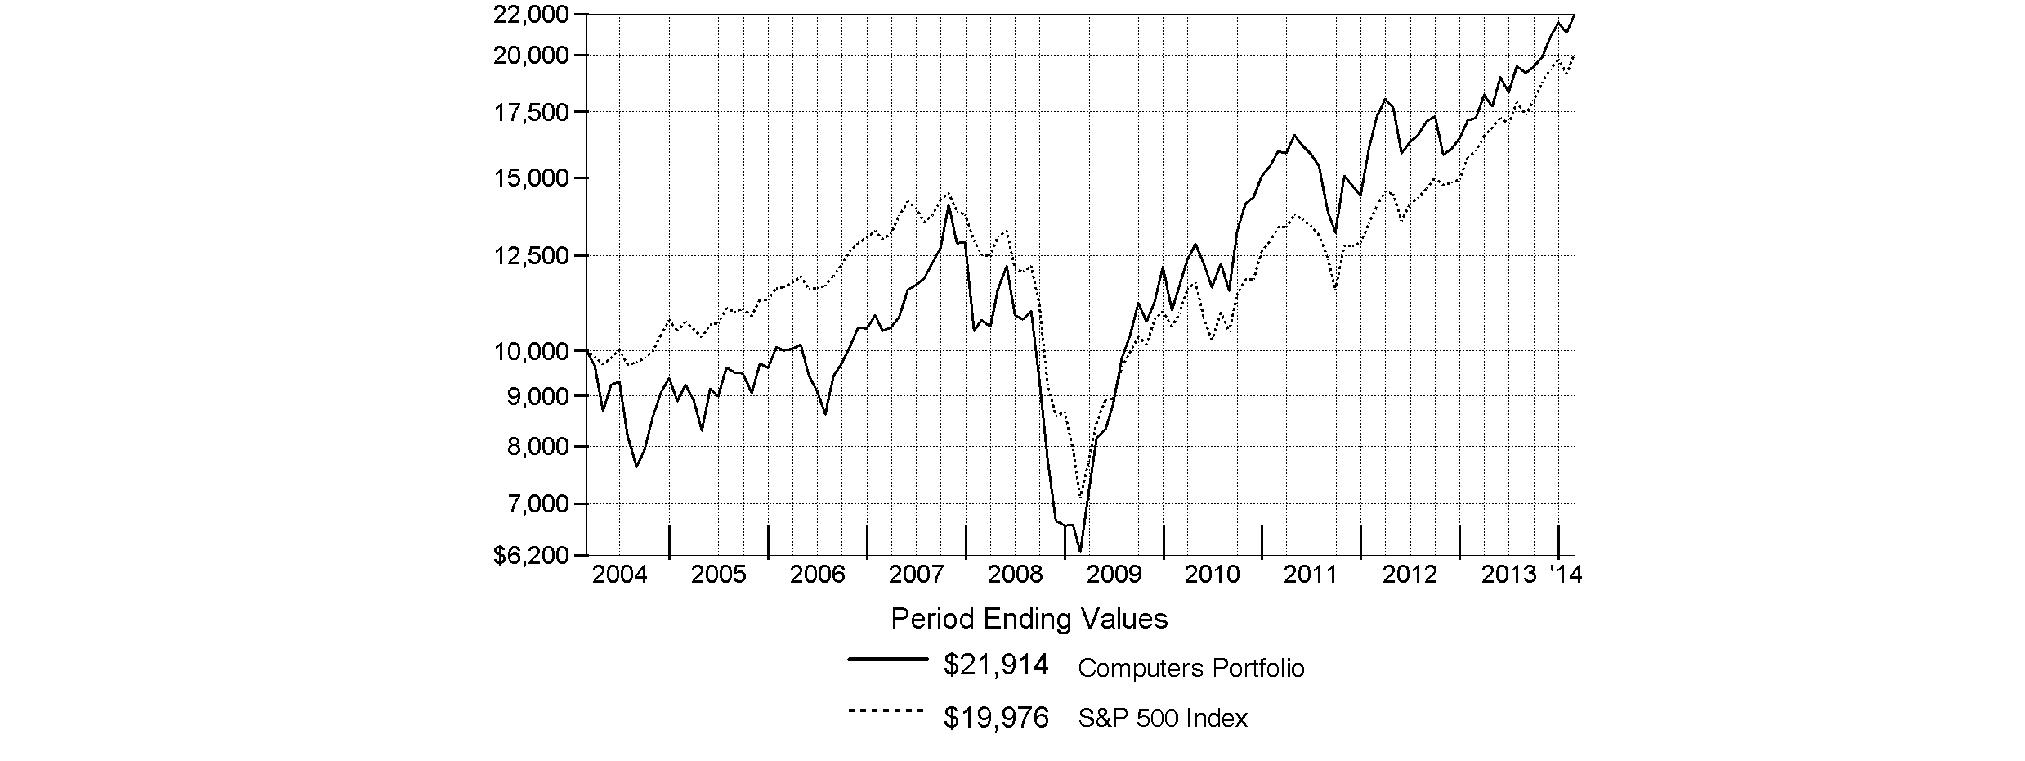
Annual Report
Computers Portfolio
Management's Discussion of Fund Performance
Market Recap: Stocks overcame fears of higher interest rates - not to mention their worst January in four years - to finish sharply higher for the 12 months ending February 28, 2014. The broad S&P 500® Index and the blue-chip Dow Jones Industrial AverageSM gained 25.37% and 19.01%, respectively, amid generally favorable earnings reports and accommodative monetary policies worldwide. Performance generally increased along the risk spectrum, with smaller-cap and growth strategies leading the way. An ebullient market helped the growth-oriented Nasdaq Composite Index® to a 38.10% period gain, for example. On the other hand, both cyclical and defensive stocks had representation in the top-performing industry sectors: returns were highest in health care and consumer discretionary; lowest in utilities and telecommunication services. From a macroeconomic perspective, data still points to slow but steady improvement in the U.S., and Europe's recession may well be over. Reports from China have disappointed, but continue to suggest a relatively soft landing there. Mixed signals from the U.S. Federal Reserve as to when it might curtail its stimulative bond buying kept markets in flux during the spring and summer. Stocks regained momentum in October despite a federal budget impasse and brief government shutdown, and lower volatility prevailed through year-end. Shedding new-year concerns about China's economy, an emerging-markets sell-off and confirmation (at last) of Fed tapering - alongside confirmation of a presumably dovish Janet Yellen as new Fed chair - February saw stocks back in record territory, bearing down on the five-year anniversary of the market's bottom.
Comments from Christopher Lin, Portfolio Manager of Computers Portfolio: For the year, the fund returned 27.13%, lagging the 29.30% return of the S&P® Custom Computers & Peripherals Index but topping the S&P 500®. Versus the broader market, computer-related stocks were lifted by strength in the technology hardware, storage & peripherals group, which makes up the vast majority of the S&P® industry index. This strength was somewhat offset by the negative result of IT consulting & other services. Versus the industry benchmark, three of our four biggest detractors were strongly performing benchmark components in which the fund had a sizable underweighting or no position at all for much of the period. The fund's largest relative detractor was 3D Systems, a supplier of three-dimensional printing equipment and materials. While I believe three-dimensional printing is a legitimate technology, the valuations in this group were stratospheric, in my opinion, leaving little room for disappointment. Still, underweighting this stock hurt in the short term. In the semiconductor group, comparatively light exposure to touch-controller maker Synaptics worked against the fund, as did selling its negligible position in Immersion, a provider of haptic, or touch-based, technologies for digital devices. Further detracting was a non-benchmark stake in Taiwan-based TPK Holding, a manufacturer of touch-panels that I sold in August. Conversely, the fund's relative performance was boosted by not owning weak-performing index component OCZ Technology Group, which makes flash-based digital storage products and was the fund's top relative contributor. In the case of Fusion-io, another provider of flash memory technology, the fund owned a significantly underweighted position, which aided our results in relative terms. Lastly, I'll mention smartphone and tablet maker Apple, by far the fund's largest position. A modest underweighting here early in the period was timely, as was an overweighting later in the period, when the stock's performance improved.
The views expressed above reflect those of the portfolio manager(s) only through the end of the period as stated on the cover of this report and do not necessarily represent the views of Fidelity or any other person in the Fidelity organization. Any such views are subject to change at any time based upon market or other conditions and Fidelity disclaims any responsibility to update such views. These views may not be relied on as investment advice and, because investment decisions for a Fidelity fund are based on numerous factors, may not be relied on as an indication of trading intent on behalf of any Fidelity fund.
Annual Report
Computers Portfolio
Investment Changes (Unaudited)
Top Ten Stocks as of February 28, 2014 | ||
| % of fund's | % of fund's net assets |
Apple, Inc. | 20.7 | 19.6 |
IBM Corp. | 10.9 | 12.1 |
EMC Corp. | 8.5 | 7.4 |
Hewlett-Packard Co. | 8.4 | 7.9 |
Western Digital Corp. | 4.7 | 4.0 |
Seagate Technology | 4.5 | 3.5 |
NetApp, Inc. | 4.4 | 4.9 |
SanDisk Corp. | 4.0 | 3.5 |
Electronics for Imaging, Inc. | 3.8 | 2.7 |
Google, Inc. Class A | 2.9 | 1.7 |
| 72.8 | |
Top Industries (% of fund's net assets) | |||
As of February 28, 2014 | |||
| Computers & Peripherals | 75.0% |
|
| IT Services | 15.0% |
|
| Internet Software & Services | 6.7% |
|
| Electronic Equipment & Components | 0.7% |
|
| Software | 0.5% |
|
| All Others* | 2.1% |
|

As of August 31, 2013 | |||
| Computers & Peripherals | 79.4% |
|
| IT Services | 15.7% |
|
| Internet Software & Services | 1.7% |
|
| Electronic Equipment & Components | 1.1% |
|
| Communications Equipment | 0.1% |
|
| All Others* | 2.0% |
|

* Includes short-term investments and net other assets (liabilities). |
Annual Report
Computers Portfolio
Investments February 28, 2014
Showing Percentage of Net Assets
Common Stocks - 98.4% | |||
Shares | Value | ||
COMMUNICATIONS EQUIPMENT - 0.4% | |||
Communications Equipment - 0.4% | |||
QUALCOMM, Inc. | 32,700 | $ 2,461,983 | |
COMPUTERS & PERIPHERALS - 75.0% | |||
Computer Hardware - 38.9% | |||
3D Systems Corp. (a)(d) | 7,700 | 584,892 | |
Apple, Inc. | 266,964 | 140,487,136 | |
Avid Technology, Inc. (a) | 723,100 | 4,772,460 | |
Cray, Inc. (a) | 308,600 | 10,705,334 | |
Diebold, Inc. | 392,500 | 14,675,575 | |
Hewlett-Packard Co. | 1,910,805 | 57,094,853 | |
NCR Corp. (a) | 481,400 | 16,391,670 | |
Silicon Graphics International Corp. (a)(d) | 359,100 | 4,420,521 | |
Super Micro Computer, Inc. (a) | 771,700 | 15,580,623 | |
| 264,713,064 | ||
Computer Storage & Peripherals - 36.1% | |||
Electronics for Imaging, Inc. (a) | 580,515 | 25,890,969 | |
EMC Corp. | 2,201,178 | 58,045,064 | |
Fusion-io, Inc. (a)(d) | 142,400 | 1,562,128 | |
Imation Corp. (a) | 975,000 | 6,240,000 | |
Intevac, Inc. (a) | 781,990 | 5,888,385 | |
Lexmark International, Inc. Class A (d) | 289,200 | 12,186,888 | |
NetApp, Inc. | 743,760 | 30,055,342 | |
Nimble Storage, Inc. | 1,000 | 48,010 | |
QLogic Corp. (a) | 954,600 | 10,901,532 | |
Quantum Corp. (a) | 4,504,600 | 5,270,382 | |
SanDisk Corp. | 361,400 | 26,852,020 | |
Seagate Technology | 587,000 | 30,635,530 | |
Western Digital Corp. | 362,784 | 31,558,580 | |
| 245,134,830 | ||
TOTAL COMPUTERS & PERIPHERALS | 509,847,894 | ||
ELECTRONIC EQUIPMENT & COMPONENTS - 0.7% | |||
Electronic Components - 0.7% | |||
Audience, Inc. (a) | 44,702 | 523,907 | |
InvenSense, Inc. (a)(d) | 217,100 | 4,374,565 | |
| 4,898,472 | ||
Electronic Manufacturing Services - 0.0% | |||
Jabil Circuit, Inc. | 11,700 | 216,567 | |
TOTAL ELECTRONIC EQUIPMENT & COMPONENTS | 5,115,039 | ||
INTERNET SOFTWARE & SERVICES - 6.7% | |||
Internet Software & Services - 6.7% | |||
Facebook, Inc. Class A (a) | 179,000 | 12,254,340 | |
| |||
Shares | Value | ||
Google, Inc. Class A (a) | 16,100 | $ 19,571,965 | |
Yahoo!, Inc. (a) | 360,500 | 13,940,535 | |
| 45,766,840 | ||
IT SERVICES - 15.0% | |||
IT Consulting & Other Services - 15.0% | |||
Datalink Corp. (a) | 673,000 | 9,832,530 | |
IBM Corp. | 398,648 | 73,817,650 | |
Teradata Corp. (a) | 391,957 | 17,998,665 | |
| 101,648,845 | ||
SEMICONDUCTORS & SEMICONDUCTOR EQUIPMENT - 0.1% | |||
Semiconductors - 0.1% | |||
Synaptics, Inc. (a) | 5,600 | 364,224 | |
SOFTWARE - 0.5% | |||
Application Software - 0.5% | |||
Nuance Communications, Inc. (a) | 225,700 | 3,450,953 | |
TOTAL COMMON STOCKS (Cost $513,723,573) |
| ||
Money Market Funds - 3.3% | |||
|
|
|
|
Fidelity Cash Central Fund, 0.10% (b) | 12,520,642 | 12,520,642 | |
Fidelity Securities Lending Cash Central Fund, 0.09% (b)(c) | 9,955,700 | 9,955,700 | |
TOTAL MONEY MARKET FUNDS (Cost $22,476,342) |
| ||
TOTAL INVESTMENT PORTFOLIO - 101.7% (Cost $536,199,915) | 691,132,120 | ||
NET OTHER ASSETS (LIABILITIES) - (1.7)% | (11,809,457) | ||
NET ASSETS - 100% | $ 679,322,663 | ||
Legend |
(a) Non-income producing |
(b) Affiliated fund that is generally available only to investment companies and other accounts managed by Fidelity Investments. The rate quoted is the annualized seven-day yield of the fund at period end. A complete unaudited listing of the fund's holdings as of its most recent quarter end is available upon request. In addition, each Fidelity Central Fund's financial statements, which are not covered by the Fund's Report of Independent Registered Public Accounting Firm, are available on the SEC's website or upon request. |
(c) Investment made with cash collateral received from securities on loan. |
(d) Security or a portion of the security is on loan at period end. |
Affiliated Central Funds |
Information regarding fiscal year to date income earned by the Fund from investments in Fidelity Central Funds is as follows: |
Fund | Income earned |
Fidelity Cash Central Fund | $ 9,819 |
Fidelity Securities Lending Cash Central Fund | 327,959 |
Total | $ 337,778 |
Other Affiliated Issuers |
An affiliated company is a company in which the Fund has ownership of at least 5% of the voting securities. Fiscal year to date transactions with companies which are or were affiliates are as follows: |
Affiliate | Value, beginning of period | Purchases | Sales Proceeds | Dividend Income | Value, |
Novatel Wireless, Inc. | $ 3,909,971 | $ 201,181 | $ 4,157,799 | $ - | $ - |
Other Information |
All investments are categorized as Level 1 under the Fair Value Hierarchy. The inputs or methodology used for valuing securities may not be an indication of the risk associated with investing in those securities. For more information on valuation inputs, please refer to the Investment Valuation section in the accompanying Notes to Financial Statements. |
See accompanying notes which are an integral part of the financial statements.
Annual Report
Computers Portfolio
Financial Statements
Statement of Assets and Liabilities
| February 28, 2014 | |
|
|
|
Assets | ||
Investment in securities, at value (including securities loaned of $9,446,563) - See accompanying schedule: Unaffiliated issuers (cost $513,723,573) | $ 668,655,778 |
|
Fidelity Central Funds (cost $22,476,342) | 22,476,342 |
|
Total Investments (cost $536,199,915) |
| $ 691,132,120 |
Cash |
| 18,610 |
Receivable for fund shares sold | 107,571 | |
Dividends receivable | 579,256 | |
Distributions receivable from Fidelity Central Funds | 19,244 | |
Prepaid expenses | 3,683 | |
Other receivables | 164,476 | |
Total assets | 692,024,960 | |
|
|
|
Liabilities | ||
Payable for investments purchased | $ 69,731 | |
Payable for fund shares redeemed | 2,196,765 | |
Accrued management fee | 309,262 | |
Other affiliated payables | 134,100 | |
Other payables and accrued expenses | 36,739 | |
Collateral on securities loaned, at value | 9,955,700 | |
Total liabilities | 12,702,297 | |
|
|
|
Net Assets | $ 679,322,663 | |
Net Assets consist of: |
| |
Paid in capital | $ 529,928,553 | |
Undistributed net investment income | 1,186,326 | |
Accumulated undistributed net realized gain (loss) on investments and foreign currency transactions | (6,642,517) | |
Net unrealized appreciation (depreciation) on investments and assets and liabilities in foreign currencies | 154,850,301 | |
Net Assets, for 9,002,304 shares outstanding | $ 679,322,663 | |
Net Asset Value, offering price and redemption price per share ($679,322,663 ÷ 9,002,304 shares) | $ 75.46 | |
Statement of Operations
| Year ended February 28, 2014 | |
|
|
|
Investment Income |
|
|
Dividends |
| $ 11,088,028 |
Interest |
| 1,755 |
Income from Fidelity Central Funds (including $327,959 from security lending) |
| 337,778 |
Total income |
| 11,427,561 |
|
|
|
Expenses | ||
Management fee | $ 3,766,880 | |
Transfer agent fees | 1,451,177 | |
Accounting and security lending fees | 248,766 | |
Custodian fees and expenses | 21,948 | |
Independent trustees' compensation | 12,977 | |
Registration fees | 28,332 | |
Audit | 42,407 | |
Legal | 13,229 | |
Interest | 4,347 | |
Miscellaneous | 9,442 | |
Total expenses before reductions | 5,599,505 | |
Expense reductions | (30,780) | 5,568,725 |
Net investment income (loss) | 5,858,836 | |
Realized and Unrealized Gain (Loss) Net realized gain (loss) on: | ||
Investment securities: |
|
|
Unaffiliated issuers | 31,556,404 | |
Other affiliated issuers | (222,576) |
|
Foreign currency transactions | (53,840) | |
Total net realized gain (loss) |
| 31,279,988 |
Change in net unrealized appreciation (depreciation) on: Investment securities | 122,770,477 | |
Assets and liabilities in foreign currencies | (19,159) | |
Total change in net unrealized appreciation (depreciation) |
| 122,751,318 |
Net gain (loss) | 154,031,306 | |
Net increase (decrease) in net assets resulting from operations | $ 159,890,142 | |
See accompanying notes which are an integral part of the financial statements.
Annual Report
Computers Portfolio
Financial Statements - continued
Statement of Changes in Net Assets
| Year ended | Year ended |
Increase (Decrease) in Net Assets |
|
|
Operations |
|
|
Net investment income (loss) | $ 5,858,836 | $ 2,193,502 |
Net realized gain (loss) | 31,279,988 | 71,793,949 |
Change in net unrealized appreciation (depreciation) | 122,751,318 | (84,879,582) |
Net increase (decrease) in net assets resulting from operations | 159,890,142 | (10,892,131) |
Distributions to shareholders from net investment income | (5,025,394) | (1,409,664) |
Distributions to shareholders from net realized gain | (50,138,396) | - |
Total distributions | (55,163,790) | (1,409,664) |
Share transactions | 187,959,145 | 291,353,775 |
Reinvestment of distributions | 53,769,152 | 1,367,084 |
Cost of shares redeemed | (354,252,067) | (352,076,506) |
Net increase (decrease) in net assets resulting from share transactions | (112,523,770) | (59,355,647) |
Redemption fees | 15,549 | 48,976 |
Total increase (decrease) in net assets | (7,781,869) | (71,608,466) |
|
|
|
Net Assets | ||
Beginning of period | 687,104,532 | 758,712,998 |
End of period (including undistributed net investment income of $1,186,326 and undistributed net investment income of $416,241, respectively) | $ 679,322,663 | $ 687,104,532 |
Other Information Shares | ||
Sold | 2,718,246 | 4,507,134 |
Issued in reinvestment of distributions | 860,063 | 22,287 |
Redeemed | (5,227,081) | (5,570,165) |
Net increase (decrease) | (1,648,772) | (1,040,744) |
Financial Highlights
Years ended February 28, | 2014 | 2013 | 2012 F | 2011 | 2010 |
Selected Per-Share Data |
|
|
|
|
|
Net asset value, beginning of period | $ 64.51 | $ 64.89 | $ 59.80 | $ 43.59 | $ 23.44 |
Income from Investment Operations |
|
|
|
|
|
Net investment income (loss) B | .59 | .18 | (.18) | (.25) | (.07) |
Net realized and unrealized gain (loss) | 15.76 | (.43) | 5.27 | 16.46 | 20.22 |
Total from investment operations | 16.35 | (.25) | 5.09 | 16.21 | 20.15 |
Distributions from net investment income | (.53) | (.13) | - | - | - |
Distributions from net realized gain | (4.87) | - | - | - | - |
Total distributions | (5.40) | (.13) | - | - | - |
Redemption fees added to paid in capital B, G | - | - | - | - | - |
Net asset value, end of period | $ 75.46 | $ 64.51 | $ 64.89 | $ 59.80 | $ 43.59 |
Total Return A | 27.13% | (.38)% | 8.51% | 37.19% | 85.96% |
Ratios to Average Net Assets C, E |
|
|
|
|
|
Expenses before reductions | .82% | .85% | .86% | .89% | .95% |
Expenses net of fee waivers, if any | .82% | .85% | .86% | .89% | .95% |
Expenses net of all reductions | .82% | .82% | .85% | .88% | .92% |
Net investment income (loss) | .86% | .29% | (.32)% | (.50)% | (.18)% |
Supplemental Data |
|
|
|
|
|
Net assets, end of period (000 omitted) | $ 679,323 | $ 687,105 | $ 758,713 | $ 609,487 | $ 502,708 |
Portfolio turnover rate D | 35% | 184% | 193% | 141% | 269% |
A Total returns would have been lower if certain expenses had not been reduced during the applicable periods shown.
B Calculated based on average shares outstanding during the period.
C Fees and expenses of any underlying Fidelity Central Funds are not included in the Fund's expense ratio. The Fund indirectly bears its proportionate share of the expenses of any underlying Fidelity Central Funds.
D Amount does not include the portfolio activity of any underlying Fidelity Central Funds.
E Expense ratios reflect operating expenses of the Fund. Expenses before reductions do not reflect amounts reimbursed by the investment adviser or reductions from brokerage service arrangements or reductions from other expense offset arrangements and do not represent the amount paid by the Fund during periods when reimbursements or reductions occur. Expenses net of fee waivers reflect expenses after reimbursement by the investment adviser but prior to reductions from brokerage service arrangements or other expense offset arrangements. Expenses net of all reductions represent the net expenses paid by the Fund.
F For the year ended February 29.
G Amount represents less than $.01 per share.
See accompanying notes which are an integral part of the financial statements.
Annual Report
Electronics Portfolio
Performance: The Bottom Line
Average annual total return reflects the change in the value of an investment, assuming reinvestment of the fund's distributions from dividend income and capital gains (the profits earned upon the sale of securities that have grown in value, if any) and assuming a constant rate of performance each year. The $10,000 table and the fund's returns do not reflect the deduction of taxes that a shareholder would pay on fund distributions or the redemption of fund shares. During periods of reimbursement by Fidelity, a fund's total return will be greater than it would be had the reimbursement not occurred. How a fund did yesterday is no guarantee of how it will do tomorrow.
Average Annual Total Returns
Periods ended February 28, 2014 | Past 1 | Past 5 | Past 10 |
Electronics Portfolio | 38.01% | 27.03% | 4.98% |
$10,000 Over 10 Years
Let's say hypothetically that $10,000 was invested in Electronics Portfolio on February 29, 2004. The chart shows how the value of your investment would have changed, and also shows how the S&P 500 Index performed over the same period.
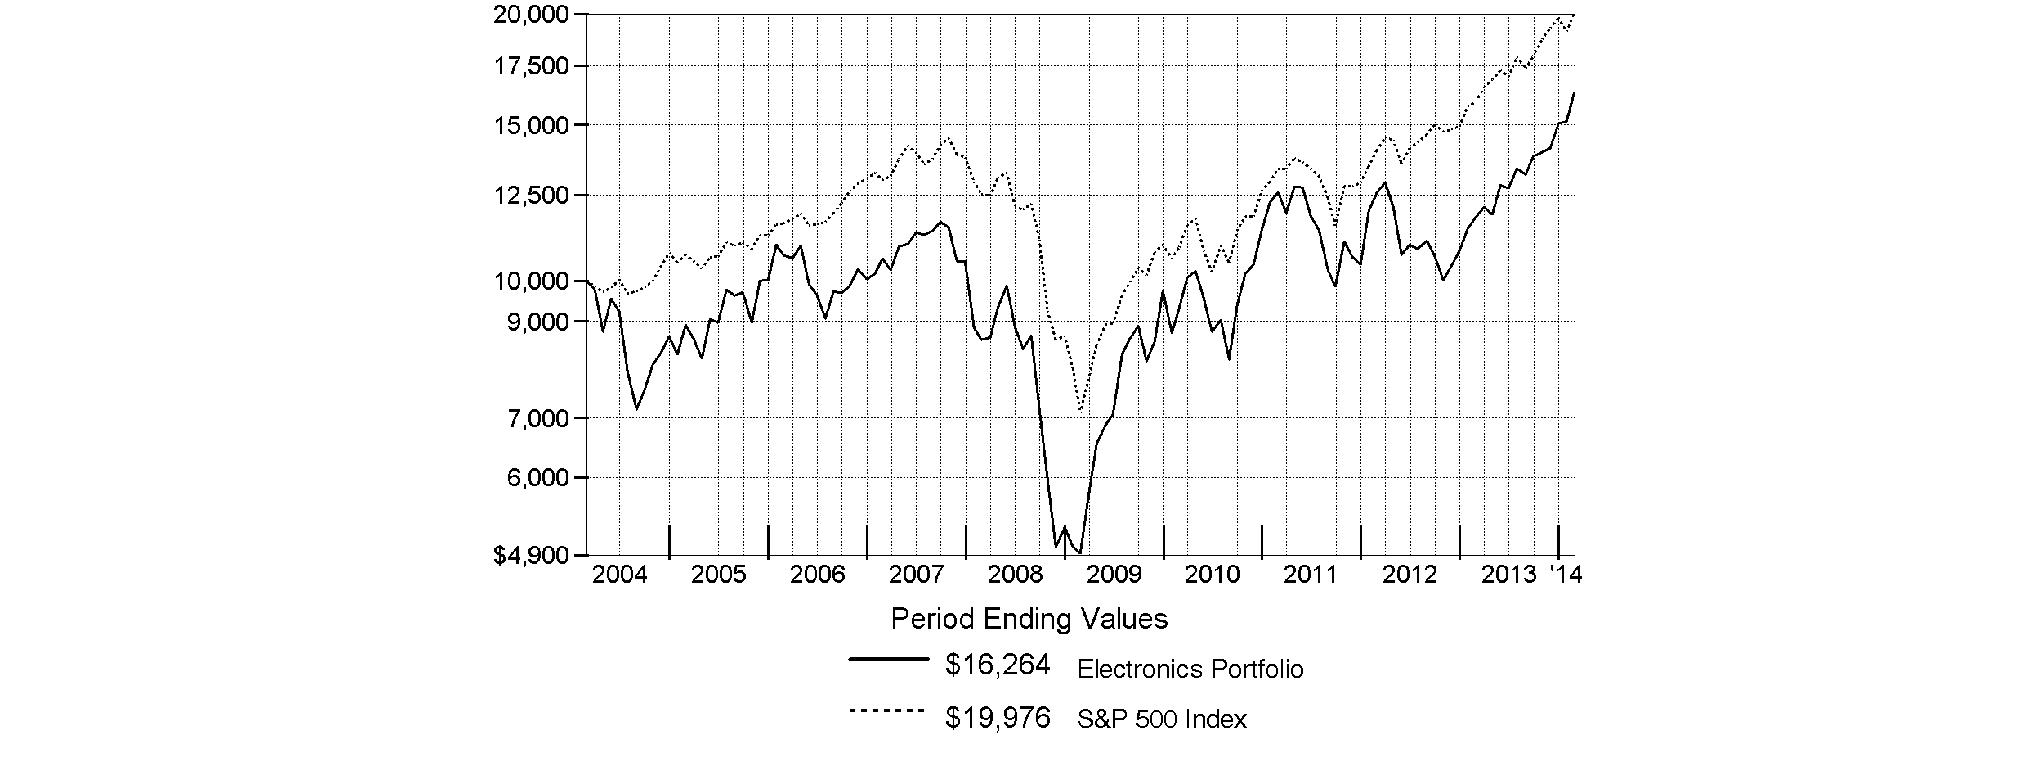
Annual Report
Electronics Portfolio
Management's Discussion of Fund Performance
Market Recap: Stocks overcame fears of higher interest rates - not to mention their worst January in four years - to finish sharply higher for the 12 months ending February 28, 2014. The broad S&P 500® Index and the blue-chip Dow Jones Industrial AverageSM gained 25.37% and 19.01%, respectively, amid generally favorable earnings reports and accommodative monetary policies worldwide. Performance generally increased along the risk spectrum, with smaller-cap and growth strategies leading the way. An ebullient market helped the growth-oriented Nasdaq Composite Index® to a 38.10% period gain, for example. On the other hand, both cyclical and defensive stocks had representation in the top-performing industry sectors: returns were highest in health care and consumer discretionary; lowest in utilities and telecommunication services. From a macroeconomic perspective, data still points to slow but steady improvement in the U.S., and Europe's recession may well be over. Reports from China have disappointed, but continue to suggest a relatively soft landing there. Mixed signals from the U.S. Federal Reserve as to when it might curtail its stimulative bond buying kept markets in flux during the spring and summer. Stocks regained momentum in October despite a federal budget impasse and brief government shutdown, and lower volatility prevailed through year-end. Shedding new-year concerns about China's economy, an emerging-markets sell-off and confirmation (at last) of Fed tapering - alongside confirmation of a presumably dovish Janet Yellen as new Fed chair - February saw stocks back in record territory, bearing down on the five-year anniversary of the market's bottom.
Comments from Stephen Barwikowski, Portfolio Manager of Electronics Portfolio: For the year, the fund returned 38.01%, well ahead of the 33.65% gain of its industry benchmark, the MSCI® U.S. IMI Semiconductors & Semiconductor Equipment 25-50 Index, and also topping the S&P 500®. Versus the broader market, chip stocks, which make up a vast majority of the MSCI index, did particularly well from mid-November through period end, supported by a combination of modest supply growth, optimism that macroeconomic conditions were set to improve and support growing demand, and low relative valuations. Compared with the MSCI index, stock selection was the major driver of the fund's outperformance. The top relative contributor was a sizable underweighting in the lagging shares of personal computer chip manufacturer Intel, by far the largest component of the MSCI index. A non-index position in Netherlands-based NXP Semiconductors also aided performance, as did an overweighting in LSI, a maker of high-performance storage and networking semiconductors. Based on LSI's favorable fundamentals, I increased the fund's stake here in advance of the mid-December offer by Avago Technologies to purchase the company at roughly a 41% premium to the stock's price at the time. Although the deal hadn't closed by period end, I liquidated this position to lock in profits. Conversely, the fund's biggest relative detractor - as well as its largest holding, on average, during the period - was Broadcom. The high end of the smartphone market appeared to be getting saturated, and this was reflected in slower earnings and revenue growth at companies that make components for these phones, including Broadcom. Also hampering the fund's relative results was Altera, a maker of high-density programmable logic devices (PLDs). The fund's cash position, averaging roughly 4% during the period, further detracted in a strongly rising market.
The views expressed above reflect those of the portfolio manager(s) only through the end of the period as stated on the cover of this report and do not necessarily represent the views of Fidelity or any other person in the Fidelity organization. Any such views are subject to change at any time based upon market or other conditions and Fidelity disclaims any responsibility to update such views. These views may not be relied on as investment advice and, because investment decisions for a Fidelity fund are based on numerous factors, may not be relied on as an indication of trading intent on behalf of any Fidelity fund.
Annual Report
Electronics Portfolio
Investment Changes (Unaudited)
Top Ten Stocks as of February 28, 2014 | ||
| % of fund's | % of fund's net assets |
Intel Corp. | 9.9 | 13.0 |
Broadcom Corp. Class A | 8.5 | 8.8 |
Analog Devices, Inc. | 6.3 | 2.6 |
Altera Corp. | 5.4 | 4.6 |
Maxim Integrated Products, Inc. | 3.6 | 4.2 |
NXP Semiconductors NV | 3.3 | 0.7 |
Xilinx, Inc. | 3.3 | 3.3 |
Intersil Corp. Class A | 3.0 | 4.2 |
Freescale Semiconductor, Inc. | 2.6 | 1.0 |
Lam Research Corp. | 2.5 | 0.1 |
| 48.4 | |
Top Industries (% of fund's net assets) | |||
As of February 28, 2014 | |||
| Semiconductors & Semiconductor Equipment | 82.2% |
|
| Electronic Equipment & Components | 7.2% |
|
| Computers & Peripherals | 2.8% |
|
| Communications Equipment | 2.4% |
|
| Software | 1.0% |
|
| All Others* | 4.4% |
|

As of August 31, 2013 | |||
| Semiconductors & Semiconductor Equipment | 72.7% |
|
| Electronic Equipment & Components | 8.8% |
|
| Communications Equipment | 7.9% |
|
| Computers & Peripherals | 3.4% |
|
| Internet Software & Services | 1.1% |
|
| All Others* | 6.1% |
|

* Includes short-term investments and net other assets (liabilities). |
Annual Report
Electronics Portfolio
Investments February 28, 2014
Showing Percentage of Net Assets
Common Stocks - 96.5% | |||
Shares | Value | ||
BIOTECHNOLOGY - 0.0% | |||
Biotechnology - 0.0% | |||
Arrowhead Research Corp. warrants 5/21/17 (a) | 285,468 | $ 3 | |
COMMERCIAL SERVICES & SUPPLIES - 0.4% | |||
Office Services & Supplies - 0.4% | |||
West Corp. | 213,433 | 5,361,437 | |
COMMUNICATIONS EQUIPMENT - 2.4% | |||
Communications Equipment - 2.4% | |||
Cisco Systems, Inc. | 595,264 | 12,976,755 | |
CommScope Holding Co., Inc. | 15 | 363 | |
NETGEAR, Inc. (a) | 102,593 | 3,506,629 | |
QUALCOMM, Inc. | 174,932 | 13,170,630 | |
| 29,654,377 | ||
COMPUTERS & PERIPHERALS - 2.8% | |||
Computer Hardware - 0.9% | |||
Apple, Inc. | 22,648 | 11,918,284 | |
Computer Storage & Peripherals - 1.9% | |||
EMC Corp. | 891,938 | 23,520,405 | |
TOTAL COMPUTERS & PERIPHERALS | 35,438,689 | ||
ELECTRONIC EQUIPMENT & COMPONENTS - 7.2% | |||
Electronic Components - 1.9% | |||
Aeroflex Holding Corp. (a) | 2,182,916 | 17,441,499 | |
Audience, Inc. (a) | 74,900 | 877,828 | |
Corning, Inc. | 21,700 | 418,159 | |
InvenSense, Inc. (a)(d) | 265,993 | 5,359,759 | |
| 24,097,245 | ||
Electronic Manufacturing Services - 5.3% | |||
Flextronics International Ltd. (a) | 2,450,340 | 21,930,543 | |
Jabil Circuit, Inc. | 1,101,236 | 20,383,878 | |
Multi-Fineline Electronix, Inc. (a) | 118,935 | 1,732,883 | |
Plexus Corp. (a) | 18 | 741 | |
TTM Technologies, Inc. (a) | 2,693,606 | 22,626,290 | |
| 66,674,335 | ||
TOTAL ELECTRONIC EQUIPMENT & COMPONENTS | 90,771,580 | ||
INTERNET SOFTWARE & SERVICES - 0.5% | |||
Internet Software & Services - 0.5% | |||
Demand Media, Inc. (a) | 646,450 | 3,135,283 | |
Google, Inc. Class A (a) | 1,400 | 1,701,910 | |
Rackspace Hosting, Inc. (a) | 37,100 | 1,364,167 | |
| 6,201,360 | ||
SEMICONDUCTORS & SEMICONDUCTOR EQUIPMENT - 82.2% | |||
Semiconductor Equipment - 5.2% | |||
Amkor Technology, Inc. (a)(d) | 1,128,986 | 6,683,597 | |
GT Advanced Technologies, Inc. (a)(d) | 401,510 | 5,753,638 | |
Lam Research Corp. (a) | 608,273 | 31,465,962 | |
| |||
Shares | Value | ||
Teradyne, Inc. (a)(d) | 660,475 | $ 13,394,433 | |
Tessera Technologies, Inc. | 372,559 | 8,091,981 | |
| 65,389,611 | ||
Semiconductors - 77.0% | |||
Advanced Micro Devices, Inc. (a)(d) | 3,084,061 | 11,441,866 | |
Altera Corp. | 1,881,518 | 68,317,919 | |
Analog Devices, Inc. | 1,551,193 | 78,831,628 | |
Applied Micro Circuits Corp. (a) | 162,347 | 1,860,497 | |
ARM Holdings PLC sponsored ADR | 17 | 853 | |
Avago Technologies Ltd. | 379,400 | 23,408,980 | |
Broadcom Corp. Class A | 3,588,559 | 106,651,973 | |
Cavium, Inc. (a) | 300,015 | 12,639,632 | |
Cypress Semiconductor Corp. | 2,611,102 | 25,562,689 | |
Entropic Communications, Inc. (a) | 650,752 | 2,850,294 | |
EZchip Semiconductor Ltd. (a) | 236,710 | 6,175,764 | |
Fairchild Semiconductor International, Inc. (a) | 1,023,978 | 14,417,610 | |
Freescale Semiconductor, Inc. (a)(d) | 1,437,779 | 32,709,472 | |
Hittite Microwave Corp. | 155,648 | 9,180,119 | |
Inphi Corp. (a) | 450,941 | 5,929,874 | |
Intel Corp. | 5,033,778 | 124,636,343 | |
Intermolecular, Inc. (a) | 541,790 | 1,435,744 | |
Intersil Corp. Class A | 2,953,567 | 37,569,372 | |
MagnaChip Semiconductor Corp. (a) | 621,597 | 9,162,340 | |
Marvell Technology Group Ltd. | 2,047,446 | 31,305,449 | |
Maxim Integrated Products, Inc. | 1,384,875 | 45,299,261 | |
Micron Technology, Inc. (a) | 1,080,140 | 26,128,587 | |
Montage Tech Group Ltd. | 83,500 | 1,313,455 | |
Motech Industries, Inc. (a) | 1 | 2 | |
NVIDIA Corp. (d) | 1,288,606 | 23,684,578 | |
NXP Semiconductors NV (a) | 736,051 | 41,388,148 | |
O2Micro International Ltd. sponsored ADR (a) | 592,178 | 2,220,668 | |
Omnivision Technologies, Inc. (a) | 234,728 | 4,053,753 | |
ON Semiconductor Corp. (a) | 2,625,319 | 24,520,479 | |
Peregrine Semiconductor Corp. (a)(d) | 325,038 | 2,171,254 | |
Pericom Semiconductor Corp. (a) | 75,728 | 612,640 | |
PMC-Sierra, Inc. (a) | 3,170,074 | 23,268,343 | |
RF Micro Devices, Inc. (a) | 1,838,202 | 13,014,470 | |
Samsung Electronics Co. Ltd. | 24,747 | 31,303,297 | |
Semtech Corp. (a) | 1,125,289 | 28,075,961 | |
Skyworks Solutions, Inc. (a) | 574,179 | 20,360,387 | |
Spansion, Inc. Class A (a) | 144,588 | 2,358,230 | |
Texas Instruments, Inc. | 605,460 | 27,221,482 | |
Wolfson Microelectronics PLC (a) | 1,645,729 | 3,472,378 | |
Xilinx, Inc. | 780,750 | 40,755,150 | |
| 965,310,941 | ||
TOTAL SEMICONDUCTORS & SEMICONDUCTOR EQUIPMENT | 1,030,700,552 | ||
Common Stocks - continued | |||
Shares | Value | ||
SOFTWARE - 1.0% | |||
Application Software - 0.9% | |||
Citrix Systems, Inc. (a) | 92,740 | $ 5,569,037 | |
Nuance Communications, Inc. (a) | 314,937 | 4,815,387 | |
| 10,384,424 | ||
Systems Software - 0.1% | |||
Check Point Software Technologies Ltd. (a) | 400 | 26,968 | |
Infoblox, Inc. (a) | 66,900 | 1,544,052 | |
| 1,571,020 | ||
TOTAL SOFTWARE | 11,955,444 | ||
TOTAL COMMON STOCKS (Cost $1,196,195,670) |
| ||
Money Market Funds - 9.6% | |||
|
|
|
|
Fidelity Cash Central Fund, 0.10% (b) | 88,555,655 | 88,555,655 | |
Fidelity Securities Lending Cash Central Fund, 0.09% (b)(c) | 31,637,723 | 31,637,723 | |
TOTAL MONEY MARKET FUNDS (Cost $120,193,378) |
| ||
TOTAL INVESTMENT PORTFOLIO - 106.1% (Cost $1,316,389,048) | 1,330,276,820 | ||
NET OTHER ASSETS (LIABILITIES) - (6.1)% | (76,423,675) | ||
NET ASSETS - 100% | $ 1,253,853,145 | ||
Legend |
(a) Non-income producing |
(b) Affiliated fund that is generally available only to investment companies and other accounts managed by Fidelity Investments. The rate quoted is the annualized seven-day yield of the fund at period end. A complete unaudited listing of the fund's holdings as of its most recent quarter end is available upon request. In addition, each Fidelity Central Fund's financial statements, which are not covered by the Fund's Report of Independent Registered Public Accounting Firm, are available on the SEC's website or upon request. |
(c) Investment made with cash collateral received from securities on loan. |
(d) Security or a portion of the security is on loan at period end. |
Affiliated Central Funds |
Information regarding fiscal year to date income earned by the Fund from investments in Fidelity Central Funds is as follows: |
Fund | Income earned |
Fidelity Cash Central Fund | $ 43,240 |
Fidelity Securities Lending Cash Central Fund | 402,429 |
Total | $ 445,669 |
Other Information |
The following is a summary of the inputs used, as of February 28, 2014, involving the Fund's assets and liabilities carried at fair value. The inputs or methodology used for valuing securities may not be an indication of the risk associated with investing in those securities. For more information on valuation inputs, and their aggregation into the levels used in the table below, please refer to the Investment Valuation section in the accompanying Notes to Financial Statements. |
Valuation Inputs at Reporting Date: | ||||
Description | Total | Level 1 | Level 2 | Level 3 |
Investments in Securities: | ||||
Common Stocks | $ 1,210,083,442 | $ 1,210,083,439 | $ 3 | $ - |
Money Market Funds | 120,193,378 | 120,193,378 | - | - |
Total Investments in Securities: | $ 1,330,276,820 | $ 1,330,276,817 | $ 3 | $ - |
Distribution of investments by country or territory of incorporation, as a percentage of total net assets, is as follows (Unaudited): |
United States of America | 84.3% |
Bermuda | 5.1% |
Singapore | 3.7% |
Netherlands | 3.3% |
Korea (South) | 2.5% |
Others (Individually Less Than 1%) | 1.1% |
| 100.0% |
See accompanying notes which are an integral part of the financial statements.
Annual Report
Electronics Portfolio
Financial Statements
Statement of Assets and Liabilities
| February 28, 2014 | |
|
|
|
Assets | ||
Investment in securities, at value (including securities loaned of $30,137,569) - See accompanying schedule: Unaffiliated issuers (cost $1,196,195,670) | $ 1,210,083,442 |
|
Fidelity Central Funds (cost $120,193,378) | 120,193,378 |
|
Total Investments (cost $1,316,389,048) |
| $ 1,330,276,820 |
Cash |
| 16,436 |
Receivable for fund shares sold | 3,609,472 | |
Dividends receivable | 3,035,546 | |
Distributions receivable from Fidelity Central Funds | 24,552 | |
Prepaid expenses | 4,932 | |
Other receivables | 136,532 | |
Total assets | 1,337,104,290 | |
|
|
|
Liabilities | ||
Payable for investments purchased | $ 48,580,762 | |
Payable for fund shares redeemed | 2,209,640 | |
Accrued management fee | 527,063 | |
Other affiliated payables | 198,392 | |
Other payables and accrued expenses | 97,565 | |
Collateral on securities loaned, at value | 31,637,723 | |
Total liabilities | 83,251,145 | |
|
|
|
Net Assets | $ 1,253,853,145 | |
Net Assets consist of: |
| |
Paid in capital | $ 1,365,463,458 | |
Undistributed net investment income | 1,092,221 | |
Accumulated undistributed net realized gain (loss) on investments and foreign currency transactions | (126,587,255) | |
Net unrealized appreciation (depreciation) on investments and assets and liabilities in foreign currencies | 13,884,721 | |
Net Assets, for 18,351,711 shares outstanding | $ 1,253,853,145 | |
Net Asset Value, offering price and redemption price per share ($1,253,853,145 ÷ 18,351,711 shares) | $ 68.32 | |
Statement of Operations
| Year ended February 28, 2014 | |
|
|
|
Investment Income |
|
|
Dividends |
| $ 13,067,576 |
Interest |
| 240,323 |
Income from Fidelity Central Funds (including $402,429 from security lending) |
| 445,669 |
Total income |
| 13,753,568 |
|
|
|
Expenses | ||
Management fee | $ 5,341,342 | |
Transfer agent fees | 2,030,692 | |
Accounting and security lending fees | 330,071 | |
Custodian fees and expenses | 109,771 | |
Independent trustees' compensation | 18,425 | |
Appreciation in deferred trustee compensation account | 104 | |
Registration fees | 37,380 | |
Audit | 42,430 | |
Legal | 19,521 | |
Interest | 49 | |
Miscellaneous | 11,669 | |
Total expenses before reductions | 7,941,454 | |
Expense reductions | (289,972) | 7,651,482 |
Net investment income (loss) | 6,102,086 | |
Realized and Unrealized Gain (Loss) Net realized gain (loss) on: | ||
Investment securities: |
|
|
Unaffiliated issuers | 153,065,222 | |
Foreign currency transactions | (29,589) | |
Total net realized gain (loss) |
| 153,035,633 |
Change in net unrealized appreciation (depreciation) on: Investment securities | 158,588,564 | |
Assets and liabilities in foreign currencies | (2,901) | |
Total change in net unrealized appreciation (depreciation) |
| 158,585,663 |
Net gain (loss) | 311,621,296 | |
Net increase (decrease) in net assets resulting from operations | $ 317,723,382 | |
See accompanying notes which are an integral part of the financial statements.
Annual Report
Electronics Portfolio
Financial Statements - continued
Statement of Changes in Net Assets
| Year ended | Year ended |
Increase (Decrease) in Net Assets |
|
|
Operations |
|
|
Net investment income (loss) | $ 6,102,086 | $ 3,458,443 |
Net realized gain (loss) | 153,035,633 | (20,311,745) |
Change in net unrealized appreciation (depreciation) | 158,585,663 | (73,077,132) |
Net increase (decrease) in net assets resulting from operations | 317,723,382 | (89,930,434) |
Distributions to shareholders from net investment income | (4,987,449) | (2,800,318) |
Distributions to shareholders from net realized gain | (991,882) | - |
Total distributions | (5,979,331) | (2,800,318) |
Share transactions | 350,642,903 | 181,948,250 |
Reinvestment of distributions | 5,638,941 | 2,646,881 |
Cost of shares redeemed | (367,995,543) | (429,835,446) |
Net increase (decrease) in net assets resulting from share transactions | (11,713,699) | (245,240,315) |
Redemption fees | 38,716 | 14,064 |
Total increase (decrease) in net assets | 300,069,068 | (337,957,003) |
|
|
|
Net Assets | ||
Beginning of period | 953,784,077 | 1,291,741,080 |
End of period (including undistributed net investment income of $1,092,221 and distributions in excess of net investment income of $900, respectively) | $ 1,253,853,145 | $ 953,784,077 |
Other Information Shares | ||
Sold | 5,733,283 | 3,819,489 |
Issued in reinvestment of distributions | 93,318 | 59,545 |
Redeemed | (6,619,835) | (8,974,424) |
Net increase (decrease) | (793,234) | (5,095,390) |
Financial Highlights
Years ended February 28, | 2014 | 2013 | 2012 F | 2011 | 2010 |
Selected Per-Share Data |
|
|
|
|
|
Net asset value, beginning of period | $ 49.82 | $ 53.29 | $ 53.36 | $ 39.66 | $ 21.13 |
Income from Investment Operations |
|
|
|
|
|
Net investment income (loss) B | .36 | .17 | .01 | .06 | .31 |
Net realized and unrealized gain (loss) | 18.53 | (3.49) | (.02) | 13.75 | 18.57 |
Total from investment operations | 18.89 | (3.32) | (.01) | 13.81 | 18.88 |
Distributions from net investment income | (.32) | (.15) | (.06) | (.11) | (.34) |
Distributions from net realized gain | (.06) | - | - | - | (.01) |
Total distributions | (.39) H | (.15) | (.06) | (.11) | (.35) |
Redemption fees added to paid in capital B, G | - | - | - | - | - |
Net asset value, end of period | $ 68.32 | $ 49.82 | $ 53.29 | $ 53.36 | $ 39.66 |
Total Return A | 38.01% | (6.20)% | (.01)% | 34.87% | 89.51% |
Ratios to Average Net Assets C, E |
|
|
|
|
|
Expenses before reductions | .82% | .84% | .84% | .86% | .92% |
Expenses net of fee waivers, if any | .82% | .84% | .84% | .86% | .92% |
Expenses net of all reductions | .79% | .82% | .83% | .86% | .91% |
Net investment income (loss) | .63% | .36% | .03% | .13% | .92% |
Supplemental Data |
|
|
|
|
|
Net assets, end of period (000 omitted) | $ 1,253,853 | $ 953,784 | $ 1,291,741 | $ 1,387,264 | $ 1,104,541 |
Portfolio turnover rate D | 186% | 118% | 137% | 101% | 71% |
A Total returns would have been lower if certain expenses had not been reduced during the applicable periods shown.
B Calculated based on average shares outstanding during the period.
C Fees and expenses of any underlying Fidelity Central Funds are not included in the Fund's expense ratio. The Fund indirectly bears its proportionate share of the expenses of any underlying Fidelity Central Funds.
D Amount does not include the portfolio activity of any underlying Fidelity Central Funds.
E Expense ratios reflect operating expenses of the Fund. Expenses before reductions do not reflect amounts reimbursed by the investment adviser or reductions from brokerage service arrangements or reductions from other expense offset arrangements and do not represent the amount paid by the Fund during periods when reimbursements or reductions occur. Expenses net of fee waivers reflect expenses after reimbursement by the investment adviser but prior to reductions from brokerage service arrangements or other expense offset arrangements. Expenses net of all reductions represent the net expenses paid by the Fund.
F For the year ended February 29.
G Amount represents less than $.01 per share.
H Total distributions of $.39 per share is comprised of distributions from net investment income of $.322 and distributions from net realized gain of $.064 per share.
See accompanying notes which are an integral part of the financial statements.
Annual Report
IT Services Portfolio
Performance: The Bottom Line
Average annual total return reflects the change in the value of an investment, assuming reinvestment of the fund's distributions from dividend income and capital gains (the profits earned upon the sale of securities that have grown in value, if any) and assuming a constant rate of performance each year. The $10,000 table and the fund's returns do not reflect the deduction of taxes that a shareholder would pay on fund distributions or the redemption of fund shares. During periods of reimbursement by Fidelity, a fund's total return will be greater than it would be had the reimbursement not occurred. How a fund did yesterday is no guarantee of how it will do tomorrow.
Average Annual Total Returns
Periods ended February 28, 2014 | Past 1 | Past 5 | Past 10 |
IT Services Portfolio A | 41.66% | 30.42% | 14.22% |
A Prior to October 1, 2006, IT Services Portfolio was named Business Service and Outsourcing Portfolio, and the fund operated under certain different investment policies and compared its performance to a different additional index. The fund's historical performance may not represent its current investment policies.
$10,000 Over 10 Years
Let's say hypothetically that $10,000 was invested in IT Services Portfolio on February 29, 2004. The chart shows how the value of your investment would have changed, and also shows how the S&P 500 Index performed over the same period.
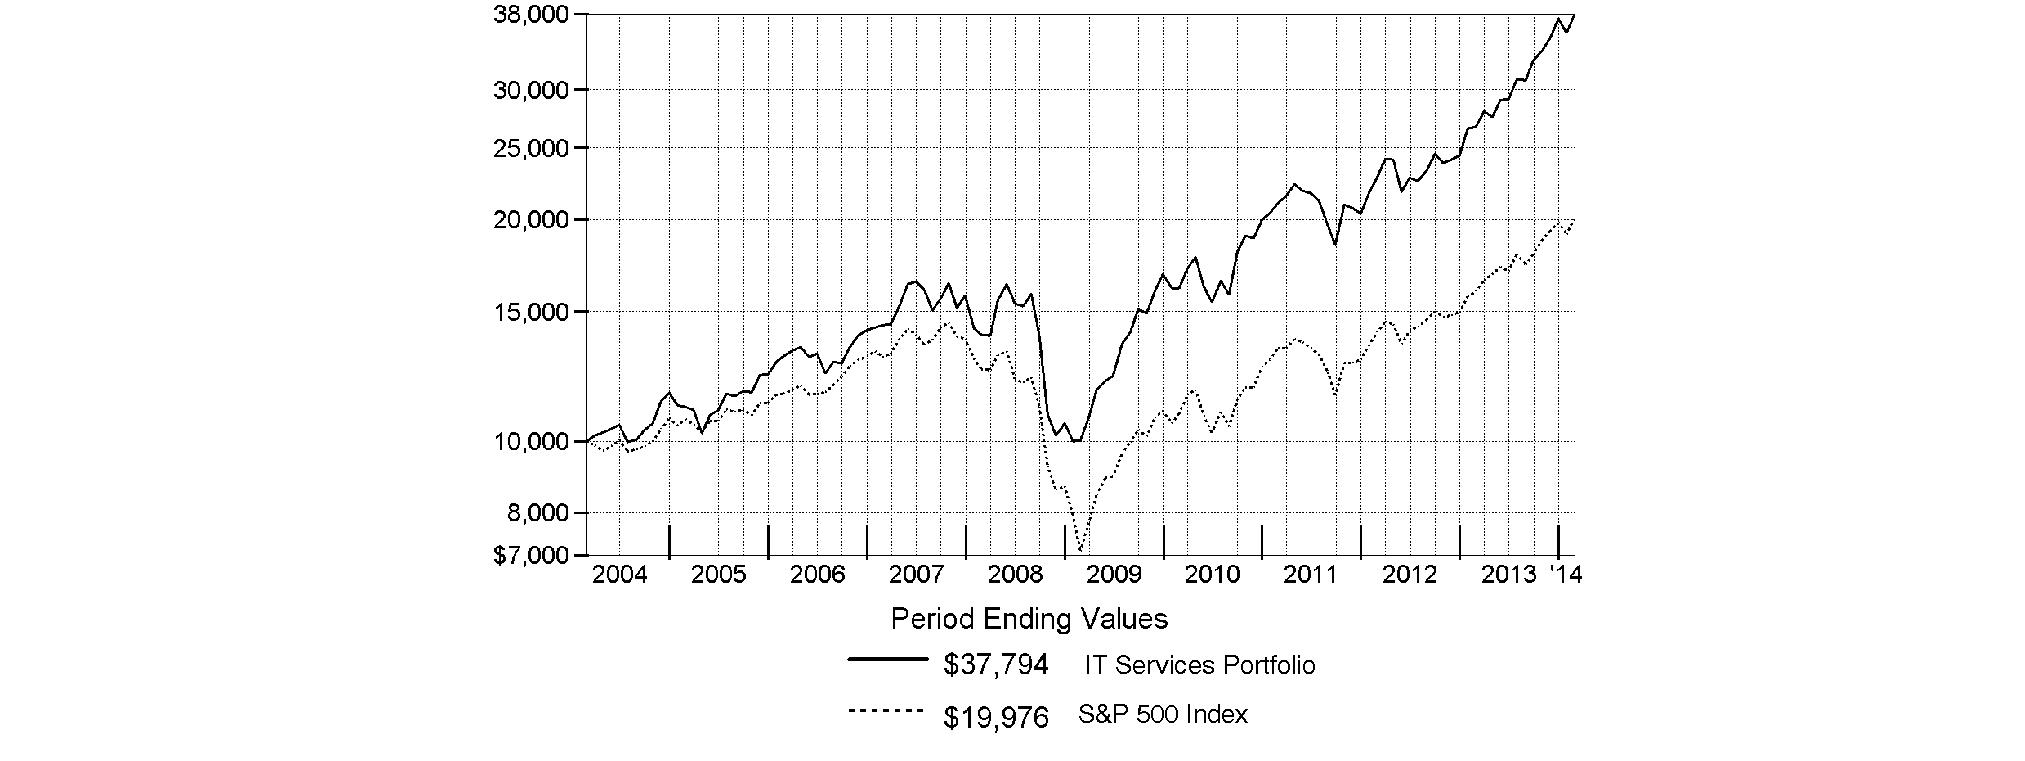
Annual Report
IT Services Portfolio
Management's Discussion of Fund Performance
Market Recap: Stocks overcame fears of higher interest rates - not to mention their worst January in four years - to finish sharply higher for the 12 months ending February 28, 2014. The broad S&P 500® Index and the blue-chip Dow Jones Industrial AverageSM gained 25.37% and 19.01%, respectively, amid generally favorable earnings reports and accommodative monetary policies worldwide. Performance generally increased along the risk spectrum, with smaller-cap and growth strategies leading the way. An ebullient market helped the growth-oriented Nasdaq Composite Index® to a 38.10% period gain, for example. On the other hand, both cyclical and defensive stocks had representation in the top-performing industry sectors: returns were highest in health care and consumer discretionary; lowest in utilities and telecommunication services. From a macroeconomic perspective, data still points to slow but steady improvement in the U.S., and Europe's recession may well be over. Reports from China have disappointed, but continue to suggest a relatively soft landing there. Mixed signals from the U.S. Federal Reserve as to when it might curtail its stimulative bond buying kept markets in flux during the spring and summer. Stocks regained momentum in October despite a federal budget impasse and brief government shutdown, and lower volatility prevailed through year-end. Shedding new-year concerns about China's economy, an emerging-markets sell-off and confirmation (at last) of Fed tapering - alongside confirmation of a presumably dovish Janet Yellen as new Fed chair - February saw stocks back in record territory, bearing down on the five-year anniversary of the market's bottom.
Comments from Kyle Weaver, Portfolio Manager of IT Services Portfolio: For the year, strong stock selection helped the fund return 41.66%, considerably ahead of the 28.52% gain of the MSCI® U.S. IMI Information Technology Services 25-50 Index and also topping the S&P 500® by a wide margin. The IT services industry outperformed the broader market, mainly due to robust gains in the data processing & outsourced services group. Versus the industry index, one decision that played out especially well during the period was a large underweighting in technology services provider IBM, which makes up about 22% of our MSCI benchmark. Software engineering provider EPAM Systems was a meaningful overweighting that lifted relative performance, as its share price roughly doubled during the period. After several quarters of unappreciated growth in revenue and earnings, the market finally took note of the firm's potential in 2013 and validated the investment thesis here. Another significant contributor to relative performance was the fund's sizable overweighting in Virtusa, a small IT services firm. A non-index position in Web.com Group, a provider of Web hosting and website development services for smaller businesses, provides another good example of a largely unknown stock that paid off for the fund during the period. Conversely, my decision to significantly underweight strong-performing benchmark component Broadridge Financial Solutions worked against the fund. This firm provides proxy delivery services for public companies, and although it effectively has a monopoly in its market, I considered it a legacy business with weak long-term growth prospects. With that said, the stock was bolstered by an inexpensive valuation at the beginning of the period, somewhat improved financial results and increased proxy activity due to a strongly rising market. My inopportune timing was the problem with another detractor, service revenue management provider ServiceSource International. Underweighting electronic payments facilitator and major index stock MasterCard further detracted on a relative basis. I significantly added to this position, making it an overweighting and our second-largest holding at period end.
The views expressed above reflect those of the portfolio manager(s) only through the end of the period as stated on the cover of this report and do not necessarily represent the views of Fidelity or any other person in the Fidelity organization. Any such views are subject to change at any time based upon market or other conditions and Fidelity disclaims any responsibility to update such views. These views may not be relied on as investment advice and, because investment decisions for a Fidelity fund are based on numerous factors, may not be relied on as an indication of trading intent on behalf of any Fidelity fund.
Annual Report
IT Services Portfolio
Investment Changes (Unaudited)
Top Ten Stocks as of February 28, 2014 | ||
| % of fund's | % of fund's net assets |
Visa, Inc. Class A | 14.0 | 10.3 |
MasterCard, Inc. Class A | 9.2 | 5.0 |
Cognizant Technology Solutions Corp. Class A | 8.7 | 4.4 |
IBM Corp. | 8.4 | 8.2 |
Accenture PLC Class A | 5.1 | 6.2 |
Fidelity National Information Services, Inc. | 3.6 | 3.1 |
Computer Sciences Corp. | 3.0 | 2.3 |
FleetCor Technologies, Inc. | 2.6 | 1.9 |
Alliance Data Systems Corp. | 2.4 | 1.6 |
Virtusa Corp. | 2.4 | 3.1 |
| 59.4 | |
Top Industries (% of fund's net assets) | |||
As of February 28, 2014 | |||
| IT Services | 90.1% |
|
| Internet Software & Services | 3.9% |
|
| Software | 3.1% |
|
| Computers & Peripherals | 1.3% |
|
| Professional Services | 1.2% |
|
| All Others* | 0.4% |
|

As of August 31, 2013 | |||
| IT Services | 84.6% |
|
| Software | 4.5% |
|
| Computers & Peripherals | 2.6% |
|
| Professional Services | 2.5% |
|
| Internet Software & Services | 2.1% |
|
| All Others* | 3.7% |
|

* Includes short-term investments and net other assets (liabilities). |
Annual Report
IT Services Portfolio
Investments February 28, 2014
Showing Percentage of Net Assets
Common Stocks - 100.0% | |||
Shares | Value | ||
COMPUTERS & PERIPHERALS - 1.3% | |||
Computer Hardware - 0.5% | |||
NCR Corp. (a) | 248,600 | $ 8,464,830 | |
Computer Storage & Peripherals - 0.8% | |||
Electronics for Imaging, Inc. (a) | 297,500 | 13,268,500 | |
Nimble Storage, Inc. | 2,000 | 96,020 | |
| 13,364,520 | ||
TOTAL COMPUTERS & PERIPHERALS | 21,829,350 | ||
DIVERSIFIED CONSUMER SERVICES - 0.4% | |||
Specialized Consumer Services - 0.4% | |||
H&R Block, Inc. | 214,300 | 6,780,452 | |
HEALTH CARE TECHNOLOGY - 0.0% | |||
Health Care Technology - 0.0% | |||
Veeva Systems, Inc. Class A | 1,000 | 35,300 | |
INSURANCE - 0.0% | |||
Property & Casualty Insurance - 0.0% | |||
Fidelity National Financial, Inc. Class A | 14 | 463 | |
INTERNET SOFTWARE & SERVICES - 3.9% | |||
Internet Software & Services - 3.9% | |||
Cvent, Inc. | 69,100 | 2,714,248 | |
Demandware, Inc. (a) | 33,820 | 2,540,220 | |
Endurance International Group Holdings, Inc. (d) | 1,333,400 | 20,121,006 | |
Web.com Group, Inc. (a) | 740,750 | 27,000,338 | |
Wix.com Ltd. (a)(d) | 149,300 | 4,613,370 | |
Xoom Corp. | 240,301 | 6,735,637 | |
| 63,724,819 | ||
IT SERVICES - 90.1% | |||
Data Processing & Outsourced Services - 52.9% | |||
Alliance Data Systems Corp. (a)(d) | 140,248 | 39,986,107 | |
Automatic Data Processing, Inc. | 2,000 | 155,560 | |
Broadridge Financial Solutions, Inc. | 7,800 | 294,528 | |
Cardtronics, Inc. (a) | 115,800 | 4,692,216 | |
Cass Information Systems, Inc. | 3,052 | 158,704 | |
Computer Sciences Corp. | 791,100 | 49,997,520 | |
Convergys Corp. | 325,400 | 6,660,938 | |
CoreLogic, Inc. (a) | 908,200 | 29,607,320 | |
CSG Systems International, Inc. | 124,070 | 3,473,960 | |
Euronet Worldwide, Inc. (a) | 414,200 | 15,847,292 | |
EVERTEC, Inc. | 921,200 | 22,348,312 | |
ExlService Holdings, Inc. (a) | 1,088,600 | 30,469,914 | |
Fidelity National Information Services, Inc. | 1,061,800 | 59,046,698 | |
Fiserv, Inc. (a) | 278,300 | 16,155,315 | |
FleetCor Technologies, Inc. (a) | 333,900 | 43,383,627 | |
Global Payments, Inc. | 251,100 | 17,659,863 | |
Heartland Payment Systems, Inc. (d) | 211,600 | 8,557,104 | |
Jack Henry & Associates, Inc. | 1,600 | 93,008 | |
MasterCard, Inc. Class A | 1,956,700 | 152,074,724 | |
| |||
Shares | Value | ||
Maximus, Inc. | 94,100 | $ 4,497,039 | |
MoneyGram International, Inc. (a) | 698,000 | 13,282,940 | |
Neustar, Inc. Class A (a) | 116,600 | 4,176,612 | |
Paychex, Inc. | 3,500 | 146,160 | |
Sykes Enterprises, Inc. (a) | 161,800 | 3,184,224 | |
Syntel, Inc. (a) | 295,400 | 27,873,944 | |
Teletech Holdings, Inc. (a) | 2,000 | 48,160 | |
The Western Union Co. | 10,000 | 167,300 | |
Total System Services, Inc. | 538,200 | 16,393,572 | |
Vantiv, Inc. (a) | 486,900 | 15,498,027 | |
VeriFone Systems, Inc. (a) | 294,700 | 8,531,565 | |
Visa, Inc. Class A | 1,025,812 | 231,771,963 | |
WEX, Inc. (a) | 121,500 | 11,763,630 | |
WNS Holdings Ltd. sponsored ADR (a) | 740,929 | 14,737,078 | |
Xerox Corp. | 1,992,500 | 21,897,575 | |
| 874,632,499 | ||
IT Consulting & Other Services - 37.2% | |||
Accenture PLC Class A | 1,006,900 | 83,925,115 | |
Acxiom Corp. (a) | 426,100 | 15,863,703 | |
Atos Origin SA (d) | 87,060 | 8,465,900 | |
Booz Allen Hamilton Holding Corp. Class A | 192,100 | 4,039,863 | |
CACI International, Inc. Class A (a) | 88,300 | 6,960,689 | |
Camelot Information Systems, Inc. ADR (a) | 44 | 90 | |
Cap Gemini SA | 2,500 | 195,761 | |
CGI Group, Inc. Class A (sub. vtg.) (a) | 556,300 | 18,171,562 | |
Ciber, Inc. (a) | 1,834,000 | 8,766,520 | |
Cognizant Technology Solutions Corp. Class A (a) | 1,383,566 | 143,973,878 | |
Computer Task Group, Inc. | 87,700 | 1,425,125 | |
EPAM Systems, Inc. (a) | 927,200 | 38,877,496 | |
Forrester Research, Inc. | 10,300 | 373,066 | |
Gartner, Inc. Class A (a) | 356,400 | 24,791,184 | |
IBM Corp. | 746,650 | 138,257,181 | |
IBS Group Holding Ltd. GDR (Reg. S) | 483,035 | 16,001,597 | |
iGATE Corp. (a) | 24,900 | 842,865 | |
Leidos Holdings, Inc. | 3,125 | 139,563 | |
Luxoft Holding, Inc. | 366,836 | 13,730,671 | |
ManTech International Corp. Class A (d) | 221,700 | 6,489,159 | |
NCI, Inc. Class A (a) | 145,876 | 1,750,512 | |
Sapient Corp. (a) | 684,000 | 11,908,440 | |
ServiceSource International, Inc. (a) | 1,281,900 | 11,690,928 | |
Teradata Corp. (a) | 19,300 | 886,256 | |
Unisys Corp. (a) | 529,040 | 18,103,749 | |
Virtusa Corp. (a) | 1,094,212 | 39,796,490 | |
| 615,427,363 | ||
TOTAL IT SERVICES | 1,490,059,862 | ||
PROFESSIONAL SERVICES - 1.2% | |||
Research & Consulting Services - 1.2% | |||
ICF International, Inc. (a) | 489,900 | 19,801,758 | |
Common Stocks - continued | |||
Shares | Value | ||
SOFTWARE - 3.1% | |||
Application Software - 0.9% | |||
Bottomline Technologies, Inc. (a) | 191,000 | $ 6,816,790 | |
Descartes Systems Group, Inc. (a) | 68,400 | 975,996 | |
Diligent Board Member Services, Inc. (a)(d) | 569,839 | 2,317,102 | |
Guidewire Software, Inc. (a) | 55,600 | 2,980,716 | |
SAP AG sponsored ADR | 1,600 | 128,464 | |
Workday, Inc. Class A (a) | 1,400 | 153,888 | |
Zensar Technologies Ltd. | 138,123 | 885,146 | |
| 14,258,102 | ||
Systems Software - 2.2% | |||
CommVault Systems, Inc. (a)(d) | 376,200 | 25,912,656 | |
Exact Holdings NV | 20,300 | 763,547 | |
FleetMatics Group PLC (a) | 144,500 | 5,339,275 | |
NetSuite, Inc. (a) | 46,400 | 5,340,176 | |
| 37,355,654 | ||
TOTAL SOFTWARE | 51,613,756 | ||
TOTAL COMMON STOCKS (Cost $1,289,745,525) |
| ||
Money Market Funds - 4.2% | |||
Shares | Value | ||
Fidelity Cash Central Fund, 0.10% (b) | 197 | $ 197 | |
Fidelity Securities Lending Cash Central Fund, 0.09% (b)(c) | 69,614,305 | 69,614,305 | |
TOTAL MONEY MARKET FUNDS (Cost $69,614,502) |
| ||
TOTAL INVESTMENT PORTFOLIO - 104.2% (Cost $1,359,360,027) | 1,723,460,262 | ||
NET OTHER ASSETS (LIABILITIES) - (4.2)% | (69,888,219) | ||
NET ASSETS - 100% | $ 1,653,572,043 | ||
Legend |
(a) Non-income producing |
(b) Affiliated fund that is generally available only to investment companies and other accounts managed by Fidelity Investments. The rate quoted is the annualized seven-day yield of the fund at period end. A complete unaudited listing of the fund's holdings as of its most recent quarter end is available upon request. In addition, each Fidelity Central Fund's financial statements, which are not covered by the Fund's Report of Independent Registered Public Accounting Firm, are available on the SEC's website or upon request. |
(c) Investment made with cash collateral received from securities on loan. |
(d) Security or a portion of the security is on loan at period end. |
Affiliated Central Funds |
Information regarding fiscal year to date income earned by the Fund from investments in Fidelity Central Funds is as follows: |
Fund | Income earned |
Fidelity Cash Central Fund | $ 20,875 |
Fidelity Securities Lending Cash Central Fund | 132,013 |
Total | $ 152,888 |
Other Information |
All investments are categorized as Level 1 under the Fair Value Hierarchy. The inputs or methodology used for valuing securities may not be an indication of the risk associated with investing in those securities. For more information on valuation inputs, please refer to the Investment Valuation section in the accompanying Notes to Financial Statements. |
Distribution of investments by country or territory of incorporation, as a percentage of total net assets, is as follows (Unaudited): |
United States of America | 88.3% |
Ireland | 5.4% |
Puerto Rico | 1.4% |
Canada | 1.2% |
Isle of Man | 1.0% |
Others (Individually Less Than 1%) | 2.7% |
| 100.0% |
See accompanying notes which are an integral part of the financial statements.
Annual Report
IT Services Portfolio
Financial Statements
Statement of Assets and Liabilities
| February 28, 2014 | |
|
|
|
Assets | ||
Investment in securities, at value (including securities loaned of $67,524,069) - See accompanying schedule: Unaffiliated issuers (cost $1,289,745,525) | $ 1,653,845,760 |
|
Fidelity Central Funds (cost $69,614,502) | 69,614,502 |
|
Total Investments (cost $1,359,360,027) |
| $ 1,723,460,262 |
Receivable for investments sold | 18,192,985 | |
Receivable for fund shares sold | 4,821,960 | |
Dividends receivable | 1,357,400 | |
Distributions receivable from Fidelity Central Funds | 35,820 | |
Prepaid expenses | 4,213 | |
Other receivables | 35,645 | |
Total assets | 1,747,908,285 | |
|
|
|
Liabilities | ||
Payable for investments purchased | $ 9,881,703 | |
Payable for fund shares redeemed | 8,204,461 | |
Accrued management fee | 751,292 | |
Notes payable | 5,471,000 | |
Other affiliated payables | 304,240 | |
Other payables and accrued expenses | 109,241 | |
Collateral on securities loaned, at value | 69,614,305 | |
Total liabilities | 94,336,242 | |
|
|
|
Net Assets | $ 1,653,572,043 | |
Net Assets consist of: |
| |
Paid in capital | $ 1,287,966,147 | |
Accumulated undistributed net realized gain (loss) on investments and foreign currency transactions | 1,511,366 | |
Net unrealized appreciation (depreciation) on investments and assets and liabilities in foreign currencies | 364,094,530 | |
Net Assets, for 43,670,930 shares outstanding | $ 1,653,572,043 | |
Net Asset Value, offering price and redemption price per share ($1,653,572,043 ÷ 43,670,930 shares) | $ 37.86 | |
Statement of Operations
| Year ended February 28, 2014 | |
|
|
|
Investment Income |
|
|
Dividends |
| $ 7,058,515 |
Interest |
| 34 |
Income from Fidelity Central Funds (including $132,013 from security lending) |
| 152,888 |
Total income |
| 7,211,437 |
|
|
|
Expenses | ||
Management fee | $ 5,409,155 | |
Transfer agent fees | 2,006,571 | |
Accounting and security lending fees | 332,930 | |
Custodian fees and expenses | 71,180 | |
Independent trustees' compensation | 18,921 | |
Registration fees | 240,943 | |
Audit | 62,112 | |
Legal | 11,895 | |
Interest | 1,624 | |
Miscellaneous | 7,458 | |
Total expenses before reductions | 8,162,789 | |
Expense reductions | (47,140) | 8,115,649 |
Net investment income (loss) | (904,212) | |
Realized and Unrealized Gain (Loss) Net realized gain (loss) on: | ||
Investment securities: |
|
|
Unaffiliated issuers | 43,220,511 | |
Foreign currency transactions | 6,391 | |
Total net realized gain (loss) |
| 43,226,902 |
Change in net unrealized appreciation (depreciation) on: Investment securities | 278,408,931 | |
Assets and liabilities in foreign currencies | (2,197) | |
Total change in net unrealized appreciation (depreciation) |
| 278,406,734 |
Net gain (loss) | 321,633,636 | |
Net increase (decrease) in net assets resulting from operations | $ 320,729,424 | |
See accompanying notes which are an integral part of the financial statements.
Annual Report
Statement of Changes in Net Assets
| Year ended | Year ended |
Increase (Decrease) in Net Assets |
|
|
Operations |
|
|
Net investment income (loss) | $ (904,212) | $ (309,883) |
Net realized gain (loss) | 43,226,902 | 2,191,917 |
Change in net unrealized appreciation (depreciation) | 278,406,734 | 46,581,393 |
Net increase (decrease) in net assets resulting from operations | 320,729,424 | 48,463,427 |
Distributions to shareholders from net realized gain | (37,192,316) | (4,164,408) |
Share transactions | 1,358,923,826 | 265,908,531 |
Reinvestment of distributions | 35,875,905 | 4,072,995 |
Cost of shares redeemed | (495,851,392) | (92,447,606) |
Net increase (decrease) in net assets resulting from share transactions | 898,948,339 | 177,533,920 |
Redemption fees | 124,274 | 5,718 |
Total increase (decrease) in net assets | 1,182,609,721 | 221,838,657 |
|
|
|
Net Assets | ||
Beginning of period | 470,962,322 | 249,123,665 |
End of period (including accumulated net investment loss of $0 and accumulated net investment loss of $441,491, respectively) | $ 1,653,572,043 | $ 470,962,322 |
Other Information Shares | ||
Sold | 39,950,860 | 10,288,342 |
Issued in reinvestment of distributions | 999,013 | 165,233 |
Redeemed | (14,385,908) | (3,828,491) |
Net increase (decrease) | 26,563,965 | 6,625,084 |
Financial Highlights
Years ended February 28, | 2014 | 2013 | 2012 G | 2011 | 2010 |
Selected Per-Share Data |
|
|
|
|
|
Net asset value, beginning of period | $ 27.53 | $ 23.77 | $ 22.31 | $ 17.08 | $ 10.62 |
Income from Investment Operations |
|
|
|
|
|
Net investment income (loss) B | (.03) | (.02) E | (.05) | (.03) | (.05) |
Net realized and unrealized gain (loss) | 11.42 | 4.08 | 1.86 | 5.26 | 6.51 |
Total from investment operations | 11.39 | 4.06 | 1.81 | 5.23 | 6.46 |
Distributions from net realized gain | (1.06) | (.30) | (.35) | - | - |
Redemption fees added to paid in capital B, H | - | - | - | - | - |
Net asset value, end of period | $ 37.86 | $ 27.53 | $ 23.77 | $ 22.31 | $ 17.08 |
Total Return A | 41.66% | 17.22% | 8.18% | 30.62% | 60.83% |
Ratios to Average Net Assets C, F |
|
|
|
|
|
Expenses before reductions | .84% | .86% | .91% | .94% | .99% |
Expenses net of fee waivers, if any | .84% | .86% | .91% | .94% | .99% |
Expenses net of all reductions | .83% | .85% | .91% | .94% | .99% |
Net investment income (loss) | (.09)% | (.09)% E | (.24)% | (.16)% | (.31)% |
Supplemental Data |
|
|
|
|
|
Net assets, end of period (000 omitted) | $ 1,653,572 | $ 470,962 | $ 249,124 | $ 131,972 | $ 96,631 |
Portfolio turnover rate D | 74% | 107% | 143% | 156% | 131% |
A Total returns would have been lower if certain expenses had not been reduced during the applicable periods shown.
B Calculated based on average shares outstanding during the period.
C Fees and expenses of any underlying Fidelity Central Funds are not included in the Fund's expense ratio. The Fund indirectly bears its proportionate share of the expenses of any underlying Fidelity Central Funds.
D Amount does not include the portfolio activity of any underlying Fidelity Central Funds.
E Investment income per share reflects a large, non-recurring dividend which amounted to $.02 per share. Excluding this non-recurring dividend, the ratio of net investment income (loss) to average net assets would have been (.19)%.
F Expense ratios reflect operating expenses of the Fund. Expenses before reductions do not reflect amounts reimbursed by the investment adviser or reductions from brokerage service arrangements or reductions from other expense offset arrangements and do not represent the amount paid by the Fund during periods when reimbursements or reductions occur. Expenses net of fee waivers reflect expenses after reimbursement by the investment adviser but prior to reductions from brokerage service arrangements or other expense offset arrangements. Expenses net of all reductions represent the net expenses paid by the Fund.
G For the year ended February 29.
H Amount represents less than $.01 per share.
See accompanying notes which are an integral part of the financial statements.
Annual Report
Software and Computer Services Portfolio
Performance: The Bottom Line
Average annual total return reflects the change in the value of an investment, assuming reinvestment of the fund's distributions from dividend income and capital gains (the profits earned upon the sale of securities that have grown in value, if any) and assuming a constant rate of performance each year. The $10,000 table and the fund's returns do not reflect the deduction of taxes that a shareholder would pay on fund distributions or the redemption of fund shares. During periods of reimbursement by Fidelity, a fund's total return will be greater than it would be had the reimbursement not occurred. How a fund did yesterday is no guarantee of how it will do tomorrow.
Average Annual Total Returns
Periods ended February 28, 2014 | Past 1 | Past 5 | Past 10 |
Software and Computer Services Portfolio | 48.18% | 31.20% | 12.99% |
$10,000 Over 10 Years
Let's say hypothetically that $10,000 was invested in Software and Computer Services Portfolio on February 29, 2004. The chart shows how the value of your investment would have changed, and also shows how the S&P 500 Index performed over the same period.
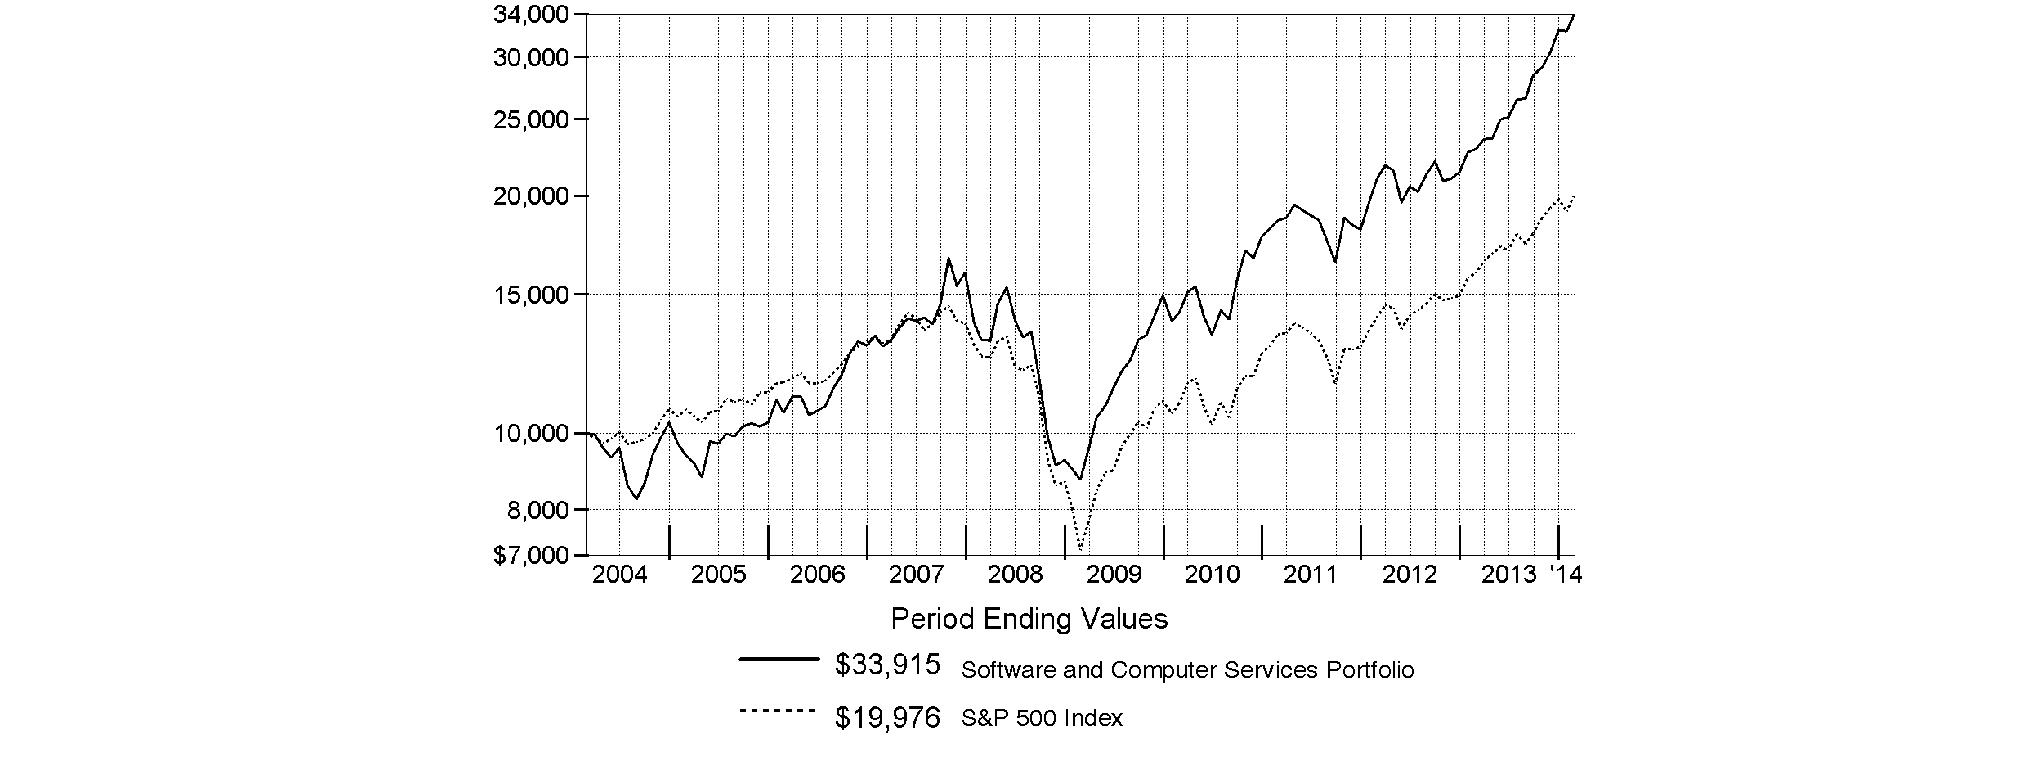
Annual Report
Software and Computer Services Portfolio
Management's Discussion of Fund Performance
Market Recap: Stocks overcame fears of higher interest rates - not to mention their worst January in four years - to finish sharply higher for the 12 months ending February 28, 2014. The broad S&P 500® Index and the blue-chip Dow Jones Industrial AverageSM gained 25.37% and 19.01%, respectively, amid generally favorable earnings reports and accommodative monetary policies worldwide. Performance generally increased along the risk spectrum, with smaller-cap and growth strategies leading the way. An ebullient market helped the growth-oriented Nasdaq Composite Index® to a 38.10% period gain, for example. On the other hand, both cyclical and defensive stocks had representation in the top-performing industry sectors: returns were highest in health care and consumer discretionary; lowest in utilities and telecommunication services. From a macroeconomic perspective, data still points to slow but steady improvement in the U.S., and Europe's recession may well be over. Reports from China have disappointed, but continue to suggest a relatively soft landing there. Mixed signals from the U.S. Federal Reserve as to when it might curtail its stimulative bond buying kept markets in flux during the spring and summer. Stocks regained momentum in October despite a federal budget impasse and brief government shutdown, and lower volatility prevailed through year-end. Shedding new-year concerns about China's economy, an emerging-markets sell-off and confirmation (at last) of Fed tapering - alongside confirmation of a presumably dovish Janet Yellen as new Fed chair - February saw stocks back in record territory, bearing down on the five-year anniversary of the market's bottom.
Comments from Brian Lempel, Portfolio Manager of Software and Computer Services Portfolio: For the year, the fund rose 48.18%, outpacing both the 33.49% increase of its industry benchmark, the MSCI® U.S. IMI Software & Services 25-50 Index, and the broad-based S&P 500®. Versus the MSCI index, stock selection proved the most powerful, especially among the Internet software & services and the IT consulting & other services segments. The fund also benefited from investments in several firms that were acquired during the period. Cloud-computing company Active Network was the fund's top relative contributor. As the stock began climbing, I stuck with it. My strategy paid off in September when a private equity firm announced plans to buy the company. The stock rose and I sold it to take profits. The fund also benefited from the acquisitions of SaaS providers Responsys and ExactTarget, two other stocks I held during the period. Responsys was purchased by Oracle in February and ExactTarget by salesforce.com in July. During the period, I added substantially to the Internet software & services segment, especially among large-cap Internet names, including three of the industry's most recognizable companies - Google, Yahoo! and Facebook. While the fund's positions in Yahoo! and Facebook proved beneficial, my average underweighting in Google hurt on a relative basis. I did move to an overweighting in Google by period end, making it the fund's largest holding. I'd like to note that Google was the fund's top absolute contributor. I maintained underweightings in two of the index's largest components - IBM and Microsoft - with mixed results. Reducing the fund's position in IBM helped, as the stock continued to suffer from missing Wall Street's sales consensus numbers for nine of the past 10 quarters. The average underweighting in Microsoft was especially detrimental, even though I raised the fund's stake after I saw numerous positive signals. Microsoft began the period at a relatively low valuation, especially given its strong balance sheet, and the stock began to improve in the run-up to the appointment of a new CEO in February. Also detracting was a position in Compuware, which provides software solutions with a combined on-premises and software-as-a-service (SaaS) business model. Activist shareholders pushed for the company's sale, and ultimately, they weren't successful. I sold the stock at a loss. SoftBank, a Japan-based out-of-index telecommunications and Internet business, was part of my large-cap Internet theme. SoftBank owns a stake in Alibaba, China's leading e-commerce site. SoftBank lost ground in January, partially due to a selloff in Japanese markets as macroeconomic concerns there mounted. I held on to the stock, and it began to rebound toward period end. Lastly, I'll mention Jive Software. This SaaS company provides social collaboration software for enterprises. The company poorly executed its business plan, and it was unclear if its software would be valuable.
The views expressed above reflect those of the portfolio manager(s) only through the end of the period as stated on the cover of this report and do not necessarily represent the views of Fidelity or any other person in the Fidelity organization. Any such views are subject to change at any time based upon market or other conditions and Fidelity disclaims any responsibility to update such views. These views may not be relied on as investment advice and, because investment decisions for a Fidelity fund are based on numerous factors, may not be relied on as an indication of trading intent on behalf of any Fidelity fund.
Annual Report
Software and Computer Services Portfolio
Investment Changes (Unaudited)
Top Ten Stocks as of February 28, 2014 | ||
| % of fund's | % of fund's net assets |
Google, Inc. Class A | 18.0 | 11.9 |
Microsoft Corp. | 12.6 | 13.9 |
Facebook, Inc. Class A | 6.2 | 5.6 |
Visa, Inc. Class A | 6.1 | 3.0 |
Oracle Corp. | 4.6 | 7.1 |
Yahoo!, Inc. | 3.9 | 2.0 |
Web.com Group, Inc. | 2.8 | 2.2 |
Cognizant Technology Solutions Corp. Class A | 2.7 | 2.1 |
IBM Corp. | 2.3 | 8.8 |
MasterCard, Inc. Class A | 2.3 | 2.8 |
| 61.5 | |
Top Industries (% of fund's net assets) | |||
As of February 28, 2014 | |||
| Internet Software & Services | 37.5% |
|
| Software | 28.8% |
|
| IT Services | 19.9% |
|
| Computers & Peripherals | 2.1% |
|
| Media | 2.0% |
|
| All Others* | 9.7% |
|

As of August 31, 2013 | |||
| Software | 38.1% |
|
| IT Services | 27.8% |
|
| Internet Software & Services | 27.8% |
|
| Media | 2.0% |
|
| Professional Services | 1.5% |
|
| All Others* | 2.8% |
|

* Includes short-term investments and net other assets (liabilities). |
Annual Report
Software and Computer Services Portfolio
Investments February 28, 2014
Showing Percentage of Net Assets
Common Stocks - 96.7% | |||
Shares | Value | ||
CAPITAL MARKETS - 0.2% | |||
Asset Management & Custody Banks - 0.2% | |||
ICG Group, Inc. (a) | 367,789 | $ 7,477,150 | |
COMMUNICATIONS EQUIPMENT - 0.5% | |||
Communications Equipment - 0.5% | |||
F5 Networks, Inc. (a) | 83,200 | 9,346,688 | |
Radware Ltd. (a) | 227,307 | 3,991,511 | |
Sonus Networks, Inc. (a) | 1,998,428 | 7,454,136 | |
| 20,792,335 | ||
COMPUTERS & PERIPHERALS - 2.1% | |||
Computer Hardware - 2.1% | |||
Cray, Inc. (a) | 7 | 243 | |
NCR Corp. (a) | 2,428,437 | 82,688,280 | |
| 82,688,523 | ||
DIVERSIFIED CONSUMER SERVICES - 0.6% | |||
Specialized Consumer Services - 0.6% | |||
H&R Block, Inc. | 753,900 | 23,853,396 | |
DIVERSIFIED TELECOMMUNICATION SERVICES - 1.0% | |||
Alternative Carriers - 1.0% | |||
8x8, Inc. (a) | 944,500 | 9,992,810 | |
inContact, Inc. (a)(e) | 3,337,956 | 30,108,363 | |
| 40,101,173 | ||
ELECTRONIC EQUIPMENT & COMPONENTS - 0.6% | |||
Electronic Manufacturing Services - 0.6% | |||
TE Connectivity Ltd. | 371,400 | 21,756,612 | |
INTERNET SOFTWARE & SERVICES - 37.5% | |||
Internet Software & Services - 37.5% | |||
Angie's List, Inc. (a)(d) | 399,075 | 5,551,133 | |
ChannelAdvisor Corp. (a) | 1,712 | 77,691 | |
Cvent, Inc. | 54,100 | 2,125,048 | |
Demand Media, Inc. (a) | 1,222,838 | 5,930,764 | |
Demandware, Inc. (a) | 312,750 | 23,490,653 | |
E2open, Inc. (a)(d) | 892,820 | 24,811,468 | |
eBay, Inc. (a) | 929,000 | 54,597,330 | |
Endurance International Group Holdings, Inc. (d) | 500,000 | 7,545,000 | |
Facebook, Inc. Class A (a) | 3,479,400 | 238,199,724 | |
Google, Inc. Class A (a) | 570,000 | 692,920,498 | |
IAC/InterActiveCorp | 103,500 | 8,024,355 | |
MercadoLibre, Inc. (d) | 40,800 | 4,250,544 | |
Naver Corp. | 4,021 | 3,080,433 | |
Rackspace Hosting, Inc. (a) | 375,200 | 13,796,104 | |
SciQuest, Inc. (a) | 1,142,715 | 33,732,947 | |
SPS Commerce, Inc. (a) | 36 | 2,441 | |
Tencent Holdings Ltd. | 450,500 | 36,136,131 | |
VeriSign, Inc. (a)(d) | 334,900 | 18,456,339 | |
Web.com Group, Inc. (a)(e) | 2,965,805 | 108,103,592 | |
| |||
Shares | Value | ||
Wix.com Ltd. (a)(d) | 306,104 | $ 9,458,614 | |
Yahoo!, Inc. (a) | 3,892,159 | 150,509,789 | |
| 1,440,800,598 | ||
IT SERVICES - 19.9% | |||
Data Processing & Outsourced Services - 12.5% | |||
Computer Sciences Corp. | 79,600 | 5,030,720 | |
ExlService Holdings, Inc. (a) | 197,310 | 5,522,707 | |
Fidelity National Information Services, Inc. | 434,500 | 24,162,545 | |
Fiserv, Inc. (a) | 234,000 | 13,583,700 | |
FleetCor Technologies, Inc. (a) | 131,600 | 17,098,788 | |
Genpact Ltd. (a) | 349,200 | 5,824,656 | |
Global Payments, Inc. | 21,500 | 1,512,095 | |
MasterCard, Inc. Class A | 1,119,000 | 86,968,680 | |
The Western Union Co. | 700,000 | 11,711,000 | |
Total System Services, Inc. | 130,100 | 3,962,846 | |
Vantiv, Inc. (a) | 152,300 | 4,847,709 | |
Visa, Inc. Class A | 1,029,930 | 232,702,384 | |
WEX, Inc. (a) | 76,800 | 7,435,776 | |
WNS Holdings Ltd. sponsored ADR (a)(e) | 2,927,854 | 58,235,016 | |
| 478,598,622 | ||
IT Consulting & Other Services - 7.4% | |||
Camelot Information Systems, Inc. ADR (a) | 1,577,937 | 3,218,991 | |
Cognizant Technology Solutions Corp. Class A (a) | 999,300 | 103,987,158 | |
EPAM Systems, Inc. (a) | 87,186 | 3,655,709 | |
HCL Technologies Ltd. | 1 | 26 | |
IBM Corp. | 482,700 | 89,381,559 | |
Lionbridge Technologies, Inc. (a)(e) | 6,154,175 | 44,063,893 | |
Sapient Corp. (a) | 1,780,800 | 31,003,728 | |
Unisys Corp. (a) | 119,000 | 4,072,180 | |
Virtusa Corp. (a) | 155,055 | 5,639,350 | |
| 285,022,594 | ||
TOTAL IT SERVICES | 763,621,216 | ||
MEDIA - 2.0% | |||
Advertising - 2.0% | |||
MDC Partners, Inc. Class A (sub. vtg.) (e) | 3,411,462 | 76,723,790 | |
PROFESSIONAL SERVICES - 1.7% | |||
Research & Consulting Services - 1.7% | |||
ICF International, Inc. (a)(e) | 1,608,943 | 65,033,476 | |
SEMICONDUCTORS & SEMICONDUCTOR EQUIPMENT - 0.5% | |||
Semiconductors - 0.5% | |||
NXP Semiconductors NV (a) | 316,400 | 17,791,172 | |
SOFTWARE - 28.8% | |||
Application Software - 8.7% | |||
Actuate Corp. (a) | 245,000 | 1,391,600 | |
Adobe Systems, Inc. (a) | 833,700 | 57,200,157 | |
Aspen Technology, Inc. (a) | 162,215 | 7,615,994 | |
Common Stocks - continued | |||
Shares | Value | ||
SOFTWARE - CONTINUED | |||
Application Software - continued | |||
Autodesk, Inc. (a) | 352,600 | $ 18,497,396 | |
BroadSoft, Inc. (a) | 380,400 | 11,415,804 | |
Citrix Systems, Inc. (a) | 614,800 | 36,918,740 | |
Comverse, Inc. (a) | 373,200 | 12,916,452 | |
Concur Technologies, Inc. (a) | 135,100 | 16,678,095 | |
Descartes Systems Group, Inc. (a) | 1,385,500 | 19,769,620 | |
Diligent Board Member Services, Inc. (a) | 465,086 | 1,891,151 | |
Guidewire Software, Inc. (a) | 338,200 | 18,130,902 | |
Interactive Intelligence Group, Inc. (a) | 138,468 | 11,026,207 | |
Jive Software, Inc. (a)(d) | 634,400 | 5,164,016 | |
Kingdee International Software Group Co. Ltd. (a) | 13,170,000 | 4,785,666 | |
Nuance Communications, Inc. (a) | 350,000 | 5,351,500 | |
Qlik Technologies, Inc. (a) | 164,400 | 5,014,200 | |
RealPage, Inc. (a)(d) | 62,000 | 1,097,400 | |
salesforce.com, Inc. (a) | 1,389,026 | 86,633,552 | |
TIBCO Software, Inc. (a) | 351,400 | 7,657,006 | |
TiVo, Inc. (a) | 267,100 | 3,605,850 | |
Workday, Inc. Class A (a) | 19,900 | 2,187,408 | |
| 334,948,716 | ||
Home Entertainment Software - 1.7% | |||
Activision Blizzard, Inc. | 292,000 | 5,650,200 | |
Electronic Arts, Inc. (a) | 2,106,900 | 60,236,271 | |
| 65,886,471 | ||
Systems Software - 18.4% | |||
CommVault Systems, Inc. (a) | 114,600 | 7,893,648 | |
Covisint Corp. (d) | 764,100 | 8,214,075 | |
Microsoft Corp. | 12,621,300 | 483,522,003 | |
NetSuite, Inc. (a) | 83,800 | 9,644,542 | |
Oracle Corp. | 4,573,300 | 178,861,763 | |
Rovi Corp. (a) | 241,900 | 6,008,796 | |
VMware, Inc. Class A (a)(d) | 149,800 | 14,388,290 | |
| 708,533,117 | ||
TOTAL SOFTWARE | 1,109,368,304 | ||
WIRELESS TELECOMMUNICATION SERVICES - 1.3% | |||
Wireless Telecommunication Services - 1.3% | |||
SoftBank Corp. | 653,200 | 49,501,666 | |
TOTAL COMMON STOCKS (Cost $2,595,699,939) |
| ||
Convertible Preferred Stocks - 0.2% | |||
Shares | Value | ||
DIVERSIFIED FINANCIAL SERVICES - 0.2% | |||
Other Diversified Financial Services - 0.2% | |||
Deem, Inc. (f) | 159,864,333 | $ 8,064,516 | |
Money Market Funds - 4.4% | |||
|
|
|
|
Fidelity Cash Central Fund, 0.10% (b) | 117,806,617 | 117,806,617 | |
Fidelity Securities Lending Cash Central Fund, 0.09% (b)(c) | 49,908,200 | 49,908,200 | |
TOTAL MONEY MARKET FUNDS (Cost $167,714,817) |
| ||
TOTAL INVESTMENT PORTFOLIO - 101.3% (Cost $2,771,479,272) | 3,895,288,744 |
NET OTHER ASSETS (LIABILITIES) - (1.3)% | (50,783,818) | ||
NET ASSETS - 100% | $ 3,844,504,926 | ||
Legend |
(a) Non-income producing |
(b) Affiliated fund that is generally available only to investment companies and other accounts managed by Fidelity Investments. The rate quoted is the annualized seven-day yield of the fund at period end. A complete unaudited listing of the fund's holdings as of its most recent quarter end is available upon request. In addition, each Fidelity Central Fund's financial statements, which are not covered by the Fund's Report of Independent Registered Public Accounting Firm, are available on the SEC's website or upon request. |
(c) Investment made with cash collateral received from securities on loan. |
(d) Security or a portion of the security is on loan at period end. |
(e) Affiliated company |
(f) Restricted securities - Investment in securities not registered under the Securities Act of 1933 (excluding 144A issues). At the end of the period, the value of restricted securities (excluding 144A issues) amounted to $8,064,516 or 0.2% of net assets. |
Additional information on each restricted holding is as follows: |
Security | Acquisition Date | Acquisition Cost |
Deem, Inc. | 9/19/13 | $ 8,064,516 |
Affiliated Central Funds |
Information regarding fiscal year to date income earned by the Fund from investments in Fidelity Central Funds is as follows: |
Fund | Income earned |
Fidelity Cash Central Fund | $ 26,555 |
Fidelity Securities Lending Cash Central Fund | 613,579 |
Total | $ 640,134 |
Other Affiliated Issuers |
An affiliated company is a company in which the Fund has ownership of at least 5% of the voting securities. Fiscal year to date transactions with companies which are or were affiliates are as follows: |
Affiliate | Value, | Purchases | Sales | Dividend | Value, |
Active Network, Inc. (The) | $ 27,734,470 | $ - | $ 81,544,599 | $ - | $ - |
Callidus Software, Inc. | 10,334,151 | - | 19,118,771 | - | - |
Camelot Information Systems, Inc. ADR | 3,705,183 | - | 1,237,609 | - | - |
Comverse, Inc. | 36,689,664 | - | 35,381,304 | - | - |
ICF International, Inc. | - | 48,014,715 | - | - | 65,033,476 |
inContact, Inc. | 22,664,721 | - | - | - | 30,108,363 |
Lionbridge Technologies, Inc. | 23,508,949 | - | - | - | 44,063,893 |
MDC Partners, Inc. Class A (sub. vtg.) | 31,271,740 | - | - | 1,855,835 | 76,723,790 |
Responsys, Inc. | 16,557,994 | 3,924,516 | 52,467,182 | - | - |
Web.com Group, Inc. | 35,488,841 | 42,893,203 | 25,556,044 | - | 108,103,592 |
WNS Holdings Ltd. sponsored ADR | 14,530,630 | 31,726,921 | - | - | 58,235,016 |
Total | $ 222,486,343 | $ 126,559,355 | $ 215,305,509 | $ 1,855,835 | $ 382,268,130 |
Other Information |
The following is a summary of the inputs used, as of February 28, 2014, involving the Fund's assets and liabilities carried at fair value. The inputs or methodology used for valuing securities may not be an indication of the risk associated with investing in those securities. For more information on valuation inputs, and their aggregation into the levels used in the table below, please refer to the Investment Valuation section in the accompanying Notes to Financial Statements. |
Valuation Inputs at Reporting Date: | ||||
Description | Total | Level 1 | Level 2 | Level 3 |
Investments in Securities: | ||||
Common Stocks | $ 3,719,509,411 | $ 3,670,007,745 | $ 49,501,666 | $ - |
Convertible Preferred Stocks | 8,064,516 | - | - | 8,064,516 |
Money Market Funds | 167,714,817 | 167,714,817 | - | - |
Total Investments in Securities: | $ 3,895,288,744 | $ 3,837,722,562 | $ 49,501,666 | $ 8,064,516 |
See accompanying notes which are an integral part of the financial statements.
Annual Report
Software and Computer Services Portfolio
Financial Statements
Statement of Assets and Liabilities
| February 28, 2014 | |
|
|
|
Assets | ||
Investment in securities, at value (including securities loaned of $48,448,534) - See accompanying schedule: Unaffiliated issuers (cost $2,392,469,913) | $ 3,345,305,797 |
|
Fidelity Central Funds (cost $167,714,817) | 167,714,817 |
|
Other affiliated issuers (cost $211,294,542) | 382,268,130 |
|
Total Investments (cost $2,771,479,272) |
| $ 3,895,288,744 |
Receivable for investments sold | 12,047,455 | |
Receivable for fund shares sold | 10,044,174 | |
Dividends receivable | 5,044,145 | |
Distributions receivable from Fidelity Central Funds | 70,877 | |
Prepaid expenses | 13,094 | |
Other receivables | 209,186 | |
Total assets | 3,922,717,675 | |
|
|
|
Liabilities | ||
Payable for investments purchased | $ 21,967,479 | |
Payable for fund shares redeemed | 3,893,985 | |
Accrued management fee | 1,685,545 | |
Other affiliated payables | 606,177 | |
Other payables and accrued expenses | 151,363 | |
Collateral on securities loaned, at value | 49,908,200 | |
Total liabilities | 78,212,749 | |
|
|
|
Net Assets | $ 3,844,504,926 | |
Net Assets consist of: |
| |
Paid in capital | $ 2,632,655,203 | |
Accumulated net investment loss | (17,421) | |
Accumulated undistributed net realized gain (loss) on investments and foreign currency transactions | 88,125,102 | |
Net unrealized appreciation (depreciation) on investments and assets and liabilities in foreign currencies | 1,123,742,042 | |
Net Assets, for 30,910,153 shares outstanding | $ 3,844,504,926 | |
Net Asset Value, offering price and redemption price per share ($3,844,504,926 ÷ 30,910,153 shares) | $ 124.38 | |
Statement of Operations
| Year ended February 28, 2014 | |
|
|
|
Investment Income |
|
|
Dividends (including $1,855,835 earned from other affiliated issuers) |
| $ 21,929,909 |
Interest |
| 15 |
Income from Fidelity Central Funds (including $613,579 from security lending) |
| 640,134 |
Total income |
| 22,570,058 |
|
|
|
Expenses | ||
Management fee | $ 14,857,047 | |
Transfer agent fees | 5,075,424 | |
Accounting and security lending fees | 796,984 | |
Custodian fees and expenses | 75,816 | |
Independent trustees' compensation | 51,457 | |
Registration fees | 201,083 | |
Audit | 58,988 | |
Legal | 40,049 | |
Interest | 2,565 | |
Miscellaneous | 27,707 | |
Total expenses before reductions | 21,187,120 | |
Expense reductions | (246,522) | 20,940,598 |
Net investment income (loss) | 1,629,460 | |
Realized and Unrealized Gain (Loss) Net realized gain (loss) on: | ||
Investment securities: |
|
|
Unaffiliated issuers | 206,593,227 | |
Other affiliated issuers | 68,002,638 |
|
Foreign currency transactions | (22,191) | |
Total net realized gain (loss) |
| 274,573,674 |
Change in net unrealized appreciation (depreciation) on: Investment securities | 798,780,646 | |
Assets and liabilities in foreign currencies | (17,915) | |
Total change in net unrealized appreciation (depreciation) |
| 798,762,731 |
Net gain (loss) | 1,073,336,405 | |
Net increase (decrease) in net assets resulting from operations | $ 1,074,965,865 | |
See accompanying notes which are an integral part of the financial statements.
Annual Report
Software and Computer Services Portfolio
Financial Statements - continued
Statement of Changes in Net Assets
| Year ended | Year ended |
Increase (Decrease) in Net Assets |
|
|
Operations |
|
|
Net investment income (loss) | $ 1,629,460 | $ 819,296 |
Net realized gain (loss) | 274,573,674 | 86,951,646 |
Change in net unrealized appreciation (depreciation) | 798,762,731 | 70,764,870 |
Net increase (decrease) in net assets resulting from operations | 1,074,965,865 | 158,535,812 |
Distributions to shareholders from net investment income | - | (16,945,649) |
Distributions to shareholders from net realized gain | (150,730,717) | (174,938,304) |
Total distributions | (150,730,717) | (191,883,953) |
Share transactions | 1,276,554,244 | 745,604,994 |
Reinvestment of distributions | 145,323,975 | 185,033,890 |
Cost of shares redeemed | (529,419,074) | (491,235,474) |
Net increase (decrease) in net assets resulting from share transactions | 892,459,145 | 439,403,410 |
Redemption fees | 79,660 | 60,186 |
Total increase (decrease) in net assets | 1,816,773,953 | 406,115,455 |
|
|
|
Net Assets | ||
Beginning of period | 2,027,730,973 | 1,621,615,518 |
End of period (including accumulated net investment loss of $17,421 and accumulated net investment loss of $16,192,390, respectively) | $ 3,844,504,926 | $ 2,027,730,973 |
Other Information Shares | ||
Sold | 11,648,557 | 8,589,526 |
Issued in reinvestment of distributions | 1,245,065 | 2,198,587 |
Redeemed | (5,034,535) | (5,763,915) |
Net increase (decrease) | 7,859,087 | 5,024,198 |
Financial Highlights
Years ended February 28, | 2014 | 2013 | 2012 F | 2011 | 2010 |
Selected Per-Share Data |
|
|
|
|
|
Net asset value, beginning of period | $ 87.97 | $ 89.96 | $ 91.63 | $ 72.29 | $ 44.38 |
Income from Investment Operations |
|
|
|
|
|
Net investment income (loss) B | .06 | .04 | (.06) | (.11) | (.04) |
Net realized and unrealized gain (loss) | 41.95 | 7.25 | 10.39 | 22.28 | 27.95 |
Total from investment operations | 42.01 | 7.29 | 10.33 | 22.17 | 27.91 |
Distributions from net investment income | - | (.78) H | - | - | - |
Distributions from net realized gain | (5.60) | (8.50) H | (12.00) | (2.83) | - |
Total distributions | (5.60) | (9.28) | (12.00) | (2.83) | - |
Redemption fees added to paid in capital B, G | - | - | - | - | - |
Net asset value, end of period | $ 124.38 | $ 87.97 | $ 89.96 | $ 91.63 | $ 72.29 |
Total Return A | 48.18% | 8.85% | 13.08% | 30.85% | 62.89% |
Ratios to Average Net Assets C, E |
|
|
|
|
|
Expenses before reductions | .79% | .82% | .82% | .84% | .90% |
Expenses net of fee waivers, if any | .79% | .82% | .82% | .84% | .90% |
Expenses net of all reductions | .78% | .80% | .81% | .83% | .89% |
Net investment income (loss) | .06% | .04% | (.07)% | (.13)% | (.07)% |
Supplemental Data |
|
|
|
|
|
Net assets, end of period (000 omitted) | $ 3,844,505 | $ 2,027,731 | $ 1,621,616 | $ 1,299,253 | $ 984,803 |
Portfolio turnover rate D | 87% | 96% | 238% | 189% | 56% |
A Total returns would have been lower if certain expenses had not been reduced during the applicable periods shown.
B Calculated based on average shares outstanding during the period.
C Fees and expenses of any underlying Fidelity Central Funds are not included in the Fund's expense ratio. The Fund indirectly bears its proportionate share of the expenses of any underlying Fidelity Central Funds.
D Amount does not include the portfolio activity of any underlying Fidelity Central Funds.
E Expense ratios reflect operating expenses of the Fund. Expenses before reductions do not reflect amounts reimbursed by the investment adviser or reductions from brokerage service arrangements or reductions from other expense offset arrangements and do not represent the amount paid by the Fund during periods when reimbursements or reductions occur. Expenses net of fee waivers reflect expenses after reimbursement by the investment adviser but prior to reductions from brokerage service arrangements or other expense offset arrangements. Expenses net of all reductions represent the net expenses paid by the Fund.
F For the year ended February 29.
G Amount represents less than $.01 per share.
H The amounts shown reflect certain reclassifications related to book to tax differences that were made in the year shown.
See accompanying notes which are an integral part of the financial statements.
Annual Report
Technology Portfolio
Performance: The Bottom Line
Average annual total return reflects the change in the value of an investment, assuming reinvestment of the fund's distributions from dividend income and capital gains (the profits earned upon the sale of securities that have grown in value, if any) and assuming a constant rate of performance each year. The $10,000 table and the fund's returns do not reflect the deduction of taxes that a shareholder would pay on fund distributions or the redemption of fund shares. During periods of reimbursement by Fidelity, a fund's total return will be greater than it would be had the reimbursement not occurred. How a fund did yesterday is no guarantee of how it will do tomorrow.
Average Annual Total Returns
Periods ended February 28, 2014 | Past 1 | Past 5 | Past 10 |
Technology Portfolio | 36.20% | 30.74% | 8.69% |
$10,000 Over 10 Years
Let's say hypothetically that $10,000 was invested in Technology Portfolio on February 29, 2004. The chart shows how the value of your investment would have changed, and also shows how the S&P 500 Index performed over the same period.
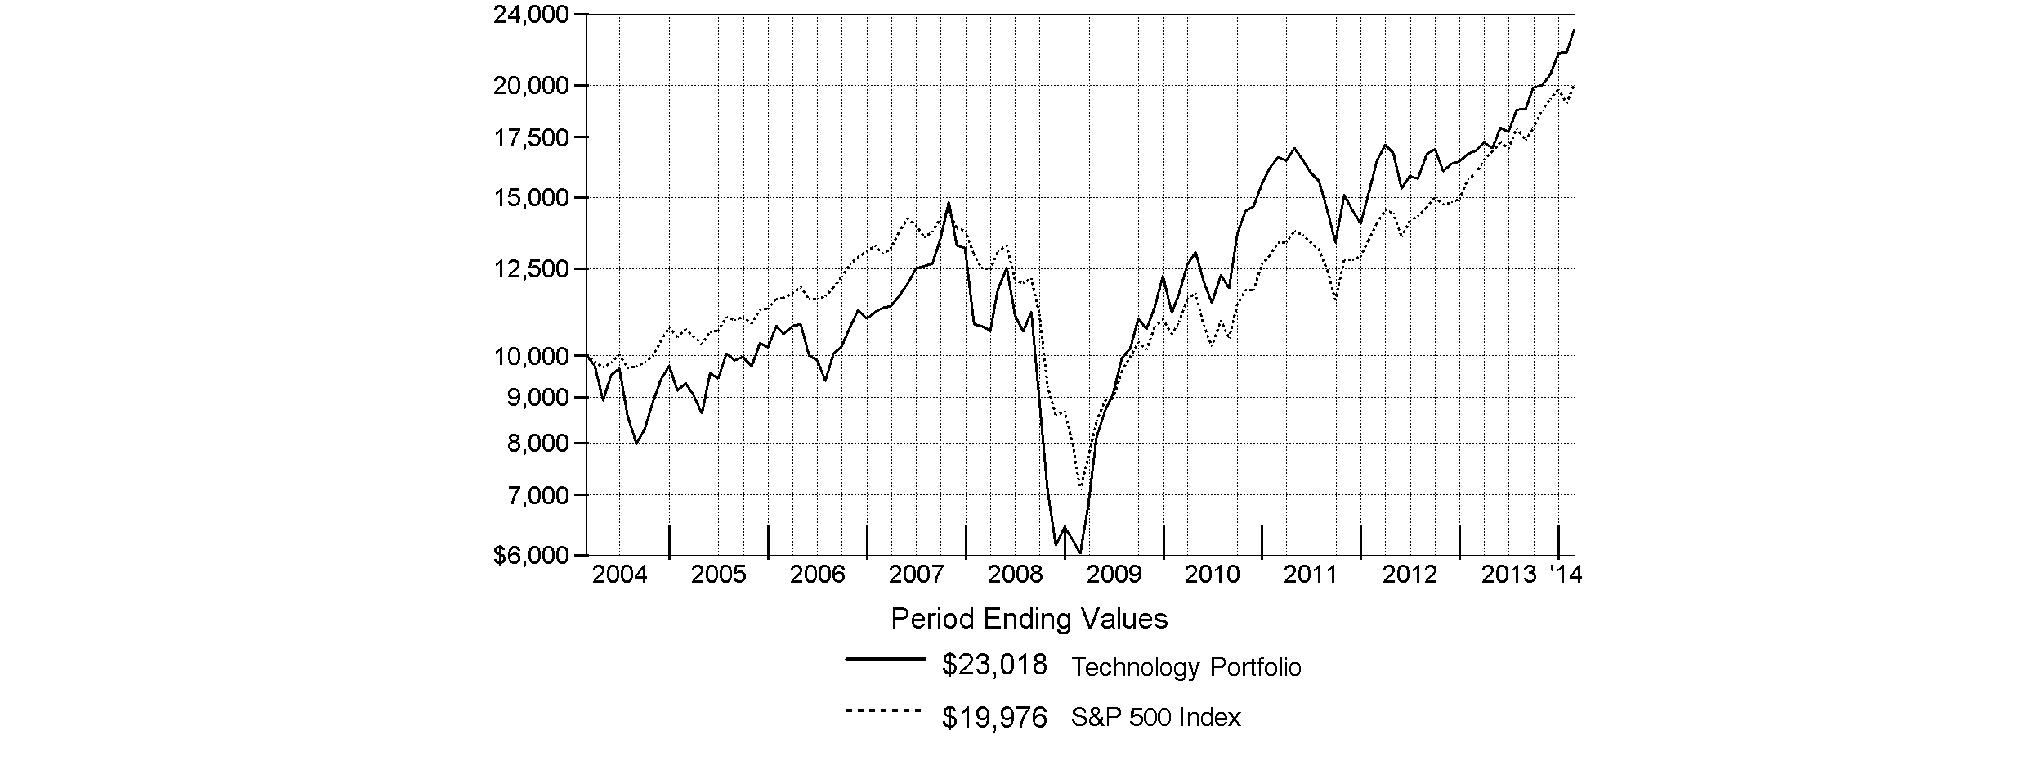
Annual Report
Technology Portfolio
Management's Discussion of Fund Performance
Market Recap: Stocks overcame fears of higher interest rates - not to mention their worst January in four years - to finish sharply higher for the 12 months ending February 28, 2014. The broad S&P 500® Index and the blue-chip Dow Jones Industrial AverageSM gained 25.37% and 19.01%, respectively, amid generally favorable earnings reports and accommodative monetary policies worldwide. Performance generally increased along the risk spectrum, with smaller-cap and growth strategies leading the way. An ebullient market helped the growth-oriented Nasdaq Composite Index® to a 38.10% period gain, for example. On the other hand, both cyclical and defensive stocks had representation in the top-performing industry sectors: returns were highest in health care and consumer discretionary; lowest in utilities and telecommunication services. From a macroeconomic perspective, data still points to slow but steady improvement in the U.S., and Europe's recession may well be over. Reports from China have disappointed, but continue to suggest a relatively soft landing there. Mixed signals from the U.S. Federal Reserve as to when it might curtail its stimulative bond buying kept markets in flux during the spring and summer. Stocks regained momentum in October despite a federal budget impasse and brief government shutdown, and lower volatility prevailed through year-end. Shedding new-year concerns about China's economy, an emerging-markets sell-off and confirmation (at last) of Fed tapering - alongside confirmation of a presumably dovish Janet Yellen as new Fed chair - February saw stocks back in record territory, bearing down on the five-year anniversary of the market's bottom.
Comments from Charlie Chai, Portfolio Manager of Technology Portfolio: For the year, the fund returned 36.20%, handily beating the 30.78% gain of the MSCI® U.S. IMI Information Technology 25-50 Index and also outpacing the 25.37% return of the S&P 500®. Versus the broader market, tech stocks were bolstered by strength in Internet software & services, a key group in the MSCI index that advanced by roughly 54%. Compared with the MSCI sector index, negligible exposure to IT consulting heavyweight IBM was timely, as the share price of this slow-growing index component returned -6% during the period. Largely avoiding IBM - which was not in the portfolio at period end - made this stock by far the fund's top relative contributor during the period. Significantly underweighting smartphone maker Apple also bolstered the fund's relative results, as this stock rose 22% but lagged our MSCI benchmark. Additionally, two non-index providers of mobile messaging contributed: South Korea-based Naver and China's Tencent Holdings. I significantly increased both positions during the period. Conversely, I got it wrong with my decision to meaningfully underweight personal computer software provider Microsoft - easily the fund's largest relative detractor - was one decision about a major benchmark component that I got wrong, as the stock posted a gain of 42% during the period. Underweighting social media platform Facebook for much of the period also hurt, given this stock's triple-digit advance. By period end, a combination of robust price appreciation and a higher share count made Facebook the fund's third-largest position. An average overweighting in NCR, a maker of ATMs and point-of-sale payment devices, further worked against us. A modest cash position also weighed on results in a strongly rising market. During the period, I initiated or increased positions in a number of stocks in the Internet software & services space. As the period progressed, I thought these companies had better growth potential than firms in a variety of tech hardware segments. On the sell side, I considerably reduced the fund's allocation to semiconductor stocks, which are particularly sensitive to shifts in supply and demand. These stocks enjoyed relatively strong performance during the period, much of it based on expectations for improving demand in 2014, and I thought valuations here might have gotten ahead of fundamentals.
The views expressed above reflect those of the portfolio manager(s) only through the end of the period as stated on the cover of this report and do not necessarily represent the views of Fidelity or any other person in the Fidelity organization. Any such views are subject to change at any time based upon market or other conditions and Fidelity disclaims any responsibility to update such views. These views may not be relied on as investment advice and, because investment decisions for a Fidelity fund are based on numerous factors, may not be relied on as an indication of trading intent on behalf of any Fidelity fund.
Annual Report
Technology Portfolio
Investment Changes (Unaudited)
Top Ten Stocks as of February 28, 2014 | ||
| % of fund's | % of fund's net assets |
Google, Inc. Class A | 9.9 | 8.8 |
Apple, Inc. | 7.0 | 10.1 |
Facebook, Inc. Class A | 6.1 | 0.3 |
Yahoo!, Inc. | 4.5 | 0.7 |
Microsoft Corp. | 4.3 | 5.0 |
Tencent Holdings Ltd. | 2.7 | 0.7 |
Cognizant Technology Solutions Corp. Class A | 2.7 | 0.3 |
Visa, Inc. Class A | 2.6 | 3.0 |
Fidelity National Information Services, Inc. | 2.3 | 1.8 |
Naver Corp. | 2.0 | 0.5 |
| 44.1 | |
Top Industries (% of fund's net assets) | |||
As of February 28, 2014 | |||
| Internet Software & Services | 30.9% |
|
| Software | 15.9% |
|
| IT Services | 12.5% |
|
| Computers & Peripherals | 10.2% |
|
| Semiconductors & Semiconductor Equipment | 9.0% |
|
| All Others* | 21.5% |
|

As of August 31, 2013 | |||
| Software | 28.4% |
|
| Internet Software & Services | 17.6% |
|
| Computers & Peripherals | 13.3% |
|
| Communications Equipment | 12.3% |
|
| Semiconductors & Semiconductor Equipment | 9.3% |
|
| All Others* | 19.1% |
|

* Includes short-term investments and net other assets (liabilities). |
Annual Report
Technology Portfolio
Investments February 28, 2014
Showing Percentage of Net Assets
Common Stocks - 94.9% | |||
Shares | Value | ||
AUTOMOBILES - 0.4% | |||
Automobile Manufacturers - 0.4% | |||
Tesla Motors, Inc. (a) | 42,856 | $ 10,491,577 | |
COMMUNICATIONS EQUIPMENT - 6.2% | |||
Communications Equipment - 6.2% | |||
ADVA Optical Networking SE (a) | 581,293 | 2,832,326 | |
BlackBerry Ltd. (a)(d) | 376,100 | 3,761,000 | |
Ciena Corp. (a)(d) | 330,657 | 8,124,242 | |
Cisco Systems, Inc. | 740,883 | 16,151,249 | |
CommScope Holding Co., Inc. | 229,400 | 5,549,186 | |
F5 Networks, Inc. (a) | 293,996 | 33,027,511 | |
Infinera Corp. (a) | 263,248 | 2,190,223 | |
Ixia (a) | 373,376 | 4,614,927 | |
Juniper Networks, Inc. (a) | 1,238,756 | 33,124,335 | |
Radware Ltd. (a) | 496,563 | 8,719,646 | |
Riverbed Technology, Inc. (a) | 562,894 | 12,541,278 | |
Sandvine Corp. (U.K.) (a) | 2,511,812 | 7,326,969 | |
Sonus Networks, Inc. (a) | 1,690,482 | 6,305,498 | |
Spirent Communications PLC | 3,168,632 | 5,571,334 | |
| 149,839,724 | ||
COMPUTERS & PERIPHERALS - 10.2% | |||
Computer Hardware - 8.6% | |||
Apple, Inc. | 319,271 | 168,013,171 | |
Cray, Inc. (a) | 316,276 | 10,971,614 | |
Lenovo Group Ltd. | 9,962,000 | 10,628,803 | |
NCR Corp. (a) | 349,324 | 11,894,482 | |
Silicon Graphics International Corp. (a) | 439,166 | 5,406,133 | |
| 206,914,203 | ||
Computer Storage & Peripherals - 1.6% | |||
EMC Corp. | 1,406,231 | 37,082,311 | |
LITE-ON Technology Corp. | 781,000 | 1,147,677 | |
Nimble Storage, Inc. | 12,460 | 598,205 | |
| 38,828,193 | ||
TOTAL COMPUTERS & PERIPHERALS | 245,742,396 | ||
CONSTRUCTION MATERIALS - 0.0% | |||
Construction Materials - 0.0% | |||
Universal Cement Corp. | 860,000 | 846,767 | |
DIVERSIFIED CONSUMER SERVICES - 0.4% | |||
Specialized Consumer Services - 0.4% | |||
LifeLock, Inc. (a) | 419,500 | 8,352,245 | |
DIVERSIFIED FINANCIAL SERVICES - 0.0% | |||
Other Diversified Financial Services - 0.0% | |||
Poly Culture Group Corp. Ltd. (H Shares) | 119,780 | 509,338 | |
ELECTRICAL EQUIPMENT - 0.1% | |||
Electrical Components & Equipment - 0.1% | |||
SolarCity Corp. (a) | 5,956 | 506,022 | |
TECO Electric & Machinery Co. Ltd. | 1,969,000 | 2,260,195 | |
| 2,766,217 | ||
| |||
Shares | Value | ||
ELECTRONIC EQUIPMENT & COMPONENTS - 4.1% | |||
Electronic Components - 1.5% | |||
Delta Electronics, Inc. | 603,000 | $ 3,351,492 | |
InvenSense, Inc. (a)(d) | 363,339 | 7,321,281 | |
Ledlink Optics, Inc. | 1,423,313 | 4,309,869 | |
Omron Corp. | 160,800 | 6,754,643 | |
Sapphire Technology Co. Ltd. (a) | 24,541 | 1,001,007 | |
Sunny Optical Technology Group Co. Ltd. | 933,000 | 887,249 | |
Tong Hsing Electronics Industries Ltd. | 1,515,000 | 7,945,673 | |
Yaskawa Electric Corp. | 326,000 | 4,868,395 | |
| 36,439,609 | ||
Electronic Equipment & Instruments - 1.2% | |||
Chroma ATE, Inc. | 2,017,644 | 4,831,724 | |
FEI Co. | 8,700 | 893,055 | |
Keyence Corp. | 15,650 | 6,715,491 | |
National Instruments Corp. | 208,717 | 6,046,531 | |
TPK Holding Co. Ltd. | 1,916,000 | 11,439,183 | |
| 29,925,984 | ||
Electronic Manufacturing Services - 1.1% | |||
AIC, Inc. | 70,000 | 436,396 | |
TE Connectivity Ltd. | 204,326 | 11,969,417 | |
Trimble Navigation Ltd. (a) | 350,521 | 13,372,376 | |
| 25,778,189 | ||
Technology Distributors - 0.3% | |||
Digital China Holdings Ltd. (H Shares) | 7,366,000 | 7,318,020 | |
Redington India Ltd. | 10,234 | 11,518 | |
| 7,329,538 | ||
TOTAL ELECTRONIC EQUIPMENT & COMPONENTS | 99,473,320 | ||
HEALTH CARE EQUIPMENT & SUPPLIES - 0.0% | |||
Health Care Equipment - 0.0% | |||
PW Medtech Group Ltd. (a) | 2,288,000 | 1,034,834 | |
HEALTH CARE TECHNOLOGY - 0.9% | |||
Health Care Technology - 0.9% | |||
athenahealth, Inc. (a)(d) | 45,126 | 8,748,578 | |
M3, Inc. | 3,758 | 12,499,587 | |
| 21,248,165 | ||
HOUSEHOLD DURABLES - 0.2% | |||
Consumer Electronics - 0.2% | |||
Skyworth Digital Holdings Ltd. | 2,036,000 | 1,038,916 | |
TCL Multimedia Technology Holdings Ltd. | 10,664,000 | 4,520,886 | |
| 5,559,802 | ||
INTERNET & CATALOG RETAIL - 1.7% | |||
Internet Retail - 1.7% | |||
Amazon.com, Inc. (a) | 6,541 | 2,368,496 | |
Ctrip.com International Ltd. sponsored ADR (a) | 323,684 | 17,482,173 | |
Common Stocks - continued | |||
Shares | Value | ||
INTERNET & CATALOG RETAIL - CONTINUED | |||
Internet Retail - continued | |||
E-Commerce China Dangdang, Inc. ADR (a)(d) | 367,091 | $ 5,161,299 | |
Expedia, Inc. | 71 | 5,576 | |
Groupon, Inc. Class A (a) | 280,679 | 2,332,442 | |
HomeAway, Inc. (a) | 28,801 | 1,321,102 | |
InterPark INT Corp. | 5,438 | 105,297 | |
priceline.com, Inc. (a) | 3,810 | 5,139,080 | |
TripAdvisor, Inc. (a) | 11,212 | 1,123,891 | |
Vipshop Holdings Ltd. ADR (a) | 20,512 | 2,693,636 | |
YOOX SpA (a) | 55,819 | 2,386,915 | |
| 40,119,907 | ||
INTERNET SOFTWARE & SERVICES - 30.9% | |||
Internet Software & Services - 30.9% | |||
58.com, Inc. ADR | 4,900 | 231,721 | |
Angie's List, Inc. (a)(d) | 188,728 | 2,625,206 | |
Blinkx PLC (a)(d) | 1,026,433 | 1,731,704 | |
Cornerstone OnDemand, Inc. (a) | 85,069 | 4,966,328 | |
Cvent, Inc. | 96,464 | 3,789,106 | |
Dealertrack Technologies, Inc. (a) | 153,003 | 8,272,872 | |
Demandware, Inc. (a) | 148,474 | 11,151,882 | |
E2open, Inc. (a) | 246,145 | 6,840,370 | |
eBay, Inc. (a) | 4,177 | 245,482 | |
eGain Communications Corp. (a) | 129,600 | 1,086,048 | |
Facebook, Inc. Class A (a) | 2,148,274 | 147,070,838 | |
Google, Inc. Class A (a) | 197,203 | 239,729,829 | |
IAC/InterActiveCorp | 196,044 | 15,199,291 | |
LinkedIn Corp. (a) | 5,652 | 1,153,234 | |
Livesense, Inc. (a)(d) | 236,800 | 3,664,734 | |
Marketo, Inc. | 61,100 | 2,505,100 | |
Millennial Media, Inc. (a)(d) | 155,176 | 937,263 | |
Move, Inc. (a) | 868,395 | 11,210,979 | |
Naver Corp. | 62,074 | 47,554,034 | |
NIC, Inc. | 119,768 | 2,328,290 | |
Rackspace Hosting, Inc. (a) | 85,991 | 3,161,889 | |
SciQuest, Inc. (a) | 98,042 | 2,894,200 | |
SINA Corp. (a) | 264,900 | 18,100,617 | |
SouFun Holdings Ltd. ADR | 62,117 | 4,893,577 | |
TelecityGroup PLC | 77,668 | 857,739 | |
Tencent Holdings Ltd. | 823,300 | 66,039,681 | |
Textura Corp. (d) | 318,281 | 8,564,942 | |
Vocus, Inc. (a) | 187,450 | 2,502,458 | |
Web.com Group, Inc. (a) | 265,198 | 9,666,467 | |
Yahoo!, Inc. (a) | 2,814,424 | 108,833,776 | |
Yelp, Inc. (a) | 74,724 | 7,055,440 | |
| 744,865,097 | ||
IT SERVICES - 12.5% | |||
Data Processing & Outsourced Services - 9.3% | |||
Automatic Data Processing, Inc. | 58,055 | 4,515,518 | |
| |||
Shares | Value | ||
DST Systems, Inc. | 24,580 | $ 2,310,028 | |
Euronet Worldwide, Inc. (a) | 62,401 | 2,387,462 | |
EVERTEC, Inc. | 256,002 | 6,210,609 | |
Fidelity National Information Services, Inc. | 1,022,168 | 56,842,762 | |
Fiserv, Inc. (a) | 200,564 | 11,642,740 | |
Jack Henry & Associates, Inc. | 39,911 | 2,320,026 | |
MasterCard, Inc. Class A | 526,017 | 40,882,041 | |
NETeller PLC (a) | 775,303 | 6,309,659 | |
QIWI PLC Class B sponsored ADR | 65,100 | 3,035,613 | |
Syntel, Inc. (a) | 2,913 | 274,871 | |
Total System Services, Inc. | 679,099 | 20,685,356 | |
Visa, Inc. Class A | 276,782 | 62,536,125 | |
WEX, Inc. (a) | 25,098 | 2,429,988 | |
WNS Holdings Ltd. sponsored ADR (a) | 26,900 | 535,041 | |
| 222,917,839 | ||
IT Consulting & Other Services - 3.2% | |||
Anite Group PLC | 587,232 | 870,264 | |
Cognizant Technology Solutions Corp. Class A (a) | 626,106 | 65,152,590 | |
EPAM Systems, Inc. (a) | 190,505 | 7,987,875 | |
ServiceSource International, Inc. (a) | 227,262 | 2,072,629 | |
Virtusa Corp. (a) | 49,000 | 1,782,130 | |
| 77,865,488 | ||
TOTAL IT SERVICES | 300,783,327 | ||
LIFE SCIENCES TOOLS & SERVICES - 0.4% | |||
Life Sciences Tools & Services - 0.4% | |||
WuXi PharmaTech Cayman, Inc. sponsored ADR (a) | 258,111 | 9,926,949 | |
MACHINERY - 0.3% | |||
Industrial Machinery - 0.3% | |||
HIWIN Technologies Corp. | 259,000 | 2,588,590 | |
King Slide Works Co. Ltd. | 283,000 | 3,281,200 | |
| 5,869,790 | ||
MEDIA - 0.6% | |||
Broadcasting - 0.6% | |||
CJ E&M Corp. (a) | 319,175 | 11,597,280 | |
Fuji Media Holdings, Inc. | 114,100 | 2,065,168 | |
| 13,662,448 | ||
Movies & Entertainment - 0.0% | |||
IMAX Corp. (a) | 770 | 20,598 | |
Publishing - 0.0% | |||
NEXT Co. Ltd. | 97,500 | 829,665 | |
TOTAL MEDIA | 14,512,711 | ||
PROFESSIONAL SERVICES - 0.4% | |||
Research & Consulting Services - 0.4% | |||
Verisk Analytics, Inc. (a) | 130,600 | 8,321,179 | |
Common Stocks - continued | |||
Shares | Value | ||
REAL ESTATE MANAGEMENT & DEVELOPMENT - 0.3% | |||
Real Estate Operating Companies - 0.3% | |||
Global Logistic Properties Ltd. | 3,102,000 | $ 6,925,145 | |
SEMICONDUCTORS & SEMICONDUCTOR EQUIPMENT - 9.0% | |||
Semiconductor Equipment - 3.2% | |||
Aixtron AG (a) | 295,571 | 4,948,456 | |
Daqo New Energy Corp. ADR (a) | 12,425 | 567,823 | |
GCL-Poly Energy Holdings Ltd. (a) | 81,406,000 | 30,629,984 | |
Giga Solar Materials Corp. | 11,000 | 238,385 | |
GT Advanced Technologies, Inc. (a) | 236,054 | 3,382,654 | |
Nanometrics, Inc. (a) | 21,591 | 396,411 | |
Rubicon Technology, Inc. (a)(d) | 880,318 | 11,364,905 | |
SMA Solar Technology AG (d) | 6,464 | 387,271 | |
SunEdison, Inc. (a) | 316,900 | 5,818,284 | |
Tessera Technologies, Inc. | 761,920 | 16,548,902 | |
Veeco Instruments, Inc. (a) | 64,776 | 2,561,891 | |
| 76,844,966 | ||
Semiconductors - 5.8% | |||
Altera Corp. | 459,768 | 16,694,176 | |
Applied Micro Circuits Corp. (a) | 257,393 | 2,949,724 | |
Broadcom Corp. Class A | 74,319 | 2,208,761 | |
Cavium, Inc. (a) | 112,404 | 4,735,581 | |
Chipbond Technology Corp. | 13,000 | 22,212 | |
Cree, Inc. (a) | 198,118 | 12,170,389 | |
Crystalwise Technology, Inc. (a) | 117,096 | 150,442 | |
Cypress Semiconductor Corp. | 433,892 | 4,247,803 | |
Epistar Corp. | 1,584,000 | 3,720,113 | |
Faraday Technology Corp. | 1,275,000 | 1,842,066 | |
Formosa Epitaxy, Inc. (a) | 1,877,000 | 1,120,634 | |
Freescale Semiconductor, Inc. (a) | 233,436 | 5,310,669 | |
Himax Technologies, Inc. sponsored ADR (d) | 68,800 | 950,128 | |
Inphi Corp. (a) | 107,978 | 1,419,911 | |
Intermolecular, Inc. (a) | 837,612 | 2,219,672 | |
Intersil Corp. Class A | 101,289 | 1,288,396 | |
Lextar Electronics Corp. | 506,000 | 556,631 | |
Marvell Technology Group Ltd. | 435,666 | 6,661,333 | |
Melexis NV | 85,467 | 3,278,389 | |
Mellanox Technologies Ltd. (a)(d) | 195,922 | 7,155,071 | |
Monolithic Power Systems, Inc. (a) | 65,295 | 2,340,173 | |
NXP Semiconductors NV (a) | 150,687 | 8,473,130 | |
On-Bright Electronics, Inc. | 421,000 | 4,124,388 | |
RDA Microelectronics, Inc. sponsored ADR | 303,621 | 5,483,395 | |
RF Micro Devices, Inc. (a) | 1,417,658 | 10,037,019 | |
Seoul Semiconductor Co. Ltd. | 359,760 | 15,500,795 | |
Silergy Corp. | 303,000 | 2,318,737 | |
Silicon Laboratories, Inc. (a) | 77,300 | 4,017,281 | |
| |||
Shares | Value | ||
Xilinx, Inc. | 186,840 | $ 9,753,048 | |
YoungTek Electronics Corp. | 87,384 | 186,202 | |
| 140,936,269 | ||
TOTAL SEMICONDUCTORS & SEMICONDUCTOR EQUIPMENT | 217,781,235 | ||
SOFTWARE - 15.9% | |||
Application Software - 8.1% | |||
Adobe Systems, Inc. (a) | 377,939 | 25,930,395 | |
ANSYS, Inc. (a) | 76,014 | 6,348,689 | |
Aspen Technology, Inc. (a) | 221,871 | 10,416,843 | |
Autodesk, Inc. (a) | 177,325 | 9,302,470 | |
BroadSoft, Inc. (a) | 150,349 | 4,511,973 | |
Citrix Systems, Inc. (a) | 405,807 | 24,368,710 | |
Concur Technologies, Inc. (a) | 71,402 | 8,814,577 | |
Descartes Systems Group, Inc. (a) | 471,900 | 6,733,514 | |
Guidewire Software, Inc. (a) | 155,111 | 8,315,501 | |
Interactive Intelligence Group, Inc. (a) | 14,690 | 1,169,765 | |
Intuit, Inc. | 29,610 | 2,314,022 | |
Jive Software, Inc. (a) | 103,646 | 843,678 | |
Kingdee International Software Group Co. Ltd. (a) | 24,639,600 | 8,953,447 | |
Linx SA | 206,400 | 3,698,871 | |
Manhattan Associates, Inc. (a) | 58,220 | 2,205,956 | |
MicroStrategy, Inc. Class A (a) | 61,245 | 7,908,567 | |
PROS Holdings, Inc. (a) | 26,200 | 902,590 | |
Qlik Technologies, Inc. (a) | 233,814 | 7,131,327 | |
salesforce.com, Inc. (a) | 508,692 | 31,727,120 | |
SolarWinds, Inc. (a) | 29,236 | 1,350,118 | |
Solera Holdings, Inc. | 76,600 | 5,240,972 | |
Splunk, Inc. (a) | 31,317 | 2,904,652 | |
Synchronoss Technologies, Inc. (a) | 31,605 | 1,086,580 | |
TIBCO Software, Inc. (a) | 157,883 | 3,440,271 | |
Ultimate Software Group, Inc. (a) | 28,117 | 4,667,422 | |
Workday, Inc. Class A (a) | 41,746 | 4,588,720 | |
| 194,876,750 | ||
Home Entertainment Software - 1.6% | |||
Activision Blizzard, Inc. | 579,400 | 11,211,390 | |
Electronic Arts, Inc. (a) | 344,500 | 9,849,255 | |
Kingsoft Corp. Ltd. | 147,000 | 500,068 | |
Nintendo Co. Ltd. | 57,700 | 7,131,673 | |
Nintendo Co. Ltd. ADR | 234,400 | 3,609,760 | |
WeMade Entertainment Co. Ltd. (a) | 174,650 | 7,451,360 | |
| 39,753,506 | ||
Systems Software - 6.2% | |||
Allot Communications Ltd. (a) | 528,072 | 8,882,171 | |
CommVault Systems, Inc. (a) | 23,873 | 1,644,372 | |
FleetMatics Group PLC (a) | 269,628 | 9,962,755 | |
Infoblox, Inc. (a) | 88,600 | 2,044,888 | |
Microsoft Corp. | 2,712,287 | 103,907,715 | |
NetSuite, Inc. (a) | 93,384 | 10,747,565 | |
Red Hat, Inc. (a) | 59,312 | 3,498,815 | |
Common Stocks - continued | |||
Shares | Value | ||
SOFTWARE - CONTINUED | |||
Systems Software - continued | |||
ServiceNow, Inc. (a) | 125,450 | $ 8,538,127 | |
Tableau Software, Inc. | 3,700 | 349,058 | |
| 149,575,466 | ||
TOTAL SOFTWARE | 384,205,722 | ||
WIRELESS TELECOMMUNICATION SERVICES - 0.4% | |||
Wireless Telecommunication Services - 0.4% | |||
RingCentral, Inc. | 120,947 | 2,618,503 | |
SoftBank Corp. | 77,100 | 5,842,894 | |
| 8,461,397 | ||
TOTAL COMMON STOCKS (Cost $1,780,995,377) |
| ||
Money Market Funds - 6.4% | |||
|
|
|
|
Fidelity Cash Central Fund, 0.10% (b) | 115,600,102 | 115,600,102 | |
Fidelity Securities Lending Cash Central Fund, 0.09% (b)(c) | 40,218,696 | 40,218,696 | |
TOTAL MONEY MARKET FUNDS (Cost $155,818,798) |
| ||
TOTAL INVESTMENT PORTFOLIO - 101.3% (Cost $1,936,814,175) | 2,443,455,642 |
NET OTHER ASSETS (LIABILITIES) - (1.3)% | (32,064,324) | ||
NET ASSETS - 100% | $ 2,411,391,318 | ||
Legend |
(a) Non-income producing |
(b) Affiliated fund that is generally available only to investment companies and other accounts managed by Fidelity Investments. The rate quoted is the annualized seven-day yield of the fund at period end. A complete unaudited listing of the fund's holdings as of its most recent quarter end is available upon request. In addition, each Fidelity Central Fund's financial statements, which are not covered by the Fund's Report of Independent Registered Public Accounting Firm, are available on the SEC's website or upon request. |
(c) Investment made with cash collateral received from securities on loan. |
(d) Security or a portion of the security is on loan at period end. |
Affiliated Central Funds |
Information regarding fiscal year to date income earned by the Fund from investments in Fidelity Central Funds is as follows: |
Fund | Income earned |
Fidelity Cash Central Fund | $ 39,453 |
Fidelity Securities Lending Cash Central Fund | 500,665 |
Total | $ 540,118 |
Other Information |
The following is a summary of the inputs used, as of February 28, 2014, involving the Fund's assets and liabilities carried at fair value. The inputs or methodology used for valuing securities may not be an indication of the risk associated with investing in those securities. For more information on valuation inputs, and their aggregation into the levels used in the tables below, please refer to the Investment Valuation section in the accompanying Notes to Financial Statements. |
Valuation Inputs at Reporting Date: | ||||
Description | Total | Level 1 | Level 2 | Level 3 |
Investments in Securities: | ||||
Common Stocks | $ 2,287,636,844 | $ 2,264,336,088 | $ 23,300,756 | $ - |
Money Market Funds | 155,818,798 | 155,818,798 | - | - |
Total Investments in Securities: | $ 2,443,455,642 | $ 2,420,154,886 | $ 23,300,756 | $ - |
The following is a summary of transfers between Level 1 and Level 2 for the period ended February 28, 2014. Transfers are assumed to have occurred at the beginning of the period, and are primarily attributable to the valuation techniques used for foreign equity securities, as discussed in the accompanying Notes to Financial Statements: |
Transfers | Total |
Level 1 to Level 2 | $ 1,407,013 |
Level 2 to Level 1 | $ 24,755,450 |
Distribution of investments by country or territory of incorporation, as a percentage of total net assets, is as follows (Unaudited): |
United States of America | 78.4% |
Cayman Islands | 8.0% |
Korea (South) | 3.5% |
Japan | 2.3% |
Taiwan | 1.6% |
Israel | 1.1% |
Others (Individually Less Than 1%) | 5.1% |
| 100.0% |
See accompanying notes which are an integral part of the financial statements.
Annual Report
Technology Portfolio
Financial Statements
Statement of Assets and Liabilities
| February 28, 2014 | |
|
|
|
Assets | ||
Investment in securities, at value (including securities loaned of $38,685,722) - See accompanying schedule: Unaffiliated issuers (cost $1,780,995,377) | $ 2,287,636,844 |
|
Fidelity Central Funds (cost $155,818,798) | 155,818,798 |
|
Total Investments (cost $1,936,814,175) |
| $ 2,443,455,642 |
Foreign currency held at value (cost $937,455) | 937,261 | |
Receivable for investments sold | 48,105,384 | |
Receivable for fund shares sold | 7,595,712 | |
Dividends receivable | 1,256,033 | |
Distributions receivable from Fidelity Central Funds | 57,062 | |
Prepaid expenses | 10,688 | |
Other receivables | 167,987 | |
Total assets | 2,501,585,769 | |
|
|
|
Liabilities | ||
Payable to custodian bank | $ 1,935,451 | |
Payable for investments purchased | 43,558,083 | |
Payable for fund shares redeemed | 2,911,087 | |
Accrued management fee | 1,051,300 | |
Other affiliated payables | 390,254 | |
Other payables and accrued expenses | 129,580 | |
Collateral on securities loaned, at value | 40,218,696 | |
Total liabilities | 90,194,451 | |
|
|
|
Net Assets | $ 2,411,391,318 | |
Net Assets consist of: |
| |
Paid in capital | $ 1,724,758,899 | |
Distributions in excess of net investment income | (12,855) | |
Accumulated undistributed net realized gain (loss) on investments and foreign currency transactions | 180,005,413 | |
Net unrealized appreciation (depreciation) on investments and assets and liabilities in foreign currencies | 506,639,861 | |
Net Assets, for 18,450,425 shares outstanding | $ 2,411,391,318 | |
Net Asset Value, offering price and redemption price per share ($2,411,391,318 ÷ 18,450,425 shares) | $ 130.70 | |
Statement of Operations
| Year ended February 28, 2014 | |
|
|
|
Investment Income |
|
|
Dividends |
| $ 16,336,086 |
Interest |
| 333,806 |
Income from Fidelity Central Funds (including $500,665 from security lending) |
| 540,118 |
Total income |
| 17,210,010 |
|
|
|
Expenses | ||
Management fee | $ 11,562,336 | |
Transfer agent fees | 4,066,687 | |
Accounting and security lending fees | 643,034 | |
Custodian fees and expenses | 265,927 | |
Independent trustees' compensation | 39,977 | |
Registration fees | 44,176 | |
Audit | 52,664 | |
Legal | 38,186 | |
Interest | 2,250 | |
Miscellaneous | 25,609 | |
Total expenses before reductions | 16,740,846 | |
Expense reductions | (614,465) | 16,126,381 |
Net investment income (loss) | 1,083,629 | |
Realized and Unrealized Gain (Loss) Net realized gain (loss) on: | ||
Investment securities: |
|
|
Unaffiliated issuers | 355,715,834 | |
Foreign currency transactions | (375,461) | |
Total net realized gain (loss) |
| 355,340,373 |
Change in net unrealized appreciation (depreciation) on: Investment securities (net of decrease in deferred foreign taxes of $64,889) | 296,895,814 | |
Assets and liabilities in foreign currencies | 6,209 | |
Total change in net unrealized appreciation (depreciation) |
| 296,902,023 |
Net gain (loss) | 652,242,396 | |
Net increase (decrease) in net assets resulting from operations | $ 653,326,025 | |
See accompanying notes which are an integral part of the financial statements.
Annual Report
Technology Portfolio
Financial Statements - continued
Statement of Changes in Net Assets
| Year ended | Year ended |
Increase (Decrease) in Net Assets |
|
|
Operations |
|
|
Net investment income (loss) | $ 1,083,629 | $ 150,049 |
Net realized gain (loss) | 355,340,373 | 212,841,957 |
Change in net unrealized appreciation (depreciation) | 296,902,023 | (169,316,033) |
Net increase (decrease) in net assets resulting from operations | 653,326,025 | 43,675,973 |
Distributions to shareholders from net investment income | (1,509,202) | - |
Distributions to shareholders from net realized gain | (167,743,037) | - |
Total distributions | (169,252,239) | - |
Share transactions | 328,754,153 | 409,925,959 |
Reinvestment of distributions | 161,829,539 | - |
Cost of shares redeemed | (591,619,174) | (775,244,365) |
Net increase (decrease) in net assets resulting from share transactions | (101,035,482) | (365,318,406) |
Redemption fees | 29,508 | 40,404 |
Total increase (decrease) in net assets | 383,067,812 | (321,602,029) |
|
|
|
Net Assets | ||
Beginning of period | 2,028,323,506 | 2,349,925,535 |
End of period (including distributions in excess of net investment income of $12,855 and undistributed net investment income of $428,148, respectively) | $ 2,411,391,318 | $ 2,028,323,506 |
Other Information Shares | ||
Sold | 2,760,510 | 4,019,573 |
Issued in reinvestment of distributions | 1,392,335 | - |
Redeemed | (5,184,105) | (7,674,977) |
Net increase (decrease) | (1,031,260) | (3,655,404) |
Financial Highlights
Years ended February 28, | 2014 | 2013 | 2012 F | 2011 | 2010 |
Selected Per-Share Data |
|
|
|
|
|
Net asset value, beginning of period | $ 104.11 | $ 101.57 | $ 102.37 | $ 72.24 | $ 37.12 |
Income from Investment Operations |
|
|
|
|
|
Net investment income (loss) B | .06 | .01 | (.27) | (.37) | (.13) |
Net realized and unrealized gain (loss) | 36.34 | 2.53 | (.53) | 30.50 | 35.25 |
Total from investment operations | 36.40 | 2.54 | (.80) | 30.13 | 35.12 |
Distributions from net investment income | (.09) H | - | - | - | - |
Distributions from net realized gain | (9.72) H | - | - | - | - |
Total distributions | (9.81) | - | - | - | - |
Redemption fees added to paid in capital B, G | - | - | - | - | - |
Net asset value, end of period | $ 130.70 | $ 104.11 | $ 101.57 | $ 102.37 | $ 72.24 |
Total Return A | 36.20% | 2.50% | (.78)% | 41.71% | 94.61% |
Ratios to Average Net Assets C, E |
|
|
|
|
|
Expenses before reductions | .80% | .81% | .82% | .85% | .92% |
Expenses net of fee waivers, if any | .80% | .81% | .82% | .85% | .92% |
Expenses net of all reductions | .77% | .79% | .81% | .83% | .89% |
Net investment income (loss) | .05% | .01% | (.29)% | (.44)% | (.21)% |
Supplemental Data |
|
|
|
|
|
Net assets, end of period (000 omitted) | $ 2,411,391 | $ 2,028,324 | $ 2,349,926 | $ 2,885,820 | $ 1,994,894 |
Portfolio turnover rate D | 181% | 140% | 196% | 136% | 127% |
A Total returns would have been lower if certain expenses had not been reduced during the applicable periods shown.
B Calculated based on average shares outstanding during the period.
C Fees and expenses of any underlying Fidelity Central Funds are not included in the Fund's expense ratio. The Fund indirectly bears its proportionate share of the expenses of any underlying Fidelity Central Funds.
D Amount does not include the portfolio activity of any underlying Fidelity Central Funds.
E Expense ratios reflect operating expenses of the Fund. Expenses before reductions do not reflect amounts reimbursed by the investment adviser or reductions from brokerage service arrangements or reductions from other expense offset arrangements and do not represent the amount paid by the Fund during periods when reimbursements or reductions occur. Expenses net of fee waivers reflect expenses after reimbursement by the investment adviser but prior to reductions from brokerage service arrangements or other expense offset arrangements. Expenses net of all reductions represent the net expenses paid by the Fund.
F For the year ended February 29.
G Amount represents less than $.01 per share.
H The amounts shown reflect certain reclassifications related to book to tax differences that were made in the year shown.
See accompanying notes which are an integral part of the financial statements.
Annual Report
Notes to Financial Statements
For the period ended February 28, 2014
1. Organization.
Communications Equipment Portfolio, Computers Portfolio, Electronics Portfolio, IT Services Portfolio, Software and Computer Services Portfolio and Technology Portfolio (the Funds) are non-diversified funds of Fidelity Select Portfolios (the Trust). The Trust is registered under the Investment Company Act of 1940, as amended (the 1940 Act), as an open-end management investment company organized as a Massachusetts business trust. The Funds invest primarily in securities of companies whose principal business activities fall within specific industries. Each Fund is authorized to issue an unlimited number of shares. Certain Funds' investments in emerging markets can be subject to social, economic, regulatory, and political uncertainties and can be extremely volatile.
2. Investments in Fidelity Central Funds.
The Funds invest in Fidelity Central Funds, which are open-end investment companies generally available only to other investment companies and accounts managed by the investment adviser and its affiliates. The Funds' Schedules of Investments list each of the Fidelity Central Funds held as of period end, if any, as an investment of each Fund, but do not include the underlying holdings of each Fidelity Central Fund. As an Investing Fund, each Fund indirectly bears its proportionate share of the expenses of the underlying Fidelity Central Funds.
The Money Market Central Funds seek preservation of capital and current income and are managed by Fidelity Investments Money Management, Inc. (FIMM), an affiliate of the investment adviser. Annualized expenses of the Money Market Central Funds as of their most recent shareholder report date are less than .01%.
A complete unaudited list of holdings for each Fidelity Central Fund is available upon request or at the Securities and Exchange Commission (the SEC) website at www.sec.gov. In addition, the financial statements of the Fidelity Central Funds, which are not covered by the Funds' Report of Independent Registered Public Accounting Firm, are available on the SEC website or upon request.
3. Significant Accounting Policies.
The financial statements have been prepared in conformity with accounting principles generally accepted in the United States of America (GAAP), which require management to make certain estimates and assumptions at the date of the financial statements. Actual results could differ from those estimates. Subsequent events, if any, through the date that the financial statements were issued have been evaluated in the preparation of the financial statements. The following summarizes the significant accounting policies of the Funds:
Investment Valuation. Investments are valued as of 4:00 p.m. Eastern time on the last calendar day of the period. In accordance with valuation policies and procedures approved by the Board of Trustees (the Board), each Fund attempts to obtain prices from one or more third party pricing vendors or brokers to value its investments. When current market prices, quotations or currency exchange rates are not readily available or reliable, investments will be fair valued in good faith by the Fidelity SelectCo, LLC (SelectCo) Fair Value Committee (the Committee), in accordance with procedures adopted by the Board. Factors used in determining fair value vary by investment type and may include market or investment specific events. The frequency with which these procedures are used cannot be predicted and they may be utilized to a significant extent. The Committee oversees each Fund's valuation policies and procedures and is responsible for approving and reporting to the Board all fair value determinations.
Each Fund categorizes the inputs to valuation techniques used to value their investments into a disclosure hierarchy consisting of three levels as shown below:
Level 1 - quoted prices in active markets for identical investments
Level 2 - other significant observable inputs (including quoted prices for similar investments, interest rates, prepayment speeds, etc.)
Level 3 - unobservable inputs (including the Fund's own assumptions based on the best information available)
Valuation techniques used to value each Fund's investments by major category are as follows:
Equity securities, including restricted securities, for which market quotations are readily available, are valued at the last reported sale price or official closing price as reported by a third party pricing vendor on the primary market or exchange on which they are traded and are categorized as Level 1 in the hierarchy. In the event there were no sales during the day or closing prices are not available, securities are valued at the last quoted bid price or may be valued using the last available price and are generally categorized as Level 2 in the hierarchy. For foreign equity securities, when market or security specific events arise, comparisons to the valuation of American Depositary Receipts (ADRs), futures contracts, Exchange-Traded Funds (ETFs) and certain indexes as well as quoted prices for similar securities may be used and would be categorized as Level 2 in the hierarchy. Utilizing these techniques may result in transfers between Level 1 and Level 2. For equity securities, including restricted securities, where observable inputs are limited, assumptions about market activity and risk are used and these securities may be categorized as Level 3 in the hierarchy.
Investments in open-end mutual funds, including the Fidelity Central Funds, are valued at their closing net asset value (NAV) each business day and are categorized as Level 1 in the hierarchy.
Annual Report
Notes to Financial Statements - continued
3. Significant Accounting Policies - continued
Investment Valuation - continued
Changes in valuation techniques may result in transfers in or out of an assigned level within the disclosure hierarchy. The aggregate value of investments by input level, as of February 28, 2014, including information on transfers between Levels 1 and 2, is included at the end of each applicable Fund's Schedule of Investments.
Foreign Currency. The Funds may use foreign currency contracts to facilitate transactions in foreign-denominated securities. Gains and losses from these transactions may arise from changes in the value of the foreign currency or if the counterparties do not perform under the contracts' terms.
Foreign-denominated assets, including investment securities, and liabilities are translated into U.S. dollars at the exchange rates at period end. Purchases and sales of investment securities, income and dividends received and expenses denominated in foreign currencies are translated into U.S. dollars at the exchange rate in effect on the transaction date.
The effects of exchange rate fluctuations on investments are included with the net realized and unrealized gain (loss) on investment securities. Other foreign currency transactions resulting in realized and unrealized gain (loss) are disclosed separately.
Investment Transactions and Income. For financial reporting purposes, the Funds' investment holdings and NAV include trades executed through the end of the last business day of the period. The NAV per share for processing shareholder transactions is calculated as of the close of business of the New York Stock Exchange (NYSE), normally 4:00 p.m. Eastern time and includes trades executed through the end of the prior business day. Gains and losses on securities sold are determined on the basis of identified cost and may include proceeds received from litigation. Dividend income is recorded on the ex-dividend date, except for certain dividends from foreign securities where the ex-dividend date may have passed, which are recorded as soon as the Funds are informed of the ex-dividend date. Non-cash dividends included in dividend income, if any, are recorded at the fair market value of the securities received. Distributions received on securities that represent a return of capital or capital gain are recorded as a reduction of cost of investments and/or as a realized gain. Subsequent to ex-dividend date the Funds determine the components of these distributions, based upon receipt of tax filings or other correspondence relating to the underlying investment. Interest income and distributions from the Fidelity Central Funds are accrued as earned. Interest income includes coupon interest and amortization of premium and accretion of discount on debt securities. Investment income is recorded net of foreign taxes withheld where recovery of such taxes is uncertain.
Expenses. Expenses directly attributable to a fund are charged to that fund. Expenses attributable to more than one fund are allocated among the respective funds on the basis of relative net assets or other appropriate methods. Expense estimates are accrued in the period to which they relate and adjustments are made when actual amounts are known.
Deferred Trustee Compensation. Under a Deferred Compensation Plan (the Plan) for Computers Portfolio, Electronics Portfolio, Software and Computer Services Portfolio and Technology Portfolio, independent Trustees may elect to defer receipt of a portion of their annual compensation. Deferred amounts are invested in a cross-section of Fidelity funds, are marked-to-market and remain in the Fund until distributed in accordance with the Plan. The investment of deferred amounts and the offsetting payable to the Trustees are included in the accompanying Statement of Assets and Liabilities.
Income Tax Information and Distributions to Shareholders. Each year, each Fund intends to qualify as a regulated investment company under Subchapter M of the Internal Revenue Code, including distributing substantially all of its taxable income and realized gains. As a result, no provision for U.S. Federal income taxes is required. As of February 28, 2014, each Fund did not have any unrecognized tax benefits in the financial statements; nor is each Fund aware of any tax positions for which it is reasonably possible that the total amounts of unrecognized tax benefits will significantly change in the next twelve months. Each Fund files a U.S. federal tax return, in addition to state and local tax returns as required. The Fund's federal income tax returns are subject to examination by the Internal Revenue Service (IRS) for a period of three fiscal years after they are filed. State and local tax returns may be subject to examination for an additional fiscal year depending on the jurisdiction. Foreign taxes are provided for based on each Fund's understanding of the tax rules and rates that exist in the foreign markets in which it invests.
Distributions are declared and recorded on the ex-dividend date. Income and capital gain distributions are determined in accordance with income tax regulations, which may differ from GAAP. These differences resulted in distribution reclassifications for Technology Portfolio and Software and Computer Services Portfolio for the periods ended February 28, 2014 and February 28, 2013, respectively. In addition, certain Funds claimed a portion of the payment made to redeeming shareholders as a distribution for income tax purposes.
Capital accounts within the financial statements are adjusted for permanent book-tax differences. These adjustments have no impact on net assets or the results of operations. Capital accounts are not adjusted for temporary book-tax differences which will reverse in a subsequent period.
Book-tax differences are primarily due to foreign currency transactions, passive foreign investment companies (PFIC), market discount, deferred trustees compensation, net operating losses, capital loss carryforwards and losses deferred due to wash sales and excise tax regulations.
Annual Report
3. Significant Accounting Policies - continued
Income Tax Information and Distributions to Shareholders - continued
The federal tax cost of investment securities and unrealized appreciation (depreciation) as of period end were as follows for each Fund:
| Tax cost | Gross unrealized | Gross unrealized | Net unrealized |
Communications Equipment Portfolio | $ 335,901,492 | $ 41,347,442 | $ (15,662,098) | $ 25,685,344 |
Computers Portfolio | 538,834,685 | 171,045,709 | (18,748,274) | 152,297,435 |
Electronics Portfolio | 1,332,904,649 | 97,298,307 | (99,926,136) | (2,627,829) |
IT Services Portfolio | 1,363,407,597 | 368,188,363 | (8,135,698) | 360,052,665 |
Software and Computer Services Portfolio | 2,787,193,191 | 1,141,688,506 | (33,592,953) | 1,108,095,553 |
Technology Portfolio | 1,943,317,906 | 537,949,595 | (37,811,859) | 500,137,736 |
The tax-based components of distributable earnings as of period end were as follows for each Fund:
| Undistributed | Undistributed long-term | Capital loss | Net unrealized appreciation |
Communications Equipment Portfolio | $ 34,338 | $ 249,421 | $ (3,485,780) | $ 25,685,725 |
Computers Portfolio | 1,190,487 | - | (4,007,747) | 152,215,631 |
Electronics Portfolio | 1,133,095 | - | (110,071,654) | (2,630,880) |
IT Services Portfolio | 4,024,460 | 1,534,476 | - | 360,046,960 |
Software and Computer Services Portfolio | 44,722,467 | 59,116,553 | - | 1,108,028,123 |
Technology Portfolio | 59,042,767 | 127,466,377 | - | 500,136,130 |
Capital loss carryforwards are only available to offset future capital gains of the Funds to the extent provided by regulations and may be limited. Under the Regulated Investment Company Modernization Act of 2010 (the Act), the Funds are permitted to carry forward capital losses incurred in taxable years beginning after December 22, 2010 for an unlimited period and such capital losses are required to be used prior to any losses that expire. The capital loss carryforward information presented below, including any applicable limitation, is estimated as of fiscal period end and is subject to adjustment.
| Fiscal year of expiration |
| |
| 2017 | 2018 | Total with |
Communications Equipment Portfolio | $ (3,485,780) | $ - | $ (3,485,780) |
Electronics Portfolio | (38,992,524) | (71,079,130) | (110,071,654) |
| No expiration |
|
| Long-term | Total capital loss |
|
|
|
Communications Equipment Portfolio | $ - | $ (3,485,780) |
Computers Portfolio | (4,007,747) | (4,007,747) |
Electronics Portfolio | - | (110,071,654) |
The tax character of distributions paid was as follows:
February 28, 2014 |
| ||
| Ordinary Income | Long-term | Total |
Communications Equipment Portfolio | $ 1,754,259 | $ - | $ 1,754,259 |
Computers Portfolio | 5,025,394 | 50,138,396 | 55,163,790 |
Electronics Portfolio | 5,979,331 | - | 5,979,331 |
IT Services Portfolio | 22,708,765 | 14,483,551 | 37,192,316 |
Software and Computer Services Portfolio | 61,190,649 | 89,540,068 | 150,730,717 |
Technology Portfolio | 79,249,202 | 90,003,037 | 169,252,239 |
Annual Report
Notes to Financial Statements - continued
3. Significant Accounting Policies - continued
Income Tax Information and Distributions to Shareholders - continued
February 28, 2013 |
|
|
|
|
| Ordinary Income | Long-term | Tax Return | Total |
Communications Equipment Portfolio | $ 1,920,292 | $ - | $ 253,959 | $ 2,174,251 |
Computers Portfolio | 1,409,664 | - | - | 1,409,664 |
Electronics Portfolio | 2,800,318 | - | - | 2,800,318 |
IT Services Portfolio | - | 4,164,408 | - | 4,164,408 |
Software and Computer Services Portfolio | 112,068,547 | 79,815,406 | - | 191,883,953 |
Trading (Redemption) Fees. Shares held by investors in the Funds less than 30 days may be subject to a redemption fee equal to .75% of the NAV of shares redeemed. All redemption fees, which reduce the proceeds of the shareholder redemption, are retained by the Funds and accounted for as an addition to paid in capital.
Restricted Securities. The Funds may invest in securities that are subject to legal or contractual restrictions on resale. These securities generally may be resold in transactions exempt from registration or to the public if the securities are registered. Disposal of these securities may involve time-consuming negotiations and expense, and prompt sale at an acceptable price may be difficult. Information regarding restricted securities is included at the end of each applicable Fund's Schedule of Investments.
4. Purchases and Sales of Investments.
Purchases and sales of securities, other than short-term securities, are noted in the table below.
| Purchases ($) | Sales ($) |
Communications Equipment Portfolio | 184,672,173 | 214,821,722 |
Computers Portfolio | 235,173,347 | 388,572,519 |
Electronics Portfolio | 1,750,009,642 | 1,765,538,857 |
IT Services Portfolio | 1,579,748,018 | 713,143,850 |
Software and Computer Services Portfolio | 3,000,442,595 | 2,342,631,340 |
Technology Portfolio | 3,723,017,760 | 4,085,348,861 |
5. Fees and Other Transactions with Affiliates.
Management Fee. Effective August 1, 2013, SelectCo replaced Fidelity Management and Research Company (FMR), an affiliate of SelectCo, as investment adviser to the Funds. The investment adviser and its affiliates provide the Funds with investment management related services for which the Funds pay a monthly management fee. The management fee is the sum of an individual fund fee rate and an annualized group fee rate. The individual fund fee rate is applied to each Fund's average net assets. The group fee rate is based upon the average net assets of all the mutual funds advised by FMR and the investment adviser. The group fee rate decreases as assets under management increase and increases as assets under management decrease. For the reporting period, each Fund's annual management fee rate expressed as a percentage of each Fund's average net assets was as follows:
| Individual Rate | Group Rate | Total |
Communications Equipment Portfolio | .30% | .25% | .55% |
Computers Portfolio | .30% | .25% | .55% |
Electronics Portfolio | .30% | .25% | .55% |
IT Services Portfolio | .30% | .25% | .55% |
Software and Computer Services Portfolio | .30% | .25% | .55% |
Technology Portfolio | .30% | .25% | .55% |
Transfer Agent Fees. Fidelity Investments Institutional Operations Company, Inc. (FIIOC), an affiliate of the investment adviser, is the Funds' transfer, dividend disbursing and shareholder servicing agent. FIIOC receives account fees and asset-based fees that vary according to account size and type of account. FIIOC pays for typesetting, printing and mailing of shareholder reports, except proxy statements. For the period, transfer agent fees were equivalent to the following annual rates expressed as a percentage of average net assets:
Communications Equipment Portfolio | .26% |
Computers Portfolio | .21% |
Electronics Portfolio | .21% |
IT Services Portfolio | .21% |
Software and Computer Services Portfolio | .19% |
Technology Portfolio | .19% |
Annual Report
5. Fees and Other Transactions with Affiliates - continued
Accounting and Security Lending Fees. Fidelity Service Company, Inc. (FSC), an affiliate of the investment adviser, maintains each Fund's accounting records. The accounting fee is based on the level of average net assets for each month. Under a separate contract, FSC administers the security lending program. The security lending fee is based on the number and duration of lending transactions.
Brokerage Commissions. Certain Funds placed a portion of their portfolio transactions with brokerage firms which are affiliates of the investment adviser. Brokerage commissions are included in net realized gain (loss) and change in net unrealized appreciation (depreciation) in the Statement of Operations. The commissions paid to these affiliated firms were as follows:
|
Amount |
Communications Equipment Portfolio | $ 13,970 |
Computers Portfolio | 18,761 |
Electronics Portfolio | 183,059 |
IT Services Portfolio | 30,677 |
Software and Computer Services Portfolio | 82,740 |
Technology Portfolio | 94,569 |
Interfund Lending Program. Pursuant to an Exemptive Order issued by the SEC, the Funds, along with other registered investment companies having management contracts with FMR or other affiliated entities of FMR, may participate in an interfund lending program. This program provides an alternative credit facility allowing the funds to borrow from, or lend money to, other participating affiliated funds. At period end, Communications Equipment Portfolio, Computers Portfolio, Electronics Portfolio, Software and Computer Services Portfolio and Technology Portfolio had no interfund loans outstanding. Each applicable fund's activity in this program during the period for which loans were outstanding was as follows:
| Borrower or | Average Loan Balance | Weighted | Interest Expense |
Communications Equipment Portfolio | Borrower | $ 12,619,750 | .31% | $ 864 |
Computers Portfolio | Borrower | 10,159,345 | .30% | 2,462 |
Electronics Portfolio | Borrower | 5,609,000 | .32% | 49 |
IT Services Portfolio | Borrower | 9,898,650 | .30% | 1,624 |
Software and Computer Services Portfolio | Borrower | 9,635,800 | .32% | 2,565 |
Technology Portfolio | Borrower | 10,793,958 | .31% | 2,250 |
6. Committed Line of Credit.
Certain Funds participate with other funds managed by the investment adviser or an affiliate in a $4.25 billion credit facility (the "line of credit") to be utilized for temporary or emergency purposes to fund shareholder redemptions or for other short-term liquidity purposes. The participating funds have agreed to pay commitment fees on their pro-rata portion of the line of credit, which are reflected in Miscellaneous expenses on the Statement of Operations, and are as follows:
Communications Equipment Portfolio | $ 593 |
Computers Portfolio | 1,371 |
Electronics Portfolio | 1,872 |
IT Services Portfolio | 1,431 |
Software and Computer Services Portfolio | 4,708 |
Technology Portfolio | 4,143 |
During the period, there were no borrowings on this line of credit.
7. Security Lending.
Certain Funds lend portfolio securities through a lending agent from time to time in order to earn additional income. For equity securities, a lending agent is used and may loan securities to certain qualified borrowers, which prior to August 1, 2013 included Fidelity Capital Markets (FCM), a broker-dealer affiliated with the Funds. On the settlement date of the loan, each applicable Fund receives collateral (in the form of U.S. Treasury obligations,
Annual Report
Notes to Financial Statements - continued
7. Security Lending - continued
letters of credit and/or cash) against the loaned securities and maintains collateral in an amount not less than 100% of the market value of the loaned securities during the period of the loan. The market value of the loaned securities is determined at the close of business of the Funds and any additional required collateral is delivered to the Funds on the next business day. If the borrower defaults on its obligation to return the securities loaned because of insolvency or other reasons, the Funds may apply collateral received from the borrower against the obligation. The Funds may experience delays and costs in recovering the securities loaned. Any cash collateral received is invested in the Fidelity Securities Lending Cash Central Fund. The value of loaned securities and cash collateral at period end are disclosed on each applicable Fund's Statement of Assets and Liabilities. At period end, there were no security loans outstanding with FCM. Security lending income represents the income earned on investing cash collateral, less rebates paid to borrowers and any lending agent fees associated with the loan, plus any premium payments received for lending certain types of securities. Security lending income is presented on each applicable Fund's Statement of Operations as a component of income from Fidelity Central Funds. FCM security lending activity was as follows:
| Security Lending |
Communications Equipment Portfolio | $ 5,939 |
Computers Portfolio | 2,237 |
Electronics Portfolio | 4,065 |
IT Services Portfolio | 967 |
Software and Computer Services Portfolio | 7,792 |
Technology Portfolio | 3,831 |
8. Bank Borrowings.
Each Fund is permitted to have bank borrowings for temporary or emergency purposes to fund shareholder redemptions or for other short-term liquidity requirements. Each Fund has established borrowing arrangements with certain banks. The interest rate on the borrowings is the bank's base rate, as revised from time to time. At period end, there were no bank borrowings outstanding. Each applicable Fund's activity in this program during the period for which loans were outstanding was as follows:
| Average Loan | Weighted | Interest Expense |
Communications Equipment Portfolio | $ 10,788,500 | .58% | $ 695 |
Computers Portfolio | 8,979,308 | .58% | 1,885 |
9. Expense Reductions.
Commissions paid to certain brokers with whom the investment adviser, or its affiliates, places trades on behalf of Certain Funds include an amount in addition to trade execution, which may be rebated back to the Funds to offset certain expenses. In addition, through arrangements with each applicable Fund's custodian, credits realized as a result of uninvested cash balances were used to reduce each applicable Fund's expenses. All of the applicable expense reductions are noted in the table below.
| Brokerage | Custody |
|
|
|
Communications Equipment Portfolio | $ 31,967 | $ 11 |
Computers Portfolio | 25,194 | 2 |
Electronics Portfolio | 275,790 | 18 |
IT Services Portfolio | 44,918 | - |
Software and Computer Services Portfolio | 233,915 | - |
Technology Portfolio | 595,125 | 162 |
Annual Report
9. Expense Reductions - continued
In addition, FMR reimbursed a portion of each Fund's operating expenses during the period as follows:
| Reimbursement |
Communications Equipment Portfolio | $ 3,790 |
Computers Portfolio | 5,584 |
Electronics Portfolio | 14,164 |
IT Services Portfolio | 2,222 |
Software and Computer Services Portfolio | 12,607 |
Technology Portfolio | 19,178 |
10. Other.
The Funds' organizational documents provide former and current trustees and officers with a limited indemnification against liabilities arising in connection with the performance of their duties to the Funds. In the normal course of business, the Funds may also enter into contracts that provide general indemnifications. The Funds' maximum exposure under these arrangements is unknown as this would be dependent on future claims that may be made against the Funds. The risk of material loss from such claims is considered remote.
At the end of the period, Strategic Advisers U.S. Opportunity Fund was the owner of record of approximately 18% of the total outstanding shares of Communications Equipment Portfolio. VIP FundsManager 60% Portfolio was the owner of record of approximately 14% of the total outstanding shares of Computers Portfolio. Mutual funds managed by the investment adviser or its affiliates were the owners of record, in the aggregate, of approximately 30%, 27% and 20% of the total outstanding shares of Communications Equipment Portfolio, Computers Portfolio and Software and Computer Services Portfolio, respectively.
Annual Report
Report of Independent Registered Public Accounting Firm
To the Trustees of Fidelity Select Portfolios and the Shareholders of Communications Equipment Portfolio, Computers Portfolio, Electronics Portfolio, IT Services Portfolio, Software and Computer Services Portfolio and Technology Portfolio:
In our opinion, the accompanying statements of assets and liabilities, including the schedules of investments, and the related statements of operations and of changes in net assets and the financial highlights present fairly, in all material respects, the financial positions of Communications Equipment Portfolio, Computers Portfolio, Electronics Portfolio, IT Services Portfolio, Software and Computer Services Portfolio and Technology Portfolio (funds of Fidelity Select Portfolios) at February 28, 2014, the results of each of their operations for the year then ended, the changes in each of their net assets for each of the two years in the period then ended and the financial highlights for each of the five years in the period then ended, in conformity with accounting principles generally accepted in the United States of America. These financial statements and financial highlights (hereafter referred to as "financial statements") are the responsibility of the Fidelity Select Portfolios' management. Our responsibility is to express an opinion on these financial statements based on our audits. We conducted our audits of these financial statements in accordance with the standards of the Public Company Accounting Oversight Board (United States). Those standards require that we plan and perform the audit to obtain reasonable assurance about whether the financial statements are free of material misstatement. An audit includes examining, on a test basis, evidence supporting the amounts and disclosures in the financial statements, assessing the accounting principles used and significant estimates made by management, and evaluating the overall financial statement presentation. We believe that our audits, which included confirmation of securities at February 28, 2014 by correspondence with the custodian and brokers, provide a reasonable basis for our opinion.
PricewaterhouseCoopers LLP
Boston, Massachusetts
April 16, 2014
Annual Report
Trustees and Officers
The Trustees and officers of the trust and funds, as applicable, are listed below. The Board of Trustees governs each fund and is responsible for protecting the interests of shareholders. The Trustees are experienced executives who meet periodically throughout the year to oversee each fund's activities, review contractual arrangements with companies that provide services to each fund, oversee management of the risks associated with such activities and contractual arrangements, and review each fund's performance. Except for Ned C. Lautenbach and William S. Stavropoulos, each of the Trustees oversees 74 funds. Mr. Lautenbach and Mr. Stavropoulos each oversees 246 funds.
The Trustees hold office without limit in time except that (a) any Trustee may resign; (b) any Trustee may be removed by written instrument, signed by at least two-thirds of the number of Trustees prior to such removal; (c) any Trustee who requests to be retired or who has become incapacitated by illness or injury may be retired by written instrument signed by a majority of the other Trustees; and (d) any Trustee may be removed at any special meeting of shareholders by a two-thirds vote of the outstanding voting securities of the trust. The officers hold office without limit in time, except that any officer may resign or may be removed by a vote of a majority of the Trustees at any regular meeting or any special meeting of the Trustees. Except as indicated, each individual has held the office shown or other offices in the same company for the past five years.
Experience, Skills, Attributes, and Qualifications of the Funds' Trustees. The Governance and Nominating Committee has adopted a statement of policy that describes the experience, qualifications, attributes, and skills that are necessary and desirable for potential Independent Trustee candidates (Statement of Policy). The Board believes that each Trustee satisfied at the time he or she was initially elected or appointed a Trustee, and continues to satisfy, the standards contemplated by the Statement of Policy. The Governance and Nominating Committee also engages professional search firms to help identify potential Independent Trustee candidates who have the experience, qualifications, attributes, and skills consistent with the Statement of Policy. From time to time, additional criteria based on the composition and skills of the current Independent Trustees, as well as experience or skills that may be appropriate in light of future changes to board composition, business conditions, and regulatory or other developments, have also been considered by the professional search firms and the Governance and Nominating Committee. In addition, the Board takes into account the Trustees' commitment and participation in Board and committee meetings, as well as their leadership of standing and ad hoc committees throughout their tenure.
In determining that a particular Trustee was and continues to be qualified to serve as a Trustee, the Board has considered a variety of criteria, none of which, in isolation, was controlling. The Board believes that, collectively, the Trustees have balanced and diverse experience, qualifications, attributes, and skills, which allow the Board to operate effectively in governing each fund and protecting the interests of shareholders. Information about the specific experience, skills, attributes, and qualifications of each Trustee, which in each case led to the Board's conclusion that the Trustee should serve (or continue to serve) as a trustee of the funds, is provided below.
Board Structure and Oversight Function. Brian B. Hogan is an interested person (as defined in the 1940 Act) and currently serves as Chairman. The Trustees have determined that an interested Chairman is appropriate and benefits shareholders because an interested Chairman has a personal and professional stake in the quality and continuity of services provided to the funds. Independent Trustees exercise their informed business judgment to appoint an individual of their choosing to serve as Chairman, regardless of whether the Trustee happens to be independent or a member of management. The Independent Trustees have determined that they can act independently and effectively without having an Independent Trustee serve as Chairman and that a key structural component for assuring that they are in a position to do so is for the Independent Trustees to constitute a substantial majority for the Board. The Independent Trustees also regularly meet in executive session. Michael E. Wiley serves as Chairman of the Independent Trustees and as such (i) acts as a liaison between the Independent Trustees and management with respect to matters important to the Independent Trustees and (ii) with management prepares agendas for Board meetings.
Fidelity funds are overseen by different Boards of Trustees. The funds' Board oversees Fidelity's sector portfolios. Other Boards oversee Fidelity's equity and high income funds, and Fidelity's investment grade bond, money market, and asset allocation funds. The use of separate Boards, each with its own committee structure, allows the Trustees of each group of Fidelity funds to focus on the unique issues of the funds they oversee, including common research, investment, and operational issues. On occasion, the separate Boards establish joint committees to address issues of overlapping consequences for the Fidelity funds overseen by each Board.
The Trustees operate using a system of committees to facilitate the timely and efficient consideration of all matters of importance to the Trustees, each fund, and fund shareholders and to facilitate compliance with legal and regulatory requirements and oversight of the funds' activities and associated risks. The Board, acting through its committees, has charged SelectCo and its affiliates with (i) identifying events or circumstances the occurrence of which could have demonstrably adverse effects on the funds' business and/or reputation; (ii) implementing processes and controls to lessen the possibility that such events or circumstances occur or to mitigate the effects of such events or circumstances if they do occur; and (iii) creating and maintaining a system designed to evaluate continuously business and market conditions in order to facilitate the identification and implementation processes described in (i) and (ii) above. Because the day-to-day operations and activities of the funds are carried out by or through SelectCo, its affiliates, and other service providers, the funds' exposure to risks is mitigated but not eliminated by the processes overseen by the Trustees. While each of the Board's committees has responsibility for overseeing different aspects of the funds' activities, oversight is exercised primarily through the Operations and Audit Committees. Appropriate personnel, including but not limited to the funds' Chief Compliance Officer (CCO), SelectCo's internal auditor, the independent accountants, the funds' Treasurer and portfolio management personnel, make periodic reports to the Board's committees, as appropriate. The responsibilities of each standing committee, including their oversight responsibilities, are described further under "Standing Committees of the Funds' Trustees."
The funds' Statement of Additional Information (SAI) includes more information about the Trustees. To request a free copy, call Fidelity at 1-800-544-8544.
Annual Report
Interested Trustee*:
Correspondence intended for the Trustee who is an interested person may be sent to Fidelity Investments, 245 Summer Street, Boston, Massachusetts 02210.
Name, Year of Birth; Principal Occupations and Other Relevant Experience+ | |
Brian B. Hogan (1964) | |
Year of Election or Appointment: 2014 Trustee Chairman of the Board of Trustees | |
| Mr. Hogan also serves as Trustee or Vice President of other funds. Mr. Hogan serves as President of FMR's Equity Division (2009-present). Previously, Mr. Hogan served as Senior Vice President, Equity Research of FMR (2006-2009) and as a portfolio manager. |
* Trustee has been determined to be an "Interested Trustee" by virtue of, among other things, his affiliation with the trust or various entities under common control with SelectCo.
+ The information above includes the Trustee's principal occupation during the last five years and other information relating to the experience, attributes, and skills relevant to the Trustee's qualifications to serve as a Trustee, which led to the conclusion that the Trustee should serve as a Trustee for each fund.
Independent Trustees:
Correspondence intended for each Independent Trustee (that is, the Trustees other than the Interested Trustee) may be sent to Fidelity Investments, P.O. Box 55235, Boston, Massachusetts 02205-5235.
Name, Year of Birth; Principal Occupations and Other Relevant Experience+ | |
Ned C. Lautenbach (1944) | |
Year of Election or Appointment: 2000 Trustee | |
| Mr. Lautenbach also serves as Trustee of other Fidelity funds. Mr. Lautenbach currently serves as the Lead Director of the Eaton Corporation Board of Directors (diversified industrial, 1997-present). Mr. Lautenbach is Chairman of the Board of Directors of the Philharmonic Center for the Arts in Naples, Florida (2012-present) and a member of the Council on Foreign Relations (1994-present). Previously, Mr. Lautenbach was a Partner/Advisory Partner at Clayton, Dubilier & Rice, LLC (private equity investment, 1998-2010), as well as a Director of Sony Corporation (2006-2007). |
David A. Rosow (1942) | |
Year of Election or Appointment: 2013 Trustee | |
| Mr. Rosow also serves as Trustee of other Fidelity funds. Mr. Rosow is Chairman and Chief Executive Officer of International Golf Group, Inc. (golf course development, 1989-present). Previously, Mr. Rosow served as Chairman and Chief Executive Officer of Rosow & Company, Inc. (private investment company, 1989-2011), a Lead Director of Hudson United Bancorp (2001-2006) and as a Director of TD Banknorth (1996-2006). In addition, Mr. Rosow is a member (2008-present) and President (2009-present) of the Town Council of Palm Beach, Florida. Mr. Rosow served as a Member of the Advisory Board of other Fidelity funds (2012-2013). |
Garnett A. Smith (1947) | |
Year of Election or Appointment: 2013 Trustee | |
| Mr. Smith also serves as Trustee of other Fidelity funds. Prior to Mr. Smith's retirement, he served as Chairman and Chief Executive Officer of Inbrand Corp. (manufacturer of personal absorbent products, 1990-1997). He also served as President (1986-1990) of Inbrand Corp. Prior to his employment with Inbrand Corp., he was employed by a retail fabric chain and North Carolina National Bank. In addition, Mr. Smith is a board member of the Jackson Hole Land Trust (2009-present). Mr. Smith served as a Member of the Advisory Board of other Fidelity funds (2012-2013). |
William S. Stavropoulos (1939) | |
Year of Election or Appointment: 2001 Trustee | |
| Mr. Stavropoulos also serves as Trustee of other Fidelity funds. Mr. Stavropoulos serves as President and Founder of the Michigan Baseball Foundation, the Great Lakes Loons (2007-present). Mr. Stavropoulos is Chairman Emeritus of the Board of Directors of The Dow Chemical Company, where he previously served in numerous senior management positions, including President, CEO (1995-2000; 2002-2004), Chairman of the Executive Committee (2000-2006), and as a member of the Board of Directors (1990-2006). Currently, Mr. Stavropoulos is Chairman of the Board of Directors of Univar Inc. (global distributor of commodity and specialty chemicals), a Director of Teradata Corporation (data warehousing and technology solutions), and Maersk Inc. (industrial conglomerate), and a member of the Advisory Board for Metalmark Capital LLC (private equity investment, 2005-present). Mr. Stavropoulos is an operating advisor to Clayton, Dubilier & Rice, LLC (private equity investment). In addition, Mr. Stavropoulos is a member of the University of Notre Dame Advisory Council for the College of Science, a Trustee of the Rollin L. Gerstacker Foundation, and a Director of the Naples Philharmonic Center for the Arts. Previously, Mr. Stavropoulos served as a Director of Chemical Financial Corporation (bank holding company, 1993-2012) and Tyco International, Ltd. (multinational manufacturing and services, 2007-2012). |
Michael E. Wiley (1950) | |
Year of Election or Appointment: 2008 Trustee Chairman of the Independent Trustees | |
| Mr. Wiley also serves as Trustee of other Fidelity funds. Mr. Wiley serves as a Director of Asia Pacific Exploration Consolidated (international oil and gas exploration and production, 2008-present). Mr. Wiley serves as a Director of Tesoro Corporation (independent oil refiner and marketer, 2005-present), and a Director of Bill Barrett Corporation (exploration and production, 2005-present). In addition, Mr. Wiley also serves as a Director of Post Oak Bank (privately-held bank, 2004-present). Previously, Mr. Wiley served as a Trustee of other Fidelity funds (2008-2013), as a member of the Board of Trustees of the University of Tulsa (2000-2006; 2007-2010), as a Senior Energy Advisor of Katzenbach Partners, LLC (consulting, 2006-2007), as an Advisory Director of Riverstone Holdings (private investment), Chairman, President, and CEO of Baker Hughes, Inc. (oilfield services, 2000-2004), and as Director of Spinnaker Exploration Company (exploration and production, 2001-2005). |
+ The information above includes each Trustee's principal occupation during the last five years and other information relating to the experience, attributes, and skills relevant to each Trustee's qualifications to serve as a Trustee, which led to the conclusion that each Trustee should serve as a Trustee for each fund.
Officers:
Except for Anthony R. Rochte, correspondence intended for each officer may be sent to Fidelity Investments, 245 Summer Street, Boston, Massachusetts 02210. Correspondence intended for Mr. Rochte may be sent to SelectCo, 1225 17th Street, Denver, Colorado 80202-5541. Officers appear below in alphabetical order.
Name, Year of Birth; Principal Occupation | |
Christopher S. Bartel (1971) | |
Year of Election or Appointment: 2009 Vice President | |
| Mr. Bartel also serves as Vice President of other funds. Mr. Bartel serves as a Director, President, and Chief Executive Officer of Fidelity Management & Research (Japan) Inc. (2012-present), a Director of Fidelity Management & Research (Hong Kong) (2012-present), and Senior Vice President of Global Equity Research (2010-present). Previously, Mr. Bartel served as Senior Vice President of Equity Research (2009-2010), Managing Director of Research (2006-2009), and an analyst and portfolio manager (2000-2006). |
Elizabeth Paige Baumann (1968) | |
Year of Election or Appointment: 2012 Anti-Money Laundering (AML) Officer | |
| Ms. Baumann also serves as AML Officer of other funds. She is Chief AML Officer of FMR LLC (2012-present) and is an employee of Fidelity Investments. Previously, Ms. Baumann served as Vice President and Deputy Anti-Money Laundering Officer (2007-2012). |
Marc Bryant (1966) | |
Year of Election or Appointment: 2013 Secretary | |
| Mr. Bryant also serves as an officer of other funds. He is Senior Vice President and Deputy General Counsel of FMR LLC. Prior to joining Fidelity Investments, Mr. Bryant served as a Senior Vice President and the Head of Global Retail Legal for AllianceBernstein L.P. (2006-2010), and as the General Counsel for ProFund Advisors LLC (2001-2006). |
William C. Coffey (1969) | |
Year of Election or Appointment: 2009 Assistant Secretary | |
| Mr. Coffey also serves as Assistant Secretary of other funds. He is Senior Vice President and Deputy General Counsel of FMR LLC (2010-present), and is an employee of Fidelity Investments. Previously, Mr. Coffey served as Vice President and Associate General Counsel of FMR LLC (2005-2009). |
Jonathan Davis (1968) | |
Year of Election or Appointment: 2010 Assistant Treasurer | |
| Mr. Davis also serves as Assistant Treasurer of other funds. Mr. Davis is an employee of Fidelity Investments. Previously, Mr. Davis served as Vice President and Associate General Counsel of FMR LLC (2003-2010). |
Adrien E. Deberghes (1967) | |
Year of Election or Appointment: 2013 President and Treasurer | |
| Mr. Deberghes also serves as an officer of other funds. He is an employee of Fidelity Investments (2008-present). Prior to joining Fidelity Investments, Mr. Deberghes was Senior Vice President of Mutual Fund Administration at State Street Corporation (2007-2008), Senior Director of Mutual Fund Administration at Investors Bank & Trust (2005-2007), and Director of Finance for Dunkin' Brands (2000-2005). |
Stephanie J. Dorsey (1969) | |
Year of Election or Appointment: 2010 Assistant Treasurer | |
| Ms. Dorsey also serves as an officer of other funds. She is an employee of Fidelity Investments (2008-present) and has served in other fund officer roles. Prior to joining Fidelity Investments, Ms. Dorsey served as Treasurer (2004-2008) of the JPMorgan Mutual Funds and Vice President (2004-2008) of JPMorgan Chase Bank. |
Joseph A. Hanlon (1968) | |
Year of Election or Appointment: 2012 Chief Compliance Officer | |
| Mr. Hanlon also serves as Chief Compliance Officer of other funds. Mr. Hanlon serves as Compliance Officer of FMR, FMR Co., Inc., Fidelity Investments Money Management, Inc. (FIMM), Fidelity Research and Analysis Company (FRAC), and Fidelity Management & Research (Hong Kong) (2009-present), as Senior Vice President of the Fidelity Asset Management Division (2009-present), and is an employee of Fidelity Investments. Previously, Mr. Hanlon served as Compliance Officer of Fidelity Management & Research (Japan) Inc. (2009-2013), Strategic Advisers, Inc. (2009-2013), and Fidelity Management & Research (U.K.) Inc. (2009-2013). |
Brian B. Hogan (1964) | |
Year of Election or Appointment: 2009 Vice President | |
| Mr. Hogan also serves as Trustee or Vice President of other funds. Mr. Hogan serves as President of FMR's Equity Division (2009-present). Previously, Mr. Hogan served as Senior Vice President, Equity Research of FMR (2006-2009) and as a portfolio manager. |
Chris Maher (1972) | |
Year of Election or Appointment: 2013 Assistant Treasurer | |
| Mr. Maher serves as Assistant Treasurer of other funds. Mr. Maher is Vice President of Valuation Oversight and is an employee of Fidelity Investments. Previously, Mr. Maher served as Vice President of Asset Management Compliance (2013), Vice President of FMR's Program Management Group (2010-2013), and Vice President of Valuation Oversight (2008-2010). |
Christine Reynolds (1958) | |
Year of Election or Appointment: 2008 Chief Financial Officer | |
| Ms. Reynolds also serves as Chief Financial Officer of other funds. Ms. Reynolds became President of Fidelity Pricing and Cash Management Services (FPCMS) in August 2008. Ms. Reynolds served as Chief Operating Officer of FPCMS (2007-2008). Previously, Ms. Reynolds served as President, Treasurer, and Anti-Money Laundering officer of the Fidelity funds (2004-2007). |
Kenneth B. Robins (1969) | |
Year of Election or Appointment: 2013 Deputy Treasurer | |
| Mr. Robins also serves as an officer of other funds. Mr. Robins serves as Executive Vice President of Fidelity Investments Money Management, Inc. (FIMM) (2013-present) and is an employee of Fidelity Investments (2004-present). Previously, Mr. Robins served in other fund officer roles. |
Anthony R. Rochte (1968) | |
Year of Election or Appointment: 2013 Vice President | |
| Mr. Rochte also serves as Vice President of other funds. Mr. Rochte serves as President of Fidelity SelectCo, LLC (2012-present) and is an employee of Fidelity Investments (2012-present). Prior to joining Fidelity Investments, Mr. Rochte served as Senior Managing Director and head of State Street Global Advisors' North American Intermediary Business Group (2006-2012). |
Stacie M. Smith (1974) | |
Year of Election or Appointment: 2013 Assistant Treasurer | |
| Ms. Smith also serves as an officer of other funds. She is an employee of Fidelity Investments (2009-present) and has served in other fund officer roles. Prior to joining Fidelity Investments, Ms. Smith served as Senior Audit Manager of Ernst & Young LLP (1996-2009). |
Renee Stagnone (1975) | |
Year of Election or Appointment: 2013 Deputy Treasurer | |
| Ms. Stagnone also serves as Deputy Treasurer of other funds. Ms. Stagnone is an employee of Fidelity Investments. |
Joseph F. Zambello (1957) | |
Year of Election or Appointment: 2011 Deputy Treasurer | |
| Mr. Zambello also serves as Deputy Treasurer of other funds. Mr. Zambello is an employee of Fidelity Investments. Previously, Mr. Zambello served as Vice President of FMR's Program Management Group (2009-2011) and Vice President of the Transfer Agent Oversight Group (2005-2009). |
Annual Report
Distributions (Unaudited)
The Board of Trustees of each fund voted to pay to shareholders of record at the opening of business on record date the following distributions per share derived from capital gains realized from sales of portfolio securities and dividends derived from net investment income:
| Pay Date | Record Date | Dividends | Capital Gains |
Communications Equipment Portfolio | 04/14/14 | 04/11/14 | $0.004 | $0.0280 |
Computers Portfolio | 04/14/14 | 04/11/14 | $0.137 | $0.000 |
Electronics Portfolio | 04/14/14 | 04/11/14 | $0.054 | $0.000 |
IT Services Portfolio | 04/14/14 | 04/11/14 | $0.000 | $0.157 |
Software and Computer Services Portfolio | 04/14/14 | 04/11/14 | $0.000 | $3.353 |
Technology Portfolio | 04/14/14 | 04/11/14 | $0.000 | $10.036 |
The funds hereby designate as capital gain dividend the amounts noted below for the taxable year ended February 28, 2014, or, if subsequently determined to be different, the net capital gain of such year.
Communications Equipment Portfolio | $249,421 |
IT Services Portfolio | $13,539,734 |
Software and Computer Services Portfolio | $148,656,624 |
Technology Portfolio | $200,213,762 |
A percentage of the dividends distributed during the fiscal year for the following funds qualify for the dividends-received deduction for corporate shareholders:
| April 2013 | December 2013 |
Communications Equipment Portfolio | 0% | 100% |
Computers Portfolio | 100% | 100% |
Electronics Portfolio | 100% | 100% |
IT Services Portfolio | 0% | 17% |
Software and Computer Services Portfolio | 0% | 23% |
Technology Portfolio | 0% | 11% |
A percentage of the dividends distributed during the fiscal year for the following funds may be taken into account as a dividend for purposes of the maximum rate under section 1(h) (11) of the Internal Revenue Code:
| April 2013 | December 2013 |
Communications Equipment Portfolio | 0% | 100% |
Computers Portfolio | 100% | 100% |
IT Services Portfolio | 0% | 22% |
Electronics Portfolio | 100% | 100% |
Software and Computer Services Portfolio | 0% | 26% |
Technology Portfolio | 0% | 13% |
The funds will notify shareholders in January 2015 of amounts for use in preparing 2014 income tax returns.
Annual Report
Proxy Voting Results
A special meeting of each fund's shareholders was held on June 18, 2013. The results of votes taken among shareholders on the proposals before them are reported below. Each vote reported represents one dollar of net asset value held on the record date for the meeting.
PROPOSAL 1 | ||
To elect a Board of Trustees.A | ||
Ned C. Lautenbach | # of | % of |
Affirmative | 25,828,395,115.78 | 94.160 |
Withheld | 1,602,101,684.27 | 5.840 |
TOTAL | 27,430,496,800.05 | 100.000 |
Ronald P. O'Hanley | ||
Affirmative | 25,907,936,922.24 | 94.450 |
Withheld | 1,522,559,877.81 | 5.550 |
TOTAL | 27,430,496,800.05 | 100.000 |
David A. Rosow | ||
Affirmative | 25,805,492,959.91 | 94.076 |
Withheld | 1,625,003,840.14 | 5.924 |
TOTAL | 27,430,496,800.05 | 100.000 |
Garnett A. Smith | ||
Affirmative | 25,892,258,831.97 | 94.393 |
Withheld | 1,538,237,968.08 | 5.607 |
TOTAL | 27,430,496,800.05 | 100.000 |
William S. Stavropoulos | ||
Affirmative | 25,738,476,030.34 | 93.832 |
Withheld | 1,692,020,769.71 | 6.168 |
TOTAL | 27,430,496,800.05 | 100.000 |
Michael E. Wiley | ||
Affirmative | 25,923,640,743.27 | 94.507 |
Withheld | 1,506,856,056.78 | 5.493 |
TOTAL | 27,430,496,800.05 | 100.000 |
PROPOSAL 2 | ||
To approve a management contract between Communications Equipment Portfolio and Fidelity SelectCo, LLC. | ||
| # of | % of |
Affirmative | 178,409,480.71 | 86.642 |
Against | 11,373,244.63 | 5.523 |
Abstain | 8,218,407.42 | 3.991 |
Broker Non-Vote | 7,916,790.17 | 3.844 |
TOTAL | 205,917,922.93 | 100.000 |
PROPOSAL 2 | ||
To approve a management contract between Computers Portfolio and Fidelity SelectCo, LLC. | ||
| # of | % of |
Affirmative | 393,979,071.95 | 83.251 |
Against | 35,661,383.84 | 7.536 |
Abstain | 20,102,994.27 | 4.247 |
Broker Non-Vote | 23,502,552.92 | 4.966 |
TOTAL | 473,246,002.98 | 100.000 |
PROPOSAL 2 | ||
To approve a management contract between Electronics Portfolio and Fidelity SelectCo, LLC. | ||
| # of | % of |
Affirmative | 441,259,605.72 | 80.317 |
Against | 32,890,601.85 | 5.987 |
Abstain | 27,809,095.01 | 5.061 |
Broker Non-Vote | 47,442,156.66 | 8.635 |
TOTAL | 549,401,459.24 | 100.000 |
PROPOSAL 2 | ||
To approve a management contract between IT Services Portfolio and Fidelity SelectCo, LLC. | ||
| # of | % of |
Affirmative | 353,428,321.34 | 90.213 |
Against | 11,891,799.65 | 3.036 |
Abstain | 16,163,159.58 | 4.126 |
Broker Non-Vote | 10,287,882.45 | 2.625 |
TOTAL | 391,771,163.02 | 100.000 |
PROPOSAL 2 | ||
To approve a management contract between Software and Computer Services Portfolio and Fidelity SelectCo, LLC. | ||
| # of | % of |
Affirmative | 1,150,010,702.94 | 82.608 |
Against | 74,724,727.17 | 5.368 |
Abstain | 52,013,173.19 | 3.736 |
Broker Non-Vote | 115,391,695.13 | 8.288 |
TOTAL | 1,392,140,298.43 | 100.000 |
PROPOSAL 2 | ||
To approve a management contract between Technology Portfolio and Fidelity SelectCo, LLC. | ||
| # of | % of |
Affirmative | 930,081,956.89 | 82.568 |
Against | 59,936,833.75 | 5.321 |
Abstain | 58,514,117.75 | 5.195 |
Broker Non-Vote | 77,911,319.05 | 6.916 |
TOTAL | 1,126,444,227.44 | 100.000 |
PROPOSAL 3 | ||
For Computers Portfolio, a shareholder proposal requesting that the Board of Trustees institute "Procedures to prevent holding investments in companies that, in management's judgment, substantially contribute to genocide or crimes against humanity."B | ||
| # of | % of |
Affirmative | 138,158,207.14 | 29.194 |
Against | 282,780,597.28 | 59.754 |
Abstain | 28,804,645.59 | 6.086 |
Broker Non-Vote | 23,502,552.97 | 4.966 |
TOTAL | 473,246,002.98 | 100.000 |
A Denotes trust-wide proposal and voting results. | ||
B Proposal was not approved by shareholders. | ||
Annual Report
Item 2. Code of Ethics
As of the end of the period, February 28, 2014, Fidelity Select Portfolios (the trust) has adopted a code of ethics, as defined in Item 2 of Form N-CSR, that applies to its President and Treasurer and its Chief Financial Officer. A copy of the code of ethics is filed as an exhibit to this Form N-CSR.
Item 3. Audit Committee Financial Expert
The Board of Trustees of the trust has determined that David A. Rosow is an audit committee financial expert, as defined in Item 3 of Form N-CSR. Mr. Rosow is independent for purposes of Item 3 of Form N-CSR.
Item 4. Principal Accountant Fees and Services
Fees and Services
The following table presents fees billed by PricewaterhouseCoopers LLP ("PwC") in each of the last two fiscal years for services rendered to Air Transportation Portfolio, Automotive Portfolio, Banking Portfolio, Biotechnology Portfolio, Brokerage and Investment Management Portfolio, Chemicals Portfolio, Communications Equipment Portfolio, Computers Portfolio, Construction and Housing Portfolio, Consumer Discretionary Portfolio, Consumer Finance Portfolio, Consumer Staples Portfolio, Defense and Aerospace Portfolio, Electronics Portfolio, Energy Portfolio, Energy Service Portfolio, Environment and Alternative Energy Portfolio, Financial Services Portfolio, Gold Portfolio, Health Care Portfolio, Industrial Equipment Portfolio, Industrials Portfolio, Insurance Portfolio, IT Services Portfolio, Leisure Portfolio, Materials Portfolio, Medical Delivery Portfolio, Medical Equipment and Systems Portfolio, Multimedia Portfolio, Natural Gas Portfolio, Natural Resources Portfolio, Pharmaceuticals Portfolio, Retailing Portfolio, Software and Computer Services Portfolio, Technology Portfolio, Telecommunications Portfolio, Transportation Portfolio, Utilities Portfolio and Wireless Portfolio (the "Funds"):
Services Billed by PwC
February 28, 2014 FeesA
| Audit Fees | Audit-Related Fees | Tax Fees | All Other Fees |
Air Transportation Portfolio | $34,000 | $- | $2,700 | $1,500 |
Automotive Portfolio | $34,000 | $- | $2,700 | $1,600 |
Banking Portfolio | $35,000 | $- | $2,700 | $1,700 |
Biotechnology Portfolio | $45,000 | $- | $2,700 | $3,700 |
Brokerage and Investment Management Portfolio | $35,000 | $- | $2,700 | $1,700 |
Chemicals Portfolio | $36,000 | $- | $2,700 | $1,900 |
Communications Equipment Portfolio | $34,000 | $- | $2,700 | $1,600 |
Computers Portfolio | $35,000 | $- | $2,700 | $1,700 |
Construction and Housing Portfolio | $34,000 | $- | $2,700 | $1,700 |
Consumer Discretionary Portfolio | $35,000 | $- | $2,700 | $1,700 |
Consumer Finance Portfolio | $35,000 | $- | $2,700 | $1,600 |
Consumer Staples Portfolio | $41,000 | $- | $2,700 | $2,300 |
Defense and Aerospace Portfolio | $35,000 | $- | $2,700 | $1,700 |
Electronics Portfolio | $35,000 | $- | $2,700 | $1,800 |
Energy Portfolio | $38,000 | $- | $2,900 | $2,200 |
Energy Service Portfolio | $36,000 | $- | $2,700 | $1,900 |
Environment and Alternative Energy Portfolio | $34,000 | $- | $2,700 | $1,500 |
Financial Services Portfolio | $35,000 | $- | $2,700 | $1,700 |
Gold Portfolio | $55,000 | $- | $6,400 | $2,000 |
Health Care Portfolio | $38,000 | $- | $2,700 | $2,800 |
Industrial Equipment Portfolio | $39,000 | $- | $2,700 | $1,600 |
Industrials Portfolio | $35,000 | $- | $2,700 | $1,800 |
Insurance Portfolio | $35,000 | $- | $2,700 | $1,600 |
IT Services Portfolio | $35,000 | $- | $2,700 | $1,800 |
Leisure Portfolio | $36,000 | $- | $2,700 | $1,600 |
Materials Portfolio | $40,000 | $- | $2,700 | $2,100 |
Medical Delivery Portfolio | $35,000 | $- | $2,700 | $1,700 |
Medical Equipment and Systems Portfolio | $36,000 | $- | $2,700 | $2,000 |
Multimedia Portfolio | $35,000 | $- | $2,700 | $1,800 |
Natural Gas Portfolio | $34,000 | $- | $2,700 | $1,700 |
Natural Resources Portfolio | $34,000 | $- | $2,700 | $1,800 |
Pharmaceuticals Portfolio | $36,000 | $- | $2,700 | $1,900 |
Retailing Portfolio | $35,000 | $- | $2,700 | $1,800 |
Software and Computer Services Portfolio | $37,000 | $- | $2,700 | $2,400 |
Technology Portfolio | $37,000 | $- | $2,700 | $2,200 |
Telecommunications Portfolio | $38,000 | $- | $2,700 | $1,600 |
Transportation Portfolio | $34,000 | $- | $2,700 | $1,600 |
Utilities Portfolio | $35,000 | $- | $2,700 | $1,700 |
Wireless Portfolio | $34,000 | $- | $2,700 | $1,600 |
February 28, 2013 FeesA
| Audit Fees | Audit-Related Fees | Tax Fees | All Other Fees |
Air Transportation Portfolio | $34,000 | $- | $2,700 | $1,500 |
Automotive Portfolio | $33,000 | $- | $2,700 | $1,500 |
Banking Portfolio | $34,000 | $- | $2,700 | $1,700 |
Biotechnology Portfolio | $41,000 | $- | $2,700 | $2,400 |
Brokerage and Investment Management Portfolio | $34,000 | $- | $2,700 | $1,700 |
Chemicals Portfolio | $35,000 | $- | $2,700 | $1,900 |
Communications Equipment Portfolio | $35,000 | $- | $2,700 | $1,600 |
Computers Portfolio | $35,000 | $- | $2,700 | $1,800 |
Construction and Housing Portfolio | $33,000 | $- | $2,700 | $1,600 |
Consumer Discretionary Portfolio | $38,000 | $- | $2,700 | $1,600 |
Consumer Finance Portfolio | $37,000 | $- | $2,700 | $1,600 |
Consumer Staples Portfolio | $40,000 | $- | $2,700 | $2,300 |
Defense and Aerospace Portfolio | $34,000 | $- | $2,700 | $1,800 |
Electronics Portfolio | $35,000 | $- | $2,700 | $1,900 |
Energy Portfolio | $36,000 | $- | $2,900 | $2,400 |
Energy Service Portfolio | $35,000 | $- | $2,700 | $2,000 |
Environment and Alternative Energy Portfolio | $33,000 | $- | $2,700 | $1,500 |
Financial Services Portfolio | $34,000 | $- | $2,700 | $1,700 |
Gold Portfolio | $57,000 | $- | $6,400 | $2,900 |
Health Care Portfolio | $37,000 | $- | $2,700 | $2,500 |
Industrial Equipment Portfolio | $38,000 | $- | $2,700 | $1,600 |
Industrials Portfolio | $34,000 | $- | $2,700 | $1,700 |
Insurance Portfolio | $37,000 | $- | $2,700 | $1,600 |
IT Services Portfolio | $34,000 | $- | $2,700 | $1,600 |
Leisure Portfolio | $35,000 | $- | $2,700 | $1,700 |
Materials Portfolio | $41,000 | $- | $2,700 | $2,100 |
Medical Delivery Portfolio | $35,000 | $- | $2,700 | $1,800 |
Medical Equipment and Systems Portfolio | $35,000 | $- | $2,700 | $2,000 |
Multimedia Portfolio | $34,000 | $- | $2,700 | $1,600 |
Natural Gas Portfolio | $34,000 | $- | $2,700 | $1,800 |
Natural Resources Portfolio | $34,000 | $- | $2,700 | $2,000 |
Pharmaceuticals Portfolio | $34,000 | $- | $2,700 | $1,800 |
Retailing Portfolio | $34,000 | $- | $2,700 | $1,700 |
Software and Computer Services Portfolio | $36,000 | $- | $2,700 | $2,200 |
Technology Portfolio | $36,000 | $- | $2,700 | $2,400 |
Telecommunications Portfolio | $38,000 | $- | $2,700 | $1,700 |
Transportation Portfolio | $35,000 | $- | $2,700 | $1,600 |
Utilities Portfolio | $34,000 | $- | $2,700 | $1,700 |
Wireless Portfolio | $33,000 | $- | $2,700 | $1,600 |
|
|
|
|
|
A Amounts may reflect rounding.
The following table presents fees billed by PwC that were required to be approved by the Audit Committee for services that relate directly to the operations and financial reporting of the Funds and that are rendered on behalf of Fidelity Management & Research Company ("FMR") and entities controlling, controlled by, or under common control with FMR (not including any sub-adviser whose role is primarily portfolio management and is subcontracted with or overseen by another investment adviser) that provide ongoing services to the Funds ("Fund Service Providers"):
Services Billed by PwC
| February 28, 2014A | February 28, 2013A |
Audit-Related Fees | $4,970,000 | $4,755,000 |
Tax Fees | $- | $- |
All Other Fees | $50,000 | $- |
A Amounts may reflect rounding.
"Audit-Related Fees" represent fees billed for assurance and related services that are reasonably related to the performance of the fund audit or the review of the fund's financial statements and that are not reported under Audit Fees.
"Tax Fees" represent fees billed for tax compliance, tax advice or tax planning that relate directly to the operations and financial reporting of the fund.
"All Other Fees" represent fees billed for services provided to the fund or Fund Service Provider, a significant portion of which are assurance related, that relate directly to the operations and financial reporting of the fund, excluding those services that are reported under Audit Fees, Audit-Related Fees or Tax Fees.
Assurance services must be performed by an independent public accountant.
* * *
The aggregate non-audit fees billed by PwC for services rendered to the Funds, FMR (not including any sub-adviser whose role is primarily portfolio management and is subcontracted with or overseen by another investment adviser), and any Fund Service Provider for each of the last two fiscal years of the Funds are as follows:
Billed By | February 28, 2014 A | February 28, 2013 A |
PwC | $5,665,000 | $5,585,000 |
A Amounts may reflect rounding.
The trust's Audit Committee has considered non-audit services that were not pre-approved that were provided by PwC to Fund Service Providers to be compatible with maintaining the independence of PwC in its audit of the Funds, taking into account representations from PwC, in accordance with Public Company Accounting Oversight Board rules, regarding its independence from the Funds and their related entities and FMR's review of the appropriateness and permissibility under applicable law of such non-audit services prior to their provision to the Fund Service Providers.
Audit Committee Pre-Approval Policies and Procedures
The trust's Audit Committee must pre-approve all audit and non-audit services provided by a fund's independent registered public accounting firm relating to the operations or financial reporting of the fund. Prior to the commencement of any audit or non-audit services to a fund, the Audit Committee reviews the services to determine whether they are appropriate and permissible under applicable law.
The Audit Committee has adopted policies and procedures to, among other purposes, provide a framework for the Committee's consideration of non-audit services by the audit firms that audit the Fidelity funds. The policies and procedures require that any non-audit service provided by a fund audit firm to a Fidelity fund and any non-audit service provided by a fund auditor to a Fund Service Provider that relates directly to the operations and financial reporting of a Fidelity fund ("Covered Service") are subject to approval by the Audit Committee before such service is provided.
All Covered Services must be approved in advance of provision of the service either: (i) by formal resolution of the Audit Committee, or (ii) by oral or written approval of the service by the Chair of the Audit Committee (or if the Chair is unavailable, such other member of the Audit Committee as may be designated by the Chair to act in the Chair's absence). The approval contemplated by (ii) above is permitted where the Treasurer determines that action on such an engagement is necessary before the next meeting of the Audit Committee.
Non-audit services provided by a fund audit firm to a Fund Service Provider that do not relate directly to the operations and financial reporting of a Fidelity fund are reported to the Audit Committee on a periodic basis.
Non-Audit Services Approved Pursuant to Rule 2-01(c)(7)(i)(C) and (ii) of Regulation S-X ("De Minimis Exception")
There were no non-audit services approved or required to be approved by the Audit Committee pursuant to the De Minimis Exception during the Funds' last two fiscal years relating to services provided to (i) the Funds or (ii) any Fund Service Provider that relate directly to the operations and financial reporting of the Funds.
Item 5. Audit Committee of Listed Registrants
Not applicable.
Item 6. Investments
(a) Not applicable.
(b) Not applicable
Item 7. Disclosure of Proxy Voting Policies and Procedures for Closed-End Management Investment Companies
Not applicable.
Item 8. Portfolio Managers of Closed-End Management Investment Companies
Not applicable.
Item 9. Purchase of Equity Securities by Closed-End Management Investment Company and Affiliated Purchasers
Not applicable.
Item 10. Submission of Matters to a Vote of Security Holders
There were no material changes to the procedures by which shareholders may recommend nominees to the trust's Board of Trustees.
Item 11. Controls and Procedures
(a)(i) The President and Treasurer and the Chief Financial Officer have concluded that the trust's disclosure controls and procedures (as defined in Rule 30a-3(c) under the Investment Company Act) provide reasonable assurances that material information relating to the trust is made known to them by the appropriate persons, based on their evaluation of these controls and procedures as of a date within 90 days of the filing date of this report.
(a)(ii) There was no change in the trust's internal control over financial reporting (as defined in Rule 30a-3(d) under the Investment Company Act) that occurred during the second fiscal quarter of the period covered by this report that has materially affected, or is reasonably likely to materially affect, the trust's internal control over financial reporting.
Item 12. Exhibits
(a) | (1) | Code of Ethics pursuant to Item 2 of Form N-CSR is filed and attached hereto as EX-99.CODE ETH. |
(a) | (2) | Certification pursuant to Rule 30a-2(a) under the Investment Company Act of 1940 (17 CFR 270.30a-2(a)) is filed and attached hereto as Exhibit 99.CERT. |
(a) | (3) | Not applicable. |
(b) |
| Certification pursuant to Rule 30a-2(b) under the Investment Company Act of 1940 (17 CFR 270.30a-2(b)) is furnished and attached hereto as Exhibit 99.906CERT. |
SIGNATURES
Pursuant to the requirements of the Securities Exchange Act of 1934 and the Investment Company Act of 1940, the registrant has duly caused this report to be signed on its behalf by the undersigned, thereunto duly authorized.
Fidelity Select Portfolios
By: | /s/Adrien E. Deberghes |
| Adrien E. Deberghes |
| President and Treasurer |
|
|
Date: | April 25, 2014 |
Pursuant to the requirements of the Securities Exchange Act of 1934 and the Investment Company Act of 1940, this report has been signed below by the following persons on behalf of the registrant and in the capacities and on the dates indicated.
By: | /s/Adrien E. Deberghes |
| Adrien E. Deberghes |
| President and Treasurer |
|
|
Date: | April 25, 2014 |
By: | /s/Christine Reynolds |
| Christine Reynolds |
| Chief Financial Officer |
|
|
Date: | April 25, 2014 |