UNITED STATES
SECURITIES AND EXCHANGE COMMISSION
Washington, D.C. 20549
FORM N-CSR
CERTIFIED SHAREHOLDER REPORT OF REGISTERED
MANAGEMENT INVESTMENT COMPANIES
Investment Company Act file number 811-3114
Fidelity Select Portfolios
(Exact name of registrant as specified in charter)
245 Summer St., Boston, MA 02210
(Address of principal executive offices) (Zip code)
William C. Coffey, Secretary
245 Summer St.
Boston, Massachusetts 02210
(Name and address of agent for service)
Registrant's telephone number, including area code:
617-563-7000
| |
Date of fiscal year end: | July 31 |
|
|
Date of reporting period: | January 31, 2019 |
Item 1.
Reports to Stockholders
Fidelity® Real Estate Investment Portfolio
Semi-Annual Report January 31, 2019 |
 |
Beginning on January 1, 2021, as permitted by regulations adopted by the Securities and Exchange Commission, paper copies of a fund’s shareholder reports will no longer be sent by mail, unless you specifically request paper copies of the reports from the fund or from your financial intermediary, such as a financial advisor, broker-dealer or bank. Instead, the reports will be made available on a website, and you will be notified by mail each time a report is posted and provided with a website link to access the report.
If you already elected to receive shareholder reports electronically, you will not be affected by this change and you need not take any action. You may elect to receive shareholder reports and other communications from a fund electronically, by contacting your financial intermediary. For Fidelity customers, visit Fidelity's web site or call Fidelity using the contact information listed below.
You may elect to receive all future reports in paper free of charge. If you wish to continue receiving paper copies of your shareholder reports, you may contact your financial intermediary or, if you are a Fidelity customer, visit Fidelity’s website, or call Fidelity at the applicable toll-free number listed below. Your election to receive reports in paper will apply to all funds held with the fund complex/your financial intermediary.
| Account Type | Website | Phone Number |
| Brokerage, Mutual Fund, or Annuity Contracts: | fidelity.com/mailpreferences | 1-800-343-3548 |
| Employer Provided Retirement Accounts: | netbenefits.fidelity.com/preferences (choose 'no' under Required Disclosures to continue to print) | 1-800-343-0860 |
| Advisor Sold Accounts Serviced Through Your Financial Intermediary: | Contact Your Financial Intermediary | Your Financial Intermediary's phone number |
| Advisor Sold Accounts Serviced by Fidelity: | institutional.fidelity.com | 1-877-208-0098 |
Contents
To view a fund's proxy voting guidelines and proxy voting record for the 12-month period ended June 30, visit http://www.fidelity.com/proxyvotingresults or visit the Securities and Exchange Commission's (SEC) web site at http://www.sec.gov.
You may also call 1-800-544-8544 to request a free copy of the proxy voting guidelines.
Standard & Poor's, S&P and S&P 500 are registered service marks of The McGraw-Hill Companies, Inc. and have been licensed for use by Fidelity Distributors Corporation.
Other third-party marks appearing herein are the property of their respective owners.
All other marks appearing herein are registered or unregistered trademarks or service marks of FMR LLC or an affiliated company. © 2019 FMR LLC. All rights reserved.
This report and the financial statements contained herein are submitted for the general information of the shareholders of the Fund. This report is not authorized for distribution to prospective investors in the Fund unless preceded or accompanied by an effective prospectus.
A fund files its complete schedule of portfolio holdings with the SEC for the first and third quarters of each fiscal year on Form N-Q. Forms N-Q are available on the SEC’s web site at http://www.sec.gov. A fund's Forms N-Q may be reviewed and copied at the SEC’s Public Reference Room in Washington, DC. Information regarding the operation of the SEC's Public Reference Room may be obtained by calling 1-800-SEC-0330.
For a complete list of a fund's portfolio holdings, view the most recent holdings listing, semiannual report, or annual report on Fidelity's web site at http://www.fidelity.com, http://www.institutional.fidelity.com, or http://www.401k.com, as applicable.
NOT FDIC INSURED •MAY LOSE VALUE •NO BANK GUARANTEE
Neither the Fund nor Fidelity Distributors Corporation is a bank.
Investment Summary (Unaudited)
Top Ten Stocks as of January 31, 2019
| | % of fund's net assets |
| Prologis, Inc. | 9.6 |
| Simon Property Group, Inc. | 9.6 |
| UDR, Inc. | 5.6 |
| Boston Properties, Inc. | 5.3 |
| Ventas, Inc. | 4.7 |
| Duke Realty Corp. | 4.7 |
| Welltower, Inc. | 4.6 |
| Equity Residential (SBI) | 4.5 |
| AvalonBay Communities, Inc. | 4.3 |
| Digital Realty Trust, Inc. | 4.0 |
| | 56.9 |
Top Five REIT Sectors as of January 31, 2019
| | % of fund's net assets |
| REITs - Apartments | 21.3 |
| REITs - Diversified | 14.6 |
| REITs - Office Property | 12.0 |
| REITs - Regional Malls | 10.8 |
| REITs - Health Care | 9.7 |
Asset Allocation (% of fund's net assets)
| As of January 31, 2019* |
| | Stocks | 99.2% |
| | Short-Term Investments and Net Other Assets (Liabilities) | 0.8% |

* Foreign investments – 0.7%
Schedule of Investments January 31, 2019 (Unaudited)
Showing Percentage of Net Assets
| Common Stocks - 99.2% | | | |
| | | Shares | Value (000s) |
| Equity Real Estate Investment Trusts (REITs) - 98.2% | | | |
| REITs - Apartments - 21.3% | | | |
| American Homes 4 Rent Class A | | 2,914,700 | $64,444 |
| Apartment Investment & Management Co. Class A | | 858,774 | 42,526 |
| AvalonBay Communities, Inc. | | 887,200 | 171,159 |
| Camden Property Trust (SBI) | | 764,900 | 74,157 |
| Equity Residential (SBI) | | 2,430,600 | 176,364 |
| Essex Property Trust, Inc. | | 328,900 | 89,198 |
| UDR, Inc. | | 5,065,341 | 221,609 |
| | | | 839,457 |
| REITs - Diversified - 14.3% | | | |
| Cousins Properties, Inc. | | 2,132,400 | 18,872 |
| Crown Castle International Corp. | | 390,500 | 45,712 |
| Digital Realty Trust, Inc. | | 1,468,100 | 159,054 |
| Duke Realty Corp. | | 6,296,000 | 184,095 |
| Equinix, Inc. | | 118,300 | 46,610 |
| Vornado Realty Trust | | 1,214,000 | 84,871 |
| Washington REIT (SBI) | | 860,200 | 21,806 |
| | | | 561,020 |
| REITs - Health Care - 9.7% | | | |
| Healthcare Trust of America, Inc. | | 548,500 | 15,588 |
| Ventas, Inc. | | 2,864,654 | 184,742 |
| Welltower, Inc. | | 2,315,340 | 179,416 |
| | | | 379,746 |
| REITs - Hotels - 5.1% | | | |
| Braemar Hotels & Resorts, Inc. | | 813,000 | 9,041 |
| DiamondRock Hospitality Co. | | 4,404,800 | 44,753 |
| Host Hotels & Resorts, Inc. | | 6,662,905 | 120,332 |
| RLJ Lodging Trust | | 1,459,200 | 27,068 |
| | | | 201,194 |
| REITs - Manufactured Homes - 5.8% | | | |
| Equity Lifestyle Properties, Inc. | | 1,334,787 | 141,327 |
| Sun Communities, Inc. | | 808,963 | 88,913 |
| | | | 230,240 |
| REITs - Office Property - 12.0% | | | |
| Boston Properties, Inc. | | 1,568,100 | 206,785 |
| Brandywine Realty Trust (SBI) | | 3,703,600 | 55,739 |
| Douglas Emmett, Inc. | | 639,800 | 24,204 |
| Highwoods Properties, Inc. (SBI) | | 822,923 | 36,472 |
| Hudson Pacific Properties, Inc. | | 315,250 | 10,236 |
| Piedmont Office Realty Trust, Inc. Class A | | 1,787,400 | 34,604 |
| SL Green Realty Corp. | | 1,044,846 | 96,575 |
| VEREIT, Inc. | | 839,500 | 6,783 |
| | | | 471,398 |
| REITs - Regional Malls - 10.8% | | | |
| Simon Property Group, Inc. | | 2,063,672 | 375,836 |
| The Macerich Co. | | 1,036,400 | 47,840 |
| | | | 423,676 |
| REITs - Shopping Centers - 5.0% | | | |
| Acadia Realty Trust (SBI) | | 1,471,823 | 42,285 |
| Kimco Realty Corp. | | 3,144,490 | 53,488 |
| Regency Centers Corp. | | 1,524,400 | 99,086 |
| | | | 194,859 |
| REITs - Single Tenant - 0.4% | | | |
| Spirit Realty Capital, Inc. | | 429,780 | 17,071 |
| REITs - Storage - 4.2% | | | |
| Extra Space Storage, Inc. | | 972,440 | 95,892 |
| Public Storage | | 323,000 | 68,644 |
| | | | 164,536 |
| REITs - Warehouse/Industrial - 9.6% | | | |
| Prologis, Inc. | | 5,479,130 | 378,937 |
|
| TOTAL EQUITY REAL ESTATE INVESTMENT TRUSTS (REITS) | | | 3,862,134 |
|
| Real Estate Management & Development - 1.0% | | | |
| Real Estate Development - 0.7% | | | |
| Instone Real Estate Group BV (a) | | 1,296,800 | 27,979 |
| REITs - Diversified - 0.3% | | | |
| VICI Properties, Inc. | | 503,900 | 10,849 |
|
| TOTAL REAL ESTATE MANAGEMENT & DEVELOPMENT | | | 38,828 |
|
| TOTAL COMMON STOCKS | | | |
| (Cost $2,662,565) | | | 3,900,962 |
|
| Money Market Funds - 0.7% | | | |
| Fidelity Cash Central Fund, 2.43% (b) | | | |
| (Cost $29,176) | | 29,171,992 | 29,178 |
| TOTAL INVESTMENT IN SECURITIES - 99.9% | | | |
| (Cost $2,691,741) | | | 3,930,140 |
| NET OTHER ASSETS (LIABILITIES) - 0.1% | | | 2,428 |
| NET ASSETS - 100% | | | $3,932,568 |
Legend
(a) Security exempt from registration under Rule 144A of the Securities Act of 1933. These securities may be resold in transactions exempt from registration, normally to qualified institutional buyers. At the end of the period, the value of these securities amounted to $27,979,000 or 0.7% of net assets.
(b) Affiliated fund that is generally available only to investment companies and other accounts managed by Fidelity Investments. The rate quoted is the annualized seven-day yield of the fund at period end. A complete unaudited listing of the fund's holdings as of its most recent quarter end is available upon request. In addition, each Fidelity Central Fund's financial statements are available on the SEC's website or upon request.
Affiliated Central Funds
Information regarding fiscal year to date income earned by the Fund from investments in Fidelity Central Funds is as follows:
| Fund | Income earned |
| | (Amounts in thousands) |
| Fidelity Cash Central Fund | $350 |
| Total | $350 |
Amounts in the income column in the above table include any capital gain distributions from underlying funds, which are presented in the corresponding line-item in the Statement of Operations, if applicable.
Investment Valuation
All investments are categorized as Level 1 under the Fair Value Hierarchy. The inputs or methodology used for valuing securities may not be an indication of the risk associated with investing in those securities. For more information on valuation inputs please refer to the Investment Valuation section in the accompanying Notes to Financial Statements.
See accompanying notes which are an integral part of the financial statements.
Financial Statements
Statement of Assets and Liabilities
| Amounts in thousands (except per-share amount) | | January 31, 2019 (Unaudited) |
| Assets | | |
Investment in securities, at value — See accompanying schedule:
Unaffiliated issuers (cost $2,662,565) | $3,900,962 | |
| Fidelity Central Funds (cost $29,176) | 29,178 | |
| Total Investment in Securities (cost $2,691,741) | | $3,930,140 |
| Cash | | 95 |
| Receivable for investments sold | | 7,819 |
| Receivable for fund shares sold | | 2,955 |
| Dividends receivable | | 786 |
| Distributions receivable from Fidelity Central Funds | | 46 |
| Prepaid expenses | | 32 |
| Other receivables | | 288 |
| Total assets | | 3,942,161 |
| Liabilities | | |
| Payable for investments purchased | $1,081 | |
| Payable for fund shares redeemed | 5,909 | |
| Accrued management fee | 1,661 | |
| Transfer agent fee payable | 544 | |
| Other affiliated payables | 86 | |
| Other payables and accrued expenses | 312 | |
| Total liabilities | | 9,593 |
| Net Assets | | $3,932,568 |
| Net Assets consist of: | | |
| Paid in capital | | $2,699,617 |
| Total distributable earnings (loss) | | 1,232,951 |
| Net Assets, for 92,010 shares outstanding | | $3,932,568 |
| Net Asset Value, offering price and redemption price per share ($3,932,568 ÷ 92,010 shares) | | $42.74 |
See accompanying notes which are an integral part of the financial statements.
Statement of Operations
| Amounts in thousands | | Six months ended January 31, 2019 (Unaudited) |
| Investment Income | | |
| Dividends | | $57,612 |
| Income from Fidelity Central Funds | | 350 |
| Total income | | 57,962 |
| Expenses | | |
| Management fee | $10,311 | |
| Transfer agent fees | 3,339 | |
| Accounting fees and expenses | 516 | |
| Custodian fees and expenses | 19 | |
| Independent trustees' fees and expenses | 12 | |
| Registration fees | 36 | |
| Audit | 28 | |
| Legal | 5 | |
| Miscellaneous | 12 | |
| Total expenses before reductions | 14,278 | |
| Expense reductions | (36) | |
| Total expenses after reductions | | 14,242 |
| Net investment income (loss) | | 43,720 |
| Realized and Unrealized Gain (Loss) | | |
| Net realized gain (loss) on: | | |
| Investment securities: | | |
| Unaffiliated issuers | 47,453 | |
| Fidelity Central Funds | (1) | |
| Foreign currency transactions | (3) | |
| Total net realized gain (loss) | | 47,449 |
| Change in net unrealized appreciation (depreciation) on: | | |
| Investment securities: | | |
| Unaffiliated issuers | 74,693 | |
| Fidelity Central Funds | 1 | |
| Total change in net unrealized appreciation (depreciation) | | 74,694 |
| Net gain (loss) | | 122,143 |
| Net increase (decrease) in net assets resulting from operations | | $165,863 |
See accompanying notes which are an integral part of the financial statements.
Statement of Changes in Net Assets
| Amounts in thousands | Six months ended January 31, 2019 (Unaudited) | Year ended July 31, 2018 |
| Increase (Decrease) in Net Assets | | |
| Operations | | |
| Net investment income (loss) | $43,720 | $78,627 |
| Net realized gain (loss) | 47,449 | 123,601 |
| Change in net unrealized appreciation (depreciation) | 74,694 | (107,445) |
| Net increase (decrease) in net assets resulting from operations | 165,863 | 94,783 |
| Distributions to shareholders | (147,450) | – |
| Distributions to shareholders from net investment income | – | (79,829) |
| Distributions to shareholders from net realized gain | – | (91,546) |
| Total distributions | (147,450) | (171,375) |
| Share transactions | | |
| Proceeds from sales of shares | 217,851 | 597,248 |
| Reinvestment of distributions | 138,723 | 161,468 |
| Cost of shares redeemed | (381,170) | (1,064,135) |
| Net increase (decrease) in net assets resulting from share transactions | (24,596) | (305,419) |
| Total increase (decrease) in net assets | (6,183) | (382,011) |
| Net Assets | | |
| Beginning of period | 3,938,751 | 4,320,762 |
| End of period | $3,932,568 | $3,938,751 |
| Other Information | | |
| Undistributed net investment income end of period | | $15,806 |
| Shares | | |
| Sold | 5,275 | 14,437 |
| Issued in reinvestment of distributions | 3,325 | 3,841 |
| Redeemed | (9,309) | (26,234) |
| Net increase (decrease) | (709) | (7,956) |
See accompanying notes which are an integral part of the financial statements.
Financial Highlights
Fidelity Real Estate Investment Portfolio
| | Six months ended (Unaudited) January 31, | Years endedJuly 31, | | | | |
| | 2019 | 2018 | 2017 | 2016 | 2015 | 2014 |
| Selected Per–Share Data | | | | | | |
| Net asset value, beginning of period | $42.48 | $42.92 | $47.35 | $40.80 | $37.56 | $34.03 |
| Income from Investment Operations | | | | | | |
| Net investment income (loss)A | .47 | .81 | .72 | .75 | .67 | .61 |
| Net realized and unrealized gain (loss) | 1.40 | .49 | (3.12) | 8.36 | 3.19 | 3.58 |
| Total from investment operations | 1.87 | 1.30 | (2.40) | 9.11 | 3.86 | 4.19 |
| Distributions from net investment income | (.74) | (.82) | (.71) | (.73) | (.63) | (.64) |
| Distributions from net realized gain | (.87) | (.92) | (1.32) | (1.83) | – | (.02) |
| Total distributions | (1.61) | (1.74) | (2.03) | (2.56) | (.63) | (.66) |
| Redemption fees added to paid in capitalA | – | – | –B | –B | .01 | –B |
| Net asset value, end of period | $42.74 | $42.48 | $42.92 | $47.35 | $40.80 | $37.56 |
| Total ReturnC,D | 4.52% | 3.13% | (4.94)% | 24.00% | 10.34% | 12.61% |
| Ratios to Average Net AssetsE,F | | | | | | |
| Expenses before reductions | .75%G | .76% | .76% | .78% | .78% | .80% |
| Expenses net of fee waivers, if any | .75%G | .75% | .76% | .77% | .78% | .80% |
| Expenses net of all reductions | .74%G | .75% | .76% | .77% | .78% | .80% |
| Net investment income (loss) | 2.29%G | 1.99% | 1.69% | 1.81% | 1.66% | 1.78% |
| Supplemental Data | | | | | | |
| Net assets, end of period (in millions) | $3,933 | $3,939 | $4,321 | $5,567 | $4,382 | $4,036 |
| Portfolio turnover rateH | 15%G | 20%I | 15% | 24% | 34% | 24% |
A Calculated based on average shares outstanding during the period.
B Amount represents less than $.005 per share.
C Total returns for periods of less than one year are not annualized.
D Total returns would have been lower if certain expenses had not been reduced during the applicable periods shown.
E Fees and expenses of any underlying Fidelity Central Funds are not included in the Fund's expense ratio. The Fund indirectly bears its proportionate share of the expenses of any underlying Fidelity Central Funds.
F Expense ratios reflect operating expenses of the Fund. Expenses before reductions do not reflect amounts reimbursed by the investment adviser or reductions from brokerage service arrangements or reductions from other expense offset arrangements and do not represent the amount paid by the Fund during periods when reimbursements or reductions occur. Expenses net of fee waivers reflect expenses after reimbursement by the investment adviser but prior to reductions from brokerage service arrangements or other expense offset arrangements. Expenses net of all reductions represent the net expenses paid by the Fund.
G Annualized
H Amount does not include the portfolio activity of any underlying Fidelity Central Funds.
I Portfolio turnover rate excludes securities received or delivered in-kind.
See accompanying notes which are an integral part of the financial statements.
Notes to Financial Statements (Unaudited)
For the period ended January 31, 2019
(Amounts in thousands except percentages)
1. Organization.
Fidelity Real Estate Investment Portfolio (the Fund) is a non-diversified fund of Fidelity Select Portfolios (the Trust) and is authorized to issue an unlimited number of shares. Share transactions on the Statement of Changes in Net Assets may contain exchanges between affiliated funds. The Trust is registered under the Investment Company Act of 1940, as amended (the 1940 Act), as an open-end management investment company organized as a Massachusetts business trust.
2. Investments in Fidelity Central Funds.
The Fund invests in Fidelity Central Funds, which are open-end investment companies generally available only to other investment companies and accounts managed by the investment adviser and its affiliates. The Fund's Schedule of Investments lists each of the Fidelity Central Funds held as of period end, if any, as an investment of the Fund, but does not include the underlying holdings of each Fidelity Central Fund. As an Investing Fund, the Fund indirectly bears its proportionate share of the expenses of the underlying Fidelity Central Funds.
The Money Market Central Funds seek preservation of capital and current income and are managed by Fidelity Investments Money Management, Inc. (FIMM), an affiliate of the investment adviser. Annualized expenses of the Money Market Central Funds as of their most recent shareholder report date are less than .005%.
A complete unaudited list of holdings for each Fidelity Central Fund is available upon request or at the Securities and Exchange Commission (the SEC) website at www.sec.gov. In addition, the financial statements of the Fidelity Central Funds are available on the SEC website or upon request.
3. Significant Accounting Policies.
The Fund is an investment company and applies the accounting and reporting guidance of the Financial Accounting Standards Board (FASB) Accounting Standards Codification Topic 946 Financial Services – Investments Companies. The financial statements have been prepared in conformity with accounting principles generally accepted in the United States of America (GAAP), which require management to make certain estimates and assumptions at the date of the financial statements. Actual results could differ from those estimates. Subsequent events, if any, through the date that the financial statements were issued have been evaluated in the preparation of the financial statements. The following summarizes the significant accounting policies of the Fund:
Investment Valuation. Investments are valued as of 4:00 p.m. Eastern time on the last calendar day of the period. The Board of Trustees (the Board) has delegated the day to day responsibility for the valuation of the Fund's investments to the Fair Value Committee (the Committee) established by the Fund's investment adviser. In accordance with valuation policies and procedures approved by the Board, the Fund attempts to obtain prices from one or more third party pricing vendors or brokers to value its investments. When current market prices, quotations or currency exchange rates are not readily available or reliable, investments will be fair valued in good faith by the Committee, in accordance with procedures adopted by the Board. Factors used in determining fair value vary by investment type and may include market or investment specific events. The frequency with which these procedures are used cannot be predicted and they may be utilized to a significant extent. The Committee oversees the Fund's valuation policies and procedures and reports to the Board on the Committee's activities and fair value determinations. The Board monitors the appropriateness of the procedures used in valuing the Fund's investments and ratifies the fair value determinations of the Committee.
The Fund categorizes the inputs to valuation techniques used to value its investments into a disclosure hierarchy consisting of three levels as shown below:
- Level 1 – quoted prices in active markets for identical investments
- Level 2 – other significant observable inputs (including quoted prices for similar investments, interest rates, prepayment speeds, etc.)
- Level 3 – unobservable inputs (including the Fund's own assumptions based on the best information available)
Valuation techniques used to value the Fund's investments by major category are as follows:
Equity securities, including restricted securities, for which market quotations are readily available, are valued at the last reported sale price or official closing price as reported by a third party pricing vendor on the primary market or exchange on which they are traded and are categorized as Level 1 in the hierarchy. In the event there were no sales during the day or closing prices are not available, securities are valued at the last quoted bid price or may be valued using the last available price and are generally categorized as Level 2 in the hierarchy. For foreign equity securities, when market or security specific events arise, comparisons to the valuation of American Depositary Receipts (ADRs), futures contracts, Exchange-Traded Funds (ETFs) and certain indexes as well as quoted prices for similar securities may be used and would be categorized as Level 2 in the hierarchy. For equity securities, including restricted securities, where observable inputs are limited, assumptions about market activity and risk are used and these securities may be categorized as Level 3 in the hierarchy.
Investments in open-end mutual funds, including the Fidelity Central Funds, are valued at their closing net asset value (NAV) each business day and are categorized as Level 1 in the hierarchy.
Changes in valuation techniques may result in transfers in or out of an assigned level within the disclosure hierarchy.
Foreign Currency. The Fund may use foreign currency contracts to facilitate transactions in foreign-denominated securities. Gains and losses from these transactions may arise from changes in the value of the foreign currency or if the counterparties do not perform under the contracts' terms.
Foreign-denominated assets, including investment securities, and liabilities are translated into U.S. dollars at the exchange rates at period end. Purchases and sales of investment securities, income and dividends received and expenses denominated in foreign currencies are translated into U.S. dollars at the exchange rate in effect on the transaction date.
The effects of exchange rate fluctuations on investments are included with the net realized and unrealized gain (loss) on investment securities. Other foreign currency transactions resulting in realized and unrealized gain (loss) are disclosed separately.
Investment Transactions and Income. For financial reporting purposes, the Fund's investment holdings and NAV include trades executed through the end of the last business day of the period. The NAV per share for processing shareholder transactions is calculated as of the close of business of the New York Stock Exchange (NYSE), normally 4:00 p.m. Eastern time and includes trades executed through the end of the prior business day. Gains and losses on securities sold are determined on the basis of identified cost. Dividend income is recorded on the ex-dividend date, except for certain dividends from foreign securities where the ex-dividend date may have passed, which are recorded as soon as the Fund is informed of the ex-dividend date. Non-cash dividends included in dividend income, if any, are recorded at the fair market value of the securities received. Income and capital gain distributions from Fidelity Central Funds, if any, are recorded on the ex-dividend date. Certain distributions received by the Fund represent a return of capital or capital gain. The Fund determines the components of these distributions subsequent to the ex-dividend date, based upon receipt of tax filings or other correspondence relating to the underlying investment. These distributions are recorded as a reduction of cost of investments and/or as a realized gain.
Expenses. Expenses directly attributable to a fund are charged to that fund. Expenses attributable to more than one fund are allocated among the respective funds on the basis of relative net assets or other appropriate methods. Expense estimates are accrued in the period to which they relate and adjustments are made when actual amounts are known.
Deferred Trustee Compensation. Under a Deferred Compensation Plan (the Plan) for the Fund, certain independent Trustees have elected to defer receipt of a portion of their annual compensation. Deferred amounts are invested in a cross-section of Fidelity funds, are marked-to-market and remain in the Fund until distributed in accordance with the Plan. The investment of deferred amounts and the offsetting payable to the Trustees of $276 are included in the accompanying Statement of Assets and Liabilities in other receivables and other payables and accrued expenses, respectively.
Income Tax Information and Distributions to Shareholders. Each year, the Fund intends to qualify as a regulated investment company under Subchapter M of the Internal Revenue Code, including distributing substantially all of its taxable income and realized gains. As a result, no provision for U.S. Federal income taxes is required. The Fund files a U.S. federal tax return, in addition to state and local tax returns as required. The Fund's federal income tax returns are subject to examination by the Internal Revenue Service (IRS) for a period of three fiscal years after they are filed. State and local tax returns may be subject to examination for an additional fiscal year depending on the jurisdiction. Foreign taxes are provided for based on the Fund's understanding of the tax rules and rates that exist in the foreign markets in which it invests.
Distributions are declared and recorded on the ex-dividend date. Income and capital gain distributions are determined in accordance with income tax regulations, which may differ from GAAP.
Capital accounts within the financial statements are adjusted for permanent book-tax differences. These adjustments have no impact on net assets or the results of operations. Capital accounts are not adjusted for temporary book-tax differences which will reverse in a subsequent period.
Book-tax differences are primarily due to foreign currency transactions, redemptions in kind, non-taxable dividends, deferred trustees compensation, and losses deferred due to wash sales.
As of period end, the cost and unrealized appreciation (depreciation) in securities, and derivatives if applicable, for federal income tax purposes were as follows:
| Gross unrealized appreciation | $1,281,494 |
| Gross unrealized depreciation | (63,952) |
| Net unrealized appreciation (depreciation) | $1,217,542 |
| Tax cost | $2,712,598 |
Restricted Securities. The Fund may invest in securities that are subject to legal or contractual restrictions on resale. These securities generally may be resold in transactions exempt from registration or to the public if the securities are registered. Disposal of these securities may involve time-consuming negotiations and expense, and prompt sale at an acceptable price may be difficult. Information regarding restricted securities is included at the end of the Fund's Schedule of Investments.
New Rule Issuance. During August 2018, the U.S. Securities and Exchange Commission issued Final Rule Release No. 33-10532, Disclosure Update and Simplification. This Final Rule includes amendments specific to registered investment companies that are intended to eliminate overlap in disclosure requirements between Regulation S-X and GAAP. In accordance with these amendments, certain line-items in the Fund's financial statements have been combined or removed for the current period as outlined in the table below.
| Financial Statement | Current Line-Item Presentation (As Applicable) | Prior Line-Item Presentation (As Applicable) |
| Statement of Assets and Liabilities | Total distributable earnings (loss) | Undistributed/Distributions in excess of/Accumulated net investment income (loss)
Accumulated/Undistributed net realized gain (loss)
Net unrealized appreciation (depreciation) |
| Statement of Changes in Net Assets | N/A - removed | Undistributed/Distributions in excess of/Accumulated net investment income (loss) end of period |
| Statement of Changes in Net Assets | Distributions to shareholders | Distributions to shareholders from net investment income
Distributions to shareholders from net realized gain |
4. Purchases and Sales of Investments.
Purchases and sales of securities, other than short sales and short-term securities, aggregated $284,872 and $384,432, respectively.
5. Fees and Other Transactions with Affiliates.
Management Fee. Fidelity Management & Research Company (the investment adviser) and its affiliates provide the Fund with investment management related services for which the Fund pays a monthly management fee. The management fee is the sum of an individual fund fee rate that is based on an annual rate of .30% of the Fund's average net assets and an annualized group fee rate that averaged .24% during the period. The group fee rate is based upon the average net assets of all the mutual funds advised by Fidelity Management & Research Company (FMR) and the investment adviser. The group fee rate decreases as assets under management increase and increases as assets under management decrease. For the reporting period, the total annualized management fee rate was .54% of the Fund's average net assets.
Transfer Agent Fees. Fidelity Investments Institutional Operations Company, Inc. (FIIOC), an affiliate of the investment adviser, is the Fund's transfer, dividend disbursing and shareholder servicing agent. FIIOC receives account fees and asset-based fees that vary according to account size and type of account. FIIOC pays for typesetting, printing and mailing of shareholder reports, except proxy statements. For the period, the transfer agent fees were equivalent to an annualized rate of .17% of average net assets.
Accounting Fees. Fidelity Service Company, Inc. (FSC), an affiliate of the investment adviser, maintains the Fund's accounting records. The fee is based on the level of average net assets for each month. For the period, the fees were equivalent to an annualized rate of .03%.
Brokerage Commissions. The Fund placed a portion of its portfolio transactions with brokerage firms which are affiliates of the investment adviser. Brokerage commissions are included in net realized gain (loss) and change in net unrealized appreciation (depreciation) in the Statement of Operations. The commissions paid to these affiliated firms were $7 for the period.
Interfund Trades. The Fund may purchase from or sell securities to other Fidelity Funds under procedures adopted by the Board. The procedures have been designed to ensure these interfund trades are executed in accordance with Rule 17a-7 of the 1940 Act. Interfund trades are included within the respective purchases and sales amounts shown in the Purchases and Sales of Investments note.
Prior Fiscal Year Redemptions In-Kind. During the prior period, 2,672 shares of the Fund held by an affiliated entity were redeemed in kind for investments and cash with a value of $102,755. The Fund had a net realized gain of $36,897 on investments delivered through in-kind redemptions. The amount of in-kind redemptions is included in share transactions in the accompanying Statement of Changes in Net Assets as well as the Notes to Financial Statements. The Fund recognized no gain or loss for federal income tax purposes.
6. Committed Line of Credit.
The Fund participates with other funds managed by the investment adviser or an affiliate in a $4.25 billion credit facility (the "line of credit") to be utilized for temporary or emergency purposes to fund shareholder redemptions or for other short-term liquidity purposes. The Fund has agreed to pay commitment fees on its pro-rata portion of the line of credit, which amounted to $5 and is reflected in Miscellaneous expenses on the Statement of Operations. During the period, the Fund did not borrow on this line of credit.
7. Expense Reductions.
Commissions paid to certain brokers with whom the investment adviser, or its affiliates, places trades on behalf of the Fund include an amount in addition to trade execution, which may be rebated back to the Fund to offset certain expenses. This amount totaled $20 for the period. Through arrangements with the Fund's custodian transfer agent, credits realized as a result of certain uninvested cash balances were used to reduce the Fund's expenses. During the period, these credits reduced the Fund's expenses by $1.
In addition, during the period the investment adviser reimbursed and/or waived a portion of operating expenses in the amount of $15.
8. Other.
The Fund's organizational documents provide former and current trustees and officers with a limited indemnification against liabilities arising in connection with the performance of their duties to the Fund. In the normal course of business, the Fund may also enter into contracts that provide general indemnifications. The Fund's maximum exposure under these arrangements is unknown as this would be dependent on future claims that may be made against the Fund. The risk of material loss from such claims is considered remote.
Shareholder Expense Example
As a shareholder of the Fund, you incur two types of costs: (1) transaction costs, and (2) ongoing costs, including management fees and other Fund expenses. This Example is intended to help you understand your ongoing costs (in dollars) of investing in the Fund and to compare these costs with the ongoing costs of investing in other mutual funds.
The Example is based on an investment of $1,000 invested at the beginning of the period and held for the entire period (August 1, 2018 to January 31, 2019).
Actual Expenses
The first line of the accompanying table provides information about actual account values and actual expenses. You may use the information in this line, together with the amount you invested, to estimate the expenses that you paid over the period. Simply divide your account value by $1,000.00 (for example, an $8,600 account value divided by $1,000.00 = 8.6), then multiply the result by the number in the first line under the heading entitled "Expenses Paid During Period" to estimate the expenses you paid on your account during this period. In addition, the Fund, as a shareholder in the underlying Fidelity Central Funds, will indirectly bear its pro-rata share of the fees and expenses incurred by the underlying Fidelity Central Funds. These fees and expenses are not included in the Fund's annualized expense ratio used to calculate the expense estimate in the table below.
Hypothetical Example for Comparison Purposes
The second line of the accompanying table provides information about hypothetical account values and hypothetical expenses based on the Fund's actual expense ratio and an assumed rate of return of 5% per year before expenses, which is not the Fund's actual return. The hypothetical account values and expenses may not be used to estimate the actual ending account balance or expenses you paid for the period. You may use this information to compare the ongoing costs of investing in the Fund and other funds. To do so, compare this 5% hypothetical example with the 5% hypothetical examples that appear in the shareholder reports of the other funds. In addition, the Fund, as a shareholder in the underlying Fidelity Central Funds, will indirectly bear its pro-rata share of the fees and expenses incurred by the underlying Fidelity Central Funds. These fees and expenses are not included in the Fund's annualized expense ratio used to calculate the expense estimate in the table below.
Please note that the expenses shown in the table are meant to highlight your ongoing costs only and do not reflect any transaction costs. Therefore, the second line of the table is useful in comparing ongoing costs only, and will not help you determine the relative total costs of owning different funds.
| | Annualized Expense Ratio-A | Beginning
Account Value
August 1, 2018 | Ending
Account Value
January 31, 2019 | Expenses Paid
During Period-B
August 1, 2018
to January 31, 2019 |
| Actual | .75% | $1,000.00 | $1,045.20 | $3.87 |
| Hypothetical-C | | $1,000.00 | $1,021.42 | $3.82 |
A Annualized expense ratio reflects expenses net of applicable fee waivers.
B Expenses are equal to the Fund's annualized expense ratio, multiplied by the average account value over the period, multiplied by 184/365 (to reflect the one-half year period).
C 5% return per year before expenses
Board Approval of Investment Advisory Contracts and Management Fees
Fidelity Real Estate Investment Portfolio
Each year, the Board of Trustees, including the Independent Trustees (together, the Board), votes on the renewal of the management contract with Fidelity SelectCo, LLC (SelectCo), an affiliate of Fidelity Management & Research Company (FMR), and the sub-advisory agreements with affiliates of FMR (together, the Advisory Contracts) for the fund. SelectCo and the sub-advisers are referred to herein as the Investment Advisers. The Board, assisted by the advice of fund counsel and Independent Trustees' counsel, requests and considers a broad range of information relevant to the renewal of the Advisory Contracts throughout the year.
The Board meets regularly and, at each of its meetings, covers an extensive agenda of topics and materials and considers factors that are relevant to its annual consideration of the renewal of the fund's Advisory Contracts, including the services and support provided to the fund and its shareholders. The Board has established various standing committees (Committees), each composed of and chaired by Independent Trustees with varying backgrounds, to which the Board has assigned specific subject matter responsibilities in order to enhance effective decision-making by the Board. The Board, acting directly and through its Committees, requests and receives information concerning the annual consideration of the renewal of the fund's Advisory Contracts. The Board also meets as needed to review matters specifically related to the Board's annual consideration of the renewal of the Advisory Contracts. Members of the Board may also meet with trustees of other Fidelity funds through joint ad hoc committees to discuss certain matters relevant to all of the Fidelity funds.
At its January 2019 meeting, the Board unanimously determined to renew the fund's Advisory Contracts. In reaching its determination, the Board considered all factors it believed relevant, including (i) the nature, extent, and quality of the services to be provided to the fund and its shareholders (including the investment performance of the fund); (ii) the competitiveness of the fund's management fee and total expense ratio relative to peer funds; (iii) the total costs of the services to be provided by and the profits to be realized by Fidelity from its relationships with the fund; and (iv) the extent to which, if any, economies of scale exist and would be realized as the fund grows, and whether any economies of scale are appropriately shared with fund shareholders.
In considering whether to renew the Advisory Contracts for the fund, the Board reached a determination, with the assistance of fund counsel and Independent Trustees' counsel and through the exercise of its business judgment, that the renewal of the Advisory Contracts was in the best interests of the fund and its shareholders and that the compensation payable under the Advisory Contracts was fair and reasonable. The Board's decision to renew the Advisory Contracts was not based on any single factor, but rather was based on a comprehensive consideration of all the information provided to the Board at its meetings throughout the year. The Board, in reaching its determination to renew the Advisory Contracts, was aware that shareholders of the fund have a broad range of investment choices available to them, including a wide choice among funds offered by Fidelity's competitors, and that the fund's shareholders, who have the opportunity to review and weigh the disclosure provided by the fund in its prospectus and other public disclosures, have chosen to invest in this fund, which is part of the Fidelity family of funds.
Nature, Extent, and Quality of Services Provided. The Board considered Fidelity's staffing as it relates to the fund, including the backgrounds of investment personnel of Fidelity, and also considered the fund's investment objective, strategies, and related investment philosophy. The Independent Trustees also had discussions with senior management of Fidelity's investment operations and investment groups. The Board considered the structure of the investment personnel compensation program and whether this structure provides appropriate incentives to act in the best interests of the fund. Additionally, the Board considered the portfolio managers' investments, if any, in the funds that they manage.
Resources Dedicated to Investment Management and Support Services. The Board and the Fund Oversight and Research Committees reviewed the general qualifications and capabilities of Fidelity's investment staff, including its size, education, experience, and resources, as well as Fidelity's approach to recruiting, training, managing, and compensating investment personnel. The Board noted that Fidelity has continued to increase the resources devoted to non-U.S. offices, including expansion of Fidelity's global investment organization. The Board also noted that Fidelity's analysts have extensive resources, tools and capabilities that allow them to conduct sophisticated quantitative and fundamental analysis, as well as credit analysis of issuers, counterparties and guarantors. Further, the Board considered that Fidelity's investment professionals have sufficient access to global information and data so as to provide competitive investment results over time, and that those professionals also have access to sophisticated tools that permit them to assess portfolio construction and risk and performance attribution characteristics continuously, as well as to transmit new information and research conclusions rapidly around the world. Additionally, in its deliberations, the Board considered Fidelity's trading, risk management, compliance, and technology and operations capabilities and resources, which are integral parts of the investment management process.
Shareholder and Administrative Services. The Board considered (i) the nature, extent, quality, and cost of advisory, administrative, and shareholder services performed by the Investment Advisers and their affiliates under the Advisory Contracts and under separate agreements covering transfer agency, pricing and bookkeeping, and securities lending services for the fund; (ii) the nature and extent of the supervision of third party service providers, principally custodians, subcustodians, and pricing vendors; and (iii) the resources devoted to, and the record of compliance with, the fund's compliance policies and procedures. The Board also reviewed the allocation of fund brokerage, including allocations to brokers affiliated with the Investment Advisers, the use of brokerage commissions to pay fund expenses, and the use of "soft" commission dollars to pay for research services.
The Board noted that the growth of fund assets over time across the complex allows Fidelity to reinvest in the development of services designed to enhance the value and convenience of the Fidelity funds as investment vehicles. These services include 24-hour access to account information and market information through telephone representatives and over the Internet, investor education materials and asset allocation tools, and the expanded availability of Fidelity Investor Centers.
The Board noted that it and the boards of certain other Fidelity funds had formed an ad hoc Committee on Transfer Agency Fees to review the variety of transfer agency fee structures throughout the industry and Fidelity's competitive positioning with respect to industry participants.
Investment in a Large Fund Family. The Board considered the benefits to shareholders of investing in a Fidelity fund, including the benefits of investing in a fund that is part of a large family of funds offering a variety of investment disciplines and providing a large variety of mutual fund investor services. The Board noted that Fidelity had taken, or had made recommendations that resulted in the Fidelity funds taking, a number of actions over the previous year that benefited particular funds, including: (i) continuing to dedicate additional resources to Fidelity's investment research process, which includes meetings with management of issuers of securities in which the funds invest, and to the support of the senior management team that oversees asset management; (ii) continuing efforts to enhance Fidelity's global research capabilities; (iii) launching new funds and making other enhancements to meet client needs; (iv) launching new share classes of existing funds; (v) eliminating purchase minimums and broadening eligibility requirements for certain funds and share classes; (vi) reducing management fees and total expenses for certain growth equity funds and index funds; (vii) lowering expense caps for certain existing funds and classes, and converting certain voluntary expense caps to contractual caps, to reduce expenses borne by shareholders; (viii) eliminating short-term redemption fees for funds that had such fees; (ix) rationalizing product lines and gaining increased efficiencies from fund mergers and share class consolidations; (x) continuing to develop, acquire and implement systems and technology to improve services to the funds and shareholders, strengthen information security, and increase efficiency; and (xi) continuing to implement enhancements to further strengthen Fidelity's product line to increase investors' probability of success in achieving their investment goals, including retirement income goals.
Investment Performance. The Board considered whether the fund has operated in accordance with its investment objective, as well as its record of compliance with its investment restrictions and its performance history.
The Board took into account discussions that occur at Board meetings throughout the year with representatives of the Investment Advisers about fund investment performance. In this regard the Board noted that as part of regularly scheduled fund reviews and other reports to the Board on fund performance, the Board considers annualized return information for the fund for different time periods, measured against an appropriate securities market index ("benchmark index"). In its evaluation of fund investment performance, the Board gave particular attention to information indicating changes in performance of certain Fidelity funds for specific time periods and discussed with the Investment Advisers the reasons for any overperformance or underperformance.
In addition to reviewing absolute and relative fund performance, the Independent Trustees periodically consider the appropriateness of fund performance metrics in evaluating the results achieved. In general, the Independent Trustees believe that fund performance should be evaluated based on net performance (after fees and expenses) of both the highest performing and lowest performing fund share classes, where applicable, compared to appropriate benchmark indices, over appropriate time periods that may include full market cycles, taking into account relevant factors including the following: general market conditions; issuer-specific information; and fund cash flows and other factors.
The Independent Trustees recognize that shareholders evaluate performance on a net basis over their own holding periods, for which one-, three-, and five-year periods are often used as a proxy. For this reason, the performance information reviewed by the Board also included net cumulative total return information for the fund and an appropriate benchmark index for the most recent one-, three-, and five-year periods ended June 30, 2018, as shown below.
Fidelity Real Estate Investment Portfolio
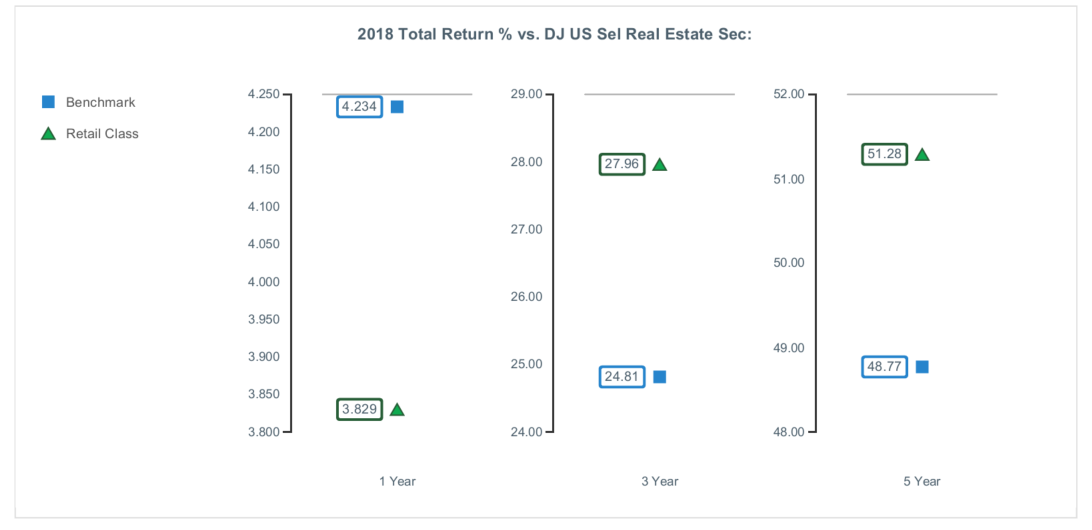
Based on its review, the Board concluded that the nature, extent, and quality of services provided to the fund under the Advisory Contracts should continue to benefit the shareholders of the fund.
Competitiveness of Management Fee and Total Expense Ratio. The Board considered the fund's management fee and total expense ratio compared to "mapped groups" of competitive funds and classes created for the purpose of facilitating the Trustees' competitive analysis of management fees and total expenses. Fidelity creates "mapped groups" by combining similar Lipper investment objective categories that have comparable investment mandates. For this purpose, all sector focused equity funds are grouped in the same mapped group. Combining Lipper investment objective categories aids the Board's management fee and total expense ratio comparisons by broadening the competitive group used for comparison.
Management Fee. The Board considered two proprietary management fee comparisons for the 12-month periods ended June 30 shown in basis points (BP) in the chart below. The group of Lipper funds used by the Board for management fee comparisons is referred to below as the "Total Mapped Group." The Total Mapped Group comparison focuses on a fund's standing in terms of gross management fees before expense reimbursements or caps relative to the total universe of funds with comparable investment mandates (i.e., sector equities), regardless of whether their management fee structures also are comparable. Funds with comparable management fee structures have similar management fee contractual arrangements (
e.g., flat rate charged for advisory services, all-inclusive fee rate,
etc.). "TMG %" represents the percentage of funds in the Total Mapped Group that had management fees that were lower than the fund's. For example, a hypothetical TMG % of 20% would mean that 80% of the funds in the Total Mapped Group had higher, and 20% had lower, management fees than the fund. The fund's actual TMG %s and the number of funds in the Total Mapped Group are in the chart below. The "Asset-Size Peer Group" (ASPG) comparison focuses on a fund's standing relative to a subset of non-Fidelity funds within the Total Mapped Group that are similar in size and management fee structure. For example, if a fund is in the first quartile of the ASPG, the fund's management fee ranks in the least expensive or lowest 25% of funds in the ASPG. The ASPG represents at least 15% of the funds in the Total Mapped Group with comparable asset size and management fee structures, subject to a minimum of 50 funds (or all funds in the Total Mapped Group if fewer than 50). Additional information, such as the ASPG quartile in which the fund's management fee rate ranked, is also included in the chart and was considered by the Board.
Fidelity Real Estate Investment Portfolio
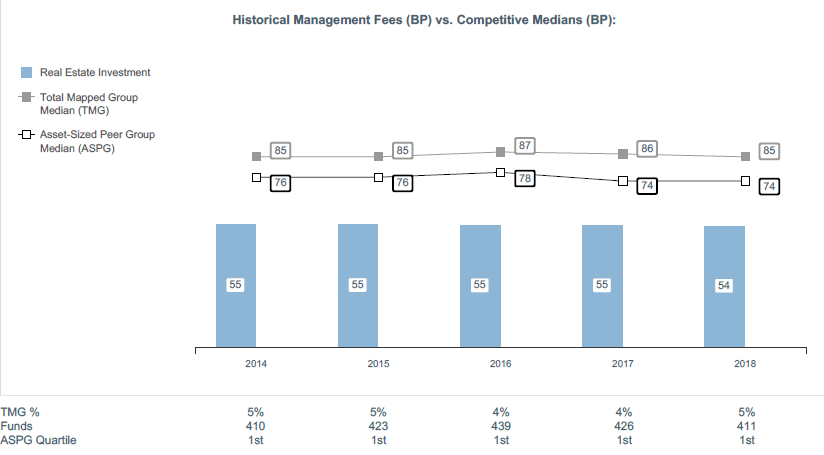
The Board noted that the fund's management fee rate ranked below the median of its Total Mapped Group and below the median of its ASPG for the 12-month period ended June 30, 2018.
The Board noted that it and the boards of other Fidelity funds formed an ad hoc Committee on Group Fee, which meets periodically, to conduct an in-depth review of the "group fee" component of the management fee of funds with such management fee structures. The Committee's focus included the mechanics of the group fee, the competitive landscape of group fee structures, Fidelity funds with no group fee component and investment products not included in group fee assets. The Board also considered that, for funds subject to the group fee, FMR agreed to voluntarily waive fees over a specified period of time in amounts designed to account for assets converted from certain funds to certain collective investment trusts.
Based on its review, the Board concluded that the fund's management fee is fair and reasonable in light of the services that the fund receives and the other factors considered.
Total Expense Ratio. In its review of the fund's total expense ratio, the Board considered the fund's management fee rate as well as other fund expenses, such as transfer agent fees, pricing and bookkeeping fees, and custodial, legal, and audit fees. The Board also noted that Fidelity may agree to waive fees and expenses from time to time, and the extent to which, if any, it has done so for the fund. As part of its review, the Board also considered the current and historical total expense ratios of the fund compared to competitive fund median expenses. The fund is compared to those funds and classes in the Total Mapped Group (used by the Board for management fee comparisons) that have a similar sales load structure.
The Board noted that the fund's total expense ratio ranked below the competitive median for the 12-month period ended June 30, 2018.
Fees Charged to Other Fidelity Clients. The Board also considered Fidelity fee structures and other information with respect to clients of Fidelity, such as other funds advised or subadvised by Fidelity, pension plan clients, and other institutional clients with similar mandates. The Board noted that a joint ad hoc committee created by it and the boards of other Fidelity funds periodically reviews and compares Fidelity's institutional investment advisory business with its business of providing services to the Fidelity funds and also noted the most recent findings of the committee. The Board noted that the committee's review included a consideration of the differences in services provided, fees charged, and costs incurred, as well as competition in the markets serving the different categories of clients.
Based on its review of total expense ratios and fees charged to other Fidelity clients, the Board concluded that the fund's total expense ratio was reasonable in light of the services that the fund and its shareholders receive and the other factors considered.
Costs of the Services and Profitability. The Board considered the revenues earned and the expenses incurred by Fidelity in conducting the business of developing, marketing, distributing, managing, administering and servicing the fund and servicing the fund's shareholders. The Board also considered the level of Fidelity's profits in respect of all the Fidelity funds.
On an annual basis, Fidelity presents to the Board information about the profitability of its relationships with the fund. Fidelity calculates profitability information for each fund, as well as aggregate profitability information for groups of Fidelity funds and all Fidelity funds, using a series of detailed revenue and cost allocation methodologies which originate with the books and records of Fidelity on which Fidelity's audited financial statements are based. The Audit Committee of the Board reviews any significant changes from the prior year's methodologies.
PricewaterhouseCoopers LLP (PwC), auditor to Fidelity and certain Fidelity funds, has been engaged annually by the Board as part of the Board's assessment of Fidelity's profitability analysis. PwC's engagement includes the review and assessment of the methodologies used by Fidelity in determining the revenues and expenses attributable to Fidelity's mutual fund business, and completion of agreed-upon procedures in respect of the mathematical accuracy of the fund profitability information and its conformity to established allocation methodologies. After considering PwC's reports issued under the engagement and information provided by Fidelity, the Board concluded that while other allocation methods may also be reasonable, Fidelity's profitability methodologies are reasonable in all material respects.
The Board also reviewed Fidelity's non-fund businesses and potential indirect benefits such businesses may have received as a result of their association with Fidelity's mutual fund business (i.e., fall-out benefits) as well as cases where Fidelity's affiliates may benefit from the fund's business. The Board noted that changes to fall-out benefits year-over-year reflect business developments at Fidelity's various businesses.
The Board considered the costs of the services provided by and the profits realized by Fidelity in connection with the operation of the fund and was satisfied that the profitability was not excessive.
Economies of Scale. The Board considered whether there have been economies of scale in respect of the management of the Fidelity funds, whether the Fidelity funds (including the fund) have appropriately benefited from any such economies of scale, and whether there is potential for realization of any further economies of scale. The Board considered the extent to which the fund will benefit from economies of scale as assets grow through increased services to the fund, through waivers or reimbursements, or through fee or expense ratio reductions. The Board also noted that a committee (the Economies of Scale Committee) created by it and the boards of other Fidelity funds periodically analyzes whether Fidelity attains economies of scale in respect of the management and servicing of the Fidelity funds, whether the Fidelity funds have appropriately benefited from such economies of scale, and whether there is potential for realization of any further economies of scale.
The Board recognized that the fund's management contract incorporates a "group fee" structure, which provides for lower group fee rates as total group assets increase, and for higher group fee rates as total group assets decrease (with "group assets" defined to include fund assets under SelectCo's management plus assets under FMR's management). SelectCo calculates the group fee rates based on a tiered asset "breakpoint" schedule that varies based on asset class. The Board considered that the group fee is designed to deliver the benefits of economies of scale to fund shareholders when total group assets increase, even if assets of any particular fund are unchanged or have declined, because some portion of Fidelity's costs are attributable to services provided to all Fidelity funds, and all funds benefit if those costs can be allocated among more assets. The Board concluded that, given the group fee structure, fund shareholders will benefit from lower management fees as group assets increase at the fund complex level, regardless of whether Fidelity achieves any such economies of scale.
The Board concluded, taking into account the analysis of the Economies of Scale Committee, that economies of scale, if any, are being appropriately shared between fund shareholders and Fidelity.
Additional Information Requested by the Board. In order to develop fully the factual basis for consideration of the Fidelity funds' advisory contracts, the Board requested and received additional information on certain topics, including: (i) fund performance trends, in particular the underperformance of certain funds, and Fidelity's long-term strategies for certain funds; (ii) Fidelity's fund profitability methodology, profitability trends for certain funds, and the impact of certain factors on fund profitability results; (iii) metrics for evaluating index fund and ETF performance and information about ETF trading characteristics; (iv) the methodology with respect to the evaluation of competitive fund data and peer group classifications and fee comparisons; (v) the expense structures for different funds and classes; (vi) information regarding other accounts managed by Fidelity, including collective investment trusts; and (vii) Fidelity's philosophies and strategies for evaluating funds and classes with lower or declining asset levels.
Based on its evaluation of all of the conclusions noted above, and after considering all factors it believed relevant, the Board concluded that the advisory fee arrangements are fair and reasonable, and that the fund's Advisory Contracts should be renewed.

REA-SANN-0319
1.706448.120
Fidelity® International Real Estate Fund
Semi-Annual Report January 31, 2019 Includes Fidelity and Fidelity Advisor share classes |
|
Beginning on January 1, 2021, as permitted by regulations adopted by the Securities and Exchange Commission, paper copies of a fund’s shareholder reports will no longer be sent by mail, unless you specifically request paper copies of the reports from the fund or from your financial intermediary, such as a financial advisor, broker-dealer or bank. Instead, the reports will be made available on a website, and you will be notified by mail each time a report is posted and provided with a website link to access the report.
If you already elected to receive shareholder reports electronically, you will not be affected by this change and you need not take any action. You may elect to receive shareholder reports and other communications from a fund electronically, by contacting your financial intermediary. For Fidelity customers, visit Fidelity's web site or call Fidelity using the contact information listed below.
You may elect to receive all future reports in paper free of charge. If you wish to continue receiving paper copies of your shareholder reports, you may contact your financial intermediary or, if you are a Fidelity customer, visit Fidelity’s website, or call Fidelity at the applicable toll-free number listed below. Your election to receive reports in paper will apply to all funds held with the fund complex/your financial intermediary.
| Account Type | Website | Phone Number |
| Brokerage, Mutual Fund, or Annuity Contracts: | fidelity.com/mailpreferences | 1-800-343-3548 |
| Employer Provided Retirement Accounts: | netbenefits.fidelity.com/preferences (choose 'no' under Required Disclosures to continue to print) | 1-800-343-0860 |
| Advisor Sold Accounts Serviced Through Your Financial Intermediary: | Contact Your Financial Intermediary | Your Financial Intermediary's phone number |
| Advisor Sold Accounts Serviced by Fidelity: | institutional.fidelity.com | 1-877-208-0098 |
Contents
To view a fund's proxy voting guidelines and proxy voting record for the 12-month period ended June 30, visit http://www.fidelity.com/proxyvotingresults or visit the Securities and Exchange Commission's (SEC) web site at http://www.sec.gov.
You may also call 1-800-544-8544 if you’re an individual investing directly with Fidelity, call 1-800-835-5092 if you’re a plan sponsor or participant with Fidelity as your recordkeeper or call 1-877-208-0098 on institutional accounts or if you’re an advisor or invest through one to request a free copy of the proxy voting guidelines.
Standard & Poor's, S&P and S&P 500 are registered service marks of The McGraw-Hill Companies, Inc. and have been licensed for use by Fidelity Distributors Corporation.
Other third-party marks appearing herein are the property of their respective owners.
All other marks appearing herein are registered or unregistered trademarks or service marks of FMR LLC or an affiliated company. © 2019 FMR LLC. All rights reserved.
This report and the financial statements contained herein are submitted for the general information of the shareholders of the Fund. This report is not authorized for distribution to prospective investors in the Fund unless preceded or accompanied by an effective prospectus.
A fund files its complete schedule of portfolio holdings with the SEC for the first and third quarters of each fiscal year on Form N-Q. Forms N-Q are available on the SEC’s web site at http://www.sec.gov. A fund's Forms N-Q may be reviewed and copied at the SEC’s Public Reference Room in Washington, DC. Information regarding the operation of the SEC's Public Reference Room may be obtained by calling 1-800-SEC-0330.
For a complete list of a fund's portfolio holdings, view the most recent holdings listing, semiannual report, or annual report on Fidelity's web site at http://www.fidelity.com, http://www.institutional.fidelity.com, or http://www.401k.com, as applicable.
NOT FDIC INSURED •MAY LOSE VALUE •NO BANK GUARANTEE
Neither the Fund nor Fidelity Distributors Corporation is a bank.
Investment Summary (Unaudited)
Top Ten Stocks as of January 31, 2019
| | % of fund's net assets |
| Mitsubishi Estate Co. Ltd. | 6.1 |
| Vonovia SE | 5.2 |
| Mitsui Fudosan Co. Ltd. | 5.1 |
| Irish Residential Properties REIT PLC | 2.9 |
| PSP Swiss Property AG | 2.8 |
| Cheung Kong Property Holdings Ltd. | 2.6 |
| Kojamo OYJ | 2.6 |
| Parkway Life REIT | 2.5 |
| LEG Immobilien AG | 2.4 |
| Advance Residence Investment Corp. | 2.3 |
| | 34.5 |
Top Five Countries as of January 31, 2019
| (excluding cash equivalents) | % of fund's net assets |
| Japan | 19.8 |
| United Kingdom | 12.1 |
| Singapore | 8.6 |
| Germany | 7.9 |
| Bermuda | 6.6 |
Top Five REIT Sectors as of January 31, 2019
| | % of fund's net assets |
| REITs - Diversified | 8.6 |
| REITs - Management/Investment | 7.6 |
| REITs - Apartments | 6.5 |
| REITs - Health Care | 5.3 |
| REITs - Warehouse/Industrial | 3.4 |
Asset Allocation (% of fund's net assets)
| As of January 31, 2019* |
| | Stocks | 96.4% |
| | Short-Term Investments and Net Other Assets (Liabilities) | 3.6% |

* Foreign investments - 94.6%
Schedule of Investments January 31, 2019 (Unaudited)
Showing Percentage of Net Assets
| Common Stocks - 96.4% | | | |
| | | Shares | Value |
| Australia - 5.0% | | | |
| 360 Capital Group Ltd. unit | | 4,004,566 | $3,012,801 |
| Abacus Property Group unit | | 2,247,429 | 6,011,855 |
| Arena (REIT) unit | | 2,310,674 | 4,518,202 |
| Mirvac Group unit | | 3,196,790 | 5,576,992 |
| National Storage (REIT) unit | | 5,022,583 | 6,553,393 |
| Propertylink Group unit | | 1,592,963 | 1,343,193 |
|
| TOTAL AUSTRALIA | | | 27,016,436 |
|
| Bailiwick of Guernsey - 0.6% | | | |
| Sirius Real Estate Ltd. | | 4,087,600 | 3,366,894�� |
| Belgium - 2.1% | | | |
| Aedifica SA | | 29,558 | 2,838,512 |
| Warehouses de Pauw | | 47,076 | 6,875,495 |
| Xior Student Housing NV | | 43,782 | 1,999,504 |
|
| TOTAL BELGIUM | | | 11,713,511 |
|
| Bermuda - 6.6% | | | |
| Great Eagle Holdings Ltd. | | 1,482,752 | 6,870,727 |
| Hongkong Land Holdings Ltd. | | 1,327,200 | 9,516,024 |
| Tai Cheung Holdings Ltd. | | 11,650,000 | 12,086,780 |
| Wing Tai Properties Ltd. | | 9,492,000 | 7,321,806 |
|
| TOTAL BERMUDA | | | 35,795,337 |
|
| Cayman Islands - 2.6% | | | |
| Cheung Kong Property Holdings Ltd. | | 1,703,000 | 14,337,237 |
| Finland - 2.8% | | | |
| Kojamo OYJ | | 1,380,700 | 14,221,563 |
| Suomen Hoivatilat Oyj | | 139,300 | 1,286,703 |
|
| TOTAL FINLAND | | | 15,508,266 |
|
| France - 3.5% | | | |
| Altarea SCA | | 19,194 | 3,972,077 |
| ARGAN SA | | 82,361 | 4,666,385 |
| Societe Fonciere Lyonnaise SA | | 143,644 | 10,193,725 |
|
| TOTAL FRANCE | | | 18,832,187 |
|
| Germany - 7.9% | | | |
| DIC Asset AG | | 161,800 | 1,826,035 |
| LEG Immobilien AG | | 110,078 | 12,914,516 |
| Vonovia SE | | 565,554 | 28,359,663 |
|
| TOTAL GERMANY | | | 43,100,214 |
|
| Greece - 0.7% | | | |
| Grivalia Properties REIC | | 386,791 | 3,740,992 |
| Hong Kong - 3.5% | | | |
| Hysan Development Co. Ltd. | | 1,578,703 | 8,215,343 |
| Magnificent Hotel Investment Ltd. | | 173,411,000 | 3,916,578 |
| Sino Land Ltd. | | 3,957,415 | 7,116,567 |
|
| TOTAL HONG KONG | | | 19,248,488 |
|
| India - 0.5% | | | |
| Oberoi Realty Ltd. | | 401,770 | 2,517,574 |
| Ireland - 3.8% | | | |
| Hibernia (REIT) PLC | | 3,328,671 | 5,006,336 |
| Irish Residential Properties REIT PLC | | 9,212,000 | 15,816,083 |
|
| TOTAL IRELAND | | | 20,822,419 |
|
| Italy - 0.5% | | | |
| COIMA RES SpA (a) | | 291,101 | 2,492,293 |
| Japan - 19.8% | | | |
| Advance Residence Investment Corp. | | 4,188 | 12,380,409 |
| Comforia Residential REIT, Inc. (b) | | 3,358 | 8,900,203 |
| Daibiru Corp. | | 286,400 | 2,850,196 |
| Health Care & Medical Investment Corp. (b)(c) | | 3,627 | 3,899,212 |
| Ichigo, Inc. | | 987,300 | 3,399,013 |
| Japan Rental Housing Investment, Inc. | | 11,674 | 9,174,151 |
| Kenedix, Inc. | | 694,700 | 3,641,714 |
| Mitsubishi Estate Co. Ltd. | | 1,879,700 | 33,210,764 |
| Mitsui Fudosan Co. Ltd. | | 1,145,700 | 27,736,616 |
| Nippon Healthcare Investment Corp. | | 1,800 | 2,829,103 |
|
| TOTAL JAPAN | | | 108,021,381 |
|
| Luxembourg - 0.4% | | | |
| Shurgard Self Storage Europe SARL | | 61,400 | 1,915,790 |
| Mexico - 0.9% | | | |
| Corporacion Inmobiliaria Vesta S.A.B. de CV | | 3,514,062 | 4,921,313 |
| Netherlands - 0.4% | | | |
| NSI NV | | 45,300 | 1,908,094 |
| New Zealand - 1.5% | | | |
| Auckland International Airport Ltd. | | 1,584,199 | 8,048,238 |
| Norway - 1.9% | | | |
| Entra ASA (a) | | 237,200 | 3,431,180 |
| Olav Thon Eiendomsselskap A/S | | 229,458 | 3,906,849 |
| Self Storage Group ASA (d) | | 1,368,752 | 2,921,233 |
|
| TOTAL NORWAY | | | 10,259,262 |
|
| Singapore - 8.6% | | | |
| Parkway Life REIT | | 6,395,700 | 13,635,165 |
| United Industrial Corp. Ltd. | | 4,383,600 | 9,736,268 |
| UOL Group Ltd. | | 2,313,247 | 11,409,865 |
| Wing Tai Holdings Ltd. | | 8,037,781 | 12,239,973 |
|
| TOTAL SINGAPORE | | | 47,021,271 |
|
| Spain - 0.7% | | | |
| Melia Hotels International SA | | 388,100 | 3,893,582 |
| Sweden - 5.4% | | | |
| Amasten Holding AB (d)(e) | | 11,089,947 | 5,356,012 |
| Catena AB | | 113,300 | 3,049,014 |
| D. Carnegie & Co. AB (d) | | 373,400 | 6,792,580 |
| Fastighets AB Trianon Class B (c) | | 343,625 | 2,468,475 |
| Hufvudstaden AB Series A | | 724,750 | 12,030,641 |
|
| TOTAL SWEDEN | | | 29,696,722 |
|
| Switzerland - 2.8% | | | |
| PSP Swiss Property AG | | 149,034 | 15,316,280 |
| United Kingdom - 12.1% | | | |
| Assura PLC | | 11,114,201 | 8,717,277 |
| Big Yellow Group PLC | | 506,464 | 6,367,106 |
| Grainger Trust PLC | | 3,574,596 | 10,708,397 |
| Great Portland Estates PLC | | 507,118 | 4,866,800 |
| Helical Bar PLC | | 1,897,751 | 8,363,343 |
| Land Securities Group PLC | | 793,897 | 9,009,114 |
| Safestore Holdings PLC | | 668,333 | 5,057,899 |
| Shaftesbury PLC | | 895,400 | 10,358,267 |
| St. Modwen Properties PLC | | 471,025 | 2,534,201 |
|
| TOTAL UNITED KINGDOM | | | 65,982,404 |
|
| United States of America - 1.8% | | | |
| CoStar Group, Inc. (d) | | 10,700 | 4,180,918 |
| Prologis, Inc. | | 81,000 | 5,601,960 |
|
| TOTAL UNITED STATES OF AMERICA | | | 9,782,878 |
|
| TOTAL COMMON STOCKS | | | |
| (Cost $515,598,146) | | | 525,259,063 |
|
| Money Market Funds - 3.6% | | | |
| Fidelity Cash Central Fund, 2.43% (f) | | 19,406,533 | 19,410,414 |
| Fidelity Securities Lending Cash Central Fund 2.43% (f)(g) | | 267,316 | 267,343 |
| TOTAL MONEY MARKET FUNDS | | | |
| (Cost $19,677,647) | | | 19,677,757 |
| TOTAL INVESTMENT IN SECURITIES - 100.0% | | | |
| (Cost $535,275,793) | | | 544,936,820 |
| NET OTHER ASSETS (LIABILITIES) - 0.0% | | | 237,207 |
| NET ASSETS - 100% | | | $545,174,027 |
Categorizations in the Schedule of Investments are based on country or territory of incorporation.
Legend
(a) Security exempt from registration under Rule 144A of the Securities Act of 1933. These securities may be resold in transactions exempt from registration, normally to qualified institutional buyers. At the end of the period, the value of these securities amounted to $5,923,473 or 1.1% of net assets.
(b) Security or a portion of the security purchased on a delayed delivery or when-issued basis.
(c) Security or a portion of the security is on loan at period end.
(d) Non-income producing
(e) Affiliated company
(f) Affiliated fund that is generally available only to investment companies and other accounts managed by Fidelity Investments. The rate quoted is the annualized seven-day yield of the fund at period end. A complete unaudited listing of the fund's holdings as of its most recent quarter end is available upon request. In addition, each Fidelity Central Fund's financial statements are available on the SEC's website or upon request.
(g) Investment made with cash collateral received from securities on loan.
Affiliated Central Funds
Information regarding fiscal year to date income earned by the Fund from investments in Fidelity Central Funds is as follows:
| Fund | Income earned |
| Fidelity Cash Central Fund | $207,884 |
| Fidelity Securities Lending Cash Central Fund | 720 |
| Total | $208,604 |
Amounts in the income column in the above table include any capital gain distributions from underlying funds, which are presented in the corresponding line-item in the Statement of Operations, if applicable.
Other Affiliated Issuers
An affiliated company is a company in which the Fund has ownership of at least 5% of the voting securities. Fiscal year to date transactions with companies which are or were affiliates are as follows:
| Affiliate | Value, beginning of period | Purchases | Sales Proceeds | Dividend Income | Realized Gain (loss) | Change in Unrealized appreciation (depreciation) | Value, end of period |
| Amasten Holding AB | $6,775,104 | $-- | $681,127 | $-- | $(28,251) | $(709,714) | $5,356,012 |
| Total | $6,775,104 | $-- | $681,127 | $-- | $(28,251) | $(709,714) | $5,356,012 |
Investment Valuation
The following is a summary of the inputs used, as of January 31, 2019, involving the Fund's assets and liabilities carried at fair value. The inputs or methodology used for valuing securities may not be an indication of the risk associated with investing in those securities. For more information on valuation inputs, and their aggregation into the levels used below, please refer to the Investment Valuation section in the accompanying Notes to Financial Statements.
| | Valuation Inputs at Reporting Date: |
| Description | Total | Level 1 | Level 2 | Level 3 |
| Investments in Securities: | | | | |
| Equities: | | | | |
| Consumer Discretionary | $10,731,393 | $6,814,815 | $3,916,578 | $-- |
| Financials | 1,343,193 | 1,343,193 | -- | -- |
| Industrials | 12,229,156 | 12,229,156 | -- | -- |
| Real Estate | 500,955,321 | 445,006,861 | 55,948,460 | -- |
| Money Market Funds | 19,677,757 | 19,677,757 | -- | -- |
| Total Investments in Securities: | $544,936,820 | $485,071,782 | $59,865,038 | $-- |
See accompanying notes which are an integral part of the financial statements.
Financial Statements
Statement of Assets and Liabilities
| | | January 31, 2019 (Unaudited) |
| Assets | | |
Investment in securities, at value (including securities loaned of $254,049) — See accompanying schedule:
Unaffiliated issuers (cost $510,896,280) | $519,903,051 | |
| Fidelity Central Funds (cost $19,677,647) | 19,677,757 | |
| Other affiliated issuers (cost $4,701,866) | 5,356,012 | |
| Total Investment in Securities (cost $535,275,793) | | $544,936,820 |
| Foreign currency held at value (cost $76,954) | | 76,954 |
| Receivable for investments sold | | 4,000,777 |
| Receivable for fund shares sold | | 954,623 |
| Dividends receivable | | 1,767,936 |
| Distributions receivable from Fidelity Central Funds | | 25,959 |
| Prepaid expenses | | 4,753 |
| Other receivables | | 2,056 |
| Total assets | | 551,769,878 |
| Liabilities | | |
| Payable for investments purchased | | |
| Regular delivery | $3,459,499 | |
| Delayed delivery | 1,826,099 | |
| Payable for fund shares redeemed | 561,087 | |
| Accrued management fee | 302,426 | |
| Distribution and service plan fees payable | 7,375 | |
| Other affiliated payables | 104,411 | |
| Other payables and accrued expenses | 68,214 | |
| Collateral on securities loaned | 266,740 | |
| Total liabilities | | 6,595,851 |
| Net Assets | | $545,174,027 |
| Net Assets consist of: | | |
| Paid in capital | | $549,597,988 |
| Total distributable earnings (loss) | | (4,423,961) |
| Net Assets | | $545,174,027 |
| Net Asset Value and Maximum Offering Price | | |
| Class A: | | |
| Net Asset Value and redemption price per share ($11,521,726 ÷ 998,856 shares) | | $11.53 |
| Maximum offering price per share (100/94.25 of $11.53) | | $12.23 |
| Class M: | | |
| Net Asset Value and redemption price per share ($3,811,823 ÷ 333,176 shares) | | $11.44 |
| Maximum offering price per share (100/96.50 of $11.44) | | $11.85 |
| Class C: | | |
| Net Asset Value and offering price per share ($4,557,851 ÷ 405,223 shares)(a) | | $11.25 |
| International Real Estate: | | |
| Net Asset Value, offering price and redemption price per share ($235,964,299 ÷ 20,197,100 shares) | | $11.68 |
| Class I: | | |
| Net Asset Value, offering price and redemption price per share ($277,282,635 ÷ 23,897,811 shares) | | $11.60 |
| Class Z: | | |
| Net Asset Value, offering price and redemption price per share ($12,035,693 ÷ 1,036,630 shares) | | $11.61 |
(a) Redemption price per share is equal to net asset value less any applicable contingent deferred sales charge.
See accompanying notes which are an integral part of the financial statements.
Statement of Operations
| | | Six months ended January 31, 2019 (Unaudited) |
| Investment Income | | |
| Dividends | | $6,074,599 |
| Income from Fidelity Central Funds | | 208,604 |
| Income before foreign taxes withheld | | 6,283,203 |
| Less foreign taxes withheld | | (464,147) |
| Total income | | 5,819,056 |
| Expenses | | |
| Management fee | $1,930,094 | |
| Transfer agent fees | 518,087 | |
| Distribution and service plan fees | 46,452 | |
| Accounting and security lending fees | 141,926 | |
| Custodian fees and expenses | 88,627 | |
| Independent trustees' fees and expenses | 1,809 | |
| Registration fees | 48,212 | |
| Audit | 29,683 | |
| Legal | 703 | |
| Miscellaneous | 1,971 | |
| Total expenses before reductions | 2,807,564 | |
| Expense reductions | (2,122) | |
| Total expenses after reductions | | 2,805,442 |
| Net investment income (loss) | | 3,013,614 |
| Realized and Unrealized Gain (Loss) | | |
| Net realized gain (loss) on: | | |
| Investment securities: | | |
| Unaffiliated issuers | (9,739,720) | |
| Fidelity Central Funds | (592) | |
| Other affiliated issuers | (28,251) | |
| Foreign currency transactions | (97,476) | |
| Total net realized gain (loss) | | (9,866,039) |
| Change in net unrealized appreciation (depreciation) on: | | |
| Investment securities: | | |
| Unaffiliated issuers | 9,625,978 | |
| Fidelity Central Funds | 805 | |
| Other affiliated issuers | (709,714) | |
| Assets and liabilities in foreign currencies | (1,238) | |
| Total change in net unrealized appreciation (depreciation) | | 8,915,831 |
| Net gain (loss) | | (950,208) |
| Net increase (decrease) in net assets resulting from operations | | $2,063,406 |
See accompanying notes which are an integral part of the financial statements.
Statement of Changes in Net Assets
| | Six months ended January 31, 2019 (Unaudited) | Year ended July 31, 2018 |
| Increase (Decrease) in Net Assets | | |
| Operations | | |
| Net investment income (loss) | $3,013,614 | $12,406,603 |
| Net realized gain (loss) | (9,866,039) | 36,419,216 |
| Change in net unrealized appreciation (depreciation) | 8,915,831 | (7,818,251) |
| Net increase (decrease) in net assets resulting from operations | 2,063,406 | 41,007,568 |
| Distributions to shareholders | (11,430,699) | – |
| Distributions to shareholders from net investment income | – | (10,124,814) |
| Distributions to shareholders from net realized gain | – | (4,548,679) |
| Total distributions | (11,430,699) | (14,673,493) |
| Share transactions - net increase (decrease) | (60,618,184) | 172,199,968 |
| Redemption fees | – | 19,597 |
| Total increase (decrease) in net assets | (69,985,477) | 198,553,640 |
| Net Assets | | |
| Beginning of period | 615,159,504 | 416,605,864 |
| End of period | $545,174,027 | $615,159,504 |
| Other Information | | |
| Undistributed net investment income end of period | | $9,800,848 |
See accompanying notes which are an integral part of the financial statements.
Financial Highlights
Fidelity International Real Estate Fund Class A
| | Six months ended (Unaudited) January 31, | Years endedJuly 31, | | | | |
| | 2019 | 2018 | 2017 | 2016 | 2015 | 2014 |
| Selected Per–Share Data | | | | | | |
| Net asset value, beginning of period | $11.63 | $11.03 | $10.46 | $10.56 | $10.85 | $10.11 |
| Income from Investment Operations | | | | | | |
| Net investment income (loss)A | .04 | .23 | .16 | .15 | .26B | .16 |
| Net realized and unrealized gain (loss) | .06C | .69 | .79 | .02 | (.10)D | 1.09 |
| Total from investment operations | .10 | .92 | .95 | .17 | .16 | 1.25 |
| Distributions from net investment income | (.17) | (.21) | (.13) | (.15) | (.14) | (.16) |
| Distributions from net realized gain | (.03) | (.11) | (.25) | (.12) | (.31) | (.35) |
| Total distributions | (.20) | (.32) | (.38) | (.27) | (.45) | (.51) |
| Redemption fees added to paid in capitalA | – | –E | –E | –E | –E | –E |
| Net asset value, end of period | $11.53 | $11.63 | $11.03 | $10.46 | $10.56 | $10.85 |
| Total ReturnF,G,H | .87% | 8.49% | 9.48% | 1.75% | 1.67%D | 12.85% |
| Ratios to Average Net AssetsI,J | | | | | | |
| Expenses before reductions | 1.33%K | 1.36% | 1.35% | 1.35% | 1.34% | 1.38% |
| Expenses net of fee waivers, if any | 1.33%K | 1.36% | 1.35% | 1.35% | 1.34% | 1.38% |
| Expenses net of all reductions | 1.33%K | 1.35% | 1.35% | 1.33% | 1.34% | 1.38% |
| Net investment income (loss) | .74%K | 2.03% | 1.60% | 1.51% | 2.45%B | 1.57% |
| Supplemental Data | | | | | | |
| Net assets, end of period (000 omitted) | $11,522 | $11,319 | $10,170 | $14,020 | $17,162 | $13,933 |
| Portfolio turnover rateL | 40%K | 56% | 55% | 71% | 82% | 59% |
A Calculated based on average shares outstanding during the period.
B Net investment income per share reflects large, non-recurring dividend which amounted to $.14 per share. Excluding this non-recurring dividend, the ratio of net investment income (loss) to average net assets would have been 1.15%.
C The amount shown for a share outstanding does not correspond with the aggregate net gain (loss) on investments for the period due to the timing of sales and repurchases of shares in relation to fluctuating market values of the investments of the Fund.
D Amount includes a reimbursement from the investment adviser for an operational error which amounted to less than $.01 per share. Excluding this reimbursement, the total return would have been 1.64%.
E Amount represents less than $.005 per share.
F Total returns for periods of less than one year are not annualized.
G Total returns would have been lower if certain expenses had not been reduced during the applicable periods shown.
H Total returns do not include the effect of the sales charges.
I Fees and expenses of any underlying Fidelity Central Funds are not included in the Fund's expense ratio. The Fund indirectly bears its proportionate share of the expenses of any underlying Fidelity Central Funds.
J Expense ratios reflect operating expenses of the class. Expenses before reductions do not reflect amounts reimbursed by the investment adviser or reductions from brokerage service arrangements or reductions from other expense offset arrangements and do not represent the amount paid by the class during periods when reimbursements or reductions occur. Expenses net of fee waivers reflect expenses after reimbursement by the investment adviser but prior to reductions from brokerage service arrangements or other expense offset arrangements. Expenses net of all reductions represent the net expenses paid by the class.
K Annualized
L Amount does not include the portfolio activity of any underlying Fidelity Central Funds.
See accompanying notes which are an integral part of the financial statements.
Fidelity International Real Estate Fund Class M
| | Six months ended (Unaudited) January 31, | Years endedJuly 31, | | | | |
| | 2019 | 2018 | 2017 | 2016 | 2015 | 2014 |
| Selected Per–Share Data | | | | | | |
| Net asset value, beginning of period | $11.53 | $10.93 | $10.39 | $10.49 | $10.76 | $10.04 |
| Income from Investment Operations | | | | | | |
| Net investment income (loss)A | .02 | .20 | .13 | .12 | .22B | .13 |
| Net realized and unrealized gain (loss) | .06C | .68 | .77 | .02 | (.08)D | 1.07 |
| Total from investment operations | .08 | .88 | .90 | .14 | .14 | 1.20 |
| Distributions from net investment income | (.14) | (.17) | (.12) | (.11) | (.10) | (.14) |
| Distributions from net realized gain | (.03) | (.11) | (.25) | (.12) | (.31) | (.35) |
| Total distributions | (.17) | (.28) | (.36)E | (.24)F | (.41) | (.48)G |
| Redemption fees added to paid in capitalA | – | –H | –H | –H | –H | –H |
| Net asset value, end of period | $11.44 | $11.53 | $10.93 | $10.39 | $10.49 | $10.76 |
| Total ReturnI,J,K | .75% | 8.19% | 9.07% | 1.43% | 1.49%D | 12.50% |
| Ratios to Average Net AssetsL,M | | | | | | |
| Expenses before reductions | 1.63%N | 1.65% | 1.65% | 1.66% | 1.64% | 1.66% |
| Expenses net of fee waivers, if any | 1.63%N | 1.65% | 1.65% | 1.66% | 1.64% | 1.66% |
| Expenses net of all reductions | 1.63%N | 1.65% | 1.65% | 1.64% | 1.63% | 1.65% |
| Net investment income (loss) | .45%N | 1.74% | 1.31% | 1.20% | 2.15%B | 1.30% |
| Supplemental Data | | | | | | |
| Net assets, end of period (000 omitted) | $3,812 | $4,360 | $4,147 | $4,545 | $4,939 | $5,563 |
| Portfolio turnover rateO | 40%N | 56% | 55% | 71% | 82% | 59% |
A Calculated based on average shares outstanding during the period.
B Net Investment income per share reflects a large, non-recurring dividend which amounted to $.14 per share. Excluding this non-recurring dividend, the ratio of net investment income (loss) to average net assets would have been .86%.
C The amount shown for a share outstanding does not correspond with the aggregate net gain (loss) on investments for the period due to the timing of sales and repurchases of shares in relation to fluctuating market values of the investments of the Fund.
D Amount includes a reimbursement from the investment adviser for an operational error which amounted to less than $.01 per share. Excluding this reimbursement, the total return would have been 1.46%.
E Total distributions of $.36 per share is comprised of distributions from net investment income of $.115 and distributions from net realized gain of $.246 per share.
F Total distributions of $.24 per share is comprised of distributions from net investment income of $.114 and distributions from net realized gain of $.121 per share.
G Total distributions of $.48 per share is comprised of distributions from net investment income of $.136 and distributions from net realized gain of $.348 per share.
H Amount represents less than $.005 per share.
I Total returns for periods of less than one year are not annualized.
J Total returns would have been lower if certain expenses had not been reduced during the applicable periods shown.
K Total returns do not include the effect of the sales charges.
L Fees and expenses of any underlying Fidelity Central Funds are not included in the Fund's expense ratio. The Fund indirectly bears its proportionate share of the expenses of any underlying Fidelity Central Funds.
M Expense ratios reflect operating expenses of the class. Expenses before reductions do not reflect amounts reimbursed by the investment adviser or reductions from brokerage service arrangements or reductions from other expense offset arrangements and do not represent the amount paid by the class during periods when reimbursements or reductions occur. Expenses net of fee waivers reflect expenses after reimbursement by the investment adviser but prior to reductions from brokerage service arrangements or other expense offset arrangements. Expenses net of all reductions represent the net expenses paid by the class.
N Annualized
O Amount does not include the portfolio activity of any underlying Fidelity Central Funds.
See accompanying notes which are an integral part of the financial statements.
Fidelity International Real Estate Fund Class C
| | Six months ended (Unaudited) January 31, | Years endedJuly 31, | | | | |
| | 2019 | 2018 | 2017 | 2016 | 2015 | 2014 |
| Selected Per–Share Data | | | | | | |
| Net asset value, beginning of period | $11.33 | $10.73 | $10.21 | $10.32 | $10.60 | $9.89 |
| Income from Investment Operations | | | | | | |
| Net investment income (loss)A | –B | .15 | .09 | .07 | .17C | .08 |
| Net realized and unrealized gain (loss) | .07D | .67 | .76 | .02 | (.08)E | 1.07 |
| Total from investment operations | .07 | .82 | .85 | .09 | .09 | 1.15 |
| Distributions from net investment income | (.12) | (.10) | (.09) | (.07) | (.07) | (.09) |
| Distributions from net realized gain | (.03) | (.11) | (.25) | (.12) | (.30) | (.35) |
| Total distributions | (.15) | (.22)F | (.33)G | (.20)H | (.37) | (.44) |
| Redemption fees added to paid in capitalA | – | –B | –B | –B | –B | –B |
| Net asset value, end of period | $11.25 | $11.33 | $10.73 | $10.21 | $10.32 | $10.60 |
| Total ReturnI,J,K | .64% | 7.70% | 8.69% | .93% | .97%E | 12.04% |
| Ratios to Average Net AssetsL,M | | | | | | |
| Expenses before reductions | 2.02%N | 2.05% | 2.09% | 2.10% | 2.09% | 2.13% |
| Expenses net of fee waivers, if any | 2.02%N | 2.04% | 2.08% | 2.10% | 2.09% | 2.13% |
| Expenses net of all reductions | 2.02%N | 2.04% | 2.08% | 2.09% | 2.09% | 2.13% |
| Net investment income (loss) | .05%N | 1.35% | .87% | .75% | 1.70%C | .82% |
| Supplemental Data | | | | | | |
| Net assets, end of period (000 omitted) | $4,558 | $4,894 | $4,818 | $5,668 | $6,548 | $6,504 |
| Portfolio turnover rateO | 40%N | 56% | 55% | 71% | 82% | 59% |
A Calculated based on average shares outstanding during the period.
B Amount represents less than $.005 per share.
C Net Investment income per share reflects a large, non-recurring dividend which amounted to $.13 per share. Excluding this non-recurring dividend, the ratio of net investment income (loss) to average net assets would have been .41%.
D The amount shown for a share outstanding does not correspond with the aggregate net gain (loss) on investments for the period due to the timing of sales and repurchases of shares in relation to fluctuating market values of the investments of the Fund.
E Amount includes a reimbursement from the investment adviser for an operational error which amounted to less than $.01 per share. Excluding this reimbursement, the total return would have been .94%.
F Total distributions of $.22 per share is comprised of distributions from net investment income of $.103 and distributions from net realized gain of $.112 per share.
G Total distributions of $.33 per share is comprised of distributions from net investment income of $.085 and distributions from net realized gain of $.246 per share.
H Total distributions of $.20 per share is comprised of distributions from net investment income of $.074 and distributions from net realized gain of $.121 per share.
I Total returns for periods of less than one year are not annualized.
J Total returns would have been lower if certain expenses had not been reduced during the applicable periods shown.
K Total returns do not include the effect of the contingent deferred sales charge.
L Fees and expenses of any underlying Fidelity Central Funds are not included in the Fund's expense ratio. The Fund indirectly bears its proportionate share of the expenses of any underlying Fidelity Central Funds.
M Expense ratios reflect operating expenses of the class. Expenses before reductions do not reflect amounts reimbursed by the investment adviser or reductions from brokerage service arrangements or reductions from other expense offset arrangements and do not represent the amount paid by the class during periods when reimbursements or reductions occur. Expenses net of fee waivers reflect expenses after reimbursement by the investment adviser but prior to reductions from brokerage service arrangements or other expense offset arrangements. Expenses net of all reductions represent the net expenses paid by the class.
N Annualized
O Amount does not include the portfolio activity of any underlying Fidelity Central Funds.
See accompanying notes which are an integral part of the financial statements.
Fidelity International Real Estate Fund
| | Six months ended (Unaudited) January 31, | Years endedJuly 31, | | | | |
| | 2019 | 2018 | 2017 | 2016 | 2015 | 2014 |
| Selected Per–Share Data | | | | | | |
| Net asset value, beginning of period | $11.78 | $11.17 | $10.58 | $10.68 | $10.96 | $10.21 |
| Income from Investment Operations | | | | | | |
| Net investment income (loss)A | .06 | .27 | .19 | .17 | .28B | .19 |
| Net realized and unrealized gain (loss) | .06C | .70 | .79 | .02 | (.09)D | 1.09 |
| Total from investment operations | .12 | .97 | .98 | .19 | .19 | 1.28 |
| Distributions from net investment income | (.19) | (.24) | (.15) | (.17) | (.16) | (.18) |
| Distributions from net realized gain | (.03) | (.11) | (.25) | (.12) | (.31) | (.35) |
| Total distributions | (.22) | (.36)E | (.39)F | (.29) | (.47) | (.53) |
| Redemption fees added to paid in capitalA | – | –G | –G | –G | –G | –G |
| Net asset value, end of period | $11.68 | $11.78 | $11.17 | $10.58 | $10.68 | $10.96 |
| Total ReturnH,I | 1.04% | 8.84% | 9.74% | 1.94% | 1.95%D | 13.12% |
| Ratios to Average Net AssetsJ,K | | | | | | |
| Expenses before reductions | 1.03%L | 1.05% | 1.12% | 1.13% | 1.12% | 1.13% |
| Expenses net of fee waivers, if any | 1.03%L | 1.05% | 1.12% | 1.13% | 1.12% | 1.13% |
| Expenses net of all reductions | 1.03%L | 1.04% | 1.11% | 1.11% | 1.12% | 1.13% |
| Net investment income (loss) | 1.04%L | 2.34% | 1.84% | 1.73% | 2.67%B | 1.82% |
| Supplemental Data | | | | | | |
| Net assets, end of period (000 omitted) | $235,964 | $244,195 | $226,027 | $341,407 | $330,910 | $342,960 |
| Portfolio turnover rateM | 40%L | 56% | 55% | 71% | 82% | 59% |
A Calculated based on average shares outstanding during the period.
B Net Investment income per share reflects a large, non-recurring dividend which amounted to $.14 per share. Excluding this non-recurring dividend, the ratio of net investment income (loss) to average net assets would have been 1.38%.
C The amount shown for a share outstanding does not correspond with the aggregate net gain (loss) on investments for the period due to the timing of sales and repurchases of shares in relation to fluctuating market values of the investments of the Fund.
D Amount includes a reimbursement from the investment adviser for an operational error which amounted to less than $.01 per share. Excluding this reimbursement, the total return would have been 1.92%.
E Total distributions of $.36 per share is comprised of distributions from net investment income of $.244 and distributions from net realized gain of $.112 per share.
F Total distributions of $.39 per share is comprised of distributions from net investment income of $.147 and distributions from net realized gain of $.246 per share.
G Amount represents less than $.005 per share.
H Total returns for periods of less than one year are not annualized.
I Total returns would have been lower if certain expenses had not been reduced during the applicable periods shown.
J Fees and expenses of any underlying Fidelity Central Funds are not included in the Fund's expense ratio. The Fund indirectly bears its proportionate share of the expenses of any underlying Fidelity Central Funds.
K Expense ratios reflect operating expenses of the class. Expenses before reductions do not reflect amounts reimbursed by the investment adviser or reductions from brokerage service arrangements or reductions from other expense offset arrangements and do not represent the amount paid by the class during periods when reimbursements or reductions occur. Expenses net of fee waivers reflect expenses after reimbursement by the investment adviser but prior to reductions from brokerage service arrangements or other expense offset arrangements. Expenses net of all reductions represent the net expenses paid by the class.
L Annualized
M Amount does not include the portfolio activity of any underlying Fidelity Central Funds.
See accompanying notes which are an integral part of the financial statements.
Fidelity International Real Estate Fund Class I
| | Six months ended (Unaudited) January 31, | Years endedJuly 31, | | | | |
| | 2019 | 2018 | 2017 | 2016 | 2015 | 2014 |
| Selected Per–Share Data | | | | | | |
| Net asset value, beginning of period | $11.70 | $11.13 | $10.54 | $10.64 | $10.92 | $10.18 |
| Income from Investment Operations | | | | | | |
| Net investment income (loss)A | .06 | .28 | .20 | .19 | .29B | .19 |
| Net realized and unrealized gain (loss) | .06C | .68 | .79 | .02 | (.09)D | 1.09 |
| Total from investment operations | .12 | .96 | .99 | .21 | .20 | 1.28 |
| Distributions from net investment income | (.19) | (.28) | (.16) | (.19) | (.17) | (.19) |
| Distributions from net realized gain | (.03) | (.11) | (.25) | (.12) | (.31) | (.35) |
| Total distributions | (.22) | (.39) | (.40)E | (.31) | (.48) | (.54) |
| Redemption fees added to paid in capitalA | – | –F | –F | –F | –F | –F |
| Net asset value, end of period | $11.60 | $11.70 | $11.13 | $10.54 | $10.64 | $10.92 |
| Total ReturnG,H | 1.12% | 8.88% | 9.89% | 2.15% | 2.01%D | 13.16% |
| Ratios to Average Net AssetsI,J | | | | | | |
| Expenses before reductions | .94%K | .96% | .95% | .97% | 1.03% | 1.12% |
| Expenses net of fee waivers, if any | .94%K | .96% | .95% | .97% | 1.03% | 1.12% |
| Expenses net of all reductions | .94%K | .95% | .95% | .96% | 1.03% | 1.12% |
| Net investment income (loss) | 1.13%K | 2.44% | 2.00% | 1.89% | 2.76%B | 1.84% |
| Supplemental Data | | | | | | |
| Net assets, end of period (000 omitted) | $277,283 | $350,392 | $171,444 | $98,238 | $37,426 | $7,336 |
| Portfolio turnover rateL | 40%K | 56% | 55% | 71% | 82% | 59% |
A Calculated based on average shares outstanding during the period.
B Net Investment income per share reflects a large, non-recurring dividend which amounted to $.14 per share. Excluding this non-recurring dividend, the ratio of net investment income (loss) to average net assets would have been 1.46%.
C The amount shown for a share outstanding does not correspond with the aggregate net gain (loss) on investments for the period due to the timing of sales and repurchases of shares in relation to fluctuating market values of the investments of the Fund.
D Amount includes a reimbursement from the investment adviser for an operational error which amounted to less than $.01 per share. Excluding this reimbursement, the total return would have been 1.98%.
E Total distributions of $.40 per share is comprised of distributions from net investment income of $.157 and distributions from net realized gain of $.246 per share.
F Amount represents less than $.005 per share.
G Total returns for periods of less than one year are not annualized.
H Total returns would have been lower if certain expenses had not been reduced during the applicable periods shown.
I Fees and expenses of any underlying Fidelity Central Funds are not included in the Fund's expense ratio. The Fund indirectly bears its proportionate share of the expenses of any underlying Fidelity Central Funds.
J Expense ratios reflect operating expenses of the class. Expenses before reductions do not reflect amounts reimbursed by the investment adviser or reductions from brokerage service arrangements or reductions from other expense offset arrangements and do not represent the amount paid by the class during periods when reimbursements or reductions occur. Expenses net of fee waivers reflect expenses after reimbursement by the investment adviser but prior to reductions from brokerage service arrangements or other expense offset arrangements. Expenses net of all reductions represent the net expenses paid by the class.
K Annualized
L Amount does not include the portfolio activity of any underlying Fidelity Central Funds.
See accompanying notes which are an integral part of the financial statements.
Fidelity International Real Estate Fund Class Z
| | Six months ended (Unaudited) January 31, |
| | 2019 A |
| Selected Per–Share Data | |
| Net asset value, beginning of period | $11.16 |
| Income from Investment Operations | |
| Net investment income (loss)B | .06 |
| Net realized and unrealized gain (loss) | .39C |
| Total from investment operations | .45 |
| Distributions from net investment income | – |
| Distributions from net realized gain | – |
| Total distributions | – |
| Net asset value, end of period | $11.61 |
| Total ReturnD,E | 4.03% |
| Ratios to Average Net AssetsF,G | |
| Expenses before reductions | .84%H |
| Expenses net of fee waivers, if any | .84%H |
| Expenses net of all reductions | .84%H |
| Net investment income (loss) | 1.83%H |
| Supplemental Data | |
| Net assets, end of period (000 omitted) | $12,036 |
| Portfolio turnover rateI | 40%H |
A For the period October 2, 2018 (commencement of sale of shares) to January 31, 2019.
B Calculated based on average shares outstanding during the period.
C The amount shown for a share outstanding does not correspond with the aggregate net gain (loss) on investments for the period due to the timing of sales and repurchases of shares in relation to fluctuating market values of the investments of the Fund.
D Total returns for periods of less than one year are not annualized.
E Total returns would have been lower if certain expenses had not been reduced during the applicable periods shown.
F Fees and expenses of any underlying Fidelity Central Funds are not included in the Fund's expense ratio. The Fund indirectly bears its proportionate share of the expenses of any underlying Fidelity Central Funds.
G Expense ratios reflect operating expenses of the class. Expenses before reductions do not reflect amounts reimbursed by the investment adviser or reductions from brokerage service arrangements or reductions from other expense offset arrangements and do not represent the amount paid by the class during periods when reimbursements or reductions occur. Expense ratios before reductions for start-up periods may not be representative of longer-term operating periods. Expenses net of fee waivers reflect expenses after reimbursement by the investment adviser but prior to reductions from brokerage service arrangements or other expense offset arrangements. Expenses net of all reductions represent the net expenses paid by the class.
H Annualized
I Amount does not include the portfolio activity of any underlying Fidelity Central Funds.
See accompanying notes which are an integral part of the financial statements.
Notes to Financial Statements (Unaudited)
For the period ended January 31, 2019
1. Organization.
Fidelity International Real Estate Fund (the Fund) is a non-diversified fund of Fidelity Select Portfolios (the Trust) and is authorized to issue an unlimited number of shares. The Trust is registered under the Investment Company Act of 1940, as amended (the 1940 Act), as an open-end management investment company organized as a Massachusetts business trust. The Fund commenced sale of Class Z shares on October 2, 2018. The Fund offers Class A, Class M, Class C, International Real Estate, Class I and Class Z shares, each of which has equal rights as to assets and voting privileges. Each class has exclusive voting rights with respect to matters that affect that class.
Effective March 1, 2019, Class C shares will automatically convert to Class A shares after a holding period of ten years from the initial date of purchase, with certain exceptions.
2. Investments in Fidelity Central Funds.
The Fund invests in Fidelity Central Funds, which are open-end investment companies generally available only to other investment companies and accounts managed by the investment adviser and its affiliates. The Fund's Schedule of Investments lists each of the Fidelity Central Funds held as of period end, if any, as an investment of the Fund, but does not include the underlying holdings of each Fidelity Central Fund. As an Investing Fund, the Fund indirectly bears its proportionate share of the expenses of the underlying Fidelity Central Funds.
The Money Market Central Funds seek preservation of capital and current income and are managed by Fidelity Investments Money Management, Inc. (FIMM), an affiliate of the investment adviser. Annualized expenses of the Money Market Central Funds as of their most recent shareholder report date are less than .005%.
A complete unaudited list of holdings for each Fidelity Central Fund is available upon request or at the Securities and Exchange Commission (the SEC) website at www.sec.gov. In addition, the financial statements of the Fidelity Central Funds are available on the SEC website or upon request.
3. Significant Accounting Policies.
The Fund is an investment company and applies the accounting and reporting guidance of the Financial Accounting Standards Board (FASB) Accounting Standards Codification Topic 946 Financial Services – Investments Companies. The financial statements have been prepared in conformity with accounting principles generally accepted in the United States of America (GAAP), which require management to make certain estimates and assumptions at the date of the financial statements. Actual results could differ from those estimates. Subsequent events, if any, through the date that the financial statements were issued have been evaluated in the preparation of the financial statements. The following summarizes the significant accounting policies of the Fund:
Investment Valuation. Investments are valued as of 4:00 p.m. Eastern time on the last calendar day of the period. The Board of Trustees (the Board) has delegated the day to day responsibility for the valuation of the Fund's investments to the Fair Value Committee (the Committee) established by the Fund's investment adviser. In accordance with valuation policies and procedures approved by the Board, the Fund attempts to obtain prices from one or more third party pricing vendors or brokers to value its investments. When current market prices, quotations or currency exchange rates are not readily available or reliable, investments will be fair valued in good faith by the Committee, in accordance with procedures adopted by the Board. Factors used in determining fair value vary by investment type and may include market or investment specific events. The frequency with which these procedures are used cannot be predicted and they may be utilized to a significant extent. The Committee oversees the Fund's valuation policies and procedures and reports to the Board on the Committee's activities and fair value determinations. The Board monitors the appropriateness of the procedures used in valuing the Fund's investments and ratifies the fair value determinations of the Committee.
The Fund categorizes the inputs to valuation techniques used to value its investments into a disclosure hierarchy consisting of three levels as shown below:
- Level 1 – quoted prices in active markets for identical investments
- Level 2 – other significant observable inputs (including quoted prices for similar investments, interest rates, prepayment speeds, etc.)
- Level 3 – unobservable inputs (including the Fund's own assumptions based on the best information available)
Valuation techniques used to value the Fund's investments by major category are as follows:
Equity securities, including restricted securities, for which market quotations are readily available, are valued at the last reported sale price or official closing price as reported by a third party pricing vendor on the primary market or exchange on which they are traded and are categorized as Level 1 in the hierarchy. In the event there were no sales during the day or closing prices are not available, securities are valued at the last quoted bid price or may be valued using the last available price and are generally categorized as Level 2 in the hierarchy. For foreign equity securities, when market or security specific events arise, comparisons to the valuation of American Depositary Receipts (ADRs), futures contracts, Exchange-Traded Funds (ETFs) and certain indexes as well as quoted prices for similar securities may be used and would be categorized as Level 2 in the hierarchy. For equity securities, including restricted securities, where observable inputs are limited, assumptions about market activity and risk are used and these securities may be categorized as Level 3 in the hierarchy.
Investments in open-end mutual funds, including the Fidelity Central Funds, are valued at their closing net asset value (NAV) each business day and are categorized as Level 1 in the hierarchy.
Changes in valuation techniques may result in transfers in or out of an assigned level within the disclosure hierarchy. The aggregate value of investments by input level as of January 31, 2019 is included at the end of the Fund's Schedule of Investments.
Foreign Currency. The Fund may use foreign currency contracts to facilitate transactions in foreign-denominated securities. Gains and losses from these transactions may arise from changes in the value of the foreign currency or if the counterparties do not perform under the contracts' terms.
Foreign-denominated assets, including investment securities, and liabilities are translated into U.S. dollars at the exchange rates at period end. Purchases and sales of investment securities, income and dividends received and expenses denominated in foreign currencies are translated into U.S. dollars at the exchange rate in effect on the transaction date.
The effects of exchange rate fluctuations on investments are included with the net realized and unrealized gain (loss) on investment securities. Other foreign currency transactions resulting in realized and unrealized gain (loss) are disclosed separately.
Investment Transactions and Income. For financial reporting purposes, the Fund's investment holdings and NAV include trades executed through the end of the last business day of the period. The NAV per share for processing shareholder transactions is calculated as of the close of business of the New York Stock Exchange (NYSE), normally 4:00 p.m. Eastern time and includes trades executed through the end of the prior business day. Gains and losses on securities sold are determined on the basis of identified cost. Dividend income is recorded on the ex-dividend date, except for certain dividends from foreign securities where the ex-dividend date may have passed, which are recorded as soon as the Fund is informed of the ex-dividend date. Non-cash dividends included in dividend income, if any, are recorded at the fair market value of the securities received. Income and capital gain distributions from Fidelity Central Funds, if any, are recorded on the ex-dividend date. Investment income is recorded net of foreign taxes withheld where recovery of such taxes is uncertain.
Class Allocations and Expenses. Investment income, realized and unrealized capital gains and losses, common expenses of the Fund, and certain fund-level expense reductions, if any, are allocated daily on a pro-rata basis to each class based on the relative net assets of each class to the total net assets of the Fund. Each class differs with respect to transfer agent and distribution and service plan fees incurred. Certain expense reductions may also differ by class. For the reporting period, the allocated portion of income and expenses to each class as a percent of its average net assets may vary due to the timing of recording these transactions in relation to fluctuating net assets of the classes. Expenses directly attributable to a fund are charged to that fund. Expenses attributable to more than one fund are allocated among the respective funds on the basis of relative net assets or other appropriate methods. Expense estimates are accrued in the period to which they relate and adjustments are made when actual amounts are known.
Income Tax Information and Distributions to Shareholders. Each year, the Fund intends to qualify as a regulated investment company under Subchapter M of the Internal Revenue Code, including distributing substantially all of its taxable income and realized gains. As a result, no provision for U.S. Federal income taxes is required. The Fund files a U.S. federal tax return, in addition to state and local tax returns as required. The Fund's federal income tax returns are subject to examination by the Internal Revenue Service (IRS) for a period of three fiscal years after they are filed. State and local tax returns may be subject to examination for an additional fiscal year depending on the jurisdiction. Foreign taxes are provided for based on the Fund's understanding of the tax rules and rates that exist in the foreign markets in which it invests.
Distributions are declared and recorded on the ex-dividend date. Income and capital gain distributions are declared separately for each class. Income and capital gain distributions are determined in accordance with income tax regulations, which may differ from GAAP.
Capital accounts within the financial statements are adjusted for permanent book-tax differences. These adjustments have no impact on net assets or the results of operations. Capital accounts are not adjusted for temporary book-tax differences which will reverse in a subsequent period.
Book-tax differences are primarily due to foreign currency transactions, certain foreign taxes, passive foreign investment companies (PFIC), capital loss carryforwards, expiring capital loss carryforwards and losses deferred due to wash sales.
As of period end, the cost and unrealized appreciation (depreciation) in securities, and derivatives if applicable, for federal income tax purposes were as follows:
| Gross unrealized appreciation | $32,582,908 |
| Gross unrealized depreciation | (29,371,959) |
| Net unrealized appreciation (depreciation) | $3,210,949 |
| Tax cost | $541,725,871 |
Delayed Delivery Transactions and When-Issued Securities. During the period, the Fund transacted in securities on a delayed delivery or when-issued basis. Payment and delivery may take place after the customary settlement period for that security. The price of the underlying securities and the date when the securities will be delivered and paid for are fixed at the time the transaction is negotiated. The securities purchased on a delayed delivery or when-issued basis are identified as such in the Fund's Schedule of Investments. Losses may arise due to changes in the value of the underlying securities or if the counterparty does not perform under the contract's terms, or if the issuer does not issue the securities due to political, economic, or other factors.
Restricted Securities. The Fund may invest in securities that are subject to legal or contractual restrictions on resale. These securities generally may be resold in transactions exempt from registration or to the public if the securities are registered. Disposal of these securities may involve time-consuming negotiations and expense, and prompt sale at an acceptable price may be difficult. Information regarding restricted securities is included at the end of the Fund's Schedule of Investments.
New Rule Issuance. During August 2018, the U.S. Securities and Exchange Commission issued Final Rule Release No. 33-10532, Disclosure Update and Simplification. This Final Rule includes amendments specific to registered investment companies that are intended to eliminate overlap in disclosure requirements between Regulation S-X and GAAP. In accordance with these amendments, certain line-items in the Fund's financial statements have been combined or removed for the current period as outlined in the table below.
| Financial Statement | Current Line-Item Presentation (As Applicable) | Prior Line-Item Presentation (As Applicable) |
| Statement of Assets and Liabilities | Total distributable earnings (loss) | Undistributed/Distributions in excess of/Accumulated net investment income (loss)
Accumulated/Undistributed net realized gain (loss)
Net unrealized appreciation (depreciation) |
| Statement of Changes in Net Assets | N/A - removed | Undistributed/Distributions in excess of/Accumulated net investment income (loss) end of period |
| Statement of Changes in Net Assets | Distributions to shareholders | Distributions to shareholders from net investment income
Distributions to shareholders from net realized gain |
| Distributions to Shareholders Note to Financial Statements | Distributions to shareholders | Distributions to shareholders from net investment income
Distributions to shareholders from net realized gain |
4. Purchases and Sales of Investments.
Purchases and sales of securities, other than short-term securities, aggregated $108,776,401 and $171,885,360, respectively.
5. Fees and Other Transactions with Affiliates.
Management Fee. Fidelity SelectCo, LLC (the investment adviser) and its affiliates provide the Fund with investment management related services for which the Fund pays a monthly management fee. The management fee is the sum of an individual fund fee rate that is based on an annual rate of .45% of the Fund's average net assets and an annualized group fee rate that averaged .24% during the period. The group fee rate is based upon the average net assets of all the mutual funds advised by Fidelity Management & Research Company (FMR) and the investment adviser. The group fee rate decreases as assets under management increase and increases as assets under management decrease. For the reporting period, the total annualized management fee rate was .69% of the Fund's average net assets.
Distribution and Service Plan Fees. In accordance with Rule 12b-1 of the 1940 Act, the Fund has adopted separate Distribution and Service Plans for each class of shares. Certain classes pay Fidelity Distributors Corporation (FDC), an affiliate of the investment adviser, separate Distribution and Service Fees, each of which is based on an annual percentage of each class' average net assets. In addition, FDC may pay financial intermediaries for selling shares of the Fund and providing shareholder support services. For the period, the Distribution and Service Fee rates, total fees and amounts retained by FDC were as follows:
| | Distribution Fee | Service Fee | Total Fees | Retained by FDC |
| Class A | -% | .25% | $13,628 | $585 |
| Class M | .25% | .25% | 9,761 | – |
| Class C | .75% | .25% | 23,063 | 3,788 |
| | | | $46,452 | $4,373 |
Sales Load. FDC may receive a front-end sales charge of up to 5.75% for selling Class A shares and 3.50% for selling Class M shares, some of which is paid to financial intermediaries for selling shares of the Fund. Depending on the holding period, FDC may receive contingent deferred sales charges levied on Class A, Class M and Class C redemptions. The deferred sales charges are 1.00% for Class C shares, 1.00% for certain purchases of Class A shares and .25% for certain purchases of Class M shares.
For the period, sales charge amounts retained by FDC were as follows:
| | Retained by FDC |
| Class A | $2,361 |
| Class M | 265 |
| Class C(a) | 931 |
| | $3,557 |
(a) When Class C shares are initially sold, FDC pays commissions from its own resources to financial intermediaries through which the sales are made.
Transfer Agent Fees. Fidelity Investments Institutional Operations Company, Inc., (FIIOC), an affiliate of the investment adviser, is the transfer, dividend disbursing and shareholder servicing agent for each class of the Fund. FIIOC receives account fees and asset-based fees that vary according to the account size and type of account of the shareholders of the respective classes of the Fund, except for Class Z. FIIOC receives an asset-based fee of Class Z's average net assets. FIIOC pays for typesetting, printing and mailing of shareholder reports, except proxy statements.
For the period, transfer agent fees for each class were as follows:
| | Amount | % of Class-Level Average Net Assets(a) |
| Class A | $15,508 | .28 |
| Class M | 6,466 | .33 |
| Class C | 5,190 | .22 |
| International Real Estate | 269,195 | .24 |
| Class I | 221,392 | .14 |
| Class Z | 336 | .05 |
| | $518,087 | |
(a) Annualized
Accounting and Security Lending Fees. Fidelity Service Company, Inc. (FSC), an affiliate of the investment adviser, maintains the Fund's accounting records. The accounting fee is based on the level of average net assets for each month. Under a separate contract, FSC administers the security lending program. The security lending fee is based on the number and duration of lending transactions. For the period, the fees were equivalent to an annualized rate of .05%.
Brokerage Commissions. The Fund placed a portion of its portfolio transactions with brokerage firms which are affiliates of the investment adviser. Brokerage commissions are included in net realized gain (loss) and change in net unrealized appreciation (depreciation) in the Statement of Operations. The commissions paid to these affiliated firms were $70 for the period.
Interfund Trades. The Fund may purchase from or sell securities to other Fidelity Funds under procedures adopted by the Board. The procedures have been designed to ensure these interfund trades are executed in accordance with Rule 17a-7 of the 1940 Act. Interfund trades are included within the respective purchases and sales amounts shown in the Purchases and Sales of Investments note.
Other. During the period, the investment adviser reimbursed the Fund for certain losses in the amount of $10,144.
6. Committed Line of Credit.
The Fund participates with other funds managed by the investment adviser or an affiliate in a $4.25 billion credit facility (the "line of credit") to be utilized for temporary or emergency purposes to fund shareholder redemptions or for other short-term liquidity purposes. The Fund has agreed to pay commitment fees on its pro-rata portion of the line of credit, which amounted to $764 and is reflected in Miscellaneous expenses on the Statement of Operations. During the period, the Fund did not borrow on this line of credit.
7. Security Lending.
The Fund lends portfolio securities through a lending agent from time to time in order to earn additional income. On the settlement date of the loan, the Fund receives collateral (in the form of U.S. Treasury obligations, letters of credit and/or cash) against the loaned securities and maintains collateral in an amount not less than 100% of the market value of the loaned securities during the period of the loan. The market value of the loaned securities is determined at the close of business of the Fund and any additional required collateral is delivered to the Fund on the next business day. The Fund or borrower may terminate the loan at any time, and if the borrower defaults on its obligation to return the securities loaned because of insolvency or other reasons, the Fund may apply collateral received from the borrower against the obligation. The Fund may experience delays and costs in recovering the securities loaned. Any cash collateral received is invested in the Fidelity Securities Lending Cash Central Fund. The value of loaned securities and cash collateral at period end are disclosed on the Fund's Statement of Assets and Liabilities. Security lending income represents the income earned on investing cash collateral, less rebates paid to borrowers and any lending agent fees associated with the loan, plus any premium payments received for lending certain types of securities. Security lending income is presented in the Statement of Operations as a component of income from Fidelity Central Funds. Total security lending income during the period amounted to $720.
8. Expense Reductions.
Through arrangements with the Fund's custodian, credits realized as a result of certain uninvested cash balances were used to reduce the Fund's expenses. During the period, these credits reduced the Fund's custody expenses by $31.
In addition, during the period the investment adviser reimbursed and/or waived a portion of fund-level operating expenses in the amount of $2,091.
9. Distributions to Shareholders.
Distributions to shareholders of each class were as follows:
| | Six months ended
January 31, 2019 | Year ended
July 31, 2018 |
| Distributions to shareholders | | |
| Class A | $196,960 | $– |
| Class M | 62,893 | – |
| Class C | 65,239 | – |
| International Real Estate | 4,435,790 | – |
| Class I | 6,669,817 | – |
| Total | $11,430,699 | $– |
| From net investment income | | |
| Class A | $– | $195,752 |
| Class M | – | 63,177 |
| Class C | – | 47,241 |
| International Real Estate | – | 4,956,891 |
| Class I | – | 4,861,753 |
| Total | $– | $10,124,814 |
| From net realized gain | | |
| Class A | $– | $107,906 |
| Class M | – | 42,399 |
| Class C | – | 50,358 |
| International Real Estate | – | 2,282,039 |
| Class I | – | 2,065,977 |
| Total | $– | $4,548,679 |
10. Share Transactions.
Share transactions for each class were as follows and may contain automatic conversions between classes or exchanges between affiliated funds:
| | Shares | Shares | Dollars | Dollars |
| | Six months ended January 31, 2019(a) | Year ended July 31, 2018 | Six months ended January 31, 2019(a) | Year ended July 31, 2018 |
| Class A | | | | |
| Shares sold | 347,264 | 339,407 | $3,813,509 | $3,867,962 |
| Reinvestment of distributions | 17,333 | 27,005 | 194,298 | 298,868 |
| Shares redeemed | (339,171) | (314,754) | (3,683,119) | (3,593,331) |
| Net increase (decrease) | 25,426 | 51,658 | $324,688 | $573,499 |
| Class M | | | | |
| Shares sold | 11,618 | 64,048 | $127,011 | $721,867 |
| Reinvestment of distributions | 5,638 | 9,612 | 62,748 | 105,576 |
| Shares redeemed | (62,354) | (74,640) | (683,357) | (848,189) |
| Net increase (decrease) | (45,098) | (980) | $(493,598) | $(20,746) |
| Class C | | | | |
| Shares sold | 21,844 | 112,833 | $240,434 | $1,260,510 |
| Reinvestment of distributions | 5,468 | 8,329 | 59,927 | 90,113 |
| Shares redeemed | (53,854) | (138,261) | (573,743) | (1,536,355) |
| Net increase (decrease) | (26,542) | (17,099) | $(273,382) | $(185,732) |
| International Real Estate | | | | |
| Shares sold | 1,758,501 | 4,614,000 | $19,669,973 | $53,516,447 |
| Reinvestment of distributions | 370,043 | 611,665 | 4,196,287 | 6,842,405 |
| Shares redeemed | (2,665,405) | (4,719,336) | (29,722,314) | (54,484,741) |
| Net increase (decrease) | (536,861) | 506,329 | $(5,856,054) | $5,874,111 |
| Class I | | | | |
| Shares sold | 4,880,753 | 17,465,869 | $53,927,036 | $199,780,614 |
| Reinvestment of distributions | 224,016 | 283,871 | 2,522,420 | 3,154,782 |
| Shares redeemed | (11,151,870) | (3,206,769) | (122,298,349) | (36,976,560) |
| Net increase (decrease) | (6,047,101) | 14,542,971 | $(65,848,893) | $165,958,836 |
| Class Z | | | | |
| Shares sold | 1,052,320 | – | $11,703,478 | $– |
| Shares redeemed | (15,690) | – | (174,423) | – |
| Net increase (decrease) | 1,036,630 | – | $11,529,055 | $– |
(a) Share transactions for Class Z are for the period October 2, 2018 (commencement of sale of shares) to January 31, 2019.
11. Other.
The Fund's organizational documents provide former and current trustees and officers with a limited indemnification against liabilities arising in connection with the performance of their duties to the Fund. In the normal course of business, the Fund may also enter into contracts that provide general indemnifications. The Fund's maximum exposure under these arrangements is unknown as this would be dependent on future claims that may be made against the Fund. The risk of material loss from such claims is considered remote.
At the end of the period, Strategic Advisers International II Fund was the owner of record of approximately 12% of the total outstanding shares of the Fund.
Shareholder Expense Example
As a shareholder of the Fund, you incur two types of costs: (1) transaction costs, including sales charges (loads) on purchase payments or redemption proceeds and (2) ongoing costs, including management fees, distribution and/or service (12b-1) fees and other Fund expenses. This Example is intended to help you understand your ongoing costs (in dollars) of investing in the Fund and to compare these costs with the ongoing costs of investing in other mutual funds.
The actual expense Example is based on an investment of $1,000 invested at the beginning of the period and held for the entire period (August 1, 2018 to January 31, 2019) for Class A, Class M, Class C, Internatioanl Real Estate and Class I and for the period (October 2, 2018 to January 31, 2019) for Class Z. The hypothetical expense Example is based on an investment of $1,000 invested for the one-half year period (August 1, 2018 to January 31, 2019).
Actual Expenses
The first line of the accompanying table for each class of the Fund provides information about actual account values and actual expenses. You may use the information in this line, together with the amount you invested, to estimate the expenses that you paid over the period. Simply divide your account value by $1,000.00 (for example, an $8,600 account value divided by $1,000.00 = 8.6), then multiply the result by the number in the first line for a class of the Fund under the heading entitled "Expenses Paid During Period" to estimate the expenses you paid on your account during this period. In addition, the Fund, as a shareholder in the underlying Fidelity Central Funds, will indirectly bear its pro-rata share of the fees and expenses incurred by the underlying Fidelity Central Funds. These fees and expenses are not included in the Fund's annualized expense ratio used to calculate the expense estimate in the table below.
Hypothetical Example for Comparison Purposes
The second line of the accompanying table for each class of the Fund provides information about hypothetical account values and hypothetical expenses based on a Class' actual expense ratio and an assumed rate of return of 5% per year before expenses, which is not the Class' actual return. The hypothetical account values and expenses may not be used to estimate the actual ending account balance or expenses you paid for the period. You may use this information to compare the ongoing costs of investing in the Fund and other funds. To do so, compare this 5% hypothetical example with the 5% hypothetical examples that appear in the shareholder reports of the other funds. In addition, the Fund, as a shareholder in the underlying Fidelity Central Funds, will indirectly bear its pro-rata share of the fees and expenses incurred by the underlying Fidelity Central Funds. These fees and expenses are not included in the Fund's annualized expense ratio used to calculate the expense estimate in the table below.
Please note that the expenses shown in the table are meant to highlight your ongoing costs only and do not reflect any transaction costs. Therefore, the second line of the table is useful in comparing ongoing costs only, and will not help you determine the relative total costs of owning different funds. In addition, if these transactional costs were included, your costs would have been higher.
| | Annualized Expense Ratio-A | Beginning
Account Value | Ending
Account Value
January 31, 2019 | Expenses Paid
During Period |
| Class A | 1.33% | | | |
| Actual | | $1,000.00 | $1,008.70 | $6.73B |
| Hypothetical-C | | $1,000.00 | $1,018.50 | $6.77D |
| Class M | 1.63% | | | |
| Actual | | $1,000.00 | $1,007.50 | $8.25B |
| Hypothetical-C | | $1,000.00 | $1,016.99 | $8.29D |
| Class C | 2.02% | | | |
| Actual | | $1,000.00 | $1,006.40 | $10.22B |
| Hypothetical-C | | $1,000.00 | $1,015.02 | $10.26D |
| International Real Estate | 1.03% | | | |
| Actual | | $1,000.00 | $1,010.40 | $5.22B |
| Hypothetical-C | | $1,000.00 | $1,020.01 | $5.24D |
| Class I | .94% | | | |
| Actual | | $1,000.00 | $1,011.20 | $4.77B |
| Hypothetical-C | | $1,000.00 | $1,020.47 | $4.79D |
| Class Z | .84% | | | |
| Actual | | $1,000.00 | $1,040.30 | $2.86B |
| Hypothetical-C | | $1,000.00 | $1,020.97 | $4.28D |
A Annualized expense ratio reflects expenses net of applicable fee waivers.
B Actual expenses are equal to each Class' annualized expense ratio, multiplied by the average account value over the period, multiplied by 184/365 (to reflect the one-half year period) for Class A, Class M, Class C, International Real Estate and Class I and multiplied by 122/365 (to reflect the period October 2, 2018 to January 31, 2019) for Class Z.
C 5% return per year before expenses.
D Hypothetical expenses are equal to each Class' annualized expense ratio, multiplied by the average account value over the period, multiplied by 184/365 (to reflect the one-half period).
Board Approval of Investment Advisory Contracts and Management Fees
Fidelity International Real Estate Fund
Each year, the Board of Trustees, including the Independent Trustees (together, the Board), votes on the renewal of the management contract with Fidelity SelectCo, LLC (SelectCo), an affiliate of Fidelity Management & Research Company (FMR), and the sub-advisory agreements with affiliates of FMR (together, the Advisory Contracts) for the fund. SelectCo and the sub-advisers are referred to herein as the Investment Advisers. The Board, assisted by the advice of fund counsel and Independent Trustees' counsel, requests and considers a broad range of information relevant to the renewal of the Advisory Contracts throughout the year.
The Board meets regularly and, at each of its meetings, covers an extensive agenda of topics and materials and considers factors that are relevant to its annual consideration of the renewal of the fund's Advisory Contracts, including the services and support provided to the fund and its shareholders. The Board has established various standing committees (Committees), each composed of and chaired by Independent Trustees with varying backgrounds, to which the Board has assigned specific subject matter responsibilities in order to enhance effective decision-making by the Board. The Board, acting directly and through its Committees, requests and receives information concerning the annual consideration of the renewal of the fund's Advisory Contracts. The Board also meets as needed to review matters specifically related to the Board's annual consideration of the renewal of the Advisory Contracts. Members of the Board may also meet with trustees of other Fidelity funds through joint ad hoc committees to discuss certain matters relevant to all of the Fidelity funds.
At its January 2019 meeting, the Board unanimously determined to renew the fund's Advisory Contracts. In reaching its determination, the Board considered all factors it believed relevant, including (i) the nature, extent, and quality of the services to be provided to the fund and its shareholders (including the investment performance of the fund); (ii) the competitiveness of the fund's management fee and total expense ratio relative to peer funds; (iii) the total costs of the services to be provided by and the profits to be realized by Fidelity from its relationships with the fund; and (iv) the extent to which, if any, economies of scale exist and would be realized as the fund grows, and whether any economies of scale are appropriately shared with fund shareholders.
In considering whether to renew the Advisory Contracts for the fund, the Board reached a determination, with the assistance of fund counsel and Independent Trustees' counsel and through the exercise of its business judgment, that the renewal of the Advisory Contracts was in the best interests of the fund and its shareholders and that the compensation payable under the Advisory Contracts was fair and reasonable. The Board's decision to renew the Advisory Contracts was not based on any single factor, but rather was based on a comprehensive consideration of all the information provided to the Board at its meetings throughout the year. The Board, in reaching its determination to renew the Advisory Contracts, was aware that shareholders of the fund have a broad range of investment choices available to them, including a wide choice among funds offered by Fidelity's competitors, and that the fund's shareholders, who have the opportunity to review and weigh the disclosure provided by the fund in its prospectus and other public disclosures, have chosen to invest in this fund, which is part of the Fidelity family of funds.
Nature, Extent, and Quality of Services Provided. The Board considered Fidelity's staffing as it relates to the fund, including the backgrounds of investment personnel of Fidelity, and also considered the fund's investment objective, strategies, and related investment philosophy. The Independent Trustees also had discussions with senior management of Fidelity's investment operations and investment groups. The Board considered the structure of the investment personnel compensation program and whether this structure provides appropriate incentives to act in the best interests of the fund. Additionally, the Board considered the portfolio managers' investments, if any, in the funds that they manage.
Resources Dedicated to Investment Management and Support Services. The Board and the Fund Oversight and Research Committees reviewed the general qualifications and capabilities of Fidelity's investment staff, including its size, education, experience, and resources, as well as Fidelity's approach to recruiting, training, managing, and compensating investment personnel. The Board noted that Fidelity has continued to increase the resources devoted to non-U.S. offices, including expansion of Fidelity's global investment organization. The Board also noted that Fidelity's analysts have extensive resources, tools and capabilities that allow them to conduct sophisticated quantitative and fundamental analysis, as well as credit analysis of issuers, counterparties and guarantors. Further, the Board considered that Fidelity's investment professionals have sufficient access to global information and data so as to provide competitive investment results over time, and that those professionals also have access to sophisticated tools that permit them to assess portfolio construction and risk and performance attribution characteristics continuously, as well as to transmit new information and research conclusions rapidly around the world. Additionally, in its deliberations, the Board considered Fidelity's trading, risk management, compliance, and technology and operations capabilities and resources, which are integral parts of the investment management process.
Shareholder and Administrative Services. The Board considered (i) the nature, extent, quality, and cost of advisory, administrative, and shareholder services performed by the Investment Advisers and their affiliates under the Advisory Contracts and under separate agreements covering transfer agency, pricing and bookkeeping, and securities lending services for the fund; (ii) the nature and extent of the supervision of third party service providers, principally custodians, subcustodians, and pricing vendors; and (iii) the resources devoted to, and the record of compliance with, the fund's compliance policies and procedures. The Board also reviewed the allocation of fund brokerage, including allocations to brokers affiliated with the Investment Advisers, the use of brokerage commissions to pay fund expenses, and the use of "soft" commission dollars to pay for research services.
The Board noted that the growth of fund assets over time across the complex allows Fidelity to reinvest in the development of services designed to enhance the value and convenience of the Fidelity funds as investment vehicles. These services include 24-hour access to account information and market information through telephone representatives and over the Internet, investor education materials and asset allocation tools, and the expanded availability of Fidelity Investor Centers.
The Board noted that it and the boards of certain other Fidelity funds had formed an ad hoc Committee on Transfer Agency Fees to review the variety of transfer agency fee structures throughout the industry and Fidelity's competitive positioning with respect to industry participants.
Investment in a Large Fund Family. The Board considered the benefits to shareholders of investing in a Fidelity fund, including the benefits of investing in a fund that is part of a large family of funds offering a variety of investment disciplines and providing a large variety of mutual fund investor services. The Board noted that Fidelity had taken, or had made recommendations that resulted in the Fidelity funds taking, a number of actions over the previous year that benefited particular funds, including: (i) continuing to dedicate additional resources to Fidelity's investment research process, which includes meetings with management of issuers of securities in which the funds invest, and to the support of the senior management team that oversees asset management; (ii) continuing efforts to enhance Fidelity's global research capabilities; (iii) launching new funds and making other enhancements to meet client needs; (iv) launching new share classes of existing funds; (v) eliminating purchase minimums and broadening eligibility requirements for certain funds and share classes; (vi) reducing management fees and total expenses for certain growth equity funds and index funds; (vii) lowering expense caps for certain existing funds and classes, and converting certain voluntary expense caps to contractual caps, to reduce expenses borne by shareholders; (viii) eliminating short-term redemption fees for funds that had such fees; (ix) rationalizing product lines and gaining increased efficiencies from fund mergers and share class consolidations; (x) continuing to develop, acquire and implement systems and technology to improve services to the funds and shareholders, strengthen information security, and increase efficiency; and (xi) continuing to implement enhancements to further strengthen Fidelity's product line to increase investors' probability of success in achieving their investment goals, including retirement income goals.
Investment Performance. The Board considered whether the fund has operated in accordance with its investment objective, as well as its record of compliance with its investment restrictions and its performance history.
The Board took into account discussions that occur at Board meetings throughout the year with representatives of the Investment Advisers about fund investment performance. In this regard the Board noted that as part of regularly scheduled fund reviews and other reports to the Board on fund performance, the Board considers annualized return information for the fund for different time periods, measured against an appropriate securities market index ("benchmark index"). In its evaluation of fund investment performance, the Board gave particular attention to information indicating changes in performance of certain Fidelity funds for specific time periods and discussed with the Investment Advisers the reasons for any overperformance or underperformance.
In addition to reviewing absolute and relative fund performance, the Independent Trustees periodically consider the appropriateness of fund performance metrics in evaluating the results achieved. In general, the Independent Trustees believe that fund performance should be evaluated based on net performance (after fees and expenses) of both the highest performing and lowest performing fund share classes, where applicable, compared to appropriate benchmark indices, over appropriate time periods that may include full market cycles, taking into account relevant factors including the following: general market conditions; issuer-specific information; and fund cash flows and other factors.
The Independent Trustees recognize that shareholders evaluate performance on a net basis over their own holding periods, for which one-, three-, and five-year periods are often used as a proxy. For this reason, the performance information reviewed by the Board also included net cumulative total return information for the fund and an appropriate benchmark index for the most recent one-, three-, and five-year periods ended June 30, 2018, as shown below.
Fidelity International Real Estate Fund
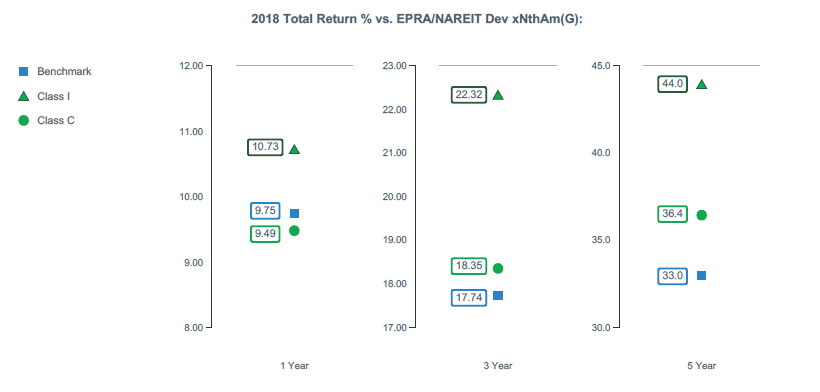
Based on its review, the Board concluded that the nature, extent, and quality of services provided to the fund under the Advisory Contracts should continue to benefit the shareholders of the fund.
Competitiveness of Management Fee and Total Expense Ratio. The Board considered the fund's management fee and total expense ratio compared to "mapped groups" of competitive funds and classes created for the purpose of facilitating the Trustees' competitive analysis of management fees and total expenses. Fidelity creates "mapped groups" by combining similar Lipper investment objective categories that have comparable investment mandates. For this purpose, all sector focused equity funds are grouped in the same mapped group. Combining Lipper investment objective categories aids the Board's management fee and total expense ratio comparisons by broadening the competitive group used for comparison.
Management Fee. The Board considered two proprietary management fee comparisons for the 12-month periods ended June 30 shown in basis points (BP) in the chart below. The group of Lipper funds used by the Board for management fee comparisons is referred to below as the "Total Mapped Group." The Total Mapped Group comparison focuses on a fund's standing in terms of gross management fees before expense reimbursements or caps relative to the total universe of funds with comparable investment mandates (i.e., sector equities), regardless of whether their management fee structures also are comparable. Funds with comparable management fee structures have similar management fee contractual arrangements (
e.g., flat rate charged for advisory services, all-inclusive fee rate,
etc.). "TMG %" represents the percentage of funds in the Total Mapped Group that had management fees that were lower than the fund's. For example, a hypothetical TMG % of 20% would mean that 80% of the funds in the Total Mapped Group had higher, and 20% had lower, management fees than the fund. The fund's actual TMG %s and the number of funds in the Total Mapped Group are in the chart below. The "Asset-Size Peer Group" (ASPG) comparison focuses on a fund's standing relative to a subset of non-Fidelity funds within the Total Mapped Group that are similar in size and management fee structure. For example, if a fund is in the first quartile of the ASPG, the fund's management fee ranks in the least expensive or lowest 25% of funds in the ASPG. The ASPG represents at least 15% of the funds in the Total Mapped Group with comparable asset size and management fee structures, subject to a minimum of 50 funds (or all funds in the Total Mapped Group if fewer than 50). Additional information, such as the ASPG quartile in which the fund's management fee rate ranked, is also included in the chart and was considered by the Board.
Fidelity International Real Estate Fund
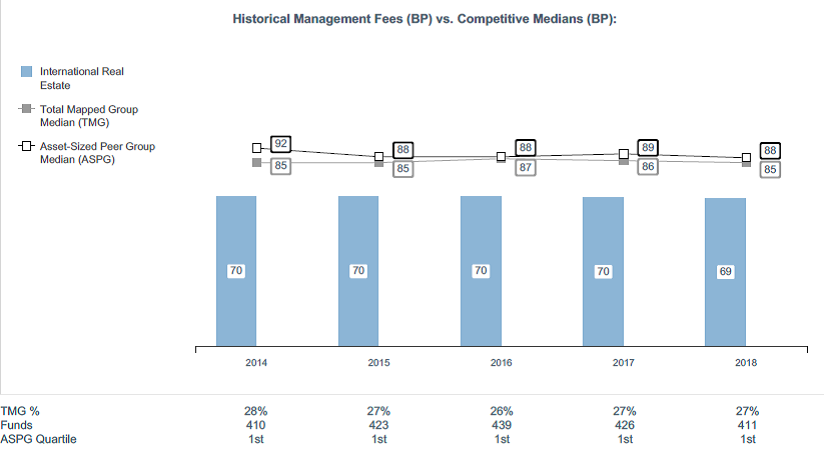
The Board noted that the fund's management fee rate ranked below the median of its Total Mapped Group and below the median of its ASPG for the 12-month period ended June 30, 2018.
The Board noted that it and the boards of other Fidelity funds formed an ad hoc Committee on Group Fee, which meets periodically, to conduct an in-depth review of the "group fee" component of the management fee of funds with such management fee structures. The Committee's focus included the mechanics of the group fee, the competitive landscape of group fee structures, Fidelity funds with no group fee component and investment products not included in group fee assets. The Board also considered that, for funds subject to the group fee, FMR agreed to voluntarily waive fees over a specified period of time in amounts designed to account for assets converted from certain funds to certain collective investment trusts.
Based on its review, the Board concluded that the fund's management fee is fair and reasonable in light of the services that the fund receives and the other factors considered.
Total Expense Ratio. In its review of each class's total expense ratio, the Board considered the fund's management fee rate as well as other fund or class expenses, as applicable, such as transfer agent fees, pricing and bookkeeping fees, fund-paid 12b-1 fees, and custodial, legal, and audit fees. The Board also noted that Fidelity may agree to waive fees and expenses from time to time, and the extent to which, if any, it has done so for the fund. As part of its review, the Board also considered the current and historical total expense ratios of each class of the fund compared to competitive fund median expenses. Each class of the fund is compared to those funds and classes in the Total Mapped Group (used by the Board for management fee comparisons) that have a similar sales load structure.
The Board noted that the total expense ratio of each of Class A, Class C, and Class I ranked below the competitive median for the 12-month period ended June 30, 2018, and the total expense ratio of each of Class M and the retail class ranked above the competitive median for the 12-month period ended June 30, 2018. The Board considered that, in general, various factors can affect total expense ratios. The Board noted that the total expense ratio of Class M was above the competitive median primarily because of higher 12b-1 fees on Class M as compared to most competitor funds. Class M has a higher 12b-1 fee, but a lower front-end sales charge, than traditionally priced front-end sales charge classes. The Board considered that Class M is primarily sold load-waived to retirement plans and intermediary wrap programs where its 0.50% 12b-1 fee is comparable to competing no-load, higher 12b-1 fee classes designed specifically for retirement plans and wrap programs. The Board noted that the total expense ratio of the retail class was above the competitive median due to higher transfer agent fees from small average account sizes. The Board noted that the fund offers multiple classes, each of which has a different sales load and 12b-1 fee structure, and that the multiple structures are intended to offer a range of pricing options for the intermediary market. The Board also noted that the total expense ratios of the classes vary primarily by the level of their 12b-1 fees, although differences in transfer agent fees may also cause expenses to vary from class to class.
The Board further considered that SelectCo has contractually agreed to reimburse Class A, Class M, Class C, Class I, and the retail class of the fund to the extent that total operating expenses, with certain exceptions, as a percentage of their respective average net assets, exceed 1.45%, 1.70%, 2.20%, 1.20%, and 1.20% through November 30, 2019.
Fees Charged to Other Fidelity Clients. The Board also considered Fidelity fee structures and other information with respect to clients of Fidelity, such as other funds advised or subadvised by Fidelity, pension plan clients, and other institutional clients with similar mandates. The Board noted that a joint ad hoc committee created by it and the boards of other Fidelity funds periodically reviews and compares Fidelity's institutional investment advisory business with its business of providing services to the Fidelity funds and also noted the most recent findings of the committee. The Board noted that the committee's review included a consideration of the differences in services provided, fees charged, and costs incurred, as well as competition in the markets serving the different categories of clients.
Based on its review of total expense ratios and fees charged to other Fidelity clients, the Board concluded that the total expense ratio of each class of the fund was reasonable in light of the services that the fund and its shareholders receive and the other factors considered.
Costs of the Services and Profitability. The Board considered the revenues earned and the expenses incurred by Fidelity in conducting the business of developing, marketing, distributing, managing, administering and servicing the fund and servicing the fund's shareholders. The Board also considered the level of Fidelity's profits in respect of all the Fidelity funds.
On an annual basis, Fidelity presents to the Board information about the profitability of its relationships with the fund. Fidelity calculates profitability information for each fund, as well as aggregate profitability information for groups of Fidelity funds and all Fidelity funds, using a series of detailed revenue and cost allocation methodologies which originate with the books and records of Fidelity on which Fidelity's audited financial statements are based. The Audit Committee of the Board reviews any significant changes from the prior year's methodologies.
PricewaterhouseCoopers LLP (PwC), auditor to Fidelity and certain Fidelity funds, has been engaged annually by the Board as part of the Board's assessment of Fidelity's profitability analysis. PwC's engagement includes the review and assessment of the methodologies used by Fidelity in determining the revenues and expenses attributable to Fidelity's mutual fund business, and completion of agreed-upon procedures in respect of the mathematical accuracy of the fund profitability information and its conformity to established allocation methodologies. After considering PwC's reports issued under the engagement and information provided by Fidelity, the Board concluded that while other allocation methods may also be reasonable, Fidelity's profitability methodologies are reasonable in all material respects.
The Board also reviewed Fidelity's non-fund businesses and potential indirect benefits such businesses may have received as a result of their association with Fidelity's mutual fund business (i.e., fall-out benefits) as well as cases where Fidelity's affiliates may benefit from the fund's business. The Board noted that changes to fall-out benefits year-over-year reflect business developments at Fidelity's various businesses.
The Board considered the costs of the services provided by and the profits realized by Fidelity in connection with the operation of the fund and was satisfied that the profitability was not excessive.
Economies of Scale. The Board considered whether there have been economies of scale in respect of the management of the Fidelity funds, whether the Fidelity funds (including the fund) have appropriately benefited from any such economies of scale, and whether there is potential for realization of any further economies of scale. The Board considered the extent to which the fund will benefit from economies of scale as assets grow through increased services to the fund, through waivers or reimbursements, or through fee or expense ratio reductions. The Board also noted that a committee (the Economies of Scale Committee) created by it and the boards of other Fidelity funds periodically analyzes whether Fidelity attains economies of scale in respect of the management and servicing of the Fidelity funds, whether the Fidelity funds have appropriately benefited from such economies of scale, and whether there is potential for realization of any further economies of scale.
The Board recognized that the fund's management contract incorporates a "group fee" structure, which provides for lower group fee rates as total group assets increase, and for higher group fee rates as total group assets decrease (with "group assets" defined to include fund assets under SelectCo's management plus assets under FMR's management). SelectCo calculates the group fee rates based on a tiered asset "breakpoint" schedule that varies based on asset class. The Board considered that the group fee is designed to deliver the benefits of economies of scale to fund shareholders when total group assets increase, even if assets of any particular fund are unchanged or have declined, because some portion of Fidelity's costs are attributable to services provided to all Fidelity funds, and all funds benefit if those costs can be allocated among more assets. The Board concluded that, given the group fee structure, fund shareholders will benefit from lower management fees as group assets increase at the fund complex level, regardless of whether Fidelity achieves any such economies of scale.
The Board concluded, taking into account the analysis of the Economies of Scale Committee, that economies of scale, if any, are being appropriately shared between fund shareholders and Fidelity.
Additional Information Requested by the Board. In order to develop fully the factual basis for consideration of the Fidelity funds' advisory contracts, the Board requested and received additional information on certain topics, including: (i) fund performance trends, in particular the underperformance of certain funds, and Fidelity's long-term strategies for certain funds; (ii) Fidelity's fund profitability methodology, profitability trends for certain funds, and the impact of certain factors on fund profitability results; (iii) metrics for evaluating index fund and ETF performance and information about ETF trading characteristics; (iv) the methodology with respect to the evaluation of competitive fund data and peer group classifications and fee comparisons; (v) the expense structures for different funds and classes; (vi) information regarding other accounts managed by Fidelity, including collective investment trusts; and (vii) Fidelity's philosophies and strategies for evaluating funds and classes with lower or declining asset levels.
Based on its evaluation of all of the conclusions noted above, and after considering all factors it believed relevant, the Board concluded that the advisory fee arrangements are fair and reasonable, and that the fund's Advisory Contracts should be renewed.
IRE-SANN-0319
1.801330.115
Fidelity Flex℠ Funds Fidelity Flex℠ Real Estate Fund
Semi-Annual Report January 31, 2019 |
|
Beginning on January 1, 2021, as permitted by regulations adopted by the Securities and Exchange Commission, paper copies of a fund’s shareholder reports will no longer be sent by mail, unless you specifically request paper copies of the reports from the fund or from your financial intermediary, such as a financial advisor, broker-dealer or bank. Instead, the reports will be made available on a website, and you will be notified by mail each time a report is posted and provided with a website link to access the report.
If you already elected to receive shareholder reports electronically, you will not be affected by this change and you need not take any action. You may elect to receive shareholder reports and other communications from a fund electronically, by contacting your financial intermediary. For Fidelity customers, visit Fidelity's web site or call Fidelity using the contact information listed below.
You may elect to receive all future reports in paper free of charge. If you wish to continue receiving paper copies of your shareholder reports, you may contact your financial intermediary or, if you are a Fidelity customer, visit Fidelity’s website, or call Fidelity at the applicable toll-free number listed below. Your election to receive reports in paper will apply to all funds held with the fund complex/your financial intermediary.
| Account Type | Website | Phone Number |
| Brokerage, Mutual Fund, or Annuity Contracts: | fidelity.com/mailpreferences | 1-800-343-3548 |
| Employer Provided Retirement Accounts: | netbenefits.fidelity.com/preferences (choose 'no' under Required Disclosures to continue to print) | 1-800-343-0860 |
| Advisor Sold Accounts Serviced Through Your Financial Intermediary: | Contact Your Financial Intermediary | Your Financial Intermediary's phone number |
| Advisor Sold Accounts Serviced by Fidelity: | institutional.fidelity.com | 1-877-208-0098 |
Contents
To view a fund's proxy voting guidelines and proxy voting record for the 12-month period ended June 30, visit http://www.fidelity.com/proxyvotingresults or visit the Securities and Exchange Commission's (SEC) web site at http://www.sec.gov.
You may also call 1-800-835-5092 to request a free copy of the proxy voting guidelines.
Standard & Poor's, S&P and S&P 500 are registered service marks of The McGraw-Hill Companies, Inc. and have been licensed for use by Fidelity Distributors Corporation.
Other third-party marks appearing herein are the property of their respective owners.
All other marks appearing herein are registered or unregistered trademarks or service marks of FMR LLC or an affiliated company. © 2019 FMR LLC. All rights reserved.
This report and the financial statements contained herein are submitted for the general information of the shareholders of the Fund. This report is not authorized for distribution to prospective investors in the Fund unless preceded or accompanied by an effective prospectus.
A fund files its complete schedule of portfolio holdings with the SEC for the first and third quarters of each fiscal year on Form N-Q. Forms N-Q are available on the SEC’s web site at http://www.sec.gov. A fund's Forms N-Q may be reviewed and copied at the SEC’s Public Reference Room in Washington, DC. Information regarding the operation of the SEC's Public Reference Room may be obtained by calling 1-800-SEC-0330.
For a complete list of a fund's portfolio holdings, view the most recent holdings listing, semiannual report, or annual report on Fidelity's web site at http://www.fidelity.com, http://www.institutional.fidelity.com, or http://www.401k.com, as applicable.
NOT FDIC INSURED •MAY LOSE VALUE •NO BANK GUARANTEE
Neither the Fund nor Fidelity Distributors Corporation is a bank.
Note to Shareholders:
During January 2019 the Board approved to change the investment advisor from Fidelity SelectCo, LLC (SelectCo) to Fidelity Management & Research Company (FMR) effective February 1, 2019. There was no change to the management fee.
Investment Summary (Unaudited)
Top Ten Stocks as of January 31, 2019
| | % of fund's net assets |
| Prologis, Inc. | 9.6 |
| Simon Property Group, Inc. | 9.6 |
| UDR, Inc. | 5.6 |
| Boston Properties, Inc. | 5.3 |
| Ventas, Inc. | 4.7 |
| Duke Realty Corp. | 4.7 |
| Welltower, Inc. | 4.5 |
| Equity Residential (SBI) | 4.5 |
| AvalonBay Communities, Inc. | 4.4 |
| Digital Realty Trust, Inc. | 4.0 |
| | 56.9 |
Top Five REIT Sectors as of January 31, 2019
| | % of fund's net assets |
| REITs - Apartments | 21.3 |
| REITs - Diversified | 14.5 |
| REITs - Office Property | 12.0 |
| REITs - Regional Malls | 10.8 |
| REITs - Health Care | 9.6 |
Asset Allocation (% of fund's net assets)
| As of January 31, 2019* |
| | Stocks | 99.0% |
| | Short-Term Investments and Net Other Assets (Liabilities) | 1.0% |

* Foreign investments - 0.7%
Schedule of Investments January 31, 2019 (Unaudited)
Showing Percentage of Net Assets
| Common Stocks - 99.0% | | | |
| | | Shares | Value |
| Equity Real Estate Investment Trusts (REITs) - 98.0% | | | |
| REITs - Apartments - 21.3% | | | |
| American Homes 4 Rent Class A | | 423 | $9,353 |
| Apartment Investment & Management Co. Class A | | 123 | 6,091 |
| AvalonBay Communities, Inc. | | 130 | 25,080 |
| Camden Property Trust (SBI) | | 111 | 10,761 |
| Equity Residential (SBI) | | 354 | 25,686 |
| Essex Property Trust, Inc. | | 48 | 13,018 |
| UDR, Inc. | | 736 | 32,200 |
| | | | 122,189 |
| REITs - Diversified - 14.2% | | | |
| Cousins Properties, Inc. | | 306 | 2,708 |
| Crown Castle International Corp. | | 57 | 6,672 |
| Digital Realty Trust, Inc. | | 214 | 23,185 |
| Duke Realty Corp. | | 919 | 26,872 |
| Equinix, Inc. | | 17 | 6,698 |
| Vornado Realty Trust | | 177 | 12,374 |
| Washington REIT (SBI) | | 125 | 3,169 |
| | | | 81,678 |
| REITs - Health Care - 9.6% | | | |
| Healthcare Trust of America, Inc. | | 78 | 2,217 |
| Ventas, Inc. | | 420 | 27,086 |
| Welltower, Inc. | | 338 | 26,192 |
| | | | 55,495 |
| REITs - Hotels - 5.1% | | | |
| Braemar Hotels & Resorts, Inc. | | 117 | 1,301 |
| DiamondRock Hospitality Co. | | 640 | 6,502 |
| Host Hotels & Resorts, Inc. | | 965 | 17,428 |
| RLJ Lodging Trust | | 212 | 3,933 |
| | | | 29,164 |
| REITs - Manufactured Homes - 5.9% | | | |
| Equity Lifestyle Properties, Inc. | | 196 | 20,752 |
| Sun Communities, Inc. | | 119 | 13,079 |
| | | | 33,831 |
| REITs - Office Property - 12.0% | | | |
| Boston Properties, Inc. | | 230 | 30,330 |
| Brandywine Realty Trust (SBI) | | 538 | 8,097 |
| Douglas Emmett, Inc. | | 92 | 3,480 |
| Highwoods Properties, Inc. (SBI) | | 120 | 5,318 |
| Hudson Pacific Properties, Inc. | | 47 | 1,526 |
| Piedmont Office Realty Trust, Inc. Class A | | 259 | 5,014 |
| SL Green Realty Corp. | | 152 | 14,049 |
| VEREIT, Inc. | | 120 | 970 |
| | | | 68,784 |
| REITs - Regional Malls - 10.8% | | | |
| Simon Property Group, Inc. | | 301 | 54,818 |
| The Macerich Co. | | 152 | 7,016 |
| | | | 61,834 |
| REITs - Shopping Centers - 4.9% | | | |
| Acadia Realty Trust (SBI) | | 217 | 6,234 |
| Kimco Realty Corp. | | 458 | 7,791 |
| Regency Centers Corp. | | 221 | 14,365 |
| | | | 28,390 |
| REITs - Single Tenant - 0.4% | | | |
| Spirit Realty Capital, Inc. | | 62 | 2,463 |
| REITs - Storage - 4.2% | | | |
| Extra Space Storage, Inc. | | 142 | 14,003 |
| Public Storage | | 47 | 9,988 |
| | | | 23,991 |
| REITs - Warehouse/Industrial - 9.6% | | | |
| Prologis, Inc. | | 798 | 55,190 |
|
| TOTAL EQUITY REAL ESTATE INVESTMENT TRUSTS (REITS) | | | 563,009 |
|
| Real Estate Management & Development - 1.0% | | | |
| Real Estate Development - 0.7% | | | |
| Instone Real Estate Group BV (a) | | 188 | 4,056 |
| REITs - Diversified - 0.3% | | | |
| VICI Properties, Inc. | | 72 | 1,550 |
|
| TOTAL REAL ESTATE MANAGEMENT & DEVELOPMENT | | | 5,606 |
|
| TOTAL COMMON STOCKS | | | |
| (Cost $505,053) | | | 568,615 |
| TOTAL INVESTMENT IN SECURITIES - 99.0% | | | |
| (Cost $505,053) | | | 568,615 |
| NET OTHER ASSETS (LIABILITIES) - 1.0% | | | 5,820 |
| NET ASSETS - 100% | | | $574,435 |
Legend
(a) Security exempt from registration under Rule 144A of the Securities Act of 1933. These securities may be resold in transactions exempt from registration, normally to qualified institutional buyers. At the end of the period, the value of these securities amounted to $4,056 or 0.7% of net assets.
Affiliated Central Funds
Information regarding fiscal year to date income earned by the Fund from investments in Fidelity Central Funds is as follows:
| Fund | Income earned |
| Fidelity Cash Central Fund | $29 |
| Total | $29 |
Amounts in the income column in the above table include any capital gain distributions from underlying funds, which are presented in the corresponding line-item in the Statement of Operations, if applicable.
Investment Valuation
All investments are categorized as Level 1 under the Fair Value Hierarchy. The inputs or methodology used for valuing securities may not be an indication of the risk associated with investing in those securities. For more information on valuation inputs please refer to the Investment Valuation section in the accompanying Notes to Financial Statements.
See accompanying notes which are an integral part of the financial statements.
Financial Statements
Statement of Assets and Liabilities
| | | January 31, 2019 (Unaudited) |
| Assets | | |
Investment in securities, at value — See accompanying schedule:
Unaffiliated issuers (cost $505,053) | | $568,615 |
| Cash | | 5,136 |
| Receivable for investments sold | | 1,213 |
| Receivable for fund shares sold | | 46 |
| Dividends receivable | | 114 |
| Total assets | | 575,124 |
| Liabilities | | |
| Payable for investments purchased | $689 | |
| Total liabilities | | 689 |
| Net Assets | | $574,435 |
| Net Assets consist of: | | |
| Paid in capital | | $529,218 |
| Total distributable earnings (loss) | | 45,217 |
| Net Assets, for 54,189 shares outstanding | | $574,435 |
| Net Asset Value, offering price and redemption price per share ($574,435 ÷ 54,189 shares) | | $10.60 |
See accompanying notes which are an integral part of the financial statements.
Statement of Operations
| | | Six months ended January 31, 2019 (Unaudited) |
| Investment Income | | |
| Dividends | | $9,520 |
| Income from Fidelity Central Funds | | 29 |
| Total income | | 9,549 |
| Expenses | | |
| Independent trustees' fees and expenses | $2 | |
| Commitment fees | 1 | |
| Total expenses | | 3 |
| Net investment income (loss) | | 9,546 |
| Realized and Unrealized Gain (Loss) | | |
| Net realized gain (loss) on: | | |
| Investment securities: | | |
| Unaffiliated issuers | 6,259 | |
| Foreign currency transactions | (1) | |
| Total net realized gain (loss) | | 6,258 |
| Change in net unrealized appreciation (depreciation) on investment securities | | 8,374 |
| Net gain (loss) | | 14,632 |
| Net increase (decrease) in net assets resulting from operations | | $24,178 |
See accompanying notes which are an integral part of the financial statements.
Statement of Changes in Net Assets
| | Six months ended January 31, 2019 (Unaudited) | Year ended July 31, 2018 |
| Increase (Decrease) in Net Assets | | |
| Operations | | |
| Net investment income (loss) | $9,546 | $10,957 |
| Net realized gain (loss) | 6,258 | (21,742) |
| Change in net unrealized appreciation (depreciation) | 8,374 | 48,537 |
| Net increase (decrease) in net assets resulting from operations | 24,178 | 37,752 |
| Distributions to shareholders | (15,922) | – |
| Distributions to shareholders from net investment income | – | (8,803) |
| Distributions to shareholders from net realized gain | – | (936) |
| Total distributions | (15,922) | (9,739) |
| Share transactions | | |
| Proceeds from sales of shares | 21,605 | 706,550 |
| Reinvestment of distributions | 15,922 | 9,739 |
| Cost of shares redeemed | (183,953) | (297,020) |
| Net increase (decrease) in net assets resulting from share transactions | (146,426) | 419,269 |
| Total increase (decrease) in net assets | (138,170) | 447,282 |
| Net Assets | | |
| Beginning of period | 712,605 | 265,323 |
| End of period | $574,435 | $712,605 |
| Other Information | | |
| Undistributed net investment income end of period | | $3,773 |
| Shares | | |
| Sold | 2,105 | 72,635 |
| Issued in reinvestment of distributions | 1,548 | 962 |
| Redeemed | (18,141) | (30,556) |
| Net increase (decrease) | (14,488) | 43,041 |
See accompanying notes which are an integral part of the financial statements.
Financial Highlights
Fidelity Flex Real Estate Fund
| | Six months ended (Unaudited) January 31, | Years endedJuly 31, | |
| | 2019 | 2018 | 2017 A |
| Selected Per–Share Data | | | |
| Net asset value, beginning of period | $10.38 | $10.35 | $10.00 |
| Income from Investment Operations | | | |
| Net investment income (loss)B | .15 | .28 | .11 |
| Net realized and unrealized gain (loss) | .34 | .05 | .29 |
| Total from investment operations | .49 | .33 | .40 |
| Distributions from net investment income | (.25) | (.26) | (.05) |
| Distributions from net realized gain | (.02) | (.04) | – |
| Total distributions | (.27) | (.30) | (.05) |
| Net asset value, end of period | $10.60 | $10.38 | $10.35 |
| Total ReturnC,D | 4.84% | 3.28% | 4.01% |
| Ratios to Average Net AssetsE,F | | | |
| Expenses before reductions | - %G,H | .01% | - %G,H |
| Expenses net of fee waivers, if any | - %G,H | .01% | - %G,H |
| Expenses net of all reductions | - %G,H | .01% | - %G,H |
| Net investment income (loss) | 3.00%G | 2.78% | 2.64%G |
| Supplemental Data | | | |
| Net assets, end of period (000 omitted) | $574 | $713 | $265 |
| Portfolio turnover rateI | 22%G | 91% | 9%J |
A For the period March 8, 2017 (commencement of operations) to July 31, 2017.
B Calculated based on average shares outstanding during the period.
C Total returns for periods of less than one year are not annualized.
D Total returns would have been lower if certain expenses had not been reduced during the applicable periods shown.
E Fees and expenses of any underlying Fidelity Central Funds are not included in the Fund's expense ratio. The Fund indirectly bears its proportionate share of the expenses of any underlying Fidelity Central Funds.
F Expense ratios reflect operating expenses of the Fund. Expenses before reductions do not reflect amounts reimbursed by the investment adviser or reductions from expense offset arrangements and do not represent the amount paid by the Fund during periods when reimbursements or reductions occur. Expenses net of fee waivers reflect expenses after reimbursement by the investment adviser but prior to reductions from expense offset arrangements. Expenses net of all reductions represent the net expenses paid by the Fund.
G Annualized
H Amount represents less than .005%.
I Amount does not include the portfolio activity of any underlying Fidelity Central Funds.
J Amount not annualized.
See accompanying notes which are an integral part of the financial statements.
Notes to Financial Statements (Unaudited)
For the period ended January 31, 2019
1. Organization.
Fidelity Flex Real Estate Fund (the Fund) is a non-diversified fund of Fidelity Select Portfolios (the Trust) and is authorized to issue an unlimited number of shares. Share transactions on the Statement of Changes in Net Assets may contain exchanges between affiliated funds. The Trust is registered under the Investment Company Act of 1940, as amended (the 1940 Act), as an open-end management investment company organized as a Massachusetts business trust. The Fund is available only to certain fee-based accounts offered by Fidelity.
2. Investments in Fidelity Central Funds.
The Fund invests in Fidelity Central Funds, which are open-end investment companies generally available only to other investment companies and accounts managed by the investment adviser and its affiliates. The Fund's Schedule of Investments lists each of the Fidelity Central Funds held as of period end, if any, as an investment of the Fund, but does not include the underlying holdings of each Fidelity Central Fund. As an Investing Fund, the Fund indirectly bears its proportionate share of the expenses of the underlying Fidelity Central Funds.
The Money Market Central Funds seek preservation of capital and current income and are managed by Fidelity Investments Money Management, Inc. (FIMM), an affiliate of the investment adviser. Annualized expenses of the Money Market Central Funds as of their most recent shareholder report date are less than .005%.
A complete unaudited list of holdings for each Fidelity Central Fund is available upon request or at the Securities and Exchange Commission (the SEC) website at www.sec.gov. In addition, the financial statements of the Fidelity Central Funds are available on the SEC website or upon request.
3. Significant Accounting Policies.
The Fund is an investment company and applies the accounting and reporting guidance of the Financial Accounting Standards Board (FASB) Accounting Standards Codification Topic 946 Financial Services – Investments Companies. The financial statements have been prepared in conformity with accounting principles generally accepted in the United States of America (GAAP), which require management to make certain estimates and assumptions at the date of the financial statements. Actual results could differ from those estimates. Subsequent events, if any, through the date that the financial statements were issued have been evaluated in the preparation of the financial statements. The following summarizes the significant accounting policies of the Fund:
Investment Valuation. Investments are valued as of 4:00 p.m. Eastern time on the last calendar day of the period. The Board of Trustees (the Board) has delegated the day to day responsibility for the valuation of the Fund's investments to the Fair Value Committee (the Committee) established by the Fund's investment adviser. In accordance with valuation policies and procedures approved by the Board, the Fund attempts to obtain prices from one or more third party pricing vendors or brokers to value its investments. When current market prices, quotations or currency exchange rates are not readily available or reliable, investments will be fair valued in good faith by the Committee, in accordance with procedures adopted by the Board. Factors used in determining fair value vary by investment type and may include market or investment specific events. The frequency with which these procedures are used cannot be predicted and they may be utilized to a significant extent. The Committee oversees the Fund's valuation policies and procedures and reports to the Board on the Committee's activities and fair value determinations. The Board monitors the appropriateness of the procedures used in valuing the Fund's investments and ratifies the fair value determinations of the Committee.
The Fund categorizes the inputs to valuation techniques used to value its investments into a disclosure hierarchy consisting of three levels as shown below:
- Level 1 – quoted prices in active markets for identical investments
- Level 2 – other significant observable inputs (including quoted prices for similar investments, interest rates, prepayment speeds, etc.)
- Level 3 – unobservable inputs (including the Fund's own assumptions based on the best information available)
Valuation techniques used to value the Fund's investments by major category are as follows:
Equity securities, including restricted securities, for which market quotations are readily available, are valued at the last reported sale price or official closing price as reported by a third party pricing vendor on the primary market or exchange on which they are traded and are categorized as Level 1 in the hierarchy. In the event there were no sales during the day or closing prices are not available, securities are valued at the last quoted bid price or may be valued using the last available price and are generally categorized as Level 2 in the hierarchy. For foreign equity securities, when market or security specific events arise, comparisons to the valuation of American Depositary Receipts (ADRs), futures contracts, Exchange-Traded Funds (ETFs) and certain indexes as well as quoted prices for similar securities may be used and would be categorized as Level 2 in the hierarchy. For equity securities, including restricted securities, where observable inputs are limited, assumptions about market activity and risk are used and these securities may be categorized as Level 3 in the hierarchy.
Changes in valuation techniques may result in transfers in or out of an assigned level within the disclosure hierarchy.
Foreign Currency. The Fund may use foreign currency contracts to facilitate transactions in foreign-denominated securities. Gains and losses from these transactions may arise from changes in the value of the foreign currency or if the counterparties do not perform under the contracts' terms.
Foreign-denominated assets, including investment securities, and liabilities are translated into U.S. dollars at the exchange rates at period end. Purchases and sales of investment securities, income and dividends received and expenses denominated in foreign currencies are translated into U.S. dollars at the exchange rate in effect on the transaction date.
The effects of exchange rate fluctuations on investments are included with the net realized and unrealized gain (loss) on investment securities. Other foreign currency transactions resulting in realized and unrealized gain (loss) are disclosed separately.
Investment Transactions and Income. For financial reporting purposes, the Fund's investment holdings and NAV include trades executed through the end of the last business day of the period. The NAV per share for processing shareholder transactions is calculated as of the close of business of the New York Stock Exchange (NYSE), normally 4:00 p.m. Eastern time and includes trades executed through the end of the prior business day. Gains and losses on securities sold are determined on the basis of identified cost. Dividend income is recorded on the ex-dividend date, except for certain dividends from foreign securities where the ex-dividend date may have passed, which are recorded as soon as the Fund is informed of the ex-dividend date. Non-cash dividends included in dividend income, if any, are recorded at the fair market value of the securities received. Income and capital gain distributions from Fidelity Central Funds, if any, are recorded on the ex-dividend date. Certain distributions received by the Fund represent a return of capital or capital gain. The Fund determines the components of these distributions subsequent to the ex-dividend date, based upon receipt of tax filings or other correspondence relating to the underlying investment. These distributions are recorded as a reduction of cost of investments and/or as a realized gain. Investment income is recorded net of foreign taxes withheld where recovery of such taxes is uncertain.
Expenses. Expenses directly attributable to a fund are charged to that fund. Expenses attributable to more than one fund are allocated among the respective funds on the basis of relative net assets or other appropriate methods. Expense estimates are accrued in the period to which they relate and adjustments are made when actual amounts are known.
Income Tax Information and Distributions to Shareholders. Each year, the Fund intends to qualify as a regulated investment company under Subchapter M of the Internal Revenue Code, including distributing substantially all of its taxable income and realized gains. As a result, no provision for U.S. Federal income taxes is required. The Fund files a U.S. federal tax return, in addition to state and local tax returns as required. The Fund's federal income tax returns are subject to examination by the Internal Revenue Service (IRS) for a period of three fiscal years after they are filed. State and local tax returns may be subject to examination for an additional fiscal year depending on the jurisdiction. Foreign taxes are provided for based on the Fund's understanding of the tax rules and rates that exist in the foreign markets in which it invests.
Distributions are declared and recorded on the ex-dividend date. Income and capital gain distributions are determined in accordance with income tax regulations, which may differ from GAAP.
Capital accounts within the financial statements are adjusted for permanent book-tax differences. These adjustments have no impact on net assets or the results of operations. Capital accounts are not adjusted for temporary book-tax differences which will reverse in a subsequent period.
Book-tax differences are primarily due to foreign currency transactions and losses deferred due to wash sales.
As of period end, the cost and unrealized appreciation (depreciation) in securities, and derivatives if applicable, for federal income tax purposes were as follows:
| Gross unrealized appreciation | $63,506 |
| Gross unrealized depreciation | (8,167) |
| Net unrealized appreciation (depreciation) | $55,339 |
| Tax cost | $513,276 |
Restricted Securities. The Fund may invest in securities that are subject to legal or contractual restrictions on resale. These securities generally may be resold in transactions exempt from registration or to the public if the securities are registered. Disposal of these securities may involve time-consuming negotiations and expense, and prompt sale at an acceptable price may be difficult. Information regarding restricted securities is included at the end of the Fund's Schedule of Investments.
New Rule Issuance. During August 2018, the U.S. Securities and Exchange Commission issued Final Rule Release No. 33-10532, Disclosure Update and Simplification. This Final Rule includes amendments specific to registered investment companies that are intended to eliminate overlap in disclosure requirements between Regulation S-X and GAAP. In accordance with these amendments, certain line-items in the Fund's financial statements have been combined or removed for the current period as outlined in the table below.
| Financial Statement | Current Line-Item Presentation (As Applicable) | Prior Line-Item Presentation (As Applicable) |
| Statement of Assets and Liabilities | Total distributable earnings (loss) | Undistributed/Distributions in excess of/Accumulated net investment income (loss)
Accumulated/Undistributed net realized gain (loss)
Net unrealized appreciation (depreciation) |
| Statement of Changes in Net Assets | N/A - removed | Undistributed/Distributions in excess of/Accumulated net investment income (loss) end of period |
| Statement of Changes in Net Assets | Distributions to shareholders | Distributions to shareholders from net investment income
Distributions to shareholders from net realized gain |
4. Purchases and Sales of Investments.
Purchases and sales of securities, other than short-term securities, aggregated $71,663 and $221,366, respectively.
5. Fees and Other Transactions with Affiliates.
Management Fee. Fidelity SelectCo, LLC (the investment adviser) and its affiliates provide the Fund with investment management related services and the Fund does not pay any fees for these services. Under the management contract, the investment adviser or an affiliate pays all other expenses of the Fund, excluding fees and expenses of the independent Trustees, and certain miscellaneous expenses such as proxy and shareholder meeting expenses.
During January 2019 the Board approved to change the investment adviser from Fidelity SelectCo, LLC to Fidelity Management & Research Company effective February 1, 2019. There was no change to the management fee.
Brokerage Commissions. The Fund placed a portion of its portfolio transactions with brokerage firms which are affiliates of the investment adviser. Brokerage commissions are included in net realized gain (loss) and change in net unrealized appreciation (depreciation) in the Statement of Operations. The commissions paid to these affiliated firms were $2 for the period.
Interfund Trades. The Fund may purchase from or sell securities to other Fidelity Funds under procedures adopted by the Board. The procedures have been designed to ensure these interfund trades are executed in accordance with Rule 17a-7 of the 1940 Act. Interfund trades are included within the respective purchases and sales amounts shown in the Purchases and Sales of Investments note.
6. Committed Line of Credit.
The Fund participates with other funds managed by the investment adviser or an affiliate in a $4.25 billion credit facility (the "line of credit") to be utilized for temporary or emergency purposes to fund shareholder redemptions or for other short-term liquidity purposes. The Fund has agreed to pay commitment fees on its pro-rata portion of the line of credit, which amounted to $1 and is reflected in Commitment fees on the Statement of Operations. During the period, the Fund did not borrow on this line of credit.
7. Other.
The Fund's organizational documents provide former and current trustees and officers with a limited indemnification against liabilities arising in connection with the performance of their duties to the Fund. In the normal course of business, the Fund may also enter into contracts that provide general indemnifications. The Fund's maximum exposure under these arrangements is unknown as this would be dependent on future claims that may be made against the Fund. The risk of material loss from such claims is considered remote.
At the end of the period, the investment adviser or its affiliates were the owners of record of 49% of the total outstanding shares of the Fund.
Shareholder Expense Example
As a shareholder of the Fund, you incur two types of costs: (1) transaction costs, and (2) ongoing costs, including other Fund expenses. This Example is intended to help you understand your ongoing costs (in dollars) of investing in the Fund and to compare these costs with the ongoing costs of investing in other mutual funds.
The Example is based on an investment of $1,000 invested at the beginning of the period and held for the entire period (August 1, 2018 to January 31, 2019).
Actual Expenses
The first line of the accompanying table provides information about actual account values and actual expenses. You may use the information in this line, together with the amount you invested, to estimate the expenses that you paid over the period. Simply divide your account value by $1,000.00 (for example, an $8,600 account value divided by $1,000.00 = 8.6), then multiply the result by the number in the first line under the heading entitled "Expenses Paid During Period" to estimate the expenses you paid on your account during this period. In addition, the Fund, as a shareholder in the underlying Fidelity Central Funds, will indirectly bear its pro-rata share of the fees and expenses incurred by the underlying Fidelity Central Funds. These fees and expenses are not included in the Fund's annualized expense ratio used to calculate the expense estimate in the table below.
Hypothetical Example for Comparison Purposes
The second line of the accompanying table provides information about hypothetical account values and hypothetical expenses based on the Fund's actual expense ratio and an assumed rate of return of 5% per year before expenses, which is not the Fund's actual return. The hypothetical account values and expenses may not be used to estimate the actual ending account balance or expenses you paid for the period. You may use this information to compare the ongoing costs of investing in the Fund and other funds. To do so, compare this 5% hypothetical example with the 5% hypothetical examples that appear in the shareholder reports of the other funds. In addition, the Fund, as a shareholder in the underlying Fidelity Central Funds, will indirectly bear its pro-rata share of the fees and expenses incurred by the underlying Fidelity Central Funds. These fees and expenses are not included in the Fund's annualized expense ratio used to calculate the expense estimate in the table below.
Please note that the expenses shown in the table are meant to highlight your ongoing costs only and do not reflect any transaction costs. Therefore, the second line of the table is useful in comparing ongoing costs only, and will not help you determine the relative total costs of owning different funds.
| | Annualized Expense Ratio-A | Beginning
Account Value
August 1, 2018 | Ending
Account Value
January 31, 2019 | Expenses Paid
During Period-B
August 1, 2018
to January 31, 2019 |
| Actual | - %-C | $1,000.00 | $1,048.40 | $--D |
| Hypothetical-E | | $1,000.00 | $1,025.21 | $--D |
A Annualized expense ratio reflects expenses net of applicable fee waivers.
B Expenses are equal to the Fund's annualized expense ratio, multiplied by the average account value over the period, multiplied by 184/365 (to reflect the one-half year period).
C Amount represents less than .005%.
D Amount represents less than $.005.
E 5% return per year before expenses
Board Approval of Investment Advisory Contracts and Management Fees
Fidelity Flex Real Estate Fund
Each year, the Board of Trustees, including the Independent Trustees (together, the Board), votes on the management contract with Fidelity SelectCo, LLC (SelectCo), an affiliate of Fidelity Management & Research Company (FMR), and the sub-advisory agreements with affiliates of FMR for the fund. SelectCo and the sub-advisers are referred to herein as the Investment Advisers. The Board, assisted by the advice of fund counsel and Independent Trustees' counsel, requests and considers a broad range of information relevant to the advisory arrangements throughout the year.
The Board meets regularly and, at each of its meetings, covers an extensive agenda of topics and materials and considers factors that are relevant to its annual consideration of the fund's advisory arrangements, including the services and support provided to the fund and its shareholders. The Board has established various standing committees (Committees), each composed of and chaired by Independent Trustees with varying backgrounds, to which the Board has assigned specific subject matter responsibilities in order to enhance effective decision-making by the Board. The Board, acting directly and through its Committees, requests and receives information concerning the annual consideration of the fund's advisory arrangements. The Board also meets as needed to review matters specifically related to the Board's annual consideration of the advisory arrangements. Members of the Board may also meet with trustees of other Fidelity funds through joint ad hoc committees to discuss certain matters relevant to all of the Fidelity funds.
At its January 2019 meeting, the Board unanimously determined to approve an amended and restated management contract and sub-advisory agreements (together, the Advisory Contracts) for the fund to reflect the fact that, effective February 1, 2019, FMR would assume the duties and rights of SelectCo under the fund's then current management contract. The Board noted that, with the exception of the date, term, and entity name, and non-operating expense language clarification described below, the terms of the fund's Advisory Contracts, including the lack of fees payable by the fund thereunder, would not change as a result of the approval of the Advisory Contracts. The Board considered that FMR would render the same services to the fund under the amended and restated management contract that SelectCo rendered to the fund under the then current management contract and that the sub-advisory agreements were simply being updated to reflect the change in investment adviser. The Board also considered that approval of the Advisory Contracts would not result in any changes to (i) the investment process or strategies employed in the management of the fund's assets; or (ii) the day-to-day management of the fund or the persons primarily responsible for such management. As a result, the Board considered that its prior experience with SelectCo as investment adviser for the fund was relevant to its consideration of the Advisory Contracts.
In considering whether to approve the Advisory Contracts for the fund, the Board considered all factors it believed relevant and reached a determination, with the assistance of fund counsel and Independent Trustees' counsel and through the exercise of its business judgment, that the approval of the Advisory Contracts was in the best interests of the fund and its shareholders and the fact that no fee is payable under the management contract was fair and reasonable.
Nature, Extent, and Quality of Services Provided. The Board considered Fidelity's staffing as it relates to the fund, including the backgrounds of investment personnel of Fidelity, and also considered the fund's investment objective, strategies, and related investment philosophy. The Independent Trustees also had discussions with senior management of Fidelity's investment operations and investment groups. The Board considered the structure of the investment personnel compensation program and whether this structure provides appropriate incentives to act in the best interests of the fund. Additionally, the Board considered the portfolio managers' investments, if any, in the funds that they manage.
Resources Dedicated to Investment Management and Support Services. The Board and the Fund Oversight and Research Committees reviewed the general qualifications and capabilities of Fidelity's investment staff, including its size, education, experience, and resources, as well as Fidelity's approach to recruiting, training, managing, and compensating investment personnel. The Board noted that Fidelity has continued to increase the resources devoted to non-U.S. offices, including expansion of Fidelity's global investment organization. The Board also noted that Fidelity's analysts have extensive resources, tools and capabilities that allow them to conduct sophisticated quantitative and fundamental analysis, as well as credit analysis of issuers, counterparties and guarantors. Further, the Board considered that Fidelity's investment professionals have sufficient access to global information and data so as to provide competitive investment results over time, and that those professionals also have access to sophisticated tools that permit them to assess portfolio construction and risk and performance attribution characteristics continuously, as well as to transmit new information and research conclusions rapidly around the world. Additionally, in its deliberations, the Board considered Fidelity's trading, risk management, compliance, and technology and operations capabilities and resources, which are integral parts of the investment management process.
Shareholder and Administrative Services. The Board considered (i) the nature, extent, quality, and cost of advisory, administrative, and shareholder services performed by the Investment Advisers and their affiliates under the Advisory Contracts and under separate agreements covering transfer agency, pricing and bookkeeping, and securities lending services for the fund; (ii) the nature and extent of the supervision of third party service providers, principally custodians, subcustodians, and pricing vendors; and (iii) the resources devoted to, and the record of compliance with, the fund's compliance policies and procedures. The Board also reviewed the allocation of fund brokerage, including allocations to brokers affiliated with the Investment Advisers, the use of brokerage commissions to pay fund expenses, and the use of "soft" commission dollars to pay for research services.
The Board noted that the growth of fund assets over time across the complex allows Fidelity to reinvest in the development of services designed to enhance the value and convenience of the Fidelity funds as investment vehicles. These services include 24-hour access to account information and market information through telephone representatives and over the Internet, investor education materials and asset allocation tools, and the expanded availability of Fidelity Investor Centers.
Investment in a Large Fund Family. The Board considered the benefits to shareholders of investing in a Fidelity fund, including the benefits of investing in a fund that is part of a large family of funds offering a variety of investment disciplines and providing a large variety of mutual fund investor services. The Board noted that Fidelity had taken, or had made recommendations that resulted in the Fidelity funds taking, a number of actions over the previous year that benefited particular funds, including: (i) continuing to dedicate additional resources to Fidelity's investment research process, which includes meetings with management of issuers of securities in which the funds invest, and to the support of the senior management team that oversees asset management; (ii) continuing efforts to enhance Fidelity's global research capabilities; (iii) launching new funds and making other enhancements to meet client needs; (iv) launching new share classes of existing funds; (v) eliminating purchase minimums and broadening eligibility requirements for certain funds and share classes; (vi) reducing management fees and total expenses for certain growth equity funds and index funds; (vii) lowering expense caps for certain existing funds and classes, and converting certain voluntary expense caps to contractual caps, to reduce expenses borne by shareholders; (viii) eliminating short-term redemption fees for funds that had such fees; (ix) rationalizing product lines and gaining increased efficiencies from fund mergers and share class consolidations; (x) continuing to develop, acquire and implement systems and technology to improve services to the funds and shareholders, strengthen information security, and increase efficiency; and (xi) continuing to implement enhancements to further strengthen Fidelity's product line to increase investors' probability of success in achieving their investment goals, including retirement income goals.
Investment Performance. The Board considered whether the fund has operated in accordance with its investment objective, as well as its record of compliance with its investment restrictions. As the fund recently commenced operations, the Board did not believe that it was appropriate to assign significant weight to its limited investment performance.
Based on its review, the Board concluded that the nature, extent, and quality of services provided to the fund under the Advisory Contracts should continue to benefit the shareholders of the fund.
Competitiveness of Management Fee and Total Expense Ratio. The Board noted that the fund is available exclusively to certain Fidelity fee-based programs. The Board considered that the fund does not pay SelectCo and would not pay FMR a management fee for investment advisory services, but that Fidelity is indirectly compensated for its services out of the program fees. The Board also noted that the investment adviser or an affiliate undertakes to pay all operating expenses of the fund with limited exceptions.
The Board noted that the amended and restated management contract for the fund contained amendments clarifying that the fund pays its non-operating expenses, including brokerage commissions and fees and expenses associated with the fund's securities lending program. The Board considered that the amendments would not change the services provided to the fund or the party responsible for making such payments under the current management contract.
Based on its review, the Board considered that the fund does not pay a management fee and concluded that the total expense ratio of the fund was reasonable in light of the services that the fund and its shareholders receive and the other factors considered.
Costs of the Services and Profitability. The Board considered the level of Fidelity's profits in respect of all the Fidelity funds.
PricewaterhouseCoopers LLP (PwC), auditor to Fidelity and certain Fidelity funds, has been engaged annually by the Board as part of the Board's assessment of Fidelity's profitability analysis. PwC's engagement includes the review and assessment of the methodologies used by Fidelity in determining the revenues and expenses attributable to Fidelity's mutual fund business, and completion of agreed-upon procedures in respect of the mathematical accuracy of the fund profitability information and its conformity to established allocation methodologies. After considering PwC's reports issued under the engagement and information provided by Fidelity, the Board concluded that while other allocation methods may also be reasonable, Fidelity's profitability methodologies are reasonable in all material respects.
The Board also reviewed Fidelity's non-fund businesses and potential indirect benefits such businesses may have received as a result of their association with Fidelity's mutual fund business (i.e., fall-out benefits) as well as cases where Fidelity's affiliates may benefit from the fund's business. The Board noted that changes to fall-out benefits year-over-year reflect business developments at Fidelity's various businesses.
The Board concluded that the costs of the services provided by and the profits realized by Fidelity in connection with the operation of the fund were not relevant to the approval of the Advisory Contracts because the fund pays no advisory fees and the investment adviser or an affiliate bears all expenses of the fund with limited exceptions.
Economies of Scale. The Board concluded that because the fund pays no advisory fees and the investment adviser bears all expenses of the fund with limited exceptions, the realization of economies of scale was not a material factor in the Board's decision to approve the fund's Advisory Contract.
Additional Information Requested by the Board. In order to develop fully the factual basis for consideration of the Fidelity funds' advisory contracts, the Board requested and received additional information on certain topics, including: (i) fund performance trends, in particular the underperformance of certain funds, and Fidelity's long-term strategies for certain funds; (ii) Fidelity's fund profitability methodology, profitability trends for certain funds, and the impact of certain factors on fund profitability results; (iii) metrics for evaluating index fund and ETF performance and information about ETF trading characteristics; (iv) the methodology with respect to the evaluation of competitive fund data and peer group classifications and fee comparisons; (v) the expense structures for different funds and classes; (vi) information regarding other accounts managed by Fidelity, including collective investment trusts; and (vii) Fidelity's philosophies and strategies for evaluating funds and classes with lower or declining asset levels.
Based on its evaluation of all of the conclusions noted above, and after considering all factors it believed relevant, the Board concluded that the advisory fee arrangements are fair and reasonable, and that the fund's Advisory Contracts should be approved.
ZXL-SANN-0319
1.9881646.101
Item 2.
Code of Ethics
Not applicable.
Item 3.
Audit Committee Financial Expert
Not applicable.
Item 4.
Principal Accountant Fees and Services
Not applicable.
Item 5.
Audit Committee of Listed Registrants
Not applicable.
Item 6.
Investments
(a)
Not applicable.
(b)
Not applicable
Item 7.
Disclosure of Proxy Voting Policies and Procedures for Closed-End Management Investment Companies
Not applicable.
Item 8.
Portfolio Managers of Closed-End Management Investment Companies
Not applicable.
Item 9.
Purchase of Equity Securities by Closed-End Management Investment Company and Affiliated Purchasers
Not applicable.
Item 10.
Submission of Matters to a Vote of Security Holders
There were no material changes to the procedures by which shareholders may recommend nominees to the Fidelity Select Portfolios’s Board of Trustees.
Item 11.
Controls and Procedures
(a)(i) The President and Treasurer and the Chief Financial Officer have concluded that the Fidelity Select Portfolios’s (the “Trust”) disclosure controls and procedures (as defined in Rule 30a-3(c) under the Investment Company Act) provide reasonable
assurances that material information relating to the Trust is made known to them by the appropriate persons, based on their evaluation of these controls and procedures as of a date within 90 days of the filing date of this report.
(a)(ii) There was no change in the Trust’s internal control over financial reporting (as defined in Rule 30a-3(d) under the Investment Company Act) that occurred during the period covered by this report that has materially affected, or is reasonably likely to materially affect, the Trust’s internal control over financial reporting.
Item 12.
Disclosure of Securities Lending Activities for Closed-End Management
Investment Companies
Not applicable.
Item 13.
Exhibits
| | |
(a) | (1) | Not applicable. |
(a) | (2) | Certification pursuant to Rule 30a-2(a) under the Investment Company Act of 1940 (17 CFR 270.30a-2(a)) is filed and attached hereto as Exhibit 99.CERT. |
(a) | (3) | Not applicable. |
(b) |
| Certification pursuant to Rule 30a-2(b) under the Investment Company Act of 1940 (17 CFR 270.30a-2(b)) is furnished and attached hereto as Exhibit 99.906CERT. |
SIGNATURES
Pursuant to the requirements of the Securities Exchange Act of 1934 and the Investment Company Act of 1940, the registrant has duly caused this report to be signed on its behalf by the undersigned, thereunto duly authorized.
Fidelity Select Portfolios
| |
By: | /s/Stacie M. Smith |
| Stacie M. Smith |
| President and Treasurer |
|
|
Date: | March 26, 2019 |
Pursuant to the requirements of the Securities Exchange Act of 1934 and the Investment Company Act of 1940, this report has been signed below by the following persons on behalf of the registrant and in the capacities and on the dates indicated.
| |
By: | /s/Stacie M. Smith |
| Stacie M. Smith |
| President and Treasurer |
|
|
Date: | March 26, 2019 |
| |
By: | /s/John J. Burke III |
| John J. Burke III |
| Chief Financial Officer |
|
|
Date: | March 26, 2019 |