UNITED STATES
SECURITIES AND EXCHANGE COMMISSION
Washington, D.C. 20549
FORM N-CSR
CERTIFIED SHAREHOLDER REPORT OF REGISTERED
MANAGEMENT INVESTMENT COMPANIES
Investment Company Act file number 811-03114
Fidelity Select Portfolios
(Exact name of registrant as specified in charter)
245 Summer St., Boston, MA 02210
(Address of principal executive offices) (Zip code)
Cynthia Lo Bessette, Secretary
245 Summer St.
Boston, Massachusetts 02210
(Name and address of agent for service)
Registrant's telephone number, including area code:
617-563-7000
| |
Date of fiscal year end: | February 29 |
|
|
Date of reporting period: | August 31, 2019 |
Item 1.
Reports to Stockholders
Fidelity® Select Portfolios®
Consumer Discretionary Sector Automotive Portfolio
Communication Services Portfolio
Construction and Housing Portfolio
Consumer Discretionary Portfolio
Leisure Portfolio
Retailing Portfolio
Semi-Annual Report August 31, 2019 Includes Fidelity and Fidelity Advisor share classes |
 |
Beginning on January 1, 2021, as permitted by regulations adopted by the Securities and Exchange Commission, paper copies of a fund’s shareholder reports will no longer be sent by mail, unless you specifically request paper copies of the reports from the fund or from your financial intermediary, such as a financial advisor, broker-dealer or bank. Instead, the reports will be made available on a website, and you will be notified by mail each time a report is posted and provided with a website link to access the report.
If you already elected to receive shareholder reports electronically, you will not be affected by this change and you need not take any action. You may elect to receive shareholder reports and other communications from a fund electronically, by contacting your financial intermediary. For Fidelity customers, visit Fidelity's web site or call Fidelity using the contact information listed below.
You may elect to receive all future reports in paper free of charge. If you wish to continue receiving paper copies of your shareholder reports, you may contact your financial intermediary or, if you are a Fidelity customer, visit Fidelity’s website, or call Fidelity at the applicable toll-free number listed below. Your election to receive reports in paper will apply to all funds held with the fund complex/your financial intermediary.
| Account Type | Website | Phone Number |
| Brokerage, Mutual Fund, or Annuity Contracts: | fidelity.com/mailpreferences | 1-800-343-3548 |
| Employer Provided Retirement Accounts: | netbenefits.fidelity.com/preferences (choose 'no' under Required Disclosures to continue to print) | 1-800-343-0860 |
| Advisor Sold Accounts Serviced Through Your Financial Intermediary: | Contact Your Financial Intermediary | Your Financial Intermediary's phone number |
| Advisor Sold Accounts Serviced by Fidelity: | institutional.fidelity.com | 1-877-208-0098 |
Contents
To view a fund's proxy voting guidelines and proxy voting record for the 12-month period ended June 30, visit http://www.fidelity.com/proxyvotingresults or visit the Securities and Exchange Commission's (SEC) web site at http://www.sec.gov.
You may also call 1-800-544-8544 if you’re an individual investing directly with Fidelity, call 1-800-835-5092 if you’re a plan sponsor or participant with Fidelity as your recordkeeper or call 1-877-208-0098 on institutional accounts or if you’re an advisor or invest through one to request a free copy of the proxy voting guidelines.
Standard & Poor's, S&P and S&P 500 are registered service marks of The McGraw-Hill Companies, Inc. and have been licensed for use by Fidelity Distributors Corporation.
Other third-party marks appearing herein are the property of their respective owners.
All other marks appearing herein are registered or unregistered trademarks or service marks of FMR LLC or an affiliated company. © 2019 FMR LLC. All rights reserved.
This report and the financial statements contained herein are submitted for the general information of the shareholders of the Funds. This report is not authorized for distribution to prospective investors in the Funds unless preceded or accompanied by an effective prospectus.
A fund files its complete schedule of portfolio holdings with the SEC for the first and third quarters of each fiscal year on Form N-PORT. Forms N-PORT are available on the SEC’s web site at http://www.sec.gov. A fund's Forms N-PORT may be reviewed and copied at the SEC’s Public Reference Room in Washington, DC. Information regarding the operation of the SEC's Public Reference Room may be obtained by calling 1-800-SEC-0330.
For a complete list of a fund's portfolio holdings, view the most recent holdings listing, semiannual report, or annual report on Fidelity's web site at http://www.fidelity.com, http://www.institutional.fidelity.com, or http://www.401k.com, as applicable.
NOT FDIC INSURED •MAY LOSE VALUE •NO BANK GUARANTEE
Neither the Funds nor Fidelity Distributors Corporation is a bank.
Automotive Portfolio
Investment Summary (Unaudited)
Top Ten Stocks as of August 31, 2019
| | % of fund's net assets |
| General Motors Co. | 11.9 |
| Toyota Motor Corp. sponsored ADR | 8.9 |
| Tesla, Inc. | 7.7 |
| Ford Motor Co. | 6.8 |
| Honda Motor Co. Ltd. sponsored ADR | 6.4 |
| Aptiv PLC | 5.2 |
| O'Reilly Automotive, Inc. | 4.9 |
| Copart, Inc. | 4.7 |
| AutoZone, Inc. | 4.5 |
| Magna International, Inc. Class A (sub. vtg.) | 4.0 |
| | 65.0 |
Top Industries (% of fund's net assets)
| As of August 31, 2019 |
| | Automobiles | 49.2% |
| | Specialty Retail | 20.0% |
| | Auto Components | 18.0% |
| | Distributors | 5.4% |
| | Commercial Services & Supplies | 4.7% |
| | All Others* | 2.7% |

* Includes short-term investments and net other assets (liabilities).
Automotive Portfolio
Schedule of Investments August 31, 2019 (Unaudited)
Showing Percentage of Net Assets
| Common Stocks - 98.4% | | | |
| | | Shares | Value |
| Auto Components - 18.0% | | | |
| Auto Parts & Equipment - 17.8% | | | |
| Adient PLC | | 1,500 | $30,255 |
| Aptiv PLC | | 20,928 | 1,740,582 |
| Autoliv, Inc. (a) | | 4,100 | 280,440 |
| BorgWarner, Inc. | | 25,100 | 819,013 |
| Gentex Corp. | | 29,200 | 776,720 |
| Lear Corp. | | 8,562 | 961,170 |
| Magna International, Inc. Class A (sub. vtg.) | | 26,500 | 1,326,791 |
| Stoneridge, Inc. (b) | | 40 | 1,228 |
| | | | 5,936,199 |
| Tires & Rubber - 0.2% | | | |
| The Goodyear Tire & Rubber Co. | | 5,100 | 58,497 |
|
| TOTAL AUTO COMPONENTS | | | 5,994,696 |
|
| Automobiles - 48.8% | | | |
| Automobile Manufacturers - 48.8% | | | |
| Ferrari NV | | 8,382 | 1,322,261 |
| Fiat Chrysler Automobiles NV | | 43,400 | 570,276 |
| Ford Motor Co. | | 246,331 | 2,258,855 |
| General Motors Co. | | 107,014 | 3,969,149 |
| Honda Motor Co. Ltd. sponsored ADR | | 89,295 | 2,112,720 |
| NIO, Inc. sponsored ADR (a)(b) | | 25,700 | 73,502 |
| Subaru Corp. | | 14,500 | 388,450 |
| Tesla, Inc. (a)(b) | | 11,391 | 2,569,924 |
| Toyota Motor Corp. sponsored ADR | | 22,717 | 2,967,522 |
| | | | 16,232,659 |
| Commercial Services & Supplies - 4.7% | | | |
| Diversified Support Services - 4.7% | | | |
| Copart, Inc. (b) | | 20,900 | 1,575,651 |
| KAR Auction Services, Inc. | | 80 | 2,125 |
| | | | 1,577,776 |
| Distributors - 5.4% | | | |
| Distributors - 5.4% | | | |
| Genuine Parts Co. | | 8,400 | 758,436 |
| LKQ Corp. (b) | | 39,000 | 1,024,530 |
| | | | 1,782,966 |
| Machinery - 1.5% | | | |
| Construction Machinery & Heavy Trucks - 1.5% | | | |
| Allison Transmission Holdings, Inc. | | 11,300 | 502,059 |
| Specialty Retail - 20.0% | | | |
| Automotive Retail - 20.0% | | | |
| Advance Auto Parts, Inc. | | 5,100 | 703,545 |
| AutoNation, Inc. (b) | | 700 | 33,222 |
| AutoZone, Inc. (b) | | 1,371 | 1,510,417 |
| CarMax, Inc. (b) | | 10,700 | 891,096 |
| Carvana Co. Class A (a)(b) | | 6,900 | 560,004 |
| IAA Spinco, Inc. (b) | | 16,680 | 814,818 |
| Lithia Motors, Inc. Class A (sub. vtg.) | | 3,900 | 511,173 |
| O'Reilly Automotive, Inc. (b) | | 4,241 | 1,627,526 |
| | | | 6,651,801 |
| TOTAL COMMON STOCKS | | | |
| (Cost $24,250,654) | | | 32,741,957 |
|
| Nonconvertible Preferred Stocks - 0.4% | | | |
| Automobiles - 0.4% | | | |
| Automobile Manufacturers - 0.4% | | | |
| Volkswagen AG | | | |
| (Cost $123,020) | | 900 | 144,514 |
|
| Money Market Funds - 9.9% | | | |
| Fidelity Cash Central Fund 2.13% (c) | | 109,974 | 109,996 |
| Fidelity Securities Lending Cash Central Fund 2.13% (c)(d) | | 3,200,962 | 3,201,282 |
| TOTAL MONEY MARKET FUNDS | | | |
| (Cost $3,311,278) | | | 3,311,278 |
| TOTAL INVESTMENT IN SECURITIES - 108.7% | | | |
| (Cost $27,684,952) | | | 36,197,749 |
| NET OTHER ASSETS (LIABILITIES) - (8.7)% | | | (2,909,366) |
| NET ASSETS - 100% | | | $33,288,383 |
Legend
(a) Security or a portion of the security is on loan at period end.
(b) Non-income producing
(c) Affiliated fund that is generally available only to investment companies and other accounts managed by Fidelity Investments. The rate quoted is the annualized seven-day yield of the fund at period end. A complete unaudited listing of the fund's holdings as of its most recent quarter end is available upon request. In addition, each Fidelity Central Fund's financial statements are available on the SEC's website or upon request.
(d) Investment made with cash collateral received from securities on loan.
Affiliated Central Funds
Information regarding fiscal year to date income earned by the Fund from investments in Fidelity Central Funds is as follows:
| Fund | Income earned |
| Fidelity Cash Central Fund | $1,641 |
| Fidelity Securities Lending Cash Central Fund | 11,547 |
| Total | $13.188 |
Amounts in the income column in the above table include any capital gain distributions from underlying funds, which are presented in the corresponding line-item in the Statement of Operations, if applicable. Amount for Fidelity Securities Lending Cash Central Fund represents the income earned on investing cash collateral, less rebates paid to borrowers and any lending agent fees associated with the loan, plus any premium payments received for lending certain types of securities.
Investment Valuation
All investments are categorized as Level 1 under the Fair Value Hierarchy. The inputs or methodology used for valuing securities may not be an indication of the risk associated with investing in those securities. For more information on valuation inputs please refer to the Investment Valuation section in the accompanying Notes to Financial Statements.
Other Information
Distribution of investments by country or territory of incorporation, as a percentage of Total Net Assets, is as follows (Unaudited):
| United States of America | 67.9% |
| Japan | 16.5% |
| Netherlands | 5.7% |
| Bailiwick of Jersey | 5.2% |
| Canada | 4.0% |
| Others (Individually Less Than 1%) | 0.7% |
| | 100.0% |
See accompanying notes which are an integral part of the financial statements.
Automotive Portfolio
Financial Statements
Statement of Assets and Liabilities
| | | August 31, 2019 (Unaudited) |
| Assets | | |
Investment in securities, at value (including securities loaned of $3,173,969) — See accompanying schedule:
Unaffiliated issuers (cost $24,373,674) | $32,886,471 | |
| Fidelity Central Funds (cost $3,311,278) | 3,311,278 | |
| Total Investment in Securities (cost $27,684,952) | | $36,197,749 |
| Receivable for investments sold | | 976,470 |
| Receivable for fund shares sold | | 5,606 |
| Dividends receivable | | 89,220 |
| Distributions receivable from Fidelity Central Funds | | 2,680 |
| Prepaid expenses | | 465 |
| Other receivables | | 219,009 |
| Total assets | | 37,491,199 |
| Liabilities | | |
| Payable for investments purchased | $906,450 | |
| Payable for fund shares redeemed | 52,035 | |
| Accrued management fee | 14,934 | |
| Other affiliated payables | 8,026 | |
| Other payables and accrued expenses | 20,582 | |
| Collateral on securities loaned | 3,200,789 | |
| Total liabilities | | 4,202,816 |
| Net Assets | | $33,288,383 |
| Net Assets consist of: | | |
| Paid in capital | | $23,480,694 |
| Total distributable earnings (loss) | | 9,807,689 |
| Net Assets, for 1,014,697 shares outstanding | | $33,288,383 |
| Net Asset Value, offering price and redemption price per share ($33,288,383 ÷ 1,014,697 shares) | | $32.81 |
See accompanying notes which are an integral part of the financial statements.
Statement of Operations
| | | Six months ended August 31, 2019 (Unaudited) |
| Investment Income | | |
| Dividends | | $527,658 |
| Income from Fidelity Central Funds (including $11,547 from security lending) | | 13,188 |
| Total income | | 540,846 |
| Expenses | | |
| Management fee | $95,029 | |
| Transfer agent fees | 42,879 | |
| Accounting and security lending fees | 7,038 | |
| Custodian fees and expenses | 1,896 | |
| Independent trustees' fees and expenses | 101 | |
| Registration fees | 13,570 | |
| Audit | 18,965 | |
| Legal | 41 | |
| Miscellaneous | 164 | |
| Total expenses before reductions | 179,683 | |
| Expense reductions | (1,185) | |
| Total expenses after reductions | | 178,498 |
| Net investment income (loss) | | 362,348 |
| Realized and Unrealized Gain (Loss) | | |
| Net realized gain (loss) on: | | |
| Investment securities: | | |
| Unaffiliated issuers | 1,150,956 | |
| Fidelity Central Funds | 233 | |
| Foreign currency transactions | (49) | |
| Total net realized gain (loss) | | 1,151,140 |
| Change in net unrealized appreciation (depreciation) on: | | |
| Investment securities: | | |
| Unaffiliated issuers | (1,995,577) | |
| Assets and liabilities in foreign currencies | (67) | |
| Total change in net unrealized appreciation (depreciation) | | (1,995,644) |
| Net gain (loss) | | (844,504) |
| Net increase (decrease) in net assets resulting from operations | | $(482,156) |
See accompanying notes which are an integral part of the financial statements.
Statement of Changes in Net Assets
| | Six months ended August 31, 2019 (Unaudited) | Year ended February 28, 2019 |
| Increase (Decrease) in Net Assets | | |
| Operations | | |
| Net investment income (loss) | $362,348 | $448,747 |
| Net realized gain (loss) | 1,151,140 | 1,271,345 |
| Change in net unrealized appreciation (depreciation) | (1,995,644) | (3,853,613) |
| Net increase (decrease) in net assets resulting from operations | (482,156) | (2,133,521) |
| Distributions to shareholders | (139,402) | (3,068,342) |
| Share transactions | | |
| Proceeds from sales of shares | 2,069,641 | 11,884,432 |
| Reinvestment of distributions | 132,587 | 2,935,846 |
| Cost of shares redeemed | (9,073,488) | (24,976,652) |
| Net increase (decrease) in net assets resulting from share transactions | (6,871,260) | (10,156,374) |
| Total increase (decrease) in net assets | (7,492,818) | (15,358,237) |
| Net Assets | | |
| Beginning of period | 40,781,201 | 56,139,438 |
| End of period | $33,288,383 | $40,781,201 |
| Other Information | | |
| Shares | | |
| Sold | 62,388 | 351,778 |
| Issued in reinvestment of distributions | 3,929 | 87,676 |
| Redeemed | (276,774) | (710,478) |
| Net increase (decrease) | (210,457) | (271,024) |
See accompanying notes which are an integral part of the financial statements.
Financial Highlights
Automotive Portfolio
| | Six months ended (Unaudited) August 31, | Years endedFebruary 28, | | | | |
| | 2019 | 2019 | 2018 | 2017 | 2016 A | 2015 |
| Selected Per–Share Data | | | | | | |
| Net asset value, beginning of period | $33.29 | $37.52 | $36.78 | $33.72 | $48.82 | $56.95 |
| Income from Investment Operations | | | | | | |
| Net investment income (loss)B | .34 | .36 | .39C | .33 | .65 | .42 |
| Net realized and unrealized gain (loss) | (.69)D | (2.15) | 6.11 | 5.22 | (9.37) | 3.05 |
| Total from investment operations | (.35) | (1.79) | 6.50 | 5.55 | (8.72) | 3.47 |
| Distributions from net investment income | (.03) | (.38) | (.20) | (.52) | (.45) | (.38) |
| Distributions from net realized gain | (.10) | (2.06) | (5.56) | (1.98) | (5.93) | (11.22) |
| Total distributions | (.13) | (2.44) | (5.76) | (2.49)E | (6.38) | (11.60) |
| Redemption fees added to paid in capitalB | – | – | –F | –F | –F | –F |
| Net asset value, end of period | $32.81 | $33.29 | $37.52 | $36.78 | $33.72 | $48.82 |
| Total ReturnG,H | (1.07)%D | (4.66)% | 19.08% | 16.80% | (20.00)% | 8.04% |
| Ratios to Average Net AssetsI,J | | | | | | |
| Expenses before reductions | 1.01%K | .97% | .97% | .96% | .87% | .85% |
| Expenses net of fee waivers, if any | 1.01%K | .97% | .96% | .96% | .87% | .85% |
| Expenses net of all reductions | 1.01%K | .97% | .96% | .95% | .86% | .85% |
| Net investment income (loss) | 2.05%K | 1.04% | 1.04%C | .92% | 1.49% | .82% |
| Supplemental Data | | | | | | |
| Net assets, end of period (000 omitted) | $33,288 | $40,781 | $56,139 | $54,069 | $65,745 | $137,877 |
| Portfolio turnover rateL | 30%K | 31% | 117% | 83% | 80% | 71% |
A For the year ended February 29.
B Calculated based on average shares outstanding during the period.
C Net investment income per share reflects a large, non-recurring dividend which amounted to $.08 per share. Excluding this non-recurring dividend, the ratio of net investment income (loss) to average net assets would have been .83%.
D Net realized and unrealized gain (loss) per share reflects proceeds received from litigation which amounted to $.20 per share. Excluding these litigation proceeds, the total return would have been 0.46%.
E Total distributions of $2.49 per share is comprised of distributions from net investment income of $.515 and distributions from net realized gain of $1.975 per share.
F Amount represents less than $.005 per share.
G Total returns for periods of less than one year are not annualized.
H Total returns would have been lower if certain expenses had not been reduced during the applicable periods shown.
I Fees and expenses of any underlying Fidelity Central Funds are not included in the Fund's expense ratio. The Fund indirectly bears its proportionate share of the expenses of any underlying Fidelity Central Funds.
J Expense ratios reflect operating expenses of the Fund. Expenses before reductions do not reflect amounts reimbursed by the investment adviser or reductions from brokerage service arrangements or reductions from other expense offset arrangements and do not represent the amount paid by the Fund during periods when reimbursements or reductions occur. Expenses net of fee waivers reflect expenses after reimbursement by the investment adviser but prior to reductions from brokerage service arrangements or other expense offset arrangements. Expenses net of all reductions represent the net expenses paid by the Fund.
K Annualized
L Amount does not include the portfolio activity of any underlying Fidelity Central Funds.
See accompanying notes which are an integral part of the financial statements.
Communication Services Portfolio
Investment Summary (Unaudited)
Top Ten Stocks as of August 31, 2019
| | % of fund's net assets |
| Alphabet, Inc. Class A | 24.7 |
| Facebook, Inc. Class A | 17.3 |
| The Walt Disney Co. | 6.0 |
| Comcast Corp. Class A | 4.8 |
| Activision Blizzard, Inc. | 4.5 |
| Netflix, Inc. | 2.7 |
| T-Mobile U.S., Inc. | 2.6 |
| Take-Two Interactive Software, Inc. | 2.3 |
| Electronic Arts, Inc. | 2.3 |
| AT&T, Inc. | 2.1 |
| | 69.3 |
Top Industries (% of fund's net assets)
| As of August 31, 2019 |
| | Interactive Media & Services | 47.6% |
| | Entertainment | 19.9% |
| | Media | 15.5% |
| | Diversified Telecommunication Services | 9.9% |
| | Internet & Direct Marketing Retail | 3.6% |
| | All Others* | 3.5% |

* Includes short-term investments and net other assets (liabilities).
Communication Services Portfolio
Schedule of Investments August 31, 2019 (Unaudited)
Showing Percentage of Net Assets
| Common Stocks - 99.7% | | | |
| | | Shares | Value |
| Diversified Telecommunication Services - 9.9% | | | |
| Alternative Carriers - 4.9% | | | |
| CenturyLink, Inc. | | 288,100 | $3,278,578 |
| Cogent Communications Group, Inc. | | 58,000 | 3,531,620 |
| GCI Liberty, Inc. (a) | | 134,400 | 8,365,056 |
| Iliad SA | | 18,500 | 1,936,460 |
| Iridium Communications, Inc. (a) | | 263,400 | 6,369,012 |
| Vonage Holdings Corp. (a) | | 277,300 | 3,665,906 |
| Zayo Group Holdings, Inc. (a) | | 85,400 | 2,874,564 |
| | | | 30,021,196 |
| Integrated Telecommunication Services - 5.0% | | | |
| AT&T, Inc. | | 367,500 | 12,958,050 |
| Atn International, Inc. | | 20,600 | 1,170,492 |
| Cincinnati Bell, Inc. (a) | | 146,300 | 794,409 |
| Masmovil Ibercom SA (a) | | 184,600 | 3,777,712 |
| Verizon Communications, Inc. | | 209,800 | 12,201,968 |
| | | | 30,902,631 |
|
| TOTAL DIVERSIFIED TELECOMMUNICATION SERVICES | | | 60,923,827 |
|
| Entertainment - 19.9% | | | |
| Interactive Home Entertainment - 9.5% | | | |
| Activision Blizzard, Inc. | | 545,900 | 27,622,540 |
| Electronic Arts, Inc. (a) | | 148,900 | 13,948,952 |
| Take-Two Interactive Software, Inc. (a) | | 109,700 | 14,477,109 |
| Zynga, Inc. (a) | | 407,000 | 2,323,970 |
| | | | 58,372,571 |
| Movies & Entertainment - 10.4% | | | |
| Lions Gate Entertainment Corp. Class B | | 130,834 | 1,091,156 |
| Live Nation Entertainment, Inc. (a) | | 25,000 | 1,737,750 |
| Netflix, Inc. (a) | | 56,200 | 16,508,750 |
| The Walt Disney Co. | | 268,071 | 36,795,425 |
| World Wrestling Entertainment, Inc. Class A (b) | | 105,700 | 7,550,151 |
| | | | 63,683,232 |
|
| TOTAL ENTERTAINMENT | | | 122,055,803 |
|
| Interactive Media & Services - 47.6% | | | |
| Interactive Media & Services - 47.6% | | | |
| Alphabet, Inc. Class A (a) | | 127,400 | 151,673,521 |
| ANGI Homeservices, Inc. Class A (a)(b) | | 104,400 | 810,144 |
| Facebook, Inc. Class A (a) | | 572,000 | 106,203,240 |
| Match Group, Inc. (b) | | 48,300 | 4,095,840 |
| Momo, Inc. ADR | | 156,200 | 5,745,036 |
| Tencent Holdings Ltd. | | 196,200 | 8,100,222 |
| TripAdvisor, Inc. (a) | | 44,200 | 1,679,158 |
| Twitter, Inc. (a) | | 281,400 | 12,001,710 |
| Zillow Group, Inc. Class A (a)(b) | | 49,500 | 1,691,415 |
| | | | 292,000,286 |
| Internet & Direct Marketing Retail - 3.6% | | | |
| Internet & Direct Marketing Retail - 3.6% | | | |
| Alibaba Group Holding Ltd. sponsored ADR (a) | | 36,100 | 6,318,583 |
| Meituan Dianping Class B | | 852,700 | 8,069,180 |
| Pinduoduo, Inc. ADR (a) | | 236,000 | 7,733,720 |
| | | | 22,121,483 |
| Media - 15.5% | | | |
| Broadcasting - 4.7% | | | |
| Discovery Communications, Inc. Class C (non-vtg.) (a) | | 231,800 | 6,033,754 |
| Fox Corp. Class B | | 64,966 | 2,130,885 |
| Liberty Media Corp.: | | | |
| Liberty Media Class A (a) | | 238,162 | 9,428,834 |
| Liberty SiriusXM Series A (a) | | 108,300 | 4,385,067 |
| Sinclair Broadcast Group, Inc. Class A (b) | | 152,600 | 6,801,382 |
| | | | 28,779,922 |
| Cable & Satellite - 10.3% | | | |
| Charter Communications, Inc. Class A (a) | | 16,871 | 6,910,193 |
| Comcast Corp. Class A | | 660,800 | 29,247,008 |
| DISH Network Corp. Class A (a) | | 94,800 | 3,181,488 |
| Liberty Broadband Corp. Class A (a) | | 122,323 | 12,813,334 |
| Liberty Global PLC Class C (a) | | 343,100 | 8,961,772 |
| Liberty Latin America Ltd. Class C (a) | | 116,500 | 1,921,085 |
| Sirius XM Holdings, Inc. (b) | | 81,952 | 505,644 |
| | | | 63,540,524 |
| Publishing - 0.5% | | | |
| The New York Times Co. Class A | | 105,600 | 3,083,520 |
|
| TOTAL MEDIA | | | 95,403,966 |
|
| Software - 0.4% | | | |
| Application Software - 0.4% | | | |
| Sciplay Corp. (A Shares) | | 239,800 | 2,280,498 |
| Wireless Telecommunication Services - 2.8% | | | |
| Wireless Telecommunication Services - 2.8% | | | |
| Boingo Wireless, Inc. (a) | | 97,800 | 1,258,686 |
| T-Mobile U.S., Inc. (a) | | 205,400 | 16,031,470 |
| | | | 17,290,156 |
| TOTAL COMMON STOCKS | | | |
| (Cost $481,161,224) | | | 612,076,019 |
|
| Money Market Funds - 3.1% | | | |
| Fidelity Cash Central Fund 2.13% (c) | | 2,259,340 | 2,259,792 |
| Fidelity Securities Lending Cash Central Fund 2.13% (c)(d) | | 16,704,256 | 16,705,926 |
| TOTAL MONEY MARKET FUNDS | | | |
| (Cost $18,965,718) | | | 18,965,718 |
| TOTAL INVESTMENT IN SECURITIES - 102.8% | | | |
| (Cost $500,126,942) | | | 631,041,737 |
| NET OTHER ASSETS (LIABILITIES) - (2.8)% | | | (17,479,978) |
| NET ASSETS - 100% | | | $613,561,759 |
Legend
(a) Non-income producing
(b) Security or a portion of the security is on loan at period end.
(c) Affiliated fund that is generally available only to investment companies and other accounts managed by Fidelity Investments. The rate quoted is the annualized seven-day yield of the fund at period end. A complete unaudited listing of the fund's holdings as of its most recent quarter end is available upon request. In addition, each Fidelity Central Fund's financial statements are available on the SEC's website or upon request.
(d) Investment made with cash collateral received from securities on loan.
Affiliated Central Funds
Information regarding fiscal year to date income earned by the Fund from investments in Fidelity Central Funds is as follows:
| Fund | Income earned |
| Fidelity Cash Central Fund | $77,124 |
| Fidelity Securities Lending Cash Central Fund | 20,516 |
| Total | $97,640 |
Amounts in the income column in the above table include any capital gain distributions from underlying funds, which are presented in the corresponding line-item in the Statement of Operations, if applicable. Amount for Fidelity Securities Lending Cash Central Fund represents the income earned on investing cash collateral, less rebates paid to borrowers and any lending agent fees associated with the loan, plus any premium payments received for lending certain types of securities.
Investment Valuation
The following is a summary of the inputs used, as of August 31, 2019, involving the Fund's assets and liabilities carried at fair value. The inputs or methodology used for valuing securities may not be an indication of the risk associated with investing in those securities. For more information on valuation inputs, and their aggregation into the levels used below, please refer to the Investment Valuation section in the accompanying Notes to Financial Statements.
| | Valuation Inputs at Reporting Date: |
| Description | Total | Level 1 | Level 2 | Level 3 |
| Investments in Securities: | | | | |
| Common Stocks | $612,076,019 | $595,906,617 | $16,169,402 | $-- |
| Money Market Funds | 18,965,718 | 18,965,718 | -- | -- |
| Total Investments in Securities: | $631,041,737 | $614,872,335 | $16,169,402 | $-- |
See accompanying notes which are an integral part of the financial statements.
Communication Services Portfolio
Financial Statements
Statement of Assets and Liabilities
| | | August 31, 2019 (Unaudited) |
| Assets | | |
Investment in securities, at value (including securities loaned of $16,313,801) — See accompanying schedule:
Unaffiliated issuers (cost $481,161,224) | $612,076,019 | |
| Fidelity Central Funds (cost $18,965,718) | 18,965,718 | |
| Total Investment in Securities (cost $500,126,942) | | $631,041,737 |
| Receivable for investments sold | | 26,437 |
| Receivable for fund shares sold | | 262,551 |
| Dividends receivable | | 138,505 |
| Distributions receivable from Fidelity Central Funds | | 10,046 |
| Prepaid expenses | | 4,895 |
| Other receivables | | 4,298 |
| Total assets | | 631,488,469 |
| Liabilities | | |
| Payable for fund shares redeemed | $809,942 | |
| Accrued management fee | 271,418 | |
| Distribution and service plan fees payable | 1,868 | |
| Other affiliated payables | 112,134 | |
| Other payables and accrued expenses | 25,895 | |
| Collateral on securities loaned | 16,705,453 | |
| Total liabilities | | 17,926,710 |
| Net Assets | | $613,561,759 |
| Net Assets consist of: | | |
| Paid in capital | | $463,657,522 |
| Total distributable earnings (loss) | | 149,904,237 |
| Net Assets | | $613,561,759 |
| Net Asset Value and Maximum Offering Price | | |
| Class A: | | |
| Net Asset Value and redemption price per share ($5,122,467 ÷ 81,334 shares)(a) | | $62.98 |
| Maximum offering price per share (100/94.25 of $62.98) | | $66.82 |
| Class M: | | |
| Net Asset Value and redemption price per share ($1,132,797 ÷ 18,025 shares)(a) | | $62.85 |
| Maximum offering price per share (100/96.50 of $62.85) | | $65.13 |
| Class C: | | |
| Net Asset Value and offering price per share ($596,836 ÷ 9,534 shares)(a) | | $62.60 |
| Communication Services: | | |
| Net Asset Value, offering price and redemption price per share ($603,512,257 ÷ 9,562,932 shares) | | $63.11 |
| Class I: | | |
| Net Asset Value, offering price and redemption price per share ($1,634,148 ÷ 25,887 shares) | | $63.13 |
| Class Z: | | |
| Net Asset Value, offering price and redemption price per share ($1,563,254 ÷ 24,747 shares) | | $63.17 |
(a) Redemption price per share is equal to net asset value less any applicable contingent deferred sales charge.
See accompanying notes which are an integral part of the financial statements.
Statement of Operations
| | | Six months ended August 31, 2019 (Unaudited) |
| Investment Income | | |
| Dividends | | $2,053,568 |
| Income from Fidelity Central Funds (including $20,516 from security lending) | | 97,640 |
| Total income | | 2,151,208 |
| Expenses | | |
| Management fee | $1,641,835 | |
| Transfer agent fees | 564,244 | |
| Distribution and service plan fees | 8,115 | |
| Accounting and security lending fees | 112,836 | |
| Custodian fees and expenses | 4,414 | |
| Independent trustees' fees and expenses | 1,644 | |
| Registration fees | 48,897 | |
| Audit | 22,171 | |
| Legal | 944 | |
| Interest | 2,721 | |
| Miscellaneous | 2,268 | |
| Total expenses before reductions | 2,410,089 | |
| Expense reductions | (17,639) | |
| Total expenses after reductions | | 2,392,450 |
| Net investment income (loss) | | (241,242) |
| Realized and Unrealized Gain (Loss) | | |
| Net realized gain (loss) on: | | |
| Investment securities: | | |
| Unaffiliated issuers | 21,472,097 | |
| Fidelity Central Funds | 537 | |
| Foreign currency transactions | 7,625 | |
| Total net realized gain (loss) | | 21,480,259 |
| Change in net unrealized appreciation (depreciation) on: | | |
| Investment securities: | | |
| Unaffiliated issuers | 34,141,330 | |
| Fidelity Central Funds | (65) | |
| Total change in net unrealized appreciation (depreciation) | | 34,141,265 |
| Net gain (loss) | | 55,621,524 |
| Net increase (decrease) in net assets resulting from operations | | $55,380,282 |
See accompanying notes which are an integral part of the financial statements.
Statement of Changes in Net Assets
| | Six months ended August 31, 2019 (Unaudited) | Year ended February 28, 2019 |
| Increase (Decrease) in Net Assets | | |
| Operations | | |
| Net investment income (loss) | $(241,242) | $844,441 |
| Net realized gain (loss) | 21,480,259 | 199,087,558 |
| Change in net unrealized appreciation (depreciation) | 34,141,265 | (164,960,880) |
| Net increase (decrease) in net assets resulting from operations | 55,380,282 | 34,971,119 |
| Distributions to shareholders | (143,080,075) | (67,435,980) |
| Share transactions - net increase (decrease) | 136,281,325 | 88,069,949 |
| Total increase (decrease) in net assets | 48,581,532 | 55,605,088 |
| Net Assets | | |
| Beginning of period | 564,980,227 | 509,375,139 |
| End of period | $613,561,759 | $564,980,227 |
See accompanying notes which are an integral part of the financial statements.
Financial Highlights
Communication Services Portfolio Class A
| | Six months ended (Unaudited) August 31, | Years endedFebruary 28, |
| | 2019 | 2019 A |
| Selected Per–Share Data | | |
| Net asset value, beginning of period | $74.84 | $78.20 |
| Income from Investment Operations | | |
| Net investment income (loss)B | (.11) | (.12) |
| Net realized and unrealized gain (loss) | 7.10 | 2.68 |
| Total from investment operations | 6.99 | 2.56 |
| Distributions from net investment income | – | (.14) |
| Distributions from net realized gain | (18.85) | (5.77) |
| Total distributions | (18.85) | (5.91) |
| Net asset value, end of period | $62.98 | $74.85 |
| Total ReturnC,D,E | 9.71% | 3.83% |
| Ratios to Average Net AssetsF,G | | |
| Expenses before reductions | 1.05%H | 1.13%H |
| Expenses net of fee waivers, if any | 1.05%H | 1.12%H |
| Expenses net of all reductions | 1.04%H | 1.11%H |
| Net investment income (loss) | (.34)%H | (.68)%H |
| Supplemental Data | | |
| Net assets, end of period (000 omitted) | $5,122 | $715 |
| Portfolio turnover rateI | 58%H | 107% |
A For the period November 30, 2018 (commencement of sale of shares) to February 28, 2019.
B Calculated based on average shares outstanding during the period.
C Total returns for periods of less than one year are not annualized.
D Total returns would have been lower if certain expenses had not been reduced during the applicable periods shown.
E Total returns do not include the effect of the sales charges.
F Fees and expenses of any underlying Fidelity Central Funds are not included in the Fund's expense ratio. The Fund indirectly bears its proportionate share of the expenses of any underlying Fidelity Central Funds.
G Expense ratios reflect operating expenses of the class. Expenses before reductions do not reflect amounts reimbursed by the investment adviser or reductions from brokerage service arrangements or reductions from other expense offset arrangements and do not represent the amount paid by the class during periods when reimbursements or reductions occur. Expense ratios before reductions for start-up periods may not be representative of longer-term operating periods. Expenses net of fee waivers reflect expenses after reimbursement by the investment adviser but prior to reductions from brokerage service arrangements or other expense offset arrangements. Expenses net of all reductions represent the net expenses paid by the class.
H Annualized
I Amount does not include the portfolio activity of any underlying Fidelity Central Funds.
See accompanying notes which are an integral part of the financial statements.
Communication Services Portfolio Class M
| | Six months ended (Unaudited) August 31, | Years endedFebruary 28, |
| | 2019 | 2019 A |
| Selected Per–Share Data | | |
| Net asset value, beginning of period | $74.82 | $78.20 |
| Income from Investment Operations | | |
| Net investment income (loss)B | (.20) | (.16) |
| Net realized and unrealized gain (loss) | 7.08 | 2.67 |
| Total from investment operations | 6.88 | 2.51 |
| Distributions from net investment income | – | (.12) |
| Distributions from net realized gain | (18.85) | (5.77) |
| Total distributions | (18.85) | (5.89) |
| Net asset value, end of period | $62.85 | $74.82 |
| Total ReturnC,D,E | 9.55% | 3.76% |
| Ratios to Average Net AssetsF,G | | |
| Expenses before reductions | 1.35%H | 1.36%H |
| Expenses net of fee waivers, if any | 1.35%H | 1.35%H |
| Expenses net of all reductions | 1.35%H | 1.34%H |
| Net investment income (loss) | (.64)%H | (.90)%H |
| Supplemental Data | | |
| Net assets, end of period (000 omitted) | $1,133 | $485 |
| Portfolio turnover rateI | 58%H | 107% |
A For the period November 30, 2018 (commencement of sale of shares) to February 28, 2019.
B Calculated based on average shares outstanding during the period.
C Total returns for periods of less than one year are not annualized.
D Total returns would have been lower if certain expenses had not been reduced during the applicable periods shown.
E Total returns do not include the effect of the sales charges.
F Fees and expenses of any underlying Fidelity Central Funds are not included in the Fund's expense ratio. The Fund indirectly bears its proportionate share of the expenses of any underlying Fidelity Central Funds.
G Expense ratios reflect operating expenses of the class. Expenses before reductions do not reflect amounts reimbursed by the investment adviser or reductions from brokerage service arrangements or reductions from other expense offset arrangements and do not represent the amount paid by the class during periods when reimbursements or reductions occur. Expense ratios before reductions for start-up periods may not be representative of longer-term operating periods. Expenses net of fee waivers reflect expenses after reimbursement by the investment adviser but prior to reductions from brokerage service arrangements or other expense offset arrangements. Expenses net of all reductions represent the net expenses paid by the class.
H Annualized
I Amount does not include the portfolio activity of any underlying Fidelity Central Funds.
See accompanying notes which are an integral part of the financial statements.
Communication Services Portfolio Class C
| | Six months ended (Unaudited) August 31, | Years endedFebruary 28, |
| | 2019 | 2019 A |
| Selected Per–Share Data | | |
| Net asset value, beginning of period | $74.76 | $78.20 |
| Income from Investment Operations | | |
| Net investment income (loss)B | (.38) | (.25) |
| Net realized and unrealized gain (loss) | 7.07 | 2.67 |
| Total from investment operations | 6.69 | 2.42 |
| Distributions from net investment income | – | (.09) |
| Distributions from net realized gain | (18.85) | (5.77) |
| Total distributions | (18.85) | (5.86) |
| Net asset value, end of period | $62.60 | $74.76 |
| Total ReturnC,D,E | 9.25% | 3.63% |
| Ratios to Average Net AssetsF,G | | |
| Expenses before reductions | 1.89%H | 1.87%H |
| Expenses net of fee waivers, if any | 1.89%H | 1.85%H |
| Expenses net of all reductions | 1.88%H | 1.84%H |
| Net investment income (loss) | (1.18)%H | (1.37)%H |
| Supplemental Data | | |
| Net assets, end of period (000 omitted) | $597 | $377 |
| Portfolio turnover rateI | 58%H | 107% |
A For the period November 30, 2018 (commencement of sale of shares) to February 28, 2019.
B Calculated based on average shares outstanding during the period.
C Total returns for periods of less than one year are not annualized.
D Total returns would have been lower if certain expenses had not been reduced during the applicable periods shown.
E Total returns do not include the effect of the contingent deferred sales charge.
F Fees and expenses of any underlying Fidelity Central Funds are not included in the Fund's expense ratio. The Fund indirectly bears its proportionate share of the expenses of any underlying Fidelity Central Funds.
G Expense ratios reflect operating expenses of the class. Expenses before reductions do not reflect amounts reimbursed by the investment adviser or reductions from brokerage service arrangements or reductions from other expense offset arrangements and do not represent the amount paid by the class during periods when reimbursements or reductions occur. Expense ratios before reductions for start-up periods may not be representative of longer-term operating periods. Expenses net of fee waivers reflect expenses after reimbursement by the investment adviser but prior to reductions from brokerage service arrangements or other expense offset arrangements. Expenses net of all reductions represent the net expenses paid by the class.
H Annualized
I Amount does not include the portfolio activity of any underlying Fidelity Central Funds.
See accompanying notes which are an integral part of the financial statements.
Communication Services Portfolio
| | Six months ended (Unaudited) August 31, | Years endedFebruary 28, | | | | |
| | 2019 | 2019 | 2018 | 2017 | 2016 A | 2015 |
| Selected Per–Share Data | | | | | | |
| Net asset value, beginning of period | $74.88 | $79.70 | $80.75 | $68.59 | $82.48 | $81.74 |
| Income from Investment Operations | | | | | | |
| Net investment income (loss)B | (.02) | .13 | .21 | .22 | .27 | .22 |
| Net realized and unrealized gain (loss) | 7.10 | 5.31 | 3.14 | 17.53 | (8.82) | 7.62 |
| Total from investment operations | 7.08 | 5.44 | 3.35 | 17.75 | (8.55) | 7.84 |
| Distributions from net investment income | – | (.20) | (.16) | (.33) | (.23) | (.20) |
| Distributions from net realized gain | (18.85) | (10.06) | (4.23) | (5.26) | (5.12) | (6.89) |
| Total distributions | (18.85) | (10.26) | (4.40)C | (5.59) | (5.34)D | (7.10)E |
| Redemption fees added to paid in capitalB | – | – | –F | –F | –F | –F |
| Net asset value, end of period | $63.11 | $74.88 | $79.70 | $80.75 | $68.59 | $82.48 |
| Total ReturnG,H | 9.86% | 8.12% | 4.16% | 26.85% | (10.88)% | 10.16% |
| Ratios to Average Net AssetsI,J | | | | | | |
| Expenses before reductions | .78%K | .82% | .80% | .82% | .81% | .81% |
| Expenses net of fee waivers, if any | .78%K | .81% | .80% | .82% | .81% | .81% |
| Expenses net of all reductions | .78%K | .80% | .79% | .82% | .80% | .81% |
| Net investment income (loss) | (.08)%K | .17% | .26% | .30% | .34% | .27% |
| Supplemental Data | | | | | | |
| Net assets, end of period (000 omitted) | $603,512 | $562,422 | $509,375 | $680,392 | $576,118 | $802,988 |
| Portfolio turnover rateL | 58%K | 107% | 22% | 33% | 42% | 55% |
A For the year ended February 29.
B Calculated based on average shares outstanding during the period.
C Total distributions of $4.40 per share is comprised of distributions from net investment income of $.163 and distributions from net realized gain of $4.233 per share.
D Total distributions of $5.34 per share is comprised of distributions from net investment income of $.227 and distributions from net realized gain of $5.115 per share.
E Total distributions of $7.10 per share is comprised of distributions from net investment income of $.204 and distributions from net realized gain of $6.892 per share.
F Amount represents less than $.005 per share.
G Total returns for periods of less than one year are not annualized.
H Total returns would have been lower if certain expenses had not been reduced during the applicable periods shown.
I Fees and expenses of any underlying Fidelity Central Funds are not included in the Fund's expense ratio. The Fund indirectly bears its proportionate share of the expenses of any underlying Fidelity Central Funds.
J Expense ratios reflect operating expenses of the class. Expenses before reductions do not reflect amounts reimbursed by the investment adviser or reductions from brokerage service arrangements or reductions from other expense offset arrangements and do not represent the amount paid by the class during periods when reimbursements or reductions occur. Expenses net of fee waivers reflect expenses after reimbursement by the investment adviser but prior to reductions from brokerage service arrangements or other expense offset arrangements. Expenses net of all reductions represent the net expenses paid by the class.
K Annualized
L Amount does not include the portfolio activity of any underlying Fidelity Central Funds.
See accompanying notes which are an integral part of the financial statements.
Communication Services Portfolio Class I
| | Six months ended (Unaudited) August 31, | Years endedFebruary 28, |
| | 2019 | 2019 A |
| Selected Per–Share Data | | |
| Net asset value, beginning of period | $74.88 | $78.20 |
| Income from Investment Operations | | |
| Net investment income (loss)B | (.02) | (.06) |
| Net realized and unrealized gain (loss) | 7.12 | 2.67 |
| Total from investment operations | 7.10 | 2.61 |
| Distributions from net investment income | – | (.15) |
| Distributions from net realized gain | (18.85) | (5.77) |
| Total distributions | (18.85) | (5.92) |
| Redemption fees added to paid in capitalB | – | – |
| Net asset value, end of period | $63.13 | $74.89 |
| Total ReturnC,D | 9.88% | 3.91% |
| Ratios to Average Net AssetsE,F | | |
| Expenses before reductions | .77%G | .70%G |
| Expenses net of fee waivers, if any | .77%G | .69%G |
| Expenses net of all reductions | .76%G | .68%G |
| Net investment income (loss) | (.06)%G | (.30)%G |
| Supplemental Data | | |
| Net assets, end of period (000 omitted) | $1,634 | $452 |
| Portfolio turnover rateH | 58%G | 107% |
A For the period November 30, 2018 (commencement of sale of shares) to February 28, 2019.
B Calculated based on average shares outstanding during the period.
C Total returns for periods of less than one year are not annualized.
D Total returns would have been lower if certain expenses had not been reduced during the applicable periods shown.
E Fees and expenses of any underlying Fidelity Central Funds are not included in the Fund's expense ratio. The Fund indirectly bears its proportionate share of the expenses of any underlying Fidelity Central Funds.
F Expense ratios reflect operating expenses of the class. Expenses before reductions do not reflect amounts reimbursed by the investment adviser or reductions from brokerage service arrangements or reductions from other expense offset arrangements and do not represent the amount paid by the class during periods when reimbursements or reductions occur. Expense ratios before reductions for start-up periods may not be representative of longer-term operating periods. Expenses net of fee waivers reflect expenses after reimbursement by the investment adviser but prior to reductions from brokerage service arrangements or other expense offset arrangements. Expenses net of all reductions represent the net expenses paid by the class.
G Annualized
H Amount does not include the portfolio activity of any underlying Fidelity Central Funds.
See accompanying notes which are an integral part of the financial statements.
Communication Services Portfolio Class Z
| | Six months ended (Unaudited) August 31, | Years endedFebruary 28, |
| | 2019 | 2019 A |
| Selected Per–Share Data | | |
| Net asset value, beginning of period | $74.89 | $78.20 |
| Income from Investment Operations | | |
| Net investment income (loss)B | .02 | (.03) |
| Net realized and unrealized gain (loss) | 7.11 | 2.65 |
| Total from investment operations | 7.13 | 2.62 |
| Distributions from net investment income | – | (.16) |
| Distributions from net realized gain | (18.85) | (5.77) |
| Total distributions | (18.85) | (5.93) |
| Net asset value, end of period | $63.17 | $74.89 |
| Total ReturnC,D | 9.94% | 3.92% |
| Ratios to Average Net AssetsE,F | | |
| Expenses before reductions | .65%G | .64%G |
| Expenses net of fee waivers, if any | .65%G | .62%G |
| Expenses net of all reductions | .64%G | .61%G |
| Net investment income (loss) | .06%G | (.16)%G |
| Supplemental Data | | |
| Net assets, end of period (000 omitted) | $1,563 | $529 |
| Portfolio turnover rateH | 58%G | 107% |
A For the period November 30, 2018 (commencement of sale of shares) to February 28, 2019.
B Calculated based on average shares outstanding during the period.
C Total returns for periods of less than one year are not annualized.
D Total returns would have been lower if certain expenses had not been reduced during the applicable periods shown.
E Fees and expenses of any underlying Fidelity Central Funds are not included in the Fund's expense ratio. The Fund indirectly bears its proportionate share of the expenses of any underlying Fidelity Central Funds.
F Expense ratios reflect operating expenses of the class. Expenses before reductions do not reflect amounts reimbursed by the investment adviser or reductions from brokerage service arrangements or reductions from other expense offset arrangements and do not represent the amount paid by the class during periods when reimbursements or reductions occur. Expense ratios before reductions for start-up periods may not be representative of longer-term operating periods. Expenses net of fee waivers reflect expenses after reimbursement by the investment adviser but prior to reductions from brokerage service arrangements or other expense offset arrangements. Expenses net of all reductions represent the net expenses paid by the class.
G Annualized
H Amount does not include the portfolio activity of any underlying Fidelity Central Funds.
See accompanying notes which are an integral part of the financial statements.
Construction and Housing Portfolio
Investment Summary (Unaudited)
Top Ten Stocks as of August 31, 2019
| | % of fund's net assets |
| The Home Depot, Inc. | 19.9 |
| Lowe's Companies, Inc. | 14.9 |
| Equity Residential (SBI) | 9.8 |
| D.R. Horton, Inc. | 4.2 |
| Vulcan Materials Co. | 3.9 |
| Johnson Controls International PLC | 3.1 |
| Apartment Investment & Management Co. Class A | 3.1 |
| PulteGroup, Inc. | 2.6 |
| NVR, Inc. | 2.5 |
| Equity Lifestyle Properties, Inc. | 2.5 |
| | 66.5 |
Top Industries (% of fund's net assets)
| As of August 31, 2019 |
| | Specialty Retail | 34.8% |
| | Equity Real Estate Investment Trusts (Reits) | 20.8% |
| | Building Products | 14.7% |
| | Household Durables | 13.5% |
| | Construction & Engineering | 6.5% |
| | All Others* | 9.7% |
* Includes short-term investments and net other assets (liabilities).
Construction and Housing Portfolio
Schedule of Investments August 31, 2019 (Unaudited)
Showing Percentage of Net Assets
| Common Stocks - 98.6% | | | |
| | | Shares | Value |
| Building Products - 14.7% | | | |
| Building Products - 14.7% | | | |
| A.O. Smith Corp. | | 109,500 | $5,093,940 |
| Allegion PLC | | 48,700 | 4,688,349 |
| American Woodmark Corp. (a) | | 28,900 | 2,380,493 |
| Armstrong World Industries, Inc. | | 35,100 | 3,350,997 |
| Continental Building Products, Inc. (a) | | 95,300 | 2,395,842 |
| Johnson Controls International PLC | | 201,634 | 8,607,755 |
| Masco Corp. | | 109,400 | 4,455,862 |
| Owens Corning | | 74,043 | 4,247,106 |
| Patrick Industries, Inc. (a) | | 44,800 | 1,619,072 |
| Simpson Manufacturing Co. Ltd. | | 58,516 | 3,756,727 |
| | | | 40,596,143 |
| Commercial Services & Supplies - 0.8% | | | |
| Environmental & Facility Services - 0.8% | | | |
| ABM Industries, Inc. | | 63,305 | 2,358,744 |
| Construction & Engineering - 6.5% | | | |
| Construction & Engineering - 6.5% | | | |
| Arcosa, Inc. | | 45,600 | 1,481,544 |
| Comfort Systems U.S.A., Inc. | | 69,300 | 2,679,138 |
| Fluor Corp. | | 16,300 | 288,021 |
| Jacobs Engineering Group, Inc. | | 66,202 | 5,882,710 |
| Quanta Services, Inc. | | 122,300 | 4,145,970 |
| Williams Scotsman Corp. (a)(b) | | 260,400 | 3,632,580 |
| | | | 18,109,963 |
| Construction Materials - 5.5% | | | |
| Construction Materials - 5.5% | | | |
| Summit Materials, Inc. (a) | | 205,500 | 4,311,390 |
| Vulcan Materials Co. | | 76,631 | 10,824,129 |
| | | | 15,135,519 |
| Equity Real Estate Investment Trusts (REITs) - 20.8% | | | |
| Residential REITs - 19.4% | | | |
| American Campus Communities, Inc. | | 97,500 | 4,531,800 |
| American Homes 4 Rent Class A | | 184,000 | 4,706,720 |
| Apartment Investment & Management Co. Class A | | 167,100 | 8,522,100 |
| Equity Lifestyle Properties, Inc. | | 51,387 | 6,922,857 |
| Equity Residential (SBI) | | 319,200 | 27,055,392 |
| UMH Properties, Inc. | | 153,600 | 1,975,296 |
| | | | 53,714,165 |
| Specialized REITs - 1.4% | | | |
| Weyerhaeuser Co. | | 143,400 | 3,772,854 |
|
| TOTAL EQUITY REAL ESTATE INVESTMENT TRUSTS (REITS) | | | 57,487,019 |
|
| Household Durables - 13.5% | | | |
| Homebuilding - 13.5% | | | |
| Blu Homes, Inc. (a)(c)(d) | | 11,990,913 | 20,739 |
| D.R. Horton, Inc. | | 237,100 | 11,729,337 |
| KB Home | | 56,800 | 1,595,512 |
| M.D.C. Holdings, Inc. | | 89,400 | 3,457,098 |
| NVR, Inc. (a) | | 1,937 | 6,971,263 |
| PulteGroup, Inc. | | 213,800 | 7,226,440 |
| Skyline Champion Corp. (a) | | 113,790 | 3,186,120 |
| TopBuild Corp. (a) | | 33,400 | 3,093,508 |
| | | | 37,280,017 |
| Real Estate Management & Development - 2.0% | | | |
| Real Estate Operating Company - 0.9% | | | |
| The RMR Group, Inc. | | 53,100 | 2,473,929 |
| Real Estate Services - 1.1% | | | |
| Jones Lang LaSalle, Inc. | | 22,500 | 3,016,125 |
|
| TOTAL REAL ESTATE MANAGEMENT & DEVELOPMENT | | | 5,490,054 |
|
| Specialty Retail - 34.8% | | | |
| Home Improvement Retail - 34.8% | | | |
| Lowe's Companies, Inc. | | 367,470 | 41,230,134 |
| The Home Depot, Inc. | | 242,231 | 55,206,868 |
| | | | 96,437,002 |
| TOTAL COMMON STOCKS | | | |
| (Cost $178,903,771) | | | 272,894,461 |
|
| Money Market Funds - 0.8% | | | |
| Fidelity Cash Central Fund 2.13% (e) | | 1,733,670 | 1,734,017 |
| Fidelity Securities Lending Cash Central Fund 2.13% (e)(f) | | 467,353 | 467,400 |
| TOTAL MONEY MARKET FUNDS | | | |
| (Cost $2,201,417) | | | 2,201,417 |
| TOTAL INVESTMENT IN SECURITIES - 99.4% | | | |
| (Cost $181,105,188) | | | 275,095,878 |
| NET OTHER ASSETS (LIABILITIES) - 0.6% | | | 1,692,802 |
| NET ASSETS - 100% | | | $276,788,680 |
Legend
(a) Non-income producing
(b) Security or a portion of the security is on loan at period end.
(c) Restricted securities - Investment in securities not registered under the Securities Act of 1933 (excluding 144A issues). At the end of the period, the value of restricted securities (excluding 144A issues) amounted to $20,739 or 0.0% of net assets.
(d) Level 3 security
(e) Affiliated fund that is generally available only to investment companies and other accounts managed by Fidelity Investments. The rate quoted is the annualized seven-day yield of the fund at period end. A complete unaudited listing of the fund's holdings as of its most recent quarter end is available upon request. In addition, each Fidelity Central Fund's financial statements are available on the SEC's website or upon request.
(f) Investment made with cash collateral received from securities on loan.
Additional information on each restricted holding is as follows:
| Security | Acquisition Date | Acquisition Cost |
| Blu Homes, Inc. | 6/10/13 | $4,000,001 |
Affiliated Central Funds
Information regarding fiscal year to date income earned by the Fund from investments in Fidelity Central Funds is as follows:
| Fund | Income earned |
| Fidelity Cash Central Fund | $21,504 |
| Fidelity Securities Lending Cash Central Fund | 126 |
| Total | $21,630 |
Amounts in the income column in the above table include any capital gain distributions from underlying funds, which are presented in the corresponding line-item in the Statement of Operations, if applicable. Amount for Fidelity Securities Lending Cash Central Fund represents the income earned on investing cash collateral, less rebates paid to borrowers and any lending agent fees associated with the loan, plus any premium payments received for lending certain types of securities.
Investment Valuation
The following is a summary of the inputs used, as of August 31, 2019, involving the Fund's assets and liabilities carried at fair value. The inputs or methodology used for valuing securities may not be an indication of the risk associated with investing in those securities. For more information on valuation inputs, and their aggregation into the levels used below, please refer to the Investment Valuation section in the accompanying Notes to Financial Statements.
| | Valuation Inputs at Reporting Date: |
| Description | Total | Level 1 | Level 2 | Level 3 |
| Investments in Securities: | | | | |
| Common Stocks | $272,894,461 | $272,873,722 | $-- | $20,739 |
| Money Market Funds | 2,201,417 | 2,201,417 | -- | -- |
| Total Investments in Securities: | $275,095,878 | $275,075,139 | $-- | $20,739 |
See accompanying notes which are an integral part of the financial statements.
Construction and Housing Portfolio
Financial Statements
Statement of Assets and Liabilities
| | | August 31, 2019 (Unaudited) |
| Assets | | |
Investment in securities, at value (including securities loaned of $457,560) — See accompanying schedule:
Unaffiliated issuers (cost $178,903,771) | $272,894,461 | |
| Fidelity Central Funds (cost $2,201,417) | 2,201,417 | |
| Total Investment in Securities (cost $181,105,188) | | $275,095,878 |
| Receivable for investments sold | | 5,325,517 |
| Receivable for fund shares sold | | 2,553,698 |
| Dividends receivable | | 52,084 |
| Distributions receivable from Fidelity Central Funds | | 2,919 |
| Prepaid expenses | | 2,841 |
| Other receivables | | 5,776 |
| Total assets | | 283,038,713 |
| Liabilities | | |
| Payable for investments purchased | $5,346,779 | |
| Payable for fund shares redeemed | 244,728 | |
| Accrued management fee | 118,034 | |
| Other affiliated payables | 48,914 | |
| Other payables and accrued expenses | 24,178 | |
| Collateral on securities loaned | 467,400 | |
| Total liabilities | | 6,250,033 |
| Net Assets | | $276,788,680 |
| Net Assets consist of: | | |
| Paid in capital | | $171,648,485 |
| Total distributable earnings (loss) | | 105,140,195 |
| Net Assets, for 4,536,347 shares outstanding | | $276,788,680 |
| Net Asset Value, offering price and redemption price per share ($276,788,680 ÷ 4,536,347 shares) | | $61.02 |
See accompanying notes which are an integral part of the financial statements.
Statement of Operations
| | | Six months ended August 31, 2019 (Unaudited) |
| Investment Income | | |
| Dividends | | $2,167,079 |
| Income from Fidelity Central Funds (including $126 from security lending) | | 21,630 |
| Total income | | 2,188,709 |
| Expenses | | |
| Management fee | $673,896 | |
| Transfer agent fees | 237,262 | |
| Accounting and security lending fees | 48,878 | |
| Custodian fees and expenses | 5,655 | |
| Independent trustees' fees and expenses | 665 | |
| Registration fees | 25,469 | |
| Audit | 18,701 | |
| Legal | 248 | |
| Miscellaneous | 1,011 | |
| Total expenses before reductions | 1,011,785 | |
| Expense reductions | (7,779) | |
| Total expenses after reductions | | 1,004,006 |
| Net investment income (loss) | | 1,184,703 |
| Realized and Unrealized Gain (Loss) | | |
| Net realized gain (loss) on: | | |
| Investment securities: | | |
| Unaffiliated issuers | 11,143,413 | |
| Total net realized gain (loss) | | 11,143,413 |
| Change in net unrealized appreciation (depreciation) on investment securities | | 25,809,660 |
| Net gain (loss) | | 36,953,073 |
| Net increase (decrease) in net assets resulting from operations | | $38,137,776 |
See accompanying notes which are an integral part of the financial statements.
Statement of Changes in Net Assets
| | Six months ended August 31, 2019 (Unaudited) | Year ended February 28, 2019 |
| Increase (Decrease) in Net Assets | | |
| Operations | | |
| Net investment income (loss) | $1,184,703 | $2,254,551 |
| Net realized gain (loss) | 11,143,413 | 29,972,866 |
| Change in net unrealized appreciation (depreciation) | 25,809,660 | (23,163,019) |
| Net increase (decrease) in net assets resulting from operations | 38,137,776 | 9,064,398 |
| Distributions to shareholders | (9,014,469) | (33,784,910) |
| Share transactions | | |
| Proceeds from sales of shares | 54,724,106 | 27,995,296 |
| Reinvestment of distributions | 8,573,552 | 32,148,706 |
| Cost of shares redeemed | (40,887,582) | (141,586,264) |
| Net increase (decrease) in net assets resulting from share transactions | 22,410,076 | (81,442,262) |
| Total increase (decrease) in net assets | 51,533,383 | (106,162,774) |
| Net Assets | | |
| Beginning of period | 225,255,297 | 331,418,071 |
| End of period | $276,788,680 | $225,255,297 |
| Other Information | | |
| Shares | | |
| Sold | 951,093 | 490,715 |
| Issued in reinvestment of distributions | 152,392 | 612,966 |
| Redeemed | (721,248) | (2,484,098) |
| Net increase (decrease) | 382,237 | (1,380,417) |
See accompanying notes which are an integral part of the financial statements.
Financial Highlights
Construction and Housing Portfolio
| | Six months ended (Unaudited) August 31, | Years endedFebruary 28, | | | | |
| | 2019 | 2019 | 2018 | 2017 | 2016 A | 2015 |
| Selected Per–Share Data | | | | | | |
| Net asset value, beginning of period | $54.22 | $59.88 | $61.70 | $53.16 | $59.74 | $57.48 |
| Income from Investment Operations | | | | | | |
| Net investment income (loss)B | .27 | .49 | .44 | .37 | .33 | .29 |
| Net realized and unrealized gain (loss) | 8.68 | 1.32 | 6.58 | 10.29 | (5.02) | 8.53 |
| Total from investment operations | 8.95 | 1.81 | 7.02 | 10.66 | (4.69) | 8.82 |
| Distributions from net investment income | (.06) | (.55) | (.30) | (.45) | (.23) | (.29) |
| Distributions from net realized gain | (2.09) | (6.92) | (8.53) | (1.67) | (1.66) | (6.28) |
| Total distributions | (2.15) | (7.47) | (8.84)C | (2.12) | (1.89) | (6.56)D |
| Redemption fees added to paid in capitalB | – | – | –E | –E | –E | –E |
| Net asset value, end of period | $61.02 | $54.22 | $59.88 | $61.70 | $53.16 | $59.74 |
| Total ReturnF,G | 16.85% | 4.03% | 11.07% | 20.23% | (8.11)% | 16.99% |
| Ratios to Average Net AssetsH,I | | | | | | |
| Expenses before reductions | .80%J | .80% | .80% | .80% | .81% | .82% |
| Expenses net of fee waivers, if any | .80%J | .80% | .80% | .80% | .80% | .82% |
| Expenses net of all reductions | .80%J | .79% | .79% | .79% | .80% | .82% |
| Net investment income (loss) | .94%J | .86% | .69% | .62% | .57% | .52% |
| Supplemental Data | | | | | | |
| Net assets, end of period (000 omitted) | $276,789 | $225,255 | $331,418 | $404,526 | $449,303 | $419,479 |
| Portfolio turnover rateK | 116%J | 90% | 56% | 87% | 80% | 71% |
A For the year ended February 29.
B Calculated based on average shares outstanding during the period.
C Total distributions of $8.84 per share is comprised of distributions from net investment income of $.303 and distributions from net realized gain of $8.534 per share.
D Total distributions of $6.56 per share is comprised of distributions from net investment income of $.287 and distributions from net realized gain of $6.276 per share.
E Amount represents less than $.005 per share.
F Total returns for periods of less than one year are not annualized.
G Total returns would have been lower if certain expenses had not been reduced during the applicable periods shown.
H Fees and expenses of any underlying Fidelity Central Funds are not included in the Fund's expense ratio. The Fund indirectly bears its proportionate share of the expenses of any underlying Fidelity Central Funds.
I Expense ratios reflect operating expenses of the Fund. Expenses before reductions do not reflect amounts reimbursed by the investment adviser or reductions from brokerage service arrangements or reductions from other expense offset arrangements and do not represent the amount paid by the Fund during periods when reimbursements or reductions occur. Expenses net of fee waivers reflect expenses after reimbursement by the investment adviser but prior to reductions from brokerage service arrangements or other expense offset arrangements. Expenses net of all reductions represent the net expenses paid by the Fund.
J Annualized
K Amount does not include the portfolio activity of any underlying Fidelity Central Funds.
See accompanying notes which are an integral part of the financial statements.
Consumer Discretionary Portfolio
Investment Summary (Unaudited)
Top Ten Stocks as of August 31, 2019
| | % of fund's net assets |
| Amazon.com, Inc. | 21.1 |
| The Home Depot, Inc. | 8.7 |
| McDonald's Corp. | 5.2 |
| Lowe's Companies, Inc. | 4.2 |
| The Booking Holdings, Inc. | 3.7 |
| Starbucks Corp. | 3.5 |
| Burlington Stores, Inc. | 3.4 |
| NIKE, Inc. Class B | 3.2 |
| TJX Companies, Inc. | 3.1 |
| Royal Caribbean Cruises Ltd. | 2.8 |
| | 58.9 |
Top Industries (% of fund's net assets)
| As of August 31, 2019 |
| | Specialty Retail | 27.9% |
| | Internet & Direct Marketing Retail | 25.3% |
| | Hotels, Restaurants & Leisure | 22.3% |
| | Textiles, Apparel & Luxury Goods | 8.5% |
| | Multiline Retail | 5.6% |
| | All Others* | 10.4% |
* Includes short-term investments and net other assets (liabilities).
Consumer Discretionary Portfolio
Schedule of Investments August 31, 2019 (Unaudited)
Showing Percentage of Net Assets
| Common Stocks - 99.8% | | | |
| | | Shares | Value |
| Automobiles - 0.3% | | | |
| Automobile Manufacturers - 0.3% | | | |
| Ferrari NV | | 8,497 | $1,340,402 |
| Beverages - 0.3% | | | |
| Distillers & Vintners - 0.2% | | | |
| Constellation Brands, Inc. Class A (sub. vtg.) | | 5,958 | 1,217,517 |
| Soft Drinks - 0.1% | | | |
| Luckin Coffee, Inc. ADR (a) | | 4,395 | 92,735 |
| Monster Beverage Corp. (b) | | 4,213 | 247,177 |
| | | | 339,912 |
|
| TOTAL BEVERAGES | | | 1,557,429 |
|
| Commercial Services & Supplies - 0.2% | | | |
| Diversified Support Services - 0.2% | | | |
| Copart, Inc. (b) | | 14,358 | 1,082,450 |
| Distributors - 0.6% | | | |
| Distributors - 0.6% | | | |
| LKQ Corp. (b) | | 64,756 | 1,701,140 |
| Pool Corp. | | 5,205 | 1,022,158 |
| | | | 2,723,298 |
| Diversified Consumer Services - 1.4% | | | |
| Education Services - 1.4% | | | |
| Grand Canyon Education, Inc. (b) | | 41,423 | 5,202,729 |
| New Oriental Education & Technology Group, Inc. sponsored ADR (b) | | 8,790 | 996,786 |
| | | | 6,199,515 |
| Entertainment - 0.5% | | | |
| Interactive Home Entertainment - 0.1% | | | |
| Electronic Arts, Inc. (b) | | 4,298 | 402,637 |
| Movies & Entertainment - 0.4% | | | |
| Live Nation Entertainment, Inc. (b) | | 7,032 | 488,794 |
| Netflix, Inc. (b) | | 2,128 | 625,100 |
| World Wrestling Entertainment, Inc. Class A | | 12,893 | 920,947 |
| | | | 2,034,841 |
|
| TOTAL ENTERTAINMENT | | | 2,437,478 |
|
| Food & Staples Retailing - 2.0% | | | |
| Food Distributors - 1.2% | | | |
| Performance Food Group Co. (b) | | 54,892 | 2,568,397 |
| U.S. Foods Holding Corp. (b) | | 70,291 | 2,843,271 |
| | | | 5,411,668 |
| Hypermarkets & Super Centers - 0.8% | | | |
| BJ's Wholesale Club Holdings, Inc. (b) | | 103,532 | 2,718,750 |
| Walmart, Inc. | | 9,963 | 1,138,372 |
| | | | 3,857,122 |
|
| TOTAL FOOD & STAPLES RETAILING | | | 9,268,790 |
|
| Hotels, Restaurants & Leisure - 22.3% | | | |
| Casinos & Gaming - 1.8% | | | |
| Boyd Gaming Corp. | | 48,934 | 1,176,373 |
| Churchill Downs, Inc. | | 16,372 | 2,018,013 |
| Eldorado Resorts, Inc. (a)(b) | | 71,007 | 2,734,480 |
| Wynn Resorts Ltd. | | 18,609 | 2,049,781 |
| | | | 7,978,647 |
| Hotels, Resorts & Cruise Lines - 6.5% | | | |
| Hilton Grand Vacations, Inc. (b) | | 58,004 | 1,958,795 |
| Marriott International, Inc. Class A | | 63,830 | 8,046,410 |
| Marriott Vacations Worldwide Corp. | | 35,478 | 3,497,776 |
| Royal Caribbean Cruises Ltd. | | 122,848 | 12,810,589 |
| Wyndham Destinations, Inc. | | 35,748 | 1,585,066 |
| Wyndham Hotels & Resorts, Inc. | | 34,380 | 1,766,444 |
| | | | 29,665,080 |
| Leisure Facilities - 1.7% | | | |
| Drive Shack, Inc. (b) | | 126,600 | 596,286 |
| Planet Fitness, Inc. (b) | | 63,096 | 4,455,209 |
| Vail Resorts, Inc. | | 11,612 | 2,743,683 |
| | | | 7,795,178 |
| Restaurants - 12.3% | | | |
| ARAMARK Holdings Corp. | | 81,068 | 3,312,438 |
| Chipotle Mexican Grill, Inc. (b) | | 5,372 | 4,503,992 |
| McDonald's Corp. | | 107,292 | 23,386,437 |
| Restaurant Brands International, Inc. | | 29,018 | 2,275,627 |
| Starbucks Corp. | | 163,787 | 15,815,273 |
| Yum! Brands, Inc. | | 53,915 | 6,296,194 |
| | | | 55,589,961 |
|
| TOTAL HOTELS, RESTAURANTS & LEISURE | | | 101,028,866 |
|
| Household Durables - 3.5% | | | |
| Home Furnishings - 0.4% | | | |
| Mohawk Industries, Inc. (b) | | 15,437 | 1,835,305 |
| Homebuilding - 3.1% | | | |
| Cavco Industries, Inc. (b) | | 5,372 | 985,601 |
| D.R. Horton, Inc. | | 114,081 | 5,643,587 |
| Lennar Corp. Class A | | 71,593 | 3,651,243 |
| NVR, Inc. (b) | | 1,027 | 3,696,173 |
| | | | 13,976,604 |
|
| TOTAL HOUSEHOLD DURABLES | | | 15,811,909 |
|
| Interactive Media & Services - 0.6% | | | |
| Interactive Media & Services - 0.6% | | | |
| Alphabet, Inc. Class A (b) | | 2,344 | 2,790,602 |
| Internet & Direct Marketing Retail - 25.3% | | | |
| Internet & Direct Marketing Retail - 25.3% | | | |
| Amazon.com, Inc. (b) | | 53,891 | 95,726,043 |
| eBay, Inc. | | 34,087 | 1,373,365 |
| The Booking Holdings, Inc. (b) | | 8,531 | 16,775,444 |
| The RealReal, Inc. (a) | | 22,895 | 299,238 |
| Wayfair LLC Class A (b) | | 3,712 | 418,491 |
| | | | 114,592,581 |
| IT Services - 0.3% | | | |
| Data Processing & Outsourced Services - 0.3% | | | |
| PayPal Holdings, Inc. (b) | | 11,037 | 1,203,585 |
| Leisure Products - 0.5% | | | |
| Leisure Products - 0.5% | | | |
| Mattel, Inc. (a)(b) | | 160,048 | 1,568,470 |
| OneSpaWorld Holdings Ltd. (b) | | 40,143 | 630,245 |
| | | | 2,198,715 |
| Multiline Retail - 5.6% | | | |
| General Merchandise Stores - 5.6% | | | |
| B&M European Value Retail SA | | 122,586 | 533,704 |
| Dollar General Corp. | | 72,842 | 11,369,908 |
| Dollar Tree, Inc. (b) | | 115,131 | 11,689,250 |
| Ollie's Bargain Outlet Holdings, Inc. (b) | | 31,869 | 1,767,136 |
| | | | 25,359,998 |
| Specialty Retail - 27.9% | | | |
| Apparel Retail - 9.4% | | | |
| Burlington Stores, Inc. (b) | | 74,975 | 15,181,688 |
| Ross Stores, Inc. | | 94,527 | 10,020,807 |
| The Children's Place Retail Stores, Inc. | | 38,138 | 3,327,541 |
| TJX Companies, Inc. | | 251,913 | 13,847,658 |
| | | | 42,377,694 |
| Automotive Retail - 2.9% | | | |
| AutoZone, Inc. (b) | | 4,493 | 4,949,893 |
| Monro, Inc. | | 19,465 | 1,512,820 |
| O'Reilly Automotive, Inc. (b) | | 17,384 | 6,671,284 |
| | | | 13,133,997 |
| Computer & Electronics Retail - 0.9% | | | |
| Best Buy Co., Inc. | | 61,743 | 3,929,942 |
| Home Improvement Retail - 13.4% | | | |
| Floor & Decor Holdings, Inc. Class A (b) | | 43,106 | 2,121,677 |
| Lowe's Companies, Inc. | | 171,728 | 19,267,882 |
| The Home Depot, Inc. | | 172,802 | 39,383,304 |
| | | | 60,772,863 |
| Specialty Stores - 1.3% | | | |
| Five Below, Inc. (b) | | 17,679 | 2,172,219 |
| National Vision Holdings, Inc. (b) | | 7,453 | 211,367 |
| Ulta Beauty, Inc. (b) | | 15,158 | 3,603,511 |
| | | | 5,987,097 |
|
| TOTAL SPECIALTY RETAIL | | | 126,201,593 |
|
| Textiles, Apparel & Luxury Goods - 8.5% | | | |
| Apparel, Accessories & Luxury Goods - 5.2% | | | |
| adidas AG | | 2,869 | 850,411 |
| Canada Goose Holdings, Inc. (b) | | 19,534 | 728,454 |
| Capri Holdings Ltd. (b) | | 95,621 | 2,522,482 |
| Carter's, Inc. | | 13,088 | 1,197,290 |
| G-III Apparel Group Ltd. (b) | | 29,497 | 604,983 |
| Hermes International SCA | | 684 | 466,837 |
| Kering SA | | 1,980 | 958,363 |
| lululemon athletica, Inc. (b) | | 2,930 | 541,083 |
| LVMH Moet Hennessy Louis Vuitton SE | | 4,884 | 1,947,672 |
| PVH Corp. | | 82,906 | 6,284,275 |
| Tapestry, Inc. | | 212,182 | 4,381,558 |
| VF Corp. | | 39,166 | 3,209,654 |
| | | | 23,693,062 |
| Footwear - 3.3% | | | |
| NIKE, Inc. Class B | | 167,530 | 14,156,285 |
| Puma AG | | 7,433 | 564,086 |
| | | | 14,720,371 |
|
| TOTAL TEXTILES, APPAREL & LUXURY GOODS | | | 38,413,433 |
|
| TOTAL COMMON STOCKS | | | |
| (Cost $331,571,592) | | | 452,210,644 |
|
| Money Market Funds - 1.0% | | | |
| Fidelity Cash Central Fund 2.13% (c) | | 280,309 | 280,365 |
| Fidelity Securities Lending Cash Central Fund 2.13% (c)(d) | | 4,349,121 | 4,349,556 |
| TOTAL MONEY MARKET FUNDS | | | |
| (Cost $4,629,921) | | | 4,629,921 |
| TOTAL INVESTMENT IN SECURITIES - 100.8% | | | |
| (Cost $336,201,513) | | | 456,840,565 |
| NET OTHER ASSETS (LIABILITIES) - (0.8)% | | | (3,769,773) |
| NET ASSETS - 100% | | | $453,070,792 |
Legend
(a) Security or a portion of the security is on loan at period end.
(b) Non-income producing
(c) Affiliated fund that is generally available only to investment companies and other accounts managed by Fidelity Investments. The rate quoted is the annualized seven-day yield of the fund at period end. A complete unaudited listing of the fund's holdings as of its most recent quarter end is available upon request. In addition, each Fidelity Central Fund's financial statements are available on the SEC's website or upon request.
(d) Investment made with cash collateral received from securities on loan.
Affiliated Central Funds
Information regarding fiscal year to date income earned by the Fund from investments in Fidelity Central Funds is as follows:
| Fund | Income earned |
| Fidelity Cash Central Fund | $16,424 |
| Fidelity Securities Lending Cash Central Fund | 6,898 |
| Total | $23,322 |
Amounts in the income column in the above table include any capital gain distributions from underlying funds, which are presented in the corresponding line-item in the Statement of Operations, if applicable. Amount for Fidelity Securities Lending Cash Central Fund represents the income earned on investing cash collateral, less rebates paid to borrowers and any lending agent fees associated with the loan, plus any premium payments received for lending certain types of securities.
Investment Valuation
The following is a summary of the inputs used, as of August 31, 2019, involving the Fund's assets and liabilities carried at fair value. The inputs or methodology used for valuing securities may not be an indication of the risk associated with investing in those securities. For more information on valuation inputs, and their aggregation into the levels used below, please refer to the Investment Valuation section in the accompanying Notes to Financial Statements.
| | Valuation Inputs at Reporting Date: |
| Description | Total | Level 1 | Level 2 | Level 3 |
| Investments in Securities: | | | | |
| Common Stocks | $452,210,644 | $450,262,972 | $1,947,672 | $-- |
| Money Market Funds | 4,629,921 | 4,629,921 | -- | -- |
| Total Investments in Securities: | $456,840,565 | $454,892,893 | $1,947,672 | $-- |
See accompanying notes which are an integral part of the financial statements.
Consumer Discretionary Portfolio
Financial Statements
Statement of Assets and Liabilities
| | | August 31, 2019 (Unaudited) |
| Assets | | |
Investment in securities, at value (including securities loaned of $4,247,412) — See accompanying schedule:
Unaffiliated issuers (cost $331,571,592) | $452,210,644 | |
| Fidelity Central Funds (cost $4,629,921) | 4,629,921 | |
| Total Investment in Securities (cost $336,201,513) | | $456,840,565 |
| Foreign currency held at value (cost $1) | | 1 |
| Receivable for investments sold | | 2,040,056 |
| Receivable for fund shares sold | | 228,068 |
| Dividends receivable | | 305,496 |
| Distributions receivable from Fidelity Central Funds | | 4,668 |
| Prepaid expenses | | 6,641 |
| Other receivables | | 39,852 |
| Total assets | | 459,465,347 |
| Liabilities | | |
| Payable for investments purchased | $709,276 | |
| Payable for fund shares redeemed | 1,032,581 | |
| Accrued management fee | 202,856 | |
| Other affiliated payables | 79,710 | |
| Other payables and accrued expenses | 24,499 | |
| Collateral on securities loaned | 4,345,633 | |
| Total liabilities | | 6,394,555 |
| Net Assets | | $453,070,792 |
| Net Assets consist of: | | |
| Paid in capital | | $332,096,213 |
| Total distributable earnings (loss) | | 120,974,579 |
| Net Assets, for 9,712,902 shares outstanding | | $453,070,792 |
| Net Asset Value, offering price and redemption price per share ($453,070,792 ÷ 9,712,902 shares) | | $46.65 |
See accompanying notes which are an integral part of the financial statements.
Statement of Operations
| | | Six months ended August 31, 2019 (Unaudited) |
| Investment Income | | |
| Dividends | | $2,301,714 |
| Income from Fidelity Central Funds (including $6,898 from security lending) | | 23,322 |
| Total income | | 2,325,036 |
| Expenses | | |
| Management fee | $1,224,056 | |
| Transfer agent fees | 383,543 | |
| Accounting and security lending fees | 88,886 | |
| Custodian fees and expenses | 6,252 | |
| Independent trustees' fees and expenses | 1,239 | |
| Registration fees | 28,012 | |
| Audit | 22,133 | |
| Legal | 854 | |
| Interest | 1,386 | |
| Miscellaneous | 2,200 | |
| Total expenses before reductions | 1,758,561 | |
| Expense reductions | (13,539) | |
| Total expenses after reductions | | 1,745,022 |
| Net investment income (loss) | | 580,014 |
| Realized and Unrealized Gain (Loss) | | |
| Net realized gain (loss) on: | | |
| Investment securities: | | |
| Unaffiliated issuers | 2,441,818 | |
| Redemptions in-kind with affiliated entities | 4,367,345 | |
| Fidelity Central Funds | (2) | |
| Foreign currency transactions | 4,836 | |
| Total net realized gain (loss) | | 6,813,997 |
| Change in net unrealized appreciation (depreciation) on: | | |
| Investment securities: | | |
| Unaffiliated issuers | 23,399,234 | |
| Assets and liabilities in foreign currencies | (221) | |
| Total change in net unrealized appreciation (depreciation) | | 23,399,013 |
| Net gain (loss) | | 30,213,010 |
| Net increase (decrease) in net assets resulting from operations | | $30,793,024 |
See accompanying notes which are an integral part of the financial statements.
Statement of Changes in Net Assets
| | Six months ended August 31, 2019 (Unaudited) | Year ended February 28, 2019 |
| Increase (Decrease) in Net Assets | | |
| Operations | | |
| Net investment income (loss) | $580,014 | $1,297,625 |
| Net realized gain (loss) | 6,813,997 | 143,683,921 |
| Change in net unrealized appreciation (depreciation) | 23,399,013 | (143,507,509) |
| Net increase (decrease) in net assets resulting from operations | 30,793,024 | 1,474,037 |
| Distributions to shareholders | (9,401,744) | (19,190,653) |
| Share transactions | | |
| Proceeds from sales of shares | 74,246,010 | 214,831,882 |
| Reinvestment of distributions | 8,923,693 | 18,576,766 |
| Cost of shares redeemed | (84,678,239) | (602,441,033) |
| Net increase (decrease) in net assets resulting from share transactions | (1,508,536) | (369,032,385) |
| Total increase (decrease) in net assets | 19,882,744 | (386,749,001) |
| Net Assets | | |
| Beginning of period | 433,188,048 | 819,937,049 |
| End of period | $453,070,792 | $433,188,048 |
| Other Information | | |
| Shares | | |
| Sold | 1,590,899 | 4,770,097 |
| Issued in reinvestment of distributions | 193,028 | 447,659 |
| Redeemed | (1,846,584) | (14,225,363) |
| Net increase (decrease) | (62,657) | (9,007,607) |
See accompanying notes which are an integral part of the financial statements.
Financial Highlights
Consumer Discretionary Portfolio
| | Six months ended (Unaudited) August 31, | Years endedFebruary 28, | | | | |
| | 2019 | 2019 | 2018 | 2017 | 2016 A | 2015 |
| Selected Per–Share Data | | | | | | |
| Net asset value, beginning of period | $44.31 | $43.65 | $37.00 | $32.38 | $35.23 | $33.30 |
| Income from Investment Operations | | | | | | |
| Net investment income (loss)B | .06 | .12 | .16 | .21 | .24 | .15 |
| Net realized and unrealized gain (loss) | 3.25 | 1.87 | 8.17 | 4.73 | (1.79) | 4.39 |
| Total from investment operations | 3.31 | 1.99 | 8.33 | 4.94 | (1.55) | 4.54 |
| Distributions from net investment income | – | (.15) | (.14) | (.32) | (.18) | (.11) |
| Distributions from net realized gain | (.97) | (1.18) | (1.54) | – | (1.13) | (2.51) |
| Total distributions | (.97) | (1.33) | (1.68) | (.32) | (1.30)C | (2.61)D |
| Redemption fees added to paid in capitalB | – | – | – | –E | –E | –E |
| Net asset value, end of period | $46.65 | $44.31 | $43.65 | $37.00 | $32.38 | $35.23 |
| Total ReturnF,G | 7.50% | 4.81% | 22.79% | 15.29% | (4.60)% | 14.79% |
| Ratios to Average Net AssetsH,I | | | | | | |
| Expenses before reductions | .77%J | .78% | .78% | .76% | .77% | .79% |
| Expenses net of fee waivers, if any | .77%J | .77% | .78% | .76% | .77% | .79% |
| Expenses net of all reductions | .76%J | .77% | .77% | .76% | .76% | .79% |
| Net investment income (loss) | .25%J | .27% | .40% | .60% | .71% | .46% |
| Supplemental Data | | | | | | |
| Net assets, end of period (000 omitted) | $453,071 | $433,188 | $819,937 | $828,992 | $1,119,021 | $1,078,988 |
| Portfolio turnover rateK | 46%J,L | 46%L | 74% | 39%L | 69% | 109%L |
A For the year ended February 29.
B Calculated based on average shares outstanding during the period.
C Total distributions of $1.30 per share is comprised of distributions from net investment income of $.175 and distributions from net realized gain of $1.126 per share.
D Total distributions of $2.61 per share is comprised of distributions from net investment income of $.105 and distributions from net realized gain of $2.508 per share.
E Amount represents less than $.005 per share.
F Total returns for periods of less than one year are not annualized.
G Total returns would have been lower if certain expenses had not been reduced during the applicable periods shown.
H Fees and expenses of any underlying Fidelity Central Funds are not included in the Fund's expense ratio. The Fund indirectly bears its proportionate share of the expenses of any underlying Fidelity Central Funds.
I Expense ratios reflect operating expenses of the Fund. Expenses before reductions do not reflect amounts reimbursed by the investment adviser or reductions from brokerage service arrangements or reductions from other expense offset arrangements and do not represent the amount paid by the Fund during periods when reimbursements or reductions occur. Expenses net of fee waivers reflect expenses after reimbursement by the investment adviser but prior to reductions from brokerage service arrangements or other expense offset arrangements. Expenses net of all reductions represent the net expenses paid by the Fund.
J Annualized
K Amount does not include the portfolio activity of any underlying Fidelity Central Funds.
L Portfolio turnover rate excludes securities received or delivered in-kind.
See accompanying notes which are an integral part of the financial statements.
Leisure Portfolio
Investment Summary (Unaudited)
Top Ten Stocks as of August 31, 2019
| | % of fund's net assets |
| McDonald's Corp. | 23.0 |
| Starbucks Corp. | 18.6 |
| Yum! Brands, Inc. | 6.4 |
| Royal Caribbean Cruises Ltd. | 4.2 |
| Hilton Worldwide Holdings, Inc. | 4.0 |
| Marriott International, Inc. Class A | 3.4 |
| Chipotle Mexican Grill, Inc. | 3.3 |
| Wynn Resorts Ltd. | 2.9 |
| Hilton Grand Vacations, Inc. | 2.6 |
| Planet Fitness, Inc. | 2.4 |
| | 70.8 |
Top Industries (% of fund's net assets)
| As of August 31, 2019 |
| | Hotels, Restaurants & Leisure | 85.8% |
| | Diversified Consumer Services | 6.3% |
| | Food & Staples Retailing | 2.3% |
| | Internet & Direct Marketing Retail | 2.3% |
| | Leisure Products | 0.9% |
| | All Others* | 2.4% |

* Includes short-term investments and net other assets (liabilities).
Leisure Portfolio
Schedule of Investments August 31, 2019 (Unaudited)
Showing Percentage of Net Assets
| Common Stocks - 98.2% | | | |
| | | Shares | Value |
| Diversified Consumer Services - 6.3% | | | |
| Education Services - 5.0% | | | |
| Bright Horizons Family Solutions, Inc. (a) | | 66,800 | $11,025,340 |
| Chegg, Inc. (a)(b) | | 102,400 | 4,059,136 |
| Grand Canyon Education, Inc. (a) | | 104,400 | 13,112,640 |
| | | | 28,197,116 |
| Specialized Consumer Services - 1.3% | | | |
| ServiceMaster Global Holdings, Inc. (a) | | 102,834 | 5,865,651 |
| Weight Watchers International, Inc. (a) | | 38,300 | 1,148,617 |
| | | | 7,014,268 |
|
| TOTAL DIVERSIFIED CONSUMER SERVICES | | | 35,211,384 |
|
| Food & Staples Retailing - 2.3% | | | |
| Food Distributors - 2.3% | | | |
| Performance Food Group Co. (a) | | 197,500 | 9,241,025 |
| U.S. Foods Holding Corp. (a) | | 90,200 | 3,648,590 |
| | | | 12,889,615 |
| Hotels, Restaurants & Leisure - 85.8% | | | |
| Casinos & Gaming - 10.1% | | | |
| Boyd Gaming Corp. | | 229,600 | 5,519,584 |
| Caesars Entertainment Corp. (a) | | 596,100 | 6,861,111 |
| Churchill Downs, Inc. | | 92,100 | 11,352,246 |
| Eldorado Resorts, Inc. (a)(b) | | 215,800 | 8,310,458 |
| Las Vegas Sands Corp. | | 139,408 | 7,732,962 |
| Scientific Games Corp. Class A (a)(b) | | 40,500 | 748,440 |
| Wynn Resorts Ltd. | | 147,400 | 16,236,110 |
| | | | 56,760,911 |
| Hotels, Resorts & Cruise Lines - 16.6% | | | |
| Carnival Corp. | | 83,200 | 3,667,456 |
| Hilton Grand Vacations, Inc. (a) | | 429,612 | 14,507,997 |
| Hilton Worldwide Holdings, Inc. | | 243,797 | 22,519,529 |
| Marriott International, Inc. Class A | | 151,193 | 19,059,390 |
| Marriott Vacations Worldwide Corp. | | 92,097 | 9,079,843 |
| Norwegian Cruise Line Holdings Ltd. (a) | | 16,900 | 857,675 |
| Royal Caribbean Cruises Ltd. | | 225,590 | 23,524,525 |
| | | | 93,216,415 |
| Leisure Facilities - 5.0% | | | |
| Planet Fitness, Inc. (a) | | 195,000 | 13,768,950 |
| SeaWorld Entertainment, Inc. (a) | | 49,500 | 1,435,995 |
| Vail Resorts, Inc. | | 54,300 | 12,830,004 |
| | | | 28,034,949 |
| Restaurants - 54.1% | | | |
| Chipotle Mexican Grill, Inc. (a) | | 22,450 | 18,822,529 |
| Denny's Corp. (a) | | 24,100 | 568,519 |
| McDonald's Corp. | | 593,508 | 129,366,939 |
| Restaurant Brands International, Inc. | | 59,200 | 4,642,536 |
| Restaurant Brands International, Inc. | | 76,500 | 6,001,425 |
| Shake Shack, Inc. Class A (a) | | 23,000 | 2,280,680 |
| Starbucks Corp. | | 1,082,400 | 104,516,544 |
| Wendy's Co. | | 98,200 | 2,160,400 |
| Yum! Brands, Inc. | | 306,016 | 35,736,548 |
| | | | 304,096,120 |
|
| TOTAL HOTELS, RESTAURANTS & LEISURE | | | 482,108,395 |
|
| Interactive Media & Services - 0.3% | | | |
| Interactive Media & Services - 0.3% | | | |
| Alphabet, Inc. Class A (a) | | 1,500 | 1,785,795 |
| Internet & Direct Marketing Retail - 2.3% | | | |
| Internet & Direct Marketing Retail - 2.3% | | | |
| Etsy, Inc. (a) | | 36,700 | 1,937,393 |
| The Booking Holdings, Inc. (a) | | 5,600 | 11,011,896 |
| | | | 12,949,289 |
| Leisure Products - 0.9% | | | |
| Leisure Products - 0.9% | | | |
| OneSpaWorld Holdings Ltd. (a)(b) | | 335,300 | 5,264,210 |
| Software - 0.3% | | | |
| Application Software - 0.3% | | | |
| 2U, Inc. (a)(b) | | 20,524 | 366,969 |
| Sciplay Corp. (A Shares) | | 115,000 | 1,093,650 |
| | | | 1,460,619 |
| TOTAL COMMON STOCKS | | | |
| (Cost $356,766,618) | | | 551,669,307 |
|
| Money Market Funds - 3.1% | | | |
| Fidelity Cash Central Fund 2.13% (c) | | 8,985,907 | 8,987,705 |
| Fidelity Securities Lending Cash Central Fund 2.13% (c)(d) | | 8,723,613 | 8,724,485 |
| TOTAL MONEY MARKET FUNDS | | | |
| (Cost $17,712,190) | | | 17,712,190 |
| TOTAL INVESTMENT IN SECURITIES - 101.3% | | | |
| (Cost $374,478,808) | | | 569,381,497 |
| NET OTHER ASSETS (LIABILITIES) - (1.3)% | | | (7,443,837) |
| NET ASSETS - 100% | | | $561,937,660 |
Legend
(a) Non-income producing
(b) Security or a portion of the security is on loan at period end.
(c) Affiliated fund that is generally available only to investment companies and other accounts managed by Fidelity Investments. The rate quoted is the annualized seven-day yield of the fund at period end. A complete unaudited listing of the fund's holdings as of its most recent quarter end is available upon request. In addition, each Fidelity Central Fund's financial statements are available on the SEC's website or upon request.
(d) Investment made with cash collateral received from securities on loan.
Affiliated Central Funds
Information regarding fiscal year to date income earned by the Fund from investments in Fidelity Central Funds is as follows:
| Fund | Income earned |
| Fidelity Cash Central Fund | $36,500 |
| Fidelity Securities Lending Cash Central Fund | 29,501 |
| Total | $66,001 |
Amounts in the income column in the above table include any capital gain distributions from underlying funds, which are presented in the corresponding line-item in the Statement of Operations, if applicable. Amount for Fidelity Securities Lending Cash Central Fund represents the income earned on investing cash collateral, less rebates paid to borrowers and any lending agent fees associated with the loan, plus any premium payments received for lending certain types of securities.
Investment Valuation
All investments are categorized as Level 1 under the Fair Value Hierarchy. The inputs or methodology used for valuing securities may not be an indication of the risk associated with investing in those securities. For more information on valuation inputs please refer to the Investment Valuation section in the accompanying Notes to Financial Statements.
See accompanying notes which are an integral part of the financial statements.
Leisure Portfolio
Financial Statements
Statement of Assets and Liabilities
| | | August 31, 2019 (Unaudited) |
| Assets | | |
Investment in securities, at value (including securities loaned of $8,546,335) — See accompanying schedule:
Unaffiliated issuers (cost $356,766,618) | $551,669,307 | |
| Fidelity Central Funds (cost $17,712,190) | 17,712,190 | |
| Total Investment in Securities (cost $374,478,808) | | $569,381,497 |
| Foreign currency held at value (cost $529) | | 502 |
| Receivable for investments sold | | 524,929 |
| Receivable for fund shares sold | | 1,495,442 |
| Dividends receivable | | 980,498 |
| Distributions receivable from Fidelity Central Funds | | 21,614 |
| Prepaid expenses | | 4,864 |
| Other receivables | | 2,578 |
| Total assets | | 572,411,924 |
| Liabilities | | |
| Payable to custodian bank | $524,930 | |
| Payable for investments purchased | 392,308 | |
| Payable for fund shares redeemed | 483,390 | |
| Accrued management fee | 245,417 | |
| Other affiliated payables | 88,507 | |
| Other payables and accrued expenses | 21,705 | |
| Collateral on securities loaned | 8,718,007 | |
| Total liabilities | | 10,474,264 |
| Net Assets | | $561,937,660 |
| Net Assets consist of: | | |
| Paid in capital | | $337,271,146 |
| Total distributable earnings (loss) | | 224,666,514 |
| Net Assets, for 34,031,921 shares outstanding | | $561,937,660 |
| Net Asset Value, offering price and redemption price per share ($561,937,660 ÷ 34,031,921 shares) | | $16.51 |
See accompanying notes which are an integral part of the financial statements.
Statement of Operations
| | | Six months ended August 31, 2019 (Unaudited) |
| Investment Income | | |
| Dividends | | $3,917,078 |
| Income from Fidelity Central Funds (including $29,501 from security lending) | | 66,001 |
| Total income | | 3,983,079 |
| Expenses | | |
| Management fee | $1,352,350 | |
| Transfer agent fees | 405,777 | |
| Accounting and security lending fees | 97,418 | |
| Custodian fees and expenses | 3,446 | |
| Independent trustees' fees and expenses | 1,330 | |
| Registration fees | 28,241 | |
| Audit | 19,112 | |
| Legal | 834 | |
| Miscellaneous | 1,840 | |
| Total expenses before reductions | 1,910,348 | |
| Expense reductions | (7,027) | |
| Total expenses after reductions | | 1,903,321 |
| Net investment income (loss) | | 2,079,758 |
| Realized and Unrealized Gain (Loss) | | |
| Net realized gain (loss) on: | | |
| Investment securities: | | |
| Unaffiliated issuers | 30,389,201 | |
| Fidelity Central Funds | (730) | |
| Foreign currency transactions | (697) | |
| Total net realized gain (loss) | | 30,387,774 |
| Change in net unrealized appreciation (depreciation) on: | | |
| Investment securities: | | |
| Unaffiliated issuers | 31,062,042 | |
| Assets and liabilities in foreign currencies | (45) | |
| Total change in net unrealized appreciation (depreciation) | | 31,061,997 |
| Net gain (loss) | | 61,449,771 |
| Net increase (decrease) in net assets resulting from operations | | $63,529,529 |
See accompanying notes which are an integral part of the financial statements.
Statement of Changes in Net Assets
| | Six months ended August 31, 2019 (Unaudited) | Year ended February 28, 2019 |
| Increase (Decrease) in Net Assets | | |
| Operations | | |
| Net investment income (loss) | $2,079,758 | $5,025,242 |
| Net realized gain (loss) | 30,387,774 | 52,534,665 |
| Change in net unrealized appreciation (depreciation) | 31,061,997 | (39,363,294) |
| Net increase (decrease) in net assets resulting from operations | 63,529,529 | 18,196,613 |
| Distributions to shareholders | (474,937) | (78,505,520) |
| Share transactions | | |
| Proceeds from sales of shares | 76,273,671 | 71,865,525 |
| Reinvestment of distributions | 442,514 | 73,488,183 |
| Cost of shares redeemed | (50,756,035) | (156,662,466) |
| Net increase (decrease) in net assets resulting from share transactions | 25,960,150 | (11,308,758) |
| Redemption fees | – | 955 |
| Total increase (decrease) in net assets | 89,014,742 | (71,616,710) |
| Net Assets | | |
| Beginning of period | 472,922,918 | 544,539,628 |
| End of period | $561,937,660 | $472,922,918 |
| Other Information | | |
| Shares | | |
| Sold | 4,754,039 | 4,800,836 |
| Issued in reinvestment of distributions | 29,132 | 5,206,751 |
| Redeemed | (3,288,460) | (10,316,567) |
| Net increase (decrease) | 1,494,711 | (308,980) |
See accompanying notes which are an integral part of the financial statements.
Financial Highlights
Leisure Portfolio
| | Six months ended (Unaudited) August 31, | Years endedFebruary 28, | | | | |
| | 2019 | 2019 A | 2018 A | 2017 A | 2016 A,B | 2015 A |
| Selected Per–Share Data | | | | | | |
| Net asset value, beginning of period | $14.53 | $16.58 | $14.14 | $12.83 | $14.01 | $13.51 |
| Income from Investment Operations | | | | | | |
| Net investment income (loss)C | .06 | .16 | .18 | .16 | .15 | .13 |
| Net realized and unrealized gain (loss) | 1.94 | .39 | 3.31 | 1.29 | (.62) | 1.48 |
| Total from investment operations | 2.00 | .55 | 3.49 | 1.45 | (.47) | 1.61 |
| Distributions from net investment income | – | (.16) | (.14) | (.14) | (.13) | (.15) |
| Distributions from net realized gain | (.01) | (2.44) | (.91) | – | (.58) | (.96) |
| Total distributions | (.02)D | (2.60) | (1.05) | (.14) | (.71) | (1.11) |
| Redemption fees added to paid in capitalC | – | – | –E | –E | –E | –E |
| Net asset value, end of period | $16.51 | $14.53 | $16.58 | $14.14 | $12.83 | $14.01 |
| Total ReturnF,G | 13.74% | 4.48% | 24.75% | 11.26% | (3.48)% | 12.91% |
| Ratios to Average Net AssetsH,I | | | | | | |
| Expenses before reductions | .76%J | .76% | .77% | .80% | .79% | .80% |
| Expenses net of fee waivers, if any | .76%J | .76% | .77% | .79% | .79% | .80% |
| Expenses net of all reductions | .75%J | .76% | .77% | .79% | .78% | .80% |
| Net investment income (loss) | .82%J | 1.05% | 1.09% | 1.17% | 1.08% | 1.00% |
| Supplemental Data | | | | | | |
| Net assets, end of period (000 omitted) | $561,938 | $472,923 | $544,540 | $402,941 | $416,771 | $445,296 |
| Portfolio turnover rateK | 52%J | 41% | 56% | 23% | 48% | 32%L |
A Per share amounts have been adjusted to reflect the impact of the 10 for 1 share split that occurred on August 10, 2018.
B For the year ended February 29.
C Calculated based on average shares outstanding during the period.
D Total distributions of $.02 per share is comprised of distributions from net investment income of $.003 and distributions from net realized gain of $.012 per share.
E Amount represents less than $.005 per share.
F Total returns for periods of less than one year are not annualized.
G Total returns would have been lower if certain expenses had not been reduced during the applicable periods shown.
H Fees and expenses of any underlying Fidelity Central Funds are not included in the Fund's expense ratio. The Fund indirectly bears its proportionate share of the expenses of any underlying Fidelity Central Funds.
I Expense ratios reflect operating expenses of the Fund. Expenses before reductions do not reflect amounts reimbursed by the investment adviser or reductions from brokerage service arrangements or reductions from other expense offset arrangements and do not represent the amount paid by the Fund during periods when reimbursements or reductions occur. Expenses net of fee waivers reflect expenses after reimbursement by the investment adviser but prior to reductions from brokerage service arrangements or other expense offset arrangements. Expenses net of all reductions represent the net expenses paid by the Fund.
J Annualized
K Amount does not include the portfolio activity of any underlying Fidelity Central Funds.
L Portfolio turnover rate excludes securities received or delivered in-kind.
See accompanying notes which are an integral part of the financial statements.
Retailing Portfolio
Investment Summary (Unaudited)
Top Ten Stocks as of August 31, 2019
| | % of fund's net assets |
| Amazon.com, Inc. | 22.2 |
| The Home Depot, Inc. | 16.0 |
| Lowe's Companies, Inc. | 5.7 |
| TJX Companies, Inc. | 5.2 |
| The Booking Holdings, Inc. | 4.9 |
| Dollar General Corp. | 4.6 |
| Dollar Tree, Inc. | 3.8 |
| Ross Stores, Inc. | 3.8 |
| Burlington Stores, Inc. | 3.4 |
| O'Reilly Automotive, Inc. | 3.0 |
| | 72.6 |
Top Industries (% of fund's net assets)
| As of August 31, 2019 |
| | Specialty Retail | 47.0% |
| | Internet & Direct Marketing Retail | 31.9% |
| | Multiline Retail | 9.7% |
| | Food & Staples Retailing | 4.6% |
| | Textiles, Apparel & Luxury Goods | 2.8% |
| | All Others* | 4.0% |

* Includes short-term investments and net other assets (liabilities).
Retailing Portfolio
Schedule of Investments August 31, 2019 (Unaudited)
Showing Percentage of Net Assets
| Common Stocks - 99.5% | | | |
| | | Shares | Value |
| Distributors - 1.1% | | | |
| Distributors - 1.1% | | | |
| LKQ Corp. (a) | | 1,241,400 | $32,611,578 |
| Food & Staples Retailing - 4.6% | | | |
| Food Distributors - 0.9% | | | |
| U.S. Foods Holding Corp. (a) | | 659,100 | 26,660,595 |
| Food Retail - 1.0% | | | |
| Kroger Co. | | 1,280,600 | 30,324,608 |
| Hypermarkets & Super Centers - 2.7% | | | |
| BJ's Wholesale Club Holdings, Inc. (a) | | 2,451,154 | 64,367,304 |
| Walmart, Inc. | | 180,500 | 20,623,930 |
| | | | 84,991,234 |
|
| TOTAL FOOD & STAPLES RETAILING | | | 141,976,437 |
|
| Hotels, Restaurants & Leisure - 0.6% | | | |
| Hotels, Resorts & Cruise Lines - 0.3% | | | |
| Hilton Grand Vacations, Inc. (a) | | 235,300 | 7,946,081 |
| Leisure Facilities - 0.3% | | | |
| Drive Shack, Inc. (a) | | 2,255,600 | 10,623,876 |
|
| TOTAL HOTELS, RESTAURANTS & LEISURE | | | 18,569,957 |
|
| Interactive Media & Services - 1.6% | | | |
| Interactive Media & Services - 1.6% | | | |
| Alphabet, Inc. Class A (a) | | 41,500 | 49,406,995 |
| Internet & Direct Marketing Retail - 31.9% | | | |
| Internet & Direct Marketing Retail - 31.9% | | | |
| Amazon.com, Inc. (a) | | 385,530 | 684,813,085 |
| eBay, Inc. | | 2,156,900 | 86,901,501 |
| Expedia, Inc. | | 131,100 | 17,056,110 |
| Liberty Interactive Corp. QVC Group Series A (a) | | 3,876,900 | 41,521,599 |
| The Booking Holdings, Inc. (a) | | 75,980 | 149,407,832 |
| The RealReal, Inc. (b) | | 220,700 | 2,884,549 |
| | | | 982,584,676 |
| Multiline Retail - 9.7% | | | |
| General Merchandise Stores - 9.7% | | | |
| Dollar General Corp. | | 898,700 | 140,278,083 |
| Dollar Tree, Inc. (a) | | 1,165,900 | 118,373,827 |
| Ollie's Bargain Outlet Holdings, Inc. (a) | | 111,400 | 6,177,130 |
| Target Corp. | | 321,000 | 34,359,840 |
| | | | 299,188,880 |
| Specialty Retail - 47.0% | | | |
| Apparel Retail - 13.7% | | | |
| Burlington Stores, Inc. (a) | | 513,494 | 103,977,400 |
| Ross Stores, Inc. | | 1,103,900 | 117,024,439 |
| The Children's Place Retail Stores, Inc. (b) | | 484,100 | 42,237,725 |
| TJX Companies, Inc. | | 2,914,600 | 160,215,562 |
| | | | 423,455,126 |
| Automotive Retail - 5.9% | | | |
| AutoZone, Inc. (a) | | 72,163 | 79,501,255 |
| CarMax, Inc. (a) | | 112,000 | 9,327,360 |
| O'Reilly Automotive, Inc. (a) | | 245,986 | 94,399,587 |
| | | | 183,228,202 |
| Computer & Electronics Retail - 1.8% | | | |
| Best Buy Co., Inc. | | 872,500 | 55,534,625 |
| Home Improvement Retail - 22.8% | | | |
| Floor & Decor Holdings, Inc. Class A (a)(b) | | 667,700 | 32,864,194 |
| Lowe's Companies, Inc. | | 1,556,500 | 174,639,300 |
| The Home Depot, Inc. | | 2,168,200 | 494,154,462 |
| | | | 701,657,956 |
| Specialty Stores - 2.8% | | | |
| Five Below, Inc. (a) | | 235,500 | 28,935,885 |
| National Vision Holdings, Inc. (a) | | 319,800 | 9,069,528 |
| Tiffany & Co., Inc. (b) | | 441,300 | 37,453,131 |
| Ulta Beauty, Inc. (a) | | 40,600 | 9,651,838 |
| | | | 85,110,382 |
|
| TOTAL SPECIALTY RETAIL | | | 1,448,986,291 |
|
| Textiles, Apparel & Luxury Goods - 2.8% | | | |
| Apparel, Accessories & Luxury Goods - 2.8% | | | |
| adidas AG | | 63,000 | 18,674,068 |
| Capri Holdings Ltd. (a) | | 154,900 | 4,086,262 |
| lululemon athletica, Inc. (a) | | 82,457 | 15,227,334 |
| PVH Corp. | | 368,700 | 27,947,460 |
| Tapestry, Inc. | | 1,059,100 | 21,870,415 |
| | | | 87,805,539 |
| Trading Companies & Distributors - 0.2% | | | |
| Trading Companies & Distributors - 0.2% | | | |
| Bunzl PLC | | 234,400 | 5,741,437 |
| TOTAL COMMON STOCKS | | | |
| (Cost $1,718,655,823) | | | 3,066,871,790 |
|
| Money Market Funds - 3.5% | | | |
| Fidelity Cash Central Fund 2.13% (c) | | 17,822,986 | 17,826,550 |
| Fidelity Securities Lending Cash Central Fund 2.13% (c)(d) | | 88,616,521 | 88,625,383 |
| TOTAL MONEY MARKET FUNDS | | | |
| (Cost $106,451,933) | | | 106,451,933 |
| TOTAL INVESTMENT IN SECURITIES - 103.0% | | | |
| (Cost $1,825,107,756) | | | 3,173,323,723 |
| NET OTHER ASSETS (LIABILITIES) - (3.0)% | | | (91,135,655) |
| NET ASSETS - 100% | | | $3,082,188,068 |
Legend
(a) Non-income producing
(b) Security or a portion of the security is on loan at period end.
(c) Affiliated fund that is generally available only to investment companies and other accounts managed by Fidelity Investments. The rate quoted is the annualized seven-day yield of the fund at period end. A complete unaudited listing of the fund's holdings as of its most recent quarter end is available upon request. In addition, each Fidelity Central Fund's financial statements are available on the SEC's website or upon request.
(d) Investment made with cash collateral received from securities on loan.
Affiliated Central Funds
Information regarding fiscal year to date income earned by the Fund from investments in Fidelity Central Funds is as follows:
| Fund | Income earned |
| Fidelity Cash Central Fund | $157,965 |
| Fidelity Securities Lending Cash Central Fund | 37,119 |
| Total | $195,084 |
Amounts in the income column in the above table include any capital gain distributions from underlying funds, which are presented in the corresponding line-item in the Statement of Operations, if applicable. Amount for Fidelity Securities Lending Cash Central Fund represents the income earned on investing cash collateral, less rebates paid to borrowers and any lending agent fees associated with the loan, plus any premium payments received for lending certain types of securities.
Investment Valuation
All investments are categorized as Level 1 under the Fair Value Hierarchy. The inputs or methodology used for valuing securities may not be an indication of the risk associated with investing in those securities. For more information on valuation inputs please refer to the Investment Valuation section in the accompanying Notes to Financial Statements.
See accompanying notes which are an integral part of the financial statements.
Retailing Portfolio
Financial Statements
Statement of Assets and Liabilities
| | | August 31, 2019 (Unaudited) |
| Assets | | |
Investment in securities, at value (including securities loaned of $86,849,322) — See accompanying schedule:
Unaffiliated issuers (cost $1,718,655,823) | $3,066,871,790 | |
| Fidelity Central Funds (cost $106,451,933) | 106,451,933 | |
| Total Investment in Securities (cost $1,825,107,756) | | $3,173,323,723 |
| Receivable for fund shares sold | | 1,573,371 |
| Dividends receivable | | 1,615,063 |
| Distributions receivable from Fidelity Central Funds | | 21,793 |
| Prepaid expenses | | 22,913 |
| Other receivables | | 8,312 |
| Total assets | | 3,176,565,175 |
| Liabilities | | |
| Payable for fund shares redeemed | $3,853,319 | |
| Accrued management fee | 1,344,202 | |
| Other affiliated payables | 527,093 | |
| Other payables and accrued expenses | 26,657 | |
| Collateral on securities loaned | 88,625,836 | |
| Total liabilities | | 94,377,107 |
| Net Assets | | $3,082,188,068 |
| Net Assets consist of: | | |
| Paid in capital | | $1,764,884,217 |
| Total distributable earnings (loss) | | 1,317,303,851 |
| Net Assets, for 191,847,356 shares outstanding | | $3,082,188,068 |
| Net Asset Value, offering price and redemption price per share ($3,082,188,068 ÷ 191,847,356 shares) | | $16.07 |
See accompanying notes which are an integral part of the financial statements.
Statement of Operations
| | | Six months ended August 31, 2019 (Unaudited) |
| Investment Income | | |
| Dividends | | $16,147,501 |
| Income from Fidelity Central Funds (including $37,119 from security lending) | | 195,084 |
| Total income | | 16,342,585 |
| Expenses | | |
| Management fee | $8,349,001 | |
| Transfer agent fees | 2,729,047 | |
| Accounting and security lending fees | 457,427 | |
| Custodian fees and expenses | 6,395 | |
| Independent trustees' fees and expenses | 8,567 | |
| Registration fees | 59,904 | |
| Audit | 19,188 | |
| Legal | 3,816 | |
| Interest | 2,571 | |
| Miscellaneous | 12,329 | |
| Total expenses before reductions | 11,648,245 | |
| Expense reductions | (21,866) | |
| Total expenses after reductions | | 11,626,379 |
| Net investment income (loss) | | 4,716,206 |
| Realized and Unrealized Gain (Loss) | | |
| Net realized gain (loss) on: | | |
| Investment securities: | | |
| Unaffiliated issuers | 1,322,209 | |
| Fidelity Central Funds | (536) | |
| Foreign currency transactions | (96) | |
| Total net realized gain (loss) | | 1,321,577 |
| Change in net unrealized appreciation (depreciation) on: | | |
| Investment securities: | | |
| Unaffiliated issuers | 257,499,385 | |
| Assets and liabilities in foreign currencies | (528) | |
| Total change in net unrealized appreciation (depreciation) | | 257,498,857 |
| Net gain (loss) | | 258,820,434 |
| Net increase (decrease) in net assets resulting from operations | | $263,536,640 |
See accompanying notes which are an integral part of the financial statements.
Statement of Changes in Net Assets
| | Six months ended August 31, 2019 (Unaudited) | Year ended February 28, 2019 |
| Increase (Decrease) in Net Assets | | |
| Operations | | |
| Net investment income (loss) | $4,716,206 | $5,960,029 |
| Net realized gain (loss) | 1,321,577 | 71,852,574 |
| Change in net unrealized appreciation (depreciation) | 257,498,857 | 36,474,379 |
| Net increase (decrease) in net assets resulting from operations | 263,536,640 | 114,286,982 |
| Distributions to shareholders | (61,847,383) | (56,366,884) |
| Share transactions | | |
| Proceeds from sales of shares | 305,035,665 | 1,561,816,984 |
| Reinvestment of distributions | 58,885,020 | 53,788,995 |
| Cost of shares redeemed | (519,012,399) | (967,301,863) |
| Net increase (decrease) in net assets resulting from share transactions | (155,091,714) | 648,304,116 |
| Total increase (decrease) in net assets | 46,597,543 | 706,224,214 |
| Net Assets | | |
| Beginning of period | 3,035,590,525 | 2,329,366,311 |
| End of period | $3,082,188,068 | $3,035,590,525 |
| Other Information | | |
| Shares | | |
| Sold | 19,280,697 | 101,600,543 |
| Issued in reinvestment of distributions | 3,712,801 | 3,880,110 |
| Redeemed | (33,341,732) | (65,594,973) |
| Net increase (decrease) | (10,348,234) | 39,885,680 |
See accompanying notes which are an integral part of the financial statements.
Financial Highlights
Retailing Portfolio
| | Six months ended (Unaudited) August 31, | Years endedFebruary 28, | | | | |
| | 2019 | 2019 A | 2018 A | 2017 A | 2016 A,B | 2015 A |
| Selected Per–Share Data | | | | | | |
| Net asset value, beginning of period | $15.01 | $14.35 | $11.56 | $9.88 | $9.53 | $8.84 |
| Income from Investment Operations | | | | | | |
| Net investment income (loss)C | .02 | .03 | .04 | .01 | .01D | .03E |
| Net realized and unrealized gain (loss) | 1.35 | .93 | 3.23 | 1.69 | .47 | 1.38 |
| Total from investment operations | 1.37 | .96 | 3.27 | 1.70 | .48 | 1.41 |
| Distributions from net investment income | – | (.02) | (.03) | (.02) | (.02) | (.02) |
| Distributions from net realized gain | (.31) | (.27) | (.45) | – | (.11) | (.70) |
| Total distributions | (.31) | (.30)F | (.48) | (.02) | (.13) | (.72) |
| Redemption fees added to paid in capitalC | – | – | – | –G | – | –G |
| Net asset value, end of period | $16.07 | $15.01 | $14.35 | $11.56 | $9.88 | $9.53 |
| Total ReturnH,I | 9.17% | 6.83% | 28.66% | 17.20% | 5.11% | 17.29% |
| Ratios to Average Net AssetsJ,K | | | | | | |
| Expenses before reductions | .75%L | .76% | .78% | .78% | .81% | .81% |
| Expenses net of fee waivers, if any | .75%L | .75% | .77% | .78% | .80% | .81% |
| Expenses net of all reductions | .75%L | .75% | .77% | .78% | .80% | .81% |
| Net investment income (loss) | .30%L | .20% | .29% | .07% | .14%D | .36%E |
| Supplemental Data | | | | | | |
| Net assets, end of period (000 omitted) | $3,082,188 | $3,035,591 | $2,329,366 | $1,924,403 | $1,849,996 | $915,177 |
| Portfolio turnover rateM | 14%L | 34% | 24% | 17% | 11% | 31% |
A Per share amounts have been adjusted to reflect the impact of the 10 for 1 share split that occurred on May 11, 2018.
B For the year ended February 29.
C Calculated based on average shares outstanding during the period.
D Net investment income per share reflects a large, non-recurring dividend which amounted to $.01 per share. Excluding this non-recurring dividend, the ratio of net investment income (loss) to average net assets would have been .02%.
E Net investment income per share reflects a large, non-recurring dividend which amounted to $.01 per share. Excluding this non-recurring dividend, the ratio of net investment income (loss) to average net assets would have been .22%.
F Total distributions of $.30 per share is comprised of distributions from net investment income of $.024 and distributions from net realized gain of $.272 per share.
G Amount represents less than $.005 per share.
H Total returns for periods of less than one year are not annualized.
I Total returns would have been lower if certain expenses had not been reduced during the applicable periods shown.
J Fees and expenses of any underlying Fidelity Central Funds are not included in the Fund's expense ratio. The Fund indirectly bears its proportionate share of the expenses of any underlying Fidelity Central Funds.
K Expense ratios reflect operating expenses of the Fund. Expenses before reductions do not reflect amounts reimbursed by the investment adviser or reductions from brokerage service arrangements or reductions from other expense offset arrangements and do not represent the amount paid by the Fund during periods when reimbursements or reductions occur. Expenses net of fee waivers reflect expenses after reimbursement by the investment adviser but prior to reductions from brokerage service arrangements or other expense offset arrangements. Expenses net of all reductions represent the net expenses paid by the Fund.
L Annualized
M Amount does not include the portfolio activity of any underlying Fidelity Central Funds.
See accompanying notes which are an integral part of the financial statements.
Notes to Financial Statements (Unaudited)
For the period ended August 31, 2019
1. Organization.
Automotive Portfolio, Communication Services Portfolio, Construction and Housing Portfolio, Consumer Discretionary Portfolio, Leisure Portfolio, and Retailing Portfolio (the Funds) are non-diversified funds of Fidelity Select Portfolios (the Trust). The Trust is registered under the Investment Company Act of 1940, as amended (the 1940 Act), as an open-end management investment company organized as a Massachusetts business trust. Each Fund is authorized to issue an unlimited number of shares. Each Fund offers a single class of shares, with the exception of Communication Services Portfolio. Communication Services Portfolio offers Class A, Class M, Class C, Communication Services, Class I and Class Z shares. Communication Services Portfolio commenced sale of Class A, Class M, Class C, Class I and Class Z on November 30, 2018. Each class of Communication Services Portfolio has equal rights as to assets and voting privileges, and each class has exclusive voting rights with respect to matters that affect that class. Effective March 1, 2019, Class C shares will automatically convert to Class A shares after a holding period of ten years from the initial date of purchase, with certain exceptions. The Funds invest primarily in securities of companies whose principal business activities fall within specific industries. Share transactions on the Statement of Changes in Net Assets and Share Transactions note may contain exchanges between affiliated funds.
2. Investments in Fidelity Central Funds.
The Funds invest in Fidelity Central Funds, which are open-end investment companies generally available only to other investment companies and accounts managed by the investment adviser and its affiliates. The Funds' Schedules of Investments list each of the Fidelity Central Funds held as of period end, if any, as an investment of each Fund, but do not include the underlying holdings of each Fidelity Central Fund. As an Investing Fund, each Fund indirectly bears its proportionate share of the expenses of the underlying Fidelity Central Funds.
The Money Market Central Funds seek preservation of capital and current income and are managed by Fidelity Investments Money Management, Inc. (FIMM), an affiliate of the investment adviser. Annualized expenses of the Money Market Central Funds as of their most recent shareholder report date ranged from less than .005% to .01%.
A complete unaudited list of holdings for each Fidelity Central Fund is available upon request or at the Securities and Exchange Commission (the SEC) website at www.sec.gov. In addition, the financial statements of the Fidelity Central Funds are available on the SEC website or upon request.
3. Significant Accounting Policies.
Each Fund is an investment company and applies the accounting and reporting guidance of the Financial Accounting Standards Board (FASB) Accounting Standards Codification Topic 946 Financial Services – Investments Companies. The financial statements have been prepared in conformity with accounting principles generally accepted in the United States of America (GAAP), which require management to make certain estimates and assumptions at the date of the financial statements. Actual results could differ from those estimates. Subsequent events, if any, through the date that the financial statements were issued have been evaluated in the preparation of the financial statements. The following summarizes the significant accounting policies of the Funds:
Investment Valuation. Investments are valued as of 4:00 p.m. Eastern time on the last calendar day of the period. The Board of Trustees (the Board) has delegated the day to day responsibility for the valuation of each Fund's investments to the Fair Value Committee (the Committee) established by each Fund's investment adviser. In accordance with valuation policies and procedures approved by the Board, each Fund attempts to obtain prices from one or more third party pricing vendors or brokers to value its investments. When current market prices, quotations or currency exchange rates are not readily available or reliable, investments will be fair valued in good faith by the Committee, in accordance with procedures adopted by the Board. Factors used in determining fair value vary by investment type and may include market or investment specific events. The frequency with which these procedures are used cannot be predicted and they may be utilized to a significant extent. The Committee oversees each Fund's valuation policies and procedures and reports to the Board on the Committee's activities and fair value determinations. The Board monitors the appropriateness of the procedures used in valuing each Fund's investments and ratifies the fair value determinations of the Committee.
Each Fund categorizes the inputs to valuation techniques used to value its investments into a disclosure hierarchy consisting of three levels as shown below:
- Level 1 – quoted prices in active markets for identical investments
- Level 2 – other significant observable inputs (including quoted prices for similar investments, interest rates, prepayment speeds, etc.)
- Level 3 – unobservable inputs (including the Fund's own assumptions based on the best information available)
Valuation techniques used to value each Fund's investments by major category are as follows:
Equity securities, including restricted securities, for which market quotations are readily available, are valued at the last reported sale price or official closing price as reported by a third party pricing vendor on the primary market or exchange on which they are traded and are categorized as Level 1 in the hierarchy. In the event there were no sales during the day or closing prices are not available, securities are valued at the last quoted bid price or may be valued using the last available price and are generally categorized as Level 2 in the hierarchy. For foreign equity securities, when market or security specific events arise, comparisons to the valuation of American Depositary Receipts (ADRs), futures contracts, Exchange-Traded Funds (ETFs) and certain indexes as well as quoted prices for similar securities may be used and would be categorized as Level 2 in the hierarchy. For equity securities, including restricted securities, where observable inputs are limited, assumptions about market activity and risk are used and these securities may be categorized as Level 3 in the hierarchy.
Investments in open-end mutual funds, including the Fidelity Central Funds, are valued at their closing net asset value (NAV) each business day and are categorized as Level 1 in the hierarchy.
Changes in valuation techniques may result in transfers in or out of an assigned level within the disclosure hierarchy. The aggregate value of investments by input level as of August 31, 2019 is included at the end of each applicable Fund's Schedule of Investments.
Foreign Currency. The Funds may use foreign currency contracts to facilitate transactions in foreign-denominated securities. Gains and losses from these transactions may arise from changes in the value of the foreign currency or if the counterparties do not perform under the contracts' terms.
Foreign-denominated assets, including investment securities, and liabilities are translated into U.S. dollars at the exchange rates at period end. Purchases and sales of investment securities, income and dividends received and expenses denominated in foreign currencies are translated into U.S. dollars at the exchange rate in effect on the transaction date.
The effects of exchange rate fluctuations on investments are included with the net realized and unrealized gain (loss) on investment securities. Other foreign currency transactions resulting in realized and unrealized gain (loss) are disclosed separately.
Investment Transactions and Income. For financial reporting purposes, the Funds' investment holdings and NAV include trades executed through the end of the last business day of the period. The NAV per share for processing shareholder transactions is calculated as of the close of business of the New York Stock Exchange (NYSE), normally 4:00 p.m. Eastern time and includes trades executed through the end of the prior business day. Gains and losses on securities sold are determined on the basis of identified cost and for certain Funds include proceeds received from litigation. Dividend income is recorded on the ex-dividend date, except for certain dividends from foreign securities where the ex-dividend date may have passed, which are recorded as soon as the Funds are informed of the ex-dividend date. Non-cash dividends included in dividend income, if any, are recorded at the fair market value of the securities received. Income and capital gain distributions from Fidelity Central Funds, if any, are recorded on the ex-dividend date. Certain distributions received by the Funds represent a return of capital or capital gain. The Funds determine the components of these distributions subsequent to the ex-dividend date, based upon receipt of tax filings or other correspondence relating to the underlying investment. These distributions are recorded as a reduction of cost of investments and/or as a realized gain. Investment income is recorded net of foreign taxes withheld where recovery of such taxes is uncertain.
Class Allocations and Expenses. Expenses directly attributable to a fund are charged to that fund. Expenses attributable to more than one fund are allocated among the respective funds on the basis of relative net assets or other appropriate methods. Expense estimates are accrued in the period to which they relate and adjustments are made when actual amounts are known.
For Communication Services Portfolio, investment income, realized and unrealized capital gains and losses, common expenses of the Fund, and certain fund-level expense reductions, if any, are allocated daily on a pro-rata basis to each class based on the relative net assets of each class to the total net assets of the Fund. Each class differs with respect to transfer agent and distribution and service plan fees incurred. Certain expense reductions may also differ by class. For the reporting period, the allocated portion of income and expenses to each class as a percent of its average net assets may vary due to the timing of recording these transactions in relation to fluctuating net assets of the classes.
Income Tax Information and Distributions to Shareholders. Each year, each Fund intends to qualify as a regulated investment company under Subchapter M of the Internal Revenue Code, including distributing substantially all of its taxable income and realized gains. As a result, no provision for U.S. Federal income taxes is required. Each Fund files a U.S. federal tax return, in addition to state and local tax returns as required. Each Fund's federal income tax returns are subject to examination by the Internal Revenue Service (IRS) for a period of three fiscal years after they are filed. State and local tax returns may be subject to examination for an additional fiscal year depending on the jurisdiction. Foreign taxes are provided for based on each Fund's understanding of the tax rules and rates that exist in the foreign markets in which it invests.
Distributions are declared and recorded on the ex-dividend date. Income and capital gain distributions are declared separately for each class. Income and capital gain distributions are determined in accordance with income tax regulations, which may differ from GAAP.
Capital accounts within the financial statements are adjusted for permanent book-tax differences. These adjustments have no impact on net assets or the results of operations. Capital accounts are not adjusted for temporary book-tax differences which will reverse in a subsequent period.
Book-tax differences are primarily due to foreign currency transactions, passive foreign investment companies (PFIC), redemptions in kind, partnerships and losses deferred due to wash sales and excise tax regulations.
As of period end, the cost and unrealized appreciation (depreciation) in securities, and derivatives if applicable, for federal income tax purposes were as follows for each Fund:
| | Tax cost | Gross unrealized appreciation | Gross unrealized depreciation | Net unrealized appreciation (depreciation) |
| Automotive Portfolio | $27,870,699 | $9,991,640 | $(1,664,590) | $8,327,050 |
| Communication Services Portfolio | 501,541,963 | 141,554,973 | (12,055,199) | 129,499,774 |
| Construction and Housing Portfolio | 181,710,616 | 99,724,154 | (6,338,892) | 93,385,262 |
| Consumer Discretionary Portfolio | 337,979,072 | 138,888,416 | (20,026,923) | 118,861,493 |
| Leisure Portfolio | 376,590,179 | 206,785,287 | (13,993,969) | 192,791,318 |
| Retailing Portfolio | 1,828,779,574 | 1,463,119,288 | (118,575,139) | 1,344,544,149 |
Certain of the Funds elected to defer to the next fiscal year capital losses recognized during the period November 1, 2018 to February 28,2019, and ordinary losses recognized during the period January 1, 2019 to February 28, 2019. Loss deferrals were as follows:
| | Capital losses | Ordinary losses |
| Communication Services Portfolio | $– | $(189,476) |
| Consumer Discretionary Portfolio | (2,137,903) | (92,910) |
| Retailing Portfolio | (31,872,385) | – |
Restricted Securities. The Funds may invest in securities that are subject to legal or contractual restrictions on resale. These securities generally may be resold in transactions exempt from registration or to the public if the securities are registered. Disposal of these securities may involve time-consuming negotiations and expense, and prompt sale at an acceptable price may be difficult. Information regarding restricted securities is included at the end of each applicable Fund's Schedule of Investments.
4. Purchases and Sales of Investments.
Purchases and sales of securities, other than short-term securities and in-kind transactions are noted in the table below.
| | Purchases ($) | Sales ($) |
| Automotive Portfolio | 5,392,954 | 12,204,284 |
| Communication Services Portfolio | 183,294,415 | 174,791,604 |
| Construction and Housing Portfolio | 155,766,799 | 143,635,711 |
| Consumer Discretionary Portfolio | 107,871,265 | 103,839,694 |
| Leisure Portfolio | 152,996,871 | 129,024,308 |
| Retailing Portfolio | 223,095,267 | 430,836,057 |
5. Fees and Other Transactions with Affiliates.
Management Fee. Fidelity SelectCo, LLC (the investment adviser) and its affiliates provide the Funds with investment management related services for which the Funds pay a monthly management fee. The management fee is the sum of an individual fund fee rate and an annualized group fee rate. The individual fund fee rate is applied to each Fund's average net assets. The group fee rate is based upon the average net assets of all the mutual funds advised by Fidelity Management & Research Company (FMR) and the investment adviser. The group fee rate decreases as assets under management increase and increases as assets under management decrease. For the reporting period, each Fund's annualized management fee rate expressed as a percentage of each Fund's average net assets was as follows:
| | Individual Rate | Group Rate | Total |
| Automotive Portfolio | .30% | .24% | .54% |
| Communication Services Portfolio | .30% | .24% | .54% |
| Construction and Housing Portfolio | .30% | .24% | .54% |
| Consumer Discretionary Portfolio | .30% | .24% | .54% |
| Leisure Portfolio | .30% | .24% | .54% |
| Retailing Portfolio | .30% | .24% | .54% |
Distribution and Service Plan Fees. In accordance with Rule 12b-1 of the 1940 Act, Communication Services Portfolio has adopted separate Distribution and Service Plans for each class of shares. Certain classes pay Fidelity Distributors Corporation (FDC), an affiliate of the investment adviser, separate Distribution and Service Fees, each of which is based on an annual percentage of each class' average net assets. In addition, FDC may pay financial intermediaries for selling shares of each Fund and providing shareholder support services. For the period, the Distribution and Service Fee rates, total fees and amounts retained by FDC were as follows:
| | Distribution Fee | Service Fee | Total Fees | Retained by FDC |
| Communication Services Portfolio | | | | |
| Class A | -% | .25% | $3,648 | $409 |
| Class M | .25% | .25% | 1,893 | 248 |
| Class C | .75% | .25% | 2,574 | 1,245 |
| | | | $8,115 | $1,902 |
Sales Load. For Communication Services Portfolio, FDC may receive a front-end sales charge of up to 5.75% for selling Class A shares and 3.50% for selling Class M shares, some of which is paid to financial intermediaries for selling shares of the Fund. Depending on the holding period, FDC may receive contingent deferred sales charges levied on Class A, Class M and Class C redemptions. The deferred sales charges are 1.00% for Class C shares, 1.00% for certain purchases of Class A shares and .25% for certain purchases of Class M shares.
For the period, sales charge amounts retained by FDC were as follows:
| | Retained by FDC |
| Communication Services Portfolio | |
| Class A | $7,283 |
| Class M | 499 |
| Class C(a) | 60 |
| | $7,842 |
(a) When Class C shares are initially sold, FDC pays commissions from its own resources to financial intermediaries through which the sales are made.
Transfer Agent Fees. Fidelity Investments Institutional Operations Company, Inc., (FIIOC), an affiliate of the investment adviser, is the transfer, dividend disbursing and shareholder servicing agent for each class (Communication Services Portfolio) or Fund (all other Funds). FIIOC receives account fees and asset-based fees that vary according to the account size and type of account of the shareholders of the respective class or Fund, except for Class Z. FIIOC receives an asset-based fee of Class Z's average net assets. FIIOC pays for typesetting, printing and mailing of shareholder reports, except proxy statements. For the period, transfer agent fees were as follows:
| | Amount | % of Average Net Assets(a) |
| Automotive Portfolio | $42,879 | .24 |
| Communication Services Portfolio | | |
| Class A | 2,945 | .20 |
| Class M | 961 | .25 |
| Class C | 747 | .29 |
| Communication Services | 558,188 | .18 |
| Class I | 1,174 | .17 |
| Class Z | 229 | .05 |
| | 564,244 | |
| Construction and Housing Portfolio | 237,262 | .19 |
| Consumer Discretionary Portfolio | 383,543 | .17 |
| Leisure Portfolio | 405,777 | .16 |
| Retailing Portfolio | 2,729,047 | .18 |
(a) Annualized.
Accounting and Security Lending Fees. Fidelity Service Company, Inc. (FSC), an affiliate of the investment adviser, maintains each Fund's accounting records. The accounting fee is based on the level of average net assets for each month. Prior to April 1, 2019, FSC had a separate agreement with each Fund for administration of the security lending program, based on the number and duration of lending transactions. For the period, the total fees paid for accounting and administration of securities lending were equivalent to the following annualized rates:
| | % of Average Net Assets |
| Automotive Portfolio | .04 |
| Communication Services Portfolio | .04 |
| Construction and Housing Portfolio | .04 |
| Consumer Discretionary Portfolio | .04 |
| Leisure Portfolio | .04 |
| Retailing Portfolio | .03 |
Brokerage Commissions. Certain Funds placed a portion of their portfolio transactions with brokerage firms which are affiliates of the investment adviser. Brokerage commissions are included in net realized gain (loss) and change in net unrealized appreciation (depreciation) in the Statement of Operations. The commissions paid to these affiliated firms were as follows:
| | Amount |
| Automotive Portfolio | $257 |
| Communication Services Portfolio | 4,511 |
| Construction and Housing Portfolio | 2,207 |
| Consumer Discretionary Portfolio | 1,476 |
| Leisure Portfolio | 2,150 |
| Retailing Portfolio | 2,762 |
Interfund Lending Program. Pursuant to an Exemptive Order issued by the SEC, the Funds, along with other registered investment companies having management contracts with Fidelity Management & Research Company (FMR) or other affiliated entities of FMR, may participate in an interfund lending program. This program provides an alternative credit facility allowing the funds to borrow from, or lend money to, other participating affiliated funds. At period end, there were no interfund loans outstanding. Each applicable fund's activity in this program during the period for which loans were outstanding was as follows:
| | Borrower or Lender | Average Loan Balance | Weighted Average Interest Rate | Interest Expense |
| Communication Services Portfolio | Borrower | $4,557,375 | 2.69% | $2,721 |
| Consumer Discretionary Portfolio | Borrower | $3,756,800 | 2.66% | $1,386 |
| Retailing Portfolio | Borrower | $7,600,800 | 2.43% | $2,571 |
Interfund Trades. The Funds may purchase from or sell securities to other Fidelity Funds under procedures adopted by the Board. The procedures have been designed to ensure these interfund trades are executed in accordance with Rule 17a-7 of the 1940 Act. Interfund trades are included within the respective purchases and sales amounts shown in the Purchases and Sales of Investments note.
Affiliated Redemptions In-Kind. During the period, 233,442 shares of Consumer Discretionary Portfolio were redeemed in-kind for investments and cash with a value of $10,509,560. The net realized gain of $4,367,345 on investments delivered through in-kind redemptions is included in the accompanying Statement of Operations. The amount of the in-kind redemptions is included in share transactions in the accompanying Statement of Changes in Net Assets. Consumer Discretionary Portfolio recognized no gain or loss for federal income tax purposes.
Prior Fiscal Year Affiliated Redemptions In-Kind. During the prior period, 10,019,311 shares of Consumer Discretionary Portfolio were redeemed in-kind for investments and cash with a value of $420,009,534. Consumer Discretionary Portfolio had a net realized gain of $132,629,032 on investments delivered through in-kind redemptions. The amount of the in-kind redemptions is included in share transactions in the accompanying Statement of Changes in Net Assets. Consumer Discretionary Portfolio recognized no gain or loss for federal income tax purposes.
6. Committed Line of Credit.
Certain Funds participate with other funds managed by the investment adviser or an affiliate in a $4.25 billion credit facility (the "line of credit") to be utilized for temporary or emergency purposes to fund shareholder redemptions or for other short-term liquidity purposes. The participating funds have agreed to pay commitment fees on their pro-rata portion of the line of credit, which are reflected in Miscellaneous expenses on the Statement of Operations, and are as follows:
| Automotive Portfolio | $51 |
| Communication Services Portfolio | 792 |
| Construction and Housing Portfolio | 316 |
| Consumer Discretionary Portfolio | 600 |
| Leisure Portfolio | 636 |
| Retailing Portfolio | 4,180 |
During the period, the Funds did not borrow on this line of credit.
7. Security Lending.
Certain Funds lend portfolio securities from time to time in order to earn additional income. For equity securities, lending agents are used, including National Financial Services (NFS), an affiliate of the Funds. Pursuant to a securities lending agreement, NFS will receive a fee, which is capped at 9.9% of daily lending revenue, for its services as lending agent. The Funds may lend securities to certain qualified borrowers. On the settlement date of the loan, each applicable Fund receives collateral (in the form of U.S. Treasury obligations, letters of credit and/or cash) against the loaned securities and maintains collateral in an amount not less than 100% of the market value of the loaned securities during the period of the loan. The market value of the loaned securities is determined at the close of business of the Funds and any additional required collateral is delivered to the Funds on the next business day. The Funds or borrower may terminate the loan at any time, and if the borrower defaults on its obligation to return the securities loaned because of insolvency or other reasons, the Funds may apply collateral received from the borrower against the obligation. The Funds may experience delays and costs in recovering the securities loaned. Any cash collateral received is invested in the Fidelity Securities Lending Cash Central Fund. The value of loaned securities and cash collateral at period end are disclosed on each applicable Fund's Statement of Assets and Liabilities. Security lending income represents the income earned on investing cash collateral, less rebates paid to borrowers and any lending agent fees associated with the loan, plus any premium payments received for lending certain types of securities. Security lending income is presented on each applicable Fund's Statement of Operations as a component of income from Fidelity Central Funds. Security lending fees paid to NFS were as follows:
| Automotive Portfolio | $713 |
| Communication Services Portfolio | 977 |
| Construction and Housing Portfolio | 11 |
| Consumer Discretionary Portfolio | 606 |
| Leisure Portfolio | 2,443 |
| Retailing Portfolio | 2,046 |
8. Expense Reductions.
Commissions paid to certain brokers with whom the investment adviser, or its affiliates, places trades on behalf of certain Funds include an amount in addition to trade execution, which may be rebated back to the Funds to offset certain expenses. In addition, through arrangements with each applicable Fund's custodian and transfer agent, credits realized as a result of certain uninvested cash balances were used to reduce each applicable Fund's expenses. All of the applicable expense reductions are noted in the table below.
| | Brokerage Service reduction | Custodian credits | Transfer Agent credits |
| Automotive Portfolio | $1,041 | $– | $– |
| Communication Services Portfolio | 15,549 | – | 84 |
| Construction and Housing Portfolio | 6,943 | – | – |
| Consumer Discretionary Portfolio | 11,915 | – | – |
| Leisure Portfolio | 4,888 | – | 404 |
| Retailing Portfolio | 9,863 | 484 | – |
In addition, during the period the investment adviser reimbursed and/or waived a portion of fund level and class level operating expenses as follows:
| | Amount |
| Automotive Portfolio | $144 |
| Communication Services Portfolio | 2,006 |
| Construction and Housing Portfolio | 836 |
| Consumer Discretionary Portfolio | 1,624 |
| Leisure Portfolio | 1,735 |
| Retailing Portfolio | 11,519 |
9. Distributions to Shareholders.
Distributions to shareholders of each class were as follows:
| | Six months ended
August 31, 2019 | Year ended
February 28, 2019(a) |
| Communication Services Portfolio | | |
| Distributions to shareholders | | |
| Class A | $302,911 | $7,552 |
| Class M | 146,807 | 7,531 |
| Class C | 126,890 | 7,488 |
| Communication Services | 142,138,463 | 67,398,247 |
| Class I | 181,895 | 7,576 |
| Class Z | 183,109 | 7,586 |
| Total | $143,080,075 | $67,435,980 |
(a) Distributions for Class A, Class M, Class C, Class I and Class Z are for the period November 30, 2018 (commencement of sale of shares) to February 28, 2019.
10. Share Transactions.
Share transactions for each class were as follows and may contain automatic conversions between classes or exchanges between affiliated funds:
| | Shares | Shares | Dollars | Dollars |
| | Six months ended August 31, 2019 | Year ended February 28, 2019(a) | Six months ended August 31, 2019 | Year ended February 28, 2019(a) |
| Communication Services Portfolio | | | | |
| Class A | | | | |
| Shares sold | 72,760 | 9,932 | $4,651,098 | $728,750 |
| Reinvestment of distributions | 4,821 | 108 | 299,154 | 7,552 |
| Shares redeemed | (5,801) | (486) | (368,278) | (36,085) |
| Net increase (decrease) | 71,780 | 9,554 | $4,581,974 | $700,217 |
| Class M | | | | |
| Shares sold | 11,049 | 6,375 | $705,931 | $476,789 |
| Reinvestment of distributions | 2,368 | 108 | 146,807 | 7,531 |
| Shares redeemed | (1,875) | – | (116,365) | – |
| Net increase (decrease) | 11,542 | 6,483 | $736,373 | $484,320 |
| Class C | | | | |
| Shares sold | 7,071 | 4,996 | $460,061 | $372,785 |
| Reinvestment of distributions | 2,051 | 107 | 126,890 | 7,488 |
| Shares redeemed | (4,631) | (60) | (280,641) | (4,466) |
| Net increase (decrease) | 4,491 | 5,043 | $306,310 | $375,807 |
| Communication Services | | | | |
| Shares sold | 1,691,263 | 2,437,944 | $107,872,812 | $187,426,841 |
| Reinvestment of distributions | 2,166,420 | 917,753 | 134,578,053 | 64,635,754 |
| Shares redeemed | (1,805,278) | (2,236,410) | (114,244,666) | (166,522,114) |
| Net increase (decrease) | 2,052,405 | 1,119,287 | $128,206,199 | $85,540,481 |
| Class I | | | | |
| Shares sold | 34,673 | 7,326 | $2,211,847 | $539,797 |
| Reinvestment of distributions | 2,928 | 109 | 181,895 | 7,576 |
| Shares redeemed | (17,753) | (1,396) | (1,087,957) | (102,385) |
| Net increase (decrease) | 19,848 | 6,039 | $1,305,785 | $444,988 |
| Class Z | | | | |
| Shares sold | 15,001 | 6,958 | $978,223 | $516,550 |
| Reinvestment of distributions | 2,937 | 109 | 182,512 | 7,586 |
| Shares redeemed | (258) | – | (16,051) | – |
| Net increase (decrease) | 17,680 | 7,067 | $1,144,684 | $524,136 |
(a) Share transactions for Class A, Class M, Class C, Class I and Class Z are for the period November 30, 2018 (commencement of sale of shares) to February 28, 2019..
11. Other.
The Funds' organizational documents provide former and current trustees and officers with a limited indemnification against liabilities arising in connection with the performance of their duties to the Funds. In the normal course of business, the Funds may also enter into contracts that provide general indemnifications. The Funds' maximum exposure under these arrangements is unknown as this would be dependent on future claims that may be made against the Funds. The risk of material loss from such claims is considered remote.
Shareholder Expense Example
As a shareholder of a Fund, you incur two types of costs: (1) transaction costs, including sales charges (loads) on purchase payments or redemption proceeds, and (2) ongoing costs, including management fees, distribution and/or service (12b-1) fees and other Fund expenses. This Example is intended to help you understand your ongoing costs (in dollars) of investing in the Funds and to compare these costs with the ongoing costs of investing in other mutual funds.
The Example is based on an investment of $1,000 invested at the beginning of the period and held for the entire period (March 1, 2019 to August 31, 2019).
Actual Expenses
The first line of the accompanying table for each Class of each fund provides information about actual account values and actual expenses. You may use the information in this line, together with the amount you invested, to estimate the expenses that you paid over the period. Simply divide your account value by $1,000.00 (for example, an $8,600 account value divided by $1,000.00 = 8.6), then multiply the result by the number in the first line for a Class of the fund under the heading entitled "Expenses Paid During Period" to estimate the expenses you paid on your account during this period. In addition, each Fund, as a shareholder in the underlying Fidelity Central Funds, will indirectly bear its pro-rata share of the fees and expenses incurred by the underlying Fidelity Central Funds. These fees and expenses are not included in the Fund's annualized expense ratio used to calculate the expense estimate in the table below.
Hypothetical Example for Comparison Purposes
The second line of the accompanying table for each Class of each fund provides information about hypothetical account values and hypothetical expenses based on a Class' actual expense ratio and an assumed rate of return of 5% per year before expenses, which is not the Class' actual return. The hypothetical account values and expenses may not be used to estimate the actual ending account balance or expenses you paid for the period. You may use this information to compare the ongoing costs of investing in the Fund and other funds. To do so, compare this 5% hypothetical example with the 5% hypothetical examples that appear in the shareholder reports of the other funds. In addition, each Fund, as a shareholder in the underlying Fidelity Central Funds, will indirectly bear its pro-rata share of the fees and expenses incurred by the underlying Fidelity Central Funds. These fees and expenses are not included in the Fund's annualized expense ratio used to calculate the expense estimate in the table below.
Please note that the expenses shown in the table are meant to highlight your ongoing costs only and do not reflect any transaction costs. Therefore, the second line of the table is useful in comparing ongoing costs only, and will not help you determine the relative total costs of owning different funds. In addition, if these transactional costs were included, your costs would have been higher.
| | Annualized Expense Ratio-A | Beginning
Account Value
March 1, 2019 | Ending
Account Value
August 31, 2019 | Expenses Paid
During Period-B
March 1, 2019
to August 31, 2019 |
| Automotive Portfolio | 1.01% | | | |
| Actual | | $1,000.00 | $989.30 | $5.05 |
| Hypothetical-C | | $1,000.00 | $1,020.06 | $5.13 |
| Communication Services Portfolio | | | | |
| Class A | 1.05% | | | |
| Actual | | $1,000.00 | $1,097.10 | $5.53 |
| Hypothetical-C | | $1,000.00 | $1,019.86 | $5.33 |
| Class M | 1.35% | | | |
| Actual | | $1,000.00 | $1,095.50 | $7.11 |
| Hypothetical-C | | $1,000.00 | $1,018.35 | $6.85 |
| Class C | 1.89% | | | |
| Actual | | $1,000.00 | $1,092.50 | $9.94 |
| Hypothetical-C | | $1,000.00 | $1,015.63 | $9.58 |
| Communication Services | .78% | | | |
| Actual | | $1,000.00 | $1,098.60 | $4.11 |
| Hypothetical-C | | $1,000.00 | $1,021.22 | $3.96 |
| Class I | .77% | | | |
| Actual | | $1,000.00 | $1,098.80 | $4.06 |
| Hypothetical-C | | $1,000.00 | $1,021.27 | $3.91 |
| Class Z | .65% | | | |
| Actual | | $1,000.00 | $1,099.40 | $3.43 |
| Hypothetical-C | | $1,000.00 | $1,021.87 | $3.30 |
| Construction and Housing Portfolio | .80% | | | |
| Actual | | $1,000.00 | $1,168.50 | $4.36 |
| Hypothetical-C | | $1,000.00 | $1,021.11 | $4.06 |
| Consumer Discretionary Portfolio | .77% | | | |
| Actual | | $1,000.00 | $1,075.00 | $4.02 |
| Hypothetical-C | | $1,000.00 | $1,021.27 | $3.91 |
| Leisure Portfolio | .76% | | | |
| Actual | | $1,000.00 | $1,137.40 | $4.08 |
| Hypothetical-C | | $1,000.00 | $1,021.32 | $3.86 |
| Retailing Portfolio | .75% | | | |
| Actual | | $1,000.00 | $1,091.70 | $3.94 |
| Hypothetical-C | | $1,000.00 | $1,021.37 | $3.81 |
A Annualized expense ratio reflects expenses net of applicable fee waivers.
B Expenses are equal to each Class' annualized expense ratio, multiplied by the average account value over the period, multiplied by 184/ 366 (to reflect the one-half year period).
C 5% return per year before expenses

SELCON-SANN-1019
1.813637.114
Fidelity® Select Portfolios®
Energy Sector Energy Portfolio
Energy Service Portfolio
Natural Gas Portfolio
Natural Resources Portfolio
Semi-Annual Report August 31, 2019 |
|
Beginning on January 1, 2021, as permitted by regulations adopted by the Securities and Exchange Commission, paper copies of a fund’s shareholder reports will no longer be sent by mail, unless you specifically request paper copies of the reports from the fund or from your financial intermediary, such as a financial advisor, broker-dealer or bank. Instead, the reports will be made available on a website, and you will be notified by mail each time a report is posted and provided with a website link to access the report.
If you already elected to receive shareholder reports electronically, you will not be affected by this change and you need not take any action. You may elect to receive shareholder reports and other communications from a fund electronically, by contacting your financial intermediary. For Fidelity customers, visit Fidelity's web site or call Fidelity using the contact information listed below.
You may elect to receive all future reports in paper free of charge. If you wish to continue receiving paper copies of your shareholder reports, you may contact your financial intermediary or, if you are a Fidelity customer, visit Fidelity’s website, or call Fidelity at the applicable toll-free number listed below. Your election to receive reports in paper will apply to all funds held with the fund complex/your financial intermediary.
| Account Type | Website | Phone Number |
| Brokerage, Mutual Fund, or Annuity Contracts: | fidelity.com/mailpreferences | 1-800-343-3548 |
| Employer Provided Retirement Accounts: | netbenefits.fidelity.com/preferences (choose 'no' under Required Disclosures to continue to print) | 1-800-343-0860 |
| Advisor Sold Accounts Serviced Through Your Financial Intermediary: | Contact Your Financial Intermediary | Your Financial Intermediary's phone number |
| Advisor Sold Accounts Serviced by Fidelity: | institutional.fidelity.com | 1-877-208-0098 |
Contents
To view a fund's proxy voting guidelines and proxy voting record for the 12-month period ended June 30, visit http://www.fidelity.com/proxyvotingresults or visit the Securities and Exchange Commission's (SEC) web site at http://www.sec.gov.
You may also call 1-800-544-8544 to request a free copy of the proxy voting guidelines.
Standard & Poor's, S&P and S&P 500 are registered service marks of The McGraw-Hill Companies, Inc. and have been licensed for use by Fidelity Distributors Corporation.
Other third-party marks appearing herein are the property of their respective owners.
All other marks appearing herein are registered or unregistered trademarks or service marks of FMR LLC or an affiliated company. © 2019 FMR LLC. All rights reserved.
This report and the financial statements contained herein are submitted for the general information of the shareholders of the Funds. This report is not authorized for distribution to prospective investors in the Funds unless preceded or accompanied by an effective prospectus.
A fund files its complete schedule of portfolio holdings with the SEC for the first and third quarters of each fiscal year on Form N-PORT. Forms N-PORT are available on the SEC’s web site at http://www.sec.gov. A fund's Forms N-PORT may be reviewed and copied at the SEC’s Public Reference Room in Washington, DC. Information regarding the operation of the SEC's Public Reference Room may be obtained by calling 1-800-SEC-0330.
For a complete list of a fund's portfolio holdings, view the most recent holdings listing, semiannual report, or annual report on Fidelity's web site at http://www.fidelity.com, http://www.institutional.fidelity.com, or http://www.401k.com, as applicable.
NOT FDIC INSURED •MAY LOSE VALUE •NO BANK GUARANTEE
Neither the Funds nor Fidelity Distributors Corporation is a bank.
Energy Portfolio
Investment Summary (Unaudited)
Top Ten Stocks as of August 31, 2019
| | % of fund's net assets |
| Chevron Corp. | 18.3 |
| EOG Resources, Inc. | 6.7 |
| Valero Energy Corp. | 6.4 |
| Exxon Mobil Corp. | 5.4 |
| Pioneer Natural Resources Co. | 5.2 |
| Phillips 66 Co. | 4.8 |
| ConocoPhillips Co. | 4.5 |
| Diamondback Energy, Inc. | 4.2 |
| Marathon Petroleum Corp. | 3.3 |
| Hess Corp. | 2.7 |
| | 61.5 |
Top Industries (% of fund's net assets)
| As of August 31, 2019 |
| | Oil, Gas & Consumable Fuels | 91.3% |
| | Energy Equipment & Services | 5.7% |
| | Machinery | 0.3% |
| | Electric Utilities | 0.2% |
| | Chemicals | 0.2% |
| | All Others* | 2.3% |

* Includes short-term investments and net other assets (liabilities).
Energy Portfolio
Schedule of Investments August 31, 2019 (Unaudited)
Showing Percentage of Net Assets
| Common Stocks - 97.7% | | | |
| | | Shares | Value |
| Chemicals - 0.2% | | | |
| Commodity Chemicals - 0.2% | | | |
| LG Chemical Ltd. | | 4,005 | $1,093,602 |
| LyondellBasell Industries NV Class A | | 12,100 | 936,298 |
| | | | 2,029,900 |
| Electric Utilities - 0.2% | | | |
| Electric Utilities - 0.2% | | | |
| ORSTED A/S (a) | | 21,300 | 2,033,759 |
| Energy Equipment & Services - 5.7% | | | |
| Oil & Gas Drilling - 0.6% | | | |
| AKITA Drilling Ltd. Class A (non-vtg.) | | 265,464 | 350,921 |
| Odfjell Drilling Ltd. (b) | | 656,180 | 1,821,882 |
| Patterson-UTI Energy, Inc. | | 155,900 | 1,348,535 |
| Shelf Drilling Ltd. (a)(b) | | 914,367 | 1,851,372 |
| | | | 5,372,710 |
| Oil & Gas Equipment & Services - 5.1% | | | |
| Baker Hughes, A GE Co. Class A | | 580,540 | 12,591,913 |
| Dmc Global, Inc. | | 24,350 | 1,057,521 |
| Forum Energy Technologies, Inc. (b) | | 599,819 | 845,745 |
| Halliburton Co. | | 209,600 | 3,948,864 |
| RigNet, Inc. (b) | | 498,801 | 3,910,600 |
| Schlumberger Ltd. | | 424,758 | 13,774,902 |
| Solaris Oilfield Infrastructure, Inc. Class A | | 462,300 | 6,356,625 |
| Tenaris SA sponsored ADR | | 121,900 | 2,637,916 |
| | | | 45,124,086 |
|
| TOTAL ENERGY EQUIPMENT & SERVICES | | | 50,496,796 |
|
| Machinery - 0.3% | | | |
| Industrial Machinery - 0.3% | | | |
| ProPetro Holding Corp. (b) | | 210,023 | 2,236,745 |
| Oil, Gas & Consumable Fuels - 91.3% | | | |
| Integrated Oil & Gas - 28.4% | | | |
| Chevron Corp. | | 1,388,623 | 163,468,699 |
| Exxon Mobil Corp. | | 701,148 | 48,014,615 |
| Occidental Petroleum Corp. | | 531,600 | 23,113,968 |
| Suncor Energy, Inc. | | 660,300 | 19,312,064 |
| | | | 253,909,346 |
| Oil & Gas Exploration & Production - 41.3% | | | |
| Berry Petroleum Corp. | | 400,000 | 3,196,000 |
| Black Stone Minerals LP | | 78,100 | 1,112,144 |
| Brigham Minerals, Inc. Class A | | 108,700 | 2,172,913 |
| Cabot Oil & Gas Corp. | | 747,400 | 12,795,488 |
| Canadian Natural Resources Ltd. | | 111,100 | 2,654,417 |
| Carrizo Oil & Gas, Inc. (b) | | 51,500 | 426,935 |
| Concho Resources, Inc. | | 46,728 | 3,418,153 |
| ConocoPhillips Co. | | 779,200 | 40,658,656 |
| Continental Resources, Inc. | | 379,088 | 11,069,370 |
| Devon Energy Corp. | | 905,100 | 19,903,149 |
| Diamondback Energy, Inc. | | 386,747 | 37,932,146 |
| Encana Corp. (Toronto) | | 1,120,942 | 4,967,371 |
| EOG Resources, Inc. | | 803,364 | 59,601,575 |
| EQT Corp. | | 55,400 | 563,418 |
| Hess Corp. | | 378,300 | 23,813,985 |
| Kosmos Energy Ltd. | | 1,409,500 | 8,908,040 |
| Lundin Petroleum AB | | 226,900 | 6,893,937 |
| Magnolia Oil & Gas Corp. Class A (b) | | 1,029,800 | 10,514,258 |
| National Energy Services Reunited Corp. (b) | | 13,300 | 101,878 |
| Noble Energy, Inc. | | 1,005,900 | 22,713,222 |
| Northern Oil & Gas, Inc. (b)(c) | | 2,834,000 | 5,214,560 |
| Parex Resources, Inc. (b) | | 869,200 | 13,311,543 |
| Parsley Energy, Inc. Class A | | 526,900 | 9,436,779 |
| PDC Energy, Inc. (b) | | 110,351 | 3,514,679 |
| Pioneer Natural Resources Co. | | 373,599 | 46,109,589 |
| Texas Pacific Land Trust | | 767 | 502,546 |
| Viper Energy Partners LP | | 585,959 | 16,975,232 |
| | | | 368,481,983 |
| Oil & Gas Refining & Marketing - 17.1% | | | |
| Delek U.S. Holdings, Inc. | | 300,431 | 9,839,115 |
| Marathon Petroleum Corp. | | 595,492 | 29,304,161 |
| Par Pacific Holdings, Inc. (b) | | 382,600 | 8,317,724 |
| Phillips 66 Co. | | 436,373 | 43,039,469 |
| Reliance Industries Ltd. | | 269,232 | 4,704,486 |
| Valero Energy Corp. | | 762,600 | 57,408,528 |
| World Fuel Services Corp. | | 12,200 | 468,480 |
| | | | 153,081,963 |
| Oil & Gas Storage & Transport - 4.5% | | | |
| Cheniere Energy, Inc. (b) | | 340,300 | 20,319,313 |
| Enterprise Products Partners LP | | 327,400 | 9,334,174 |
| Golar LNG Ltd. | | 106,900 | 1,251,799 |
| Noble Midstream Partners LP (b)(d) | | 101,027 | 2,457,987 |
| Teekay LNG Partners LP | | 53,200 | 772,464 |
| The Williams Companies, Inc. | | 255,462 | 6,028,903 |
| | | | 40,164,640 |
|
| TOTAL OIL, GAS & CONSUMABLE FUELS | | | 815,637,932 |
|
| TOTAL COMMON STOCKS | | | |
| (Cost $889,575,865) | | | 872,435,132 |
|
| Money Market Funds - 0.8% | | | |
| Fidelity Cash Central Fund 2.13% (e) | | 5,049,737 | 5,050,747 |
| Fidelity Securities Lending Cash Central Fund 2.13% (e)(f) | | 2,103,455 | 2,103,666 |
| TOTAL MONEY MARKET FUNDS | | | |
| (Cost $7,154,413) | | | 7,154,413 |
| TOTAL INVESTMENT IN SECURITIES - 98.5% | | | |
| (Cost $896,730,278) | | | 879,589,545 |
| NET OTHER ASSETS (LIABILITIES) - 1.5% | | | 13,657,409 |
| NET ASSETS - 100% | | | $893,246,954 |
Legend
(a) Security exempt from registration under Rule 144A of the Securities Act of 1933. These securities may be resold in transactions exempt from registration, normally to qualified institutional buyers. At the end of the period, the value of these securities amounted to $3,885,131 or 0.4% of net assets.
(b) Non-income producing
(c) Security or a portion of the security is on loan at period end.
(d) Restricted securities - Investment in securities not registered under the Securities Act of 1933 (excluding 144A issues). At the end of the period, the value of restricted securities (excluding 144A issues) amounted to $2,457,987 or 0.3% of net assets.
(e) Affiliated fund that is generally available only to investment companies and other accounts managed by Fidelity Investments. The rate quoted is the annualized seven-day yield of the fund at period end. A complete unaudited listing of the fund's holdings as of its most recent quarter end is available upon request. In addition, each Fidelity Central Fund's financial statements are available on the SEC's website or upon request.
(f) Investment made with cash collateral received from securities on loan.
Additional information on each restricted holding is as follows:
| Security | Acquisition Date | Acquisition Cost |
| Noble Midstream Partners LP | 6/21/17 | $4,086,542 |
Affiliated Central Funds
Information regarding fiscal year to date income earned by the Fund from investments in Fidelity Central Funds is as follows:
| Fund | Income earned |
| Fidelity Cash Central Fund | $70,340 |
| Fidelity Securities Lending Cash Central Fund | 12,910 |
| Total | $83,250 |
Amounts in the income column in the above table include any capital gain distributions from underlying funds, which are presented in the corresponding line-item in the Statement of Operations, if applicable. Amount for Fidelity Securities Lending Cash Central Fund represents the income earned on investing cash collateral, less rebates paid to borrowers and any lending agent fees associated with the loan, plus any premium payments received for lending certain types of securities.
Investment Valuation
All investments are categorized as Level 1 under the Fair Value Hierarchy. The inputs or methodology used for valuing securities may not be an indication of the risk associated with investing in those securities. For more information on valuation inputs please refer to the Investment Valuation section in the accompanying Notes to Financial Statements.
See accompanying notes which are an integral part of the financial statements.
Energy Portfolio
Financial Statements
Statement of Assets and Liabilities
| | | August 31, 2019 (Unaudited) |
| Assets | | |
Investment in securities, at value (including securities loaned of $1,903,344) — See accompanying schedule:
Unaffiliated issuers (cost $889,575,865) | $872,435,132 | |
| Fidelity Central Funds (cost $7,154,413) | 7,154,413 | |
| Total Investment in Securities (cost $896,730,278) | | $879,589,545 |
| Foreign currency held at value (cost $10,385) | | 10,419 |
| Receivable for investments sold | | 12,721,219 |
| Receivable for fund shares sold | | 483,669 |
| Dividends receivable | | 4,113,497 |
| Distributions receivable from Fidelity Central Funds | | 9,565 |
| Prepaid expenses | | 14,547 |
| Other receivables | | 242,091 |
| Total assets | | 897,184,552 |
| Liabilities | | |
| Payable for fund shares redeemed | 922,663 | |
| Accrued management fee | 413,471 | |
| Other affiliated payables | 220,784 | |
| Other payables and accrued expenses | 282,480 | |
| Collateral on securities loaned | 2,098,200 | |
| Total liabilities | | 3,937,598 |
| Net Assets | | $893,246,954 |
| Net Assets consist of: | | |
| Paid in capital | | $1,317,827,428 |
| Total distributable earnings (loss) | | (424,580,474) |
| Net Assets, for 27,079,566 shares outstanding | | $893,246,954 |
| Net Asset Value, offering price and redemption price per share ($893,246,954 ÷ 27,079,566 shares) | | $32.99 |
See accompanying notes which are an integral part of the financial statements.
Statement of Operations
| | | Six months ended August 31, 2019 (Unaudited) |
| Investment Income | | |
| Dividends | | $13,808,265 |
| Income from Fidelity Central Funds (including $12,910 from security lending) | | 83,250 |
| Total income | | 13,891,515 |
| Expenses | | |
| Management fee | $2,894,797 | |
| Transfer agent fees | 1,220,084 | |
| Accounting and security lending fees | 177,480 | |
| Custodian fees and expenses | 10,101 | |
| Independent trustees' fees and expenses | 3,104 | |
| Registration fees | 39,459 | |
| Audit | 40,643 | |
| Legal | 1,629 | |
| Interest | 999 | |
| Miscellaneous | 6,664 | |
| Total expenses before reductions | 4,394,960 | |
| Expense reductions | (28,168) | |
| Total expenses after reductions | | 4,366,792 |
| Net investment income (loss) | | 9,524,723 |
| Realized and Unrealized Gain (Loss) | | |
| Net realized gain (loss) on: | | |
| Investment securities: | | |
| Unaffiliated issuers (net of foreign taxes of $29,785) | (55,020,792) | |
| Redemptions in-kind with affiliated entities | 6,179,274 | |
| Fidelity Central Funds | 468 | |
| Foreign currency transactions | (12,877) | |
| Total net realized gain (loss) | | (48,853,927) |
| Change in net unrealized appreciation (depreciation) on: | | |
| Investment securities: | | |
| Unaffiliated issuers (net of decrease in deferred foreign taxes of $46,024) | (89,878,577) | |
| Assets and liabilities in foreign currencies | 85 | |
| Total change in net unrealized appreciation (depreciation) | | (89,878,492) |
| Net gain (loss) | | (138,732,419) |
| Net increase (decrease) in net assets resulting from operations | | $(129,207,696) |
See accompanying notes which are an integral part of the financial statements.
Statement of Changes in Net Assets
| | Six months ended August 31, 2019 (Unaudited) | Year ended February 28, 2019 |
| Increase (Decrease) in Net Assets | | |
| Operations | | |
| Net investment income (loss) | $9,524,723 | $17,770,142 |
| Net realized gain (loss) | (48,853,927) | 44,684,339 |
| Change in net unrealized appreciation (depreciation) | (89,878,492) | (128,275,248) |
| Net increase (decrease) in net assets resulting from operations | (129,207,696) | (65,820,767) |
| Distributions to shareholders | (1,607,160) | (15,141,238) |
| Share transactions | | |
| Proceeds from sales of shares | 95,643,695 | 441,916,034 |
| Reinvestment of distributions | 1,515,626 | 14,307,440 |
| Cost of shares redeemed | (225,270,911) | (1,001,524,132) |
| Net increase (decrease) in net assets resulting from share transactions | (128,111,590) | (545,300,658) |
| Total increase (decrease) in net assets | (258,926,446) | (626,262,663) |
| Net Assets | | |
| Beginning of period | 1,152,173,400 | 1,778,436,063 |
| End of period | $893,246,954 | $1,152,173,400 |
| Other Information | | |
| Shares | | |
| Sold | 2,600,383 | 10,039,540 |
| Issued in reinvestment of distributions | 38,674 | 402,346 |
| Redeemed | (6,285,394) | (23,082,720) |
| Net increase (decrease) | (3,646,337) | (12,640,834) |
See accompanying notes which are an integral part of the financial statements.
Financial Highlights
Energy Portfolio
| | Six months ended (Unaudited) August 31, | Years endedFebruary 28, | | | | |
| | 2019 | 2019 | 2018 | 2017 | 2016 A | 2015 |
| Selected Per–Share Data | | | | | | |
| Net asset value, beginning of period | $37.50 | $41.01 | $44.10 | $32.63 | $45.64 | $56.25 |
| Income from Investment Operations | | | | | | |
| Net investment income (loss)B | .32 | .49 | .75C | .18 | .42 | .46 |
| Net realized and unrealized gain (loss) | (4.78) | (3.51) | (3.06) | 11.58 | (12.98) | (6.37) |
| Total from investment operations | (4.46) | (3.02) | (2.31) | 11.76 | (12.56) | (5.91) |
| Distributions from net investment income | (.05) | (.48) | (.68) | (.24) | (.39) | (.46) |
| Distributions from net realized gain | – | (.01) | (.10) | (.05) | (.07) | (4.23) |
| Total distributions | (.05) | (.49) | (.78) | (.29) | (.45)D | (4.70)E |
| Redemption fees added to paid in capitalB | – | – | – | –F | –F | –F |
| Net asset value, end of period | $32.99 | $37.50 | $41.01 | $44.10 | $32.63 | $45.64 |
| Total ReturnG,H | (11.91)% | (7.30)% | (5.27)% | 36.05% | (27.61)% | (11.25)% |
| Ratios to Average Net AssetsI,J | | | | | | |
| Expenses before reductions | .82%K | .78% | .79% | .79% | .80% | .79% |
| Expenses net of fee waivers, if any | .81%K | .78% | .79% | .79% | .80% | .79% |
| Expenses net of all reductions | .81%K | .77% | .78% | .78% | .79% | .79% |
| Net investment income (loss) | 1.77%K | 1.12% | 1.82%C | .44% | 1.03% | .85% |
| Supplemental Data | | | | | | |
| Net assets, end of period (000 omitted) | $893,247 | $1,152,173 | $1,778,436 | $2,289,350 | $1,928,897 | $2,179,828 |
| Portfolio turnover rateL | 64%K,M | 59%M | 59% | 93%M | 79% | 73%M |
A For the year ended February 29.
B Calculated based on average shares outstanding during the period.
C Net investment income per share reflects a large, non-recurring dividend which amounted to $.48 per share. Excluding this non-recurring dividend, the ratio of net investment income (loss) to average net assets would have been .66%.
D Total distributions of $.45 per share is comprised of distributions from net investment income of $.387 and distributions from net realized gain of $.066 per share.
E Total distributions of $4.70 per share is comprised of distributions from net investment income of $.463 and distributions from net realized gain of $4.233 per share.
F Amount represents less than $.005 per share.
G Total returns for periods of less than one year are not annualized.
H Total returns would have been lower if certain expenses had not been reduced during the applicable periods shown.
I Fees and expenses of any underlying Fidelity Central Funds are not included in the Fund's expense ratio. The Fund indirectly bears its proportionate share of the expenses of any underlying Fidelity Central Funds.
J Expense ratios reflect operating expenses of the Fund. Expenses before reductions do not reflect amounts reimbursed by the investment adviser or reductions from brokerage service arrangements or reductions from other expense offset arrangements and do not represent the amount paid by the Fund during periods when reimbursements or reductions occur. Expenses net of fee waivers reflect expenses after reimbursement by the investment adviser but prior to reductions from brokerage service arrangements or other expense offset arrangements. Expenses net of all reductions represent the net expenses paid by the Fund.
K Annualized
L Amount does not include the portfolio activity of any underlying Fidelity Central Funds.
M Portfolio turnover rate excludes securities received or delivered in-kind.
See accompanying notes which are an integral part of the financial statements.
Energy Service Portfolio
Investment Summary (Unaudited)
Top Ten Stocks as of August 31, 2019
| | % of fund's net assets |
| Schlumberger Ltd. | 17.7 |
| Baker Hughes, A GE Co. Class A | 14.1 |
| Halliburton Co. | 11.9 |
| National Energy Services Reunited Corp. | 3.9 |
| TechnipFMC PLC | 3.6 |
| Odfjell Drilling Ltd. | 3.1 |
| Patterson-UTI Energy, Inc. | 3.1 |
| Nabors Industries Ltd. | 2.9 |
| Shelf Drilling Ltd. | 2.8 |
| Dril-Quip, Inc. | 2.8 |
| | 65.9 |
Top Industries (% of fund's net assets)
| As of August 31, 2019 |
| | Energy Equipment & Services | 86.8% |
| | Oil, Gas & Consumable Fuels | 6.5% |
| | Machinery | 5.3% |
| | All Others* | 1.4% |

* Includes short-term investments and net other assets (liabilities).
Energy Service Portfolio
Schedule of Investments August 31, 2019 (Unaudited)
Showing Percentage of Net Assets
| Common Stocks - 98.6% | | | |
| | | Shares | Value |
| Energy Equipment & Services - 86.8% | | | |
| Oil & Gas Drilling - 15.4% | | | |
| Borr Drilling Ltd. (a)(b) | | 92,112 | $513,519 |
| Helmerich & Payne, Inc. | | 109,598 | 4,119,789 |
| Independence Contract Drilling, Inc. (a) | | 1,249,655 | 1,312,138 |
| Nabors Industries Ltd. (b) | | 3,245,678 | 5,452,739 |
| Odfjell Drilling Ltd. (a)(b) | | 2,107,082 | 5,850,308 |
| Patterson-UTI Energy, Inc. | | 673,790 | 5,828,284 |
| Shelf Drilling Ltd. (a)(c) | | 2,651,976 | 5,369,610 |
| Transocean Ltd. (United States) (a) | | 121,500 | 552,825 |
| Valaris PLC Class A (b) | | 44,362 | 206,727 |
| | | | 29,205,939 |
| Oil & Gas Equipment & Services - 71.4% | | | |
| Archrock, Inc. | | 366,816 | 3,561,783 |
| Baker Hughes, A GE Co. Class A | | 1,230,238 | 26,683,862 |
| C&J Energy Services, Inc. (a) | | 118,651 | 1,134,304 |
| Core Laboratories NV (b) | | 21,100 | 835,349 |
| CSI Compressco LP | | 1,243,883 | 3,657,016 |
| Dril-Quip, Inc. (a) | | 116,500 | 5,341,525 |
| Forum Energy Technologies, Inc. (a) | | 703,397 | 991,790 |
| Frank's International NV (a)(b) | | 370,583 | 1,612,036 |
| FTS International, Inc. (a) | | 31,700 | 79,567 |
| Halliburton Co. | | 1,193,250 | 22,480,830 |
| Helix Energy Solutions Group, Inc. (a) | | 304,829 | 2,206,962 |
| McDermott International, Inc. (a)(b) | | 350,099 | 1,652,467 |
| National Oilwell Varco, Inc. | | 189,300 | 3,867,399 |
| NCS Multistage Holdings, Inc. (a) | | 190,737 | 411,992 |
| Oceaneering International, Inc. (a) | | 399,825 | 5,181,732 |
| Oil States International, Inc. (a) | | 195,625 | 2,697,669 |
| Ranger Energy Services, Inc. Class A (a)(b) | | 579,494 | 3,691,377 |
| RigNet, Inc. (a)(b) | | 605,035 | 4,743,474 |
| Schlumberger Ltd. | | 1,037,911 | 33,659,452 |
| SEACOR Marine Holdings, Inc. (a) | | 100 | 1,303 |
| Smart Sand, Inc. (a)(b) | | 529,290 | 1,254,417 |
| Superior Energy Services, Inc. (a) | | 460,600 | 154,209 |
| TechnipFMC PLC | | 274,172 | 6,810,432 |
| TETRA Technologies, Inc. (a) | | 1,636,822 | 2,717,125 |
| TETRA Technologies, Inc. warrants 12/14/21 (a) | | 300,100 | 32,171 |
| U.S. Silica Holdings, Inc. (b) | | 4,200 | 42,714 |
| Weatherford International PLC (a) | | 2,162,766 | 55,259 |
| | | | 135,558,216 |
|
| TOTAL ENERGY EQUIPMENT & SERVICES | | | 164,764,155 |
|
| Machinery - 5.3% | | | |
| Industrial Machinery - 5.3% | | | |
| Apergy Corp. (a) | | 146,648 | 3,809,915 |
| Cactus, Inc. (a) | | 103,000 | 2,623,410 |
| ProPetro Holding Corp. (a) | | 334,900 | 3,566,685 |
| | | | 10,000,010 |
| Oil, Gas & Consumable Fuels - 6.5% | | | |
| Oil & Gas Exploration & Production - 3.9% | | | |
| National Energy Services Reunited Corp. (a)(b) | | 956,069 | 7,323,489 |
| Oil & Gas Storage & Transport - 2.6% | | | |
| Cheniere Energy, Inc. (a) | | 68,512 | 4,090,852 |
| Golar LNG Ltd. | | 72,833 | 852,874 |
| | | | 4,943,726 |
|
| TOTAL OIL, GAS & CONSUMABLE FUELS | | | 12,267,215 |
|
| TOTAL COMMON STOCKS | | | |
| (Cost $311,548,233) | | | 187,031,380 |
|
| Money Market Funds - 4.4% | | | |
| Fidelity Cash Central Fund 2.13% (d) | | 2,744,954 | 2,745,503 |
| Fidelity Securities Lending Cash Central Fund 2.13% (d)(e) | | 5,701,041 | 5,701,611 |
| TOTAL MONEY MARKET FUNDS | | | |
| (Cost $8,446,717) | | | 8,447,114 |
| TOTAL INVESTMENT IN SECURITIES - 103.0% | | | |
| (Cost $319,994,950) | | | 195,478,494 |
| NET OTHER ASSETS (LIABILITIES) - (3.0)% | | | (5,731,872) |
| NET ASSETS - 100% | | | $189,746,622 |
Legend
(a) Non-income producing
(b) Security or a portion of the security is on loan at period end.
(c) Security exempt from registration under Rule 144A of the Securities Act of 1933. These securities may be resold in transactions exempt from registration, normally to qualified institutional buyers. At the end of the period, the value of these securities amounted to $5,369,610 or 2.8% of net assets.
(d) Affiliated fund that is generally available only to investment companies and other accounts managed by Fidelity Investments. The rate quoted is the annualized seven-day yield of the fund at period end. A complete unaudited listing of the fund's holdings as of its most recent quarter end is available upon request. In addition, each Fidelity Central Fund's financial statements are available on the SEC's website or upon request.
(e) Investment made with cash collateral received from securities on loan.
Affiliated Central Funds
Information regarding fiscal year to date income earned by the Fund from investments in Fidelity Central Funds is as follows:
| Fund | Income earned |
| Fidelity Cash Central Fund | $14,748 |
| Fidelity Securities Lending Cash Central Fund | 27,883 |
| Total | $42,631 |
Amounts in the income column in the above table include any capital gain distributions from underlying funds, which are presented in the corresponding line-item in the Statement of Operations, if applicable. Amount for Fidelity Securities Lending Cash Central Fund represents the income earned on investing cash collateral, less rebates paid to borrowers and any lending agent fees associated with the loan, plus any premium payments received for lending certain types of securities.
Other Affiliated Issuers
An affiliated company is a company in which the Fund has ownership of at least 5% of the voting securities. Fiscal year to date transactions with companies which are or were affiliates are as follows:
| Affiliate | Value, beginning of period | Purchases | Sales Proceeds | Dividend Income | Realized Gain (loss) | Change in Unrealized appreciation (depreciation) | Value, end of period |
| Enterprise Group, Inc. | $1,104,089 | $-- | $805,986 | $-- | $(6,662,065) | $6,363,962 | $-- |
| Superior Drilling Products, Inc. | 3,855,310 | -- | 2,755,415 | -- | (3,822,347) | 2,722,452 | -- |
| Total | $4,959,399 | $-- | $3,561,401 | $-- | $(10,484,412) | $9,086,414 | $-- |
Investment Valuation
The following is a summary of the inputs used, as of August 31, 2019, involving the Fund's assets and liabilities carried at fair value. The inputs or methodology used for valuing securities may not be an indication of the risk associated with investing in those securities. For more information on valuation inputs, and their aggregation into the levels used below, please refer to the Investment Valuation section in the accompanying Notes to Financial Statements.
| | Valuation Inputs at Reporting Date: |
| Description | Total | Level 1 | Level 2 | Level 3 |
| Investments in Securities: | | | | |
| Common Stocks | $187,031,380 | $186,999,209 | $32,171 | $-- |
| Money Market Funds | 8,447,114 | 8,447,114 | -- | -- |
| Total Investments in Securities: | $195,478,494 | $195,446,323 | $32,171 | $-- |
Other Information
Distribution of investments by country or territory of incorporation, as a percentage of Total Net Assets, is as follows (Unaudited):
| United States of America | 62.8% |
| Curacao | 17.7% |
| Bermuda | 6.6% |
| British Virgin Islands | 3.9% |
| United Kingdom | 3.7% |
| Norway | 2.8% |
| Netherlands | 1.3% |
| Others (Individually Less Than 1%) | 1.2% |
| | 100.0% |
See accompanying notes which are an integral part of the financial statements.
Energy Service Portfolio
Financial Statements
Statement of Assets and Liabilities
| | | August 31, 2019 (Unaudited) |
| Assets | | |
Investment in securities, at value (including securities loaned of $5,495,692) — See accompanying schedule:
Unaffiliated issuers (cost $311,548,233) | $187,031,380 | |
| Fidelity Central Funds (cost $8,446,717) | 8,447,114 | |
| Total Investment in Securities (cost $319,994,950) | | $195,478,494 |
| Receivable for fund shares sold | | 271,765 |
| Dividends receivable | | 117,147 |
| Distributions receivable from Fidelity Central Funds | | 4,163 |
| Prepaid expenses | | 3,357 |
| Other receivables | | 69,989 |
| Total assets | | 195,944,915 |
| Liabilities | | |
| Payable for fund shares redeemed | $267,355 | |
| Accrued management fee | 87,003 | |
| Other affiliated payables | 61,800 | |
| Other payables and accrued expenses | 79,959 | |
| Collateral on securities loaned | 5,702,176 | |
| Total liabilities | | 6,198,293 |
| Net Assets | | $189,746,622 |
| Net Assets consist of: | | |
| Paid in capital | | $536,385,397 |
| Total distributable earnings (loss) | | (346,638,775) |
| Net Assets, for 8,986,750 shares outstanding | | $189,746,622 |
| Net Asset Value, offering price and redemption price per share ($189,746,622 ÷ 8,986,750 shares) | | $21.11 |
See accompanying notes which are an integral part of the financial statements.
Statement of Operations
| | | Six months ended August 31, 2019 (Unaudited) |
| Investment Income | | |
| Dividends | | $2,087,765 |
| Income from Fidelity Central Funds (including $27,883 from security lending) | | 42,631 |
| Total income | | 2,130,396 |
| Expenses | | |
| Management fee | $692,099 | |
| Transfer agent fees | 360,082 | |
| Accounting and security lending fees | 50,566 | |
| Custodian fees and expenses | 4,736 | |
| Independent trustees' fees and expenses | 765 | |
| Registration fees | 26,218 | |
| Audit | 26,745 | |
| Legal | 678 | |
| Miscellaneous | 1,291 | |
| Total expenses before reductions | 1,163,180 | |
| Expense reductions | (24,870) | |
| Total expenses after reductions | | 1,138,310 |
| Net investment income (loss) | | 992,086 |
| Realized and Unrealized Gain (Loss) | | |
| Net realized gain (loss) on: | | |
| Investment securities: | | |
| Unaffiliated issuers | (63,992,552) | |
| Fidelity Central Funds | (237) | |
| Other affiliated issuers | (10,484,412) | |
| Foreign currency transactions | (5,849) | |
| Total net realized gain (loss) | | (74,483,050) |
| Change in net unrealized appreciation (depreciation) on: | | |
| Investment securities: | | |
| Unaffiliated issuers | (28,746,247) | |
| Affiliated issuers | 9,086,414 | |
| Assets and liabilities in foreign currencies | 1,994 | |
| Total change in net unrealized appreciation (depreciation) | | (19,657,839) |
| Net gain (loss) | | (94,140,889) |
| Net increase (decrease) in net assets resulting from operations | | $(93,148,803) |
See accompanying notes which are an integral part of the financial statements.
Statement of Changes in Net Assets
| | Six months ended August 31, 2019 (Unaudited) | Year ended February 28, 2019 |
| Increase (Decrease) in Net Assets | | |
| Operations | | |
| Net investment income (loss) | $992,086 | $2,432,011 |
| Net realized gain (loss) | (74,483,050) | (32,141,097) |
| Change in net unrealized appreciation (depreciation) | (19,657,839) | (62,884,617) |
| Net increase (decrease) in net assets resulting from operations | (93,148,803) | (92,593,703) |
| Distributions to shareholders | – | (2,784,223) |
| Share transactions | | |
| Proceeds from sales of shares | 73,489,266 | 135,703,149 |
| Reinvestment of distributions | – | 2,638,204 |
| Cost of shares redeemed | (93,943,337) | (152,668,531) |
| Net increase (decrease) in net assets resulting from share transactions | (20,454,071) | (14,327,178) |
| Total increase (decrease) in net assets | (113,602,874) | (109,705,104) |
| Net Assets | | |
| Beginning of period | 303,349,496 | 413,054,600 |
| End of period | $189,746,622 | $303,349,496 |
| Other Information | | |
| Shares | | |
| Sold | 2,631,975 | 3,781,710 |
| Issued in reinvestment of distributions | – | 94,121 |
| Redeemed | (3,554,333) | (3,793,132) |
| Net increase (decrease) | (922,358) | 82,699 |
See accompanying notes which are an integral part of the financial statements.
Financial Highlights
Energy Service Portfolio
| | Six months ended (Unaudited) August 31, | Years endedFebruary 28, | | | | |
| | 2019 | 2019 | 2018 | 2017 | 2016 A | 2015 |
| Selected Per–Share Data | | | | | | |
| Net asset value, beginning of period | $30.61 | $42.04 | $54.70 | $37.54 | $54.34 | $86.13 |
| Income from Investment Operations | | | | | | |
| Net investment income (loss)B | .10 | .26 | 1.41C | .17 | .45 | .45 |
| Net realized and unrealized gain (loss) | (9.60) | (11.37) | (10.86) | 17.22 | (16.85) | (23.10) |
| Total from investment operations | (9.50) | (11.11) | (9.45) | 17.39 | (16.40) | (22.65) |
| Distributions from net investment income | – | (.32) | (1.77) | (.23) | (.40) | (.39) |
| Distributions from net realized gain | – | – | (1.43) | – | – | (8.75) |
| Total distributions | – | (.32) | (3.21)D | (.23) | (.40) | (9.14) |
| Redemption fees added to paid in capitalB | – | – | –E | –E | –E | –E |
| Net asset value, end of period | $21.11 | $30.61 | $42.04 | $54.70 | $37.54 | $54.34 |
| Total ReturnF,G | (31.04)% | (26.36)% | (17.41)% | 46.36% | (30.30)% | (27.82)% |
| Ratios to Average Net AssetsH,I | | | | | | |
| Expenses before reductions | .90%J | .84% | .84% | .85% | .85% | .79% |
| Expenses net of fee waivers, if any | .90%J | .84% | .84% | .85% | .84% | .79% |
| Expenses net of all reductions | .88%J | .81% | .82% | .84% | .81% | .79% |
| Net investment income (loss) | .77%J | .65% | 3.04%C | .36% | .92% | .56% |
| Supplemental Data | | | | | | |
| Net assets, end of period (000 omitted) | $189,747 | $303,349 | $413,055 | $734,091 | $435,375 | $698,803 |
| Portfolio turnover rateK | 55%J | 80% | 62% | 96% | 58% | 55% |
A For the year ended February 29.
B Calculated based on average shares outstanding during the period.
C Net investment income per share reflects a large, non-recurring dividend which amounted to $1.34 per share. Excluding this non-recurring dividend, the ratio of net investment income (loss) to average net assets would have been .16%.
D Total distributions of $3.21 per share is comprised of distributions from net investment income of $1.774 and distributions from net realized gain of $1.431 per share.
E Amount represents less than $.005 per share.
F Total returns for periods of less than one year are not annualized.
G Total returns would have been lower if certain expenses had not been reduced during the applicable periods shown.
H Fees and expenses of any underlying Fidelity Central Funds are not included in the Fund's expense ratio. The Fund indirectly bears its proportionate share of the expenses of any underlying Fidelity Central Funds.
I Expense ratios reflect operating expenses of the Fund. Expenses before reductions do not reflect amounts reimbursed by the investment adviser or reductions from brokerage service arrangements or reductions from other expense offset arrangements and do not represent the amount paid by the Fund during periods when reimbursements or reductions occur. Expenses net of fee waivers reflect expenses after reimbursement by the investment adviser but prior to reductions from brokerage service arrangements or other expense offset arrangements. Expenses net of all reductions represent the net expenses paid by the Fund.
J Annualized
K Amount does not include the portfolio activity of any underlying Fidelity Central Funds.
See accompanying notes which are an integral part of the financial statements.
Natural Gas Portfolio
Investment Summary (Unaudited)
Top Ten Stocks as of August 31, 2019
| | % of fund's net assets |
| EOG Resources, Inc. | 7.2 |
| The Williams Companies, Inc. | 6.9 |
| Enbridge, Inc. | 6.7 |
| Noble Energy, Inc. | 5.6 |
| Schlumberger Ltd. | 5.3 |
| Devon Energy Corp. | 5.2 |
| PDC Energy, Inc. | 4.9 |
| Encana Corp. | 4.8 |
| CenterPoint Energy, Inc. | 4.6 |
| Targa Resources Corp. | 4.0 |
| | 55.2 |
Top Industries (% of fund's net assets)
| As of August 31, 2019 |
| | Oil, Gas & Consumable Fuels | 70.9% |
| | Energy Equipment & Services | 18.0% |
| | Multi-Utilities | 5.7% |
| | Gas Utilities | 2.7% |
| | Road & Rail | 2.5% |
| | All Others* | 0.2% |

* Includes short-term investments and net other assets (liabilities).
Natural Gas Portfolio
Schedule of Investments August 31, 2019 (Unaudited)
Showing Percentage of Net Assets
| Common Stocks - 99.8% | | | |
| | | Shares | Value |
| Energy Equipment & Services - 18.0% | | | |
| Oil & Gas Drilling - 2.6% | | | |
| Borr Drilling Ltd. (a) | | 4,800 | $26,760 |
| Borr Drilling Ltd. | | 46,200 | 269,808 |
| Independence Contract Drilling, Inc. (a) | | 222,415 | 233,536 |
| Shelf Drilling Ltd. (a)(b) | | 1,671,956 | 3,385,306 |
| | | | 3,915,410 |
| Oil & Gas Equipment & Services - 15.4% | | | |
| Baker Hughes, A GE Co. Class A | | 63,900 | 1,385,991 |
| Forum Energy Technologies, Inc. (a) | | 1,655,314 | 2,333,993 |
| Halliburton Co. | | 136,800 | 2,577,312 |
| NCS Multistage Holdings, Inc. (a) | | 1,119,877 | 2,418,934 |
| Ranger Energy Services, Inc. Class A (a) | | 142,306 | 906,489 |
| RigNet, Inc. (a) | | 747,035 | 5,856,754 |
| Schlumberger Ltd. | | 253,718 | 8,228,075 |
| Weatherford International PLC (a) | | 265,800 | 6,791 |
| | | | 23,714,339 |
|
| TOTAL ENERGY EQUIPMENT & SERVICES | | | 27,629,749 |
|
| Gas Utilities - 2.7% | | | |
| Gas Utilities - 2.7% | | | |
| South Jersey Industries, Inc. | | 15,300 | 494,802 |
| UGI Corp. | | 76,600 | 3,728,122 |
| | | | 4,222,924 |
| Multi-Utilities - 5.7% | | | |
| Multi-Utilities - 5.7% | | | |
| CenterPoint Energy, Inc. | | 255,900 | 7,085,871 |
| NiSource, Inc. | | 57,400 | 1,696,170 |
| | | | 8,782,041 |
| Oil, Gas & Consumable Fuels - 70.9% | | | |
| Integrated Oil & Gas - 3.6% | | | |
| Occidental Petroleum Corp. | | 128,400 | 5,582,832 |
| Unit Corp. (a) | | 14,100 | 42,723 |
| | | | 5,625,555 |
| Oil & Gas Exploration & Production - 42.6% | | | |
| Advantage Oil & Gas Ltd. (a) | | 32,100 | 35,683 |
| Antero Resources Corp. (a)(c) | | 85,400 | 270,718 |
| ARC Resources Ltd. | | 88,100 | 371,881 |
| Berry Petroleum Corp. | | 13,300 | 106,267 |
| Bonanza Creek Energy, Inc. (a) | | 10,200 | 230,112 |
| Cabot Oil & Gas Corp. | | 77,400 | 1,325,088 |
| Carrizo Oil & Gas, Inc. (a) | | 17,500 | 145,075 |
| Centennial Resource Development, Inc. Class A (a) | | 442,300 | 2,131,886 |
| Cimarex Energy Co. | | 42,000 | 1,796,760 |
| CNX Resources Corp. (a) | | 15,700 | 125,129 |
| Concho Resources, Inc. | | 37,700 | 2,757,755 |
| ConocoPhillips Co. | | 14,900 | 777,482 |
| Devon Energy Corp. | | 362,987 | 7,982,084 |
| Encana Corp. (c) | | 1,666,003 | 7,397,053 |
| Encana Corp. (Toronto) | | 443,600 | 1,965,780 |
| EOG Resources, Inc. | | 148,200 | 10,994,958 |
| EQT Corp. | | 74,423 | 756,882 |
| Extraction Oil & Gas, Inc. (a)(c) | | 11,500 | 46,345 |
| Hess Corp. | | 3,000 | 188,850 |
| Magnolia Oil & Gas Corp. Class A (a) | | 115,500 | 1,179,255 |
| Matador Resources Co. (a)(c) | | 29,800 | 466,370 |
| National Energy Services Reunited Corp. (a) | | 114,973 | 880,693 |
| Noble Energy, Inc. | | 382,400 | 8,634,592 |
| Northern Oil & Gas, Inc. (a) | | 3,200 | 5,888 |
| NuVista Energy Ltd. (a) | | 21,500 | 25,999 |
| PDC Energy, Inc. (a) | | 236,700 | 7,538,895 |
| Pioneer Natural Resources Co. | | 39,400 | 4,862,748 |
| QEP Resources, Inc. | | 200 | 712 |
| Range Resources Corp. (c) | | 47,700 | 169,812 |
| Seven Generations Energy Ltd. (a) | | 85,100 | 460,207 |
| Southwestern Energy Co. (a) | | 36,907 | 58,313 |
| SRC Energy, Inc. (a) | | 31,700 | 159,134 |
| Tourmaline Oil Corp. | | 51,700 | 490,051 |
| WPX Energy, Inc. (a) | | 101,300 | 1,089,988 |
| | | | 65,428,445 |
| Oil & Gas Storage & Transport - 24.7% | | | |
| Cheniere Energy, Inc. (a) | | 45,100 | 2,692,921 |
| Enbridge, Inc. | | 309,300 | 10,344,847 |
| Enbridge, Inc. | | 1,900 | 63,574 |
| Enterprise Products Partners LP | | 154,900 | 4,416,199 |
| Keyera Corp. | | 22,900 | 552,634 |
| Kinder Morgan Canada Ltd. (b) | | 7,200 | 79,387 |
| Noble Midstream Partners LP | | 12,300 | 299,259 |
| ONEOK, Inc. | | 24,400 | 1,739,232 |
| Pembina Pipeline Corp. | | 27,200 | 995,740 |
| Targa Resources Corp. | | 168,500 | 6,086,220 |
| The Williams Companies, Inc. | | 451,600 | 10,657,760 |
| | | | 37,927,773 |
|
| TOTAL OIL, GAS & CONSUMABLE FUELS | | | 108,981,773 |
|
| Road & Rail - 2.5% | | | |
| Trucking - 2.5% | | | |
| 2020 Bulkers Ltd. (a) | | 113,500 | 977,783 |
| Avenir LNG Ltd. (a)(d) | | 2,000,000 | 2,853,318 |
| | | | 3,831,101 |
| TOTAL COMMON STOCKS | | | |
| (Cost $227,142,977) | | | 153,447,588 |
|
| Money Market Funds - 2.4% | | | |
| Fidelity Securities Lending Cash Central Fund 2.13% (e)(f) | | | |
| (Cost $3,690,854) | | 3,690,485 | 3,690,854 |
| TOTAL INVESTMENT IN SECURITIES - 102.2% | | | |
| (Cost $230,833,831) | | | 157,138,442 |
| NET OTHER ASSETS (LIABILITIES) - (2.2)% | | | (3,419,905) |
| NET ASSETS - 100% | | | $153,718,537 |
Legend
(a) Non-income producing
(b) Security exempt from registration under Rule 144A of the Securities Act of 1933. These securities may be resold in transactions exempt from registration, normally to qualified institutional buyers. At the end of the period, the value of these securities amounted to $3,464,693 or 2.3% of net assets.
(c) Security or a portion of the security is on loan at period end.
(d) Level 3 security
(e) Investment made with cash collateral received from securities on loan.
(f) Affiliated fund that is generally available only to investment companies and other accounts managed by Fidelity Investments. The rate quoted is the annualized seven-day yield of the fund at period end. A complete unaudited listing of the fund's holdings as of its most recent quarter end is available upon request. In addition, each Fidelity Central Fund's financial statements are available on the SEC's website or upon request.
Affiliated Central Funds
Information regarding fiscal year to date income earned by the Fund from investments in Fidelity Central Funds is as follows:
| Fund | Income earned |
| Fidelity Cash Central Fund | $1,000 |
| Fidelity Securities Lending Cash Central Fund | 2,750 |
| Total | $3,750 |
Amounts in the income column in the above table include any capital gain distributions from underlying funds, which are presented in the corresponding line-item in the Statement of Operations, if applicable. Amount for Fidelity Securities Lending Cash Central Fund represents the income earned on investing cash collateral, less rebates paid to borrowers and any lending agent fees associated with the loan, plus any premium payments received for lending certain types of securities.
Investment Valuation
The following is a summary of the inputs used, as of August 31, 2019, involving the Fund's assets and liabilities carried at fair value. The inputs or methodology used for valuing securities may not be an indication of the risk associated with investing in those securities. For more information on valuation inputs, and their aggregation into the levels used below, please refer to the Investment Valuation section in the accompanying Notes to Financial Statements.
| | Valuation Inputs at Reporting Date: |
| Description | Total | Level 1 | Level 2 | Level 3 |
| Investments in Securities: | | | | |
| Common Stocks | $153,447,588 | $150,594,270 | $-- | $2,853,318 |
| Money Market Funds | 3,690,854 | 3,690,854 | -- | -- |
| Total Investments in Securities: | $157,138,442 | $154,285,124 | $-- | $2,853,318 |
The following is a reconciliation of Investments in Securities for which Level 3 inputs were used in determining value:
| Investments in Securities: | |
| Common Stocks | |
| Beginning Balance | $3,506,045 |
| Total Realized Gain (Loss) | -- |
| Total Unrealized Gain (Loss) | (652,727) |
| Cost of Purchases | -- |
| Proceeds of Sales | -- |
| Amortization/Accretion | -- |
| Transfers in to Level 3 | -- |
| Transfers out of Level 3 | -- |
| Ending Balance | $2,853,318 |
| The change in unrealized gain (loss) for the period attributable to Level 3 securities held at August 31, 2019 | $(652,727) |
The information used in the above reconciliation represents fiscal year to date activity for any Investments in Securities identified as using Level 3 inputs at either the beginning or the end of the current fiscal period includes securities through affiliated in-kind transactions. Transfers in or out of Level 3 represent the beginning value of any Security or Instrument where a change in the pricing level occurred from the beginning to the end of the period. The cost of purchases and the proceeds of sales may include securities received or delivered through corporate actions or exchanges. Realized and unrealized gains (losses) disclosed in the reconciliation are included in Net Gain (Loss) on the Fund's Statement of Operations.
Other Information
Distribution of investments by country or territory of incorporation, as a percentage of Total Net Assets, is as follows (Unaudited):
| United States of America | 74.5% |
| Canada | 14.7% |
| Curacao | 5.3% |
| Norway | 2.8% |
| Bermuda | 2.1% |
| Others (Individually Less Than 1%) | 0.6% |
| | 100.0% |
See accompanying notes which are an integral part of the financial statements.
Natural Gas Portfolio
Financial Statements
Statement of Assets and Liabilities
| | | August 31, 2019 (Unaudited) |
| Assets | | |
Investment in securities, at value (including securities loaned of $3,443,834) — See accompanying schedule:
Unaffiliated issuers (cost $227,142,977) | $153,447,588 | |
| Fidelity Central Funds (cost $3,690,854) | 3,690,854 | |
| Total Investment in Securities (cost $230,833,831) | | $157,138,442 |
| Receivable for investments sold | | 419,263 |
| Receivable for fund shares sold | | 268,144 |
| Dividends receivable | | 248,117 |
| Distributions receivable from Fidelity Central Funds | | 2,138 |
| Prepaid expenses | | 2,031 |
| Other receivables | | 45,290 |
| Total assets | | 158,123,425 |
| Liabilities | | |
| Payable to custodian bank | $41,375 | |
| Payable for investments purchased | 371,830 | |
| Payable for fund shares redeemed | 119,468 | |
| Accrued management fee | 68,578 | |
| Other affiliated payables | 47,134 | |
| Other payables and accrued expenses | 65,646 | |
| Collateral on securities loaned | 3,690,857 | |
| Total liabilities | | 4,404,888 |
| Net Assets | | $153,718,537 |
| Net Assets consist of: | | |
| Paid in capital | | $534,069,214 |
| Total distributable earnings (loss) | | (380,350,677) |
| Net Assets, for 9,071,896 shares outstanding | | $153,718,537 |
| Net Asset Value, offering price and redemption price per share ($153,718,537 ÷ 9,071,896 shares) | | $16.94 |
See accompanying notes which are an integral part of the financial statements.
Statement of Operations
| | | Six months ended August 31, 2019 (Unaudited) |
| Investment Income | | |
| Dividends | | $1,960,765 |
| Income from Fidelity Central Funds (including $2,750 from security lending) | | 3,750 |
| Total income | | 1,964,515 |
| Expenses | | |
| Management fee | $492,732 | |
| Transfer agent fees | 274,495 | |
| Accounting and security lending fees | 35,800 | |
| Custodian fees and expenses | 8,050 | |
| Independent trustees' fees and expenses | 531 | |
| Registration fees | 17,617 | |
| Audit | 18,850 | |
| Legal | 949 | |
| Miscellaneous | 6,917 | |
| Total expenses before reductions | 855,941 | |
| Expense reductions | (747) | |
| Total expenses after reductions | | 855,194 |
| Net investment income (loss) | | 1,109,321 |
| Realized and Unrealized Gain (Loss) | | |
| Net realized gain (loss) on: | | |
| Investment securities: | | |
| Unaffiliated issuers | (34,542,206) | |
| Fidelity Central Funds | (45) | |
| Foreign currency transactions | 2,779 | |
| Total net realized gain (loss) | | (34,539,472) |
| Change in net unrealized appreciation (depreciation) on: | | |
| Investment securities: | | |
| Unaffiliated issuers | 1,642,648 | |
| Fidelity Central Funds | 42 | |
| Assets and liabilities in foreign currencies | (188) | |
| Total change in net unrealized appreciation (depreciation) | | 1,642,502 |
| Net gain (loss) | | (32,896,970) |
| Net increase (decrease) in net assets resulting from operations | | $(31,787,649) |
See accompanying notes which are an integral part of the financial statements.
Statement of Changes in Net Assets
| | Six months ended August 31, 2019 (Unaudited) | Year ended February 28, 2019 |
| Increase (Decrease) in Net Assets | | |
| Operations | | |
| Net investment income (loss) | $1,109,321 | $2,473,009 |
| Net realized gain (loss) | (34,539,472) | (42,874,910) |
| Change in net unrealized appreciation (depreciation) | 1,642,502 | 33,853,278 |
| Net increase (decrease) in net assets resulting from operations | (31,787,649) | (6,548,623) |
| Distributions to shareholders | – | (1,257,826) |
| Share transactions | | |
| Proceeds from sales of shares | 17,159,522 | 73,386,071 |
| Reinvestment of distributions | – | 1,185,845 |
| Cost of shares redeemed | (32,738,220) | (104,048,790) |
| Net increase (decrease) in net assets resulting from share transactions | (15,578,698) | (29,476,874) |
| Total increase (decrease) in net assets | (47,366,347) | (37,283,323) |
| Net Assets | | |
| Beginning of period | 201,084,884 | 238,368,207 |
| End of period | $153,718,537 | $201,084,884 |
| Other Information | | |
| Shares | | |
| Sold | 898,641 | 3,179,983 |
| Issued in reinvestment of distributions | – | 54,372 |
| Redeemed | (1,659,438) | (4,435,015) |
| Net increase (decrease) | (760,797) | (1,200,660) |
See accompanying notes which are an integral part of the financial statements.
Financial Highlights
Natural Gas Portfolio
| | Six months ended (Unaudited) August 31, | Years endedFebruary 28, | | | | |
| | 2019 | 2019 | 2018 | 2017 | 2016 A | 2015 |
| Selected Per–Share Data | | | | | | |
| Net asset value, beginning of period | $20.45 | $21.60 | $27.76 | $17.83 | $32.05 | $39.16 |
| Income from Investment Operations | | | | | | |
| Net investment income (loss)B | .12 | .24 | .61C | .13 | .33 | .34 |
| Net realized and unrealized gain (loss) | (3.63) | (1.27) | (5.83) | 9.98 | (14.16) | (7.03) |
| Total from investment operations | (3.51) | (1.03) | (5.22) | 10.11 | (13.83) | (6.69) |
| Distributions from net investment income | – | – | (.65) | (.15) | (.39) | (.38) |
| Distributions from net realized gain | – | (.12) | (.29) | (.03) | – | (.04) |
| Total distributions | – | (.12) | (.94) | (.18) | (.39) | (.42) |
| Redemption fees added to paid in capitalB | – | – | –D | –D | –D | –D |
| Net asset value, end of period | $16.94 | $20.45 | $21.60 | $27.76 | $17.83 | $32.05 |
| Total ReturnE,F | (17.16)% | (4.82)% | (18.97)% | 56.75% | (43.29)% | (17.15)% |
| Ratios to Average Net AssetsG,H | | | | | | |
| Expenses before reductions | .93%I | .89% | .89% | .87% | .89% | .82% |
| Expenses net of fee waivers, if any | .93%I | .89% | .89% | .87% | .88% | .82% |
| Expenses net of all reductions | .93%I | .86% | .87% | .87% | .88% | .82% |
| Net investment income (loss) | 1.21%I | 1.02% | 2.52%C | .50% | 1.24% | .84% |
| Supplemental Data | | | | | | |
| Net assets, end of period (000 omitted) | $153,719 | $201,085 | $238,368 | $479,879 | $255,990 | $530,285 |
| Portfolio turnover rateJ,K | 113%I | 86% | 69% | 76% | 62% | 147%K |
A For the year ended February 29.
B Calculated based on average shares outstanding during the period.
C Net investment income per share reflects a large, non-recurring dividend which amounted to $.45 per share. Excluding this non-recurring dividend, the ratio of net investment income (loss) to average net assets would have been .66%.
D Amount represents less than $.005 per share.
E Total returns for periods of less than one year are not annualized.
F Total returns would have been lower if certain expenses had not been reduced during the applicable periods shown.
G Fees and expenses of any underlying Fidelity Central Funds are not included in the Fund's expense ratio. The Fund indirectly bears its proportionate share of the expenses of any underlying Fidelity Central Funds.
H Expense ratios reflect operating expenses of the Fund. Expenses before reductions do not reflect amounts reimbursed by the investment adviser or reductions from brokerage service arrangements or reductions from other expense offset arrangements and do not represent the amount paid by the Fund during periods when reimbursements or reductions occur. Expenses net of fee waivers reflect expenses after reimbursement by the investment adviser but prior to reductions from brokerage service arrangements or other expense offset arrangements. Expenses net of all reductions represent the net expenses paid by the Fund.
I Annualized
J Amount does not include the portfolio activity of any underlying Fidelity Central Funds.
K Portfolio turnover rate excludes securities received or delivered in-kind.
See accompanying notes which are an integral part of the financial statements.
Natural Resources Portfolio
Investment Summary (Unaudited)
Top Ten Stocks as of August 31, 2019
| | % of fund's net assets |
| Chevron Corp. | 9.5 |
| Cenovus Energy, Inc. (Canada) | 5.1 |
| Suncor Energy, Inc. | 4.9 |
| The Williams Companies, Inc. | 4.5 |
| Franco-Nevada Corp. | 4.5 |
| Barrick Gold Corp. | 3.8 |
| Agnico Eagle Mines Ltd. (Canada) | 3.7 |
| Pioneer Natural Resources Co. | 3.5 |
| ConocoPhillips Co. | 3.4 |
| Cheniere Energy, Inc. | 3.3 |
| | 46.2 |
Top Industries (% of fund's net assets)
| As of August 31, 2019 |
| | Oil, Gas & Consumable Fuels | 70.3% |
| | Metals & Mining | 12.0% |
| | Containers & Packaging | 8.8% |
| | Energy Equipment & Services | 6.0% |
| | Construction Materials | 1.3% |
| | All Others* | 1.6% |

* Includes short-term investments and net other assets (liabilities).
Natural Resources Portfolio
Schedule of Investments August 31, 2019 (Unaudited)
Showing Percentage of Net Assets
| Common Stocks - 99.1% | | | |
| | | Shares | Value |
| Construction Materials - 1.3% | | | |
| Construction Materials - 1.3% | | | |
| Eagle Materials, Inc. | | 46,600 | $3,923,254 |
| Summit Materials, Inc. (a) | | 51,100 | 1,072,078 |
| | | | 4,995,332 |
| Containers & Packaging - 8.8% | | | |
| Metal & Glass Containers - 4.8% | | | |
| Aptargroup, Inc. | | 57,000 | 6,966,540 |
| Crown Holdings, Inc. (a) | | 178,100 | 11,726,104 |
| | | | 18,692,644 |
| Paper Packaging - 4.0% | | | |
| Avery Dennison Corp. | | 79,100 | 9,141,587 |
| Graphic Packaging Holding Co. | | 135,400 | 1,869,874 |
| Packaging Corp. of America | | 42,100 | 4,234,418 |
| | | | 15,245,879 |
|
| TOTAL CONTAINERS & PACKAGING | | | 33,938,523 |
|
| Energy Equipment & Services - 6.0% | | | |
| Oil & Gas Drilling - 0.6% | | | |
| Nabors Industries Ltd. | | 139,520 | 234,394 |
| Odfjell Drilling Ltd. (a) | | 178,700 | 496,160 |
| Shelf Drilling Ltd. (a)(b) | | 759,800 | 1,538,411 |
| | | | 2,268,965 |
| Oil & Gas Equipment & Services - 5.4% | | | |
| Baker Hughes, A GE Co. Class A | | 432,700 | 9,385,263 |
| Dril-Quip, Inc. (a) | | 31,425 | 1,440,836 |
| Halliburton Co. | | 215,800 | 4,065,672 |
| National Oilwell Varco, Inc. | | 60,900 | 1,244,187 |
| NCS Multistage Holdings, Inc. (a) | | 49,500 | 106,920 |
| Oceaneering International, Inc. (a) | | 49,600 | 642,816 |
| RigNet, Inc. (a) | | 270,230 | 2,118,603 |
| Schlumberger Ltd. | | 48,565 | 1,574,963 |
| | | | 20,579,260 |
|
| TOTAL ENERGY EQUIPMENT & SERVICES | | | 22,848,225 |
|
| Machinery - 0.1% | | | |
| Industrial Machinery - 0.1% | | | |
| ProPetro Holding Corp. (a) | | 43,600 | 464,340 |
| Metals & Mining - 12.0% | | | |
| Gold - 12.0% | | | |
| Agnico Eagle Mines Ltd. (Canada) | | 229,100 | 14,323,482 |
| Barrick Gold Corp. (c) | | 751,832 | 14,570,504 |
| Franco-Nevada Corp. | | 174,300 | 17,026,782 |
| | | | 45,920,768 |
| Oil, Gas & Consumable Fuels - 70.3% | | | |
| Coal & Consumable Fuels - 0.3% | | | |
| Pinnacle Renewable Energy, Inc. | | 157,200 | 1,115,773 |
| Integrated Oil & Gas - 19.5% | | | |
| Cenovus Energy, Inc. (Canada) | | 2,221,900 | 19,391,977 |
| Chevron Corp. | | 310,398 | 36,540,053 |
| Suncor Energy, Inc. | | 646,000 | 18,893,826 |
| | | | 74,825,856 |
| Oil & Gas Exploration & Production - 29.5% | | | |
| Cabot Oil & Gas Corp. | | 231,600 | 3,964,992 |
| Canadian Natural Resources Ltd. | | 382,900 | 9,148,302 |
| Centennial Resource Development, Inc. Class A (a) | | 240,100 | 1,157,282 |
| ConocoPhillips Co. | | 250,600 | 13,076,308 |
| Crescent Point Energy Corp. | | 311,600 | 982,965 |
| Devon Energy Corp. | | 301,500 | 6,629,985 |
| Diamondback Energy, Inc. | | 103,700 | 10,170,896 |
| Encana Corp. (Toronto) (c) | | 1,441,000 | 6,385,684 |
| EOG Resources, Inc. | | 132,300 | 9,815,337 |
| Kosmos Energy Ltd. | | 167,900 | 1,061,128 |
| Magnolia Oil & Gas Corp. Class A (a)(c) | | 975,800 | 9,962,918 |
| Noble Energy, Inc. (c) | | 473,700 | 10,696,146 |
| Parsley Energy, Inc. Class A | | 458,900 | 8,218,899 |
| PDC Energy, Inc. (a) | | 135,300 | 4,309,305 |
| Pioneer Natural Resources Co. | | 108,100 | 13,341,702 |
| PrairieSky Royalty Ltd. (c) | | 71,238 | 902,648 |
| Viper Energy Partners LP | | 116,500 | 3,375,005 |
| | | | 113,199,502 |
| Oil & Gas Refining & Marketing - 8.6% | | | |
| Delek U.S. Holdings, Inc. (c) | | 197,404 | 6,464,981 |
| Marathon Petroleum Corp. | | 65,298 | 3,213,315 |
| Phillips 66 Co. | | 100,316 | 9,894,167 |
| Reliance Industries Ltd. | | 137,286 | 2,398,898 |
| Valero Energy Corp. | | 148,100 | 11,148,968 |
| | | | 33,120,329 |
| Oil & Gas Storage & Transport - 12.4% | | | |
| Cheniere Energy, Inc. (a) | | 213,600 | 12,754,056 |
| Enterprise Products Partners LP | | 399,300 | 11,384,043 |
| Equitrans Midstream Corp. (c) | | 80,800 | 1,089,992 |
| Golar LNG Ltd. | | 132,400 | 1,550,404 |
| Noble Midstream Partners LP | | 99,337 | 2,416,869 |
| Noble Midstream Partners LP (a)(d) | | 43,718 | 1,063,659 |
| The Williams Companies, Inc. | | 723,000 | 17,062,800 |
| | | | 47,321,823 |
|
| TOTAL OIL, GAS & CONSUMABLE FUELS | | | 269,583,283 |
|
| Paper & Forest Products - 0.6% | | | |
| Forest Products - 0.6% | | | |
| Western Forest Products, Inc. (c) | | 2,625,200 | 2,366,111 |
| TOTAL COMMON STOCKS | | | |
| (Cost $404,442,825) | | | 380,116,582 |
|
| Money Market Funds - 9.9% | | | |
| Fidelity Cash Central Fund 2.13% (e) | | 2,957,548 | 2,958,139 |
| Fidelity Securities Lending Cash Central Fund 2.13% (e)(f) | | 35,117,229 | 35,120,740 |
| TOTAL MONEY MARKET FUNDS | | | |
| (Cost $38,078,879) | | | 38,078,879 |
| TOTAL INVESTMENT IN SECURITIES - 109.0% | | | |
| (Cost $442,521,704) | | | 418,195,461 |
| NET OTHER ASSETS (LIABILITIES) - (9.0)% | | | (34,513,460) |
| NET ASSETS - 100% | | | $383,682,001 |
Legend
(a) Non-income producing
(b) Security exempt from registration under Rule 144A of the Securities Act of 1933. These securities may be resold in transactions exempt from registration, normally to qualified institutional buyers. At the end of the period, the value of these securities amounted to $1,538,411 or 0.4% of net assets.
(c) Security or a portion of the security is on loan at period end.
(d) Restricted securities - Investment in securities not registered under the Securities Act of 1933 (excluding 144A issues). At the end of the period, the value of restricted securities (excluding 144A issues) amounted to $1,063,659 or 0.3% of net assets.
(e) Affiliated fund that is generally available only to investment companies and other accounts managed by Fidelity Investments. The rate quoted is the annualized seven-day yield of the fund at period end. A complete unaudited listing of the fund's holdings as of its most recent quarter end is available upon request. In addition, each Fidelity Central Fund's financial statements are available on the SEC's website or upon request.
(f) Investment made with cash collateral received from securities on loan.
Additional information on each restricted holding is as follows:
| Security | Acquisition Date | Acquisition Cost |
| Noble Midstream Partners LP | 6/21/17 | $1,768,393 |
Affiliated Central Funds
Information regarding fiscal year to date income earned by the Fund from investments in Fidelity Central Funds is as follows:
| Fund | Income earned |
| Fidelity Cash Central Fund | $18,480 |
| Fidelity Securities Lending Cash Central Fund | 8,795 |
| Total | $27,275 |
Amounts in the income column in the above table include any capital gain distributions from underlying funds, which are presented in the corresponding line-item in the Statement of Operations, if applicable. Amount for Fidelity Securities Lending Cash Central Fund represents the income earned on investing cash collateral, less rebates paid to borrowers and any lending agent fees associated with the loan, plus any premium payments received for lending certain types of securities.
Investment Valuation
All investments are categorized as Level 1 under the Fair Value Hierarchy. The inputs or methodology used for valuing securities may not be an indication of the risk associated with investing in those securities. For more information on valuation inputs please refer to the Investment Valuation section in the accompanying Notes to Financial Statements.
Other Information
Distribution of investments by country or territory of incorporation, as a percentage of Total Net Assets, is as follows (Unaudited):
| United States of America | 70.5% |
| Canada | 27.5% |
| Others (Individually Less Than 1%) | 2.0% |
| | 100.0% |
See accompanying notes which are an integral part of the financial statements.
Natural Resources Portfolio
Financial Statements
Statement of Assets and Liabilities
| | | August 31, 2019 (Unaudited) |
| Assets | | |
Investment in securities, at value (including securities loaned of $34,101,910) — See accompanying schedule:
Unaffiliated issuers (cost $404,442,825) | $380,116,582 | |
| Fidelity Central Funds (cost $38,078,879) | 38,078,879 | |
| Total Investment in Securities (cost $442,521,704) | | $418,195,461 |
| Foreign currency held at value (cost $7) | | 7 |
| Receivable for fund shares sold | | 513,204 |
| Dividends receivable | | 874,042 |
| Distributions receivable from Fidelity Central Funds | | 6,115 |
| Prepaid expenses | | 7,163 |
| Other receivables | | 98,852 |
| Total assets | | 419,694,844 |
| Liabilities | | |
| Payable for fund shares redeemed | $502,359 | |
| Accrued management fee | 170,860 | |
| Other affiliated payables | 97,366 | |
| Other payables and accrued expenses | 121,518 | |
| Collateral on securities loaned | 35,120,740 | |
| Total liabilities | | 36,012,843 |
| Net Assets | | $383,682,001 |
| Net Assets consist of: | | |
| Paid in capital | | $614,232,584 |
| Total distributable earnings (loss) | | (230,550,583) |
| Net Assets, for 15,688,996 shares outstanding | | $383,682,001 |
| Net Asset Value, offering price and redemption price per share ($383,682,001 ÷ 15,688,996 shares) | | $24.46 |
See accompanying notes which are an integral part of the financial statements.
Statement of Operations
| | | Six months ended August 31, 2019 (Unaudited) |
| Investment Income | | |
| Dividends | | $4,195,475 |
| Income from Fidelity Central Funds (including $8,795 from security lending) | | 27,275 |
| Total income | | 4,222,750 |
| Expenses | | |
| Management fee | $1,117,600 | |
| Transfer agent fees | 494,711 | |
| Accounting and security lending fees | 81,245 | |
| Custodian fees and expenses | 4,728 | |
| Independent trustees' fees and expenses | 1,264 | |
| Registration fees | 18,423 | |
| Audit | 35,102 | |
| Legal | 1,028 | |
| Miscellaneous | 3,417 | |
| Total expenses before reductions | 1,757,518 | |
| Expense reductions | (52,472) | |
| Total expenses after reductions | | 1,705,046 |
| Net investment income (loss) | | 2,517,704 |
| Realized and Unrealized Gain (Loss) | | |
| Net realized gain (loss) on: | | |
| Investment securities: | | |
| Unaffiliated issuers | 7,820,015 | |
| Fidelity Central Funds | 232 | |
| Foreign currency transactions | 5,290 | |
| Total net realized gain (loss) | | 7,825,537 |
| Change in net unrealized appreciation (depreciation) on: | | |
| Investment securities: | | |
| Unaffiliated issuers (net of increase in deferred foreign taxes of $3,763) | (27,129,981) | |
| Assets and liabilities in foreign currencies | 380 | |
| Total change in net unrealized appreciation (depreciation) | | (27,129,601) |
| Net gain (loss) | | (19,304,064) |
| Net increase (decrease) in net assets resulting from operations | | $(16,786,360) |
See accompanying notes which are an integral part of the financial statements.
Statement of Changes in Net Assets
| | Six months ended August 31, 2019 (Unaudited) | Year ended February 28, 2019 |
| Increase (Decrease) in Net Assets | | |
| Operations | | |
| Net investment income (loss) | $2,517,704 | $9,676,207 |
| Net realized gain (loss) | 7,825,537 | (66,304,623) |
| Change in net unrealized appreciation (depreciation) | (27,129,601) | (26,353,779) |
| Net increase (decrease) in net assets resulting from operations | (16,786,360) | (82,982,195) |
| Distributions to shareholders | (1,233,911) | (10,282,640) |
| Share transactions | | |
| Proceeds from sales of shares | 60,628,621 | 379,536,177 |
| Reinvestment of distributions | 1,132,024 | 9,981,955 |
| Cost of shares redeemed | (84,225,231) | (782,819,915) |
| Net increase (decrease) in net assets resulting from share transactions | (22,464,586) | (393,301,783) |
| Total increase (decrease) in net assets | (40,484,857) | (486,566,618) |
| Net Assets | | |
| Beginning of period | 424,166,858 | 910,733,476 |
| End of period | $383,682,001 | $424,166,858 |
| Other Information | | |
| Shares | | |
| Sold | 2,384,198 | 13,740,663 |
| Issued in reinvestment of distributions | 42,654 | 414,331 |
| Redeemed | (3,337,797) | (30,659,455) |
| Net increase (decrease) | (910,945) | (16,504,461) |
See accompanying notes which are an integral part of the financial statements.
Financial Highlights
Natural Resources Portfolio
| | Six months ended (Unaudited) August 31, | Years endedFebruary 28, | | | | |
| | 2019 | 2019 | 2018 | 2017 | 2016 A | 2015 |
| Selected Per–Share Data | | | | | | |
| Net asset value, beginning of period | $25.55 | $27.51 | $29.13 | $21.80 | $31.49 | $37.85 |
| Income from Investment Operations | | | | | | |
| Net investment income (loss)B | .15 | .29 | .43C | .10 | .18 | .21 |
| Net realized and unrealized gain (loss) | (1.16) | (1.97) | (1.64) | 7.42 | (9.69) | (4.55) |
| Total from investment operations | (1.01) | (1.68) | (1.21) | 7.52 | (9.51) | (4.34) |
| Distributions from net investment income | – | (.28) | (.39) | (.11) | (.18) | (.15) |
| Distributions from net realized gain | (.08) | –D | (.02) | (.08) | – | (1.87) |
| Total distributions | (.08) | (.28) | (.41) | (.19) | (.18) | (2.02) |
| Redemption fees added to paid in capitalB | – | – | –D | –D | –D | –D |
| Net asset value, end of period | $24.46 | $25.55 | $27.51 | $29.13 | $21.80 | $31.49 |
| Total ReturnE,F | (4.00)% | (6.06)% | (4.16)% | 34.54% | (30.22)% | (11.45)% |
| Ratios to Average Net AssetsG,H | | | | | | |
| Expenses before reductions | .84%I | .81% | .83% | .84% | .86% | .82% |
| Expenses net of fee waivers, if any | .84%I | .81% | .83% | .84% | .86% | .82% |
| Expenses net of all reductions | .82%I | .80% | .82% | .83% | .85% | .82% |
| Net investment income (loss) | 1.21%I | 1.02% | 1.54%C | .35% | .66% | .55% |
| Supplemental Data | | | | | | |
| Net assets, end of period (000 omitted) | $383,682 | $424,167 | $910,733 | $912,090 | $462,869 | $761,078 |
| Portfolio turnover rateJ | 11%I | 26% | 78% | 84% | 78% | 87% |
A For the year ended February 29.
B Calculated based on average shares outstanding during the period.
C Net investment income per share reflects a large, non-recurring dividend which amounted to $.31 per share. Excluding this non-recurring dividend, the ratio of net investment income (loss) to average net assets would have been .41%.
D Amount represents less than $.005 per share.
E Total returns for periods of less than one year are not annualized.
F Total returns would have been lower if certain expenses had not been reduced during the applicable periods shown.
G Fees and expenses of any underlying Fidelity Central Funds are not included in the Fund's expense ratio. The Fund indirectly bears its proportionate share of the expenses of any underlying Fidelity Central Funds.
H Expense ratios reflect operating expenses of the Fund. Expenses before reductions do not reflect amounts reimbursed by the investment adviser or reductions from brokerage service arrangements or reductions from other expense offset arrangements and do not represent the amount paid by the Fund during periods when reimbursements or reductions occur. Expenses net of fee waivers reflect expenses after reimbursement by the investment adviser but prior to reductions from brokerage service arrangements or other expense offset arrangements. Expenses net of all reductions represent the net expenses paid by the Fund.
I Annualized
J Amount does not include the portfolio activity of any underlying Fidelity Central Funds.
See accompanying notes which are an integral part of the financial statements.
Notes to Financial Statements (Unaudited)
For the period ended August 31, 2019
1. Organization.
Energy Portfolio, Energy Service Portfolio, Natural Gas Portfolio, and Natural Resources Portfolio (the Funds) are non-diversified funds of Fidelity Select Portfolios (the Trust). The Trust is registered under the Investment Company Act of 1940, as amended (the 1940 Act), as an open-end management investment company organized as a Massachusetts business trust. The Funds invest primarily in securities of companies whose principal business activities fall within specific industries. Each Fund is authorized to issue an unlimited number of shares. Share transactions on the Statement of Changes in Net Assets may contain exchanges between affiliated funds. The Natural Resources Portfolio may also invest in certain precious metals.
2. Investments in Fidelity Central Funds.
The Funds invest in Fidelity Central Funds, which are open-end investment companies generally available only to other investment companies and accounts managed by the investment adviser and its affiliates. The Funds' Schedules of Investments list each of the Fidelity Central Funds held as of period end, if any, as an investment of each Fund, but does not include the underlying holdings of each Fidelity Central Fund. As an Investing Fund, each Fund indirectly bears its proportionate share of the expenses of the underlying Fidelity Central Funds.
The Money Market Central Funds seek preservation of capital and current income and are managed by Fidelity Investments Money Management, Inc. (FIMM), an affiliate of the investment adviser. Annualized expenses of the Money Market Central Funds as of their most recent shareholder report date ranged from less than .005% to .01%.
A complete unaudited list of holdings for each Fidelity Central Fund is available upon request or at the Securities and Exchange Commission (the SEC) website at www.sec.gov. In addition, the financial statements of the Fidelity Central Funds are available on the SEC website or upon request.
3. Significant Accounting Policies.
Each Fund is an investment company and applies the accounting and reporting guidance of the Financial Accounting Standards Board (FASB) Accounting Standards Codification Topic 946 Financial Services – Investments Companies. The financial statements have been prepared in conformity with accounting principles generally accepted in the United States of America (GAAP), which require management to make certain estimates and assumptions at the date of the financial statements. Actual results could differ from those estimates. Subsequent events, if any, through the date that the financial statements were issued have been evaluated in the preparation of the financial statements. The following summarizes the significant accounting policies of the Funds:
Investment Valuation. Investments are valued as of 4:00 p.m. Eastern time on the last calendar day of the period. The Board of Trustees (the Board) has delegated the day to day responsibility for the valuation of each Fund's investments to the Fair Value Committee (the Committee) established by each Fund's investment adviser. In accordance with valuation policies and procedures approved by the Board, each Fund attempts to obtain prices from one or more third party pricing vendors or brokers to value its investments. When current market prices, quotations or currency exchange rates are not readily available or reliable, investments will be fair valued in good faith by the Committee, in accordance with procedures adopted by the Board. Factors used in determining fair value vary by investment type and may include market or investment specific events. The frequency with which these procedures are used cannot be predicted and they may be utilized to a significant extent. The Committee oversees each Fund's valuation policies and procedures and reports to the Board on the Committee's activities and fair value determinations. The Board monitors the appropriateness of the procedures used in valuing each Fund's investments and ratifies the fair value determinations of the Committee.
Each Fund categorizes the inputs to valuation techniques used to value its investments into a disclosure hierarchy consisting of three levels as shown below:
- Level 1 – quoted prices in active markets for identical investments
- Level 2 – other significant observable inputs (including quoted prices for similar investments, interest rates, prepayment speeds, etc.)
- Level 3 – unobservable inputs (including the Fund's own assumptions based on the best information available)
Valuation techniques used to value each Fund's investments by major category are as follows:
Equity securities, including restricted securities, for which market quotations are readily available, are valued at the last reported sale price or official closing price as reported by a third party pricing vendor on the primary market or exchange on which they are traded and are categorized as Level 1 in the hierarchy. In the event there were no sales during the day or closing prices are not available, securities are valued at the last quoted bid price or may be valued using the last available price and are generally categorized as Level 2 in the hierarchy. For foreign equity securities, when market or security specific events arise, comparisons to the valuation of American Depositary Receipts (ADRs), futures contracts, Exchange-Traded Funds (ETFs) and certain indexes as well as quoted prices for similar securities may be used and would be categorized as Level 2 in the hierarchy. For equity securities, including restricted securities, where observable inputs are limited, assumptions about market activity and risk are used and these securities may be categorized as Level 3 in the hierarchy. Equity securities, including restricted securities, for which observable inputs are not available are valued using alternate valuation approaches, including the market approach and the income approach and are categorized as Level 3 in the hierarchy. The market approach generally consists of using comparable market transactions while the income approach generally consists of using the net present value of estimated future cash flows, adjusted as appropriate for liquidity, credit, market and/or other risk factors.
Investments in open-end mutual funds, including the Fidelity Central Funds, are valued at their closing net asset value (NAV) each business day and are categorized as Level 1 in the hierarchy.
The following provides information on Level 3 securities held by Natural Gas Portfolio that were valued at period end based on unobservable inputs. These amounts exclude valuations provided by a broker.
| Asset Type | Fair Value | Valuation Technique(s) | Unobservable Input | Amount or Range/Weighted Average | Impact to Valuation from an Increase in Input A |
| Equities | $2,853,318 | Market approach | Transaction price | $1.43 | Increase |
A Represents the directional change in the fair value of the Level 3 investments that could have resulted from an increase in the corresponding input as of period end. A decrease to the unobservable input would have had the opposite effect. Significant changes in these inputs may have resulted in a significantly higher or lower fair value measurement at period end.
Changes in valuation techniques may result in transfers in or out of an assigned level within the disclosure hierarchy. The aggregate value of investments by input level as of August 31, 2019, as well as a roll forward of Level 3 investments, is included at the end of each applicable Fund's Schedule of Investments.
Foreign Currency. The Funds may use foreign currency contracts to facilitate transactions in foreign-denominated securities. Gains and losses from these transactions may arise from changes in the value of the foreign currency or if the counterparties do not perform under the contracts' terms.
Foreign-denominated assets, including investment securities, and liabilities are translated into U.S. dollars at the exchange rates at period end. Purchases and sales of investment securities, income and dividends received and expenses denominated in foreign currencies are translated into U.S. dollars at the exchange rate in effect on the transaction date.
The effects of exchange rate fluctuations on investments are included with the net realized and unrealized gain (loss) on investment securities. Other foreign currency transactions resulting in realized and unrealized gain (loss) are disclosed separately.
Investment Transactions and Income. For financial reporting purposes, the Funds' investment holdings and NAV include trades executed through the end of the last business day of the period. The NAV per share for processing shareholder transactions is calculated as of the close of business of the New York Stock Exchange (NYSE), normally 4:00 p.m. Eastern time and includes trades executed through the end of the prior business day. Gains and losses on securities sold are determined on the basis of identified cost and for certain Funds include proceeds received from litigation. Dividend income is recorded on the ex-dividend date, except for certain dividends from foreign securities where the ex-dividend date may have passed, which are recorded as soon as the Funds are informed of the ex-dividend date. Non-cash dividends included in dividend income, if any, are recorded at the fair market value of the securities received. Income and capital gain distributions from Fidelity Central Funds, if any, are recorded on the ex-dividend date. Certain distributions received by the Funds represent a return of capital or capital gain. The Funds determine the components of these distributions subsequent to the ex-dividend date, based upon receipt of tax filings or other correspondence relating to the underlying investment. These distributions are recorded as a reduction of cost of investments and/or as a realized gain. Investment income is recorded net of foreign taxes withheld where recovery of such taxes is uncertain.
Expenses. Expenses directly attributable to a fund are charged to that fund. Expenses attributable to more than one fund are allocated among the respective funds on the basis of relative net assets or other appropriate methods. Expense estimates are accrued in the period to which they relate and adjustments are made when actual amounts are known.
Deferred Trustee Compensation. Under a Deferred Compensation Plan (the Plan) the Funds, certain independent Trustees have elected to defer receipt of a portion of their annual compensation. Deferred amounts are invested in a cross-section of Fidelity funds, are marked-to-market and remain in each Fund until distributed in accordance with the Plan. The investment of deferred amounts and the offsetting payable to the Trustees presented below are included in each accompanying Statement of Assets and Liabilities in other receivables and other payables and accrued expenses, respectively.
| Energy Portfolio | $165,050 |
| Energy Service Portfolio | 55,694 |
| Natural Gas Portfolio | 40,358 |
| Natural Resources Portfolio | 64,724 |
Income Tax Information and Distributions to Shareholders. Each year, each Fund intends to qualify as a regulated investment company under Subchapter M of the Internal Revenue Code, including distributing substantially all of its taxable income and realized gains. As a result, no provision for U.S. Federal income taxes is required. Each Fund files a U.S. federal tax return, in addition to state and local tax returns as required. Each Fund's federal income tax returns are subject to examination by the Internal Revenue Service (IRS) for a period of three fiscal years after they are filed. State and local tax returns may be subject to examination for an additional fiscal year depending on the jurisdiction. Foreign taxes are provided for based on each Fund's understanding of the tax rules and rates that exist in the foreign markets in which it invests. An estimated deferred tax liability for net unrealized appreciation on the applicable securities is included in Other payables and accrued expenses on each applicable Fund's Statement of Assets & Liabilities.
Distributions are declared and recorded on the ex-dividend date. Income and capital gain distributions are determined in accordance with income tax regulations, which may differ from GAAP.
Capital accounts within the financial statements are adjusted for permanent book-tax differences. These adjustments have no impact on net assets or the results of operations. Capital accounts are not adjusted for temporary book-tax differences which will reverse in a subsequent period.
Book-tax differences are primarily due to foreign currency transactions, net operating losses, expiring capital loss carryforwards, certain foreign taxes, redemptions in-kind, passive foreign investment companies (PFIC), partnerships, deferred trustees compensation, capital loss carryforwards and losses deferred due to wash sales and excise tax regulations.
As of period end, the cost and unrealized appreciation (depreciation) in securities, and derivatives if applicable, for federal income tax purposes were as follows for each Fund:
| | Tax cost | Gross unrealized appreciation | Gross unrealized depreciation | Net unrealized appreciation (depreciation) |
| Energy Portfolio | $907,723,721 | $93,123,513 | $(121,257,689) | $(28,134,176) |
| Energy Service Portfolio | 322,938,033 | 2,216,098 | (129,675,637) | (127,459,539) |
| Natural Gas Portfolio | 237,157,816 | 2,262,913 | (82,282,287) | (80,019,374) |
| Natural Resources Portfolio | 443,530,085 | 44,569,164 | (69,903,788) | (25,334,624) |
Capital loss carryforwards are only available to offset future capital gains of the Funds to the extent provided by regulations and may be limited. Under the Regulated Investment Company Modernization Act of 2010 (the Act), the Funds are permitted to carry forward capital losses incurred in taxable years beginning after December 22, 2010 for an unlimited period and such capital losses are required to be used prior to any losses that expire. The capital loss carryforward information presented below, including any applicable limitation, is estimated as of prior fiscal period end and is subject to adjustment.
| | No expiration | | | |
| | Short-term | Long-term | Total no expiration | Total capital loss carryforward |
| Energy Portfolio | $(236,660,242) | $(120,340,051) | $(357,000,293) | $(357,000,293) |
| Energy Service Portfolio | (24,393,961) | (115,053,914) | (139,447,875) | (139,447,875) |
| Natural Gas Portfolio | (58,829,181) | (209,992,850) | (268,822,031) | (268,822,031) |
| Natural Resources Portfolio | (93,211,364) | (119,843,225) | (213,054,589) | (213,054,589) |
Certain of the Funds elected to defer to the next fiscal year ordinary losses recognized during the period January 1, 2019 to February 28, 2019 Loss deferrals were as follows:
| | Ordinary losses |
| Energy Service Portfolio | $(682,849) |
| Natural Gas Portfolio | (380,297) |
Restricted Securities. The Funds may invest in securities that are subject to legal or contractual restrictions on resale. These securities generally may be resold in transactions exempt from registration or to the public if the securities are registered. Disposal of these securities may involve time-consuming negotiations and expense, and prompt sale at an acceptable price may be difficult. Information regarding restricted securities is included at the end of each applicable Fund's Schedule of Investments.
4. Purchases and Sales of Investments.
Purchases and sales of securities, other than short-term securities and in-kind transactions, are noted in the table below.
| | Purchases ($) | Sales ($) |
| Energy Portfolio | 340,168,215 | 428,136,228 |
| Energy Service Portfolio | 71,493,952 | 92,674,858 |
| Natural Gas Portfolio | 104,010,661 | 118,487,219 |
| Natural Resources Portfolio | 23,697,260 | 43,148,982 |
5. Fees and Other Transactions with Affiliates.
Management Fee. Fidelity SelectCo, LLC (the investment adviser) and its affiliates provide the Funds with investment management related services for which the Funds pay a monthly management fee. The management fee is the sum of an individual fund fee rate and an annualized group fee rate. The individual fund fee rate is applied to each Fund's average net assets. The group fee rate is based upon the average net assets of all the mutual funds advised by Fidelity Management & Research Company (FMR) and the investment adviser. The group fee rate decreases as assets under management increase and increases as assets under management decrease. For the reporting period, each Fund's annualized management fee rate expressed as a percentage of each Fund's average net assets was as follows:
| | Individual Rate | Group Rate | Total |
| Energy Portfolio | .30% | .24% | .54% |
| Energy Service Portfolio | .30% | .24% | .54% |
| Natural Gas Portfolio | .30% | .24% | .54% |
| Natural Resources Portfolio | .30% | .24% | .54% |
Transfer Agent Fees. Fidelity Investments Institutional Operations Company, Inc. (FIIOC), an affiliate of the investment adviser, is the Funds' transfer, dividend disbursing and shareholder servicing agent. FIIOC receives account fees and asset-based fees that vary according to account size and type of account. FIIOC pays for typesetting, printing and mailing of shareholder reports, except proxy statements. For the period, transfer agent fees were equivalent to the following annualized rates expressed as a percentage of average net assets:
| Energy Portfolio | .23% |
| Energy Service Portfolio | .28% |
| Natural Gas Portfolio | .30% |
| Natural Resources Portfolio | .24% |
Accounting and Security Lending Fees. Fidelity Service Company, Inc. (FSC), an affiliate of the investment adviser, maintains each Fund's accounting records. The accounting fee is based on the level of average net assets for each month. Prior to April 1, 2019, FSC had a separate agreement with each Fund for administration of the security lending program, based on the number and duration of lending transactions. For the period, the total fees paid for accounting and administration of securities lending were equivalent to the following annualized rates:
| | % of Average Net Assets |
| Energy Portfolio | .03 |
| Energy Service Portfolio | .04 |
| Natural Gas Portfolio | .04 |
| Natural Resources Portfolio | .04 |
Brokerage Commissions. Certain Funds placed a portion of their portfolio transactions with brokerage firms which are affiliates of the investment adviser. Brokerage commissions are included in net realized gain (loss) and change in net unrealized appreciation (depreciation) in the Statement of Operations. The commissions paid to these affiliated firms were as follows:
| | Amount |
| Energy Portfolio | $11,153 |
| Energy Service Portfolio | 8,835 |
| Natural Gas Portfolio | 3,397 |
| Natural Resources Portfolio | 1,300 |
Interfund Lending Program. Pursuant to an Exemptive Order issued by the SEC, the Funds, along with other registered investment companies having management contracts with Fidelity Management & Research Company (FMR) or other affiliated entities of FMR, may participate in an interfund lending program. This program provides an alternative credit facility allowing the funds to borrow from, or lend money to, other participating affiliated funds. Each applicable fund's activity in this program during the period for which loans were outstanding was as follows:
| | Borrower or Lender | Average Loan Balance | Weighted Average Interest Rate | Interest Expense |
| Energy Portfolio | Borrower | $4,588,667 | 2.61% | $999 |
Interfund Trades. The Funds may purchase from or sell securities to other Fidelity Funds under procedures adopted by the Board. The procedures have been designed to ensure these interfund trades are executed in accordance with Rule 17a-7 of the 1940 Act. Interfund trades are included within the respective purchases and sales amounts shown in the Purchases and Sales of Investments note.
Other. During the period, the investment adviser reimbursed the Funds for certain losses as follows:
| | Amount |
| Natural Gas Portfolio | $1,658 |
Affiliated Redemptions In-Kind. During the period, 1,155,173 shares of Energy Portfolio were redeemed in-kind for investments and cash with a value of $37,704,833. The net realized gain of $6,179,274 on investments delivered through in-kind redemptions is included in the accompanying Statement of Operations. The amount of the in-kind redemptions is included in share transactions in the accompanying Statement of Changes in Net Assets. Energy Portfolio recognized no gain or loss for federal income tax purposes.
Prior Fiscal Year Affiliated Redemptions In-Kind. During the prior period, 5,345,534 shares of Energy Portfolio were redeemed in-kind for investments and cash with a value of $239,961,028. The Fund had a net realized gain of $76,585,161 on investments delivered through in-kind redemptions. The amount of the in-kind redemptions is included in share transactions in the accompanying Statement of Changes in Net Assets. Energy Portfolio recognized no gain or loss for federal income tax purposes.
6. Committed Line of Credit.
Certain Funds participate with other funds managed by the investment adviser or an affiliate in a $4.25 billion credit facility (the "line of credit") to be utilized for temporary or emergency purposes to fund shareholder redemptions or for other short-term liquidity purposes. The participating funds have agreed to pay commitment fees on their pro-rata portion of the line of credit, which are reflected in Miscellaneous expenses on the Statement of Operations, and are as follows:
| Energy Portfolio | $1,542 |
| Energy Service Portfolio | 384 |
| Natural Gas Portfolio | 265 |
| Natural Resources Portfolio | 665 |
During the period, the Funds did not borrow on this line of credit.
7. Security Lending.
Certain Funds lend portfolio securities from time to time in order to earn additional income. For equity securities, lending agents are used, including National Financial Services (NFS), an affiliate of the Funds. Pursuant to a securities lending agreement, NFS will receive a fee, which is capped at 9.9% of daily lending revenue, for its services as lending agent. The Funds may lend securities to certain qualified borrowers. On the settlement date of the loan, each applicable Fund receives collateral (in the form of U.S. Treasury obligations, letters of credit and/or cash) against the loaned securities and maintains collateral in an amount not less than 100% of the market value of the loaned securities during the period of the loan. The market value of the loaned securities is determined at the close of business of the Funds and any additional required collateral is delivered to the Funds on the next business day. The Funds or borrower may terminate the loan at any time, and if the borrower defaults on its obligation to return the securities loaned because of insolvency or other reasons, the Funds may apply collateral received from the borrower against the obligation. The Funds may experience delays and costs in recovering the securities loaned. Any cash collateral received is invested in the Fidelity Securities Lending Cash Central Fund. The value of loaned securities and cash collateral at period end are disclosed on each applicable Fund's Statement of Assets and Liabilities. Security lending income represents the income earned on investing cash collateral, less rebates paid to borrowers and any lending agent fees associated with the loan, plus any premium payments received for lending certain types of securities. Security lending income is presented on each applicable Fund's Statement of Operations as a component of income from Fidelity Central Funds. Security lending fees paid to NFS were as follows:
| Energy Portfolio | $100 |
| Energy Service Portfolio | $390 |
| Natural Gas Portfolio | $30 |
| Natural Resources Portfolio | $231 |
8. Expense Reductions.
Commissions paid to certain brokers with whom the investment adviser, or its affiliates, places trades on behalf of certain Funds include an amount in addition to trade execution, which may be rebated back to the Funds to offset certain expenses. Through arrangements with each applicable Fund's custodian and transfer agent, credits realized as a result of certain uninvested cash balances were used to reduce each applicable Fund's expenses. All of the applicable expense reductions are noted in the table below.
| | Brokerage Service reduction | Custodian credits | Transfer Agent credits |
| Energy Portfolio | $23,713 | $– | $65 |
| Energy Service Portfolio | 23,519 | 118 | 257 |
| Natural Resources Portfolio | 48,854 | – | 37 |
In addition, during the period the investment adviser reimbursed and/or waived a portion of operating expenses as follows:
| | Amount |
| Energy Portfolio | $4,390 |
| Energy Service Portfolio | 976 |
| Natural Gas Portfolio | 747 |
| Natural Resources Portfolio | 3,581 |
9. Other.
The Funds' organizational documents provide former and current trustees and officers with a limited indemnification against liabilities arising in connection with the performance of their duties to the Funds. In the normal course of business, the Funds may also enter into contracts that provide general indemnifications. The Funds' maximum exposure under these arrangements is unknown as this would be dependent on future claims that may be made against the Funds. The risk of material loss from such claims is considered remote.
Shareholder Expense Example
As a shareholder of the Fund, you incur two types of costs: (1) transaction costs and (2) ongoing costs, including management fees and other Fund expenses. This Example is intended to help you understand your ongoing costs (in dollars) of investing in the Fund and to compare these costs with the ongoing costs of investing in other mutual funds.
The Example is based on an investment of $1,000 invested at the beginning of the period and held for the entire period (March 1, 2019 to August 31, 2019).
Actual Expenses
The first line of the accompanying table for each fund provides information about actual account values and actual expenses. You may use the information in this line, together with the amount you invested, to estimate the expenses that you paid over the period. Simply divide your account value by $1,000.00 (for example, an $8,600 account value divided by $1,000.00 = 8.6), then multiply the result by the number in the first line for a fund under the heading entitled "Expenses Paid During Period" to estimate the expenses you paid on your account during this period. In addition, each Fund, as a shareholder in the underlying Fidelity Central Funds, will indirectly bear its pro-rata share of the fees and expenses incurred by the underlying Fidelity Central Funds. These fees and expenses are not included in the Fund's annualized expense ratio used to calculate the expense estimate in the table below.
Hypothetical Example for Comparison Purposes
The second line of the accompanying table for each fund provides information about hypothetical account values and hypothetical expenses based on a fund's actual expense ratio and an assumed rate of return of 5% per year before expenses, which is not the Fund's actual return. The hypothetical account values and expenses may not be used to estimate the actual ending account balance or expenses you paid for the period. You may use this information to compare the ongoing costs of investing in the Fund and other funds. To do so, compare this 5% hypothetical example with the 5% hypothetical examples that appear in the shareholder reports of the other funds. In addition, each Fund, as a shareholder in the underlying Fidelity Central Funds, will indirectly bear its pro-rata share of the fees and expenses incurred by the underlying Fidelity Central Funds. These fees and expenses are not included in the Fund's annualized expense ratio used to calculate the expense estimate in the table below.
Please note that the expenses shown in the table are meant to highlight your ongoing costs only and do not reflect any transaction costs. Therefore, the second line of the table is useful in comparing ongoing costs only, and will not help you determine the relative total costs of owning different funds. In addition, if these transactional costs were included, your costs would have been higher.
| | Annualized Expense Ratio-A | Beginning
Account Value
March 1, 2019 | Ending
Account Value
August 31, 2019 | Expenses Paid
During Period-B
March 1, 2019
to August 31, 2019 |
| Energy Portfolio | .81% | | | |
| Actual | | $1,000.00 | $880.90 | $3.83 |
| Hypothetical-C | | $1,000.00 | $1,021.06 | $4.12 |
| Energy Service Portfolio | .90% | | | |
| Actual | | $1,000.00 | $689.60 | $3.82 |
| Hypothetical-C | | $1,000.00 | $1,020.61 | $4.57 |
| Natural Gas Portfolio | .93% | | | |
| Actual | | $1,000.00 | $828.40 | $4.27 |
| Hypothetical-C | | $1,000.00 | $1,020.46 | $4.72 |
| Natural Resources Portfolio | .84% | | | |
| Actual | | $1,000.00 | $960.00 | $4.14 |
| Hypothetical-C | | $1,000.00 | $1,020.91 | $4.27 |
A Annualized expense ratio reflects expenses net of applicable fee waivers.
B Expenses are equal to each Fund's annualized expense ratio, multiplied by the average account value over the period, multiplied by 184/ 366 (to reflect the one-half year period).
C 5% return per year before expenses
SELNR-SANN-1019
1.813654.114
Fidelity® Select Portfolios®
Health Care Sector Biotechnology Portfolio
Health Care Portfolio
Health Care Services Portfolio
Medical Technology and Devices Portfolio
Pharmaceuticals Portfolio
Semi-Annual Report August 31, 2019 |
|
Beginning on January 1, 2021, as permitted by regulations adopted by the Securities and Exchange Commission, paper copies of a fund’s shareholder reports will no longer be sent by mail, unless you specifically request paper copies of the reports from the fund or from your financial intermediary, such as a financial advisor, broker-dealer or bank. Instead, the reports will be made available on a website, and you will be notified by mail each time a report is posted and provided with a website link to access the report.
If you already elected to receive shareholder reports electronically, you will not be affected by this change and you need not take any action. You may elect to receive shareholder reports and other communications from a fund electronically, by contacting your financial intermediary. For Fidelity customers, visit Fidelity's web site or call Fidelity using the contact information listed below.
You may elect to receive all future reports in paper free of charge. If you wish to continue receiving paper copies of your shareholder reports, you may contact your financial intermediary or, if you are a Fidelity customer, visit Fidelity’s website, or call Fidelity at the applicable toll-free number listed below. Your election to receive reports in paper will apply to all funds held with the fund complex/your financial intermediary.
| Account Type | Website | Phone Number |
| Brokerage, Mutual Fund, or Annuity Contracts: | fidelity.com/mailpreferences | 1-800-343-3548 |
| Employer Provided Retirement Accounts: | netbenefits.fidelity.com/preferences (choose 'no' under Required Disclosures to continue to print) | 1-800-343-0860 |
| Advisor Sold Accounts Serviced Through Your Financial Intermediary: | Contact Your Financial Intermediary | Your Financial Intermediary's phone number |
| Advisor Sold Accounts Serviced by Fidelity: | institutional.fidelity.com | 1-877-208-0098 |
Contents
To view a fund's proxy voting guidelines and proxy voting record for the 12-month period ended June 30, visit http://www.fidelity.com/proxyvotingresults or visit the Securities and Exchange Commission's (SEC) web site at http://www.sec.gov.
You may also call 1-800-544-8544 to request a free copy of the proxy voting guidelines.
Standard & Poor's, S&P and S&P 500 are registered service marks of The McGraw-Hill Companies, Inc. and have been licensed for use by Fidelity Distributors Corporation.
Other third-party marks appearing herein are the property of their respective owners.
All other marks appearing herein are registered or unregistered trademarks or service marks of FMR LLC or an affiliated company. © 2019 FMR LLC. All rights reserved.
This report and the financial statements contained herein are submitted for the general information of the shareholders of the Funds. This report is not authorized for distribution to prospective investors in the Funds unless preceded or accompanied by an effective prospectus.
A fund files its complete schedule of portfolio holdings with the SEC for the first and third quarters of each fiscal year on Form N-PORT. Forms N-PORT are available on the SEC’s web site at http://www.sec.gov. A fund's Forms N-PORT may be reviewed and copied at the SEC’s Public Reference Room in Washington, DC. Information regarding the operation of the SEC's Public Reference Room may be obtained by calling 1-800-SEC-0330.
For a complete list of a fund's portfolio holdings, view the most recent holdings listing, semiannual report, or annual report on Fidelity's web site at http://www.fidelity.com, http://www.institutional.fidelity.com, or http://www.401k.com, as applicable.
NOT FDIC INSURED •MAY LOSE VALUE •NO BANK GUARANTEE
Neither the Funds nor Fidelity Distributors Corporation is a bank.
Biotechnology Portfolio
Investment Summary (Unaudited)
Top Ten Stocks as of August 31, 2019
| | % of fund's net assets |
| AbbVie, Inc. | 8.9 |
| Amgen, Inc. | 8.1 |
| Vertex Pharmaceuticals, Inc. | 4.8 |
| Gilead Sciences, Inc. | 3.6 |
| Alexion Pharmaceuticals, Inc. | 3.3 |
| Neurocrine Biosciences, Inc. | 2.4 |
| Sage Therapeutics, Inc. | 2.3 |
| Regeneron Pharmaceuticals, Inc. | 2.1 |
| Ionis Pharmaceuticals, Inc. | 1.9 |
| Alnylam Pharmaceuticals, Inc. | 1.9 |
| | 39.3 |
Top Industries (% of fund's net assets)
| As of August 31, 2019 |
| | Biotechnology | 89.2% |
| | Pharmaceuticals | 8.2% |
| | Health Care Equipment & Supplies | 1.0% |
| | Health Care Providers & Services | 0.5% |
| | Health Care Technology | 0.2% |
| | All Others* | 0.9% |

* Includes short-term investments and net other assets (liabilities).
Biotechnology Portfolio
Schedule of Investments August 31, 2019 (Unaudited)
Showing Percentage of Net Assets
| Common Stocks - 98.5% | | | |
| | | Shares | Value |
| Biotechnology - 88.6% | | | |
| Biotechnology - 88.6% | | | |
| AbbVie, Inc. | | 8,738,317 | $574,456,953 |
| AC Immune SA (a)(b) | | 141,432 | 738,275 |
| ACADIA Pharmaceuticals, Inc. (a)(b) | | 2,882,880 | 79,740,461 |
| Acceleron Pharma, Inc. (a) | | 1,609,458 | 72,280,759 |
| Acorda Therapeutics, Inc. (a) | | 2,235,418 | 7,220,400 |
| Agios Pharmaceuticals, Inc. (a)(b) | | 782,733 | 29,704,717 |
| Aimmune Therapeutics, Inc. (a)(b) | | 361,543 | 7,371,862 |
| Akebia Therapeutics, Inc. (a)(b) | | 131,868 | 544,615 |
| Albireo Pharma, Inc. (a) | | 420,100 | 10,271,445 |
| Alder Biopharmaceuticals, Inc. (a)(b) | | 477,748 | 4,275,845 |
| Aldeyra Therapeutics, Inc. (a)(c) | | 1,471,233 | 6,488,138 |
| Alector, Inc. (b) | | 676,718 | 11,138,778 |
| Alexion Pharmaceuticals, Inc. (a) | | 2,100,716 | 211,668,144 |
| Alkermes PLC (a) | | 386,874 | 8,116,617 |
| Allakos, Inc. (a)(b) | | 831,972 | 73,596,243 |
| Allena Pharmaceuticals, Inc. (a)(c) | | 28,440 | 118,595 |
| Allena Pharmaceuticals, Inc. (a)(c)(d) | | 1,447,443 | 6,035,837 |
| Allogene Therapeutics, Inc. (b) | | 131,766 | 3,587,988 |
| Alnylam Pharmaceuticals, Inc. (a) | | 1,485,678 | 119,879,358 |
| Amarin Corp. PLC ADR (a)(b) | | 701,531 | 10,515,950 |
| Amgen, Inc. | | 2,496,226 | 520,762,668 |
| Amicus Therapeutics, Inc. (a) | | 1,540,181 | 15,232,390 |
| AnaptysBio, Inc. (a) | | 465,116 | 18,906,965 |
| Anchiano Therapeutics Ltd. ADR | | 26,700 | 65,949 |
| Apellis Pharmaceuticals, Inc. (a) | | 373,134 | 10,858,199 |
| Applied Therapeutics, Inc. (a) | | 586,130 | 6,330,204 |
| Arcturus Therapeutics Holdings, Inc. (a) | | 200,000 | 2,246,000 |
| Arena Pharmaceuticals, Inc. (a) | | 890,473 | 47,097,117 |
| Argenx SE ADR (a) | | 892,486 | 117,317,285 |
| Arrowhead Pharmaceuticals, Inc. (a)(b) | | 1,354,722 | 46,290,851 |
| Ascendis Pharma A/S sponsored ADR (a) | | 649,309 | 72,742,087 |
| Assembly Biosciences, Inc. (a) | | 167,133 | 1,890,274 |
| Atara Biotherapeutics, Inc. (a) | | 906,043 | 12,231,581 |
| Atreca, Inc. | | 117,700 | 2,284,557 |
| aTyr Pharma, Inc. (b)(c) | | 262,046 | 770,415 |
| Audentes Therapeutics, Inc. (a) | | 207,814 | 6,463,015 |
| AVROBIO, Inc. (a) | | 51,280 | 998,934 |
| Axcella Health, Inc. | | 100,000 | 693,000 |
| Axcella Health, Inc. | | 891,570 | 5,869,651 |
| BioCryst Pharmaceuticals, Inc. (a) | | 1,788,541 | 5,347,738 |
| Biogen, Inc. (a) | | 514,644 | 113,093,019 |
| Biohaven Pharmaceutical Holding Co. Ltd. (a) | | 344,090 | 13,484,887 |
| BioMarin Pharmaceutical, Inc. (a) | | 539,071 | 40,462,669 |
| bluebird bio, Inc. (a)(b) | | 793,207 | 81,946,215 |
| Blueprint Medicines Corp. (a) | | 1,022,606 | 78,403,202 |
| Bridgebio Pharma, Inc. (b) | | 366,861 | 11,181,923 |
| ChemoCentryx, Inc. (a) | | 1,092,532 | 7,276,263 |
| Chimerix, Inc. (a) | | 1,849,867 | 3,736,731 |
| Clovis Oncology, Inc. (a)(b) | | 432,570 | 2,426,718 |
| Coherus BioSciences, Inc. (a)(b) | | 211,487 | 4,692,897 |
| Constellation Pharmaceuticals, Inc. (a)(b) | | 76,800 | 556,800 |
| Corbus Pharmaceuticals Holdings, Inc. (a)(b) | | 952,867 | 4,935,851 |
| Cortexyme, Inc. (b) | | 8,847 | 175,613 |
| Corvus Pharmaceuticals, Inc. (a)(b) | | 525,456 | 1,791,805 |
| Crinetics Pharmaceuticals, Inc. (a)(b) | | 990,700 | 15,712,502 |
| CRISPR Therapeutics AG (a)(b) | | 369,257 | 17,063,366 |
| Cytokinetics, Inc. (a) | | 506,890 | 7,121,805 |
| CytomX Therapeutics, Inc. (a) | | 74,681 | 655,699 |
| CytomX Therapeutics, Inc. (a)(d) | | 287,485 | 2,524,118 |
| Deciphera Pharmaceuticals, Inc. (a) | | 98,400 | 3,569,952 |
| Denali Therapeutics, Inc. (a)(b) | | 404,452 | 7,280,136 |
| Dicerna Pharmaceuticals, Inc. (a) | | 667,948 | 9,284,477 |
| Dynavax Technologies Corp. (a)(b) | | 558,498 | 2,312,182 |
| Eagle Pharmaceuticals, Inc. (a) | | 101,808 | 5,740,953 |
| Editas Medicine, Inc. (a)(b) | | 70,218 | 1,743,513 |
| Eidos Therapeutics, Inc. (a)(b) | | 118,947 | 4,973,174 |
| Emergent BioSolutions, Inc. (a) | | 132,750 | 5,814,450 |
| Enanta Pharmaceuticals, Inc. (a) | | 97,667 | 6,890,407 |
| Epizyme, Inc. (a) | | 2,634,746 | 34,172,656 |
| Equillium, Inc. (b) | | 619,843 | 2,386,396 |
| Esperion Therapeutics, Inc. (a) | | 221,784 | 8,126,166 |
| Evelo Biosciences, Inc. (a)(b) | | 55,800 | 306,342 |
| Exact Sciences Corp. (a) | | 981,100 | 116,966,742 |
| Exelixis, Inc. (a) | | 1,201,090 | 23,841,637 |
| Fate Therapeutics, Inc. (a) | | 1,018,487 | 16,621,708 |
| FibroGen, Inc. (a) | | 1,938,569 | 86,576,492 |
| Five Prime Therapeutics, Inc. (a) | | 182,700 | 992,061 |
| Forty Seven, Inc. (a) | | 140,800 | 1,067,264 |
| Galapagos Genomics NV sponsored ADR (a) | | 561,734 | 94,466,807 |
| Gamida Cell Ltd. (a) | | 700,400 | 2,591,480 |
| Genmab A/S (a) | | 60,383 | 12,343,472 |
| Genmab A/S ADR | | 281,690 | 5,740,842 |
| Genomic Health, Inc. (a) | | 28 | 2,146 |
| Geron Corp. (a)(b)(c) | | 15,536,850 | 21,751,590 |
| Gilead Sciences, Inc. | | 3,660,689 | 232,600,179 |
| Global Blood Therapeutics, Inc. (a)(b) | | 1,053,543 | 48,441,907 |
| Gossamer Bio, Inc. | | 95,714 | 2,006,165 |
| Gritstone Oncology, Inc. | | 1,248,800 | 12,637,856 |
| Halozyme Therapeutics, Inc. (a) | | 2,561,377 | 42,313,948 |
| Heron Therapeutics, Inc. (a)(b) | | 2,741,225 | 50,767,487 |
| Homology Medicines, Inc. (a) | | 136,867 | 2,588,155 |
| Immunomedics, Inc. (a)(b) | | 3,801,183 | 48,655,142 |
| Incyte Corp. (a) | | 1,183,685 | 96,849,107 |
| Insmed, Inc. (a) | | 1,085,945 | 17,852,936 |
| Intellia Therapeutics, Inc. (a)(b) | | 57,132 | 810,703 |
| Intercept Pharmaceuticals, Inc. (a)(b) | | 746,925 | 47,937,647 |
| Ionis Pharmaceuticals, Inc. (a) | | 1,965,477 | 124,237,801 |
| Iovance Biotherapeutics, Inc. (a) | | 1,643,707 | 34,534,284 |
| Ironwood Pharmaceuticals, Inc. Class A (a)(b) | | 2,925,820 | 27,239,384 |
| Jounce Therapeutics, Inc. (a) | | 737,774 | 2,781,408 |
| Kaleido Biosciences, Inc. (a)(b) | | 66,633 | 623,685 |
| Kalvista Pharmaceuticals, Inc. (a)(b) | | 151,196 | 2,361,682 |
| Karuna Therapeutics, Inc. (a)(b) | | 73,300 | 1,449,141 |
| Karyopharm Therapeutics, Inc. (a)(b) | | 953,300 | 8,236,512 |
| Kezar Life Sciences, Inc. (a) | | 820,472 | 2,773,195 |
| Krystal Biotech, Inc. (a)(c) | | 1,148,286 | 51,672,870 |
| Kura Oncology, Inc. (a) | | 2,096,963 | 31,831,898 |
| La Jolla Pharmaceutical Co. (a)(b)(c) | | 1,361,589 | 13,030,407 |
| Leap Therapeutics, Inc. (a)(b) | | 840,724 | 1,269,493 |
| Lexicon Pharmaceuticals, Inc. (a)(b) | | 824,004 | 1,087,685 |
| Ligand Pharmaceuticals, Inc. Class B (a)(b) | | 24,098 | 2,190,749 |
| Macrogenics, Inc. (a) | | 301,631 | 4,325,389 |
| Madrigal Pharmaceuticals, Inc. (a)(b) | | 34,241 | 3,174,141 |
| Magenta Therapeutics, Inc. (a) | | 40,712 | 420,555 |
| MannKind Corp. (a)(b) | | 1,402,861 | 1,543,147 |
| MediciNova, Inc. (a)(b) | | 96,484 | 835,551 |
| Minerva Neurosciences, Inc. (a)(c) | | 2,218,614 | 15,840,904 |
| Miragen Therapeutics, Inc. (a)(c) | | 2,888,656 | 3,321,954 |
| Mirati Therapeutics, Inc. (a)(b) | | 720,885 | 59,090,943 |
| Moderna, Inc. (b) | | 904,705 | 14,231,010 |
| Momenta Pharmaceuticals, Inc. (a) | | 1,315,656 | 16,616,735 |
| Morphosys AG (a) | | 141,175 | 16,679,526 |
| Morphosys AG sponsored ADR (a) | | 1,114,727 | 32,862,152 |
| Natera, Inc. (a) | | 721,231 | 23,764,561 |
| Neon Therapeutics, Inc. (a)(b) | | 407,398 | 1,095,901 |
| Neurocrine Biosciences, Inc. (a) | | 1,581,651 | 157,247,742 |
| Oragenics, Inc. (a) | | 155,806 | 62,089 |
| Pharming Group NV (a)(b) | | 19,512,456 | 26,613,450 |
| Portola Pharmaceuticals, Inc. (a)(b) | | 568,803 | 16,529,415 |
| Prevail Therapeutics, Inc. | | 999,800 | 11,317,736 |
| Principia Biopharma, Inc. | | 725,627 | 28,807,392 |
| ProQR Therapeutics BV (a)(b) | | 778,186 | 5,595,157 |
| Protagonist Therapeutics, Inc. (a) | | 608,963 | 7,934,788 |
| Prothena Corp. PLC (a) | | 685,651 | 5,766,325 |
| PTC Therapeutics, Inc. (a) | | 2,161,247 | 96,326,779 |
| Puma Biotechnology, Inc. (a)(b) | | 258,668 | 2,780,681 |
| Ra Pharmaceuticals, Inc. (a) | | 535,697 | 14,570,958 |
| Radius Health, Inc. (a) | | 794,921 | 22,496,264 |
| Regeneron Pharmaceuticals, Inc. (a) | | 463,890 | 134,551,295 |
| REGENXBIO, Inc. (a) | | 445,008 | 15,348,326 |
| Repligen Corp. (a) | | 296,386 | 27,507,585 |
| Replimune Group, Inc. (a) | | 428,010 | 4,442,744 |
| Retrophin, Inc. (a) | | 636,499 | 8,013,522 |
| Rigel Pharmaceuticals, Inc. (a) | | 904,339 | 1,528,333 |
| Rocket Pharmaceuticals, Inc. (a)(b) | | 1,359,736 | 14,753,136 |
| Rubius Therapeutics, Inc. (a) | | 51,000 | 473,280 |
| Sage Therapeutics, Inc. (a)(b) | | 844,793 | 145,025,614 |
| Sangamo Therapeutics, Inc. (a)(b) | | 2,563,821 | 27,945,649 |
| Sarepta Therapeutics, Inc. (a)(b) | | 999,404 | 90,096,271 |
| Scholar Rock Holding Corp. (a)(b)(c) | | 1,528,947 | 16,191,549 |
| Seattle Genetics, Inc. (a) | | 549,790 | 39,936,746 |
| Selecta Biosciences, Inc. (a)(b) | | 538,225 | 958,041 |
| Seres Therapeutics, Inc. (a)(b) | | 1,391,275 | 5,606,838 |
| Sienna Biopharmaceuticals, Inc. (a) | | 265,714 | 198,037 |
| Solid Biosciences, Inc. (a)(b) | | 317,997 | 2,569,416 |
| Spectrum Pharmaceuticals, Inc. (a) | | 2,061,703 | 15,132,900 |
| Stemline Therapeutics, Inc. (a) | | 682,698 | 8,130,933 |
| Stoke Therapeutics, Inc. | | 650,000 | 24,336,000 |
| Surface Oncology, Inc. (a) | | 44,796 | 92,280 |
| Synthorx, Inc. (b) | | 350,362 | 6,274,983 |
| Syros Pharmaceuticals, Inc. (a) | | 704,361 | 7,726,840 |
| Syros Pharmaceuticals, Inc. (a)(d) | | 303,621 | 3,330,722 |
| Syros Pharmaceuticals, Inc. warrants 10/10/22 (a)(e) | | 21,625 | 48,656 |
| TG Therapeutics, Inc. (a)(b) | | 1,835,037 | 11,395,580 |
| The Medicines Company (a)(b) | | 977,308 | 41,007,844 |
| Translate Bio, Inc. (a)(b) | | 1,522,497 | 13,824,273 |
| Twist Bioscience Corp. | | 624,631 | 18,133,038 |
| Ultragenyx Pharmaceutical, Inc. (a) | | 1,062,037 | 57,849,155 |
| uniQure B.V. (a) | | 296,462 | 16,083,064 |
| United Therapeutics Corp. (a) | | 51,625 | 4,262,160 |
| UNITY Biotechnology, Inc. (a)(b) | | 51,400 | 313,540 |
| Vanda Pharmaceuticals, Inc. (a) | | 490,192 | 6,906,805 |
| Verastem, Inc. (a)(b) | | 2,671,779 | 3,366,442 |
| Vertex Pharmaceuticals, Inc. (a) | | 1,726,327 | 310,773,387 |
| Viking Therapeutics, Inc. (a)(b) | | 637,500 | 4,430,625 |
| Voyager Therapeutics, Inc. (a) | | 484,129 | 8,651,385 |
| X4 Pharmaceuticals, Inc. (a)(c) | | 900,000 | 11,475,000 |
| X4 Pharmaceuticals, Inc. warrants 4/12/24 (a) | | 450,000 | 2,391,574 |
| Xencor, Inc. (a)(b) | | 1,158,643 | 43,194,211 |
| Y-mAbs Therapeutics, Inc. (b) | | 1,265,742 | 33,630,765 |
| Zafgen, Inc. (a) | | 779,646 | 643,208 |
| Zealand Pharma A/S (a) | | 205,144 | 3,915,683 |
| Zymeworks, Inc. (a) | | 659,195 | 17,560,955 |
| | | | 5,723,616,049 |
| Capital Markets - 0.0% | | | |
| Asset Management & Custody Banks - 0.0% | | | |
| Arix Bioscience PLC (a)(b)(d) | | 2,049,700 | 2,731,012 |
| Health Care Equipment & Supplies - 1.0% | | | |
| Health Care Equipment - 1.0% | | | |
| Novocure Ltd. (a)(d) | | 701,713 | 63,757,643 |
| Health Care Providers & Services - 0.5% | | | |
| Health Care Services - 0.5% | | | |
| G1 Therapeutics, Inc. (a) | | 789,800 | 28,669,740 |
| OptiNose, Inc. (a)(b) | | 162,115 | 1,241,801 |
| Precipio, Inc. (a)(f) | | 525 | 1,339 |
| | | | 29,912,880 |
| Life Sciences Tools & Services - 0.2% | | | |
| Life Sciences Tools & Services - 0.2% | | | |
| Bruker Corp. | | 192,600 | 8,314,542 |
| Evotec OAI AG (a) | | 170,687 | 3,772,506 |
| | | | 12,087,048 |
| Personal Products - 0.0% | | | |
| Personal Products - 0.0% | | | |
| MYOS Corp. (a) | | 33,334 | 50,668 |
| Pharmaceuticals - 8.2% | | | |
| Pharmaceuticals - 8.2% | | | |
| Adimab LLC (a)(e)(f)(g) | | 1,954,526 | 90,240,465 |
| Aerie Pharmaceuticals, Inc. (a)(b) | | 868,404 | 18,809,631 |
| Afferent Pharmaceuticals, Inc. rights 12/31/24 (a)(e) | | 8,274,568 | 12,825,580 |
| Aradigm Corp. (a) | | 148,009 | 28,122 |
| Aradigm Corp. (a) | | 11,945 | 2,270 |
| Arvinas Holding Co. LLC (a) | | 554,700 | 14,427,747 |
| Autolus Therapeutics Ltd. ADR (a)(b) | | 374,648 | 3,877,607 |
| BioXcel Therapeutics, Inc. (a) | | 706,789 | 6,933,600 |
| Cara Therapeutics, Inc. (a)(b) | | 2,286 | 53,584 |
| Chiasma, Inc. (a) | | 2,046,399 | 10,600,347 |
| Chiasma, Inc. warrants 12/16/24 (a) | | 382,683 | 593,196 |
| Corcept Therapeutics, Inc. (a)(b) | | 703,595 | 8,872,333 |
| Cyclerion Therapeutics, Inc. (a) | | 624,607 | 5,940,013 |
| Cyclerion Therapeutics, Inc. (f) | | 94,809 | 901,634 |
| Dova Pharmaceuticals, Inc. (a)(b) | | 810,164 | 12,144,358 |
| Fulcrum Therapeutics, Inc. (b) | | 35,500 | 388,725 |
| GW Pharmaceuticals PLC ADR (a)(b) | | 28,600 | 4,072,926 |
| Hookipa Pharma, Inc. (b) | | 300,000 | 2,532,000 |
| Horizon Pharma PLC (a) | | 744,719 | 20,576,586 |
| Idorsia Ltd. (a)(b) | | 432,921 | 12,159,842 |
| Intra-Cellular Therapies, Inc. (a)(b) | | 544,748 | 4,663,043 |
| Milestone Pharmaceuticals, Inc. (b) | | 239,600 | 5,510,800 |
| Morphic Holding, Inc. | | 531,518 | 9,833,083 |
| MyoKardia, Inc. (a) | | 1,045,501 | 56,216,589 |
| Nektar Therapeutics (a) | | 418,251 | 7,348,670 |
| NeurogesX, Inc. (a)(e) | | 2,550,000 | 26 |
| NGM Biopharmaceuticals, Inc. (b) | | 288,200 | 5,109,786 |
| ObsEva SA (a) | | 1,373,362 | 13,362,812 |
| Ocular Therapeutix, Inc. (a)(b) | | 497,053 | 2,132,357 |
| Odonate Therapeutics, Inc. (a)(b) | | 325,594 | 10,031,551 |
| Reata Pharmaceuticals, Inc. (a)(b) | | 36,697 | 2,829,339 |
| RedHill Biopharma Ltd. sponsored ADR (a) | | 93,300 | 712,812 |
| resTORbio, Inc. (a)(b) | | 307,512 | 2,958,265 |
| Rhythm Pharmaceuticals, Inc. (a)(b) | | 307,407 | 6,922,806 |
| RPI International Holdings LP (a)(e)(f) | | 54,958 | 8,716,888 |
| Spero Therapeutics, Inc. (a) | | 208,252 | 2,072,107 |
| Stemcentrx, Inc. rights 12/31/21 (a)(e) | | 876,163 | 9 |
| Sutro Biopharma, Inc. (a) | | 222,600 | 1,796,382 |
| TherapeuticsMD, Inc. (a)(b) | | 3,665,442 | 10,593,127 |
| Theravance Biopharma, Inc. (a) | | 354,600 | 7,811,838 |
| Trevi Therapeutics, Inc. (b) | | 792,700 | 3,931,792 |
| Tricida, Inc. (a)(b) | | 549,365 | 19,167,345 |
| Turning Point Therapeutics, Inc. (b) | | 390,916 | 21,316,649 |
| UroGen Pharma Ltd. (a)(b) | | 588,203 | 19,969,492 |
| Urovant Sciences Ltd. (a)(b)(c) | | 1,710,836 | 15,089,574 |
| Verrica Pharmaceuticals, Inc. (a)(b) | | 621,800 | 6,162,038 |
| WAVE Life Sciences (a)(b) | | 290,612 | 6,684,076 |
| Xeris Pharmaceuticals, Inc. (a) | | 819,896 | 9,502,595 |
| Zogenix, Inc. (a) | | 1,109,752 | 47,375,313 |
| | | | 533,801,730 |
| TOTAL COMMON STOCKS | | | |
| (Cost $4,717,320,635) | | | 6,365,957,030 |
|
| Preferred Stocks - 0.8% | | | |
| Convertible Preferred Stocks - 0.7% | | | |
| Biotechnology - 0.5% | | | |
| Biotechnology - 0.5% | | | |
| 23andMe, Inc. Series E (a)(e)(f) | | 1,505,457 | 20,489,270 |
| Immunocore Ltd. Series A (a)(e)(f) | | 73,318 | 8,685,811 |
| Nuvation Bio, Inc. Series A (e)(f)(h) | | 2,086,600 | 1,609,562 |
| | | | 30,784,643 |
| Health Care Technology - 0.2% | | | |
| Health Care Technology - 0.2% | | | |
| Codiak Biosciences, Inc.: | | | |
| Series A 8.00% (a)(e)(f) | | 856,366 | 3,108,609 |
| Series B 8.00% (a)(e)(f) | | 2,783,187 | 10,102,969 |
| | | | 13,211,578 |
| Pharmaceuticals - 0.0% | | | |
| Pharmaceuticals - 0.0% | | | |
| Afferent Pharmaceuticals, Inc. Series C (a)(e)(f) | | 8,274,568 | 83 |
|
| TOTAL CONVERTIBLE PREFERRED STOCKS | | | 43,996,304 |
|
| Nonconvertible Preferred Stocks - 0.1% | | | |
| Biotechnology - 0.1% | | | |
| Biotechnology - 0.1% | | | |
| Yumanity Holdings LLC Class A (a)(e)(f) | | 588,700 | 3,879,533 |
| TOTAL PREFERRED STOCKS | | | |
| (Cost $44,891,248) | | | 47,875,837 |
|
| Money Market Funds - 12.4% | | | |
| Fidelity Cash Central Fund 2.13% (i) | | 38,207,283 | 38,214,925 |
| Fidelity Securities Lending Cash Central Fund 2.13% (i)(j) | | 764,756,292 | 764,832,768 |
| TOTAL MONEY MARKET FUNDS | | | |
| (Cost $803,009,915) | | | 803,047,693 |
| TOTAL INVESTMENT IN SECURITIES - 111.7% | | | |
| (Cost $5,565,221,798) | | | 7,216,880,560 |
| NET OTHER ASSETS (LIABILITIES) - (11.7)% | | | (756,069,370) |
| NET ASSETS - 100% | | | $6,460,811,190 |
Legend
(a) Non-income producing
(b) Security or a portion of the security is on loan at period end.
(c) Affiliated company
(d) Security exempt from registration under Rule 144A of the Securities Act of 1933. These securities may be resold in transactions exempt from registration, normally to qualified institutional buyers. At the end of the period, the value of these securities amounted to $78,379,332 or 1.2% of net assets.
(e) Level 3 security
(f) Restricted securities - Investment in securities not registered under the Securities Act of 1933 (excluding 144A issues). At the end of the period, the value of restricted securities (excluding 144A issues) amounted to $147,736,162 or 2.3% of net assets.
(g) Investment is owned by a wholly-owned subsidiary (Subsidiary) that is treated as a corporation for U.S. tax purposes.
(h) Security or a portion of the security purchased on a delayed delivery or when-issued basis.
(i) Affiliated fund that is generally available only to investment companies and other accounts managed by Fidelity Investments. The rate quoted is the annualized seven-day yield of the fund at period end. A complete unaudited listing of the fund's holdings as of its most recent quarter end is available upon request. In addition, each Fidelity Central Fund's financial statements are available on the SEC's website or upon request.
(j) Investment made with cash collateral received from securities on loan.
Additional information on each restricted holding is as follows:
| Security | Acquisition Date | Acquisition Cost |
| 23andMe, Inc. Series E | 6/18/15 | $16,299,991 |
| Adimab LLC | 9/17/14 - 6/5/15 | $31,094,459 |
| Afferent Pharmaceuticals, Inc. Series C | 7/1/15 | $0 |
| Codiak Biosciences, Inc. Series A 8.00% | 11/12/15 | $856,366 |
| Codiak Biosciences, Inc. Series B 8.00% | 11/12/15 | $8,349,561 |
| Cyclerion Therapeutics, Inc. | 4/2/19 | $1,404,026 |
| Immunocore Ltd. Series A | 7/27/15 | $13,796,921 |
| Nuvation Bio, Inc. Series A | 6/17/19 | $1,609,562 |
| Precipio, Inc. | 2/3/12 | $2,828,200 |
| RPI International Holdings LP | 5/21/15 | $6,479,548 |
| Yumanity Holdings LLC Class A | 2/8/16 | $3,978,847 |
Affiliated Central Funds
Information regarding fiscal year to date income earned by the Fund from investments in Fidelity Central Funds is as follows:
| Fund | Income earned |
| Fidelity Cash Central Fund | $887,056 |
| Fidelity Securities Lending Cash Central Fund | 2,469,018 |
| Total | $3,356,074 |
Amounts in the income column in the above table include any capital gain distributions from underlying funds, which are presented in the corresponding line-item in the Statement of Operations, if applicable. Amount for Fidelity Securities Lending Cash Central Fund represents the income earned on investing cash collateral, less rebates paid to borrowers and any lending agent fees associated with the loan, plus any premium payments received for lending certain types of securities.
Other Affiliated Issuers
An affiliated company is a company in which the Fund has ownership of at least 5% of the voting securities. Fiscal year to date transactions with companies which are or were affiliates are as follows:
| Affiliate | Value, beginning of period | Purchases | Sales Proceeds | Dividend Income | Realized Gain (loss) | Change in Unrealized appreciation (depreciation) | Value, end of period |
| Aldeyra Therapeutics, Inc. | $15,316,715 | $-- | $2,806,142 | $-- | $(3,029,358) | $(2,993,077) | $6,488,138 |
| Allena Pharmaceuticals, Inc. | 302,085 | -- | 76,062 | -- | (111,538) | 4,110 | 118,595 |
| Allena Pharmaceuticals, Inc. | 10,450,538 | -- | -- | -- | -- | (4,414,701) | 6,035,837 |
| aTyr Pharma, Inc. | 465,786 | 1,055,153 | -- | -- | -- | (750,524) | 770,415 |
| BioXcel Therapeutics, Inc. | 7,133,758 | -- | 1,390,433 | -- | (88,583) | 1,278,858 | -- |
| Chiasma, Inc. | 6,554,922 | 8,452,825 | 7,732,393 | -- | (1,845,889) | 5,170,883 | -- |
| Geron Corp. | 22,683,801 | -- | -- | -- | -- | (932,211) | 21,751,590 |
| Krystal Biotech, Inc. | 27,623,544 | 13,780,000 | 14,279,321 | -- | 6,963,181 | 17,585,466 | 51,672,870 |
| Kura Oncology, Inc. | 29,861,469 | 14,937,860 | 9,417,571 | -- | (2,521,237) | (1,028,623) | -- |
| La Jolla Pharmaceutical Co. | 6,781,849 | 1,074,435 | -- | -- | -- | 5,174,123 | 13,030,407 |
| Minerva Neurosciences, Inc. | 22,014,584 | -- | 4,203,737 | -- | (818,315) | (1,151,628) | 15,840,904 |
| Miragen Therapeutics, Inc. | 8,088,237 | -- | -- | -- | -- | (4,766,283) | 3,321,954 |
| Scholar Rock Holding Corp. | 28,051,905 | 336,000 | -- | -- | -- | (12,196,356) | 16,191,549 |
| Seres Therapeutics, Inc. | 14,224,512 | 2,160,000 | 7,983,943 | -- | (36,752,171) | 33,958,441 | -- |
| Urovant Sciences Ltd. | 16,285,606 | 4,174,942 | -- | -- | -- | (5,370,974) | 15,089,574 |
| X4 Pharmaceuticals, Inc. | -- | 9,900,000 | -- | -- | -- | 1,575,000 | 11,475,000 |
| Total | $215,839,311 | $55,871,215 | $47,889,602 | $-- | $(38,203,910) | $31,142,504 | $161,786,833 |
Investment Valuation
The following is a summary of the inputs used, as of August 31, 2019, involving the Fund's assets and liabilities carried at fair value. The inputs or methodology used for valuing securities may not be an indication of the risk associated with investing in those securities. For more information on valuation inputs, and their aggregation into the levels used below, please refer to the Investment Valuation section in the accompanying Notes to Financial Statements.
| | Valuation Inputs at Reporting Date: |
| Description | Total | Level 1 | Level 2 | Level 3 |
| Investments in Securities: | | | | |
| Common Stocks | $6,365,957,030 | $6,232,927,513 | $21,197,893 | $111,831,624 |
| Preferred Stocks | 47,875,837 | -- | -- | 47,875,837 |
| Money Market Funds | 803,047,693 | 803,047,693 | -- | -- |
| Total Investments in Securities: | $7,216,880,560 | $7,035,975,206 | $21,197,893 | $159,707,461 |
The following is a reconciliation of Investments in Securities for which Level 3 inputs were used in determining value:
| Investments in Securities: | |
| Common Stocks | |
| Beginning Balance | $104,032,879 |
| Total Realized Gain (Loss) | (1,776,815) |
| Total Unrealized Gain (Loss) | 9,524,764 |
| Cost of Purchases | 50,796 |
| Proceeds of Sales | -- |
| Amortization/Accretion | -- |
| Transfers in to Level 3 | -- |
| Transfers out of Level 3 | -- |
| Ending Balance | $111,831,624 |
| The change in unrealized gain (loss) for the period attributable to Level 3 securities held at August 31, 2019 | $7,748,056 |
| Preferred Stocks | |
| Beginning Balance | $73,988,606 |
| Total Realized Gain (Loss) | -- |
| Total Unrealized Gain (Loss) | (11,168,229) |
| Cost of Purchases | 1,609,562 |
| Proceeds of Sales | (16,554,102) |
| Amortization/Accretion | -- |
| Transfers in to Level 3 | -- |
| Transfers out of Level 3 | -- |
| Ending Balance | $47,875,837 |
| The change in unrealized gain (loss) for the period attributable to Level 3 securities held at August 31, 2019 | $(9,378,154) |
The information used in the above reconciliations represents fiscal year to date activity for any Investments in Securities identified as using Level 3 inputs at either the beginning or the end of the current fiscal period. Transfers in or out of Level 3 represent the beginning value of any Security or Instrument where a change in the pricing level occurred from the beginning to the end of the period. The cost of purchases and the proceeds of sales may include securities received or delivered through corporate actions or exchanges. Realized and unrealized gains (losses) disclosed in the reconciliations are included in Net Gain (Loss) on the Fund's Statement of Operations.
Other Information
Distribution of investments by country or territory of incorporation, as a percentage of Total Net Assets, is as follows (Unaudited):
| United States of America | 89.7% |
| Netherlands | 2.6% |
| Denmark | 1.5% |
| Belgium | 1.5% |
| Bailiwick of Jersey | 1.0% |
| Others (Individually Less Than 1%) | 3.7% |
| | 100.0% |
See accompanying notes which are an integral part of the financial statements.
Biotechnology Portfolio
Financial Statements
Statement of Assets and Liabilities
| | | August 31, 2019 (Unaudited) |
| Assets | | |
Investment in securities, at value (including securities loaned of $738,048,576) — See accompanying schedule:
Unaffiliated issuers (cost $4,573,434,627) | $6,252,046,034 | |
| Fidelity Central Funds (cost $803,009,915) | 803,047,693 | |
| Other affiliated issuers (cost $188,777,256) | 161,786,833 | |
| Total Investment in Securities (cost $5,565,221,798) | | $7,216,880,560 |
| Cash | | 502,414 |
| Restricted cash | | 158,397 |
| Receivable for investments sold | | 16,712,646 |
| Receivable for fund shares sold | | 591,651 |
| Dividends receivable | | 2,972,418 |
| Distributions receivable from Fidelity Central Funds | | 699,904 |
| Prepaid expenses | | 76,802 |
| Other receivables | | 934,691 |
| Total assets | | 7,239,529,483 |
| Liabilities | | |
| Payable for investments purchased | | |
| Regular delivery | $1,998,719 | |
| Delayed delivery | 804,781 | |
| Payable for fund shares redeemed | 6,370,370 | |
| Accrued management fee | 2,943,765 | |
| Other affiliated payables | 1,033,980 | |
| Other payables and accrued expenses | 879,378 | |
| Collateral on securities loaned | 764,687,300 | |
| Total liabilities | | 778,718,293 |
| Net Assets | | $6,460,811,190 |
| Net Assets consist of: | | |
| Paid in capital | | $4,456,096,060 |
| Total distributable earnings (loss) | | 2,004,715,130 |
| Net Assets, for 333,949,420 shares outstanding | | $6,460,811,190 |
| Net Asset Value, offering price and redemption price per share ($6,460,811,190 ÷ 333,949,420 shares) | | $19.35 |
See accompanying notes which are an integral part of the financial statements.
Statement of Operations
| | | Six months ended August 31, 2019 (Unaudited) |
| Investment Income | | |
| Dividends | | $30,545,120 |
| Income from Fidelity Central Funds (including $2,469,018 from security lending) | | 3,356,074 |
| Total income | | 33,901,194 |
| Expenses | | |
| Management fee | $18,875,218 | |
| Transfer agent fees | 5,850,974 | |
| Accounting and security lending fees | 601,337 | |
| Custodian fees and expenses | 23,236 | |
| Independent trustees' fees and expenses | 19,788 | |
| Registration fees | 41,996 | |
| Audit | 37,525 | |
| Legal | 9,892 | |
| Miscellaneous | 35,610 | |
| Total expenses before reductions | 25,495,576 | |
| Expense reductions | (124,324) | |
| Total expenses after reductions | | 25,371,252 |
| Net investment income (loss) | | 8,529,942 |
| Realized and Unrealized Gain (Loss) | | |
| Net realized gain (loss) on: | | |
| Investment securities: | | |
| Unaffiliated issuers | 418,602,021 | |
| Fidelity Central Funds | 7,140 | |
| Other affiliated issuers | (38,215,361) | |
| Foreign currency transactions | (12,731) | |
| Total net realized gain (loss) | | 380,381,069 |
| Change in net unrealized appreciation (depreciation) on: | | |
| Investment securities: | | |
| Unaffiliated issuers | (792,891,395) | |
| Fidelity Central Funds | 1 | |
| Other affiliated issuers | 31,142,504 | |
| Assets and liabilities in foreign currencies | 34 | |
| Total change in net unrealized appreciation (depreciation) | | (761,748,856) |
| Net gain (loss) | | (381,367,787) |
| Net increase (decrease) in net assets resulting from operations | | $(372,837,845) |
See accompanying notes which are an integral part of the financial statements.
Statement of Changes in Net Assets
| | Six months ended August 31, 2019 (Unaudited) | Year ended February 28, 2019 |
| Increase (Decrease) in Net Assets | | |
| Operations | | |
| Net investment income (loss) | $8,529,942 | $(16,275,432) |
| Net realized gain (loss) | 380,381,069 | 723,982,765 |
| Change in net unrealized appreciation (depreciation) | (761,748,856) | (785,659,475) |
| Net increase (decrease) in net assets resulting from operations | (372,837,845) | (77,952,142) |
| Distributions to shareholders | (273,839,957) | (723,235,576) |
| Share transactions | | |
| Proceeds from sales of shares | 173,787,849 | 600,449,390 |
| Reinvestment of distributions | 257,966,700 | 680,697,509 |
| Cost of shares redeemed | (907,987,708) | (1,837,003,918) |
| Net increase (decrease) in net assets resulting from share transactions | (476,233,159) | (555,857,019) |
| Total increase (decrease) in net assets | (1,122,910,961) | (1,357,044,737) |
| Net Assets | | |
| Beginning of period | 7,583,722,151 | 8,940,766,888 |
| End of period | $6,460,811,190 | $7,583,722,151 |
| Other Information | | |
| Shares(a) | | |
| Sold | 8,570,665 | 27,380,941 |
| Issued in reinvestment of distributions | 12,099,751 | 34,822,262 |
| Redeemed | (45,445,056) | (84,784,313) |
| Net increase (decrease) | (24,774,640) | (22,581,110) |
(a) Share activity prior to August 10, 2018 has been adjusted to reflect the impact of the 10 for 1 share split that occurred on that date.
See accompanying notes which are an integral part of the financial statements.
Financial Highlights
Biotechnology Portfolio
| | Six months ended (Unaudited) August 31, | Years endedFebruary 28, | | | | |
| | 2019 | 2019 A | 2018 A | 2017 A | 2016 A,B | 2015 A |
| Selected Per–Share Data | | | | | | |
| Net asset value, beginning of period | $21.14 | $23.45 | $20.32 | $16.20 | $24.80 | $22.15 |
| Income from Investment Operations | | | | | | |
| Net investment income (loss)C | .02 | (.04) | (.05) | (.08) | (.10) | (.09) |
| Net realized and unrealized gain (loss) | (1.04) | (.29)D | 3.49 | 4.80 | (6.92) | 5.12 |
| Total from investment operations | (1.02) | (.33) | 3.44 | 4.72 | (7.02) | 5.03 |
| Distributions from net investment income | – | – | – | – | – | – |
| Distributions from net realized gain | (.77) | (1.98) | (.31) | (.60) | (1.58) | (2.38) |
| Total distributions | (.77) | (1.98) | (.31) | (.60) | (1.58) | (2.38) |
| Redemption fees added to paid in capitalC | – | – | – | –E | –E | –E |
| Net asset value, end of period | $19.35 | $21.14 | $23.45 | $20.32 | $16.20 | $24.80 |
| Total ReturnF,G | (5.15)% | (.46)%D | 17.04% | 29.67% | (30.35)% | 24.21% |
| Ratios to Average Net AssetsH,I | | | | | | |
| Expenses before reductions | .73%J | .72% | .74% | .75% | .73% | .74% |
| Expenses net of fee waivers, if any | .72%J | .72% | .74% | .75% | .73% | .74% |
| Expenses net of all reductions | .72%J | .72% | .73% | .74% | .73% | .74% |
| Net investment income (loss) | .24%J | (.20)% | (.25)% | (.43)% | (.39)% | (.41)% |
| Supplemental Data | | | | | | |
| Net assets, end of period (000 omitted) | $6,460,811 | $7,583,722 | $8,940,767 | $9,573,681 | $9,723,599 | $13,277,052 |
| Portfolio turnover rateK | 46%J | 37% | 26% | 28% | 35% | 61% |
A Per share amounts have been adjusted to reflect the impact of the 10 for 1 share split that occurred on August 10, 2018.
B For the year ended February 29.
C Calculated based on average shares outstanding during the period.
D Net realized and unrealized gain (loss) per share reflects proceeds received from litigation which amounted to $0.01 per share. Excluding these litigation proceeds, the total return would have been (0.53)%.
E Amount represents less than $.005 per share.
F Total returns for periods of less than one year are not annualized.
G Total returns would have been lower if certain expenses had not been reduced during the applicable periods shown.
H Fees and expenses of any underlying Fidelity Central Funds are not included in the Fund's expense ratio. The Fund indirectly bears its proportionate share of the expenses of any underlying Fidelity Central Funds.
I Expense ratios reflect operating expenses of the Fund. Expenses before reductions do not reflect amounts reimbursed by the investment adviser or reductions from brokerage service arrangements or reductions from other expense offset arrangements and do not represent the amount paid by the Fund during periods when reimbursements or reductions occur. Expenses net of fee waivers reflect expenses after reimbursement by the investment adviser but prior to reductions from brokerage service arrangements or other expense offset arrangements. Expenses net of all reductions represent the net expenses paid by the Fund.
J Annualized
K Amount does not include the portfolio activity of any underlying Fidelity Central Funds.
See accompanying notes which are an integral part of the financial statements.
Health Care Portfolio
Investment Summary (Unaudited)
Top Ten Stocks as of August 31, 2019
| | % of fund's net assets |
| UnitedHealth Group, Inc. | 8.2 |
| Boston Scientific Corp. | 7.3 |
| Roche Holding AG (participation certificate) | 5.6 |
| Becton, Dickinson & Co. | 5.4 |
| AstraZeneca PLC (United Kingdom) | 5.2 |
| Vertex Pharmaceuticals, Inc. | 4.7 |
| Stryker Corp. | 3.7 |
| Humana, Inc. | 3.5 |
| Cigna Corp. | 3.4 |
| Intuitive Surgical, Inc. | 2.5 |
| | 49.5 |
Top Industries (% of fund's net assets)
| As of August 31, 2019 |
| | Health Care Equipment & Supplies | 28.8% |
| | Biotechnology | 24.8% |
| | Health Care Providers & Services | 24.5% |
| | Pharmaceuticals | 17.8% |
| | Life Sciences Tools & Services | 2.0% |
| | All Others* | 2.1% |
* Includes short-term investments and net other assets (liabilities).
Health Care Portfolio
Schedule of Investments August 31, 2019 (Unaudited)
Showing Percentage of Net Assets
| Common Stocks - 96.2% | | | |
| | | Shares | Value |
| Biotechnology - 22.8% | | | |
| Biotechnology - 22.8% | | | |
| AbbVie, Inc. | | 690,000 | $45,360,600 |
| Acceleron Pharma, Inc. (a) | | 580,000 | 26,047,800 |
| Acorda Therapeutics, Inc. (a) | | 973,100 | 3,143,113 |
| Alexion Pharmaceuticals, Inc. (a) | | 1,600,000 | 161,216,000 |
| Allakos, Inc. (a)(b) | | 460,000 | 40,691,600 |
| Allogene Therapeutics, Inc. (b) | | 330,000 | 8,985,900 |
| Alnylam Pharmaceuticals, Inc. (a) | | 654,000 | 52,771,260 |
| Amgen, Inc. | | 470,000 | 98,051,400 |
| AnaptysBio, Inc. (a) | | 552,401 | 22,455,101 |
| Argenx SE ADR (a) | | 584,000 | 76,766,800 |
| Ascendis Pharma A/S sponsored ADR (a) | | 715,700 | 80,179,871 |
| BeiGene Ltd. ADR (a) | | 369,900 | 53,173,125 |
| bluebird bio, Inc. (a)(b) | | 336,000 | 34,712,160 |
| Blueprint Medicines Corp. (a) | | 866,500 | 66,434,555 |
| Cellectis SA sponsored ADR (a) | | 690,000 | 8,404,200 |
| FibroGen, Inc. (a) | | 970,000 | 43,320,200 |
| Gritstone Oncology, Inc. | | 486,600 | 4,924,392 |
| Immunomedics, Inc. (a)(b) | | 950,000 | 12,160,000 |
| Insmed, Inc. (a) | | 1,240,000 | 20,385,600 |
| Intercept Pharmaceuticals, Inc. (a) | | 340,600 | 21,859,708 |
| Kura Oncology, Inc. (a) | | 900,000 | 13,662,000 |
| Momenta Pharmaceuticals, Inc. (a) | | 486,600 | 6,145,758 |
| Morphosys AG (a) | | 194,600 | 22,991,577 |
| Morphosys AG sponsored ADR (a) | | 99 | 2,919 |
| Neurocrine Biosciences, Inc. (a) | | 600,000 | 59,652,000 |
| Principia Biopharma, Inc. | | 622,800 | 24,725,160 |
| Sage Therapeutics, Inc. (a) | | 81,279 | 13,953,166 |
| Sarepta Therapeutics, Inc. (a)(b) | | 1,080,000 | 97,362,000 |
| Scholar Rock Holding Corp. (a) | | 68,335 | 723,668 |
| The Medicines Company (a)(b) | | 700,000 | 29,372,000 |
| uniQure B.V. (a) | | 360,000 | 19,530,000 |
| Vertex Pharmaceuticals, Inc. (a) | | 1,800,000 | 324,036,000 |
| Viking Therapeutics, Inc. (a)(b) | | 1,160,000 | 8,062,000 |
| Xencor, Inc. (a) | | 1,196,900 | 44,620,432 |
| Zymeworks, Inc. (a) | | 775,770 | 20,666,513 |
| | | | 1,566,548,578 |
| Diversified Consumer Services - 0.2% | | | |
| Specialized Consumer Services - 0.2% | | | |
| Carriage Services, Inc. | | 634,300 | 13,491,561 |
| Health Care Equipment & Supplies - 28.8% | | | |
| Health Care Equipment - 28.6% | | | |
| Atricure, Inc. (a) | | 1,480,000 | 40,537,200 |
| Becton, Dickinson & Co. | | 1,460,000 | 370,723,200 |
| Boston Scientific Corp. (a) | | 11,700,000 | 499,941,000 |
| Danaher Corp. | | 778,500 | 110,617,065 |
| Genmark Diagnostics, Inc. (a) | | 2,465,300 | 14,767,147 |
| Hologic, Inc. (a) | | 1,740,000 | 85,903,800 |
| Insulet Corp. (a) | | 970,000 | 149,544,900 |
| Intuitive Surgical, Inc. (a) | | 340,000 | 173,855,600 |
| Masimo Corp. (a) | | 550,000 | 84,287,500 |
| Penumbra, Inc. (a) | | 680,000 | 98,974,000 |
| Shockwave Medical, Inc. | | 608,679 | 25,218,484 |
| Stryker Corp. | | 1,160,000 | 255,965,600 |
| Wright Medical Group NV (a) | | 2,600,000 | 54,210,000 |
| | | | 1,964,545,496 |
| Health Care Supplies - 0.2% | | | |
| Hoya Corp. | | 200,000 | 16,282,769 |
|
| TOTAL HEALTH CARE EQUIPMENT & SUPPLIES | | | 1,980,828,265 |
|
| Health Care Providers & Services - 24.2% | | | |
| Health Care Distributors & Services - 0.6% | | | |
| Covetrus, Inc. (a)(b) | | 600,000 | 7,974,000 |
| EBOS Group Ltd. | | 2,335,500 | 34,906,318 |
| | | | 42,880,318 |
| Health Care Facilities - 2.4% | | | |
| HCA Holdings, Inc. | | 1,357,900 | 163,219,580 |
| Health Care Services - 4.2% | | | |
| Cigna Corp. | | 1,540,000 | 237,113,800 |
| G1 Therapeutics, Inc. (a) | | 870,000 | 31,581,000 |
| Premier, Inc. (a) | | 600,000 | 21,156,000 |
| | | | 289,850,800 |
| Managed Health Care - 17.0% | | | |
| Centene Corp. (a) | | 2,500,000 | 116,550,000 |
| HealthEquity, Inc. (a) | | 550,000 | 32,648,000 |
| Humana, Inc. | | 840,000 | 237,896,400 |
| Molina Healthcare, Inc. (a) | | 600,000 | 78,168,000 |
| Notre Dame Intermedica Participacoes SA | | 3,800,000 | 51,461,966 |
| UnitedHealth Group, Inc. | | 2,400,000 | 561,599,997 |
| Wellcare Health Plans, Inc. (a) | | 320,000 | 86,636,800 |
| | | | 1,164,961,163 |
|
| TOTAL HEALTH CARE PROVIDERS & SERVICES | | | 1,660,911,861 |
|
| Health Care Technology - 0.2% | | | |
| Health Care Technology - 0.2% | | | |
| Castlight Health, Inc. (a) | | 1,849,450 | 2,607,725 |
| Castlight Health, Inc. Class B (a) | | 3,783,681 | 5,334,990 |
| Health Catalyst, Inc. (b) | | 140,000 | 5,580,400 |
| | | | 13,523,115 |
| Life Sciences Tools & Services - 2.0% | | | |
| Life Sciences Tools & Services - 2.0% | | | |
| Avantor, Inc. | | 2,600,000 | 45,500,000 |
| Bruker Corp. | | 771,516 | 33,306,346 |
| Lonza Group AG | | 159,600 | 56,406,244 |
| | | | 135,212,590 |
| Pharmaceuticals - 17.5% | | | |
| Pharmaceuticals - 17.5% | | | |
| Allergan PLC | | 400,000 | 63,888,000 |
| AstraZeneca PLC (United Kingdom) | | 4,000,000 | 357,285,897 |
| Bristol-Myers Squibb Co. | | 486,600 | 23,390,862 |
| Dechra Pharmaceuticals PLC | | 1,450,000 | 52,930,800 |
| Eli Lilly & Co. | | 1,460,000 | 164,936,200 |
| MyoKardia, Inc. (a) | | 520,121 | 27,966,906 |
| Recordati SpA | | 603,300 | 26,429,447 |
| Roche Holding AG (participation certificate) | | 1,400,000 | 382,564,364 |
| RPI International Holdings LP (a)(c)(d) | | 199,753 | 31,682,823 |
| Theravance Biopharma, Inc. (a)(b) | | 1,267,800 | 27,929,634 |
| Turning Point Therapeutics, Inc. | | 45,400 | 2,475,662 |
| Zogenix, Inc. (a) | | 876,613 | 37,422,609 |
| | | | 1,198,903,204 |
| Software - 0.5% | | | |
| Application Software - 0.5% | | | |
| Benefitfocus, Inc. (a)(b) | | 1,459,700 | 38,127,364 |
| TOTAL COMMON STOCKS | | | |
| (Cost $4,822,325,949) | | | 6,607,546,538 |
|
| Convertible Preferred Stocks - 3.0% | | | |
| Biotechnology - 2.0% | | | |
| Biotechnology - 2.0% | | | |
| 10X Genomics, Inc.: | | | |
| Series C (a)(d) | | 2,958,778 | 103,853,108 |
| Series D (a)(d) | | 60,000 | 2,106,000 |
| BioNTech AG: | | | |
| Series A (a)(c)(d) | | 78,748 | 24,801,079 |
| Series B (c) | | 12,276 | 3,866,232 |
| Generation Bio Series B (a)(c)(d) | | 130,800 | 1,188,972 |
| | | | 135,815,391 |
| Health Care Providers & Services - 0.3% | | | |
| Health Care Services - 0.3% | | | |
| 1Life Healthcare, Inc. Series G (a)(c)(d) | | 1,639,892 | 20,941,421 |
| Pharmaceuticals - 0.3% | | | |
| Pharmaceuticals - 0.3% | | | |
| Harmony Biosciences II, Inc.: | | | |
| Series A (a)(c)(d) | | 10,935,215 | 21,433,021 |
| Series C (c)(d) | | 1,845,926 | 3,618,015 |
| | | | 25,051,036 |
| Software - 0.4% | | | |
| Application Software - 0.4% | | | |
| Outset Medical, Inc. Series B (a)(c)(d) | | 8,159,125 | 25,374,879 |
| TOTAL CONVERTIBLE PREFERRED STOCKS | | | |
| (Cost $80,089,483) | | | 207,182,727 |
|
| Money Market Funds - 1.8% | | | |
| Fidelity Cash Central Fund 2.13% (e) | | 49,633,187 | 49,643,114 |
| Fidelity Securities Lending Cash Central Fund 2.13% (e)(f) | | 70,619,388 | 70,626,450 |
| TOTAL MONEY MARKET FUNDS | | | |
| (Cost $120,266,869) | | | 120,269,564 |
| TOTAL INVESTMENT IN SECURITIES - 101.0% | | | |
| (Cost $5,022,682,301) | | | 6,934,998,829 |
| NET OTHER ASSETS (LIABILITIES) - (1.0)% | | | (69,863,182) |
| NET ASSETS - 100% | | | $6,865,135,647 |
Legend
(a) Non-income producing
(b) Security or a portion of the security is on loan at period end.
(c) Level 3 security
(d) Restricted securities - Investment in securities not registered under the Securities Act of 1933 (excluding 144A issues). At the end of the period, the value of restricted securities (excluding 144A issues) amounted to $234,999,318 or 3.4% of net assets.
(e) Affiliated fund that is generally available only to investment companies and other accounts managed by Fidelity Investments. The rate quoted is the annualized seven-day yield of the fund at period end. A complete unaudited listing of the fund's holdings as of its most recent quarter end is available upon request. In addition, each Fidelity Central Fund's financial statements are available on the SEC's website or upon request.
(f) Investment made with cash collateral received from securities on loan.
Additional information on each restricted holding is as follows:
| Security | Acquisition Date | Acquisition Cost |
| 10X Genomics, Inc. Series C | 2/23/16 - 4/3/17 | $13,250,000 |
| 10X Genomics, Inc. Series D | 4/10/18 | $574,200 |
| 1Life Healthcare, Inc. Series G | 4/10/14 | $10,800,001 |
| BioNTech AG Series A | 12/29/17 | $17,246,491 |
| Generation Bio Series B | 2/21/18 | $1,196,258 |
| Harmony Biosciences II, Inc. Series A | 9/22/17 | $10,935,215 |
| Harmony Biosciences II, Inc. Series C | 8/9/19 | $3,618,015 |
| Outset Medical, Inc. Series B | 5/5/15 | $18,500,000 |
| RPI International Holdings LP | 5/21/15 - 3/23/16 | $26,504,031 |
Affiliated Central Funds
Information regarding fiscal year to date income earned by the Fund from investments in Fidelity Central Funds is as follows:
| Fund | Income earned |
| Fidelity Cash Central Fund | $497,854 |
| Fidelity Securities Lending Cash Central Fund | 613,227 |
| Total | $1,111,081 |
Amounts in the income column in the above table include any capital gain distributions from underlying funds, which are presented in the corresponding line-item in the Statement of Operations, if applicable. Amount for Fidelity Securities Lending Cash Central Fund represents the income earned on investing cash collateral, less rebates paid to borrowers and any lending agent fees associated with the loan, plus any premium payments received for lending certain types of securities.
Investment Valuation
The following is a summary of the inputs used, as of August 31, 2019, involving the Fund's assets and liabilities carried at fair value. The inputs or methodology used for valuing securities may not be an indication of the risk associated with investing in those securities. For more information on valuation inputs, and their aggregation into the levels used below, please refer to the Investment Valuation section in the accompanying Notes to Financial Statements.
| | Valuation Inputs at Reporting Date: |
| Description | Total | Level 1 | Level 2 | Level 3 |
| Investments in Securities: | | | | |
| Common Stocks | $6,607,546,538 | $5,810,794,970 | $765,068,745 | $31,682,823 |
| Convertible Preferred Stocks | 207,182,727 | -- | 105,959,108 | 101,223,619 |
| Money Market Funds | 120,269,564 | 120,269,564 | -- | -- |
| Total Investments in Securities: | $6,934,998,829 | $5,931,064,534 | $871,027,853 | $132,906,442 |
The following is a reconciliation of Investments in Securities for which Level 3 inputs were used in determining value:
| Investments in Securities: | |
| Convertible Preferred Stocks | |
| Beginning Balance | $119,050,694 |
| Total Realized Gain (Loss) | -- |
| Total Unrealized Gain (Loss) | 13,014,651 |
| Cost of Purchases | 7,587,318 |
| Proceeds of Sales | -- |
| Amortization/Accretion | -- |
| Transfers in to Level 3 | -- |
| Transfers out of Level 3 | (38,429,044) |
| Ending Balance | $101,223,619 |
| The change in unrealized gain (loss) for the period attributable to Level 3 securities held at August 31, 2019 | $13,014,651 |
| Other Investments in Securities | |
| Beginning Balance | $30,985,685 |
| Total Realized Gain (Loss) | -- |
| Total Unrealized Gain (Loss) | 697,138 |
| Cost of Purchases | -- |
| Proceeds of Sales | -- |
| Amortization/Accretion | -- |
| Transfers in to Level 3 | -- |
| Transfers out of Level 3 | -- |
| Ending Balance | $31,682,823 |
| The change in unrealized gain (loss) for the period attributable to Level 3 securities held at August 31, 2019 | $697,138 |
The information used in the above reconciliations represents fiscal year to date activity for any Investments in Securities identified as using Level 3 inputs at either the beginning or the end of the current fiscal period. Transfers in or out of Level 3 represent the beginning value of any Security or Instrument where a change in the pricing level occurred from the beginning to the end of the period. The cost of purchases and the proceeds of sales may include securities received or delivered through corporate actions or exchanges. Realized and unrealized gains (losses) disclosed in the reconciliations are included in Net Gain (Loss) on the Fund's Statement of Operations.
Other Information
Distribution of investments by country or territory of incorporation, as a percentage of Total Net Assets, is as follows (Unaudited):
| United States of America | 78.6% |
| Switzerland | 6.4% |
| United Kingdom | 6.0% |
| Netherlands | 2.2% |
| Cayman Islands | 1.7% |
| Denmark | 1.2% |
| Others (Individually Less Than 1%) | 3.9% |
| | 100.0% |
See accompanying notes which are an integral part of the financial statements.
Health Care Portfolio
Financial Statements
Statement of Assets and Liabilities
| | | August 31, 2019 (Unaudited) |
| Assets | | |
Investment in securities, at value (including securities loaned of $69,047,793) — See accompanying schedule:
Unaffiliated issuers (cost $4,902,415,432) | $6,814,729,265 | |
| Fidelity Central Funds (cost $120,266,869) | 120,269,564 | |
| Total Investment in Securities (cost $5,022,682,301) | | $6,934,998,829 |
| Receivable for investments sold | | 14,047,919 |
| Receivable for fund shares sold | | 2,839,081 |
| Dividends receivable | | 10,106,165 |
| Distributions receivable from Fidelity Central Funds | | 151,102 |
| Prepaid expenses | | 63,389 |
| Other receivables | | 614,598 |
| Total assets | | 6,962,821,083 |
| Liabilities | | |
| Payable for investments purchased | $15,930,965 | |
| Payable for fund shares redeemed | 6,364,915 | |
| Accrued management fee | 3,124,242 | |
| Other affiliated payables | 984,813 | |
| Other payables and accrued expenses | 676,053 | |
| Collateral on securities loaned | 70,604,448 | |
| Total liabilities | | 97,685,436 |
| Net Assets | | $6,865,135,647 |
| Net Assets consist of: | | |
| Paid in capital | | $4,837,563,622 |
| Total distributable earnings (loss) | | 2,027,572,025 |
| Net Assets, for 279,801,918 shares outstanding | | $6,865,135,647 |
| Net Asset Value, offering price and redemption price per share ($6,865,135,647 ÷ 279,801,918 shares) | | $24.54 |
See accompanying notes which are an integral part of the financial statements.
Statement of Operations
| | | Six months ended August 31, 2019 (Unaudited) |
| Investment Income | | |
| Dividends | | $32,426,454 |
| Income from Fidelity Central Funds (including $613,227 from security lending) | | 1,111,081 |
| Total income | | 33,537,535 |
| Expenses | | |
| Management fee | $19,095,158 | |
| Transfer agent fees | 5,388,222 | |
| Accounting and security lending fees | 588,634 | |
| Custodian fees and expenses | 90,677 | |
| Independent trustees' fees and expenses | 19,850 | |
| Registration fees | 69,075 | |
| Audit | 23,855 | |
| Legal | 8,933 | |
| Miscellaneous | 31,144 | |
| Total expenses before reductions | 25,315,548 | |
| Expense reductions | (81,590) | |
| Total expenses after reductions | | 25,233,958 |
| Net investment income (loss) | | 8,303,577 |
| Realized and Unrealized Gain (Loss) | | |
| Net realized gain (loss) on: | | |
| Investment securities: | | |
| Unaffiliated issuers | 154,848,403 | |
| Redemptions in-kind with affiliated entities | 52,017,323 | |
| Fidelity Central Funds | 2,027 | |
| Foreign currency transactions | 208,311 | |
| Total net realized gain (loss) | | 207,076,064 |
| Change in net unrealized appreciation (depreciation) on: | | |
| Investment securities: | | |
| Unaffiliated issuers | (209,137,082) | |
| Assets and liabilities in foreign currencies | 51,793 | |
| Total change in net unrealized appreciation (depreciation) | | (209,085,289) |
| Net gain (loss) | | (2,009,225) |
| Net increase (decrease) in net assets resulting from operations | | $6,294,352 |
See accompanying notes which are an integral part of the financial statements.
Statement of Changes in Net Assets
| | Six months ended August 31, 2019 (Unaudited) | Year ended February 28, 2019 |
| Increase (Decrease) in Net Assets | | |
| Operations | | |
| Net investment income (loss) | $8,303,577 | $7,100,479 |
| Net realized gain (loss) | 207,076,064 | 557,360,838 |
| Change in net unrealized appreciation (depreciation) | (209,085,289) | 276,169,757 |
| Net increase (decrease) in net assets resulting from operations | 6,294,352 | 840,631,074 |
| Distributions to shareholders | – | (587,162,015) |
| Share transactions | | |
| Proceeds from sales of shares | 358,241,633 | 1,445,029,108 |
| Reinvestment of distributions | – | 550,453,790 |
| Cost of shares redeemed | (950,107,437) | (1,721,649,295) |
| Net increase (decrease) in net assets resulting from share transactions | (591,865,804) | 273,833,603 |
| Total increase (decrease) in net assets | (585,571,452) | 527,302,662 |
| Net Assets | | |
| Beginning of period | 7,450,707,099 | 6,923,404,437 |
| End of period | $6,865,135,647 | $7,450,707,099 |
| Other Information | | |
| Shares(a) | | |
| Sold | 14,813,046 | 58,505,582 |
| Issued in reinvestment of distributions | – | 24,271,579 |
| Redeemed | (39,349,349) | (72,356,020) |
| Net increase (decrease) | (24,536,303) | 10,421,141 |
(a) Share activity prior to August 10, 2018 has been adjusted to reflect the impact of the 10 for 1 share split that occurred on that date.
See accompanying notes which are an integral part of the financial statements.
Financial Highlights
Health Care Portfolio
| | Six months ended (Unaudited) August 31, | Years endedFebruary 28, | | | | |
| | 2019 | 2019 A | 2018 A | 2017 A | 2016 A,B | 2015 A |
| Selected Per–Share Data | | | | | | |
| Net asset value, beginning of period | $24.48 | $23.56 | $20.89 | $18.05 | $23.64 | $21.69 |
| Income from Investment Operations | | | | | | |
| Net investment income (loss)C | .03 | .02 | .05 | .02 | (.01) | (.04) |
| Net realized and unrealized gain (loss) | .03 | 2.90 | 3.17 | 2.93 | (3.16) | 5.00 |
| Total from investment operations | .06 | 2.92 | 3.22 | 2.95 | (3.17) | 4.96 |
| Distributions from net investment income | – | (.03) | (.04) | (.02) | – | – |
| Distributions from net realized gain | – | (1.97) | (.51) | (.09) | (2.42) | (3.01) |
| Total distributions | – | (2.00) | (.55) | (.11) | (2.42) | (3.01) |
| Redemption fees added to paid in capitalC | – | – | – | –D | –D | –D |
| Net asset value, end of period | $24.54 | $24.48 | $23.56 | $20.89 | $18.05 | $23.64 |
| Total ReturnE,F | .25% | 13.30% | 15.49% | 16.43% | (14.90)% | 25.44% |
| Ratios to Average Net AssetsG,H | | | | | | |
| Expenses before reductions | .71%I | .71% | .73% | .74% | .73% | .74% |
| Expenses net of fee waivers, if any | .71%I | .71% | .73% | .73% | .73% | .74% |
| Expenses net of all reductions | .71%I | .71% | .72% | .73% | .72% | .74% |
| Net investment income (loss) | .23%I | .10% | .23% | .12% | (.03)% | (.18)% |
| Supplemental Data | | | | | | |
| Net assets, end of period (000 omitted) | $6,865,136 | $7,450,707 | $6,923,404 | $6,628,882 | $7,439,085 | $9,831,808 |
| Portfolio turnover rateJ | 34%I,K | 60%K | 75% | 49%K | 76% | 98%K |
A Per share amounts have been adjusted to reflect the impact of the 10 for 1 share split that occurred on August 10, 2018.
B For the year ended February 29.
C Calculated based on average shares outstanding during the period.
D Amount represents less than $.005 per share.
E Total returns for periods of less than one year are not annualized.
F Total returns would have been lower if certain expenses had not been reduced during the applicable periods shown.
G Fees and expenses of any underlying Fidelity Central Funds are not included in the Fund's expense ratio. The Fund indirectly bears its proportionate share of the expenses of any underlying Fidelity Central Funds.
H Expense ratios reflect operating expenses of the Fund. Expenses before reductions do not reflect amounts reimbursed by the investment adviser or reductions from brokerage service arrangements or reductions from other expense offset arrangements and do not represent the amount paid by the Fund during periods when reimbursements or reductions occur. Expenses net of fee waivers reflect expenses after reimbursement by the investment adviser but prior to reductions from brokerage service arrangements or other expense offset arrangements. Expenses net of all reductions represent the net expenses paid by the Fund.
I Annualized
J Amount does not include the portfolio activity of any underlying Fidelity Central Funds.
K Portfolio turnover rate excludes securities received or delivered in-kind.
See accompanying notes which are an integral part of the financial statements.
Health Care Services Portfolio
Investment Summary (Unaudited)
Top Ten Stocks as of August 31, 2019
| | % of fund's net assets |
| UnitedHealth Group, Inc. | 24.8 |
| Cigna Corp. | 10.2 |
| Humana, Inc. | 9.4 |
| HCA Holdings, Inc. | 5.7 |
| CVS Health Corp. | 4.9 |
| Wellcare Health Plans, Inc. | 4.9 |
| Centene Corp. | 4.8 |
| Anthem, Inc. | 4.1 |
| Chemed Corp. | 3.6 |
| Molina Healthcare, Inc. | 3.4 |
| | 75.8 |
Top Industries (% of fund's net assets)
| As of August 31, 2019 |
| | Health Care Providers & Services | 95.7% |
| | Diversified Consumer Services | 1.2% |
| | Insurance | 0.8% |
| | Health Care Technology | 0.5% |
| | Software | 0.3% |
| | All Others* | 1.5% |

* Includes short-term investments and net other assets (liabilities).
Health Care Services Portfolio
Schedule of Investments August 31, 2019 (Unaudited)
Showing Percentage of Net Assets
| Common Stocks - 98.5% | | | |
| | | Shares | Value |
| Diversified Consumer Services - 1.2% | | | |
| Specialized Consumer Services - 1.2% | | | |
| Service Corp. International | | 262,700 | $12,163,010 |
| Health Care Providers & Services - 95.7% | | | |
| Health Care Distributors & Services - 4.0% | | | |
| AmerisourceBergen Corp. | | 389,500 | 32,044,165 |
| Covetrus, Inc. (a)(b) | | 515,673 | 6,853,294 |
| | | | 38,897,459 |
| Health Care Facilities - 11.6% | | | |
| Brookdale Senior Living, Inc. (a) | | 1,775,900 | 14,526,862 |
| HCA Holdings, Inc. | | 472,300 | 56,770,460 |
| Surgery Partners, Inc. (a)(b) | | 947,000 | 6,098,680 |
| U.S. Physical Therapy, Inc. | | 76,400 | 10,200,928 |
| Universal Health Services, Inc. Class B | | 189,500 | 27,397,910 |
| | | | 114,994,840 |
| Health Care Services - 26.8% | | | |
| 1Life Healthcare, Inc. (a)(c)(d) | | 810,794 | 10,353,839 |
| Amedisys, Inc. (a) | | 142,600 | 18,354,046 |
| Chemed Corp. | | 83,700 | 35,943,291 |
| Cigna Corp. | | 652,472 | 100,461,114 |
| CVS Health Corp. | | 799,400 | 48,699,448 |
| Laboratory Corp. of America Holdings (a) | | 25,100 | 4,205,756 |
| LHC Group, Inc. (a) | | 241,844 | 28,658,514 |
| Quest Diagnostics, Inc. | | 179,000 | 18,324,230 |
| | | | 265,000,238 |
| Managed Health Care - 53.3% | | | |
| Anthem, Inc. | | 155,802 | 40,745,339 |
| Centene Corp. (a) | | 1,023,600 | 47,720,232 |
| HealthEquity, Inc. (a) | | 303,900 | 18,039,504 |
| Humana, Inc. | | 328,200 | 92,949,522 |
| Molina Healthcare, Inc. (a) | | 255,500 | 33,286,540 |
| Notre Dame Intermedica Participacoes SA | | 90,000 | 1,218,836 |
| UnitedHealth Group, Inc. | | 1,045,850 | 244,728,900 |
| Wellcare Health Plans, Inc. (a) | | 178,260 | 48,262,112 |
| | | | 526,950,985 |
|
| TOTAL HEALTH CARE PROVIDERS & SERVICES | | | 945,843,522 |
|
| Health Care Technology - 0.5% | | | |
| Health Care Technology - 0.5% | | | |
| Teladoc Health, Inc. (a)(b) | | 84,629 | 4,898,327 |
| Insurance - 0.8% | | | |
| Insurance Brokers - 0.8% | | | |
| eHealth, Inc. (a) | | 99,500 | 8,289,345 |
| Software - 0.3% | | | |
| Application Software - 0.3% | | | |
| Benefitfocus, Inc. (a) | | 90,500 | 2,363,860 |
| TOTAL COMMON STOCKS | | | |
| (Cost $668,344,599) | | | 973,558,064 |
|
| Money Market Funds - 2.0% | | | |
| Fidelity Cash Central Fund 2.13% (e) | | 8,448,461 | 8,450,151 |
| Fidelity Securities Lending Cash Central Fund 2.13% (e)(f) | | 11,549,676 | 11,550,831 |
| TOTAL MONEY MARKET FUNDS | | | |
| (Cost $20,000,982) | | | 20,000,982 |
| TOTAL INVESTMENT IN SECURITIES - 100.5% | | | |
| (Cost $688,345,581) | | | 993,559,046 |
| NET OTHER ASSETS (LIABILITIES) - (0.5)% | | | (5,142,785) |
| NET ASSETS - 100% | | | $988,416,261 |
Legend
(a) Non-income producing
(b) Security or a portion of the security is on loan at period end.
(c) Level 3 security
(d) Restricted securities - Investment in securities not registered under the Securities Act of 1933 (excluding 144A issues). At the end of the period, the value of restricted securities (excluding 144A issues) amounted to $10,353,839 or 1.0% of net assets.
(e) Affiliated fund that is generally available only to investment companies and other accounts managed by Fidelity Investments. The rate quoted is the annualized seven-day yield of the fund at period end. A complete unaudited listing of the fund's holdings as of its most recent quarter end is available upon request. In addition, each Fidelity Central Fund's financial statements are available on the SEC's website or upon request.
(f) Investment made with cash collateral received from securities on loan.
Additional information on each restricted holding is as follows:
| Security | Acquisition Date | Acquisition Cost |
| 1Life Healthcare, Inc. | 10/24/18 | $10,078,169 |
Affiliated Central Funds
Information regarding fiscal year to date income earned by the Fund from investments in Fidelity Central Funds is as follows:
| Fund | Income earned |
| Fidelity Cash Central Fund | $83,082 |
| Fidelity Securities Lending Cash Central Fund | 11,171 |
| Total | $94,253 |
Amounts in the income column in the above table include any capital gain distributions from underlying funds, which are presented in the corresponding line-item in the Statement of Operations, if applicable. Amount for Fidelity Securities Lending Cash Central Fund represents the income earned on investing cash collateral, less rebates paid to borrowers and any lending agent fees associated with the loan, plus any premium payments received for lending certain types of securities.
Investment Valuation
The following is a summary of the inputs used, as of August 31, 2019, involving the Fund's assets and liabilities carried at fair value. The inputs or methodology used for valuing securities may not be an indication of the risk associated with investing in those securities. For more information on valuation inputs, and their aggregation into the levels used below, please refer to the Investment Valuation section in the accompanying Notes to Financial Statements.
| | Valuation Inputs at Reporting Date: |
| Description | Total | Level 1 | Level 2 | Level 3 |
| Investments in Securities: | | | | |
| Common Stocks | $973,558,064 | $963,204,225 | $-- | $10,353,839 |
| Money Market Funds | 20,000,982 | 20,000,982 | -- | -- |
| Total Investments in Securities: | $993,559,046 | $983,205,207 | $-- | $10,353,839 |
The following is a reconciliation of Investments in Securities for which Level 3 inputs were used in determining value:
| Investments in Securities: | |
| Common Stocks | |
| Beginning Balance | $10,078,169 |
| Total Realized Gain (Loss) | -- |
| Total Unrealized Gain (Loss) | 275,670 |
| Cost of Purchases | -- |
| Proceeds of Sales | -- |
| Amortization/Accretion | -- |
| Transfers in to Level 3 | -- |
| Transfers out of Level 3 | -- |
| Ending Balance | $10,353,839 |
| The change in unrealized gain (loss) for the period attributable to Level 3 securities held at August 31, 2019 | $275,670 |
The information used in the above reconciliations represents fiscal year to date activity for any Investments in Securities identified as using Level 3 inputs at either the beginning or the end of the current fiscal period. Transfers in or out of Level 3 represent the beginning value of any Security or Instrument where a change in the pricing level occurred from the beginning to the end of the period. The cost of purchases and the proceeds of sales may include securities received or delivered through corporate actions or exchanges. Realized and unrealized gains (losses) disclosed in the reconciliations are included in Net Gain (Loss) on the Fund's Statement of Operations.
See accompanying notes which are an integral part of the financial statements.
Health Care Services Portfolio
Financial Statements
Statement of Assets and Liabilities
| | | August 31, 2019 (Unaudited) |
| Assets | | |
Investment in securities, at value (including securities loaned of $11,400,198) — See accompanying schedule:
Unaffiliated issuers (cost $668,344,599) | $973,558,064 | |
| Fidelity Central Funds (cost $20,000,982) | 20,000,982 | |
| Total Investment in Securities (cost $688,345,581) | | $993,559,046 |
| Receivable for investments sold | | 8,305,267 |
| Receivable for fund shares sold | | 291,319 |
| Dividends receivable | | 452,541 |
| Distributions receivable from Fidelity Central Funds | | 18,473 |
| Prepaid expenses | | 8,123 |
| Other receivables | | 70,611 |
| Total assets | | 1,002,705,380 |
| Liabilities | | |
| Payable for fund shares redeemed | $2,008,722 | |
| Accrued management fee | 459,089 | |
| Other affiliated payables | 182,675 | |
| Other payables and accrued expenses | 88,868 | |
| Collateral on securities loaned | 11,549,765 | |
| Total liabilities | | 14,289,119 |
| Net Assets | | $988,416,261 |
| Net Assets consist of: | | |
| Paid in capital | | $752,740,211 |
| Total distributable earnings (loss) | | 235,676,050 |
| Net Assets, for 11,366,106 shares outstanding | | $988,416,261 |
| Net Asset Value, offering price and redemption price per share ($988,416,261 ÷ 11,366,106 shares) | | $86.96 |
See accompanying notes which are an integral part of the financial statements.
Statement of Operations
| | | Six months ended August 31, 2019 (Unaudited) |
| Investment Income | | |
| Dividends | | $5,858,510 |
| Income from Fidelity Central Funds (including $11,171 from security lending) | | 94,253 |
| Total income | | 5,952,763 |
| Expenses | | |
| Management fee | $2,964,754 | |
| Transfer agent fees | 980,421 | |
| Accounting and security lending fees | 181,267 | |
| Custodian fees and expenses | 7,865 | |
| Independent trustees' fees and expenses | 3,304 | |
| Registration fees | 38,676 | |
| Audit | 19,001 | |
| Legal | 1,277 | |
| Interest | 1,579 | |
| Miscellaneous | 4,458 | |
| Total expenses before reductions | 4,202,602 | |
| Expense reductions | (15,714) | |
| Total expenses after reductions | | 4,186,888 |
| Net investment income (loss) | | 1,765,875 |
| Realized and Unrealized Gain (Loss) | | |
| Net realized gain (loss) on: | | |
| Investment securities: | | |
| Unaffiliated issuers | (36,108,202) | |
| Fidelity Central Funds | 161 | |
| Foreign currency transactions | 14,656 | |
| Total net realized gain (loss) | | (36,093,385) |
| Change in net unrealized appreciation (depreciation) on: | | |
| Investment securities: | | |
| Unaffiliated issuers | (2,825,164) | |
| Assets and liabilities in foreign currencies | (179) | |
| Total change in net unrealized appreciation (depreciation) | | (2,825,343) |
| Net gain (loss) | | (38,918,728) |
| Net increase (decrease) in net assets resulting from operations | | $(37,152,853) |
See accompanying notes which are an integral part of the financial statements.
Statement of Changes in Net Assets
| | Six months ended August 31, 2019 (Unaudited) | Year ended February 28, 2019 |
| Increase (Decrease) in Net Assets | | |
| Operations | | |
| Net investment income (loss) | $1,765,875 | $1,468,668 |
| Net realized gain (loss) | (36,093,385) | 62,070,916 |
| Change in net unrealized appreciation (depreciation) | (2,825,343) | (28,936,165) |
| Net increase (decrease) in net assets resulting from operations | (37,152,853) | 34,603,419 |
| Distributions to shareholders | – | (130,842,102) |
| Share transactions | | |
| Proceeds from sales of shares | 95,009,634 | 924,676,252 |
| Reinvestment of distributions | – | 124,342,856 |
| Cost of shares redeemed | (412,510,474) | (439,402,544) |
| Net increase (decrease) in net assets resulting from share transactions | (317,500,840) | 609,616,564 |
| Total increase (decrease) in net assets | (354,653,693) | 513,377,881 |
| Net Assets | | |
| Beginning of period | 1,343,069,954 | 829,692,073 |
| End of period | $988,416,261 | $1,343,069,954 |
| Other Information | | |
| Shares | | |
| Sold | 1,097,960 | 9,355,084 |
| Issued in reinvestment of distributions | – | 1,381,139 |
| Redeemed | (4,775,655) | (4,690,557) |
| Net increase (decrease) | (3,677,695) | 6,045,666 |
See accompanying notes which are an integral part of the financial statements.
Financial Highlights
Health Care Services Portfolio
| | Six months ended (Unaudited) August 31, | Years endedFebruary 28, | | | | |
| | 2019 | 2019 | 2018 | 2017 | 2016 A | 2015 |
| Selected Per–Share Data | | | | | | |
| Net asset value, beginning of period | $89.28 | $92.21 | $89.93 | $78.59 | $87.26 | $75.55 |
| Income from Investment Operations | | | | | | |
| Net investment income (loss)B | .14 | .13 | .11 | .12 | (.03) | (.09) |
| Net realized and unrealized gain (loss) | (2.46) | 8.27 | 14.23 | 15.03 | (5.21) | 19.25 |
| Total from investment operations | (2.32) | 8.40 | 14.34 | 15.15 | (5.24) | 19.16 |
| Distributions from net investment income | – | (.10) | (.10) | (.13) | (.02) | – |
| Distributions from net realized gain | – | (11.23) | (11.96) | (3.68) | (3.41) | (7.45) |
| Total distributions | – | (11.33) | (12.06) | (3.81) | (3.43) | (7.45) |
| Redemption fees added to paid in capitalB | – | – | –C | –C | –C | –C |
| Net asset value, end of period | $86.96 | $89.28 | $92.21 | $89.93 | $78.59 | $87.26 |
| Total ReturnD,E | (2.60)% | 9.61% | 17.03% | 19.71% | (6.30)% | 26.88% |
| Ratios to Average Net AssetsF,G | | | | | | |
| Expenses before reductions | .76%H | .76% | .77% | .78% | .77% | .79% |
| Expenses net of fee waivers, if any | .76%H | .76% | .77% | .78% | .77% | .79% |
| Expenses net of all reductions | .76%H | .76% | .76% | .78% | .77% | .79% |
| Net investment income (loss) | .32%H | .14% | .12% | .15% | (.03)% | (.12)% |
| Supplemental Data | | | | | | |
| Net assets, end of period (000 omitted) | $988,416 | $1,343,070 | $829,692 | $760,108 | $837,518 | $878,416 |
| Portfolio turnover rateI | 35%H | 60% | 65% | 26% | 39% | 44% |
A For the year ended February 29.
B Calculated based on average shares outstanding during the period.
C Amount represents less than $.005 per share.
D Total returns for periods of less than one year are not annualized.
E Total returns would have been lower if certain expenses had not been reduced during the applicable periods shown.
F Fees and expenses of any underlying Fidelity Central Funds are not included in the Fund's expense ratio. The Fund indirectly bears its proportionate share of the expenses of any underlying Fidelity Central Funds.
G Expense ratios reflect operating expenses of the Fund. Expenses before reductions do not reflect amounts reimbursed by the investment adviser or reductions from brokerage service arrangements or reductions from other expense offset arrangements and do not represent the amount paid by the Fund during periods when reimbursements or reductions occur. Expenses net of fee waivers reflect expenses after reimbursement by the investment adviser but prior to reductions from brokerage service arrangements or other expense offset arrangements. Expenses net of all reductions represent the net expenses paid by the Fund.
H Annualized
I Amount does not include the portfolio activity of any underlying Fidelity Central Funds.
See accompanying notes which are an integral part of the financial statements.
Medical Technology and Devices Portfolio
Investment Summary (Unaudited)
Top Ten Stocks as of August 31, 2019
| | % of fund's net assets |
| Boston Scientific Corp. | 10.9 |
| Becton, Dickinson & Co. | 9.8 |
| Thermo Fisher Scientific, Inc. | 8.8 |
| Stryker Corp. | 8.5 |
| Intuitive Surgical, Inc. | 5.8 |
| Danaher Corp. | 5.4 |
| Medtronic PLC | 3.7 |
| Abbott Laboratories | 3.4 |
| Hologic, Inc. | 3.3 |
| Insulet Corp. | 2.8 |
| | 62.4 |
Top Industries (% of fund's net assets)
| As of August 31, 2019 |
| | Health Care Equipment & Supplies | 74.6% |
| | Life Sciences Tools & Services | 14.2% |
| | Health Care Providers & Services | 7.3% |
| | Biotechnology | 1.5% |
| | Health Care Technology | 0.8% |
| | All Others* | 1.6% |

* Includes short-term investments and net other assets (liabilities).
Medical Technology and Devices Portfolio
Schedule of Investments August 31, 2019 (Unaudited)
Showing Percentage of Net Assets
| Common Stocks - 99.2% | | | |
| | | Shares | Value |
| Biotechnology - 1.3% | | | |
| Biotechnology - 1.3% | | | |
| Calyxt, Inc. (a) | | 702,582 | $4,348,983 |
| Natera, Inc. (a) | | 1,500,000 | 49,425,000 |
| Polarityte, Inc. (a)(b) | | 600,000 | 2,226,000 |
| Sarepta Therapeutics, Inc. (a) | | 300,000 | 27,045,000 |
| | | | 83,044,983 |
| Health Care Equipment & Supplies - 74.6% | | | |
| Health Care Equipment - 70.7% | | | |
| Abbott Laboratories | | 2,580,000 | 220,125,600 |
| Atricure, Inc. (a)(c) | | 2,240,000 | 61,353,600 |
| Becton, Dickinson & Co. | | 2,500,000 | 634,800,000 |
| Boston Scientific Corp. (a) | | 16,600,000 | 709,317,998 |
| Danaher Corp. | | 2,460,000 | 349,541,400 |
| DexCom, Inc. (a) | | 580,000 | 99,533,800 |
| Edwards Lifesciences Corp. (a) | | 64,000 | 14,197,760 |
| Fisher & Paykel Healthcare Corp. | | 5,000,000 | 52,455,825 |
| Genmark Diagnostics, Inc. (a) | | 2,185,617 | 13,091,846 |
| Hologic, Inc. (a) | | 4,280,000 | 211,303,600 |
| IDEXX Laboratories, Inc. (a) | | 200,000 | 57,948,000 |
| Insulet Corp. (a) | | 1,200,000 | 185,004,000 |
| Integra LifeSciences Holdings Corp. (a) | | 300,000 | 18,006,000 |
| Intuitive Surgical, Inc. (a) | | 740,000 | 378,391,600 |
| Masimo Corp. (a) | | 1,200,000 | 183,900,000 |
| Medtronic PLC | | 2,200,000 | 237,358,000 |
| Penumbra, Inc. (a)(b) | | 1,003,900 | 146,117,645 |
| ResMed, Inc. | | 800,000 | 111,440,000 |
| Shockwave Medical, Inc. | | 608,679 | 25,218,484 |
| Smith & Nephew PLC sponsored ADR | | 1,200,000 | 57,552,000 |
| Stryker Corp. | | 2,500,000 | 551,650,000 |
| Teleflex, Inc. | | 188,000 | 68,416,960 |
| Varian Medical Systems, Inc. (a) | | 900,000 | 95,337,000 |
| Wright Medical Group NV (a)(b) | | 5,000,000 | 104,250,000 |
| | | | 4,586,311,118 |
| Health Care Supplies - 3.9% | | | |
| Align Technology, Inc. (a) | | 60,000 | 10,986,600 |
| Haemonetics Corp. (a) | | 200,000 | 26,706,000 |
| Hoya Corp. | | 296,369 | 24,128,540 |
| ICU Medical, Inc. (a) | | 280,000 | 45,290,000 |
| Nanosonics Ltd. (a)(c) | | 20,000,000 | 89,838,230 |
| Quotient Ltd. (a)(b) | | 1,500,000 | 13,530,000 |
| STERIS PLC | | 260,000 | 40,144,000 |
| | | | 250,623,370 |
|
| TOTAL HEALTH CARE EQUIPMENT & SUPPLIES | | | 4,836,934,488 |
|
| Health Care Providers & Services - 7.2% | | | |
| Health Care Distributors & Services - 0.2% | | | |
| Covetrus, Inc. (a)(b) | | 1,000,000 | 13,290,000 |
| Health Care Facilities - 1.3% | | | |
| HCA Holdings, Inc. | | 700,000 | 84,140,000 |
| Health Care Services - 1.3% | | | |
| 1Life Healthcare, Inc. (a)(d)(e) | | 606,058 | 7,739,361 |
| Cigna Corp. | | 500,000 | 76,985,000 |
| | | | 84,724,361 |
| Managed Health Care - 4.4% | | | |
| HealthEquity, Inc. (a)(b) | | 650,000 | 38,584,000 |
| Humana, Inc. | | 280,000 | 79,298,800 |
| UnitedHealth Group, Inc. | | 720,000 | 168,480,000 |
| | | | 286,362,800 |
|
| TOTAL HEALTH CARE PROVIDERS & SERVICES | | | 468,517,161 |
|
| Health Care Technology - 0.8% | | | |
| Health Care Technology - 0.8% | | | |
| Castlight Health, Inc. (a) | | 985,400 | 1,389,414 |
| Castlight Health, Inc. Class B (a) | | 5,000,000 | 7,050,000 |
| Health Catalyst, Inc. (b) | | 129,625 | 5,166,853 |
| HTG Molecular Diagnostics (a)(b)(c) | | 2,392,976 | 2,225,468 |
| Veeva Systems, Inc. Class A (a) | | 210,000 | 33,679,800 |
| | | | 49,511,535 |
| Insurance - 0.6% | | | |
| Insurance Brokers - 0.6% | | | |
| eHealth, Inc. (a) | | 460,000 | 38,322,600 |
| Life Sciences Tools & Services - 14.2% | | | |
| Life Sciences Tools & Services - 14.2% | | | |
| Avantor, Inc. | | 3,600,000 | 63,000,000 |
| Bio-Rad Laboratories, Inc. Class A (a) | | 80,000 | 27,016,800 |
| Bruker Corp. | | 2,586,836 | 111,673,710 |
| Lonza Group AG | | 340,000 | 120,163,678 |
| Nanostring Technologies, Inc. (a) | | 520,000 | 13,249,600 |
| PerkinElmer, Inc. | | 180,000 | 14,886,000 |
| Thermo Fisher Scientific, Inc. | | 2,000,000 | 574,120,000 |
| | | | 924,109,788 |
| Software - 0.5% | | | |
| Application Software - 0.5% | | | |
| Benefitfocus, Inc. (a) | | 1,290,000 | 33,694,800 |
| TOTAL COMMON STOCKS | | | |
| (Cost $4,487,590,723) | | | 6,434,135,355 |
|
| Convertible Preferred Stocks - 0.5% | | | |
| Biotechnology - 0.2% | | | |
| Biotechnology - 0.2% | | | |
| 10X Genomics, Inc. Series D1 0.00 (e) | | 392,772 | 13,786,297 |
| Health Care Providers & Services - 0.1% | | | |
| Health Care Services - 0.1% | | | |
| 1Life Healthcare, Inc. Series G (a)(d)(e) | | 455,526 | 5,817,067 |
| Software - 0.2% | | | |
| Application Software - 0.2% | | | |
| Outset Medical, Inc.: | | | |
| Series B (a)(d)(e) | | 3,307,754 | 10,287,115 |
| Series D (d)(e) | | 1,607,717 | 5,000,000 |
| | | | 15,287,115 |
| TOTAL CONVERTIBLE PREFERRED STOCKS | | | |
| (Cost $20,499,992) | | | 34,890,479 |
|
| Money Market Funds - 1.7% | | | |
| Fidelity Cash Central Fund 2.13% (f) | | 18,669,459 | 18,673,193 |
| Fidelity Securities Lending Cash Central Fund 2.13% (f)(g) | | 91,423,154 | 91,432,296 |
| TOTAL MONEY MARKET FUNDS | | | |
| (Cost $110,103,169) | | | 110,105,489 |
| TOTAL INVESTMENT IN SECURITIES - 101.4% | | | |
| (Cost $4,618,193,884) | | | 6,579,131,323 |
| NET OTHER ASSETS (LIABILITIES) - (1.4)% | | | (90,744,067) |
| NET ASSETS - 100% | | | $6,488,387,256 |
Legend
(a) Non-income producing
(b) Security or a portion of the security is on loan at period end.
(c) Affiliated company
(d) Level 3 security
(e) Restricted securities - Investment in securities not registered under the Securities Act of 1933 (excluding 144A issues). At the end of the period, the value of restricted securities (excluding 144A issues) amounted to $42,629,840 or 0.7% of net assets.
(f) Affiliated fund that is generally available only to investment companies and other accounts managed by Fidelity Investments. The rate quoted is the annualized seven-day yield of the fund at period end. A complete unaudited listing of the fund's holdings as of its most recent quarter end is available upon request. In addition, each Fidelity Central Fund's financial statements are available on the SEC's website or upon request.
(g) Investment made with cash collateral received from securities on loan.
Additional information on each restricted holding is as follows:
| Security | Acquisition Date | Acquisition Cost |
| 10X Genomics, Inc. Series D1 0.00 | 10/18/18 | $4,999,988 |
| 1Life Healthcare, Inc. | 9/28/18 | $7,533,301 |
| 1Life Healthcare, Inc. Series G | 4/10/14 | $3,000,003 |
| Outset Medical, Inc. Series B | 5/5/15 - 6/5/15 | $7,500,001 |
| Outset Medical, Inc. Series D | 8/20/18 | $5,000,000 |
Affiliated Central Funds
Information regarding fiscal year to date income earned by the Fund from investments in Fidelity Central Funds is as follows:
| Fund | Income earned |
| Fidelity Cash Central Fund | $823,461 |
| Fidelity Securities Lending Cash Central Fund | 639,955 |
| Total | $1,463,416 |
Amounts in the income column in the above table include any capital gain distributions from underlying funds, which are presented in the corresponding line-item in the Statement of Operations, if applicable. Amount for Fidelity Securities Lending Cash Central Fund represents the income earned on investing cash collateral, less rebates paid to borrowers and any lending agent fees associated with the loan, plus any premium payments received for lending certain types of securities.
Other Affiliated Issuers
An affiliated company is a company in which the Fund has ownership of at least 5% of the voting securities. Fiscal year to date transactions with companies which are or were affiliates are as follows:
| Affiliate | Value, beginning of period | Purchases | Sales Proceeds | Dividend Income | Realized Gain (loss) | Change in Unrealized appreciation (depreciation) | Value, end of period |
| Atricure, Inc. | $66,435,200 | $4,731,086 | $38,113 | $-- | $(4,279) | $(9,770,294) | $61,353,600 |
| HTG Molecular Diagnostics | 6,580,684 | -- | -- | -- | -- | (4,355,216) | 2,225,468 |
| Nanosonics Ltd. | 57,698,529 | 3,156,431 | 2,325,707 | -- | 926,625 | 30,382,352 | 89,838,230 |
| Polarityte, Inc. | 14,532,000 | -- | 2,811,312 | -- | (8,302,156) | (1,192,530) | -- |
| Total | $145,246,413 | $7,887,517 | $5,175,132 | $-- | $(7,379,810) | $15,064,312 | $153,417,298 |
Investment Valuation
The following is a summary of the inputs used, as of August 31, 2019, involving the Fund's assets and liabilities carried at fair value. The inputs or methodology used for valuing securities may not be an indication of the risk associated with investing in those securities. For more information on valuation inputs, and their aggregation into the levels used below, please refer to the Investment Valuation section in the accompanying Notes to Financial Statements.
| | Valuation Inputs at Reporting Date: |
| Description | Total | Level 1 | Level 2 | Level 3 |
| Investments in Securities: | | | | |
| Common Stocks | $6,434,135,355 | $6,401,177,510 | $25,218,484 | $7,739,361 |
| Convertible Preferred Stocks | 34,890,479 | -- | 13,786,297 | 21,104,182 |
| Money Market Funds | 110,105,489 | 110,105,489 | -- | -- |
| Total Investments in Securities: | $6,579,131,323 | $6,511,282,999 | $39,004,781 | $28,843,543 |
Other Information
Distribution of investments by country or territory of incorporation, as a percentage of Total Net Assets, is as follows (Unaudited):
| United States of America | 88.5% |
| Ireland | 4.3% |
| Switzerland | 1.9% |
| Netherlands | 1.6% |
| Australia | 1.4% |
| Others (Individually Less Than 1%) | 2.3% |
| | 100.0% |
See accompanying notes which are an integral part of the financial statements.
Medical Technology and Devices Portfolio
Financial Statements
Statement of Assets and Liabilities
| | | August 31, 2019 (Unaudited) |
| Assets | | |
Investment in securities, at value (including securities loaned of $89,254,074) — See accompanying schedule:
Unaffiliated issuers (cost $4,410,554,472) | $6,315,608,536 | |
| Fidelity Central Funds (cost $110,103,169) | 110,105,489 | |
| Other affiliated issuers (cost $97,536,243) | 153,417,298 | |
| Total Investment in Securities (cost $4,618,193,884) | | $6,579,131,323 |
| Cash | | 58,637 |
| Receivable for investments sold | | 8,592,031 |
| Receivable for fund shares sold | | 2,059,241 |
| Dividends receivable | | 804,499 |
| Distributions receivable from Fidelity Central Funds | | 139,308 |
| Prepaid expenses | | 42,669 |
| Other receivables | | 223,807 |
| Total assets | | 6,591,051,515 |
| Liabilities | | |
| Payable for investments purchased | $1,050,021 | |
| Payable for fund shares redeemed | 6,110,819 | |
| Accrued management fee | 2,887,480 | |
| Other affiliated payables | 968,745 | |
| Other payables and accrued expenses | 239,577 | |
| Collateral on securities loaned | 91,407,617 | |
| Total liabilities | | 102,664,259 |
| Net Assets | | $6,488,387,256 |
| Net Assets consist of: | | |
| Paid in capital | | $4,406,199,440 |
| Total distributable earnings (loss) | | 2,082,187,816 |
| Net Assets, for 115,875,480 shares outstanding | | $6,488,387,256 |
| Net Asset Value, offering price and redemption price per share ($6,488,387,256 ÷ 115,875,480 shares) | | $55.99 |
See accompanying notes which are an integral part of the financial statements.
Statement of Operations
| | | Six months ended August 31, 2019 (Unaudited) |
| Investment Income | | |
| Dividends | | $19,240,060 |
| Income from Fidelity Central Funds (including $639,955 from security lending) | | 1,463,416 |
| Total income | | 20,703,476 |
| Expenses | | |
| Management fee | $17,682,325 | |
| Transfer agent fees | 5,390,246 | |
| Accounting and security lending fees | 579,502 | |
| Custodian fees and expenses | 31,483 | |
| Independent trustees' fees and expenses | 18,085 | |
| Registration fees | 99,886 | |
| Audit | 19,460 | |
| Legal | 8,186 | |
| Miscellaneous | 23,776 | |
| Total expenses before reductions | 23,852,949 | |
| Expense reductions | (68,973) | |
| Total expenses after reductions | | 23,783,976 |
| Net investment income (loss) | | (3,080,500) |
| Realized and Unrealized Gain (Loss) | | |
| Net realized gain (loss) on: | | |
| Investment securities: | | |
| Unaffiliated issuers | 151,945,739 | |
| Fidelity Central Funds | 11,411 | |
| Other affiliated issuers | (7,379,810) | |
| Foreign currency transactions | 84,236 | |
| Total net realized gain (loss) | | 144,661,576 |
| Change in net unrealized appreciation (depreciation) on: | | |
| Investment securities: | | |
| Unaffiliated issuers | 193,425,230 | |
| Affiliated issuers | 15,064,312 | |
| Assets and liabilities in foreign currencies | 1,143 | |
| Total change in net unrealized appreciation (depreciation) | | 208,490,685 |
| Net gain (loss) | | 353,152,261 |
| Net increase (decrease) in net assets resulting from operations | | $350,071,761 |
See accompanying notes which are an integral part of the financial statements.
Statement of Changes in Net Assets
| | Six months ended August 31, 2019 (Unaudited) | Year ended February 28, 2019 |
| Increase (Decrease) in Net Assets | | |
| Operations | | |
| Net investment income (loss) | $(3,080,500) | $(3,877,280) |
| Net realized gain (loss) | 144,661,576 | 196,864,394 |
| Change in net unrealized appreciation (depreciation) | 208,490,685 | 844,785,779 |
| Net increase (decrease) in net assets resulting from operations | 350,071,761 | 1,037,772,893 |
| Distributions to shareholders | – | (356,492,522) |
| Share transactions | | |
| Proceeds from sales of shares | 459,418,781 | 3,069,361,368 |
| Reinvestment of distributions | – | 339,089,973 |
| Cost of shares redeemed | (1,108,748,171) | (1,366,012,756) |
| Net increase (decrease) in net assets resulting from share transactions | (649,329,390) | 2,042,438,585 |
| Total increase (decrease) in net assets | (299,257,629) | 2,723,718,956 |
| Net Assets | | |
| Beginning of period | 6,787,644,885 | 4,063,925,929 |
| End of period | $6,488,387,256 | $6,787,644,885 |
| Other Information | | |
| Shares | | |
| Sold | 8,564,784 | 60,281,432 |
| Issued in reinvestment of distributions | – | 7,362,903 |
| Redeemed | (20,956,951) | (27,541,203) |
| Net increase (decrease) | (12,392,167) | 40,103,132 |
See accompanying notes which are an integral part of the financial statements.
Financial Highlights
Medical Technology and Devices Portfolio
| | Six months ended (Unaudited) August 31, | Years endedFebruary 28, | | | | |
| | 2019 | 2019 | 2018 | 2017 | 2016 A | 2015 |
| Selected Per–Share Data | | | | | | |
| Net asset value, beginning of period | $52.92 | $46.09 | $41.48 | $33.75 | $41.90 | $38.03 |
| Income from Investment Operations | | | | | | |
| Net investment income (loss)B | (.03) | (.04) | .05 | .01 | (.03) | .04 |
| Net realized and unrealized gain (loss) | 3.10 | 10.40 | 7.31 | 9.87 | (2.25) | 9.86 |
| Total from investment operations | 3.07 | 10.36 | 7.36 | 9.88 | (2.28) | 9.90 |
| Distributions from net investment income | – | – | (.08) | – | (.01) | (.05) |
| Distributions from net realized gain | – | (3.53) | (2.67) | (2.15) | (5.86) | (5.98) |
| Total distributions | – | (3.53) | (2.75) | (2.15) | (5.87) | (6.03) |
| Redemption fees added to paid in capitalB | – | – | – | –C | –C | –C |
| Net asset value, end of period | $55.99 | $52.92 | $46.09 | $41.48 | $33.75 | $41.90 |
| Total ReturnD,E | 5.80% | 23.85% | 18.01% | 30.13% | (6.63)% | 28.52% |
| Ratios to Average Net AssetsF,G | | | | | | |
| Expenses before reductions | .72%H | .73% | .76% | .76% | .76% | .77% |
| Expenses net of fee waivers, if any | .72%H | .73% | .76% | .76% | .76% | .77% |
| Expenses net of all reductions | .72%H | .73% | .75% | .76% | .75% | .77% |
| Net investment income (loss) | (.09)%H | (.07)% | .11% | .01% | (.09)% | .11% |
| Supplemental Data | | | | | | |
| Net assets, end of period (000 omitted) | $6,488,387 | $6,787,645 | $4,063,926 | $3,134,376 | $1,915,772 | $2,107,515 |
| Portfolio turnover rateI | 35%H | 43% | 77% | 55% | 46% | 106% |
A For the year ended February 29.
B Calculated based on average shares outstanding during the period.
C Amount represents less than $.005 per share.
D Total returns for periods of less than one year are not annualized.
E Total returns would have been lower if certain expenses had not been reduced during the applicable periods shown.
F Fees and expenses of any underlying Fidelity Central Funds are not included in the Fund's expense ratio. The Fund indirectly bears its proportionate share of the expenses of any underlying Fidelity Central Funds.
G Expense ratios reflect operating expenses of the Fund. Expenses before reductions do not reflect amounts reimbursed by the investment adviser or reductions from brokerage service arrangements or reductions from other expense offset arrangements and do not represent the amount paid by the Fund during periods when reimbursements or reductions occur. Expenses net of fee waivers reflect expenses after reimbursement by the investment adviser but prior to reductions from brokerage service arrangements or other expense offset arrangements. Expenses net of all reductions represent the net expenses paid by the Fund.
H Annualized
I Amount does not include the portfolio activity of any underlying Fidelity Central Funds.
See accompanying notes which are an integral part of the financial statements.
Pharmaceuticals Portfolio
Investment Summary (Unaudited)
Top Ten Stocks as of August 31, 2019
| | % of fund's net assets |
| AstraZeneca PLC sponsored ADR | 13.2 |
| Johnson & Johnson | 10.3 |
| Sanofi SA sponsored ADR | 8.3 |
| Bristol-Myers Squibb Co. | 7.9 |
| Roche Holding AG (participation certificate) | 7.2 |
| Eli Lilly & Co. | 5.0 |
| Novartis AG sponsored ADR | 4.8 |
| Merck & Co., Inc. | 4.7 |
| Zoetis, Inc. Class A | 4.0 |
| Allergan PLC | 3.1 |
| | 68.5 |
Top Industries (% of fund's net assets)
| As of August 31, 2019 |
| | Pharmaceuticals | 81.1% |
| | Biotechnology | 15.9% |
| | Health Care Equipment & Supplies | 2.1% |
| | Life Sciences Tools & Services | 0.2% |
| | All Others* | 0.7% |

* Includes short-term investments and net other assets (liabilities).
Pharmaceuticals Portfolio
Schedule of Investments August 31, 2019 (Unaudited)
Showing Percentage of Net Assets
| Common Stocks - 98.8% | | | |
| | | Shares | Value |
| Biotechnology - 15.7% | | | |
| Biotechnology - 15.7% | | | |
| Acceleron Pharma, Inc. (a) | | 63,600 | $2,856,276 |
| Alnylam Pharmaceuticals, Inc. (a) | | 33,200 | 2,678,908 |
| Amgen, Inc. | | 68,700 | 14,332,194 |
| AnaptysBio, Inc. (a) | | 17,300 | 703,245 |
| Argenx SE (a) | | 25,200 | 3,300,179 |
| Ascendis Pharma A/S sponsored ADR (a) | | 51,300 | 5,747,139 |
| Blueprint Medicines Corp. (a) | | 61,000 | 4,676,870 |
| Celgene Corp. (a) | | 184,200 | 17,830,560 |
| Cytokinetics, Inc. (a) | | 79,400 | 1,115,570 |
| FibroGen, Inc. (a) | | 72,900 | 3,255,714 |
| Global Blood Therapeutics, Inc. (a) | | 95,200 | 4,377,296 |
| Immunomedics, Inc. (a)(b) | | 306,051 | 3,917,453 |
| Kalvista Pharmaceuticals, Inc. (a)(b) | | 99,000 | 1,546,380 |
| Kura Oncology, Inc. (a) | | 58,600 | 889,548 |
| Leap Therapeutics, Inc. (a)(b) | | 660,800 | 997,808 |
| Leap Therapeutics, Inc. warrants 1/31/26 (a) | | 606,000 | 392,848 |
| Magenta Therapeutics, Inc. (a)(b) | | 97,400 | 1,006,142 |
| Moderna, Inc. (b) | | 165,800 | 2,608,034 |
| Momenta Pharmaceuticals, Inc. (a) | | 86,372 | 1,090,878 |
| Morphosys AG sponsored ADR (a) | | 86,300 | 2,544,124 |
| Olivo Labs (a)(c)(d) | | 6,851 | 0 |
| PTC Therapeutics, Inc. (a) | | 82,700 | 3,685,939 |
| Rubius Therapeutics, Inc. (a) | | 46,400 | 430,592 |
| Sarepta Therapeutics, Inc. (a)(b) | | 72,041 | 6,494,496 |
| Synthorx, Inc. (b) | | 76,800 | 1,375,488 |
| The Medicines Company (a)(b) | | 89,184 | 3,742,161 |
| Vertex Pharmaceuticals, Inc. (a) | | 83,400 | 15,013,668 |
| Xencor, Inc. (a) | | 66,468 | 2,477,927 |
| | | | 109,087,437 |
| Health Care Equipment & Supplies - 2.1% | | | |
| Health Care Equipment - 1.5% | | | |
| Boston Scientific Corp. (a) | | 243,300 | 10,396,209 |
| Health Care Supplies - 0.6% | | | |
| Alcon, Inc. (a) | | 64,369 | 3,923,934 |
|
| TOTAL HEALTH CARE EQUIPMENT & SUPPLIES | | | 14,320,143 |
|
| Life Sciences Tools & Services - 0.2% | | | |
| Life Sciences Tools & Services - 0.2% | | | |
| Bruker Corp. | | 34,200 | 1,476,414 |
| Personal Products - 0.0% | | | |
| Personal Products - 0.0% | | | |
| MYOS Corp. (a) | | 40,000 | 60,800 |
| Pharmaceuticals - 80.8% | | | |
| Pharmaceuticals - 80.8% | | | |
| Allergan PLC | | 135,038 | 21,568,269 |
| AstraZeneca PLC sponsored ADR | | 2,039,500 | 91,838,686 |
| Bausch Health Cos., Inc. (Canada) (a) | | 111,000 | 2,365,232 |
| Bristol-Myers Squibb Co. | | 1,145,680 | 55,072,838 |
| Catalent, Inc. (a) | | 41,100 | 2,167,614 |
| Cronos Group, Inc. (a)(b) | | 233,800 | 2,579,632 |
| Elanco Animal Health, Inc. | | 99,600 | 2,591,592 |
| Eli Lilly & Co. | | 308,861 | 34,892,027 |
| GlaxoSmithKline PLC sponsored ADR | | 241,000 | 10,020,780 |
| Horizon Pharma PLC (a) | | 386,100 | 10,667,943 |
| Johnson & Johnson | | 554,250 | 71,143,530 |
| Merck & Co., Inc. | | 377,036 | 32,602,303 |
| Mylan NV (a) | | 171,600 | 3,341,052 |
| MyoKardia, Inc. (a) | | 67,500 | 3,629,475 |
| Nektar Therapeutics (a)(b) | | 393,233 | 6,909,104 |
| Novartis AG sponsored ADR | | 365,248 | 32,912,497 |
| Novo Nordisk A/S Series B sponsored ADR | | 138,200 | 7,201,602 |
| Perrigo Co. PLC (b) | | 260,300 | 12,176,834 |
| Pfizer, Inc. | | 259,788 | 9,235,463 |
| Roche Holding AG (participation certificate) | | 182,196 | 49,786,926 |
| Sanofi SA sponsored ADR | | 1,334,022 | 57,296,245 |
| Takeda Pharmaceutical Co. Ltd. ADR (b) | | 386,400 | 6,514,704 |
| Theravance Biopharma, Inc. (a) | | 57,697 | 1,271,065 |
| WAVE Life Sciences (a)(b) | | 73,700 | 1,695,100 |
| Zoetis, Inc. Class A | | 219,900 | 27,799,758 |
| Zogenix, Inc. (a) | | 71,100 | 3,035,259 |
| | | | 560,315,530 |
| TOTAL COMMON STOCKS | | | |
| (Cost $539,154,763) | | | 685,260,324 |
|
| Convertible Preferred Stocks - 0.5% | | | |
| Biotechnology - 0.2% | | | |
| Biotechnology - 0.2% | | | |
| BioNTech AG Series B (c) | | 5,386 | 1,696,279 |
| Pharmaceuticals - 0.3% | | | |
| Pharmaceuticals - 0.3% | | | |
| Harmony Biosciences II, Inc. Series C (c)(d) | | 1,020,408 | 2,000,000 |
| TOTAL CONVERTIBLE PREFERRED STOCKS | | | |
| (Cost $3,741,501) | | | 3,696,279 |
|
| Money Market Funds - 4.4% | | | |
| Fidelity Cash Central Fund 2.13% (e) | | 1,074,498 | 1,074,712 |
| Fidelity Securities Lending Cash Central Fund 2.13% (e)(f) | | 29,369,525 | 29,372,462 |
| TOTAL MONEY MARKET FUNDS | | | |
| (Cost $30,447,174) | | | 30,447,174 |
| TOTAL INVESTMENT IN SECURITIES - 103.7% | | | |
| (Cost $573,343,438) | | | 719,403,777 |
| NET OTHER ASSETS (LIABILITIES) - (3.7)% | | | (25,688,017) |
| NET ASSETS - 100% | | | $693,715,760 |
Legend
(a) Non-income producing
(b) Security or a portion of the security is on loan at period end.
(c) Level 3 security
(d) Restricted securities - Investment in securities not registered under the Securities Act of 1933 (excluding 144A issues). At the end of the period, the value of restricted securities (excluding 144A issues) amounted to $2,000,000 or 0.3% of net assets.
(e) Affiliated fund that is generally available only to investment companies and other accounts managed by Fidelity Investments. The rate quoted is the annualized seven-day yield of the fund at period end. A complete unaudited listing of the fund's holdings as of its most recent quarter end is available upon request. In addition, each Fidelity Central Fund's financial statements are available on the SEC's website or upon request.
(f) Investment made with cash collateral received from securities on loan.
Additional information on each restricted holding is as follows:
| Security | Acquisition Date | Acquisition Cost |
| Harmony Biosciences II, Inc. Series C | 8/9/19 | $2,000,000 |
| Olivo Labs | 2/8/17 | $8,290 |
Affiliated Central Funds
Information regarding fiscal year to date income earned by the Fund from investments in Fidelity Central Funds is as follows:
| Fund | Income earned |
| Fidelity Cash Central Fund | $29,165 |
| Fidelity Securities Lending Cash Central Fund | 188,149 |
| Total | $217,314 |
Amounts in the income column in the above table include any capital gain distributions from underlying funds, which are presented in the corresponding line-item in the Statement of Operations, if applicable. Amount for Fidelity Securities Lending Cash Central Fund represents the income earned on investing cash collateral, less rebates paid to borrowers and any lending agent fees associated with the loan, plus any premium payments received for lending certain types of securities.
Investment Valuation
The following is a summary of the inputs used, as of August 31, 2019, involving the Fund's assets and liabilities carried at fair value. The inputs or methodology used for valuing securities may not be an indication of the risk associated with investing in those securities. For more information on valuation inputs, and their aggregation into the levels used below, please refer to the Investment Valuation section in the accompanying Notes to Financial Statements.
| | Valuation Inputs at Reporting Date: |
| Description | Total | Level 1 | Level 2 | Level 3 |
| Investments in Securities: | | | | |
| Common Stocks | $685,260,324 | $631,780,371 | $53,479,953 | $-- |
| Convertible Preferred Stocks | 3,696,279 | -- | -- | 3,696,279 |
| Money Market Funds | 30,447,174 | 30,447,174 | -- | -- |
| Total Investments in Securities: | $719,403,777 | $662,227,545 | $53,479,953 | $3,696,279 |
Other Information
Distribution of investments by country or territory of incorporation, as a percentage of Total Net Assets, is as follows (Unaudited):
| United States of America | 52.5% |
| United Kingdom | 14.7% |
| Switzerland | 12.6% |
| France | 8.3% |
| Ireland | 6.4% |
| Denmark | 1.8% |
| Netherlands | 1.0% |
| Others (Individually Less Than 1%) | 2.7% |
| | 100.0% |
See accompanying notes which are an integral part of the financial statements.
Pharmaceuticals Portfolio
Financial Statements
Statement of Assets and Liabilities
| | | August 31, 2019 (Unaudited) |
| Assets | | |
Investment in securities, at value (including securities loaned of $28,480,015) — See accompanying schedule:
Unaffiliated issuers (cost $542,896,264) | $688,956,603 | |
| Fidelity Central Funds (cost $30,447,174) | 30,447,174 | |
| Total Investment in Securities (cost $573,343,438) | | $719,403,777 |
| Receivable for investments sold | | 1,739,203 |
| Receivable for fund shares sold | | 74,486 |
| Dividends receivable | | 3,155,396 |
| Distributions receivable from Fidelity Central Funds | | 19,324 |
| Prepaid expenses | | 6,695 |
| Other receivables | | 116,529 |
| Total assets | | 724,515,410 |
| Liabilities | | |
| Payable for investments purchased | $112,354 | |
| Payable for fund shares redeemed | 740,863 | |
| Accrued management fee | 311,194 | |
| Other affiliated payables | 135,450 | |
| Other payables and accrued expenses | 136,236 | |
| Collateral on securities loaned | 29,363,553 | |
| Total liabilities | | 30,799,650 |
| Net Assets | | $693,715,760 |
| Net Assets consist of: | | |
| Paid in capital | | $506,848,297 |
| Total distributable earnings (loss) | | 186,867,463 |
| Net Assets, for 33,080,392 shares outstanding | | $693,715,760 |
| Net Asset Value, offering price and redemption price per share ($693,715,760 ÷ 33,080,392 shares) | | $20.97 |
See accompanying notes which are an integral part of the financial statements.
Statement of Operations
| | | Six months ended August 31, 2019 (Unaudited) |
| Investment Income | | |
| Dividends | | $10,094,543 |
| Income from Fidelity Central Funds (including $188,149 from security lending) | | 217,314 |
| Income before foreign taxes withheld | | 10,311,857 |
| Less foreign taxes withheld | | (778,469) |
| Total income | | 9,533,388 |
| Expenses | | |
| Management fee | $1,912,021 | |
| Transfer agent fees | 708,759 | |
| Accounting and security lending fees | 127,380 | |
| Custodian fees and expenses | 6,291 | |
| Independent trustees' fees and expenses | 1,986 | |
| Registration fees | 28,929 | |
| Audit | 22,186 | |
| Legal | 2,334 | |
| Interest | 1,824 | |
| Miscellaneous | 3,284 | |
| Total expenses before reductions | 2,814,994 | |
| Expense reductions | (12,842) | |
| Total expenses after reductions | | 2,802,152 |
| Net investment income (loss) | | 6,731,236 |
| Realized and Unrealized Gain (Loss) | | |
| Net realized gain (loss) on: | | |
| Investment securities: | | |
| Unaffiliated issuers | 36,496,303 | |
| Fidelity Central Funds | 368 | |
| Foreign currency transactions | 14,362 | |
| Total net realized gain (loss) | | 36,511,033 |
| Change in net unrealized appreciation (depreciation) on: | | |
| Investment securities: | | |
| Unaffiliated issuers | (28,949,645) | |
| Assets and liabilities in foreign currencies | 6,931 | |
| Total change in net unrealized appreciation (depreciation) | | (28,942,714) |
| Net gain (loss) | | 7,568,319 |
| Net increase (decrease) in net assets resulting from operations | | $14,299,555 |
See accompanying notes which are an integral part of the financial statements.
Statement of Changes in Net Assets
| | Six months ended August 31, 2019 (Unaudited) | Year ended February 28, 2019 |
| Increase (Decrease) in Net Assets | | |
| Operations | | |
| Net investment income (loss) | $6,731,236 | $10,939,589 |
| Net realized gain (loss) | 36,511,033 | 48,998,628 |
| Change in net unrealized appreciation (depreciation) | (28,942,714) | 37,013,441 |
| Net increase (decrease) in net assets resulting from operations | 14,299,555 | 96,951,658 |
| Distributions to shareholders | (19,477,114) | (14,056,846) |
| Share transactions | | |
| Proceeds from sales of shares | 28,425,297 | 102,161,790 |
| Reinvestment of distributions | 18,393,714 | 13,373,472 |
| Cost of shares redeemed | (95,529,616) | (195,388,778) |
| Net increase (decrease) in net assets resulting from share transactions | (48,710,605) | (79,853,516) |
| Total increase (decrease) in net assets | (53,888,164) | 3,041,296 |
| Net Assets | | |
| Beginning of period | 747,603,924 | 744,562,628 |
| End of period | $693,715,760 | $747,603,924 |
| Other Information | | |
| Shares | | |
| Sold | 1,360,566 | 5,084,653 |
| Issued in reinvestment of distributions | 880,925 | 688,424 |
| Redeemed | (4,639,983) | (9,855,467) |
| Net increase (decrease) | (2,398,492) | (4,082,390) |
See accompanying notes which are an integral part of the financial statements.
Financial Highlights
Pharmaceuticals Portfolio
| | Six months ended (Unaudited) August 31, | Years endedFebruary 28, | | | | |
| | 2019 | 2019 | 2018 | 2017 | 2016 A | 2015 |
| Selected Per–Share Data | | | | | | |
| Net asset value, beginning of period | $21.07 | $18.82 | $18.11 | $18.20 | $23.08 | $21.39 |
| Income from Investment Operations | | | | | | |
| Net investment income (loss)B | .20 | .29 | .27 | .22 | .24 | .14 |
| Net realized and unrealized gain (loss) | .25 | 2.34 | .74 | (.13) | (2.52) | 3.76 |
| Total from investment operations | .45 | 2.63 | 1.01 | .09 | (2.28) | 3.90 |
| Distributions from net investment income | (.08) | (.28) | (.25) | (.18) | (.17) | (.18) |
| Distributions from net realized gain | (.47) | (.10) | (.05) | – | (2.43) | (2.03) |
| Total distributions | (.55) | (.38) | (.30) | (.18) | (2.60) | (2.21) |
| Redemption fees added to paid in capitalB | – | – | – | –C | –C | –C |
| Net asset value, end of period | $20.97 | $21.07 | $18.82 | $18.11 | $18.20 | $23.08 |
| Total ReturnD,E | 2.16% | 14.15% | 5.61% | .57% | (11.33)% | 20.04% |
| Ratios to Average Net AssetsF,G | | | | | | |
| Expenses before reductions | .79%H | .80% | .81% | .80% | .78% | .79% |
| Expenses net of fee waivers, if any | .79%H | .79% | .81% | .80% | .78% | .79% |
| Expenses net of all reductions | .79%H | .79% | .80% | .79% | .77% | .79% |
| Net investment income (loss) | 1.89%H | 1.48% | 1.44% | 1.16% | 1.09% | .66% |
| Supplemental Data | | | | | | |
| Net assets, end of period (000 omitted) | $693,716 | $747,604 | $744,563 | $1,000,937 | $1,693,410 | $1,892,865 |
| Portfolio turnover rateI | 56%H | 55% | 89% | 77% | 77% | 72%J |
A For the year ended February 29.
B Calculated based on average shares outstanding during the period.
C Amount represents less than $.005 per share.
D Total returns for periods of less than one year are not annualized.
E Total returns would have been lower if certain expenses had not been reduced during the applicable periods shown.
F Fees and expenses of any underlying Fidelity Central Funds are not included in the Fund's expense ratio. The Fund indirectly bears its proportionate share of the expenses of any underlying Fidelity Central Funds.
G Expense ratios reflect operating expenses of the Fund. Expenses before reductions do not reflect amounts reimbursed by the investment adviser or reductions from brokerage service arrangements or reductions from other expense offset arrangements and do not represent the amount paid by the Fund during periods when reimbursements or reductions occur. Expenses net of fee waivers reflect expenses after reimbursement by the investment adviser but prior to reductions from brokerage service arrangements or other expense offset arrangements. Expenses net of all reductions represent the net expenses paid by the Fund.
H Annualized
I Amount does not include the portfolio activity of any underlying Fidelity Central Funds.
J Portfolio turnover rate excludes securities received or delivered in-kind.
See accompanying notes which are an integral part of the financial statements.
Notes to Financial Statements (Unaudited)
For the period ended August 31, 2019
1. Organization.
Biotechnology Portfolio, Health Care Portfolio, Health Care Services Portfolio, Medical Technology and Devices Portfolio, and Pharmaceuticals Portfolio (the Funds) are non-diversified funds of Fidelity Select Portfolios (the Trust). The Trust is registered under the Investment Company Act of 1940, as amended (the 1940 Act), as an open-end management investment company organized as a Massachusetts business trust. The Funds invest primarily in securities of companies whose principal business activities fall within specific industries. Each Fund is authorized to issue an unlimited number of shares. Effective after the close of business on March 29, 2019, Medical Technology and Devices Portfolio is closed to new accounts with certain exceptions. Share transactions on the Statement of Changes in Net Assets may contain exchanges between affiliated funds.
2. Investments in Fidelity Central Funds.
The Funds invest in Fidelity Central Funds, which are open-end investment companies generally available only to other investment companies and accounts managed by the investment adviser and its affiliates. The Funds' Schedules of Investments list each of the Fidelity Central Funds held as of period end, if any, as an investment of each Fund, but do not include the underlying holdings of each Fidelity Central Fund. As an Investing Fund, each Fund indirectly bears its proportionate share of the expenses of the underlying Fidelity Central Funds.
The Money Market Central Funds seek preservation of capital and current income and are managed by Fidelity Investments Money Management, Inc. (FIMM), an affiliate of the investment adviser. Annualized expenses of the Money Market Central Funds as of their most recent shareholder report date ranged from less than .005% to .01%.
A complete unaudited list of holdings for each Fidelity Central Fund is available upon request or at the Securities and Exchange Commission (the SEC) website at www.sec.gov. In addition, the financial statements of the Fidelity Central Funds are available on the SEC website or upon request.
3. Significant Accounting Policies.
Each Fund is an investment company and applies the accounting and reporting guidance of the Financial Accounting Standards Board (FASB) Accounting Standards Codification Topic 946 Financial Services – Investments Companies. The financial statements have been prepared in conformity with accounting principles generally accepted in the United States of America (GAAP), which require management to make certain estimates and assumptions at the date of the financial statements. Actual results could differ from those estimates. Subsequent events, if any, through the date that the financial statements were issued have been evaluated in the preparation of the financial statements. The following summarizes the significant accounting policies of the Funds:
Investment Valuation. Investments are valued as of 4:00 p.m. Eastern time on the last calendar day of the period. The Board of Trustees (the Board) has delegated the day to day responsibility for the valuation of each Fund's investments to the Fair Value Committee (the Committee) established by each Fund's investment adviser. In accordance with valuation policies and procedures approved by the Board, each Fund attempts to obtain prices from one or more third party pricing vendors or brokers to value its investments. When current market prices, quotations or currency exchange rates are not readily available or reliable, investments will be fair valued in good faith by the Committee, in accordance with procedures adopted by the Board. Factors used in determining fair value vary by investment type and may include market or investment specific events. The frequency with which these procedures are used cannot be predicted and they may be utilized to a significant extent. The Committee oversees each Fund's valuation policies and procedures and reports to the Board on the Committee's activities and fair value determinations. The Board monitors the appropriateness of the procedures used in valuing each Fund's investments and ratifies the fair value determinations of the Committee.
Each Fund categorizes the inputs to valuation techniques used to value its investments into a disclosure hierarchy consisting of three levels as shown below:
- Level 1 – quoted prices in active markets for identical investments
- Level 2 – other significant observable inputs (including quoted prices for similar investments, interest rates, prepayment speeds, etc.)
- Level 3 – unobservable inputs (including the Fund's own assumptions based on the best information available)
Valuation techniques used to value each Fund's investments by major category are as follows:
Equity securities, including restricted securities, for which market quotations are readily available, are valued at the last reported sale price or official closing price as reported by a third party pricing vendor on the primary market or exchange on which they are traded and are categorized as Level 1 in the hierarchy. In the event there were no sales during the day or closing prices are not available, securities are valued at the last quoted bid price or may be valued using the last available price and are generally categorized as Level 2 in the hierarchy. For foreign equity securities, when market or security specific events arise, comparisons to the valuation of American Depositary Receipts (ADRs), futures contracts, Exchange-Traded Funds (ETFs) and certain indexes as well as quoted prices for similar securities may be used and would be categorized as Level 2 in the hierarchy. For equity securities, including restricted securities, where observable inputs are limited, assumptions about market activity and risk are used and these securities may be categorized as Level 3 in the hierarchy. Equity securities, including restricted securities, for which observable inputs are not available are valued using alternate valuation approaches, including the market approach and the income approach and are categorized as Level 3 in the hierarchy. The market approach generally consists of using comparable market transactions while the income approach generally consists of using the net present value of estimated future cash flows, adjusted as appropriate for liquidity, credit, market and/or other risk factors.
Investments in open-end mutual funds, including Fidelity Central Funds, are valued at their closing net asset value (NAV) each business day and are categorized as Level 1 in the hierarchy.
The following provides information on Level 3 securities held by the Fund that were valued at period end based on unobservable inputs. These amounts exclude valuations provided by a broker.
Biotechnology Portfolio:
| Asset Type | Fair Value | Valuation Technique(s) | Unobservable Input | Amount or Range/Weighted Average | Impact to Valuation from an Increase in Input(a) |
| Equities | $ 159,707,461 | Market comparable | Enterprise value/Sales multiple (EV/S) | 3.9 | Increase |
| | | | Transaction price | $0.77 - $132.98 / $45.23 | Increase |
| | | | Discount rate | 10.0% | Decrease |
| | | | Proxy discount | 4.0% - 26.8% / 14.3% | Decrease |
| | | Recovery value | Recovery value | 0.0% | Increase |
| | | Market approach | Transaction price | $2.25 - $158.61 / $157.74 | Increase |
| | | Discounted cash flow | Discount rate | 8.0% - 11.0% / 10.3% | Decrease |
| | | | Discount for lack of marketability | 10.0% | Decrease |
| | | | Growth rate | 3.5% | Increase |
| | | | Probability rate | 6.3% | Increase |
(a) Represents the directional change in the fair value of the Level 3 investments that could have resulted from an increase in the corresponding input as of period end. A decrease to the unobservable input would have had the opposite effect. Significant changes in these inputs may have resulted in a significantly higher or lower fair value measurement at period end.
Health Care Portfolio:
| Asset Type | Fair Value | Valuation Technique(s) | Unobservable Input | Amount or Range/Weighted Average | Impact to Valuation from an Increase in Input(a) |
| Equities | $ 132,906,442 | Market comparable | Enterprise value/Sales multiple (EV/S) | 4.9 | Increase |
| | | | Transaction price | $1.96 - $325.82 / $171.20 | Increase |
| | | | Proxy discount | 0.6% | Decrease |
| | | | Premium rate | 98.5% | Increase |
| | | Market approach | Transaction price | $3.11 - $158.61 / $89.46 | Increase |
(a) Represents the directional change in the fair value of the Level 3 investments that could have resulted from an increase in the corresponding input as of period end. A decrease to the unobservable input would have had the opposite effect. Significant changes in these inputs may have resulted in a significantly higher or lower fair value measurement at period end.
Health Care Services Portfolio:
| Asset Type | Fair Value | Valuation Technique(s) | Unobservable Input | Amount or Range/Weighted Average | Impact to Valuation from an Increase in Input(a) |
| Equities | $ 10,353,839 | Market comparable | Enterprise value/Sales multiple (EV/S) | 4.9 | Increase |
| | | | Premium rate | 98.5% | Increase |
(a) Represents the directional change in the fair value of the Level 3 investments that could have resulted from an increase in the corresponding input as of period end. A decrease to the unobservable input would have had the opposite effect. Significant changes in these inputs may have resulted in a significantly higher or lower fair value measurement at period end.
Changes in valuation techniques may result in transfers in or out of an assigned level within the disclosure hierarchy. The aggregate value of investments by input level as of August 31, 2019, as well as a roll forward of Level 3 investments, is included at the end of each applicable Fund's Schedule of Investments.
Foreign Currency. The Funds may use foreign currency contracts to facilitate transactions in foreign-denominated securities. Gains and losses from these transactions may arise from changes in the value of the foreign currency or if the counterparties do not perform under the contracts' terms.
Foreign-denominated assets, including investment securities, and liabilities are translated into U.S. dollars at the exchange rates at period end. Purchases and sales of investment securities, income and dividends received and expenses denominated in foreign currencies are translated into U.S. dollars at the exchange rate in effect on the transaction date.
The effects of exchange rate fluctuations on investments are included with the net realized and unrealized gain (loss) on investment securities. Other foreign currency transactions resulting in realized and unrealized gain (loss) are disclosed separately.
Investment Transactions and Income. For financial reporting purposes, the Funds' investment holdings and NAV include trades executed through the end of the last business day of the period. The NAV per share for processing shareholder transactions is calculated as of the close of business of the New York Stock Exchange (NYSE), normally 4:00 p.m. Eastern time and includes trades executed through the end of the prior business day. Gains and losses on securities sold are determined on the basis of identified cost and for certain Funds include proceeds received from litigation. Dividend income is recorded on the ex-dividend date, except for certain dividends from foreign securities where the ex-dividend date may have passed, which are recorded as soon as the Funds are informed of the ex-dividend date. Non-cash dividends included in dividend income, if any, are recorded at the fair market value of the securities received. Income and capital gain distributions from Fidelity Central Funds, if any, are recorded on the ex-dividend date. Certain distributions received by the Funds represent a return of capital or capital gain. The Funds determine the components of these distributions subsequent to the ex-dividend date, based upon receipt of tax filings or other correspondence relating to the underlying investment. These distributions are recorded as a reduction of cost of investments and/or as a realized gain. Investment income is recorded net of foreign taxes withheld where recovery of such taxes is uncertain.
Expenses. Expenses directly attributable to a fund are charged to that fund. Expenses attributable to more than one fund are allocated among the respective funds on the basis of relative net assets or other appropriate methods. Expense estimates are accrued in the period to which they relate and adjustments are made when actual amounts are known.
Deferred Trustee Compensation. Under a Deferred Compensation Plan (the Plan) the Funds, certain independent Trustees have elected to defer receipt of a portion of their annual compensation. Deferred amounts are invested in a cross-section of Fidelity funds, are marked-to-market and remain in each Fund until distributed in accordance with the Plan. The investment of deferred amounts and the offsetting payable to the Trustees presented below are included in each accompanying Statement of Assets and Liabilities in other receivables and other payables and accrued expenses, respectively.
| Biotechnology Portfolio | $816,359 |
| Health Care Portfolio | 566,804 |
| Health Care Services Portfolio | 61,987 |
| Medical Technology and Devices Portfolio | 186,692 |
| Pharmaceuticals Portfolio | 110,981 |
Income Tax Information and Distributions to Shareholders. Each year, each Fund intends to qualify as a regulated investment company under Subchapter M of the Internal Revenue Code, including distributing substantially all of its taxable income and realized gains. As a result, no provision for U.S. Federal income taxes is required. Each Fund files a U.S. federal tax return, in addition to state and local tax returns as required. Each Fund's federal income tax returns are subject to examination by the Internal Revenue Service (IRS) for a period of three fiscal years after they are filed. State and local tax returns may be subject to examination for an additional fiscal year depending on the jurisdiction. Foreign taxes are provided for based on each Fund's understanding of the tax rules and rates that exist in the foreign markets in which it invests.
Distributions are declared and recorded on the ex-dividend date. Income and capital gain distributions are determined in accordance with income tax regulations, which may differ from GAAP. These differences resulted in distribution reclassifications.
Capital accounts within the financial statements are adjusted for permanent book-tax differences. These adjustments have no impact on net assets or the results of operations. Capital accounts are not adjusted for temporary book-tax differences which will reverse in a subsequent period.
Book-tax differences are primarily due to redemptions in kind, foreign currency transactions, passive foreign investment companies (PFIC), partnerships, deferred trustees compensation, net operating losses, certain deemed dividends, capital loss carryforwards and losses deferred due to wash sales and excise tax regulations.
As of period end, the cost and unrealized appreciation (depreciation) in securities, and derivatives if applicable, for federal income tax purposes were as follows for each Fund:
| | Tax cost | Gross unrealized appreciation | Gross unrealized depreciation | Net unrealized appreciation (depreciation) |
| Biotechnology Portfolio | $5,582,794,024 | $2,408,508,905 | $(774,422,369) | $1,634,086,536 |
| Health Care Portfolio | 5,075,415,760 | 2,123,443,777 | (263,860,708) | 1,859,583,069 |
| Health Care Services Portfolio | 706,378,073 | 326,525,892 | (39,344,919) | 287,180,973 |
| Medical Technology and Devices Portfolio | 4,630,269,760 | 2,131,441,000 | (182,579,437) | 1,948,861,563 |
| Pharmaceuticals Portfolio | 575,697,785 | 158,599,788 | (14,893,796) | 143,705,992 |
Certain of the Funds elected to defer to the next fiscal year capital and currency losses recognized during the period November 1, 2018 to February 28, 2019, and ordinary losses recognized during the period January 1, 2019 to February 28, 2019. Loss deferrals were as follows:
| | Capital losses | Ordinary losses |
| Biotechnology Portfolio | $(9,468,707) | $– |
| Health Care Portfolio | (52,551,216) | – |
| Health Care Services Portfolio | (7,545,546) | – |
| Medical Technology and Devices Portfolio | (4,763,866) | (4,505,609) |
Delayed Delivery Transactions and When-Issued Securities. During the period, certain Funds transacted in securities on a delayed delivery or when-issued basis. Payment and delivery may take place after the customary settlement period for that security. The price of the underlying securities and the date when the securities will be delivered and paid for are fixed at the time the transaction is negotiated. The securities purchased on a delayed delivery or when-issued basis are identified as such in each applicable Fund's Schedule of Investments. Losses may arise due to changes in the value of the underlying securities or if the counterparty does not perform under the contract's terms, or if the issuer does not issue the securities due to political, economic, or other factors.
Restricted Securities. The Funds may invest in securities that are subject to legal or contractual restrictions on resale. These securities generally may be resold in transactions exempt from registration or to the public if the securities are registered. Disposal of these securities may involve time-consuming negotiations and expense, and prompt sale at an acceptable price may be difficult. Information regarding restricted securities is included at the end of each applicable Fund's Schedule of Investments.
Consolidated Subsidiary. Biotechnology Portfolio invests in certain investments through a wholly-owned subsidiary ("Subsidiary"), which may be subject to federal and state taxes upon disposition.
As of period end, Biotechnology Portfolio held an investment of $90,398,862 in this Subsidiary, representing 1.40% of the Fund's net assets. The financial statements have been consolidated and include accounts of the Fund and the Subsidiary. Accordingly, all inter-company transactions and balances have been eliminated.
Any cash held by the Subsidiary is restricted as to its use and is presented as Restricted cash in the Statement of Assets and Liabilities.
4. Purchases and Sales of Investments.
Purchases and sales of securities, other than short-term securities and in-kind transactions, are noted in the table below.
| | Purchases ($) | Sales ($) |
| Biotechnology Portfolio | 1,595,360,530 | 2,241,094,731 |
| Health Care Portfolio | 1,204,596,135 | 1,671,284,135 |
| Health Care Services Portfolio | 196,607,177 | 526,192,645 |
| Medical Technology and Devices Portfolio | 1,130,655,028 | 1,753,669,289 |
| Pharmaceuticals Portfolio | 198,294,176 | 251,354,672 |
5. Fees and Other Transactions with Affiliates.
Management Fee. Fidelity SelectCo, LLC (the investment adviser) and its affiliates provide the Funds with investment management related services for which the Funds pay a monthly management fee. The management fee is the sum of an individual fund fee rate and an annualized group fee rate. The individual fund fee rate is applied to each Fund's average net assets. The group fee rate is based upon the average net assets of all the mutual funds advised by Fidelity Management & Research Company (FMR) and the investment adviser. The group fee rate decreases as assets under management increase and increases as assets under management decrease. For the reporting period, each Fund's annualized management fee rate expressed as a percentage of each Fund's average net assets was as follows:
| | Individual Rate | Group Rate | Total |
| Biotechnology Portfolio | .30% | .24% | .54% |
| Health Care Portfolio | .30% | .24% | .54% |
| Health Care Services Portfolio | .30% | .24% | .54% |
| Medical Technology and Devices Portfolio | .30% | .24% | .54% |
| Pharmaceuticals Portfolio | .30% | .24% | .54% |
Transfer Agent Fees. Fidelity Investments Institutional Operations Company, Inc. (FIIOC), an affiliate of the investment adviser, is the Funds' transfer, dividend disbursing and shareholder servicing agent. FIIOC receives account fees and asset-based fees that vary according to account size and type of account. FIIOC pays for typesetting, printing and mailing of shareholder reports, except proxy statements. For the period, transfer agent fees were equivalent to the following annualized rates expressed as a percentage of average net assets:
| Biotechnology Portfolio | .17% |
| Health Care Portfolio | .15% |
| Health Care Services Portfolio | .18% |
| Medical Technology and Devices Portfolio | .16% |
| Pharmaceuticals Portfolio | .20% |
Accounting and Security Lending Fees. Fidelity Service Company, Inc. (FSC), an affiliate of the investment adviser, maintains each Fund's accounting records. The accounting fee is based on the level of average net assets for each month. Prior to April 1, 2019, FSC had a separate agreement with each Fund for administration of the security lending program, based on the number and duration of lending transactions. For the period, the total fees paid for accounting and administration of securities lending were equivalent to the following annualized rates:
| | % of Average Net Assets |
| Biotechnology Portfolio | .02 |
| Health Care Portfolio | .02 |
| Health Care Services Portfolio | .03 |
| Medical Technology and Devices Portfolio | .02 |
| Pharmaceuticals Portfolio | .04 |
Brokerage Commissions. Certain Funds placed a portion of their portfolio transactions with brokerage firms which are affiliates of the investment adviser. Brokerage commissions are included in net realized gain (loss) and change in net unrealized appreciation (depreciation) in the Statement of Operations. The commissions paid to these affiliated firms were as follows:
| | Amount |
| Biotechnology Portfolio | $83,810 |
| Health Care Portfolio | 36,380 |
| Health Care Services Portfolio | 6,561 |
| Medical Technology and Devices Portfolio | 33,638 |
| Pharmaceuticals Portfolio | 5,145 |
Interfund Lending Program. Pursuant to an Exemptive Order issued by the SEC, the Funds, along with other registered investment companies having management contracts with Fidelity Management & Research Company (FMR) or other affiliated entities of FMR, may participate in an interfund lending program. This program provides an alternative credit facility allowing the funds to borrow from, or lend money to, other participating affiliated funds. At period end, there were no interfund loans outstanding. Each applicable fund's activity in this program during the period for which loans were outstanding was as follows:
| | Borrower or Lender | Average Loan Balance | Weighted Average Interest Rate | Interest Expense |
| Health Care Services Portfolio | Borrower | $3,070,000 | 2.64% | $1,579 |
| Pharmaceuticals Portfolio | Borrower | $4,883,400 | 2.69% | $1,824 |
Interfund Trades. The Funds may purchase from or sell securities to other Fidelity Funds under procedures adopted by the Board. The procedures have been designed to ensure these interfund trades are executed in accordance with Rule 17a-7 of the 1940 Act. Interfund trades are included within the respective purchases and sales amounts shown in the Purchases and Sales of Investments note.
Affiliated Redemptions In-Kind. During the period, 4,971,286 shares of Health Care Portfolio were redeemed in-kind for investments and cash with a value of $122,939,907. The net realized gain of $52,017,323 on investments delivered through in-kind redemptions is included in the accompanying Statement of Operations. The amount of the in-kind redemptions is included in share transactions in the accompanying Statement of Changes in Net Assets. Health Care Portfolio recognized no gain or loss for federal income tax purposes.
Prior Fiscal Year Affiliated Redemptions In-Kind. During the prior period, 23,409,830* shares of Health Care Portfolio were redeemed in-kind for investments and cash with a value of $541,001,090. Health Care had a net realized gain of $233,538,287 on investments delivered through in-kind redemptions. The amount of the in-kind redemptions is included in share transactions in the accompanying Statement of Changes in Net Assets. Health Care Portfolio recognized no gain or loss for federal income tax purposes.
*Share activity prior to August 10, 2018 has been adjusted to reflect the impact of the 10 for 1 split that occurred on that date.
Other. During the period, the investment adviser reimbursed the Funds for certain losses as follows:
| | Amount |
| Health Care Portfolio | $7,841 |
| Medical Technology and Devices Portfolio | 58,638 |
6. Committed Line of Credit.
Certain Funds participate with other funds managed by the investment adviser or an affiliate in a $4.25 billion credit facility (the "line of credit") to be utilized for temporary or emergency purposes to fund shareholder redemptions or for other short-term liquidity purposes. The participating funds have agreed to pay commitment fees on their pro-rata portion of the line of credit, which are reflected in Miscellaneous expenses on the Statement of Operations, and are as follows:
| Biotechnology Portfolio | $9,814 |
| Health Care Portfolio | 9,755 |
| Health Care Services Portfolio | 1,683 |
| Medical Technology and Devices Portfolio | 8,793 |
| Pharmaceuticals Portfolio | 981 |
During the period, the Funds did not borrow on this line of credit.
7. Security Lending.
Certain Funds lend portfolio securities from time to time in order to earn additional income. For equity securities, lending agents are used, including National Financial Services (NFS), an affiliate of the Funds. Pursuant to a securities lending agreement, NFS will receive a fee, which is capped at 9.9% of daily lending revenue, for its services as lending agent. The Funds may lend securities to certain qualified borrowers. On the settlement date of the loan, each applicable Fund receives collateral (in the form of U.S. Treasury obligations, letters of credit and/or cash) against the loaned securities and maintains collateral in an amount not less than 100% of the market value of the loaned securities during the period of the loan. The market value of the loaned securities is determined at the close of business of the Funds and any additional required collateral is delivered to the Funds on the next business day. The Funds or borrower may terminate the loan at any time, and if the borrower defaults on its obligation to return the securities loaned because of insolvency or other reasons, the Funds may apply collateral received from the borrower against the obligation. The Funds may experience delays and costs in recovering the securities loaned. Any cash collateral received is invested in the Fidelity Securities Lending Cash Central Fund. The value of loaned securities and cash collateral at period end are disclosed on each applicable Fund's Statement of Assets and Liabilities. Security lending income represents the income earned on investing cash collateral, less rebates paid to borrowers and any lending agent fees associated with the loan, plus any premium payments received for lending certain types of securities. Security lending income is presented on each applicable Fund's Statement of Operations as a component of income from Fidelity Central Funds. Security lending fees paid to NFS were as follows:
| Biotechnology Portfolio | $156,383 |
| Health Care Portfolio | $13,480 |
| Health Care Services Portfolio | $473 |
| Medical Technology and Devices Portfolio | $7,104 |
| Pharmaceuticals Portfolio | $3,752 |
8. Expense Reductions.
Commissions paid to certain brokers with whom the investment adviser, or its affiliates, places trades on behalf of certain Funds include an amount in addition to trade execution, which may be rebated back to the Funds to offset certain expenses. In addition, through arrangements with each applicable Fund's custodian and transfer agent, credits realized as a result of certain uninvested cash balances were used to reduce each applicable Fund's expenses. All of the applicable expense reductions are noted in the table below.
| | Brokerage Service reduction | Custodian credits | Transfer Agent credits |
| Biotechnology Portfolio | $93,665 | $1,339 | $1,964 |
| Health Care Portfolio | 48,787 | 752 | 4,399 |
| Health Care Services Portfolio | 10,154 | 336 | – |
| Medical Technology and Devices Portfolio | 46,098 | 62 | – |
| Pharmaceuticals Portfolio | 9,964 | 10 | – |
In addition, during the period the investment adviser reimbursed and/or waived a portion of operating expenses as follows:
| | Amount |
| Biotechnology Portfolio | $27,356 |
| Health Care Portfolio | 27,652 |
| Health Care Services Portfolio | 5,224 |
| Medical Technology and Devices Portfolio | 22,813 |
| Pharmaceuticals Portfolio | 2,868 |
9. Other.
The Funds' organizational documents provide former and current trustees and officers with a limited indemnification against liabilities arising in connection with the performance of their duties to the Funds. In the normal course of business, the Funds may also enter into contracts that provide general indemnifications. The Funds' maximum exposure under these arrangements is unknown as this would be dependent on future claims that may be made against the Funds. The risk of material loss from such claims is considered remote.
Shareholder Expense Example
As a shareholder of a Fund, you incur two types of costs: (1) transaction costs, including and (2) ongoing costs, including management fees and other Fund expenses. This Example is intended to help you understand your ongoing costs (in dollars) of investing in the Funds and to compare these costs with the ongoing costs of investing in other mutual funds.
The Example is based on an investment of $1,000 invested at the beginning of the period and held for the entire period (March 1, 2019 to August 31, 2019).
Actual Expenses
The first line of the accompanying table for each fund provides information about actual account values and actual expenses. You may use the information in this line, together with the amount you invested, to estimate the expenses that you paid over the period. Simply divide your account value by $1,000.00 (for example, an $8,600 account value divided by $1,000.00 = 8.6), then multiply the result by the number in the first line for a fund under the heading entitled "Expenses Paid During Period" to estimate the expenses you paid on your account during this period. In addition, each Fund, as a shareholder in the underlying Fidelity Central Funds, will indirectly bear its pro-rata share of the fees and expenses incurred by the underlying Fidelity Central Funds. These fees and expenses are not included in the Fund's annualized expense ratio used to calculate the expense estimate in the table below.
Hypothetical Example for Comparison Purposes
The second line of the accompanying table for each fund provides information about hypothetical account values and hypothetical expenses based on a fund's actual expense ratio and an assumed rate of return of 5% per year before expenses, which is not the Fund's actual return. The hypothetical account values and expenses may not be used to estimate the actual ending account balance or expenses you paid for the period. You may use this information to compare the ongoing costs of investing in the Fund and other funds. To do so, compare this 5% hypothetical example with the 5% hypothetical examples that appear in the shareholder reports of the other funds. In addition, each Fund, as a shareholder in the underlying Fidelity Central Funds, will indirectly bear its pro-rata share of the fees and expenses incurred by the underlying Fidelity Central Funds. These fees and expenses are not included in the Fund's annualized expense ratio used to calculate the expense estimate in the table below.
Please note that the expenses shown in the table are meant to highlight your ongoing costs only and do not reflect any transaction costs. Therefore, the second line of the table is useful in comparing ongoing costs only, and will not help you determine the relative total costs of owning different funds. In addition, if these transactional costs were included, your costs would have been higher.
| | Annualized Expense Ratio-A | Beginning
Account Value
March 1, 2019 | Ending
Account Value
August 31, 2019 | Expenses Paid
During Period-B
March 1, 2019
to August 31, 2019 |
| Biotechnology Portfolio | .72% | | | |
| Actual | | $1,000.00 | $948.50 | $3.53 |
| Hypothetical-C | | $1,000.00 | $1,021.52 | $3.66 |
| Health Care Portfolio | .71% | | | |
| Actual | | $1,000.00 | $1,002.50 | $3.57 |
| Hypothetical-C | | $1,000.00 | $1,021.57 | $3.61 |
| Health Care Services Portfolio | .76% | | | |
| Actual | | $1,000.00 | $974.00 | $3.77 |
| Hypothetical-C | | $1,000.00 | $1,021.32 | $3.86 |
| Medical Technology and Devices Portfolio | .72% | | | |
| Actual | | $1,000.00 | $1,058.00 | $3.72 |
| Hypothetical-C | | $1,000.00 | $1,021.52 | $3.66 |
| Pharmaceuticals Portfolio | .79% | | | |
| Actual | | $1,000.00 | $1,021.60 | $4.01 |
| Hypothetical-C | | $1,000.00 | $1,021.17 | $4.01 |
A Annualized expense ratio reflects expenses net of applicable fee waivers.
B Expenses are equal to each Fund's annualized expense ratio, multiplied by the average account value over the period, multiplied by 184/ 366 (to reflect the one-half year period).
C 5% return per year before expenses
SELHC-SANN-1019
1.813645.114
Fidelity® Select Portfolios®
Financials Sector Banking Portfolio
Brokerage and Investment Management Portfolio
Consumer Finance Portfolio
Financial Services Portfolio
Insurance Portfolio
Semi-Annual Report August 31, 2019 |
|
Beginning on January 1, 2021, as permitted by regulations adopted by the Securities and Exchange Commission, paper copies of a fund’s shareholder reports will no longer be sent by mail, unless you specifically request paper copies of the reports from the fund or from your financial intermediary, such as a financial advisor, broker-dealer or bank. Instead, the reports will be made available on a website, and you will be notified by mail each time a report is posted and provided with a website link to access the report.
If you already elected to receive shareholder reports electronically, you will not be affected by this change and you need not take any action. You may elect to receive shareholder reports and other communications from a fund electronically, by contacting your financial intermediary. For Fidelity customers, visit Fidelity's web site or call Fidelity using the contact information listed below.
You may elect to receive all future reports in paper free of charge. If you wish to continue receiving paper copies of your shareholder reports, you may contact your financial intermediary or, if you are a Fidelity customer, visit Fidelity’s website, or call Fidelity at the applicable toll-free number listed below. Your election to receive reports in paper will apply to all funds held with the fund complex/your financial intermediary.
| Account Type | Website | Phone Number |
| Brokerage, Mutual Fund, or Annuity Contracts: | fidelity.com/mailpreferences | 1-800-343-3548 |
| Employer Provided Retirement Accounts: | netbenefits.fidelity.com/preferences (choose 'no' under Required Disclosures to continue to print) | 1-800-343-0860 |
| Advisor Sold Accounts Serviced Through Your Financial Intermediary: | Contact Your Financial Intermediary | Your Financial Intermediary's phone number |
| Advisor Sold Accounts Serviced by Fidelity: | institutional.fidelity.com | 1-877-208-0098 |
Contents
To view a fund's proxy voting guidelines and proxy voting record for the 12-month period ended June 30, visit http://www.fidelity.com/proxyvotingresults or visit the Securities and Exchange Commission's (SEC) web site at http://www.sec.gov.
You may also call 1-800-544-8544 to request a free copy of the proxy voting guidelines.
Standard & Poor's, S&P and S&P 500 are registered service marks of The McGraw-Hill Companies, Inc. and have been licensed for use by Fidelity Distributors Corporation.
Other third-party marks appearing herein are the property of their respective owners.
All other marks appearing herein are registered or unregistered trademarks or service marks of FMR LLC or an affiliated company. © 2019 FMR LLC. All rights reserved.
This report and the financial statements contained herein are submitted for the general information of the shareholders of the Funds. This report is not authorized for distribution to prospective investors in the Funds unless preceded or accompanied by an effective prospectus.
A fund files its complete schedule of portfolio holdings with the SEC for the first and third quarters of each fiscal year on Form N-PORT. Forms N-PORT are available on the SEC’s web site at http://www.sec.gov. A fund's Forms N-PORT may be reviewed and copied at the SEC’s Public Reference Room in Washington, DC. Information regarding the operation of the SEC's Public Reference Room may be obtained by calling 1-800-SEC-0330.
For a complete list of a fund's portfolio holdings, view the most recent holdings listing, semiannual report, or annual report on Fidelity's web site at http://www.fidelity.com, http://www.institutional.fidelity.com, or http://www.401k.com, as applicable.
NOT FDIC INSURED •MAY LOSE VALUE •NO BANK GUARANTEE
Neither the Funds nor Fidelity Distributors Corporation is a bank.
Banking Portfolio
Investment Summary (Unaudited)
Top Ten Stocks as of August 31, 2019
| | % of fund's net assets |
| Wells Fargo & Co. | 9.3 |
| Bank of America Corp. | 8.9 |
| Citigroup, Inc. | 6.5 |
| PNC Financial Services Group, Inc. | 5.1 |
| SunTrust Banks, Inc. | 5.0 |
| KeyCorp | 4.2 |
| Huntington Bancshares, Inc. | 4.2 |
| Capital One Financial Corp. | 2.5 |
| Regions Financial Corp. | 2.4 |
| M&T Bank Corp. | 2.3 |
| | 50.4 |
Top Industries (% of fund's net assets)
| As of August 31, 2019 |
| | Banks | 86.3% |
| | Consumer Finance | 5.2% |
| | Thrifts & Mortgage Finance | 3.3% |
| | Capital Markets | 2.7% |
| | Software | 0.6% |
| | All Others* | 1.9% |

* Includes short-term investments and net other assets (liabilities).
Banking Portfolio
Schedule of Investments August 31, 2019 (Unaudited)
Showing Percentage of Net Assets
| Common Stocks - 98.5% | | | |
| | | Shares | Value |
| Banks - 86.3% | | | |
| Diversified Banks - 25.3% | | | |
| Amalgamated Bank | | 154,100 | $2,473,305 |
| Bank of America Corp. | | 1,321,876 | 36,364,809 |
| Citigroup, Inc. | | 414,400 | 26,666,640 |
| Wells Fargo & Co. | | 813,492 | 37,884,321 |
| | | | 103,389,075 |
| Regional Banks - 61.0% | | | |
| 1st Source Corp. | | 80,460 | 3,570,010 |
| American National Bankshares, Inc. | | 95,184 | 3,255,293 |
| Ameris Bancorp | | 113,960 | 4,010,252 |
| Bank OZK | | 297,900 | 7,685,820 |
| BayCom Corp. (a) | | 161,782 | 3,575,382 |
| BOK Financial Corp. | | 85,800 | 6,532,812 |
| Cadence Bancorp Class A | | 457,128 | 7,026,057 |
| Camden National Corp. | | 34,032 | 1,410,967 |
| Community Trust Bancorp, Inc. | | 127,886 | 4,974,765 |
| ConnectOne Bancorp, Inc. | | 110,100 | 2,254,848 |
| Cullen/Frost Bankers, Inc. | | 10,800 | 896,508 |
| East West Bancorp, Inc. | | 205,600 | 8,456,328 |
| First Citizens Bancshares, Inc. | | 17,100 | 7,602,660 |
| First Hawaiian, Inc. | | 342,500 | 8,802,250 |
| First Horizon National Corp. | | 499,666 | 7,909,713 |
| First Interstate Bancsystem, Inc. | | 236,700 | 9,231,300 |
| Great Western Bancorp, Inc. | | 146,200 | 4,361,146 |
| Hilltop Holdings, Inc. | | 222,100 | 5,274,875 |
| Huntington Bancshares, Inc. | | 1,286,400 | 17,044,800 |
| KeyCorp | | 1,029,900 | 17,096,340 |
| Lakeland Financial Corp. | | 94,600 | 4,004,418 |
| M&T Bank Corp. | | 64,700 | 9,459,787 |
| PacWest Bancorp | | 154,636 | 5,269,995 |
| PNC Financial Services Group, Inc. | | 160,691 | 20,717,891 |
| Preferred Bank, Los Angeles (b) | | 86,195 | 4,306,302 |
| Regions Financial Corp. | | 678,600 | 9,921,132 |
| Sierra Bancorp | | 88,000 | 2,168,320 |
| Signature Bank | | 60,090 | 7,009,499 |
| SunTrust Banks, Inc. | | 330,000 | 20,298,300 |
| Trico Bancshares | | 99,187 | 3,507,252 |
| UMB Financial Corp. | | 81,366 | 5,070,729 |
| Univest Corp. of Pennsylvania | | 160,800 | 4,069,848 |
| WesBanco, Inc. | | 179,700 | 6,149,334 |
| Wintrust Financial Corp. | | 144,300 | 9,066,369 |
| Zions Bancorp NA (b) | | 190,650 | 7,833,809 |
| | | | 249,825,111 |
|
| TOTAL BANKS | | | 353,214,186 |
|
| Capital Markets - 2.7% | | | |
| Asset Management & Custody Banks - 2.7% | | | |
| Northern Trust Corp. | | 42,200 | 3,710,646 |
| State Street Corp. | | 139,600 | 7,162,876 |
| | | | 10,873,522 |
| Consumer Finance - 5.2% | | | |
| Consumer Finance - 5.2% | | | |
| Capital One Financial Corp. | | 119,100 | 10,316,442 |
| OneMain Holdings, Inc. | | 219,000 | 7,851,150 |
| SLM Corp. | | 395,000 | 3,333,800 |
| | | | 21,501,392 |
| IT Services - 0.4% | | | |
| Data Processing & Outsourced Services - 0.4% | | | |
| GreenSky, Inc. Class A (a)(b) | | 215,300 | 1,464,040 |
| Software - 0.6% | | | |
| Application Software - 0.6% | | | |
| Cardlytics, Inc. (a) | | 66,094 | 2,483,152 |
| Thrifts & Mortgage Finance - 3.3% | | | |
| Thrifts & Mortgage Finance - 3.3% | | | |
| Essent Group Ltd. | | 105,929 | 5,137,557 |
| LendingTree, Inc. (a) | | 100 | 31,009 |
| Meridian Bancorp, Inc. Maryland | | 65 | 1,136 |
| MGIC Investment Corp. | | 250,600 | 3,170,090 |
| NMI Holdings, Inc. (a) | | 36,402 | 1,031,633 |
| Radian Group, Inc. | | 184,936 | 4,170,307 |
| | | | 13,541,732 |
| TOTAL COMMON STOCKS | | | |
| (Cost $354,492,598) | | | 403,078,024 |
|
| Money Market Funds - 0.9% | | | |
| Fidelity Securities Lending Cash Central Fund 2.13% (c)(d) | | | |
| (Cost $3,642,170) | | 3,641,806 | 3,642,170 |
| TOTAL INVESTMENT IN SECURITIES - 99.4% | | | |
| (Cost $358,134,768) | | | 406,720,194 |
| NET OTHER ASSETS (LIABILITIES) - 0.6% | | | 2,564,485 |
| NET ASSETS - 100% | | | $409,284,679 |
Legend
(a) Non-income producing
(b) Security or a portion of the security is on loan at period end.
(c) Affiliated fund that is generally available only to investment companies and other accounts managed by Fidelity Investments. The rate quoted is the annualized seven-day yield of the fund at period end. A complete unaudited listing of the fund's holdings as of its most recent quarter end is available upon request. In addition, each Fidelity Central Fund's financial statements are available on the SEC's website or upon request.
(d) Investment made with cash collateral received from securities on loan.
Affiliated Central Funds
Information regarding fiscal year to date income earned by the Fund from investments in Fidelity Central Funds is as follows:
| Fund | Income earned |
| Fidelity Cash Central Fund | $10,932 |
| Fidelity Securities Lending Cash Central Fund | 19,429 |
| Total | $30,361 |
Amounts in the income column in the above table include any capital gain distributions from underlying funds, which are presented in the corresponding line-item in the Statement of Operations, if applicable. Amount for Fidelity Securities Lending Cash Central Fund represents the income earned on investing cash collateral, less rebates paid to borrowers and any lending agent fees associated with the loan, plus any premium payments received for lending certain types of securities.
Investment Valuation
All investments are categorized as Level 1 under the Fair Value Hierarchy. The inputs or methodology used for valuing securities may not be an indication of the risk associated with investing in those securities. For more information on valuation inputs please refer to the Investment Valuation section in the accompanying Notes to Financial Statements.
See accompanying notes which are an integral part of the financial statements.
Banking Portfolio
Financial Statements
Statement of Assets and Liabilities
| | | August 31, 2019 (Unaudited) |
| Assets | | |
Investment in securities, at value (including securities loaned of $3,569,210) — See accompanying schedule:
Unaffiliated issuers (cost $354,492,598) | $403,078,024 | |
| Fidelity Central Funds (cost $3,642,170) | 3,642,170 | |
| Total Investment in Securities (cost $358,134,768) | | $406,720,194 |
| Receivable for investments sold | | 9,561,695 |
| Receivable for fund shares sold | | 110,709 |
| Dividends receivable | | 1,577,481 |
| Distributions receivable from Fidelity Central Funds | | 12,594 |
| Prepaid expenses | | 6,703 |
| Other receivables | | 3,566 |
| Total assets | | 417,992,942 |
| Liabilities | | |
| Payable to custodian bank | $328,644 | |
| Payable for investments purchased | 2,116,215 | |
| Payable for fund shares redeemed | 2,333,216 | |
| Accrued management fee | 185,403 | |
| Other affiliated payables | 80,932 | |
| Other payables and accrued expenses | 21,683 | |
| Collateral on securities loaned | 3,642,170 | |
| Total liabilities | | 8,708,263 |
| Net Assets | | $409,284,679 |
| Net Assets consist of: | | |
| Paid in capital | | $347,210,060 |
| Total distributable earnings (loss) | | 62,074,619 |
| Net Assets, for 16,638,235 shares outstanding | | $409,284,679 |
| Net Asset Value, offering price and redemption price per share ($409,284,679 ÷ 16,638,235 shares) | | $24.60 |
See accompanying notes which are an integral part of the financial statements.
Statement of Operations
| | | Six months ended August 31, 2019 (Unaudited) |
| Investment Income | | |
| Dividends | | $6,913,565 |
| Income from Fidelity Central Funds (including $19,429 from security lending) | | 30,361 |
| Total income | | 6,943,926 |
| Expenses | | |
| Management fee | $1,235,736 | |
| Transfer agent fees | 424,382 | |
| Accounting and security lending fees | 89,679 | |
| Custodian fees and expenses | 2,872 | |
| Independent trustees' fees and expenses | 1,323 | |
| Registration fees | 20,878 | |
| Audit | 19,287 | |
| Legal | 2,629 | |
| Miscellaneous | 2,791 | |
| Total expenses before reductions | 1,799,577 | |
| Expense reductions | (9,199) | |
| Total expenses after reductions | | 1,790,378 |
| Net investment income (loss) | | 5,153,548 |
| Realized and Unrealized Gain (Loss) | | |
| Net realized gain (loss) on: | | |
| Investment securities: | | |
| Unaffiliated issuers | 10,536,133 | |
| Total net realized gain (loss) | | 10,536,133 |
| Change in net unrealized appreciation (depreciation) on investment securities | | (39,350,390) |
| Net gain (loss) | | (28,814,257) |
| Net increase (decrease) in net assets resulting from operations | | $(23,660,709) |
See accompanying notes which are an integral part of the financial statements.
Statement of Changes in Net Assets
| | Six months ended August 31, 2019 (Unaudited) | Year ended February 28, 2019 |
| Increase (Decrease) in Net Assets | | |
| Operations | | |
| Net investment income (loss) | $5,153,548 | $9,788,529 |
| Net realized gain (loss) | 10,536,133 | 102,235,585 |
| Change in net unrealized appreciation (depreciation) | (39,350,390) | (165,933,677) |
| Net increase (decrease) in net assets resulting from operations | (23,660,709) | (53,909,563) |
| Distributions to shareholders | (10,527,630) | (139,846,212) |
| Share transactions | | |
| Proceeds from sales of shares | 28,482,207 | 151,956,223 |
| Reinvestment of distributions | 10,037,536 | 131,871,083 |
| Cost of shares redeemed | (109,696,259) | (405,666,643) |
| Net increase (decrease) in net assets resulting from share transactions | (71,176,516) | (121,839,337) |
| Total increase (decrease) in net assets | (105,364,855) | (315,595,112) |
| Net Assets | | |
| Beginning of period | 514,649,534 | 830,244,646 |
| End of period | $409,284,679 | $514,649,534 |
| Other Information | | |
| Shares | | |
| Sold | 1,114,879 | 4,816,713 |
| Issued in reinvestment of distributions | 396,114 | 5,072,697 |
| Redeemed | (4,350,723) | (12,960,820) |
| Net increase (decrease) | (2,839,730) | (3,071,410) |
See accompanying notes which are an integral part of the financial statements.
Financial Highlights
Banking Portfolio
| | Six months ended (Unaudited) August 31, | Years endedFebruary 28, | | | | |
| | 2019 | 2019 | 2018 | 2017 | 2016 A | 2015 |
| Selected Per–Share Data | | | | | | |
| Net asset value, beginning of period | $26.42 | $36.82 | $33.63 | $21.70 | $26.24 | $26.11 |
| Income from Investment Operations | | | | | | |
| Net investment income (loss)B | .28 | .49 | .42 | .33 | .33 | .30 |
| Net realized and unrealized gain (loss) | (1.53) | (3.62) | 3.68 | 11.85 | (3.43) | 1.04 |
| Total from investment operations | (1.25) | (3.13) | 4.10 | 12.18 | (3.10) | 1.34 |
| Distributions from net investment income | (.06) | (.54) | (.33) | (.25) | (.28) | (.34) |
| Distributions from net realized gain | (.51) | (6.73) | (.58) | – | (1.16) | (.87) |
| Total distributions | (.57) | (7.27) | (.91) | (.25) | (1.44) | (1.21) |
| Redemption fees added to paid in capitalB | – | – | –C | –C | –C | –C |
| Net asset value, end of period | $24.60 | $26.42 | $36.82 | $33.63 | $21.70 | $26.24 |
| Total ReturnD,E | (4.81)% | (6.57)% | 12.31% | 56.16% | (12.57)% | 5.30% |
| Ratios to Average Net AssetsF,G | | | | | | |
| Expenses before reductions | .78%H | .77% | .77% | .79% | .79% | .80% |
| Expenses net of fee waivers, if any | .78%H | .77% | .77% | .79% | .79% | .80% |
| Expenses net of all reductions | .78%H | .76% | .77% | .79% | .79% | .79% |
| Net investment income (loss) | 2.24%H | 1.54% | 1.26% | 1.20% | 1.27% | 1.14% |
| Supplemental Data | | | | | | |
| Net assets, end of period (000 omitted) | $409,285 | $514,650 | $830,245 | $1,261,859 | $565,479 | $584,635 |
| Portfolio turnover rateI | 21%H | 44% | 35% | 34% | 63% | 65% |
A For the year ended February 29.
B Calculated based on average shares outstanding during the period.
C Amount represents less than $.005 per share.
D Total returns for periods of less than one year are not annualized.
E Total returns would have been lower if certain expenses had not been reduced during the applicable periods shown.
F Fees and expenses of any underlying Fidelity Central Funds are not included in the Fund's expense ratio. The Fund indirectly bears its proportionate share of the expenses of any underlying Fidelity Central Funds.
G Expense ratios reflect operating expenses of the Fund. Expenses before reductions do not reflect amounts reimbursed by the investment adviser or reductions from brokerage service arrangements or reductions from other expense offset arrangements and do not represent the amount paid by the Fund during periods when reimbursements or reductions occur. Expenses net of fee waivers reflect expenses after reimbursement by the investment adviser but prior to reductions from brokerage service arrangements or other expense offset arrangements. Expenses net of all reductions represent the net expenses paid by the Fund.
H Annualized
I Amount does not include the portfolio activity of any underlying Fidelity Central Funds.
See accompanying notes which are an integral part of the financial statements.
Brokerage and Investment Management Portfolio
Investment Summary (Unaudited)
Top Ten Stocks as of August 31, 2019
| | % of fund's net assets |
| S&P Global, Inc. | 7.8 |
| BlackRock, Inc. Class A | 7.3 |
| IntercontinentalExchange, Inc. | 6.6 |
| CME Group, Inc. | 6.4 |
| Morgan Stanley | 5.9 |
| Charles Schwab Corp. | 5.8 |
| MSCI, Inc. | 5.2 |
| TD Ameritrade Holding Corp. | 4.6 |
| T. Rowe Price Group, Inc. | 4.6 |
| The NASDAQ OMX Group, Inc. | 4.5 |
| | 58.7 |
Top Industries (% of fund's net assets)
| As of August 31, 2019 |
| | Capital Markets | 99.9% |
| | All Others* | 0.1% |

* Includes short-term investments and net other assets (liabilities).
Brokerage and Investment Management Portfolio
Schedule of Investments August 31, 2019 (Unaudited)
Showing Percentage of Net Assets
| Common Stocks - 99.9% | | | |
| | | Shares | Value |
| Capital Markets - 99.9% | | | |
| Asset Management & Custody Banks - 27.3% | | | |
| AllianceBernstein Holding LP | | 27,000 | $763,560 |
| Ameriprise Financial, Inc. | | 103,500 | 13,349,430 |
| Apollo Global Management LLC Class A | | 279,800 | 10,556,854 |
| Bank of New York Mellon Corp. | | 211,300 | 8,887,278 |
| BlackRock, Inc. Class A | | 53,700 | 22,691,472 |
| Eaton Vance Corp. (non-vtg.) | | 18,700 | 806,344 |
| KKR & Co. LP | | 59,200 | 1,529,728 |
| Northern Trust Corp. | | 60,100 | 5,284,593 |
| State Street Corp. | | 128,000 | 6,567,680 |
| T. Rowe Price Group, Inc. | | 127,600 | 14,115,112 |
| | | | 84,552,051 |
| Financial Exchanges & Data - 40.2% | | | |
| Cboe Global Markets, Inc. | | 94,138 | 11,217,484 |
| CME Group, Inc. | | 90,800 | 19,729,932 |
| IntercontinentalExchange, Inc. | | 218,400 | 20,416,032 |
| MarketAxess Holdings, Inc. | | 23,400 | 9,304,308 |
| Moody's Corp. | | 44,500 | 9,593,310 |
| MSCI, Inc. | | 68,600 | 16,095,618 |
| S&P Global, Inc. | | 92,600 | 24,093,594 |
| The NASDAQ OMX Group, Inc. | | 140,000 | 13,977,600 |
| | | | 124,427,878 |
| Investment Banking & Brokerage - 32.4% | | | |
| BGC Partners, Inc. Class A | | 400,800 | 2,044,080 |
| Charles Schwab Corp. | | 465,080 | 17,798,612 |
| E*TRADE Financial Corp. | | 199,200 | 8,314,608 |
| Goldman Sachs Group, Inc. | | 31,900 | 6,504,729 |
| Interactive Brokers Group, Inc. | | 28,900 | 1,364,080 |
| LPL Financial | | 181,900 | 13,633,405 |
| Moelis & Co. Class A | | 62,400 | 2,092,272 |
| Morgan Stanley | | 439,000 | 18,214,110 |
| PJT Partners, Inc. | | 99,512 | 4,140,694 |
| Raymond James Financial, Inc. | | 104,700 | 8,219,997 |
| TD Ameritrade Holding Corp. | | 322,500 | 14,322,225 |
| Tradeweb Markets, Inc. Class A | | 1,400 | 59,626 |
| Virtu Financial, Inc. Class A (a) | | 178,800 | 3,361,440 |
| | | | 100,069,878 |
|
| TOTAL CAPITAL MARKETS | | | 309,049,807 |
|
| Real Estate Management & Development - 0.0% | | | |
| Real Estate Services - 0.0% | | | |
| Newmark Group, Inc. | | 49 | 425 |
| TOTAL COMMON STOCKS | | | |
| (Cost $243,096,392) | | | 309,050,232 |
|
| Money Market Funds - 1.2% | | | |
| Fidelity Cash Central Fund 2.13% (b) | | 470,689 | 470,783 |
| Fidelity Securities Lending Cash Central Fund 2.13% (b)(c) | | 3,352,182 | 3,352,517 |
| TOTAL MONEY MARKET FUNDS | | | |
| (Cost $3,823,300) | | | 3,823,300 |
| TOTAL INVESTMENT IN SECURITIES - 101.1% | | | |
| (Cost $246,919,692) | | | 312,873,532 |
| NET OTHER ASSETS (LIABILITIES) - (1.1)% | | | (3,465,843) |
| NET ASSETS - 100% | | | $309,407,689 |
Legend
(a) Security or a portion of the security is on loan at period end.
(b) Affiliated fund that is generally available only to investment companies and other accounts managed by Fidelity Investments. The rate quoted is the annualized seven-day yield of the fund at period end. A complete unaudited listing of the fund's holdings as of its most recent quarter end is available upon request. In addition, each Fidelity Central Fund's financial statements are available on the SEC's website or upon request.
(c) Investment made with cash collateral received from securities on loan.
Affiliated Central Funds
Information regarding fiscal year to date income earned by the Fund from investments in Fidelity Central Funds is as follows:
| Fund | Income earned |
| Fidelity Cash Central Fund | $39,389 |
| Fidelity Securities Lending Cash Central Fund | 1,588 |
| Total | $40,977 |
Amounts in the income column in the above table include any capital gain distributions from underlying funds, which are presented in the corresponding line-item in the Statement of Operations, if applicable. Amount for Fidelity Securities Lending Cash Central Fund represents the income earned on investing cash collateral, less rebates paid to borrowers and any lending agent fees associated with the loan, plus any premium payments received for lending certain types of securities.
Investment Valuation
All investments are categorized as Level 1 under the Fair Value Hierarchy. The inputs or methodology used for valuing securities may not be an indication of the risk associated with investing in those securities. For more information on valuation inputs please refer to the Investment Valuation section in the accompanying Notes to Financial Statements.
See accompanying notes which are an integral part of the financial statements.
Brokerage and Investment Management Portfolio
Financial Statements
Statement of Assets and Liabilities
| | | August 31, 2019 (Unaudited) |
| Assets | | |
Investment in securities, at value (including securities loaned of $3,361,440) — See accompanying schedule:
Unaffiliated issuers (cost $243,096,392) | $309,050,232 | |
| Fidelity Central Funds (cost $3,823,300) | 3,823,300 | |
| Total Investment in Securities (cost $246,919,692) | | $312,873,532 |
| Cash | | 5,737 |
| Receivable for investments sold | | 1,501,497 |
| Receivable for fund shares sold | | 5,816 |
| Dividends receivable | | 256,366 |
| Distributions receivable from Fidelity Central Funds | | 947 |
| Prepaid expenses | | 3,883 |
| Other receivables | | 41,754 |
| Total assets | | 314,689,532 |
| Liabilities | | |
| Payable for investments purchased | $1,548,802 | |
| Payable for fund shares redeemed | 129,418 | |
| Accrued management fee | 136,378 | |
| Other affiliated payables | 56,005 | |
| Other payables and accrued expenses | 58,740 | |
| Collateral on securities loaned | 3,352,500 | |
| Total liabilities | | 5,281,843 |
| Net Assets | | $309,407,689 |
| Net Assets consist of: | | |
| Paid in capital | | $237,967,108 |
| Total distributable earnings (loss) | | 71,440,581 |
| Net Assets, for 4,223,161 shares outstanding | | $309,407,689 |
| Net Asset Value, offering price and redemption price per share ($309,407,689 ÷ 4,223,161 shares) | | $73.26 |
See accompanying notes which are an integral part of the financial statements.
Statement of Operations
| | | Six months ended August 31, 2019 (Unaudited) |
| Investment Income | | |
| Dividends | | $3,372,955 |
| Income from Fidelity Central Funds (including $1,588 from security lending) | | 40,977 |
| Total income | | 3,413,932 |
| Expenses | | |
| Management fee | $846,474 | |
| Transfer agent fees | 279,078 | |
| Accounting and security lending fees | 61,391 | |
| Custodian fees and expenses | 1,066 | |
| Independent trustees' fees and expenses | 877 | |
| Registration fees | 15,936 | |
| Audit | 19,108 | |
| Legal | 2,194 | |
| Miscellaneous | 1,391 | |
| Total expenses before reductions | 1,227,515 | |
| Expense reductions | (5,634) | |
| Total expenses after reductions | | 1,221,881 |
| Net investment income (loss) | | 2,192,051 |
| Realized and Unrealized Gain (Loss) | | |
| Net realized gain (loss) on: | | |
| Investment securities: | | |
| Unaffiliated issuers | 4,037,005 | |
| Fidelity Central Funds | 27 | |
| Total net realized gain (loss) | | 4,037,032 |
| Change in net unrealized appreciation (depreciation) on: | | |
| Investment securities: | | |
| Unaffiliated issuers | 5,492,952 | |
| Fidelity Central Funds | (10) | |
| Assets and liabilities in foreign currencies | (927) | |
| Total change in net unrealized appreciation (depreciation) | | 5,492,015 |
| Net gain (loss) | | 9,529,047 |
| Net increase (decrease) in net assets resulting from operations | | $11,721,098 |
See accompanying notes which are an integral part of the financial statements.
Statement of Changes in Net Assets
| | Six months ended August 31, 2019 (Unaudited) | Year ended February 28, 2019 |
| Increase (Decrease) in Net Assets | | |
| Operations | | |
| Net investment income (loss) | $2,192,051 | $3,778,261 |
| Net realized gain (loss) | 4,037,032 | 11,468,298 |
| Change in net unrealized appreciation (depreciation) | 5,492,015 | (49,108,346) |
| Net increase (decrease) in net assets resulting from operations | 11,721,098 | (33,861,787) |
| Distributions to shareholders | (5,284,991) | (30,375,735) |
| Share transactions | | |
| Proceeds from sales of shares | 8,480,215 | 45,360,056 |
| Reinvestment of distributions | 4,922,599 | 28,526,962 |
| Cost of shares redeemed | (37,558,923) | (144,502,646) |
| Net increase (decrease) in net assets resulting from share transactions | (24,156,109) | (70,615,628) |
| Total increase (decrease) in net assets | (17,720,002) | (134,853,150) |
| Net Assets | | |
| Beginning of period | 327,127,691 | 461,980,841 |
| End of period | $309,407,689 | $327,127,691 |
| Other Information | | |
| Shares | | |
| Sold | 116,483 | 587,267 |
| Issued in reinvestment of distributions | 69,587 | 390,034 |
| Redeemed | (524,898) | (1,884,257) |
| Net increase (decrease) | (338,828) | (906,956) |
See accompanying notes which are an integral part of the financial statements.
Financial Highlights
Brokerage and Investment Management Portfolio
| | Six months ended (Unaudited) August 31, | Years endedFebruary 28, | | | | |
| | 2019 | 2019 | 2018 | 2017 | 2016 A | 2015 |
| Selected Per–Share Data | | | | | | |
| Net asset value, beginning of period | $71.71 | $84.47 | $71.13 | $54.65 | $74.78 | $71.99 |
| Income from Investment Operations | | | | | | |
| Net investment income (loss)B | .50 | .77 | 1.15 | .89 | .72 | .96 |
| Net realized and unrealized gain (loss) | 2.27 | (7.60) | 17.88 | 16.44 | (16.77) | 4.39 |
| Total from investment operations | 2.77 | (6.83) | 19.03 | 17.33 | (16.05) | 5.35 |
| Distributions from net investment income | (.05) | (.96) | (.82) | (.83) | (.74) | (.83) |
| Distributions from net realized gain | (1.17) | (4.96) | (4.87) | (.01) | (3.34) | (1.73) |
| Total distributions | (1.22) | (5.93)C | (5.69) | (.85)D | (4.08) | (2.56) |
| Redemption fees added to paid in capitalB | – | – | –E | –E | –E | –E |
| Net asset value, end of period | $73.26 | $71.71 | $84.47 | $71.13 | $54.65 | $74.78 |
| Total ReturnF,G | 3.92% | (8.04)% | 27.51% | 31.76% | (22.23)% | 7.43% |
| Ratios to Average Net AssetsH,I | | | | | | |
| Expenses before reductions | .78%J | .78% | .79% | .82% | .79% | .79% |
| Expenses net of fee waivers, if any | .78%J | .77% | .79% | .82% | .79% | .79% |
| Expenses net of all reductions | .77%J | .77% | .78% | .80% | .78% | .79% |
| Net investment income (loss) | 1.39%J | 1.01% | 1.49% | 1.43% | 1.02% | 1.32% |
| Supplemental Data | | | | | | |
| Net assets, end of period (000 omitted) | $309,408 | $327,128 | $461,981 | $405,283 | $310,570 | $577,953 |
| Portfolio turnover rateK | 11%J | 30% | 75% | 146% | 67% | 31% |
A For the year ended February 29.
B Calculated based on average shares outstanding during the period.
C Total distributions of $5.93 per share is comprised of distributions from net investment income of $.963 and distributions from net realized gain of $4.962 per share.
D Total distributions of $.85 per share is comprised of distributions from net investment income of $.831 and distributions from net realized gain of $.014 per share.
E Amount represents less than $.005 per share.
F Total returns for periods of less than one year are not annualized.
G Total returns would have been lower if certain expenses had not been reduced during the applicable periods shown.
H Fees and expenses of any underlying Fidelity Central Funds are not included in the Fund's expense ratio. The Fund indirectly bears its proportionate share of the expenses of any underlying Fidelity Central Funds.
I Expense ratios reflect operating expenses of the Fund. Expenses before reductions do not reflect amounts reimbursed by the investment adviser or reductions from brokerage service arrangements or reductions from other expense offset arrangements and do not represent the amount paid by the Fund during periods when reimbursements or reductions occur. Expenses net of fee waivers reflect expenses after reimbursement by the investment adviser but prior to reductions from brokerage service arrangements or other expense offset arrangements. Expenses net of all reductions represent the net expenses paid by the Fund.
J Annualized
K Amount does not include the portfolio activity of any underlying Fidelity Central Funds.
See accompanying notes which are an integral part of the financial statements.
Consumer Finance Portfolio
Investment Summary (Unaudited)
Top Ten Stocks as of August 31, 2019
| | % of fund's net assets |
| MasterCard, Inc. Class A | 7.7 |
| Visa, Inc. Class A | 7.4 |
| Ally Financial, Inc. | 6.9 |
| American Express Co. | 6.7 |
| Synchrony Financial | 6.6 |
| Capital One Financial Corp. | 6.0 |
| AGNC Investment Corp. | 5.5 |
| OneMain Holdings, Inc. | 3.7 |
| Credit Acceptance Corp. | 3.5 |
| MGIC Investment Corp. | 3.4 |
| | 57.4 |
Top Industries (% of fund's net assets)
| As of August 31, 2019 |
| | Consumer Finance | 46.8% |
| | IT Services | 21.0% |
| | Mortgage Real Estate Investment Trusts | 15.0% |
| | Thrifts & Mortgage Finance | 10.1% |
| | Banks | 4.7% |
| | All Others* | 2.4% |

* Includes short-term investments and net other assets (liabilities).
Consumer Finance Portfolio
Schedule of Investments August 31, 2019 (Unaudited)
Showing Percentage of Net Assets
| Common Stocks - 98.7% | | | |
| | | Shares | Value |
| Banks - 4.7% | | | |
| Diversified Banks - 1.5% | | | |
| Merchants Bancorp/IN | | 11,300 | $179,218 |
| Wells Fargo & Co. | | 45,800 | 2,132,906 |
| | | | 2,312,124 |
| Regional Banks - 3.2% | | | |
| Huntington Bancshares, Inc. | | 138,900 | 1,840,425 |
| Signature Bank | | 28,500 | 3,324,525 |
| | | | 5,164,950 |
|
| TOTAL BANKS | | | 7,477,074 |
|
| Consumer Finance - 46.8% | | | |
| Consumer Finance - 46.8% | | | |
| Ally Financial, Inc. | | 351,500 | 11,019,525 |
| American Express Co. | | 88,200 | 10,616,634 |
| Capital One Financial Corp. | | 109,800 | 9,510,876 |
| Credit Acceptance Corp. (a) | | 12,275 | 5,556,279 |
| Discover Financial Services | | 67,100 | 5,365,987 |
| First Cash Financial Services, Inc. | | 49,911 | 4,927,713 |
| LendingClub Corp. (a) | | 17,820 | 233,264 |
| Navient Corp. | | 144,700 | 1,843,478 |
| Network International Holdings PLC (b) | | 34,100 | 249,372 |
| OneMain Holdings, Inc. | | 165,419 | 5,930,271 |
| Santander Consumer U.S.A. Holdings, Inc. | | 179,300 | 4,681,523 |
| SLM Corp. | | 467,500 | 3,945,700 |
| Synchrony Financial | | 326,300 | 10,457,915 |
| | | | 74,338,537 |
| IT Services - 21.0% | | | |
| Data Processing & Outsourced Services - 21.0% | | | |
| Alliance Data Systems Corp. | | 8,200 | 1,008,190 |
| Fidelity National Information Services, Inc. | | 22,010 | 2,998,202 |
| FleetCor Technologies, Inc. (a) | | 3,000 | 895,200 |
| MasterCard, Inc. Class A | | 43,600 | 12,267,730 |
| PayPal Holdings, Inc. (a) | | 13,000 | 1,417,650 |
| Total System Services, Inc. | | 12,800 | 1,718,016 |
| Visa, Inc. Class A | | 64,736 | 11,705,564 |
| WEX, Inc. (a) | | 6,400 | 1,309,120 |
| | | | 33,319,672 |
| Mortgage Real Estate Investment Trusts - 15.0% | | | |
| Mortgage REITs - 15.0% | | | |
| AGNC Investment Corp. | | 589,300 | 8,762,891 |
| Annaly Capital Management, Inc. | | 314,115 | 2,607,155 |
| Invesco Mortgage Capital, Inc. | | 117,157 | 1,760,870 |
| MFA Financial, Inc. | | 511,900 | 3,670,323 |
| New Residential Investment Corp. | | 345,350 | 4,859,075 |
| Redwood Trust, Inc. | | 128,400 | 2,131,440 |
| | | | 23,791,754 |
| Software - 1.1% | | | |
| Application Software - 1.1% | | | |
| Black Knight, Inc. (a) | | 27,100 | 1,686,975 |
| Thrifts & Mortgage Finance - 10.1% | | | |
| Thrifts & Mortgage Finance - 10.1% | | | |
| Axos Financial, Inc. (a)(c) | | 39,500 | 1,023,445 |
| MGIC Investment Corp. | | 431,728 | 5,461,359 |
| NMI Holdings, Inc. (a) | | 9,000 | 255,060 |
| Northwest Bancshares, Inc. | | 18,500 | 292,485 |
| Radian Group, Inc. | | 56,965 | 1,284,561 |
| TFS Financial Corp. | | 106,600 | 1,866,566 |
| Washington Federal, Inc. | | 82,400 | 2,933,440 |
| WSFS Financial Corp. | | 71,400 | 2,943,108 |
| | | | 16,060,024 |
| TOTAL COMMON STOCKS | | | |
| (Cost $126,313,494) | | | 156,674,036 |
|
| Money Market Funds - 2.0% | | | |
| Fidelity Cash Central Fund 2.13% (d) | | 2,873,251 | 2,873,825 |
| Fidelity Securities Lending Cash Central Fund 2.13% (d)(e) | | 259,731 | 259,757 |
| TOTAL MONEY MARKET FUNDS | | | |
| (Cost $3,133,582) | | | 3,133,582 |
| TOTAL INVESTMENT IN SECURITIES - 100.7% | | | |
| (Cost $129,447,076) | | | 159,807,618 |
| NET OTHER ASSETS (LIABILITIES) - (0.7)% | | | (1,174,820) |
| NET ASSETS - 100% | | | $158,632,798 |
Legend
(a) Non-income producing
(b) Security exempt from registration under Rule 144A of the Securities Act of 1933. These securities may be resold in transactions exempt from registration, normally to qualified institutional buyers. At the end of the period, the value of these securities amounted to $249,372 or 0.2% of net assets.
(c) Security or a portion of the security is on loan at period end.
(d) Affiliated fund that is generally available only to investment companies and other accounts managed by Fidelity Investments. The rate quoted is the annualized seven-day yield of the fund at period end. A complete unaudited listing of the fund's holdings as of its most recent quarter end is available upon request. In addition, each Fidelity Central Fund's financial statements are available on the SEC's website or upon request.
(e) Investment made with cash collateral received from securities on loan.
Affiliated Central Funds
Information regarding fiscal year to date income earned by the Fund from investments in Fidelity Central Funds is as follows:
| Fund | Income earned |
| Fidelity Cash Central Fund | $45,967 |
| Fidelity Securities Lending Cash Central Fund | 4,262 |
| Total | $50,229 |
Amounts in the income column in the above table include any capital gain distributions from underlying funds, which are presented in the corresponding line-item in the Statement of Operations, if applicable. Amount for Fidelity Securities Lending Cash Central Fund represents the income earned on investing cash collateral, less rebates paid to borrowers and any lending agent fees associated with the loan, plus any premium payments received for lending certain types of securities.
Investment Valuation
All investments are categorized as Level 1 under the Fair Value Hierarchy. The inputs or methodology used for valuing securities may not be an indication of the risk associated with investing in those securities. For more information on valuation inputs please refer to the Investment Valuation section in the accompanying Notes to Financial Statements.
See accompanying notes which are an integral part of the financial statements.
Consumer Finance Portfolio
Financial Statements
Statement of Assets and Liabilities
| | | August 31, 2019 (Unaudited) |
| Assets | | |
Investment in securities, at value (including securities loaned of $256,509) — See accompanying schedule:
Unaffiliated issuers (cost $126,313,494) | $156,674,036 | |
| Fidelity Central Funds (cost $3,133,582) | 3,133,582 | |
| Total Investment in Securities (cost $129,447,076) | | $159,807,618 |
| Receivable for investments sold | | 256,958 |
| Receivable for fund shares sold | | 306,442 |
| Dividends receivable | | 590,817 |
| Distributions receivable from Fidelity Central Funds | | 7,270 |
| Prepaid expenses | | 1,050 |
| Other receivables | | 770 |
| Total assets | | 160,970,925 |
| Liabilities | | |
| Payable for fund shares redeemed | $1,950,321 | |
| Accrued management fee | 72,428 | |
| Other affiliated payables | 34,328 | |
| Other payables and accrued expenses | 21,175 | |
| Collateral on securities loaned | 259,875 | |
| Total liabilities | | 2,338,127 |
| Net Assets | | $158,632,798 |
| Net Assets consist of: | | |
| Paid in capital | | $127,255,403 |
| Total distributable earnings (loss) | | 31,377,395 |
| Net Assets, for 9,510,002 shares outstanding | | $158,632,798 |
| Net Asset Value, offering price and redemption price per share ($158,632,798 ÷ 9,510,002 shares) | | $16.68 |
See accompanying notes which are an integral part of the financial statements.
Statement of Operations
| | | Six months ended August 31, 2019 (Unaudited) |
| Investment Income | | |
| Dividends | | $2,211,187 |
| Income from Fidelity Central Funds (including $4,262 from security lending) | | 50,229 |
| Total income | | 2,261,416 |
| Expenses | | |
| Management fee | $375,034 | |
| Transfer agent fees | 153,509 | |
| Accounting and security lending fees | 27,214 | |
| Custodian fees and expenses | 2,613 | |
| Independent trustees' fees and expenses | 345 | |
| Registration fees | 26,952 | |
| Audit | 20,152 | |
| Legal | 3,200 | |
| Miscellaneous | 417 | |
| Total expenses before reductions | 609,436 | |
| Expense reductions | (380) | |
| Total expenses after reductions | | 609,056 |
| Net investment income (loss) | | 1,652,360 |
| Realized and Unrealized Gain (Loss) | | |
| Net realized gain (loss) on: | | |
| Investment securities: | | |
| Unaffiliated issuers | (193,511) | |
| Fidelity Central Funds | (118) | |
| Foreign currency transactions | 476 | |
| Total net realized gain (loss) | | (193,153) |
| Change in net unrealized appreciation (depreciation) on investment securities | | 4,647,435 |
| Net gain (loss) | | 4,454,282 |
| Net increase (decrease) in net assets resulting from operations | | $6,106,642 |
See accompanying notes which are an integral part of the financial statements.
Statement of Changes in Net Assets
| | Six months ended August 31, 2019 (Unaudited) | Year ended February 28, 2019 |
| Increase (Decrease) in Net Assets | | |
| Operations | | |
| Net investment income (loss) | $1,652,360 | $1,557,347 |
| Net realized gain (loss) | (193,153) | 3,278,953 |
| Change in net unrealized appreciation (depreciation) | 4,647,435 | (547,465) |
| Net increase (decrease) in net assets resulting from operations | 6,106,642 | 4,288,835 |
| Distributions to shareholders | (99,870) | (7,207,802) |
| Share transactions | | |
| Proceeds from sales of shares | 93,602,973 | 21,726,183 |
| Reinvestment of distributions | 94,787 | 6,892,942 |
| Cost of shares redeemed | (43,405,761) | (27,471,352) |
| Net increase (decrease) in net assets resulting from share transactions | 50,291,999 | 1,147,773 |
| Total increase (decrease) in net assets | 56,298,771 | (1,771,194) |
| Net Assets | | |
| Beginning of period | 102,334,027 | 104,105,221 |
| End of period | $158,632,798 | $102,334,027 |
| Other Information | | |
| Shares | | |
| Sold | 5,623,504 | 1,401,562 |
| Issued in reinvestment of distributions | 5,833 | 473,065 |
| Redeemed | (2,595,871) | (1,787,915) |
| Net increase (decrease) | 3,033,466 | 86,712 |
See accompanying notes which are an integral part of the financial statements.
Financial Highlights
Consumer Finance Portfolio
| | Six months ended (Unaudited) August 31, | Years endedFebruary 28, | | | | |
| | 2019 | 2019 | 2018 | 2017 | 2016 A | 2015 |
| Selected Per–Share Data | | | | | | |
| Net asset value, beginning of period | $15.80 | $16.29 | $14.02 | $10.94 | $14.01 | $16.16 |
| Income from Investment Operations | | | | | | |
| Net investment income (loss)B | .20 | .24 | .20 | .21 | .20 | .22 |
| Net realized and unrealized gain (loss) | .69 | .43 | 2.33C | 3.38 | (1.99) | .95 |
| Total from investment operations | .89 | .67 | 2.53 | 3.59 | (1.79) | 1.17 |
| Distributions from net investment income | (.01) | (.20) | (.26) | (.23) | (.20) | (.30) |
| Distributions from net realized gain | (.01) | (.95) | – | (.28) | (1.08) | (3.03) |
| Total distributions | (.01)D | (1.16)E | (.26) | (.51) | (1.28) | (3.32)F |
| Redemption fees added to paid in capitalB | – | – | –G | –G | –G | –G |
| Net asset value, end of period | $16.68 | $15.80 | $16.29 | $14.02 | $10.94 | $14.01 |
| Total ReturnH,I | 5.66% | 4.83% | 18.07%C | 33.57% | (14.01)% | 7.69% |
| Ratios to Average Net AssetsJ,K | | | | | | |
| Expenses before reductions | .87%L | .87% | .90% | .94% | .90% | .88% |
| Expenses net of fee waivers, if any | .87%L | .87% | .89% | .94% | .89% | .88% |
| Expenses net of all reductions | .87%L | .86% | .89% | .93% | .89% | .88% |
| Net investment income (loss) | 2.36%L | 1.57% | 1.38% | 1.72% | 1.53% | 1.45% |
| Supplemental Data | | | | | | |
| Net assets, end of period (000 omitted) | $158,633 | $102,334 | $104,105 | $101,823 | $86,643 | $134,569 |
| Portfolio turnover rateM | 8%L | 32% | 81% | 44% | 48% | 71% |
A For the year ended February 29.
B Calculated based on average shares outstanding during the period.
C Net realized and unrealized gain (loss) per share reflects proceeds received from litigation which amounted to $.28 per share. Excluding these litigation proceeds, the total return would have been 16.18%.
D Total distributions of $ .01 per share is comprised of distributions from net investment income of $.006 and distributions from net realized gain of $.008 per share.
E Total distributions of $1.16 per share is comprised of distributions from net investment income of $.201 and distributions from net realized gain of $.954 per share.
F Total distributions of $3.32 per share is comprised of distributions from net investment income of $.296 and distributions from net realized gain of $3.026 per share.
G Amount represents less than $.005 per share.
H Total returns for periods of less than one year are not annualized.
I Total returns would have been lower if certain expenses had not been reduced during the applicable periods shown.
J Fees and expenses of any underlying Fidelity Central Funds are not included in the Fund's expense ratio. The Fund indirectly bears its proportionate share of the expenses of any underlying Fidelity Central Funds.
K Expense ratios reflect operating expenses of the Fund. Expenses before reductions do not reflect amounts reimbursed by the investment adviser or reductions from brokerage service arrangements or reductions from other expense offset arrangements and do not represent the amount paid by the Fund during periods when reimbursements or reductions occur. Expenses net of fee waivers reflect expenses after reimbursement by the investment adviser but prior to reductions from brokerage service arrangements or other expense offset arrangements. Expenses net of all reductions represent the net expenses paid by the Fund.
L Annualized
M Amount does not include the portfolio activity of any underlying Fidelity Central Funds.
See accompanying notes which are an integral part of the financial statements.
Financial Services Portfolio
Investment Summary (Unaudited)
Top Ten Stocks as of August 31, 2019
| | % of fund's net assets |
| Citigroup, Inc. | 6.6 |
| Bank of America Corp. | 5.8 |
| Berkshire Hathaway, Inc. Class B | 5.3 |
| Wells Fargo & Co. | 5.2 |
| Capital One Financial Corp. | 3.9 |
| Morgan Stanley | 3.9 |
| The Travelers Companies, Inc. | 3.4 |
| PNC Financial Services Group, Inc. | 3.2 |
| Cboe Global Markets, Inc. | 2.7 |
| Hartford Financial Services Group, Inc. | 2.6 |
| | 42.6 |
Top Industries (% of fund's net assets)
| As of August 31, 2019 |
| | Banks | 37.8% |
| | Insurance | 23.7% |
| | Capital Markets | 17.1% |
| | Consumer Finance | 7.6% |
| | Diversified Financial Services | 5.3% |
| | All Others* | 8.5% |
* Includes short-term investments and net other assets (liabilities).
Financial Services Portfolio
Schedule of Investments August 31, 2019 (Unaudited)
Showing Percentage of Net Assets
| Common Stocks - 99.0% | | | |
| | | Shares | Value |
| Banks - 37.8% | | | |
| Diversified Banks - 18.9% | | | |
| Bank of America Corp. | | 1,046,100 | $28,778,211 |
| Citigroup, Inc. | | 516,300 | 33,223,905 |
| JPMorgan Chase & Co. | | 59,100 | 6,492,726 |
| Wells Fargo & Co. | | 553,800 | 25,790,466 |
| | | | 94,285,308 |
| Regional Banks - 18.9% | | | |
| Ameris Bancorp | | 76,100 | 2,677,959 |
| BOK Financial Corp. | | 28,500 | 2,169,990 |
| Cadence Bancorp Class A | | 159,700 | 2,454,589 |
| Cullen/Frost Bankers, Inc. | | 13,119 | 1,089,008 |
| East West Bancorp, Inc. | | 96,600 | 3,973,158 |
| First Citizens Bancshares, Inc. | | 9,000 | 4,001,400 |
| First Hawaiian, Inc. | | 142,600 | 3,664,820 |
| First Horizon National Corp. | | 203,600 | 3,222,988 |
| First Interstate Bancsystem, Inc. | | 81,400 | 3,174,600 |
| Huntington Bancshares, Inc. | | 906,200 | 12,007,150 |
| KeyCorp | | 332,700 | 5,522,820 |
| M&T Bank Corp. | | 33,300 | 4,868,793 |
| PNC Financial Services Group, Inc. | | 123,000 | 15,858,390 |
| Regions Financial Corp. | | 647,500 | 9,466,450 |
| Signature Bank | | 37,400 | 4,362,710 |
| SunTrust Banks, Inc. | | 140,500 | 8,642,155 |
| WesBanco, Inc. | | 99,700 | 3,411,734 |
| Wintrust Financial Corp. | | 59,500 | 3,738,385 |
| | | | 94,307,099 |
|
| TOTAL BANKS | | | 188,592,407 |
|
| Capital Markets - 17.1% | | | |
| Asset Management & Custody Banks - 4.9% | | | |
| Affiliated Managers Group, Inc. | | 38,000 | 2,911,940 |
| Apollo Global Management LLC Class A | | 179,400 | 6,768,762 |
| Northern Trust Corp. | | 85,100 | 7,482,843 |
| State Street Corp. | | 144,600 | 7,419,426 |
| | | | 24,582,971 |
| Financial Exchanges & Data - 4.4% | | | |
| Cboe Global Markets, Inc. | | 112,600 | 13,417,416 |
| The NASDAQ OMX Group, Inc. | | 82,700 | 8,256,768 |
| | | | 21,674,184 |
| Investment Banking & Brokerage - 7.8% | | | |
| E*TRADE Financial Corp. | | 187,300 | 7,817,902 |
| Hamilton Lane, Inc. Class A | | 79,900 | 4,964,986 |
| Morgan Stanley | | 465,700 | 19,321,893 |
| PJT Partners, Inc. | | 61,800 | 2,571,498 |
| Tradeweb Markets, Inc. Class A | | 23,800 | 1,013,642 |
| Virtu Financial, Inc. Class A (a) | | 162,300 | 3,051,240 |
| | | | 38,741,161 |
|
| TOTAL CAPITAL MARKETS | | | 84,998,316 |
|
| Consumer Finance - 7.6% | | | |
| Consumer Finance - 7.6% | | | |
| Capital One Financial Corp. | | 226,500 | 19,619,430 |
| OneMain Holdings, Inc. | | 261,400 | 9,371,190 |
| SLM Corp. | | 1,043,700 | 8,808,828 |
| | | | 37,799,448 |
| Diversified Financial Services - 5.3% | | | |
| Multi-Sector Holdings - 5.3% | | | |
| Berkshire Hathaway, Inc. Class B (b) | | 129,800 | 26,402,618 |
| Insurance - 23.7% | | | |
| Insurance Brokers - 4.2% | | | |
| Arthur J. Gallagher & Co. | | 96,600 | 8,762,586 |
| Willis Group Holdings PLC | | 60,200 | 11,917,794 |
| | | | 20,680,380 |
| Life & Health Insurance - 3.0% | | | |
| CNO Financial Group, Inc. | | 198,900 | 2,880,072 |
| Globe Life, Inc. | | 78,600 | 7,015,836 |
| Primerica, Inc. | | 42,300 | 5,040,891 |
| | | | 14,936,799 |
| Multi-Line Insurance - 5.9% | | | |
| American International Group, Inc. | | 221,500 | 11,526,860 |
| Assurant, Inc. | | 42,800 | 5,264,400 |
| Hartford Financial Services Group, Inc. | | 219,500 | 12,792,460 |
| | | | 29,583,720 |
| Property & Casualty Insurance - 8.3% | | | |
| Allstate Corp. | | 100,400 | 10,279,956 |
| Beazley PLC | | 703,100 | 4,872,255 |
| FNF Group | | 152,100 | 6,683,274 |
| RSA Insurance Group PLC | | 389,600 | 2,481,258 |
| The Travelers Companies, Inc. | | 115,800 | 17,017,968 |
| | | | 41,334,711 |
| Reinsurance - 2.3% | | | |
| Reinsurance Group of America, Inc. | | 75,600 | 11,640,132 |
|
| TOTAL INSURANCE | | | 118,175,742 |
|
| IT Services - 2.7% | | | |
| Data Processing & Outsourced Services - 2.7% | | | |
| Fidelity National Information Services, Inc. | | 39,400 | 5,367,068 |
| GreenSky, Inc. Class A (a)(b) | | 95,100 | 646,680 |
| Visa, Inc. Class A | | 42,200 | 7,630,604 |
| | | | 13,644,352 |
| Mortgage Real Estate Investment Trusts - 1.4% | | | |
| Mortgage REITs - 1.4% | | | |
| AGNC Investment Corp. | | 274,300 | 4,078,841 |
| MFA Financial, Inc. | | 405,100 | 2,904,567 |
| | | | 6,983,408 |
| Software - 1.3% | | | |
| Application Software - 1.3% | | | |
| Black Knight, Inc. (b) | | 103,900 | 6,467,775 |
| Thrifts & Mortgage Finance - 2.1% | | | |
| Thrifts & Mortgage Finance - 2.1% | | | |
| Essent Group Ltd. | | 113,100 | 5,485,350 |
| MGIC Investment Corp. | | 395,900 | 5,008,135 |
| | | | 10,493,485 |
| TOTAL COMMON STOCKS | | | |
| (Cost $431,163,600) | | | 493,557,551 |
|
| Money Market Funds - 0.7% | | | |
| Fidelity Cash Central Fund 2.13% (c) | | 298,594 | 298,654 |
| Fidelity Securities Lending Cash Central Fund 2.13% (c)(d) | | 3,099,941 | 3,100,251 |
| TOTAL MONEY MARKET FUNDS | | | |
| (Cost $3,398,905) | | | 3,398,905 |
| TOTAL INVESTMENT IN SECURITIES - 99.7% | | | |
| (Cost $434,562,505) | | | 496,956,456 |
| NET OTHER ASSETS (LIABILITIES) - 0.3% | | | 1,359,456 |
| NET ASSETS - 100% | | | $498,315,912 |
Legend
(a) Security or a portion of the security is on loan at period end.
(b) Non-income producing
(c) Affiliated fund that is generally available only to investment companies and other accounts managed by Fidelity Investments. The rate quoted is the annualized seven-day yield of the fund at period end. A complete unaudited listing of the fund's holdings as of its most recent quarter end is available upon request. In addition, each Fidelity Central Fund's financial statements are available on the SEC's website or upon request.
(d) Investment made with cash collateral received from securities on loan.
Affiliated Central Funds
Information regarding fiscal year to date income earned by the Fund from investments in Fidelity Central Funds is as follows:
| Fund | Income earned |
| Fidelity Cash Central Fund | $66,707 |
| Fidelity Securities Lending Cash Central Fund | 3,769 |
| Total | $70,476 |
Amounts in the income column in the above table include any capital gain distributions from underlying funds, which are presented in the corresponding line-item in the Statement of Operations, if applicable. Amount for Fidelity Securities Lending Cash Central Fund represents the income earned on investing cash collateral, less rebates paid to borrowers and any lending agent fees associated with the loan, plus any premium payments received for lending certain types of securities.
Investment Valuation
All investments are categorized as Level 1 under the Fair Value Hierarchy. The inputs or methodology used for valuing securities may not be an indication of the risk associated with investing in those securities. For more information on valuation inputs please refer to the Investment Valuation section in the accompanying Notes to Financial Statements.
See accompanying notes which are an integral part of the financial statements.
Financial Services Portfolio
Financial Statements
Statement of Assets and Liabilities
| | | August 31, 2019 (Unaudited) |
| Assets | | |
Investment in securities, at value (including securities loaned of $3,092,939) — See accompanying schedule:
Unaffiliated issuers (cost $431,163,600) | $493,557,551 | |
| Fidelity Central Funds (cost $3,398,905) | 3,398,905 | |
| Total Investment in Securities (cost $434,562,505) | | $496,956,456 |
| Cash | | 29,945 |
| Receivable for investments sold | | 8,704,829 |
| Receivable for fund shares sold | | 120,966 |
| Dividends receivable | | 1,448,784 |
| Distributions receivable from Fidelity Central Funds | | 7,580 |
| Prepaid expenses | | 10,184 |
| Other receivables | | 17,026 |
| Total assets | | 507,295,770 |
| Liabilities | | |
| Payable for investments purchased | $4,681,965 | |
| Payable for fund shares redeemed | 850,905 | |
| Accrued management fee | 228,636 | |
| Other affiliated payables | 96,425 | |
| Other payables and accrued expenses | 21,708 | |
| Collateral on securities loaned | 3,100,219 | |
| Total liabilities | | 8,979,858 |
| Net Assets | | $498,315,912 |
| Net Assets consist of: | | |
| Paid in capital | | $412,842,344 |
| Total distributable earnings (loss) | | 85,473,568 |
| Net Assets, for 49,865,287 shares outstanding | | $498,315,912 |
| Net Asset Value, offering price and redemption price per share ($498,315,912 ÷ 49,865,287 shares) | | $9.99 |
See accompanying notes which are an integral part of the financial statements.
Statement of Operations
| | | Six months ended August 31, 2019 (Unaudited) |
| Investment Income | | |
| Dividends | | $7,044,508 |
| Income from Fidelity Central Funds (including $3,769 from security lending) | | 70,476 |
| Total income | | 7,114,984 |
| Expenses | | |
| Management fee | $1,455,902 | |
| Transfer agent fees | 488,629 | |
| Accounting and security lending fees | 103,145 | |
| Custodian fees and expenses | 2,024 | |
| Independent trustees' fees and expenses | 1,518 | |
| Registration fees | 22,553 | |
| Audit | 21,900 | |
| Legal | 4,120 | |
| Miscellaneous | 3,462 | |
| Total expenses before reductions | 2,103,253 | |
| Expense reductions | (18,885) | |
| Total expenses after reductions | | 2,084,368 |
| Net investment income (loss) | | 5,030,616 |
| Realized and Unrealized Gain (Loss) | | |
| Net realized gain (loss) on: | | |
| Investment securities: | | |
| Unaffiliated issuers | 14,723,673 | |
| Redemptions in-kind with affiliated entities | 4,465,779 | |
| Fidelity Central Funds | 166 | |
| Foreign currency transactions | (186) | |
| Total net realized gain (loss) | | 19,189,432 |
| Change in net unrealized appreciation (depreciation) on: | | |
| Investment securities: | | |
| Unaffiliated issuers | (5,491,149) | |
| Fidelity Central Funds | (134) | |
| Assets and liabilities in foreign currencies | 55 | |
| Total change in net unrealized appreciation (depreciation) | | (5,491,228) |
| Net gain (loss) | | 13,698,204 |
| Net increase (decrease) in net assets resulting from operations | | $18,728,820 |
See accompanying notes which are an integral part of the financial statements.
Statement of Changes in Net Assets
| | Six months ended August 31, 2019 (Unaudited) | Year ended February 28, 2019 |
| Increase (Decrease) in Net Assets | | |
| Operations | | |
| Net investment income (loss) | $5,030,616 | $9,454,128 |
| Net realized gain (loss) | 19,189,432 | 171,095,579 |
| Change in net unrealized appreciation (depreciation) | (5,491,228) | (251,132,264) |
| Net increase (decrease) in net assets resulting from operations | 18,728,820 | (70,582,557) |
| Distributions to shareholders | – | (77,410,363) |
| Share transactions | | |
| Proceeds from sales of shares | 27,615,058 | 123,696,998 |
| Reinvestment of distributions | – | 73,815,465 |
| Cost of shares redeemed | (106,456,679) | (799,345,128) |
| Net increase (decrease) in net assets resulting from share transactions | (78,841,621) | (601,832,665) |
| Total increase (decrease) in net assets | (60,112,801) | (749,825,585) |
| Net Assets | | |
| Beginning of period | 558,428,713 | 1,308,254,298 |
| End of period | $498,315,912 | $558,428,713 |
| Other Information | | |
| Shares(a) | | |
| Sold | 2,786,958 | 11,614,796 |
| Issued in reinvestment of distributions | – | 7,838,384 |
| Redeemed | (10,775,543) | (73,744,698) |
| Net increase (decrease) | (7,988,585) | (54,291,518) |
(a) Share activity prior to August 10, 2018 has been adjusted to reflect the impact of the 10 for 1 share split that occurred on that date.
See accompanying notes which are an integral part of the financial statements.
Financial Highlights
Financial Services Portfolio
| | Six months ended (Unaudited) August 31, | Years endedFebruary 28, | | | | |
| | 2019 | 2019 | 2018 | 2017 | 2016 A | 2015 |
| Selected Per–Share DataB | | | | | | |
| Net asset value, beginning of period | $9.65 | $11.67 | $10.31 | $7.50 | $8.88 | $8.09 |
| Income from Investment Operations | | | | | | |
| Net investment income (loss)C | .09 | .14 | .09 | .10 | .09 | .08 |
| Net realized and unrealized gain (loss) | .25 | (1.04) | 1.76 | 2.81 | (1.33) | .88 |
| Total from investment operations | .34 | (.90) | 1.85 | 2.91 | (1.24) | .96 |
| Distributions from net investment income | – | (.14) | (.07) | (.10) | (.08) | (.09) |
| Distributions from net realized gain | – | (.98) | (.42) | – | (.06) | (.08) |
| Total distributions | – | (1.12) | (.49) | (.10) | (.14) | (.17) |
| Redemption fees added to paid in capitalC | – | – | – | –D | –D | –D |
| Net asset value, end of period | $9.99 | $9.65 | $11.67 | $10.31 | $7.50 | $8.88 |
| Total ReturnE,F | 3.52% | (6.91)% | 18.33% | 38.78% | (14.18)% | 11.87% |
| Ratios to Average Net AssetsG,H | | | | | | |
| Expenses before reductions | .78%I | .76% | .77% | .77% | .76% | .78% |
| Expenses net of fee waivers, if any | .77%I | .76% | .77% | .77% | .76% | .78% |
| Expenses net of all reductions | .77%I | .75% | .76% | .76% | .75% | .78% |
| Net investment income (loss) | 1.85%I | 1.28% | .87% | 1.10% | 1.01% | .99% |
| Supplemental Data | | | | | | |
| Net assets, end of period (000 omitted) | $498,316 | $558,429 | $1,308,254 | $1,019,656 | $1,043,574 | $1,385,490 |
| Portfolio turnover rateJ | 65%I,K | 49%K | 54% | 84%K | 55% | 42%K |
A For the year ended February 29.
B Per share amounts have been adjusted to reflect the impact of the 10 for 1 share split that occurred on August 10, 2018.
C Calculated based on average shares outstanding during the period.
D Amount represents less than $.005 per share.
E Total returns for periods of less than one year are not annualized.
F Total returns would have been lower if certain expenses had not been reduced during the applicable periods shown.
G Fees and expenses of any underlying Fidelity Central Funds are not included in the Fund's expense ratio. The Fund indirectly bears its proportionate share of the expenses of any underlying Fidelity Central Funds.
H Expense ratios reflect operating expenses of the Fund. Expenses before reductions do not reflect amounts reimbursed by the investment adviser or reductions from brokerage service arrangements or reductions from other expense offset arrangements and do not represent the amount paid by the Fund during periods when reimbursements or reductions occur. Expenses net of fee waivers reflect expenses after reimbursement by the investment adviser but prior to reductions from brokerage service arrangements or other expense offset arrangements. Expenses net of all reductions represent the net expenses paid by the Fund.
I Annualized
J Amount does not include the portfolio activity of any underlying Fidelity Central Funds.
K Portfolio turnover rate excludes securities received or delivered in-kind.
See accompanying notes which are an integral part of the financial statements.
Insurance Portfolio
Investment Summary (Unaudited)
Top Ten Stocks as of August 31, 2019
| | % of fund's net assets |
| Chubb Ltd. | 11.1 |
| The Travelers Companies, Inc. | 8.2 |
| American International Group, Inc. | 6.9 |
| Marsh & McLennan Companies, Inc. | 6.4 |
| Berkshire Hathaway, Inc. Class B | 5.3 |
| MetLife, Inc. | 5.1 |
| Allstate Corp. | 4.5 |
| Hartford Financial Services Group, Inc. | 3.6 |
| Arthur J. Gallagher & Co. | 3.3 |
| Brown & Brown, Inc. | 3.2 |
| | 57.6 |
Top Industries (% of fund's net assets)
| As of August 31, 2019 |
| | Insurance | 88.0% |
| | Diversified Financial Services | 7.4% |
| | Capital Markets | 3.3% |
| | Software | 0.5% |
| | Consumer Finance | 0.3% |
| | All Others* | 0.5% |

* Includes short-term investments and net other assets (liabilities).
Insurance Portfolio
Schedule of Investments August 31, 2019 (Unaudited)
Showing Percentage of Net Assets
| Common Stocks - 99.5% | | | |
| | | Shares | Value |
| Banks - 0.0% | | | |
| Regional Banks - 0.0% | | | |
| Hilltop Holdings, Inc. | | 500 | $11,875 |
| Capital Markets - 3.3% | | | |
| Asset Management & Custody Banks - 3.3% | | | |
| Apollo Global Management LLC Class A | | 90,944 | 3,431,317 |
| Ares Management Corp. | | 170,314 | 4,956,137 |
| | | | 8,387,454 |
| Consumer Finance - 0.3% | | | |
| Consumer Finance - 0.3% | | | |
| OneMain Holdings, Inc. | | 21,900 | 785,115 |
| Diversified Financial Services - 7.4% | | | |
| Multi-Sector Holdings - 5.3% | | | |
| Berkshire Hathaway, Inc. Class B (a) | | 66,800 | 13,587,788 |
| Other Diversified Financial Services - 2.1% | | | |
| Cannae Holdings, Inc. (a) | | 15,499 | 431,182 |
| Voya Financial, Inc. | | 102,600 | 5,060,232 |
| | | | 5,491,414 |
|
| TOTAL DIVERSIFIED FINANCIAL SERVICES | | | 19,079,202 |
|
| Insurance - 88.0% | | | |
| Insurance Brokers - 18.8% | | | |
| Aon PLC | | 38,100 | 7,423,785 |
| Arthur J. Gallagher & Co. | | 93,800 | 8,508,598 |
| Brown & Brown, Inc. | | 223,000 | 8,226,470 |
| Marsh & McLennan Companies, Inc. | | 164,600 | 16,441,894 |
| Willis Group Holdings PLC | | 39,628 | 7,845,155 |
| | | | 48,445,902 |
| Life & Health Insurance - 18.6% | | | |
| AFLAC, Inc. | | 154,200 | 7,737,756 |
| Brighthouse Financial, Inc. (a) | | 17,606 | 620,788 |
| CNO Financial Group, Inc. | | 223,200 | 3,231,936 |
| FBL Financial Group, Inc. Class A | | 300 | 16,269 |
| Genworth Financial, Inc. Class A | | 140,200 | 621,086 |
| Globe Life, Inc. | | 25,000 | 2,231,500 |
| MetLife, Inc. | | 298,575 | 13,226,873 |
| Primerica, Inc. | | 34,800 | 4,147,116 |
| Principal Financial Group, Inc. | | 101,200 | 5,385,864 |
| Prudential Financial, Inc. | | 88,289 | 7,071,066 |
| Sony Financial Holdings, Inc. | | 34,800 | 803,871 |
| Unum Group | | 107,761 | 2,738,207 |
| | | | 47,832,332 |
| Multi-Line Insurance - 13.1% | | | |
| American International Group, Inc. | | 342,150 | 17,805,486 |
| Assurant, Inc. | | 19,900 | 2,447,700 |
| Hartford Financial Services Group, Inc. | | 159,300 | 9,284,004 |
| Loews Corp. | | 72,300 | 3,475,461 |
| Zurich Insurance Group Ltd. | | 2,216 | 788,558 |
| | | | 33,801,209 |
| Property & Casualty Insurance - 34.7% | | | |
| Allstate Corp. | | 113,900 | 11,662,221 |
| Arch Capital Group Ltd. (a) | | 157,500 | 6,221,250 |
| Argo Group International Holdings, Ltd. | | 11,768 | 773,393 |
| Assured Guaranty Ltd. | | 76,500 | 3,255,075 |
| Axis Capital Holdings Ltd. | | 10,800 | 663,012 |
| Chubb Ltd. | | 182,705 | 28,553,138 |
| First American Financial Corp. | | 65,400 | 3,822,630 |
| FNF Group | | 76,600 | 3,365,804 |
| Hanover Insurance Group, Inc. | | 30,800 | 4,101,020 |
| Markel Corp. (a) | | 3,230 | 3,692,148 |
| MBIA, Inc. (a)(b) | | 57,000 | 513,000 |
| Mercury General Corp. | | 200 | 10,700 |
| Progressive Corp. | | 22,600 | 1,713,080 |
| The Travelers Companies, Inc. | | 143,300 | 21,059,368 |
| | | | 89,405,839 |
| Reinsurance - 2.8% | | | |
| Athene Holding Ltd. (a) | | 17,500 | 680,050 |
| Everest Re Group Ltd. | | 3,300 | 778,404 |
| Maiden Holdings Ltd. | | 400 | 192 |
| Reinsurance Group of America, Inc. | | 35,233 | 5,424,825 |
| Third Point Reinsurance Ltd. (a) | | 28,400 | 267,528 |
| | | | 7,150,999 |
|
| TOTAL INSURANCE | | | 226,636,281 |
|
| Road & Rail - 0.0% | | | |
| Trucking - 0.0% | | | |
| Lyft, Inc. | | 1,200 | 58,764 |
| Software - 0.5% | | | |
| Application Software - 0.5% | | | |
| Black Knight, Inc. (a) | | 22,957 | 1,429,073 |
| TOTAL COMMON STOCKS | | | |
| (Cost $150,902,046) | | | 256,387,764 |
|
| Nonconvertible Preferred Stocks - 0.0% | | | |
| Insurance - 0.0% | | | |
| Life & Health Insurance - 0.0% | | | |
| Globe Life, Inc. 6.125% | | | |
| (Cost $73,591) | | 2,959 | 79,863 |
|
| Money Market Funds - 0.7% | | | |
| Fidelity Cash Central Fund 2.13% (c) | | 1,222,616 | 1,222,861 |
| Fidelity Securities Lending Cash Central Fund 2.13% (c)(d) | | 408,809 | 408,850 |
| TOTAL MONEY MARKET FUNDS | | | |
| (Cost $1,631,711) | | | 1,631,711 |
| TOTAL INVESTMENT IN SECURITIES - 100.2% | | | |
| (Cost $152,607,348) | | | 258,099,338 |
| NET OTHER ASSETS (LIABILITIES) - (0.2)% | | | (460,600) |
| NET ASSETS - 100% | | | $257,638,738 |
Legend
(a) Non-income producing
(b) Security or a portion of the security is on loan at period end.
(c) Affiliated fund that is generally available only to investment companies and other accounts managed by Fidelity Investments. The rate quoted is the annualized seven-day yield of the fund at period end. A complete unaudited listing of the fund's holdings as of its most recent quarter end is available upon request. In addition, each Fidelity Central Fund's financial statements are available on the SEC's website or upon request.
(d) Investment made with cash collateral received from securities on loan.
Affiliated Central Funds
Information regarding fiscal year to date income earned by the Fund from investments in Fidelity Central Funds is as follows:
| Fund | Income earned |
| Fidelity Cash Central Fund | $74,428 |
| Fidelity Securities Lending Cash Central Fund | 2,206 |
| Total | $76,634 |
Amounts in the income column in the above table include any capital gain distributions from underlying funds, which are presented in the corresponding line-item in the Statement of Operations, if applicable. Amount for Fidelity Securities Lending Cash Central Fund represents the income earned on investing cash collateral, less rebates paid to borrowers and any lending agent fees associated with the loan, plus any premium payments received for lending certain types of securities.
Investment Valuation
All investments are categorized as Level 1 under the Fair Value Hierarchy. The inputs or methodology used for valuing securities may not be an indication of the risk associated with investing in those securities. For more information on valuation inputs please refer to the Investment Valuation section in the accompanying Notes to Financial Statements.
Other Information
Distribution of investments by country or territory of incorporation, as a percentage of Total Net Assets, is as follows (Unaudited):
| United States of America | 80.5% |
| Switzerland | 11.4% |
| Bermuda | 4.9% |
| United Kingdom | 2.9% |
| Others (Individually Less Than 1%) | 0.3% |
| | 100.0% |
See accompanying notes which are an integral part of the financial statements.
Insurance Portfolio
Financial Statements
Statement of Assets and Liabilities
| | | August 31, 2019 (Unaudited) |
| Assets | | |
Investment in securities, at value (including securities loaned of $397,800) — See accompanying schedule:
Unaffiliated issuers (cost $150,975,637) | $256,467,627 | |
| Fidelity Central Funds (cost $1,631,711) | 1,631,711 | |
| Total Investment in Securities (cost $152,607,348) | | $258,099,338 |
| Receivable for investments sold | | 5,750 |
| Receivable for fund shares sold | | 443,558 |
| Dividends receivable | | 532,046 |
| Distributions receivable from Fidelity Central Funds | | 9,224 |
| Prepaid expenses | | 2,900 |
| Other receivables | | 283 |
| Total assets | | 259,093,099 |
| Liabilities | | |
| Payable for fund shares redeemed | $849,546 | |
| Accrued management fee | 120,859 | |
| Other affiliated payables | 54,134 | |
| Other payables and accrued expenses | 20,972 | |
| Collateral on securities loaned | 408,850 | |
| Total liabilities | | 1,454,361 |
| Net Assets | | $257,638,738 |
| Net Assets consist of: | | |
| Paid in capital | | $146,143,954 |
| Total distributable earnings (loss) | | 111,494,784 |
| Net Assets, for 4,121,023 shares outstanding | | $257,638,738 |
| Net Asset Value, offering price and redemption price per share ($257,638,738 ÷ 4,121,023 shares) | | $62.52 |
See accompanying notes which are an integral part of the financial statements.
Statement of Operations
| | | Six months ended August 31, 2019 (Unaudited) |
| Investment Income | | |
| Dividends | | $2,672,619 |
| Income from Fidelity Central Funds (including $2,206 from security lending) | | 76,634 |
| Total income | | 2,749,253 |
| Expenses | | |
| Management fee | $651,084 | |
| Transfer agent fees | 245,330 | |
| Accounting and security lending fees | 47,225 | |
| Custodian fees and expenses | 2,250 | |
| Independent trustees' fees and expenses | 638 | |
| Registration fees | 24,492 | |
| Audit | 19,105 | |
| Legal | 238 | |
| Interest | 412 | |
| Miscellaneous | 979 | |
| Total expenses before reductions | 991,753 | |
| Expense reductions | (1,402) | |
| Total expenses after reductions | | 990,351 |
| Net investment income (loss) | | 1,758,902 |
| Realized and Unrealized Gain (Loss) | | |
| Net realized gain (loss) on: | | |
| Investment securities: | | |
| Unaffiliated issuers | 4,681,794 | |
| Foreign currency transactions | 21,179 | |
| Total net realized gain (loss) | | 4,702,973 |
| Change in net unrealized appreciation (depreciation) on: | | |
| Investment securities: | | |
| Unaffiliated issuers | 13,188,574 | |
| Assets and liabilities in foreign currencies | (222) | |
| Total change in net unrealized appreciation (depreciation) | | 13,188,352 |
| Net gain (loss) | | 17,891,325 |
| Net increase (decrease) in net assets resulting from operations | | $19,650,227 |
See accompanying notes which are an integral part of the financial statements.
Statement of Changes in Net Assets
| | Six months ended August 31, 2019 (Unaudited) | Year ended February 28, 2019 |
| Increase (Decrease) in Net Assets | | |
| Operations | | |
| Net investment income (loss) | $1,758,902 | $3,699,355 |
| Net realized gain (loss) | 4,702,973 | 40,681,744 |
| Change in net unrealized appreciation (depreciation) | 13,188,352 | (48,058,421) |
| Net increase (decrease) in net assets resulting from operations | 19,650,227 | (3,677,322) |
| Distributions to shareholders | (8,448,623) | (67,803,862) |
| Share transactions | | |
| Proceeds from sales of shares | 81,362,804 | 36,330,834 |
| Reinvestment of distributions | 8,009,734 | 64,608,201 |
| Cost of shares redeemed | (66,016,430) | (148,119,349) |
| Net increase (decrease) in net assets resulting from share transactions | 23,356,108 | (47,180,314) |
| Total increase (decrease) in net assets | 34,557,712 | (118,661,498) |
| Net Assets | | |
| Beginning of period | 223,081,026 | 341,742,524 |
| End of period | $257,638,738 | $223,081,026 |
| Other Information | | |
| Shares | | |
| Sold | 1,297,293 | 576,823 |
| Issued in reinvestment of distributions | 138,242 | 1,067,443 |
| Redeemed | (1,078,620) | (2,234,071) |
| Net increase (decrease) | 356,915 | (589,805) |
See accompanying notes which are an integral part of the financial statements.
Financial Highlights
Insurance Portfolio
| | Six months ended (Unaudited) August 31, | Years endedFebruary 28, | | | | |
| | 2019 | 2019 | 2018 | 2017 | 2016 A | 2015 |
| Selected Per–Share Data | | | | | | |
| Net asset value, beginning of period | $59.27 | $78.49 | $80.60 | $63.15 | $66.87 | $66.08 |
| Income from Investment Operations | | | | | | |
| Net investment income (loss)B | .44 | .98 | 1.08 | .99 | .89 | .96 |
| Net realized and unrealized gain (loss) | 5.17 | (2.40) | 6.76 | 18.64 | (2.50) | 7.13 |
| Total from investment operations | 5.61 | (1.42) | 7.84 | 19.63 | (1.61) | 8.09 |
| Distributions from net investment income | (.12) | (1.16) | (.96) | (.89) | (.74) | (.96) |
| Distributions from net realized gain | (2.24) | (16.63) | (8.99) | (1.29) | (1.37) | (6.34) |
| Total distributions | (2.36) | (17.80)C | (9.95) | (2.18) | (2.11) | (7.30) |
| Redemption fees added to paid in capitalB | – | – | –D | –D | –D | –D |
| Net asset value, end of period | $62.52 | $59.27 | $78.49 | $80.60 | $63.15 | $66.87 |
| Total ReturnE,F | 9.78% | (.29)% | 9.62% | 31.60% | (2.54)% | 13.01% |
| Ratios to Average Net AssetsG,H | | | | | | |
| Expenses before reductions | .82%I | .82% | .79% | .80% | .80% | .81% |
| Expenses net of fee waivers, if any | .82%I | .81% | .79% | .79% | .80% | .81% |
| Expenses net of all reductions | .81%I | .81% | .79% | .79% | .80% | .81% |
| Net investment income (loss) | 1.45%I | 1.48% | 1.30% | 1.37% | 1.32% | 1.44% |
| Supplemental Data | | | | | | |
| Net assets, end of period (000 omitted) | $257,639 | $223,081 | $341,743 | $647,787 | $459,854 | $401,818 |
| Portfolio turnover rateJ | 28%I | 9% | 21% | 16% | 25% | 26% |
A For the year ended February 29.
B Calculated based on average shares outstanding during the period.
C Total distributions of $17.80 per share is comprised of distributions from net investment income of $1.162 and distributions from net realized gain of $16.633 per share.
D Amount represents less than $.005 per share.
E Total returns for periods of less than one year are not annualized.
F Total returns would have been lower if certain expenses had not been reduced during the applicable periods shown.
G Fees and expenses of any underlying Fidelity Central Funds are not included in the Fund's expense ratio. The Fund indirectly bears its proportionate share of the expenses of any underlying Fidelity Central Funds.
H Expense ratios reflect operating expenses of the Fund. Expenses before reductions do not reflect amounts reimbursed by the investment adviser or reductions from brokerage service arrangements or reductions from other expense offset arrangements and do not represent the amount paid by the Fund during periods when reimbursements or reductions occur. Expenses net of fee waivers reflect expenses after reimbursement by the investment adviser but prior to reductions from brokerage service arrangements or other expense offset arrangements. Expenses net of all reductions represent the net expenses paid by the Fund.
I Annualized
J Amount does not include the portfolio activity of any underlying Fidelity Central Funds.
See accompanying notes which are an integral part of the financial statements.
Notes to Financial Statements (Unaudited)
For the period ended August 31, 2019
1. Organization.
Banking Portfolio, Brokerage and Investment Management Portfolio, Financial Services Portfolio, Consumer Finance Portfolio, and Insurance Portfolio (the Funds) are non-diversified funds of Fidelity Select Portfolios (the Trust). The Trust is registered under the Investment Company Act of 1940, as amended (the 1940 Act), as an open-end management investment company organized as a Massachusetts business trust. The Funds invest primarily in securities of companies whose principal business activities fall within specific industries. Each Fund is authorized to issue an unlimited number of shares. Share transactions on the Statement of Changes in Net Assets may contain exchanges between affiliated funds.
Effective August 10, 2018, Financial Services Portfolio underwent a 10 for 1 share split. The effect of the share split transaction was to multiply the number of outstanding shares of Financial Services Portfolio by a split factor of 10:1, with a corresponding decrease in net asset value (NAV) per share. This event does not impact the overall net assets of Financial Services Portfolio. The per share data presented in the Financial Highlights and Share activity presented in the Statements of Changes in Net Assets for Financial Services Portfolio have been retroactively adjusted to reflect this share split.
2. Investments in Fidelity Central Funds.
The Funds invest in Fidelity Central Funds, which are open-end investment companies generally available only to other investment companies and accounts managed by the investment adviser and its affiliates. The Funds' Schedules of Investments list each of the Fidelity Central Funds held as of period end, if any, as an investment of each Fund, but does not include the underlying holdings of each Fidelity Central Fund. As an Investing Fund, each Fund indirectly bears its proportionate share of the expenses of the underlying Fidelity Central Funds.
The Money Market Central Funds seek preservation of capital and current income and are managed by Fidelity Investments Money Management, Inc. (FIMM), an affiliate of the investment adviser. Annualized expenses of the Money Market Central Funds as of their most recent shareholder report date ranged from less than .005% to .01%.
A complete unaudited list of holdings for each Fidelity Central Fund is available upon request or at the Securities and Exchange Commission (the SEC) website at www.sec.gov. In addition, the financial statements of the Fidelity Central Funds are available on the SEC website or upon request.
3. Significant Accounting Policies.
Each Fund is an investment company and applies the accounting and reporting guidance of the Financial Accounting Standards Board (FASB) Accounting Standards Codification Topic 946 Financial Services – Investments Companies. The financial statements have been prepared in conformity with accounting principles generally accepted in the United States of America (GAAP), which require management to make certain estimates and assumptions at the date of the financial statements. Actual results could differ from those estimates. Subsequent events, if any, through the date that the financial statements were issued have been evaluated in the preparation of the financial statements. The following summarizes the significant accounting policies of the Funds:
Investment Valuation. Investments are valued as of 4:00 p.m. Eastern time on the last calendar day of the period. The Board of Trustees (the Board) has delegated the day to day responsibility for the valuation of each Fund's investments to the Fair Value Committee (the Committee) established by each Fund's investment adviser. In accordance with valuation policies and procedures approved by the Board, each Fund attempts to obtain prices from one or more third party pricing vendors or brokers to value its investments. When current market prices, quotations or currency exchange rates are not readily available or reliable, investments will be fair valued in good faith by the Committee, in accordance with procedures adopted by the Board. Factors used in determining fair value vary by investment type and may include market or investment specific events. The frequency with which these procedures are used cannot be predicted and they may be utilized to a significant extent. The Committee oversees each Fund's valuation policies and procedures and reports to the Board on the Committee's activities and fair value determinations. The Board monitors the appropriateness of the procedures used in valuing each Fund's investments and ratifies the fair value determinations of the Committee.
Each Fund categorizes the inputs to valuation techniques used to value its investments into a disclosure hierarchy consisting of three levels as shown below:
- Level 1 – quoted prices in active markets for identical investments
- Level 2 – other significant observable inputs (including quoted prices for similar investments, interest rates, prepayment speeds, etc.)
- Level 3 – unobservable inputs (including the Fund's own assumptions based on the best information available)
Valuation techniques used to value each Fund's investments by major category are as follows:
Equity securities, including restricted securities, for which market quotations are readily available, are valued at the last reported sale price or official closing price as reported by a third party pricing vendor on the primary market or exchange on which they are traded and are categorized as Level 1 in the hierarchy. In the event there were no sales during the day or closing prices are not available, securities are valued at the last quoted bid price or may be valued using the last available price and are generally categorized as Level 2 in the hierarchy. For foreign equity securities, when market or security specific events arise, comparisons to the valuation of American Depositary Receipts (ADRs), futures contracts, Exchange-Traded Funds (ETFs) and certain indexes as well as quoted prices for similar securities may be used and would be categorized as Level 2 in the hierarchy. For equity securities, including restricted securities, where observable inputs are limited, assumptions about market activity and risk are used and these securities may be categorized as Level 3 in the hierarchy.
Investments in open-end mutual funds, including the Fidelity Central Funds, are valued at their closing net asset value (NAV) each business day and are categorized as Level 1 in the hierarchy.
Changes in valuation techniques may result in transfers in or out of an assigned level within the disclosure hierarchy.
Foreign Currency. The Funds may use foreign currency contracts to facilitate transactions in foreign-denominated securities. Gains and losses from these transactions may arise from changes in the value of the foreign currency or if the counterparties do not perform under the contracts' terms.
Foreign-denominated assets, including investment securities, and liabilities are translated into U.S. dollars at the exchange rates at period end. Purchases and sales of investment securities, income and dividends received and expenses denominated in foreign currencies are translated into U.S. dollars at the exchange rate in effect on the transaction date.
The effects of exchange rate fluctuations on investments are included with the net realized and unrealized gain (loss) on investment securities. Other foreign currency transactions resulting in realized and unrealized gain (loss) are disclosed separately.
Investment Transactions and Income. For financial reporting purposes, the Funds' investment holdings and NAV include trades executed through the end of the last business day of the period. The NAV per share for processing shareholder transactions is calculated as of the close of business of the New York Stock Exchange (NYSE), normally 4:00 p.m. Eastern time and includes trades executed through the end of the prior business day. Gains and losses on securities sold are determined on the basis of identified cost and for certain Funds include proceeds received from litigation. Dividend income is recorded on the ex-dividend date, except for certain dividends from foreign securities where the ex-dividend date may have passed, which are recorded as soon as the Funds are informed of the ex-dividend date. Non-cash dividends included in dividend income, if any, are recorded at the fair market value of the securities received. Income and capital gain distributions from Fidelity Central Funds, if any, are recorded on the ex-dividend date. Certain distributions received by the Funds represent a return of capital or capital gain. The Funds determine the components of these distributions subsequent to the ex-dividend date, based upon receipt of tax filings or other correspondence relating to the underlying investment. These distributions are recorded as a reduction of cost of investments and/or as a realized gain. Investment income is recorded net of foreign taxes withheld where recovery of such taxes is uncertain.
Expenses. Expenses directly attributable to a fund are charged to that fund. Expenses attributable to more than one fund are allocated among the respective funds on the basis of relative net assets or other appropriate methods. Expense estimates are accrued in the period to which they relate and adjustments are made when actual amounts are known.
Deferred Trustee Compensation. Under a Deferred Compensation Plan (the Plan) for Brokerage and Investment Management Portfolio, certain independent Trustees have elected to defer receipt of a portion of their annual compensation. Deferred amounts are invested in a cross-section of Fidelity funds, are marked-to-market and remain in each Fund until distributed in accordance with the Plan. The investment of deferred amounts and the offsetting payable to the Trustees presented below are included in each accompanying Statement of Assets and Liabilities in other receivables and other payables and accrued expenses, respectively.
| Brokerage and Investment Management Portfolio | $38,694 |
Income Tax Information and Distributions to Shareholders. Each year, each Fund intends to qualify as a regulated investment company under Subchapter M of the Internal Revenue Code, including distributing substantially all of its taxable income and realized gains. As a result, no provision for U.S. Federal income taxes is required. Each Fund files a U.S. federal tax return, in addition to state and local tax returns as required. Each Fund's federal income tax returns are subject to examination by the Internal Revenue Service (IRS) for a period of three fiscal years after they are filed. State and local tax returns may be subject to examination for an additional fiscal year depending on the jurisdiction. Foreign taxes are provided for based on each Fund's understanding of the tax rules and rates that exist in the foreign markets in which it invests.
Distributions are declared and recorded on the ex-dividend date. Income and capital gain distributions are determined in accordance with income tax regulations, which may differ from GAAP.
Capital accounts within the financial statements are adjusted for permanent book-tax differences. These adjustments have no impact on net assets or the results of operations. Capital accounts are not adjusted for temporary book-tax differences which will reverse in a subsequent period.
Book-tax differences are primarily due to foreign currency transactions, equity-debt classifications, redemptions in kind, partnerships, deferred trustees compensation, capital loss carryforwards and losses deferred due to wash sales and excise tax regulations.
As of period end, the cost and unrealized appreciation (depreciation) in securities, and derivatives if applicable, for federal income tax purposes were as follows for each Fund:
| | Tax cost | Gross unrealized appreciation | Gross unrealized depreciation | Net unrealized appreciation (depreciation) |
| Banking Portfolio | $358,780,068 | $74,294,948 | $(26,354,822) | $47,940,126 |
| Brokerage and Investment Management Portfolio | 247,015,203 | 80,173,709 | (14,315,380) | 65,858,329 |
| Consumer Finance Portfolio | 130,015,871 | 36,704,534 | (6,912,787) | 29,791,747 |
| Financial Services Portfolio | 434,865,903 | 75,135,354 | (13,044,801) | 62,090,553 |
| Insurance Portfolio | 153,099,501 | 107,187,969 | (2,188,132) | 104,999,837 |
Restricted Securities. The Funds may invest in securities that are subject to legal or contractual restrictions on resale. These securities generally may be resold in transactions exempt from registration or to the public if the securities are registered. Disposal of these securities may involve time-consuming negotiations and expense, and prompt sale at an acceptable price may be difficult. Information regarding restricted securities is included at the end of each applicable Fund's Schedule of Investments.
4. Purchases and Sales of Investments.
Purchases and sales of securities, other than short-term securities and in-kind transactions, are noted in the table below.
| | Purchases ($) | Sales ($) |
| Banking Portfolio | 48,607,149 | 128,635,602 |
| Brokerage and Investment Management Portfolio | 17,243,379 | 34,645,891 |
| Consumer Finance Portfolio | 57,488,259 | 5,437,574 |
| Financial Services Portfolio | 172,664,391 | 213,631,687 |
| Insurance Portfolio | 51,827,685 | 33,389,248 |
5. Fees and Other Transactions with Affiliates.
Management Fee. Fidelity SelectCo, LLC (the investment adviser) and its affiliates provide the Funds with investment management related services for which the Funds pay a monthly management fee. The management fee is the sum of an individual fund fee rate and an annualized group fee rate. The individual fund fee rate is applied to each Fund's average net assets. The group fee rate is based upon the average net assets of all the mutual funds advised by Fidelity Management & Research Company (FMR) and the investment adviser. The group fee rate decreases as assets under management increase and increases as assets under management decrease. For the reporting period, each Fund's annualized management fee rate expressed as a percentage of each Fund's average net assets was as follows:
| | Individual Rate | Group Rate | Total |
| Banking Portfolio | .30% | .24% | .54% |
| Brokerage and Investment Management Portfolio | .30% | .24% | .54% |
| Consumer Finance Portfolio | .30% | .24% | .54% |
| Financial Services Portfolio | .30% | .24% | .54% |
| Insurance Portfolio | .30% | .24% | .54% |
Transfer Agent Fees. Fidelity Investments Institutional Operations Company, Inc. (FIIOC), an affiliate of the investment adviser, is the Funds' transfer, dividend disbursing and shareholder servicing agent. FIIOC receives account fees and asset-based fees that vary according to account size and type of account. FIIOC pays for typesetting, printing and mailing of shareholder reports, except proxy statements. For the period, transfer agent fees were equivalent to the following annualized rates expressed as a percentage of average net assets:
| Banking Portfolio | .18% |
| Brokerage and Investment Management Portfolio | .18% |
| Consumer Finance Portfolio | .22% |
| Financial Services Portfolio | .18% |
| Insurance Portfolio | .20% |
Accounting and Security Lending Fees. Fidelity Service Company, Inc. (FSC), an affiliate of the investment adviser, maintains each Fund's accounting records. The accounting fee is based on the level of average net assets for each month. Prior to April 1, 2019, FSC had a separate agreement with each Fund for administration of the security lending program, based on the number and duration of lending transactions. For the period, the total fees paid for accounting and administration of securities lending were equivalent to the following annualized rates:
| | % of Average Net Assets |
| Banking Portfolio | .04 |
| Brokerage and Investment Management Portfolio | .04 |
| Consumer Finance Portfolio | .04 |
| Financial Services Portfolio | .04 |
| Insurance Portfolio | .04 |
Brokerage Commissions. Certain Funds placed a portion of their portfolio transactions with brokerage firms which are affiliates of the investment adviser. Brokerage commissions are included in net realized gain (loss) and change in net unrealized appreciation (depreciation) in the Statement of Operations. The commissions paid to these affiliated firms were as follows:
| | Amount |
| Banking Portfolio | $3,064 |
| Brokerage and Investment Management Portfolio | 615 |
| Consumer Finance Portfolio | 1,025 |
| Financial Services Portfolio | 5,786 |
| Insurance Portfolio | 510 |
Interfund Lending Program. Pursuant to an Exemptive Order issued by the SEC, the Funds, along with other registered investment companies having management contracts with Fidelity Management & Research Company (FMR) or other affiliated entities of FMR, may participate in an interfund lending program. This program provides an alternative credit facility allowing the funds to borrow from, or lend money to, other participating affiliated funds. At period end, there were no interfund loans outstanding. Each applicable fund's activity in this program during the period for which loans were outstanding was as follows:
| | Borrower or Lender | Average Loan Balance | Weighted Average Interest Rate | Interest Expense |
| Insurance Portfolio | Borrower | $6,269,000 | 2.36% | $412 |
Interfund Trades. The Funds may purchase from or sell securities to other Fidelity Funds under procedures adopted by the Board. The procedures have been designed to ensure these interfund trades are executed in accordance with Rule 17a-7 of the 1940 Act. Interfund trades are included within the respective purchases and sales amounts shown in the Purchases and Sales of Investments note.
Affiliated Redemptions In-Kind. During the period, 2,278,421 shares of Financial Services Portfolio were redeemed in-kind for investments and cash with a value of $22,465,229. The net realized gain of $4,465,779 on investments delivered through in-kind redemptions is included in the accompanying Statement of Operations. The amount of the in-kind redemptions is included in share transactions in the accompanying Statement of Changes in Net Assets. Financial Services Portfolio recognized no gain or loss for federal income tax purposes.
Prior Fiscal Year Affiliated Redemptions In-Kind. During the prior period, 42,927,330* shares of Financial Services Portfolio were redeemed in-kind for investments and cash with a value of $473,016,260. Financial Services Portfolio had a net realized gain of $122,035,415 on investments delivered through in-kind redemptions. The amount of the in-kind redemptions is included in share transactions in the accompanying Statement of Changes in Net Assets. Financial Services Portfolio recognized no gain or loss for federal income tax purposes.
*Share activity prior to August 10, 2018 has been adjusted to reflect the impact of the 10 for 1 share split that occurred on that date.
6. Committed Line of Credit.
Certain Funds participate with other funds managed by the investment adviser or an affiliate in a $4.25 billion credit facility (the "line of credit") to be utilized for temporary or emergency purposes to fund shareholder redemptions or for other short-term liquidity purposes. The participating funds have agreed to pay commitment fees on their pro-rata portion of the line of credit, which are reflected in Miscellaneous expenses on the Statement of Operations, and are as follows:
| Banking Portfolio | $656 |
| Brokerage and Investment Management Portfolio | 430 |
| Consumer Finance Portfolio | 157 |
| Financial Services Portfolio | 744 |
| Insurance Portfolio | 300 |
During the period, the Funds did not borrow on this line of credit.
7. Security Lending.
Certain Funds lend portfolio securities from time to time in order to earn additional income. For equity securities, lending agents are used, including National Financial Services (NFS), an affiliate of the Funds. Pursuant to a securities lending agreement, NFS will receive a fee, which is capped at 9.9% of daily lending revenue, for its services as lending agent. The Funds may lend securities to certain qualified borrowers. On the settlement date of the loan, each applicable Fund receives collateral (in the form of U.S. Treasury obligations, letters of credit and/or cash) against the loaned securities and maintains collateral in an amount not less than 100% of the market value of the loaned securities during the period of the loan. The market value of the loaned securities is determined at the close of business of the Funds and any additional required collateral is delivered to the Funds on the next business day. The Funds or borrower may terminate the loan at any time, and if the borrower defaults on its obligation to return the securities loaned because of insolvency or other reasons, the Funds may apply collateral received from the borrower against the obligation. The Funds may experience delays and costs in recovering the securities loaned. Any cash collateral received is invested in the Fidelity Securities Lending Cash Central Fund. The value of loaned securities and cash collateral at period end are disclosed on each applicable Fund's Statement of Assets and Liabilities. Security lending income represents the income earned on investing cash collateral, less rebates paid to borrowers and any lending agent fees associated with the loan, plus any premium payments received for lending certain types of securities. Security lending income is presented on each applicable Fund's Statement of Operations as a component of income from Fidelity Central Funds. Security lending fees paid to NFS were as follows:
| Banking Portfolio | $2,006 |
| Brokerage and Investment Management Portfolio | 104 |
| Consumer Finance Portfolio | 410 |
| Financial Services Portfolio | 328 |
| Insurance Portfolio | 128 |
8. Expense Reductions.
Commissions paid to certain brokers with whom the investment adviser, or its affiliates, places trades on behalf of certain Funds include an amount in addition to trade execution, which may be rebated back to the Funds to offset certain expenses. In addition, through arrangements with each applicable Fund's custodian and transfer agent, credits realized as a result of certain uninvested cash balances were used to reduce each applicable Fund's expenses. All of the applicable expense reductions are noted in the table below.
| | Brokerage Service reduction | Custodian credits | Transfer Agent credits |
| Banking Portfolio | $7,218 | $– | $107 |
| Brokerage and Investment Management Portfolio | 4,444 | – | – |
| Consumer Finance Portfolio | 27 | – | – |
| Financial Services Portfolio | 16,722 | 62 | – |
| Insurance Portfolio | 594 | – | – |
In addition, during the period the investment adviser reimbursed and/or waived a portion of operating expenses as follows:
| | Amount |
| Banking Portfolio | $1,874 |
| Brokerage and Investment Management Portfolio | 1,190 |
| Consumer Finance Portfolio | 353 |
| Financial Services Portfolio | 2,101 |
| Insurance Portfolio | 808 |
9. Other.
The Funds' organizational documents provide former and current trustees and officers with a limited indemnification against liabilities arising in connection with the performance of their duties to the Funds. In the normal course of business, the Funds may also enter into contracts that provide general indemnifications. The Funds' maximum exposure under these arrangements is unknown as this would be dependent on future claims that may be made against the Funds. The risk of material loss from such claims is considered remote.
Shareholder Expense Example
As a shareholder of a Fund, you incur two types of costs: (1) transaction costs, including and (2) ongoing costs, including management fees and other Fund expenses. This Example is intended to help you understand your ongoing costs (in dollars) of investing in the Funds and to compare these costs with the ongoing costs of investing in other mutual funds.
The Example is based on an investment of $1,000 invested at the beginning of the period and held for the entire period (March 1, 2019 to August 31, 2019).
Actual Expenses
The first line of the accompanying table for each fund provides information about actual account values and actual expenses. You may use the information in this line, together with the amount you invested, to estimate the expenses that you paid over the period. Simply divide your account value by $1,000.00 (for example, an $8,600 account value divided by $1,000.00 = 8.6), then multiply the result by the number in the first line for a fund under the heading entitled "Expenses Paid During Period" to estimate the expenses you paid on your account during this period. In addition, each Fund, as a shareholder in the underlying Fidelity Central Funds, will indirectly bear its pro-rata share of the fees and expenses incurred by the underlying Fidelity Central Funds. These fees and expenses are not included in the Fund's annualized expense ratio used to calculate the expense estimate in the table below.
Hypothetical Example for Comparison Purposes
The second line of the accompanying table for each fund provides information about hypothetical account values and hypothetical expenses based on a fund's actual expense ratio and an assumed rate of return of 5% per year before expenses, which is not the Fund's actual return. The hypothetical account values and expenses may not be used to estimate the actual ending account balance or expenses you paid for the period. You may use this information to compare the ongoing costs of investing in the Fund and other funds. To do so, compare this 5% hypothetical example with the 5% hypothetical examples that appear in the shareholder reports of the other funds. In addition, each Fund, as a shareholder in the underlying Fidelity Central Funds, will indirectly bear its pro-rata share of the fees and expenses incurred by the underlying Fidelity Central Funds. These fees and expenses are not included in the Fund's annualized expense ratio used to calculate the expense estimate in the table below.
Please note that the expenses shown in the table are meant to highlight your ongoing costs only and do not reflect any transaction costs. Therefore, the second line of the table is useful in comparing ongoing costs only, and will not help you determine the relative total costs of owning different funds. In addition, if these transactional costs were included, your costs would have been higher.
| | Annualized Expense RatioA | Beginning
Account Value
March 1, 2019 | Ending
Account Value
August 31, 2019 | Expenses Paid
During Period-B
March 1, 2019
to August 31, 2019 |
| Banking Portfolio | .78% | | | |
| Actual | | $1,000.00 | $951.90 | $3.83 |
| Hypothetical-C | | $1,000.00 | $1,021.22 | $3.96 |
| Brokerage and Investment Management Portfolio | .78% | | | |
| Actual | | $1,000.00 | $1,039.20 | $4.00 |
| Hypothetical-C | | $1,000.00 | $1,021.22 | $3.96 |
| Consumer Finance Portfolio | .87% | | | |
| Actual | | $1,000.00 | $1,056.60 | $4.50 |
| Hypothetical-C | | $1,000.00 | $1,020.76 | $4.42 |
| Financial Services Portfolio | .77% | | | |
| Actual | | $1,000.00 | $1,035.20 | $3.94 |
| Hypothetical-C | | $1,000.00 | $1,021.27 | $3.91 |
| Insurance Portfolio | .82% | | | |
| Actual | | $1,000.00 | $1,097.80 | $4.32 |
| Hypothetical-C | | $1,000.00 | $1,021.01 | $4.17 |
A Annualized expense ratio reflects expenses net of applicable fee waivers.
B Expenses are equal to each Fund's annualized expense ratio, multiplied by the average account value over the period, multiplied by 184/ 366 (to reflect the one-half year period).
C 5% return per year before expenses
SELFIN-SANN-1019
1.813666.114
Fidelity® Select Portfolios®
Industrials Sector Air Transportation Portfolio
Defense and Aerospace Portfolio
Environment and Alternative Energy Portfolio
Industrials Portfolio
Transportation Portfolio
Semi-Annual Report August 31, 2019 |
|
Beginning on January 1, 2021, as permitted by regulations adopted by the Securities and Exchange Commission, paper copies of a fund’s shareholder reports will no longer be sent by mail, unless you specifically request paper copies of the reports from the fund or from your financial intermediary, such as a financial advisor, broker-dealer or bank. Instead, the reports will be made available on a website, and you will be notified by mail each time a report is posted and provided with a website link to access the report.
If you already elected to receive shareholder reports electronically, you will not be affected by this change and you need not take any action. You may elect to receive shareholder reports and other communications from a fund electronically, by contacting your financial intermediary. For Fidelity customers, visit Fidelity's web site or call Fidelity using the contact information listed below.
You may elect to receive all future reports in paper free of charge. If you wish to continue receiving paper copies of your shareholder reports, you may contact your financial intermediary or, if you are a Fidelity customer, visit Fidelity’s website, or call Fidelity at the applicable toll-free number listed below. Your election to receive reports in paper will apply to all funds held with the fund complex/your financial intermediary.
| Account Type | Website | Phone Number |
| Brokerage, Mutual Fund, or Annuity Contracts: | fidelity.com/mailpreferences | 1-800-343-3548 |
| Employer Provided Retirement Accounts: | netbenefits.fidelity.com/preferences (choose 'no' under Required Disclosures to continue to print) | 1-800-343-0860 |
| Advisor Sold Accounts Serviced Through Your Financial Intermediary: | Contact Your Financial Intermediary | Your Financial Intermediary's phone number |
| Advisor Sold Accounts Serviced by Fidelity: | institutional.fidelity.com | 1-877-208-0098 |
Contents
To view a fund's proxy voting guidelines and proxy voting record for the 12-month period ended June 30, visit http://www.fidelity.com/proxyvotingresults or visit the Securities and Exchange Commission's (SEC) web site at http://www.sec.gov.
You may also call 1-800-544-8544 to request a free copy of the proxy voting guidelines.
Standard & Poor's, S&P and S&P 500 are registered service marks of The McGraw-Hill Companies, Inc. and have been licensed for use by Fidelity Distributors Corporation.
Other third-party marks appearing herein are the property of their respective owners.
All other marks appearing herein are registered or unregistered trademarks or service marks of FMR LLC or an affiliated company. © 2019 FMR LLC. All rights reserved.
This report and the financial statements contained herein are submitted for the general information of the shareholders of the Funds. This report is not authorized for distribution to prospective investors in the Funds unless preceded or accompanied by an effective prospectus.
A fund files its complete schedule of portfolio holdings with the SEC for the first and third quarters of each fiscal year on Form N-PORT. Forms N-PORT are available on the SEC’s web site at http://www.sec.gov. A fund's Forms N-PORT may be reviewed and copied at the SEC’s Public Reference Room in Washington, DC. Information regarding the operation of the SEC's Public Reference Room may be obtained by calling 1-800-SEC-0330.
For a complete list of a fund's portfolio holdings, view the most recent holdings listing, semiannual report, or annual report on Fidelity's web site at http://www.fidelity.com, http://www.institutional.fidelity.com, or http://www.401k.com, as applicable.
NOT FDIC INSURED •MAY LOSE VALUE •NO BANK GUARANTEE
Neither the Funds nor Fidelity Distributors Corporation is a bank.
Air Transportation Portfolio
Investment Summary (Unaudited)
Top Ten Stocks as of August 31, 2019
| | % of fund's net assets |
| United Parcel Service, Inc. Class B | 11.1 |
| Delta Air Lines, Inc. | 10.5 |
| Southwest Airlines Co. | 8.5 |
| United Technologies Corp. | 8.5 |
| TransDigm Group, Inc. | 6.0 |
| Teledyne Technologies, Inc. | 5.1 |
| Spirit AeroSystems Holdings, Inc. Class A | 5.0 |
| The Boeing Co. | 3.3 |
| HEICO Corp. Class A | 3.2 |
| JetBlue Airways Corp. | 3.0 |
| | 64.2 |
Top Industries (% of fund's net assets)
| As of August 31, 2019 |
| | Aerospace & Defense | 44.0% |
| | Airlines | 36.3% |
| | Air Freight & Logistics | 14.6% |
| | Road & Rail | 1.4% |
| | Machinery | 0.2% |
| | All Others* | 3.5% |
* Includes short-term investments and net other assets (liabilities).
Air Transportation Portfolio
Schedule of Investments August 31, 2019 (Unaudited)
Showing Percentage of Net Assets
| Common Stocks - 96.5% | | | |
| | | Shares | Value |
| Aerospace & Defense - 44.0% | | | |
| Aerospace & Defense - 44.0% | | | |
| AAR Corp. | | 78,300 | $3,363,768 |
| Bombardier, Inc. Class B (sub. vtg.) (a) | | 4,143,000 | 5,352,231 |
| CAE, Inc. | | 203,200 | 5,318,852 |
| General Dynamics Corp. | | 24,400 | 4,666,988 |
| HEICO Corp. Class A | | 84,300 | 9,303,348 |
| Heroux-Devtek, Inc. (a) | | 122,300 | 1,607,518 |
| Hexcel Corp. | | 19,700 | 1,657,755 |
| Moog, Inc. Class A | | 67,400 | 5,476,250 |
| Northrop Grumman Corp. | | 13,800 | 5,076,606 |
| Spirit AeroSystems Holdings, Inc. Class A | | 176,300 | 14,209,780 |
| Teledyne Technologies, Inc. (a) | | 47,000 | 14,503,730 |
| Textron, Inc. | | 99,800 | 4,491,000 |
| The Boeing Co. | | 26,410 | 9,615,617 |
| TransDigm Group, Inc. | | 31,800 | 17,118,576 |
| United Technologies Corp. | | 186,300 | 24,263,712 |
| | | | 126,025,731 |
| Air Freight & Logistics - 14.6% | | | |
| Air Freight & Logistics - 14.6% | | | |
| Air Transport Services Group, Inc. (a) | | 89,900 | 1,815,980 |
| FedEx Corp. | | 51,800 | 8,215,998 |
| United Parcel Service, Inc. Class B | | 267,900 | 31,789,014 |
| | | | 41,820,992 |
| Airlines - 36.3% | | | |
| Airlines - 36.3% | | | |
| Air Canada (a) | | 171,200 | 5,754,244 |
| Alaska Air Group, Inc. | | 132,000 | 7,883,040 |
| Allegiant Travel Co. | | 5,000 | 709,950 |
| American Airlines Group, Inc. | | 305,400 | 8,035,074 |
| Delta Air Lines, Inc. | | 517,102 | 29,919,522 |
| Hawaiian Holdings, Inc. | | 64,600 | 1,576,886 |
| JetBlue Airways Corp. (a) | | 489,300 | 8,474,676 |
| Mesa Air Group, Inc. | | 196,500 | 1,269,390 |
| SkyWest, Inc. | | 137,300 | 7,861,798 |
| Southwest Airlines Co. | | 464,200 | 24,286,944 |
| Spirit Airlines, Inc. (a) | | 118,200 | 4,437,228 |
| United Continental Holdings, Inc. (a) | | 44,300 | 3,734,933 |
| | | | 103,943,685 |
| Machinery - 0.2% | | | |
| Industrial Machinery - 0.2% | | | |
| Park-Ohio Holdings Corp. | | 16,990 | 461,958 |
| Road & Rail - 1.4% | | | |
| Railroads - 1.4% | | | |
| Genesee & Wyoming, Inc. Class A (a) | | 15,900 | 1,762,992 |
| Norfolk Southern Corp. | | 12,400 | 2,158,220 |
| | | | 3,921,212 |
| TOTAL COMMON STOCKS | | | |
| (Cost $200,950,523) | | | 276,173,578 |
|
| Money Market Funds - 3.9% | | | |
| Fidelity Cash Central Fund 2.13% (b) | | | |
| (Cost $11,113,008) | | 11,110,869 | 11,113,092 |
| TOTAL INVESTMENT IN SECURITIES - 100.4% | | | |
| (Cost $212,063,531) | | | 287,286,670 |
| NET OTHER ASSETS (LIABILITIES) - (0.4)% | | | (1,006,397) |
| NET ASSETS - 100% | | | $286,280,273 |
Legend
(a) Non-income producing
(b) Affiliated fund that is generally available only to investment companies and other accounts managed by Fidelity Investments. The rate quoted is the annualized seven-day yield of the fund at period end. A complete unaudited listing of the fund's holdings as of its most recent quarter end is available upon request. In addition, each Fidelity Central Fund's financial statements are available on the SEC's website or upon request.
Affiliated Central Funds
Information regarding fiscal year to date income earned by the Fund from investments in Fidelity Central Funds is as follows:
| Fund | Income earned |
| Fidelity Cash Central Fund | $104,483 |
| Fidelity Securities Lending Cash Central Fund | 206 |
| Total | $104,689 |
Amounts in the income column in the above table include any capital gain distributions from underlying funds, which are presented in the corresponding line-item in the Statement of Operations, if applicable. Amount for Fidelity Securities Lending Cash Central Fund represents the income earned on investing cash collateral, less rebates paid to borrowers and any lending agent fees associated with the loan, plus any premium payments received for lending certain types of securities.
Investment Valuation
All investments are categorized as Level 1 under the Fair Value Hierarchy. The inputs or methodology used for valuing securities may not be an indication of the risk associated with investing in those securities. For more information on valuation inputs please refer to the Investment Valuation section in the accompanying Notes to Financial Statements.
See accompanying notes which are an integral part of the financial statements.
Air Transportation Portfolio
Financial Statements
Statement of Assets and Liabilities
| | | August 31, 2019 (Unaudited) |
| Assets | | |
Investment in securities, at value — See accompanying schedule:
Unaffiliated issuers (cost $200,950,523) | $276,173,578 | |
| Fidelity Central Funds (cost $11,113,008) | 11,113,092 | |
| Total Investment in Securities (cost $212,063,531) | | $287,286,670 |
| Receivable for investments sold | | 1,828,524 |
| Receivable for fund shares sold | | 38,067 |
| Dividends receivable | | 612,486 |
| Distributions receivable from Fidelity Central Funds | | 14,983 |
| Prepaid expenses | | 3,266 |
| Other receivables | | 1,933 |
| Total assets | | 289,785,929 |
| Liabilities | | |
| Payable for investments purchased | $2,736,385 | |
| Payable for fund shares redeemed | 560,311 | |
| Accrued management fee | 126,532 | |
| Other affiliated payables | 60,384 | |
| Other payables and accrued expenses | 22,044 | |
| Total liabilities | | 3,505,656 |
| Net Assets | | $286,280,273 |
| Net Assets consist of: | | |
| Paid in capital | | $195,202,981 |
| Total distributable earnings (loss) | | 91,077,292 |
| Net Assets, for 3,754,203 shares outstanding | | $286,280,273 |
| Net Asset Value, offering price and redemption price per share ($286,280,273 ÷ 3,754,203 shares) | | $76.26 |
See accompanying notes which are an integral part of the financial statements.
Statement of Operations
| | | Six months ended August 31, 2019 (Unaudited) |
| Investment Income | | |
| Dividends | | $2,166,501 |
| Special dividends | | 954,000 |
| Income from Fidelity Central Funds (including $206 from security lending) | | 104,689 |
| Total income | | 3,225,190 |
| Expenses | | |
| Management fee | $779,514 | |
| Transfer agent fees | 311,812 | |
| Accounting and security lending fees | 56,535 | |
| Custodian fees and expenses | 3,207 | |
| Independent trustees' fees and expenses | 810 | |
| Registration fees | 20,170 | |
| Audit | 19,107 | |
| Legal | 1,062 | |
| Miscellaneous | 1,189 | |
| Total expenses before reductions | 1,193,406 | |
| Expense reductions | (3,966) | |
| Total expenses after reductions | | 1,189,440 |
| Net investment income (loss) | | 2,035,750 |
| Realized and Unrealized Gain (Loss) | | |
| Net realized gain (loss) on: | | |
| Investment securities: | | |
| Unaffiliated issuers | 14,190,889 | |
| Foreign currency transactions | 766 | |
| Total net realized gain (loss) | | 14,191,655 |
| Change in net unrealized appreciation (depreciation) on: | | |
| Investment securities: | | |
| Unaffiliated issuers | (14,840,857) | |
| Assets and liabilities in foreign currencies | 68 | |
| Total change in net unrealized appreciation (depreciation) | | (14,840,789) |
| Net gain (loss) | | (649,134) |
| Net increase (decrease) in net assets resulting from operations | | $1,386,616 |
See accompanying notes which are an integral part of the financial statements.
Statement of Changes in Net Assets
| | Six months ended August 31, 2019 (Unaudited) | Year ended February 28, 2019 |
| Increase (Decrease) in Net Assets | | |
| Operations | | |
| Net investment income (loss) | $2,035,750 | $2,251,097 |
| Net realized gain (loss) | 14,191,655 | 18,552,096 |
| Change in net unrealized appreciation (depreciation) | (14,840,789) | (12,856,555) |
| Net increase (decrease) in net assets resulting from operations | 1,386,616 | 7,946,638 |
| Distributions to shareholders | (2,956,197) | (35,655,527) |
| Share transactions | | |
| Proceeds from sales of shares | 17,331,683 | 52,101,305 |
| Reinvestment of distributions | 2,799,299 | 34,073,279 |
| Cost of shares redeemed | (39,144,281) | (134,132,078) |
| Net increase (decrease) in net assets resulting from share transactions | (19,013,299) | (47,957,494) |
| Total increase (decrease) in net assets | (20,582,880) | (75,666,383) |
| Net Assets | | |
| Beginning of period | 306,863,153 | 382,529,536 |
| End of period | $286,280,273 | $306,863,153 |
| Other Information | | |
| Shares | | |
| Sold | 231,145 | 666,871 |
| Issued in reinvestment of distributions | 36,693 | 475,878 |
| Redeemed | (524,037) | (1,761,425) |
| Net increase (decrease) | (256,199) | (618,676) |
See accompanying notes which are an integral part of the financial statements.
Financial Highlights
Air Transportation Portfolio
| | Six months ended (Unaudited) August 31, | Years endedFebruary 28, | | | | |
| | 2019 | 2019 | 2018 | 2017 | 2016 A | 2015 |
| Selected Per–Share Data | | | | | | |
| Net asset value, beginning of period | $76.52 | $82.64 | $76.04 | $60.60 | $73.09 | $61.02 |
| Income from Investment Operations | | | | | | |
| Net investment income (loss)B | .52C | .54 | .48D | .32 | .18 | .20E |
| Net realized and unrealized gain (loss) | (.03) | 1.73 | 13.85 | 15.61 | (6.82) | 13.09 |
| Total from investment operations | .49 | 2.27 | 14.33 | 15.93 | (6.64) | 13.29 |
| Distributions from net investment income | (.15) | (.48) | (.38) | (.25) | (.17) | (.08) |
| Distributions from net realized gain | (.60) | (7.91) | (7.36) | (.24) | (5.68) | (1.14) |
| Total distributions | (.75) | (8.39) | (7.73)F | (.49) | (5.85) | (1.23)G |
| Redemption fees added to paid in capitalB | – | – | –H | –H | –H | .01 |
| Net asset value, end of period | $76.26 | $76.52 | $82.64 | $76.04 | $60.60 | $73.09 |
| Total ReturnI,J | .64% | 3.79% | 19.07% | 26.30% | (9.24)% | 21.93% |
| Ratios to Average Net AssetsK,L | | | | | | |
| Expenses before reductions | .82%M | .81% | .82% | .85% | .83% | .83% |
| Expenses net of fee waivers, if any | .82%M | .81% | .82% | .85% | .83% | .83% |
| Expenses net of all reductions | .82%M | .81% | .82% | .84% | .82% | .83% |
| Net investment income (loss) | 1.07%C,M | .70% | .59%D | .48% | .27% | .30%E |
| Supplemental Data | | | | | | |
| Net assets, end of period (000 omitted) | $286,280 | $306,863 | $382,530 | $394,143 | $325,630 | $715,925 |
| Portfolio turnover rateN,O | 65%M | 32% | 86% | 106% | 97% | 65%O |
A For the year ended February 29.
B Calculated based on average shares outstanding during the period.
C Net investment income per share reflects a large, non-recurring dividend which amounted to $.25 per share. This dividend is not annualized in the ratio of net investment income (loss) to average net assets. Excluding this dividend the ratio would have been .74%.
D Net investment income per share reflects a large, non-recurring dividend which amounted to $.22 per share. Excluding this non-recurring dividend, the ratio of net investment income (loss) to average net assets would have been .31%.
E Net investment income per share reflects a large, non-recurring dividend which amounted to $.22 per share. Excluding this non-recurring dividend, the ratio of net investment income (loss) to average net assets would have been (.04) %.
F Total distributions of $7.73 per share is comprised of distributions from net investment income of $.377 and distributions from net realized gain of $7.357 per share.
G Total distributions of $1.23 per share is comprised of distributions from net investment income of $.084 and distributions from net realized gain of $1.144 per share.
H Amount represents less than $.005 per share.
I Total returns for periods of less than one year are not annualized.
J Total returns would have been lower if certain expenses had not been reduced during the applicable periods shown.
K Fees and expenses of any underlying Fidelity Central Funds are not included in the Fund's expense ratio. The Fund indirectly bears its proportionate share of the expenses of any underlying Fidelity Central Funds.
L Expense ratios reflect operating expenses of the Fund. Expenses before reductions do not reflect amounts reimbursed by the investment adviser or reductions from brokerage service arrangements or reductions from other expense offset arrangements and do not represent the amount paid by the Fund during periods when reimbursements or reductions occur. Expenses net of fee waivers reflect expenses after reimbursement by the investment adviser but prior to reductions from brokerage service arrangements or other expense offset arrangements. Expenses net of all reductions represent the net expenses paid by the Fund.
M Annualized
N Amount does not include the portfolio activity of any underlying Fidelity Central Funds.
O Portfolio turnover rate excludes securities received or delivered in-kind.
See accompanying notes which are an integral part of the financial statements.
Defense and Aerospace Portfolio
Investment Summary (Unaudited)
Top Ten Stocks as of August 31, 2019
| | % of fund's net assets |
| The Boeing Co. | 15.0 |
| Northrop Grumman Corp. | 12.5 |
| General Dynamics Corp. | 8.7 |
| TransDigm Group, Inc. | 8.5 |
| Teledyne Technologies, Inc. | 5.4 |
| United Technologies Corp. | 4.9 |
| Huntington Ingalls Industries, Inc. | 4.9 |
| HEICO Corp. Class A | 4.9 |
| Moog, Inc. Class A | 4.4 |
| Lockheed Martin Corp. | 4.2 |
| | 73.4 |
Top Industries (% of fund's net assets)
| As of August 31, 2019 |
| | Aerospace & Defense | 94.7% |
| | IT Services | 2.7% |
| | Machinery | 1.8% |
| | All Others* | 0.8% |

* Includes short-term investments and net other assets (liabilities).
Defense and Aerospace Portfolio
Schedule of Investments August 31, 2019 (Unaudited)
Showing Percentage of Net Assets
| Common Stocks - 99.2% | | | |
| | | Shares | Value |
| Aerospace & Defense - 94.7% | | | |
| Aerospace & Defense - 94.7% | | | |
| Airbus Group NV | | 239,200 | $32,960,188 |
| Arconic, Inc. | | 2,840,869 | 73,408,055 |
| Astronics Corp. Class B | | 361,216 | 10,124,884 |
| Bombardier, Inc. Class B (sub. vtg.) (a) | | 42,488,700 | 54,890,014 |
| BWX Technologies, Inc. (b) | | 773,879 | 45,813,637 |
| CAE, Inc. | | 3,263,300 | 85,418,360 |
| Cubic Corp. (b) | | 75,400 | 5,222,958 |
| Elbit Systems Ltd. | | 540,000 | 83,710,800 |
| General Dynamics Corp. | | 1,340,000 | 256,301,800 |
| Harris Corp. | | 265,500 | 56,129,355 |
| HEICO Corp. Class A | | 1,304,834 | 144,001,480 |
| Huntington Ingalls Industries, Inc. | | 695,000 | 145,255,000 |
| Kratos Defense & Security Solutions, Inc. (a) | | 1,000,000 | 19,970,000 |
| Lockheed Martin Corp. | | 320,000 | 122,915,200 |
| Moog, Inc. Class A | | 1,607,375 | 130,599,219 |
| Northrop Grumman Corp. | | 1,000,000 | 367,870,000 |
| Parsons Corp. | | 305,300 | 10,386,306 |
| Raytheon Co. | | 600,000 | 111,192,000 |
| Spirit AeroSystems Holdings, Inc. Class A | | 491,065 | 39,579,839 |
| Teledyne Technologies, Inc. (a) | | 515,000 | 158,923,850 |
| The Boeing Co. | | 1,217,000 | 443,097,531 |
| TransDigm Group, Inc. | | 464,500 | 250,049,640 |
| United Technologies Corp. | | 1,117,996 | 145,607,799 |
| | | | 2,793,427,915 |
| IT Services - 2.7% | | | |
| IT Consulting & Other Services - 2.7% | | | |
| CACI International, Inc. Class A (a) | | 332,300 | 73,866,967 |
| Perspecta, Inc. | | 283,700 | 7,362,015 |
| | | | 81,228,982 |
| Machinery - 1.8% | | | |
| Industrial Machinery - 1.8% | | | |
| Woodward, Inc. | | 500,000 | 53,925,000 |
| TOTAL COMMON STOCKS | | | |
| (Cost $1,919,622,031) | | | 2,928,581,897 |
|
| Money Market Funds - 1.1% | | | |
| Fidelity Cash Central Fund 2.13% (c) | | 24,620,078 | 24,625,002 |
| Fidelity Securities Lending Cash Central Fund 2.13% (c)(d) | | 6,284,694 | 6,285,323 |
| TOTAL MONEY MARKET FUNDS | | | |
| (Cost $30,910,325) | | | 30,910,325 |
| TOTAL INVESTMENT IN SECURITIES - 100.3% | | | |
| (Cost $1,950,532,356) | | | 2,959,492,222 |
| NET OTHER ASSETS (LIABILITIES) - (0.3)% | | | (8,317,159) |
| NET ASSETS - 100% | | | $2,951,175,063 |
Legend
(a) Non-income producing
(b) Security or a portion of the security is on loan at period end.
(c) Affiliated fund that is generally available only to investment companies and other accounts managed by Fidelity Investments. The rate quoted is the annualized seven-day yield of the fund at period end. A complete unaudited listing of the fund's holdings as of its most recent quarter end is available upon request. In addition, each Fidelity Central Fund's financial statements are available on the SEC's website or upon request.
(d) Investment made with cash collateral received from securities on loan.
Affiliated Central Funds
Information regarding fiscal year to date income earned by the Fund from investments in Fidelity Central Funds is as follows:
| Fund | Income earned |
| Fidelity Cash Central Fund | $258,556 |
| Fidelity Securities Lending Cash Central Fund | 4,207 |
| Total | $262,763 |
Amounts in the income column in the above table include any capital gain distributions from underlying funds, which are presented in the corresponding line-item in the Statement of Operations, if applicable. Amount for Fidelity Securities Lending Cash Central Fund represents the income earned on investing cash collateral, less rebates paid to borrowers and any lending agent fees associated with the loan, plus any premium payments received for lending certain types of securities.
Investment Valuation
The following is a summary of the inputs used, as of August 31, 2019, involving the Fund's assets and liabilities carried at fair value. The inputs or methodology used for valuing securities may not be an indication of the risk associated with investing in those securities. For more information on valuation inputs, and their aggregation into the levels used below, please refer to the Investment Valuation section in the accompanying Notes to Financial Statements.
| | Valuation Inputs at Reporting Date: |
| Description | Total | Level 1 | Level 2 | Level 3 |
| Investments in Securities: | | | | |
| Common Stocks | $2,928,581,897 | $2,895,621,709 | $32,960,188 | $-- |
| Money Market Funds | 30,910,325 | 30,910,325 | -- | -- |
| Total Investments in Securities: | $2,959,492,222 | $2,926,532,034 | $32,960,188 | $-- |
See accompanying notes which are an integral part of the financial statements.
Defense and Aerospace Portfolio
Financial Statements
Statement of Assets and Liabilities
| | | August 31, 2019 (Unaudited) |
| Assets | | |
Investment in securities, at value (including securities loaned of $6,200,742) — See accompanying schedule:
Unaffiliated issuers (cost $1,919,622,031) | $2,928,581,897 | |
| Fidelity Central Funds (cost $30,910,325) | 30,910,325 | |
| Total Investment in Securities (cost $1,950,532,356) | | $2,959,492,222 |
| Receivable for investments sold | | 9,435,855 |
| Receivable for fund shares sold | | 3,531,405 |
| Dividends receivable | | 5,096,205 |
| Distributions receivable from Fidelity Central Funds | | 38,080 |
| Prepaid expenses | | 27,260 |
| Other receivables | | 94,177 |
| Total assets | | 2,977,715,204 |
| Liabilities | | |
| Payable for investments purchased | $15,953,881 | |
| Payable for fund shares redeemed | 2,423,138 | |
| Accrued management fee | 1,276,731 | |
| Other affiliated payables | 478,458 | |
| Other payables and accrued expenses | 122,633 | |
| Collateral on securities loaned | 6,285,300 | |
| Total liabilities | | 26,540,141 |
| Net Assets | | $2,951,175,063 |
| Net Assets consist of: | | |
| Paid in capital | | $1,900,084,319 |
| Total distributable earnings (loss) | | 1,051,090,744 |
| Net Assets, for 159,617,181 shares outstanding | | $2,951,175,063 |
| Net Asset Value, offering price and redemption price per share ($2,951,175,063 ÷ 159,617,181 shares) | | $18.49 |
See accompanying notes which are an integral part of the financial statements.
Statement of Operations
| | | Six months ended August 31, 2019 (Unaudited) |
| Investment Income | | |
| Dividends | | $16,677,930 |
| Special dividends | | 14,011,380 |
| Income from Fidelity Central Funds (including $4,207 from security lending) | | 262,763 |
| Total income | | 30,952,073 |
| Expenses | | |
| Management fee | $7,416,465 | |
| Transfer agent fees | 2,424,658 | |
| Accounting and security lending fees | 408,759 | |
| Custodian fees and expenses | 11,137 | |
| Independent trustees' fees and expenses | 7,460 | |
| Registration fees | 83,034 | |
| Audit | 19,178 | |
| Legal | 2,939 | |
| Miscellaneous | 12,319 | |
| Total expenses before reductions | 10,385,949 | |
| Expense reductions | (31,302) | |
| Total expenses after reductions | | 10,354,647 |
| Net investment income (loss) | | 20,597,426 |
| Realized and Unrealized Gain (Loss) | | |
| Net realized gain (loss) on: | | |
| Investment securities: | | |
| Unaffiliated issuers | 34,780,075 | |
| Fidelity Central Funds | 23 | |
| Foreign currency transactions | 8,932 | |
| Total net realized gain (loss) | | 34,789,030 |
| Change in net unrealized appreciation (depreciation) on: | | |
| Investment securities: | | |
| Unaffiliated issuers | 136,212,292 | |
| Assets and liabilities in foreign currencies | 595 | |
| Total change in net unrealized appreciation (depreciation) | | 136,212,887 |
| Net gain (loss) | | 171,001,917 |
| Net increase (decrease) in net assets resulting from operations | | $191,599,343 |
See accompanying notes which are an integral part of the financial statements.
Statement of Changes in Net Assets
| | Six months ended August 31, 2019 (Unaudited) | Year ended February 28, 2019 |
| Increase (Decrease) in Net Assets | | |
| Operations | | |
| Net investment income (loss) | $20,597,426 | $18,430,029 |
| Net realized gain (loss) | 34,789,030 | 166,542,771 |
| Change in net unrealized appreciation (depreciation) | 136,212,887 | (133,968,209) |
| Net increase (decrease) in net assets resulting from operations | 191,599,343 | 51,004,591 |
| Distributions to shareholders | – | (258,550,952) |
| Share transactions | | |
| Proceeds from sales of shares | 428,601,902 | 996,158,246 |
| Reinvestment of distributions | – | 244,578,007 |
| Cost of shares redeemed | (464,284,848) | (1,311,720,576) |
| Net increase (decrease) in net assets resulting from share transactions | (35,682,946) | (70,984,323) |
| Total increase (decrease) in net assets | 155,916,397 | (278,530,684) |
| Net Assets | | |
| Beginning of period | 2,795,258,666 | 3,073,789,350 |
| End of period | $2,951,175,063 | $2,795,258,666 |
| Other Information | | |
| Shares | | |
| Sold | 24,795,342 | 57,403,273 |
| Issued in reinvestment of distributions | – | 15,780,023 |
| Redeemed | (27,046,588) | (77,908,049) |
| Net increase (decrease) | (2,251,246) | (4,724,753) |
See accompanying notes which are an integral part of the financial statements.
Financial Highlights
Defense and Aerospace Portfolio
| | Six months ended (Unaudited) August 31, | Years endedFebruary 28, | | | | |
| | 2019 | 2019 A | 2018 A | 2017 A | 2016 A,B | 2015 A |
| Selected Per–Share Data | | | | | | |
| Net asset value, beginning of period | $17.27 | $18.45 | $13.83 | $10.81 | $12.90 | $12.26 |
| Income from Investment Operations | | | | | | |
| Net investment income (loss)C | .13D | .11 | .09E | .13F | .11 | .11G |
| Net realized and unrealized gain (loss) | 1.09 | .33 | 5.14 | 3.52 | (1.47) | 1.31 |
| Total from investment operations | 1.22 | .44 | 5.23 | 3.65 | (1.36) | 1.42 |
| Distributions from net investment income | – | (.10) | (.07) | (.12) | (.10) | (.10) |
| Distributions from net realized gain | – | (1.52) | (.54) | (.51) | (.63) | (.68) |
| Total distributions | – | (1.62) | (.61) | (.63) | (.73) | (.78) |
| Redemption fees added to paid in capitalC | – | – | – | –H | –H | –H |
| Net asset value, end of period | $18.49 | $17.27 | $18.45 | $13.83 | $10.81 | $12.90 |
| Total ReturnI,J | 7.06% | 3.57% | 38.46% | 34.36% | (11.08)% | 12.53% |
| Ratios to Average Net AssetsK,L | | | | | | |
| Expenses before reductions | .75%M | .75% | .76% | .79% | .80% | .79% |
| Expenses net of fee waivers, if any | .75%M | .75% | .76% | .79% | .79% | .79% |
| Expenses net of all reductions | .75%M | .75% | .76% | .79% | .79% | .79% |
| Net investment income (loss) | .98%D,M | .66% | .58%E | 1.03%F | .92% | .90%G |
| Supplemental Data | | | | | | |
| Net assets, end of period (000 omitted) | $2,951,175 | $2,795,259 | $3,073,789 | $1,601,468 | $885,398 | $948,156 |
| Portfolio turnover rateN | 43%M | 44% | 32% | 24% | 52% | 20% |
A Per share amounts have been adjusted to reflect the impact of the 10 for 1 share split that occurred on August 10, 2018.
B For the year ended February 29.
C Calculated based on average shares outstanding during the period.
D Net investment income per share reflects a large, non-recurring dividend which amounted to $.09 per share. This dividend is not annualized in the ratio of net investment income (loss) to average net assets. Excluding this dividend the ratio would have been .48%.
E Net investment income per share reflects a large, non-recurring dividend which amounted to $.07 per share. Excluding this non-recurring dividend, the ratio of net investment income (loss) to average net assets would have been .14%.
F Net investment income per share reflects a large, non-recurring dividend which amounted to $.05 per share. Excluding this non-recurring dividend, the ratio of net investment income (loss) to average net assets would have been .64%.
G Net investment income per share reflects a large, non-recurring dividend which amounted to $.07 per share. Excluding this non-recurring dividend, the ratio of net investment income (loss) to average net assets would have been .34%.
H Amount represents less than $.005 per share.
I Total returns for periods of less than one year are not annualized.
J Total returns would have been lower if certain expenses had not been reduced during the applicable periods shown.
K Fees and expenses of any underlying Fidelity Central Funds are not included in the Fund's expense ratio. The Fund indirectly bears its proportionate share of the expenses of any underlying Fidelity Central Funds.
L Expense ratios reflect operating expenses of the Fund. Expenses before reductions do not reflect amounts reimbursed by the investment adviser or reductions from brokerage service arrangements or reductions from other expense offset arrangements and do not represent the amount paid by the Fund during periods when reimbursements or reductions occur. Expenses net of fee waivers reflect expenses after reimbursement by the investment adviser but prior to reductions from brokerage service arrangements or other expense offset arrangements. Expenses net of all reductions represent the net expenses paid by the Fund.
M Annualized
N Amount does not include the portfolio activity of any underlying Fidelity Central Funds.
See accompanying notes which are an integral part of the financial statements.
Environment and Alternative Energy Portfolio
Investment Summary (Unaudited)
Top Ten Stocks as of August 31, 2019
| | % of fund's net assets |
| Honeywell International, Inc. | 10.2 |
| Danaher Corp. | 8.2 |
| 3M Co. | 7.9 |
| Ingersoll-Rand PLC | 5.1 |
| Eaton Corp. PLC | 4.6 |
| TE Connectivity Ltd. | 4.5 |
| Cummins, Inc. | 3.6 |
| Innospec, Inc. | 3.2 |
| Parker Hannifin Corp. | 3.2 |
| EMCOR Group, Inc. | 3.1 |
| | 53.6 |
Top Industries (% of fund's net assets)
| As of August 31, 2019 |
| | Energy Efficiency | 45.5% |
| | Environmental Support Services | 16.8% |
| | Renewable & Alternative Energy | 11.7% |
| | Water Infrastructure & Technologies | 11.2% |
| | Other | 8.0% |
| | All Others* | 6.8% |
* Includes short-term investments and net other assets (liabilities).
Environment and Alternative Energy Portfolio
Schedule of Investments August 31, 2019 (Unaudited)
Showing Percentage of Net Assets
| Common Stocks - 96.6% | | | |
| | | Shares | Value |
| Energy Efficiency - 45.5% | | | |
| Buildings Energy Efficiency - 13.7% | | | |
| A.O. Smith Corp. (a) | | 66,540 | $3,095,441 |
| Acuity Brands, Inc. | | 21,880 | 2,743,971 |
| Apogee Enterprises, Inc. | | 37,290 | 1,377,120 |
| Comfort Systems U.S.A., Inc. | | 85,170 | 3,292,672 |
| Ingersoll-Rand PLC | | 67,360 | 8,156,622 |
| Lennox International, Inc. | | 12,491 | 3,169,966 |
| | | | 21,835,792 |
| Diversified Energy Efficiency - 10.2% | | | |
| Honeywell International, Inc. | | 98,147 | 16,156,958 |
| Industrial Energy Efficiency - 11.7% | | | |
| EMCOR Group, Inc. | | 55,828 | 4,881,600 |
| Linde PLC | | 24,980 | 4,718,972 |
| Minerals Technologies, Inc. | | 7,730 | 372,586 |
| ON Semiconductor Corp. (b) | | 166,040 | 2,955,512 |
| Regal Beloit Corp. | | 48,204 | 3,417,664 |
| Rockwell Automation, Inc. | | 14,330 | 2,189,481 |
| | | | 18,535,815 |
| Power Network Efficiency - 4.6% | | | |
| Eaton Corp. PLC | | 91,690 | 7,401,217 |
| Transport Energy Efficiency - 5.3% | | | |
| BorgWarner, Inc. | | 101,300 | 3,305,419 |
| Innospec, Inc. | | 61,907 | 5,149,424 |
| | | | 8,454,843 |
|
| TOTAL ENERGY EFFICIENCY | | | 72,384,625 |
|
| Environmental Support Services - 16.8% | | | |
| Diversified Environmental - 14.9% | | | |
| 3M Co. | | 77,972 | 12,609,632 |
| Dover Corp. | | 31,710 | 2,972,495 |
| MKS Instruments, Inc. | | 37,400 | 2,928,046 |
| Parker Hannifin Corp. | | 30,740 | 5,095,770 |
| | | | 23,605,943 |
| Environmental Consultancies - 1.9% | | | |
| AECOM (b) | | 40,330 | 1,430,908 |
| Tetra Tech, Inc. | | 20,440 | 1,658,093 |
| | | | 3,089,001 |
|
| TOTAL ENVIRONMENTAL SUPPORT SERVICES | | | 26,694,944 |
|
| Other Select Environmental - 4.6% | | | |
| Other Environmental - 4.6% | | | |
| Accenture PLC Class A | | 5,370 | 1,064,173 |
| Amcor PLC | | 127,806 | 1,255,055 |
| Boise Cascade Co. | | 2,710 | 85,094 |
| C.H. Robinson Worldwide, Inc. | | 9,440 | 797,586 |
| Henry Schein, Inc. (b) | | 6,620 | 407,924 |
| Oracle Corp. | | 16,430 | 855,346 |
| Philips Lighting NV (c) | | 96,160 | 2,812,268 |
| | | | 7,277,446 |
| Pollution Control - 3.6% | | | |
| Pollution Control Solutions - 3.6% | | | |
| Cummins, Inc. | | 38,322 | 5,720,325 |
| Renewable & Alternative Energy - 11.7% | | | |
| Biofuels - 2.0% | | | |
| Cosan SA Industria e Comercio | | 167,630 | 2,023,623 |
| Sao Martinho SA | | 265,260 | 1,142,777 |
| | | | 3,166,400 |
| Renewable Energy Developers and Independent Power Producers (IPPs) - 7.9% | | | |
| Colbun SA (b) | | 10,856,360 | 1,933,263 |
| Empresa Nacional de Electricidad SA sponsored ADR(a) | | 111,110 | 1,799,982 |
| Hollysys Automation Technologies Ltd. | | 79,161 | 1,238,870 |
| SPX Flow, Inc. (b) | | 12,670 | 427,106 |
| TE Connectivity Ltd. | | 78,480 | 7,158,946 |
| | | | 12,558,167 |
| Solar Energy Generation Equipment - 1.8% | | | |
| Advanced Energy Industries, Inc. (b) | | 56,230 | 2,903,717 |
|
| TOTAL RENEWABLE & ALTERNATIVE ENERGY | | | 18,628,284 |
|
| Waste Management & Technologies - 3.2% | | | |
| Recycling and Value Added Waste Processing - 1.4% | | | |
| Steel Dynamics, Inc. | | 84,850 | 2,290,950 |
| Waste Technology Equipment - 1.8% | | | |
| Schnitzer Steel Industries, Inc. Class A | | 127,050 | 2,812,887 |
|
| TOTAL WASTE MANAGEMENT & TECHNOLOGIES | | | 5,103,837 |
|
| Water Infrastructure & Technologies - 11.2% | | | |
| Diversified Water Infrastructure and Technology - 8.2% | | | |
| Danaher Corp. | | 91,620 | 13,018,286 |
| Water Infrastructure - 3.0% | | | |
| Crane Co. | | 42,347 | 3,228,535 |
| HD Supply Holdings, Inc. (b) | | 41,110 | 1,599,590 |
| | | | 4,828,125 |
|
| TOTAL WATER INFRASTRUCTURE & TECHNOLOGIES | | | 17,846,411 |
|
| TOTAL COMMON STOCKS | | | |
| (Cost $133,734,251) | | | 153,655,872 |
|
| Money Market Funds - 3.3% | | | |
| Fidelity Cash Central Fund 2.13% (d) | | 5,142,379 | 5,143,408 |
| Fidelity Securities Lending Cash Central Fund 2.13% (d)(e) | | 121,872 | 121,884 |
| TOTAL MONEY MARKET FUNDS | | | |
| (Cost $5,265,292) | | | 5,265,292 |
| TOTAL INVESTMENT IN SECURITIES - 99.9% | | | |
| (Cost $138,999,543) | | | 158,921,164 |
| NET OTHER ASSETS (LIABILITIES) - 0.1% | | | 97,193 |
| NET ASSETS - 100% | | | $159,018,357 |
Legend
(a) Security or a portion of the security is on loan at period end.
(b) Non-income producing
(c) Security exempt from registration under Rule 144A of the Securities Act of 1933. These securities may be resold in transactions exempt from registration, normally to qualified institutional buyers. At the end of the period, the value of these securities amounted to $2,812,268 or 1.8% of net assets.
(d) Affiliated fund that is generally available only to investment companies and other accounts managed by Fidelity Investments. The rate quoted is the annualized seven-day yield of the fund at period end. A complete unaudited listing of the fund's holdings as of its most recent quarter end is available upon request. In addition, each Fidelity Central Fund's financial statements are available on the SEC's website or upon request.
(e) Investment made with cash collateral received from securities on loan.
Affiliated Central Funds
Information regarding fiscal year to date income earned by the Fund from investments in Fidelity Central Funds is as follows:
| Fund | Income earned |
| Fidelity Cash Central Fund | $76,044 |
| Fidelity Securities Lending Cash Central Fund | 3,309 |
| Total | $79,353 |
Amounts in the income column in the above table include any capital gain distributions from underlying funds, which are presented in the corresponding line-item in the Statement of Operations, if applicable. Amount for Fidelity Securities Lending Cash Central Fund represents the income earned on investing cash collateral, less rebates paid to borrowers and any lending agent fees associated with the loan, plus any premium payments received for lending certain types of securities.
Investment Valuation
All investments are categorized as Level 1 under the Fair Value Hierarchy. The inputs or methodology used for valuing securities may not be an indication of the risk associated with investing in those securities. For more information on valuation inputs please refer to the Investment Valuation section in the accompanying Notes to Financial Statements.
Other Information
Distribution of investments by country or territory of incorporation, as a percentage of Total Net Assets, is as follows (Unaudited):
| United States of America | 75.5% |
| Ireland | 13.4% |
| Switzerland | 4.5% |
| Brazil | 2.0% |
| Netherlands | 1.8% |
| Chile | 1.2% |
| Others (Individually Less Than 1%) | 1.6% |
| | 100.0% |
See accompanying notes which are an integral part of the financial statements.
Environment and Alternative Energy Portfolio
Financial Statements
Statement of Assets and Liabilities
| | | August 31, 2019 (Unaudited) |
| Assets | | |
Investment in securities, at value (including securities loaned of $119,587) — See accompanying schedule:
Unaffiliated issuers (cost $133,734,251) | $153,655,872 | |
| Fidelity Central Funds (cost $5,265,292) | 5,265,292 | |
| Total Investment in Securities (cost $138,999,543) | | $158,921,164 |
| Receivable for fund shares sold | | 81,835 |
| Dividends receivable | | 465,769 |
| Distributions receivable from Fidelity Central Funds | | 11,246 |
| Prepaid expenses | | 1,674 |
| Other receivables | | 1,289 |
| Total assets | | 159,482,977 |
| Liabilities | | |
| Payable for fund shares redeemed | $211,679 | |
| Accrued management fee | 70,900 | |
| Transfer agent fee payable | 32,148 | |
| Other affiliated payables | 5,149 | |
| Other payables and accrued expenses | 23,169 | |
| Collateral on securities loaned | 121,575 | |
| Total liabilities | | 464,620 |
| Net Assets | | $159,018,357 |
| Net Assets consist of: | | |
| Paid in capital | | $140,355,728 |
| Total distributable earnings (loss) | | 18,662,629 |
| Net Assets, for 6,666,626 shares outstanding | | $159,018,357 |
| Net Asset Value, offering price and redemption price per share ($159,018,357 ÷ 6,666,626 shares) | | $23.85 |
See accompanying notes which are an integral part of the financial statements.
Statement of Operations
| | | Six months ended August 31, 2019 (Unaudited) |
| Investment Income | | |
| Dividends | | $1,729,133 |
| Income from Fidelity Central Funds (including $3,309 from security lending) | | 79,353 |
| Total income | | 1,808,486 |
| Expenses | | |
| Management fee | $472,647 | |
| Transfer agent fees | 200,963 | |
| Accounting and security lending fees | 34,276 | |
| Custodian fees and expenses | 5,016 | |
| Independent trustees' fees and expenses | 475 | |
| Registration fees | 21,089 | |
| Audit | 26,908 | |
| Legal | 165 | |
| Interest | 1,861 | |
| Miscellaneous | 623 | |
| Total expenses before reductions | 764,023 | |
| Expense reductions | (4,079) | |
| Total expenses after reductions | | 759,944 |
| Net investment income (loss) | | 1,048,542 |
| Realized and Unrealized Gain (Loss) | | |
| Net realized gain (loss) on: | | |
| Investment securities: | | |
| Unaffiliated issuers | (2,075,638) | |
| Fidelity Central Funds | 309 | |
| Foreign currency transactions | (1,031) | |
| Total net realized gain (loss) | | (2,076,360) |
| Change in net unrealized appreciation (depreciation) on: | | |
| Investment securities: | | |
| Unaffiliated issuers | (3,979,680) | |
| Assets and liabilities in foreign currencies | (1,988) | |
| Total change in net unrealized appreciation (depreciation) | | (3,981,668) |
| Net gain (loss) | | (6,058,028) |
| Net increase (decrease) in net assets resulting from operations | | $(5,009,486) |
See accompanying notes which are an integral part of the financial statements.
Statement of Changes in Net Assets
| | Six months ended August 31, 2019 (Unaudited) | Year ended February 28, 2019 |
| Increase (Decrease) in Net Assets | | |
| Operations | | |
| Net investment income (loss) | $1,048,542 | $1,466,779 |
| Net realized gain (loss) | (2,076,360) | 7,646,839 |
| Change in net unrealized appreciation (depreciation) | (3,981,668) | (8,828,163) |
| Net increase (decrease) in net assets resulting from operations | (5,009,486) | 285,455 |
| Distributions to shareholders | (3,004,920) | (8,454,008) |
| Share transactions | | |
| Proceeds from sales of shares | 61,636,355 | 40,206,295 |
| Reinvestment of distributions | 2,856,265 | 7,969,907 |
| Cost of shares redeemed | (58,420,081) | (67,430,135) |
| Net increase (decrease) in net assets resulting from share transactions | 6,072,539 | (19,253,933) |
| Total increase (decrease) in net assets | (1,941,867) | (27,422,486) |
| Net Assets | | |
| Beginning of period | 160,960,224 | 188,382,710 |
| End of period | $159,018,357 | $160,960,224 |
| Other Information | | |
| Shares | | |
| Sold | 2,474,902 | 1,651,291 |
| Issued in reinvestment of distributions | 111,225 | 340,861 |
| Redeemed | (2,377,656) | (2,693,678) |
| Net increase (decrease) | 208,471 | (701,526) |
See accompanying notes which are an integral part of the financial statements.
Financial Highlights
Environment and Alternative Energy Portfolio
| | Six months ended (Unaudited) August 31, | Years endedFebruary 28, | | | | |
| | 2019 | 2019 | 2018 | 2017 | 2016 A | 2015 |
| Selected Per–Share Data | | | | | | |
| Net asset value, beginning of period | $24.92 | $26.31 | $23.89 | $18.20 | $20.94 | $23.36 |
| Income from Investment Operations | | | | | | |
| Net investment income (loss)B | .15 | .24 | .27 | .20 | .17 | .16 |
| Net realized and unrealized gain (loss) | (.82) | (.25) | 3.83 | 5.78 | (2.34) | .31 |
| Total from investment operations | (.67) | (.01) | 4.10 | 5.98 | (2.17) | .47 |
| Distributions from net investment income | (.05) | (.22) | (.22) | (.16) | (.13) | (.14) |
| Distributions from net realized gain | (.35) | (1.16) | (1.46) | (.13) | (.44) | (2.75) |
| Total distributions | (.40) | (1.38) | (1.68) | (.29) | (.57) | (2.89) |
| Redemption fees added to paid in capitalB | – | – | –C | –C | –C | –C |
| Net asset value, end of period | $23.85 | $24.92 | $26.31 | $23.89 | $18.20 | $20.94 |
| Total ReturnD,E | (2.81)% | .39% | 17.73% | 33.02% | (10.63)% | 2.19% |
| Ratios to Average Net AssetsF,G | | | | | | |
| Expenses before reductions | .87%H | .87% | .87% | .94% | .95% | .92% |
| Expenses net of fee waivers, if any | .87%H | .87% | .87% | .94% | .95% | .92% |
| Expenses net of all reductions | .86%H | .87% | .86% | .94% | .95% | .92% |
| Net investment income (loss) | 1.19%H | .96% | 1.07% | .94% | .86% | .71% |
| Supplemental Data | | | | | | |
| Net assets, end of period (000 omitted) | $159,018 | $160,960 | $188,383 | $137,674 | $73,432 | $88,573 |
| Portfolio turnover rateI | 28%H | 62% | 47% | 82% | 20% | 160% |
A For the year ended February 29.
B Calculated based on average shares outstanding during the period.
C Amount represents less than $.005 per share.
D Total returns for periods of less than one year are not annualized.
E Total returns would have been lower if certain expenses had not been reduced during the applicable periods shown.
F Fees and expenses of any underlying Fidelity Central Funds are not included in the Fund's expense ratio. The Fund indirectly bears its proportionate share of the expenses of any underlying Fidelity Central Funds.
G Expense ratios reflect operating expenses of the Fund. Expenses before reductions do not reflect amounts reimbursed by the investment adviser or reductions from brokerage service arrangements or reductions from other expense offset arrangements and do not represent the amount paid by the Fund during periods when reimbursements or reductions occur. Expenses net of fee waivers reflect expenses after reimbursement by the investment adviser but prior to reductions from brokerage service arrangements or other expense offset arrangements. Expenses net of all reductions represent the net expenses paid by the Fund.
H Annualized
I Amount does not include the portfolio activity of any underlying Fidelity Central Funds.
See accompanying notes which are an integral part of the financial statements.
Industrials Portfolio
Investment Summary (Unaudited)
Top Ten Stocks as of August 31, 2019
| | % of fund's net assets |
| The Boeing Co. | 6.7 |
| AMETEK, Inc. | 5.7 |
| Union Pacific Corp. | 5.1 |
| Roper Technologies, Inc. | 5.0 |
| Ingersoll-Rand PLC | 4.2 |
| Honeywell International, Inc. | 4.1 |
| Equifax, Inc. | 4.0 |
| Waste Connection, Inc. (United States) | 3.8 |
| Verisk Analytics, Inc. | 3.7 |
| Lockheed Martin Corp. | 3.7 |
| | 46.0 |
Top Industries (% of fund's net assets)
| As of August 31, 2019 |
| | Aerospace & Defense | 28.1% |
| | Industrial Conglomerates | 15.8% |
| | Professional Services | 12.2% |
| | Machinery | 10.5% |
| | Road & Rail | 10.3% |
| | All Others* | 23.1% |

* Includes short-term investments and net other assets (liabilities).
Industrials Portfolio
Schedule of Investments August 31, 2019 (Unaudited)
Showing Percentage of Net Assets
| Common Stocks - 99.4% | | | |
| | | Shares | Value |
| Aerospace & Defense - 28.1% | | | |
| Aerospace & Defense - 28.1% | | | |
| General Dynamics Corp. | | 51,535 | $9,857,099 |
| Harris Corp. | | 79,562 | 16,820,202 |
| HEICO Corp. Class A | | 147,120 | 16,236,163 |
| Huntington Ingalls Industries, Inc. | | 6,160 | 1,287,440 |
| Lockheed Martin Corp. | | 56,306 | 21,627,698 |
| Northrop Grumman Corp. | | 52,199 | 19,202,446 |
| Raytheon Co. | | 22,882 | 4,240,492 |
| Teledyne Technologies, Inc. (a) | | 23,303 | 7,191,073 |
| The Boeing Co. | | 107,849 | 39,266,744 |
| TransDigm Group, Inc. | | 33,127 | 17,832,927 |
| United Technologies Corp. | | 84,861 | 11,052,297 |
| | | | 164,614,581 |
| Air Freight & Logistics - 3.1% | | | |
| Air Freight & Logistics - 3.1% | | | |
| United Parcel Service, Inc. Class B | | 153,322 | 18,193,189 |
| Airlines - 2.5% | | | |
| Airlines - 2.5% | | | |
| Delta Air Lines, Inc. | | 135,261 | 7,826,201 |
| Southwest Airlines Co. | | 63,560 | 3,325,459 |
| Spirit Airlines, Inc. (a) | | 95,634 | 3,590,100 |
| | | | 14,741,760 |
| Building Products - 0.9% | | | |
| Building Products - 0.9% | | | |
| Johnson Controls International PLC | | 117,507 | 5,016,374 |
| Commercial Services & Supplies - 4.8% | | | |
| Diversified Support Services - 0.9% | | | |
| Cintas Corp. | | 19,808 | 5,225,350 |
| Environmental & Facility Services - 3.9% | | | |
| Stericycle, Inc. (a) | | 13,299 | 596,992 |
| Waste Connection, Inc. (United States) | | 240,426 | 22,095,149 |
| | | | 22,692,141 |
|
| TOTAL COMMERCIAL SERVICES & SUPPLIES | | | 27,917,491 |
|
| Electrical Equipment - 9.5% | | | |
| Electrical Components & Equipment - 9.5% | | | |
| AMETEK, Inc. | | 387,746 | 33,319,014 |
| Emerson Electric Co. | | 24,099 | 1,436,059 |
| Fortive Corp. | | 296,401 | 21,014,831 |
| | | | 55,769,904 |
| Industrial Conglomerates - 15.8% | | | |
| Industrial Conglomerates - 15.8% | | | |
| General Electric Co. | | 2,429,233 | 20,041,172 |
| Honeywell International, Inc. | | 146,298 | 24,083,577 |
| ITT, Inc. | | 338,550 | 19,270,266 |
| Roper Technologies, Inc. | | 79,668 | 29,219,036 |
| | | | 92,614,051 |
| Machinery - 10.5% | | | |
| Agricultural & Farm Machinery - 0.5% | | | |
| Deere & Co. | | 18,384 | 2,847,865 |
| Construction Machinery & Heavy Trucks - 0.5% | | | |
| Caterpillar, Inc. | | 23,647 | 2,813,993 |
| Industrial Machinery - 9.5% | | | |
| Gardner Denver Holdings, Inc. (a) | | 375,064 | 10,756,836 |
| IDEX Corp. | | 123,407 | 20,326,367 |
| Ingersoll-Rand PLC | | 205,465 | 24,879,757 |
| | | | 55,962,960 |
|
| TOTAL MACHINERY | | | 61,624,818 |
|
| Professional Services - 12.2% | | | |
| Human Resource & Employment Services - 2.0% | | | |
| TriNet Group, Inc. (a) | | 174,813 | 11,735,197 |
| Research & Consulting Services - 10.2% | | | |
| CoStar Group, Inc. (a) | | 10,947 | 6,730,982 |
| Equifax, Inc. | | 158,459 | 23,195,228 |
| IHS Markit Ltd. (a) | | 40,393 | 2,650,185 |
| TransUnion Holding Co., Inc. | | 67,065 | 5,609,987 |
| Verisk Analytics, Inc. | | 134,117 | 21,665,260 |
| | | | 59,851,642 |
|
| TOTAL PROFESSIONAL SERVICES | | | 71,586,839 |
|
| Road & Rail - 10.3% | | | |
| Railroads - 8.3% | | | |
| CSX Corp. | | 52,705 | 3,532,289 |
| Norfolk Southern Corp. | | 86,609 | 15,074,296 |
| Union Pacific Corp. | | 183,521 | 29,723,061 |
| | | | 48,329,646 |
| Trucking - 2.0% | | | |
| Knight-Swift Transportation Holdings, Inc. Class A (b) | | 278,913 | 9,522,090 |
| Schneider National, Inc. Class B | | 120,335 | 2,339,312 |
| | | | 11,861,402 |
|
| TOTAL ROAD & RAIL | | | 60,191,048 |
|
| Trading Companies & Distributors - 1.7% | | | |
| Trading Companies & Distributors - 1.7% | | | |
| HD Supply Holdings, Inc. (a) | | 247,766 | 9,640,575 |
| TOTAL COMMON STOCKS | | | |
| (Cost $470,403,260) | | | 581,910,630 |
|
| Money Market Funds - 2.0% | | | |
| Fidelity Cash Central Fund 2.13% (c) | | 2,123,724 | 2,124,149 |
| Fidelity Securities Lending Cash Central Fund 2.13% (c)(d) | | 9,549,589 | 9,550,544 |
| TOTAL MONEY MARKET FUNDS | | | |
| (Cost $11,674,693) | | | 11,674,693 |
| TOTAL INVESTMENT IN SECURITIES - 101.4% | | | |
| (Cost $482,077,953) | | | 593,585,323 |
| NET OTHER ASSETS (LIABILITIES) - (1.4)% | | | (8,249,729) |
| NET ASSETS - 100% | | | $585,335,594 |
Legend
(a) Non-income producing
(b) Security or a portion of the security is on loan at period end.
(c) Affiliated fund that is generally available only to investment companies and other accounts managed by Fidelity Investments. The rate quoted is the annualized seven-day yield of the fund at period end. A complete unaudited listing of the fund's holdings as of its most recent quarter end is available upon request. In addition, each Fidelity Central Fund's financial statements are available on the SEC's website or upon request.
(d) Investment made with cash collateral received from securities on loan.
Affiliated Central Funds
Information regarding fiscal year to date income earned by the Fund from investments in Fidelity Central Funds is as follows:
| Fund | Income earned |
| Fidelity Cash Central Fund | $44,605 |
| Fidelity Securities Lending Cash Central Fund | 140 |
| Total | $44,745 |
Amounts in the income column in the above table include any capital gain distributions from underlying funds, which are presented in the corresponding line-item in the Statement of Operations, if applicable. Amount for Fidelity Securities Lending Cash Central Fund represents the income earned on investing cash collateral, less rebates paid to borrowers and any lending agent fees associated with the loan, plus any premium payments received for lending certain types of securities.
Investment Valuation
All investments are categorized as Level 1 under the Fair Value Hierarchy. The inputs or methodology used for valuing securities may not be an indication of the risk associated with investing in those securities. For more information on valuation inputs please refer to the Investment Valuation section in the accompanying Notes to Financial Statements.
See accompanying notes which are an integral part of the financial statements.
Industrials Portfolio
Financial Statements
Statement of Assets and Liabilities
| | | August 31, 2019 (Unaudited) |
| Assets | | |
Investment in securities, at value (including securities loaned of $9,519,871) — See accompanying schedule:
Unaffiliated issuers (cost $470,403,260) | $581,910,630 | |
| Fidelity Central Funds (cost $11,674,693) | 11,674,693 | |
| Total Investment in Securities (cost $482,077,953) | | $593,585,323 |
| Receivable for investments sold | | 1,405,913 |
| Receivable for fund shares sold | | 89,765 |
| Dividends receivable | | 1,066,183 |
| Distributions receivable from Fidelity Central Funds | | 3,713 |
| Prepaid expenses | | 8,800 |
| Other receivables | | 92,784 |
| Total assets | | 596,252,481 |
| Liabilities | | |
| Payable for investments purchased | $160,718 | |
| Payable for fund shares redeemed | 729,278 | |
| Accrued management fee | 264,448 | |
| Other affiliated payables | 106,505 | |
| Other payables and accrued expenses | 105,394 | |
| Collateral on securities loaned | 9,550,544 | |
| Total liabilities | | 10,916,887 |
| Net Assets | | $585,335,594 |
| Net Assets consist of: | | |
| Paid in capital | | $456,723,483 |
| Total distributable earnings (loss) | | 128,612,111 |
| Net Assets, for 16,913,916 shares outstanding | | $585,335,594 |
| Net Asset Value, offering price and redemption price per share ($585,335,594 ÷ 16,913,916 shares) | | $34.61 |
See accompanying notes which are an integral part of the financial statements.
Statement of Operations
| | | Six months ended August 31, 2019 (Unaudited) |
| Investment Income | | |
| Dividends | | $4,126,609 |
| Special dividends | | 1,047,000 |
| Income from Fidelity Central Funds (including $140 from security lending) | | 44,745 |
| Total income | | 5,218,354 |
| Expenses | | |
| Management fee | $1,673,630 | |
| Transfer agent fees | 540,329 | |
| Accounting and security lending fees | 114,307 | |
| Custodian fees and expenses | 4,820 | |
| Independent trustees' fees and expenses | 1,723 | |
| Registration fees | 17,122 | |
| Audit | 21,347 | |
| Legal | 1,379 | |
| Miscellaneous | 3,376 | |
| Total expenses before reductions | 2,378,033 | |
| Expense reductions | (23,695) | |
| Total expenses after reductions | | 2,354,338 |
| Net investment income (loss) | | 2,864,016 |
| Realized and Unrealized Gain (Loss) | | |
| Net realized gain (loss) on: | | |
| Investment securities: | | |
| Unaffiliated issuers | 16,871,578 | |
| Redemptions in-kind with affiliated entities | 4,051,467 | |
| Total net realized gain (loss) | | 20,923,045 |
| Change in net unrealized appreciation (depreciation) on: | | |
| Investment securities: | | |
| Unaffiliated issuers | (10,065,206) | |
| Assets and liabilities in foreign currencies | (2) | |
| Total change in net unrealized appreciation (depreciation) | | (10,065,208) |
| Net gain (loss) | | 10,857,837 |
| Net increase (decrease) in net assets resulting from operations | | $13,721,853 |
See accompanying notes which are an integral part of the financial statements.
Statement of Changes in Net Assets
| | Six months ended August 31, 2019 (Unaudited) | Year ended February 28, 2019 |
| Increase (Decrease) in Net Assets | | |
| Operations | | |
| Net investment income (loss) | $2,864,016 | $6,617,484 |
| Net realized gain (loss) | 20,923,045 | 96,502,940 |
| Change in net unrealized appreciation (depreciation) | (10,065,208) | (119,039,649) |
| Net increase (decrease) in net assets resulting from operations | 13,721,853 | (15,919,225) |
| Distributions to shareholders | – | (65,750,180) |
| Share transactions | | |
| Proceeds from sales of shares | 37,166,080 | 81,696,031 |
| Reinvestment of distributions | – | 62,911,721 |
| Cost of shares redeemed | (98,022,128) | (507,418,619) |
| Net increase (decrease) in net assets resulting from share transactions | (60,856,048) | (362,810,867) |
| Total increase (decrease) in net assets | (47,134,195) | (444,480,272) |
| Net Assets | | |
| Beginning of period | 632,469,789 | 1,076,950,061 |
| End of period | $585,335,594 | $632,469,789 |
| Other Information | | |
| Shares | | |
| Sold | 1,074,664 | 2,374,933 |
| Issued in reinvestment of distributions | – | 1,933,852 |
| Redeemed | (2,848,863) | (14,757,500) |
| Net increase (decrease) | (1,774,199) | (10,448,715) |
See accompanying notes which are an integral part of the financial statements.
Financial Highlights
Industrials Portfolio
| | Six months ended (Unaudited) August 31, | Years endedFebruary 28, | | | | |
| | 2019 | 2019 | 2018 | 2017 | 2016 A | 2015 |
| Selected Per–Share Data | | | | | | |
| Net asset value, beginning of period | $33.84 | $36.96 | $33.72 | $28.10 | $32.69 | $33.69 |
| Income from Investment Operations | | | | | | |
| Net investment income (loss)B | .16C | .32 | .21 | .26 | .24 | .22 |
| Net realized and unrealized gain (loss) | .61 | (.70) | 4.95 | 6.76 | (2.90) | 2.44 |
| Total from investment operations | .77 | (.38) | 5.16 | 7.02 | (2.66) | 2.66 |
| Distributions from net investment income | – | (.25) | (.22) | (.19) | (.20) | (.23) |
| Distributions from net realized gain | – | (2.49) | (1.71) | (1.21) | (1.73) | (3.43) |
| Total distributions | – | (2.74) | (1.92)D | (1.40) | (1.93) | (3.66) |
| Redemption fees added to paid in capitalB | – | – | – | –E | –E | –E |
| Net asset value, end of period | $34.61 | $33.84 | $36.96 | $33.72 | $28.10 | $32.69 |
| Total ReturnF,G | 2.28% | (.45)% | 15.73% | 25.18% | (8.29)% | 8.74% |
| Ratios to Average Net AssetsH,I | | | | | | |
| Expenses before reductions | .76%J | .76% | .77% | .77% | .77% | .78% |
| Expenses net of fee waivers, if any | .76%J | .76% | .77% | .77% | .76% | .78% |
| Expenses net of all reductions | .75%J | .75% | .77% | .77% | .76% | .78% |
| Net investment income (loss) | .75%C,J | .92% | .60% | .83% | .79% | .68% |
| Supplemental Data | | | | | | |
| Net assets, end of period (000 omitted) | $585,336 | $632,470 | $1,076,950 | $1,006,420 | $978,550 | $1,142,689 |
| Portfolio turnover rateK | 111%J,L | 88%L | 64%M | 62%L | 75%L | 72%L |
A For the year ended February 29.
B Calculated based on average shares outstanding during the period.
C Net investment income per share reflects a large, non-recurring dividend which amounted to $.06 per share. This dividend is not annualized in the ratio of net investment income (loss) to average net assets. Excluding this dividend the ratio would have been .58%.
D Total distributions of $1.92 per share is comprised of distributions from net investment income of $.216 and distributions from net realized gain of $1.705 per share.
E Amount represents less than $.005 per share.
F Total returns for periods of less than one year are not annualized.
G Total returns would have been lower if certain expenses had not been reduced during the applicable periods shown.
H Fees and expenses of any underlying Fidelity Central Funds are not included in the Fund's expense ratio. The Fund indirectly bears its proportionate share of the expenses of any underlying Fidelity Central Funds.
I Expense ratios reflect operating expenses of the Fund. Expenses before reductions do not reflect amounts reimbursed by the investment adviser or reductions from brokerage service arrangements or reductions from other expense offset arrangements and do not represent the amount paid by the Fund during periods when reimbursements or reductions occur. Expenses net of fee waivers reflect expenses after reimbursement by the investment adviser but prior to reductions from brokerage service arrangements or other expense offset arrangements. Expenses net of all reductions represent the net expenses paid by the Fund.
J Annualized
K Amount does not include the portfolio activity of any underlying Fidelity Central Funds.
L Portfolio turnover rate excludes securities received or delivered in-kind.
M The portfolio turnover rate does not include the assets acquired in the merger.
See accompanying notes which are an integral part of the financial statements.
Transportation Portfolio
Investment Summary (Unaudited)
Top Ten Stocks as of August 31, 2019
| | % of fund's net assets |
| Union Pacific Corp. | 20.9 |
| United Parcel Service, Inc. Class B | 14.6 |
| Norfolk Southern Corp. | 7.2 |
| CSX Corp. | 6.9 |
| Southwest Airlines Co. | 4.9 |
| FedEx Corp. | 4.8 |
| Delta Air Lines, Inc. | 4.4 |
| Genesee & Wyoming, Inc. Class A | 3.7 |
| Kansas City Southern | 3.2 |
| JetBlue Airways Corp. | 2.3 |
| | 72.9 |
Top Industries (% of fund's net assets)
| As of August 31, 2019 |
| | Road & Rail | 48.5% |
| | Air Freight & Logistics | 23.5% |
| | Airlines | 18.6% |
| | Marine | 2.6% |
| | Transportation Infrastructure | 1.8% |
| | All Others* | 5.0% |

* Includes short-term investments and net other assets (liabilities).
Transportation Portfolio
Schedule of Investments August 31, 2019 (Unaudited)
Showing Percentage of Net Assets
| Common Stocks - 96.8% | | | |
| | | Shares | Value |
| Aerospace & Defense - 0.6% | | | |
| Aerospace & Defense - 0.6% | | | |
| Northrop Grumman Corp. | | 3,400 | $1,250,758 |
| TransDigm Group, Inc. | | 2,300 | 1,238,136 |
| | | | 2,488,894 |
| Air Freight & Logistics - 23.5% | | | |
| Air Freight & Logistics - 23.5% | | | |
| Air Transport Services Group, Inc. (a)(b) | | 152,400 | 3,078,480 |
| Atlas Air Worldwide Holdings, Inc. (a) | | 8,800 | 227,480 |
| C.H. Robinson Worldwide, Inc. (b) | | 52,796 | 4,460,734 |
| Echo Global Logistics, Inc. (a) | | 345,300 | 6,919,812 |
| FedEx Corp. | | 120,750 | 19,152,158 |
| Hub Group, Inc. Class A (a)(b) | | 31,800 | 1,369,308 |
| United Parcel Service, Inc. Class B | | 489,500 | 58,084,070 |
| | | | 93,292,042 |
| Airlines - 18.6% | | | |
| Airlines - 18.6% | | | |
| Alaska Air Group, Inc. | | 82,700 | 4,938,844 |
| American Airlines Group, Inc. | | 151,700 | 3,991,227 |
| Delta Air Lines, Inc. | | 301,802 | 17,462,264 |
| Hawaiian Holdings, Inc. | | 35,400 | 864,114 |
| JetBlue Airways Corp. (a) | | 536,200 | 9,286,984 |
| Mesa Air Group, Inc. | | 351,600 | 2,271,336 |
| SkyWest, Inc. | | 143,700 | 8,228,262 |
| Southwest Airlines Co. | | 373,300 | 19,531,056 |
| Spirit Airlines, Inc. (a) | | 163,100 | 6,122,774 |
| United Continental Holdings, Inc. (a) | | 14,700 | 1,239,357 |
| | | | 73,936,218 |
| Commercial Services & Supplies - 0.8% | | | |
| Diversified Support Services - 0.8% | | | |
| Boyd Group Income Fund | | 23,500 | 3,143,924 |
| Marine - 2.6% | | | |
| Marine - 2.6% | | | |
| Kirby Corp. (a)(b) | | 122,300 | 9,000,057 |
| Matson, Inc. | | 32,495 | 1,154,547 |
| | | | 10,154,604 |
| Road & Rail - 48.5% | | | |
| Railroads - 43.5% | | | |
| Canadian Pacific Railway Ltd. | | 27,300 | 6,573,202 |
| CSX Corp. | | 408,219 | 27,358,837 |
| Genesee & Wyoming, Inc. Class A (a) | | 131,600 | 14,591,808 |
| Kansas City Southern | | 100,800 | 12,680,640 |
| Norfolk Southern Corp. | | 164,550 | 28,639,928 |
| Union Pacific Corp. | | 514,095 | 83,262,826 |
| | | | 173,107,241 |
| Trucking - 5.0% | | | |
| AMERCO (b) | | 7,400 | 2,601,988 |
| Avis Budget Group, Inc. (a)(b) | | 67,000 | 1,659,590 |
| Hertz Global Holdings, Inc. (a)(b) | | 288,291 | 3,491,204 |
| J.B. Hunt Transport Services, Inc. | | 34,500 | 3,727,380 |
| Knight-Swift Transportation Holdings, Inc. Class A | | 10,200 | 348,228 |
| Old Dominion Freight Lines, Inc. | | 13,200 | 2,161,632 |
| Ryder System, Inc. | | 111,600 | 5,375,772 |
| Werner Enterprises, Inc. | | 13,683 | 447,160 |
| | | | 19,812,954 |
|
| TOTAL ROAD & RAIL | | | 192,920,195 |
|
| Trading Companies & Distributors - 0.4% | | | |
| Trading Companies & Distributors - 0.4% | | | |
| AerCap Holdings NV (a) | | 28,300 | 1,517,446 |
| Transportation Infrastructure - 1.8% | | | |
| Airport Services - 1.8% | | | |
| Macquarie Infrastructure Co. LLC | | 193,700 | 7,325,734 |
| TOTAL COMMON STOCKS | | | |
| (Cost $240,948,968) | | | 384,779,057 |
|
| Money Market Funds - 6.8% | | | |
| Fidelity Cash Central Fund 2.13% (c) | | 13,675,113 | 13,677,848 |
| Fidelity Securities Lending Cash Central Fund 2.13% (c)(d) | | 13,479,342 | 13,480,690 |
| TOTAL MONEY MARKET FUNDS | | | |
| (Cost $27,158,538) | | | 27,158,538 |
| TOTAL INVESTMENT IN SECURITIES - 103.6% | | | |
| (Cost $268,107,506) | | | 411,937,595 |
| NET OTHER ASSETS (LIABILITIES) - (3.6)% | | | (14,341,820) |
| NET ASSETS - 100% | | | $397,595,775 |
Legend
(a) Non-income producing
(b) Security or a portion of the security is on loan at period end.
(c) Affiliated fund that is generally available only to investment companies and other accounts managed by Fidelity Investments. The rate quoted is the annualized seven-day yield of the fund at period end. A complete unaudited listing of the fund's holdings as of its most recent quarter end is available upon request. In addition, each Fidelity Central Fund's financial statements are available on the SEC's website or upon request.
(d) Investment made with cash collateral received from securities on loan.
Affiliated Central Funds
Information regarding fiscal year to date income earned by the Fund from investments in Fidelity Central Funds is as follows:
| Fund | Income earned |
| Fidelity Cash Central Fund | $156,023 |
| Fidelity Securities Lending Cash Central Fund | 5,630 |
| Total | $161,653 |
Amounts in the income column in the above table include any capital gain distributions from underlying funds, which are presented in the corresponding line-item in the Statement of Operations, if applicable. Amount for Fidelity Securities Lending Cash Central Fund represents the income earned on investing cash collateral, less rebates paid to borrowers and any lending agent fees associated with the loan, plus any premium payments received for lending certain types of securities.
Investment Valuation
All investments are categorized as Level 1 under the Fair Value Hierarchy. The inputs or methodology used for valuing securities may not be an indication of the risk associated with investing in those securities. For more information on valuation inputs please refer to the Investment Valuation section in the accompanying Notes to Financial Statements.
See accompanying notes which are an integral part of the financial statements.
Transportation Portfolio
Financial Statements
Statement of Assets and Liabilities
| | | August 31, 2019 (Unaudited) |
| Assets | | |
Investment in securities, at value (including securities loaned of $13,150,922) — See accompanying schedule:
Unaffiliated issuers (cost $240,948,968) | $384,779,057 | |
| Fidelity Central Funds (cost $27,158,538) | 27,158,538 | |
| Total Investment in Securities (cost $268,107,506) | | $411,937,595 |
| Receivable for fund shares sold | | 65,932 |
| Dividends receivable | | 1,404,930 |
| Distributions receivable from Fidelity Central Funds | | 21,697 |
| Prepaid expenses | | 4,468 |
| Other receivables | | 833 |
| Total assets | | 413,435,455 |
| Liabilities | | |
| Payable for investments purchased | $1,611,578 | |
| Payable for fund shares redeemed | 465,120 | |
| Accrued management fee | 179,200 | |
| Other affiliated payables | 81,468 | |
| Other payables and accrued expenses | 21,639 | |
| Collateral on securities loaned | 13,480,675 | |
| Total liabilities | | 15,839,680 |
| Net Assets | | $397,595,775 |
| Net Assets consist of: | | |
| Paid in capital | | $256,357,020 |
| Total distributable earnings (loss) | | 141,238,755 |
| Net Assets, for 4,418,577 shares outstanding | | $397,595,775 |
| Net Asset Value, offering price and redemption price per share ($397,595,775 ÷ 4,418,577 shares) | | $89.98 |
See accompanying notes which are an integral part of the financial statements.
Statement of Operations
| | | Six months ended August 31, 2019 (Unaudited) |
| Investment Income | | |
| Dividends | | $4,149,420 |
| Income from Fidelity Central Funds (including $5,630 from security lending) | | 161,653 |
| Total income | | 4,311,073 |
| Expenses | | |
| Management fee | $1,150,467 | |
| Transfer agent fees | 424,441 | |
| Accounting and security lending fees | 83,467 | |
| Custodian fees and expenses | 2,599 | |
| Independent trustees' fees and expenses | 1,207 | |
| Registration fees | 22,617 | |
| Audit | 26,330 | |
| Legal | 1,833 | |
| Miscellaneous | 1,715 | |
| Total expenses before reductions | 1,714,676 | |
| Expense reductions | (3,581) | |
| Total expenses after reductions | | 1,711,095 |
| Net investment income (loss) | | 2,599,978 |
| Realized and Unrealized Gain (Loss) | | |
| Net realized gain (loss) on: | | |
| Investment securities: | | |
| Unaffiliated issuers | (2,826,160) | |
| Fidelity Central Funds | 15 | |
| Foreign currency transactions | 12 | |
| Total net realized gain (loss) | | (2,826,133) |
| Change in net unrealized appreciation (depreciation) on: | | |
| Investment securities: | | |
| Unaffiliated issuers | (12,347,967) | |
| Assets and liabilities in foreign currencies | (1) | |
| Total change in net unrealized appreciation (depreciation) | | (12,347,968) |
| Net gain (loss) | | (15,174,101) |
| Net increase (decrease) in net assets resulting from operations | | $(12,574,123) |
See accompanying notes which are an integral part of the financial statements.
Statement of Changes in Net Assets
| | Six months ended August 31, 2019 (Unaudited) | Year ended February 28, 2019 |
| Increase (Decrease) in Net Assets | | |
| Operations | | |
| Net investment income (loss) | $2,599,978 | $4,120,803 |
| Net realized gain (loss) | (2,826,133) | 35,678,195 |
| Change in net unrealized appreciation (depreciation) | (12,347,968) | (13,313,644) |
| Net increase (decrease) in net assets resulting from operations | (12,574,123) | 26,485,354 |
| Distributions to shareholders | (13,041,305) | (46,373,355) |
| Share transactions | | |
| Proceeds from sales of shares | 26,220,708 | 101,838,716 |
| Reinvestment of distributions | 12,378,575 | 43,939,054 |
| Cost of shares redeemed | (66,579,744) | (186,853,315) |
| Net increase (decrease) in net assets resulting from share transactions | (27,980,461) | (41,075,545) |
| Total increase (decrease) in net assets | (53,595,889) | (60,963,546) |
| Net Assets | | |
| Beginning of period | 451,191,664 | 512,155,210 |
| End of period | $397,595,775 | $451,191,664 |
| Other Information | | |
| Shares | | |
| Sold | 281,454 | 1,020,111 |
| Issued in reinvestment of distributions | 129,213 | 490,031 |
| Redeemed | (720,833) | (1,950,861) |
| Net increase (decrease) | (310,166) | (440,719) |
See accompanying notes which are an integral part of the financial statements.
Financial Highlights
Transportation Portfolio
| | Six months ended (Unaudited) August 31, | Years endedFebruary 28, | | | | |
| | 2019 | 2019 | 2018 | 2017 | 2016 A | 2015 |
| Selected Per–Share Data | | | | | | |
| Net asset value, beginning of period | $95.41 | $99.07 | $92.98 | $73.25 | $94.04 | $76.28 |
| Income from Investment Operations | | | | | | |
| Net investment income (loss)B | .56 | .85 | .78 | .63 | .50 | .46 |
| Net realized and unrealized gain (loss) | (3.16) | 5.05 | 10.83 | 20.86 | (15.81) | 19.67 |
| Total from investment operations | (2.60) | 5.90 | 11.61 | 21.49 | (15.31) | 20.13 |
| Distributions from net investment income | (.25) | (.78) | (.67) | (.38) | (.52) | (.34) |
| Distributions from net realized gain | (2.58) | (8.78) | (4.85) | (1.39) | (4.95) | (2.04) |
| Total distributions | (2.83) | (9.56) | (5.52) | (1.77) | (5.48)C | (2.38) |
| Redemption fees added to paid in capitalB | – | – | –D | .01 | –D | .01 |
| Net asset value, end of period | $89.98 | $95.41 | $99.07 | $92.98 | $73.25 | $94.04 |
| Total ReturnE,F | (2.91)% | 6.85% | 12.48% | 29.40% | (16.28)% | 26.80% |
| Ratios to Average Net AssetsG,H | | | | | | |
| Expenses before reductions | .80%I | .79% | .80% | .83% | .81% | .81% |
| Expenses net of fee waivers, if any | .80%I | .79% | .80% | .83% | .81% | .81% |
| Expenses net of all reductions | .80%I | .78% | .80% | .82% | .80% | .81% |
| Net investment income (loss) | 1.21%I | .87% | .80% | .76% | .60% | .53% |
| Supplemental Data | | | | | | |
| Net assets, end of period (000 omitted) | $397,596 | $451,192 | $512,155 | $643,067 | $408,171 | $1,146,633 |
| Portfolio turnover rateJ | 58%I | 58% | 47% | 104% | 80% | 72%K |
A For the year ended February 29.
B Calculated based on average shares outstanding during the period.
C Total distributions of $5.48 per share is comprised of distributions from net investment income of $.521 and distributions from net realized gain of $4.954 per share.
D Amount represents less than $.005 per share.
E Total returns for periods of less than one year are not annualized.
F Total returns would have been lower if certain expenses had not been reduced during the applicable periods shown.
G Fees and expenses of any underlying Fidelity Central Funds are not included in the Fund's expense ratio. The Fund indirectly bears its proportionate share of the expenses of any underlying Fidelity Central Funds.
H Expense ratios reflect operating expenses of the Fund. Expenses before reductions do not reflect amounts reimbursed by the investment adviser or reductions from brokerage service arrangements or reductions from other expense offset arrangements and do not represent the amount paid by the Fund during periods when reimbursements or reductions occur. Expenses net of fee waivers reflect expenses after reimbursement by the investment adviser but prior to reductions from brokerage service arrangements or other expense offset arrangements. Expenses net of all reductions represent the net expenses paid by the Fund.
I Annualized
J Amount does not include the portfolio activity of any underlying Fidelity Central Funds.
K Portfolio turnover rate excludes securities received or delivered in-kind.
See accompanying notes which are an integral part of the financial statements.
Notes to Financial Statements (Unaudited)
For the period ended August 31, 2019
1. Organization.
Air Transportation Portfolio, Defense and Aerospace Portfolio, Environment and Alternative Energy Portfolio, Industrial Equipment Portfolio, Industrials Portfolio, and Transportation Portfolio (the Funds) are non-diversified funds of Fidelity Select Portfolios (the Trust). The Trust is registered under the Investment Company Act of 1940, as amended (the 1940 Act), as an open-end management investment company organized as a Massachusetts business trust. The Funds invest primarily in securities of companies whose principal business activities fall within specific industries. Each Fund is authorized to issue an unlimited number of shares. Share transactions on the Statement of Changes in Net Assets may contain exchanges between affiliated funds.
2. Investments in Fidelity Central Funds.
The Funds invest in Fidelity Central Funds, which are open-end investment companies generally available only to other investment companies and accounts managed by the investment adviser and its affiliates. The Funds' Schedules of Investments list each of the Fidelity Central Funds held as of period end, if any, as an investment of each Fund, but do not include the underlying holdings of each Fidelity Central Fund. As an Investing Fund, each Fund indirectly bears its proportionate share of the expenses of the underlying Fidelity Central Funds.
The Money Market Central Funds seek preservation of capital and current income and are managed by Fidelity Investments Money Management, Inc. (FIMM), an affiliate of the investment adviser. Annualized expenses of the Money Market Central Funds as of their most recent shareholder report date ranged from less than .005% to .01%.
A complete unaudited list of holdings for each Fidelity Central Fund is available upon request or at the Securities and Exchange Commission (the SEC) website at www.sec.gov. In addition, the financial statements of the Fidelity Central Funds are available on the SEC website or upon request.
3. Significant Accounting Policies.
Each Fund is an investment company and applies the accounting and reporting guidance of the Financial Accounting Standards Board (FASB) Accounting Standards Codification Topic 946 Financial Services – Investments Companies. The financial statements have been prepared in conformity with accounting principles generally accepted in the United States of America (GAAP), which require management to make certain estimates and assumptions at the date of the financial statements. Actual results could differ from those estimates. Subsequent events, if any, through the date that the financial statements were issued have been evaluated in the preparation of the financial statements. The following summarizes the significant accounting policies of the Funds:
Investment Valuation. Investments are valued as of 4:00 p.m. Eastern time on the last calendar day of the period. The Board of Trustees (the Board) has delegated the day to day responsibility for the valuation of each Fund's investments to the Fair Value Committee (the Committee) established by each Fund's investment adviser. In accordance with valuation policies and procedures approved by the Board, each Fund attempts to obtain prices from one or more third party pricing vendors or brokers to value its investments. When current market prices, quotations or currency exchange rates are not readily available or reliable, investments will be fair valued in good faith by the Committee, in accordance with procedures adopted by the Board. Factors used in determining fair value vary by investment type and may include market or investment specific events. The frequency with which these procedures are used cannot be predicted and they may be utilized to a significant extent. The Committee oversees each Fund's valuation policies and procedures and reports to the Board on the Committee's activities and fair value determinations. The Board monitors the appropriateness of the procedures used in valuing each Fund's investments and ratifies the fair value determinations of the Committee.
Each Fund categorizes the inputs to valuation techniques used to value its investments into a disclosure hierarchy consisting of three levels as shown below:
- Level 1 – quoted prices in active markets for identical investments
- Level 2 – other significant observable inputs (including quoted prices for similar investments, interest rates, prepayment speeds, etc.)
- Level 3 – unobservable inputs (including the Fund's own assumptions based on the best information available)
Valuation techniques used to value each Fund's investments by major category are as follows:
Equity securities, including restricted securities, for which market quotations are readily available, are valued at the last reported sale price or official closing price as reported by a third party pricing vendor on the primary market or exchange on which they are traded and are categorized as Level 1 in the hierarchy. In the event there were no sales during the day or closing prices are not available, securities are valued at the last quoted bid price or may be valued using the last available price and are generally categorized as Level 2 in the hierarchy. For foreign equity securities, when market or security specific events arise, comparisons to the valuation of American Depositary Receipts (ADRs), futures contracts, Exchange-Traded Funds (ETFs) and certain indexes as well as quoted prices for similar securities may be used and would be categorized as Level 2 in the hierarchy. For equity securities, including restricted securities, where observable inputs are limited, assumptions about market activity and risk are used and these securities may be categorized as Level 3 in the hierarchy.
Investments in open-end mutual funds, including the Fidelity Central Funds, are valued at their closing net asset value (NAV) each business day and are categorized as Level 1 in the hierarchy.
Changes in valuation techniques may result in transfers in or out of an assigned level within the disclosure hierarchy.
Foreign Currency. The Funds may use foreign currency contracts to facilitate transactions in foreign-denominated securities. Gains and losses from these transactions may arise from changes in the value of the foreign currency or if the counterparties do not perform under the contracts' terms.
Foreign-denominated assets, including investment securities, and liabilities are translated into U.S. dollars at the exchange rates at period end. Purchases and sales of investment securities, income and dividends received and expenses denominated in foreign currencies are translated into U.S. dollars at the exchange rate in effect on the transaction date.
The effects of exchange rate fluctuations on investments are included with the net realized and unrealized gain (loss) on investment securities. Other foreign currency transactions resulting in realized and unrealized gain (loss) are disclosed separately.
Investment Transactions and Income. For financial reporting purposes, the Funds' investment holdings and NAV include trades executed through the end of the last business day of the period. The NAV per share for processing shareholder transactions is calculated as of the close of business of the New York Stock Exchange (NYSE), normally 4:00 p.m. Eastern time and includes trades executed through the end of the prior business day. Gains and losses on securities sold are determined on the basis of identified cost and for certain Funds include proceeds received from litigation. Dividend income is recorded on the ex-dividend date, except for certain dividends from foreign securities where the ex-dividend date may have passed, which are recorded as soon as the Funds are informed of the ex-dividend date. Non-cash dividends included in dividend income, if any, are recorded at the fair market value of the securities received. Income and capital gain distributions from Fidelity Central Funds, if any, are recorded on the ex-dividend date. Certain distributions received by the Funds represent a return of capital or capital gain. The Funds determine the components of these distributions subsequent to the ex-dividend date, based upon receipt of tax filings or other correspondence relating to the underlying investment. These distributions are recorded as a reduction of cost of investments and/or as a realized gain. Large, non-recurring dividends recognized by the Funds are presented separately on the Statement of Operations as "Special Dividends" and the impact of these dividends is presented in the Financial Highlights. Investment income is recorded net of foreign taxes withheld where recovery of such taxes is uncertain.
Expenses. Expenses directly attributable to a fund are charged to that fund. Expenses attributable to more than one fund are allocated among the respective funds on the basis of relative net assets or other appropriate methods. Expense estimates are accrued in the period to which they relate and adjustments are made when actual amounts are known.
Deferred Trustee Compensation. Under a Deferred Compensation Plan (the Plan) certain Funds, certain independent Trustees have elected to defer receipt of a portion of their annual compensation. Deferred amounts are invested in a cross-section of Fidelity funds, are marked-to-market and remain in each Fund until distributed in accordance with the Plan. The investment of deferred amounts and the offsetting payable to the Trustees presented below are included in each accompanying Statement of Assets and Liabilities in other receivables and other payables and accrued expenses, respectively.
| Defense and Aerospace Portfolio | $91,424 |
| Industrials Portfolio | 82,311 |
Income Tax Information and Distributions to Shareholders. Each year, each Fund intends to qualify as a regulated investment company under Subchapter M of the Internal Revenue Code, including distributing substantially all of its taxable income and realized gains. As a result, no provision for U.S. Federal income taxes is required. Each Fund files a U.S. federal tax return, in addition to state and local tax returns as required. Each Fund's federal income tax returns are subject to examination by the Internal Revenue Service (IRS) for a period of three fiscal years after they are filed. State and local tax returns may be subject to examination for an additional fiscal year depending on the jurisdiction. Foreign taxes are provided for based on each Fund's understanding of the tax rules and rates that exist in the foreign markets in which it invests.
Distributions are declared and recorded on the ex-dividend date. Income and capital gain distributions are determined in accordance with income tax regulations, which may differ from GAAP.
Capital accounts within the financial statements are adjusted for permanent book-tax differences. These adjustments have no impact on net assets or the results of operations. Capital accounts are not adjusted for temporary book-tax differences which will reverse in a subsequent period.
Book-tax differences are primarily due to, foreign currency transactions, redemptions in kind, deferred trustees compensation and losses deferred due to wash sales and excise tax regulations.
As of period end, the cost and unrealized appreciation (depreciation) in securities, and derivatives if applicable, for federal income tax purposes were as follows for each Fund:
| | Tax cost | Gross unrealized appreciation | Gross unrealized depreciation | Net unrealized appreciation (depreciation) |
| Air Transportation Portfolio | $212,566,304 | $84,014,181 | $(9,293,815) | $74,720,366 |
| Defense and Aerospace Portfolio | 1,955,322,858 | 1,065,505,682 | (61,336,318) | 1,004,169,364 |
| Environment and Alternative Energy Portfolio | 139,164,047 | 26,655,932 | (6,898,815) | 19,757,117 |
| Industrials Portfolio | 484,627,386 | 125,740,415 | (16,782,478) | 108,957,937 |
| Transportation Portfolio | 268,962,396 | 154,935,212 | (11,960,013) | 142,975,199 |
Certain of the Funds elected to defer to the next fiscal year capital losses recognized during the period November 1, 2018 to February 28, 2019. Loss deferrals were as follows:
| | Capital losses | | |
| Defense and Aerospace Portfolio | $(12,080,856) | | |
| Industrials Portfolio | (4,485,371) | | |
Restricted Securities. The Funds may invest in securities that are subject to legal or contractual restrictions on resale. These securities generally may be resold in transactions exempt from registration or to the public if the securities are registered. Disposal of these securities may involve time-consuming negotiations and expense, and prompt sale at an acceptable price may be difficult. Information regarding restricted securities is included at the end of each applicable Fund's Schedule of Investments.
4. Purchases and Sales of Investments.
Purchases and sales of securities, other than short-term securities and in-kind transactions, are noted in the table below.
| | Purchases ($) | Sales ($) |
| Air Transportation Portfolio | 92,178,898 | 112,081,727 |
| Defense and Aerospace Portfolio | 598,096,941 | 610,252,215 |
| Environment and Alternative Energy Portfolio | 28,446,996 | 23,148,792 |
| Industrials Portfolio | 344,518,051 | 386,996,358 |
| Transportation Portfolio | 119,825,880 | 155,068,072 |
5. Fees and Other Transactions with Affiliates.
Management Fee. Fidelity SelectCo, LLC (the investment adviser) and its affiliates provide the Funds with investment management related services for which the Funds pay a monthly management fee. The management fee is the sum of an individual fund fee rate and an annualized group fee rate. The individual fund fee rate is applied to each Fund's average net assets. The group fee rate is based upon the average net assets of all the mutual funds advised by Fidelity Management & Research Company (FMR) and the investment adviser. The group fee rate decreases as assets under management increase and increases as assets under management decrease. For the reporting period, each Fund's annualized management fee rate expressed as a percentage of each Fund's average net assets was as follows:
| | Individual Rate | Group Rate | Total |
| Air Transportation Portfolio | .30% | .24% | .54% |
| Defense and Aerospace Portfolio | .30% | .24% | .54% |
| Environment and Alternative Energy Portfolio | .30% | .24% | .54% |
| Industrials Portfolio | .30% | .24% | .54% |
| Transportation Portfolio | .30% | .24% | .54% |
Transfer Agent Fees. Fidelity Investments Institutional Operations Company, Inc. (FIIOC), an affiliate of the investment adviser, is the Funds' transfer, dividend disbursing and shareholder servicing agent. FIIOC receives account fees and asset-based fees that vary according to account size and type of account. FIIOC pays for typesetting, printing and mailing of shareholder reports, except proxy statements. For the period, transfer agent fees were equivalent to the following annualized rates expressed as a percentage of average net assets:
| Air Transportation Portfolio | .21% |
| Defense and Aerospace Portfolio | .18% |
| Environment and Alternative Energy Portfolio | .23% |
| Industrials Portfolio | .17% |
| Transportation Portfolio | .20% |
Accounting and Security Lending Fees. FSC maintains each Fund's accounting records. The accounting fee is based on the level of average net assets for each month. Prior to April 1, 2019, FSC had a separate agreement with each Fund for administration of the security lending program, based on the number and duration of lending transactions. For the period, the total fees paid for accounting and administration of securities lending were equivalent to the following annualized rates:
| | % of Average Net Assets |
| Air Transportation Portfolio | .04 |
| Defense and Aerospace Portfolio | .03 |
| Environment and Alternative Energy Portfolio | .04 |
| Industrials Portfolio | .04 |
| Transportation Portfolio | .04 |
Brokerage Commissions. Certain Funds placed a portion of their portfolio transactions with brokerage firms which are affiliates of the investment adviser. Brokerage commissions are included in net realized gain (loss) and change in net unrealized appreciation (depreciation) in the Statement of Operations. The commissions paid to these affiliated firms were as follows:
| | Amount |
| Air Transportation Portfolio | $1,576 |
| Defense and Aerospace Portfolio | 12,617 |
| Environment and Alternative Energy Portfolio | 418 |
| Industrials Portfolio | 7,929 |
| Transportation Portfolio | 2,479 |
Interfund Lending Program. Pursuant to an Exemptive Order issued by the SEC, the Funds, along with other registered investment companies having management contracts with Fidelity Management & Research Company (FMR) or other affiliated entities of FMR, may participate in an interfund lending program. This program provides an alternative credit facility allowing the funds to borrow from, or lend money to, other participating affiliated funds. At period end, there were no interfund loans outstanding. Each applicable fund's activity in this program during the period for which loans were outstanding was as follows:
| | Borrower or Lender | Average Loan Balance | Weighted Average Interest Rate | Interest Expense |
| Environment and Alternative Energy Portfolio | Borrower | $12,808,000 | 2.62% | $1,861 |
Interfund Trades. The Funds may purchase from or sell securities to other Fidelity Funds under procedures adopted by the Board. The procedures have been designed to ensure these interfund trades are executed in accordance with Rule 17a-7 of the 1940 Act. Interfund trades are included within the respective purchases and sales amounts shown in the Purchases and Sales of Investments note.
Affiliated Redemptions In-Kind. During the period, 386,628 shares of Industrials Portfolio were redeemed in-kind for investments and cash with a value of $13,207,212. The net realized gain of $4,051,467 on investments delivered through in-kind redemptions is included in the accompanying Statement of Operations. The amount of the in-kind redemptions is included in share transactions in the accompanying Statement of Changes in Net Assets. Industrials Portfolio recognized no gain or loss for federal income tax purposes.
Prior Fiscal Year Affiliated Redemptions In-Kind. During the prior period, 8,024,186 shares of Industrials Portfolio were redeemed in-kind for investments and cash with a value of $278,038,031. Industrials Portfolio had a net realized gain of $779,998,333 on investments delivered through in-kind redemptions. The amount of the in-kind redemptions is included in share transactions in the accompanying Statement of Changes in Net Assets. Industrials Portfolio recognized no gain or loss for federal income tax purposes.
6. Committed Line of Credit.
Certain Funds participate with other funds managed by the investment adviser or an affiliate in a $4.25 billion credit facility (the "line of credit") to be utilized for temporary or emergency purposes to fund shareholder redemptions or for other short-term liquidity purposes. The participating funds have agreed to pay commitment fees on their pro-rata portion of the line of credit, which are reflected in Miscellaneous expenses on the Statement of Operations, and are as follows:
| Air Transportation Portfolio | $395 |
| Defense and Aerospace Portfolio | 3,582 |
| Environment and Alternative Energy Portfolio | 228 |
| Industrials Portfolio | 836 |
| Transportation Portfolio | 592 |
During the period, the Funds did not borrow on this line of credit.
7. Security Lending.
Certain Funds lend portfolio securities from time to time in order to earn additional income. For equity securities, lending agents are used, including National Financial Services (NFS), an affiliate of the Funds. Pursuant to a securities lending agreement, NFS will receive a fee, which is capped at 9.9% of daily lending revenue, for its services as lending agent. The Funds may lend securities to certain qualified borrowers. On the settlement date of the loan, each applicable Fund receives collateral (in the form of U.S. Treasury obligations, letters of credit and/or cash) against the loaned securities and maintains collateral in an amount not less than 100% of the market value of the loaned securities during the period of the loan. The market value of the loaned securities is determined at the close of business of the Funds and any additional required collateral is delivered to the Funds on the next business day. The Funds or borrower may terminate the loan at any time, and if the borrower defaults on its obligation to return the securities loaned because of insolvency or other reasons, the Funds may apply collateral received from the borrower against the obligation. The Funds may experience delays and costs in recovering the securities loaned. Any cash collateral received is invested in the Fidelity Securities Lending Cash Central Fund. The value of loaned securities and cash collateral at period end are disclosed on each applicable Fund's Statement of Assets and Liabilities. Security lending income represents the income earned on investing cash collateral, less rebates paid to borrowers and any lending agent fees associated with the loan, plus any premium payments received for lending certain types of securities. Security lending income is presented on each applicable Fund's Statement of Operations as a component of income from Fidelity Central Funds. Security lending fees paid to NFS were as follows:
| Air Transportation Portfolio | $22 |
| Defense and Aerospace Portfolio | $259 |
| Environment and Alternative Energy Portfolio | $10 |
| Industrials Portfolio | $15 |
| Transportation Portfolio | $438 |
8. Expense Reductions.
Commissions paid to certain brokers with whom the investment adviser, or its affiliates, places trades on behalf of certain Funds include an amount in addition to trade execution, which may be rebated back to the Funds to offset certain expenses. In addition, through arrangements with each applicable Fund's custodian and transfer agent, credits realized as a result of certain uninvested cash balances were used to reduce each applicable Fund's expenses. All of the applicable expense reductions are noted in the table below.
| | Brokerage Service reduction | Custodian credits | Transfer Agent credits |
| Air Transportation Portfolio | $2,783 | $52 | $– |
| Defense and Aerospace Portfolio | 15,151 | 6,649 | – |
| Environment and Alternative Energy Portfolio | 2,363 | 1,180 | – |
| Industrials Portfolio | 21,336 | – | 92 |
| Transportation Portfolio | 1,882 | – | – |
In addition, during the period the investment adviser reimbursed and/or waived a portion of operating expenses as follows:
| | Amount |
| Air Transportation Portfolio | $1,131 |
| Defense and Aerospace Portfolio | 9,502 |
| Environment and Alternative Energy Portfolio | 536 |
| Industrials Portfolio | 2,267 |
| Transportation Portfolio | 1,699 |
9. Other.
The Funds' organizational documents provide former and current trustees and officers with a limited indemnification against liabilities arising in connection with the performance of their duties to the Funds. In the normal course of business, the Funds may also enter into contracts that provide general indemnifications. The Funds' maximum exposure under these arrangements is unknown as this would be dependent on future claims that may be made against the Funds. The risk of material loss from such claims is considered remote.
Shareholder Expense Example
As a shareholder of the Fund, you incur two types of costs: (1) transaction costs and (2) ongoing costs, including management fees and other Fund expenses. This Example is intended to help you understand your ongoing costs (in dollars) of investing in the Fund and to compare these costs with the ongoing costs of investing in other mutual funds.
The Example is based on an investment of $1,000 invested at the beginning of the period and held for the entire period (March 1, 2019 to August 31, 2019).
Actual Expenses
The first line of the accompanying table provides information about actual account values and actual expenses. You may use the information in this line, together with the amount you invested, to estimate the expenses that you paid over the period. Simply divide your account value by $1,000.00 (for example, an $8,600 account value divided by $1,000.00 = 8.6), then multiply the result by the number in the first line under the heading entitled "Expenses Paid During Period" to estimate the expenses you paid on your account during this period.
Hypothetical Example for Comparison Purposes
The second line of the accompanying table provides information about hypothetical account values and hypothetical expenses based on the Fund's actual expense ratio and an assumed rate of return of 5% per year before expenses, which is not the Fund's actual return. The hypothetical account values and expenses may not be used to estimate the actual ending account balance or expenses you paid for the period. You may use this information to compare the ongoing costs of investing in the Fund and other funds. To do so, compare this 5% hypothetical example with the 5% hypothetical examples that appear in the shareholder reports of the other funds.
Please note that the expenses shown in the table are meant to highlight your ongoing costs only and do not reflect any transaction costs. Therefore, the second line of the table is useful in comparing ongoing costs only, and will not help you determine the relative total costs of owning different funds. In addition, if these transactional costs were included, your costs would have been higher.
| | Annualized Expense Ratio-A | Beginning
Account Value
March 1, 2019 | Ending
Account Value
August 31, 2019 | Expenses Paid
During Period-B
March 1, 2019
to August 31, 2019 |
| Air Transportation Portfolio | .82% | | | |
| Actual | | $1,000.00 | $1,006.40 | $4.14 |
| Hypothetical-C | | $1,000.00 | $1,021.01 | $4.17 |
| Defense and Aerospace Portfolio | .75% | | | |
| Actual | | $1,000.00 | $1,070.60 | $3.90 |
| Hypothetical-C | | $1,000.00 | $1,021.37 | $3.81 |
| Environment and Alternative Energy Portfolio | .87% | | | |
| Actual | | $1,000.00 | $971.90 | $4.31 |
| Hypothetical-C | | $1,000.00 | $1,020.76 | $4.42 |
| Industrials Portfolio | .76% | | | |
| Actual | | $1,000.00 | $1,022.80 | $3.86 |
| Hypothetical-C | | $1,000.00 | $1,021.32 | $3.86 |
| Transportation Portfolio | .80% | | | |
| Actual | | $1,000.00 | $970.90 | $3.96 |
| Hypothetical-C | | $1,000.00 | $1,021.11 | $4.06 |
A Annualized expense ratio reflects expenses net of applicable fee waivers.
B Expenses are equal to each Fund's annualized expense ratio, multiplied by the average account value over the period, multiplied by 184/ 366 (to reflect the one-half year period).
C 5% return per year before expenses
SELCI-SANN-1019
1.813660.114
Fidelity® Select Portfolios®
Utilities Sector Utilities Portfolio
Semi-Annual Report August 31, 2019 |
|
Beginning on January 1, 2021, as permitted by regulations adopted by the Securities and Exchange Commission, paper copies of a fund’s shareholder reports will no longer be sent by mail, unless you specifically request paper copies of the reports from the fund or from your financial intermediary, such as a financial advisor, broker-dealer or bank. Instead, the reports will be made available on a website, and you will be notified by mail each time a report is posted and provided with a website link to access the report.
If you already elected to receive shareholder reports electronically, you will not be affected by this change and you need not take any action. You may elect to receive shareholder reports and other communications from a fund electronically, by contacting your financial intermediary. For Fidelity customers, visit Fidelity's web site or call Fidelity using the contact information listed below.
You may elect to receive all future reports in paper free of charge. If you wish to continue receiving paper copies of your shareholder reports, you may contact your financial intermediary or, if you are a Fidelity customer, visit Fidelity’s website, or call Fidelity at the applicable toll-free number listed below. Your election to receive reports in paper will apply to all funds held with the fund complex/your financial intermediary.
| Account Type | Website | Phone Number |
| Brokerage, Mutual Fund, or Annuity Contracts: | fidelity.com/mailpreferences | 1-800-343-3548 |
| Employer Provided Retirement Accounts: | netbenefits.fidelity.com/preferences (choose 'no' under Required Disclosures to continue to print) | 1-800-343-0860 |
| Advisor Sold Accounts Serviced Through Your Financial Intermediary: | Contact Your Financial Intermediary | Your Financial Intermediary's phone number |
| Advisor Sold Accounts Serviced by Fidelity: | institutional.fidelity.com | 1-877-208-0098 |
Contents
To view a fund's proxy voting guidelines and proxy voting record for the 12-month period ended June 30, visit http://www.fidelity.com/proxyvotingresults or visit the Securities and Exchange Commission's (SEC) web site at http://www.sec.gov.
You may also call 1-800-544-8544 to request a free copy of the proxy voting guidelines.
Standard & Poor's, S&P and S&P 500 are registered service marks of The McGraw-Hill Companies, Inc. and have been licensed for use by Fidelity Distributors Corporation.
Other third-party marks appearing herein are the property of their respective owners.
All other marks appearing herein are registered or unregistered trademarks or service marks of FMR LLC or an affiliated company. © 2019 FMR LLC. All rights reserved.
This report and the financial statements contained herein are submitted for the general information of the shareholders of the Fund. This report is not authorized for distribution to prospective investors in the Fund unless preceded or accompanied by an effective prospectus.
A fund files its complete schedule of portfolio holdings with the SEC for the first and third quarters of each fiscal year on Form N-PORT. Forms N-PORT are available on the SEC’s web site at http://www.sec.gov. A fund's Forms N-PORT may be reviewed and copied at the SEC’s Public Reference Room in Washington, DC. Information regarding the operation of the SEC's Public Reference Room may be obtained by calling 1-800-SEC-0330.
For a complete list of a fund's portfolio holdings, view the most recent holdings listing, semiannual report, or annual report on Fidelity's web site at http://www.fidelity.com, http://www.institutional.fidelity.com, or http://www.401k.com, as applicable.
NOT FDIC INSURED •MAY LOSE VALUE •NO BANK GUARANTEE
Neither the Fund nor Fidelity Distributors Corporation is a bank.
Investment Summary (Unaudited)
Top Ten Stocks as of August 31, 2019
| | % of fund's net assets |
| Dominion Energy, Inc. | 10.7 |
| Exelon Corp. | 9.5 |
| Southern Co. | 8.2 |
| Sempra Energy | 7.8 |
| Edison International | 7.4 |
| Public Service Enterprise Group, Inc. | 4.9 |
| FirstEnergy Corp. | 4.9 |
| Entergy Corp. | 4.9 |
| Duke Energy Corp. | 4.5 |
| NextEra Energy, Inc. | 4.3 |
| | 67.1 |
Top Industries (% of fund's net assets)
| As of August 31, 2019 |
| | Electric Utilities | 54.4% |
| | Multi-Utilities | 31.1% |
| | Independent Power and Renewable Electricity Producers | 7.6% |
| | Gas Utilities | 4.0% |
| | Oil, Gas & Consumable Fuels | 1.0% |
| | All Others* | 1.9% |

* Includes short-term investments and net other assets (liabilities).
Schedule of Investments August 31, 2019 (Unaudited)
Showing Percentage of Net Assets
| Common Stocks - 98.8% | | | |
| | | Shares | Value |
| Electric Utilities - 54.4% | | | |
| Electric Utilities - 54.4% | | | |
| American Electric Power Co., Inc. | | 72,530 | $6,611,110 |
| Duke Energy Corp. | | 582,580 | 54,028,469 |
| Edison International | | 1,227,940 | 88,743,224 |
| Entergy Corp. | | 523,462 | 59,067,452 |
| Evergy, Inc. | | 602,466 | 39,160,290 |
| Eversource Energy | | 122,406 | 9,808,393 |
| Exelon Corp. | | 2,418,889 | 114,316,694 |
| FirstEnergy Corp. | | 1,284,992 | 59,109,632 |
| NextEra Energy, Inc. | | 239,372 | 52,441,618 |
| PPL Corp. | | 895,068 | 26,449,259 |
| Southern Co. | | 1,692,550 | 98,607,963 |
| Vistra Energy Corp. | | 1,957,234 | 48,832,988 |
| | | | 657,177,092 |
| Gas Utilities - 4.0% | | | |
| Gas Utilities - 4.0% | | | |
| Atmos Energy Corp. | | 303,548 | 33,460,096 |
| South Jersey Industries, Inc. (a) | | 385,675 | 12,472,730 |
| UGI Corp. | | 53,452 | 2,601,509 |
| | | | 48,534,335 |
| Independent Power and Renewable Electricity Producers - 7.6% | | | |
| Independent Power Producers & Energy Traders - 4.4% | | | |
| NRG Energy, Inc. | | 797,804 | 29,040,066 |
| NRG Yield, Inc. Class C | | 344,586 | 6,099,172 |
| The AES Corp. | | 1,136,306 | 17,419,571 |
| | | | 52,558,809 |
| Renewable Electricity - 3.2% | | | |
| Atlantica Yield PLC | | 729,329 | 17,350,737 |
| NextEra Energy Partners LP | | 423,771 | 21,718,264 |
| | | | 39,069,001 |
|
| TOTAL INDEPENDENT POWER AND RENEWABLE ELECTRICITY PRODUCERS | | | 91,627,810 |
|
| Multi-Utilities - 31.1% | | | |
| Multi-Utilities - 31.1% | | | |
| Avangrid, Inc. | | 457,973 | 23,145,955 |
| CenterPoint Energy, Inc. | | 1,871,500 | 51,821,835 |
| CMS Energy Corp. | | 37,884 | 2,388,586 |
| Dominion Energy, Inc. | | 1,671,063 | 129,724,619 |
| National Grid PLC sponsored ADR | | 137,997 | 7,218,623 |
| Public Service Enterprise Group, Inc. | | 977,725 | 59,123,031 |
| Sempra Energy | | 663,384 | 93,955,076 |
| WEC Energy Group, Inc. | | 82,900 | 7,939,333 |
| | | | 375,317,058 |
| Oil, Gas & Consumable Fuels - 1.0% | | | |
| Oil & Gas Storage & Transport - 1.0% | | | |
| Cheniere Energy, Inc. (b) | | 194,101 | 11,589,771 |
| Semiconductors & Semiconductor Equipment - 0.2% | | | |
| Semiconductor Equipment - 0.2% | | | |
| Enphase Energy, Inc. (b) | | 90,800 | 2,694,036 |
| Water Utilities - 0.5% | | | |
| Water Utilities - 0.5% | | | |
| SJW Corp. | | 94,902 | 6,484,654 |
| TOTAL COMMON STOCKS | | | |
| (Cost $968,011,688) | | | 1,193,424,756 |
|
| Money Market Funds - 0.9% | | | |
| Fidelity Cash Central Fund 2.13% (c) | | 8,216,734 | 8,218,377 |
| Fidelity Securities Lending Cash Central Fund 2.13% (c)(d) | | 2,271,523 | 2,271,750 |
| TOTAL MONEY MARKET FUNDS | | | |
| (Cost $10,490,127) | | | 10,490,127 |
| TOTAL INVESTMENT IN SECURITIES - 99.7% | | | |
| (Cost $978,501,815) | | | 1,203,914,883 |
| NET OTHER ASSETS (LIABILITIES) - 0.3% | | | 3,287,529 |
| NET ASSETS - 100% | | | $1,207,202,412 |
Legend
(a) Security or a portion of the security is on loan at period end.
(b) Non-income producing
(c) Affiliated fund that is generally available only to investment companies and other accounts managed by Fidelity Investments. The rate quoted is the annualized seven-day yield of the fund at period end. A complete unaudited listing of the fund's holdings as of its most recent quarter end is available upon request. In addition, each Fidelity Central Fund's financial statements are available on the SEC's website or upon request.
(d) Investment made with cash collateral received from securities on loan.
Affiliated Central Funds
Information regarding fiscal year to date income earned by the Fund from investments in Fidelity Central Funds is as follows:
| Fund | Income earned |
| Fidelity Cash Central Fund | $205,046 |
| Fidelity Securities Lending Cash Central Fund | 1,587 |
| Total | $206,633 |
Amounts in the income column in the above table include any capital gain distributions from underlying funds, which are presented in the corresponding line-item in the Statement of Operations, if applicable. Amount for Fidelity Securities Lending Cash Central Fund represents the income earned on investing cash collateral, less rebates paid to borrowers and any lending agent fees associated with the loan, plus any premium payments received for lending certain types of securities.
Investment Valuation
All investments are categorized as Level 1 under the Fair Value Hierarchy. The inputs or methodology used for valuing securities may not be an indication of the risk associated with investing in those securities. For more information on valuation inputs please refer to the Investment Valuation section in the accompanying Notes to Financial Statements.
See accompanying notes which are an integral part of the financial statements.
Financial Statements
Statement of Assets and Liabilities
| | | August 31, 2019 (Unaudited) |
| Assets | | |
Investment in securities, at value (including securities loaned of $2,260,566) — See accompanying schedule:
Unaffiliated issuers (cost $968,011,688) | $1,193,424,756 | |
| Fidelity Central Funds (cost $10,490,127) | 10,490,127 | |
| Total Investment in Securities (cost $978,501,815) | | $1,203,914,883 |
| Receivable for investments sold | | 1,295,898 |
| Receivable for fund shares sold | | 2,773,956 |
| Dividends receivable | | 5,137,890 |
| Distributions receivable from Fidelity Central Funds | | 20,322 |
| Prepaid expenses | | 7,631 |
| Other receivables | | 39,832 |
| Total assets | | 1,213,190,412 |
| Liabilities | | |
| Payable for investments purchased | $946,042 | |
| Payable for fund shares redeemed | 2,015,705 | |
| Accrued management fee | 528,871 | |
| Other affiliated payables | 202,929 | |
| Other payables and accrued expenses | 22,703 | |
| Collateral on securities loaned | 2,271,750 | |
| Total liabilities | | 5,988,000 |
| Net Assets | | $1,207,202,412 |
| Net Assets consist of: | | |
| Paid in capital | | $963,242,883 |
| Total distributable earnings (loss) | | 243,959,529 |
| Net Assets, for 12,928,964 shares outstanding | | $1,207,202,412 |
| Net Asset Value, offering price and redemption price per share ($1,207,202,412 ÷ 12,928,964 shares) | | $93.37 |
See accompanying notes which are an integral part of the financial statements.
Statement of Operations
| | | Six months ended August 31, 2019 (Unaudited) |
| Investment Income | | |
| Dividends | | $18,748,745 |
| Income from Fidelity Central Funds (including $1,587 from security lending) | | 206,633 |
| Total income | | 18,955,378 |
| Expenses | | |
| Management fee | $3,123,329 | |
| Transfer agent fees | 1,017,548 | |
| Accounting and security lending fees | 188,634 | |
| Custodian fees and expenses | 3,811 | |
| Independent trustees' fees and expenses | 3,079 | |
| Registration fees | 54,959 | |
| Audit | 21,646 | |
| Legal | 1,064 | |
| Interest | 4,547 | |
| Miscellaneous | 3,928 | |
| Total expenses before reductions | 4,422,545 | |
| Expense reductions | (36,070) | |
| Total expenses after reductions | | 4,386,475 |
| Net investment income (loss) | | 14,568,903 |
| Realized and Unrealized Gain (Loss) | | |
| Net realized gain (loss) on: | | |
| Investment securities: | | |
| Unaffiliated issuers | 26,314,798 | |
| Redemptions in-kind with affiliated entities | 7,538,422 | |
| Foreign currency transactions | 3,487 | |
| | | |
| Total net realized gain (loss) | | 33,856,707 |
| Change in net unrealized appreciation (depreciation) on: | | |
| Investment securities: | | |
| Unaffiliated issuers | 54,726,434 | |
| Assets and liabilities in foreign currencies | (320) | |
| Total change in net unrealized appreciation (depreciation) | | 54,726,114 |
| Net gain (loss) | | 88,582,821 |
| Net increase (decrease) in net assets resulting from operations | | $103,151,724 |
See accompanying notes which are an integral part of the financial statements.
Statement of Changes in Net Assets
| | Six months ended August 31, 2019 (Unaudited) | Year ended February 28, 2019 |
| Increase (Decrease) in Net Assets | | |
| Operations | | |
| Net investment income (loss) | $14,568,903 | $19,645,080 |
| Net realized gain (loss) | 33,856,707 | 65,504,258 |
| Change in net unrealized appreciation (depreciation) | 54,726,114 | 53,870,262 |
| Net increase (decrease) in net assets resulting from operations | 103,151,724 | 139,019,600 |
| Distributions to shareholders | – | (73,577,455) |
| Share transactions | | |
| Proceeds from sales of shares | 314,461,246 | 638,656,367 |
| Reinvestment of distributions | – | 68,851,242 |
| Cost of shares redeemed | (251,173,652) | (449,165,874) |
| Net increase (decrease) in net assets resulting from share transactions | 63,287,594 | 258,341,735 |
| Total increase (decrease) in net assets | 166,439,318 | 323,783,880 |
| Net Assets | | |
| Beginning of period | 1,040,763,094 | 716,979,214 |
| End of period | $1,207,202,412 | $1,040,763,094 |
| Other Information | | |
| Shares | | |
| Sold | 3,530,731 | 7,498,067 |
| Issued in reinvestment of distributions | – | 812,301 |
| Redeemed | (2,800,483) | (5,452,798) |
| Net increase (decrease) | 730,248 | 2,857,570 |
See accompanying notes which are an integral part of the financial statements.
Financial Highlights
Utilities Portfolio
| | Six months ended (Unaudited) August 31, | Years endedFebruary 28, | | | | |
| | 2019 | 2019 | 2018 | 2017 | 2016 A | 2015 |
| Selected Per–Share Data | | | | | | |
| Net asset value, beginning of period | $85.32 | $76.75 | $77.05 | $66.88 | $72.85 | $70.64 |
| Income from Investment Operations | | | | | | |
| Net investment income (loss)B | 1.12 | 2.06 | 1.62 | 1.52 | 1.39 | 1.41 |
| Net realized and unrealized gain (loss) | 6.93 | 13.35 | 2.56 | 10.44 | (4.49) | 6.40 |
| Total from investment operations | 8.05 | 15.41 | 4.18 | 11.96 | (3.10) | 7.81 |
| Distributions from net investment income | – | (1.37) | (1.29) | (1.77) | (1.60) | (1.20) |
| Distributions from net realized gain | – | (5.46) | (3.19) | (.02) | (1.27) | (4.42) |
| Total distributions | – | (6.84)C | (4.48) | (1.79) | (2.87) | (5.61)D |
| Redemption fees added to paid in capitalB | – | – | –E | –E | –E | .01 |
| Net asset value, end of period | $93.37 | $85.32 | $76.75 | $77.05 | $66.88 | $72.85 |
| Total ReturnF,G | 9.44% | 20.17% | 4.99% | 18.21% | (4.19)% | 11.22% |
| Ratios to Average Net AssetsH,I | | | | | | |
| Expenses before reductions | .76%J | .78% | .78% | .79% | .80% | .80% |
| Expenses net of fee waivers, if any | .76%J | .78% | .78% | .79% | .79% | .80% |
| Expenses net of all reductions | .75%J | .76% | .77% | .78% | .78% | .80% |
| Net investment income (loss) | 2.50%J | 2.45% | 2.00% | 2.09% | 2.05% | 1.89% |
| Supplemental Data | | | | | | |
| Net assets, end of period (000 omitted) | $1,207,202 | $1,040,763 | $716,979 | $696,138 | $808,235 | $988,426 |
| Portfolio turnover rateK | 58%J,L | 97%L | 66%L | 70%L | 74% | 129%L |
A For the year ended February 29.
B Calculated based on average shares outstanding during the period.
C Total distributions of $6.84 per share is comprised of distributions from net investment income of $1.373 and distributions from net realized gain of $5.463 per share.
D Total distributions of $5.61 per share is comprised of distributions from net investment income of $1.199 and distributions from net realized gain of $4.415 per share.
E Amount represents less than $.005 per share.
F Total returns for periods of less than one year are not annualized.
G Total returns would have been lower if certain expenses had not been reduced during the applicable periods shown.
H Fees and expenses of any underlying Fidelity Central Funds are not included in the Fund's expense ratio. The Fund indirectly bears its proportionate share of the expenses of any underlying Fidelity Central Funds.
I Expense ratios reflect operating expenses of the Fund. Expenses before reductions do not reflect amounts reimbursed by the investment adviser or reductions from brokerage service arrangements or reductions from other expense offset arrangements and do not represent the amount paid by the Fund during periods when reimbursements or reductions occur. Expenses net of fee waivers reflect expenses after reimbursement by the investment adviser but prior to reductions from brokerage service arrangements or other expense offset arrangements. Expenses net of all reductions represent the net expenses paid by the Fund.
J Annualized
K Amount does not include the portfolio activity of any underlying Fidelity Central Funds.
L Portfolio turnover rate excludes securities received or delivered in-kind.
See accompanying notes which are an integral part of the financial statements.
Notes to Financial Statements (Unaudited)
For the period ended August 31, 2019
1. Organization.
Utilities Portfolio (the Fund) is a non-diversified fund of Fidelity Select Portfolios (the Trust) and is authorized to issue an unlimited number of shares. Share transactions on the Statement of Changes in Net Assets may contain exchanges between affiliated funds. The Trust is registered under the Investment Company Act of 1940, as amended (the 1940 Act), as an open-end management investment company organized as a Massachusetts business trust. The Fund invests primarily in securities of companies whose principal business activities fall within specific industries.
2. Investments in Fidelity Central Funds.
The Fund invests in Fidelity Central Funds, which are open-end investment companies generally available only to other investment companies and accounts managed by the investment adviser and its affiliates. The Fund's Schedule of Investments lists each of the Fidelity Central Funds held as of period end, if any, as an investment of the Fund, but does not include the underlying holdings of each Fidelity Central Fund. As an Investing Fund, the Fund indirectly bears its proportionate share of the expenses of the underlying Fidelity Central Funds.
The Money Market Central Funds seek preservation of capital and current income and are managed by Fidelity Investments Money Management, Inc. (FIMM), an affiliate of the investment adviser. Annualized expenses of the Money Market Central Funds as of their most recent shareholder report date ranged from less than .005% to .01%.
A complete unaudited list of holdings for each Fidelity Central Fund is available upon request or at the Securities and Exchange Commission (the SEC) website at www.sec.gov. In addition, the financial statements of the Fidelity Central Funds are available on the SEC website or upon request.
3. Significant Accounting Policies.
The Fund is an investment company and applies the accounting and reporting guidance of the Financial Accounting Standards Board (FASB) Accounting Standards Codification Topic 946 Financial Services – Investments Companies. The financial statements have been prepared in conformity with accounting principles generally accepted in the United States of America (GAAP), which require management to make certain estimates and assumptions at the date of the financial statements. Actual results could differ from those estimates. Subsequent events, if any, through the date that the financial statements were issued have been evaluated in the preparation of the financial statements. The following summarizes the significant accounting policies of the Fund:
Investment Valuation. Investments are valued as of 4:00 p.m. Eastern time on the last calendar day of the period. The Board of Trustees (the Board) has delegated the day to day responsibility for the valuation of the Fund's investments to the Fair Value Committee (the Committee) established by the Fund's investment adviser. In accordance with valuation policies and procedures approved by the Board, the Fund attempts to obtain prices from one or more third party pricing vendors or brokers to value its investments. When current market prices, quotations or currency exchange rates are not readily available or reliable, investments will be fair valued in good faith by the Committee, in accordance with procedures adopted by the Board. Factors used in determining fair value vary by investment type and may include market or investment specific events. The frequency with which these procedures are used cannot be predicted and they may be utilized to a significant extent. The Committee oversees the Fund's valuation policies and procedures and reports to the Board on the Committee's activities and fair value determinations. The Board monitors the appropriateness of the procedures used in valuing the Fund's investments and ratifies the fair value determinations of the Committee.
The Fund categorizes the inputs to valuation techniques used to value its investments into a disclosure hierarchy consisting of three levels as shown below:
- Level 1 – quoted prices in active markets for identical investments
- Level 2 – other significant observable inputs (including quoted prices for similar investments, interest rates, prepayment speeds, etc.)
- Level 3 – unobservable inputs (including the Fund's own assumptions based on the best information available)
Valuation techniques used to value the Fund's investments by major category are as follows:
Equity securities, including restricted securities, for which market quotations are readily available, are valued at the last reported sale price or official closing price as reported by a third party pricing vendor on the primary market or exchange on which they are traded and are categorized as Level 1 in the hierarchy. In the event there were no sales during the day or closing prices are not available, securities are valued at the last quoted bid price or may be valued using the last available price and are generally categorized as Level 2 in the hierarchy. For foreign equity securities, when market or security specific events arise, comparisons to the valuation of American Depositary Receipts (ADRs), futures contracts, Exchange-Traded Funds (ETFs) and certain indexes as well as quoted prices for similar securities may be used and would be categorized as Level 2 in the hierarchy. For equity securities, including restricted securities, where observable inputs are limited, assumptions about market activity and risk are used and these securities may be categorized as Level 3 in the hierarchy.
Investments in open-end mutual funds, including the Fidelity Central Funds, are valued at their closing net asset value (NAV) each business day and are categorized as Level 1 in the hierarchy.
Changes in valuation techniques may result in transfers in or out of an assigned level within the disclosure hierarchy.
Foreign Currency. The Fund may use foreign currency contracts to facilitate transactions in foreign-denominated securities. Gains and losses from these transactions may arise from changes in the value of the foreign currency or if the counterparties do not perform under the contracts' terms.
Foreign-denominated assets, including investment securities, and liabilities are translated into U.S. dollars at the exchange rates at period end. Purchases and sales of investment securities, income and dividends received and expenses denominated in foreign currencies are translated into U.S. dollars at the exchange rate in effect on the transaction date.
The effects of exchange rate fluctuations on investments are included with the net realized and unrealized gain (loss) on investment securities. Other foreign currency transactions resulting in realized and unrealized gain (loss) are disclosed separately.
Investment Transactions and Income. For financial reporting purposes, the Fund's investment holdings and NAV include trades executed through the end of the last business day of the period. The NAV per share for processing shareholder transactions is calculated as of the close of business of the New York Stock Exchange (NYSE), normally 4:00 p.m. Eastern time and includes trades executed through the end of the prior business day. Gains and losses on securities sold are determined on the basis of identified cost. Dividend income is recorded on the ex-dividend date, except for certain dividends from foreign securities where the ex-dividend date may have passed, which are recorded as soon as the Fund is informed of the ex-dividend date. Non-cash dividends included in dividend income, if any, are recorded at the fair market value of the securities received. Income and capital gain distributions from Fidelity Central Funds, if any, are recorded on the ex-dividend date. Certain distributions received by the Fund represent a return of capital or capital gain. The Fund determines the components of these distributions subsequent to the ex-dividend date, based upon receipt of tax filings or other correspondence relating to the underlying investment. These distributions are recorded as a reduction of cost of investments and/or as a realized gain. Investment income is recorded net of foreign taxes withheld where recovery of such taxes is uncertain.
Expenses. Expenses directly attributable to a fund are charged to that fund. Expenses attributable to more than one fund are allocated among the respective funds on the basis of relative net assets or other appropriate methods. Expense estimates are accrued in the period to which they relate and adjustments are made when actual amounts are known.
Income Tax Information and Distributions to Shareholders. Each year, the Fund intends to qualify as a regulated investment company under Subchapter M of the Internal Revenue Code, including distributing substantially all of its taxable income and realized gains. As a result, no provision for U.S. Federal income taxes is required. The Fund files a U.S. federal tax return, in addition to state and local tax returns as required. The Fund's federal income tax returns are subject to examination by the Internal Revenue Service (IRS) for a period of three fiscal years after they are filed. State and local tax returns may be subject to examination for an additional fiscal year depending on the jurisdiction. Foreign taxes are provided for based on the Fund's understanding of the tax rules and rates that exist in the foreign markets in which it invests.
Distributions are declared and recorded on the ex-dividend date. Income and capital gain distributions are determined in accordance with income tax regulations, which may differ from GAAP.
Capital accounts within the financial statements are adjusted for permanent book-tax differences. These adjustments have no impact on net assets or the results of operations. Capital accounts are not adjusted for temporary book-tax differences which will reverse in a subsequent period.
Book-tax differences are primarily due to foreign currency transactions, redemptions in kind, partnerships, losses deferred due to wash sales and excise tax regulations.
As of period end, the cost and unrealized appreciation (depreciation) in securities, and derivatives if applicable, for federal income tax purposes were as follows:
| Gross unrealized appreciation | $227,617,333 |
| Gross unrealized depreciation | (4,592,864) |
| Net unrealized appreciation (depreciation) | $223,024,469 |
| Tax cost | $980,890,414 |
The Fund elected to defer to its next fiscal year approximately $19,416,492 of capital losses recognized during the period November 1,2018 to February 28, 2019.
4. Purchases and Sales of Investments.
Purchases and sales of securities, other than short-term securities and in-kind transactions, aggregated $438,542,777 and $331,715,727, respectively.
5. Fees and Other Transactions with Affiliates.
Management Fee. Fidelity SelectCo, LLC (the investment adviser) and its affiliates provide the Fund with investment management related services for which the Fund pays a monthly management fee. The management fee is the sum of an individual fund fee rate that is based on an annual rate of .30% of the Fund's average net assets and an annualized group fee rate that averaged .24% during the period. The group fee rate is based upon the average net assets of all the mutual funds advised by Fidelity Management & Research Company (FMR) and the investment adviser. The group fee rate decreases as assets under management increase and increases as assets under management decrease. For the reporting period, the total annualized management fee rate was .54% of the Fund's average net assets.
Transfer Agent Fees. Fidelity Investments Institutional Operations Company, Inc. (FIIOC), an affiliate of the investment adviser, is the Fund's transfer, dividend disbursing and shareholder servicing agent. FIIOC receives account fees and asset-based fees that vary according to account size and type of account. FIIOC pays for typesetting, printing and mailing of shareholder reports, except proxy statements. For the period, the transfer agent fees were equivalent to an annualized rate of .17% of average net assets.
Accounting and Security Lending Fees. Fidelity Service Company, Inc. (FSC), an affiliate of the investment adviser, maintains the Fund's accounting records. The accounting fee is based on the level of average net assets for each month. Prior to April 1, 2019, FSC had a separate agreement with the Fund for administration of the security lending program, based on the number and duration of lending transactions. For the period, the total fees paid for accounting and administration of securities lending were equivalent to an annualized rate of .03%.
Brokerage Commissions. The Fund placed a portion of its portfolio transactions with brokerage firms which are affiliates of the investment adviser. Brokerage commissions are included in net realized gain (loss) and change in net unrealized appreciation (depreciation) in the Statement of Operations. The commissions paid to these affiliated firms were $14,787 for the period.
Interfund Lending Program. Pursuant to an Exemptive Order issued by the SEC, the Fund, along with other registered investment companies having management contracts with Fidelity Management & Research Company (FMR) or other affiliated entities of FMR, may participate in an interfund lending program. This program provides an alternative credit facility allowing the funds to borrow from, or lend money to, other participating affiliated funds. At period end, there were no interfund loans outstanding. The Fund's activity in this program during the period for which loans were outstanding was as follows:
| Borrower or Lender | Average Loan Balance | Weighted Average Interest Rate | Interest Expense |
| Borrower | $15,448,500 | 2.65% | $4,547 |
Interfund Trades. The Fund may purchase from or sell securities to other Fidelity Funds under procedures adopted by the Board. The procedures have been designed to ensure these interfund trades are executed in accordance with Rule 17a-7 of the 1940 Act. Interfund trades are included within the respective purchases and sales amounts shown in the Purchases and Sales of Investments note.
Affiliated Redemptions In-Kind. During the period, 272,865 shares of the Fund were redeemed in-kind for investments and cash with a value of $24,994,414. The net realized gain of $7,538,422 on investments delivered through in-kind redemptions is included in the accompanying Statement of Operations. The amount of the in-kind redemptions is included in share transactions in the accompanying Statement of Changes in Net Assets. The Fund recognized no gain or loss for federal income tax purposes.
Prior Fiscal Year Affiliated Redemptions In-Kind. During the prior period, 1,469,597 shares of the Fund were redeemed in-kind for investments and cash with a value of $117,288,521. The Fund had a net realized gain of $26,295,315 on investments delivered through in-kind redemptions. The amount of the in-kind redemptions is included in share transactions in the accompanying Statement of Changes in Net Assets. The Fund recognized no gain or loss for federal income tax purposes.
6. Committed Line of Credit.
The Fund participates with other funds managed by the investment adviser or an affiliate in a $4.25 billion credit facility (the "line of credit") to be utilized for temporary or emergency purposes to fund shareholder redemptions or for other short-term liquidity purposes. The Fund has agreed to pay commitment fees on its pro-rata portion of the line of credit, which amounted to $1,477 and is reflected in Miscellaneous expenses on the Statement of Operations. During the period, the Fund did not borrow on this line of credit.
7. Security Lending.
The Fund lends portfolio securities from time to time in order to earn additional income. For equity securities, lending agents are used, including National Financial Services (NFS), an affiliate of the Fund. Pursuant to a securities lending agreement, NFS will receive a fee, which is capped at 9.9% of daily lending revenue, for its services as lending agent. The Fund may lend securities to certain qualified borrowers. On the settlement date of the loan, the Fund receives collateral (in the form of U.S. Treasury obligations, letters of credit and/or cash) against the loaned securities and maintains collateral in an amount not less than 100% of the market value of the loaned securities during the period of the loan. The market value of the loaned securities is determined at the close of business of the Fund and any additional required collateral is delivered to the Fund on the next business day. The Fund or borrower may terminate the loan at any time, and if the borrower defaults on its obligation to return the securities loaned because of insolvency or other reasons, the Fund may apply collateral received from the borrower against the obligation. The Fund may experience delays and costs in recovering the securities loaned. Any cash collateral received is invested in the Fidelity Securities Lending Cash Central Fund. The value of loaned securities and cash collateral at period end are disclosed on the Fund's Statement of Assets and Liabilities. Total fees paid by the Fund to NFS amounted to $157. Security lending income represents the income earned on investing cash collateral, less rebates paid to borrowers and any lending agent fees associated with the loan, plus any premium payments received for lending certain types of securities. Security lending income is presented in the Statement of Operations as a component of income from Fidelity Central Funds.
8. Expense Reductions.
Commissions paid to certain brokers with whom the investment adviser, or its affiliates, places trades on behalf of the Fund include an amount in addition to trade execution, which may be rebated back to the Fund to offset certain expenses. This amount totaled $32,056 for the period. In addition, through arrangements with the Fund's transfer agent, credits realized as a result of certain uninvested cash balances were used to reduce the Fund's expenses by $204.
In addition, during the period the investment adviser reimbursed and/or waived a portion of operating expenses in the amount of $3,810.
9. Other.
The Fund's organizational documents provide former and current trustees and officers with a limited indemnification against liabilities arising in connection with the performance of their duties to the Fund. In the normal course of business, the Fund may also enter into contracts that provide general indemnifications. The Fund's maximum exposure under these arrangements is unknown as this would be dependent on future claims that may be made against the Fund. The risk of material loss from such claims is considered remote.
Shareholder Expense Example
As a shareholder of the Fund, you incur two types of costs: (1) transaction costs, including and (2) ongoing costs, including management fees and other Fund expenses. This Example is intended to help you understand your ongoing costs (in dollars) of investing in the Fund and to compare these costs with the ongoing costs of investing in other mutual funds.
The Example is based on an investment of $1,000 invested at the beginning of the period and held for the entire period (March 1, 2019 to August 31, 2019).
Actual Expenses
The first line of the accompanying table provides information about actual account values and actual expenses. You may use the information in this line, together with the amount you invested, to estimate the expenses that you paid over the period. Simply divide your account value by $1,000.00 (for example, an $8,600 account value divided by $1,000.00 = 8.6), then multiply the result by the number in the first line under the heading entitled "Expenses Paid During Period" to estimate the expenses you paid on your account during this period. In addition, the Fund, as a shareholder in the underlying Fidelity Central Funds, will indirectly bear its pro-rata share of the fees and expenses incurred by the underlying Fidelity Central Funds. These fees and expenses are not included in the Fund's annualized expense ratio used to calculate the expense estimate in the table below.
Hypothetical Example for Comparison Purposes
The second line of the accompanying table provides information about hypothetical account values and hypothetical expenses based on the Fund's actual expense ratio and an assumed rate of return of 5% per year before expenses, which is not the Fund's actual return. The hypothetical account values and expenses may not be used to estimate the actual ending account balance or expenses you paid for the period. You may use this information to compare the ongoing costs of investing in the Fund and other funds. To do so, compare this 5% hypothetical example with the 5% hypothetical examples that appear in the shareholder reports of the other funds. In addition, the Fund, as a shareholder in the underlying Fidelity Central Funds, will indirectly bear its pro-rata share of the fees and expenses incurred by the underlying Fidelity Central Funds. These fees and expenses are not included in the Fund's annualized expense ratio used to calculate the expense estimate in the table below.
Please note that the expenses shown in the table are meant to highlight your ongoing costs only and do not reflect any transaction costs. Therefore, the second line of the table is useful in comparing ongoing costs only, and will not help you determine the relative total costs of owning different funds. In addition, if these transactional costs were included, your costs would have been higher.
| | Annualized Expense Ratio-A | Beginning
Account Value
March 1, 2019 | Ending
Account Value
August 31, 2019 | Expenses Paid
During Period-B
March 1, 2019
to August 31, 2019 |
| Actual | .76% | $1,000.00 | $1,094.40 | $4.00 |
| Hypothetical-C | | $1,000.00 | $1,021.32 | $3.86 |
A Annualized expense ratio reflects expenses net of applicable fee waivers.
B Expenses are equal to the Fund's annualized expense ratio, multiplied by the average account value over the period, multiplied by 184/366 (to reflect the one-half year period).
C 5% return per year before expenses
SELUTL-SANN-1019
1.813630.114
Fidelity® Select Portfolios®
Materials Sector Chemicals Portfolio
Gold Portfolio
Materials Portfolio
Semi-Annual Report August 31, 2019 Includes Fidelity and Fidelity Advisor share classes |
|
Beginning on January 1, 2021, as permitted by regulations adopted by the Securities and Exchange Commission, paper copies of a fund’s shareholder reports will no longer be sent by mail, unless you specifically request paper copies of the reports from the fund or from your financial intermediary, such as a financial advisor, broker-dealer or bank. Instead, the reports will be made available on a website, and you will be notified by mail each time a report is posted and provided with a website link to access the report.
If you already elected to receive shareholder reports electronically, you will not be affected by this change and you need not take any action. You may elect to receive shareholder reports and other communications from a fund electronically, by contacting your financial intermediary. For Fidelity customers, visit Fidelity's web site or call Fidelity using the contact information listed below.
You may elect to receive all future reports in paper free of charge. If you wish to continue receiving paper copies of your shareholder reports, you may contact your financial intermediary or, if you are a Fidelity customer, visit Fidelity’s website, or call Fidelity at the applicable toll-free number listed below. Your election to receive reports in paper will apply to all funds held with the fund complex/your financial intermediary.
| Account Type | Website | Phone Number |
| Brokerage, Mutual Fund, or Annuity Contracts: | fidelity.com/mailpreferences | 1-800-343-3548 |
| Employer Provided Retirement Accounts: | netbenefits.fidelity.com/preferences (choose 'no' under Required Disclosures to continue to print) | 1-800-343-0860 |
| Advisor Sold Accounts Serviced Through Your Financial Intermediary: | Contact Your Financial Intermediary | Your Financial Intermediary's phone number |
| Advisor Sold Accounts Serviced by Fidelity: | institutional.fidelity.com | 1-877-208-0098 |
Contents
To view a fund's proxy voting guidelines and proxy voting record for the 12-month period ended June 30, visit http://www.fidelity.com/proxyvotingresults or visit the Securities and Exchange Commission's (SEC) web site at http://www.sec.gov.
You may also call 1-800-544-8544 if you’re an individual investing directly with Fidelity, call 1-800-835-5092 if you’re a plan sponsor or participant with Fidelity as your recordkeeper or call 1-877-208-0098 on institutional accounts or if you’re an advisor or invest through one to request a free copy of the proxy voting guidelines.
Standard & Poor's, S&P and S&P 500 are registered service marks of The McGraw-Hill Companies, Inc. and have been licensed for use by Fidelity Distributors Corporation.
Other third-party marks appearing herein are the property of their respective owners.
All other marks appearing herein are registered or unregistered trademarks or service marks of FMR LLC or an affiliated company. © 2019 FMR LLC. All rights reserved.
This report and the financial statements contained herein are submitted for the general information of the shareholders of the Funds. This report is not authorized for distribution to prospective investors in the Funds unless preceded or accompanied by an effective prospectus.
A fund files its complete schedule of portfolio holdings with the SEC for the first and third quarters of each fiscal year on Form N-PORT. Forms N-PORT are available on the SEC’s web site at http://www.sec.gov. A fund's Forms N-PORT may be reviewed and copied at the SEC’s Public Reference Room in Washington, DC. Information regarding the operation of the SEC's Public Reference Room may be obtained by calling 1-800-SEC-0330.
For a complete list of a fund's portfolio holdings, view the most recent holdings listing, semiannual report, or annual report on Fidelity's web site at http://www.fidelity.com, http://www.institutional.fidelity.com, or http://www.401k.com, as applicable.
NOT FDIC INSURED •MAY LOSE VALUE •NO BANK GUARANTEE
Neither the Funds nor Fidelity Distributors Corporation is a bank.
Chemicals Portfolio
Investment Summary (Unaudited)
Top Ten Stocks as of August 31, 2019
| | % of fund's net assets |
| Linde PLC | 20.5 |
| DowDuPont, Inc. | 13.0 |
| Air Products & Chemicals, Inc. | 9.3 |
| Ecolab, Inc. | 6.3 |
| Olin Corp. | 5.1 |
| Sherwin-Williams Co. | 4.7 |
| Corteva, Inc. | 4.6 |
| The Chemours Co. LLC | 4.5 |
| International Flavors & Fragrances, Inc. | 4.3 |
| W.R. Grace & Co. | 2.9 |
| | 75.2 |
Top Industries (% of fund's net assets)
| As of August 31, 2019 |
| | Chemicals | 88.0% |
| | Pharmaceuticals | 4.6% |
| | Containers & Packaging | 2.4% |
| | Trading Companies & Distributors | 2.3% |
| | Commercial Services & Supplies | 2.0% |
| | All Others* | 0.7% |

* Includes short-term investments and net other assets (liabilities).
Chemicals Portfolio
Schedule of Investments August 31, 2019 (Unaudited)
Showing Percentage of Net Assets
| Common Stocks - 99.4% | | | |
| | | Shares | Value |
| Biotechnology - 0.1% | | | |
| Biotechnology - 0.1% | | | |
| Calyxt, Inc. (a)(b) | | 187,310 | $1,159,449 |
| Chemicals - 88.0% | | | |
| Commodity Chemicals - 7.1% | | | |
| Cabot Corp. | | 145,100 | 5,804,000 |
| Olin Corp. (b) | | 2,643,740 | 44,890,705 |
| Orion Engineered Carbons SA | | 512,300 | 7,126,093 |
| Westlake Chemical Corp. | | 90,756 | 5,317,394 |
| | | | 63,138,192 |
| Diversified Chemicals - 19.8% | | | |
| DowDuPont, Inc. | | 1,703,793 | 115,738,658 |
| Huntsman Corp. | | 445,700 | 8,878,344 |
| Ingevity Corp. (a) | | 147,000 | 11,196,990 |
| The Chemours Co. LLC | | 2,833,859 | 40,155,782 |
| | | | 175,969,774 |
| Fertilizers & Agricultural Chemicals - 4.5% | | | |
| CF Industries Holdings, Inc. | | 500,100 | 24,099,819 |
| The Mosaic Co. | | 299,300 | 5,504,127 |
| The Scotts Miracle-Gro Co. Class A | | 94,700 | 10,068,504 |
| | | | 39,672,450 |
| Industrial Gases - 29.8% | | | |
| Air Products & Chemicals, Inc. | | 364,911 | 82,440,693 |
| Linde PLC | | 960,816 | 181,507,750 |
| | | | 263,948,443 |
| Specialty Chemicals - 26.8% | | | |
| Akzo Nobel NV | | 204,600 | 18,319,803 |
| Ecolab, Inc. | | 269,900 | 55,683,069 |
| Element Solutions, Inc. (a) | | 560,343 | 5,228,000 |
| International Flavors & Fragrances, Inc. (b) | | 351,600 | 38,588,100 |
| PolyOne Corp. | | 198,300 | 6,347,583 |
| PPG Industries, Inc. | | 96,800 | 10,724,472 |
| Sherwin-Williams Co. | | 78,933 | 41,577,958 |
| Symrise AG | | 142,900 | 13,337,047 |
| Tronox Holdings PLC | | 3,056,369 | 22,708,822 |
| W.R. Grace & Co. | | 377,600 | 25,567,296 |
| | | | 238,082,150 |
|
| TOTAL CHEMICALS | | | 780,811,009 |
|
| Commercial Services & Supplies - 2.0% | | | |
| Environmental & Facility Services - 2.0% | | | |
| Waste Connection, Inc. (United States) | | 191,200 | 17,571,280 |
| Containers & Packaging - 2.4% | | | |
| Metal & Glass Containers - 2.4% | | | |
| Ball Corp. | | 164,700 | 13,243,527 |
| Crown Holdings, Inc. (a) | | 126,600 | 8,335,344 |
| | | | 21,578,871 |
| Pharmaceuticals - 4.6% | | | |
| Pharmaceuticals - 4.6% | | | |
| Corteva, Inc. | | 1,397,093 | 40,962,767 |
| Trading Companies & Distributors - 2.3% | | | |
| Trading Companies & Distributors - 2.3% | | | |
| Univar, Inc. (a) | | 1,048,594 | 20,290,294 |
| TOTAL COMMON STOCKS | | | |
| (Cost $822,725,041) | | | 882,373,670 |
|
| Money Market Funds - 5.0% | | | |
| Fidelity Cash Central Fund 2.13% (c) | | 124,782 | 124,807 |
| Fidelity Securities Lending Cash Central Fund 2.13% (c)(d) | | 44,355,220 | 44,359,655 |
| TOTAL MONEY MARKET FUNDS | | | |
| (Cost $44,484,462) | | | 44,484,462 |
| TOTAL INVESTMENT IN SECURITIES - 104.4% | | | |
| (Cost $867,209,503) | | | 926,858,132 |
| NET OTHER ASSETS (LIABILITIES) - (4.4)% | | | (39,369,060) |
| NET ASSETS - 100% | | | $887,489,072 |
Legend
(a) Non-income producing
(b) Security or a portion of the security is on loan at period end.
(c) Affiliated fund that is generally available only to investment companies and other accounts managed by Fidelity Investments. The rate quoted is the annualized seven-day yield of the fund at period end. A complete unaudited listing of the fund's holdings as of its most recent quarter end is available upon request. In addition, each Fidelity Central Fund's financial statements are available on the SEC's website or upon request.
(d) Investment made with cash collateral received from securities on loan.
Affiliated Central Funds
Information regarding fiscal year to date income earned by the Fund from investments in Fidelity Central Funds is as follows:
| Fund | Income earned |
| Fidelity Cash Central Fund | $40,839 |
| Fidelity Securities Lending Cash Central Fund | 34,257 |
| Total | $75,096 |
Amounts in the income column in the above table include any capital gain distributions from underlying funds, which are presented in the corresponding line-item in the Statement of Operations, if applicable. Amount for Fidelity Securities Lending Cash Central Fund represents the income earned on investing cash collateral, less rebates paid to borrowers and any lending agent fees associated with the loan, plus any premium payments received for lending certain types of securities.
Investment Valuation
All investments are categorized as Level 1 under the Fair Value Hierarchy. The inputs or methodology used for valuing securities may not be an indication of the risk associated with investing in those securities. For more information on valuation inputs please refer to the Investment Valuation section in the accompanying Notes to Financial Statements.
Other Information
Distribution of investments by country or territory of incorporation, as a percentage of Total Net Assets, is as follows (Unaudited):
| United States of America | 70.6% |
| Ireland | 20.5% |
| United Kingdom | 2.5% |
| Netherlands | 2.1% |
| Canada | 2.0% |
| Germany | 1.5% |
| Others (Individually Less Than 1%) | 0.8% |
| | 100.0% |
See accompanying notes which are an integral part of the financial statements.
Chemicals Portfolio
Financial Statements
Statement of Assets and Liabilities
| | | August 31, 2019 (Unaudited) |
| Assets | | |
Investment in securities, at value (including securities loaned of $43,925,467) — See accompanying schedule:
Unaffiliated issuers (cost $822,725,041) | $882,373,670 | |
| Fidelity Central Funds (cost $44,484,462) | 44,484,462 | |
| Total Investment in Securities (cost $867,209,503) | | $926,858,132 |
| Receivable for investments sold | | 3,105,123 |
| Receivable for fund shares sold | | 193,238 |
| Dividends receivable | | 3,745,450 |
| Distributions receivable from Fidelity Central Funds | | 9,260 |
| Prepaid expenses | | 14,655 |
| Other receivables | | 136,674 |
| Total assets | | 934,062,532 |
| Liabilities | | |
| Payable for investments purchased | $5,602 | |
| Payable for fund shares redeemed | 1,480,919 | |
| Accrued management fee | 403,061 | |
| Other affiliated payables | 193,269 | |
| Other payables and accrued expenses | 135,959 | |
| Collateral on securities loaned | 44,354,650 | |
| Total liabilities | | 46,573,460 |
| Net Assets | | $887,489,072 |
| Net Assets consist of: | | |
| Paid in capital | | $799,247,309 |
| Total distributable earnings (loss) | | 88,241,763 |
| Net Assets, for 75,373,118 shares outstanding | | $887,489,072 |
| Net Asset Value, offering price and redemption price per share ($887,489,072 ÷ 75,373,118 shares) | | $11.77 |
See accompanying notes which are an integral part of the financial statements.
Statement of Operations
| | | Six months ended August 31, 2019 (Unaudited) |
| Investment Income | | |
| Dividends | | $11,513,677 |
| Income from Fidelity Central Funds (including $34,257 from security lending) | | 75,096 |
| Total income | | 11,588,773 |
| Expenses | | |
| Management fee | $2,794,525 | |
| Transfer agent fees | 1,061,096 | |
| Accounting and security lending fees | 172,288 | |
| Custodian fees and expenses | 4,848 | |
| Independent trustees' fees and expenses | 3,007 | |
| Registration fees | 22,579 | |
| Audit | 26,915 | |
| Legal | 1,193 | |
| Interest | 3,016 | |
| Miscellaneous | 6,314 | |
| Total expenses before reductions | 4,095,781 | |
| Expense reductions | (50,846) | |
| Total expenses after reductions | | 4,044,935 |
| Net investment income (loss) | | 7,543,838 |
| Realized and Unrealized Gain (Loss) | | |
| Net realized gain (loss) on: | | |
| Investment securities: | | |
| Unaffiliated issuers | 24,816,306 | |
| Fidelity Central Funds | 5,005 | |
| Foreign currency transactions | 62,219 | |
| Total net realized gain (loss) | | 24,883,530 |
| Change in net unrealized appreciation (depreciation) on: | | |
| Investment securities: | | |
| Unaffiliated issuers | (141,917,727) | |
| Assets and liabilities in foreign currencies | (11,172) | |
| Total change in net unrealized appreciation (depreciation) | | (141,928,899) |
| Net gain (loss) | | (117,045,369) |
| Net increase (decrease) in net assets resulting from operations | | $(109,501,531) |
See accompanying notes which are an integral part of the financial statements.
Statement of Changes in Net Assets
| | Six months ended August 31, 2019 (Unaudited) | Year ended February 28, 2019 |
| Increase (Decrease) in Net Assets | | |
| Operations | | |
| Net investment income (loss) | $7,543,838 | $21,659,821 |
| Net realized gain (loss) | 24,883,530 | 93,669,306 |
| Change in net unrealized appreciation (depreciation) | (141,928,899) | (285,174,370) |
| Net increase (decrease) in net assets resulting from operations | (109,501,531) | (169,845,243) |
| Distributions to shareholders | (36,252,928) | (172,397,316) |
| Share transactions | | |
| Proceeds from sales of shares | 29,008,793 | 142,345,479 |
| Reinvestment of distributions | 34,478,614 | 163,460,684 |
| Cost of shares redeemed | (183,622,918) | (600,405,301) |
| Net increase (decrease) in net assets resulting from share transactions | (120,135,511) | (294,599,138) |
| Total increase (decrease) in net assets | (265,889,970) | (636,841,697) |
| Net Assets | | |
| Beginning of period | 1,153,379,042 | 1,790,220,739 |
| End of period | $887,489,072 | $1,153,379,042 |
| Other Information | | |
| Shares(a) | | |
| Sold | 2,271,292 | 9,180,276 |
| Issued in reinvestment of distributions | 2,513,019 | 11,635,665 |
| Redeemed | (14,416,071) | (39,027,003) |
| Net increase (decrease) | (9,631,760) | (18,211,062) |
(a) Share activity prior to August 10, 2018 has been adjusted to reflect the impact of the 10 for 1 share split that occurred on that date.
See accompanying notes which are an integral part of the financial statements.
Financial Highlights
Chemicals Portfolio
| | Six months ended (Unaudited) August 31, | Years endedFebruary 28, | | | | |
| | 2019 | 2019 | 2018 | 2017 | 2016A | 2015 |
| Selected Per–Share DataB | | | | | | |
| Net asset value, beginning of period | $13.57 | $17.34 | $16.24 | $12.32 | $15.33 | $14.82 |
| Income from Investment Operations | | | | | | |
| Net investment income (loss)C | .09 | .23 | .19 | .18 | .19 | .16 |
| Net realized and unrealized gain (loss) | (1.45) | (2.17) | 2.36 | 4.44 | (2.34) | .91 |
| Total from investment operations | (1.36) | (1.94) | 2.55 | 4.62 | (2.15) | 1.07 |
| Distributions from net investment income | (.04) | (.21) | (.16) | (.17) | (.18) | (.14) |
| Distributions from net realized gain | (.40) | (1.62) | (1.29) | (.53) | (.68) | (.42) |
| Total distributions | (.44) | (1.83) | (1.45) | (.70) | (.86) | (.56) |
| Redemption fees added to paid in capitalC | – | – | – | –D | –D | –D |
| Net asset value, end of period | $11.77 | $13.57 | $17.34 | $16.24 | $12.32 | $15.33 |
| Total ReturnE,F | (10.50)% | (11.10)% | 16.31% | 38.02% | (14.46)% | 7.52% |
| Ratios to Average Net AssetsG,H | | | | | | |
| Expenses before reductions | .79%I | .77% | .77% | .80% | .80% | .79% |
| Expenses net of fee waivers, if any | .79%I | .77% | .77% | .80% | .80% | .79% |
| Expenses net of all reductions | .78%I | .76% | .77% | .79% | .79% | .79% |
| Net investment income (loss) | 1.45%I | 1.50% | 1.12% | 1.26% | 1.36% | 1.10% |
| Supplemental Data | | | | | | |
| Net assets, end of period (000 omitted) | $887,489 | $1,153,379 | $1,790,221 | $1,626,642 | $1,046,827 | $1,625,067 |
| Portfolio turnover rateJ | 81%I | 62% | 62% | 85% | 79% | 80%K |
A For the year ended February 29.
B Per share amounts have been adjusted to reflect the impact of the 10 for 1 share split that occurred on August 10, 2018.
C Calculated based on average shares outstanding during the period.
D Amount represents less than $.005 per share.
E Total returns for periods of less than one year are not annualized.
F Total returns would have been lower if certain expenses had not been reduced during the applicable periods shown.
G Fees and expenses of any underlying Fidelity Central Funds are not included in the Fund's expense ratio. The Fund indirectly bears its proportionate share of the expenses of any underlying Fidelity Central Funds.
H Expense ratios reflect operating expenses of the Fund. Expenses before reductions do not reflect amounts reimbursed by the investment adviser or reductions from brokerage service arrangements or reductions from other expense offset arrangements and do not represent the amount paid by the Fund during periods when reimbursements or reductions occur. Expenses net of fee waivers reflect expenses after reimbursement by the investment adviser but prior to reductions from brokerage service arrangements or other expense offset arrangements. Expenses net of all reductions represent the net expenses paid by the Fund.
I Annualized
J Amount does not include the portfolio activity of any underlying Fidelity Central Funds.
K Portfolio turnover rate excludes securities received or delivered in-kind.
See accompanying notes which are an integral part of the financial statements.
Notes to Financial Statements (Unaudited)
For the period ended August 31, 2019
1. Organization.
Chemicals Portfolio (the Fund) is a non-diversified fund of Fidelity Select Portfolios (the Trust) and is authorized to issue an unlimited number of shares. Share transactions on the Statement of Changes in Net Assets may contain exchanges between affiliated funds. The Trust is registered under the Investment Company Act of 1940, as amended (the 1940 Act), as an open-end management investment company organized as a Massachusetts business trust. The Fund invests primarily in securities of companies whose principal business activities fall within specific industries.
Effective August 10, 2018, Chemicals Portfolio underwent a 10 for 1 share split. The effect of the share split transaction was to multiply the number of outstanding shares of Chemicals Portfolio by a split factor of 10:1, with a corresponding decrease in net asset value (NAV) per share. This event does not impact the overall net assets of Chemicals Portfolio. The per share data presented in the Financial Highlights and Share activity presented in the Statements of Changes in Net Assets for Chemicals Portfolio have been retroactively adjusted to reflect this share split.
2. Investments in Fidelity Central Funds.
The Fund invests in Fidelity Central Funds, which are open-end investment companies generally available only to other investment companies and accounts managed by the investment adviser and its affiliates. The Fund's Schedule of Investments lists each of the Fidelity Central Funds held as of period end, if any, as an investment of the Fund, but does not include the underlying holdings of each Fidelity Central Fund. As an Investing Fund, the Fund indirectly bears its proportionate share of the expenses of the underlying Fidelity Central Funds.
The Money Market Central Funds seek preservation of capital and current income and are managed by Fidelity Investments Money Management, Inc. (FIMM), an affiliate of the investment adviser. Annualized expenses of the Money Market Central Funds as of their most recent shareholder report date ranged from less than .005% to .01%.
A complete unaudited list of holdings for each Fidelity Central Fund is available upon request or at the Securities and Exchange Commission (the SEC) website at www.sec.gov. In addition, the financial statements of the Fidelity Central Funds are available on the SEC website or upon request.
3. Significant Accounting Policies.
The Fund is an investment company and applies the accounting and reporting guidance of the Financial Accounting Standards Board (FASB) Accounting Standards Codification Topic 946 Financial Services – Investments Companies. The financial statements have been prepared in conformity with accounting principles generally accepted in the United States of America (GAAP), which require management to make certain estimates and assumptions at the date of the financial statements. Actual results could differ from those estimates. Subsequent events, if any, through the date that the financial statements were issued have been evaluated in the preparation of the financial statements. The following summarizes the significant accounting policies of the Fund:
Investment Valuation. Investments are valued as of 4:00 p.m. Eastern time on the last calendar day of the period. The Board of Trustees (the Board) has delegated the day to day responsibility for the valuation of the Fund's investments to the Fair Value Committee (the Committee) established by the Fund's investment adviser. In accordance with valuation policies and procedures approved by the Board, the Fund attempts to obtain prices from one or more third party pricing vendors or brokers to value its investments. When current market prices, quotations or currency exchange rates are not readily available or reliable, investments will be fair valued in good faith by the Committee, in accordance with procedures adopted by the Board. Factors used in determining fair value vary by investment type and may include market or investment specific events. The frequency with which these procedures are used cannot be predicted and they may be utilized to a significant extent. The Committee oversees the Fund's valuation policies and procedures and reports to the Board on the Committee's activities and fair value determinations. The Board monitors the appropriateness of the procedures used in valuing the Fund's investments and ratifies the fair value determinations of the Committee.
The Fund categorizes the inputs to valuation techniques used to value its investments into a disclosure hierarchy consisting of three levels as shown below:
- Level 1 – quoted prices in active markets for identical investments
- Level 2 – other significant observable inputs (including quoted prices for similar investments, interest rates, prepayment speeds, etc.)
- Level 3 – unobservable inputs (including the Fund's own assumptions based on the best information available)
Valuation techniques used to value the Fund's investments by major category are as follows:
Equity securities, including restricted securities, for which market quotations are readily available, are valued at the last reported sale price or official closing price as reported by a third party pricing vendor on the primary market or exchange on which they are traded and are categorized as Level 1 in the hierarchy. In the event there were no sales during the day or closing prices are not available, securities are valued at the last quoted bid price or may be valued using the last available price and are generally categorized as Level 2 in the hierarchy. For foreign equity securities, when market or security specific events arise, comparisons to the valuation of American Depositary Receipts (ADRs), futures contracts, Exchange-Traded Funds (ETFs) and certain indexes as well as quoted prices for similar securities may be used and would be categorized as Level 2 in the hierarchy. For equity securities, including restricted securities, where observable inputs are limited, assumptions about market activity and risk are used and these securities may be categorized as Level 3 in the hierarchy.
Investments in open-end mutual funds, including the Fidelity Central Funds, are valued at their closing net asset value (NAV) each business day and are categorized as Level 1 in the hierarchy.
Changes in valuation techniques may result in transfers in or out of an assigned level within the disclosure hierarchy.
Foreign Currency. The Fund may use foreign currency contracts to facilitate transactions in foreign-denominated securities. Gains and losses from these transactions may arise from changes in the value of the foreign currency or if the counterparties do not perform under the contracts' terms.
Foreign-denominated assets, including investment securities, and liabilities are translated into U.S. dollars at the exchange rates at period end. Purchases and sales of investment securities, income and dividends received and expenses denominated in foreign currencies are translated into U.S. dollars at the exchange rate in effect on the transaction date.
The effects of exchange rate fluctuations on investments are included with the net realized and unrealized gain (loss) on investment securities. Other foreign currency transactions resulting in realized and unrealized gain (loss) are disclosed separately.
Investment Transactions and Income. For financial reporting purposes, the Fund's investment holdings and NAV include trades executed through the end of the last business day of the period. The NAV per share for processing shareholder transactions is calculated as of the close of business of the New York Stock Exchange (NYSE), normally 4:00 p.m. Eastern time and includes trades executed through the end of the prior business day. Gains and losses on securities sold are determined on the basis of identified cost. Dividend income is recorded on the ex-dividend date, except for certain dividends from foreign securities where the ex-dividend date may have passed, which are recorded as soon as the Fund is informed of the ex-dividend date. Non-cash dividends included in dividend income, if any, are recorded at the fair market value of the securities received. Income and capital gain distributions from Fidelity Central Funds, if any, are recorded on the ex-dividend date. Certain distributions received by the Fund represent a return of capital or capital gain. The Fund determines the components of these distributions subsequent to the ex-dividend date, based upon receipt of tax filings or other correspondence relating to the underlying investment. These distributions are recorded as a reduction of cost of investments and/or as a realized gain. Investment income is recorded net of foreign taxes withheld where recovery of such taxes is uncertain.
Expenses. Expenses directly attributable to a fund are charged to that fund. Expenses attributable to more than one fund are allocated among the respective funds on the basis of relative net assets or other appropriate methods. Expense estimates are accrued in the period to which they relate and adjustments are made when actual amounts are known.
Deferred Trustee Compensation. Under a Deferred Compensation Plan (the Plan) for the Fund, certain independent Trustees have elected to defer receipt of a portion of their annual compensation. Deferred amounts are invested in a cross-section of Fidelity funds, are marked-to-market and remain in the Fund until distributed in accordance with the Plan. The investment of deferred amounts and the offsetting payable to the Trustees of $112,107 are included in the accompanying Statement of Assets and Liabilities in other receivables and other payables and accrued expenses, respectively.
Income Tax Information and Distributions to Shareholders. Each year, the Fund intends to qualify as a regulated investment company under Subchapter M of the Internal Revenue Code, including distributing substantially all of its taxable income and realized gains. As a result, no provision for U.S. Federal income taxes is required. The Fund files a U.S. federal tax return, in addition to state and local tax returns as required. The Fund's federal income tax returns are subject to examination by the Internal Revenue Service (IRS) for a period of three fiscal years after they are filed. State and local tax returns may be subject to examination for an additional fiscal year depending on the jurisdiction. Foreign taxes are provided for based on the Fund's understanding of the tax rules and rates that exist in the foreign markets in which it invests.
Distributions are declared and recorded on the ex-dividend date. Income and capital gain distributions are determined in accordance with income tax regulations, which may differ from GAAP.
Capital accounts within the financial statements are adjusted for permanent book-tax differences. These adjustments have no impact on net assets or the results of operations. Capital accounts are not adjusted for temporary book-tax differences which will reverse in a subsequent period.
Book-tax differences are primarily due to foreign currency transactions, partnerships, deferred trustees compensation, and losses deferred due to wash sales.
As of period end, the cost and unrealized appreciation (depreciation) in securities, and derivatives if applicable, for federal income tax purposes were as follows:
| Gross unrealized appreciation | $132,925,179 |
| Gross unrealized depreciation | (79,282,363) |
| Net unrealized appreciation (depreciation) | $53,642,816 |
| Tax cost | $873,215,316 |
4. Purchases and Sales of Investments.
Purchases and sales of securities, other than short-term securities, aggregated $415,155,222 and $559,676,881, respectively.
5. Fees and Other Transactions with Affiliates.
Management Fee. Fidelity SelectCo, LLC (the investment adviser) and its affiliates provide the Fund with investment management related services for which the Fund pays a monthly management fee. The management fee is the sum of an individual fund fee rate that is based on an annual rate of .30% of the Fund's average net assets and an annualized group fee rate that averaged .24% during the period. The group fee rate is based upon the average net assets of all the mutual funds advised by Fidelity Management & Research Company (FMR) and the investment adviser. The group fee rate decreases as assets under management increase and increases as assets under management decrease. For the reporting period, the total annualized management fee rate was .54% of the Fund's average net assets.
Transfer Agent Fees. Fidelity Investments Institutional Operations Company, Inc. (FIIOC), an affiliate of the investment adviser, is the Fund's transfer, dividend disbursing and shareholder servicing agent. FIIOC receives account fees and asset-based fees that vary according to account size and type of account. FIIOC pays for typesetting, printing and mailing of shareholder reports, except proxy statements. For the period, the transfer agent fees were equivalent to an annualized rate of .20% of average net assets.
Accounting and Security Lending Fees. Fidelity Service Company, Inc. (FSC), an affiliate of the investment adviser, maintains the Fund's accounting records. The accounting fee is based on the level of average net assets for each month. Prior to April 1, 2019, FSC had a separate agreement with the Fund for administration of the security lending program, based on the number and duration of lending transactions. For the period, the total fees paid for accounting and administration of securities lending were equivalent to an annualized rate of .03%.
Brokerage Commissions. The Fund placed a portion of its portfolio transactions with brokerage firms which are affiliates of the investment adviser. Brokerage commissions are included in net realized gain (loss) and change in net unrealized appreciation (depreciation) in the Statement of Operations. The commissions paid to these affiliated firms were $16,785 for the period.
Interfund Lending Program. Pursuant to an Exemptive Order issued by the SEC, the Fund, along with other registered investment companies having management contracts with Fidelity Management & Research Company (FMR) or other affiliated entities of FMR, may participate in an interfund lending program. This program provides an alternative credit facility allowing the funds to borrow from, or lend money to, other participating affiliated funds. At period end, there were no interfund loans outstanding. The Fund's activity in this program during the period for which loans were outstanding was as follows:
| Borrower or Lender | Average Loan Balance | Weighted Average Interest Rate | Interest Expense |
| Borrower | $5,109,000 | 2.66% | $3,016 |
Interfund Trades. The Fund may purchase from or sell securities to other Fidelity Funds under procedures adopted by the Board. The procedures have been designed to ensure these interfund trades are executed in accordance with Rule 17a-7 of the 1940 Act. Interfund trades are included within the respective purchases and sales amounts shown in the Purchases and Sales of Investments note.
6. Committed Line of Credit.
The Fund participates with other funds managed by the investment adviser or an affiliate in a $4.25 billion credit facility (the "line of credit") to be utilized for temporary or emergency purposes to fund shareholder redemptions or for other short-term liquidity purposes. The Fund has agreed to pay commitment fees on its pro-rata portion of the line of credit, which amounted to $1,502 and is reflected in Miscellaneous expenses on the Statement of Operations. During the period, the Fund did not borrow on this line of credit.
7. Security Lending.
The Fund lends portfolio securities from time to time in order to earn additional income. For equity securities, lending agents are used, including National Financial Services (NFS), an affiliate of the Fund. Pursuant to a securities lending agreement, NFS will receive a fee, which is capped at 9.9% of daily lending revenue, for its services as lending agent. The Fund may lend securities to certain qualified borrowers. On the settlement date of the loan, the Fund receives collateral (in the form of U.S. Treasury obligations, letters of credit and/or cash) against the loaned securities and maintains collateral in an amount not less than 100% of the market value of the loaned securities during the period of the loan. The market value of the loaned securities is determined at the close of business of the Fund and any additional required collateral is delivered to the Fund on the next business day. The Fund or borrower may terminate the loan at any time, and if the borrower defaults on its obligation to return the securities loaned because of insolvency or other reasons, the Fund may apply collateral received from the borrower against the obligation. The Fund may experience delays and costs in recovering the securities loaned. Any cash collateral received is invested in the Fidelity Securities Lending Cash Central Fund. The value of loaned securities and cash collateral at period end are disclosed on the Fund's Statement of Assets and Liabilities. Total fees paid by the Fund to NFS, amounted to $1,271. Security lending income represents the income earned on investing cash collateral, less rebates paid to borrowers and any lending agent fees associated with the loan, plus any premium payments received for lending certain types of securities. Security lending income is presented in the Statement of Operations as a component of income from Fidelity Central Funds.
8. Expense Reductions.
Commissions paid to certain brokers with whom the investment adviser, or its affiliates, places trades on behalf of the Fund include an amount in addition to trade execution, which may be rebated back to the Fund to offset certain expenses. This amount totaled $46,478 for the period.
In addition, during the period the investment adviser reimbursed and/or waived a portion of operating expenses in the amount of $4,368.
9. Other.
The Fund's organizational documents provide former and current trustees and officers with a limited indemnification against liabilities arising in connection with the performance of their duties to the Fund. In the normal course of business, the Fund may also enter into contracts that provide general indemnifications. The Fund's maximum exposure under these arrangements is unknown as this would be dependent on future claims that may be made against the Fund. The risk of material loss from such claims is considered remote.
Gold Portfolio
Consolidated Investment Summary (Unaudited)
The information in the following tables is based on the consolidated investments of the Fund.
Top Ten Holdings as of August 31, 2019
| (excluding repurchase agreements) | % of fund's net assets |
| Barrick Gold Corp. (Canada) | 13.4 |
| Newmont Goldcorp Corp. | 12.4 |
| Newcrest Mining Ltd. | 7.7 |
| Franco-Nevada Corp. | 6.7 |
| Agnico Eagle Mines Ltd. (Canada) | 6.4 |
| AngloGold Ashanti Ltd. | 4.9 |
| Royal Gold, Inc. | 4.8 |
| Kirkland Lake Gold Ltd. | 4.5 |
| Evolution Mining Ltd. | 3.6 |
| Northern Star Resources Ltd. | 3.3 |
| | 67.7 |
Top Industries (% of fund's net assets)
| As of August 31, 2019 |
| | Gold | 93.8% |
| | Silver | 3.2% |
| | Precious Metals & Minerals | 1.4% |
| | Commodities & Related Investments* | 0.8% |
| | All Others* | 0.8% |

* Includes gold bullion and/or silver bullion.
* Includes short-term investments and net other assets (liabilities).
Geographic Diversification (% of fund's net assets)
| As of August 31, 2019 |
| | Canada | 53.4% |
| | United States of America* | 18.8% |
| | Australia | 18.0% |
| | South Africa | 7.7% |
| | Cayman Islands | 1.5% |
| | Peru | 0.6% |

* Includes Short-Term investments and Net Other Assets (Liabilities).
Percentages are based on country or territory of incorporation and are adjusted for the effect of futures contracts, if applicable.
Gold Portfolio
Consolidated Schedule of Investments August 31, 2019 (Unaudited)
Showing Percentage of Net Assets
| Common Stocks - 98.4% | | | |
| | | Shares | Value |
| Australia - 18.0% | | | |
| Metals & Mining - 18.0% | | | |
| Gold - 18.0% | | | |
| Evolution Mining Ltd. | | 20,512,441 | $71,557,056 |
| Gold Road Resources Ltd. (a)(b) | | 20,813,386 | 18,361,975 |
| Newcrest Mining Ltd. | | 6,048,924 | 150,724,971 |
| Northern Star Resources Ltd. | | 8,161,913 | 65,410,020 |
| Regis Resources Ltd. | | 5,696,132 | 19,717,349 |
| Saracen Mineral Holdings Ltd. (a) | | 11,692,105 | 28,661,535 |
| | | | 354,432,906 |
| Canada - 53.4% | | | |
| Metals & Mining - 53.4% | | | |
| Gold - 48.8% | | | |
| Agnico Eagle Mines Ltd. (Canada) | | 1,999,201 | 124,991,356 |
| Alamos Gold, Inc. | | 6,086,012 | 42,877,266 |
| B2Gold Corp. (a) | | 9,199,293 | 33,027,355 |
| Barrick Gold Corp. (Canada) | | 13,651,995 | 264,652,241 |
| Centerra Gold, Inc. (a) | | 2,000,000 | 18,191,378 |
| Franco-Nevada Corp. | | 1,348,900 | 131,769,516 |
| Gold Standard Ventures Corp. (a)(c) | | 17,798,000 | 18,046,643 |
| Kirkland Lake Gold Ltd. | | 1,831,080 | 89,037,193 |
| Novagold Resources, Inc. (a) | | 1,872,000 | 13,961,965 |
| OceanaGold Corp. | | 12,449,332 | 29,828,278 |
| Premier Gold Mines Ltd. (a)(b) | | 10,126,122 | 17,340,813 |
| Pretium Resources, Inc. (a) | | 2,707,683 | 35,528,933 |
| Pretium Resources, Inc. (a)(d) | | 225,000 | 2,952,343 |
| Seabridge Gold, Inc. (a)(b) | | 1,678,210 | 26,508,004 |
| SSR Mining, Inc. (a) | | 2,644,200 | 43,434,470 |
| Torex Gold Resources, Inc. (a) | | 1,705,000 | 27,379,375 |
| Yamana Gold, Inc. | | 11,500,000 | 41,546,492 |
| | | | 961,073,621 |
| Precious Metals & Minerals - 1.4% | | | |
| Osisko Mining, Inc. (a) | | 3,598,200 | 9,458,991 |
| SilverCrest Metals, Inc. (a) | | 3,000,000 | 18,454,259 |
| | | | 27,913,250 |
| Silver - 3.2% | | | |
| MAG Silver Corp. (a) | | 1,710,801 | 21,831,537 |
| Wheaton Precious Metals Corp. | | 1,397,400 | 41,101,235 |
| | | | 62,932,772 |
| TOTAL METALS & MINING | | | 1,051,919,643 |
| Cayman Islands - 1.5% | | | |
| Metals & Mining - 1.5% | | | |
| Gold - 1.5% | | | |
| Endeavour Mining Corp. (a) | | 1,555,640 | 30,320,608 |
| Peru - 0.6% | | | |
| Metals & Mining - 0.6% | | | |
| Gold - 0.6% | | | |
| Compania de Minas Buenaventura SA sponsored ADR | | 700,197 | 10,671,002 |
| South Africa - 7.7% | | | |
| Metals & Mining - 7.7% | | | |
| Gold - 7.7% | | | |
| AngloGold Ashanti Ltd. | | 4,240,000 | 96,371,583 |
| Gold Fields Ltd. | | 9,275,000 | 55,017,803 |
| | | | 151,389,386 |
| United States of America - 17.2% | | | |
| Metals & Mining - 17.2% | | | |
| Gold - 17.2% | | | |
| Newmont Goldcorp Corp. | | 6,130,381 | 244,540,898 |
| Royal Gold, Inc. | | 702,167 | 93,655,034 |
| | | | 338,195,932 |
| TOTAL COMMON STOCKS | | | |
| (Cost $1,287,587,764) | | | 1,936,929,477 |
|
| Commodities - 0.8% | | | |
| | | Troy Ounces | |
| Gold Bullion | | | |
| (Cost $9,320,790) | | 10,010 | 15,252,637 |
|
| Money Market Funds - 1.4% | | | |
| Fidelity Cash Central Fund 2.13% (e) | | 19,777,362 | 19,781,317 |
| Fidelity Securities Lending Cash Central Fund 2.13% (e)(f) | | 8,094,210 | 8,095,019 |
| TOTAL MONEY MARKET FUNDS | | | |
| (Cost $27,875,923) | | | 27,876,336 |
| TOTAL INVESTMENT IN SECURITIES - 100.6% | | | |
| (Cost $1,324,784,477) | | | 1,980,058,450 |
| NET OTHER ASSETS (LIABILITIES) - (0.6)% | | | (11,304,417) |
| NET ASSETS - 100% | | | $1,968,754,033 |
Legend
(a) Non-income producing
(b) Security or a portion of the security is on loan at period end.
(c) Affiliated company
(d) Security exempt from registration under Rule 144A of the Securities Act of 1933. These securities may be resold in transactions exempt from registration, normally to qualified institutional buyers. At the end of the period, the value of these securities amounted to $2,952,343 or 0.1% of net assets.
(e) Affiliated fund that is generally available only to investment companies and other accounts managed by Fidelity Investments. The rate quoted is the annualized seven-day yield of the fund at period end. A complete unaudited listing of the fund's holdings as of its most recent quarter end is available upon request. In addition, each Fidelity Central Fund's financial statements are available on the SEC's website or upon request.
(f) Investment made with cash collateral received from securities on loan.
Affiliated Central Funds
Information regarding fiscal year to date income earned by the Fund from investments in Fidelity Central Funds is as follows:
| Fund | Income earned |
| Fidelity Cash Central Fund | $278,239 |
| Fidelity Securities Lending Cash Central Fund | 45,739 |
| Total | $323,978 |
Amounts in the income column in the above table include any capital gain distributions from underlying funds, which are presented in the corresponding line-item in the Consolidated Statement of Operations, if applicable. Amount for Fidelity Securities Lending Cash Central Fund represents the income earned on investing cash collateral, less rebates paid to borrowers and any lending agent fees associated with the loan, plus any premium payments received for lending certain types of securities.
Consolidated Subsidiary
| Fund | Value, beginning of period | Purchases | Sales Proceeds | Dividend Income | Realized Gain/Loss | Change in unrealized appreciation (depreciation) | Value, end of period |
| Fidelity Select Gold Cayman Ltd. | $14,429,238 | $41,891 | $1,299,200 | $-- | $284,760 | $1,818,590 | $15,275,279 |
Other Affiliated Issuers
An affiliated company is a company in which the Fund has ownership of at least 5% of the voting securities. Fiscal year to date transactions with companies which are or were affiliates are as follows:
| Affiliate | Value, beginning of period | Purchases | Sales Proceeds | Dividend Income | Realized Gain (loss) | Change in Unrealized appreciation (depreciation) | Value, end of period |
| Gold Standard Ventures Corp. | $3,745,642 | $14,966,327 | $-- | $-- | $-- | $(665,326) | $18,046,643 |
| Premier Gold Mines Ltd. | 20,806,293 | 1,368,553 | 7,371,242 | -- | (11,012,291) | 13,549,500 | -- |
| Total | $24,551,935 | $16,334,880 | $7,371,242 | $-- | $(11,012,291) | $12,884,174 | $18,046,643 |
Investment Valuation
The following is a summary of the inputs used, as of August 31, 2019, involving the Fund's assets and liabilities carried at fair value. The inputs or methodology used for valuing securities may not be an indication of the risk associated with investing in those securities. For more information on valuation inputs, and their aggregation into the levels used below, please refer to the Investment Valuation section in the accompanying Notes to Consolidated Financial Statements.
| | Valuation Inputs at Reporting Date: |
| Description | Total | Level 1 | Level 2 | Level 3 |
| Investments in Securities: | | | | |
| Common Stocks | $1,936,929,477 | $1,785,540,091 | $151,389,386 | $-- |
| Commodities | 15,252,637 | 15,252,637 | -- | -- |
| Money Market Funds | 27,876,336 | 27,876,336 | -- | -- |
| Total Investments in Securities: | $1,980,058,450 | $1,828,669,064 | $151,389,386 | $-- |
See accompanying notes which are an integral part of the consolidated financial statements.
Gold Portfolio
Consolidated Financial Statements
Consolidated Statement of Assets and Liabilities
| | | August 31, 2019 (Unaudited) |
| Assets | | |
Investment in securities, at value (including securities loaned of $7,728,173) — See accompanying schedule:
Unaffiliated issuers (cost $1,269,251,399) | $1,918,882,834 | |
| Fidelity Central Funds (cost $27,875,923) | 27,876,336 | |
| Commodities (cost $9,320,790) | 15,252,637 | |
| Other affiliated issuers (cost $18,336,365) | 18,046,643 | |
| Total Investment in Securities (cost $1,324,784,477) | | $1,980,058,450 |
| Cash | | 23,554 |
| Foreign currency held at value (cost $1,093,078) | | 1,093,078 |
| Receivable for fund shares sold | | 5,291,636 |
| Dividends receivable | | 2,836,109 |
| Distributions receivable from Fidelity Central Funds | | 83,990 |
| Prepaid expenses | | 11,577 |
| Other receivables | | 113,315 |
| Total assets | | 1,989,511,709 |
| Liabilities | | |
| Payable for investments purchased | $9,108,408 | |
| Payable for fund shares redeemed | 2,150,575 | |
| Accrued management fee | 836,107 | |
| Distribution and service plan fees payable | 76,840 | |
| Other affiliated payables | 319,647 | |
| Other payables and accrued expenses | 170,513 | |
| Collateral on securities loaned | 8,095,586 | |
| Total liabilities | | 20,757,676 |
| Net Assets | | $1,968,754,033 |
| Net Assets consist of: | | |
| Paid in capital | | $2,980,425,072 |
| Total distributable earnings (loss) | | (1,011,671,039) |
| Net Assets | | $1,968,754,033 |
| Net Asset Value and Maximum Offering Price | | |
| Class A: | | |
| Net Asset Value and redemption price per share ($70,154,492 ÷ 2,934,831 shares)(a) | | $23.90 |
| Maximum offering price per share (100/94.25 of $23.90) | | $25.36 |
| Class M: | | |
| Net Asset Value and redemption price per share ($21,528,650 ÷ 922,446 shares)(a) | | $23.34 |
| Maximum offering price per share (100/96.50 of $23.34) | | $24.19 |
| Class C: | | |
| Net Asset Value and offering price per share ($66,307,783 ÷ 2,989,982 shares)(a) | | $22.18 |
| Gold: | | |
| Net Asset Value, offering price and redemption price per share ($1,574,487,453 ÷ 63,873,077 shares) | | $24.65 |
| Class I: | | |
| Net Asset Value, offering price and redemption price per share ($136,369,236 ÷ 5,531,185 shares) | | $24.65 |
| Class Z: | | |
| Net Asset Value, offering price and redemption price per share ($99,906,419 ÷ 4,047,785 shares) | | $24.68 |
(a) Redemption price per share is equal to net asset value less any applicable contingent deferred sales charge.
See accompanying notes which are an integral part of the consolidated financial statements.
Consolidated Statement of Operations
| | | Six months ended August 31, 2019 (Unaudited) |
| Investment Income | | |
| Dividends | | $7,249,825 |
| Special dividends | | 3,377,597 |
| Income from Fidelity Central Funds (including $45,739 from security lending) | | 323,978 |
| Income before foreign taxes withheld | | 10,951,400 |
| Less foreign taxes withheld | | (502,521) |
| Total income | | 10,448,879 |
| Expenses | | |
| Management fee | $3,724,732 | |
| Transfer agent fees | 1,386,688 | |
| Distribution and service plan fees | 415,228 | |
| Accounting and security lending fees | 313,992 | |
| Custodian fees and expenses | 19,180 | |
| Independent trustees' fees and expenses | 3,510 | |
| Registration fees | 72,903 | |
| Audit | 33,224 | |
| Legal | 1,284 | |
| Miscellaneous | 5,565 | |
| Total expenses before reductions | 5,976,306 | |
| Expense reductions | (27,649) | |
| Total expenses after reductions | | 5,948,657 |
| Net investment income (loss) | | 4,500,222 |
| Realized and Unrealized Gain (Loss) | | |
| Net realized gain (loss) on: | | |
| Investments: | | |
| Unaffiliated issuers | (71,491,985) | |
| Fidelity Central Funds | (567) | |
| Other affiliated issuers | (11,012,291) | |
| Commodities | 102,850 | |
| Foreign currency transactions | (139,155) | |
| Total net realized gain (loss) | | (82,541,148) |
| Change in net unrealized appreciation (depreciation) on: | | |
| Investments: | | |
| Investments | 449,495,782 | |
| Fidelity Central Funds | (1) | |
| Other affiliated issuers | 12,884,174 | |
| Assets and liabilities in foreign currencies | 27,543 | |
| Commodities | 1,990,325 | |
| Total change in net unrealized appreciation (depreciation) | | 464,397,823 |
| Net gain (loss) | | 381,856,675 |
| Net increase (decrease) in net assets resulting from operations | | $386,356,897 |
See accompanying notes which are an integral part of the consolidated financial statements.
Consolidated Statement of Changes in Net Assets
| | Six months ended August 31, 2019 (Unaudited) | Year ended February 28, 2019 |
| Increase (Decrease) in Net Assets | | |
| Operations | | |
| Net investment income (loss) | $4,500,222 | $1,072,405 |
| Net realized gain (loss) | (82,541,148) | (221,994,173) |
| Change in net unrealized appreciation (depreciation) | 464,397,823 | 239,641,869 |
| Net increase (decrease) in net assets resulting from operations | 386,356,897 | 18,720,101 |
| Share transactions - net increase (decrease) | 323,068,242 | (6,262,689) |
| Total increase (decrease) in net assets | 709,425,139 | 12,457,412 |
| Net Assets | | |
| Beginning of period | 1,259,328,894 | 1,246,871,482 |
| End of period | $1,968,754,033 | $1,259,328,894 |
See accompanying notes which are an integral part of the consolidated financial statements.
Consolidated Financial Highlights
Gold Portfolio Class A
| | Six months ended (Unaudited) August 31, | Years endedFebruary 28, | | | | |
| | 2019 | 2019 | 2018 | 2017 | 2016A | 2015 |
| Selected Per–Share Data | | | | | | |
| Net asset value, beginning of period | $18.52 | $18.30 | $20.54 | $17.70 | $18.11 | $22.01 |
| Income from Investment Operations | | | | | | |
| Net investment income (loss)B | .04C | (.03) | (.12) | (.16) | (.06) | (.10) |
| Net realized and unrealized gain (loss) | 5.34 | .25 | (2.09) | 3.59 | (.35) | (3.80) |
| Total from investment operations | 5.38 | .22 | (2.21) | 3.43 | (.41) | (3.90) |
| Distributions from net realized gain | – | – | (.03) | (.60) | – | – |
| Total distributions | – | – | (.03) | (.60) | – | – |
| Redemption fees added to paid in capitalB | – | – | – | .01 | –D | –D |
| Net asset value, end of period | $23.90 | $18.52 | $18.30 | $20.54 | $17.70 | $18.11 |
| Total ReturnE,F,G | 29.05% | 1.20% | (10.77)% | 19.97% | (2.26)% | (17.72)% |
| Ratios to Average Net AssetsH,I | | | | | | |
| Expenses before reductions | 1.14%J | 1.19% | 1.18% | 1.19% | 1.23% | 1.23% |
| Expenses net of fee waivers, if any | 1.14%J | 1.18% | 1.16% | 1.16% | 1.20% | 1.19% |
| Expenses net of all reductions | 1.13%J | 1.18% | 1.16% | 1.16% | 1.20% | 1.19% |
| Net investment income (loss) | .37%C,J | (.15)% | (.58)% | (.71)% | (.44)% | (.51)% |
| Supplemental Data | | | | | | |
| Net assets, end of period (000 omitted) | $70,154 | $50,479 | $61,703 | $83,589 | $53,509 | $46,898 |
| Portfolio turnover rateK | 49%J | 37% | 13% | 28% | 20% | 20% |
A For the year ended February 29.
B Calculated based on average shares outstanding during the period.
C Net investment income per share reflects a large, non-recurring dividend which amounted to $.05 per share. Excluding this non-recurring dividend, the ratio of net investment income (loss) to average net assets would have been (.12)%.
D Amount represents less than $.005 per share.
E Total returns for periods of less than one year are not annualized.
F Total returns would have been lower if certain expenses had not been reduced during the applicable periods shown.
G Total returns do not include the effect of the sales charges.
H Fees and expenses of any underlying Fidelity Central Funds are not included in the Fund's expense ratio. The Fund indirectly bears its proportionate share of the expenses of any underlying Fidelity Central Funds.
I Expense ratios reflect operating expenses of the class. Expenses before reductions do not reflect amounts reimbursed by the investment adviser or reductions from brokerage service arrangements or reductions from other expense offset arrangements and do not represent the amount paid by the class during periods when reimbursements or reductions occur. Expenses net of fee waivers reflect expenses after reimbursement by the investment adviser but prior to reductions from brokerage service arrangements or other expense offset arrangements. Expenses net of all reductions represent the net expenses paid by the class.
J Annualized
K Amount does not include the portfolio activity of any underlying Fidelity Central Funds.
See accompanying notes which are an integral part of the consolidated financial statements.
Gold Portfolio Class M
| | Six months ended (Unaudited) August 31, | Years endedFebruary 28, | | | | |
| | 2019 | 2019 | 2018 | 2017 | 2016A | 2015 |
| Selected Per–Share Data | | | | | | |
| Net asset value, beginning of period | $18.11 | $17.94 | $20.19 | $17.37 | $17.83 | $21.73 |
| Income from Investment Operations | | | | | | |
| Net investment income (loss)B | .01C | (.07) | (.17) | (.22) | (.11) | (.15) |
| Net realized and unrealized gain (loss) | 5.22 | .24 | (2.05) | 3.54 | (.35) | (3.75) |
| Total from investment operations | 5.23 | .17 | (2.22) | 3.32 | (.46) | (3.90) |
| Distributions from net realized gain | – | – | (.03) | (.51) | – | – |
| Total distributions | – | – | (.03) | (.51) | – | – |
| Redemption fees added to paid in capitalB | – | – | – | .01 | –D | –D |
| Net asset value, end of period | $23.34 | $18.11 | $17.94 | $20.19 | $17.37 | $17.83 |
| Total ReturnE,F,G | 28.88% | .95% | (11.04)% | 19.62% | (2.58)% | (17.95)% |
| Ratios to Average Net AssetsH,I | | | | | | |
| Expenses before reductions | 1.42%J | 1.48% | 1.48% | 1.49% | 1.52% | 1.50% |
| Expenses net of fee waivers, if any | 1.42%J | 1.46% | 1.47% | 1.46% | 1.48% | 1.46% |
| Expenses net of all reductions | 1.42%J | 1.46% | 1.47% | 1.46% | 1.48% | 1.46% |
| Net investment income (loss) | .08%C,J | (.43)% | (.88)% | (1.01)% | (.72)% | (.79)% |
| Supplemental Data | | | | | | |
| Net assets, end of period (000 omitted) | $21,529 | $17,401 | $19,355 | $25,170 | $17,720 | $16,200 |
| Portfolio turnover rateK | 49%J | 37% | 13% | 28% | 20% | 20% |
A For the year ended February 29.
B Calculated based on average shares outstanding during the period.
C Net investment income per share reflects a large, non-recurring dividend which amounted to $.05 per share. Excluding this non-recurring dividend, the ratio of net investment income (loss) to average net assets would have been (.41)%.
D Amount represents less than $.005 per share.
E Total returns for periods of less than one year are not annualized.
F Total returns would have been lower if certain expenses had not been reduced during the applicable periods shown.
G Total returns do not include the effect of the sales charges.
H Fees and expenses of any underlying Fidelity Central Funds are not included in the Fund's expense ratio. The Fund indirectly bears its proportionate share of the expenses of any underlying Fidelity Central Funds.
I Expense ratios reflect operating expenses of the class. Expenses before reductions do not reflect amounts reimbursed by the investment adviser or reductions from brokerage service arrangements or reductions from other expense offset arrangements and do not represent the amount paid by the class during periods when reimbursements or reductions occur. Expenses net of fee waivers reflect expenses after reimbursement by the investment adviser but prior to reductions from brokerage service arrangements or other expense offset arrangements. Expenses net of all reductions represent the net expenses paid by the class.
J Annualized
K Amount does not include the portfolio activity of any underlying Fidelity Central Funds.
See accompanying notes which are an integral part of the consolidated financial statements.
Gold Portfolio Class C
| | Six months ended (Unaudited) August 31, | Years endedFebruary 28, | | | | |
| | 2019 | 2019 | 2018 | 2017 | 2016A | 2015 |
| Selected Per–Share Data | | | | | | |
| Net asset value, beginning of period | $17.24 | $17.15 | $19.36 | $16.68 | $17.20 | $21.06 |
| Income from Investment Operations | | | | | | |
| Net investment income (loss)B | (.03)C | (.13) | (.24) | (.29) | (.16) | (.23) |
| Net realized and unrealized gain (loss) | 4.97 | .22 | (1.95) | 3.42 | (.36) | (3.63) |
| Total from investment operations | 4.94 | .09 | (2.19) | 3.13 | (.52) | (3.86) |
| Distributions from net realized gain | – | – | (.02) | (.45) | – | – |
| Total distributions | – | – | (.02) | (.45) | – | – |
| Redemption fees added to paid in capitalB | – | – | – | –D | –D | –D |
| Net asset value, end of period | $22.18 | $17.24 | $17.15 | $19.36 | $16.68 | $17.20 |
| Total ReturnE,F,G | 28.65% | .52% | (11.35)% | 19.19% | (3.02)% | (18.33)% |
| Ratios to Average Net AssetsH,I | | | | | | |
| Expenses before reductions | 1.80%J | 1.84% | 1.85% | 1.88% | 1.97% | 1.96% |
| Expenses net of fee waivers, if any | 1.80%J | 1.83% | 1.83% | 1.85% | 1.93% | 1.92% |
| Expenses net of all reductions | 1.80%J | 1.83% | 1.83% | 1.84% | 1.93% | 1.92% |
| Net investment income (loss) | (.30)%C,J | (.80)% | (1.25)% | (1.40)% | (1.17)% | (1.25)% |
| Supplemental Data | | | | | | |
| Net assets, end of period (000 omitted) | $66,308 | $67,760 | $92,724 | $101,215 | $52,732 | $39,429 |
| Portfolio turnover rateK | 49%J | 37% | 13% | 28% | 20% | 20% |
A For the year ended February 29.
B Calculated based on average shares outstanding during the period.
C Net investment income per share reflects a large, non-recurring dividend which amounted to $.04 per share. Excluding this non-recurring dividend, the ratio of net investment income (loss) to average net assets would have been (.78)%.
D Amount represents less than $.005 per share.
E Total returns for periods of less than one year are not annualized.
F Total returns would have been lower if certain expenses had not been reduced during the applicable periods shown.
G Total returns do not include the effect of the contingent deferred sales charge.
H Fees and expenses of any underlying Fidelity Central Funds are not included in the Fund's expense ratio. The Fund indirectly bears its proportionate share of the expenses of any underlying Fidelity Central Funds.
I Expense ratios reflect operating expenses of the class. Expenses before reductions do not reflect amounts reimbursed by the investment adviser or reductions from brokerage service arrangements or reductions from other expense offset arrangements and do not represent the amount paid by the class during periods when reimbursements or reductions occur. Expenses net of fee waivers reflect expenses after reimbursement by the investment adviser but prior to reductions from brokerage service arrangements or other expense offset arrangements. Expenses net of all reductions represent the net expenses paid by the class.
J Annualized
K Amount does not include the portfolio activity of any underlying Fidelity Central Funds.
See accompanying notes which are an integral part of the consolidated financial statements.
Gold Portfolio
| | Six months ended (Unaudited) August 31, | Years endedFebruary 28, | | | | |
| | 2019 | 2019 | 2018 | 2017 | 2016A | 2015 |
| Selected Per–Share Data | | | | | | |
| Net asset value, beginning of period | $19.07 | $18.78 | $21.02 | $18.12 | $18.50 | $22.41 |
| Income from Investment Operations | | | | | | |
| Net investment income (loss)B | .07C | .03 | (.05) | (.09) | (.03) | (.04) |
| Net realized and unrealized gain (loss) | 5.51 | .26 | (2.14) | 3.66 | (.35) | (3.87) |
| Total from investment operations | 5.58 | .29 | (2.19) | 3.57 | (.38) | (3.91) |
| Distributions from net realized gain | – | – | (.05) | (.68) | – | – |
| Total distributions | – | – | (.05) | (.68) | – | – |
| Redemption fees added to paid in capitalB | – | – | – | .01 | –D | –D |
| Net asset value, end of period | $24.65 | $19.07 | $18.78 | $21.02 | $18.12 | $18.50 |
| Total ReturnE,F | 29.26% | 1.54% | (10.47)% | 20.38% | (2.05)% | (17.45)% |
| Ratios to Average Net AssetsG,H | | | | | | |
| Expenses before reductions | .79%I | .86% | .86% | .87% | .97% | .94% |
| Expenses net of fee waivers, if any | .79%I | .85% | .85% | .84% | .93% | .90% |
| Expenses net of all reductions | .79%I | .85% | .84% | .84% | .93% | .90% |
| Net investment income (loss) | .71%C,I | .18% | (.26)% | (.39)% | (.17)% | (.22)% |
| Supplemental Data | | | | | | |
| Net assets, end of period (000 omitted) | $1,574,487 | $1,035,697 | $1,011,412 | $1,271,458 | $1,076,206 | $992,944 |
| Portfolio turnover rateJ | 49%I | 37% | 13% | 28% | 20% | 20% |
A For the year ended February 29.
B Calculated based on average shares outstanding during the period.
C Net investment income per share reflects a large, non-recurring dividend which amounted to $.05 per share. Excluding this non-recurring dividend, the ratio of net investment income (loss) to average net assets would have been .23%.
D Amount represents less than $.005 per share.
E Total returns for periods of less than one year are not annualized.
F Total returns would have been lower if certain expenses had not been reduced during the applicable periods shown.
G Fees and expenses of any underlying Fidelity Central Funds are not included in the Fund's expense ratio. The Fund indirectly bears its proportionate share of the expenses of any underlying Fidelity Central Funds.
H Expense ratios reflect operating expenses of the class. Expenses before reductions do not reflect amounts reimbursed by the investment adviser or reductions from brokerage service arrangements or reductions from other expense offset arrangements and do not represent the amount paid by the class during periods when reimbursements or reductions occur. Expenses net of fee waivers reflect expenses after reimbursement by the investment adviser but prior to reductions from brokerage service arrangements or other expense offset arrangements. Expenses net of all reductions represent the net expenses paid by the class.
I Annualized
J Amount does not include the portfolio activity of any underlying Fidelity Central Funds.
See accompanying notes which are an integral part of the consolidated financial statements.
Gold Portfolio Class I
| | Six months ended (Unaudited) August 31, | Years endedFebruary 28, | | | | |
| | 2019 | 2019 | 2018 | 2017 | 2016A | 2015 |
| Selected Per–Share Data | | | | | | |
| Net asset value, beginning of period | $19.07 | $18.78 | $21.02 | $18.13 | $18.50 | $22.41 |
| Income from Investment Operations | | | | | | |
| Net investment income (loss)B | .07C | .04 | (.05) | (.09) | (.02) | (.04) |
| Net realized and unrealized gain (loss) | 5.51 | .25 | (2.14) | 3.67 | (.35) | (3.87) |
| Total from investment operations | 5.58 | .29 | (2.19) | 3.58 | (.37) | (3.91) |
| Distributions from net realized gain | – | – | (.05) | (.70) | – | – |
| Total distributions | – | – | (.05) | (.70) | – | – |
| Redemption fees added to paid in capitalB | – | – | – | .01 | –D | –D |
| Net asset value, end of period | $24.65 | $19.07 | $18.78 | $21.02 | $18.13 | $18.50 |
| Total ReturnE,F | 29.26% | 1.54% | (10.47)% | 20.41% | (2.00)% | (17.45)% |
| Ratios to Average Net AssetsG,H | | | | | | |
| Expenses before reductions | .79%I | .84% | .85% | .87% | .92% | .90% |
| Expenses net of fee waivers, if any | .79%I | .82% | .83% | .84% | .88% | .86% |
| Expenses net of all reductions | .79%I | .82% | .83% | .84% | .88% | .86% |
| Net investment income (loss) | .71%C,I | .21% | (.24)% | (.39)% | (.12)% | (.18)% |
| Supplemental Data | | | | | | |
| Net assets, end of period (000 omitted) | $136,369 | $84,956 | $61,677 | $58,673 | $52,607 | $23,667 |
| Portfolio turnover rateJ | 49%I | 37% | 13% | 28% | 20% | 20% |
A For the year ended February 29.
B Calculated based on average shares outstanding during the period.
C Net investment income per share reflects a large, non-recurring dividend which amounted to $.05 per share. Excluding this non-recurring dividend, the ratio of net investment income (loss) to average net assets would have been .23%.
D Amount represents less than $.005 per share.
E Total returns for periods of less than one year are not annualized.
F Total returns would have been lower if certain expenses had not been reduced during the applicable periods shown.
G Fees and expenses of any underlying Fidelity Central Funds are not included in the Fund's expense ratio. The Fund indirectly bears its proportionate share of the expenses of any underlying Fidelity Central Funds.
H Expense ratios reflect operating expenses of the class. Expenses before reductions do not reflect amounts reimbursed by the investment adviser or reductions from brokerage service arrangements or reductions from other expense offset arrangements and do not represent the amount paid by the class during periods when reimbursements or reductions occur. Expenses net of fee waivers reflect expenses after reimbursement by the investment adviser but prior to reductions from brokerage service arrangements or other expense offset arrangements. Expenses net of all reductions represent the net expenses paid by the class.
I Annualized
J Amount does not include the portfolio activity of any underlying Fidelity Central Funds.
See accompanying notes which are an integral part of the consolidated financial statements.
Gold Portfolio Class Z
| | Six months ended (Unaudited) August 31, | Year endedFebruary 28, |
| | 2019 | 2019 A |
| Selected Per–Share Data | | |
| Net asset value, beginning of period | $19.08 | $16.62 |
| Income from Investment Operations | | |
| Net investment income (loss)B | .09C | .07 |
| Net realized and unrealized gain (loss) | 5.51 | 2.39 |
| Total from investment operations | 5.60 | 2.46 |
| Distributions from net realized gain | – | – |
| Net asset value, end of period | $24.68 | $19.08 |
| Total ReturnD,E | 29.35% | 14.80% |
| Ratios to Average Net AssetsF,G | | |
| Expenses before reductions | .64%H | .68%H |
| Expenses net of fee waivers, if any | .64%H | .68%H |
| Expenses net of all reductions | .64%H | .67%H |
| Net investment income (loss) | .86%C,H | .97%H |
| Supplemental Data | | |
| Net assets, end of period (000 omitted) | $99,906 | $3,037 |
| Portfolio turnover rateI | 49%H | 37% |
A For the period October 2, 2018 (commencement of sale of shares) to February 28, 2019.
B Calculated based on average shares outstanding during the period.
C Net investment income per share reflects a large, non-recurring dividend which amounted to $.05 per share. Excluding this non-recurring dividend, the ratio of net investment income (loss) to average net assets would have been .38%.
D Total returns for periods of less than one year are not annualized.
E Total returns would have been lower if certain expenses had not been reduced during the applicable periods shown.
F Fees and expenses of any underlying Fidelity Central Funds are not included in the Fund's expense ratio. The Fund indirectly bears its proportionate share of the expenses of any underlying Fidelity Central Funds.
G Expense ratios reflect operating expenses of the class. Expenses before reductions do not reflect amounts reimbursed by the investment adviser or reductions from brokerage service arrangements or reductions from other expense offset arrangements and do not represent the amount paid by the class during periods when reimbursements or reductions occur. Expense ratios before reductions for start-up periods may not be representative of longer-term operating periods. Expenses net of fee waivers reflect expenses after reimbursement by the investment adviser but prior to reductions from brokerage service arrangements or other expense offset arrangements. Expenses net of all reductions represent the net expenses paid by the class.
H Annualized
I Amount does not include the portfolio activity of any underlying Fidelity Central Funds.
See accompanying notes which are an integral part of the consolidated financial statements.
Notes to Consolidated Financial Statements (Unaudited)
For the period ended August 31, 2019
1. Organization.
Gold Portfolio (the Fund) is a non-diversified fund of Fidelity Select Portfolios (the Trust) and is authorized to issue an unlimited number of shares. The Trust is registered under the Investment Company Act of 1940, as amended (the 1940 Act), as an open-end management investment company organized as a Massachusetts business trust. The Fund invests primarily in securities of companies whose principal business activities fall within specific industries. The Fund commenced sale of Class Z shares on October 2, 2018. The Fund offers Class A, Class M, Class C, Gold, Class I and Class Z shares, each of which has equal rights as to assets and voting privileges. Each class has exclusive voting rights with respect to matters that affect that class.
Effective March 1, 2019, Class C shares will automatically convert to Class A shares after a holding period of ten years from the initial date of purchase, with certain exceptions.
2. Consolidated Subsidiary.
The Fund invests in certain commodity-related investments through Fidelity Select Gold Cayman Ltd., a wholly owned subsidiary (the "Subsidiary"). As of period end, the Fund held an investment of $15,275,279 in the Subsidiary, representing 0.8% of the Fund's net assets.
The financial statements have been consolidated and include accounts of the Fund and the Subsidiary. Accordingly, all inter-company transactions and balances have been eliminated.
3. Investments in Fidelity Central Funds.
The Fund invests in Fidelity Central Funds, which are open-end investment companies generally available only to other investment companies and accounts managed by the investment adviser and its affiliates. The Fund's Consolidated Schedule of Investments lists each of the Fidelity Central Funds held as of period end, if any, as an investment of the Fund, but does not include the underlying holdings of each Fidelity Central Fund. As an Investing Fund, the Fund indirectly bears its proportionate share of the expenses of the underlying Fidelity Central Funds.
The Money Market Central Funds seek preservation of capital and current income and are managed by Fidelity Investments Money Management, Inc. (FIMM), an affiliate of the investment adviser. Annualized expenses of the Money Market Central Funds as of their most recent shareholder report date ranged from less than .005% to .01%.
A complete unaudited list of holdings for each Fidelity Central Fund is available upon request or at the Securities and Exchange Commission (the SEC) website at www.sec.gov. In addition, the financial statements of the Fidelity Central Funds are available on the SEC website or upon request.
4. Significant Accounting Policies.
The Fund is an investment company and applies the accounting and reporting guidance of the Financial Accounting Standards Board (FASB) Accounting Standards Codification Topic 946 Financial Services – Investments Companies. The consolidated financial statements have been prepared in conformity with accounting principles generally accepted in the United States of America (GAAP), which require management to make certain estimates and assumptions at the date of the consolidated financial statements. Actual results could differ from those estimates. Subsequent events, if any, through the date that the consolidated financial statements were issued have been evaluated in the preparation of the consolidated financial statements. The following summarizes the significant accounting policies of the Fund:
Investment Valuation. Investments are valued as of 4:00 p.m. Eastern time on the last calendar day of the period. The Board of Trustees (the Board) has delegated the day to day responsibility for the valuation of the Fund's investments to the Fair Value Committee (the Committee) established by the Fund's investment adviser. In accordance with valuation policies and procedures approved by the Board, the Fund attempts to obtain prices from one or more third party pricing vendors or brokers to value its investments. When current market prices, quotations or currency exchange rates are not readily available or reliable, investments will be fair valued in good faith by the Committee, in accordance with procedures adopted by the Board. Factors used in determining fair value vary by investment type and may include market or investment specific events. The frequency with which these procedures are used cannot be predicted and they may be utilized to a significant extent. The Committee oversees the Fund's valuation policies and procedures and reports to the Board on the Committee's activities and fair value determinations. The Board monitors the appropriateness of the procedures used in valuing the Fund's investments and ratifies the fair value determinations of the Committee.
The Fund categorizes the inputs to valuation techniques used to value its investments into a disclosure hierarchy consisting of three levels as shown below:
- Level 1 – quoted prices in active markets for identical investments
- Level 2 – other significant observable inputs (including quoted prices for similar investments, interest rates, prepayment speeds, etc.)
- Level 3 – unobservable inputs (including the Fund's own assumptions based on the best information available)
Valuation techniques used to value the Fund's investments by major category are as follows:
Equity securities, including restricted securities, for which market quotations are readily available, are valued at the last reported sale price or official closing price as reported by a third party pricing vendor on the primary market or exchange on which they are traded and are categorized as Level 1 in the hierarchy. In the event there were no sales during the day or closing prices are not available, securities are valued at the last quoted bid price or may be valued using the last available price and are generally categorized as Level 2 in the hierarchy. For foreign equity securities, when market or security specific events arise, comparisons to the valuation of American Depositary Receipts (ADRs), futures contracts, Exchange-Traded Funds (ETFs) and certain indexes as well as quoted prices for similar securities may be used and would be categorized as Level 2 in the hierarchy. For equity securities, including restricted securities, where observable inputs are limited, assumptions about market activity and risk are used and these securities may be categorized as Level 3 in the hierarchy.
Investments in commodities are valued at their last traded price at 4:00 p.m. Eastern time each business day and are categorized as Level 1 in the hierarchy. Investments in open-end mutual funds, including the Fidelity Central Funds, are valued at their closing net asset value (NAV) each business day and are categorized as Level 1 in the hierarchy.
Changes in valuation techniques may result in transfers in or out of an assigned level within the disclosure hierarchy. The aggregate value of investments by input level as of August 31, 2019, is included at the end of the Fund's Consolidated Schedule of Investments.
Foreign Currency. The Fund may use foreign currency contracts to facilitate transactions in foreign-denominated securities. Gains and losses from these transactions may arise from changes in the value of the foreign currency or if the counterparties do not perform under the contracts' terms.
Foreign-denominated assets, including investment securities, and liabilities are translated into U.S. dollars at the exchange rates at period end. Purchases and sales of investment securities, income and dividends received and expenses denominated in foreign currencies are translated into U.S. dollars at the exchange rate in effect on the transaction date.
The effects of exchange rate fluctuations on investments are included with the net realized and unrealized gain (loss) on investment securities. Other foreign currency transactions resulting in realized and unrealized gain (loss) are disclosed separately.
Investment Transactions and Income. For financial reporting purposes, the Fund's investment holdings and NAV include trades executed through the end of the last business day of the period. The NAV per share for processing shareholder transactions is calculated as of the close of business of the New York Stock Exchange (NYSE), normally 4:00 p.m. Eastern time and includes trades executed through the end of the prior business day. Gains and losses on securities sold are determined on the basis of identified cost and include proceeds received from litigation. Dividend income is recorded on the ex-dividend date, except for certain dividends from foreign securities where the ex-dividend date may have passed, which are recorded as soon as the Fund is informed of the ex-dividend date. Non-cash dividends included in dividend income, if any, are recorded at the fair market value of the securities received. Income and capital gain distributions from Fidelity Central Funds, if any, are recorded on the ex-dividend date. Certain distributions received by the Fund represent a return of capital or capital gain. The Fund determines the components of these distributions subsequent to the ex-dividend date, based upon receipt of tax filings or other correspondence relating to the underlying investment. These distributions are recorded as a reduction of cost of investments and/or as a realized gain. Large, non-recurring dividends recognized by the Fund are presented separately on the Statement of Operations as "Special Dividends" and the impact of these dividends is presented in the Financial Highlights. Investment income is recorded net of foreign taxes withheld where recovery of such taxes is uncertain.
Class Allocations and Expenses. Investment income, realized and unrealized capital gains and losses, common expenses of the Fund, and certain fund-level expense reductions, if any, are allocated daily on a pro-rata basis to each class based on the relative net assets of each class to the total net assets of the Fund. Each class differs with respect to transfer agent and distribution and service plan fees incurred. Certain expense reductions may also differ by class. For the reporting period, the allocated portion of income and expenses to each class as a percent of its average net assets may vary due to the timing of recording these transactions in relation to fluctuating net assets of the classes. Expenses directly attributable to a fund are charged to that fund. Expenses attributable to more than one fund are allocated among the respective funds on the basis of relative net assets or other appropriate methods. Expense estimates are accrued in the period to which they relate and adjustments are made when actual amounts are known.
Deferred Trustee Compensation. Under a Deferred Compensation Plan (the Plan) for the Fund, certain independent Trustees have elected to defer receipt of a portion of their annual compensation. Deferred amounts are invested in a cross-section of Fidelity funds, are marked-to-market and remain in the Fund until distributed in accordance with the Plan. The investment of deferred amounts and the offsetting payable to the Trustees of $103,897 are included in the accompanying Statement of Assets and Liabilities in other receivables and other payables and accrued expenses, respectively.
Income Tax Information and Distributions to Shareholders. Each year, the Fund intends to qualify as a regulated investment company under Subchapter M of the Internal Revenue Code, including distributing substantially all of its taxable income and realized gains. As a result, no provision for U.S. Federal income taxes is required. The Fund files a U.S. federal tax return, in addition to state and local tax returns as required. The Fund's federal income tax returns are subject to examination by the Internal Revenue Service (IRS) for a period of three fiscal years after they are filed. State and local tax returns may be subject to examination for an additional fiscal year depending on the jurisdiction. Foreign taxes are provided for based on the Fund's understanding of the tax rules and rates that exist in the foreign markets in which it invests.
The Subsidiary is classified as a controlled foreign corporation under Subchapter N of the Internal Revenue Code. Therefore, the Fund is required to increase its taxable income by its share of the Subsidiary's income. Net investment losses of the Subsidiary cannot be deducted by the Fund in the current period nor carried forward to offset taxable income in future periods.
Distributions are declared and recorded on the ex-dividend date. Income and capital gain distributions are declared separately for each class. Income and capital gain distributions are determined in accordance with income tax regulations, which may differ from GAAP.
Capital accounts within the consolidated financial statements are adjusted for permanent book-tax differences. These adjustments have no impact on net assets or the results of operations. Capital accounts are not adjusted for temporary book-tax differences which will reverse in a subsequent period.
Book-tax differences are primarily due to foreign currency transactions, passive foreign investment companies (PFIC), controlled foreign corporations, deferred trustees compensation, net operating losses, capital loss carryforwards and losses deferred due to wash sales and excise tax regulations.
As of period end, the cost and unrealized appreciation (depreciation) in securities, and derivatives if applicable, for federal income tax purposes on an unconsolidated basis were as follows:
| Gross unrealized appreciation | $644,249,803 |
| Gross unrealized depreciation | (23,835,827) |
| Net unrealized appreciation (depreciation) | $620,413,976 |
| Tax cost | $1,359,644,474 |
Capital loss carryforwards are only available to offset future capital gains of the Fund to the extent provided by regulations and may be limited. Under the Regulated Investment Company Modernization Act of 2010 (the Act), the Fund is permitted to carry forward capital losses incurred in taxable years beginning after December 22, 2010 for an unlimited period and such capital losses are required to be used prior to any losses that expire. The capital loss carryforward information presented below, including any applicable limitation, is estimated as of prior fiscal period end and is subject to adjustment.
| No expiration | |
| Short-term | $(147,410,277) |
| Long-term | (1,363,936,257) |
| Total capital loss carryforward | $(1,511,346,534) |
Restricted Securities. The Fund may invest in securities that are subject to legal or contractual restrictions on resale. These securities generally may be resold in transactions exempt from registration or to the public if the securities are registered. Disposal of these securities may involve time-consuming negotiations and expense, and prompt sale at an acceptable price may be difficult. Information regarding restricted securities is included at the end of the Fund's Consolidated Schedule of Investments.
5. Purchases and Sales of Investments.
Purchases and sales of securities, other than short-term securities, aggregated $655,664,981 and $338,529,439, respectively.
6. Fees and Other Transactions with Affiliates.
Management Fee. Fidelity SelectCo, LLC (the investment adviser) and its affiliates provide the Fund with investment management related services for which the Fund pays a monthly management fee. The management fee is the sum of an individual fund fee rate that is based on an annual rate of .30% of the Fund's average net assets and an annualized group fee rate that averaged .24% during the period. The group fee rate is based upon the average net assets of all the mutual funds advised by Fidelity Management & Research Company (FMR) and the investment adviser. The group fee rate decreases as assets under management increase and increases as assets under management decrease. For the reporting period, the total annualized management fee rate was .53% of the Fund's average net assets.
FMR, either through itself or through an affiliate provides investment management related services to the Subsidiary. The Subsidiary does not pay the investment adviser a fee for these services. Under the management contract with the subsidiary, FMR pays all other expenses of the Subsidiary, except custodian fees.
Distribution and Service Plan Fees. In accordance with Rule 12b-1 of the 1940 Act, the Fund has adopted separate Distribution and Service Plans for each class of shares. Certain classes pay Fidelity Distributors Corporation (FDC), an affiliate of the investment adviser, separate Distribution and Service Fees, each of which is based on an annual percentage of each class' average net assets. In addition, FDC may pay financial intermediaries for selling shares of the Fund and providing shareholder support services. For the period, the Distribution and Service Fee rates, total fees and amounts retained by FDC were as follows:
| | Distribution Fee | Service Fee | Total Fees | Retained by FDC |
| Class A | -% | .25% | $69,762 | $3,267 |
| Class M | .25% | .25% | 44,654 | – |
| Class C | .75% | .25% | 300,812 | 18,180 |
| | | | $415,228 | $21,447 |
Sales Load. FDC may receive a front-end sales charge of up to 5.75% for selling Class A shares and 3.50% for selling Class M shares, some of which is paid to financial intermediaries for selling shares of the Fund. Depending on the holding period, FDC may receive contingent deferred sales charges levied on Class A, Class M and Class C redemptions. The deferred sales charges are 1.00% for Class C shares, 1.00% for certain purchases of Class A shares and .25% for certain purchases of Class M shares.
For the period, sales charge amounts retained by FDC were as follows:
| | Retained by FDC |
| Class A | $15,432 |
| Class M | 2,515 |
| Class C(a) | 8,544 |
| | $26,491 |
(a) When Class C shares are initially sold, FDC pays commissions from its own resources to financial intermediaries through which the sales are made.
Transfer Agent Fees. Fidelity Investments Institutional Operations Company, Inc., (FIIOC), an affiliate of the investment adviser, is the transfer, dividend disbursing and shareholder servicing agent for each class of the Fund. FIIOC receives account fees and asset-based fees that vary according to the account size and type of account of the shareholders of the respective classes of the Fund, except for Class Z. FIIOC receives an asset-based fee of Class Z's average net assets. FIIOC pays for typesetting, printing and mailing of shareholder reports, except proxy statements.
For the period, transfer agent fees for each class were as follows:
| | Amount | % of Class-Level Average Net Assets(a) |
| Class A | $80,882 | .29 |
| Class M | 29,154 | .33 |
| Class C | 60,725 | .20 |
| Gold | 1,115,476 | .19 |
| Class I | 98,020 | .19 |
| Class Z | 2,431 | .04 |
| | $1,386,688 | |
(a) Annualized
Accounting and Security Lending Fees. Fidelity Service Company, Inc. (FSC), an affiliate of the investment adviser, maintains the Fund's accounting records. The accounting fee is based on the level of average net assets for each month. Prior to April 1, 2019, FSC had a separate agreement with the Fund for administration of the security lending program, based on the number and duration of lending transactions. For the period, the total fees paid for accounting and administration of securities lending were equivalent to an annualized rate of .05%.
Brokerage Commissions. The Fund placed a portion of its portfolio transactions with brokerage firms which are affiliates of the investment adviser. Brokerage commissions are included in net realized gain (loss) and change in net unrealized appreciation (depreciation) in the Consolidated Statement of Operations. The commissions paid to these affiliated firms were $5,526 for the period.
Interfund Trades. The Fund may purchase from or sell securities to other Fidelity Funds under procedures adopted by the Board. The procedures have been designed to ensure these interfund trades are executed in accordance with Rule 17a-7 of the 1940 Act. Interfund trades are included within the respective purchases and sales amounts shown in the Purchases and Sales of Investments note.
7. Committed Line of Credit.
The Fund participates with other funds managed by the investment adviser or an affiliate in a $4.25 billion credit facility (the "line of credit") to be utilized for temporary or emergency purposes to fund shareholder redemptions or for other short-term liquidity purposes. The Fund has agreed to pay commitment fees on its pro-rata portion of the line of credit, which amounted to $1,679 and is reflected in Miscellaneous expenses on the Consolidated Statement of Operations. During the period, the Fund did not borrow on this line of credit.
8. Security Lending.
The Fund lends portfolio securities from time to time in order to earn additional income. For equity securities, lending agents are used, including National Financial Services (NFS), an affiliate of the Fund. Pursuant to a securities lending agreement, NFS will receive a fee, which is capped at 9.9% of daily lending revenue, for its services as lending agent. The Fund may lend securities to certain qualified borrowers. On the settlement date of the loan, the Fund receives collateral (in the form of U.S. Treasury obligations, letters of credit and/or cash) against the loaned securities and maintains collateral in an amount not less than 100% of the market value of the loaned securities during the period of the loan. The market value of the loaned securities is determined at the close of business of the Fund and any additional required collateral is delivered to the Fund on the next business day. The Fund or borrower may terminate the loan at any time, and if the borrower defaults on its obligation to return the securities loaned because of insolvency or other reasons, the Fund may apply collateral received from the borrower against the obligation. The Fund may experience delays and costs in recovering the securities loaned. Any cash collateral received is invested in the Fidelity Securities Lending Cash Central Fund. The value of loaned securities and cash collateral at period end are disclosed on the Fund's Consolidated Statement of Assets and Liabilities. Security lending income represents the income earned on investing cash collateral, less rebates paid to borrowers and any lending agent fees associated with the loan, plus any premium payments received for lending certain types of securities. Security lending income is presented in the Consolidated Statement of Operations as a component of income from Fidelity Central Funds.
9. Expense Reductions.
Commissions paid to certain brokers with whom the investment adviser, or its affiliates, places trades on behalf of the Fund include an amount in addition to trade execution, which may be rebated back to the Fund to offset certain expenses. This amount totaled $20,983 for the period. In addition, through arrangements with the Fund's custodian and each class' transfer agent, credits realized as a result of certain uninvested cash balances were used to reduce the Fund's expenses. During the period, custodian credits reduced the Fund's expenses by $1,897. During the period, transfer agent credits reduced each class' expenses as noted in the table below.
| | Expense reduction |
| Gold | $167 |
In addition, during the period the investment adviser reimbursed and/or waived a portion of fund-level operating expenses in the amount of $4,602.
10. Share Transactions.
Share transactions for each class were as follows and may contain automatic conversions between classes or exchanges between affiliated funds:
| | Shares | Shares | Dollars | Dollars |
| | Six months ended August 31, 2019 | Year ended February 28, 2019(a) | Six months ended August 31, 2019 | Year ended February 28, 2019(a) |
| Class A | | | | |
| Shares sold | 594,244 | 562,437 | $12,167,668 | $9,909,468 |
| Shares redeemed | (384,748) | (1,208,833) | (7,712,430) | (21,611,552) |
| Net increase (decrease) | 209,496 | (646,396) | $4,455,238 | $(11,702,084) |
| Class M | | | | |
| Shares sold | 123,263 | 229,723 | $2,501,995 | $3,924,126 |
| Shares redeemed | (161,657) | (347,502) | (3,092,482) | (6,015,227) |
| Net increase (decrease) | (38,394) | (117,779) | $(590,487) | $(2,091,101) |
| Class C | | | | |
| Shares sold | 201,711 | 752,482 | $4,039,404 | $12,855,428 |
| Shares redeemed | (1,141,918) | (2,230,268) | (20,562,212) | (35,991,400) |
| Net increase (decrease) | (940,207) | (1,477,786) | $(16,522,808) | $(23,135,972) |
| Gold | | | | |
| Shares sold | 24,841,670 | 18,855,174 | $547,096,104 | $336,678,749 |
| Shares redeemed | (15,282,055) | (18,402,999) | (325,392,576) | (329,426,640) |
| Net increase (decrease) | 9,559,615 | 452,175 | $221,703,528 | $7,252,109 |
| Class I | | | | |
| Shares sold | 1,872,532 | 2,830,267 | $38,788,189 | $50,462,127 |
| Shares redeemed | (796,040) | (1,660,500) | (16,510,988) | (29,601,141) |
| Net increase (decrease) | 1,076,492 | 1,169,767 | $22,277,201 | $20,860,986 |
| Class Z | | | | |
| Shares sold | 4,049,746 | 368,708 | $95,294,874 | $6,495,798 |
| Shares redeemed | (161,119) | (209,550) | (3,549,304) | (3,942,425) |
| Net increase (decrease) | 3,888,627 | 159,158 | $91,745,570 | $2,553,373 |
(a) Share transactions for Class Z are for the period October 2, 2018 (commencement of sale of shares) to February 28, 2019.
11. Other.
The Fund's organizational documents provide former and current trustees and officers with a limited indemnification against liabilities arising in connection with the performance of their duties to the Fund. In the normal course of business, the Fund may also enter into contracts that provide general indemnifications. The Fund's maximum exposure under these arrangements is unknown as this would be dependent on future claims that may be made against the Fund. The risk of material loss from such claims is considered remote.
Materials Portfolio
Investment Summary (Unaudited)
Top Ten Stocks as of August 31, 2019
| | % of fund's net assets |
| Linde PLC | 14.3 |
| DowDuPont, Inc. | 10.2 |
| Air Products & Chemicals, Inc. | 7.1 |
| Corteva, Inc. | 5.5 |
| Olin Corp. | 5.4 |
| Sherwin-Williams Co. | 5.2 |
| The Chemours Co. LLC | 5.0 |
| Ecolab, Inc. | 4.3 |
| Crown Holdings, Inc. | 4.0 |
| Vulcan Materials Co. | 3.9 |
| | 64.9 |
Top Industries (% of fund's net assets)
| As of August 31, 2019 |
| | Chemicals | 63.9% |
| | Containers & Packaging | 13.8% |
| | Construction Materials | 8.1% |
| | Pharmaceuticals | 5.5% |
| | Metals & Mining | 5.0% |
| | All Others* | 3.7% |

* Includes short-term investments and net other assets (liabilities).
Materials Portfolio
Schedule of Investments August 31, 2019 (Unaudited)
Showing Percentage of Net Assets
| Common Stocks - 99.5% | | | |
| | | Shares | Value |
| Chemicals - 63.9% | | | |
| Commodity Chemicals - 7.1% | | | |
| Cabot Corp. | | 65,456 | $2,618,240 |
| Olin Corp. | | 2,829,450 | 48,044,061 |
| Orion Engineered Carbons SA | | 714,073 | 9,932,755 |
| Westlake Chemical Corp. | | 43,942 | 2,574,562 |
| | | | 63,169,618 |
| Diversified Chemicals - 16.9% | | | |
| DowDuPont, Inc. | | 1,330,111 | 90,354,440 |
| Huntsman Corp. | | 237,800 | 4,736,976 |
| Ingevity Corp. (a) | | 127,100 | 9,681,207 |
| The Chemours Co. LLC (b) | | 3,126,180 | 44,297,971 |
| | | | 149,070,594 |
| Fertilizers & Agricultural Chemicals - 1.4% | | | |
| CF Industries Holdings, Inc. | | 255,300 | 12,302,907 |
| Industrial Gases - 21.4% | | | |
| Air Products & Chemicals, Inc. | | 277,100 | 62,602,432 |
| Linde PLC | | 670,286 | 126,623,727 |
| | | | 189,226,159 |
| Specialty Chemicals - 17.1% | | | |
| Ecolab, Inc. | | 184,100 | 37,981,671 |
| Element Solutions, Inc. (a) | | 249,715 | 2,329,841 |
| International Flavors & Fragrances, Inc. (b) | | 264,931 | 29,076,177 |
| PolyOne Corp. | | 90,500 | 2,896,905 |
| Sherwin-Williams Co. | | 87,700 | 46,195,975 |
| Tronox Holdings PLC | | 2,172,103 | 16,138,725 |
| W.R. Grace & Co. | | 251,200 | 17,008,752 |
| | | | 151,628,046 |
|
| TOTAL CHEMICALS | | | 565,397,324 |
|
| Commercial Services & Supplies - 1.3% | | | |
| Environmental & Facility Services - 1.3% | | | |
| Waste Connection, Inc. (United States) | | 128,200 | 11,781,580 |
| Construction Materials - 8.1% | | | |
| Construction Materials - 8.1% | | | |
| Martin Marietta Materials, Inc. | | 135,200 | 34,309,704 |
| Summit Materials, Inc. (a) | | 127,900 | 2,683,342 |
| Vulcan Materials Co. | | 248,000 | 35,030,000 |
| | | | 72,023,046 |
| Containers & Packaging - 13.8% | | | |
| Metal & Glass Containers - 10.5% | | | |
| Aptargroup, Inc. | | 195,500 | 23,894,010 |
| Ball Corp. | | 419,100 | 33,699,831 |
| Crown Holdings, Inc. (a) | | 537,559 | 35,392,885 |
| | | | 92,986,726 |
| Paper Packaging - 3.3% | | | |
| Avery Dennison Corp. | | 250,200 | 28,915,614 |
|
| TOTAL CONTAINERS & PACKAGING | | | 121,902,340 |
|
| Metals & Mining - 5.0% | | | |
| Gold - 5.0% | | | |
| Newmont Goldcorp Corp. | | 859,200 | 34,273,488 |
| Royal Gold, Inc. | | 70,900 | 9,456,642 |
| | | | 43,730,130 |
| Pharmaceuticals - 5.5% | | | |
| Pharmaceuticals - 5.5% | | | |
| Corteva, Inc. | | 1,648,211 | 48,325,547 |
| Trading Companies & Distributors - 1.9% | | | |
| Trading Companies & Distributors - 1.9% | | | |
| Univar, Inc. (a) | | 886,933 | 17,162,154 |
| TOTAL COMMON STOCKS | | | |
| (Cost $874,425,230) | | | 880,322,121 |
|
| Money Market Funds - 4.5% | | | |
| Fidelity Cash Central Fund 2.13% (c) | | 842,563 | 842,732 |
| Fidelity Securities Lending Cash Central Fund 2.13% (c)(d) | | 39,261,530 | 39,265,456 |
| TOTAL MONEY MARKET FUNDS | | | |
| (Cost $40,108,188) | | | 40,108,188 |
| TOTAL INVESTMENT IN SECURITIES - 104.0% | | | |
| (Cost $914,533,418) | | | 920,430,309 |
| NET OTHER ASSETS (LIABILITIES) - (4.0)% | | | (35,258,606) |
| NET ASSETS - 100% | | | $885,171,703 |
Legend
(a) Non-income producing
(b) Security or a portion of the security is on loan at period end.
(c) Affiliated fund that is generally available only to investment companies and other accounts managed by Fidelity Investments. The rate quoted is the annualized seven-day yield of the fund at period end. A complete unaudited listing of the fund's holdings as of its most recent quarter end is available upon request. In addition, each Fidelity Central Fund's financial statements are available on the SEC's website or upon request.
(d) Investment made with cash collateral received from securities on loan.
Affiliated Central Funds
Information regarding fiscal year to date income earned by the Fund from investments in Fidelity Central Funds is as follows:
| Fund | Income earned |
| Fidelity Cash Central Fund | $26,505 |
| Fidelity Securities Lending Cash Central Fund | 24,300 |
| Total | $50,805 |
Amounts in the income column in the above table include any capital gain distributions from underlying funds, which are presented in the corresponding line-item in the Statement of Operations, if applicable. Amount for Fidelity Securities Lending Cash Central Fund represents the income earned on investing cash collateral, less rebates paid to borrowers and any lending agent fees associated with the loan, plus any premium payments received for lending certain types of securities.
Investment Valuation
All investments are categorized as Level 1 under the Fair Value Hierarchy. The inputs or methodology used for valuing securities may not be an indication of the risk associated with investing in those securities. For more information on valuation inputs please refer to the Investment Valuation section in the accompanying Notes to Financial Statements.
Other Information
Distribution of investments by country or territory of incorporation, as a percentage of Total Net Assets, is as follows (Unaudited):
| United States of America | 81.5% |
| Ireland | 14.3% |
| United Kingdom | 1.8% |
| Canada | 1.3% |
| Luxembourg | 1.1% |
| | 100.0% |
See accompanying notes which are an integral part of the financial statements.
Materials Portfolio
Financial Statements
Statement of Assets and Liabilities
| | | August 31, 2019 (Unaudited) |
| Assets | | |
Investment in securities, at value (including securities loaned of $38,880,379) — See accompanying schedule:
Unaffiliated issuers (cost $874,425,230) | $880,322,121 | |
| Fidelity Central Funds (cost $40,108,188) | 40,108,188 | |
| Total Investment in Securities (cost $914,533,418) | | $920,430,309 |
| Foreign currency held at value (cost $19,367) | | 19,342 |
| Receivable for investments sold | | 2,687,600 |
| Receivable for fund shares sold | | 209,620 |
| Dividends receivable | | 3,356,007 |
| Distributions receivable from Fidelity Central Funds | | 5,238 |
| Prepaid expenses | | 15,113 |
| Other receivables | | 153,037 |
| Total assets | | 926,876,266 |
| Liabilities | | |
| Payable for investments purchased | $5,602 | |
| Payable for fund shares redeemed | 1,627,861 | |
| Accrued management fee | 397,495 | |
| Distribution and service plan fees payable | 59,425 | |
| Other affiliated payables | 194,858 | |
| Other payables and accrued expenses | 159,867 | |
| Collateral on securities loaned | 39,259,455 | |
| Total liabilities | | 41,704,563 |
| Net Assets | | $885,171,703 |
| Net Assets consist of: | | |
| Paid in capital | | $903,570,899 |
| Total distributable earnings (loss) | | (18,399,196) |
| Net Assets | | $885,171,703 |
| Net Asset Value and Maximum Offering Price | | |
| Class A: | | |
| Net Asset Value and redemption price per share ($99,447,354 ÷ 1,529,656 shares)(a) | | $65.01 |
| Maximum offering price per share (100/94.25 of $65.01) | | $68.98 |
| Class M: | | |
| Net Asset Value and redemption price per share ($24,332,997 ÷ 378,010 shares)(a) | | $64.37 |
| Maximum offering price per share (100/96.50 of $64.37) | | $66.70 |
| Class C: | | |
| Net Asset Value and offering price per share ($33,240,891 ÷ 531,861 shares)(a) | | $62.50 |
| Materials: | | |
| Net Asset Value, offering price and redemption price per share ($514,334,928 ÷ 7,869,781 shares) | | $65.36 |
| Class I: | | |
| Net Asset Value, offering price and redemption price per share ($196,035,030 ÷ 3,005,364 shares) | | $65.23 |
| Class Z: | | |
| Net Asset Value, offering price and redemption price per share ($17,780,503 ÷ 272,860 shares) | | $65.16 |
(a) Redemption price per share is equal to net asset value less any applicable contingent deferred sales charge.
See accompanying notes which are an integral part of the financial statements.
Statement of Operations
| | | Six months ended August 31, 2019 (Unaudited) |
| Investment Income | | |
| Dividends | | $11,251,594 |
| Income from Fidelity Central Funds (including $24,300 from security lending) | | 50,805 |
| Total income | | 11,302,399 |
| Expenses | | |
| Management fee | $2,663,289 | |
| Transfer agent fees | 1,067,705 | |
| Distribution and service plan fees | 412,276 | |
| Accounting and security lending fees | 165,379 | |
| Custodian fees and expenses | 5,376 | |
| Independent trustees' fees and expenses | 2,855 | |
| Registration fees | 47,126 | |
| Audit | 25,691 | |
| Legal | 1,150 | |
| Interest | 3,874 | |
| Miscellaneous | 6,210 | |
| Total expenses before reductions | 4,400,931 | |
| Expense reductions | (35,788) | |
| Total expenses after reductions | | 4,365,143 |
| Net investment income (loss) | | 6,937,256 |
| Realized and Unrealized Gain (Loss) | | |
| Net realized gain (loss) on: | | |
| Investment securities: | | |
| Unaffiliated issuers | (17,836,573) | |
| Fidelity Central Funds | 5,841 | |
| Foreign currency transactions | 47,007 | |
| Total net realized gain (loss) | | (17,783,725) |
| Change in net unrealized appreciation (depreciation) on: | | |
| Investment securities: | | |
| Unaffiliated issuers | (53,887,678) | |
| Assets and liabilities in foreign currencies | (9,394) | |
| Total change in net unrealized appreciation (depreciation) | | (53,897,072) |
| Net gain (loss) | | (71,680,797) |
| Net increase (decrease) in net assets resulting from operations | | $(64,743,541) |
See accompanying notes which are an integral part of the financial statements.
Statement of Changes in Net Assets
| | Six months ended August 31, 2019 (Unaudited) | Year ended February 28, 2019 |
| Increase (Decrease) in Net Assets | | |
| Operations | | |
| Net investment income (loss) | $6,937,256 | $18,081,625 |
| Net realized gain (loss) | (17,783,725) | 91,013,519 |
| Change in net unrealized appreciation (depreciation) | (53,897,072) | (319,877,443) |
| Net increase (decrease) in net assets resulting from operations | (64,743,541) | (210,782,299) |
| Distributions to shareholders | – | (148,511,389) |
| Share transactions - net increase (decrease) | (146,399,783) | (426,989,061) |
| Total increase (decrease) in net assets | (211,143,324) | (786,282,749) |
| Net Assets | | |
| Beginning of period | 1,096,315,027 | 1,882,597,776 |
| End of period | $885,171,703 | $1,096,315,027 |
See accompanying notes which are an integral part of the financial statements.
Financial Highlights
Materials Portfolio Class A
| | Six months ended (Unaudited) August 31, | Years endedFebruary 28, | | | | |
| | 2019 | 2019 | 2018 | 2017 | 2016A | 2015 |
| Selected Per–Share Data | | | | | | |
| Net asset value, beginning of period | $69.57 | $88.50 | $81.27 | $62.94 | $80.43 | $86.46 |
| Income from Investment Operations | | | | | | |
| Net investment income (loss)B | .41 | .84 | .55 | .70 | .79 | .51 |
| Net realized and unrealized gain (loss) | (4.97) | (12.01) | 11.18 | 18.26 | (16.80) | 1.05 |
| Total from investment operations | (4.56) | (11.17) | 11.73 | 18.96 | (16.01) | 1.56 |
| Distributions from net investment income | – | (.67) | (.50) | (.63) | (.58) | (.43) |
| Distributions from net realized gain | – | (7.09) | (4.00) | – | (.91) | (7.17) |
| Total distributions | – | (7.76) | (4.50) | (.63) | (1.48)C | (7.59)D |
| Redemption fees added to paid in capitalB | – | – | – | –E | –E | –E |
| Net asset value, end of period | $65.01 | $69.57 | $88.50 | $81.27 | $62.94 | $80.43 |
| Total ReturnF,G,H | (6.55)% | (12.59)% | 14.65% | 30.18% | (20.01)% | 2.20% |
| Ratios to Average Net AssetsI,J | | | | | | |
| Expenses before reductions | 1.08%K | 1.06% | 1.07% | 1.08% | 1.06% | 1.06% |
| Expenses net of fee waivers, if any | 1.08%K | 1.06% | 1.07% | 1.08% | 1.06% | 1.06% |
| Expenses net of all reductions | 1.07%K | 1.05% | 1.06% | 1.07% | 1.06% | 1.06% |
| Net investment income (loss) | 1.21%K | 1.08% | .64% | .96% | 1.09% | .61% |
| Supplemental Data | | | | | | |
| Net assets, end of period (000 omitted) | $99,447 | $126,182 | $201,933 | $229,086 | $202,747 | $319,740 |
| Portfolio turnover rateL | 68%K | 77%M | 67% | 49%M | 64% | 76%M |
A For the year ended February 29.
B Calculated based on average shares outstanding during the period.
C Total distributions of $1.48 per share is comprised of distributions from net investment income of $.575 and distributions from net realized gain of $.906 per share.
D Total distributions of $7.59 per share is comprised of distributions from net investment income of $.425 and distributions from net realized gain of $7.167 per share.
E Amount represents less than $.005 per share.
F Total returns for periods of less than one year are not annualized.
G Total returns would have been lower if certain expenses had not been reduced during the applicable periods shown.
H Total returns do not include the effect of the sales charges.
I Fees and expenses of any underlying Fidelity Central Funds are not included in the Fund's expense ratio. The Fund indirectly bears its proportionate share of the expenses of any underlying Fidelity Central Funds.
J Expense ratios reflect operating expenses of the class. Expenses before reductions do not reflect amounts reimbursed by the investment adviser or reductions from brokerage service arrangements or reductions from other expense offset arrangements and do not represent the amount paid by the class during periods when reimbursements or reductions occur. Expenses net of fee waivers reflect expenses after reimbursement by the investment adviser but prior to reductions from brokerage service arrangements or other expense offset arrangements. Expenses net of all reductions represent the net expenses paid by the class.
K Annualized
L Amount does not include the portfolio activity of any underlying Fidelity Central Funds.
M Portfolio turnover rate excludes securities received or delivered in-kind.
See accompanying notes which are an integral part of the financial statements.
Materials Portfolio Class M
| | Six months ended (Unaudited) August 31, | Years endedFebruary 28, | | | | |
| | 2019 | 2019 | 2018 | 2017 | 2016A | 2015 |
| Selected Per–Share Data | | | | | | |
| Net asset value, beginning of period | $68.98 | $87.79 | $80.66 | $62.52 | $79.95 | $85.99 |
| Income from Investment Operations | | | | | | |
| Net investment income (loss)B | .31 | .61 | .30 | .47 | .56 | .25 |
| Net realized and unrealized gain (loss) | (4.92) | (11.88) | 11.08 | 18.12 | (16.69) | 1.06 |
| Total from investment operations | (4.61) | (11.27) | 11.38 | 18.59 | (16.13) | 1.31 |
| Distributions from net investment income | – | (.45) | (.25) | (.45) | (.40) | (.18) |
| Distributions from net realized gain | – | (7.09) | (4.00) | – | (.91) | (7.17) |
| Total distributions | – | (7.54) | (4.25) | (.45) | (1.30)C | (7.35) |
| Redemption fees added to paid in capitalB | – | – | – | –D | –D | –D |
| Net asset value, end of period | $64.37 | $68.98 | $87.79 | $80.66 | $62.52 | $79.95 |
| Total ReturnE,F,G | (6.68)% | (12.84)% | 14.30% | 29.78% | (20.27)% | 1.90% |
| Ratios to Average Net AssetsH,I | | | | | | |
| Expenses before reductions | 1.37%J | 1.35% | 1.36% | 1.39% | 1.38% | 1.37% |
| Expenses net of fee waivers, if any | 1.37%J | 1.35% | 1.36% | 1.39% | 1.37% | 1.37% |
| Expenses net of all reductions | 1.36%J | 1.34% | 1.35% | 1.38% | 1.37% | 1.37% |
| Net investment income (loss) | .92%J | .79% | .35% | .65% | .77% | .31% |
| Supplemental Data | | | | | | |
| Net assets, end of period (000 omitted) | $24,333 | $27,436 | $40,107 | $40,935 | $30,118 | $45,252 |
| Portfolio turnover rateK | 68%J | 77%L | 67% | 49%L | 64% | 76%L |
A For the year ended February 29.
B Calculated based on average shares outstanding during the period.
C Total distributions of $1.30 per share is comprised of distributions from net investment income of $.395 and distributions from net realized gain of $.906 per share.
D Amount represents less than $.005 per share.
E Total returns for periods of less than one year are not annualized.
F Total returns would have been lower if certain expenses had not been reduced during the applicable periods shown.
G Total returns do not include the effect of the sales charges.
H Fees and expenses of any underlying Fidelity Central Funds are not included in the Fund's expense ratio. The Fund indirectly bears its proportionate share of the expenses of any underlying Fidelity Central Funds.
I Expense ratios reflect operating expenses of the class. Expenses before reductions do not reflect amounts reimbursed by the investment adviser or reductions from brokerage service arrangements or reductions from other expense offset arrangements and do not represent the amount paid by the class during periods when reimbursements or reductions occur. Expenses net of fee waivers reflect expenses after reimbursement by the investment adviser but prior to reductions from brokerage service arrangements or other expense offset arrangements. Expenses net of all reductions represent the net expenses paid by the class.
J Annualized
K Amount does not include the portfolio activity of any underlying Fidelity Central Funds.
L Portfolio turnover rate excludes securities received or delivered in-kind.
See accompanying notes which are an integral part of the financial statements.
Materials Portfolio Class C
| | Six months ended (Unaudited) August 31, | Years endedFebruary 28, | | | | |
| | 2019 | 2019 | 2018 | 2017 | 2016A | 2015 |
| Selected Per–Share Data | | | | | | |
| Net asset value, beginning of period | $67.13 | $85.52 | $78.72 | $61.09 | $78.12 | $84.38 |
| Income from Investment Operations | | | | | | |
| Net investment income (loss)B | .15 | .25 | (.09) | .15 | .24 | (.12) |
| Net realized and unrealized gain (loss) | (4.78) | (11.50) | 10.80 | 17.68 | (16.28) | 1.03 |
| Total from investment operations | (4.63) | (11.25) | 10.71 | 17.83 | (16.04) | .91 |
| Distributions from net investment income | – | (.04) | (.02) | (.20) | (.08) | – |
| Distributions from net realized gain | – | (7.09) | (3.89) | – | (.91) | (7.17) |
| Total distributions | – | (7.14)C | (3.91) | (.20) | (.99) | (7.17) |
| Redemption fees added to paid in capitalB | – | – | – | –D | –D | –D |
| Net asset value, end of period | $62.50 | $67.13 | $85.52 | $78.72 | $61.09 | $78.12 |
| Total ReturnE,F,G | (6.90)% | (13.24)% | 13.78% | 29.21% | (20.61)% | 1.43% |
| Ratios to Average Net AssetsH,I | | | | | | |
| Expenses before reductions | 1.83%J | 1.81% | 1.82% | 1.83% | 1.81% | 1.82% |
| Expenses net of fee waivers, if any | 1.83%J | 1.81% | 1.82% | 1.82% | 1.81% | 1.82% |
| Expenses net of all reductions | 1.82%J | 1.79% | 1.82% | 1.82% | 1.81% | 1.82% |
| Net investment income (loss) | .46%J | .33% | (.11)% | .21% | .34% | (.14)% |
| Supplemental Data | | | | | | |
| Net assets, end of period (000 omitted) | $33,241 | $51,659 | $85,792 | $80,225 | $66,896 | $107,697 |
| Portfolio turnover rateK | 68%J | 77%L | 67% | 49%L | 64% | 76%L |
A For the year ended February 29.
B Calculated based on average shares outstanding during the period.
C Total distributions of $7.14 per share is comprised of distributions from net investment income of $.042 and distributions from net realized gain of $7.094 per share.
D Amount represents less than $.005 per share.
E Total returns for periods of less than one year are not annualized.
F Total returns would have been lower if certain expenses had not been reduced during the applicable periods shown.
G Total returns do not include the effect of the contingent deferred sales charge.
H Fees and expenses of any underlying Fidelity Central Funds are not included in the Fund's expense ratio. The Fund indirectly bears its proportionate share of the expenses of any underlying Fidelity Central Funds.
I Expense ratios reflect operating expenses of the class. Expenses before reductions do not reflect amounts reimbursed by the investment adviser or reductions from brokerage service arrangements or reductions from other expense offset arrangements and do not represent the amount paid by the class during periods when reimbursements or reductions occur. Expenses net of fee waivers reflect expenses after reimbursement by the investment adviser but prior to reductions from brokerage service arrangements or other expense offset arrangements. Expenses net of all reductions represent the net expenses paid by the class.
J Annualized
K Amount does not include the portfolio activity of any underlying Fidelity Central Funds.
L Portfolio turnover rate excludes securities received or delivered in-kind.
See accompanying notes which are an integral part of the financial statements.
Materials Portfolio
| | Six months ended (Unaudited) August 31, | Years endedFebruary 28, | | | | |
| | 2019 | 2019 | 2018 | 2017 | 2016A | 2015 |
| Selected Per–Share Data | | | | | | |
| Net asset value, beginning of period | $69.84 | $88.90 | $81.64 | $63.20 | $80.77 | $86.81 |
| Income from Investment Operations | | | | | | |
| Net investment income (loss)B | .51 | 1.06 | .79 | .90 | .98 | .73 |
| Net realized and unrealized gain (loss) | (4.99) | (12.09) | 11.24 | 18.34 | (16.89) | 1.05 |
| Total from investment operations | (4.48) | (11.03) | 12.03 | 19.24 | (15.91) | 1.78 |
| Distributions from net investment income | – | (.93) | (.77) | (.80) | (.76) | (.65) |
| Distributions from net realized gain | – | (7.09) | (4.00) | – | (.91) | (7.17) |
| Total distributions | – | (8.03)C | (4.77) | (.80) | (1.66)D | (7.82) |
| Redemption fees added to paid in capitalB | – | – | – | –E | –E | –E |
| Net asset value, end of period | $65.36 | $69.84 | $88.90 | $81.64 | $63.20 | $80.77 |
| Total ReturnF,G | (6.41)% | (12.35)% | 14.96% | 30.52% | (19.81)% | 2.46% |
| Ratios to Average Net AssetsH,I | | | | | | |
| Expenses before reductions | .80%J | .79% | .79% | .81% | .81% | .80% |
| Expenses net of fee waivers, if any | .80%J | .79% | .79% | .81% | .81% | .80% |
| Expenses net of all reductions | .80%J | .78% | .79% | .81% | .80% | .80% |
| Net investment income (loss) | 1.48%J | 1.35% | .91% | 1.22% | 1.34% | .87% |
| Supplemental Data | | | | | | |
| Net assets, end of period (000 omitted) | $514,335 | $626,759 | $1,043,704 | $882,504 | $711,985 | $1,107,689 |
| Portfolio turnover rateK | 68%J | 77%L | 67% | 49%L | 64% | 76%L |
A For the year ended February 29.
B Calculated based on average shares outstanding during the period.
C Total distributions of $8.03 per share is comprised of distributions from net investment income of $.932 and distributions from net realized gain of $7.094 per share.
D Total distributions of $1.66 per share is comprised of distributions from net investment income of $.756 and distributions from net realized gain of $.906 per share.
E Amount represents less than $.005 per share.
F Total returns for periods of less than one year are not annualized.
G Total returns would have been lower if certain expenses had not been reduced during the applicable periods shown.
H Fees and expenses of any underlying Fidelity Central Funds are not included in the Fund's expense ratio. The Fund indirectly bears its proportionate share of the expenses of any underlying Fidelity Central Funds.
I Expense ratios reflect operating expenses of the class. Expenses before reductions do not reflect amounts reimbursed by the investment adviser or reductions from brokerage service arrangements or reductions from other expense offset arrangements and do not represent the amount paid by the class during periods when reimbursements or reductions occur. Expenses net of fee waivers reflect expenses after reimbursement by the investment adviser but prior to reductions from brokerage service arrangements or other expense offset arrangements. Expenses net of all reductions represent the net expenses paid by the class.
J Annualized
K Amount does not include the portfolio activity of any underlying Fidelity Central Funds.
L Portfolio turnover rate excludes securities received or delivered in-kind.
See accompanying notes which are an integral part of the financial statements.
Materials Portfolio Class I
| | Six months ended (Unaudited) August 31, | Years endedFebruary 28, | | | | |
| | 2019 | 2019 | 2018 | 2017 | 2016A | 2015 |
| Selected Per–Share Data | | | | | | |
| Net asset value, beginning of period | $69.70 | $88.73 | $81.49 | $63.07 | $80.60 | $86.66 |
| Income from Investment Operations | | | | | | |
| Net investment income (loss)B | .51 | 1.07 | .80 | .91 | 1.00 | .74 |
| Net realized and unrealized gain (loss) | (4.98) | (12.08) | 11.22 | 18.31 | (16.86) | 1.05 |
| Total from investment operations | (4.47) | (11.01) | 12.02 | 19.22 | (15.86) | 1.79 |
| Distributions from net investment income | – | (.93) | (.78) | (.80) | (.77) | (.68) |
| Distributions from net realized gain | – | (7.09) | (4.00) | – | (.91) | (7.17) |
| Total distributions | – | (8.02) | (4.78) | (.80) | (1.67)C | (7.85) |
| Redemption fees added to paid in capitalB | – | – | – | –D | –D | –D |
| Net asset value, end of period | $65.23 | $69.70 | $88.73 | $81.49 | $63.07 | $80.60 |
| Total ReturnE,F | (6.41)% | (12.34)% | 14.97% | 30.55% | (19.79)% | 2.49% |
| Ratios to Average Net AssetsG,H | | | | | | |
| Expenses before reductions | .79%I | .78% | .79% | .79% | .78% | .78% |
| Expenses net of fee waivers, if any | .79%I | .78% | .79% | .79% | .78% | .78% |
| Expenses net of all reductions | .78%I | .77% | .78% | .78% | .78% | .78% |
| Net investment income (loss) | 1.49%I | 1.36% | .92% | 1.25% | 1.37% | .89% |
| Supplemental Data | | | | | | |
| Net assets, end of period (000 omitted) | $196,035 | $254,240 | $511,062 | $335,124 | $306,145 | $468,371 |
| Portfolio turnover rateJ | 68%I | 77%K | 67% | 49%K | 64% | 76%K |
A For the year ended February 29.
B Calculated based on average shares outstanding during the period.
C Total distributions of $1.67 per share is comprised of distributions from net investment income of $.767 and distributions from net realized gain of $.906 per share.
D Amount represents less than $.005 per share.
E Total returns for periods of less than one year are not annualized.
F Total returns would have been lower if certain expenses had not been reduced during the applicable periods shown.
G Fees and expenses of any underlying Fidelity Central Funds are not included in the Fund's expense ratio. The Fund indirectly bears its proportionate share of the expenses of any underlying Fidelity Central Funds.
H Expense ratios reflect operating expenses of the class. Expenses before reductions do not reflect amounts reimbursed by the investment adviser or reductions from brokerage service arrangements or reductions from other expense offset arrangements and do not represent the amount paid by the class during periods when reimbursements or reductions occur. Expenses net of fee waivers reflect expenses after reimbursement by the investment adviser but prior to reductions from brokerage service arrangements or other expense offset arrangements. Expenses net of all reductions represent the net expenses paid by the class.
I Annualized
J Amount does not include the portfolio activity of any underlying Fidelity Central Funds.
K Portfolio turnover rate excludes securities received or delivered in-kind.
See accompanying notes which are an integral part of the financial statements.
Materials Portfolio Class Z
| | Six months ended (Unaudited) August 31, | Year endedFebruary 28, |
| | 2019 | 2019 A |
| Selected Per–Share Data | | |
| Net asset value, beginning of period | $69.58 | $79.81 |
| Income from Investment Operations | | |
| Net investment income (loss)B | .55 | .62 |
| Net realized and unrealized gain (loss) | (4.97) | (6.96) |
| Total from investment operations | (4.42) | (6.34) |
| Distributions from net investment income | – | (.96) |
| Distributions from net realized gain | – | (2.93) |
| Total distributions | – | (3.89) |
| Redemption fees added to paid in capitalB | – | – |
| Net asset value, end of period | $65.16 | $69.58 |
| Total ReturnC,D | (6.35)% | (7.35)% |
| Ratios to Average Net AssetsE,F | | |
| Expenses before reductions | .63%G | .63%G |
| Expenses net of fee waivers, if any | .63%G | .62%G |
| Expenses net of all reductions | .63%G | .61%G |
| Net investment income (loss) | 1.65%G | 2.27%G |
| Supplemental Data | | |
| Net assets, end of period (000 omitted) | $17,781 | $10,039 |
| Portfolio turnover rateH | 68%G | 77%I |
A For the period October 2, 2018 (commencement of sale of shares) to February 28, 2019.
B Calculated based on average shares outstanding during the period.
C Total returns for periods of less than one year are not annualized.
D Total returns would have been lower if certain expenses had not been reduced during the applicable periods shown.
E Fees and expenses of any underlying Fidelity Central Funds are not included in the Fund's expense ratio. The Fund indirectly bears its proportionate share of the expenses of any underlying Fidelity Central Funds.
F Expense ratios reflect operating expenses of the class. Expenses before reductions do not reflect amounts reimbursed by the investment adviser or reductions from brokerage service arrangements or reductions from other expense offset arrangements and do not represent the amount paid by the class during periods when reimbursements or reductions occur. Expense ratios before reductions for start-up periods may not be representative of longer-term operating periods. Expenses net of fee waivers reflect expenses after reimbursement by the investment adviser but prior to reductions from brokerage service arrangements or other expense offset arrangements. Expenses net of all reductions represent the net expenses paid by the class.
G Annualized
H Amount does not include the portfolio activity of any underlying Fidelity Central Funds.
I Portfolio turnover rate excludes securities received or delivered in-kind.
See accompanying notes which are an integral part of the financial statements.
Notes to Financial Statements (Unaudited)
For the period ended August 31, 2019
1. Organization.
Materials Portfolio (the Fund) is a non-diversified fund of Fidelity Select Portfolios (the Trust) and is authorized to issue an unlimited number of shares. The Trust is registered under the Investment Company Act of 1940, as amended (the 1940 Act), as an open-end management investment company organized as a Massachusetts business trust. The Fund invests primarily in securities of companies whose principal business activities fall within specific industries. The Fund commenced sale of Class Z shares on October 2, 2018. The Fund offers Class A, Class M, Class C, Materials, Class I and Class Z shares, each of which has equal rights as to assets and voting privileges. Each class has exclusive voting rights with respect to matters that affect that class.
Effective March 1, 2019, Class C shares will automatically convert to Class A shares after a holding period of ten years from the initial date of purchase, with certain exceptions.
2. Investments in Fidelity Central Funds.
The Fund invests in Fidelity Central Funds, which are open-end investment companies generally available only to other investment companies and accounts managed by the investment adviser and its affiliates. The Fund's Schedule of Investments lists each of the Fidelity Central Funds held as of period end, if any, as an investment of the Fund, but does not include the underlying holdings of each Fidelity Central Fund. As an Investing Fund, the Fund indirectly bears its proportionate share of the expenses of the underlying Fidelity Central Funds.
The Money Market Central Funds seek preservation of capital and current income and are managed by Fidelity Investments Money Management, Inc. (FIMM), an affiliate of the investment adviser. Annualized expenses of the Money Market Central Funds as of their most recent shareholder report date ranged from less than .005% to .01%.
A complete unaudited list of holdings for each Fidelity Central Fund is available upon request or at the Securities and Exchange Commission (the SEC) website at www.sec.gov. In addition, the financial statements of the Fidelity Central Funds are available on the SEC website or upon request.
3. Significant Accounting Policies.
The Fund is an investment company and applies the accounting and reporting guidance of the Financial Accounting Standards Board (FASB) Accounting Standards Codification Topic 946 Financial Services – Investments Companies. The financial statements have been prepared in conformity with accounting principles generally accepted in the United States of America (GAAP), which require management to make certain estimates and assumptions at the date of the financial statements. Actual results could differ from those estimates. Subsequent events, if any, through the date that the financial statements were issued have been evaluated in the preparation of the financial statements. The following summarizes the significant accounting policies of the Fund:
Investment Valuation. Investments are valued as of 4:00 p.m. Eastern time on the last calendar day of the period. The Board of Trustees (the Board) has delegated the day to day responsibility for the valuation of the Fund's investments to the Fair Value Committee (the Committee) established by the Fund's investment adviser. In accordance with valuation policies and procedures approved by the Board, the Fund attempts to obtain prices from one or more third party pricing vendors or brokers to value its investments. When current market prices, quotations or currency exchange rates are not readily available or reliable, investments will be fair valued in good faith by the Committee, in accordance with procedures adopted by the Board. Factors used in determining fair value vary by investment type and may include market or investment specific events. The frequency with which these procedures are used cannot be predicted and they may be utilized to a significant extent. The Committee oversees the Fund's valuation policies and procedures and reports to the Board on the Committee's activities and fair value determinations. The Board monitors the appropriateness of the procedures used in valuing the Fund's investments and ratifies the fair value determinations of the Committee.
The Fund categorizes the inputs to valuation techniques used to value its investments into a disclosure hierarchy consisting of three levels as shown below:
- Level 1 – quoted prices in active markets for identical investments
- Level 2 – other significant observable inputs (including quoted prices for similar investments, interest rates, prepayment speeds, etc.)
- Level 3 – unobservable inputs (including the Fund's own assumptions based on the best information available)
Valuation techniques used to value the Fund's investments by major category are as follows:
Equity securities, including restricted securities, for which market quotations are readily available, are valued at the last reported sale price or official closing price as reported by a third party pricing vendor on the primary market or exchange on which they are traded and are categorized as Level 1 in the hierarchy. In the event there were no sales during the day or closing prices are not available, securities are valued at the last quoted bid price or may be valued using the last available price and are generally categorized as Level 2 in the hierarchy. For foreign equity securities, when market or security specific events arise, comparisons to the valuation of American Depositary Receipts (ADRs), futures contracts, Exchange-Traded Funds (ETFs) and certain indexes as well as quoted prices for similar securities may be used and would be categorized as Level 2 in the hierarchy. For equity securities, including restricted securities, where observable inputs are limited, assumptions about market activity and risk are used and these securities may be categorized as Level 3 in the hierarchy.
Investments in open-end mutual funds, including the Fidelity Central Funds, are valued at their closing net asset value (NAV) each business day and are categorized as Level 1 in the hierarchy.
Changes in valuation techniques may result in transfers in or out of an assigned level within the disclosure hierarchy.
Foreign Currency. The Fund may use foreign currency contracts to facilitate transactions in foreign-denominated securities. Gains and losses from these transactions may arise from changes in the value of the foreign currency or if the counterparties do not perform under the contracts' terms.
Foreign-denominated assets, including investment securities, and liabilities are translated into U.S. dollars at the exchange rates at period end. Purchases and sales of investment securities, income and dividends received and expenses denominated in foreign currencies are translated into U.S. dollars at the exchange rate in effect on the transaction date.
The effects of exchange rate fluctuations on investments are included with the net realized and unrealized gain (loss) on investment securities. Other foreign currency transactions resulting in realized and unrealized gain (loss) are disclosed separately.
Investment Transactions and Income. For financial reporting purposes, the Fund's investment holdings and NAV include trades executed through the end of the last business day of the period. The NAV per share for processing shareholder transactions is calculated as of the close of business of the New York Stock Exchange (NYSE), normally 4:00 p.m. Eastern time and includes trades executed through the end of the prior business day. Gains and losses on securities sold are determined on the basis of identified cost and include proceeds received from litigation. Dividend income is recorded on the ex-dividend date, except for certain dividends from foreign securities where the ex-dividend date may have passed, which are recorded as soon as the Fund is informed of the ex-dividend date. Non-cash dividends included in dividend income, if any, are recorded at the fair market value of the securities received. Income and capital gain distributions from Fidelity Central Funds, if any, are recorded on the ex-dividend date. Certain distributions received by the Fund represent a return of capital or capital gain. The Fund determines the components of these distributions subsequent to the ex-dividend date, based upon receipt of tax filings or other correspondence relating to the underlying investment. These distributions are recorded as a reduction of cost of investments and/or as a realized gain. Investment income is recorded net of foreign taxes withheld where recovery of such taxes is uncertain.
Class Allocations and Expenses. Investment income, realized and unrealized capital gains and losses, common expenses of the Fund, and certain fund-level expense reductions, if any, are allocated daily on a pro-rata basis to each class based on the relative net assets of each class to the total net assets of the Fund. Each class differs with respect to transfer agent and distribution and service plan fees incurred. Certain expense reductions may also differ by class. For the reporting period, the allocated portion of income and expenses to each class as a percent of its average net assets may vary due to the timing of recording these transactions in relation to fluctuating net assets of the classes. Expenses directly attributable to a fund are charged to that fund. Expenses attributable to more than one fund are allocated among the respective funds on the basis of relative net assets or other appropriate methods. Expense estimates are accrued in the period to which they relate and adjustments are made when actual amounts are known.
Deferred Trustee Compensation. Under a Deferred Compensation Plan (the Plan) for the Fund, certain independent Trustees have elected to defer receipt of a portion of their annual compensation. Deferred amounts are invested in a cross-section of Fidelity funds, are marked-to-market and remain in the Fund until distributed in accordance with the Plan. The investment of deferred amounts and the offsetting payable to the Trustees of $133,135 are included in the accompanying Statement of Assets and Liabilities in other receivables and other payables and accrued expenses, respectively.
Income Tax Information and Distributions to Shareholders. Each year, the Fund intends to qualify as a regulated investment company under Subchapter M of the Internal Revenue Code, including distributing substantially all of its taxable income and realized gains. As a result, no provision for U.S. Federal income taxes is required. The Fund files a U.S. federal tax return, in addition to state and local tax returns as required. The Fund's federal income tax returns are subject to examination by the Internal Revenue Service (IRS) for a period of three fiscal years after they are filed. State and local tax returns may be subject to examination for an additional fiscal year depending on the jurisdiction. Foreign taxes are provided for based on the Fund's understanding of the tax rules and rates that exist in the foreign markets in which it invests.
Distributions are declared and recorded on the ex-dividend date. Income and capital gain distributions are declared separately for each class. Income and capital gain distributions are determined in accordance with income tax regulations, which may differ from GAAP.
Capital accounts within the financial statements are adjusted for permanent book-tax differences. These adjustments have no impact on net assets or the results of operations. Capital accounts are not adjusted for temporary book-tax differences which will reverse in a subsequent period.
Book-tax differences are primarily due to in-kind transactions, foreign currency transactions, deferred trustees compensation, partnerships, capital loss carryforwards and losses deferred due to wash sales and excise tax regulations.
As of period end, the cost and unrealized appreciation (depreciation) in securities, and derivatives if applicable, for federal income tax purposes were as follows:
| Gross unrealized appreciation | $114,663,778 |
| Gross unrealized depreciation | (114,798,878) |
| Net unrealized appreciation (depreciation) | $(135,100) |
| Tax cost | $920,565,409 |
At the prior fiscal period end, the Fund elected to defer to its next fiscal year approximately $5,111,087 of capital losses recognized during the period November 1, 2018 to February 28, 2019.
4. Purchases and Sales of Investments.
Purchases and sales of securities, other than short-term securities, aggregated $332,842,729 and $474,901,718, respectively.
5. Fees and Other Transactions with Affiliates.
Management Fee. Fidelity SelectCo, LLC (the investment adviser) and its affiliates provide the Fund with investment management related services for which the Fund pays a monthly management fee. The management fee is the sum of an individual fund fee rate that is based on an annual rate of .30% of the Fund's average net assets and an annualized group fee rate that averaged .24% during the period. The group fee rate is based upon the average net assets of all the mutual funds advised by Fidelity Management & Research Company (FMR) and the investment adviser. The group fee rate decreases as assets under management increase and increases as assets under management decrease. For the reporting period, the total annualized management fee rate was .54% of the Fund's average net assets.
Distribution and Service Plan Fees. In accordance with Rule 12b-1 of the 1940 Act, the Fund has adopted separate Distribution and Service Plans for each class of shares. Certain classes pay Fidelity Distributors Corporation (FDC), an affiliate of the investment adviser, separate Distribution and Service Fees, each of which is based on an annual percentage of each class' average net assets. In addition, FDC may pay financial intermediaries for selling shares of the Fund and providing shareholder support services. For the period, the Distribution and Service Fee rates, total fees and amounts retained by FDC were as follows:
| | Distribution Fee | Service Fee | Total Fees | Retained by FDC |
| Class A | -% | .25% | $141,593 | $– |
| Class M | .25% | .25% | 65,507 | – |
| Class C | .75% | .25% | 205,176 | 6,738 |
| | | | $412,276 | $6,738 |
Sales Load. FDC may receive a front-end sales charge of up to 5.75% for selling Class A shares and 3.50% for selling Class M shares, some of which is paid to financial intermediaries for selling shares of the Fund. Depending on the holding period, FDC may receive contingent deferred sales charges levied on Class A, Class M and Class C redemptions. The deferred sales charges are 1.00% for Class C shares, 1.00% for certain purchases of Class A shares and .25% for certain purchases of Class M shares.
For the period, sales charge amounts retained by FDC were as follows:
| | Retained by FDC |
| Class A | $8,493 |
| Class M | 967 |
| Class C(a) | 1,311 |
| | $10,771 |
(a) When Class C shares are initially sold, FDC pays commissions from its own resources to financial intermediaries through which the sales are made.
Transfer Agent Fees. Fidelity Investments Institutional Operations Company, Inc., (FIIOC), an affiliate of the investment adviser, is the transfer, dividend disbursing and shareholder servicing agent for each class of the Fund. FIIOC receives account fees and asset-based fees that vary according to the account size and type of account of the shareholders of the respective classes of the Fund, except for Class Z. FIIOC receives an asset-based fee of Class Z's average net assets. FIIOC pays for typesetting, printing and mailing of shareholder reports, except proxy statements.
For the period, transfer agent fees for each class were as follows:
| | Amount | % of Class-Level Average Net Assets(a) |
| Class A | $136,091 | .24 |
| Class M | 36,568 | .28 |
| Class C | 48,164 | .24 |
| Materials | 618,525 | .21 |
| Class I | 226,161 | .20 |
| Class Z | 2,196 | .05 |
| | $1,067,705 | |
(a) Annualized
Accounting and Security Lending Fees. Fidelity Service Company, Inc. (FSC), an affiliate of the investment adviser, maintains the Fund's accounting records. The accounting fee is based on the level of average net assets for each month. Prior to April 1, 2019, FSC had a separate agreement with the Fund for administration of the security lending program, based on the number and duration of lending transactions. For the period, the total fees paid for accounting and administration of securities lending were equivalent to an annualized rate of .03%.
Brokerage Commissions. The Fund placed a portion of its portfolio transactions with brokerage firms which are affiliates of the investment adviser. Brokerage commissions are included in net realized gain (loss) and change in net unrealized appreciation (depreciation) in the Statement of Operations. The commissions paid to these affiliated firms were $12,101 for the period.
Interfund Lending Program. Pursuant to an Exemptive Order issued by the SEC, the Fund, along with other registered investment companies having management contracts with Fidelity Management & Research Company (FMR) or other affiliated entities of FMR, may participate in an interfund lending program. This program provides an alternative credit facility allowing the funds to borrow from, or lend money to, other participating affiliated funds. At period end, there were no interfund loans outstanding. The Fund's activity in this program during the period for which loans were outstanding was as follows:
| Borrower or Lender | Average Loan Balance | Weighted Average Interest Rate | Interest Expense |
| Borrower | $4,235,667 | 2.69% | $3,792 |
Interfund Trades. The Fund may purchase from or sell securities to other Fidelity Funds under procedures adopted by the Board. The procedures have been designed to ensure these interfund trades are executed in accordance with Rule 17a-7 of the 1940 Act. Interfund trades are included within the respective purchases and sales amounts shown in the Purchases and Sales of Investments note.
Prior Fiscal Year Affiliated Redemptions In-Kind. During the prior period, 1,531,828 shares of the Fund were redeemed in-kind for investments and cash with a value of $126,544,324. The Fund had a net realized gain of $42,386,899 on investments delivered through in-kind redemptions. The amount of the in-kind redemptions is included in share transactions in the accompanying Statement of Changes in Net Assets as well as the Notes to Financial Statements. The Fund recognized no gain or loss for federal income tax purposes.
6. Committed Line of Credit.
The Fund participates with other funds managed by the investment adviser or an affiliate in a $4.25 billion credit facility (the "line of credit") to be utilized for temporary or emergency purposes to fund shareholder redemptions or for other short-term liquidity purposes. The Fund has agreed to pay commitment fees on its pro-rata portion of the line of credit, which amounted to $1,421 and is reflected in Miscellaneous expenses on the Statement of Operations. During the period, the Fund did not borrow on this line of credit.
7. Security Lending.
The Fund lends portfolio securities from time to time in order to earn additional income. For equity securities, lending agents are used, including National Financial Services (NFS), an affiliate of the Fund. Pursuant to a securities lending agreement, NFS will receive a fee, which is capped at 9.9% of daily lending revenue, for its services as lending agent. The Fund may lend securities to certain qualified borrowers. On the settlement date of the loan, the Fund receives collateral (in the form of U.S. Treasury obligations, letters of credit and/or cash) against the loaned securities and maintains collateral in an amount not less than 100% of the market value of the loaned securities during the period of the loan. The market value of the loaned securities is determined at the close of business of the Fund and any additional required collateral is delivered to the Fund on the next business day. The Fund or borrower may terminate the loan at any time, and if the borrower defaults on its obligation to return the securities loaned because of insolvency or other reasons, the Fund may apply collateral received from the borrower against the obligation. The Fund may experience delays and costs in recovering the securities loaned. Any cash collateral received is invested in the Fidelity Securities Lending Cash Central Fund. The value of loaned securities and cash collateral at period end are disclosed on the Fund's Statement of Assets and Liabilities. Total fees paid by the Fund to NFS, amounted to $950. Security lending income represents the income earned on investing cash collateral, less rebates paid to borrowers and any lending agent fees associated with the loan, plus any premium payments received for lending certain types of securities. Security lending income is presented in the Statement of Operations as a component of income from Fidelity Central Funds.
8. Bank Borrowings.
The Fund is permitted to have bank borrowings for temporary or emergency purposes to fund shareholder redemptions or for other short-term liquidity requirements. The Fund has established borrowing arrangements with certain banks. The interest rate on the borrowings is the bank's base rate, as revised from time to time. The average loan balance during the period for which loans were outstanding amounted to $1,002,000. The weighted average interest rate was 2.94%. The interest expense amounted to $82 under the bank borrowing program. At period end, there were no bank borrowings outstanding.
9. Expense Reductions.
Commissions paid to certain brokers with whom the investment adviser, or its affiliates, places trades on behalf of the Fund include an amount in addition to trade execution, which may be rebated back to the Fund to offset certain expenses. This amount totaled $31,530 for the period.
In addition, during the period the investment adviser reimbursed and/or waived a portion of fund-level operating expenses in the amount of $4,258.
10. Distributions to Shareholders.
Distributions to shareholders of each class were as follows:
| | Six months ended
August 31, 2019 | Year ended
February 28, 2019(a) |
| Distributions to shareholders | | |
| Class A | $– | $15,708,925 |
| Class M | – | 3,202,320 |
| Class C | – | 6,520,876 |
| Materials | – | 82,797,754 |
| Class I | – | 39,718,583 |
| Class Z | – | 562,931 |
| Total | $– | $148,511,389 |
(a) Distributions for Class Z are for the period October 2, 2018 (commencement of sale of shares) to February 28, 2019.
11. Share Transactions.
Share transactions for each class were as follows and may contain automatic conversions between classes or exchanges between affiliated funds:
| | Shares | Shares | Dollars | Dollars |
| | Six months ended August 31, 2019 | Year ended February 28, 2019(a) | Six months ended August 31, 2019 | Year ended February 28, 2019(a) |
| Class A | | | | |
| Shares sold | 185,556 | 308,373 | $12,586,452 | $22,956,940 |
| Reinvestment of distributions | – | 212,733 | – | 15,369,185 |
| Shares redeemed | (469,519) | (989,324) | (31,984,998) | (75,462,106) |
| Net increase (decrease) | (283,963) | (468,218) | $(19,398,546) | $(37,135,981) |
| Class M | | | | |
| Shares sold | 17,228 | 54,673 | $1,169,523 | $4,209,329 |
| Reinvestment of distributions | – | 44,672 | – | 3,195,601 |
| Shares redeemed | (36,930) | (158,456) | (2,464,631) | (12,302,958) |
| Net increase (decrease) | (19,702) | (59,111) | $(1,295,108) | $(4,898,028) |
| Class C | | | | |
| Shares sold | 8,443 | 52,426 | $555,510 | $3,945,243 |
| Reinvestment of distributions | – | 88,963 | – | 6,259,533 |
| Shares redeemed | (246,106) | (375,023) | (15,989,915) | (27,023,944) |
| Net increase (decrease) | (237,663) | (233,634) | $(15,434,405) | $(16,819,168) |
| Materials | | | | |
| Shares sold | 231,944 | 723,502 | $15,830,254 | $55,284,340 |
| Reinvestment of distributions | – | 1,071,623 | – | 77,748,766 |
| Shares redeemed | (1,336,334) | (4,560,838)(b) | (90,422,489) | (359,459,696)(b) |
| Net increase (decrease) | (1,104,390) | (2,765,713) | $(74,592,235) | $(226,426,590) |
| Class I | | | | |
| Shares sold | 277,611 | 1,171,052 | $18,828,850 | $91,157,331 |
| Reinvestment of distributions | – | 515,251 | – | 37,224,159 |
| Shares redeemed | (919,769) | (3,798,586) | (62,702,138) | (280,329,178) |
| Net increase (decrease) | (642,158) | (2,112,283) | $(43,873,288) | $(151,947,688) |
| Class Z | | | | |
| Shares sold | 173,446 | 190,704 | $11,236,911 | $13,136,478 |
| Reinvestment of distributions | – | 6,745 | – | 418,264 |
| Shares redeemed | (44,867) | (53,168) | (3,043,112) | (3,316,348) |
| Net increase (decrease) | 128,579 | 144,281 | $8,193,799 | $10,238,394 |
(a) Share transactions for Class Z are for the period October 2, 2018 (commencement of sale of shares) to February 28, 2019.
(b) Amount includes in-kind redemptions (See Prior Fiscal Year Affiliated Redemptions In-Kind note for additional details).
12. Other.
The Fund's organizational documents provide former and current trustees and officers with a limited indemnification against liabilities arising in connection with the performance of their duties to the Fund. In the normal course of business, the Fund may also enter into contracts that provide general indemnifications. The Fund's maximum exposure under these arrangements is unknown as this would be dependent on future claims that may be made against the Fund. The risk of material loss from such claims is considered remote.
Shareholder Expense Example
As a shareholder of a Fund, you incur two types of costs: (1) transaction costs, including sales charges (loads) on purchase payments or redemption proceeds, and (2) ongoing costs, including management fees, distribution and/or service (12b-1) fees and other Fund expenses. This Example is intended to help you understand your ongoing costs (in dollars) of investing in the Funds and to compare these costs with the ongoing costs of investing in other mutual funds.
The Example is based on an investment of $1,000 invested at the beginning of the period and held for the entire period (March 1, 2019 to August 31, 2019).
Actual Expenses
The first line of the accompanying table for each class of each Fund provides information about actual account values and actual expenses. You may use the information in this line, together with the amount you invested, to estimate the expenses that you paid over the period. Simply divide your account value by $1,000.00 (for example, an $8,600 account value divided by $1,000.00 = 8.6), then multiply the result by the number in the first line for a class of the Fund under the heading entitled "Expenses Paid During Period" to estimate the expenses you paid on your account during this period. In addition, each Fund, as a shareholder in the underlying Fidelity Central Funds, will indirectly bear its pro-rata share of the fees and expenses incurred by the underlying Fidelity Central Funds. These fees and expenses are not included in the Fund's annualized expense ratio used to calculate the expense estimate in the table below.
Hypothetical Example for Comparison Purposes
The second line of the accompanying table for each Class of each fund provides information about hypothetical account values and hypothetical expenses based on a Class' actual expense ratio and an assumed rate of return of 5% per year before expenses, which is not the Class' actual return. The hypothetical account values and expenses may not be used to estimate the actual ending account balance or expenses you paid for the period. You may use this information to compare the ongoing costs of investing in the Fund and other funds. To do so, compare this 5% hypothetical example with the 5% hypothetical examples that appear in the shareholder reports of the other funds. In addition, each Fund, as a shareholder in the underlying Fidelity Central Funds, will indirectly bear its pro-rata share of the fees and expenses incurred by the underlying Fidelity Central Funds. These fees and expenses are not included in the Fund's annualized expense ratio used to calculate the expense estimate in the table below.
Please note that the expenses shown in the table are meant to highlight your ongoing costs only and do not reflect any transaction costs. Therefore, the second line of the table is useful in comparing ongoing costs only, and will not help you determine the relative total costs of owning different funds. In addition, if these transactional costs were included, your costs would have been higher.
| | Annualized Expense RatioA | Beginning
Account Value
March 1, 2019 | Ending
Account Value
August 31, 2019 | Expenses Paid
During Period-B
March 1, 2019
to August 31, 2019 |
| Chemicals Portfolio | .79% | | | |
| Actual | | $1,000.00 | $895.00 | $3.76 |
| Hypothetical-C | | $1,000.00 | $1,021.17 | $4.01 |
| Gold Portfolio | | | | |
| Class A | 1.14% | | | |
| Actual | | $1,000.00 | $1,290.50 | $6.56 |
| Hypothetical-C | | $1,000.00 | $1,019.41 | $5.79 |
| Class M | 1.42% | | | |
| Actual | | $1,000.00 | $1,288.80 | $8.17 |
| Hypothetical-C | | $1,000.00 | $1,018.00 | $7.20 |
| Class C | 1.80% | | | |
| Actual | | $1,000.00 | $1,286.50 | $10.35 |
| Hypothetical-C | | $1,000.00 | $1,016.09 | $9.12 |
| Gold | .79% | | | |
| Actual | | $1,000.00 | $1,292.60 | $4.55 |
| Hypothetical-C | | $1,000.00 | $1,021.17 | $4.01 |
| Class I | .79% | | | |
| Actual | | $1,000.00 | $1,292.60 | $4.55 |
| Hypothetical-C | | $1,000.00 | $1,021.17 | $4.01 |
| Class Z | .64% | | | |
| Actual | | $1,000.00 | $1,293.50 | $3.69 |
| Hypothetical-C | | $1,000.00 | $1,021.92 | $3.25 |
| Materials Portfolio | | | | |
| Class A | 1.08% | | | |
| Actual | | $1,000.00 | $934.50 | $5.25 |
| Hypothetical-C | | $1,000.00 | $1,019.71 | $5.48 |
| Class M | 1.37% | | | |
| Actual | | $1,000.00 | $933.20 | $6.66 |
| Hypothetical-C | | $1,000.00 | $1,018.25 | $6.95 |
| Class C | 1.83% | | | |
| Actual | | $1,000.00 | $931.00 | $8.88 |
| Hypothetical-C | | $1,000.00 | $1,015.94 | $9.27 |
| Materials | .80% | | | |
| Actual | | $1,000.00 | $935.90 | $3.89 |
| Hypothetical-C | | $1,000.00 | $1,021.11 | $4.06 |
| Class I | .79% | | | |
| Actual | | $1,000.00 | $935.90 | $3.84 |
| Hypothetical-C | | $1,000.00 | $1,021.17 | $4.01 |
| Class Z | .63% | | | |
| Actual | | $1,000.00 | $936.50 | $3.07 |
| Hypothetical-C | | $1,000.00 | $1,021.97 | $3.20 |
A Annualized expense ratio reflects expenses net of applicable fee waivers.
B Expenses are equal to each Class' annualized expense ratio, multiplied by the average account value over the period, multiplied by 184/ 366 (to reflect the one-half year period).
C 5% return per year before expenses
SELMT-SANN-1019
1.846035.112
Fidelity® Select Portfolios®
Telecommunications Services Sector Telecommunications Portfolio
Wireless Portfolio
Semi-Annual Report August 31, 2019 Includes Fidelity and Fidelity Advisor share classes |
|
Beginning on January 1, 2021, as permitted by regulations adopted by the Securities and Exchange Commission, paper copies of a fund’s shareholder reports will no longer be sent by mail, unless you specifically request paper copies of the reports from the fund or from your financial intermediary, such as a financial advisor, broker-dealer or bank. Instead, the reports will be made available on a website, and you will be notified by mail each time a report is posted and provided with a website link to access the report.
If you already elected to receive shareholder reports electronically, you will not be affected by this change and you need not take any action. You may elect to receive shareholder reports and other communications from a fund electronically, by contacting your financial intermediary. For Fidelity customers, visit Fidelity's web site or call Fidelity using the contact information listed below.
You may elect to receive all future reports in paper free of charge. If you wish to continue receiving paper copies of your shareholder reports, you may contact your financial intermediary or, if you are a Fidelity customer, visit Fidelity’s website, or call Fidelity at the applicable toll-free number listed below. Your election to receive reports in paper will apply to all funds held with the fund complex/your financial intermediary.
| Account Type | Website | Phone Number |
| Brokerage, Mutual Fund, or Annuity Contracts: | fidelity.com/mailpreferences | 1-800-343-3548 |
| Employer Provided Retirement Accounts: | netbenefits.fidelity.com/preferences (choose 'no' under Required Disclosures to continue to print) | 1-800-343-0860 |
| Advisor Sold Accounts Serviced Through Your Financial Intermediary: | Contact Your Financial Intermediary | Your Financial Intermediary's phone number |
| Advisor Sold Accounts Serviced by Fidelity: | institutional.fidelity.com | 1-877-208-0098 |
Contents
To view a fund's proxy voting guidelines and proxy voting record for the 12-month period ended June 30, visit http://www.fidelity.com/proxyvotingresults or visit the Securities and Exchange Commission's (SEC) web site at http://www.sec.gov.
You may also call 1-800-544-8544 if you’re an individual investing directly with Fidelity, call 1-800-835-5092 if you’re a plan sponsor or participant with Fidelity as your recordkeeper or call 1-877-208-0098 on institutional accounts or if you’re an advisor or invest through one to request a free copy of the proxy voting guidelines.
Standard & Poor's, S&P and S&P 500 are registered service marks of The McGraw-Hill Companies, Inc. and have been licensed for use by Fidelity Distributors Corporation.
Other third-party marks appearing herein are the property of their respective owners.
All other marks appearing herein are registered or unregistered trademarks or service marks of FMR LLC or an affiliated company. © 2019 FMR LLC. All rights reserved.
This report and the financial statements contained herein are submitted for the general information of the shareholders of the Funds. This report is not authorized for distribution to prospective investors in the Funds unless preceded or accompanied by an effective prospectus.
A fund files its complete schedule of portfolio holdings with the SEC for the first and third quarters of each fiscal year on Form N-PORT. Forms N-PORT are available on the SEC’s web site at http://www.sec.gov. A fund's Forms N-PORT may be reviewed and copied at the SEC’s Public Reference Room in Washington, DC. Information regarding the operation of the SEC's Public Reference Room may be obtained by calling 1-800-SEC-0330.
For a complete list of a fund's portfolio holdings, view the most recent holdings listing, semiannual report, or annual report on Fidelity's web site at http://www.fidelity.com, http://www.institutional.fidelity.com, or http://www.401k.com, as applicable.
NOT FDIC INSURED •MAY LOSE VALUE •NO BANK GUARANTEE
Neither the Funds nor Fidelity Distributors Corporation is a bank.
Telecommunications Portfolio
Investment Summary (Unaudited)
Top Ten Stocks as of August 31, 2019
| | % of fund's net assets |
| AT&T, Inc. | 24.9 |
| Verizon Communications, Inc. | 16.8 |
| T-Mobile U.S., Inc. | 7.0 |
| CenturyLink, Inc. | 4.7 |
| Vonage Holdings Corp. | 4.4 |
| Iridium Communications, Inc. | 4.3 |
| Liberty Broadband Corp. Class A | 3.2 |
| Cogent Communications Group, Inc. | 3.0 |
| Sprint Corp. | 2.8 |
| Liberty Global PLC Class C | 2.3 |
| | 73.4 |
Top Industries (% of fund's net assets)
| As of August 31, 2019 |
| | Diversified Telecommunication Services | 68.9% |
| | Wireless Telecommunication Services | 15.8% |
| | Media | 8.4% |
| | Entertainment | 2.1% |
| | Interactive Media & Services | 2.1% |
| | All Others* | 2.7% |

* Includes short-term investments and net other assets (liabilities).
Telecommunications Portfolio
Schedule of Investments August 31, 2019 (Unaudited)
Showing Percentage of Net Assets
| Common Stocks - 99.2% | | | |
| | | Shares | Value |
| Communications Equipment - 0.7% | | | |
| Communications Equipment - 0.7% | | | |
| CommScope Holding Co., Inc. (a) | | 179,400 | $1,926,756 |
| Construction & Engineering - 0.4% | | | |
| Construction & Engineering - 0.4% | | | |
| Dycom Industries, Inc. (a) | | 28,000 | 1,246,000 |
| Diversified Telecommunication Services - 68.9% | | | |
| Alternative Carriers - 21.3% | | | |
| CenturyLink, Inc. (b) | | 1,169,300 | 13,306,634 |
| Cogent Communications Group, Inc. | | 142,139 | 8,654,844 |
| GCI Liberty, Inc. (a) | | 62,100 | 3,865,104 |
| Globalstar, Inc. (a)(b) | | 1,102,348 | 417,018 |
| Iliad SA | | 23,667 | 2,477,308 |
| Iridium Communications, Inc. (a) | | 504,211 | 12,191,822 |
| ORBCOMM, Inc. (a) | | 349,349 | 1,610,499 |
| Vonage Holdings Corp. (a) | | 947,271 | 12,522,923 |
| Zayo Group Holdings, Inc. (a) | | 160,000 | 5,385,600 |
| | | | 60,431,752 |
| Integrated Telecommunication Services - 47.6% | | | |
| AT&T, Inc. | | 2,002,220 | 70,598,276 |
| Atn International, Inc. | | 79,300 | 4,505,826 |
| Bandwidth, Inc. (a) | | 35,100 | 3,060,369 |
| Cincinnati Bell, Inc. (a)(b) | | 638,102 | 3,464,894 |
| Consolidated Communications Holdings, Inc. (b) | | 411,800 | 1,659,554 |
| Masmovil Ibercom SA (a) | | 199,200 | 4,076,491 |
| Verizon Communications, Inc. | | 816,097 | 47,464,202 |
| | | | 134,829,612 |
|
| TOTAL DIVERSIFIED TELECOMMUNICATION SERVICES | | | 195,261,364 |
|
| Entertainment - 2.1% | | | |
| Interactive Home Entertainment - 2.1% | | | |
| Activision Blizzard, Inc. | | 115,800 | 5,859,480 |
| Equity Real Estate Investment Trusts (REITs) - 0.2% | | | |
| Specialized REITs - 0.2% | | | |
| American Tower Corp. | | 2,890 | 665,249 |
| Interactive Media & Services - 2.1% | | | |
| Interactive Media & Services - 2.1% | | | |
| Alphabet, Inc. Class A (a) | | 5,100 | 6,071,703 |
| Media - 8.4% | | | |
| Cable & Satellite - 8.4% | | | |
| Comcast Corp. Class A | | 130,000 | 5,753,800 |
| Liberty Broadband Corp. Class A (a) | | 85,700 | 8,977,075 |
| Liberty Global PLC Class C (a) | | 248,936 | 6,502,208 |
| Liberty Latin America Ltd. Class C (a) | | 76,734 | 1,265,344 |
| Megacable Holdings S.A.B. de CV unit | | 295,600 | 1,206,796 |
| | | | 23,705,223 |
| Semiconductors & Semiconductor Equipment - 0.6% | | | |
| Semiconductors - 0.6% | | | |
| Qorvo, Inc. (a) | | 21,600 | 1,542,888 |
| Wireless Telecommunication Services - 15.8% | | | |
| Wireless Telecommunication Services - 15.8% | | | |
| Boingo Wireless, Inc. (a) | | 218,400 | 2,810,808 |
| Shenandoah Telecommunications Co. | | 158,267 | 4,991,741 |
| SoftBank Corp. | | 56,300 | 2,556,513 |
| Sprint Corp. (a) | | 1,180,485 | 8,015,493 |
| T-Mobile U.S., Inc. (a) | | 253,397 | 19,777,636 |
| Telephone & Data Systems, Inc. | | 171,564 | 4,323,413 |
| U.S. Cellular Corp. (a) | | 66,900 | 2,407,731 |
| | | | 44,883,335 |
| TOTAL COMMON STOCKS | | | |
| (Cost $237,143,231) | | | 281,161,998 |
|
| Money Market Funds - 4.5% | | | |
| Fidelity Cash Central Fund 2.13% (c) | | 3,049,010 | 3,049,620 |
| Fidelity Securities Lending Cash Central Fund 2.13% (c)(d) | | 9,888,374 | 9,889,363 |
| TOTAL MONEY MARKET FUNDS | | | |
| (Cost $12,938,892) | | | 12,938,983 |
| TOTAL INVESTMENT IN SECURITIES - 103.7% | | | |
| (Cost $250,082,123) | | | 294,100,981 |
| NET OTHER ASSETS (LIABILITIES) - (3.7)% | | | (10,624,471) |
| NET ASSETS - 100% | | | $283,476,510 |
Legend
(a) Non-income producing
(b) Security or a portion of the security is on loan at period end.
(c) Affiliated fund that is generally available only to investment companies and other accounts managed by Fidelity Investments. The rate quoted is the annualized seven-day yield of the fund at period end. A complete unaudited listing of the fund's holdings as of its most recent quarter end is available upon request. In addition, each Fidelity Central Fund's financial statements are available on the SEC's website or upon request.
(d) Investment made with cash collateral received from securities on loan.
Affiliated Central Funds
Information regarding fiscal year to date income earned by the Fund from investments in Fidelity Central Funds is as follows:
| Fund | Income earned |
| Fidelity Cash Central Fund | $15,761 |
| Fidelity Securities Lending Cash Central Fund | 4,609 |
| Total | $20,370 |
Amounts in the income column in the above table include any capital gain distributions from underlying funds, which are presented in the corresponding line-item in the Statement of Operations, if applicable. Amount for Fidelity Securities Lending Cash Central Fund represents the income earned on investing cash collateral, less rebates paid to borrowers and any lending agent fees associated with the loan, plus any premium payments received for lending certain types of securities.
Investment Valuation
All investments are categorized as Level 1 under the Fair Value Hierarchy. The inputs or methodology used for valuing securities may not be an indication of the risk associated with investing in those securities. For more information on valuation inputs please refer to the Investment Valuation section in the accompanying Notes to Financial Statements.
See accompanying notes which are an integral part of the financial statements.
Telecommunications Portfolio
Financial Statements
Statement of Assets and Liabilities
| | | August 31, 2019 (Unaudited) |
| Assets | | |
Investment in securities, at value (including securities loaned of $9,073,234) — See accompanying schedule:
Unaffiliated issuers (cost $237,143,231) | $281,161,998 | |
| Fidelity Central Funds (cost $12,938,892) | 12,938,983 | |
| Total Investment in Securities (cost $250,082,123) | | $294,100,981 |
| Receivable for fund shares sold | | 39,921 |
| Dividends receivable | | 380,452 |
| Distributions receivable from Fidelity Central Funds | | 3,006 |
| Prepaid expenses | | 3,114 |
| Other receivables | | 6,724 |
| Total assets | | 294,534,198 |
| Liabilities | | |
| Payable for fund shares redeemed | $953,647 | |
| Accrued management fee | 125,303 | |
| Distribution and service plan fees payable | 12,103 | |
| Other affiliated payables | 61,798 | |
| Other payables and accrued expenses | 23,483 | |
| Collateral on securities loaned | 9,881,354 | |
| Total liabilities | | 11,057,688 |
| Net Assets | | $283,476,510 |
| Net Assets consist of: | | |
| Paid in capital | | $236,264,499 |
| Total distributable earnings (loss) | | 47,212,011 |
| Net Assets | | $283,476,510 |
| Net Asset Value and Maximum Offering Price | | |
| Class A: | | |
| Net Asset Value and redemption price per share ($20,820,043 ÷ 352,941 shares)(a) | | $58.99 |
| Maximum offering price per share (100/94.25 of $58.99) | | $62.59 |
| Class M: | | |
| Net Asset Value and redemption price per share ($6,204,542 ÷ 105,812 shares)(a) | | $58.64 |
| Maximum offering price per share (100/96.50 of $58.64) | | $60.77 |
| Class C: | | |
| Net Asset Value and offering price per share ($6,355,891 ÷ 108,444 shares)(a) | | $58.61 |
| Telecommunications: | | |
| Net Asset Value, offering price and redemption price per share ($219,816,451 ÷ 3,697,694 shares) | | $59.45 |
| Class I: | | |
| Net Asset Value, offering price and redemption price per share ($26,270,324 ÷ 443,666 shares) | | $59.21 |
| Class Z: | | |
| Net Asset Value, offering price and redemption price per share ($4,009,259 ÷ 67,651 shares) | | $59.26 |
(a) Redemption price per share is equal to net asset value less any applicable contingent deferred sales charge.
See accompanying notes which are an integral part of the financial statements.
Statement of Operations
| | | Six months ended August 31, 2019 (Unaudited) |
| Investment Income | | |
| Dividends | | $4,494,054 |
| Income from Fidelity Central Funds (including $4,609 from security lending) | | 20,370 |
| Total income | | 4,514,424 |
| Expenses | | |
| Management fee | $767,614 | |
| Transfer agent fees | 317,790 | |
| Distribution and service plan fees | 75,525 | |
| Accounting and security lending fees | 55,858 | |
| Custodian fees and expenses | 2,398 | |
| Independent trustees' fees and expenses | 796 | |
| Registration fees | 44,597 | |
| Audit | 32,457 | |
| Legal | 320 | |
| Miscellaneous | 1,859 | |
| Total expenses before reductions | 1,299,214 | |
| Expense reductions | (1,249) | |
| Total expenses after reductions | | 1,297,965 |
| Net investment income (loss) | | 3,216,459 |
| Realized and Unrealized Gain (Loss) | | |
| Net realized gain (loss) on: | | |
| Investment securities: | | |
| Unaffiliated issuers | 10,034,604 | |
| Fidelity Central Funds | 204 | |
| Foreign currency transactions | (15,704) | |
| Total net realized gain (loss) | | 10,019,104 |
| Change in net unrealized appreciation (depreciation) on: | | |
| Investment securities: | | |
| Unaffiliated issuers | 4,895,519 | |
| Fidelity Central Funds | (318) | |
| Assets and liabilities in foreign currencies | (47) | |
| Total change in net unrealized appreciation (depreciation) | | 4,895,154 |
| Net gain (loss) | | 14,914,258 |
| Net increase (decrease) in net assets resulting from operations | | $18,130,717 |
See accompanying notes which are an integral part of the financial statements.
Statement of Changes in Net Assets
| | Six months ended August 31, 2019 (Unaudited) | Year ended February 28, 2019 |
| Increase (Decrease) in Net Assets | | |
| Operations | | |
| Net investment income (loss) | $3,216,459 | $6,750,662 |
| Net realized gain (loss) | 10,019,104 | 6,025,654 |
| Change in net unrealized appreciation (depreciation) | 4,895,154 | (5,510,177) |
| Net increase (decrease) in net assets resulting from operations | 18,130,717 | 7,266,139 |
| Distributions to shareholders | (1,280,371) | (9,778,496) |
| Share transactions - net increase (decrease) | (19,976,530) | (71,184,477) |
| Total increase (decrease) in net assets | (3,126,184) | (73,696,834) |
| Net Assets | | |
| Beginning of period | 286,602,694 | 360,299,528 |
| End of period | $283,476,510 | $286,602,694 |
See accompanying notes which are an integral part of the financial statements.
Financial Highlights
Telecommunications Portfolio Class A
| | Six months ended (Unaudited) August 31, | Years endedFebruary 28, | | | | |
| | 2019 | 2019 | 2018 | 2017 | 2016 A | 2015 |
| Selected Per–Share Data | | | | | | |
| Net asset value, beginning of period | $55.68 | $55.58 | $69.61 | $62.32 | $63.26 | $58.71 |
| Income from Investment Operations | | | | | | |
| Net investment income (loss)B | .57 | 1.10C | 1.05 | .88 | .81 | .76 |
| Net realized and unrealized gain (loss) | 2.97 | .56 | (3.38) | 10.68 | (.76) | 5.83 |
| Total from investment operations | 3.54 | 1.66 | (2.33) | 11.56 | .05 | 6.59 |
| Distributions from net investment income | (.23) | (.94) | (1.31) | (1.11) | (.54) | (2.04) |
| Distributions from net realized gain | – | (.62) | (10.39) | (3.16) | (.45) | – |
| Total distributions | (.23) | (1.56) | (11.70) | (4.27) | (.99) | (2.04) |
| Redemption fees added to paid in capitalB | – | – | – | –D | –D | –D |
| Net asset value, end of period | $58.99 | $55.68 | $55.58 | $69.61 | $62.32 | $63.26 |
| Total ReturnE,F,G | 6.36% | 3.03% | (4.06)% | 18.65% | .16% | 11.54% |
| Ratios to Average Net AssetsH,I | | | | | | |
| Expenses before reductions | 1.19%J | 1.18% | 1.14% | 1.14% | 1.15% | 1.15% |
| Expenses net of fee waivers, if any | 1.19%J | 1.17% | 1.14% | 1.14% | 1.15% | 1.15% |
| Expenses net of all reductions | 1.19%J | 1.16% | 1.12% | 1.12% | 1.15% | 1.15% |
| Net investment income (loss) | 1.97%J | 1.96%C | 1.59% | 1.28% | 1.33% | 1.26% |
| Supplemental Data | | | | | | |
| Net assets, end of period (000 omitted) | $20,820 | $20,589 | $17,816 | $31,966 | $13,032 | $11,052 |
| Portfolio turnover rateK | 34%J | 64%L | 66% | 105%L | 51% | 94%L |
A For the year ended February 29.
B Calculated based on average shares outstanding during the period.
C Net investment income per share reflects a large, non-recurring dividend which amounted to $.25 per share. Excluding this non-recurring dividend, the ratio of net investment income (loss) to average net assets would have been 1.52%.
D Amount represents less than $.005 per share.
E Total returns for periods of less than one year are not annualized.
F Total returns would have been lower if certain expenses had not been reduced during the applicable periods shown.
G Total returns do not include the effect of the sales charges.
H Fees and expenses of any underlying Fidelity Central Funds are not included in the Fund's expense ratio. The Fund indirectly bears its proportionate share of the expenses of any underlying Fidelity Central Funds.
I Expense ratios reflect operating expenses of the class. Expenses before reductions do not reflect amounts reimbursed by the investment adviser or reductions from brokerage service arrangements or reductions from other expense offset arrangements and do not represent the amount paid by the class during periods when reimbursements or reductions occur. Expenses net of fee waivers reflect expenses after reimbursement by the investment adviser but prior to reductions from brokerage service arrangements or other expense offset arrangements. Expenses net of all reductions represent the net expenses paid by the class.
J Annualized
K Amount does not include the portfolio activity of any underlying Fidelity Central Funds.
L Portfolio turnover rate excludes securities received or delivered in-kind.
See accompanying notes which are an integral part of the financial statements.
Telecommunications Portfolio Class M
| | Six months ended (Unaudited) August 31, | Years endedFebruary 28, | | | | |
| | 2019 | 2019 | 2018 | 2017 | 2016 A | 2015 |
| Selected Per–Share Data | | | | | | |
| Net asset value, beginning of period | $55.40 | $55.31 | $69.33 | $61.95 | $63.04 | $58.50 |
| Income from Investment Operations | | | | | | |
| Net investment income (loss)B | .48 | .92C | .81 | .65 | .61 | .57 |
| Net realized and unrealized gain (loss) | 2.97 | .55 | (3.36) | 10.62 | (.76) | 5.81 |
| Total from investment operations | 3.45 | 1.47 | (2.55) | 11.27 | (.15) | 6.38 |
| Distributions from net investment income | (.21) | (.76) | (1.07) | (.73) | (.49) | (1.84) |
| Distributions from net realized gain | – | (.62) | (10.39) | (3.16) | (.45) | – |
| Total distributions | (.21) | (1.38) | 11.47D | (3.89) | (.94) | (1.84) |
| Redemption fees added to paid in capitalB | – | – | – | –E | –E | –E |
| Net asset value, end of period | $58.64 | $55.40 | $55.31 | $69.33 | $61.95 | $63.04 |
| Total ReturnF,G,H | 6.23% | 2.69% | (4.40)% | 18.26% | (.16)% | 11.19% |
| Ratios to Average Net AssetsI,J | | | | | | |
| Expenses before reductions | 1.48%K | 1.50% | 1.49% | 1.46% | 1.47% | 1.47% |
| Expenses net of fee waivers, if any | 1.47%K | 1.49% | 1.49% | 1.46% | 1.47% | 1.47% |
| Expenses net of all reductions | 1.47%K | 1.48% | 1.48% | 1.44% | 1.46% | 1.46% |
| Net investment income (loss) | 1.68%K | 1.64%C | 1.24% | .96% | 1.01% | .94% |
| Supplemental Data | | | | | | |
| Net assets, end of period (000 omitted) | $6,205 | $6,018 | $4,847 | $6,933 | $8,280 | $5,095 |
| Portfolio turnover rateL | 34%K | 64%M | 66% | 105%M | 51% | 94%M |
A For the year ended February 29.
B Calculated based on average shares outstanding during the period.
C Net investment income per share reflects a large, non-recurring dividend which amounted to $.25 per share. Excluding this non-recurring dividend, the ratio of net investment income (loss) to average net assets would have been 1.19%.
D Total distributions of $11.47 per share is comprised of distributions from net investment income of $1.073 and distributions from net realized gain of $10.393 per share.
E Amount represents less than $.005 per share.
F Total returns for periods of less than one year are not annualized.
G Total returns would have been lower if certain expenses had not been reduced during the applicable periods shown.
H Total returns do not include the effect of the sales charges.
I Fees and expenses of any underlying Fidelity Central Funds are not included in the Fund's expense ratio. The Fund indirectly bears its proportionate share of the expenses of any underlying Fidelity Central Funds.
J Expense ratios reflect operating expenses of the class. Expenses before reductions do not reflect amounts reimbursed by the investment adviser or reductions from brokerage service arrangements or reductions from other expense offset arrangements and do not represent the amount paid by the class during periods when reimbursements or reductions occur. Expenses net of fee waivers reflect expenses after reimbursement by the investment adviser but prior to reductions from brokerage service arrangements or other expense offset arrangements. Expenses net of all reductions represent the net expenses paid by the class.
K Annualized
L Amount does not include the portfolio activity of any underlying Fidelity Central Funds.
M Portfolio turnover rate excludes securities received or delivered in-kind.
See accompanying notes which are an integral part of the financial statements.
Telecommunications Portfolio Class C
| | Six months ended (Unaudited) August 31, | Years endedFebruary 28, | | | | |
| | 2019 | 2019 | 2018 | 2017 | 2016 A | 2015 |
| Selected Per–Share Data | | | | | | |
| Net asset value, beginning of period | $55.45 | $55.29 | $69.24 | $62.10 | $63.04 | $58.54 |
| Income from Investment Operations | | | | | | |
| Net investment income (loss)B | .36 | .70C | .57 | .37 | .36 | .34 |
| Net realized and unrealized gain (loss) | 2.97 | .56 | (3.36) | 10.62 | (.75) | 5.80 |
| Total from investment operations | 3.33 | 1.26 | (2.79) | 10.99 | (.39) | 6.14 |
| Distributions from net investment income | (.17) | (.48) | (.77) | (.69) | (.10) | (1.64) |
| Distributions from net realized gain | – | (.62) | (10.39) | (3.16) | (.45) | – |
| Total distributions | (.17) | (1.10) | (11.16) | (3.85) | (.55) | (1.64) |
| Redemption fees added to paid in capitalB | – | – | – | –D | –D | –D |
| Net asset value, end of period | $58.61 | $55.45 | $55.29 | $69.24 | $62.10 | $63.04 |
| Total ReturnE,F,G | 6.00% | 2.30% | (4.75)% | 17.77% | (.57)% | 10.75% |
| Ratios to Average Net AssetsH,I | | | | | | |
| Expenses before reductions | 1.88%J | 1.88% | 1.86% | 1.88% | 1.89% | 1.85% |
| Expenses net of fee waivers, if any | 1.88%J | 1.88% | 1.86% | 1.88% | 1.89% | 1.85% |
| Expenses net of all reductions | 1.88%J | 1.86% | 1.85% | 1.86% | 1.88% | 1.85% |
| Net investment income (loss) | 1.27%J | 1.26%C | .87% | .54% | .60% | .56% |
| Supplemental Data | | | | | | |
| Net assets, end of period (000 omitted) | $6,356 | $6,994 | $8,396 | $13,528 | $7,735 | $7,074 |
| Portfolio turnover rateK | 34%J | 64%L | 66% | 105%L | 51% | 94%L |
A For the year ended February 29.
B Calculated based on average shares outstanding during the period.
C Net investment income per share reflects a large, non-recurring dividend which amounted to $.25 per share. Excluding this non-recurring dividend, the ratio of net investment income (loss) to average net assets would have been .81%.
D Amount represents less than $.005 per share.
E Total returns for periods of less than one year are not annualized.
F Total returns would have been lower if certain expenses had not been reduced during the applicable periods shown.
G Total returns do not include the effect of the contingent deferred sales charge.
H Fees and expenses of any underlying Fidelity Central Funds are not included in the Fund's expense ratio. The Fund indirectly bears its proportionate share of the expenses of any underlying Fidelity Central Funds.
I Expense ratios reflect operating expenses of the class. Expenses before reductions do not reflect amounts reimbursed by the investment adviser or reductions from brokerage service arrangements or reductions from other expense offset arrangements and do not represent the amount paid by the class during periods when reimbursements or reductions occur. Expenses net of fee waivers reflect expenses after reimbursement by the investment adviser but prior to reductions from brokerage service arrangements or other expense offset arrangements. Expenses net of all reductions represent the net expenses paid by the class.
J Annualized
K Amount does not include the portfolio activity of any underlying Fidelity Central Funds.
L Portfolio turnover rate excludes securities received or delivered in-kind.
See accompanying notes which are an integral part of the financial statements.
Telecommunications Portfolio
| | Six months ended (Unaudited) August 31, | Years endedFebruary 28, | | | | |
| | 2019 | 2019 | 2018 | 2017 | 2016 A | 2015 |
| Selected Per–Share Data | | | | | | |
| Net asset value, beginning of period | $56.04 | $55.88 | $69.97 | $62.58 | $63.54 | $58.94 |
| Income from Investment Operations | | | | | | |
| Net investment income (loss)B | .67 | 1.30C | 1.28 | 1.12 | 1.02 | .96 |
| Net realized and unrealized gain (loss) | 3.01 | .56 | (3.42) | 10.74 | (.77) | 5.85 |
| Total from investment operations | 3.68 | 1.86 | (2.14) | 11.86 | .25 | 6.81 |
| Distributions from net investment income | (.27) | (1.08) | (1.56) | (1.31) | (.76) | (2.21) |
| Distributions from net realized gain | – | (.62) | (10.39) | (3.16) | (.45) | – |
| Total distributions | (.27) | (1.70) | (11.95) | (4.47) | (1.21) | (2.21) |
| Redemption fees added to paid in capitalB | – | – | – | –D | –D | –D |
| Net asset value, end of period | $59.45 | $56.04 | $55.88 | $69.97 | $62.58 | $63.54 |
| Total ReturnE,F | 6.56% | 3.38% | (3.76)% | 19.06% | .49% | 11.90% |
| Ratios to Average Net AssetsG,H | | | | | | |
| Expenses before reductions | .83%I | .84% | .82% | .80% | .82% | .83% |
| Expenses net of fee waivers, if any | .83%I | .83% | .82% | .80% | .81% | .83% |
| Expenses net of all reductions | .83%I | .82% | .80% | .78% | .81% | .82% |
| Net investment income (loss) | 2.32%I | 2.30%C | 1.92% | 1.62% | 1.67% | 1.58% |
| Supplemental Data | | | | | | |
| Net assets, end of period (000 omitted) | $219,816 | $227,438 | $320,908 | $690,720 | $689,600 | $346,174 |
| Portfolio turnover rateJ | 34%I | 64%K | 66% | 105%K | 51% | 94%K |
A For the year ended February 29.
B Calculated based on average shares outstanding during the period.
C Net investment income per share reflects a large, non-recurring dividend which amounted to $.25 per share. Excluding this non-recurring dividend, the ratio of net investment income (loss) to average net assets would have been 1.85%.
D Amount represents less than $.005 per share.
E Total returns for periods of less than one year are not annualized.
F Total returns would have been lower if certain expenses had not been reduced during the applicable periods shown.
G Fees and expenses of any underlying Fidelity Central Funds are not included in the Fund's expense ratio. The Fund indirectly bears its proportionate share of the expenses of any underlying Fidelity Central Funds.
H Expense ratios reflect operating expenses of the class. Expenses before reductions do not reflect amounts reimbursed by the investment adviser or reductions from brokerage service arrangements or reductions from other expense offset arrangements and do not represent the amount paid by the class during periods when reimbursements or reductions occur. Expenses net of fee waivers reflect expenses after reimbursement by the investment adviser but prior to reductions from brokerage service arrangements or other expense offset arrangements. Expenses net of all reductions represent the net expenses paid by the class.
I Annualized
J Amount does not include the portfolio activity of any underlying Fidelity Central Funds.
K Portfolio turnover rate excludes securities received or delivered in-kind.
See accompanying notes which are an integral part of the financial statements.
Telecommunications Portfolio Class I
| | Six months ended (Unaudited) August 31, | Years endedFebruary 28, | | | | |
| | 2019 | 2019 | 2018 | 2017 | 2016 A | 2015 |
| Selected Per–Share Data | | | | | | |
| Net asset value, beginning of period | $55.84 | $55.74 | $69.82 | $62.46 | $63.38 | $58.80 |
| Income from Investment Operations | | | | | | |
| Net investment income (loss)B | .64 | 1.27C | 1.26 | 1.12 | 1.02 | .94 |
| Net realized and unrealized gain (loss) | 2.99 | .57 | (3.39) | 10.70 | (.76) | 5.83 |
| Total from investment operations | 3.63 | 1.84 | (2.13) | 11.82 | .26 | 6.77 |
| Distributions from net investment income | (.26) | (1.12) | (1.56) | (1.30) | (.73) | (2.19) |
| Distributions from net realized gain | – | (.62) | (10.39) | (3.16) | (.45) | – |
| Total distributions | (.26) | (1.74) | (11.95) | (4.46) | (1.18) | (2.19) |
| Redemption fees added to paid in capitalB | – | – | – | –D | –D | –D |
| Net asset value, end of period | $59.21 | $55.84 | $55.74 | $69.82 | $62.46 | $63.38 |
| Total ReturnE,F | 6.50% | 3.35% | (3.75)% | 19.03% | .51% | 11.85% |
| Ratios to Average Net AssetsG,H | | | | | | |
| Expenses before reductions | .93%I | .91% | .82% | .80% | .82% | .86% |
| Expenses net of fee waivers, if any | .93%I | .90% | .82% | .80% | .82% | .86% |
| Expenses net of all reductions | .93%I | .88% | .80% | .78% | .81% | .85% |
| Net investment income (loss) | 2.22%I | 2.23%C | 1.91% | 1.62% | 1.67% | 1.55% |
| Supplemental Data | | | | | | |
| Net assets, end of period (000 omitted) | $26,270 | $25,181 | $8,332 | $14,550 | $6,197 | $2,505 |
| Portfolio turnover rateJ | 34%I | 64%K | 66% | 105%K | 51% | 94%K |
A For the year ended February 29.
B Calculated based on average shares outstanding during the period.
C Net investment income per share reflects a large, non-recurring dividend which amounted to $.25 per share. Excluding this non-recurring dividend, the ratio of net investment income (loss) to average net assets would have been 1.79%.
D Amount represents less than $.005 per share.
E Total returns for periods of less than one year are not annualized.
F Total returns would have been lower if certain expenses had not been reduced during the applicable periods shown.
G Fees and expenses of any underlying Fidelity Central Funds are not included in the Fund's expense ratio. The Fund indirectly bears its proportionate share of the expenses of any underlying Fidelity Central Funds.
H Expense ratios reflect operating expenses of the class. Expenses before reductions do not reflect amounts reimbursed by the investment adviser or reductions from brokerage service arrangements or reductions from other expense offset arrangements and do not represent the amount paid by the class during periods when reimbursements or reductions occur. Expenses net of fee waivers reflect expenses after reimbursement by the investment adviser but prior to reductions from brokerage service arrangements or other expense offset arrangements. Expenses net of all reductions represent the net expenses paid by the class.
I Annualized
J Amount does not include the portfolio activity of any underlying Fidelity Central Funds.
K Portfolio turnover rate excludes securities received or delivered in-kind.
See accompanying notes which are an integral part of the financial statements.
Telecommunications Portfolio Class Z
| | Six months ended (Unaudited) August 31, | Years endedFebruary 28, |
| | 2019 | 2019 A |
| Selected Per–Share Data | | |
| Net asset value, beginning of period | $55.84 | $60.97 |
| Income from Investment Operations | | |
| Net investment income (loss) | .69 | .39B |
| Net realized and unrealized gain (loss) | 3.01 | (4.55)C |
| Total from investment operations | 3.70 | (4.16) |
| Distributions from net investment income | (.28) | (.97) |
| Distributions from net realized gain | – | – |
| Total distributions | (.28) | (.97) |
| Net asset value, end of period | $59.26 | $55.84 |
| Total ReturnD,E | 6.65% | (6.80)% |
| Ratios to Average Net AssetsF,G | | |
| Expenses before reductions | .68%H | .68%H |
| Expenses net of fee waivers, if any | .68%H | .66%H |
| Expenses net of all reductions | .68%H | .64%H |
| Net investment income (loss) | 2.48%H | 1.67%B,H |
| Supplemental Data | | |
| Net assets, end of period (000 omitted) | $4,009 | $383 |
| Portfolio turnover rateI | 34%H | 64%J |
A For the period October 2, 2018 (commencement of sale of shares) to February 28, 2019.
B Net investment income per share reflects a large, non-recurring dividend which amounted to $.10 per share. Excluding this non-recurring dividend, the ratio of net investment income (loss) to average net assets would have been 1.23%.
C The amount shown for a share outstanding does not correspond with the aggregate net gain (loss) on investments for the period due to the timing of sales and repurchases of shares in relation to fluctuating market values of the investments of the Fund.
D Total returns for periods of less than one year are not annualized.
E Total returns would have been lower if certain expenses had not been reduced during the applicable periods shown.
F Fees and expenses of any underlying Fidelity Central Funds are not included in the Fund's expense ratio. The Fund indirectly bears its proportionate share of the expenses of any underlying Fidelity Central Funds.
G Expense ratios reflect operating expenses of the class. Expenses before reductions do not reflect amounts reimbursed by the investment adviser or reductions from brokerage service arrangements or reductions from other expense offset arrangements and do not represent the amount paid by the class during periods when reimbursements or reductions occur. Expense ratios before reductions for start-up periods may not be representative of longer-term operating periods. Expenses net of fee waivers reflect expenses after reimbursement by the investment adviser but prior to reductions from brokerage service arrangements or other expense offset arrangements. Expenses net of all reductions represent the net expenses paid by the class.
H Annualized
I Amount does not include the portfolio activity of any underlying Fidelity Central Funds.
J Portfolio turnover rate excludes securities received or delivered in-kind.
See accompanying notes which are an integral part of the financial statements.
Notes to Financial Statements (Unaudited)
For the period ended August 31, 2019
1. Organization.
Telecommunications Portfolio (the Fund) is a non-diversified fund of Fidelity Select Portfolios (the Trust) and is authorized to issue an unlimited number of shares. The Trust is registered under the Investment Company Act of 1940, as amended (the 1940 Act), as an open-end management investment company organized as a Massachusetts business trust. The Fund invests primarily in securities of companies whose principal business activities fall within specific industries. The Fund offers Class A, Class M, Class C, Telecommunications, Class I and Class Z shares, each of which has equal rights as to assets and voting privileges. Each class has exclusive voting rights with respect to matters that affect that class. Effective March 1, 2019, Class C shares will automatically convert to Class A shares after a holding period of ten years from the initial date of purchase, with certain exceptions.
2. Investments in Fidelity Central Funds.
The Fund invests in Fidelity Central Funds, which are open-end investment companies generally available only to other investment companies and accounts managed by the investment adviser and its affiliates. The Fund's Schedule of Investments lists each of the Fidelity Central Funds held as of period end, if any, as an investment of the Fund, but does not include the underlying holdings of each Fidelity Central Fund. As an Investing Fund, the Fund indirectly bears its proportionate share of the expenses of the underlying Fidelity Central Funds.
The Money Market Central Funds seek preservation of capital and current income and are managed by Fidelity Investments Money Management, Inc. (FIMM), an affiliate of the investment adviser. Annualized expenses of the Money Market Central Funds as of their most recent shareholder report date ranged from less than .005% to .01%.
A complete unaudited list of holdings for each Fidelity Central Fund is available upon request or at the Securities and Exchange Commission (the SEC) website at www.sec.gov. In addition, the financial statements of the Fidelity Central Funds are available on the SEC website or upon request.
3. Significant Accounting Policies.
The Fund is an investment company and applies the accounting and reporting guidance of the Financial Accounting Standards Board (FASB) Accounting Standards Codification Topic 946 Financial Services – Investments Companies. The financial statements have been prepared in conformity with accounting principles generally accepted in the United States of America (GAAP), which require management to make certain estimates and assumptions at the date of the financial statements. Actual results could differ from those estimates. Subsequent events, if any, through the date that the financial statements were issued have been evaluated in the preparation of the financial statements. The following summarizes the significant accounting policies of the Fund:
Investment Valuation. Investments are valued as of 4:00 p.m. Eastern time on the last calendar day of the period. The Board of Trustees (the Board) has delegated the day to day responsibility for the valuation of the Fund's investments to the Fair Value Committee (the Committee) established by the Fund's investment adviser. In accordance with valuation policies and procedures approved by the Board, the Fund attempts to obtain prices from one or more third party pricing vendors or brokers to value its investments. When current market prices, quotations or currency exchange rates are not readily available or reliable, investments will be fair valued in good faith by the Committee, in accordance with procedures adopted by the Board. Factors used in determining fair value vary by investment type and may include market or investment specific events. The frequency with which these procedures are used cannot be predicted and they may be utilized to a significant extent. The Committee oversees the Fund's valuation policies and procedures and reports to the Board on the Committee's activities and fair value determinations. The Board monitors the appropriateness of the procedures used in valuing the Fund's investments and ratifies the fair value determinations of the Committee.
The Fund categorizes the inputs to valuation techniques used to value its investments into a disclosure hierarchy consisting of three levels as shown below:
- Level 1 – quoted prices in active markets for identical investments
- Level 2 – other significant observable inputs (including quoted prices for similar investments, interest rates, prepayment speeds, etc.)
- Level 3 – unobservable inputs (including the Fund's own assumptions based on the best information available)
Valuation techniques used to value the Fund's investments by major category are as follows:
Equity securities, including restricted securities, for which market quotations are readily available, are valued at the last reported sale price or official closing price as reported by a third party pricing vendor on the primary market or exchange on which they are traded and are categorized as Level 1 in the hierarchy. In the event there were no sales during the day or closing prices are not available, securities are valued at the last quoted bid price or may be valued using the last available price and are generally categorized as Level 2 in the hierarchy. For foreign equity securities, when market or security specific events arise, comparisons to the valuation of American Depositary Receipts (ADRs), futures contracts, Exchange-Traded Funds (ETFs) and certain indexes as well as quoted prices for similar securities may be used and would be categorized as Level 2 in the hierarchy. For equity securities, including restricted securities, where observable inputs are limited, assumptions about market activity and risk are used and these securities may be categorized as Level 3 in the hierarchy.
Investments in open-end mutual funds, including the Fidelity Central Funds, are valued at their closing net asset value (NAV) each business day and are categorized as Level 1 in the hierarchy.
Changes in valuation techniques may result in transfers in or out of an assigned level within the disclosure hierarchy.
Foreign Currency. The Fund may use foreign currency contracts to facilitate transactions in foreign-denominated securities. Gains and losses from these transactions may arise from changes in the value of the foreign currency or if the counterparties do not perform under the contracts' terms.
Foreign-denominated assets, including investment securities, and liabilities are translated into U.S. dollars at the exchange rates at period end. Purchases and sales of investment securities, income and dividends received and expenses denominated in foreign currencies are translated into U.S. dollars at the exchange rate in effect on the transaction date.
The effects of exchange rate fluctuations on investments are included with the net realized and unrealized gain (loss) on investment securities. Other foreign currency transactions resulting in realized and unrealized gain (loss) are disclosed separately.
Investment Transactions and Income. For financial reporting purposes, the Fund's investment holdings and NAV include trades executed through the end of the last business day of the period. The NAV per share for processing shareholder transactions is calculated as of the close of business of the New York Stock Exchange (NYSE), normally 4:00 p.m. Eastern time and includes trades executed through the end of the prior business day. Gains and losses on securities sold are determined on the basis of identified cost and include proceeds received from litigation. Dividend income is recorded on the ex-dividend date, except for certain dividends from foreign securities where the ex-dividend date may have passed, which are recorded as soon as the Fund is informed of the ex-dividend date. Non-cash dividends included in dividend income, if any, are recorded at the fair market value of the securities received. Income and capital gain distributions from Fidelity Central Funds, if any, are recorded on the ex-dividend date. Certain distributions received by the Fund represent a return of capital or capital gain. The Fund determines the components of these distributions subsequent to the ex-dividend date, based upon receipt of tax filings or other correspondence relating to the underlying investment. These distributions are recorded as a reduction of cost of investments and/or as a realized gain. Investment income is recorded net of foreign taxes withheld where recovery of such taxes is uncertain.
Class Allocations and Expenses. Investment income realized and unrealized capital gains and losses, common expenses of the Fund, and certain fund-level expense reductions, if any, are allocated daily on a pro-rata basis to each class based on the relative net assets of each class to the total net assets of each Fund. Each class differs with respect to transfer agent and distribution and service plan fees incurred. Certain expense reductions may also differ by class. For the reporting period, the allocated portion of income and expenses to each class as a percent of its average net assets may vary due to the timing of recording these transactions in relation to fluctuating net assets of the classes. Expenses directly attributable to a fund are charged to that fund. Expenses attributable to more than one fund are allocated among the respective funds on the basis of relative net assets or other appropriate methods. Expense estimates are accrued in the period to which they relate and adjustments are made when actual amounts are known.
Income Tax Information and Distributions to Shareholders. Each year, the Fund intends to qualify as a regulated investment company under Subchapter M of the Internal Revenue Code, including distributing substantially all of its taxable income and realized gains. As a result, no provision for U.S. Federal income taxes is required. The Fund files a U.S. federal tax return, in addition to state and local tax returns as required. The Fund's federal income tax returns are subject to examination by the Internal Revenue Service (IRS) for a period of three fiscal years after they are filed. State and local tax returns may be subject to examination for an additional fiscal year depending on the jurisdiction. Foreign taxes are provided for based on the Fund's understanding of the tax rules and rates that exist in the foreign markets in which it invests.
Distributions are declared and recorded on the ex-dividend date. Income and capital gain distributions are declared separately for each class. Income and capital gain distributions are determined in accordance with income tax regulations, which may differ from GAAP.
Capital accounts within the financial statements are adjusted for permanent book-tax differences. These adjustments have no impact on net assets or the results of operations. Capital accounts are not adjusted for temporary book-tax differences which will reverse in a subsequent period.
Book-tax differences are primarily due to foreign currency transactions, redemptions in kind, capital loss carryforwards, and losses deferred due to wash sales.
As of period end, the cost and unrealized appreciation (depreciation) in securities, and derivatives if applicable, for federal income tax purposes were as follows:
| Gross unrealized appreciation | $69,561,355 |
| Gross unrealized depreciation | (27,527,693) |
| Net unrealized appreciation (depreciation) | $42,033,662 |
| Tax cost | $252,067,319 |
Capital loss carryforwards are only available to offset future capital gains of the Fund to the extent provided by regulations and may be limited. Under the Regulated Investment Company Modernization Act of 2010 (the Act), the Fund is permitted to carry forward capital losses incurred in taxable years beginning after December 22, 2010 for an unlimited period and such capital losses are required to be used prior to any losses that expire. The capital loss carryforward information presented below, including any applicable limitation, is estimated as of prior fiscal period end and is subject to adjustment.
| No expiration | |
| Short-term | $(5,201,193) |
| Long-term | (2,187,411) |
| Total capital loss carryforward | $(7,388,604) |
4. Purchases and Sales of Investments.
Purchases and sales of securities, other than short-term securities, aggregated $48,248,613 and $65,186,117, respectively.
5. Fees and Other Transactions with Affiliates.
Management Fee. Fidelity SelectCo, LLC (the investment adviser) and its affiliates provide the Fund with investment management related services for which the Fund pays a monthly management fee. The management fee is the sum of an individual fund fee rate that is based on an annual rate of .30% of the Fund's average net assets and an annualized group fee rate that averaged .24% during the period. The group fee rate is based upon the average net assets of all the mutual funds advised by Fidelity Management & Research Company (FMR) and the investment adviser. The group fee rate decreases as assets under management increase and increases as assets under management decrease. For the reporting period, the total annualized management fee rate was .54% of the Fund's average net assets.
Distribution and Service Plan Fees. In accordance with Rule 12b-1 of the 1940 Act, the Fund has adopted separate Distribution and Service Plans for each class of shares. Certain classes pay Fidelity Distributors Corporation (FDC), an affiliate of the investment adviser, separate Distribution and Service Fees, each of which is based on an annual percentage of each class' average net assets. In addition, FDC may pay financial intermediaries for selling shares of the Fund and providing shareholder support services. For the period, the Distribution and Service Fee rates, total fees and amounts retained by FDC were as follows:
| | Distribution Fee | Service Fee | Total Fees | Retained by FDC |
| Class A | -% | .25% | $26,475 | $498 |
| Class M | .25% | .25% | 15,998 | – |
| Class C | .75% | .25% | 33,052 | 3,416 |
| | | | $75,525 | $3,914 |
Sales Load. FDC may receive a front-end sales charge of up to 5.75% for selling Class A shares and 3.50% for selling Class M shares, some of which is paid to financial intermediaries for selling shares of the Fund. Depending on the holding period, FDC may receive contingent deferred sales charges levied on Class A, Class M and Class C redemptions. The deferred sales charges are 1.00% for Class C shares, 1.00% for certain purchases of Class A shares and .25% for certain purchases of Class M shares.
For the period, sales charge amounts retained by FDC were as follows:
| | Retained by FDC |
| Class A | $5,405 |
| Class M | 608 |
| Class C(a) | 419 |
| | $6,432 |
(a) When Class C shares are initially sold, FDC pays commissions from its own resources to financial intermediaries through which the sales are made.
Transfer Agent Fees. Fidelity Investments Institutional Operations Company, Inc., (FIIOC), an affiliate of the investment adviser, is the transfer, dividend disbursing and shareholder servicing agent for each class of the Fund. FIIOC receives account fees and asset-based fees that vary according to the account size and type of account of the shareholders of the respective classes of the Fund, except for Class Z. FIIOC receives an asset-based fee of Class Z's average net assets. FIIOC pays for typesetting, printing and mailing of shareholder reports, except proxy statements.
For the period, transfer agent fees for each class were as follows:
| | Amount | % of Class-Level Average Net Assets(a) |
| Class A | $32,291 | .30 |
| Class M | 10,956 | .34 |
| Class C | 8,311 | .25 |
| Telecommunications | 227,321 | .20 |
| Class I | 38,769 | .30 |
| Class Z | 142 | .04 |
| | $317,790 | |
(a) Annualized
Accounting and Security Lending Fees. Fidelity Service Company, Inc. (FSC), an affiliate of the investment adviser, maintains the Fund's accounting records. The accounting fee is based on the level of average net assets for each month. Prior to April 1, 2019, FSC had a separate agreement with the Fund for administration of the security lending program, based on the number and duration of lending transactions. For the period, the total fees paid for accounting and administration of securities lending were equivalent to an annualized rate of .04%.
Brokerage Commissions. The Fund placed a portion of its portfolio transactions with brokerage firms which are affiliates of the investment adviser. Brokerage commissions are included in net realized gain (loss) and change in net unrealized appreciation (depreciation) in the Statement of Operations. The commissions paid to these affiliated firms were $4,700 for the period.
Interfund Trades. The Fund may purchase from or sell securities to other Fidelity Funds under procedures adopted by the Board. The procedures have been designed to ensure these interfund trades are executed in accordance with Rule 17a-7 of the 1940 Act. Interfund trades are included within the respective purchases and sales amounts shown in the Purchases and Sales of Investments note.
Prior Fiscal Year Affiliated Redemptions In-Kind. During the prior period, 1,218,775 shares of the Fund were redeemed in-kind for investments and cash with a value of $67,398,250. The Fund had a net realized gain of $14,071,812 on investments delivered through in-kind redemptions. The amount of the in-kind redemptions is included in share transactions in the accompanying Statement of Changes in Net Assets as well as the Notes to Financial Statements. The Fund recognized no gain or loss for federal income tax purposes.
6. Committed Line of Credit.
The Fund participates with other funds managed by the investment adviser or an affiliate in a $4.25 billion credit facility (the "line of credit") to be utilized for temporary or emergency purposes to fund shareholder redemptions or for other short-term liquidity purposes. The Fund has agreed to pay commitment fees on its pro-rata portion of the line of credit, which amounted to $390 and is reflected in Miscellaneous expenses on the Statement of Operations. During the period, the Fund did not borrow on this line of credit.
7. Security Lending.
The Fund lends portfolio securities from time to time in order to earn additional income. For equity securities, lending agents are used, including National Financial Services (NFS), an affiliate of the Fund. Pursuant to a securities lending agreement, NFS will receive a fee, which is capped at 9.9% of daily lending revenue, for its services as lending agent. The Fund may lend securities to certain qualified borrowers. On the settlement date of the loan, the Fund receives collateral (in the form of U.S. Treasury obligations, letters of credit and/or cash) against the loaned securities and maintains collateral in an amount not less than 100% of the market value of the loaned securities during the period of the loan. The market value of the loaned securities is determined at the close of business of the Fund and any additional required collateral is delivered to the Fund on the next business day. The Fund or borrower may terminate the loan at any time, and if the borrower defaults on its obligation to return the securities loaned because of insolvency or other reasons, the Fund may apply collateral received from the borrower against the obligation. The Fund may experience delays and costs in recovering the securities loaned. Any cash collateral received is invested in the Fidelity Securities Lending Cash Central Fund. The value of loaned securities and cash collateral at period end are disclosed on the Fund's Statement of Assets and Liabilities. Total fees paid by the Fund to NFS, amounted to $139. Security lending income represents the income earned on investing cash collateral, less rebates paid to borrowers and any lending agent fees associated with the loan, plus any premium payments received for lending certain types of securities. Security lending income is presented in the Statement of Operations as a component of income from Fidelity Central Funds.
8. Expense Reductions.
Through arrangements with each class' transfer agent, credits realized as a result of certain uninvested cash balances were used to reduce the Fund's expenses. During the period, transfer agent credits reduced each class' expenses as noted in the table below.
| | Expense reduction |
| Telecommunications | $79 |
In addition, during the period the investment adviser reimbursed and/or waived a portion of fund-level operating expenses in the amount of $1,170.
9. Distributions to Shareholders.
Distributions to shareholders of each class were as follows:
| | Six months ended
August 31, 2019 | Year ended
February 28, 2019(a) |
| Distributions to shareholders | | |
| Class A | $85,244 | $535,063 |
| Class M | 22,170 | 130,556 |
| Class C | 19,584 | 159,015 |
| Telecommunications | 1,035,180 | 8,378,886 |
| Class I | 116,248 | 568,868 |
| Class Z | 1,945 | 6,108 |
| Total | $1,280,371 | $9,778,496 |
(a) Distribution for Class Z are for the period October 2, 2018 (commencement of sale of shares) to February 28, 2019.
10. Share Transactions.
Share transactions for each class were as follows and may contain automatic conversions between classes or exchanges between affiliated funds:
| | Shares | Shares | Dollars | Dollars |
| | Six months ended August 31, 2019 | Year ended February 28, 2019(a) | Six months ended August 31, 2019 | Year ended February 28, 2019(a) |
| Class A | | | | |
| Shares sold | 79,250 | 178,681 | $4,546,891 | $10,119,847 |
| Reinvestment of distributions | 1,392 | 9,360 | 81,701 | 516,144 |
| Shares redeemed | (97,506) | (138,810) | (5,634,739) | (7,791,536) |
| Net increase (decrease) | (16,864) | 49,231 | $(1,006,147) | $2,844,455 |
| Class M | | | | |
| Shares sold | 21,773 | 44,519 | $1,244,232 | $2,532,619 |
| Reinvestment of distributions | 379 | 2,373 | 22,131 | 130,297 |
| Shares redeemed | (24,954) | (25,923) | (1,444,737) | (1,462,119) |
| Net increase (decrease) | (2,802) | 20,969 | $(178,374) | $1,200,797 |
| Class C | | | | |
| Shares sold | 8,306 | 31,491 | $478,084 | $1,771,517 |
| Reinvestment of distributions | 303 | 2,644 | 17,741 | 145,392 |
| Shares redeemed | (26,292) | (59,867) | (1,505,742) | (3,334,750) |
| Net increase (decrease) | (17,683) | (25,732) | $(1,009,917) | $(1,417,841) |
| Telecommunications | | | | |
| Shares sold | 213,651 | 715,808 | $12,382,186 | $41,325,429 |
| Reinvestment of distributions | 16,532 | 143,615 | 976,557 | 7,967,864 |
| Shares redeemed | (590,937) | (2,543,354)(b) | (34,240,982) | (142,062,236)(b) |
| Net increase (decrease) | (360,754) | (1,683,931) | $(20,882,239) | $(92,768,943) |
| Class I | | | | |
| Shares sold | 50,599 | 628,872 | $2,911,783 | $37,138,940 |
| Reinvestment of distributions | 1,444 | 8,061 | 84,973 | 444,865 |
| Shares redeemed | (59,307) | (335,488) | (3,419,919) | (19,029,976) |
| Net increase (decrease) | (7,264) | 301,445 | $(423,163) | $18,553,829 |
| Class Z | | | | |
| Shares sold | 62,838 | 6,750 | $3,642,130 | $397,427 |
| Reinvestment of distributions | 31 | 110 | 1,836 | 6,066 |
| Shares redeemed | (2,073) | (5) | (120,656) | (267) |
| Net increase (decrease) | 60,796 | 6,855 | $3,523,310 | $403,226 |
(a) Share transactions for Class Z are for the period October 2, 2018 (commencement of sale of shares) to February 28, 2019.
(b) Amount includes in-kind redemptions (see the Prior Fiscal Year Affiliated Redemptions In-Kind note for additional details).
11. Other.
The Fund's organizational documents provide former and current trustees and officers with a limited indemnification against liabilities arising in connection with the performance of their duties to the Fund. In the normal course of business, the Fund may also enter into contracts that provide general indemnifications. The Fund's maximum exposure under these arrangements is unknown as this would be dependent on future claims that may be made against the Fund. The risk of material loss from such claims is considered remote.
Wireless Portfolio
Investment Summary (Unaudited)
Top Ten Stocks as of August 31, 2019
| | % of fund's net assets |
| Apple, Inc. | 18.1 |
| AT&T, Inc. | 9.4 |
| Verizon Communications, Inc. | 8.0 |
| American Tower Corp. | 7.7 |
| Qualcomm, Inc. | 6.2 |
| Marvell Technology Group Ltd. | 3.8 |
| Alphabet, Inc. Class A | 3.8 |
| T-Mobile U.S., Inc. | 3.5 |
| Activision Blizzard, Inc. | 2.3 |
| Vodafone Group PLC sponsored ADR | 2.3 |
| | 65.1 |
Top Industries (% of fund's net assets)
| As of August 31, 2019 |
| | Diversified Telecommunication Services | 29.3% |
| | Technology Hardware, Storage & Peripherals | 18.1% |
| | Semiconductors & Semiconductor Equipment | 13.3% |
| | Wireless Telecommunication Services | 8.6% |
| | Equity Real Estate Investment Trusts (Reits) | 7.7% |
| | All Others* | 23.0% |
* Includes short-term investments and net other assets (liabilities).
Wireless Portfolio
Schedule of Investments August 31, 2019 (Unaudited)
Showing Percentage of Net Assets
| Common Stocks - 98.0% | | | |
| | | Shares | Value |
| Communications Equipment - 4.9% | | | |
| Communications Equipment - 4.9% | | | |
| CommScope Holding Co., Inc. (a) | | 206,400 | $2,216,736 |
| Motorola Solutions, Inc. | | 11,768 | 2,128,949 |
| Nokia Corp. sponsored ADR (b) | | 411,500 | 2,041,040 |
| Telefonaktiebolaget LM Ericsson: | | | |
| (B Shares) | | 133,500 | 1,044,661 |
| (B Shares) sponsored ADR (b) | | 746,800 | 5,854,912 |
| ViaSat, Inc. (a) | | 1 | 79 |
| | | | 13,286,377 |
| Diversified Telecommunication Services - 28.4% | | | |
| Alternative Carriers - 1.0% | | | |
| Iliad SA | | 25,495 | 2,668,651 |
| Integrated Telecommunication Services - 27.4% | | | |
| AT&T, Inc. | | 718,800 | 25,344,888 |
| BCE, Inc. | | 101,600 | 4,807,571 |
| BT Group PLC sponsored ADR | | 406,000 | 4,060,000 |
| Cincinnati Bell, Inc. (a) | | 310,900 | 1,688,187 |
| Masmovil Ibercom SA (a) | | 263,750 | 5,397,462 |
| Orange SA ADR | | 372,500 | 5,658,275 |
| Telecom Italia SpA (a) | | 2,600,600 | 1,390,260 |
| Telecom Italia SpA sponsored ADR (a) | | 25,400 | 133,858 |
| Telefonica SA sponsored ADR (b) | | 544,397 | 3,756,339 |
| Verizon Communications, Inc. | | 367,501 | 21,373,858 |
| | | | 73,610,698 |
|
| TOTAL DIVERSIFIED TELECOMMUNICATION SERVICES | | | 76,279,349 |
|
| Entertainment - 2.7% | | | |
| Interactive Home Entertainment - 2.3% | | | |
| Activision Blizzard, Inc. | | 124,900 | 6,319,940 |
| Movies & Entertainment - 0.4% | | | |
| Spotify Technology SA (a) | | 8,000 | 1,079,600 |
|
| TOTAL ENTERTAINMENT | | | 7,399,540 |
|
| Equity Real Estate Investment Trusts (REITs) - 7.7% | | | |
| Specialized REITs - 7.7% | | | |
| American Tower Corp. | | 90,492 | 20,830,353 |
| Crown Castle International Corp. | | 1 | 145 |
| | | | 20,830,498 |
| Hotels, Restaurants & Leisure - 0.8% | | | |
| Casinos & Gaming - 0.8% | | | |
| The Stars Group, Inc. (a)(b) | | 140,000 | 2,126,600 |
| Interactive Media & Services - 3.8% | | | |
| Interactive Media & Services - 3.8% | | | |
| Alphabet, Inc. Class A (a) | | 8,500 | 10,119,505 |
| Internet & Direct Marketing Retail - 0.8% | | | |
| Internet & Direct Marketing Retail - 0.8% | | | |
| Pinduoduo, Inc. ADR (a) | | 62,300 | 2,041,571 |
| Media - 4.1% | | | |
| Cable & Satellite - 4.1% | | | |
| Altice Europe NV Class A (a) | | 134,099 | 592,621 |
| Altice U.S.A., Inc. Class A (a) | | 53,725 | 1,551,578 |
| DISH Network Corp. Class A (a) | | 24,500 | 822,220 |
| Liberty Global PLC Class A (a) | | 225,800 | 6,033,376 |
| Telenet Group Holding NV | | 41,479 | 2,066,937 |
| | | | 11,066,732 |
| Semiconductors & Semiconductor Equipment - 13.3% | | | |
| Semiconductors - 13.3% | | | |
| Marvell Technology Group Ltd. | | 422,900 | 10,136,913 |
| Qorvo, Inc. (a) | | 77,025 | 5,501,896 |
| Qualcomm, Inc. | | 214,450 | 16,677,777 |
| Sequans Communications SA ADR (a) | | 393,300 | 389,367 |
| Skyworks Solutions, Inc. | | 33,700 | 2,536,599 |
| STMicroelectronics NV (NY Shares) unit (b) | | 33,500 | 592,950 |
| | | | 35,835,502 |
| Software - 3.8% | | | |
| Application Software - 3.6% | | | |
| LivePerson, Inc. (a)(b) | | 86,000 | 3,417,640 |
| RingCentral, Inc. (a) | | 42,800 | 6,040,364 |
| Sciplay Corp. (A Shares) | | 27,500 | 261,525 |
| | | | 9,719,529 |
| Systems Software - 0.2% | | | |
| BlackBerry Ltd. (a) | | 77,101 | 529,295 |
|
| TOTAL SOFTWARE | | | 10,248,824 |
|
| Technology Hardware, Storage & Peripherals - 18.1% | | | |
| Technology Hardware, Storage & Peripherals - 18.1% | | | |
| Apple, Inc. | | 233,305 | 48,700,086 |
| Textiles, Apparel & Luxury Goods - 1.0% | | | |
| Textiles - 1.0% | | | |
| China Tower Corp. Ltd. (H Shares) (c) | | 11,992,000 | 2,729,969 |
| Wireless Telecommunication Services - 8.6% | | | |
| Wireless Telecommunication Services - 8.6% | | | |
| China Mobile Ltd. sponsored ADR | | 142,100 | 5,870,151 |
| Millicom International Cellular SA | | 24,300 | 1,242,216 |
| Rogers Communications, Inc. Class B (non-vtg.) | | 6,900 | 341,580 |
| Shenandoah Telecommunications Co. | | 300 | 9,462 |
| Spok Holdings, Inc. | | 1 | 12 |
| Sprint Corp. (a) | | 32 | 217 |
| T-Mobile U.S., Inc. (a) | | 120,675 | 9,418,684 |
| Vodafone Group PLC sponsored ADR | | 328,181 | 6,176,366 |
| | | | 23,058,688 |
| TOTAL COMMON STOCKS | | | |
| (Cost $212,511,889) | | | 263,723,241 |
|
| Nonconvertible Preferred Stocks - 0.9% | | | |
| Diversified Telecommunication Services - 0.9% | | | |
| Integrated Telecommunication Services - 0.9% | | | |
| Telefonica Brasil SA | | | |
| (Cost $2,366,266) | | 183,100 | 2,373,093 |
|
| Money Market Funds - 5.6% | | | |
| Fidelity Cash Central Fund 2.13% (d) | | 2,213,775 | 2,214,218 |
| Fidelity Securities Lending Cash Central Fund 2.13% (d)(e) | | 12,750,721 | 12,751,996 |
| TOTAL MONEY MARKET FUNDS | | | |
| (Cost $14,966,214) | | | 14,966,214 |
| TOTAL INVESTMENT IN SECURITIES - 104.5% | | | |
| (Cost $229,844,369) | | | 281,062,548 |
| NET OTHER ASSETS (LIABILITIES) - (4.5)% | | | (12,058,768) |
| NET ASSETS - 100% | | | $269,003,780 |
Legend
(a) Non-income producing
(b) Security or a portion of the security is on loan at period end.
(c) Security exempt from registration under Rule 144A of the Securities Act of 1933. These securities may be resold in transactions exempt from registration, normally to qualified institutional buyers. At the end of the period, the value of these securities amounted to $2,729,969 or 1.0% of net assets.
(d) Affiliated fund that is generally available only to investment companies and other accounts managed by Fidelity Investments. The rate quoted is the annualized seven-day yield of the fund at period end. A complete unaudited listing of the fund's holdings as of its most recent quarter end is available upon request. In addition, each Fidelity Central Fund's financial statements are available on the SEC's website or upon request.
(e) Investment made with cash collateral received from securities on loan.
Affiliated Central Funds
Information regarding fiscal year to date income earned by the Fund from investments in Fidelity Central Funds is as follows:
| Fund | Income earned |
| Fidelity Cash Central Fund | $21,959 |
| Fidelity Securities Lending Cash Central Fund | 63,138 |
| Total | $85,097 |
Amounts in the income column in the above table include any capital gain distributions from underlying funds, which are presented in the corresponding line-item in the Statement of Operations, if applicable. Amount for Fidelity Securities Lending Cash Central Fund represents the income earned on investing cash collateral, less rebates paid to borrowers and any lending agent fees associated with the loan, plus any premium payments received for lending certain types of securities.
Investment Valuation
The following is a summary of the inputs used, as of August 31, 2019, involving the Fund's assets and liabilities carried at fair value. The inputs or methodology used for valuing securities may not be an indication of the risk associated with investing in those securities. For more information on valuation inputs, and their aggregation into the levels used below, please refer to the Investment Valuation section in the accompanying Notes to Financial Statements.
| | Valuation Inputs at Reporting Date: |
| Description | Total | Level 1 | Level 2 | Level 3 |
| Investments in Securities: | | | | |
| Common Stocks | $263,723,241 | $258,558,351 | $5,164,890 | $-- |
| Nonconvertible Preferred Stocks | 2,373,093 | 2,373,093 | -- | -- |
| Money Market Funds | 14,966,214 | 14,966,214 | -- | -- |
| Total Investments in Securities: | $281,062,548 | $275,897,658 | $5,164,890 | $-- |
Other Information
Distribution of investments by country or territory of incorporation, as a percentage of Total Net Assets, is as follows (Unaudited):
| United States of America | 70.4% |
| United Kingdom | 6.0% |
| Bermuda | 3.8% |
| Spain | 3.4% |
| France | 3.2% |
| Canada | 2.9% |
| Sweden | 2.6% |
| Hong Kong | 2.2% |
| China | 1.0% |
| Others (Individually Less Than 1%) | 4.5% |
| | 100.0% |
See accompanying notes which are an integral part of the financial statements.
Wireless Portfolio
Financial Statements
Statement of Assets and Liabilities
| | | August 31, 2019 (Unaudited) |
| Assets | | |
Investment in securities, at value (including securities loaned of $12,388,460) — See accompanying schedule:
Unaffiliated issuers (cost $214,878,155) | $266,096,334 | |
| Fidelity Central Funds (cost $14,966,214) | 14,966,214 | |
| Total Investment in Securities (cost $229,844,369) | | $281,062,548 |
| Cash | | 47,474 |
| Receivable for fund shares sold | | 323,497 |
| Dividends receivable | | 619,360 |
| Distributions receivable from Fidelity Central Funds | | 7,399 |
| Prepaid expenses | | 2,476 |
| Other receivables | | 16,433 |
| Total assets | | 282,079,187 |
| Liabilities | | |
| Payable for fund shares redeemed | $132,710 | |
| Accrued management fee | 117,795 | |
| Other affiliated payables | 51,839 | |
| Other payables and accrued expenses | 22,496 | |
| Collateral on securities loaned | 12,750,567 | |
| Total liabilities | | 13,075,407 |
| Net Assets | | $269,003,780 |
| Net Assets consist of: | | |
| Paid in capital | | $213,702,979 |
| Total distributable earnings (loss) | | 55,300,801 |
| Net Assets, for 26,931,380 shares outstanding | | $269,003,780 |
| Net Asset Value, offering price and redemption price per share ($269,003,780 ÷ 26,931,380 shares) | | $9.99 |
See accompanying notes which are an integral part of the financial statements.
Statement of Operations
| | | Six months ended August 31, 2019 (Unaudited) |
| Investment Income | | |
| Dividends | | $3,472,166 |
| Income from Fidelity Central Funds (including $63,138 from security lending) | | 85,097 |
| Total income | | 3,557,263 |
| Expenses | | |
| Management fee | $699,642 | |
| Transfer agent fees | 261,274 | |
| Accounting and security lending fees | 51,195 | |
| Custodian fees and expenses | (2,581) | |
| Independent trustees' fees and expenses | 699 | |
| Registration fees | 27,497 | |
| Audit | 25,920 | |
| Legal | 972 | |
| Interest | 563 | |
| Miscellaneous | 938 | |
| Total expenses before reductions | 1,066,119 | |
| Expense reductions | (2,840) | |
| Total expenses after reductions | | 1,063,279 |
| Net investment income (loss) | | 2,493,984 |
| Realized and Unrealized Gain (Loss) | | |
| Net realized gain (loss) on: | | |
| Investment securities: | | |
| Unaffiliated issuers | 5,437,398 | |
| Fidelity Central Funds | (921) | |
| Foreign currency transactions | (45,377) | |
| Total net realized gain (loss) | | 5,391,100 |
| Change in net unrealized appreciation (depreciation) on: | | |
| Investment securities: | | |
| Unaffiliated issuers | 19,597,351 | |
| Assets and liabilities in foreign currencies | (16,330) | |
| Total change in net unrealized appreciation (depreciation) | | 19,581,021 |
| Net gain (loss) | | 24,972,121 |
| Net increase (decrease) in net assets resulting from operations | | $27,466,105 |
See accompanying notes which are an integral part of the financial statements.
Statement of Changes in Net Assets
| | Six months ended August 31, 2019 (Unaudited) | Year ended February 28, 2019 |
| Increase (Decrease) in Net Assets | | |
| Operations | | |
| Net investment income (loss) | $2,493,984 | $5,089,450 |
| Net realized gain (loss) | 5,391,100 | 25,048,460 |
| Change in net unrealized appreciation (depreciation) | 19,581,021 | (30,802,695) |
| Net increase (decrease) in net assets resulting from operations | 27,466,105 | (664,785) |
| Distributions to shareholders | – | (31,692,225) |
| Share transactions | | |
| Proceeds from sales of shares | 43,890,365 | 36,649,769 |
| Reinvestment of distributions | – | 30,046,831 |
| Cost of shares redeemed | (40,259,316) | (72,175,357) |
| Net increase (decrease) in net assets resulting from share transactions | 3,631,049 | (5,478,757) |
| Total increase (decrease) in net assets | 31,097,154 | (37,835,767) |
| Net Assets | | |
| Beginning of period | 237,906,626 | 275,742,393 |
| End of period | $269,003,780 | $237,906,626 |
| Other Information | | |
| Shares | | |
| Sold | 4,538,936 | 3,719,654 |
| Issued in reinvestment of distributions | – | 3,493,506 |
| Redeemed | (4,240,918) | (7,373,198) |
| Net increase (decrease) | 298,018 | (160,038) |
See accompanying notes which are an integral part of the financial statements.
Financial Highlights
Wireless Portfolio
| | Six months ended (Unaudited) August 31, | Years endedFebruary 28, | | | | |
| | 2019 | 2019 | 2018 | 2017 | 2016 A | 2015 |
| Selected Per–Share Data | | | | | | |
| Net asset value, beginning of period | $8.93 | $10.29 | $9.11 | $7.85 | $9.54 | $10.57 |
| Income from Investment Operations | | | | | | |
| Net investment income (loss)B | .09 | .20C | .16 | .10 | .11 | .17 |
| Net realized and unrealized gain (loss) | .97 | (.24)D | 1.39 | 1.71 | (1.11) | .48 |
| Total from investment operations | 1.06 | (.04) | 1.55 | 1.81 | (1.00) | .65 |
| Distributions from net investment income | – | (.19) | (.14) | (.09) | (.12) | (.62) |
| Distributions from net realized gain | – | (1.13) | (.24) | (.46) | (.57) | (1.06) |
| Total distributions | – | (1.32) | (.37)E | (.55) | (.69) | (1.68) |
| Redemption fees added to paid in capitalB | – | – | –F | –F | –F | –F |
| Net asset value, end of period | $9.99 | $8.93 | $10.29 | $9.11 | $7.85 | $9.54 |
| Total ReturnG,H | 11.87% | .21%D | 17.21% | 24.09% | (11.07)% | 7.55% |
| Ratios to Average Net AssetsI,J | | | | | | |
| Expenses before reductions | .82%K | .83% | .83% | .87% | .86% | .86% |
| Expenses net of fee waivers, if any | .82%K | .83% | .83% | .87% | .86% | .86% |
| Expenses net of all reductions | .81%K | .82% | .82% | .86% | .85% | .85% |
| Net investment income (loss) | 1.91%K | 2.07%C | 1.61% | 1.23% | 1.23% | 1.76% |
| Supplemental Data | | | | | | |
| Net assets, end of period (000 omitted) | $269,004 | $237,907 | $275,742 | $239,359 | $207,492 | $270,449 |
| Portfolio turnover rateL | 39%K | 54% | 85% | 98% | 78% | 48% |
A For the year ended February 29.
B Calculated based on average shares outstanding during the period.
C Net investment income per share reflects a large, non-recurring dividend which amounted to $.03 per share. Excluding this non-recurring dividend, the ratio of net investment income(loss) to average net assets would have been 1.74%
D Net realized and unrealized gain (loss) per share reflects proceeds received from litigation which amounted to $.01 per share. Excluding these litigation proceeds, the total return would have been .12%.
E Total distributions of $.37 per share is comprised of distributions from net investment income of $.136 and distributions from net realized gain of $.235 per share.
F Amount represents less than $.005 per share.
G Total returns for periods of less than one year are not annualized.
H Total returns would have been lower if certain expenses had not been reduced during the applicable periods shown.
I Fees and expenses of any underlying Fidelity Central Funds are not included in the Fund's expense ratio. The Fund indirectly bears its proportionate share of the expenses of any underlying Fidelity Central Funds.
J Expense ratios reflect operating expenses of the Fund. Expenses before reductions do not reflect amounts reimbursed by the investment adviser or reductions from brokerage service arrangements or reductions from other expense offset arrangements and do not represent the amount paid by the Fund during periods when reimbursements or reductions occur. Expenses net of fee waivers reflect expenses after reimbursement by the investment adviser but prior to reductions from brokerage service arrangements or other expense offset arrangements. Expenses net of all reductions represent the net expenses paid by the Fund.
K Annualized
L Amount does not include the portfolio activity of any underlying Fidelity Central Funds.
See accompanying notes which are an integral part of the financial statements.
Notes to Financial Statements (Unaudited)
For the period ended August 31, 2019
1. Organization.
Wireless Portfolio (the Fund) is a non-diversified fund of Fidelity Select Portfolios (the Trust) and is authorized to issue an unlimited number of shares. Share transactions on the Statement of Changes in Net Assets may contain exchanges between affiliated funds. The Trust is registered under the Investment Company Act of 1940, as amended (the 1940 Act), as an open-end management investment company organized as a Massachusetts business trust. The Fund invests primarily in securities of companies whose principal business activities fall within specific industries.
2. Investments in Fidelity Central Funds.
The Fund invests in Fidelity Central Funds, which are open-end investment companies generally available only to other investment companies and accounts managed by the investment adviser and its affiliates. The Fund's Schedule of Investments lists each of the Fidelity Central Funds held as of period end, if any, as an investment of the Fund, but does not include the underlying holdings of each Fidelity Central Fund. As an Investing Fund, the Fund indirectly bears its proportionate share of the expenses of the underlying Fidelity Central Funds.
The Money Market Central Funds seek preservation of capital and current income and are managed by Fidelity Investments Money Management, Inc. (FIMM), an affiliate of the investment adviser. Annualized expenses of the Money Market Central Funds as of their most recent shareholder report date ranged from less than .005% to .01%.
A complete unaudited list of holdings for each Fidelity Central Fund is available upon request or at the Securities and Exchange Commission (the SEC) website at www.sec.gov. In addition, the financial statements of the Fidelity Central Funds are available on the SEC website or upon request.
3. Significant Accounting Policies.
The Fund is an investment company and applies the accounting and reporting guidance of the Financial Accounting Standards Board (FASB) Accounting Standards Codification Topic 946 Financial Services – Investments Companies. The financial statements have been prepared in conformity with accounting principles generally accepted in the United States of America (GAAP), which require management to make certain estimates and assumptions at the date of the financial statements. Actual results could differ from those estimates. Subsequent events, if any, through the date that the financial statements were issued have been evaluated in the preparation of the financial statements. The following summarizes the significant accounting policies of the Fund:
Investment Valuation. Investments are valued as of 4:00 p.m. Eastern time on the last calendar day of the period. The Board of Trustees (the Board) has delegated the day to day responsibility for the valuation of the Fund's investments to the Fair Value Committee (the Committee) established by the Fund's investment adviser. In accordance with valuation policies and procedures approved by the Board, the Fund attempts to obtain prices from one or more third party pricing vendors or brokers to value its investments. When current market prices, quotations or currency exchange rates are not readily available or reliable, investments will be fair valued in good faith by the Committee, in accordance with procedures adopted by the Board. Factors used in determining fair value vary by investment type and may include market or investment specific events. The frequency with which these procedures are used cannot be predicted and they may be utilized to a significant extent. The Committee oversees the Fund's valuation policies and procedures and reports to the Board on the Committee's activities and fair value determinations. The Board monitors the appropriateness of the procedures used in valuing the Fund's investments and ratifies the fair value determinations of the Committee.
The Fund categorizes the inputs to valuation techniques used to value its investments into a disclosure hierarchy consisting of three levels as shown below:
- Level 1 – quoted prices in active markets for identical investments
- Level 2 – other significant observable inputs (including quoted prices for similar investments, interest rates, prepayment speeds, etc.)
- Level 3 – unobservable inputs (including the Fund's own assumptions based on the best information available)
Valuation techniques used to value the Fund's investments by major category are as follows:
Equity securities, including restricted securities, for which market quotations are readily available, are valued at the last reported sale price or official closing price as reported by a third party pricing vendor on the primary market or exchange on which they are traded and are categorized as Level 1 in the hierarchy. In the event there were no sales during the day or closing prices are not available, securities are valued at the last quoted bid price or may be valued using the last available price and are generally categorized as Level 2 in the hierarchy. For foreign equity securities, when market or security specific events arise, comparisons to the valuation of American Depositary Receipts (ADRs), futures contracts, Exchange-Traded Funds (ETFs) and certain indexes as well as quoted prices for similar securities may be used and would be categorized as Level 2 in the hierarchy. For equity securities, including restricted securities, where observable inputs are limited, assumptions about market activity and risk are used and these securities may be categorized as Level 3 in the hierarchy.
Investments in open-end mutual funds, including the Fidelity Central Funds, are valued at their closing net asset value (NAV) each business day and are categorized as Level 1 in the hierarchy.
Changes in valuation techniques may result in transfers in or out of an assigned level within the disclosure hierarchy. The aggregate value of investments by input level as of August 31, 2019, is included at the end of the Fund's Schedule of Investments.
Foreign Currency. The Fund may use foreign currency contracts to facilitate transactions in foreign-denominated securities. Gains and losses from these transactions may arise from changes in the value of the foreign currency or if the counterparties do not perform under the contracts' terms.
Foreign-denominated assets, including investment securities, and liabilities are translated into U.S. dollars at the exchange rates at period end. Purchases and sales of investment securities, income and dividends received and expenses denominated in foreign currencies are translated into U.S. dollars at the exchange rate in effect on the transaction date.
The effects of exchange rate fluctuations on investments are included with the net realized and unrealized gain (loss) on investment securities. Other foreign currency transactions resulting in realized and unrealized gain (loss) are disclosed separately.
Investment Transactions and Income. For financial reporting purposes, the Fund's investment holdings and NAV include trades executed through the end of the last business day of the period. The NAV per share for processing shareholder transactions is calculated as of the close of business of the New York Stock Exchange (NYSE), normally 4:00 p.m. Eastern time and includes trades executed through the end of the prior business day. Gains and losses on securities sold are determined on the basis of identified cost and include proceeds received from litigation. Dividend income is recorded on the ex-dividend date, except for certain dividends from foreign securities where the ex-dividend date may have passed, which are recorded as soon as the Fund is informed of the ex-dividend date. Non-cash dividends included in dividend income, if any, are recorded at the fair market value of the securities received. Income and capital gain distributions from Fidelity Central Funds, if any, are recorded on the ex-dividend date. Certain distributions received by the Fund represent a return of capital or capital gain. The Fund determines the components of these distributions subsequent to the ex-dividend date, based upon receipt of tax filings or other correspondence relating to the underlying investment. These distributions are recorded as a reduction of cost of investments and/or as a realized gain. Investment income is recorded net of foreign taxes withheld where recovery of such taxes is uncertain.
Expenses. Expenses directly attributable to a fund are charged to that fund. Expenses attributable to more than one fund are allocated among the respective funds on the basis of relative net assets or other appropriate methods. Expense estimates are accrued in the period to which they relate and adjustments are made when actual amounts are known.
Income Tax Information and Distributions to Shareholders. Each year, the Fund intends to qualify as a regulated investment company under Subchapter M of the Internal Revenue Code, including distributing substantially all of its taxable income and realized gains. As a result, no provision for U.S. Federal income taxes is required. The Fund files a U.S. federal tax return, in addition to state and local tax returns as required. The Fund's federal income tax returns are subject to examination by the Internal Revenue Service (IRS) for a period of three fiscal years after they are filed. State and local tax returns may be subject to examination for an additional fiscal year depending on the jurisdiction. Foreign taxes are provided for based on the Fund's understanding of the tax rules and rates that exist in the foreign markets in which it invests.
Distributions are declared and recorded on the ex-dividend date. Income and capital gain distributions are determined in accordance with income tax regulations, which may differ from GAAP.
Capital accounts within the financial statements are adjusted for permanent book-tax differences. These adjustments have no impact on net assets or the results of operations. Capital accounts are not adjusted for temporary book-tax differences which will reverse in a subsequent period.
Book-tax differences are primarily due to foreign currency transactions and losses deferred due to wash sales and excise tax regulations.
As of period end, the cost and unrealized appreciation (depreciation) in securities, and derivatives if applicable, for federal income tax purposes were as follows:
| Gross unrealized appreciation | $73,784,536 |
| Gross unrealized depreciation | (24,321,444) |
| Net unrealized appreciation (depreciation) | $49,463,092 |
| Tax cost | $231,599,456 |
The Fund elected to defer to its next fiscal year approximately $1,891,040 of capital losses recognized during the period November 1, 2018 to February 28, 2019.
Restricted Securities. The Fund may invest in securities that are subject to legal or contractual restrictions on resale. These securities generally may be resold in transactions exempt from registration or to the public if the securities are registered. Disposal of these securities may involve time-consuming negotiations and expense, and prompt sale at an acceptable price may be difficult. Information regarding restricted securities is included at the end of the Fund's Schedule of Investments.
4. Purchases and Sales of Investments.
Purchases and sales of securities, other than short-term securities, aggregated $56,658,020 and $50,426,849, respectively.
5. Fees and Other Transactions with Affiliates.
Management Fee. Fidelity SelectCo, LLC (the investment adviser) and its affiliates provide the Fund with investment management related services for which the Fund pays a monthly management fee. The management fee is the sum of an individual fund fee rate that is based on an annual rate of .30% of the Fund's average net assets and an annualized group fee rate that averaged .24% during the period. The group fee rate is based upon the average net assets of all the mutual funds advised by Fidelity Management & Research Company (FMR) and the investment adviser. The group fee rate decreases as assets under management increase and increases as assets under management decrease. For the reporting period, the total annualized management fee rate was .54% of the Fund's average net assets.
Transfer Agent Fees. Fidelity Investments Institutional Operations Company, Inc. (FIIOC), an affiliate of the investment adviser, is the Fund's transfer, dividend disbursing and shareholder servicing agent. FIIOC receives account fees and asset-based fees that vary according to account size and type of account. FIIOC pays for typesetting, printing and mailing of shareholder reports, except proxy statements. For the period, the transfer agent fees were equivalent to an annualized rate of .20% of average net assets.
Accounting and Security Lending Fees. Fidelity Service Company, Inc. (FSC), an affiliate of the investment adviser, maintains the Fund's accounting records. The accounting fee is based on the level of average net assets for each month. Prior to April 1, 2019, FSC had a separate agreement with the Fund for administration of the security lending program, based on the number and duration of lending transactions. For the period, the total fees paid for accounting and administration of securities lending were equivalent to an annualized rate of .04%.
Brokerage Commissions. The Fund placed a portion of its portfolio transactions with brokerage firms which are affiliates of the investment adviser. Brokerage commissions are included in net realized gain (loss) and change in net unrealized appreciation (depreciation) in the Statement of Operations. The commissions paid to these affiliated firms were $2,011 for the period.
Interfund Lending Program. Pursuant to an Exemptive Order issued by the SEC, the Fund, along with other registered investment companies having management contracts with Fidelity Management & Research Company (FMR) or other affiliated entities of FMR, may participate in an interfund lending program. This program provides an alternative credit facility allowing the funds to borrow from, or lend money to, other participating affiliated funds. At period end, there were no interfund loans outstanding. The Fund's activity in this program during the period for which loans were outstanding was as follows:
| Borrower or Lender | Average Loan Balance | Weighted Average Interest Rate | Interest Expense |
| Borrower | $7,701,000 | 2.63% | $563 |
Interfund Trades. The Fund may purchase from or sell securities to other Fidelity Funds under procedures adopted by the Board. The procedures have been designed to ensure these interfund trades are executed in accordance with Rule 17a-7 of the 1940 Act. Interfund trades are included within the respective purchases and sales amounts shown in the Purchases and Sales of Investments note.
6. Committed Line of Credit.
The Fund participates with other funds managed by the investment adviser or an affiliate in a $4.25 billion credit facility (the "line of credit") to be utilized for temporary or emergency purposes to fund shareholder redemptions or for other short-term liquidity purposes. The Fund has agreed to pay commitment fees on its pro-rata portion of the line of credit, which amounted to $336 and is reflected in Miscellaneous expenses on the Statement of Operations. During the period, the Fund did not borrow on this line of credit.
7. Security Lending.
The Fund lends portfolio securities from time to time in order to earn additional income. For equity securities, lending agents are used, including National Financial Services (NFS), an affiliate of the Fund. Pursuant to a securities lending agreement, NFS will receive a fee, which is capped at 9.9% of daily lending revenue, for its services as lending agent. The Fund may lend securities to certain qualified borrowers. On the settlement date of the loan, the Fund receives collateral (in the form of U.S. Treasury obligations, letters of credit and/or cash) against the loaned securities and maintains collateral in an amount not less than 100% of the market value of the loaned securities during the period of the loan. The market value of the loaned securities is determined at the close of business of the Fund and any additional required collateral is delivered to the Fund on the next business day. The Fund or borrower may terminate the loan at any time, and if the borrower defaults on its obligation to return the securities loaned because of insolvency or other reasons, the Fund may apply collateral received from the borrower against the obligation. The Fund may experience delays and costs in recovering the securities loaned. Any cash collateral received is invested in the Fidelity Securities Lending Cash Central Fund. The value of loaned securities and cash collateral at period end are disclosed on the Fund's Statement of Assets and Liabilities. Total fees paid by the Fund to NFS, amounted to $1,239. Security lending income represents the income earned on investing cash collateral, less rebates paid to borrowers and any lending agent fees associated with the loan, plus any premium payments received for lending certain types of securities. Security lending income is presented in the Statement of Operations as a component of income from Fidelity Central Funds.
8. Expense Reductions.
Commissions paid to certain brokers with whom the investment adviser, or its affiliates, places trades on behalf of the Fund include an amount in addition to trade execution, which may be rebated back to the Fund to offset certain expenses. This amount totaled $1,932 for the period.
In addition, during the period the investment adviser reimbursed and/or waived a portion of operating expenses in the amount of $908.
9. Other.
The Fund's organizational documents provide former and current trustees and officers with a limited indemnification against liabilities arising in connection with the performance of their duties to the Fund. In the normal course of business, the Fund may also enter into contracts that provide general indemnifications. The Fund's maximum exposure under these arrangements is unknown as this would be dependent on future claims that may be made against the Fund. The risk of material loss from such claims is considered remote.
Shareholder Expense Example
As a shareholder of the Fund, you incur two types of costs: (1) transaction costs, including sales charges (loads) on purchase payments or redemption proceeds, and (2) ongoing costs, including management fees, distribution and/or service (12b-1) fees and other Fund expenses. This Example is intended to help you understand your ongoing costs (in dollars) of investing in the Fund and to compare these costs with the ongoing costs of investing in other mutual funds.
The Example is based on an investment of $1,000 invested at the beginning of the period and held for the entire period (March 1, 2019 to August 31, 2019).
Actual Expenses
The first line of the accompanying table for each Class of each fund provides information about actual account values and actual expenses. You may use the information in this line, together with the amount you invested, to estimate the expenses that you paid over the period. Simply divide your account value by $1,000.00 (for example, an $8,600 account value divided by $1,000.00 = 8.6), then multiply the result by the number in the first line for a Class of the fund under the heading entitled "Expenses Paid During Period" to estimate the expenses you paid on your account during this period. In addition, each Fund, as a shareholder in the underlying Fidelity Central Funds, will indirectly bear its pro-rata share of the fees and expenses incurred by the underlying Fidelity Central Funds. These fees and expenses are not included in the Fund's annualized expense ratio used to calculate the expense estimate in the table below.
Hypothetical Example for Comparison Purposes
The second line of the accompanying table for each Class of each fund provides information about hypothetical account values and hypothetical expenses based on a Class' actual expense ratio and an assumed rate of return of 5% per year before expenses, which is not the Class' actual return. The hypothetical account values and expenses may not be used to estimate the actual ending account balance or expenses you paid for the period. You may use this information to compare the ongoing costs of investing in the Fund and other funds. To do so, compare this 5% hypothetical example with the 5% hypothetical examples that appear in the shareholder reports of the other funds. In addition, each Fund, as a shareholder in the underlying Fidelity Central Funds, will indirectly bear its pro-rata share of the fees and expenses incurred by the underlying Fidelity Central Funds. These fees and expenses are not included in the Fund's annualized expense ratio used to calculate the expense estimate in the table below.
Please note that the expenses shown in the table are meant to highlight your ongoing costs only and do not reflect any transaction costs. Therefore, the second line of the table is useful in comparing ongoing costs only, and will not help you determine the relative total costs of owning different funds. In addition, if these transactional costs were included, your costs would have been higher.
| | Annualized Expense Ratio-A | Beginning
Account Value
March 1, 2019 | Ending
Account Value
August 31, 2019 | Expenses Paid
During Period-B
March 1, 2019
to August 31, 2019 |
| Telecommunications Portfolio | | | | |
| Class A | 1.19% | | | |
| Actual | | $1,000.00 | $1,063.60 | $6.17 |
| Hypothetical-C | | $1,000.00 | $1,019.15 | $6.04 |
| Class M | 1.47% | | | |
| Actual | | $1,000.00 | $1,062.30 | $7.62 |
| Hypothetical-C | | $1,000.00 | $1,017.75 | $7.46 |
| Class C | 1.88% | | | |
| Actual | | $1,000.00 | $1,060.00 | $9.73 |
| Hypothetical-C | | $1,000.00 | $1,015.69 | $9.53 |
| Telecommunications | .83% | | | |
| Actual | | $1,000.00 | $1,065.60 | $4.31 |
| Hypothetical-C | | $1,000.00 | $1,020.96 | $4.22 |
| Class I | .93% | | | |
| Actual | | $1,000.00 | $1,065.00 | $4.83 |
| Hypothetical-C | | $1,000.00 | $1,020.46 | $4.72 |
| Class Z | .68% | | | |
| Actual | | $1,000.00 | $1,066.50 | $3.53 |
| Hypothetical-C | | $1,000.00 | $1,021.72 | $3.46 |
| Wireless Portfolio | .82% | | | |
| Actual | | $1,000.00 | $1,118.70 | $4.37 |
| Hypothetical-C | | $1,000.00 | $1,021.01 | $4.17 |
A Annualized expense ratio reflects expenses net of applicable fee waivers.
B Expenses are equal to each Class' annualized expense ratio, multiplied by the average account value over the period, multiplied by 184/ 366 (to reflect the one-half year period).
C 5% return per year before expenses.
SELTS-SANN-1019
1.846053.112
Fidelity® Select Portfolios®
Information Technology Sector Communications Equipment Portfolio
Computers Portfolio
IT Services Portfolio
Semiconductors Portfolio
Software and IT Services Portfolio
Technology Portfolio
Semi-Annual Report August 31, 2019 |
|
Beginning on January 1, 2021, as permitted by regulations adopted by the Securities and Exchange Commission, paper copies of a fund’s shareholder reports will no longer be sent by mail, unless you specifically request paper copies of the reports from the fund or from your financial intermediary, such as a financial advisor, broker-dealer or bank. Instead, the reports will be made available on a website, and you will be notified by mail each time a report is posted and provided with a website link to access the report.
If you already elected to receive shareholder reports electronically, you will not be affected by this change and you need not take any action. You may elect to receive shareholder reports and other communications from a fund electronically, by contacting your financial intermediary. For Fidelity customers, visit Fidelity's web site or call Fidelity using the contact information listed below.
You may elect to receive all future reports in paper free of charge. If you wish to continue receiving paper copies of your shareholder reports, you may contact your financial intermediary or, if you are a Fidelity customer, visit Fidelity’s website, or call Fidelity at the applicable toll-free number listed below. Your election to receive reports in paper will apply to all funds held with the fund complex/your financial intermediary.
| Account Type | Website | Phone Number |
| Brokerage, Mutual Fund, or Annuity Contracts: | fidelity.com/mailpreferences | 1-800-343-3548 |
| Employer Provided Retirement Accounts: | netbenefits.fidelity.com/preferences (choose 'no' under Required Disclosures to continue to print) | 1-800-343-0860 |
| Advisor Sold Accounts Serviced Through Your Financial Intermediary: | Contact Your Financial Intermediary | Your Financial Intermediary's phone number |
| Advisor Sold Accounts Serviced by Fidelity: | institutional.fidelity.com | 1-877-208-0098 |
Contents
To view a fund's proxy voting guidelines and proxy voting record for the 12-month period ended June 30, visit http://www.fidelity.com/proxyvotingresults or visit the Securities and Exchange Commission's (SEC) web site at http://www.sec.gov.
You may also call 1-800-544-8544 to request a free copy of the proxy voting guidelines.
Standard & Poor's, S&P and S&P 500 are registered service marks of The McGraw-Hill Companies, Inc. and have been licensed for use by Fidelity Distributors Corporation.
Other third-party marks appearing herein are the property of their respective owners.
All other marks appearing herein are registered or unregistered trademarks or service marks of FMR LLC or an affiliated company. © 2019 FMR LLC. All rights reserved.
This report and the financial statements contained herein are submitted for the general information of the shareholders of the Funds. This report is not authorized for distribution to prospective investors in the Funds unless preceded or accompanied by an effective prospectus.
A fund files its complete schedule of portfolio holdings with the SEC for the first and third quarters of each fiscal year on Form N-PORT. Forms N-PORT are available on the SEC’s web site at http://www.sec.gov. A fund's Forms N-PORT may be reviewed and copied at the SEC’s Public Reference Room in Washington, DC. Information regarding the operation of the SEC's Public Reference Room may be obtained by calling 1-800-SEC-0330.
For a complete list of a fund's portfolio holdings, view the most recent holdings listing, semiannual report, or annual report on Fidelity's web site at http://www.fidelity.com, http://www.institutional.fidelity.com, or http://www.401k.com, as applicable.
NOT FDIC INSURED •MAY LOSE VALUE •NO BANK GUARANTEE
Neither the Funds nor Fidelity Distributors Corporation is a bank.
Communications Equipment Portfolio
Investment Summary (Unaudited)
Top Ten Stocks as of August 31, 2019
| | % of fund's net assets |
| Cisco Systems, Inc. | 23.5 |
| Nokia Corp. sponsored ADR | 8.4 |
| Motorola Solutions, Inc. | 7.8 |
| Arista Networks, Inc. | 6.5 |
| ViaSat, Inc. | 5.0 |
| Lumentum Holdings, Inc. | 4.5 |
| Juniper Networks, Inc. | 4.0 |
| CommScope Holding Co., Inc. | 3.7 |
| Ciena Corp. | 3.6 |
| Viavi Solutions, Inc. | 3.6 |
| | 70.6 |
Top Industries (% of fund's net assets)
| As of August 31, 2019 |
| | Communications Equipment | 94.0% |
| | IT Services | 1.2% |
| | Diversified Telecommunication Services | 1.0% |
| | Media | 1.0% |
| | Electronic Equipment & Components | 0.5% |
| | All Others* | 2.3% |

* Includes short-term investments and net other assets (liabilities).
Communications Equipment Portfolio
Schedule of Investments August 31, 2019 (Unaudited)
Showing Percentage of Net Assets
| Common Stocks - 98.2% | | | |
| | | Shares | Value |
| Communications Equipment - 94.0% | | | |
| Communications Equipment - 94.0% | | | |
| Acacia Communications, Inc. (a) | | 67,000 | $4,224,350 |
| ADTRAN, Inc. | | 102,453 | 1,052,192 |
| Arista Networks, Inc. (a) | | 52,145 | 11,817,100 |
| Ciena Corp. (a) | | 158,700 | 6,495,591 |
| Cisco Systems, Inc. | | 906,999 | 42,456,623 |
| CommScope Holding Co., Inc. (a) | | 622,571 | 6,686,413 |
| Comtech Telecommunications Corp. (b) | | 35,000 | 936,250 |
| EchoStar Holding Corp. Class A (a) | | 95,200 | 4,022,200 |
| Extreme Networks, Inc. (a) | | 475,705 | 3,177,709 |
| F5 Networks, Inc. (a) | | 49,685 | 6,395,950 |
| Finisar Corp. (a) | | 232,700 | 5,261,347 |
| Infinera Corp. (a) | | 14,814 | 78,959 |
| InterDigital, Inc. | | 67,500 | 3,318,975 |
| Juniper Networks, Inc. | | 308,012 | 7,133,558 |
| Lumentum Holdings, Inc. (a) | | 145,763 | 8,127,745 |
| Motorola Solutions, Inc. | | 77,759 | 14,067,381 |
| NETGEAR, Inc. (a) | | 39,100 | 1,357,552 |
| NetScout Systems, Inc. (a) | | 77,100 | 1,707,765 |
| Nokia Corp. sponsored ADR (b) | | 3,050,583 | 15,130,892 |
| Plantronics, Inc. (b) | | 65,134 | 2,023,713 |
| Sierra Wireless, Inc. (a)(b) | | 206,500 | 2,230,336 |
| Sonus Networks, Inc. (a) | | 119,660 | 618,642 |
| Telefonaktiebolaget LM Ericsson (B Shares) sponsored ADR (b) | | 766,780 | 6,011,555 |
| ViaSat, Inc. (a) | | 113,200 | 8,980,156 |
| Viavi Solutions, Inc. (a) | | 464,000 | 6,444,960 |
| | | | 169,757,914 |
| Diversified Telecommunication Services - 1.0% | | | |
| Alternative Carriers - 1.0% | | | |
| Vonage Holdings Corp. (a)(b) | | 135,200 | 1,787,344 |
| Electronic Equipment & Components - 0.5% | | | |
| Electronic Manufacturing Services - 0.5% | | | |
| Fabrinet (a) | | 18,400 | 929,016 |
| IT Services - 1.2% | | | |
| Internet Services & Infrastructure - 1.2% | | | |
| Fastly, Inc. Class A (b) | | 65,300 | 2,063,480 |
| Media - 1.0% | | | |
| Cable & Satellite - 1.0% | | | |
| Comcast Corp. Class A | | 41,500 | 1,836,790 |
| Software - 0.5% | | | |
| Systems Software - 0.5% | | | |
| Tufin Software Technologies Ltd. (b) | | 51,500 | 928,030 |
| TOTAL COMMON STOCKS | | | |
| (Cost $141,213,349) | | | 177,302,574 |
|
| Money Market Funds - 14.9% | | | |
| Fidelity Cash Central Fund 2.13% (c) | | 5,434,157 | 5,435,244 |
| Fidelity Securities Lending Cash Central Fund 2.13% (c)(d) | | 21,481,619 | 21,483,767 |
| TOTAL MONEY MARKET FUNDS | | | |
| (Cost $26,919,011) | | | 26,919,011 |
| TOTAL INVESTMENT IN SECURITIES - 113.1% | | | |
| (Cost $168,132,360) | | | 204,221,585 |
| NET OTHER ASSETS (LIABILITIES) - (13.1)% | | | (23,580,665) |
| NET ASSETS - 100% | | | $180,640,920 |
Legend
(a) Non-income producing
(b) Security or a portion of the security is on loan at period end.
(c) Affiliated fund that is generally available only to investment companies and other accounts managed by Fidelity Investments. The rate quoted is the annualized seven-day yield of the fund at period end. A complete unaudited listing of the fund's holdings as of its most recent quarter end is available upon request. In addition, each Fidelity Central Fund's financial statements are available on the SEC's website or upon request.
(d) Investment made with cash collateral received from securities on loan.
Affiliated Central Funds
Information regarding fiscal year to date income earned by the Fund from investments in Fidelity Central Funds is as follows:
| Fund | Income earned |
| Fidelity Cash Central Fund | $44,991 |
| Fidelity Securities Lending Cash Central Fund | 52,344 |
| Total | $97,335 |
Amounts in the income column in the above table include any capital gain distributions from underlying funds, which are presented in the corresponding line-item in the Statement of Operations, if applicable. Amount for Fidelity Securities Lending Cash Central Fund represents the income earned on investing cash collateral, less rebates paid to borrowers and any lending agent fees associated with the loan, plus any premium payments received for lending certain types of securities.
Investment Valuation
All investments are categorized as Level 1 under the Fair Value Hierarchy. The inputs or methodology used for valuing securities may not be an indication of the risk associated with investing in those securities. For more information on valuation inputs please refer to the Investment Valuation section in the accompanying Notes to Financial Statements.
Other Information
Distribution of investments by country or territory of incorporation, as a percentage of Total Net Assets, is as follows (Unaudited):
| United States of America | 86.1% |
| Finland | 8.4% |
| Sweden | 3.3% |
| Canada | 1.2% |
| Others (Individually Less Than 1%) | 1.0% |
| | 100.0% |
See accompanying notes which are an integral part of the financial statements.
Communications Equipment Portfolio
Financial Statements
Statement of Assets and Liabilities
| | | August 31, 2019 (Unaudited) |
| Assets | | |
Investment in securities, at value (including securities loaned of $20,859,430) — See accompanying schedule:
Unaffiliated issuers (cost $141,213,349) | $177,302,574 | |
| Fidelity Central Funds (cost $26,919,011) | 26,919,011 | |
| Total Investment in Securities (cost $168,132,360) | | $204,221,585 |
| Cash | | 1,472,029 |
| Foreign currency held at value (cost $8) | | 7 |
| Receivable for investments sold | | 874,013 |
| Receivable for fund shares sold | | 6,566 |
| Dividends receivable | | 9,304 |
| Distributions receivable from Fidelity Central Funds | | 13,392 |
| Prepaid expenses | | 1,906 |
| Other receivables | | 7,008 |
| Total assets | | 206,605,810 |
| Liabilities | | |
| Payable for investments purchased | $4,109,213 | |
| Payable for fund shares redeemed | 224,264 | |
| Accrued management fee | 83,792 | |
| Other affiliated payables | 40,645 | |
| Other payables and accrued expenses | 21,290 | |
| Collateral on securities loaned | 21,485,686 | |
| Total liabilities | | 25,964,890 |
| Net Assets | | $180,640,920 |
| Net Assets consist of: | | |
| Paid in capital | | $142,524,631 |
| Total distributable earnings (loss) | | 38,116,289 |
| Net Assets, for 5,073,231 shares outstanding | | $180,640,920 |
| Net Asset Value, offering price and redemption price per share ($180,640,920 ÷ 5,073,231 shares) | | $35.61 |
See accompanying notes which are an integral part of the financial statements.
Statement of Operations
| | | Six months ended August 31, 2019 (Unaudited) |
| Investment Income | | |
| Dividends | | $1,426,031 |
| Income from Fidelity Central Funds (including $52,344 from security lending) | | 97,335 |
| Total income | | 1,523,366 |
| Expenses | | |
| Management fee | $584,530 | |
| Transfer agent fees | 221,898 | |
| Accounting and security lending fees | 43,420 | |
| Custodian fees and expenses | 1,943 | |
| Independent trustees' fees and expenses | 605 | |
| Registration fees | 27,892 | |
| Audit | 19,120 | |
| Legal | 224 | |
| Miscellaneous | 805 | |
| Total expenses before reductions | 900,437 | |
| Expense reductions | (16,663) | |
| Total expenses after reductions | | 883,774 |
| Net investment income (loss) | | 639,592 |
| Realized and Unrealized Gain (Loss) | | |
| Net realized gain (loss) on: | | |
| Investment securities: | | |
| Unaffiliated issuers | 3,792,016 | |
| Fidelity Central Funds | (1,643) | |
| Foreign currency transactions | 291 | |
| Total net realized gain (loss) | | 3,790,664 |
| Change in net unrealized appreciation (depreciation) on: | | |
| Investment securities: | | |
| Unaffiliated issuers | (26,768,463) | |
| Assets and liabilities in foreign currencies | (180) | |
| Total change in net unrealized appreciation (depreciation) | | (26,768,643) |
| Net gain (loss) | | (22,977,979) |
| Net increase (decrease) in net assets resulting from operations | | $(22,338,387) |
See accompanying notes which are an integral part of the financial statements.
Statement of Changes in Net Assets
| | Six months ended August 31, 2019 (Unaudited) | Year ended February 28, 2019 |
| Increase (Decrease) in Net Assets | | |
| Operations | | |
| Net investment income (loss) | $639,592 | $1,439,378 |
| Net realized gain (loss) | 3,790,664 | 5,596,798 |
| Change in net unrealized appreciation (depreciation) | (26,768,643) | 13,337,823 |
| Net increase (decrease) in net assets resulting from operations | (22,338,387) | 20,373,999 |
| Distributions to shareholders | (3,760,114) | (15,319,912) |
| Share transactions | | |
| Proceeds from sales of shares | 39,610,357 | 95,495,326 |
| Reinvestment of distributions | 3,566,916 | 14,435,389 |
| Cost of shares redeemed | (55,382,662) | (105,217,924) |
| Net increase (decrease) in net assets resulting from share transactions | (12,205,389) | 4,712,791 |
| Total increase (decrease) in net assets | (38,303,890) | 9,766,878 |
| Net Assets | | |
| Beginning of period | 218,944,810 | 209,177,932 |
| End of period | $180,640,920 | $218,944,810 |
| Other Information | | |
| Shares | | |
| Sold | 971,195 | 2,510,396 |
| Issued in reinvestment of distributions | 84,524 | 396,991 |
| Redeemed | (1,406,995) | (2,828,010) |
| Net increase (decrease) | (351,276) | 79,377 |
See accompanying notes which are an integral part of the financial statements.
Financial Highlights
Communications Equipment Portfolio
| | Six months ended (Unaudited) August 31, | Years endedFebruary 28, | | | | |
| | 2019 | 2019 | 2018 | 2017 | 2016 A | 2015 |
| Selected Per–Share Data | | | | | | |
| Net asset value, beginning of period | $40.36 | $39.13 | $34.12 | $26.71 | $32.99 | $31.24 |
| Income from Investment Operations | | | | | | |
| Net investment income (loss)B | .12 | .25 | .17 | .38 | .31 | .28 |
| Net realized and unrealized gain (loss) | (4.22) | 3.76 | 5.45C | 7.39 | (5.64) | 3.52 |
| Total from investment operations | (4.10) | 4.01 | 5.62 | 7.77 | (5.33) | 3.80 |
| Distributions from net investment income | (.01) | (.17)D | (.33) | (.36) | (.30) | (.30) |
| Distributions from net realized gain | (.64) | (2.61)D | (.28) | – | (.65) | (1.75) |
| Total distributions | (.65) | (2.78) | (.61) | (.36) | (.95) | (2.05) |
| Redemption fees added to paid in capitalB | – | – | –E | –E | –E | –E |
| Net asset value, end of period | $35.61 | $40.36 | $39.13 | $34.12 | $26.71 | $32.99 |
| Total ReturnF,G | (10.42)% | 11.11% | 16.71%C | 29.24% | (16.38)% | 12.49% |
| Ratios to Average Net AssetsH,I | | | | | | |
| Expenses before reductions | .83%J | .84% | .85% | .88% | .90% | .89% |
| Expenses net of fee waivers, if any | .83%J | .84% | .85% | .88% | .89% | .89% |
| Expenses net of all reductions | .81%J | .83% | .85% | .88% | .89% | .89% |
| Net investment income (loss) | .59%J | .66% | .48% | 1.27% | 1.04% | .89% |
| Supplemental Data | | | | | | |
| Net assets, end of period (000 omitted) | $180,641 | $218,945 | $209,178 | $204,651 | $169,455 | $263,631 |
| Portfolio turnover rateK | 110%J | 71% | 56% | 38% | 30% | 42%L |
A For the year ended February 29.
B Calculated based on average shares outstanding during the period.
C Net realized and unrealized gain (loss) per share reflects proceeds received from litigation which amounted to $.01 per share. Excluding these litigation proceeds, the total return would have been 16.67%.
D The amounts shown reflect certain reclassifications related to book to tax differences that were made in the year shown.
E Amount represents less than $.005 per share.
F Total returns for periods of less than one year are not annualized.
G Total returns would have been lower if certain expenses had not been reduced during the applicable periods shown.
H Fees and expenses of any underlying Fidelity Central Funds are not included in the Fund's expense ratio. The Fund indirectly bears its proportionate share of the expenses of any underlying Fidelity Central Funds.
I Expense ratios reflect operating expenses of the Fund. Expenses before reductions do not reflect amounts reimbursed by the investment adviser or reductions from brokerage service arrangements or reductions from other expense offset arrangements and do not represent the amount paid by the Fund during periods when reimbursements or reductions occur. Expenses net of fee waivers reflect expenses after reimbursement by the investment adviser but prior to reductions from brokerage service arrangements or other expense offset arrangements. Expenses net of all reductions represent the net expenses paid by the Fund.
J Annualized
K Amount does not include the portfolio activity of any underlying Fidelity Central Funds.
L Portfolio turnover rate excludes securities received or delivered in-kind.
See accompanying notes which are an integral part of the financial statements.
Computers Portfolio
Investment Summary (Unaudited)
Top Ten Stocks as of August 31, 2019
| | % of fund's net assets |
| Apple, Inc. | 18.4 |
| Samsung Electronics Co. Ltd. | 15.7 |
| Sony Corp. | 15.6 |
| Western Digital Corp. | 4.0 |
| Kyocera Corp. | 4.0 |
| NetApp, Inc. | 3.9 |
| Logitech International SA (Reg.) | 3.6 |
| Hewlett Packard Enterprise Co. | 3.3 |
| Fujifilm Holdings Corp. | 2.9 |
| Alphabet, Inc. Class A | 2.7 |
| | 74.1 |
Top Industries (% of fund's net assets)
| As of August 31, 2019 |
| | Technology Hardware, Storage & Peripherals | 59.6% |
| | Household Durables | 16.3% |
| | Electronic Equipment & Components | 5.7% |
| | IT Services | 4.7% |
| | Semiconductors & Semiconductor Equipment | 4.1% |
| | All Others* | 9.6% |

* Includes short-term investments and net other assets (liabilities).
Computers Portfolio
Schedule of Investments August 31, 2019 (Unaudited)
Showing Percentage of Net Assets
| Common Stocks - 100.0% | | | |
| | | Shares | Value |
| Communications Equipment - 3.5% | | | |
| Communications Equipment - 3.5% | | | |
| Arista Networks, Inc. (a) | | 18,288 | $4,144,427 |
| Xiaomi Corp. Class B (a)(b)(c) | | 11,202,532 | 12,144,889 |
| | | | 16,289,316 |
| Electronic Equipment & Components - 5.7% | | | |
| Electronic Components - 4.0% | | | |
| Kyocera Corp. | | 314,800 | 18,712,872 |
| Technology Distributors - 1.7% | | | |
| Dell Technologies, Inc. (a) | | 154,418 | 7,957,160 |
|
| TOTAL ELECTRONIC EQUIPMENT & COMPONENTS | | | 26,670,032 |
|
| Household Durables - 16.3% | | | |
| Consumer Electronics - 16.3% | | | |
| LG Electronics, Inc. | | 60,467 | 3,062,417 |
| Sony Corp. | | 1,272,446 | 72,481,638 |
| | | | 75,544,055 |
| Interactive Media & Services - 2.7% | | | |
| Interactive Media & Services - 2.7% | | | |
| Alphabet, Inc. Class A (a) | | 10,611 | 12,632,714 |
| IT Services - 4.7% | | | |
| Data Processing & Outsourced Services - 4.7% | | | |
| MasterCard, Inc. Class A | | 39,435 | 11,095,826 |
| Visa, Inc. Class A | | 60,420 | 10,925,144 |
| | | | 22,020,970 |
| Internet Services & Infrastructure - 0.0% | | | |
| Fastly, Inc. Class A (b) | | 1,000 | 31,600 |
|
| TOTAL IT SERVICES | | | 22,052,570 |
|
| Machinery - 0.1% | | | |
| Industrial Machinery - 0.1% | | | |
| Kornit Digital Ltd. (a)(b) | | 16,370 | 461,798 |
| Semiconductors & Semiconductor Equipment - 4.1% | | | |
| Semiconductor Equipment - 3.2% | | | |
| ASML Holding NV | | 24,796 | 5,519,838 |
| Entegris, Inc. | | 220,098 | 9,426,797 |
| | | | 14,946,635 |
| Semiconductors - 0.9% | | | |
| Mellanox Technologies Ltd. (a) | | 36,095 | 3,863,970 |
|
| TOTAL SEMICONDUCTORS & SEMICONDUCTOR EQUIPMENT | | | 18,810,605 |
|
| Software - 3.3% | | | |
| Systems Software - 3.3% | | | |
| Microsoft Corp. | | 76,525 | 10,549,737 |
| Symantec Corp. | | 195,383 | 4,542,655 |
| | | | 15,092,392 |
| Technology Hardware, Storage & Peripherals - 59.6% | | | |
| Technology Hardware, Storage & Peripherals - 59.6% | | | |
| Apple, Inc. | | 410,023 | 85,588,198 |
| Canon, Inc. | | 238,094 | 6,172,721 |
| Diebold Nixdorf, Inc. (a) | | 102,247 | 1,146,189 |
| Fujifilm Holdings Corp. | | 309,795 | 13,265,472 |
| Hewlett Packard Enterprise Co. | | 1,122,188 | 15,508,638 |
| HP, Inc. | | 588,771 | 10,768,622 |
| Logitech International SA (Reg.) | | 414,835 | 16,811,348 |
| NetApp, Inc. | | 377,779 | 18,156,059 |
| Pure Storage, Inc. Class A (a) | | 419,247 | 6,825,341 |
| Samsung Electronics Co. Ltd. | | 2,000,854 | 72,736,687 |
| Seagate Technology LLC | | 180,351 | 9,055,424 |
| Western Digital Corp. | | 326,954 | 18,724,656 |
| Xerox Holdings Corp. | | 63,108 | 1,829,501 |
| | | | 276,588,856 |
| TOTAL COMMON STOCKS | | | |
| (Cost $353,120,272) | | | 464,142,338 |
|
| Money Market Funds - 1.6% | | | |
| Fidelity Cash Central Fund 2.13% (d) | | 361,190 | 361,263 |
| Fidelity Securities Lending Cash Central Fund 2.13% (d)(e) | | 6,790,841 | 6,791,520 |
| TOTAL MONEY MARKET FUNDS | | | |
| (Cost $7,152,783) | | | 7,152,783 |
| TOTAL INVESTMENT IN SECURITIES - 101.6% | | | |
| (Cost $360,273,055) | | | 471,295,121 |
| NET OTHER ASSETS (LIABILITIES) - (1.6)% | | | (7,234,392) |
| NET ASSETS - 100% | | | $464,060,729 |
Legend
(a) Non-income producing
(b) Security or a portion of the security is on loan at period end.
(c) Security exempt from registration under Rule 144A of the Securities Act of 1933. These securities may be resold in transactions exempt from registration, normally to qualified institutional buyers. At the end of the period, the value of these securities amounted to $12,144,889 or 2.6% of net assets.
(d) Affiliated fund that is generally available only to investment companies and other accounts managed by Fidelity Investments. The rate quoted is the annualized seven-day yield of the fund at period end. A complete unaudited listing of the fund's holdings as of its most recent quarter end is available upon request. In addition, each Fidelity Central Fund's financial statements are available on the SEC's website or upon request.
(e) Investment made with cash collateral received from securities on loan.
Affiliated Central Funds
Information regarding fiscal year to date income earned by the Fund from investments in Fidelity Central Funds is as follows:
| Fund | Income earned |
| Fidelity Cash Central Fund | $83,047 |
| Fidelity Securities Lending Cash Central Fund | 36,145 |
| Total | $119,192 |
Amounts in the income column in the above table include any capital gain distributions from underlying funds, which are presented in the corresponding line-item in the Statement of Operations, if applicable. Amount for Fidelity Securities Lending Cash Central Fund represents the income earned on investing cash collateral, less rebates paid to borrowers and any lending agent fees associated with the loan, plus any premium payments received for lending certain types of securities.
Investment Valuation
The following is a summary of the inputs used, as of August 31, 2019, involving the Fund's assets and liabilities carried at fair value. The inputs or methodology used for valuing securities may not be an indication of the risk associated with investing in those securities. For more information on valuation inputs, and their aggregation into the levels used below, please refer to the Investment Valuation section in the accompanying Notes to Financial Statements.
| | Valuation Inputs at Reporting Date: |
| Description | Total | Level 1 | Level 2 | Level 3 |
| Investments in Securities: | | | | |
| Common Stocks | $464,142,338 | $373,343,090 | $90,799,248 | $-- |
| Money Market Funds | 7,152,783 | 7,152,783 | -- | -- |
| Total Investments in Securities: | $471,295,121 | $380,495,873 | $90,799,248 | $-- |
Other Information
Distribution of investments by country or territory of incorporation, as a percentage of Total Net Assets, is as follows (Unaudited):
| United States of America | 49.4% |
| Japan | 23.8% |
| Korea (South) | 16.4% |
| Switzerland | 3.6% |
| Cayman Islands | 2.6% |
| Ireland | 2.0% |
| Netherlands | 1.2% |
| Israel | 1.0% |
| | 100.0% |
See accompanying notes which are an integral part of the financial statements.
Computers Portfolio
Financial Statements
Statement of Assets and Liabilities
| | | August 31, 2019 (Unaudited) |
| Assets | | |
Investment in securities, at value (including securities loaned of $6,428,752) — See accompanying schedule:
Unaffiliated issuers (cost $353,120,272) | $464,142,338 | |
| Fidelity Central Funds (cost $7,152,783) | 7,152,783 | |
| Total Investment in Securities (cost $360,273,055) | | $471,295,121 |
| Receivable for fund shares sold | | 52,157 |
| Dividends receivable | | 110,246 |
| Distributions receivable from Fidelity Central Funds | | 12,821 |
| Prepaid expenses | | 4,771 |
| Other receivables | | 178,977 |
| Total assets | | 471,654,093 |
| Liabilities | | |
| Payable for fund shares redeemed | $437,720 | |
| Accrued management fee | 205,031 | |
| Other affiliated payables | 82,077 | |
| Other payables and accrued expenses | 76,964 | |
| Collateral on securities loaned | 6,791,572 | |
| Total liabilities | | 7,593,364 |
| Net Assets | | $464,060,729 |
| Net Assets consist of: | | |
| Paid in capital | | $344,028,632 |
| Total distributable earnings (loss) | | 120,032,097 |
| Net Assets, for 6,463,654 shares outstanding | | $464,060,729 |
| Net Asset Value, offering price and redemption price per share ($464,060,729 ÷ 6,463,654 shares) | | $71.80 |
See accompanying notes which are an integral part of the financial statements.
Statement of Operations
| | | Six months ended August 31, 2019 (Unaudited) |
| Investment Income | | |
| Dividends | | $4,530,624 |
| Income from Fidelity Central Funds (including $36,145 from security lending) | | 119,192 |
| Income before foreign taxes withheld | | 4,649,816 |
| Less foreign taxes withheld | | (258,667) |
| Total income | | 4,391,149 |
| Expenses | | |
| Management fee | $1,316,086 | |
| Transfer agent fees | 418,626 | |
| Accounting and security lending fees | 95,276 | |
| Custodian fees and expenses | 14,162 | |
| Independent trustees' fees and expenses | 1,364 | |
| Registration fees | 16,685 | |
| Audit | 19,398 | |
| Legal | 867 | |
| Interest | 1,744 | |
| Miscellaneous | 2,188 | |
| Total expenses before reductions | 1,886,396 | |
| Expense reductions | (21,742) | |
| Total expenses after reductions | | 1,864,654 |
| Net investment income (loss) | | 2,526,495 |
| Realized and Unrealized Gain (Loss) | | |
| Net realized gain (loss) on: | | |
| Investment securities: | | |
| Unaffiliated issuers | 11,982,763 | |
| Fidelity Central Funds | (51) | |
| Foreign currency transactions | (119,199) | |
| Total net realized gain (loss) | | 11,863,513 |
| Change in net unrealized appreciation (depreciation) on: | | |
| Investment securities: | | |
| Unaffiliated issuers | (391,872) | |
| Assets and liabilities in foreign currencies | 36,862 | |
| Total change in net unrealized appreciation (depreciation) | | (355,010) |
| Net gain (loss) | | 11,508,503 |
| Net increase (decrease) in net assets resulting from operations | | $14,034,998 |
See accompanying notes which are an integral part of the financial statements.
Statement of Changes in Net Assets
| | Six months ended August 31, 2019 (Unaudited) | Year ended February 28, 2019 |
| Increase (Decrease) in Net Assets | | |
| Operations | | |
| Net investment income (loss) | $2,526,495 | $4,700,043 |
| Net realized gain (loss) | 11,863,513 | 119,220,783 |
| Change in net unrealized appreciation (depreciation) | (355,010) | (121,913,173) |
| Net increase (decrease) in net assets resulting from operations | 14,034,998 | 2,007,653 |
| Distributions to shareholders | (41,949,430) | (87,948,443) |
| Share transactions | | |
| Proceeds from sales of shares | 30,603,043 | 34,349,889 |
| Reinvestment of distributions | 40,062,718 | 83,463,307 |
| Cost of shares redeemed | (70,470,914) | (78,423,602) |
| Net increase (decrease) in net assets resulting from share transactions | 194,847 | 39,389,594 |
| Total increase (decrease) in net assets | (27,719,585) | (46,551,196) |
| Net Assets | | |
| Beginning of period | 491,780,314 | 538,331,510 |
| End of period | $464,060,729 | $491,780,314 |
| Other Information | | |
| Shares | | |
| Sold | 410,158 | 391,378 |
| Issued in reinvestment of distributions | 540,293 | 1,189,565 |
| Redeemed | (971,585) | (896,723) |
| Net increase (decrease) | (21,134) | 684,220 |
See accompanying notes which are an integral part of the financial statements.
Financial Highlights
Computers Portfolio
| | Six months ended (Unaudited) August 31, | Years endedFebruary 28, | | | | |
| | 2019 | 2019 | 2018 | 2017 | 2016 A | 2015 |
| Selected Per–Share Data | | | | | | |
| Net asset value, beginning of period | $75.84 | $92.81 | $83.01 | $62.46 | $83.28 | $75.46 |
| Income from Investment Operations | | | | | | |
| Net investment income (loss)B | .38 | .81 | .67 | .73 | .69 | .45 |
| Net realized and unrealized gain (loss) | 2.02 | (1.67) | 19.24 | 24.69 | (18.42) | 9.61 |
| Total from investment operations | 2.40 | (.86) | 19.91 | 25.42 | (17.73) | 10.06 |
| Distributions from net investment income | – | (.88)C | (.73)C | (.88) | (.80) | (.47) |
| Distributions from net realized gain | (6.44) | (15.23)C | (9.38)C | (4.00) | (2.29) | (1.77) |
| Total distributions | (6.44) | (16.11) | (10.11) | (4.87)D | (3.09) | (2.24) |
| Redemption fees added to paid in capitalB | – | – | –E | –E | –E | –E |
| Net asset value, end of period | $71.80 | $75.84 | $92.81 | $83.01 | $62.46 | $83.28 |
| Total ReturnF,G | 2.90% | .54% | 24.82% | 41.57% | (21.56)% | 13.36% |
| Ratios to Average Net AssetsH,I | | | | | | |
| Expenses before reductions | .77%J | .77% | .79% | .81% | .80% | .80% |
| Expenses net of fee waivers, if any | .77%J | .77% | .79% | .81% | .80% | .80% |
| Expenses net of all reductions | .76%J | .77% | .78% | .81% | .79% | .80% |
| Net investment income (loss) | 1.03%J | .90% | .75% | 1.01% | .91% | .57% |
| Supplemental Data | | | | | | |
| Net assets, end of period (000 omitted) | $464,061 | $491,780 | $538,332 | $472,745 | $388,554 | $808,852 |
| Portfolio turnover rateK | 117%J | 81% | 57% | 49% | 31% | 46% |
A For the year ended February 29.
B Calculated based on average shares outstanding during the period.
C The amounts shown reflect certain reclassifications related to book to tax differences that were made in the year shown.
D Total distributions of $4.87 per share is comprised of distributions from net investment income of $.879 and distributions from net realized gain of $3.995 per share.
E Amount represents less than $.005 per share.
F Total returns for periods of less than one year are not annualized.
G Total returns would have been lower if certain expenses had not been reduced during the applicable periods shown.
H Fees and expenses of any underlying Fidelity Central Funds are not included in the Fund's expense ratio. The Fund indirectly bears its proportionate share of the expenses of any underlying Fidelity Central Funds.
I Expense ratios reflect operating expenses of the Fund. Expenses before reductions do not reflect amounts reimbursed by the investment adviser or reductions from brokerage service arrangements or reductions from other expense offset arrangements and do not represent the amount paid by the Fund during periods when reimbursements or reductions occur. Expenses net of fee waivers reflect expenses after reimbursement by the investment adviser but prior to reductions from brokerage service arrangements or other expense offset arrangements. Expenses net of all reductions represent the net expenses paid by the Fund.
J Annualized
K Amount does not include the portfolio activity of any underlying Fidelity Central Funds.
See accompanying notes which are an integral part of the financial statements.
IT Services Portfolio
Investment Summary (Unaudited)
Top Ten Stocks as of August 31, 2019
| | % of fund's net assets |
| Visa, Inc. Class A | 17.4 |
| MasterCard, Inc. Class A | 16.0 |
| Fidelity National Information Services, Inc. | 8.2 |
| Fiserv, Inc. | 6.0 |
| PayPal Holdings, Inc. | 5.0 |
| Accenture PLC Class A | 4.2 |
| Cognizant Technology Solutions Corp. Class A | 3.2 |
| IBM Corp. | 2.9 |
| FleetCor Technologies, Inc. | 2.3 |
| GoDaddy, Inc. | 2.2 |
| | 67.4 |
Top Industries (% of fund's net assets)
| As of August 31, 2019 |
| | IT Services | 89.3% |
| | Software | 7.5% |
| | Professional Services | 0.4% |
| | Electronic Equipment & Components | 0.3% |
| | Internet & Direct Marketing Retail | 0.2% |
| | All Others* | 2.3% |

* Includes short-term investments and net other assets (liabilities).
IT Services Portfolio
Schedule of Investments August 31, 2019 (Unaudited)
Showing Percentage of Net Assets
| Common Stocks - 97.7% | | | |
| | | Shares | Value |
| Electronic Equipment & Components - 0.3% | | | |
| Technology Distributors - 0.3% | | | |
| SYNNEX Corp. | | 154,535 | $12,951,578 |
| Internet & Direct Marketing Retail - 0.2% | | | |
| Internet & Direct Marketing Retail - 0.2% | | | |
| MercadoLibre, Inc. (a) | | 15,200 | 9,037,920 |
| IT Services - 89.3% | | | |
| Data Processing & Outsourced Services - 64.4% | | | |
| Adyen BV (a)(b) | | 2,500 | 1,810,135 |
| Alliance Data Systems Corp. | | 291,148 | 35,796,647 |
| Amadeus IT Holding SA Class A | | 800 | 59,577 |
| Automatic Data Processing, Inc. | | 498,500 | 84,665,240 |
| CoreLogic, Inc. (a) | | 2,700 | 130,680 |
| Fidelity National Information Services, Inc. | | 2,449,997 | 333,738,591 |
| Fiserv, Inc. (a) | | 2,264,117 | 242,124,672 |
| FleetCor Technologies, Inc. (a) | | 307,400 | 91,728,160 |
| Genpact Ltd. | | 2,017,280 | 82,627,789 |
| Global Payments, Inc. | | 518,203 | 86,011,334 |
| Jack Henry & Associates, Inc. | | 1,600 | 231,936 |
| MasterCard, Inc. Class A | | 2,315,500 | 651,512,235 |
| Paychex, Inc. | | 3,700 | 302,290 |
| PayPal Holdings, Inc. (a) | | 1,846,400 | 201,349,920 |
| Square, Inc. (a) | | 302,600 | 18,712,784 |
| The Western Union Co. | | 4,800 | 106,176 |
| Ttec Holdings, Inc. | | 2,000 | 93,820 |
| Visa, Inc. Class A (c) | | 3,912,348 | 707,430,767 |
| WEX, Inc. (a) | | 700 | 143,185 |
| WNS Holdings Ltd. sponsored ADR (a) | | 1,256,992 | 76,399,974 |
| | | | 2,614,975,912 |
| Internet Services & Infrastructure - 4.2% | | | |
| Akamai Technologies, Inc. (a) | | 112,500 | 10,027,125 |
| GoDaddy, Inc. (a) | | 1,429,127 | 90,520,904 |
| VeriSign, Inc. (a) | | 89,100 | 18,163,035 |
| Wix.com Ltd. (a) | | 380,917 | 53,423,609 |
| | | | 172,134,673 |
| IT Consulting & Other Services - 20.7% | | | |
| Accenture PLC Class A | | 861,980 | 170,818,577 |
| Amdocs Ltd. | | 431,300 | 27,922,362 |
| Booz Allen Hamilton Holding Corp. Class A | | 833,100 | 62,907,381 |
| Capgemini SA | | 482,500 | 57,881,331 |
| Cognizant Technology Solutions Corp. Class A | | 2,109,932 | 129,528,725 |
| DXC Technology Co. | | 1,161,400 | 38,581,708 |
| Endava PLC ADR (a) | | 462,558 | 17,387,555 |
| EPAM Systems, Inc. (a) | | 460,100 | 88,030,933 |
| IBM Corp. | | 867,150 | 117,524,840 |
| Interxion Holding N.V. (a) | | 379,400 | 30,708,636 |
| Leidos Holdings, Inc. | | 676,425 | 59,092,488 |
| Liveramp Holdings, Inc. (a) | | 6,100 | 258,396 |
| Netcompany Group A/S (a)(b) | | 47,700 | 1,916,563 |
| Perspecta, Inc. | | 14,868 | 385,825 |
| Science Applications International Corp. | | 800 | 70,408 |
| Virtusa Corp. (a) | | 1,087,628 | 39,306,876 |
| | | | 842,322,604 |
|
| TOTAL IT SERVICES | | | 3,629,433,189 |
|
| Professional Services - 0.4% | | | |
| Research & Consulting Services - 0.4% | | | |
| ICF International, Inc. | | 178,011 | 15,070,411 |
| Software - 7.5% | | | |
| Application Software - 7.4% | | | |
| Adobe, Inc. (a) | | 162,869 | 46,337,859 |
| Black Knight, Inc. (a) | | 1,016,500 | 63,277,125 |
| Blue Prism Group PLC (a) | | 678,600 | 7,666,815 |
| Ceridian HCM Holding, Inc. (a)(c) | | 7,073 | 408,607 |
| DocuSign, Inc. (a) | | 143,700 | 6,709,353 |
| Globant SA (a) | | 128,400 | 12,189,012 |
| Intuit, Inc. | | 305,700 | 88,151,652 |
| Lightspeed POS, Inc. (a) | | 28,000 | 894,848 |
| SAP SE sponsored ADR | | 219,000 | 26,093,850 |
| SS&C Technologies Holdings, Inc. | | 993,200 | 46,293,052 |
| | | | 298,022,173 |
| Systems Software - 0.1% | | | |
| Zoom Video Communications, Inc. Class A (c) | | 4,500 | 412,515 |
| Zuora, Inc. (a)(c) | | 312,500 | 4,703,125 |
| | | | 5,115,640 |
|
| TOTAL SOFTWARE | | | 303,137,813 |
|
| TOTAL COMMON STOCKS | | | |
| (Cost $2,296,250,874) | | | 3,969,630,911 |
|
| Money Market Funds - 7.9% | | | |
| Fidelity Cash Central Fund 2.13% (d) | | 116,028,191 | 116,051,396 |
| Fidelity Securities Lending Cash Central Fund 2.13% (d)(e) | | 205,622,754 | 205,643,316 |
| TOTAL MONEY MARKET FUNDS | | | |
| (Cost $321,694,399) | | | 321,694,712 |
| TOTAL INVESTMENT IN SECURITIES - 105.6% | | | |
| (Cost $2,617,945,273) | | | 4,291,325,623 |
| NET OTHER ASSETS (LIABILITIES) - (5.6)% | | | (226,942,611) |
| NET ASSETS - 100% | | | $4,064,383,012 |
Legend
(a) Non-income producing
(b) Security exempt from registration under Rule 144A of the Securities Act of 1933. These securities may be resold in transactions exempt from registration, normally to qualified institutional buyers. At the end of the period, the value of these securities amounted to $3,726,698 or 0.1% of net assets.
(c) Security or a portion of the security is on loan at period end.
(d) Affiliated fund that is generally available only to investment companies and other accounts managed by Fidelity Investments. The rate quoted is the annualized seven-day yield of the fund at period end. A complete unaudited listing of the fund's holdings as of its most recent quarter end is available upon request. In addition, each Fidelity Central Fund's financial statements are available on the SEC's website or upon request.
(e) Investment made with cash collateral received from securities on loan.
Affiliated Central Funds
Information regarding fiscal year to date income earned by the Fund from investments in Fidelity Central Funds is as follows:
| Fund | Income earned |
| Fidelity Cash Central Fund | $972,762 |
| Fidelity Securities Lending Cash Central Fund | 198,126 |
| Total | $1,170,888 |
Amounts in the income column in the above table include any capital gain distributions from underlying funds, which are presented in the corresponding line-item in the Statement of Operations, if applicable. Amount for Fidelity Securities Lending Cash Central Fund represents the income earned on investing cash collateral, less rebates paid to borrowers and any lending agent fees associated with the loan, plus any premium payments received for lending certain types of securities.
Investment Valuation
All investments are categorized as Level 1 under the Fair Value Hierarchy. The inputs or methodology used for valuing securities may not be an indication of the risk associated with investing in those securities. For more information on valuation inputs please refer to the Investment Valuation section in the accompanying Notes to Financial Statements.
Other Information
Distribution of investments by country or territory of incorporation, as a percentage of Total Net Assets, is as follows (Unaudited):
| United States of America | 86.1% |
| Ireland | 4.2% |
| Bermuda | 2.0% |
| Bailiwick of Jersey | 1.9% |
| France | 1.4% |
| Israel | 1.3% |
| Others (Individually Less Than 1%) | 3.1% |
| | 100.0% |
See accompanying notes which are an integral part of the financial statements.
IT Services Portfolio
Financial Statements
Statement of Assets and Liabilities
| | | August 31, 2019 (Unaudited) |
| Assets | | |
Investment in securities, at value (including securities loaned of $201,021,090) — See accompanying schedule:
Unaffiliated issuers (cost $2,296,250,874) | $3,969,630,911 | |
| Fidelity Central Funds (cost $321,694,399) | 321,694,712 | |
| Total Investment in Securities (cost $2,617,945,273) | | $4,291,325,623 |
| Cash | | 3,065,511 |
| Receivable for investments sold | | 3,200,773 |
| Receivable for fund shares sold | | 9,383,610 |
| Dividends receivable | | 2,467,698 |
| Distributions receivable from Fidelity Central Funds | | 223,981 |
| Prepaid expenses | | 23,698 |
| Other receivables | | 33,159 |
| Total assets | | 4,309,724,053 |
| Liabilities | | |
| Payable for investments purchased | $32,369,739 | |
| Payable for fund shares redeemed | 4,932,084 | |
| Accrued management fee | 1,773,460 | |
| Other affiliated payables | 586,287 | |
| Other payables and accrued expenses | 36,144 | |
| Collateral on securities loaned | 205,643,327 | |
| Total liabilities | | 245,341,041 |
| Net Assets | | $4,064,383,012 |
| Net Assets consist of: | | |
| Paid in capital | | $2,381,835,402 |
| Total distributable earnings (loss) | | 1,682,547,610 |
| Net Assets, for 55,328,859 shares outstanding | | $4,064,383,012 |
| Net Asset Value, offering price and redemption price per share ($4,064,383,012 ÷ 55,328,859 shares) | | $73.46 |
See accompanying notes which are an integral part of the financial statements.
Statement of Operations
| | | Six months ended August 31, 2019 (Unaudited) |
| Investment Income | | |
| Dividends | | $12,180,371 |
| Income from Fidelity Central Funds (including $198,126 from security lending) | | 1,170,888 |
| Total income | | 13,351,259 |
| Expenses | | |
| Management fee | $9,370,954 | |
| Transfer agent fees | 2,736,938 | |
| Accounting and security lending fees | 490,446 | |
| Custodian fees and expenses | 12,230 | |
| Independent trustees' fees and expenses | 8,831 | |
| Registration fees | 129,456 | |
| Audit | 26,689 | |
| Legal | 3,570 | |
| Miscellaneous | 12,032 | |
| Total expenses before reductions | 12,791,146 | |
| Expense reductions | (37,780) | |
| Total expenses after reductions | | 12,753,366 |
| Net investment income (loss) | | 597,893 |
| Realized and Unrealized Gain (Loss) | | |
| Net realized gain (loss) on: | | |
| Investment securities: | | |
| Unaffiliated issuers | 17,104,977 | |
| Fidelity Central Funds | (445) | |
| Foreign currency transactions | (15,919) | |
| Total net realized gain (loss) | | 17,088,613 |
| Change in net unrealized appreciation (depreciation) on: | | |
| Investment securities: | | |
| Unaffiliated issuers | 407,499,994 | |
| Assets and liabilities in foreign currencies | (152) | |
| Total change in net unrealized appreciation (depreciation) | | 407,499,842 |
| Net gain (loss) | | 424,588,455 |
| Net increase (decrease) in net assets resulting from operations | | $425,186,348 |
See accompanying notes which are an integral part of the financial statements.
Statement of Changes in Net Assets
| | Six months ended August 31, 2019 (Unaudited) | Year ended February 28, 2019 |
| Increase (Decrease) in Net Assets | | |
| Operations | | |
| Net investment income (loss) | $597,893 | $1,576,745 |
| Net realized gain (loss) | 17,088,613 | 94,401,044 |
| Change in net unrealized appreciation (depreciation) | 407,499,842 | 266,646,267 |
| Net increase (decrease) in net assets resulting from operations | 425,186,348 | 362,624,056 |
| Distributions to shareholders | (16,816,493) | (111,405,360) |
| Share transactions | | |
| Proceeds from sales of shares | 1,186,482,950 | 866,407,438 |
| Reinvestment of distributions | 15,944,226 | 105,563,259 |
| Cost of shares redeemed | (413,735,318) | (640,019,796) |
| Net increase (decrease) in net assets resulting from share transactions | 788,691,858 | 331,950,901 |
| Total increase (decrease) in net assets | 1,197,061,713 | 583,169,597 |
| Net Assets | | |
| Beginning of period | 2,867,321,299 | 2,284,151,702 |
| End of period | $4,064,383,012 | $2,867,321,299 |
| Other Information | | |
| Shares | | |
| Sold | 16,850,809 | 14,047,200 |
| Issued in reinvestment of distributions | 231,311 | 1,880,626 |
| Redeemed | (5,892,279) | (10,707,678) |
| Net increase (decrease) | 11,189,841 | 5,220,148 |
See accompanying notes which are an integral part of the financial statements.
Financial Highlights
IT Services Portfolio
| | Six months ended (Unaudited) August 31, | Years endedFebruary 28, | | | | |
| | 2019 | 2019 | 2018 | 2017 | 2016 A | 2015 |
| Selected Per–Share Data | | | | | | |
| Net asset value, beginning of period | $64.96 | $58.69 | $44.84 | $37.16 | $38.88 | $37.86 |
| Income from Investment Operations | | | | | | |
| Net investment income (loss)B | .01 | .04 | .04 | .13C | (.02) | (.03) |
| Net realized and unrealized gain (loss) | 8.85 | 8.92 | 15.50 | 7.68 | (.15) | 4.06 |
| Total from investment operations | 8.86 | 8.96 | 15.54 | 7.81 | (.17) | 4.03 |
| Distributions from net investment income | (.01) | (.03) | (.02) | (.13) | – | (.01) |
| Distributions from net realized gain | (.35) | (2.66) | (1.67) | – | (1.55) | (3.01) |
| Total distributions | (.36) | (2.69) | (1.69) | (.13) | (1.55) | (3.01)D |
| Redemption fees added to paid in capitalB | – | – | – | –E | –E | –E |
| Net asset value, end of period | $73.46 | $64.96 | $58.69 | $44.84 | $37.16 | $38.88 |
| Total ReturnF,G | 13.68% | 16.04% | 35.17% | 21.05% | (.59)% | 11.16% |
| Ratios to Average Net AssetsH,I | | | | | | |
| Expenses before reductions | .73%J | .74% | .77% | .79% | .81% | .81% |
| Expenses net of fee waivers, if any | .73%J | .74% | .77% | .79% | .81% | .81% |
| Expenses net of all reductions | .73%J | .74% | .77% | .79% | .80% | .81% |
| Net investment income (loss) | .03%J | .06% | .08% | .33%C | (.06)% | (.07)% |
| Supplemental Data | | | | | | |
| Net assets, end of period (000 omitted) | $4,064,383 | $2,867,321 | $2,284,152 | $1,663,802 | $1,894,175 | $941,998 |
| Portfolio turnover rateK | 5%J | 26% | 26% | 27% | 24% | 56% |
A For the year ended February 29.
B Calculated based on average shares outstanding during the period.
C Net investment income per share reflects a large, non-recurring dividend which amounted to $.13 per share. Excluding this non-recurring dividend, the ratio of net investment income (loss) to average net assets would have been .02%.
D Total distributions of $3.01 per share is comprised of distributions from net investment income of $.005 and distributions from net realized gain of $3.009 per share.
E Amount represents less than $.005 per share.
F Total returns for periods of less than one year are not annualized.
G Total returns would have been lower if certain expenses had not been reduced during the applicable periods shown.
H Fees and expenses of any underlying Fidelity Central Funds are not included in the Fund's expense ratio. The Fund indirectly bears its proportionate share of the expenses of any underlying Fidelity Central Funds.
I Expense ratios reflect operating expenses of the Fund. Expenses before reductions do not reflect amounts reimbursed by the investment adviser or reductions from brokerage service arrangements or reductions from other expense offset arrangements and do not represent the amount paid by the Fund during periods when reimbursements or reductions occur. Expenses net of fee waivers reflect expenses after reimbursement by the investment adviser but prior to reductions from brokerage service arrangements or other expense offset arrangements. Expenses net of all reductions represent the net expenses paid by the Fund.
J Annualized
K Amount does not include the portfolio activity of any underlying Fidelity Central Funds.
See accompanying notes which are an integral part of the financial statements.
Semiconductors Portfolio
Investment Summary (Unaudited)
Top Ten Stocks as of August 31, 2019
| | % of fund's net assets |
| Intel Corp. | 11.6 |
| Broadcom, Inc. | 9.7 |
| Qualcomm, Inc. | 9.4 |
| Micron Technology, Inc. | 6.4 |
| NVIDIA Corp. | 5.6 |
| Marvell Technology Group Ltd. | 5.4 |
| ON Semiconductor Corp. | 4.8 |
| Lam Research Corp. | 4.8 |
| NXP Semiconductors NV | 4.5 |
| Applied Materials, Inc. | 3.9 |
| | 66.1 |
Top Industries (% of fund's net assets)
| As of August 31, 2019 |
| | Semiconductors & Semiconductor Equipment | 86.9% |
| | Electronic Equipment & Components | 7.1% |
| | Communications Equipment | 2.6% |
| | Technology Hardware, Storage & Peripherals | 1.1% |
| | Software | 0.4% |
| | All Others* | 1.9% |

* Includes short-term investments and net other assets (liabilities).
Semiconductors Portfolio
Schedule of Investments August 31, 2019 (Unaudited)
Showing Percentage of Net Assets
| Common Stocks - 98.1% | | | |
| | | Shares | Value |
| Communications Equipment - 2.6% | | | |
| Communications Equipment - 2.6% | | | |
| CommScope Holding Co., Inc. (a) | | 7,878,500 | $84,615,090 |
| Electronic Equipment & Components - 7.1% | | | |
| Electronic Manufacturing Services - 7.1% | | | |
| Celestica, Inc. (a) | | 904,300 | 5,850,821 |
| Flextronics International Ltd. (a) | | 11,330,100 | 109,108,863 |
| Jabil, Inc. | | 2,380,037 | 68,568,866 |
| TTM Technologies, Inc. (a) | | 4,131,894 | 44,045,990 |
| | | | 227,574,540 |
| Independent Power and Renewable Electricity Producers - 0.0% | | | |
| Renewable Electricity - 0.0% | | | |
| Bloom Energy Corp. Class A (a) | | 222,800 | 998,144 |
| Semiconductors & Semiconductor Equipment - 86.9% | | | |
| Semiconductor Equipment - 11.5% | | | |
| Advanced Energy Industries, Inc. (a) | | 1,017,300 | 52,533,372 |
| Applied Materials, Inc. | | 2,628,900 | 126,239,778 |
| Kulicke & Soffa Industries, Inc. | | 269,700 | 5,617,851 |
| Lam Research Corp. | | 736,573 | 155,055,982 |
| MKS Instruments, Inc. | | 417,900 | 32,717,391 |
| | | | 372,164,374 |
| Semiconductors - 75.4% | | | |
| Advanced Micro Devices, Inc. (a) | | 1,337,500 | 42,064,375 |
| Alpha & Omega Semiconductor Ltd. (a) | | 891,445 | 10,501,222 |
| Ambarella, Inc. (a) | | 92,900 | 5,190,323 |
| Analog Devices, Inc. | | 633,096 | 69,532,934 |
| Broadcom, Inc. | | 1,112,050 | 314,309,812 |
| Cree, Inc. (a) | | 139,100 | 5,971,563 |
| Intel Corp. | | 7,916,871 | 375,338,854 |
| Marvell Technology Group Ltd. | | 7,243,879 | 173,635,780 |
| Maxim Integrated Products, Inc. | | 238,600 | 13,013,244 |
| MaxLinear, Inc. Class A (a) | | 9,831 | 194,850 |
| MediaTek, Inc. | | 57,000 | 668,651 |
| Mellanox Technologies Ltd. (a) | | 455,900 | 48,804,095 |
| Microchip Technology, Inc. (b) | | 898,900 | 77,602,037 |
| Micron Technology, Inc. (a) | | 4,600,960 | 208,285,459 |
| Nordic VLSI ASA (a) | | 57,279 | 259,485 |
| NVIDIA Corp. | | 1,072,292 | 179,619,633 |
| NXP Semiconductors NV | | 1,413,418 | 144,366,515 |
| O2Micro International Ltd. sponsored ADR (a) | | 357,607 | 464,889 |
| ON Semiconductor Corp. (a) | | 8,783,246 | 156,341,779 |
| Qorvo, Inc. (a) | | 786,124 | 56,152,837 |
| Qualcomm, Inc. | | 3,904,284 | 303,636,167 |
| Renesas Electronics Corp. (a) | | 9,368,425 | 58,555,412 |
| Sanken Electric Co. Ltd. | | 877,600 | 15,307,505 |
| Semtech Corp. (a) | | 66,500 | 2,791,005 |
| Silicon Motion Technology Corp. sponsored ADR | | 498,300 | 16,080,141 |
| Skyworks Solutions, Inc. | | 943,000 | 70,979,610 |
| SMART Global Holdings, Inc. (a) | | 339,600 | 9,648,036 |
| Synaptics, Inc. (a)(b) | | 726,664 | 23,267,781 |
| Xilinx, Inc. | | 529,100 | 55,058,146 |
| | | | 2,437,642,140 |
|
| TOTAL SEMICONDUCTORS & SEMICONDUCTOR EQUIPMENT | | | 2,809,806,514 |
|
| Software - 0.4% | | | |
| Application Software - 0.4% | | | |
| SS&C Technologies Holdings, Inc. | | 288,200 | 13,433,002 |
| Technology Hardware, Storage & Peripherals - 1.1% | | | |
| Technology Hardware, Storage & Peripherals - 1.1% | | | |
| Western Digital Corp. | | 630,300 | 36,097,281 |
| TOTAL COMMON STOCKS | | | |
| (Cost $2,524,350,538) | | | 3,172,524,571 |
|
| Money Market Funds - 3.7% | | | |
| Fidelity Cash Central Fund 2.13% (c) | | 52,564,114 | 52,574,627 |
| Fidelity Securities Lending Cash Central Fund 2.13% (c)(d) | | 65,471,538 | 65,478,085 |
| TOTAL MONEY MARKET FUNDS | | | |
| (Cost $118,052,431) | | | 118,052,712 |
| TOTAL INVESTMENT IN SECURITIES - 101.8% | | | |
| (Cost $2,642,402,969) | | | 3,290,577,283 |
| NET OTHER ASSETS (LIABILITIES) - (1.8)% | | | (57,018,569) |
| NET ASSETS - 100% | | | $3,233,558,714 |
Legend
(a) Non-income producing
(b) Security or a portion of the security is on loan at period end.
(c) Affiliated fund that is generally available only to investment companies and other accounts managed by Fidelity Investments. The rate quoted is the annualized seven-day yield of the fund at period end. A complete unaudited listing of the fund's holdings as of its most recent quarter end is available upon request. In addition, each Fidelity Central Fund's financial statements are available on the SEC's website or upon request.
(d) Investment made with cash collateral received from securities on loan.
Affiliated Central Funds
Information regarding fiscal year to date income earned by the Fund from investments in Fidelity Central Funds is as follows:
| Fund | Income earned |
| Fidelity Cash Central Fund | $1,015,340 |
| Fidelity Securities Lending Cash Central Fund | 76,074 |
| Total | $1,091,414 |
Amounts in the income column in the above table include any capital gain distributions from underlying funds, which are presented in the corresponding line-item in the Statement of Operations, if applicable. Amount for Fidelity Securities Lending Cash Central Fund represents the income earned on investing cash collateral, less rebates paid to borrowers and any lending agent fees associated with the loan, plus any premium payments received for lending certain types of securities.
Other Affiliated Issuers
An affiliated company is a company in which the Fund has ownership of at least 5% of the voting securities. Fiscal year to date transactions with companies which are or were affiliates are as follows:
| Affiliate | Value, beginning of period | Purchases | Sales Proceeds | Dividend Income | Realized Gain (loss) | Change in Unrealized appreciation (depreciation) | Value, end of period |
| Alpha & Omega Semiconductor Ltd. | $10,846,575 | $3,805,896 | $5,624,094 | $-- | $(2,451,158) | $3,924,003 | $-- |
| Total | $10,846,575 | $3,805,896 | $5,624,094 | $-- | $(2,451,158) | $3,924,003 | $-- |
Investment Valuation
All investments are categorized as Level 1 under the Fair Value Hierarchy. The inputs or methodology used for valuing securities may not be an indication of the risk associated with investing in those securities. For more information on valuation inputs please refer to the Investment Valuation section in the accompanying Notes to Financial Statements.
Other Information
Distribution of investments by country or territory of incorporation, as a percentage of Total Net Assets, is as follows (Unaudited):
| United States of America | 81.7% |
| Bermuda | 5.7% |
| Netherlands | 4.5% |
| Singapore | 3.4% |
| Japan | 2.3% |
| Israel | 1.5% |
| Others (Individually Less Than 1%) | 0.9% |
| | 100.0% |
See accompanying notes which are an integral part of the financial statements.
Semiconductors Portfolio
Financial Statements
Statement of Assets and Liabilities
| | | August 31, 2019 (Unaudited) |
| Assets | | |
Investment in securities, at value (including securities loaned of $63,874,934) — See accompanying schedule:
Unaffiliated issuers (cost $2,524,350,538) | $3,172,524,571 | |
| Fidelity Central Funds (cost $118,052,431) | 118,052,712 | |
| Total Investment in Securities (cost $2,642,402,969) | | $3,290,577,283 |
| Receivable for investments sold | | 8,583,373 |
| Receivable for fund shares sold | | 1,076,709 |
| Dividends receivable | | 4,834,524 |
| Distributions receivable from Fidelity Central Funds | | 113,799 |
| Prepaid expenses | | 31,996 |
| Other receivables | | 220,654 |
| Total assets | | 3,305,438,338 |
| Liabilities | | |
| Payable for fund shares redeemed | $4,262,642 | |
| Accrued management fee | 1,421,735 | |
| Other affiliated payables | 501,863 | |
| Other payables and accrued expenses | 220,322 | |
| Collateral on securities loaned | 65,473,062 | |
| Total liabilities | | 71,879,624 |
| Net Assets | | $3,233,558,714 |
| Net Assets consist of: | | |
| Paid in capital | | $2,566,494,586 |
| Total distributable earnings (loss) | | 667,064,128 |
| Net Assets, for 315,146,473 shares outstanding | | $3,233,558,714 |
| Net Asset Value, offering price and redemption price per share ($3,233,558,714 ÷ 315,146,473 shares) | | $10.26 |
See accompanying notes which are an integral part of the financial statements.
Statement of Operations
| | | Six months ended August 31, 2019 (Unaudited) |
| Investment Income | | |
| Dividends | | $25,751,423 |
| Income from Fidelity Central Funds (including $76,074 from security lending) | | 1,091,414 |
| Total income | | 26,842,837 |
| Expenses | | |
| Management fee | $8,657,582 | |
| Transfer agent fees | 2,570,922 | |
| Accounting and security lending fees | 477,025 | |
| Custodian fees and expenses | 26,624 | |
| Independent trustees' fees and expenses | 8,690 | |
| Registration fees | 69,012 | |
| Audit | 19,340 | |
| Legal | 3,423 | |
| Miscellaneous | 14,979 | |
| Total expenses before reductions | 11,847,597 | |
| Expense reductions | (52,362) | |
| Total expenses after reductions | | 11,795,235 |
| Net investment income (loss) | | 15,047,602 |
| Realized and Unrealized Gain (Loss) | | |
| Net realized gain (loss) on: | | |
| Investment securities: | | |
| Unaffiliated issuers | 111,754,855 | |
| Fidelity Central Funds | (205) | |
| Other affiliated issuers | (2,451,158) | |
| Foreign currency transactions | 4,731 | |
| Total net realized gain (loss) | | 109,308,223 |
| Change in net unrealized appreciation (depreciation) on: | | |
| Investment securities: | | |
| Unaffiliated issuers | 133,093,018 | |
| Affiliated issuers | 3,924,003 | |
| Assets and liabilities in foreign currencies | 7,319 | |
| Total change in net unrealized appreciation (depreciation) | | 137,024,340 |
| Net gain (loss) | | 246,332,563 |
| Net increase (decrease) in net assets resulting from operations | | $261,380,165 |
See accompanying notes which are an integral part of the financial statements.
Statement of Changes in Net Assets
| | Six months ended August 31, 2019 (Unaudited) | Year ended February 28, 2019 |
| Increase (Decrease) in Net Assets | | |
| Operations | | |
| Net investment income (loss) | $15,047,602 | $30,274,775 |
| Net realized gain (loss) | 109,308,223 | 295,665,075 |
| Change in net unrealized appreciation (depreciation) | 137,024,340 | (362,836,983) |
| Net increase (decrease) in net assets resulting from operations | 261,380,165 | (36,897,133) |
| Distributions to shareholders | (2,623,239) | (611,562,086) |
| Share transactions | | |
| Proceeds from sales of shares | 411,704,026 | 593,371,840 |
| Reinvestment of distributions | 2,516,962 | 585,226,471 |
| Cost of shares redeemed | (491,924,898) | (1,130,198,787) |
| Net increase (decrease) in net assets resulting from share transactions | (77,703,910) | 48,399,524 |
| Total increase (decrease) in net assets | 181,053,016 | (600,059,695) |
| Net Assets | | |
| Beginning of period | 3,052,505,698 | 3,652,565,393 |
| End of period | $3,233,558,714 | $3,052,505,698 |
| Other Information | | |
| Shares(a) | | |
| Sold | 40,747,273 | 55,572,693 |
| Issued in reinvestment of distributions | 242,716 | 66,721,427 |
| Redeemed | (50,188,889) | (108,362,277) |
| Net increase (decrease) | (9,198,900) | 13,931,843 |
(a) Share activity prior to May 11, 2018 has been adjusted to reflect the impact of the 10 for 1 share split that occurred on that date.
See accompanying notes which are an integral part of the financial statements.
Financial Highlights
Semiconductors Portfolio
| | Six months ended (Unaudited) August 31, | Years endedFebruary 28, | | | | |
| | 2019 | 2019 A | 2018 A | 2017 A | 2016 A,B | 2015 A |
| Selected Per–Share Data | | | | | | |
| Net asset value, beginning of period | $9.41 | $11.77 | $10.12 | $6.99 | $8.95 | $6.83 |
| Income from Investment Operations | | | | | | |
| Net investment income (loss)C | .05 | .10 | .05 | .10 | .07 | .05 |
| Net realized and unrealized gain (loss) | .81 | (.35) | 3.24 | 3.40 | (.88) | 2.33 |
| Total from investment operations | .86 | (.25) | 3.29 | 3.50 | (.81) | 2.38 |
| Distributions from net investment income | (.01) | (.06) | (.12) | (.07) | (.08) | (.05) |
| Distributions from net realized gain | – | (2.05) | (1.52) | (.30) | (1.07) | (.21) |
| Total distributions | (.01) | (2.11) | (1.64) | (.37) | (1.15) | (.26) |
| Redemption fees added to paid in capitalC | – | – | –D | –D | –D | –D |
| Net asset value, end of period | $10.26 | $9.41 | $11.77 | $10.12 | $6.99 | $8.95 |
| Total ReturnE,F | 9.12% | .19% | 34.20% | 51.79% | (10.44)% | 34.91% |
| Ratios to Average Net AssetsG,H | | | | | | |
| Expenses before reductions | .73%I | .73% | .75% | .77% | .77% | .78% |
| Expenses net of fee waivers, if any | .73%I | .73% | .75% | .77% | .77% | .78% |
| Expenses net of all reductions | .73%I | .72% | .74% | .75% | .74% | .77% |
| Net investment income (loss) | .93%I | .92% | .47% | 1.19% | .88% | .61% |
| Supplemental Data | | | | | | |
| Net assets, end of period (000 omitted) | $3,233,559 | $3,052,506 | $3,652,565 | $3,012,372 | $1,338,175 | $2,395,039 |
| Portfolio turnover rateJ | 112%I | 130% | 110% | 110% | 179% | 132%K |
A Per share amounts have been adjusted to reflect the impact of the 10 for 1 share split that occurred on May 11, 2018.
B For the year ended February 29.
C Calculated based on average shares outstanding during the period.
D Amount represents less than $.005 per share.
E Total returns for periods of less than one year are not annualized.
F Total returns would have been lower if certain expenses had not been reduced during the applicable periods shown.
G Fees and expenses of any underlying Fidelity Central Funds are not included in the Fund's expense ratio. The Fund indirectly bears its proportionate share of the expenses of any underlying Fidelity Central Funds.
H Expense ratios reflect operating expenses of the Fund. Expenses before reductions do not reflect amounts reimbursed by the investment adviser or reductions from brokerage service arrangements or reductions from other expense offset arrangements and do not represent the amount paid by the Fund during periods when reimbursements or reductions occur. Expenses net of fee waivers reflect expenses after reimbursement by the investment adviser but prior to reductions from brokerage service arrangements or other expense offset arrangements. Expenses net of all reductions represent the net expenses paid by the Fund.
I Annualized
J Amount does not include the portfolio activity of any underlying Fidelity Central Funds.
K Portfolio turnover rate excludes securities received or delivered in-kind.
See accompanying notes which are an integral part of the financial statements.
Software and IT Services Portfolio
Investment Summary (Unaudited)
Top Ten Stocks as of August 31, 2019
| | % of fund's net assets |
| Microsoft Corp. | 24.6 |
| Visa, Inc. Class A | 7.1 |
| Adobe, Inc. | 5.8 |
| MasterCard, Inc. Class A | 5.1 |
| Salesforce.com, Inc. | 4.5 |
| PayPal Holdings, Inc. | 4.1 |
| Alphabet, Inc. Class A | 3.3 |
| Cognizant Technology Solutions Corp. Class A | 2.3 |
| Oracle Corp. | 2.1 |
| Citrix Systems, Inc. | 2.0 |
| | 60.9 |
Top Industries (% of fund's net assets)
| As of August 31, 2019 |
| | Software | 51.6% |
| | IT Services | 32.0% |
| | Interactive Media & Services | 4.6% |
| | Entertainment | 2.6% |
| | Internet & Direct Marketing Retail | 1.7% |
| | All Others* | 7.5% |

* Includes short-term investments and net other assets (liabilities).
Software and IT Services Portfolio
Schedule of Investments August 31, 2019 (Unaudited)
Showing Percentage of Net Assets
| Common Stocks - 95.1% | | | |
| | | Shares | Value |
| Electronic Equipment & Components - 0.6% | | | |
| Electronic Equipment & Instruments - 0.6% | | | |
| Trimble, Inc. (a) | | 1,211,200 | $45,444,224 |
| Entertainment - 2.6% | | | |
| Interactive Home Entertainment - 2.6% | | | |
| Activision Blizzard, Inc. | | 1,809,200 | 91,545,520 |
| Electronic Arts, Inc. (a) | | 1,031,500 | 96,630,920 |
| | | | 188,176,440 |
| Interactive Media & Services - 4.6% | | | |
| Interactive Media & Services - 4.6% | | | |
| Alphabet, Inc. Class A (a) | | 202,100 | 240,606,113 |
| Facebook, Inc. Class A (a) | | 252,500 | 46,881,675 |
| Tencent Holdings Ltd. | | 576,900 | 23,817,624 |
| Twitter, Inc. (a) | | 600,900 | 25,628,385 |
| | | | 336,933,797 |
| Internet & Direct Marketing Retail - 1.7% | | | |
| Internet & Direct Marketing Retail - 1.7% | | | |
| Alibaba Group Holding Ltd. sponsored ADR (a) | | 433,400 | 75,858,002 |
| The Booking Holdings, Inc. (a) | | 24,100 | 47,390,481 |
| | | | 123,248,483 |
| IT Services - 32.0% | | | |
| Data Processing & Outsourced Services - 21.5% | | | |
| Alliance Data Systems Corp. | | 320,900 | 39,454,655 |
| Broadridge Financial Solutions, Inc. | | 258,500 | 33,460,240 |
| ExlService Holdings, Inc. (a) | | 527,500 | 35,711,750 |
| Fidelity National Information Services, Inc. | | 297,900 | 40,579,938 |
| FleetCor Technologies, Inc. (a) | | 235,700 | 70,332,880 |
| Global Payments, Inc. | | 161,000 | 26,722,780 |
| MasterCard, Inc. Class A | | 1,338,400 | 376,585,608 |
| NIC, Inc. | | 1,063,400 | 22,139,988 |
| PayPal Holdings, Inc. (a) | | 2,786,200 | 303,835,110 |
| The Western Union Co. | | 773,100 | 17,100,972 |
| Total System Services, Inc. | | 585,200 | 78,545,544 |
| Visa, Inc. Class A | | 2,884,520 | 521,578,906 |
| WEX, Inc. (a) | | 46,600 | 9,532,030 |
| | | | 1,575,580,401 |
| Internet Services & Infrastructure - 1.7% | | | |
| Akamai Technologies, Inc. (a) | | 1,392,200 | 124,086,786 |
| IT Consulting & Other Services - 8.8% | | | |
| Accenture PLC Class A | | 555,300 | 110,043,801 |
| Capgemini SA | | 646,200 | 77,518,997 |
| Cognizant Technology Solutions Corp. Class A | | 2,720,400 | 167,005,356 |
| DXC Technology Co. | | 422,600 | 14,038,772 |
| Gartner, Inc. (a) | | 527,700 | 70,537,659 |
| IBM Corp. | | 946,200 | 128,238,486 |
| Leidos Holdings, Inc. | | 732,500 | 63,991,200 |
| Liveramp Holdings, Inc. (a)(b) | | 314,700 | 13,330,692 |
| | | | 644,704,963 |
|
| TOTAL IT SERVICES | | | 2,344,372,150 |
|
| Semiconductors & Semiconductor Equipment - 0.6% | | | |
| Semiconductors - 0.6% | | | |
| NVIDIA Corp. | | 131,200 | 21,977,312 |
| Qualcomm, Inc. | | 292,000 | 22,708,840 |
| | | | 44,686,152 |
| Software - 51.6% | | | |
| Application Software - 22.0% | | | |
| Adobe, Inc. (a) | | 1,486,300 | 422,867,213 |
| Autodesk, Inc. (a) | | 856,100 | 122,268,202 |
| Blackbaud, Inc. | | 256,700 | 23,351,999 |
| BlackLine, Inc. (a) | | 328,600 | 16,735,598 |
| Box, Inc. Class A (a) | | 1,532,900 | 22,426,327 |
| Citrix Systems, Inc. | | 1,545,750 | 143,723,835 |
| Cloudera, Inc. (a)(b) | | 3,193,100 | 22,798,734 |
| Constellation Software, Inc. | | 34,400 | 33,503,698 |
| Dropbox, Inc. Class A (a) | | 1,064,000 | 19,045,600 |
| HubSpot, Inc. (a) | | 22,300 | 4,452,864 |
| Instructure, Inc. (a)(b) | | 716,381 | 29,629,518 |
| Intuit, Inc. | | 278,300 | 80,250,588 |
| LogMeIn, Inc. | | 187,300 | 12,519,132 |
| Micro Focus International PLC | | 1,333,964 | 18,216,660 |
| Monotype Imaging Holdings, Inc. | | 814,200 | 16,080,450 |
| New Relic, Inc. (a) | | 119,900 | 6,875,066 |
| Nuance Communications, Inc. (a) | | 1,154,900 | 19,413,869 |
| Nutanix, Inc. Class A (a) | | 676,100 | 16,381,903 |
| Parametric Technology Corp. (a) | | 723,400 | 47,360,998 |
| Pivotal Software, Inc. (a)(b) | | 4,120,900 | 61,442,619 |
| RealPage, Inc. (a) | | 254,000 | 16,172,180 |
| Salesforce.com, Inc. (a) | | 2,132,126 | 332,760,905 |
| Slack Technologies, Inc. Class A (a)(b) | | 279,900 | 8,016,336 |
| SPS Commerce, Inc. (a) | | 246,600 | 12,463,164 |
| Talend SA ADR (a) | | 565,900 | 23,026,471 |
| Workday, Inc. Class A (a) | | 354,400 | 62,828,032 |
| Zendesk, Inc. (a) | | 178,700 | 14,331,740 |
| | | | 1,608,943,701 |
| Systems Software - 29.6% | | | |
| Check Point Software Technologies Ltd. (a) | | 120,000 | 12,924,000 |
| Microsoft Corp. | | 13,088,000 | 1,804,311,681 |
| Oracle Corp. | | 3,015,400 | 156,981,724 |
| Palo Alto Networks, Inc. (a) | | 289,700 | 58,988,714 |
| Pluralsight, Inc. (a)(b) | | 2,053,500 | 33,061,350 |
| Symantec Corp. | | 4,240,600 | 98,593,950 |
| | | | 2,164,861,419 |
|
| TOTAL SOFTWARE | | | 3,773,805,120 |
|
| Technology Hardware, Storage & Peripherals - 1.4% | | | |
| Technology Hardware, Storage & Peripherals - 1.4% | | | |
| Apple, Inc. | | 459,400 | 95,895,156 |
| Pure Storage, Inc. Class A (a) | | 489,000 | 7,960,920 |
| | | | 103,856,076 |
| TOTAL COMMON STOCKS | | | |
| (Cost $4,300,533,523) | | | 6,960,522,442 |
|
| Money Market Funds - 4.9% | | | |
| Fidelity Cash Central Fund 2.13% (c) | | 323,256,187 | 323,320,839 |
| Fidelity Securities Lending Cash Central Fund 2.13% (c)(d) | | 36,516,896 | 36,520,548 |
| TOTAL MONEY MARKET FUNDS | | | |
| (Cost $359,837,542) | | | 359,841,387 |
| TOTAL INVESTMENT IN SECURITIES - 100.0% | | | |
| (Cost $4,660,371,065) | | | 7,320,363,829 |
| NET OTHER ASSETS (LIABILITIES) - 0.0% | | | 2,461,323 |
| NET ASSETS - 100% | | | $7,322,825,152 |
Legend
(a) Non-income producing
(b) Security or a portion of the security is on loan at period end.
(c) Affiliated fund that is generally available only to investment companies and other accounts managed by Fidelity Investments. The rate quoted is the annualized seven-day yield of the fund at period end. A complete unaudited listing of the fund's holdings as of its most recent quarter end is available upon request. In addition, each Fidelity Central Fund's financial statements are available on the SEC's website or upon request.
(d) Investment made with cash collateral received from securities on loan.
Affiliated Central Funds
Information regarding fiscal year to date income earned by the Fund from investments in Fidelity Central Funds is as follows:
| Fund | Income earned |
| Fidelity Cash Central Fund | $4,827,292 |
| Fidelity Securities Lending Cash Central Fund | 19,424 |
| Total | $4,846,716 |
Amounts in the income column in the above table include any capital gain distributions from underlying funds, which are presented in the corresponding line-item in the Statement of Operations, if applicable. Amount for Fidelity Securities Lending Cash Central Fund represents the income earned on investing cash collateral, less rebates paid to borrowers and any lending agent fees associated with the loan, plus any premium payments received for lending certain types of securities.
Investment Valuation
The following is a summary of the inputs used, as of August 31, 2019, involving the Fund's assets and liabilities carried at fair value. The inputs or methodology used for valuing securities may not be an indication of the risk associated with investing in those securities. For more information on valuation inputs, and their aggregation into the levels used below, please refer to the Investment Valuation section in the accompanying Notes to Financial Statements.
| | Valuation Inputs at Reporting Date: |
| Description | Total | Level 1 | Level 2 | Level 3 |
| Investments in Securities: | | | | |
| Common Stocks | $6,960,522,442 | $6,918,488,158 | $42,034,284 | $-- |
| Money Market Funds | 359,841,387 | 359,841,387 | -- | -- |
| Total Investments in Securities: | $7,320,363,829 | $7,278,329,545 | $42,034,284 | $-- |
See accompanying notes which are an integral part of the financial statements.
Software and IT Services Portfolio
Financial Statements
Statement of Assets and Liabilities
| | | August 31, 2019 (Unaudited) |
| Assets | | |
Investment in securities, at value (including securities loaned of $35,492,642) — See accompanying schedule:
Unaffiliated issuers (cost $4,300,533,523) | $6,960,522,442 | |
| Fidelity Central Funds (cost $359,837,542) | 359,841,387 | |
| Total Investment in Securities (cost $4,660,371,065) | | $7,320,363,829 |
| Receivable for investments sold | | 36,783,604 |
| Receivable for fund shares sold | | 3,797,880 |
| Dividends receivable | | 8,951,116 |
| Distributions receivable from Fidelity Central Funds | | 625,301 |
| Prepaid expenses | | 54,079 |
| Other receivables | | 391,654 |
| Total assets | | 7,370,967,463 |
| Liabilities | | |
| Payable for fund shares redeemed | $7,038,874 | |
| Accrued management fee | 3,241,000 | |
| Other affiliated payables | 1,024,737 | |
| Other payables and accrued expenses | 320,020 | |
| Collateral on securities loaned | 36,517,680 | |
| Total liabilities | | 48,142,311 |
| Net Assets | | $7,322,825,152 |
| Net Assets consist of: | | |
| Paid in capital | | $4,466,710,410 |
| Total distributable earnings (loss) | | 2,856,114,742 |
| Net Assets, for 391,727,301 shares outstanding | | $7,322,825,152 |
| Net Asset Value, offering price and redemption price per share ($7,322,825,152 ÷ 391,727,301 shares) | | $18.69 |
See accompanying notes which are an integral part of the financial statements.
Statement of Operations
| | | Six months ended August 31, 2019 (Unaudited) |
| Investment Income | | |
| Dividends | | $32,966,555 |
| Income from Fidelity Central Funds (including $19,424 from security lending) | | 4,846,716 |
| Total income | | 37,813,271 |
| Expenses | | |
| Management fee | $18,996,167 | |
| Transfer agent fees | 5,413,322 | |
| Accounting and security lending fees | 584,026 | |
| Custodian fees and expenses | 29,252 | |
| Independent trustees' fees and expenses | 18,848 | |
| Registration fees | 111,932 | |
| Audit | 26,242 | |
| Legal | 7,191 | |
| Miscellaneous | 27,412 | |
| Total expenses before reductions | 25,214,392 | |
| Expense reductions | (44,132) | |
| Total expenses after reductions | | 25,170,260 |
| Net investment income (loss) | | 12,643,011 |
| Realized and Unrealized Gain (Loss) | | |
| Net realized gain (loss) on: | | |
| Investment securities: | | |
| Unaffiliated issuers | 187,640,754 | |
| Fidelity Central Funds | 177 | |
| Foreign currency transactions | (19,889) | |
| Total net realized gain (loss) | | 187,621,042 |
| Change in net unrealized appreciation (depreciation) on: | | |
| Investment securities: | | |
| Unaffiliated issuers | 491,085,994 | |
| Assets and liabilities in foreign currencies | (503) | |
| Total change in net unrealized appreciation (depreciation) | | 491,085,491 |
| Net gain (loss) | | 678,706,533 |
| Net increase (decrease) in net assets resulting from operations | | $691,349,544 |
See accompanying notes which are an integral part of the financial statements.
Statement of Changes in Net Assets
| | Six months ended August 31, 2019 (Unaudited) | Year ended February 28, 2019 |
| Increase (Decrease) in Net Assets | | |
| Operations | | |
| Net investment income (loss) | $12,643,011 | $6,169,057 |
| Net realized gain (loss) | 187,621,042 | 951,041,361 |
| Change in net unrealized appreciation (depreciation) | 491,085,491 | (361,820,252) |
| Net increase (decrease) in net assets resulting from operations | 691,349,544 | 595,390,166 |
| Distributions to shareholders | (669,388,041) | (333,011,171) |
| Share transactions | | |
| Proceeds from sales of shares | 817,769,285 | 1,674,148,271 |
| Reinvestment of distributions | 634,813,866 | 316,098,925 |
| Cost of shares redeemed | (692,615,151) | (1,251,087,217) |
| Net increase (decrease) in net assets resulting from share transactions | 759,968,000 | 739,159,979 |
| Total increase (decrease) in net assets | 781,929,503 | 1,001,538,974 |
| Net Assets | | |
| Beginning of period | 6,540,895,649 | 5,539,356,675 |
| End of period | $7,322,825,152 | $6,540,895,649 |
| Other Information | | |
| Shares(a) | | |
| Sold | 44,102,278 | 90,790,200 |
| Issued in reinvestment of distributions | 35,523,998 | 18,671,999 |
| Redeemed | (37,494,484) | (69,476,890) |
| Net increase (decrease) | 42,131,792 | 39,985,309 |
(a) Share activity prior to May 11, 2018 has been adjusted to reflect the impact of the 10 for 1 share split that occurred on that date.
See accompanying notes which are an integral part of the financial statements.
Financial Highlights
Software and IT Services Portfolio
| | Six months ended (Unaudited) August 31, | Years endedFebruary 28, | | | | |
| | 2019 | 2019 A | 2018 A | 2017 A | 2016 A,B | 2015 A |
| Selected Per–Share Data | | | | | | |
| Net asset value, beginning of period | $18.71 | $17.89 | $14.09 | $11.11 | $11.94 | $12.44 |
| Income from Investment Operations | | | | | | |
| Net investment income (loss)C | .03 | .02 | (.02) | (.01) | .01 | (.02) |
| Net realized and unrealized gain (loss) | 1.85 | 1.81 | 5.01 | 3.50 | (.20) | .73 |
| Total from investment operations | 1.88 | 1.83 | 4.99 | 3.49 | (.19) | .71 |
| Distributions from net investment income | (.01) | (.01) | – | (.01) | (.01) | – |
| Distributions from net realized gain | (1.89) | (1.00) | (1.19) | (.50) | (.63) | (1.21) |
| Total distributions | (1.90) | (1.01) | (1.19) | (.51) | (.64) | (1.21) |
| Redemption fees added to paid in capitalC | – | – | – | –D | –D | –D |
| Net asset value, end of period | $18.69 | $18.71 | $17.89 | $14.09 | $11.11 | $11.94 |
| Total ReturnE,F | 10.54% | 10.90% | 36.76% | 31.83% | (1.84)% | 6.33% |
| Ratios to Average Net AssetsG,H | | | | | | |
| Expenses before reductions | .71%I | .72% | .73% | .76% | .77% | .77% |
| Expenses net of fee waivers, if any | .71%I | .72% | .73% | .76% | .76% | .77% |
| Expenses net of all reductions | .71%I | .71% | .73% | .75% | .76% | .77% |
| Net investment income (loss) | .36%I | .10% | (.09)% | (.11)% | .10% | (.15)% |
| Supplemental Data | | | | | | |
| Net assets, end of period (000 omitted) | $7,322,825 | $6,540,896 | $5,539,357 | $4,155,435 | $2,971,370 | $3,012,792 |
| Portfolio turnover rateJ | 18%I | 48% | 31% | 44% | 36% | 53% |
A Per share amounts have been adjusted to reflect the impact of the 10 for 1 share split that occurred on May 11, 2018.
B For the year ended February 29.
C Calculated based on average shares outstanding during the period.
D Amount represents less than $.005 per share.
E Total returns for periods of less than one year are not annualized.
F Total returns would have been lower if certain expenses had not been reduced during the applicable periods shown.
G Fees and expenses of any underlying Fidelity Central Funds are not included in the Fund's expense ratio. The Fund indirectly bears its proportionate share of the expenses of any underlying Fidelity Central Funds.
H Expense ratios reflect operating expenses of the Fund. Expenses before reductions do not reflect amounts reimbursed by the investment adviser or reductions from brokerage service arrangements or reductions from other expense offset arrangements and do not represent the amount paid by the Fund during periods when reimbursements or reductions occur. Expenses net of fee waivers reflect expenses after reimbursement by the investment adviser but prior to reductions from brokerage service arrangements or other expense offset arrangements. Expenses net of all reductions represent the net expenses paid by the Fund.
I Annualized
J Amount does not include the portfolio activity of any underlying Fidelity Central Funds.
See accompanying notes which are an integral part of the financial statements.
Technology Portfolio
Investment Summary (Unaudited)
Top Ten Stocks as of August 31, 2019
| | % of fund's net assets |
| Microsoft Corp. | 17.7 |
| Apple, Inc. | 17.2 |
| Visa, Inc. Class A | 6.1 |
| MasterCard, Inc. Class A | 4.0 |
| Adobe, Inc. | 3.2 |
| Salesforce.com, Inc. | 3.1 |
| Accenture PLC Class A | 2.0 |
| Applied Materials, Inc. | 1.9 |
| PayPal Holdings, Inc. | 1.9 |
| Alphabet, Inc. Class C | 1.9 |
| | 59.0 |
Top Industries (% of fund's net assets)
| As of August 31, 2019 |
| | Software | 31.1% |
| | IT Services | 22.8% |
| | Technology Hardware, Storage & Peripherals | 17.7% |
| | Semiconductors & Semiconductor Equipment | 16.4% |
| | Internet & Direct Marketing Retail | 3.4% |
| | All Others* | 8.6% |
* Includes short-term investments and net other assets (liabilities).
Technology Portfolio
Schedule of Investments August 31, 2019 (Unaudited)
Showing Percentage of Net Assets
| Common Stocks - 99.9% | | | |
| | | Shares | Value |
| Communications Equipment - 2.0% | | | |
| Communications Equipment - 2.0% | | | |
| Arista Networks, Inc. (a) | | 47,800 | $10,832,436 |
| Cisco Systems, Inc. | | 1,537,304 | 71,961,200 |
| Motorola Solutions, Inc. | | 151,500 | 27,407,865 |
| | | | 110,201,501 |
| Electronic Equipment & Components - 2.1% | | | |
| Electronic Components - 0.8% | | | |
| Amphenol Corp. Class A | | 267,930 | 23,454,592 |
| Corning, Inc. | | 722,766 | 20,129,033 |
| | | | 43,583,625 |
| Electronic Equipment & Instruments - 0.5% | | | |
| Keysight Technologies, Inc. (a) | | 163,086 | 15,796,510 |
| Zebra Technologies Corp. Class A (a) | | 48,300 | 9,902,949 |
| | | | 25,699,459 |
| Electronic Manufacturing Services - 0.5% | | | |
| TE Connectivity Ltd. | | 310,600 | 28,332,932 |
| Technology Distributors - 0.3% | | | |
| CDW Corp. | | 134,900 | 15,580,950 |
|
| TOTAL ELECTRONIC EQUIPMENT & COMPONENTS | | | 113,196,966 |
|
| Entertainment - 1.4% | | | |
| Movies & Entertainment - 1.4% | | | |
| Netflix, Inc. (a) | | 261,086 | 76,694,013 |
| Equity Real Estate Investment Trusts (REITs) - 0.6% | | | |
| Diversified REITs - 0.6% | | | |
| Ant International Co. Ltd. Class C (a)(b)(c) | | 4,366,389 | 31,438,001 |
| Interactive Media & Services - 1.9% | | | |
| Interactive Media & Services - 1.9% | | | |
| Alphabet, Inc. Class C (a) | | 87,768 | 104,277,161 |
| Internet & Direct Marketing Retail - 3.3% | | | |
| Internet & Direct Marketing Retail - 3.3% | | | |
| Amazon.com, Inc. (a) | | 29,100 | 51,690,039 |
| eBay, Inc. | | 1,086,100 | 43,758,969 |
| Meituan Dianping Class B | | 7,346,217 | 69,517,938 |
| Pinduoduo, Inc. ADR (a) | | 408,100 | 13,373,437 |
| | | | 178,340,383 |
| IT Services - 22.8% | | | |
| Data Processing & Outsourced Services - 18.1% | | | |
| Alliance Data Systems Corp. | | 43,000 | 5,286,850 |
| Automatic Data Processing, Inc. | | 222,014 | 37,706,858 |
| Broadridge Financial Solutions, Inc. | | 101,041 | 13,078,747 |
| Fidelity National Information Services, Inc. | | 724,827 | 98,735,934 |
| Fiserv, Inc. (a) | | 490,085 | 52,409,690 |
| FleetCor Technologies, Inc. (a) | | 82,900 | 24,737,360 |
| Global Payments, Inc. | | 145,000 | 24,067,100 |
| Jack Henry & Associates, Inc. | | 66,893 | 9,696,809 |
| MasterCard, Inc. Class A | | 785,100 | 220,903,587 |
| Paychex, Inc. | | 286,947 | 23,443,570 |
| PayPal Holdings, Inc. (a) | | 959,700 | 104,655,285 |
| Square, Inc. (a) | | 276,200 | 17,080,208 |
| The Western Union Co. | | 415,500 | 9,190,860 |
| Total System Services, Inc. | | 151,500 | 20,334,330 |
| Visa, Inc. Class A | | 1,845,600 | 333,721,392 |
| | | | 995,048,580 |
| Internet Services & Infrastructure - 2.2% | | | |
| Akamai Technologies, Inc. (a) | | 147,000 | 13,102,110 |
| GoDaddy, Inc. (a) | | 153,600 | 9,729,024 |
| MongoDB, Inc. Class A (a)(d) | | 313,500 | 47,749,185 |
| Okta, Inc. (a) | | 239,900 | 30,347,350 |
| VeriSign, Inc. (a) | | 96,673 | 19,706,791 |
| | | | 120,634,460 |
| IT Consulting & Other Services - 2.5% | | | |
| Accenture PLC Class A | | 546,608 | 108,321,307 |
| DXC Technology Co. | | 255,700 | 8,494,354 |
| Gartner, Inc. (a) | | 79,264 | 10,595,219 |
| Leidos Holdings, Inc. | | 109,167 | 9,536,829 |
| | | | 136,947,709 |
|
| TOTAL IT SERVICES | | | 1,252,630,749 |
|
| Life Sciences Tools & Services - 0.0% | | | |
| Life Sciences Tools & Services - 0.0% | | | |
| JHL Biotech, Inc. (a)(c) | | 1,015,442 | 996,707 |
| Road & Rail - 0.6% | | | |
| Trucking - 0.6% | | | |
| Lyft, Inc. | | 374,294 | 18,329,177 |
| Uber Technologies, Inc. | | 515,696 | 15,956,408 |
| | | | 34,285,585 |
| Semiconductors & Semiconductor Equipment - 16.4% | | | |
| Semiconductor Equipment - 3.8% | | | |
| Applied Materials, Inc. | | 2,226,100 | 106,897,322 |
| ASML Holding NV (Netherlands) | | 94,200 | 20,950,719 |
| KLA-Tencor Corp. | | 145,900 | 21,578,610 |
| Lam Research Corp. | | 277,600 | 58,437,576 |
| | | | 207,864,227 |
| Semiconductors - 12.6% | | | |
| Advanced Micro Devices, Inc. (a) | | 839,600 | 26,405,420 |
| ams AG (a) | | 402,340 | 16,109,860 |
| Analog Devices, Inc. | | 327,300 | 35,947,359 |
| Broadcom, Inc. | | 365,464 | 103,294,745 |
| Intel Corp. | | 1,548,741 | 73,425,811 |
| Marvell Technology Group Ltd. | | 1,619,154 | 38,811,121 |
| Microchip Technology, Inc. (d) | | 207,700 | 17,930,741 |
| Micron Technology, Inc. (a) | | 1,039,900 | 47,076,273 |
| NVIDIA Corp. | | 498,750 | 83,545,613 |
| NXP Semiconductors NV | | 532,400 | 54,379,336 |
| ON Semiconductor Corp. (a) | | 401,700 | 7,150,260 |
| Qorvo, Inc. (a) | | 120,000 | 8,571,600 |
| Qualcomm, Inc. | | 1,220,200 | 94,894,954 |
| Skyworks Solutions, Inc. | | 167,800 | 12,630,306 |
| Texas Instruments, Inc. | | 598,783 | 74,099,396 |
| | | | 694,272,795 |
|
| TOTAL SEMICONDUCTORS & SEMICONDUCTOR EQUIPMENT | | | 902,137,022 |
|
| Software - 31.1% | | | |
| Application Software - 11.9% | | | |
| Adobe, Inc. (a) | | 611,239 | 173,903,608 |
| ANSYS, Inc. (a) | | 68,498 | 14,148,947 |
| Atlassian Corp. PLC (a) | | 186,525 | 25,089,478 |
| Autodesk, Inc. (a) | | 201,900 | 28,835,358 |
| Cadence Design Systems, Inc. (a) | | 246,642 | 16,890,044 |
| Citrix Systems, Inc. | | 119,048 | 11,069,083 |
| Intuit, Inc. | | 326,000 | 94,005,360 |
| Nutanix, Inc. Class B (a)(e) | | 72,872 | 1,765,689 |
| Parametric Technology Corp. (a) | | 641,850 | 42,021,920 |
| Salesforce.com, Inc. (a) | | 1,075,488 | 167,851,412 |
| Splunk, Inc. (a) | | 119,500 | 13,362,490 |
| SS&C Technologies Holdings, Inc. | | 478,900 | 22,321,529 |
| Synopsys, Inc. (a) | | 129,901 | 18,421,261 |
| Workday, Inc. Class A (a) | | 130,900 | 23,205,952 |
| | | | 652,892,131 |
| Systems Software - 19.2% | | | |
| Crowdstrike Holdings, Inc. (d) | | 8,900 | 723,392 |
| Fortinet, Inc. (a) | | 124,229 | 9,836,452 |
| Microsoft Corp. | | 7,056,540 | 972,814,602 |
| Palo Alto Networks, Inc. (a) | | 83,500 | 17,002,270 |
| ServiceNow, Inc. (a) | | 154,600 | 40,480,464 |
| Symantec Corp. | | 544,000 | 12,648,000 |
| | | | 1,053,505,180 |
|
| TOTAL SOFTWARE | | | 1,706,397,311 |
|
| Technology Hardware, Storage & Peripherals - 17.7% | | | |
| Technology Hardware, Storage & Peripherals - 17.7% | | | |
| Apple, Inc. | | 4,516,097 | 942,690,088 |
| NetApp, Inc. | | 240,200 | 11,544,012 |
| Western Digital Corp. | | 253,300 | 14,506,491 |
| | | | 968,740,591 |
| TOTAL COMMON STOCKS | | | |
| (Cost $4,133,771,443) | | | 5,479,335,990 |
|
| Convertible Preferred Stocks - 0.4% | | | |
| Food & Staples Retailing - 0.3% | | | |
| Food Retail - 0.3% | | | |
| Roofoods Ltd. Series F (a)(b)(c) | | 41,041 | 17,151,034 |
| Internet & Direct Marketing Retail - 0.1% | | | |
| Internet & Direct Marketing Retail - 0.1% | | | |
| Reddit, Inc. Series D (b)(c) | | 250,861 | 5,440,247 |
| Software - 0.0% | | | |
| Application Software - 0.0% | | | |
| UiPath, Inc.: | | | |
| Series A1 (b)(c) | | 25,657 | 1,009,647 |
| Series B1 (b)(c) | | 1,278 | 50,291 |
| Series B2 (b)(c) | | 6,365 | 250,474 |
| | | | 1,310,412 |
| TOTAL CONVERTIBLE PREFERRED STOCKS | | | |
| (Cost $21,261,549) | | | 23,901,693 |
|
| Money Market Funds - 0.4% | | | |
| Fidelity Securities Lending Cash Central Fund 2.13% (f)(g) | | | |
| (Cost $21,331,389) | | 21,329,256 | 21,331,389 |
| TOTAL INVESTMENT IN SECURITIES - 100.7% | | | |
| (Cost $4,176,364,381) | | | 5,524,569,072 |
| NET OTHER ASSETS (LIABILITIES) - (0.7)% | | | (38,509,682) |
| NET ASSETS - 100% | | | $5,486,059,390 |
Legend
(a) Non-income producing
(b) Restricted securities - Investment in securities not registered under the Securities Act of 1933 (excluding 144A issues). At the end of the period, the value of restricted securities (excluding 144A issues) amounted to $55,339,693 or 1.0% of net assets.
(c) Level 3 security
(d) Security or a portion of the security is on loan at period end.
(e) Security exempt from registration under Rule 144A of the Securities Act of 1933. These securities may be resold in transactions exempt from registration, normally to qualified institutional buyers. At the end of the period, the value of these securities amounted to $1,765,689 or 0.0% of net assets.
(f) Investment made with cash collateral received from securities on loan.
(g) Affiliated fund that is generally available only to investment companies and other accounts managed by Fidelity Investments. The rate quoted is the annualized seven-day yield of the fund at period end. A complete unaudited listing of the fund's holdings as of its most recent quarter end is available upon request. In addition, each Fidelity Central Fund's financial statements are available on the SEC's website or upon request.
Additional information on each restricted holding is as follows:
| Security | Acquisition Date | Acquisition Cost |
| Ant International Co. Ltd. Class C | 5/16/18 | $24,495,442 |
| Reddit, Inc. Series D | 2/4/19 | $5,440,247 |
| Roofoods Ltd. Series F | 9/12/17 | $14,510,890 |
| UiPath, Inc. Series A1 | 6/14/19 | $1,009,647 |
| UiPath, Inc. Series B1 | 6/14/19 | $50,291 |
| UiPath, Inc. Series B2 | 6/14/19 | $250,474 |
Affiliated Central Funds
Information regarding fiscal year to date income earned by the Fund from investments in Fidelity Central Funds is as follows:
| Fund | Income earned |
| Fidelity Cash Central Fund | $511,804 |
| Fidelity Securities Lending Cash Central Fund | 96,352 |
| Total | $608,156 |
Amounts in the income column in the above table include any capital gain distributions from underlying funds, which are presented in the corresponding line-item in the Statement of Operations, if applicable. Amount for Fidelity Securities Lending Cash Central Fund represents the income earned on investing cash collateral, less rebates paid to borrowers and any lending agent fees associated with the loan, plus any premium payments received for lending certain types of securities.
Investment Valuation
The following is a summary of the inputs used, as of August 31, 2019, involving the Fund's assets and liabilities carried at fair value. The inputs or methodology used for valuing securities may not be an indication of the risk associated with investing in those securities. For more information on valuation inputs, and their aggregation into the levels used below, please refer to the Investment Valuation section in the accompanying Notes to Financial Statements.
| | Valuation Inputs at Reporting Date: |
| Description | Total | Level 1 | Level 2 | Level 3 |
| Investments in Securities: | | | | |
| Common Stocks | $5,479,335,990 | $5,340,476,217 | $106,425,065 | $32,434,708 |
| Convertible Preferred Stocks | 23,901,693 | -- | -- | 23,901,693 |
| Money Market Funds | 21,331,389 | 21,331,389 | -- | -- |
| Total Investments in Securities: | $5,524,569,072 | $5,361,807,606 | $106,425,065 | $56,336,401 |
The following is a reconciliation of Investments in Securities for which Level 3 inputs were used in determining value:
| Investments in Securities: | |
| Convertible Preferred Stocks | |
| Beginning Balance | $70,182,546 |
| Total Realized Gain (Loss) | -- |
| Total Unrealized Gain (Loss) | (23,311,260) |
| Cost of Purchases | 1,310,412 |
| Proceeds of Sales | (24,280,005) |
| Amortization/Accretion | -- |
| Transfers in to Level 3 | -- |
| Transfers out of Level 3 | -- |
| Ending Balance | $23,901,693 |
| The change in unrealized gain (loss) for the period attributable to Level 3 securities held at August 31, 2019 | $(5,354,209) |
| Other Investments in Securities | |
| Beginning Balance | $29,260,049 |
| Total Realized Gain (Loss) | -- |
| Total Unrealized Gain (Loss) | 3,174,659 |
| Cost of Purchases | -- |
| Proceeds of Sales | -- |
| Amortization/Accretion | -- |
| Transfers in to Level 3 | -- |
| Transfers out of Level 3 | -- |
| Ending Balance | $32,434,708 |
| The change in unrealized gain (loss) for the period attributable to Level 3 securities held at August 31, 2019 | $3,174,659 |
The information used in the above reconciliations represents fiscal year to date activity for any Investments in Securities identified as using Level 3 inputs at either the beginning or the end of the current fiscal period. Transfers in or out of Level 3 represent the beginning value of any Security or Instrument where a change in the pricing level occurred from the beginning to the end of the period. The cost of purchases and the proceeds of sales may include securities received or delivered through corporate actions or exchanges. Realized and unrealized gains (losses) disclosed in the reconciliations are included in Net Gain (Loss) on the Fund's Statement of Operations.
See accompanying notes which are an integral part of the financial statements.
Technology Portfolio
Financial Statements
Statement of Assets and Liabilities
| | | August 31, 2019 (Unaudited) |
| Assets | | |
Investment in securities, at value (including securities loaned of $20,720,154) — See accompanying schedule:
Unaffiliated issuers (cost $4,155,032,992) | $5,503,237,683 | |
| Fidelity Central Funds (cost $21,331,389) | 21,331,389 | |
| Total Investment in Securities (cost $4,176,364,381) | | $5,524,569,072 |
| Cash | | 221 |
| Receivable for fund shares sold | | 1,932,067 |
| Dividends receivable | | 5,854,147 |
| Distributions receivable from Fidelity Central Funds | | 50,131 |
| Prepaid expenses | | 62,013 |
| Other receivables | | 309,540 |
| Total assets | | 5,532,777,191 |
| Liabilities | | |
| Payable for fund shares redeemed | $5,537,838 | |
| Accrued management fee | 2,454,034 | |
| Notes payable to affiliates | 16,303,000 | |
| Other affiliated payables | 802,997 | |
| Other payables and accrued expenses | 300,448 | |
| Collateral on securities loaned | 21,319,484 | |
| Total liabilities | | 46,717,801 |
| Net Assets | | $5,486,059,390 |
| Net Assets consist of: | | |
| Paid in capital | | $4,076,562,651 |
| Total distributable earnings (loss) | | 1,409,496,739 |
| Net Assets, for 314,139,125 shares outstanding | | $5,486,059,390 |
| Net Asset Value, offering price and redemption price per share ($5,486,059,390 ÷ 314,139,125 shares) | | $17.46 |
See accompanying notes which are an integral part of the financial statements.
Statement of Operations
| | | Six months ended August 31, 2019 (Unaudited) |
| Investment Income | | |
| Dividends | | $30,144,777 |
| Income from Fidelity Central Funds (including $96,352 from security lending) | | 608,156 |
| Total income | | 30,752,933 |
| Expenses | | |
| Management fee | $14,773,590 | |
| Transfer agent fees | 4,246,373 | |
| Accounting and security lending fees | 553,304 | |
| Custodian fees and expenses | (1,060) | |
| Independent trustees' fees and expenses | 14,799 | |
| Registration fees | 67,493 | |
| Audit | 27,261 | |
| Legal | 6,729 | |
| Interest | 2,905 | |
| Miscellaneous | 26,663 | |
| Total expenses before reductions | 19,718,057 | |
| Expense reductions | (55,900) | |
| Total expenses after reductions | | 19,662,157 |
| Net investment income (loss) | | 11,090,776 |
| Realized and Unrealized Gain (Loss) | | |
| Net realized gain (loss) on: | | |
| Investment securities: | | |
| Unaffiliated issuers | 49,237,716 | |
| Redemptions in-kind with affiliated entities | 44,795,304 | |
| Fidelity Central Funds | 984 | |
| Foreign currency transactions | 2,107 | |
| Total net realized gain (loss) | | 94,036,111 |
| Change in net unrealized appreciation (depreciation) on: | | |
| Investment securities: | | |
| Unaffiliated issuers | 553,799,701 | |
| Assets and liabilities in foreign currencies | (180) | |
| Total change in net unrealized appreciation (depreciation) | | 553,799,521 |
| Net gain (loss) | | 647,835,632 |
| Net increase (decrease) in net assets resulting from operations | | $658,926,408 |
See accompanying notes which are an integral part of the financial statements.
Statement of Changes in Net Assets
| | Six months ended August 31, 2019 (Unaudited) | Year ended February 28, 2019 |
| Increase (Decrease) in Net Assets | | |
| Operations | | |
| Net investment income (loss) | $11,090,776 | $19,936,210 |
| Net realized gain (loss) | 94,036,111 | 1,037,466,722 |
| Change in net unrealized appreciation (depreciation) | 553,799,521 | (1,294,917,827) |
| Net increase (decrease) in net assets resulting from operations | 658,926,408 | (237,514,895) |
| Distributions to shareholders | – | (1,122,751,603) |
| Share transactions | | |
| Proceeds from sales of shares | 486,348,951 | 1,410,590,985 |
| Reinvestment of distributions | – | 1,076,404,658 |
| Cost of shares redeemed | (783,337,467) | (3,244,907,806) |
| Net increase (decrease) in net assets resulting from share transactions | (296,988,516) | (757,912,163) |
| Total increase (decrease) in net assets | 361,937,892 | (2,118,178,661) |
| Net Assets | | |
| Beginning of period | 5,124,121,498 | 7,242,300,159 |
| End of period | $5,486,059,390 | $5,124,121,498 |
| Other Information | | |
| Shares(a) | | |
| Sold | 29,030,844 | 80,059,360 |
| Issued in reinvestment of distributions | – | 68,331,578 |
| Redeemed | (46,645,348) | (190,798,339) |
| Net increase (decrease) | (17,614,504) | (42,407,401) |
(a) Share activity prior to August 10, 2018 has been adjusted to reflect the impact of the 10 for 1 share split that occurred on that date.
See accompanying notes which are an integral part of the financial statements.
Financial Highlights
Technology Portfolio
| | Six months ended (Unaudited) August 31, | Years endedFebruary 28, | | | | |
| | 2019 | 2019 A | 2018 A | 2017 A | 2016 A,B | 2015 A |
| Selected Per–Share Data | | | | | | |
| Net asset value, beginning of period | $15.45 | $19.36 | $14.70 | $10.78 | $12.09 | $13.07 |
| Income from Investment Operations | | | | | | |
| Net investment income (loss)C | .03 | .06 | – | .01 | .01 | .02 |
| Net realized and unrealized gain (loss) | 1.98 | (.78) | 6.15 | 4.11 | (.82) | 1.03 |
| Total from investment operations | 2.01 | (.72) | 6.15 | 4.12 | (.81) | 1.05 |
| Distributions from net investment income | – | (.02) | – | (.01) | (.01) | (.02) |
| Distributions from net realized gain | – | (3.17) | (1.49) | (.19) | (.49) | (2.01) |
| Total distributions | – | (3.19) | (1.49) | (.20) | (.50) | (2.03) |
| Redemption fees added to paid in capitalC | – | – | – | –D | –D | –D |
| Net asset value, end of period | $17.46 | $15.45 | $19.36 | $14.70 | $10.78 | $12.09 |
| Total ReturnE,F | 13.01% | (3.03)% | 43.71% | 38.52% | (7.16)% | 9.97% |
| Ratios to Average Net AssetsG,H | | | | | | |
| Expenses before reductions | .72%I | .72% | .75% | .77% | .78% | .78% |
| Expenses net of fee waivers, if any | .72%I | .72% | .75% | .77% | .77% | .78% |
| Expenses net of all reductions | .71%I | .71% | .74% | .76% | .76% | .78% |
| Net investment income (loss) | .40%I | .34% | .01% | .11% | .11% | .13% |
| Supplemental Data | | | | | | |
| Net assets, end of period (000 omitted) | $5,486,059 | $5,124,121 | $7,242,300 | $4,119,489 | $2,777,346 | $2,824,848 |
| Portfolio turnover rateJ | 10%I,K | 126%K | 71% | 82% | 130% | 144% |
A Per share amounts have been adjusted to reflect the impact of the 10 for 1 share split that occurred on August 10, 2018.
B For the year ended February 29.
C Calculated based on average shares outstanding during the period.
D Amount represents less than $.005 per share.
E Total returns for periods of less than one year are not annualized.
F Total returns would have been lower if certain expenses had not been reduced during the applicable periods shown.
G Fees and expenses of any underlying Fidelity Central Funds are not included in the Fund's expense ratio. The Fund indirectly bears its proportionate share of the expenses of any underlying Fidelity Central Funds.
H Expense ratios reflect operating expenses of the Fund. Expenses before reductions do not reflect amounts reimbursed by the investment adviser or reductions from brokerage service arrangements or reductions from other expense offset arrangements and do not represent the amount paid by the Fund during periods when reimbursements or reductions occur. Expenses net of fee waivers reflect expenses after reimbursement by the investment adviser but prior to reductions from brokerage service arrangements or other expense offset arrangements. Expenses net of all reductions represent the net expenses paid by the Fund.
I Annualized
J Amount does not include the portfolio activity of any underlying Fidelity Central Funds.
K Portfolio turnover rate excludes securities received or delivered in-kind.
See accompanying notes which are an integral part of the financial statements.
Notes to Financial Statements (Unaudited)
For the period ended August 31, 2019
1. Organization.
Communications Equipment Portfolio, Computers Portfolio, IT Services Portfolio, Semiconductors Portfolio, Software and IT Services Portfolio, and Technology Portfolio (the Funds) are non-diversified funds of Fidelity Select Portfolios (the Trust). The Trust is registered under the Investment Company Act of 1940, as amended (the 1940 Act), as an open-end management investment company organized as a Massachusetts business trust. The Funds invest primarily in securities of companies whose principal business activities fall within specific industries. Each Fund is authorized to issue an unlimited number of shares. Share transactions on the Statement of Changes in Net Assets may contain exchanges between affiliated funds.
2. Investments in Fidelity Central Funds.
The Funds invest in Fidelity Central Funds, which are open-end investment companies generally available only to other investment companies and accounts managed by the investment adviser and its affiliates. The Funds' Schedules of Investments list each of the Fidelity Central Funds held as of period end, if any, as an investment of each Fund, but do not include the underlying holdings of each Fidelity Central Fund. As an Investing Fund, each Fund indirectly bears its proportionate share of the expenses of the underlying Fidelity Central Funds.
The Money Market Central Funds seek preservation of capital and current income and are managed by Fidelity Investments Money Management, Inc. (FIMM), an affiliate of the investment adviser. Annualized expenses of the Money Market Central Funds as of their most recent shareholder report date ranged from less than .005% to .01%.
A complete unaudited list of holdings for each Fidelity Central Fund is available upon request or at the Securities and Exchange Commission (the SEC) website at www.sec.gov. In addition, the financial statements of the Fidelity Central Funds are available on the SEC website or upon request.
3. Significant Accounting Policies.
Each Fund is an investment company and applies the accounting and reporting guidance of the Financial Accounting Standards Board (FASB) Accounting Standards Codification Topic 946 Financial Services – Investments Companies. The financial statements have been prepared in conformity with accounting principles generally accepted in the United States of America (GAAP), which require management to make certain estimates and assumptions at the date of the financial statements. Actual results could differ from those estimates. Subsequent events, if any, through the date that the financial statements were issued have been evaluated in the preparation of the financial statements. The following summarizes the significant accounting policies of the Funds:
Investment Valuation. Investments are valued as of 4:00 p.m. Eastern time on the last calendar day of the period. The Board of Trustees (the Board) has delegated the day to day responsibility for the valuation of each Fund's investments to the Fair Value Committee (the Committee) established by each Fund's investment adviser. In accordance with valuation policies and procedures approved by the Board, each Fund attempts to obtain prices from one or more third party pricing vendors or brokers to value its investments. When current market prices, quotations or currency exchange rates are not readily available or reliable, investments will be fair valued in good faith by the Committee, in accordance with procedures adopted by the Board. Factors used in determining fair value vary by investment type and may include market or investment specific events. The frequency with which these procedures are used cannot be predicted and they may be utilized to a significant extent. The Committee oversees each Fund's valuation policies and procedures and reports to the Board on the Committee's activities and fair value determinations. The Board monitors the appropriateness of the procedures used in valuing each Fund's investments and ratifies the fair value determinations of the Committee.
Each Fund categorizes the inputs to valuation techniques used to value its investments into a disclosure hierarchy consisting of three levels as shown below:
- Level 1 – quoted prices in active markets for identical investments
- Level 2 – other significant observable inputs (including quoted prices for similar investments, interest rates, prepayment speeds, etc.)
- Level 3 – unobservable inputs (including the Fund's own assumptions based on the best information available)
Valuation techniques used to value each Fund's investments by major category are as follows:
Equity securities, including restricted securities, for which market quotations are readily available, are valued at the last reported sale price or official closing price as reported by a third party pricing vendor on the primary market or exchange on which they are traded and are categorized as Level 1 in the hierarchy. In the event there were no sales during the day or closing prices are not available, securities are valued at the last quoted bid price or may be valued using the last available price and are generally categorized as Level 2 in the hierarchy. For foreign equity securities, when market or security specific events arise, comparisons to the valuation of American Depositary Receipts (ADRs), futures contracts, Exchange-Traded Funds (ETFs) and certain indexes as well as quoted prices for similar securities may be used and would be categorized as Level 2 in the hierarchy. For equity securities, including restricted securities, where observable inputs are limited, assumptions about market activity and risk are used and these securities may be categorized as Level 3 in the hierarchy. Equity securities, including restricted securities, for which observable inputs are not available are valued using alternate valuation approaches, including the market approach and the income approach and are categorized as Level 3 in the hierarchy. The market approach generally consists of using comparable market transactions while the income approach generally consists of using the net present value of estimated future cash flows, adjusted as appropriate for liquidity, credit, market and/or other risk factors.
Investments in open-end mutual funds, including the Fidelity Central Funds, are valued at their closing net asset value (NAV) each business day and are categorized as Level 1 in the hierarchy.
The following provides information on Level 3 securities held by Technology Portfolio that were valued at period end based on unobservable inputs. These amounts exclude valuations provided by a broker.
| Asset Type | Fair Value | Valuation Technique(s) | Unobservable Input | Amount or Range/Weighted Average | Impact to Valuation from an Increase in Input(a) |
| Equities | $56,336,401 | Market comparable | Enterprise value/Sales multiple (EV/S) | 8.1 | Increase |
| | | Market approach | Discount rate | 6.0% | Decrease |
| | | | Transaction price
Discount for lack of marketability | $21.69 - $417.90 / $306.96
50.0% | Increase
Decrease |
(a) Represents the directional change in the fair value of the Level 3 investments that could have resulted from an increase in the corresponding input as of period end. A decrease to the unobservable input would have had the opposite effect. Significant changes in these inputs may have resulted in a significantly higher or lower fair value measurement at period end.
Changes in valuation techniques may result in transfers in or out of an assigned level within the disclosure hierarchy. The aggregate value of investments by input level as of August 31, 2019, as well as a roll forward of Level 3 investments, is included at the end of each applicable Fund's Schedule of Investments.
Foreign Currency. The Funds may use foreign currency contracts to facilitate transactions in foreign-denominated securities. Gains and losses from these transactions may arise from changes in the value of the foreign currency or if the counterparties do not perform under the contracts' terms.
Foreign-denominated assets, including investment securities, and liabilities are translated into U.S. dollars at the exchange rates at period end. Purchases and sales of investment securities, income and dividends received and expenses denominated in foreign currencies are translated into U.S. dollars at the exchange rate in effect on the transaction date.
The effects of exchange rate fluctuations on investments are included with the net realized and unrealized gain (loss) on investment securities. Other foreign currency transactions resulting in realized and unrealized gain (loss) are disclosed separately.
Investment Transactions and Income. For financial reporting purposes, the Funds' investment holdings and NAV include trades executed through the end of the last business day of the period. The NAV per share for processing shareholder transactions is calculated as of the close of business of the New York Stock Exchange (NYSE), normally 4:00 p.m. Eastern time and includes trades executed through the end of the prior business day. Gains and losses on securities sold are determined on the basis of identified cost and for certain Funds include proceeds received from litigation. Dividend income is recorded on the ex-dividend date, except for certain dividends from foreign securities where the ex-dividend date may have passed, which are recorded as soon as the Funds are informed of the ex-dividend date. Non-cash dividends included in dividend income, if any, are recorded at the fair market value of the securities received. Income and capital gain distributions from Fidelity Central Funds, if any, are recorded on the ex-dividend date. Certain distributions received by the Funds represent a return of capital or capital gain. The Funds determine the components of these distributions subsequent to the ex-dividend date, based upon receipt of tax filings or other correspondence relating to the underlying investment. These distributions are recorded as a reduction of cost of investments and/or as a realized gain. Investment income is recorded net of foreign taxes withheld where recovery of such taxes is uncertain.
Expenses. Expenses directly attributable to a fund are charged to that fund. Expenses attributable to more than one fund are allocated among the respective funds on the basis of relative net assets or other appropriate methods. Expense estimates are accrued in the period to which they relate and adjustments are made when actual amounts are known.
Deferred Trustee Compensation. Under a Deferred Compensation Plan (the Plan) for Computers Portfolio, Semiconductors Portfolio, Software and IT Services Portfolio and Technology Portfolio, certain independent Trustees have elected to defer receipt of a portion of their annual compensation. Deferred amounts are invested in a cross-section of Fidelity funds, are marked-to-market and remain in each Fund until distributed in accordance with the Plan. The investment of deferred amounts and the offsetting payable to the Trustees presented below are included in each accompanying Statement of Assets and Liabilities in other receivables and other payables and accrued expenses, respectively.
| Computers Portfolio | $42,898 |
| Semiconductors Portfolio | 175,868 |
| Software and IT Services Portfolio | 270,447 |
| Technology Portfolio | 261,392 |
Income Tax Information and Distributions to Shareholders. Each year, each Fund intends to qualify as a regulated investment company under Subchapter M of the Internal Revenue Code, including distributing substantially all of its taxable income and realized gains. As a result, no provision for U.S. Federal income taxes is required. Each Fund files a U.S. federal tax return, in addition to state and local tax returns as required. Each Fund's federal income tax returns are subject to examination by the Internal Revenue Service (IRS) for a period of three fiscal years after they are filed. State and local tax returns may be subject to examination for an additional fiscal year depending on the jurisdiction. Foreign taxes are provided for based on each Fund's understanding of the tax rules and rates that exist in the foreign markets in which it invests.
Distributions are declared and recorded on the ex-dividend date. Income and capital gain distributions are determined in accordance with income tax regulations, which may differ from GAAP.
Capital accounts within the financial statements are adjusted for permanent book-tax differences. These adjustments have no impact on net assets or the results of operations. Capital accounts are not adjusted for temporary book-tax differences which will reverse in a subsequent period.
Book-tax differences are primarily due to foreign currency transactions, passive foreign investment companies (PFIC), redemptions in kind, deferred trustees compensation, losses deferred due to wash sales and excise tax regulations.
As of period end, the cost and unrealized appreciation (depreciation) in securities, and derivatives if applicable, for federal income tax purposes were as follows for each Fund:
| | Tax cost | Gross unrealized appreciation | Gross unrealized depreciation | Net unrealized appreciation (depreciation) |
| Communications Equipment Portfolio | $169,595,485 | $42,743,244 | $(8,117,144) | $34,626,100 |
| Computers Portfolio | 362,312,167 | 122,554,844 | (13,571,890) | 108,982,954 |
| IT Services Portfolio | 2,626,120,161 | 1,756,283,717 | (91,078,255) | 1,665,205,462 |
| Semiconductors Portfolio | 2,666,375,532 | 729,826,507 | (105,624,756) | 624,201,751 |
| Software and IT Services Portfolio | 4,662,737,307 | 2,847,983,932 | (190,357,410) | 2,657,626,522 |
| Technology Portfolio | 4,195,113,455 | 1,399,539,268 | (70,083,651) | 1,329,455,617 |
In addition, certain of the Funds elected to defer to the next fiscal year capital losses recognized during the period November 1, 2018 to February 28, 2019, and ordinary losses recognized during the period January 1, 2019 to February 28, 2019. Loss deferrals were as follows:
| | Capital losses | Ordinary losses |
| Computers Portfolio | – | (120,917) |
| Semiconductors Portfolio | (76,699,891) | – |
| Technology Portfolio | (18,413,476) | – |
Restricted Securities. The Funds may invest in securities that are subject to legal or contractual restrictions on resale. These securities generally may be resold in transactions exempt from registration or to the public if the securities are registered. Disposal of these securities may involve time-consuming negotiations and expense, and prompt sale at an acceptable price may be difficult. Information regarding restricted securities is included at the end of each applicable Fund's Schedule of Investments.
4. Purchases and Sales of Investments.
Purchases and sales of securities, other than short-term securities and in-kind transactions, are noted in the table below.
| | Purchases ($) | Sales ($) |
| Communications Equipment Portfolio | 117,761,405 | 128,063,763 |
| Computers Portfolio | 281,453,456 | 315,680,602 |
| IT Services Portfolio | 835,526,365 | 83,277,023 |
| Semiconductors Portfolio | 1,762,701,715 | 1,773,277,362 |
| Software and IT Services Portfolio | 831,499,514 | 585,578,165 |
| Technology Portfolio | 263,011,305 | 390,102,431 |
5. Fees and Other Transactions with Affiliates.
Management Fee. Fidelity SelectCo, LLC (the investment adviser) and its affiliates provide the Funds with investment management related services for which the Funds pay a monthly management fee. The management fee is the sum of an individual fund fee rate and an annualized group fee rate. The individual fund fee rate is applied to each Fund's average net assets. The group fee rate is based upon the average net assets of all the mutual funds advised by Fidelity Management & Research Company (FMR) and the investment adviser. The group fee rate decreases as assets under management increase and increases as assets under management decrease. For the reporting period, each Fund's annualized management fee rate expressed as a percentage of each Fund's average net assets was as follows:
| | Individual Rate | Group Rate | Total |
| Communications Equipment Portfolio | .30% | .24% | .54% |
| Computers Portfolio | .30% | .24% | .54% |
| IT Services Portfolio | .30% | .24% | .54% |
| Semiconductors Portfolio | .30% | .24% | .54% |
| Software and IT Services Portfolio | .30% | .24% | .54% |
| Technology Portfolio | .30% | .24% | .54% |
Transfer Agent Fees. Fidelity Investments Institutional Operations Company, Inc. (FIIOC), an affiliate of the investment adviser, is the Funds' transfer, dividend disbursing and shareholder servicing agent. FIIOC receives account fees and asset-based fees that vary according to account size and type of account. FIIOC pays for typesetting, printing and mailing of shareholder reports, except proxy statements. For the period, transfer agent fees were equivalent to the following annualized rates expressed as a percentage of average net assets:
| Communications Equipment Portfolio | .20% |
| Computers Portfolio | .17% |
| IT Services Portfolio | .16% |
| Semiconductors Portfolio | .16% |
| Software and IT Services Portfolio | .15% |
| Technology Portfolio | .15% |
Accounting and Security Lending Fees. Fidelity Service Company, Inc. (FSC), an affiliate of the investment adviser, maintains each Fund's accounting records. The accounting fee is based on the level of average net assets for each month. Prior to April 1, 2019, FSC had a separate agreement with each Fund for administration of the security lending program, based on the number and duration of lending transactions. For the period, the total fees paid for accounting and administration of securities lending were equivalent to the following annualized rates:
| | % of Average Net Assets |
| Communications Equipment Portfolio | .04 |
| Computers Portfolio | .04 |
| IT Services Portfolio | .03 |
| Semiconductors Portfolio | .03 |
| Software and IT Services Portfolio | .02 |
| Technology Portfolio | .02 |
Brokerage Commissions. Certain Funds placed a portion of their portfolio transactions with brokerage firms which are affiliates of the investment adviser. Brokerage commissions are included in net realized gain (loss) and change in net unrealized appreciation (depreciation) in the Statement of Operations. The commissions paid to these affiliated firms were as follows:
| | Amount |
| Communications Equipment Portfolio | $11,243 |
| Computers Portfolio | 9,194 |
| IT Services Portfolio | 11,811 |
| Semiconductors Portfolio | 96,870 |
| Software and IT Services Portfolio | 21,870 |
| Technology Portfolio | 5,934 |
Interfund Lending Program. Pursuant to an Exemptive Order issued by the SEC, the Funds, along with other registered investment companies having management contracts with Fidelity Management & Research Company (FMR) or other affiliated entities of FMR, may participate in an interfund lending program. This program provides an alternative credit facility allowing the funds to borrow from, or lend money to, other participating affiliated funds. At period end, Computers Portfolio had no interfund loans outstanding. Technology Portfolio's open loans, including accrued interest, at period end are presented under the caption "Notes payable to affiliates" in the Statement of Assets and Liabilities. Each applicable fund's activity in this program during the period for which loans were outstanding was as follows:
| | Borrower or Lender | Average Loan Balance | Weighted Average Interest Rate | Interest Expense |
| Computers Portfolio | Borrower | $11,918,000 | 2.63% | $1,744 |
| Technology Portfolio | Borrower | $15,324,200 | 2.38% | $2,905 |
Interfund Trades. The Funds may purchase from or sell securities to other Fidelity Funds under procedures adopted by the Board. The procedures have been designed to ensure these interfund trades are executed in accordance with Rule 17a-7 of the 1940 Act. Interfund trades are included within the respective purchases and sales amounts shown in the Purchases and Sales of Investments note.
Prior Fiscal Year Affiliated Redemptions In-Kind. Affiliated Redemptions In-Kind. During the period, 5,658,948 shares of Technology Portfolio were redeemed in-kind for investments and cash with a value of $97,220,739. The net realized gain of $44,795,304 on investments delivered through in-kind redemptions is included in the accompanying Statement of Operations. The amount of the in-kind redemptions is included in share transactions in the accompanying Statement of Changes in Net Assets. Technology Portfolio recognized no gain or loss for federal income tax purposes.
During the prior period, 68,677,500* shares of Technology Portfolio were redeemed in-kind for investments and cash with a value of $1,186,541,219. Technology Portfolio had a net realized gain of $473,405,337 on investments delivered through in-kind redemptions. The amount of the in-kind redemptions is included in share transactions in the accompanying Statement of Changes in Net Assets. Technology Portfolio recognized no gain or loss for federal income tax purposes.
* Share activity prior to August 10, 2018 has been adjusted to reflect the impact of the 10 for 1 split that occurred on that date.
6. Committed Line of Credit.
Certain Funds participate with other funds managed by the investment adviser or an affiliate in a $4.25 billion credit facility (the "line of credit") to be utilized for temporary or emergency purposes to fund shareholder redemptions or for other short-term liquidity purposes. The participating funds have agreed to pay commitment fees on their pro-rata portion of the line of credit, which are reflected in Miscellaneous expenses on the Statement of Operations, and are as follows:
| Communications Equipment Portfolio | $295 |
| Computers Portfolio | 666 |
| IT Services Portfolio | 4,089 |
| Semiconductors Portfolio | 4,167 |
| Software and IT Services Portfolio | 9,002 |
| Technology Portfolio | 7,077 |
During the period, the Funds did not borrow on this line of credit.
7. Security Lending.
Certain Funds lend portfolio securities from time to time in order to earn additional income. For equity securities, lending agents are used, including National Financial Services (NFS), an affiliate of the Funds. Pursuant to a securities lending agreement, NFS will receive a fee, which is capped at 9.9% of daily lending revenue, for its services as lending agent. The Funds may lend securities to certain qualified borrowers. On the settlement date of the loan, each applicable Fund receives collateral (in the form of U.S. Treasury obligations, letters of credit and/or cash) against the loaned securities and maintains collateral in an amount not less than 100% of the market value of the loaned securities during the period of the loan. The market value of the loaned securities is determined at the close of business of the Funds and any additional required collateral is delivered to the Funds on the next business day. The Funds or borrower may terminate the loan at any time, and if the borrower defaults on its obligation to return the securities loaned because of insolvency or other reasons, the Funds may apply collateral received from the borrower against the obligation. The Funds may experience delays and costs in recovering the securities loaned. Any cash collateral received is invested in the Fidelity Securities Lending Cash Central Fund. The value of loaned securities and cash collateral at period end are disclosed on each applicable Fund's Statement of Assets and Liabilities. Security lending income represents the income earned on investing cash collateral, less rebates paid to borrowers and any lending agent fees associated with the loan, plus any premium payments received for lending certain types of securities. Security lending income is presented on each applicable Fund's Statement of Operations as a component of income from Fidelity Central Funds. Security lending fees paid to NFS were as follows:
| Communications Equipment Portfolio | $2,416 |
| Computers Portfolio | 20 |
| IT Services Portfolio | 934 |
| Semiconductors Portfolio | 3,296 |
| Software and IT Services Portfolio | 742 |
| Technology Portfolio | 3,991 |
8. Expense Reductions.
Commissions paid to certain brokers with whom the investment adviser, or its affiliates, places trades on behalf of certain Funds include an amount in addition to trade execution, which may be rebated back to the Funds to offset certain expenses. In addition, through arrangements with each applicable Fund's custodian and transfer agent, credits realized as a result of certain uninvested cash balances were used to reduce each applicable Fund's expenses. All of the applicable expense reductions are noted in the table below.
| | Brokerage Service reduction | Custodian credits | Transfer Agent credits |
| Communications Equipment Portfolio | $15,707 | $122 | $21 |
| Computers Portfolio | 19,861 | – | 61 |
| IT Services Portfolio | 27,515 | 636 | – |
| Semiconductors Portfolio | 40,391 | – | 1,597 |
| Software and IT Services Portfolio | 18,838 | 173 | 1,884 |
| Technology Portfolio | 34,858 | 431 | 1,676 |
In addition, during the period the investment adviser reimbursed and/or waived a portion of operating expenses as follows:
| | Amount |
| Communications Equipment Portfolio | $813 |
| Computers Portfolio | 1,820 |
| IT Services Portfolio | 9,629 |
| Semiconductors Portfolio | 10,374 |
| Software and IT Services Portfolio | 23,237 |
| Technology Portfolio | 18,935 |
9. Other.
The Funds' organizational documents provide former and current trustees and officers with a limited indemnification against liabilities arising in connection with the performance of their duties to the Funds. In the normal course of business, the Funds may also enter into contracts that provide general indemnifications. The Funds' maximum exposure under these arrangements is unknown as this would be dependent on future claims that may be made against the Funds. The risk of material loss from such claims is considered remote.
Shareholder Expense Example
As a shareholder of a Fund, you incur two types of costs: (1) transaction costs and (2) ongoing costs, including management fees and other Fund expenses. This Example is intended to help you understand your ongoing costs (in dollars) of investing in the Funds and to compare these costs with the ongoing costs of investing in other mutual funds.
The Example is based on an investment of $1,000 invested at the beginning of the period and held for the entire period (March 1, 2019 to August 31, 2019).
Actual Expenses
The first line of the accompanying table for each fund provides information about actual account values and actual expenses. You may use the information in this line, together with the amount you invested, to estimate the expenses that you paid over the period. Simply divide your account value by $1,000.00 (for example, an $8,600 account value divided by $1,000.00 = 8.6), then multiply the result by the number in the first line for a fund under the heading entitled "Expenses Paid During Period" to estimate the expenses you paid on your account during this period. In addition, each Fund, as a shareholder in the underlying Fidelity Central Funds, will indirectly bear its pro-rata share of the fees and expenses incurred by the underlying Fidelity Central Funds. These fees and expenses are not included in the Fund's annualized expense ratio used to calculate the expense estimate in the table below.
Hypothetical Example for Comparison Purposes
The second line of the accompanying table for each fund provides information about hypothetical account values and hypothetical expenses based on a fund's actual expense ratio and an assumed rate of return of 5% per year before expenses, which is not the Fund's actual return. The hypothetical account values and expenses may not be used to estimate the actual ending account balance or expenses you paid for the period. You may use this information to compare the ongoing costs of investing in the Fund and other funds. To do so, compare this 5% hypothetical example with the 5% hypothetical examples that appear in the shareholder reports of the other funds. In addition, each Fund, as a shareholder in the underlying Fidelity Central Funds, will indirectly bear its pro-rata share of the fees and expenses incurred by the underlying Fidelity Central Funds. These fees and expenses are not included in the Fund's annualized expense ratio used to calculate the expense estimate in the table below.
Please note that the expenses shown in the table are meant to highlight your ongoing costs only and do not reflect any transaction costs. Therefore, the second line of the table is useful in comparing ongoing costs only, and will not help you determine the relative total costs of owning different funds. In addition, if these transactional costs were included, your costs would have been higher.
| | Annualized Expense Ratio-A | Beginning
Account Value
March 1, 2019 | Ending
Account Value
August 31, 2019 | Expenses Paid
During Period-B
March 1, 2019
to August 31, 2019 |
| Communications Equipment Portfolio | .83% | | | |
| Actual | | $1,000.00 | $895.80 | $3.96 |
| Hypothetical-C | | $1,000.00 | $1,020.96 | $4.22 |
| Computers Portfolio | .77% | | | |
| Actual | | $1,000.00 | $1,029.00 | $3.93 |
| Hypothetical-C | | $1,000.00 | $1,021.27 | $3.91 |
| IT Services Portfolio | .73% | | | |
| Actual | | $1,000.00 | $1,136.80 | $3.92 |
| Hypothetical-C | | $1,000.00 | $1,021.47 | $3.71 |
| Semiconductors Portfolio | .73% | | | |
| Actual | | $1,000.00 | $1,091.20 | $3.84 |
| Hypothetical-C | | $1,000.00 | $1,021.47 | $3.71 |
| Software and IT Services Portfolio | .71% | | | |
| Actual | | $1,000.00 | $1,105.40 | $3.76 |
| Hypothetical-C | | $1,000.00 | $1,021.57 | $3.61 |
| Technology Portfolio | .72% | | | |
| Actual | | $1,000.00 | $1,130.10 | $3.86 |
| Hypothetical-C | | $1,000.00 | $1,021.52 | $3.66 |
A Annualized expense ratio reflects expenses net of applicable fee waivers.
B Expenses are equal to each Fund's annualized expense ratio, multiplied by the average account value over the period, multiplied by 184/ 366 (to reflect the one-half year period).
C 5% return per year before expenses
SELTEC-SANN-1019
1.813673.114
Fidelity® Select Portfolios®
Consumer Staples Sector Consumer Staples Portfolio
Semi-Annual Report August 31, 2019 Includes Fidelity and Fidelity Advisor share classes |
|
Beginning on January 1, 2021, as permitted by regulations adopted by the Securities and Exchange Commission, paper copies of a fund’s shareholder reports will no longer be sent by mail, unless you specifically request paper copies of the reports from the fund or from your financial intermediary, such as a financial advisor, broker-dealer or bank. Instead, the reports will be made available on a website, and you will be notified by mail each time a report is posted and provided with a website link to access the report.
If you already elected to receive shareholder reports electronically, you will not be affected by this change and you need not take any action. You may elect to receive shareholder reports and other communications from a fund electronically, by contacting your financial intermediary. For Fidelity customers, visit Fidelity's web site or call Fidelity using the contact information listed below.
You may elect to receive all future reports in paper free of charge. If you wish to continue receiving paper copies of your shareholder reports, you may contact your financial intermediary or, if you are a Fidelity customer, visit Fidelity’s website, or call Fidelity at the applicable toll-free number listed below. Your election to receive reports in paper will apply to all funds held with the fund complex/your financial intermediary.
| Account Type | Website | Phone Number |
| Brokerage, Mutual Fund, or Annuity Contracts: | fidelity.com/mailpreferences | 1-800-343-3548 |
| Employer Provided Retirement Accounts: | netbenefits.fidelity.com/preferences (choose 'no' under Required Disclosures to continue to print) | 1-800-343-0860 |
| Advisor Sold Accounts Serviced Through Your Financial Intermediary: | Contact Your Financial Intermediary | Your Financial Intermediary's phone number |
| Advisor Sold Accounts Serviced by Fidelity: | institutional.fidelity.com | 1-877-208-0098 |
Contents
To view a fund's proxy voting guidelines and proxy voting record for the 12-month period ended June 30, visit http://www.fidelity.com/proxyvotingresults or visit the Securities and Exchange Commission's (SEC) web site at http://www.sec.gov.
You may also call 1-800-544-8544 if you’re an individual investing directly with Fidelity, call 1-800-835-5092 if you’re a plan sponsor or participant with Fidelity as your recordkeeper or call 1-877-208-0098 on institutional accounts or if you’re an advisor or invest through one to request a free copy of the proxy voting guidelines.
Standard & Poor's, S&P and S&P 500 are registered service marks of The McGraw-Hill Companies, Inc. and have been licensed for use by Fidelity Distributors Corporation.
Other third-party marks appearing herein are the property of their respective owners.
All other marks appearing herein are registered or unregistered trademarks or service marks of FMR LLC or an affiliated company. © 2019 FMR LLC. All rights reserved.
This report and the financial statements contained herein are submitted for the general information of the shareholders of the Fund. This report is not authorized for distribution to prospective investors in the Fund unless preceded or accompanied by an effective prospectus.
A fund files its complete schedule of portfolio holdings with the SEC for the first and third quarters of each fiscal year on Form N-PORT. Forms N-PORT are available on the SEC’s web site at http://www.sec.gov. A fund's Forms N-PORT may be reviewed and copied at the SEC’s Public Reference Room in Washington, DC. Information regarding the operation of the SEC's Public Reference Room may be obtained by calling 1-800-SEC-0330.
For a complete list of a fund's portfolio holdings, view the most recent holdings listing, semiannual report, or annual report on Fidelity's web site at http://www.fidelity.com, http://www.institutional.fidelity.com, or http://www.401k.com, as applicable.
NOT FDIC INSURED •MAY LOSE VALUE •NO BANK GUARANTEE
Neither the Fund nor Fidelity Distributors Corporation is a bank.
Investment Summary (Unaudited)
Top Ten Stocks as of August 31, 2019
| | % of fund's net assets |
| The Coca-Cola Co. | 10.2 |
| Procter & Gamble Co. | 10.2 |
| Philip Morris International, Inc. | 5.8 |
| Altria Group, Inc. | 5.1 |
| PepsiCo, Inc. | 4.7 |
| Monster Beverage Corp. | 4.5 |
| Spectrum Brands Holdings, Inc. | 4.0 |
| Coty, Inc. Class A | 4.0 |
| Mondelez International, Inc. | 3.3 |
| Costco Wholesale Corp. | 3.2 |
| | 55.0 |
Top Industries (% of fund's net assets)
| As of August 31, 2019 |
| | Beverages | 25.3% |
| | Household Products | 20.0% |
| | Food Products | 19.1% |
| | Tobacco | 11.6% |
| | Food & Staples Retailing | 11.2% |
| | All Others* | 12.8% |
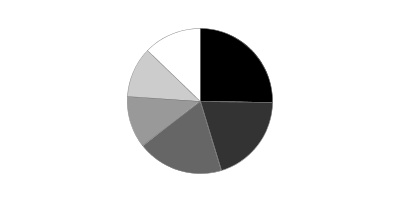
* Includes short-term investments and net other assets (liabilities).
Schedule of Investments August 31, 2019 (Unaudited)
Showing Percentage of Net Assets
| Common Stocks - 99.8% | | | |
| | | Shares | Value |
| Beverages - 25.3% | | | |
| Brewers - 1.3% | | | |
| Anheuser-Busch InBev SA NV | | 143,100 | $13,525,733 |
| Beijing Yanjing Brewery Co. Ltd. (A Shares) | | 6,079,840 | 5,385,953 |
| | | | 18,911,686 |
| Distillers & Vintners - 2.4% | | | |
| Constellation Brands, Inc. Class A (sub. vtg.) | | 160,700 | 32,839,045 |
| Kweichow Moutai Co. Ltd. (A Shares) | | 13,453 | 2,146,675 |
| | | | 34,985,720 |
| Soft Drinks - 21.6% | | | |
| Coca-Cola European Partners PLC | | 179,653 | 10,121,650 |
| Coca-Cola FEMSA S.A.B. de CV sponsored ADR | | 71,000 | 4,189,000 |
| Coca-Cola West Co. Ltd. | | 44,000 | 956,747 |
| Fever-Tree Drinks PLC | | 2,176 | 59,839 |
| Keurig Dr. Pepper, Inc. (a) | | 617,100 | 16,834,488 |
| Monster Beverage Corp. (b) | | 1,132,502 | 66,443,892 |
| PepsiCo, Inc. | | 505,100 | 69,062,323 |
| The Coca-Cola Co. | | 2,753,518 | 151,553,630 |
| | | | 319,221,569 |
|
| TOTAL BEVERAGES | | | 373,118,975 |
|
| Food & Staples Retailing - 11.2% | | | |
| Drug Retail - 1.3% | | | |
| Walgreens Boots Alliance, Inc. | | 380,224 | 19,463,667 |
| Food Distributors - 3.0% | | | |
| Performance Food Group Co. (b) | | 142,100 | 6,648,859 |
| Sysco Corp. | | 317,900 | 23,629,507 |
| U.S. Foods Holding Corp. (b) | | 363,316 | 14,696,132 |
| | | | 44,974,498 |
| Food Retail - 2.1% | | | |
| Kroger Co. | | 1,142,170 | 27,046,586 |
| Sprouts Farmers Market LLC (b) | | 188,500 | 3,383,575 |
| | | | 30,430,161 |
| Hypermarkets & Super Centers - 4.8% | | | |
| BJ's Wholesale Club Holdings, Inc. (b) | | 21,300 | 559,338 |
| Costco Wholesale Corp. | | 159,600 | 47,043,696 |
| Walmart, Inc. | | 199,600 | 22,806,296 |
| | | | 70,409,330 |
|
| TOTAL FOOD & STAPLES RETAILING | | | 165,277,656 |
|
| Food Products - 19.1% | | | |
| Agricultural Products - 1.0% | | | |
| Bunge Ltd. | | 128,935 | 6,886,418 |
| Darling International, Inc. (b) | | 392,500 | 7,300,500 |
| | | | 14,186,918 |
| Packaged Foods & Meats - 18.1% | | | |
| Conagra Brands, Inc. | | 608,300 | 17,251,388 |
| Danone SA | | 319,591 | 28,631,950 |
| Freshpet, Inc. (b) | | 345,700 | 16,966,956 |
| General Mills, Inc. | | 365,200 | 19,647,760 |
| JBS SA | | 2,388,500 | 17,096,146 |
| Kellogg Co. | | 108,100 | 6,788,680 |
| Lamb Weston Holdings, Inc. | | 45,100 | 3,174,589 |
| Mondelez International, Inc. | | 891,958 | 49,253,921 |
| Muyuan Foodstuff Co. Ltd. (A Shares) | | 411,100 | 4,618,327 |
| Post Holdings, Inc. (b) | | 59,000 | 5,881,710 |
| SunOpta, Inc. (b) | | 195,591 | 449,859 |
| The Hain Celestial Group, Inc. (a)(b) | | 131,299 | 2,501,246 |
| The J.M. Smucker Co. | | 204,900 | 21,547,284 |
| The Kraft Heinz Co. | | 1,064,500 | 27,166,040 |
| TreeHouse Foods, Inc. (a)(b) | | 320,459 | 16,231,248 |
| Tyson Foods, Inc. Class A | | 280,700 | 26,116,328 |
| Wens Foodstuffs Group Co. Ltd. (A Shares) | | 691,273 | 4,007,506 |
| | | | 267,330,938 |
|
| TOTAL FOOD PRODUCTS | | | 281,517,856 |
|
| Household Products - 20.0% | | | |
| Household Products - 20.0% | | | |
| C&S Paper Co. Ltd. (A Shares) | | 4,028,497 | 7,649,686 |
| Colgate-Palmolive Co. | | 564,780 | 41,878,437 |
| Energizer Holdings, Inc. | | 142,200 | 5,474,700 |
| Essity AB Class B | | 909,100 | 28,353,075 |
| Procter & Gamble Co. | | 1,250,050 | 150,293,512 |
| Reckitt Benckiser Group PLC | | 35,659 | 2,786,785 |
| Spectrum Brands Holdings, Inc. (a) | | 1,061,599 | 59,311,536 |
| | | | 295,747,731 |
| Internet & Direct Marketing Retail - 0.6% | | | |
| Internet & Direct Marketing Retail - 0.6% | | | |
| Ocado Group PLC (b) | | 346,800 | 5,466,832 |
| The Honest Co., Inc. (b)(c)(d) | | 212,235 | 3,200,504 |
| | | | 8,667,336 |
| Multiline Retail - 1.0% | | | |
| General Merchandise Stores - 1.0% | | | |
| Dollar General Corp. | | 34,100 | 5,322,669 |
| Dollar Tree, Inc. (b) | | 95,500 | 9,696,115 |
| | | | 15,018,784 |
| Personal Products - 11.0% | | | |
| Personal Products - 11.0% | | | |
| Avon Products, Inc. (b) | | 4,003,407 | 17,414,820 |
| Coty, Inc. Class A (a) | | 6,165,297 | 58,878,586 |
| Edgewell Personal Care Co. (b) | | 880,291 | 24,507,301 |
| Estee Lauder Companies, Inc. Class A | | 42,439 | 8,402,498 |
| Ontex Group NV | | 875,400 | 14,450,868 |
| Unilever NV | | 632,730 | 39,259,823 |
| | | | 162,913,896 |
| Tobacco - 11.6% | | | |
| Tobacco - 11.6% | | | |
| Altria Group, Inc. | | 1,719,945 | 75,230,394 |
| British American Tobacco PLC sponsored ADR | | 298,426 | 10,474,753 |
| Philip Morris International, Inc. | | 1,187,191 | 85,584,599 |
| | | | 171,289,746 |
| TOTAL COMMON STOCKS | | | |
| (Cost $1,263,261,053) | | | 1,473,551,980 |
|
| Money Market Funds - 1.4% | | | |
| Fidelity Cash Central Fund 2.13% (e) | | 1,015,820 | 1,016,023 |
| Fidelity Securities Lending Cash Central Fund 2.13% (e)(f) | | 19,865,577 | 19,867,563 |
| TOTAL MONEY MARKET FUNDS | | | |
| (Cost $20,883,586) | | | 20,883,586 |
| TOTAL INVESTMENT IN SECURITIES - 101.2% | | | |
| (Cost $1,284,144,639) | | | 1,494,435,566 |
| NET OTHER ASSETS (LIABILITIES) - (1.2)% | | | (17,848,598) |
| NET ASSETS - 100% | | | $1,476,586,968 |
Legend
(a) Security or a portion of the security is on loan at period end.
(b) Non-income producing
(c) Restricted securities - Investment in securities not registered under the Securities Act of 1933 (excluding 144A issues). At the end of the period, the value of restricted securities (excluding 144A issues) amounted to $3,200,504 or 0.2% of net assets.
(d) Level 3 security
(e) Affiliated fund that is generally available only to investment companies and other accounts managed by Fidelity Investments. The rate quoted is the annualized seven-day yield of the fund at period end. A complete unaudited listing of the fund's holdings as of its most recent quarter end is available upon request. In addition, each Fidelity Central Fund's financial statements are available on the SEC's website or upon request.
(f) Investment made with cash collateral received from securities on loan.
Additional information on each restricted holding is as follows:
| Security | Acquisition Date | Acquisition Cost |
| The Honest Co., Inc. | 8/28/18 | $2,381,277 |
Affiliated Central Funds
Information regarding fiscal year to date income earned by the Fund from investments in Fidelity Central Funds is as follows:
| Fund | Income earned |
| Fidelity Cash Central Fund | $52,682 |
| Fidelity Securities Lending Cash Central Fund | 611,480 |
| Total | $664,162 |
Amounts in the income column in the above table include any capital gain distributions from underlying funds, which are presented in the corresponding line-item in the Statement of Operations, if applicable. Amount for Fidelity Securities Lending Cash Central Fund represents the income earned on investing cash collateral, less rebates paid to borrowers and any lending agent fees associated with the loan, plus any premium payments received for lending certain types of securities.
Investment Valuation
The following is a summary of the inputs used, as of August 31, 2019, involving the Fund's assets and liabilities carried at fair value. The inputs or methodology used for valuing securities may not be an indication of the risk associated with investing in those securities. For more information on valuation inputs, and their aggregation into the levels used below, please refer to the Investment Valuation section in the accompanying Notes to Financial Statements.
| | Valuation Inputs at Reporting Date: |
| Description | Total | Level 1 | Level 2 | Level 3 |
| Investments in Securities: | | | | |
| Common Stocks | $1,473,551,980 | $1,386,147,185 | $84,204,291 | $3,200,504 |
| Money Market Funds | 20,883,586 | 20,883,586 | -- | -- |
| Total Investments in Securities: | $1,494,435,566 | $1,407,030,771 | $84,204,291 | $3,200,504 |
Other Information
Distribution of investments by country or territory of incorporation, as a percentage of Total Net Assets, is as follows (Unaudited):
| United States of America | 85.9% |
| Netherlands | 2.6% |
| United Kingdom | 2.0% |
| France | 1.9% |
| Sweden | 1.9% |
| Belgium | 1.9% |
| China | 1.7% |
| Brazil | 1.2% |
| Others (Individually Less Than 1%) | 0.9% |
| | 100.0% |
See accompanying notes which are an integral part of the financial statements.
Financial Statements
Statement of Assets and Liabilities
| | | August 31, 2019 (Unaudited) |
| Assets | | |
Investment in securities, at value (including securities loaned of $19,536,121) — See accompanying schedule:
Unaffiliated issuers (cost $1,263,261,053) | $1,473,551,980 | |
| Fidelity Central Funds (cost $20,883,586) | 20,883,586 | |
| Total Investment in Securities (cost $1,284,144,639) | | $1,494,435,566 |
| Receivable for fund shares sold | | 1,840,952 |
| Dividends receivable | | 3,025,793 |
| Distributions receivable from Fidelity Central Funds | | 4,741 |
| Prepaid expenses | | 18,421 |
| Other receivables | | 239,085 |
| Total assets | | 1,499,564,558 |
| Liabilities | | |
| Payable for fund shares redeemed | $1,758,715 | |
| Accrued management fee | 651,335 | |
| Distribution and service plan fees payable | 183,758 | |
| Other affiliated payables | 266,963 | |
| Other payables and accrued expenses | 249,256 | |
| Collateral on securities loaned | 19,867,563 | |
| Total liabilities | | 22,977,590 |
| Net Assets | | $1,476,586,968 |
| Net Assets consist of: | | |
| Paid in capital | | $1,257,215,201 |
| Total distributable earnings (loss) | | 219,371,767 |
| Net Assets | | $1,476,586,968 |
| Net Asset Value and Maximum Offering Price | | |
| Class A: | | |
| Net Asset Value and redemption price per share ($251,376,094 ÷ 3,009,112 shares)(a) | | $83.54 |
| Maximum offering price per share (100/94.25 of $83.54) | | $88.64 |
| Class M: | | |
| Net Asset Value and redemption price per share ($61,827,471 ÷ 748,430 shares)(a) | | $82.61 |
| Maximum offering price per share (100/96.50 of $82.61) | | $85.61 |
| Class C: | | |
| Net Asset Value and offering price per share ($128,492,004 ÷ 1,586,836 shares)(a) | | $80.97 |
| Consumer Staples: | | |
| Net Asset Value, offering price and redemption price per share ($833,331,719 ÷ 9,864,882 shares) | | $84.47 |
| Class I: | | |
| Net Asset Value, offering price and redemption price per share ($161,106,296 ÷ 1,911,615 shares) | | $84.28 |
| Class Z: | | |
| Net Asset Value, offering price and redemption price per share ($40,453,384 ÷ 480,237 shares) | | $84.24 |
(a) Redemption price per share is equal to net asset value less any applicable contingent deferred sales charge.
See accompanying notes which are an integral part of the financial statements.
Statement of Operations
| | | Six months ended August 31, 2019 (Unaudited) |
| Investment Income | | |
| Dividends | | $20,406,744 |
| Income from Fidelity Central Funds (including $611,480 from security lending) | | 664,162 |
| Total income | | 21,070,906 |
| Expenses | | |
| Management fee | $3,949,615 | |
| Transfer agent fees | 1,377,884 | |
| Distribution and service plan fees | 1,140,555 | |
| Accounting and security lending fees | 231,652 | |
| Custodian fees and expenses | 17,889 | |
| Independent trustees' fees and expenses | 4,029 | |
| Registration fees | 61,796 | |
| Audit | 37,487 | |
| Legal | 1,933 | |
| Interest | 1,333 | |
| Miscellaneous | 7,400 | |
| Total expenses before reductions | 6,831,573 | |
| Expense reductions | (22,561) | |
| Total expenses after reductions | | 6,809,012 |
| Net investment income (loss) | | 14,261,894 |
| Realized and Unrealized Gain (Loss) | | |
| Net realized gain (loss) on: | | |
| Investment securities: | | |
| Unaffiliated issuers | 21,329,006 | |
| Fidelity Central Funds | 697 | |
| Foreign currency transactions | (23,207) | |
| Total net realized gain (loss) | | 21,306,496 |
| Change in net unrealized appreciation (depreciation) on: | | |
| Investment securities: | | |
| Unaffiliated issuers | 86,201,177 | |
| Assets and liabilities in foreign currencies | (16,494) | |
| Total change in net unrealized appreciation (depreciation) | | 86,184,683 |
| Net gain (loss) | | 107,491,179 |
| Net increase (decrease) in net assets resulting from operations | | $121,753,073 |
See accompanying notes which are an integral part of the financial statements.
Statement of Changes in Net Assets
| | Six months ended August 31, 2019 (Unaudited) | Year ended February 28, 2019 |
| Increase (Decrease) in Net Assets | | |
| Operations | | |
| Net investment income (loss) | $14,261,894 | $44,496,210 |
| Net realized gain (loss) | 21,306,496 | 98,024,548 |
| Change in net unrealized appreciation (depreciation) | 86,184,683 | (167,507,828) |
| Net increase (decrease) in net assets resulting from operations | 121,753,073 | (24,987,070) |
| Distributions to shareholders | – | (212,172,340) |
| Share transactions - net increase (decrease) | (70,092,673) | (530,026,269) |
| Total increase (decrease) in net assets | 51,660,400 | (767,185,679) |
| Net Assets | | |
| Beginning of period | 1,424,926,568 | 2,192,112,247 |
| End of period | $1,476,586,968 | $1,424,926,568 |
See accompanying notes which are an integral part of the financial statements.
Financial Highlights
Consumer Staples Portfolio Class A
| | Six months ended (Unaudited) August 31, | Years endedFebruary 28, | | | | |
| | 2019 | 2019 | 2018 | 2017 | 2016 A | 2015 |
| Selected Per–Share Data | | | | | | |
| Net asset value, beginning of period | $76.88 | $87.07 | $96.18 | $89.78 | $101.33 | $87.93 |
| Income from Investment Operations | | | | | | |
| Net investment income (loss)B | .74 | 2.08C | 1.54 | 1.28 | 1.34 | 1.37 |
| Net realized and unrealized gain (loss) | 5.92 | (2.64) | (2.80) | 9.12 | (4.86) | 17.28 |
| Total from investment operations | 6.66 | (.56) | (1.26) | 10.40 | (3.52) | 18.65 |
| Distributions from net investment income | – | (2.11) | (1.55) | (1.37) | (1.31) | (1.28) |
| Distributions from net realized gain | – | (7.53) | (6.30) | (2.64) | (6.72) | (3.98) |
| Total distributions | – | (9.63)D | (7.85) | (4.00)E | (8.03) | (5.25)F |
| Redemption fees added to paid in capitalB | – | – | – | –G | –G | –G |
| Net asset value, end of period | $83.54 | $76.88 | $87.07 | $96.18 | $89.78 | $101.33 |
| Total ReturnH,I,J | 8.66% | (.32)% | (1.68)% | 11.91% | (3.51)% | 21.95% |
| Ratios to Average Net AssetsK,L | | | | | | |
| Expenses before reductions | 1.05%M | 1.05% | 1.05% | 1.04% | 1.04% | 1.05% |
| Expenses net of fee waivers, if any | 1.05%M | 1.05% | 1.05% | 1.04% | 1.04% | 1.05% |
| Expenses net of all reductions | 1.05%M | 1.04% | 1.04% | 1.03% | 1.04% | 1.05% |
| Net investment income (loss) | 1.82%M | 2.65%C | 1.60% | 1.37% | 1.45% | 1.45% |
| Supplemental Data | | | | | | |
| Net assets, end of period (000 omitted) | $251,376 | $232,020 | $317,366 | $522,014 | $470,249 | $414,151 |
| Portfolio turnover rateN | 31%M | 41%O | 76% | 56%O | 63% | 42%O |
A For the year ended February 29.
B Calculated based on average shares outstanding during the period.
C Net investment income per share reflects a large, non-recurring dividend which amounted to $.69 per share. Excluding this non-recurring dividend, the ratio of net investment income (loss) to average net assets would have been 1.78%.
D Total distributions of $9.63 per share is comprised of distributions from net investment income of $2.105 and distributions from net realized gain of $7.525 per share.
E Total distributions of $4.00 per share is comprised of distributions from net investment income of $1.365 and distributions from net realized gain of $2.636 per share.
F Total distributions of $5.25 per share is comprised of distributions from net investment income of $1.275 and distributions from net realized gain of $3.976 per share.
G Amount represents less than $.005 per share.
H Total returns for periods of less than one year are not annualized.
I Total returns would have been lower if certain expenses had not been reduced during the applicable periods shown.
J Total returns do not include the effect of the sales charges.
K Fees and expenses of any underlying Fidelity Central Funds are not included in the Fund's expense ratio. The Fund indirectly bears its proportionate share of the expenses of any underlying Fidelity Central Funds.
L Expense ratios reflect operating expenses of the class. Expenses before reductions do not reflect amounts reimbursed by the investment adviser or reductions from brokerage service arrangements or reductions from other expense offset arrangements and do not represent the amount paid by the class during periods when reimbursements or reductions occur. Expenses net of fee waivers reflect expenses after reimbursement by the investment adviser but prior to reductions from brokerage service arrangements or other expense offset arrangements. Expenses net of all reductions represent the net expenses paid by the class.
M Annualized
N Amount does not include the portfolio activity of any underlying Fidelity Central Funds.
O Portfolio turnover rate excludes securities received or delivered in-kind.
See accompanying notes which are an integral part of the financial statements.
Consumer Staples Portfolio Class M
| | Six months ended (Unaudited) August 31, | Years endedFebruary 28, | | | | |
| | 2019 | 2019 | 2018 | 2017 | 2016 A | 2015 |
| Selected Per–Share Data | | | | | | |
| Net asset value, beginning of period | $76.13 | $86.30 | $95.42 | $89.10 | $100.61 | $87.37 |
| Income from Investment Operations | | | | | | |
| Net investment income (loss)B | .62 | 1.85C | 1.27 | 1.01 | 1.08 | 1.10 |
| Net realized and unrealized gain (loss) | 5.86 | (2.61) | (2.78) | 9.07 | (4.83) | 17.15 |
| Total from investment operations | 6.48 | (.76) | (1.51) | 10.08 | (3.75) | 18.25 |
| Distributions from net investment income | – | (1.88) | (1.31) | (1.12) | (1.04) | (1.04) |
| Distributions from net realized gain | – | (7.53) | (6.30) | (2.64) | (6.72) | (3.98) |
| Total distributions | – | (9.41) | (7.61) | (3.76) | (7.76) | (5.01)D |
| Redemption fees added to paid in capitalB | – | – | – | –E | –E | –E |
| Net asset value, end of period | $82.61 | $76.13 | $86.30 | $95.42 | $89.10 | $100.61 |
| Total ReturnF,G,H | 8.51% | (.59)% | (1.94)% | 11.61% | (3.78)% | 21.60% |
| Ratios to Average Net AssetsI,J | | | | | | |
| Expenses before reductions | 1.32%K | 1.33% | 1.32% | 1.32% | 1.32% | 1.32% |
| Expenses net of fee waivers, if any | 1.32%K | 1.32% | 1.32% | 1.32% | 1.32% | 1.32% |
| Expenses net of all reductions | 1.32%K | 1.31% | 1.31% | 1.31% | 1.31% | 1.32% |
| Net investment income (loss) | 1.54%K | 2.37%C | 1.33% | 1.09% | 1.17% | 1.18% |
| Supplemental Data | | | | | | |
| Net assets, end of period (000 omitted) | $61,827 | $60,069 | $76,572 | $89,925 | $76,586 | $81,489 |
| Portfolio turnover rateL | 31%K | 41%M | 76% | 56%M | 63% | 42%M |
A For the year ended February 29.
B Calculated based on average shares outstanding during the period.
C Net investment income per share reflects a large, non-recurring dividend which amounted to $.68 per share. Excluding this non-recurring dividend, the ratio of net investment income (loss) to average net assets would have been 1.50%.
D Total distributions of $5.01 per share is comprised of distributions from net investment income of $1.036 and distributions from net realized gain of $3.976 per share.
E Amount represents less than $.005 per share.
F Total returns for periods of less than one year are not annualized.
G Total returns would have been lower if certain expenses had not been reduced during the applicable periods shown.
H Total returns do not include the effect of the sales charges.
I Fees and expenses of any underlying Fidelity Central Funds are not included in the Fund's expense ratio. The Fund indirectly bears its proportionate share of the expenses of any underlying Fidelity Central Funds.
J Expense ratios reflect operating expenses of the class. Expenses before reductions do not reflect amounts reimbursed by the investment adviser or reductions from brokerage service arrangements or reductions from other expense offset arrangements and do not represent the amount paid by the class during periods when reimbursements or reductions occur. Expenses net of fee waivers reflect expenses after reimbursement by the investment adviser but prior to reductions from brokerage service arrangements or other expense offset arrangements. Expenses net of all reductions represent the net expenses paid by the class.
K Annualized
L Amount does not include the portfolio activity of any underlying Fidelity Central Funds.
M Portfolio turnover rate excludes securities received or delivered in-kind.
See accompanying notes which are an integral part of the financial statements.
Consumer Staples Portfolio Class C
| | Six months ended (Unaudited) August 31, | Years endedFebruary 28, | | | | |
| | 2019 | 2019 | 2018 | 2017 | 2016 A | 2015 |
| Selected Per–Share Data | | | | | | |
| Net asset value, beginning of period | $74.79 | $84.85 | $93.89 | $87.77 | $99.27 | $86.32 |
| Income from Investment Operations | | | | | | |
| Net investment income (loss)B | .42 | 1.46C | .81 | .56 | .63 | .65 |
| Net realized and unrealized gain (loss) | 5.76 | (2.57) | (2.73) | 8.92 | (4.75) | 16.93 |
| Total from investment operations | 6.18 | (1.11) | (1.92) | 9.48 | (4.12) | 17.58 |
| Distributions from net investment income | – | (1.43) | (.82) | (.73) | (.65) | (.65) |
| Distributions from net realized gain | – | (7.53) | (6.30) | (2.64) | (6.72) | (3.98) |
| Total distributions | – | (8.95)D | (7.12) | (3.36)E | (7.38)F | (4.63) |
| Redemption fees added to paid in capitalB | – | – | – | –G | –G | –G |
| Net asset value, end of period | $80.97 | $74.79 | $84.85 | $93.89 | $87.77 | $99.27 |
| Total ReturnH,I,J | 8.26% | (1.05)% | (2.41)% | 11.07% | (4.23)% | 21.03% |
| Ratios to Average Net AssetsK,L | | | | | | |
| Expenses before reductions | 1.80%M | 1.79% | 1.79% | 1.80% | 1.80% | 1.80% |
| Expenses net of fee waivers, if any | 1.80%M | 1.79% | 1.79% | 1.79% | 1.80% | 1.80% |
| Expenses net of all reductions | 1.79%M | 1.78% | 1.78% | 1.79% | 1.79% | 1.80% |
| Net investment income (loss) | 1.07%M | 1.91%C | .86% | .61% | .69% | .70% |
| Supplemental Data | | | | | | |
| Net assets, end of period (000 omitted) | $128,492 | $150,822 | $228,874 | $308,350 | $250,576 | $228,151 |
| Portfolio turnover rateN | 31%M | 41%O | 76% | 56%O | 63% | 42%O |
A For the year ended February 29.
B Calculated based on average shares outstanding during the period.
C Net investment income per share reflects a large, non-recurring dividend which amounted to $.67 per share. Excluding this non-recurring dividend, the ratio of net investment income (loss) to average net assets would have been 1.04%.
D Total distributions of $8.95 per share is comprised of distributions from net investment income of $1.427 and distributions from net realized gain of $7.525 per share.
E Total distributions of $3.36 per share is comprised of distributions from net investment income of $.726 and distributions from net realized gain of $2.636 per share.
F Total distributions of $7.38 per share is comprised of distributions from net investment income of $.651 and distributions from net realized gain of $6.724 per share.
G Amount represents less than $.005 per share.
H Total returns for periods of less than one year are not annualized.
I Total returns would have been lower if certain expenses had not been reduced during the applicable periods shown.
J Total returns do not include the effect of the contingent deferred sales charge.
K Fees and expenses of any underlying Fidelity Central Funds are not included in the Fund's expense ratio. The Fund indirectly bears its proportionate share of the expenses of any underlying Fidelity Central Funds.
L Expense ratios reflect operating expenses of the class. Expenses before reductions do not reflect amounts reimbursed by the investment adviser or reductions from brokerage service arrangements or reductions from other expense offset arrangements and do not represent the amount paid by the class during periods when reimbursements or reductions occur. Expenses net of fee waivers reflect expenses after reimbursement by the investment adviser but prior to reductions from brokerage service arrangements or other expense offset arrangements. Expenses net of all reductions represent the net expenses paid by the class.
M Annualized
N Amount does not include the portfolio activity of any underlying Fidelity Central Funds.
O Portfolio turnover rate excludes securities received or delivered in-kind.
See accompanying notes which are an integral part of the financial statements.
Consumer Staples Portfolio
| | Six months ended (Unaudited) August 31, | Years endedFebruary 28, | | | | |
| | 2019 | 2019 | 2018 | 2017 | 2016 A | 2015 |
| Selected Per–Share Data | | | | | | |
| Net asset value, beginning of period | $77.63 | $87.85 | $97.01 | $90.48 | $102.03 | $88.51 |
| Income from Investment Operations | | | | | | |
| Net investment income (loss)B | .87 | 2.34C | 1.82 | 1.56 | 1.61 | 1.64 |
| Net realized and unrealized gain (loss) | 5.97 | (2.67) | (2.82) | 9.20 | (4.89) | 17.40 |
| Total from investment operations | 6.84 | (.33) | (1.00) | 10.76 | (3.28) | 19.04 |
| Distributions from net investment income | – | (2.36) | (1.86) | (1.60) | (1.55) | (1.54) |
| Distributions from net realized gain | – | (7.53) | (6.30) | (2.64) | (6.72) | (3.98) |
| Total distributions | – | (9.89) | (8.16) | (4.23)D | (8.27) | (5.52) |
| Redemption fees added to paid in capitalB | – | – | – | –E | –E | –E |
| Net asset value, end of period | $84.47 | $77.63 | $87.85 | $97.01 | $90.48 | $102.03 |
| Total ReturnF,G | 8.81% | (.03)% | (1.40)% | 12.24% | (3.25)% | 22.27% |
| Ratios to Average Net AssetsH,I | | | | | | |
| Expenses before reductions | .76%J | .77% | .76% | .76% | .77% | .77% |
| Expenses net of fee waivers, if any | .76%J | .76% | .76% | .76% | .77% | .77% |
| Expenses net of all reductions | .76%J | .75% | .76% | .76% | .76% | .77% |
| Net investment income (loss) | 2.10%J | 2.94%C | 1.89% | 1.64% | 1.72% | 1.73% |
| Supplemental Data | | | | | | |
| Net assets, end of period (000 omitted) | $833,332 | $814,350 | $1,328,696 | $1,665,604 | $2,039,983 | $2,173,970 |
| Portfolio turnover rateK | 31%J | 41%L | 76% | 56%L | 63% | 42%L |
A For the year ended February 29.
B Calculated based on average shares outstanding during the period.
C Net investment income per share reflects a large, non-recurring dividend which amounted to $.69 per share. Excluding this non-recurring dividend, the ratio of net investment income (loss) to average net assets would have been 2.07%.
D Total distributions of $4.23 per share is comprised of distributions from net investment income of $1.596 and distributions from net realized gain of $2.636 per share.
E Amount represents less than $.005 per share.
F Total returns for periods of less than one year are not annualized.
G Total returns would have been lower if certain expenses had not been reduced during the applicable periods shown.
H Fees and expenses of any underlying Fidelity Central Funds are not included in the Fund's expense ratio. The Fund indirectly bears its proportionate share of the expenses of any underlying Fidelity Central Funds.
I Expense ratios reflect operating expenses of the class. Expenses before reductions do not reflect amounts reimbursed by the investment adviser or reductions from brokerage service arrangements or reductions from other expense offset arrangements and do not represent the amount paid by the class during periods when reimbursements or reductions occur. Expenses net of fee waivers reflect expenses after reimbursement by the investment adviser but prior to reductions from brokerage service arrangements or other expense offset arrangements. Expenses net of all reductions represent the net expenses paid by the class.
J Annualized
K Amount does not include the portfolio activity of any underlying Fidelity Central Funds.
L Portfolio turnover rate excludes securities received or delivered in-kind.
See accompanying notes which are an integral part of the financial statements.
Consumer Staples Portfolio Class I
| | Six months ended (Unaudited) August 31, | Years endedFebruary 28, | | | | |
| | 2019 | 2019 | 2018 | 2017 | 2016 A | 2015 |
| Selected Per–Share Data | | | | | | |
| Net asset value, beginning of period | $77.45 | $87.68 | $96.82 | $90.34 | $101.91 | $88.33 |
| Income from Investment Operations | | | | | | |
| Net investment income (loss)B | .86 | 2.33C | 1.81 | 1.54 | 1.60 | 1.59 |
| Net realized and unrealized gain (loss) | 5.97 | (2.68) | (2.82) | 9.19 | (4.89) | 17.40 |
| Total from investment operations | 6.83 | (.35) | (1.01) | 10.73 | (3.29) | 18.99 |
| Distributions from net investment income | – | (2.36) | (1.83) | (1.61) | (1.55) | (1.44) |
| Distributions from net realized gain | – | (7.53) | (6.30) | (2.64) | (6.72) | (3.98) |
| Total distributions | – | (9.88)D | (8.13) | (4.25) | (8.28)E | (5.41)F |
| Redemption fees added to paid in capitalB | – | – | – | –G | –G | –G |
| Net asset value, end of period | $84.28 | $77.45 | $87.68 | $96.82 | $90.34 | $101.91 |
| Total ReturnH,I | 8.82% | (.04)% | (1.41)% | 12.22% | (3.26)% | 22.26% |
| Ratios to Average Net AssetsJ,K | | | | | | |
| Expenses before reductions | .77%L | .77% | .78% | .78% | .78% | .80% |
| Expenses net of fee waivers, if any | .77%L | .77% | .78% | .78% | .77% | .80% |
| Expenses net of all reductions | .77%L | .76% | .77% | .77% | .77% | .80% |
| Net investment income (loss) | 2.09%L | 2.93%C | 1.88% | 1.63% | 1.71% | 1.70% |
| Supplemental Data | | | | | | |
| Net assets, end of period (000 omitted) | $161,106 | $159,614 | $240,605 | $275,616 | $216,836 | $198,538 |
| Portfolio turnover rateM | 31%L | 41%N | 76% | 56%N | 63% | 42%N |
A For the year ended February 29.
B Calculated based on average shares outstanding during the period.
C Net investment income per share reflects a large, non-recurring dividend which amounted to $.69 per share. Excluding this non-recurring dividend, the ratio of net investment income (loss) to average net assets would have been 2.06%.
D Total distributions of $9.88 per share is comprised of distributions from net investment income of $2.357 and distributions from net realized gain of $7.525 per share.
E Total distributions of $8.28 per share is comprised of distributions from net investment income of $1.553 and distributions from net realized gain of $6.724 per share.
F Total distributions of $5.41 per share is comprised of distributions from net investment income of $1.436 and distributions from net realized gain of $3.976 per share.
G Amount represents less than $.005 per share.
H Total returns for periods of less than one year are not annualized.
I Total returns would have been lower if certain expenses had not been reduced during the applicable periods shown.
J Fees and expenses of any underlying Fidelity Central Funds are not included in the Fund's expense ratio. The Fund indirectly bears its proportionate share of the expenses of any underlying Fidelity Central Funds.
K Expense ratios reflect operating expenses of the class. Expenses before reductions do not reflect amounts reimbursed by the investment adviser or reductions from brokerage service arrangements or reductions from other expense offset arrangements and do not represent the amount paid by the class during periods when reimbursements or reductions occur. Expenses net of fee waivers reflect expenses after reimbursement by the investment adviser but prior to reductions from brokerage service arrangements or other expense offset arrangements. Expenses net of all reductions represent the net expenses paid by the class.
L Annualized
M Amount does not include the portfolio activity of any underlying Fidelity Central Funds.
N Portfolio turnover rate excludes securities received or delivered in-kind.
See accompanying notes which are an integral part of the financial statements.
Consumer Staples Portfolio Class Z
| | Six months ended (Unaudited) August 31, | Years endedFebruary 28, |
| | 2019 | 2019 A |
| Selected Per–Share Data | | |
| Net asset value, beginning of period | $77.36 | $81.61 |
| Income from Investment Operations | | |
| Net investment income (loss)B | .90 | .05C |
| Net realized and unrealized gain (loss) | 5.98 | .33D |
| Total from investment operations | 6.88 | .38 |
| Distributions from net investment income | – | (2.23) |
| Distributions from net realized gain | – | (2.40) |
| Total distributions | – | (4.63) |
| Net asset value, end of period | $84.24 | $77.36 |
| Total ReturnE,F | 8.89% | .79% |
| Ratios to Average Net AssetsG,H | | |
| Expenses before reductions | .63%I | .63%I |
| Expenses net of fee waivers, if any | .63%I | .62%I |
| Expenses net of all reductions | .63%I | .61%I |
| Net investment income (loss) | 2.23%I | .16%C,I |
| Supplemental Data | | |
| Net assets, end of period (000 omitted) | $40,453 | $8,052 |
| Portfolio turnover rateJ | 31% | 41%K |
A For the period October 2, 2018 (commencement of sale of shares) to February 28, 2019.
B Calculated based on average shares outstanding during the period.
C Net investment income per share reflects a large, non-recurring dividend which amounted to $.26 per share. Excluding this non-recurring dividend, the ratio of net investment income (loss) to average net assets would have been (.69) %.
D The amount shown for a share outstanding does not correspond with the aggregate net gain (loss) on investments for the period due to the timing of sales and repurchases of shares in relation to fluctuating market values of the investments of the Fund.
E Total returns for periods of less than one year are not annualized.
F Total returns would have been lower if certain expenses had not been reduced during the applicable periods shown.
G Fees and expenses of any underlying Fidelity Central Funds are not included in the Fund's expense ratio. The Fund indirectly bears its proportionate share of the expenses of any underlying Fidelity Central Funds.
H Expense ratios reflect operating expenses of the class. Expenses before reductions do not reflect amounts reimbursed by the investment adviser or reductions from brokerage service arrangements or reductions from other expense offset arrangements and do not represent the amount paid by the class during periods when reimbursements or reductions occur. Expense ratios before reductions for start-up periods may not be representative of longer-term operating periods. Expenses net of fee waivers reflect expenses after reimbursement by the investment adviser but prior to reductions from brokerage service arrangements or other expense offset arrangements. Expenses net of all reductions represent the net expenses paid by the class.
I Annualized
J Amount does not include the portfolio activity of any underlying Fidelity Central Funds.
K Portfolio turnover rate excludes securities received or delivered in-kind.
See accompanying notes which are an integral part of the financial statements.
Notes to Financial Statements (Unaudited)
For the period ended August 31, 2019
1. Organization.
Consumer Staples Portfolio (the Fund) is a non-diversified fund of Fidelity Select Portfolios (the Trust) and is authorized to issue an unlimited number of shares. The Trust is registered under the Investment Company Act of 1940, as amended (the 1940 Act), as an open-end management investment company organized as a Massachusetts business trust. The Fund invests primarily in securities of companies whose principal business activities fall within specific industries. The Fund offers Class A, Class M, Class C, Consumer Staples, Class I and Class Z shares, each of which has equal rights as to assets and voting privileges. Each class has exclusive voting rights with respect to matters that affect that class. Effective March 1, 2019, Class C shares will automatically convert to Class A shares after a holding period of ten years from the initial date of purchase, with certain exceptions.
2. Investments in Fidelity Central Funds.
The Fund invests in Fidelity Central Funds, which are open-end investment companies generally available only to other investment companies and accounts managed by the investment adviser and its affiliates. The Fund's Schedule of Investments lists each of the Fidelity Central Funds held as of period end, if any, as an investment of the Fund, but does not include the underlying holdings of each Fidelity Central Fund. As an Investing Fund, the Fund indirectly bears its proportionate share of the expenses of the underlying Fidelity Central Funds.
The Money Market Central Funds seek preservation of capital and current income and are managed by Fidelity Investments Money Management, Inc. (FIMM), an affiliate of the investment adviser. Annualized expenses of the Money Market Central Funds as of their most recent shareholder report date ranged from less than .005% to .01%.
A complete unaudited list of holdings for each Fidelity Central Fund is available upon request or at the Securities and Exchange Commission (the SEC) website at www.sec.gov. In addition, the financial statements of the Fidelity Central Funds are available on the SEC website or upon request.
3. Significant Accounting Policies.
The Fund is an investment company and applies the accounting and reporting guidance of the Financial Accounting Standards Board (FASB) Accounting Standards Codification Topic 946 Financial Services – Investments Companies. The financial statements have been prepared in conformity with accounting principles generally accepted in the United States of America (GAAP), which require management to make certain estimates and assumptions at the date of the financial statements. Actual results could differ from those estimates. Subsequent events, if any, through the date that the financial statements were issued have been evaluated in the preparation of the financial statements. The following summarizes the significant accounting policies of the Fund:
Investment Valuation. Investments are valued as of 4:00 p.m. Eastern time on the last calendar day of the period. The Board of Trustees (the Board) has delegated the day to day responsibility for the valuation of the Fund's investments to the Fair Value Committee (the Committee) established by the Fund's investment adviser. In accordance with valuation policies and procedures approved by the Board, the Fund attempts to obtain prices from one or more third party pricing vendors or brokers to value its investments. When current market prices, quotations or currency exchange rates are not readily available or reliable, investments will be fair valued in good faith by the Committee, in accordance with procedures adopted by the Board. Factors used in determining fair value vary by investment type and may include market or investment specific events. The frequency with which these procedures are used cannot be predicted and they may be utilized to a significant extent. The Committee oversees the Fund's valuation policies and procedures and reports to the Board on the Committee's activities and fair value determinations. The Board monitors the appropriateness of the procedures used in valuing the Fund's investments and ratifies the fair value determinations of the Committee.
The Fund categorizes the inputs to valuation techniques used to value its investments into a disclosure hierarchy consisting of three levels as shown below:
- Level 1 – quoted prices in active markets for identical investments
- Level 2 – other significant observable inputs (including quoted prices for similar investments, interest rates, prepayment speeds, etc.)
- Level 3 – unobservable inputs (including the Fund's own assumptions based on the best information available)
Valuation techniques used to value the Fund's investments by major category are as follows:
Equity securities, including restricted securities, for which market quotations are readily available, are valued at the last reported sale price or official closing price as reported by a third party pricing vendor on the primary market or exchange on which they are traded and are categorized as Level 1 in the hierarchy. In the event there were no sales during the day or closing prices are not available, securities are valued at the last quoted bid price or may be valued using the last available price and are generally categorized as Level 2 in the hierarchy. For foreign equity securities, when market or security specific events arise, comparisons to the valuation of American Depositary Receipts (ADRs), futures contracts, Exchange-Traded Funds (ETFs) and certain indexes as well as quoted prices for similar securities may be used and would be categorized as Level 2 in the hierarchy. For equity securities, including restricted securities, where observable inputs are limited, assumptions about market activity and risk are used and these securities may be categorized as Level 3 in the hierarchy.
Investments in open-end mutual funds, including the Fidelity Central Funds, are valued at their closing net asset value (NAV) each business day and are categorized as Level 1 in the hierarchy.
Changes in valuation techniques may result in transfers in or out of an assigned level within the disclosure hierarchy. The aggregate value of investments by input level as of August 31, 2019 is included at the end of the Fund's Schedule of Investments.
Foreign Currency. The Fund may use foreign currency contracts to facilitate transactions in foreign-denominated securities. Gains and losses from these transactions may arise from changes in the value of the foreign currency or if the counterparties do not perform under the contracts' terms.
Foreign-denominated assets, including investment securities, and liabilities are translated into U.S. dollars at the exchange rates at period end. Purchases and sales of investment securities, income and dividends received and expenses denominated in foreign currencies are translated into U.S. dollars at the exchange rate in effect on the transaction date.
The effects of exchange rate fluctuations on investments are included with the net realized and unrealized gain (loss) on investment securities. Other foreign currency transactions resulting in realized and unrealized gain (loss) are disclosed separately.
Investment Transactions and Income. For financial reporting purposes, the Fund's investment holdings and NAV include trades executed through the end of the last business day of the period. The NAV per share for processing shareholder transactions is calculated as of the close of business of the New York Stock Exchange (NYSE), normally 4:00 p.m. Eastern time and includes trades executed through the end of the prior business day. Gains and losses on securities sold are determined on the basis of identified cost. Dividend income is recorded on the ex-dividend date, except for certain dividends from foreign securities where the ex-dividend date may have passed, which are recorded as soon as the Fund is informed of the ex-dividend date. Non-cash dividends included in dividend income, if any, are recorded at the fair market value of the securities received. Income and capital gain distributions from Fidelity Central Funds, if any, are recorded on the ex-dividend date. Certain distributions received by the Fund represent a return of capital or capital gain. The Fund determines the components of these distributions subsequent to the ex-dividend date, based upon receipt of tax filings or other correspondence relating to the underlying investment. These distributions are recorded as a reduction of cost of investments and/or as a realized gain. Investment income is recorded net of foreign taxes withheld where recovery of such taxes is uncertain.
Class Allocations and Expenses. Investment income realized and unrealized capital gains and losses, common expenses of the Fund, and certain fund-level expense reductions, if any, are allocated daily on a pro-rata basis to each class based on the relative net assets of each class to the total net assets of the Fund. Each class differs with respect to transfer agent and distribution and service plan fees incurred. Certain expense reductions may also differ by class. For the reporting period, the allocated portion of income and expenses to each class as a percent of its average net assets may vary due to the timing of recording these transactions in relation to fluctuating net assets of the classes. Expenses directly attributable to a fund are charged to that fund. Expenses attributable to more than one fund are allocated among the respective funds on the basis of relative net assets or other appropriate methods. Expense estimates are accrued in the period to which they relate and adjustments are made when actual amounts are known.
Deferred Trustee Compensation. Under a Deferred Compensation Plan (the Plan) for the Fund, certain independent Trustees have elected to defer receipt of a portion of their annual compensation. Deferred amounts are invested in a cross-section of Fidelity funds, are marked-to-market and remain in the Fund until distributed in accordance with the Plan. The investment of deferred amounts and the offsetting payable to the Trustees of $212,425 are included in the accompanying Statement of Assets and Liabilities in other receivables and other payables and accrued expenses, respectively.
Income Tax Information and Distributions to Shareholders. Each year, the Fund intends to qualify as a regulated investment company under Subchapter M of the Internal Revenue Code, including distributing substantially all of its taxable income and realized gains. As a result, no provision for U.S. Federal income taxes is required. The Fund files a U.S. federal tax return, in addition to state and local tax returns as required. The Fund's federal income tax returns are subject to examination by the Internal Revenue Service (IRS) for a period of three fiscal years after they are filed. State and local tax returns may be subject to examination for an additional fiscal year depending on the jurisdiction. Foreign taxes are provided for based on the Fund's understanding of the tax rules and rates that exist in the foreign markets in which it invests.
Distributions are declared and recorded on the ex-dividend date. Income and capital gain distributions are declared separately for each class. Income and capital gain distributions are determined in accordance with income tax regulations, which may differ from GAAP.
Capital accounts within the financial statements are adjusted for permanent book-tax differences. These adjustments have no impact on net assets or the results of operations. Capital accounts are not adjusted for temporary book-tax differences which will reverse in a subsequent period.
Book-tax differences are primarily due to foreign currency transactions, certain foreign taxes, redemptions in-kind, deferred trustees compensation and losses deferred due to wash sales and excise tax regulations.
As of period end, the cost and unrealized appreciation (depreciation) in securities, and derivatives if applicable, for federal income tax purposes were as follows:
| Gross unrealized appreciation | $349,409,868 |
| Gross unrealized depreciation | (150,161,788) |
| Net unrealized appreciation (depreciation) | $199,248,080 |
| Tax cost | $1,295,187,486 |
The Fund elected to defer to its next fiscal year approximately $12,809,133 of capital losses recognized during the period November 1, 2018 to February 28, 2019.
Restricted Securities. The Fund may invest in securities that are subject to legal or contractual restrictions on resale. These securities generally may be resold in transactions exempt from registration or to the public if the securities are registered. Disposal of these securities may involve time-consuming negotiations and expense, and prompt sale at an acceptable price may be difficult. Information regarding restricted securities is included at the end of the Fund's Schedule of Investments.
4. Purchases and Sales of Investments.
Purchases and sales of securities, other than short-term securities, aggregated $224,110,827 and $278,416,294, respectively.
5. Fees and Other Transactions with Affiliates.
Management Fee. Fidelity SelectCo, LLC (the investment adviser) and its affiliates provide the Fund with investment management related services for which the Fund pays a monthly management fee. The management fee is the sum of an individual fund fee rate that is based on an annual rate of .30% of the Fund's average net assets and an annualized group fee rate that averaged .24% during the period. The group fee rate is based upon the average net assets of all the mutual funds advised by Fidelity Management & Research Company (FMR) and the investment adviser. The group fee rate decreases as assets under management increase and increases as assets under management decrease. For the reporting period, the total annualized management fee rate was .54% of the Fund's average net assets.
Distribution and Service Plan Fees. In accordance with Rule 12b-1 of the 1940 Act, the Fund has adopted separate Distribution and Service Plans for each class of shares. Certain classes pay Fidelity Distributors Corporation (FDC), an affiliate of the investment adviser, separate Distribution and Service Fees, each of which is based on an annual percentage of each class' average net assets. In addition, FDC may pay financial intermediaries for selling shares of the Fund and providing shareholder support services. For the period, the Distribution and Service Fee rates, total fees and amounts retained by FDC were as follows:
| | Distribution Fee | Service Fee | Total Fees | Retained by FDC |
| Class A | -% | .25% | $313,321 | $1,079 |
| Class M | .25% | .25% | 154,404 | – |
| Class C | .75% | .25% | 672,830 | 44,736 |
| | | | $1,140,555 | $45,815 |
Sales Load. FDC may receive a front-end sales charge of up to 5.75% for selling Class A shares and 3.50% for selling Class M shares, some of which is paid to financial intermediaries for selling shares of the Fund. Depending on the holding period, FDC may receive contingent deferred sales charges levied on Class A, Class M and Class C redemptions. The deferred sales charges are 1.00% for Class C shares, 1.00% for certain purchases of Class A shares and .25% for certain purchases of Class M shares.
For the period, sales charge amounts retained by FDC were as follows:
| | Retained by FDC |
| Class A | $46,554 |
| Class M | 5,067 |
| Class C(a) | 3,973 |
| | $55,594 |
(a) When Class C shares are initially sold, FDC pays commissions from its own resources to financial intermediaries through which the sales are made.
Transfer Agent Fees. Fidelity Investments Institutional Operations Company, Inc., (FIIOC), an affiliate of the investment adviser, is the transfer, dividend disbursing and shareholder servicing agent for each class of the Fund. FIIOC receives account fees and asset-based fees that vary according to the account size and type of account of the shareholders of the respective classes of the Fund, except for Class Z. FIIOC receives an asset-based fee of Class Z's average net assets. FIIOC pays for typesetting, printing and mailing of shareholder reports, except proxy statements.
For the period, transfer agent fees for each class were as follows:
| | Amount | % of Class-Level Average Net Assets(a) |
| Class A | $267,489 | .21 |
| Class M | 72,842 | .24 |
| Class C | 142,515 | .21 |
| Consumer Staples | 739,337 | .17 |
| Class I | 152,767 | .19 |
| Class Z | 2,934 | .05 |
| | $1,377,884 | |
(a) Annualized
Accounting and Security Lending Fees. Fidelity Service Company, Inc. (FSC), an affiliate of the investment adviser, maintains the Fund's accounting records. The accounting fee is based on the level of average net assets for each month. Prior to April 1, 2019, FSC had a separate agreement with the Fund for administration of the security lending program, based on the number and duration of lending transactions. For the period, the total fees paid for accounting and administration of securities lending were equivalent to an annualized rate of .03%.
Brokerage Commissions. The Fund placed a portion of its portfolio transactions with brokerage firms which are affiliates of the investment adviser. Brokerage commissions are included in net realized gain (loss) and change in net unrealized appreciation (depreciation) in the Statement of Operations. The commissions paid to these affiliated firms were $8,593 for the period.
Interfund Lending Program. Pursuant to an Exemptive Order issued by the SEC, the Fund, along with other registered investment companies having management contracts with Fidelity Management & Research Company (FMR) or other affiliated entities of FMR, may participate in an interfund lending program. This program provides an alternative credit facility allowing the funds to borrow from, or lend money to, other participating affiliated funds. At period end, there were no interfund loans outstanding. The Fund's activity in this program during the period for which loans were outstanding was as follows:
| Borrower or Lender | Average Loan Balance | Weighted Average Interest Rate | Interest Expense |
| Borrower | $2,318,750 | 2.59% | $1,333 |
Interfund Trades. The Fund may purchase from or sell securities to other Fidelity Funds under procedures adopted by the Board. The procedures have been designed to ensure these interfund trades are executed in accordance with Rule 17a-7 of the 1940 Act. Interfund trades are included within the respective purchases and sales amounts shown in the Purchases and Sales of Investments note.
Prior Fiscal Year Affiliated Redemptions In-Kind. During the prior period, 3,404,232 shares of the Fund were redeemed in-kind for investments and cash with a value of $278,330,010. The Fund had a net realized gain of $70,956,466 on investments delivered through in-kind redemptions. The amount of the in-kind redemptions is included in share transactions in the accompanying Statement of Changes in Net Assets as well as the Notes to Financial Statements. The Fund recognized no gain or loss for federal income tax purposes.
6. Committed Line of Credit.
The Fund participates with other funds managed by the investment adviser or an affiliate in a $4.25 billion credit facility (the "line of credit") to be utilized for temporary or emergency purposes to fund shareholder redemptions or for other short-term liquidity purposes. The Fund has agreed to pay commitment fees on its pro-rata portion of the line of credit, which amounted to $1,953 and is reflected in Miscellaneous expenses on the Statement of Operations. During the period, the Fund did not borrow on this line of credit.
7. Security Lending.
The Fund lends portfolio securities from time to time in order to earn additional income. For equity securities, lending agents are used, including National Financial Services (NFS), an affiliate of the Fund. Pursuant to a securities lending agreement, NFS will receive a fee, which is capped at 9.9% of daily lending revenue, for its services as lending agent. The Fund may lend securities to certain qualified borrowers. On the settlement date of the loan, the Fund receives collateral (in the form of U.S. Treasury obligations, letters of credit and/or cash) against the loaned securities and maintains collateral in an amount not less than 100% of the market value of the loaned securities during the period of the loan. The market value of the loaned securities is determined at the close of business of the Fund and any additional required collateral is delivered to the Fund on the next business day. The Fund or borrower may terminate the loan at any time, and if the borrower defaults on its obligation to return the securities loaned because of insolvency or other reasons, the Fund may apply collateral received from the borrower against the obligation. The Fund may experience delays and costs in recovering the securities loaned. Any cash collateral received is invested in the Fidelity Securities Lending Cash Central Fund. The value of loaned securities and cash collateral at period end are disclosed on the Fund's Statement of Assets and Liabilities. Total fees paid by the Fund to NFS, amounted to $372. Security lending income represents the income earned on investing cash collateral, less rebates paid to borrowers and any lending agent fees associated with the loan, plus any premium payments received for lending certain types of securities. Security lending income is presented in the Statement of Operations as a component of income from Fidelity Central Funds.
8. Expense Reductions.
Commissions paid to certain brokers with whom the investment adviser, or its affiliates, places trades on behalf of the Fund include an amount in addition to trade execution, which may be rebated back to the Fund to offset certain expenses. This amount totaled $16,849 for the period. In addition, through arrangements with each class' transfer agent, credits realized as a result of certain uninvested cash balances were used to reduce the Fund's expenses. During the period, transfer agent credits reduced each class' expenses as noted in the table below.
| | Expense reduction |
| Consumer Staples | $80 |
In addition, during the period the investment adviser reimbursed and/or waived a portion of fund-level operating expenses in the amount of $5,632.
9. Distributions to Shareholders.
Distributions to shareholders of each class were as follows:
| | Six months ended
August 31, 2019 | Year ended
February 28, 2019(a) |
| Distributions to shareholders | | |
| Class A | $– | $31,532,315 |
| Class M | – | 7,789,847 |
| Class C | – | 21,174,166 |
| Consumer Staples | – | 126,567,988 |
| Class I | – | 24,805,720 |
| Class Z | – | 302,304 |
| Total | $– | $212,172,340 |
(a) Distributions for Class Z are for the period October 2, 2018 (commencement of sale of shares) to February 28, 2019.
10. Share Transactions.
Share transactions for each class were as follows and may contain automatic conversions between classes or exchanges between affiliated funds:
| | Shares | Shares | Dollars | Dollars |
| | Six months ended August 31, 2019 | Year ended February 28, 2019(a) | Six months ended August 31, 2019 | Year ended February 28, 2019(a) |
| Class A | | | | |
| Shares sold | 412,993 | 449,932 | $33,077,431 | $35,089,323 |
| Reinvestment of distributions | – | 398,204 | – | 30,796,418 |
| Shares redeemed | (421,890) | (1,475,083) | (34,316,343) | (115,548,253) |
| Net increase (decrease) | (8,897) | (626,947) | $(1,238,912) | $(49,662,512) |
| Class M | | | | |
| Shares sold | 43,679 | 79,651 | $3,534,134 | $6,204,264 |
| Reinvestment of distributions | – | 101,114 | – | 7,739,839 |
| Shares redeemed | (84,322) | (278,973) | (6,773,695) | (21,711,204) |
| Net increase (decrease) | (40,643) | (98,208) | $(3,239,561) | $(7,767,101) |
| Class C | | | | |
| Shares sold | 74,124 | 207,723 | $5,876,908 | $15,770,092 |
| Reinvestment of distributions | – | 267,367 | – | 20,225,054 |
| Shares redeemed | (503,836) | (1,155,923) | (39,250,132) | (88,087,579) |
| Net increase (decrease) | (429,712) | (680,833) | $(33,373,224) | $(52,092,433) |
| Consumer Staples | | | | |
| Shares sold | 946,641 | 1,329,875 | $78,271,293 | $104,789,246 |
| Reinvestment of distributions | – | 1,509,435 | – | 118,306,244 |
| Shares redeemed | (1,572,512) | (7,473,301)(b) | (129,970,478) | (599,358,298)(b) |
| Net increase (decrease) | (625,871) | (4,633,991) | $(51,699,185) | $(376,262,808) |
| Class I | | | | |
| Shares sold | 466,785 | 973,629 | $38,639,889 | $76,737,622 |
| Reinvestment of distributions | – | 293,006 | – | 22,761,304 |
| Shares redeemed | (616,038) | (1,949,992) | (50,442,361) | (151,953,970) |
| Net increase (decrease) | (149,253) | (683,357) | $(11,802,472) | $(52,455,044) |
| Class Z | | | | |
| Shares sold | 400,660 | 110,114 | $33,284,428 | $8,671,440 |
| Reinvestment of distributions | – | 3,266 | – | 238,969 |
| Shares redeemed | (24,507) | (9,296) | (2,023,747) | (696,780) |
| Net increase (decrease) | 376,153 | 104,084 | $31,260,681 | $8,213,629 |
(a) Share transactions for Class Z are for the period October 2, 2018 (commencement of sale of shares) to February 28, 2019.
(b) Amount includes in-kind redemptions (see the Prior Fiscal Year Affiliated Redemptions In-Kind note for additional details).
11. Other.
The Fund's organizational documents provide former and current trustees and officers with a limited indemnification against liabilities arising in connection with the performance of their duties to the Fund. In the normal course of business, the Fund may also enter into contracts that provide general indemnifications. The Fund's maximum exposure under these arrangements is unknown as this would be dependent on future claims that may be made against the Fund. The risk of material loss from such claims is considered remote.
Shareholder Expense Example
As a shareholder of the Fund, you incur two types of costs: (1) transaction costs, including sales charges (loads) on purchase payments or redemption proceeds, and (2) ongoing costs, including management fees, distribution and/or service (12b-1) fees and other Fund expenses. This Example is intended to help you understand your ongoing costs (in dollars) of investing in the Fund and to compare these costs with the ongoing costs of investing in other mutual funds.
The Example is based on an investment of $1,000 invested at the beginning of the period and held for the entire period (March 1, 2019 to August 31, 2019).
Actual Expenses
The first line of the accompanying table for each class of the Fund provides information about actual account values and actual expenses. You may use the information in this line, together with the amount you invested, to estimate the expenses that you paid over the period. Simply divide your account value by $1,000.00 (for example, an $8,600 account value divided by $1,000.00 = 8.6), then multiply the result by the number in the first line for a class of the Fund under the heading entitled "Expenses Paid During Period" to estimate the expenses you paid on your account during this period. In addition, the Fund, as a shareholder in the underlying Fidelity Central Funds, will indirectly bear its pro-rata share of the fees and expenses incurred by the underlying Fidelity Central Funds. These fees and expenses are not included in the Fund's annualized expense ratio used to calculate the expense estimate in the table below.
Hypothetical Example for Comparison Purposes
The second line of the accompanying table for each class of the Fund provides information about hypothetical account values and hypothetical expenses based on a Class' actual expense ratio and an assumed rate of return of 5% per year before expenses, which is not the Class' actual return. The hypothetical account values and expenses may not be used to estimate the actual ending account balance or expenses you paid for the period. You may use this information to compare the ongoing costs of investing in the Fund and other funds. To do so, compare this 5% hypothetical example with the 5% hypothetical examples that appear in the shareholder reports of the other funds. In addition, the Fund, as a shareholder in the underlying Fidelity Central Funds, will indirectly bear its pro-rata share of the fees and expenses incurred by the underlying Fidelity Central Funds. These fees and expenses are not included in the Fund's annualized expense ratio used to calculate the expense estimate in the table below.
Please note that the expenses shown in the table are meant to highlight your ongoing costs only and do not reflect any transaction costs. Therefore, the second line of the table is useful in comparing ongoing costs only, and will not help you determine the relative total costs of owning different funds. In addition, if these transactional costs were included, your costs would have been higher.
| | Annualized Expense Ratio-A | Beginning
Account Value
March 1, 2019 | Ending
Account Value
August 31, 2019 | Expenses Paid
During Period-B
March 1, 2019
to August 31, 2019 |
| Class A | 1.05% | | | |
| Actual | | $1,000.00 | $1,086.60 | $5.51 |
| Hypothetical-C | | $1,000.00 | $1,019.86 | $5.33 |
| Class M | 1.32% | | | |
| Actual | | $1,000.00 | $1,085.10 | $6.92 |
| Hypothetical-C | | $1,000.00 | $1,018.50 | $6.70 |
| Class C | 1.80% | | | |
| Actual | | $1,000.00 | $1,082.60 | $9.42 |
| Hypothetical-C | | $1,000.00 | $1,016.09 | $9.12 |
| Consumer Staples | .76% | | | |
| Actual | | $1,000.00 | $1,088.10 | $3.99 |
| Hypothetical-C | | $1,000.00 | $1,021.32 | $3.86 |
| Class I | .77% | | | |
| Actual | | $1,000.00 | $1,088.20 | $4.04 |
| Hypothetical-C | | $1,000.00 | $1,021.27 | $3.91 |
| Class Z | .63% | | | |
| Actual | | $1,000.00 | $1,088.90 | $3.31 |
| Hypothetical-C | | $1,000.00 | $1,021.97 | $3.20 |
A Annualized expense ratio reflects expenses net of applicable fee waivers.
B Expenses are equal to each Class' annualized expense ratio, multiplied by the average account value over the period, multiplied by 184/366 (to reflect the one-half year period).
C 5% return per year before expenses
SELCS-SANN-1019
1.846045.112
Item 2.
Code of Ethics
Not applicable.
Item 3.
Audit Committee Financial Expert
Not applicable.
Item 4.
Principal Accountant Fees and Services
Not applicable.
Item 5.
Audit Committee of Listed Registrants
Not applicable.
Item 6.
Investments
(a)
Not applicable.
(b)
Not applicable
Item 7.
Disclosure of Proxy Voting Policies and Procedures for Closed-End Management Investment Companies
Not applicable.
Item 8.
Portfolio Managers of Closed-End Management Investment Companies
Not applicable.
Item 9.
Purchase of Equity Securities by Closed-End Management Investment Company and Affiliated Purchasers
Not applicable.
Item 10.
Submission of Matters to a Vote of Security Holders
There were no material changes to the procedures by which shareholders may recommend nominees to the Fidelity Select Portfolios’s Board of Trustees.
Item 11.
Controls and Procedures
(a)(i) The President and Treasurer and the Chief Financial Officer have concluded that the Fidelity Select Portfolios’s (the “Trust”) disclosure controls and procedures (as
defined in Rule 30a-3(c) under the Investment Company Act) provide reasonable assurances that material information relating to the Trust is made known to them by the appropriate persons, based on their evaluation of these controls and procedures as of a date within 90 days of the filing date of this report.
(a)(ii) There was no change in the Trust’s internal control over financial reporting (as defined in Rule 30a-3(d) under the Investment Company Act) that occurred during the period covered by this report that has materially affected, or is reasonably likely to materially affect, the Trust’s internal control over financial reporting.
Item 12.
Disclosure of Securities Lending Activities for Closed-End Management
Investment Companies
Not applicable.
Item 13.
Exhibits
| | |
(a) | (1) | Not applicable. |
(a) | (2) | Certification pursuant to Rule 30a-2(a) under the Investment Company Act of 1940 (17 CFR 270.30a-2(a)) is filed and attached hereto as Exhibit 99.CERT. |
(a) | (3) | Not applicable. |
(b) |
| Certification pursuant to Rule 30a-2(b) under the Investment Company Act of 1940 (17 CFR 270.30a-2(b)) is furnished and attached hereto as Exhibit 99.906CERT. |
SIGNATURES
Pursuant to the requirements of the Securities Exchange Act of 1934 and the Investment Company Act of 1940, the registrant has duly caused this report to be signed on its behalf by the undersigned, thereunto duly authorized.
Fidelity Select Portfolios
| |
By: | /s/Stacie M. Smith |
| Stacie M. Smith |
| President and Treasurer |
|
|
Date: | October 24, 2019 |
Pursuant to the requirements of the Securities Exchange Act of 1934 and the Investment Company Act of 1940, this report has been signed below by the following persons on behalf of the registrant and in the capacities and on the dates indicated.
| |
By: | /s/Stacie M. Smith |
| Stacie M. Smith |
| President and Treasurer |
|
|
Date: | October 24, 2019 |
| |
By: | /s/John J. Burke III |
| John J. Burke III |
| Chief Financial Officer |
|
|
Date: | October 24, 2019 |