UNITED STATES
SECURITIES AND EXCHANGE COMMISSION
Washington, D.C. 20549
FORM N-CSR
CERTIFIED SHAREHOLDER REPORT OF REGISTERED
MANAGEMENT INVESTMENT COMPANIES
Investment Company Act file number 811-03114
Fidelity Select Portfolios
(Exact name of registrant as specified in charter)
245 Summer St., Boston, MA 02210
(Address of principal executive offices) (Zip code)
Cynthia Lo Bessette, Secretary
245 Summer St.
Boston, Massachusetts 02210
(Name and address of agent for service)
Registrant's telephone number, including area code:
617-563-7000
| |
Date of fiscal year end: | February 28 |
|
|
Date of reporting period: | August 31, 2020 |
Item 1.
Reports to Stockholders
Fidelity® Select Portfolios®
Consumer Discretionary Sector
Automotive Portfolio
Communication Services Portfolio
Construction and Housing Portfolio
Consumer Discretionary Portfolio
Leisure Portfolio
Retailing Portfolio
Semi-Annual Report
August 31, 2020
Includes Fidelity and Fidelity Advisor share classes

See the inside front cover for important information about access to your fund’s shareholder reports.

Beginning on January 1, 2021, as permitted by regulations adopted by the Securities and Exchange Commission, paper copies of a fund’s shareholder reports will no longer be sent by mail, unless you specifically request paper copies of the reports from the fund or from your financial intermediary, such as a financial advisor, broker-dealer or bank. Instead, the reports will be made available on a website, and you will be notified by mail each time a report is posted and provided with a website link to access the report.
If you already elected to receive shareholder reports electronically, you will not be affected by this change and you need not take any action. You may elect to receive shareholder reports and other communications from a fund electronically, by contacting your financial intermediary. For Fidelity customers, visit Fidelity's web site or call Fidelity using the contact information listed below.
You may elect to receive all future reports in paper free of charge. If you wish to continue receiving paper copies of your shareholder reports, you may contact your financial intermediary or, if you are a Fidelity customer, visit Fidelity’s website, or call Fidelity at the applicable toll-free number listed below. Your election to receive reports in paper will apply to all funds held with the fund complex/your financial intermediary.
| Account Type | Website | Phone Number |
| Brokerage, Mutual Fund, or Annuity Contracts: | fidelity.com/mailpreferences | 1-800-343-3548 |
| Employer Provided Retirement Accounts: | netbenefits.fidelity.com/preferences (choose 'no' under Required Disclosures to continue to print) | 1-800-343-0860 |
| Advisor Sold Accounts Serviced Through Your Financial Intermediary: | Contact Your Financial Intermediary | Your Financial Intermediary's phone number |
| Advisor Sold Accounts Serviced by Fidelity: | institutional.fidelity.com | 1-877-208-0098 |
Contents
To view a fund's proxy voting guidelines and proxy voting record for the 12-month period ended June 30, visit http://www.fidelity.com/proxyvotingresults or visit the Securities and Exchange Commission's (SEC) web site at http://www.sec.gov.
You may also call 1-800-544-8544 if you’re an individual investing directly with Fidelity, call 1-800-835-5092 if you’re a plan sponsor or participant with Fidelity as your recordkeeper or call 1-877-208-0098 on institutional accounts or if you’re an advisor or invest through one to request a free copy of the proxy voting guidelines.
Standard & Poor's, S&P and S&P 500 are registered service marks of The McGraw-Hill Companies, Inc. and have been licensed for use by Fidelity Distributors Corporation.
Other third-party marks appearing herein are the property of their respective owners.
All other marks appearing herein are registered or unregistered trademarks or service marks of FMR LLC or an affiliated company. © 2020 FMR LLC. All rights reserved.
This report and the financial statements contained herein are submitted for the general information of the shareholders of the Funds. This report is not authorized for distribution to prospective investors in the Funds unless preceded or accompanied by an effective prospectus.
A fund files its complete schedule of portfolio holdings with the SEC for the first and third quarters of each fiscal year on Form N-PORT. Forms N-PORT are available on the SEC’s web site at http://www.sec.gov. A fund's Forms N-PORT may be reviewed and copied at the SEC’s Public Reference Room in Washington, DC. Information regarding the operation of the SEC's Public Reference Room may be obtained by calling 1-800-SEC-0330.
For a complete list of a fund's portfolio holdings, view the most recent holdings listing, semiannual report, or annual report on Fidelity's web site at http://www.fidelity.com, http://www.institutional.fidelity.com, or http://www.401k.com, as applicable.
NOT FDIC INSURED •MAY LOSE VALUE •NO BANK GUARANTEE
Neither the Funds nor Fidelity Distributors Corporation is a bank.
Note to Shareholders:
Early in 2020, the outbreak and spread of a new coronavirus emerged as a public health emergency that had a major influence on financial markets, primarily based on its impact on the global economy and the outlook for corporate earnings. The virus causes a respiratory disease known as COVID-19. On March 11, the World Health Organization declared the COVID-19 outbreak a pandemic, citing sustained risk of further global spread.
In the weeks following, as the crisis worsened, we witnessed an escalating human tragedy with wide-scale social and economic consequences from coronavirus-containment measures. The outbreak of COVID-19 prompted a number of measures to limit the spread, including travel and border restrictions, quarantines, and restrictions on large gatherings. In turn, these resulted in lower consumer activity, diminished demand for a wide range of products and services, disruption in manufacturing and supply chains, and – given the wide variability in outcomes regarding the outbreak – significant market uncertainty and volatility. Amid the turmoil, the U.S. government took unprecedented action – in concert with the U.S. Federal Reserve and central banks around the world – to help support consumers, businesses, and the broader economy, and to limit disruption to the financial system.
The situation continues to unfold, and the extent and duration of its impact on financial markets and the economy remain highly uncertain. Extreme events such as the coronavirus crisis are “exogenous shocks” that can have significant adverse effects on mutual funds and their investments. Although multiple asset classes may be affected by market disruption, the duration and impact may not be the same for all types of assets.
Fidelity is committed to helping you stay informed amid news about COVID-19 and during increased market volatility, and we’re taking extra steps to be responsive to customer needs. We encourage you to visit our websites, where we offer ongoing updates, commentary, and analysis on the markets and our funds.
Automotive Portfolio
Investment Summary (Unaudited)
Top Ten Stocks as of August 31, 2020
| | % of fund's net assets |
| Tesla, Inc. | 11.8 |
| Toyota Motor Corp. sponsored ADR | 10.7 |
| General Motors Co. | 8.7 |
| Honda Motor Co. Ltd. sponsored ADR | 5.4 |
| O'Reilly Automotive, Inc. | 4.5 |
| Aptiv PLC | 4.3 |
| Copart, Inc. | 4.1 |
| AutoZone, Inc. | 4.1 |
| BorgWarner, Inc. | 3.6 |
| Ferrari NV | 3.3 |
| | 60.5 |
Top Industries (% of fund's net assets)
| As of August 31, 2020 |
| | Automobiles | 47.8% |
| | Specialty Retail | 19.3% |
| | Auto Components | 15.9% |
| | Commercial Services & Supplies | 5.9% |
| | Distributors | 4.2% |
| | All Others* | 6.9% |
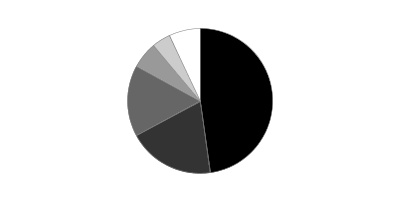
* Includes short-term investments and net other assets (liabilities).
Automotive Portfolio
Schedule of Investments August 31, 2020 (Unaudited)
Showing Percentage of Net Assets
| Common Stocks - 95.1% | | | |
| | | Shares | Value |
| Auto Components - 15.9% | | | |
| Auto Parts & Equipment - 15.9% | | | |
| Adient PLC (a) | | 36,234 | $628,298 |
| Aptiv PLC | | 27,440 | 2,363,133 |
| Autoliv, Inc. | | 2,793 | 218,804 |
| BorgWarner, Inc. | | 49,006 | 1,989,154 |
| Gentex Corp. | | 36,991 | 1,000,607 |
| Lear Corp. | | 13,350 | 1,520,966 |
| Magna International, Inc. Class A (sub. vtg.) | | 19,738 | 961,213 |
| | | | 8,682,175 |
| Automobiles - 46.8% | | | |
| Automobile Manufacturers - 46.2% | | | |
| Ferrari NV (b) | | 9,320 | 1,815,070 |
| Fiat Chrysler Automobiles NV (b) | | 57,484 | 634,049 |
| Ford Motor Co. | | 213,891 | 1,458,737 |
| General Motors Co. | | 159,883 | 4,737,333 |
| Honda Motor Co. Ltd. sponsored ADR | | 116,103 | 2,969,915 |
| Li Auto, Inc. ADR (a)(b) | | 700 | 11,410 |
| NIO, Inc. sponsored ADR (a)(b) | | 66,299 | 1,261,670 |
| Tesla, Inc. (a) | | 12,985 | 6,470,682 |
| Toyota Motor Corp. sponsored ADR | | 44,035 | 5,831,555 |
| XPeng, Inc. ADR (a) | | 3,900 | 79,950 |
| | | | 25,270,371 |
| Motorcycle Manufacturers - 0.6% | | | |
| Harley-Davidson, Inc. | | 11,100 | 307,581 |
|
| TOTAL AUTOMOBILES | | | 25,577,952 |
|
| Commercial Services & Supplies - 5.9% | | | |
| Diversified Support Services - 5.9% | | | |
| Copart, Inc. (a) | | 21,669 | 2,238,841 |
| IAA Spinco, Inc. (a) | | 17,416 | 911,205 |
| KAR Auction Services, Inc. | | 6,088 | 105,566 |
| | | | 3,255,612 |
| Distributors - 4.2% | | | |
| Distributors - 4.2% | | | |
| Genuine Parts Co. | | 10,051 | 949,216 |
| LKQ Corp. (a) | | 42,296 | 1,342,475 |
| | | | 2,291,691 |
| Machinery - 0.9% | | | |
| Construction Machinery & Heavy Trucks - 0.9% | | | |
| Allison Transmission Holdings, Inc. | | 13,657 | 489,877 |
| Road & Rail - 2.1% | | | |
| Trucking - 2.1% | | | |
| Lyft, Inc. (a) | | 11,796 | 349,987 |
| Uber Technologies, Inc. (a) | | 24,387 | 820,135 |
| | | | 1,170,122 |
| Specialty Retail - 19.3% | | | |
| Automotive Retail - 19.3% | | | |
| Advance Auto Parts, Inc. | | 9,920 | 1,550,595 |
| AutoZone, Inc. (a) | | 1,857 | 2,221,548 |
| CarMax, Inc. (a)(b) | | 11,744 | 1,255,786 |
| Carvana Co. Class A (a)(b) | | 7,636 | 1,649,071 |
| Lithia Motors, Inc. Class A (sub. vtg.) | | 4,373 | 1,088,702 |
| O'Reilly Automotive, Inc. (a) | | 5,278 | 2,457,595 |
| Sonic Automotive, Inc. Class A (sub. vtg.) | | 7,200 | 304,272 |
| | | | 10,527,569 |
| TOTAL COMMON STOCKS | | | |
| (Cost $35,308,535) | | | 51,994,998 |
|
| Nonconvertible Preferred Stocks - 1.0% | | | |
| Automobiles - 1.0% | | | |
| Automobile Manufacturers - 1.0% | | | |
| Volkswagen AG | | | |
| (Cost $452,360) | | 3,167 | 526,613 |
|
| Money Market Funds - 7.9% | | | |
| Fidelity Cash Central Fund 0.12% (c) | | 1,144,586 | 1,144,815 |
| Fidelity Securities Lending Cash Central Fund 0.11% (c)(d) | | 3,158,044 | 3,158,360 |
| TOTAL MONEY MARKET FUNDS | | | |
| (Cost $4,303,175) | | | 4,303,175 |
| TOTAL INVESTMENT IN SECURITIES - 104.0% | | | |
| (Cost $40,064,070) | | | 56,824,786 |
| NET OTHER ASSETS (LIABILITIES) - (4.0)% | | | (2,165,380) |
| NET ASSETS - 100% | | | $54,659,406 |
Legend
(a) Non-income producing
(b) Security or a portion of the security is on loan at period end.
(c) Affiliated fund that is generally available only to investment companies and other accounts managed by Fidelity Investments. The rate quoted is the annualized seven-day yield of the fund at period end. A complete unaudited listing of the fund's holdings as of its most recent quarter end is available upon request. In addition, each Fidelity Central Fund's financial statements are available on the SEC's website or upon request.
(d) Investment made with cash collateral received from securities on loan.
Affiliated Central Funds
Information regarding fiscal year to date income earned by the Fund from investments in Fidelity Central Funds is as follows:
| Fund | Income earned |
| Fidelity Cash Central Fund | $287 |
| Fidelity Securities Lending Cash Central Fund | 3,400 |
| Total | $3,687 |
Amounts in the income column in the above table include any capital gain distributions from underlying funds, which are presented in the corresponding line-item in the Statement of Operations, if applicable. Amount for Fidelity Securities Lending Cash Central Fund represents the income earned on investing cash collateral, less rebates paid to borrowers and any lending agent fees associated with the loan, plus any premium payments received for lending certain types of securities.
The value, beginning of period, for the Fidelity Cash Central Fund was $535,945. Net realized gain (loss) and change in net unrealized appreciation (depreciation) was $110 and $0 respectively. Purchases and sales of the Fidelity Cash Central Fund were $17,519,399 and $14,896,874, respectively, during the period.
Investment Valuation
The following is a summary of the inputs used, as of August 31, 2020, involving the Fund's assets and liabilities carried at fair value. The inputs or methodology used for valuing securities may not be an indication of the risk associated with investing in those securities. For more information on valuation inputs, and their aggregation into the levels used below, please refer to the Investment Valuation section in the accompanying Notes to Financial Statements.
| | Valuation Inputs at Reporting Date: |
| Description | Total | Level 1 | Level 2 | Level 3 |
| Investments in Securities: | | | | |
| Common Stocks | $51,994,998 | $51,994,998 | $-- | $-- |
| Nonconvertible Preferred Stocks | 526,613 | 526,613 | -- | -- |
| Money Market Funds | 4,303,175 | 4,303,175 | -- | -- |
| Total Investments in Securities: | $56,824,786 | $56,824,786 | $-- | $-- |
Other Information
Distribution of investments by country or territory of incorporation, as a percentage of Total Net Assets, is as follows (Unaudited):
| United States of America | 68.7% |
| Japan | 16.1% |
| Netherlands | 4.5% |
| Bailiwick of Jersey | 4.3% |
| Cayman Islands | 2.4% |
| Canada | 1.8% |
| Ireland | 1.2% |
| Germany | 1.0% |
| | 100.0% |
See accompanying notes which are an integral part of the financial statements.
Automotive Portfolio
Financial Statements
Statement of Assets and Liabilities
| | | August 31, 2020 (Unaudited) |
| Assets | | |
Investment in securities, at value (including securities loaned of $3,070,526) — See accompanying schedule:
Unaffiliated issuers (cost $35,760,895) | $52,521,611 | |
| Fidelity Central Funds (cost $4,303,175) | 4,303,175 | |
| Total Investment in Securities (cost $40,064,070) | | $56,824,786 |
| Receivable for investments sold | | 4,980,115 |
| Receivable for fund shares sold | | 599,665 |
| Dividends receivable | | 37,083 |
| Distributions receivable from Fidelity Central Funds | | 1,287 |
| Prepaid expenses | | 396 |
| Other receivables | | 2,811 |
| Total assets | | 62,446,143 |
| Liabilities | | |
| Payable for investments purchased | $4,525,970 | |
| Payable for fund shares redeemed | 56,209 | |
| Accrued management fee | 20,940 | |
| Other affiliated payables | 9,089 | |
| Other payables and accrued expenses | 16,579 | |
| Collateral on securities loaned | 3,157,950 | |
| Total liabilities | | 7,786,737 |
| Net Assets | | $54,659,406 |
| Net Assets consist of: | | |
| Paid in capital | | $33,870,165 |
| Total accumulated earnings (loss) | | 20,789,241 |
| Net Assets | | $54,659,406 |
| Net Asset Value, offering price and redemption price per share ($54,659,406 ÷ 1,293,885 shares) | | $42.24 |
See accompanying notes which are an integral part of the financial statements.
Statement of Operations
| | | Six months ended August 31, 2020 (Unaudited) |
| Investment Income | | |
| Dividends | | $221,629 |
| Income from Fidelity Central Funds (including $3,400 from security lending) | | 3,687 |
| Total income | | 225,316 |
| Expenses | | |
| Management fee | $93,671 | |
| Transfer agent fees | 41,742 | |
| Accounting fees | 6,852 | |
| Custodian fees and expenses | 2,460 | |
| Independent trustees' fees and expenses | 109 | |
| Registration fees | 13,591 | |
| Audit | 17,653 | |
| Legal | 25 | |
| Miscellaneous | 1,014 | |
| Total expenses before reductions | 177,117 | |
| Expense reductions | (944) | |
| Total expenses after reductions | | 176,173 |
| Net investment income (loss) | | 49,143 |
| Realized and Unrealized Gain (Loss) | | |
| Net realized gain (loss) on: | | |
| Investment securities: | | |
| Unaffiliated issuers | 4,262,720 | |
| Fidelity Central Funds | (252) | |
| Foreign currency transactions | 706 | |
| Total net realized gain (loss) | | 4,263,174 |
| Change in net unrealized appreciation (depreciation) on: | | |
| Investment securities: | | |
| Unaffiliated issuers | 7,732,062 | |
| Assets and liabilities in foreign currencies | 153 | |
| Total change in net unrealized appreciation (depreciation) | | 7,732,215 |
| Net gain (loss) | | 11,995,389 |
| Net increase (decrease) in net assets resulting from operations | | $12,044,532 |
See accompanying notes which are an integral part of the financial statements.
Statement of Changes in Net Assets
| | Six months ended August 31, 2020 (Unaudited) | Year ended February 29, 2020 |
| Increase (Decrease) in Net Assets | | |
| Operations | | |
| Net investment income (loss) | $49,143 | $493,545 |
| Net realized gain (loss) | 4,263,174 | 4,080,200 |
| Change in net unrealized appreciation (depreciation) | 7,732,215 | (1,479,820) |
| Net increase (decrease) in net assets resulting from operations | 12,044,532 | 3,093,925 |
| Distributions to shareholders | (2,839,507) | (1,655,954) |
| Share transactions | | |
| Proceeds from sales of shares | 16,909,732 | 14,390,055 |
| Reinvestment of distributions | 2,689,399 | 1,571,589 |
| Cost of shares redeemed | (10,624,530) | (21,701,036) |
| Net increase (decrease) in net assets resulting from share transactions | 8,974,601 | (5,739,392) |
| Total increase (decrease) in net assets | 18,179,626 | (4,301,421) |
| Net Assets | | |
| Beginning of period | 36,479,780 | 40,781,201 |
| End of period | $54,659,406 | $36,479,780 |
| Other Information | | |
| Shares | | |
| Sold | 483,639 | 396,128 |
| Issued in reinvestment of distributions | 104,362 | 42,404 |
| Redeemed | (339,130) | (618,672) |
| Net increase (decrease) | 248,871 | (180,140) |
See accompanying notes which are an integral part of the financial statements.
Financial Highlights
Automotive Portfolio
| | Six months ended (Unaudited) August 31, | Years endedFebruary 28, | | | | |
| | 2020 | 2020 A | 2019 | 2018 | 2017 | 2016 A |
| Selected Per–Share Data | | | | | | |
| Net asset value, beginning of period | $34.91 | $33.29 | $37.52 | $36.78 | $33.72 | $48.82 |
| Income from Investment Operations | | | | | | |
| Net investment income (loss)B | .05 | .46C | .36 | .39D | .33 | .65 |
| Net realized and unrealized gain (loss) | 10.23 | 2.67E | (2.15) | 6.11 | 5.22 | (9.37) |
| Total from investment operations | 10.28 | 3.13 | (1.79) | 6.50 | 5.55 | (8.72) |
| Distributions from net investment income | – | (.49)F | (.38) | (.20) | (.52) | (.45) |
| Distributions from net realized gain | (2.95) | (1.02)F | (2.06) | (5.56) | (1.98) | (5.93) |
| Total distributions | (2.95) | (1.51) | (2.44) | (5.76) | (2.49)G | (6.38) |
| Redemption fees added to paid in capitalB | – | – | – | –H | –H | –H |
| Net asset value, end of period | $42.24 | $34.91 | $33.29 | $37.52 | $36.78 | $33.72 |
| Total ReturnI,J | 34.86% | 9.14%E | (4.66)% | 19.08% | 16.80% | (20.00)% |
| Ratios to Average Net AssetsK,L | | | | | | |
| Expenses before reductions | 1.00%M | 1.00% | .97% | .97% | .96% | .87% |
| Expenses net of fee waivers, if any | 1.00%M | 1.00% | .97% | .96% | .96% | .87% |
| Expenses net of all reductions | 1.00%M | .99% | .97% | .96% | .95% | .86% |
| Net investment income (loss) | .28%M | 1.33%C | 1.04% | 1.04%D | .92% | 1.49% |
| Supplemental Data | | | | | | |
| Net assets, end of period (000 omitted) | $54,659 | $36,480 | $40,781 | $56,139 | $54,069 | $65,745 |
| Portfolio turnover rateN | 64%M | 45% | 31% | 117% | 83% | 80% |
A For the year ended February 29.
B Calculated based on average shares outstanding during the period.
C Net investment income per share reflects a large, non-recurring dividend which amounted to $.09 per share. Excluding such non-recurring dividend, the ratio of net investment income (loss) to average net assets would have been 1.07%.
D Net investment income per share reflects a large, non-recurring dividend which amounted to $.08 per share. Excluding such non-recurring dividend, the ratio of net investment income (loss) to average net assets would have been .83%.
E Net realized and unrealized gain (loss) per share reflects proceeds received from litigation which amounted to $.19 per share. Excluding these litigation proceeds, the total return would have been 8.58%.
F The amounts shown reflect certain reclassifications related to book to tax differences that were made in the year shown.
G Total distributions of $2.49 per share is comprised of distributions from net investment income of $.515 and distributions from net realized gain of $1.975 per share.
H Amount represents less than $.005 per share.
I Total returns for periods of less than one year are not annualized.
J Total returns would have been lower if certain expenses had not been reduced during the applicable periods shown.
K Fees and expenses of any underlying mutual funds or exchange-traded funds (ETFs) are not included in the Fund's expense ratio. The Fund indirectly bears its proportionate share of these expenses. For additional expense information related to investments in Fidelity Central Funds, please refer to the "Investments in Fidelity Central Funds" note found in the Notes to Financial Statements section of the most recent Annual or Semi-Annual report.
L Expense ratios reflect operating expenses of the class. Expenses before reductions do not reflect amounts reimbursed, waived, or reduced through arrangements with the investment advisor, brokerage services, or other offset arrangements, if applicable, and do not represent the amount paid by the class during periods when reimbursements, waivers or reductions occur.
M Annualized
N Amount does not include the portfolio activity of any underlying Fidelity Central Funds.
See accompanying notes which are an integral part of the financial statements.
Communication Services Portfolio
Investment Summary (Unaudited)
Top Ten Stocks as of August 31, 2020
| | % of fund's net assets |
| Alphabet, Inc. Class A | 22.7 |
| Facebook, Inc. Class A | 20.3 |
| T-Mobile U.S., Inc. | 6.5 |
| Netflix, Inc. | 4.5 |
| The Walt Disney Co. | 4.3 |
| Activision Blizzard, Inc. | 4.2 |
| Liberty Broadband Corp. Class A | 4.1 |
| Liberty Global PLC Class C | 4.0 |
| Comcast Corp. Class A | 3.4 |
| Electronic Arts, Inc. | 2.6 |
| | 76.6 |
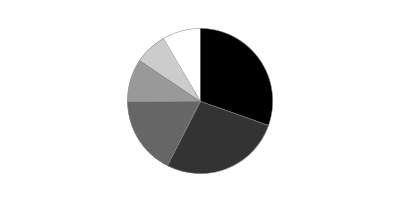
Top Industries (% of fund's net assets)
| As of August 31, 2020 |
| | Interactive Media & Services | 46.4% |
| | Entertainment | 21.2% |
| | Media | 12.6% |
| | Diversified Telecommunication Services | 8.1% |
| | Wireless Telecommunication Services | 7.5% |
| | All Others* | 4.2% |

* Includes short-term investments and net other assets (liabilities).
Communication Services Portfolio
Schedule of Investments August 31, 2020 (Unaudited)
Showing Percentage of Net Assets
| Common Stocks - 98.4% | | | |
| | | Shares | Value |
| Communications Equipment - 0.7% | | | |
| Communications Equipment - 0.7% | | | |
| EchoStar Holding Corp. Class A (a) | | 182,400 | $5,358,912 |
| Diversified Telecommunication Services - 8.1% | | | |
| Alternative Carriers - 6.3% | | | |
| GCI Liberty, Inc. (a) | | 145,032 | 11,715,685 |
| Liberty Global PLC Class C (a) | | 1,337,900 | 30,785,079 |
| Liberty Latin America Ltd. Class C (a) | | 211,100 | 2,013,894 |
| Vonage Holdings Corp. (a) | | 306,300 | 3,507,135 |
| | | | 48,021,793 |
| Integrated Telecommunication Services - 1.8% | | | |
| Verizon Communications, Inc. | | 230,900 | 13,685,443 |
|
| TOTAL DIVERSIFIED TELECOMMUNICATION SERVICES | | | 61,707,236 |
|
| Entertainment - 21.2% | | | |
| Interactive Home Entertainment - 10.9% | | | |
| Activision Blizzard, Inc. | | 386,900 | 32,313,888 |
| DouYu International Holdings Ltd. ADR (a) | | 628,065 | 10,513,808 |
| Electronic Arts, Inc. (a) | | 140,500 | 19,595,535 |
| Take-Two Interactive Software, Inc. (a) | | 94,700 | 16,211,693 |
| Zynga, Inc. (a) | | 500,800 | 4,537,248 |
| | | | 83,172,172 |
| Movies & Entertainment - 10.3% | | | |
| Lions Gate Entertainment Corp.: | | | |
| Class A (a)(b) | | 34,500 | 336,030 |
| Class B (a) | | 309,934 | 2,808,002 |
| Netflix, Inc. (a) | | 64,200 | 33,997,752 |
| Spotify Technology SA (a)(b) | | 7,600 | 2,144,416 |
| The Walt Disney Co. | | 245,971 | 32,436,196 |
| Warner Music Group Corp. Class A | | 99,800 | 2,960,068 |
| World Wrestling Entertainment, Inc. Class A | | 75,600 | 3,331,692 |
| | | | 78,014,156 |
|
| TOTAL ENTERTAINMENT | | | 161,186,328 |
|
| Interactive Media & Services - 46.4% | | | |
| Interactive Media & Services - 46.4% | | | |
| Alphabet, Inc. Class A (a) | | 105,900 | 172,567,227 |
| ANGI Homeservices, Inc. Class A (a)(b) | | 497,200 | 6,898,650 |
| Facebook, Inc. Class A (a) | | 528,200 | 154,868,240 |
| InterActiveCorp (a) | | 13,700 | 1,821,963 |
| Match Group, Inc. (a) | | 112,970 | 12,616,490 |
| Zillow Group, Inc. Class A (a) | | 57,700 | 4,920,656 |
| | | | 353,693,226 |
| Media - 12.6% | | | |
| Advertising - 0.0% | | | |
| S4 Capital PLC (a) | | 65,900 | 315,369 |
| Broadcasting - 4.0% | | | |
| Liberty Media Corp.: | | | |
| Liberty Media Class A (a) | | 177,962 | 6,438,665 |
| Liberty SiriusXM Series A (a) | | 218,200 | 7,922,842 |
| Liberty SiriusXM Series C (a) | | 19,870 | 715,221 |
| Nexstar Broadcasting Group, Inc. Class A | | 41,400 | 3,974,814 |
| Sinclair Broadcast Group, Inc. Class A | | 14,400 | 299,664 |
| ViacomCBS, Inc. Class B | | 387,800 | 10,800,230 |
| | | | 30,151,436 |
| Cable & Satellite - 8.6% | | | |
| Altice U.S.A., Inc. Class A (a) | | 132,500 | 3,654,350 |
| Comcast Corp. Class A | | 577,300 | 25,868,813 |
| DISH Network Corp. Class A (a) | | 120,339 | 4,274,441 |
| Liberty Broadband Corp. Class A (a) | | 228,623 | 31,593,412 |
| | | | 65,391,016 |
|
| TOTAL MEDIA | | | 95,857,821 |
|
| Road & Rail - 1.9% | | | |
| Trucking - 1.9% | | | |
| Lyft, Inc. (a)(b) | | 485,200 | 14,395,884 |
| Wireless Telecommunication Services - 7.5% | | | |
| Wireless Telecommunication Services - 7.5% | | | |
| Millicom International Cellular SA | | 245,300 | 7,248,615 |
| T-Mobile U.S., Inc. | | 425,050 | 49,594,834 |
| | | | 56,843,449 |
| TOTAL COMMON STOCKS | | | |
| (Cost $474,763,266) | | | 749,042,856 |
|
| Money Market Funds - 4.3% | | | |
| Fidelity Cash Central Fund 0.12% (c) | | 9,093,729 | 9,095,547 |
| Fidelity Securities Lending Cash Central Fund 0.11% (c)(d) | | 23,853,259 | 23,855,644 |
| TOTAL MONEY MARKET FUNDS | | | |
| (Cost $32,951,427) | | | 32,951,191 |
| TOTAL INVESTMENT IN SECURITIES - 102.7% | | | |
| (Cost $507,714,693) | | | 781,994,047 |
| NET OTHER ASSETS (LIABILITIES) - (2.7)% | | | (20,498,543) |
| NET ASSETS - 100% | | | $761,495,504 |
Legend
(a) Non-income producing
(b) Security or a portion of the security is on loan at period end.
(c) Affiliated fund that is generally available only to investment companies and other accounts managed by Fidelity Investments. The rate quoted is the annualized seven-day yield of the fund at period end. A complete unaudited listing of the fund's holdings as of its most recent quarter end is available upon request. In addition, each Fidelity Central Fund's financial statements are available on the SEC's website or upon request.
(d) Investment made with cash collateral received from securities on loan.
Affiliated Central Funds
Information regarding fiscal year to date income earned by the Fund from investments in Fidelity Central Funds is as follows:
| Fund | Income earned |
| Fidelity Cash Central Fund | $4,787 |
| Fidelity Securities Lending Cash Central Fund | 224,614 |
| Total | $229,401 |
Amounts in the income column in the above table include any capital gain distributions from underlying funds, which are presented in the corresponding line-item in the Statement of Operations, if applicable. Amount for Fidelity Securities Lending Cash Central Fund represents the income earned on investing cash collateral, less rebates paid to borrowers and any lending agent fees associated with the loan, plus any premium payments received for lending certain types of securities.
Investment Valuation
The following is a summary of the inputs used, as of August 31, 2020, involving the Fund's assets and liabilities carried at fair value. The inputs or methodology used for valuing securities may not be an indication of the risk associated with investing in those securities. For more information on valuation inputs, and their aggregation into the levels used below, please refer to the Investment Valuation section in the accompanying Notes to Financial Statements.
| | Valuation Inputs at Reporting Date: |
| Description | Total | Level 1 | Level 2 | Level 3 |
| Investments in Securities: | | | | |
| Common Stocks | $749,042,856 | $749,042,856 | $-- | $-- |
| Money Market Funds | 32,951,191 | 32,951,191 | -- | -- |
| Total Investments in Securities: | $781,994,047 | $781,994,047 | $-- | $-- |
See accompanying notes which are an integral part of the financial statements.
Communication Services Portfolio
Financial Statements
Statement of Assets and Liabilities
| | | August 31, 2020 (Unaudited) |
| Assets | | |
Investment in securities, at value (including securities loaned of $22,776,389) — See accompanying schedule:
Unaffiliated issuers (cost $474,763,266) | $749,042,856 | |
| Fidelity Central Funds (cost $32,951,427) | 32,951,191 | |
| Total Investment in Securities (cost $507,714,693) | | $781,994,047 |
| Receivable for investments sold | | 3,865,609 |
| Receivable for fund shares sold | | 1,861,842 |
| Dividends receivable | | 14,856 |
| Distributions receivable from Fidelity Central Funds | | 13,802 |
| Prepaid expenses | | 4,299 |
| Other receivables | | 14,246 |
| Total assets | | 787,768,701 |
| Liabilities | | |
| Payable for fund shares redeemed | 1,945,505 | |
| Accrued management fee | 321,896 | |
| Distribution and service plan fees payable | 8,791 | |
| Other affiliated payables | 121,976 | |
| Other payables and accrued expenses | 20,279 | |
| Collateral on securities loaned | 23,854,750 | |
| Total liabilities | | 26,273,197 |
| Net Assets | | $761,495,504 |
| Net Assets consist of: | | |
| Paid in capital | | $489,887,784 |
| Total accumulated earnings (loss) | | 271,607,720 |
| Net Assets | | $761,495,504 |
| Net Asset Value and Maximum Offering Price | | |
| Class A: | | |
| Net Asset Value and redemption price per share ($20,278,399 ÷ 266,478 shares)(a) | | $76.10 |
| Maximum offering price per share (100/94.25 of $76.10) | | $80.74 |
| Class M: | | |
| Net Asset Value and redemption price per share ($4,669,666 ÷ 61,550 shares)(a) | | $75.87 |
| Maximum offering price per share (100/96.50 of $75.87) | | $78.62 |
| Class C: | | |
| Net Asset Value and offering price per share ($4,002,613 ÷ 53,170 shares)(a) | | $75.28 |
| Communication Services: | | |
| Net Asset Value, offering price and redemption price per share ($704,893,257 ÷ 9,218,439 shares) | | $76.47 |
| Class I: | | |
| Net Asset Value, offering price and redemption price per share ($17,628,039 ÷ 230,565 shares) | | $76.46 |
| Class Z: | | |
| Net Asset Value, offering price and redemption price per share ($10,023,530 ÷ 130,930 shares) | | $76.56 |
(a) Redemption price per share is equal to net asset value less any applicable contingent deferred sales charge.
See accompanying notes which are an integral part of the financial statements.
Statement of Operations
| | | Six months ended August 31, 2020 (Unaudited) |
| Investment Income | | |
| Dividends | | $1,053,922 |
| Income from Fidelity Central Funds (including $224,614 from security lending) | | 229,401 |
| Total income | | 1,283,323 |
| Expenses | | |
| Management fee | $1,647,190 | |
| Transfer agent fees | 566,703 | |
| Distribution and service plan fees | 36,681 | |
| Accounting fees | 113,671 | |
| Custodian fees and expenses | 3,160 | |
| Independent trustees' fees and expenses | 1,924 | |
| Registration fees | 54,872 | |
| Audit | 20,791 | |
| Legal | 432 | |
| Interest | 69 | |
| Miscellaneous | 12,701 | |
| Total expenses before reductions | 2,458,194 | |
| Expense reductions | (30,161) | |
| Total expenses after reductions | | 2,428,033 |
| Net investment income (loss) | | (1,144,710) |
| Realized and Unrealized Gain (Loss) | | |
| Net realized gain (loss) on: | | |
| Investment securities: | | |
| Unaffiliated issuers | 1,349,575 | |
| Fidelity Central Funds | (1,480) | |
| Foreign currency transactions | (1,498) | |
| Total net realized gain (loss) | | 1,346,597 |
| Change in net unrealized appreciation (depreciation) on: | | |
| Investment securities: | | |
| Unaffiliated issuers | 164,497,429 | |
| Fidelity Central Funds | (236) | |
| Total change in net unrealized appreciation (depreciation) | | 164,497,193 |
| Net gain (loss) | | 165,843,790 |
| Net increase (decrease) in net assets resulting from operations | | $164,699,080 |
See accompanying notes which are an integral part of the financial statements.
Statement of Changes in Net Assets
| | Six months ended August 31, 2020 (Unaudited) | Year ended February 29, 2020 |
| Increase (Decrease) in Net Assets | | |
| Operations | | |
| Net investment income (loss) | $(1,144,710) | $(1,158,013) |
| Net realized gain (loss) | 1,346,597 | 57,254,598 |
| Change in net unrealized appreciation (depreciation) | 164,497,193 | 13,008,631 |
| Net increase (decrease) in net assets resulting from operations | 164,699,080 | 69,105,216 |
| Distributions to shareholders | (13,180,711) | (180,128,842) |
| Share transactions - net increase (decrease) | 14,301,887 | 141,718,647 |
| Total increase (decrease) in net assets | 165,820,256 | 30,695,021 |
| Net Assets | | |
| Beginning of period | 595,675,248 | 564,980,227 |
| End of period | $761,495,504 | $595,675,248 |
See accompanying notes which are an integral part of the financial statements.
Financial Highlights
Communication Services Portfolio Class A
| | Six months ended (Unaudited) August 31, | Years endedFebruary 28, | |
| | 2020 | 2020 A | 2019 B |
| Selected Per–Share Data | | | |
| Net asset value, beginning of period | $60.63 | $74.84 | $78.20 |
| Income from Investment Operations | | | |
| Net investment income (loss)C | (.21) | (.30) | (.12) |
| Net realized and unrealized gain (loss) | 17.08 | 8.78 | 2.68 |
| Total from investment operations | 16.87 | 8.48 | 2.56 |
| Distributions from net investment income | – | – | (.14) |
| Distributions from net realized gain | (1.40) | (22.69) | (5.77) |
| Total distributions | (1.40) | (22.69) | (5.91) |
| Net asset value, end of period | $76.10 | $60.63 | $74.85 |
| Total ReturnD,E,F | 28.77% | 11.90% | 3.83% |
| Ratios to Average Net AssetsG,H | | | |
| Expenses before reductions | 1.09%I | 1.07% | 1.13%I |
| Expenses net of fee waivers, if any | 1.09%I | 1.07% | 1.12%I |
| Expenses net of all reductions | 1.08%I | 1.06% | 1.11%I |
| Net investment income (loss) | (.67)%I | (.47)% | (.68)%I |
| Supplemental Data | | | |
| Net assets, end of period (000 omitted) | $20,278 | $9,947 | $715 |
| Portfolio turnover rateJ | 55%I | 73% | 107% |
A For the year ended February 29.
B For the period November 30, 2018 (commencement of sale of shares) to February 28, 2019.
C Calculated based on average shares outstanding during the period.
D Total returns for periods of less than one year are not annualized.
E Total returns would have been lower if certain expenses had not been reduced during the applicable periods shown.
F Total returns do not include the effect of the sales charges.
G Fees and expenses of any underlying mutual funds or exchange-traded funds (ETFs) are not included in the Fund's expense ratio. The Fund indirectly bears its proportionate share of these expenses. For additional expense information related to investments in Fidelity Central Funds, please refer to the "Investments in Fidelity Central Funds" note found in the Notes to Financial Statements section of the most recent Annual or Semi-Annual report.
H Expense ratios reflect operating expenses of the class. Expenses before reductions do not reflect amounts reimbursed, waived, or reduced through arrangements with the investment adviser, brokerage services, or other offset arrangements, if applicable, and do not represent the amount paid by the class during periods when reimbursements, waivers or reductions occur.
I Annualized
J Amount does not include the portfolio activity of any underlying Fidelity Central Funds.
See accompanying notes which are an integral part of the financial statements.
Communication Services Portfolio Class M
| | Six months ended (Unaudited) August 31, | Years endedFebruary 28, | |
| | 2020 | 2020 A | 2019 B |
| Selected Per–Share Data | | | |
| Net asset value, beginning of period | $60.52 | $74.82 | $78.20 |
| Income from Investment Operations | | | |
| Net investment income (loss)C | (.29) | (.48) | (.16) |
| Net realized and unrealized gain (loss) | 17.04 | 8.75 | 2.67 |
| Total from investment operations | 16.75 | 8.27 | 2.51 |
| Distributions from net investment income | – | – | (.12) |
| Distributions from net realized gain | (1.40) | (22.57) | (5.77) |
| Total distributions | (1.40) | (22.57) | (5.89) |
| Net asset value, end of period | $75.87 | $60.52 | $74.82 |
| Total ReturnD,E,F | 28.62% | 11.58% | 3.76% |
| Ratios to Average Net AssetsG,H | | | |
| Expenses before reductions | 1.34%I | 1.35% | 1.36%I |
| Expenses net of fee waivers, if any | 1.34%I | 1.35% | 1.35%I |
| Expenses net of all reductions | 1.33%I | 1.34% | 1.34%I |
| Net investment income (loss) | (.92)%I | (.75)% | (.90)%I |
| Supplemental Data | | | |
| Net assets, end of period (000 omitted) | $4,670 | $2,264 | $485 |
| Portfolio turnover rateJ | 55%I | 73% | 107% |
A For the year ended February 29.
B For the period November 30, 2018 (commencement of sale of shares) to February 28, 2019.
C Calculated based on average shares outstanding during the period.
D Total returns for periods of less than one year are not annualized.
E Total returns would have been lower if certain expenses had not been reduced during the applicable periods shown.
F Total returns do not include the effect of the sales charges.
G Fees and expenses of any underlying mutual funds or exchange-traded funds (ETFs) are not included in the Fund's expense ratio. The Fund indirectly bears its proportionate share of these expenses. For additional expense information related to investments in Fidelity Central Funds, please refer to the "Investments in Fidelity Central Funds" note found in the Notes to Financial Statements section of the most recent Annual or Semi-Annual report.
H Expense ratios reflect operating expenses of the class. Expenses before reductions do not reflect amounts reimbursed, waived, or reduced through arrangements with the investment adviser, brokerage services, or other offset arrangements, if applicable, and do not represent the amount paid by the class during periods when reimbursements, waivers or reductions occur.
I Annualized
J Amount does not include the portfolio activity of any underlying Fidelity Central Funds.
See accompanying notes which are an integral part of the financial statements.
Communication Services Portfolio Class C
| | Six months ended (Unaudited) August 31, | Years endedFebruary 28, | |
| | 2020 | 2020 A | 2019 B |
| Selected Per–Share Data | | | |
| Net asset value, beginning of period | $60.20 | $74.76 | $78.20 |
| Income from Investment Operations | | | |
| Net investment income (loss)C | (.43) | (.81) | (.25) |
| Net realized and unrealized gain (loss) | 16.91 | 8.74 | 2.67 |
| Total from investment operations | 16.48 | 7.93 | 2.42 |
| Distributions from net investment income | – | – | (.09) |
| Distributions from net realized gain | (1.40) | (22.49) | (5.77) |
| Total distributions | (1.40) | (22.49) | (5.86) |
| Net asset value, end of period | $75.28 | $60.20 | $74.76 |
| Total ReturnD,E,F | 28.32% | 11.01% | 3.63% |
| Ratios to Average Net AssetsG,H | | | |
| Expenses before reductions | 1.79%I | 1.86% | 1.87%I |
| Expenses net of fee waivers, if any | 1.79%I | 1.86% | 1.85%I |
| Expenses net of all reductions | 1.78%I | 1.85% | 1.84%I |
| Net investment income (loss) | (1.36)%I | (1.26)% | (1.37)%I |
| Supplemental Data | | | |
| Net assets, end of period (000 omitted) | $4,003 | $1,982 | $377 |
| Portfolio turnover rateJ | 55%I | 73% | 107% |
A For the year ended February 29.
B For the period November 30, 2018 (commencement of sale of shares) to February 28, 2019.
C Calculated based on average shares outstanding during the period.
D Total returns for periods of less than one year are not annualized.
E Total returns would have been lower if certain expenses had not been reduced during the applicable periods shown.
F Total returns do not include the effect of the contingent deferred sales charge.
G Fees and expenses of any underlying mutual funds or exchange-traded funds (ETFs) are not included in the Fund's expense ratio. The Fund indirectly bears its proportionate share of these expenses. For additional expense information related to investments in Fidelity Central Funds, please refer to the "Investments in Fidelity Central Funds" note found in the Notes to Financial Statements section of the most recent Annual or Semi-Annual report.
H Expense ratios reflect operating expenses of the class. Expenses before reductions do not reflect amounts reimbursed, waived, or reduced through arrangements with the investment adviser, brokerage services, or other offset arrangements, if applicable, and do not represent the amount paid by the class during periods when reimbursements, waivers or reductions occur.
I Annualized
J Amount does not include the portfolio activity of any underlying Fidelity Central Funds.
See accompanying notes which are an integral part of the financial statements.
Communication Services Portfolio
| | Six months ended (Unaudited) August 31, | Years endedFebruary 28, | | | | |
| | 2020 | 2020 A | 2019 | 2018 | 2017 | 2016 A |
| Selected Per–Share Data | | | | | | |
| Net asset value, beginning of period | $60.82 | $74.88 | $79.70 | $80.75 | $68.59 | $82.48 |
| Income from Investment Operations | | | | | | |
| Net investment income (loss)B | (.11) | (.12) | .13 | .21 | .22 | .27 |
| Net realized and unrealized gain (loss) | 17.16 | 8.79 | 5.31 | 3.14 | 17.53 | (8.82) |
| Total from investment operations | 17.05 | 8.67 | 5.44 | 3.35 | 17.75 | (8.55) |
| Distributions from net investment income | – | – | (.20) | (.16) | (.33) | (.23) |
| Distributions from net realized gain | (1.40) | (22.73) | (10.06) | (4.23) | (5.26) | (5.12) |
| Total distributions | (1.40) | (22.73) | (10.26) | (4.40)C | (5.59) | (5.34)D |
| Redemption fees added to paid in capitalB | – | – | – | –E | –E | –E |
| Net asset value, end of period | $76.47 | $60.82 | $74.88 | $79.70 | $80.75 | $68.59 |
| Total ReturnF,G | 28.98% | 12.22% | 8.12% | 4.16% | 26.85% | (10.88)% |
| Ratios to Average Net AssetsH,I | | | | | | |
| Expenses before reductions | .78%J | .78% | .82% | .80% | .82% | .81% |
| Expenses net of fee waivers, if any | .78%J | .78% | .81% | .80% | .82% | .81% |
| Expenses net of all reductions | .77%J | .77% | .80% | .79% | .82% | .80% |
| Net investment income (loss) | (.36)%J | (.18)% | .17% | .26% | .30% | .34% |
| Supplemental Data | | | | | | |
| Net assets, end of period (000 omitted) | $704,893 | $577,157 | $562,422 | $509,375 | $680,392 | $576,118 |
| Portfolio turnover rateK | 55%J | 73% | 107% | 22% | 33% | 42% |
A For the year ended February 29.
B Calculated based on average shares outstanding during the period.
C Total distributions of $4.40 per share is comprised of distributions from net investment income of $.163 and distributions from net realized gain of $4.233 per share.
D Total distributions of $5.34 per share is comprised of distributions from net investment income of $.227 and distributions from net realized gain of $5.115 per share.
E Amount represents less than $.005 per share.
F Total returns for periods of less than one year are not annualized.
G Total returns would have been lower if certain expenses had not been reduced during the applicable periods shown.
H Fees and expenses of any underlying mutual funds or exchange-traded funds (ETFs) are not included in the Fund's expense ratio. The Fund indirectly bears its proportionate share of these expenses. For additional expense information related to investments in Fidelity Central Funds, please refer to the "Investments in Fidelity Central Funds" note found in the Notes to Financial Statements section of the most recent Annual or Semi-Annual report.
I Expense ratios reflect operating expenses of the class. Expenses before reductions do not reflect amounts reimbursed, waived, or reduced through arrangements with the investment adviser, brokerage services, or other offset arrangements, if applicable, and do not represent the amount paid by the class during periods when reimbursements, waivers or reductions occur.
J Annualized
K Amount does not include the portfolio activity of any underlying Fidelity Central Funds.
See accompanying notes which are an integral part of the financial statements.
Communication Services Portfolio Class I
| | Six months ended (Unaudited) August 31, | Years endedFebruary 28, | |
| | 2020 | 2020 A | 2019 B |
| Selected Per–Share Data | | | |
| Net asset value, beginning of period | $60.80 | $74.88 | $78.20 |
| Income from Investment Operations | | | |
| Net investment income (loss)C | (.11) | (.11) | (.06) |
| Net realized and unrealized gain (loss) | 17.17 | 8.79 | 2.67 |
| Total from investment operations | 17.06 | 8.68 | 2.61 |
| Distributions from net investment income | – | – | (.15) |
| Distributions from net realized gain | (1.40) | (22.76) | (5.77) |
| Total distributions | (1.40) | (22.76) | (5.92) |
| Net asset value, end of period | $76.46 | $60.80 | $74.89 |
| Total ReturnD,E | 29.01% | 12.22% | 3.91% |
| Ratios to Average Net AssetsF,G | | | |
| Expenses before reductions | .76%H | .77% | .70%H |
| Expenses net of fee waivers, if any | .76%H | .77% | .69%H |
| Expenses net of all reductions | .75%H | .76% | .68%H |
| Net investment income (loss) | (.34)%H | (.17)% | (.30)%H |
| Supplemental Data | | | |
| Net assets, end of period (000 omitted) | $17,628 | $2,493 | $452 |
| Portfolio turnover rateI | 55%H | 73% | 107% |
A For the year ended February 29.
B For the period November 30, 2018 (commencement of sale of shares) to February 28, 2019.
C Calculated based on average shares outstanding during the period.
D Total returns for periods of less than one year are not annualized.
E Total returns would have been lower if certain expenses had not been reduced during the applicable periods shown.
F Fees and expenses of any underlying mutual funds or exchange-traded funds (ETFs) are not included in the Fund's expense ratio. The Fund indirectly bears its proportionate share of these expenses. For additional expense information related to investments in Fidelity Central Funds, please refer to the "Investments in Fidelity Central Funds" note found in the Notes to Financial Statements section of the most recent Annual or Semi-Annual report.
G Expense ratios reflect operating expenses of the class. Expenses before reductions do not reflect amounts reimbursed, waived, or reduced through arrangements with the investment adviser, brokerage services, or other offset arrangements, if applicable, and do not represent the amount paid by the class during periods when reimbursements, waivers or reductions occur.
H Annualized
I Amount does not include the portfolio activity of any underlying Fidelity Central Funds.
See accompanying notes which are an integral part of the financial statements.
Communication Services Portfolio Class Z
| | Six months ended (Unaudited) August 31, | Years endedFebruary 28, | |
| | 2020 | 2020 A | 2019 B |
| Selected Per–Share Data | | | |
| Net asset value, beginning of period | $60.85 | $74.89 | $78.20 |
| Income from Investment Operations | | | |
| Net investment income (loss)C | (.07) | (.03) | (.03) |
| Net realized and unrealized gain (loss) | 17.18 | 8.80 | 2.65 |
| Total from investment operations | 17.11 | 8.77 | 2.62 |
| Distributions from net investment income | – | – | (.16) |
| Distributions from net realized gain | (1.40) | (22.81) | (5.77) |
| Total distributions | (1.40) | (22.81) | (5.93) |
| Net asset value, end of period | $76.56 | $60.85 | $74.89 |
| Total ReturnD,E | 29.07% | 12.38% | 3.92% |
| Ratios to Average Net AssetsF,G | | | |
| Expenses before reductions | .64%H | .65% | .64%H |
| Expenses net of fee waivers, if any | .64%H | .65% | .62%H |
| Expenses net of all reductions | .63%H | .64% | .61%H |
| Net investment income (loss) | (.22)%H | (.05)% | (.16)%H |
| Supplemental Data | | | |
| Net assets, end of period (000 omitted) | $10,024 | $1,833 | $529 |
| Portfolio turnover rateI | 55%H | 73% | 107% |
A For the year ended February 29.
B For the period November 30, 2018 (commencement of sale of shares) to February 28, 2019.
C Calculated based on average shares outstanding during the period.
D Total returns for periods of less than one year are not annualized.
E Total returns would have been lower if certain expenses had not been reduced during the applicable periods shown.
F Fees and expenses of any underlying mutual funds or exchange-traded funds (ETFs) are not included in the Fund's expense ratio. The Fund indirectly bears its proportionate share of these expenses. For additional expense information related to investments in Fidelity Central Funds, please refer to the "Investments in Fidelity Central Funds" note found in the Notes to Financial Statements section of the most recent Annual or Semi-Annual report.
G Expense ratios reflect operating expenses of the class. Expenses before reductions do not reflect amounts reimbursed, waived, or reduced through arrangements with the investment adviser, brokerage services, or other offset arrangements, if applicable, and do not represent the amount paid by the class during periods when reimbursements, waivers or reductions occur.
H Annualized
I Amount does not include the portfolio activity of any underlying Fidelity Central Funds.
See accompanying notes which are an integral part of the financial statements.
Construction and Housing Portfolio
Investment Summary (Unaudited)
Top Ten Stocks as of August 31, 2020
| | % of fund's net assets |
| Lowe's Companies, Inc. | 17.7 |
| The Home Depot, Inc. | 16.4 |
| Equity Residential (SBI) | 6.0 |
| Johnson Controls International PLC | 5.6 |
| Welltower, Inc. | 3.7 |
| D.R. Horton, Inc. | 3.4 |
| Toll Brothers, Inc. | 3.0 |
| Vulcan Materials Co. | 2.9 |
| Essex Property Trust, Inc. | 2.8 |
| Invitation Homes, Inc. | 2.5 |
| | 64.0 |
Top Industries (% of fund's net assets)
| As of August 31, 2020 |
| | Specialty Retail | 34.1% |
| | Building Products | 17.1% |
| | Equity Real Estate Investment Trusts (Reits) | 16.4% |
| | Household Durables | 13.5% |
| | Construction & Engineering | 6.9% |
| | All Others* | 12.0% |

* Includes short-term investments and net other assets (liabilities).
Construction and Housing Portfolio
Schedule of Investments August 31, 2020 (Unaudited)
Showing Percentage of Net Assets
| Common Stocks - 99.5% | | | |
| | | Shares | Value |
| Building Products - 17.1% | | | |
| Building Products - 17.1% | | | |
| Allegion PLC | | 68,231 | $7,054,403 |
| Carrier Global Corp. | | 127,900 | 3,817,815 |
| Fortune Brands Home & Security, Inc. | | 89,487 | 7,524,067 |
| Johnson Controls International PLC | | 440,251 | 17,931,423 |
| Patrick Industries, Inc. | | 31,805 | 1,787,759 |
| Resideo Technologies, Inc. (a) | | 112,900 | 1,508,344 |
| The AZEK Co., Inc. | | 79,400 | 3,134,712 |
| Trane Technologies PLC | | 57,500 | 6,807,425 |
| Ufp Industries, Inc. | | 83,107 | 4,932,400 |
| | | | 54,498,348 |
| Commercial Services & Supplies - 0.4% | | | |
| Environmental & Facility Services - 0.4% | | | |
| ABM Industries, Inc. | | 33,097 | 1,262,320 |
| Construction & Engineering - 6.9% | | | |
| Construction & Engineering - 6.9% | | | |
| Comfort Systems U.S.A., Inc. | | 49,429 | 2,504,567 |
| Construction Partners, Inc. Class A (a) | | 108,907 | 2,035,472 |
| Dycom Industries, Inc. (a) | | 50,454 | 3,103,426 |
| EMCOR Group, Inc. | | 40,370 | 3,028,154 |
| Granite Construction, Inc. | | 44,418 | 825,731 |
| Quanta Services, Inc. | | 89,799 | 4,602,199 |
| Willscot Mobile Mini Holdings (a) | | 329,950 | 5,906,105 |
| | | | 22,005,654 |
| Construction Materials - 4.0% | | | |
| Construction Materials - 4.0% | | | |
| Forterra, Inc. (a) | | 60,780 | 805,335 |
| Summit Materials, Inc. (a) | | 183,814 | 2,736,990 |
| Vulcan Materials Co. | | 77,476 | 9,297,120 |
| | | | 12,839,445 |
| Electrical Equipment - 0.9% | | | |
| Electrical Components & Equipment - 0.9% | | | |
| Atkore International Group, Inc. (a) | | 111,401 | 2,977,749 |
| Equity Real Estate Investment Trusts (REITs) - 16.4% | | | |
| Health Care REITs - 3.7% | | | |
| Welltower, Inc. | | 202,700 | 11,659,304 |
| Hotel & Resort REITs - 0.8% | | | |
| MGM Growth Properties LLC | | 96,816 | 2,717,625 |
| Residential REITs - 11.9% | | | |
| Equity Lifestyle Properties, Inc. | | 27,703 | 1,836,432 |
| Equity Residential (SBI) | | 337,600 | 19,057,520 |
| Essex Property Trust, Inc. | | 40,972 | 8,870,848 |
| Invitation Homes, Inc. | | 283,900 | 8,128,057 |
| | | | 37,892,857 |
|
| TOTAL EQUITY REAL ESTATE INVESTMENT TRUSTS (REITS) | | | 52,269,786 |
|
| Household Durables - 13.5% | | | |
| Homebuilding - 13.5% | | | |
| Blu Investments LLC (b)(c) | | 11,990,913 | 3,717 |
| D.R. Horton, Inc. | | 149,956 | 10,702,360 |
| NVR, Inc. (a) | | 1,849 | 7,707,261 |
| PulteGroup, Inc. | | 144,785 | 6,455,963 |
| Skyline Champion Corp. (a) | | 70,113 | 2,001,025 |
| Taylor Morrison Home Corp. (a) | | 166,700 | 3,922,451 |
| Toll Brothers, Inc. | | 223,600 | 9,440,392 |
| TopBuild Corp. (a) | | 16,858 | 2,592,760 |
| | | | 42,825,929 |
| Paper & Forest Products - 0.7% | | | |
| Forest Products - 0.7% | | | |
| Louisiana-Pacific Corp. | | 66,541 | 2,191,861 |
| Real Estate Management & Development - 3.3% | | | |
| Diversified Real Estate Activities - 0.6% | | | |
| The RMR Group, Inc. | | 67,528 | 1,905,640 |
| Real Estate Development - 0.7% | | | |
| Howard Hughes Corp. (a) | | 37,700 | 2,228,447 |
| Real Estate Services - 2.0% | | | |
| CBRE Group, Inc. (a) | | 91,300 | 4,293,839 |
| Cushman & Wakefield PLC (a) | | 184,495 | 2,141,987 |
| | | | 6,435,826 |
|
| TOTAL REAL ESTATE MANAGEMENT & DEVELOPMENT | | | 10,569,913 |
|
| Specialty Retail - 34.1% | | | |
| Home Improvement Retail - 34.1% | | | |
| Lowe's Companies, Inc. | | 341,795 | 56,290,216 |
| The Home Depot, Inc. | | 183,190 | 52,216,478 |
| | | | 108,506,694 |
| Trading Companies & Distributors - 2.2% | | | |
| Trading Companies & Distributors - 2.2% | | | |
| Beacon Roofing Supply, Inc. (a) | | 86,803 | 2,941,754 |
| BMC Stock Holdings, Inc. (a) | | 99,700 | 3,980,024 |
| | | | 6,921,778 |
| TOTAL COMMON STOCKS | | | |
| (Cost $188,627,164) | | | 316,869,477 |
|
| Money Market Funds - 0.9% | | | |
| Fidelity Cash Central Fund 0.12% (d) | | | |
| (Cost $2,873,909) | | 2,873,334 | 2,873,909 |
| TOTAL INVESTMENT IN SECURITIES - 100.4% | | | |
| (Cost $191,501,073) | | | 319,743,386 |
| NET OTHER ASSETS (LIABILITIES) - (0.4)% | | | (1,197,914) |
| NET ASSETS - 100% | | | $318,545,472 |
Legend
(a) Non-income producing
(b) Restricted securities (including private placements) - Investment in securities not registered under the Securities Act of 1933 (excluding 144A issues). At the end of the period, the value of restricted securities (excluding 144A issues) amounted to $3,717 or 0.0% of net assets.
(c) Level 3 security
(d) Affiliated fund that is generally available only to investment companies and other accounts managed by Fidelity Investments. The rate quoted is the annualized seven-day yield of the fund at period end. A complete unaudited listing of the fund's holdings as of its most recent quarter end is available upon request. In addition, each Fidelity Central Fund's financial statements are available on the SEC's website or upon request.
Additional information on each restricted holding is as follows:
| Security | Acquisition Date | Acquisition Cost |
| Blu Investments LLC | 5/21/20 | $20,739 |
Affiliated Central Funds
Information regarding fiscal year to date income earned by the Fund from investments in Fidelity Central Funds is as follows:
| Fund | Income earned |
| Fidelity Cash Central Fund | $1,381 |
| Fidelity Securities Lending Cash Central Fund | 1,738 |
| Total | $3,119 |
Amounts in the income column in the above table include any capital gain distributions from underlying funds, which are presented in the corresponding line-item in the Statement of Operations, if applicable. Amount for Fidelity Securities Lending Cash Central Fund represents the income earned on investing cash collateral, less rebates paid to borrowers and any lending agent fees associated with the loan, plus any premium payments received for lending certain types of securities.
Investment Valuation
The following is a summary of the inputs used, as of August 31, 2020, involving the Fund's assets and liabilities carried at fair value. The inputs or methodology used for valuing securities may not be an indication of the risk associated with investing in those securities. For more information on valuation inputs, and their aggregation into the levels used below, please refer to the Investment Valuation section in the accompanying Notes to Financial Statements.
| | Valuation Inputs at Reporting Date: |
| Description | Total | Level 1 | Level 2 | Level 3 |
| Investments in Securities: | | | | |
| Common Stocks | $316,869,477 | $316,865,760 | $-- | $3,717 |
| Money Market Funds | 2,873,909 | 2,873,909 | -- | -- |
| Total Investments in Securities: | $319,743,386 | $319,739,669 | $-- | $3,717 |
Other Information
Distribution of investments by country or territory of incorporation, as a percentage of Total Net Assets, is as follows (Unaudited):
| United States of America | 89.4% |
| Ireland | 9.9% |
| Others (Individually Less Than 1%) | 0.7% |
| | 100.0% |
See accompanying notes which are an integral part of the financial statements.
Construction and Housing Portfolio
Financial Statements
Statement of Assets and Liabilities
| | | August 31, 2020 (Unaudited) |
| Assets | | |
Investment in securities, at value — See accompanying schedule:
Unaffiliated issuers (cost $188,627,164) | $316,869,477 | |
| Fidelity Central Funds (cost $2,873,909) | 2,873,909 | |
| Total Investment in Securities (cost $191,501,073) | | $319,743,386 |
| Cash | | 139 |
| Receivable for investments sold | | 64,785 |
| Receivable for fund shares sold | | 781,856 |
| Dividends receivable | | 75,985 |
| Distributions receivable from Fidelity Central Funds | | 400 |
| Prepaid expenses | | 2,474 |
| Other receivables | | 17,806 |
| Total assets | | 320,686,831 |
| Liabilities | | |
| Payable for investments purchased | $1,267,119 | |
| Payable for fund shares redeemed | 666,465 | |
| Accrued management fee | 135,720 | |
| Other affiliated payables | 52,410 | |
| Other payables and accrued expenses | 19,645 | |
| Total liabilities | | 2,141,359 |
| Net Assets | | $318,545,472 |
| Net Assets consist of: | | |
| Paid in capital | | $202,837,766 |
| Total accumulated earnings (loss) | | 115,707,706 |
| Net Assets | | $318,545,472 |
| Net Asset Value, offering price and redemption price per share ($318,545,472 ÷ 4,731,682 shares) | | $67.32 |
See accompanying notes which are an integral part of the financial statements.
Statement of Operations
| | | Six months ended August 31, 2020 (Unaudited) |
| Investment Income | | |
| Dividends | | $2,690,651 |
| Income from Fidelity Central Funds (including $1,738 from security lending) | | 3,119 |
| Total income | | 2,693,770 |
| Expenses | | |
| Management fee | $698,121 | |
| Transfer agent fees | 250,882 | |
| Accounting fees | 51,056 | |
| Custodian fees and expenses | 9,932 | |
| Independent trustees' fees and expenses | 907 | |
| Registration fees | 27,330 | |
| Audit | 17,391 | |
| Legal | 1,492 | |
| Interest | 1,551 | |
| Miscellaneous | 6,347 | |
| Total expenses before reductions | 1,065,009 | |
| Expense reductions | (46,673) | |
| Total expenses after reductions | | 1,018,336 |
| Net investment income (loss) | | 1,675,434 |
| Realized and Unrealized Gain (Loss) | | |
| Net realized gain (loss) on: | | |
| Investment securities: | | |
| Unaffiliated issuers | (12,318,415) | |
| Fidelity Central Funds | 119 | |
| Total net realized gain (loss) | | (12,318,296) |
| Change in net unrealized appreciation (depreciation) on investment securities | | 56,727,003 |
| Net gain (loss) | | 44,408,707 |
| Net increase (decrease) in net assets resulting from operations | | $46,084,141 |
See accompanying notes which are an integral part of the financial statements.
Statement of Changes in Net Assets
| | Six months ended August 31, 2020 (Unaudited) | Year ended February 29, 2020 |
| Increase (Decrease) in Net Assets | | |
| Operations | | |
| Net investment income (loss) | $1,675,434 | $2,713,972 |
| Net realized gain (loss) | (12,318,296) | 32,794,214 |
| Change in net unrealized appreciation (depreciation) | 56,727,003 | 3,334,280 |
| Net increase (decrease) in net assets resulting from operations | 46,084,141 | 38,842,466 |
| Distributions to shareholders | (13,100,539) | (24,490,216) |
| Share transactions | | |
| Proceeds from sales of shares | 57,177,433 | 299,727,079 |
| Reinvestment of distributions | 12,458,535 | 22,923,116 |
| Cost of shares redeemed | (102,979,469) | (243,352,371) |
| Net increase (decrease) in net assets resulting from share transactions | (33,343,501) | 79,297,824 |
| Total increase (decrease) in net assets | (359,899) | 93,650,074 |
| Net Assets | | |
| Beginning of period | 318,905,371 | 225,255,297 |
| End of period | $318,545,472 | $318,905,371 |
| Other Information | | |
| Shares | | |
| Sold | 976,030 | 4,813,223 |
| Issued in reinvestment of distributions | 270,192 | 383,278 |
| Redeemed | (1,960,078) | (3,905,073) |
| Net increase (decrease) | (713,856) | 1,291,428 |
See accompanying notes which are an integral part of the financial statements.
Financial Highlights
Construction and Housing Portfolio
| | Six months ended (Unaudited) August 31, | Years endedFebruary 28, | | | | |
| | 2020 | 2020 A | 2019 | 2018 | 2017 | 2016 A |
| Selected Per–Share Data | | | | | | |
| Net asset value, beginning of period | $58.56 | $54.22 | $59.88 | $61.70 | $53.16 | $59.74 |
| Income from Investment Operations | | | | | | |
| Net investment income (loss)B | .35 | .53 | .49 | .44 | .37 | .33 |
| Net realized and unrealized gain (loss) | 11.24 | 8.71 | 1.32 | 6.58 | 10.29 | (5.02) |
| Total from investment operations | 11.59 | 9.24 | 1.81 | 7.02 | 10.66 | (4.69) |
| Distributions from net investment income | – | (.60) | (.55) | (.30) | (.45) | (.23) |
| Distributions from net realized gain | (2.83) | (4.31) | (6.92) | (8.53) | (1.67) | (1.66) |
| Total distributions | (2.83) | (4.90)C | (7.47) | (8.84)D | (2.12) | (1.89) |
| Redemption fees added to paid in capitalB | – | – | – | –E | –E | –E |
| Net asset value, end of period | $67.32 | $58.56 | $54.22 | $59.88 | $61.70 | $53.16 |
| Total ReturnF,G | 22.02% | 17.10% | 4.03% | 11.07% | 20.23% | (8.11)% |
| Ratios to Average Net AssetsH,I | | | | | | |
| Expenses before reductions | .81%J | .79% | .80% | .80% | .80% | .81% |
| Expenses net of fee waivers, if any | .81%J | .79% | .80% | .80% | .80% | .80% |
| Expenses net of all reductions | .77%J | .79% | .79% | .79% | .79% | .80% |
| Net investment income (loss) | 1.27%J | .88% | .86% | .69% | .62% | .57% |
| Supplemental Data | | | | | | |
| Net assets, end of period (000 omitted) | $318,545 | $318,905 | $225,255 | $331,418 | $404,526 | $449,303 |
| Portfolio turnover rateK | 121%J | 161% | 90% | 56% | 87% | 80% |
A For the year ended February 29.
B Calculated based on average shares outstanding during the period.
C Total distributions of $4.90 per share is comprised of distributions from net investment income of $.598 and distributions from net realized gain of $4.306 per share.
D Total distributions of $8.84 per share is comprised of distributions from net investment income of $.303 and distributions from net realized gain of $8.534 per share.
E Amount represents less than $.005 per share.
F Total returns for periods of less than one year are not annualized.
G Total returns would have been lower if certain expenses had not been reduced during the applicable periods shown.
H Fees and expenses of any underlying mutual funds or exchange-traded funds (ETFs) are not included in the Fund's expense ratio. The Fund indirectly bears its proportionate share of these expenses. For additional expense information related to investments in Fidelity Central Funds, please refer to the "Investments in Fidelity Central Funds" note found in the Notes to Financial Statements section of the most recent Annual or Semi-Annual report.
I Expense ratios reflect operating expenses of the class. Expenses before reductions do not reflect amounts reimbursed, waived, or reduced through arrangements with the investment advisor, brokerage services, or other offset arrangements, if applicable, and do not represent the amount paid by the class during periods when reimbursements, waivers or reductions occur.
J Annualized
K Amount does not include the portfolio activity of any underlying Fidelity Central Funds.
See accompanying notes which are an integral part of the financial statements.
Consumer Discretionary Portfolio
Investment Summary (Unaudited)
Top Ten Stocks as of August 31, 2020
| | % of fund's net assets |
| Amazon.com, Inc. | 25.5 |
| The Home Depot, Inc. | 9.0 |
| Lowe's Companies, Inc. | 5.2 |
| NIKE, Inc. Class B | 4.1 |
| Starbucks Corp. | 3.8 |
| McDonald's Corp. | 3.8 |
| Dollar General Corp. | 2.9 |
| Burlington Stores, Inc. | 2.9 |
| TJX Companies, Inc. | 2.8 |
| Dollar Tree, Inc. | 2.4 |
| | 62.4 |
Top Industries (% of fund's net assets)
| As of August 31, 2020 |
| | Internet & Direct Marketing Retail | 30.4% |
| | Specialty Retail | 27.0% |
| | Hotels, Restaurants & Leisure | 17.4% |
| | Textiles, Apparel & Luxury Goods | 9.6% |
| | Multiline Retail | 7.1% |
| | All Others* | 8.5% |
* Includes short-term investments and net other assets (liabilities).
Consumer Discretionary Portfolio
Schedule of Investments August 31, 2020 (Unaudited)
Showing Percentage of Net Assets
| Common Stocks - 100.6% | | | |
| | | Shares | Value |
| Automobiles - 0.7% | | | |
| Automobile Manufacturers - 0.7% | | | |
| Ferrari NV | | 10,097 | $1,966,391 |
| Tesla, Inc. (a) | | 3,000 | 1,494,960 |
| | | | 3,461,351 |
| Commercial Services & Supplies - 0.3% | | | |
| Diversified Support Services - 0.3% | | | |
| Copart, Inc. (a) | | 13,858 | 1,431,809 |
| Diversified Consumer Services - 1.4% | | | |
| Education Services - 1.4% | | | |
| Bright Horizons Family Solutions, Inc. (a) | | 10,200 | 1,356,702 |
| Grand Canyon Education, Inc. (a) | | 38,723 | 3,641,511 |
| New Oriental Education & Technology Group, Inc. sponsored ADR (a) | | 10,790 | 1,582,138 |
| | | | 6,580,351 |
| Food & Staples Retailing - 1.6% | | | |
| Food Distributors - 0.8% | | | |
| Performance Food Group Co. (a) | | 102,092 | 3,727,379 |
| Food Retail - 0.2% | | | |
| Kroger Co. | | 27,800 | 991,904 |
| Hypermarkets & Super Centers - 0.6% | | | |
| BJ's Wholesale Club Holdings, Inc. (a) | | 61,932 | 2,750,400 |
|
| TOTAL FOOD & STAPLES RETAILING | | | 7,469,683 |
|
| Food Products - 0.2% | | | |
| Packaged Foods & Meats - 0.2% | | | |
| JDE Peet's BV | | 19,300 | 850,098 |
| Hotels, Restaurants & Leisure - 17.4% | | | |
| Casinos & Gaming - 2.3% | | | |
| Caesars Entertainment, Inc. (a) | | 99,007 | 4,534,521 |
| Churchill Downs, Inc. | | 30,046 | 5,250,839 |
| Penn National Gaming, Inc. (a) | | 26,619 | 1,360,231 |
| | | | 11,145,591 |
| Hotels, Resorts & Cruise Lines - 2.3% | | | |
| Extended Stay America, Inc. unit | | 180,500 | 2,254,445 |
| Hilton Worldwide Holdings, Inc. | | 61,700 | 5,575,212 |
| Marriott Vacations Worldwide Corp. | | 33,378 | 3,159,895 |
| | | | 10,989,552 |
| Leisure Facilities - 1.8% | | | |
| Drive Shack, Inc. (a) | | 175,900 | 244,501 |
| Planet Fitness, Inc. (a) | | 63,096 | 3,835,606 |
| Vail Resorts, Inc. | | 19,712 | 4,290,711 |
| | | | 8,370,818 |
| Restaurants - 11.0% | | | |
| ARAMARK Holdings Corp. | | 99,768 | 2,749,606 |
| Chipotle Mexican Grill, Inc. (a) | | 7,072 | 9,266,300 |
| Darden Restaurants, Inc. | | 7,500 | 650,025 |
| McDonald's Corp. | | 84,416 | 18,024,504 |
| Noodles & Co. (a) | | 87,700 | 667,397 |
| Restaurant Brands International, Inc. | | 18,800 | 1,018,589 |
| Starbucks Corp. | | 217,387 | 18,362,680 |
| Wendy's Co. | | 100,300 | 2,100,282 |
| | | | 52,839,383 |
|
| TOTAL HOTELS, RESTAURANTS & LEISURE | | | 83,345,344 |
|
| Household Durables - 3.7% | | | |
| Homebuilding - 3.7% | | | |
| D.R. Horton, Inc. | | 107,281 | 7,656,645 |
| Lennar Corp. Class A | | 59,793 | 4,473,712 |
| NVR, Inc. (a) | | 1,367 | 5,698,121 |
| | | | 17,828,478 |
| Interactive Media & Services - 0.5% | | | |
| Interactive Media & Services - 0.5% | | | |
| Alphabet, Inc. Class A (a) | | 1,344 | 2,190,088 |
| Internet & Direct Marketing Retail - 30.4% | | | |
| Internet & Direct Marketing Retail - 30.4% | | | |
| Amazon.com, Inc. (a) | | 35,385 | 122,112,218 |
| Delivery Hero AG (a)(b) | | 3,900 | 418,959 |
| Expedia, Inc. | | 56,100 | 5,506,215 |
| MercadoLibre, Inc. (a) | | 2,300 | 2,687,757 |
| Ocado Group PLC (a) | | 35,500 | 1,184,942 |
| The Booking Holdings, Inc. (a) | | 5,731 | 10,948,789 |
| The RealReal, Inc. (a)(c) | | 77,800 | 1,249,468 |
| Wayfair LLC Class A (a) | | 4,412 | 1,308,423 |
| | | | 145,416,771 |
| IT Services - 0.6% | | | |
| Data Processing & Outsourced Services - 0.6% | | | |
| PayPal Holdings, Inc. (a) | | 9,937 | 2,028,539 |
| Visa, Inc. Class A | | 4,300 | 911,557 |
| | | | 2,940,096 |
| Multiline Retail - 7.1% | | | |
| General Merchandise Stores - 7.1% | | | |
| B&M European Value Retail SA | | 230,386 | 1,465,930 |
| Dollar General Corp. | | 70,142 | 14,160,267 |
| Dollar Tree, Inc. (a) | | 118,031 | 11,362,844 |
| Ollie's Bargain Outlet Holdings, Inc. (a) | | 48,302 | 4,614,773 |
| Target Corp. | | 16,200 | 2,449,602 |
| | | | 34,053,416 |
| Road & Rail - 0.1% | | | |
| Trucking - 0.1% | | | |
| Lyft, Inc. (a) | | 22,800 | 676,476 |
| Specialty Retail - 27.0% | | | |
| Apparel Retail - 7.3% | | | |
| Burlington Stores, Inc. (a) | | 70,300 | 13,844,179 |
| Ross Stores, Inc. | | 83,827 | 7,634,963 |
| TJX Companies, Inc. | | 244,113 | 13,374,951 |
| | | | 34,854,093 |
| Automotive Retail - 2.3% | | | |
| AutoZone, Inc. (a) | | 3,693 | 4,417,973 |
| O'Reilly Automotive, Inc. (a) | | 13,884 | 6,464,807 |
| | | | 10,882,780 |
| Computer & Electronics Retail - 1.0% | | | |
| Best Buy Co., Inc. | | 43,743 | 4,851,536 |
| Home Improvement Retail - 14.9% | | | |
| Floor & Decor Holdings, Inc. Class A (a) | | 45,106 | 3,303,563 |
| Lowe's Companies, Inc. | | 151,834 | 25,005,541 |
| The Home Depot, Inc. | | 151,917 | 43,302,422 |
| | | | 71,611,526 |
| Specialty Stores - 1.5% | | | |
| Dick's Sporting Goods, Inc. | | 36,300 | 1,964,556 |
| Five Below, Inc. (a) | | 31,379 | 3,434,432 |
| National Vision Holdings, Inc. (a) | | 30,753 | 1,155,390 |
| Sally Beauty Holdings, Inc. (a) | | 52,800 | 589,248 |
| | | | 7,143,626 |
|
| TOTAL SPECIALTY RETAIL | | | 129,343,561 |
|
| Textiles, Apparel & Luxury Goods - 9.6% | | | |
| Apparel, Accessories & Luxury Goods - 4.6% | | | |
| adidas AG | | 8,205 | 2,492,900 |
| Canada Goose Holdings, Inc. (a)(c) | | 20,434 | 501,157 |
| Capri Holdings Ltd. (a) | | 117,621 | 1,863,117 |
| G-III Apparel Group Ltd. (a) | | 20,097 | 222,273 |
| Hermes International SCA | | 984 | 844,760 |
| lululemon athletica, Inc. (a) | | 8,330 | 3,129,331 |
| LVMH Moet Hennessy Louis Vuitton SE | | 6,484 | 3,045,033 |
| PVH Corp. | | 82,606 | 4,606,111 |
| Tapestry, Inc. | | 191,682 | 2,823,476 |
| VF Corp. | | 37,266 | 2,450,240 |
| | | | 21,978,398 |
| Footwear - 5.0% | | | |
| Deckers Outdoor Corp. (a) | | 18,700 | 3,812,369 |
| NIKE, Inc. Class B | | 176,130 | 19,707,186 |
| Skechers U.S.A., Inc. Class A (sub. vtg.) (a) | | 18,446 | 550,613 |
| | | | 24,070,168 |
|
| TOTAL TEXTILES, APPAREL & LUXURY GOODS | | | 46,048,566 |
|
| TOTAL COMMON STOCKS | | | |
| (Cost $269,254,424) | | | 481,636,088 |
|
| Money Market Funds - 1.2% | | | |
| Fidelity Cash Central Fund 0.12% (d) | | 5,331,412 | 5,332,478 |
| Fidelity Securities Lending Cash Central Fund 0.11% (d)(e) | | 167,721 | 167,738 |
| TOTAL MONEY MARKET FUNDS | | | |
| (Cost $5,500,216) | | | 5,500,216 |
| TOTAL INVESTMENT IN SECURITIES - 101.8% | | | |
| (Cost $274,754,640) | | | 487,136,304 |
| NET OTHER ASSETS (LIABILITIES) - (1.8)% | | | (8,437,718) |
| NET ASSETS - 100% | | | $478,698,586 |
Legend
(a) Non-income producing
(b) Security exempt from registration under Rule 144A of the Securities Act of 1933. These securities may be resold in transactions exempt from registration, normally to qualified institutional buyers. At the end of the period, the value of these securities amounted to $418,959 or 0.1% of net assets.
(c) Security or a portion of the security is on loan at period end.
(d) Affiliated fund that is generally available only to investment companies and other accounts managed by Fidelity Investments. The rate quoted is the annualized seven-day yield of the fund at period end. A complete unaudited listing of the fund's holdings as of its most recent quarter end is available upon request. In addition, each Fidelity Central Fund's financial statements are available on the SEC's website or upon request.
(e) Investment made with cash collateral received from securities on loan.
Affiliated Central Funds
Information regarding fiscal year to date income earned by the Fund from investments in Fidelity Central Funds is as follows:
| Fund | Income earned |
| Fidelity Cash Central Fund | $1,837 |
| Fidelity Securities Lending Cash Central Fund | 12,335 |
| Total | $14,172 |
Amounts in the income column in the above table include any capital gain distributions from underlying funds, which are presented in the corresponding line-item in the Statement of Operations, if applicable. Amount for Fidelity Securities Lending Cash Central Fund represents the income earned on investing cash collateral, less rebates paid to borrowers and any lending agent fees associated with the loan, plus any premium payments received for lending certain types of securities.
Investment Valuation
The following is a summary of the inputs used, as of August 31, 2020, involving the Fund's assets and liabilities carried at fair value. The inputs or methodology used for valuing securities may not be an indication of the risk associated with investing in those securities. For more information on valuation inputs, and their aggregation into the levels used below, please refer to the Investment Valuation section in the accompanying Notes to Financial Statements.
| | Valuation Inputs at Reporting Date: |
| Description | Total | Level 1 | Level 2 | Level 3 |
| Investments in Securities: | | | | |
| Common Stocks | $481,636,088 | $478,591,055 | $3,045,033 | $-- |
| Money Market Funds | 5,500,216 | 5,500,216 | -- | -- |
| Total Investments in Securities: | $487,136,304 | $484,091,271 | $3,045,033 | $-- |
See accompanying notes which are an integral part of the financial statements.
Consumer Discretionary Portfolio
Financial Statements
Statement of Assets and Liabilities
| | | August 31, 2020 (Unaudited) |
| Assets | | |
Investment in securities, at value (including securities loaned of $152,130) — See accompanying schedule:
Unaffiliated issuers (cost $269,254,424) | $481,636,088 | |
| Fidelity Central Funds (cost $5,500,216) | 5,500,216 | |
| Total Investment in Securities (cost $274,754,640) | | $487,136,304 |
| Receivable for investments sold | | 3,726,336 |
| Receivable for fund shares sold | | 1,308,491 |
| Dividends receivable | | 207,377 |
| Distributions receivable from Fidelity Central Funds | | 624 |
| Prepaid expenses | | 5,483 |
| Other receivables | | 20,364 |
| Total assets | | 492,404,979 |
| Liabilities | | |
| Payable for investments purchased | $292,668 | |
| Payable for fund shares redeemed | 12,953,259 | |
| Accrued management fee | 206,143 | |
| Other affiliated payables | 73,063 | |
| Other payables and accrued expenses | 17,835 | |
| Collateral on securities loaned | 163,425 | |
| Total liabilities | | 13,706,393 |
| Net Assets | | $478,698,586 |
| Net Assets consist of: | | |
| Paid in capital | | $261,755,119 |
| Total accumulated earnings (loss) | | 216,943,467 |
| Net Assets | | $478,698,586 |
| Net Asset Value, offering price and redemption price per share ($478,698,586 ÷ 8,056,442 shares) | | $59.42 |
See accompanying notes which are an integral part of the financial statements.
Statement of Operations
| | | Six months ended August 31, 2020 (Unaudited) |
| Investment Income | | |
| Dividends | | $1,574,049 |
| Income from Fidelity Central Funds (including $12,335 from security lending) | | 14,172 |
| Total income | | 1,588,221 |
| Expenses | | |
| Management fee | $1,057,322 | |
| Transfer agent fees | 329,778 | |
| Accounting fees | 77,332 | |
| Custodian fees and expenses | 5,950 | |
| Independent trustees' fees and expenses | 1,271 | |
| Registration fees | 25,680 | |
| Audit | 26,318 | |
| Legal | 295 | |
| Interest | 1,656 | |
| Miscellaneous | 6,927 | |
| Total expenses before reductions | 1,532,529 | |
| Expense reductions | (7,720) | |
| Total expenses after reductions | | 1,524,809 |
| Net investment income (loss) | | 63,412 |
| Realized and Unrealized Gain (Loss) | | |
| Net realized gain (loss) on: | | |
| Investment securities: | | |
| Unaffiliated issuers | 7,800,550 | |
| Fidelity Central Funds | (45) | |
| Foreign currency transactions | (4,764) | |
| Total net realized gain (loss) | | 7,795,741 |
| Change in net unrealized appreciation (depreciation) on: | | |
| Investment securities: | | |
| Unaffiliated issuers | 100,705,607 | |
| Assets and liabilities in foreign currencies | 73 | |
| Total change in net unrealized appreciation (depreciation) | | 100,705,680 |
| Net gain (loss) | | 108,501,421 |
| Net increase (decrease) in net assets resulting from operations | | $108,564,833 |
See accompanying notes which are an integral part of the financial statements.
Statement of Changes in Net Assets
| | Six months ended August 31, 2020 (Unaudited) | Year ended February 29, 2020 |
| Increase (Decrease) in Net Assets | | |
| Operations | | |
| Net investment income (loss) | $63,412 | $1,050,157 |
| Net realized gain (loss) | 7,795,741 | 8,088,931 |
| Change in net unrealized appreciation (depreciation) | 100,705,680 | 14,436,079 |
| Net increase (decrease) in net assets resulting from operations | 108,564,833 | 23,575,167 |
| Distributions to shareholders | – | (10,526,325) |
| Share transactions | | |
| Proceeds from sales of shares | 71,686,768 | 141,736,274 |
| Reinvestment of distributions | – | 9,985,146 |
| Cost of shares redeemed | (103,956,364) | (195,554,961) |
| Net increase (decrease) in net assets resulting from share transactions | (32,269,596) | (43,833,541) |
| Total increase (decrease) in net assets | 76,295,237 | (30,784,699) |
| Net Assets | | |
| Beginning of period | 402,403,349 | 433,188,048 |
| End of period | $478,698,586 | $402,403,349 |
| Other Information | | |
| Shares | | |
| Sold | 1,460,812 | 2,990,069 |
| Issued in reinvestment of distributions | – | 214,717 |
| Redeemed | (2,233,395) | (4,151,320) |
| Net increase (decrease) | (772,583) | (946,534) |
See accompanying notes which are an integral part of the financial statements.
Financial Highlights
Consumer Discretionary Portfolio
| | Six months ended (Unaudited) August 31, | Years endedFebruary 28, | | | | |
| | 2020 | 2020 A | 2019 | 2018 | 2017 | 2016 A |
| Selected Per–Share Data | | | | | | |
| Net asset value, beginning of period | $45.58 | $44.31 | $43.65 | $37.00 | $32.38 | $35.23 |
| Income from Investment Operations | | | | | | |
| Net investment income (loss)B | .01 | .11 | .12 | .16 | .21 | .24 |
| Net realized and unrealized gain (loss) | 13.83 | 2.26 | 1.87 | 8.17 | 4.73 | (1.79) |
| Total from investment operations | 13.84 | 2.37 | 1.99 | 8.33 | 4.94 | (1.55) |
| Distributions from net investment income | – | (.11) | (.15) | (.14) | (.32) | (.18) |
| Distributions from net realized gain | – | (.99) | (1.18) | (1.54) | – | (1.13) |
| Total distributions | – | (1.10) | (1.33) | (1.68) | (.32) | (1.30)C |
| Redemption fees added to paid in capitalB | – | – | – | – | –D | –D |
| Net asset value, end of period | $59.42 | $45.58 | $44.31 | $43.65 | $37.00 | $32.38 |
| Total ReturnE,F | 30.36% | 5.30% | 4.81% | 22.79% | 15.29% | (4.60)% |
| Ratios to Average Net AssetsG,H | | | | | | |
| Expenses before reductions | .77%I | .76% | .78% | .78% | .76% | .77% |
| Expenses net of fee waivers, if any | .77%I | .76% | .77% | .78% | .76% | .77% |
| Expenses net of all reductions | .77%I | .76% | .77% | .77% | .76% | .76% |
| Net investment income (loss) | .03%I | .23% | .27% | .40% | .60% | .71% |
| Supplemental Data | | | | | | |
| Net assets, end of period (000 omitted) | $478,699 | $402,403 | $433,188 | $819,937 | $828,992 | $1,119,021 |
| Portfolio turnover rateJ | 37%I | 41%K | 46%K | 74% | 39%K | 69% |
A For the year ended February 29.
B Calculated based on average shares outstanding during the period.
C Total distributions of $1.30 per share is comprised of distributions from net investment income of $.175 and distributions from net realized gain of $1.126 per share.
D Amount represents less than $.005 per share.
E Total returns for periods of less than one year are not annualized.
F Total returns would have been lower if certain expenses had not been reduced during the applicable periods shown.
G Fees and expenses of any underlying mutual funds or exchange-traded funds (ETFs) are not included in the Fund's expense ratio. The Fund indirectly bears its proportionate share of these expenses. For additional expense information related to investments in Fidelity Central Funds, please refer to the "Investments in Fidelity Central Funds" note found in the Notes to Financial Statements section of the most recent Annual or Semi-Annual report.
H Expense ratios reflect operating expenses of the class. Expenses before reductions do not reflect amounts reimbursed, waived, or reduced through arrangements with the investment advisor, brokerage services, or other offset arrangements, if applicable, and do not represent the amount paid by the class during periods when reimbursements, waivers or reductions occur.
I Annualized
J Amount does not include the portfolio activity of any underlying Fidelity Central Funds.
K Portfolio turnover rate excludes securities received or delivered in-kind.
See accompanying notes which are an integral part of the financial statements.
Leisure Portfolio
Investment Summary (Unaudited)
Top Ten Stocks as of August 31, 2020
| | % of fund's net assets |
| McDonald's Corp. | 23.3 |
| Starbucks Corp. | 18.2 |
| Chipotle Mexican Grill, Inc. | 7.1 |
| Hilton Worldwide Holdings, Inc. | 4.9 |
| Marriott International, Inc. Class A | 4.9 |
| Churchill Downs, Inc. | 3.5 |
| Las Vegas Sands Corp. | 3.2 |
| Penn National Gaming, Inc. | 2.5 |
| Caesars Entertainment, Inc. | 2.5 |
| Darden Restaurants, Inc. | 2.5 |
| | 72.6 |
Top Industries (% of fund's net assets)
| As of August 31, 2020 |
| | Hotels, Restaurants & Leisure | 89.7% |
| | Diversified Consumer Services | 4.2% |
| | Internet & Direct Marketing Retail | 1.3% |
| | Multiline Retail | 1.1% |
| | Food & Staples Retailing | 1.0% |
| | All Others* | 2.7% |

* Includes short-term investments and net other assets (liabilities).
Leisure Portfolio
Schedule of Investments August 31, 2020 (Unaudited)
Showing Percentage of Net Assets
| Common Stocks - 99.3% | | | |
| | | Shares | Value |
| Diversified Consumer Services - 4.2% | | | |
| Education Services - 4.1% | | | |
| Bright Horizons Family Solutions, Inc. (a) | | 60,000 | $7,980,600 |
| Chegg, Inc. (a)(b) | | 74,800 | 5,515,752 |
| Grand Canyon Education, Inc. (a) | | 53,100 | 4,993,524 |
| | | | 18,489,876 |
| Specialized Consumer Services - 0.1% | | | |
| Weight Watchers International, Inc. (a) | | 22,500 | 528,300 |
|
| TOTAL DIVERSIFIED CONSUMER SERVICES | | | 19,018,176 |
|
| Food & Staples Retailing - 1.0% | | | |
| Food Distributors - 1.0% | | | |
| Performance Food Group Co. (a) | | 129,039 | 4,711,214 |
| Hotels, Restaurants & Leisure - 89.7% | | | |
| Casinos & Gaming - 13.8% | | | |
| Aristocrat Leisure Ltd. | | 175,277 | 3,667,547 |
| Boyd Gaming Corp. | | 16,500 | 441,870 |
| Caesars Entertainment, Inc. (a) | | 246,500 | 11,289,700 |
| Churchill Downs, Inc. | | 91,200 | 15,938,112 |
| DraftKings, Inc. Class A (a)(b) | | 17,400 | 615,264 |
| Galaxy Entertainment Group Ltd. | | 535,000 | 4,205,748 |
| Las Vegas Sands Corp. | | 290,808 | 14,746,874 |
| MGM Mirage, Inc. | | 50,100 | 1,127,250 |
| Penn National Gaming, Inc. (a) | | 222,709 | 11,380,430 |
| | | | 63,412,795 |
| Hotels, Resorts & Cruise Lines - 15.3% | | | |
| Choice Hotels International, Inc. | | 46,700 | 4,636,843 |
| Extended Stay America, Inc. unit | | 460,900 | 5,756,641 |
| Hilton Worldwide Holdings, Inc. | | 251,097 | 22,689,125 |
| Marriott International, Inc. Class A | | 216,093 | 22,238,131 |
| Marriott Vacations Worldwide Corp. | | 57,800 | 5,471,926 |
| Royal Caribbean Cruises Ltd. (b) | | 131,490 | 9,051,772 |
| | | | 69,844,438 |
| Leisure Facilities - 2.2% | | | |
| Planet Fitness, Inc. (a) | | 100,000 | 6,079,000 |
| Vail Resorts, Inc. | | 19,000 | 4,135,730 |
| | | | 10,214,730 |
| Restaurants - 58.4% | | | |
| Chipotle Mexican Grill, Inc. (a) | | 24,950 | 32,691,486 |
| Darden Restaurants, Inc. | | 130,100 | 11,275,767 |
| Dunkin' Brands Group, Inc. | | 119,000 | 9,053,520 |
| McDonald's Corp. | | 500,208 | 106,804,410 |
| Noodles & Co. (a) | | 96,900 | 737,409 |
| Restaurant Brands International, Inc. | | 57,100 | 3,093,692 |
| Starbucks Corp. | | 989,700 | 83,599,959 |
| Wendy's Co. | | 314,900 | 6,594,006 |
| Wingstop, Inc. | | 40,600 | 6,634,040 |
| Yum! Brands, Inc. | | 74,316 | 7,123,189 |
| | | | 267,607,478 |
|
| TOTAL HOTELS, RESTAURANTS & LEISURE | | | 411,079,441 |
|
| Internet & Direct Marketing Retail - 1.3% | | | |
| Internet & Direct Marketing Retail - 1.3% | | | |
| Expedia, Inc. | | 59,700 | 5,859,555 |
| IT Services - 0.3% | | | |
| Data Processing & Outsourced Services - 0.3% | | | |
| Shift4 Payments, Inc. | | 26,700 | 1,344,879 |
| Leisure Products - 0.0% | | | |
| Leisure Products - 0.0% | | | |
| Callaway Golf Co. | | 10,700 | 223,202 |
| Multiline Retail - 1.1% | | | |
| General Merchandise Stores - 1.1% | | | |
| Dollar General Corp. | | 14,300 | 2,886,884 |
| Ollie's Bargain Outlet Holdings, Inc. (a) | | 21,200 | 2,025,448 |
| | | | 4,912,332 |
| Real Estate Management & Development - 0.1% | | | |
| Real Estate Services - 0.1% | | | |
| KE Holdings, Inc. ADR (a) | | 9,200 | 471,868 |
| Road & Rail - 0.8% | | | |
| Trucking - 0.8% | | | |
| Lyft, Inc. (a) | | 54,800 | 1,625,916 |
| Uber Technologies, Inc. (a) | | 63,100 | 2,122,053 |
| | | | 3,747,969 |
| Textiles, Apparel & Luxury Goods - 0.8% | | | |
| Apparel, Accessories & Luxury Goods - 0.8% | | | |
| LVMH Moet Hennessy Louis Vuitton SE | | 8,200 | 3,850,906 |
| TOTAL COMMON STOCKS | | | |
| (Cost $262,202,764) | | | 455,219,542 |
|
| Money Market Funds - 2.4% | | | |
| Fidelity Cash Central Fund 0.12% (c) | | 2,476,664 | 2,477,159 |
| Fidelity Securities Lending Cash Central Fund 0.11% (c)(d) | | 8,391,081 | 8,391,921 |
| TOTAL MONEY MARKET FUNDS | | | |
| (Cost $10,869,080) | | | 10,869,080 |
| TOTAL INVESTMENT IN SECURITIES - 101.7% | | | |
| (Cost $273,071,844) | | | 466,088,622 |
| NET OTHER ASSETS (LIABILITIES) - (1.7)% | | | (7,941,949) |
| NET ASSETS - 100% | | | $458,146,673 |
Legend
(a) Non-income producing
(b) Security or a portion of the security is on loan at period end.
(c) Affiliated fund that is generally available only to investment companies and other accounts managed by Fidelity Investments. The rate quoted is the annualized seven-day yield of the fund at period end. A complete unaudited listing of the fund's holdings as of its most recent quarter end is available upon request. In addition, each Fidelity Central Fund's financial statements are available on the SEC's website or upon request.
(d) Investment made with cash collateral received from securities on loan.
Affiliated Central Funds
Information regarding fiscal year to date income earned by the Fund from investments in Fidelity Central Funds is as follows:
| Fund | Income earned |
| Fidelity Cash Central Fund | $2,317 |
| Fidelity Securities Lending Cash Central Fund | 31,539 |
| Total | $33,856 |
Amounts in the income column in the above table include any capital gain distributions from underlying funds, which are presented in the corresponding line-item in the Statement of Operations, if applicable. Amount for Fidelity Securities Lending Cash Central Fund represents the income earned on investing cash collateral, less rebates paid to borrowers and any lending agent fees associated with the loan, plus any premium payments received for lending certain types of securities.
Investment Valuation
The following is a summary of the inputs used, as of August 31, 2020, involving the Fund's assets and liabilities carried at fair value. The inputs or methodology used for valuing securities may not be an indication of the risk associated with investing in those securities. For more information on valuation inputs, and their aggregation into the levels used below, please refer to the Investment Valuation section in the accompanying Notes to Financial Statements.
| | Valuation Inputs at Reporting Date: |
| Description | Total | Level 1 | Level 2 | Level 3 |
| Investments in Securities: | | | | |
| Common Stocks | $455,219,542 | $447,162,888 | $8,056,654 | $-- |
| Money Market Funds | 10,869,080 | 10,869,080 | -- | -- |
| Total Investments in Securities: | $466,088,622 | $458,031,968 | $8,056,654 | $-- |
See accompanying notes which are an integral part of the financial statements.
Leisure Portfolio
Financial Statements
Statement of Assets and Liabilities
| | | August 31, 2020 (Unaudited) |
| Assets | | |
Investment in securities, at value (including securities loaned of $8,062,498) — See accompanying schedule:
Unaffiliated issuers (cost $262,202,764) | $455,219,542 | |
| Fidelity Central Funds (cost $10,869,080) | 10,869,080 | |
| Total Investment in Securities (cost $273,071,844) | | $466,088,622 |
| Foreign currency held at value (cost $529) | | 551 |
| Receivable for investments sold | | 879,038 |
| Receivable for fund shares sold | | 1,026,863 |
| Dividends receivable | | 733,569 |
| Distributions receivable from Fidelity Central Funds | | 1,953 |
| Prepaid expenses | | 3,938 |
| Other receivables | | 14,184 |
| Total assets | | 468,748,718 |
| Liabilities | | |
| Payable for investments purchased | $930,021 | |
| Payable for fund shares redeemed | 1,000,447 | |
| Accrued management fee | 192,020 | |
| Other affiliated payables | 76,188 | |
| Other payables and accrued expenses | 17,494 | |
| Collateral on securities loaned | 8,385,875 | |
| Total liabilities | | 10,602,045 |
| Net Assets | | $458,146,673 |
| Net Assets consist of: | | |
| Paid in capital | | $294,167,958 |
| Total accumulated earnings (loss) | | 163,978,715 |
| Net Assets | | $458,146,673 |
| Net Asset Value, offering price and redemption price per share ($458,146,673 ÷ 30,916,218 shares) | | $14.82 |
See accompanying notes which are an integral part of the financial statements.
Statement of Operations
| | | Six months ended August 31, 2020 (Unaudited) |
| Investment Income | | |
| Dividends | | $2,901,938 |
| Income from Fidelity Central Funds (including $31,539 from security lending) | | 33,856 |
| Total income | | 2,935,794 |
| Expenses | | |
| Management fee | $1,034,852 | |
| Transfer agent fees | 362,175 | |
| Accounting fees | 75,704 | |
| Custodian fees and expenses | 6,095 | |
| Independent trustees' fees and expenses | 1,297 | |
| Registration fees | 24,431 | |
| Audit | 17,800 | |
| Legal | 313 | |
| Miscellaneous | 8,373 | |
| Total expenses before reductions | 1,531,040 | |
| Expense reductions | (34,664) | |
| Total expenses after reductions | | 1,496,376 |
| Net investment income (loss) | | 1,439,418 |
| Realized and Unrealized Gain (Loss) | | |
| Net realized gain (loss) on: | | |
| Investment securities: | | |
| Unaffiliated issuers | (28,545,945) | |
| Fidelity Central Funds | (1,420) | |
| Foreign currency transactions | 3,540 | |
| Total net realized gain (loss) | | (28,543,825) |
| Change in net unrealized appreciation (depreciation) on: | | |
| Investment securities: | | |
| Unaffiliated issuers | 67,772,544 | |
| Assets and liabilities in foreign currencies | 24 | |
| Total change in net unrealized appreciation (depreciation) | | 67,772,568 |
| Net gain (loss) | | 39,228,743 |
| Net increase (decrease) in net assets resulting from operations | | $40,668,161 |
See accompanying notes which are an integral part of the financial statements.
Statement of Changes in Net Assets
| | Six months ended August 31, 2020 (Unaudited) | Year ended February 29, 2020 |
| Increase (Decrease) in Net Assets | | |
| Operations | | |
| Net investment income (loss) | $1,439,418 | $3,993,037 |
| Net realized gain (loss) | (28,543,825) | 44,807,931 |
| Change in net unrealized appreciation (depreciation) | 67,772,568 | (38,596,433) |
| Net increase (decrease) in net assets resulting from operations | 40,668,161 | 10,204,535 |
| Distributions to shareholders | (11,021,977) | (31,042,814) |
| Share transactions | | |
| Proceeds from sales of shares | 85,369,009 | 119,782,717 |
| Reinvestment of distributions | 10,296,502 | 28,804,554 |
| Cost of shares redeemed | (98,310,790) | (169,526,142) |
| Net increase (decrease) in net assets resulting from share transactions | (2,645,279) | (20,938,871) |
| Total increase (decrease) in net assets | 27,000,905 | (41,777,150) |
| Net Assets | | |
| Beginning of period | 431,145,768 | 472,922,918 |
| End of period | $458,146,673 | $431,145,768 |
| Other Information | | |
| Shares | | |
| Sold | 7,143,569 | 7,488,013 |
| Issued in reinvestment of distributions | 934,347 | 1,846,047 |
| Redeemed | (8,197,007) | (10,835,961) |
| Net increase (decrease) | (119,091) | (1,501,901) |
See accompanying notes which are an integral part of the financial statements.
Financial Highlights
Leisure Portfolio
| | Six months ended (Unaudited) August 31, | Years endedFebruary 28, | | | | |
| | 2020 | 2020 A | 2019 B | 2018 B | 2017 B | 2016 A,B |
| Selected Per–Share Data | | | | | | |
| Net asset value, beginning of period | $13.89 | $14.53 | $16.58 | $14.14 | $12.83 | $14.01 |
| Income from Investment Operations | | | | | | |
| Net investment income (loss)C | .05 | .12 | .16 | .18 | .16 | .15 |
| Net realized and unrealized gain (loss) | 1.24 | .25 | .39 | 3.31 | 1.29 | (.62) |
| Total from investment operations | 1.29 | .37 | .55 | 3.49 | 1.45 | (.47) |
| Distributions from net investment income | (.02) | (.11) | (.16) | (.14) | (.14) | (.13) |
| Distributions from net realized gain | (.34) | (.89) | (2.44) | (.91) | – | (.58) |
| Total distributions | (.36) | (1.01)D | (2.60) | (1.05) | (.14) | (.71) |
| Redemption fees added to paid in capitalC | – | – | –E | –E | –E | –E |
| Net asset value, end of period | $14.82 | $13.89 | $14.53 | $16.58 | $14.14 | $12.83 |
| Total ReturnF,G | 10.20% | 1.76% | 4.48% | 24.75% | 11.26% | (3.48)% |
| Ratios to Average Net AssetsH,I | | | | | | |
| Expenses before reductions | .79%J | .76% | .76% | .77% | .80% | .79% |
| Expenses net of fee waivers, if any | .78%J | .75% | .76% | .77% | .79% | .79% |
| Expenses net of all reductions | .77%J | .75% | .76% | .77% | .79% | .78% |
| Net investment income (loss) | .74%J | .79% | 1.05% | 1.09% | 1.17% | 1.08% |
| Supplemental Data | | | | | | |
| Net assets, end of period (000 omitted) | $458,147 | $431,146 | $472,923 | $544,540 | $402,941 | $416,771 |
| Portfolio turnover rateK | 44%J | 53% | 41% | 56% | 23% | 48% |
A For the year ended February 29.
B Per share amounts have been adjusted to reflect the impact of the 10 for 1 share split that occurred on August 10, 2018.
C Calculated based on average shares outstanding during the period.
D Total distributions of $1.01 per share is comprised of distributions from net investment income of $.111 and distributions from net realized gain of $.894 per share.
E Amount represents less than $.005 per share.
F Total returns for periods of less than one year are not annualized.
G Total returns would have been lower if certain expenses had not been reduced during the applicable periods shown.
H Fees and expenses of any underlying mutual funds or exchange-traded funds (ETFs) are not included in the Fund's expense ratio. The Fund indirectly bears its proportionate share of these expenses. For additional expense information related to investments in Fidelity Central Funds, please refer to the "Investments in Fidelity Central Funds" note found in the Notes to Financial Statements section of the most recent Annual or Semi-Annual report.
I Expense ratios reflect operating expenses of the class. Expenses before reductions do not reflect amounts reimbursed, waived, or reduced through arrangements with the investment advisor, brokerage services, or other offset arrangements, if applicable, and do not represent the amount paid by the class during periods when reimbursements, waivers or reductions occur.
J Annualized
K Amount does not include the portfolio activity of any underlying Fidelity Central Funds.
See accompanying notes which are an integral part of the financial statements.
Retailing Portfolio
Investment Summary (Unaudited)
Top Ten Stocks as of August 31, 2020
| | % of fund's net assets |
| Amazon.com, Inc. | 24.7 |
| The Home Depot, Inc. | 13.4 |
| Lowe's Companies, Inc. | 6.3 |
| Dollar General Corp. | 3.7 |
| TJX Companies, Inc. | 3.7 |
| MercadoLibre, Inc. | 3.3 |
| Dollar Tree, Inc. | 3.3 |
| Target Corp. | 2.9 |
| Ross Stores, Inc. | 2.6 |
| Burlington Stores, Inc. | 2.5 |
| | 66.4 |
Top Industries (% of fund's net assets)
| As of August 31, 2020 |
| | Specialty Retail | 40.9% |
| | Internet & Direct Marketing Retail | 35.2% |
| | Multiline Retail | 11.1% |
| | Food & Staples Retailing | 4.8% |
| | Textiles, Apparel & Luxury Goods | 4.0% |
| | All Others* | 4.0% |

* Includes short-term investments and net other assets (liabilities).
Retailing Portfolio
Schedule of Investments August 31, 2020 (Unaudited)
Showing Percentage of Net Assets
| Common Stocks - 99.8% | | | |
| | | Shares | Value |
| Food & Staples Retailing - 4.8% | | | |
| Food Distributors - 2.4% | | | |
| Performance Food Group Co. (a) | | 826,436 | $30,173,179 |
| U.S. Foods Holding Corp. (a) | | 2,210,000 | 53,813,500 |
| | | | 83,986,679 |
| Food Retail - 0.8% | | | |
| Kroger Co. | | 776,100 | 27,691,248 |
| Hypermarkets & Super Centers - 1.6% | | | |
| BJ's Wholesale Club Holdings, Inc. (a) | | 589,740 | 26,190,353 |
| Costco Wholesale Corp. | | 72,900 | 25,344,414 |
| Walmart, Inc. | | 31,800 | 4,415,430 |
| | | | 55,950,197 |
|
| TOTAL FOOD & STAPLES RETAILING | | | 167,628,124 |
|
| Interactive Media & Services - 1.3% | | | |
| Interactive Media & Services - 1.3% | | | |
| Alphabet, Inc. Class A (a) | | 15,700 | 25,583,621 |
| Facebook, Inc. Class A (a) | | 63,400 | 18,588,880 |
| | | | 44,172,501 |
| Internet & Direct Marketing Retail - 35.2% | | | |
| Internet & Direct Marketing Retail - 35.2% | | | |
| Amazon.com, Inc. (a) | | 250,830 | 865,604,296 |
| Expedia, Inc. | | 810,600 | 79,560,390 |
| Farfetch Ltd. Class A (a)(b) | | 1,811,600 | 50,163,204 |
| MercadoLibre, Inc. (a) | | 98,300 | 114,872,397 |
| The Booking Holdings, Inc. (a) | | 43,840 | 83,754,128 |
| The RealReal, Inc. (a)(b) | | 2,471,815 | 39,697,349 |
| Wayfair LLC Class A (a) | | 2,700 | 800,712 |
| | | | 1,234,452,476 |
| Leisure Products - 0.2% | | | |
| Leisure Products - 0.2% | | | |
| Vista Outdoor, Inc. (a) | | 366,600 | 7,115,706 |
| Multiline Retail - 11.1% | | | |
| General Merchandise Stores - 11.1% | | | |
| Dollar General Corp. | | 646,300 | 130,475,044 |
| Dollar Tree, Inc. (a) | | 1,178,800 | 113,483,076 |
| Ollie's Bargain Outlet Holdings, Inc. (a)(b) | | 448,635 | 42,862,588 |
| Target Corp. | | 673,000 | 101,764,330 |
| | | | 388,585,038 |
| Oil, Gas & Consumable Fuels - 0.5% | | | |
| Oil & Gas Refining & Marketing - 0.5% | | | |
| Reliance Industries Ltd. sponsored GDR (c) | | 291,395 | 16,871,771 |
| Road & Rail - 0.9% | | | |
| Trucking - 0.9% | | | |
| Lyft, Inc. (a) | | 682,800 | 20,258,676 |
| Uber Technologies, Inc. (a) | | 355,100 | 11,942,013 |
| | | | 32,200,689 |
| Software - 0.9% | | | |
| Application Software - 0.9% | | | |
| HubSpot, Inc. (a) | | 41,600 | 12,466,688 |
| Manhattan Associates, Inc. (a) | | 205,700 | 20,004,325 |
| | | | 32,471,013 |
| Specialty Retail - 40.9% | | | |
| Apparel Retail - 8.9% | | | |
| Burlington Stores, Inc. (a) | | 431,794 | 85,033,192 |
| Ross Stores, Inc. | | 1,010,300 | 92,018,124 |
| The Children's Place Retail Stores, Inc. (b) | | 217,043 | 4,333,264 |
| TJX Companies, Inc. | | 2,352,400 | 128,887,996 |
| | | | 310,272,576 |
| Automotive Retail - 5.7% | | | |
| AutoZone, Inc. (a) | | 28,163 | 33,691,679 |
| CarMax, Inc. (a)(b) | | 636,100 | 68,018,173 |
| Carvana Co. Class A (a)(b) | | 267,500 | 57,769,300 |
| O'Reilly Automotive, Inc. (a) | | 88,986 | 41,434,551 |
| | | | 200,913,703 |
| Computer & Electronics Retail - 2.0% | | | |
| Best Buy Co., Inc. | | 644,000 | 71,426,040 |
| Home Improvement Retail - 20.9% | | | |
| Floor & Decor Holdings, Inc. Class A (a) | | 562,537 | 41,200,210 |
| Lowe's Companies, Inc. | | 1,347,100 | 221,853,899 |
| The Home Depot, Inc. | | 1,640,100 | 467,494,104 |
| | | | 730,548,213 |
| Specialty Stores - 3.4% | | | |
| Dick's Sporting Goods, Inc. (b) | | 866,100 | 46,873,332 |
| Five Below, Inc. (a) | | 589,800 | 64,553,610 |
| Tiffany & Co., Inc. | | 50,100 | 6,137,250 |
| | | | 117,564,192 |
|
| TOTAL SPECIALTY RETAIL | | | 1,430,724,724 |
|
| Textiles, Apparel & Luxury Goods - 4.0% | | | |
| Apparel, Accessories & Luxury Goods - 4.0% | | | |
| adidas AG | | 78,300 | 23,789,647 |
| Aritzia LP (a) | | 348,300 | 4,988,112 |
| Canada Goose Holdings, Inc. (a)(b) | | 306,600 | 7,519,557 |
| Capri Holdings Ltd. (a) | | 440,400 | 6,975,936 |
| G-III Apparel Group Ltd. (a) | | 784,528 | 8,676,880 |
| lululemon athletica, Inc. (a) | | 82,457 | 30,976,621 |
| LVMH Moet Hennessy Louis Vuitton SE | | 56,500 | 26,533,680 |
| PVH Corp. | | 536,100 | 29,892,936 |
| | | | 139,353,369 |
| TOTAL COMMON STOCKS | | | |
| (Cost $1,563,050,222) | | | 3,493,575,411 |
|
| Money Market Funds - 5.0% | | | |
| Fidelity Cash Central Fund 0.12% (d) | | 25,882,938 | 25,888,114 |
| Fidelity Securities Lending Cash Central Fund 0.11% (d)(e) | | 149,217,023 | 149,231,945 |
| TOTAL MONEY MARKET FUNDS | | | |
| (Cost $175,120,059) | | | 175,120,059 |
| TOTAL INVESTMENT IN SECURITIES - 104.8% | | | |
| (Cost $1,738,170,281) | | | 3,668,695,470 |
| NET OTHER ASSETS (LIABILITIES) - (4.8)% | | | (167,798,753) |
| NET ASSETS - 100% | | | $3,500,896,717 |
Legend
(a) Non-income producing
(b) Security or a portion of the security is on loan at period end.
(c) Security exempt from registration under Rule 144A of the Securities Act of 1933. These securities may be resold in transactions exempt from registration, normally to qualified institutional buyers. At the end of the period, the value of these securities amounted to $16,871,771 or 0.5% of net assets.
(d) Affiliated fund that is generally available only to investment companies and other accounts managed by Fidelity Investments. The rate quoted is the annualized seven-day yield of the fund at period end. A complete unaudited listing of the fund's holdings as of its most recent quarter end is available upon request. In addition, each Fidelity Central Fund's financial statements are available on the SEC's website or upon request.
(e) Investment made with cash collateral received from securities on loan.
Affiliated Central Funds
Information regarding fiscal year to date income earned by the Fund from investments in Fidelity Central Funds is as follows:
| Fund | Income earned |
| Fidelity Cash Central Fund | $9,774 |
| Fidelity Securities Lending Cash Central Fund | 122,411 |
| Total | $132,185 |
Amounts in the income column in the above table include any capital gain distributions from underlying funds, which are presented in the corresponding line-item in the Statement of Operations, if applicable. Amount for Fidelity Securities Lending Cash Central Fund represents the income earned on investing cash collateral, less rebates paid to borrowers and any lending agent fees associated with the loan, plus any premium payments received for lending certain types of securities.
Other Affiliated Issuers
An affiliated company is a company in which the Fund has ownership of at least 5% of the voting securities. Fiscal year to date transactions with companies which are or were affiliates are as follows:
| Affiliate | Value, beginning of period | Purchases | Sales Proceeds | Dividend Income | Realized Gain (loss) | Change in Unrealized appreciation (depreciation) | Value, end of period |
| Drive Shack, Inc. | $9,998,274 | $-- | $4,390,046 | $-- | $(11,712,122) | $6,103,894 | $-- |
| Total | $9,998,274 | $-- | $4,390,046 | $-- | $(11,712,122) | $6,103,894 | $-- |
Investment Valuation
The following is a summary of the inputs used, as of August 31, 2020, involving the Fund's assets and liabilities carried at fair value. The inputs or methodology used for valuing securities may not be an indication of the risk associated with investing in those securities. For more information on valuation inputs, and their aggregation into the levels used below, please refer to the Investment Valuation section in the accompanying Notes to Financial Statements.
| | Valuation Inputs at Reporting Date: |
| Description | Total | Level 1 | Level 2 | Level 3 |
| Investments in Securities: | | | | |
| Common Stocks | $3,493,575,411 | $3,467,041,731 | $26,533,680 | $-- |
| Money Market Funds | 175,120,059 | 175,120,059 | -- | -- |
| Total Investments in Securities: | $3,668,695,470 | $3,642,161,790 | $26,533,680 | $-- |
See accompanying notes which are an integral part of the financial statements.
Retailing Portfolio
Financial Statements
Statement of Assets and Liabilities
| | | August 31, 2020 (Unaudited) |
| Assets | | |
Investment in securities, at value (including securities loaned of $145,555,386) — See accompanying schedule:
Unaffiliated issuers (cost $1,563,050,222) | $3,493,575,411 | |
| Fidelity Central Funds (cost $175,120,059) | 175,120,059 | |
| Total Investment in Securities (cost $1,738,170,281) | | $3,668,695,470 |
| Receivable for investments sold | | 12,149,064 |
| Receivable for fund shares sold | | 8,153,543 |
| Dividends receivable | | 525,994 |
| Distributions receivable from Fidelity Central Funds | | 35,654 |
| Prepaid expenses | | 19,400 |
| Other receivables | | 62,365 |
| Total assets | | 3,689,641,490 |
| Liabilities | | |
| Payable for investments purchased | $33,259,971 | |
| Payable for fund shares redeemed | 4,246,480 | |
| Accrued management fee | 1,482,276 | |
| Other affiliated payables | 506,449 | |
| Other payables and accrued expenses | 21,987 | |
| Collateral on securities loaned | 149,227,610 | |
| Total liabilities | | 188,744,773 |
| Net Assets | | $3,500,896,717 |
| Net Assets consist of: | | |
| Paid in capital | | $1,297,211,552 |
| Total accumulated earnings (loss) | | 2,203,685,165 |
| Net Assets | | $3,500,896,717 |
| Net Asset Value, offering price and redemption price per share ($3,500,896,717 ÷ 160,508,991 shares) | | $21.81 |
See accompanying notes which are an integral part of the financial statements.
Statement of Operations
| | | Six months ended August 31, 2020 (Unaudited) |
| Investment Income | | |
| Dividends | | $10,213,668 |
| Income from Fidelity Central Funds (including $122,411 from security lending) | | 132,185 |
| Total income | | 10,345,853 |
| Expenses | | |
| Management fee | $7,450,014 | |
| Transfer agent fees | 2,395,173 | |
| Accounting fees | 413,718 | |
| Custodian fees and expenses | 10,635 | |
| Independent trustees' fees and expenses | 8,790 | |
| Registration fees | 53,163 | |
| Audit | 19,265 | |
| Legal | 2,002 | |
| Interest | 12,464 | |
| Miscellaneous | 51,840 | |
| Total expenses before reductions | 10,417,064 | |
| Expense reductions | (166,489) | |
| Total expenses after reductions | | 10,250,575 |
| Net investment income (loss) | | 95,278 |
| Realized and Unrealized Gain (Loss) | | |
| Net realized gain (loss) on: | | |
| Investment securities: | | |
| Unaffiliated issuers | 291,473,525 | |
| Fidelity Central Funds | 8,303 | |
| Other affiliated issuers | (11,712,122) | |
| Foreign currency transactions | 37,782 | |
| Total net realized gain (loss) | | 279,807,488 |
| Change in net unrealized appreciation (depreciation) on: | | |
| Investment securities: | | |
| Unaffiliated issuers | 653,297,809 | |
| Affiliated issuers | 6,103,894 | |
| Assets and liabilities in foreign currencies | (2,707) | |
| Total change in net unrealized appreciation (depreciation) | | 659,398,996 |
| Net gain (loss) | | 939,206,484 |
| Net increase (decrease) in net assets resulting from operations | | $939,301,762 |
See accompanying notes which are an integral part of the financial statements.
Statement of Changes in Net Assets
| | Six months ended August 31, 2020 (Unaudited) | Year ended February 29, 2020 |
| Increase (Decrease) in Net Assets | | |
| Operations | | |
| Net investment income (loss) | $95,278 | $8,073,263 |
| Net realized gain (loss) | 279,807,488 | 34,252,880 |
| Change in net unrealized appreciation (depreciation) | 659,398,996 | 180,411,347 |
| Net increase (decrease) in net assets resulting from operations | 939,301,762 | 222,737,490 |
| Distributions to shareholders | (2,233,202) | (70,573,195) |
| Share transactions | | |
| Proceeds from sales of shares | 381,463,799 | 537,224,260 |
| Reinvestment of distributions | 2,123,182 | 67,160,431 |
| Cost of shares redeemed | (518,756,465) | (1,093,141,870) |
| Net increase (decrease) in net assets resulting from share transactions | (135,169,484) | (488,757,179) |
| Total increase (decrease) in net assets | 801,899,076 | (336,592,884) |
| Net Assets | | |
| Beginning of period | 2,698,997,641 | 3,035,590,525 |
| End of period | $3,500,896,717 | $2,698,997,641 |
| Other Information | | |
| Shares | | |
| Sold | 21,056,068 | 33,219,799 |
| Issued in reinvestment of distributions | 143,749 | 4,207,150 |
| Redeemed | (32,481,458) | (67,831,907) |
| Net increase (decrease) | (11,281,641) | (30,404,958) |
See accompanying notes which are an integral part of the financial statements.
Financial Highlights
Retailing Portfolio
| | Six months ended (Unaudited) August 31, | Years endedFebruary 28, | | | | |
| | 2020 | 2020 A | 2019 B | 2018 B | 2017 B | 2016 A,B |
| Selected Per–Share Data | | | | | | |
| Net asset value, beginning of period | $15.71 | $15.01 | $14.35 | $11.56 | $9.88 | $9.53 |
| Income from Investment Operations | | | | | | |
| Net investment income (loss)C | –D | .04 | .03 | .04 | .01 | .01E |
| Net realized and unrealized gain (loss) | 6.11 | 1.02 | .93 | 3.23 | 1.69 | .47 |
| Total from investment operations | 6.11 | 1.06 | .96 | 3.27 | 1.70 | .48 |
| Distributions from net investment income | – | (.05) | (.02) | (.03) | (.02) | (.02) |
| Distributions from net realized gain | (.01) | (.31) | (.27) | (.45) | – | (.11) |
| Total distributions | (.01) | (.36) | (.30)F | (.48) | (.02) | (.13) |
| Redemption fees added to paid in capitalC | – | – | – | – | –D | –D |
| Net asset value, end of period | $21.81 | $15.71 | $15.01 | $14.35 | $11.56 | $9.88 |
| Total ReturnG,H | 38.96% | 7.02% | 6.83% | 28.66% | 17.20% | 5.11% |
| Ratios to Average Net AssetsI,J | | | | | | |
| Expenses before reductions | .74%K | .74% | .76% | .78% | .78% | .81% |
| Expenses net of fee waivers, if any | .74%K | .74% | .75% | .77% | .78% | .80% |
| Expenses net of all reductions | .73%K | .74% | .75% | .77% | .78% | .80% |
| Net investment income (loss) | .01%K | .26% | .20% | .29% | .07% | .14%E |
| Supplemental Data | | | | | | |
| Net assets, end of period (000 omitted) | $3,500,897 | $2,698,998 | $3,035,591 | $2,329,366 | $1,924,403 | $1,849,996 |
| Portfolio turnover rateL | 52%K | 17% | 34% | 24% | 17% | 11% |
A For the year ended February 29.
B Per share amounts have been adjusted to reflect the impact of the 10 for 1 share split that occurred on May 11, 2018.
C Calculated based on average shares outstanding during the period.
D Amount represents less than $.005 per share.
E Net investment income per share reflects one a large, non-recurring dividend which amounted to $.01 per share. Excluding such non-recurring dividend, the ratio of net investment income (loss) to average net assets would have been .02%.
F Total distributions of $.30 per share is comprised of distributions from net investment income of $.024 and distributions from net realized gain of $.272 per share.
G Total returns for periods of less than one year are not annualized.
H Total returns would have been lower if certain expenses had not been reduced during the applicable periods shown.
I Fees and expenses of any underlying mutual funds or exchange-traded funds (ETFs) are not included in the Fund's expense ratio. The Fund indirectly bears its proportionate share of these expenses. For additional expense information related to investments in Fidelity Central Funds, please refer to the "Investments in Fidelity Central Funds" note found in the Notes to Financial Statements section of the most recent Annual or Semi-Annual report.
J Expense ratios reflect operating expenses of the class. Expenses before reductions do not reflect amounts reimbursed, waived, or reduced through arrangements with the investment advisor, brokerage services, or other offset arrangements, if applicable, and do not represent the amount paid by the class during periods when reimbursements, waivers or reductions occur.
K Annualized
L Amount does not include the portfolio activity of any underlying Fidelity Central Funds.
See accompanying notes which are an integral part of the financial statements.
Notes to Financial Statements (Unaudited)
For the period ended August 31, 2020
1. Organization.
Automotive Portfolio, Communication Services Portfolio, Construction and Housing Portfolio, Consumer Discretionary Portfolio, Leisure Portfolio, and Retailing Portfolio (the Funds) are non-diversified funds of Fidelity Select Portfolios (the Trust). The Trust is registered under the Investment Company Act of 1940, as amended (the 1940 Act), as an open-end management investment company organized as a Massachusetts business trust. Each Fund is authorized to issue an unlimited number of shares. Each Fund offers a single class of shares, with the exception of Communication Services Portfolio. Communication Services Portfolio offers Class A, Class M, Class C, Communication Services, Class I and Class Z shares. Communication Services Portfolio commenced sale of Class A, Class M, Class C, Class I and Class Z on November 30, 2018. Each class of Communication Services Portfolio has equal rights as to assets and voting privileges, and each class has exclusive voting rights with respect to matters that affect that class. Class C shares will automatically convert to Class A shares after a holding period of ten years from the initial date of purchase, with certain exceptions. The Funds invest primarily in securities of companies whose principal business activities fall within specific industries. Share transactions on the Statement of Changes in Net Assets and Share Transactions note may contain exchanges between affiliated funds.
2. Investments in Fidelity Central Funds.
The Funds invest in Fidelity Central Funds, which are open-end investment companies generally available only to other investment companies and accounts managed by the investment adviser and its affiliates. The Funds' Schedules of Investments list each of the Fidelity Central Funds held as of period end, if any, as an investment of each Fund, but do not include the underlying holdings of each Fidelity Central Fund. As an Investing Fund, each Fund indirectly bears its proportionate share of the expenses of the underlying Fidelity Central Funds.
The Money Market Central Funds seek preservation of capital and current income and are managed by the investment adviser. Annualized expenses of the Money Market Central Funds as of their most recent shareholder report date ranged from less than .005% to .01%.
A complete unaudited list of holdings for each Fidelity Central Fund is available upon request or at the Securities and Exchange Commission (the SEC) website at www.sec.gov. In addition, the financial statements of the Fidelity Central Funds are available on the SEC website or upon request.
3. Significant Accounting Policies.
Each Fund is an investment company and applies the accounting and reporting guidance of the Financial Accounting Standards Board (FASB) Accounting Standards Codification Topic 946 Financial Services – Investment Companies. The financial statements have been prepared in conformity with accounting principles generally accepted in the United States of America (GAAP), which require management to make certain estimates and assumptions at the date of the financial statements. Actual results could differ from those estimates. Subsequent events, if any, through the date that the financial statements were issued have been evaluated in the preparation of the financial statements. The following summarizes the significant accounting policies of the Funds:
Investment Valuation. Investments are valued as of 4:00 p.m. Eastern time on the last calendar day of the period. The Board of Trustees (the Board) has delegated the day to day responsibility for the valuation of each Fund's investments to the Fair Value Committee (the Committee) established by each Fund's investment adviser. In accordance with valuation policies and procedures approved by the Board, each Fund attempts to obtain prices from one or more third party pricing vendors or brokers to value its investments. When current market prices, quotations or currency exchange rates are not readily available or reliable, investments will be fair valued in good faith by the Committee, in accordance with procedures adopted by the Board. Factors used in determining fair value vary by investment type and may include market or investment specific events. The frequency with which these procedures are used cannot be predicted and they may be utilized to a significant extent. The Committee oversees each Fund's valuation policies and procedures and reports to the Board on the Committee's activities and fair value determinations. The Board monitors the appropriateness of the procedures used in valuing each Fund's investments and ratifies the fair value determinations of the Committee.
Each Fund categorizes the inputs to valuation techniques used to value its investments into a disclosure hierarchy consisting of three levels as shown below:
- Level 1 – quoted prices in active markets for identical investments
- Level 2 – other significant observable inputs (including quoted prices for similar investments, interest rates, prepayment speeds, etc.)
- Level 3 – unobservable inputs (including the Fund's own assumptions based on the best information available)
Valuation techniques used to value each Fund's investments by major category are as follows:
Equity securities, including restricted securities, for which market quotations are readily available, are valued at the last reported sale price or official closing price as reported by a third party pricing vendor on the primary market or exchange on which they are traded and are categorized as Level 1 in the hierarchy. In the event there were no sales during the day or closing prices are not available, securities are valued at the last quoted bid price or may be valued using the last available price and are generally categorized as Level 2 in the hierarchy. For foreign equity securities, when market or security specific events arise, comparisons to the valuation of American Depositary Receipts (ADRs), futures contracts, Exchange-Traded Funds (ETFs) and certain indexes as well as quoted prices for similar securities may be used and would be categorized as Level 2 in the hierarchy. For equity securities, including restricted securities, where observable inputs are limited, assumptions about market activity and risk are used and these securities may be categorized as Level 3 in the hierarchy.
Investments in open-end mutual funds, including Fidelity Central Funds, are valued at their closing net asset value (NAV) each business day and are categorized as Level 1 in the hierarchy.
Changes in valuation techniques may result in transfers in or out of an assigned level within the disclosure hierarchy. The aggregate value of investments by input level as of August 31, 2020 is included at the end of each Fund's Schedule of Investments.
Foreign Currency. Certain Funds may use foreign currency contracts to facilitate transactions in foreign-denominated securities. Gains and losses from these transactions may arise from changes in the value of the foreign currency or if the counterparties do not perform under the contracts' terms.
Foreign-denominated assets, including investment securities, and liabilities are translated into U.S. dollars at the exchange rates at period end. Purchases and sales of investment securities, income and dividends received, and expenses denominated in foreign currencies are translated into U.S. dollars at the exchange rate in effect on the transaction date.
The effects of exchange rate fluctuations on investments are included with the net realized and unrealized gain (loss) on investment securities. Other foreign currency transactions resulting in realized and unrealized gain (loss) are disclosed separately.
Investment Transactions and Income. For financial reporting purposes, the Funds' investment holdings and NAV include trades executed through the end of the last business day of the period. The NAV per share for processing shareholder transactions is calculated as of the close of business of the New York Stock Exchange (NYSE), normally 4:00 p.m. Eastern time and includes trades executed through the end of the prior business day. Gains and losses on securities sold are determined on the basis of identified cost and for certain Funds include proceeds received from litigation. Dividend income is recorded on the ex-dividend date, except for certain dividends from foreign securities where the ex-dividend date may have passed, which are recorded as soon as the Funds are informed of the ex-dividend date. Non-cash dividends included in dividend income, if any, are recorded at the fair market value of the securities received. Income and capital gain distributions from Fidelity Central Funds, if any, are recorded on the ex-dividend date. Certain distributions received by the Funds represent a return of capital or capital gain. The Funds determine the components of these distributions subsequent to the ex-dividend date, based upon receipt of tax filings or other correspondence relating to the underlying investment. These distributions are recorded as a reduction of cost of investments and/or as a realized gain.Investment income is recorded net of foreign taxes withheld where recovery of such taxes is uncertain.
Class Allocations and Expenses. Expenses directly attributable to a fund are charged to that fund. Expenses attributable to more than one fund are allocated among the respective funds on the basis of relative net assets or other appropriate methods. Expense estimates are accrued in the period to which they relate and adjustments are made when actual amounts are known.
For Communication Services Portfolio, investment income, realized and unrealized capital gains and losses, common expenses of the Fund, and certain fund-level expense reductions, if any, are allocated daily on a pro-rata basis to each class based on the relative net assets of each class to the total net assets of the Fund. Each class differs with respect to transfer agent and distribution and service plan fees incurred. Certain expense reductions may also differ by class. For the reporting period, the allocated portion of income and expenses to each class as a percent of its average net assets may vary due to the timing of recording these transactions in relation to fluctuating net assets of the classes.
Income Tax Information and Distributions to Shareholders. Each year, each Fund intends to qualify as a regulated investment company under Subchapter M of the Internal Revenue Code, including distributing substantially all of its taxable income and realized gains. As a result, no provision for U.S. Federal income taxes is required. Each Fund files a U.S. federal tax return, in addition to state and local tax returns as required. Each Fund's federal income tax returns are subject to examination by the Internal Revenue Service (IRS) for a period of three fiscal years after they are filed. State and local tax returns may be subject to examination for an additional fiscal year depending on the jurisdiction. Foreign taxes are provided for based on each Fund's understanding of the tax rules and rates that exist in the foreign markets in which it invests.
Distributions are declared and recorded on the ex-dividend date. Income and capital gain distributions are declared separately for each class. Income and capital gain distributions are determined in accordance with income tax regulations, which may differ from GAAP. These differences resulted in distribution reclassifications.
Capital accounts within the financial statements are adjusted for permanent book-tax differences. These adjustments have no impact on net assets or the results of operations. Capital accounts are not adjusted for temporary book-tax differences which will reverse in a subsequent period.
Book-tax differences are primarily due to foreign currency transactions, redemptions in kind, partnerships, net operating losses, and losses deferred due to wash sales and excise tax regulations.
As of period end, the cost and unrealized appreciation (depreciation) in securities, and derivatives if applicable, for federal income tax purposes were as follows for each Fund:
| | Tax cost | Gross unrealized appreciation | Gross unrealized depreciation | Net unrealized appreciation (depreciation) |
| Automotive Portfolio | $40,461,112 | $17,597,185 | $(1,233,511) | $16,363,674 |
| Communication Services Portfolio | 512,978,440 | 285,370,171 | (16,354,564) | 269,015,607 |
| Construction and Housing Portfolio | 193,375,325 | 133,471,894 | (7,086,810) | 126,385,084 |
| Consumer Discretionary Portfolio | 276,915,551 | 223,974,705 | (13,753,952) | 210,220,753 |
| Leisure Portfolio | 277,881,777 | 196,616,416 | (8,409,571) | 188,206,845 |
| Retailing Portfolio | 1,740,140,131 | 1,983,675,070 | (55,119,731) | 1,928,555,339 |
Capital loss carryforwards are only available to offset future capital gains of the Funds to the extent provided by regulations and may be limited. The capital loss carryforward information presented below, including any applicable limitation, is estimated as of prior fiscal period end and is subject to adjustment.
| | No expiration | | |
| | Short-term | Long-term | Total capital loss carryforward |
| Consumer Discretionary Portfolio | (2,391,308) | (–) | (2,391,308) |
Certain of the Funds elected to defer to the next fiscal year capital losses recognized during the period November 1, 2019 to February 29, 2020 and ordinary losses recognized during the period January 1, 2020 to February 29, 2020. Loss deferrals were as follows:
| | | Capital losses | | Ordinary losses |
| Automotive Portfolio | | $(37,594) | | $(12,920) |
| Construction and Housing Portfolio | | (–) | | (380,060) |
| Consumer Discretionary Portfolio | | (–) | | (58,248) |
| Retailing Portfolio | | (–) | | (993,743) |
Restricted Securities (including Private Placements). The Funds may invest in securities that are subject to legal or contractual restrictions on resale. These securities generally may be resold in transactions exempt from registration or to the public if the securities are registered. Disposal of these securities may involve time-consuming negotiations and expense, and prompt sale at an acceptable price may be difficult. Information regarding restricted securities is included at the end of each applicable Fund's Schedule of Investments.
4. Purchases and Sales of Investments.
Purchases and sales of securities, other than short-term securities are noted in the table below.
| | Purchases ($) | Sales ($) |
| Automotive Portfolio | 15,667,920 | 11,551,955 |
| Communication Services Portfolio | 171,299,829 | 180,291,692 |
| Construction and Housing Portfolio | 164,666,005 | 209,525,060 |
| Consumer Discretionary Portfolio | 74,969,895 | 109,500,715 |
| Leisure Portfolio | 86,963,684 | 103,082,462 |
| Retailing Portfolio | 739,637,213 | 912,693,666 |
5. Fees and Other Transactions with Affiliates.
Management Fee. Fidelity Management & Research Company LLC (the investment adviser) and its affiliates provide the Funds with investment management related services for which the Funds pay a monthly management fee. The management fee is the sum of an individual fund fee rate and an annualized group fee rate. The individual fund fee rate is applied to each Fund's average net assets. The group fee rate is based upon the monthly average net assets of a group of registered investment companies with which the investment adviser has management contracts. The group fee rate decreases as assets under management increase and increases as assets under management decrease. For the reporting period, each Fund's annualized management fee rate expressed as a percentage of each Fund's average net assets was as follows:
| | Individual Rate | Group Rate | Total |
| Automotive Portfolio | .30% | .23% | .53% |
| Communication Services Portfolio | .30% | .23% | .53% |
| Construction and Housing Portfolio | .30% | .23% | .53% |
| Consumer Discretionary Portfolio | .30% | .23% | .53% |
| Leisure Portfolio | .30% | .23% | .53% |
| Retailing Portfolio | .30% | .23% | .53% |
Distribution and Service Plan Fees. In accordance with Rule 12b-1 of the 1940 Act, Communication Services Portfolio has adopted separate Distribution and Service Plans for each class of shares. Certain classes pay Fidelity Distributors Company LLC (FDC), an affiliate of the investment adviser, separate Distribution and Service Fees, each of which is based on an annual percentage of each class' average net assets. In addition, FDC may pay financial intermediaries for selling shares of each Fund and providing shareholder support services. For the period, the Distribution and Service Fee rates, total fees and amounts retained by FDC were as follows:
| | Distribution Fee | Service Fee | Total Fees | Retained by FDC |
| Communication Services Portfolio | | | | |
| Class A | -% | .25% | $17,276 | $– |
| Class M | .25% | .25% | 6,748 | – |
| Class C | .75% | .25% | 12,657 | – |
| | | | $36,681 | $– |
Sales Load. For Communication Services Portfolio, FDC may receive a front-end sales charge of up to 5.75% for selling Class A shares and 3.50% for selling Class M shares, some of which is paid to financial intermediaries for selling shares of the Fund. Depending on the holding period, FDC may receive contingent deferred sales charges levied on Class A, Class M and Class C redemptions. The deferred sales charges are 1.00% for Class C shares, 1.00% for certain purchases of Class A shares and .25% for certain purchases of Class M shares.
For the period, sales charge amounts retained by FDC were as follows:
| | Retained by FDC |
| Communication Services Portfolio | |
| Class A | $18,166 |
| Class M | 1,071 |
| Class C(a) | 333 |
| | $19,570 |
(a) When Class C shares are initially sold, FDC pays commissions from its own resources to financial intermediaries through which the sales are made.
Transfer Agent Fees. Fidelity Investments Institutional Operations Company LLC (FIIOC), an affiliate of the investment adviser, is the transfer, dividend disbursing and shareholder servicing agent for each class (Communication Services Portfolio) or Fund (all other Funds). FIIOC receives account fees and asset-based fees that vary according to the account size and type of account of the shareholders of the respective class or Fund, except for Class Z. FIIOC receives an asset-based fee of Class Z's average net assets. FIIOC pays for typesetting, printing and mailing of shareholder reports, except proxy statements. For the period, transfer agent fees were as follows:
| | Amount | % of Average Net Assets |
| Automotive Portfolio | $41,742 | .24 |
| Communication Services Portfolio | | |
| Class A | 16,713 | .24 |
| Class M | 3,297 | .24 |
| Class C | 2,447 | .19 |
| Communication Services | 536,957 | .18 |
| Class I | 6,378 | .16 |
| Class Z | 911 | .04 |
| | 566,703 | |
| Construction and Housing Portfolio | 250,882 | .19 |
| Consumer Discretionary Portfolio | 329,778 | .17 |
| Leisure Portfolio | 362,175 | .19 |
| Retailing Portfolio | 2,395,173 | .17 |
Accounting Fees. Fidelity Service Company, Inc. (FSC), an affiliate of the investment adviser, maintains each Fund's accounting records. The accounting fee is based on the level of average net assets for each month. For the period, the fees were equivalent to the following annualized rates:
| | % of Average Net Assets |
| Automotive Portfolio | .04 |
| Communication Services Portfolio | .04 |
| Construction and Housing Portfolio | .04 |
| Consumer Discretionary Portfolio | .04 |
| Leisure Portfolio | .04 |
| Retailing Portfolio | .03 |
Brokerage Commissions. A portion of portfolio transactions were placed with brokerage firms which are affiliates of the investment adviser. Brokerage commissions are included in net realized gain (loss) and change in net unrealized appreciation (depreciation) in the Statement of Operations. The commissions paid to these affiliated firms were as follows:
| | Amount |
| Automotive Portfolio | $576 |
| Communication Services Portfolio | 3,943 |
| Construction and Housing Portfolio | 3,354 |
| Consumer Discretionary Portfolio | 862 |
| Leisure Portfolio | 2,585 |
| Retailing Portfolio | 8,896 |
Interfund Lending Program. Pursuant to an Exemptive Order issued by the SEC, each fund, along with other registered investment companies having management contracts with Fidelity Management & Research Company LLC (FMR), or other affiliated entities of FMR, may participate in an interfund lending program. This program provides an alternative credit facility allowing each fund to borrow from, or lend money to, other participating affiliated funds. At period end, there were no interfund loans outstanding. Activity in this program during the period for which loans were outstanding was as follows:
| | Borrower or Lender | Average Loan Balance | Weighted Average Interest Rate | Interest Expense |
| Communication Services Portfolio | Borrower | $3,623,500 | .34% | $69 |
| Construction and Housing Portfolio | Borrower | $5,209,875 | 1.34% | $1,551 |
| Consumer Discretionary Portfolio | Borrower | $1,565,188 | 1.59% | $1,108 |
| Retailing Portfolio | Borrower | $14,073,867 | .92% | $12,464 |
Interfund Trades. Funds may purchase from or sell securities to other Fidelity Funds under procedures adopted by the Board. The procedures have been designed to ensure these interfund trades are executed in accordance with Rule 17a-7 of the 1940 Act. Interfund trades are included within the respective purchases and sales amounts shown in the Purchases and Sales of Investments note.
Prior Fiscal Year Affiliated Redemptions In-Kind. During the prior period, 233,442 shares of the Consumer Discretionary Portfolio were redeemed in-kind for investments and cash with a value of $10,509,560. The Fund had a net realized gain of $4,367,344 on investments delivered through in-kind redemptions. The amount of the in-kind redemptions is included in share transactions in the accompanying Statement of Changes in Net Assets. Consumer Discretionary Portfolio recognized no gain or loss for federal income tax purposes.
6. Committed Line of Credit.
Certain Funds participate with other funds managed by the investment adviser or an affiliate in a $4.25 billion credit facility (the "line of credit") to be utilized for temporary or emergency purposes to fund shareholder redemptions or for other short-term liquidity purposes. The participating funds have agreed to pay commitment fees on their pro-rata portion of the line of credit, which are reflected in Miscellaneous expenses on the Statement of Operations, and are as follows:
| | Amount |
| Automotive Portfolio | $43 |
| Communication Services Portfolio | 752 |
| Construction and Housing Portfolio | 364 |
| Consumer Discretionary Portfolio | 501 |
| Leisure Portfolio | 526 |
| Retailing Portfolio | 3,436 |
During the period, there were no borrowings on this line of credit.
7. Security Lending.
Certain Funds lend portfolio securities from time to time in order to earn additional income. Lending agents are used, including National Financial Services (NFS), an affiliate of the Funds. Pursuant to a securities lending agreement, NFS will receive a fee, which is capped at 9.9% of a Fund's daily lending revenue, for its services as lending agent. The Funds may lend securities to certain qualified borrowers, including NFS. On the settlement date of the loan, each applicable Fund receives collateral (in the form of U.S. Treasury obligations, letters of credit and/or cash) against the loaned securities and maintains collateral in an amount not less than 100% of the market value of the loaned securities during the period of the loan. The market value of the loaned securities is determined at the close of business of the Funds and any additional required collateral is delivered to the Funds on the next business day. The Funds or borrower may terminate the loan at any time, and if the borrower defaults on its obligation to return the securities loaned because of insolvency or other reasons, the Funds may apply collateral received from the borrower against the obligation. The Funds may experience delays and costs in recovering the securities loaned. Any cash collateral received is invested in the Fidelity Securities Lending Cash Central Fund. The value of loaned securities and cash collateral at period end are disclosed on each applicable Fund's Statement of Assets and Liabilities. At period end, there were no security loans outstanding with NFS, an affiliated borrower. Security lending income represents the income earned on investing cash collateral, less rebates paid to borrowers and any lending agent fees associated with the loan, plus any premium payments received for lending certain types of securities. Net income from Fidelity Central Funds is presented in the Statement of Operations as a component of income from Fidelity Central Funds. Affiliated security lending activity was as follows:
| | Total Security Lending Income Fees Paid to NFS | Security Lending Income From Securities Loaned to NFS |
| Automotive Portfolio | $286 | $– |
| Communication Services Portfolio | $22,234 | $2 |
| Construction and Housing Portfolio | $155 | $– |
| Consumer Discretionary Portfolio | $1,060 | $– |
| Leisure Portfolio | $2,988 | $– |
| Retailing Portfolio | $9,053 | $– |
8. Bank Borrowings.
Each Fund is permitted to have bank borrowings for temporary or emergency purposes to fund shareholder redemptions or for other short-term liquidity requirements. Each Fund has established borrowing arrangements with certain banks. The interest rate on the borrowings is the bank's base rate, as revised from time to time. Any open loans, including accrued interest, at period end are presented under the caption "Notes payable" in the Statement of Assets and Liabilities, if applicable. Activity in this program during the period for which loans were outstanding was as follows:
| | Average Loan Balance | Weighted Average Interest Rate | Interest Expense |
| Consumer Discretionary Portfolio | $1,436,538 | 1.06% | $548 |
9. Expense Reductions.
Commissions paid to certain brokers with whom the investment adviser, or its affiliates, places trades on behalf of certain Funds include an amount in addition to trade execution, which may be rebated back to the Funds to offset certain expenses. All of the applicable expense reductions are noted in the table below.
| | Brokerage service rebates |
| Automotive Portfolio | $860 |
| Communication Services Portfolio | 28,878 |
| Construction and Housing Portfolio | 45,925 |
| Consumer Discretionary Portfolio | 6,817 |
| Leisure Portfolio | 33,658 |
| Retailing Portfolio | 160,296 |
In addition, during the period the investment adviser or an affiliate reimbursed and/or waived a portion of fund-level operating expenses as follows:
| | Amount |
| Automotive Portfolio | $84 |
| Communication Services Portfolio | 1,283 |
| Construction and Housing Portfolio | 748 |
| Consumer Discretionary Portfolio | 903 |
| Leisure Portfolio | 1,006 |
| Retailing Portfolio | 6,193 |
10. Distributions to Shareholders.
Distributions to shareholders of each class were as follows:
| | Six months ended
August 31, 2020 | Year ended
February 29, 2020 |
| Communication Services Portfolio | | |
| Distributions to shareholders | | |
| Class A | $218,147 | $798,640 |
| Class M | 43,040 | 242,564 |
| Class C | 46,096 | 201,206 |
| Communication Services | 12,783,820 | 178,269,893 |
| Class I | 48,553 | 316,058 |
| Class Z | 41,055 | 300,481 |
| Total | $13,180,711 | $180,128,842 |
11. Share Transactions.
Share transactions for each class were as follows and may contain automatic conversions between classes or exchanges between affiliated funds:
| | Shares | Shares | Dollars | Dollars |
| | Six months ended August 31, 2020 | Year ended February 29, 2020 | Six months ended August 31, 2020 | Year ended February 29, 2020 |
| Communication Services Portfolio | | | | |
| Class A | | | | |
| Shares sold | 183,160 | 163,941 | $10,857,508 | $10,592,862 |
| Reinvestment of distributions | 4,024 | 12,499 | 217,520 | 794,118 |
| Shares redeemed | (84,779) | (21,919) | (4,682,847) | (1,385,300) |
| Net increase (decrease) | 102,405 | 154,521 | $6,392,181 | $10,001,680 |
| Class M | | | | |
| Shares sold | 38,060 | 40,632 | $2,532,360 | $2,626,137 |
| Reinvestment of distributions | 798 | 3,855 | 43,040 | 242,564 |
| Shares redeemed | (14,710) | (13,568) | (834,702) | (861,553) |
| Net increase (decrease) | 24,148 | 30,919 | $1,740,698 | $2,007,148 |
| Class C | | | | |
| Shares sold | 27,058 | 32,141 | $1,759,437 | $2,084,369 |
| Reinvestment of distributions | 860 | 3,184 | 46,096 | 199,573 |
| Shares redeemed | (7,676) | (7,441) | (436,503) | (459,981) |
| Net increase (decrease) | 20,242 | 27,884 | $1,369,030 | $1,823,961 |
| Communication Services | | | | |
| Shares sold | 1,259,943 | 2,955,352 | $80,871,063 | $190,171,586 |
| Reinvestment of distributions | 227,417 | 2,705,020 | 12,337,334 | 169,393,115 |
| Shares redeemed | (1,758,755) | (3,681,065) | (107,897,773) | (235,496,213) |
| Net increase (decrease) | (271,395) | 1,979,307 | $(14,689,376) | $124,068,488 |
| Class I | | | | |
| Shares sold | 218,951 | 63,284 | $14,449,225 | $4,090,035 |
| Reinvestment of distributions | 888 | 4,990 | 48,174 | 315,170 |
| Shares redeemed | (30,272) | (33,315) | (1,876,297) | (2,081,507) |
| Net increase (decrease) | 189,567 | 34,959 | $12,621,102 | $2,323,698 |
| Class Z | | | | |
| Shares sold | 121,078 | 25,004 | $8,178,654 | $1,643,568 |
| Reinvestment of distributions | 712 | 4,650 | 38,657 | 293,270 |
| Shares redeemed | (20,980) | (6,601) | (1,349,059) | (443,166) |
| Net increase (decrease) | 100,810 | 23,053 | $6,868,252 | $1,493,672 |
12. Other.
The Funds' organizational documents provide former and current trustees and officers with a limited indemnification against liabilities arising in connection with the performance of their duties to the Funds. In the normal course of business, the Funds may also enter into contracts that provide general indemnifications. The Funds' maximum exposure under these arrangements is unknown as this would be dependent on future claims that may be made against the Funds. The risk of material loss from such claims is considered remote.
13. Coronavirus (COVID-19) Pandemic.
An outbreak of COVID-19 first detected in China during December 2019 has since spread globally and was declared a pandemic by the World Health Organization during March 2020. Developments that disrupt global economies and financial markets, such as the COVID-19 pandemic, may magnify factors that affect the Funds' performance.
Shareholder Expense Example
As a shareholder, you incur two types of costs: (1) transaction costs, which may include sales charges (loads) on purchase payments or redemption proceeds, as applicable and (2) ongoing costs, which generally include management fees, distribution and/or service (12b-1) fees and other Fund expenses. This Example is intended to help you understand your ongoing costs (in dollars) of investing in a fund and to compare these costs with the ongoing costs of investing in other mutual funds.
The Example is based on an investment of $1,000 invested at the beginning of the period and held for the entire period (March 1, 2020 to August 31, 2020).
Actual Expenses
The first line of the accompanying table provides information about actual account values and actual expenses. You may use the information in this line, together with the amount you invested, to estimate the expenses that you paid over the period. Simply divide your account value by $1,000.00 (for example, an $8,600 account value divided by $1,000.00 = 8.6), then multiply the result by the number in the first line for a class/Fund under the heading entitled "Expenses Paid During Period" to estimate the expenses you paid on your account during this period. If any fund is a shareholder of any underlying mutual funds or exchange-traded funds (ETFs) (the Underlying Funds), such fund indirectly bears its proportional share of the expenses of the Underlying Funds in addition to the direct expenses incurred presented in the table. These fees and expenses are not included in the annualized expense ratio used to calculate the expense estimate in the table below.
Hypothetical Example for Comparison Purposes
The second line of the accompanying table provides information about hypothetical account values and hypothetical expenses based on the actual expense ratio and an assumed rate of return of 5% per year before expenses, which is not the actual return. The hypothetical account values and expenses may not be used to estimate the actual ending account balance or expenses you paid for the period. You may use this information to compare the ongoing costs of investing in the Fund and other funds. To do so, compare this 5% hypothetical example with the 5% hypothetical examples that appear in the shareholder reports of the other funds. If any fund is a shareholder of any Underlying Funds, such fund indirectly bears its proportional share of the expenses of the Underlying Funds in addition to the direct expenses as presented in the table. These fees and expenses are not included in the annualized expense ratio used to calculate the expense estimate in the table below.
Please note that the expenses shown in the table are meant to highlight your ongoing costs only and do not reflect any transaction costs. Therefore, the second line of the table is useful in comparing ongoing costs only, and will not help you determine the relative total costs of owning different funds. In addition, if these transactional costs were included, your costs would have been higher.
| | Annualized Expense Ratio-A | Beginning
Account Value
March 1, 2020 | Ending
Account Value
August 31, 2020 | Expenses Paid
During Period-B
March 1, 2020
to August 31, 2020 |
| Automotive Portfolio | 1.00% | | | |
| Actual | | $1,000.00 | $1,348.60 | $5.92 |
| Hypothetical-C | | $1,000.00 | $1,020.16 | $5.09 |
| Communication Services Portfolio | | | | |
| Class A | 1.09% | | | |
| Actual | | $1,000.00 | $1,287.70 | $6.29 |
| Hypothetical-C | | $1,000.00 | $1,019.71 | $5.55 |
| Class M | 1.34% | | | |
| Actual | | $1,000.00 | $1,286.20 | $7.72 |
| Hypothetical-C | | $1,000.00 | $1,018.45 | $6.82 |
| Class C | 1.79% | | | |
| Actual | | $1,000.00 | $1,283.20 | $10.30 |
| Hypothetical-C | | $1,000.00 | $1,016.18 | $9.10 |
| Communication Services | .78% | | | |
| Actual | | $1,000.00 | $1,289.80 | $4.50 |
| Hypothetical-C | | $1,000.00 | $1,021.27 | $3.97 |
| Class I | .76% | | | |
| Actual | | $1,000.00 | $1,290.10 | $4.39 |
| Hypothetical-C | | $1,000.00 | $1,021.37 | $3.87 |
| Class Z | .64% | | | |
| Actual | | $1,000.00 | $1,290.70 | $3.70 |
| Hypothetical-C | | $1,000.00 | $1,021.98 | $3.26 |
| Construction and Housing Portfolio | .81% | | | |
| Actual | | $1,000.00 | $1,220.20 | $4.53 |
| Hypothetical-C | | $1,000.00 | $1,021.12 | $4.13 |
| Consumer Discretionary Portfolio | .77% | | | |
| Actual | | $1,000.00 | $1,303.60 | $4.47 |
| Hypothetical-C | | $1,000.00 | $1,021.32 | $3.92 |
| Leisure Portfolio | .78% | | | |
| Actual | | $1,000.00 | $1,102.00 | $4.13 |
| Hypothetical-C | | $1,000.00 | $1,021.27 | $3.97 |
| Retailing Portfolio | .74% | | | |
| Actual | | $1,000.00 | $1,389.60 | $4.46 |
| Hypothetical-C | | $1,000.00 | $1,021.48 | $3.77 |
A Annualized expense ratio reflects expenses net of applicable fee waivers.
B Expenses are equal to the annualized expense ratio, multiplied by the average account value over the period, multiplied by 184/ 365 (to reflect the one-half year period). The fees and expenses of any Underlying Funds are not included in each annualized expense ratio.
C 5% return per year before expenses
Proxy Voting Results
A special meeting of shareholders was held on June 9, 2020. The results of votes taken among shareholders on the proposal before them are reported below. Each vote reported represents one dollar of net asset value held on the record date for the meeting.
PROPOSAL 1
To elect a Board of Trustees.
| | # of
Votes | % of
Votes |
| Dennis J. Dirks |
| Affirmative | 32,463,705,305.665 | 92.437 |
| Withheld | 2,655,951,104.308 | 7.563 |
| TOTAL | 35,119,656,409.973 | 100.000 |
| Donald F. Donahue |
| Affirmative | 32,446,843,861.354 | 92.389 |
| Withheld | 2,672,812,548.619 | 7.611 |
| TOTAL | 35,119,656,409.973 | 100.000 |
| Bettina Doulton |
| Affirmative | 32,610,463,757.584 | 92.855 |
| Withheld | 2,509,192,652.389 | 7.145 |
| TOTAL | 35,119,656,409.973 | 100.000 |
| Vicki L. Fuller |
| Affirmative | 32,688,213,522.720 | 93.077 |
| Withheld | 2,431,442,887.253 | 6.923 |
| TOTAL | 35,119,656,409.973 | 100.000 |
| Patricia L. Kampling |
| Affirmative | 32,313,755,598.535 | 92.010 |
| Withheld | 2,805,900,811.438 | 7.990 |
| TOTAL | 35,119,656,409.973 | 100.000 |
| Alan J. Lacy |
| Affirmative | 31,990,158,754.948 | 91.089 |
| Withheld | 3,129,497,655.026 | 8.911 |
| TOTAL | 35,119,656,409.973 | 100.000 |
| Ned C. Lautenbach |
| Affirmative | 32,043,019,991.143 | 91.240 |
| Withheld | 3,076,636,418.830 | 8.760 |
| TOTAL | 35,119,656,409.973 | 100.000 |
| Robert A. Lawrence |
| Affirmative | 32,150,842,398.009 | 91.547 |
| Withheld | 2,968,814,011.965 | 8.453 |
| TOTAL | 35,119,656,409.973 | 100.000 |
| Joseph Mauriello |
| Affirmative | 32,082,201,213.166 | 91.351 |
| Withheld | 3,037,455,196.807 | 8.649 |
| TOTAL | 35,119,656,409.973 | 100.000 |
| Cornelia M. Small |
| Affirmative | 32,207,976,835.934 | 91.709 |
| Withheld | 2,911,679,574.039 | 8.291 |
| TOTAL | 35,119,656,409.973 | 100.000 |
| Garnett A. Smith |
| Affirmative | 32,102,654,343.096 | 91.409 |
| Withheld | 3,017,002,066.877 | 8.591 |
| TOTAL | 35,119,656,409.973 | 100.000 |
| David M. Thomas |
| Affirmative | 32,150,749,424.556 | 91.546 |
| Withheld | 2,968,906,985.418 | 8.454 |
| TOTAL | 35,119,656,409.973 | 100.000 |
| Susan Tomasky |
| Affirmative | 32,381,933,484.515 | 92.205 |
| Withheld | 2,737,722,925.459 | 7.795 |
| TOTAL | 35,119,656,409.973 | 100.000 |
| Michael E. Wiley |
| Affirmative | 32,135,064,741.973 | 91.502 |
| Withheld | 2,984,591,668.000 | 8.498 |
| TOTAL | 35,119,656,409.973 | 100.000 |
|
| Proposal 1 reflects trust wide proposal and voting results. |

SELCON-SANN-1020
1.813637.115
Fidelity® Select Portfolios®
Energy Sector
Energy Portfolio
Energy Service Portfolio
Natural Gas Portfolio
Natural Resources Portfolio
Semi-Annual Report
August 31, 2020
See the inside front cover for important information about access to your fund’s shareholder reports.
Beginning on January 1, 2021, as permitted by regulations adopted by the Securities and Exchange Commission, paper copies of a fund’s shareholder reports will no longer be sent by mail, unless you specifically request paper copies of the reports from the fund or from your financial intermediary, such as a financial advisor, broker-dealer or bank. Instead, the reports will be made available on a website, and you will be notified by mail each time a report is posted and provided with a website link to access the report.
If you already elected to receive shareholder reports electronically, you will not be affected by this change and you need not take any action. You may elect to receive shareholder reports and other communications from a fund electronically, by contacting your financial intermediary. For Fidelity customers, visit Fidelity's web site or call Fidelity using the contact information listed below.
You may elect to receive all future reports in paper free of charge. If you wish to continue receiving paper copies of your shareholder reports, you may contact your financial intermediary or, if you are a Fidelity customer, visit Fidelity’s website, or call Fidelity at the applicable toll-free number listed below. Your election to receive reports in paper will apply to all funds held with the fund complex/your financial intermediary.
| Account Type | Website | Phone Number |
| Brokerage, Mutual Fund, or Annuity Contracts: | fidelity.com/mailpreferences | 1-800-343-3548 |
| Employer Provided Retirement Accounts: | netbenefits.fidelity.com/preferences (choose 'no' under Required Disclosures to continue to print) | 1-800-343-0860 |
| Advisor Sold Accounts Serviced Through Your Financial Intermediary: | Contact Your Financial Intermediary | Your Financial Intermediary's phone number |
| Advisor Sold Accounts Serviced by Fidelity: | institutional.fidelity.com | 1-877-208-0098 |
Contents
To view a fund's proxy voting guidelines and proxy voting record for the 12-month period ended June 30, visit http://www.fidelity.com/proxyvotingresults or visit the Securities and Exchange Commission's (SEC) web site at http://www.sec.gov.
You may also call 1-800-544-8544 to request a free copy of the proxy voting guidelines.
Standard & Poor's, S&P and S&P 500 are registered service marks of The McGraw-Hill Companies, Inc. and have been licensed for use by Fidelity Distributors Corporation.
Other third-party marks appearing herein are the property of their respective owners.
All other marks appearing herein are registered or unregistered trademarks or service marks of FMR LLC or an affiliated company. © 2020 FMR LLC. All rights reserved.
This report and the financial statements contained herein are submitted for the general information of the shareholders of the Funds. This report is not authorized for distribution to prospective investors in the Funds unless preceded or accompanied by an effective prospectus.
A fund files its complete schedule of portfolio holdings with the SEC for the first and third quarters of each fiscal year on Form N-PORT. Forms N-PORT are available on the SEC’s web site at http://www.sec.gov. A fund's Forms N-PORT may be reviewed and copied at the SEC’s Public Reference Room in Washington, DC. Information regarding the operation of the SEC's Public Reference Room may be obtained by calling 1-800-SEC-0330.
For a complete list of a fund's portfolio holdings, view the most recent holdings listing, semiannual report, or annual report on Fidelity's web site at http://www.fidelity.com, http://www.institutional.fidelity.com, or http://www.401k.com, as applicable.
NOT FDIC INSURED •MAY LOSE VALUE •NO BANK GUARANTEE
Neither the Funds nor Fidelity Distributors Corporation is a bank.
Note to Shareholders:
Early in 2020, the outbreak and spread of a new coronavirus emerged as a public health emergency that had a major influence on financial markets, primarily based on its impact on the global economy and the outlook for corporate earnings. The virus causes a respiratory disease known as COVID-19. On March 11, the World Health Organization declared the COVID-19 outbreak a pandemic, citing sustained risk of further global spread.
In the weeks following, as the crisis worsened, we witnessed an escalating human tragedy with wide-scale social and economic consequences from coronavirus-containment measures. The outbreak of COVID-19 prompted a number of measures to limit the spread, including travel and border restrictions, quarantines, and restrictions on large gatherings. In turn, these resulted in lower consumer activity, diminished demand for a wide range of products and services, disruption in manufacturing and supply chains, and – given the wide variability in outcomes regarding the outbreak – significant market uncertainty and volatility. Amid the turmoil, the U.S. government took unprecedented action – in concert with the U.S. Federal Reserve and central banks around the world – to help support consumers, businesses, and the broader economy, and to limit disruption to the financial system.
The situation continues to unfold, and the extent and duration of its impact on financial markets and the economy remain highly uncertain. Extreme events such as the coronavirus crisis are “exogenous shocks” that can have significant adverse effects on mutual funds and their investments. Although multiple asset classes may be affected by market disruption, the duration and impact may not be the same for all types of assets.
Fidelity is committed to helping you stay informed amid news about COVID-19 and during increased market volatility, and we’re taking extra steps to be responsive to customer needs. We encourage you to visit our websites, where we offer ongoing updates, commentary, and analysis on the markets and our funds.
Energy Portfolio
Investment Summary (Unaudited)
Top Ten Stocks as of August 31, 2020
| | % of fund's net assets |
| Chevron Corp. | 18.0 |
| Exxon Mobil Corp. | 12.7 |
| Cheniere Energy, Inc. | 5.8 |
| BP PLC sponsored ADR | 5.5 |
| The Williams Companies, Inc. | 4.3 |
| EOG Resources, Inc. | 4.0 |
| Pioneer Natural Resources Co. | 3.9 |
| ConocoPhillips Co. | 3.7 |
| Marathon Petroleum Corp. | 3.5 |
| Valero Energy Corp. | 3.5 |
| | 64.9 |
Top Industries (% of fund's net assets)
| As of August 31, 2020 |
| | Oil, Gas & Consumable Fuels | 87.4% |
| | Energy Equipment & Services | 8.5% |
| | Independent Power and Renewable Electricity Producers | 3.1% |
| | All Others* | 1.0% |

* Includes short-term investments and net other assets (liabilities).
Energy Portfolio
Schedule of Investments August 31, 2020 (Unaudited)
Showing Percentage of Net Assets
| Common Stocks - 99.0% | | | |
| | | Shares | Value |
| Energy Equipment & Services - 8.5% | | | |
| Oil & Gas Drilling - 0.8% | | | |
| Nabors Industries Ltd. (a) | | 34,558 | $1,381,629 |
| Odfjell Drilling Ltd. (b) | | 1,835,680 | 2,437,571 |
| Patterson-UTI Energy, Inc. | | 379,500 | 1,461,075 |
| Shelf Drilling Ltd. (b)(c) | | 1,474,713 | 496,315 |
| | | | 5,776,590 |
| Oil & Gas Equipment & Services - 7.7% | | | |
| Baker Hughes Co. Class A (a) | | 1,674,140 | 23,906,719 |
| Cactus, Inc. | | 166,300 | 3,673,567 |
| Forum Energy Technologies, Inc. (b) | | 491,419 | 268,855 |
| Nextier Oilfield Solutions, Inc. (b) | | 762,900 | 1,922,508 |
| Oceaneering International, Inc. (b) | | 253,000 | 1,363,670 |
| ProPetro Holding Corp. (b) | | 759,300 | 4,768,404 |
| RigNet, Inc. (b) | | 582,601 | 2,907,179 |
| Schlumberger Ltd. | | 386,458 | 7,346,567 |
| TechnipFMC PLC | | 799,700 | 6,157,690 |
| | | | 52,315,159 |
|
| TOTAL ENERGY EQUIPMENT& SERVICES | | | 58,091,749 |
|
| Independent Power and Renewable Electricity Producers - 3.1% | | | |
| Independent Power Producers & Energy Traders - 3.1% | | | |
| Vistra Corp. | | 1,117,200 | 21,483,756 |
| Oil, Gas & Consumable Fuels - 87.4% | | | |
| Integrated Oil & Gas - 41.9% | | | |
| BP PLC sponsored ADR | | 1,787,100 | 37,404,003 |
| Chevron Corp. | | 1,465,723 | 123,018,131 |
| Exxon Mobil Corp. | | 2,167,648 | 86,575,861 |
| Occidental Petroleum Corp. | | 479,400 | 6,107,556 |
| Occidental Petroleum Corp. warrants 8/3/27 (b) | | 63,600 | 187,620 |
| Royal Dutch Shell PLC Class B sponsored ADR | | 488,600 | 13,729,660 |
| Suncor Energy, Inc. | | 831,600 | 13,344,109 |
| Total SA sponsored ADR | | 156,200 | 6,180,834 |
| | | | 286,547,774 |
| Oil & Gas Exploration & Production - 22.1% | | | |
| Callon Petroleum Co. (a)(b) | | 76,900 | 509,847 |
| Canadian Natural Resources Ltd. | | 806,100 | 15,895,191 |
| Cimarex Energy Co. | | 161,300 | 4,480,914 |
| Concho Resources, Inc. | | 57,100 | 2,968,058 |
| ConocoPhillips Co. | | 675,800 | 25,606,062 |
| Devon Energy Corp. | | 275,700 | 2,996,859 |
| EOG Resources, Inc. | | 605,164 | 27,438,136 |
| Hess Corp. | | 96,500 | 4,442,860 |
| Magnolia Oil & Gas Corp. Class A (b) | | 533,100 | 3,433,164 |
| National Energy Services Reunited Corp. (b) | | 788,300 | 5,943,782 |
| Noble Energy, Inc. | | 1,319,400 | 13,128,030 |
| Northern Oil & Gas, Inc. (a)(b) | | 3,643,400 | 2,472,047 |
| Parsley Energy, Inc. Class A | | 554,500 | 5,960,875 |
| PDC Energy, Inc. (b) | | 470,751 | 7,127,170 |
| Pioneer Natural Resources Co. | | 257,899 | 26,803,443 |
| Viper Energy Partners LP | | 225,159 | 2,292,119 |
| | | | 151,498,557 |
| Oil & Gas Refining & Marketing - 9.8% | | | |
| Marathon Petroleum Corp. | | 683,692 | 24,243,718 |
| Phillips 66 Co. | | 314,873 | 18,410,624 |
| Valero Energy Corp. | | 456,600 | 24,012,594 |
| World Fuel Services Corp. | | 25,500 | 673,200 |
| | | | 67,340,136 |
| Oil & Gas Storage & Transport - 13.6% | | | |
| Cheniere Energy, Inc. (b) | | 764,100 | 39,771,405 |
| Enterprise Products Partners LP | | 587,700 | 10,320,012 |
| Euronav NV | | 102,700 | 936,624 |
| Golar LNG Ltd. (a)(b) | | 380,600 | 3,939,210 |
| Noble Midstream Partners LP | | 514,314 | 4,608,253 |
| Teekay LNG Partners LP | | 366,400 | 4,056,048 |
| The Williams Companies, Inc. | | 1,403,800 | 29,142,888 |
| | | | 92,774,440 |
|
| TOTAL OIL, GAS & CONSUMABLE FUELS | | | 598,160,907 |
|
| TOTAL COMMON STOCKS | | | |
| (Cost $893,167,769) | | | 677,736,412 |
|
| Money Market Funds - 4.8% | | | |
| Fidelity Cash Central Fund 0.12% (d) | | 1,150,086 | 1,150,316 |
| Fidelity Securities Lending Cash Central Fund 0.11% (d)(e) | | 31,410,362 | 31,413,503 |
| TOTAL MONEY MARKET FUNDS | | | |
| (Cost $32,563,819) | | | 32,563,819 |
| TOTAL INVESTMENT IN SECURITIES - 103.8% | | | |
| (Cost $925,731,588) | | | 710,300,231 |
| NET OTHER ASSETS (LIABILITIES) - (3.8)% | | | (25,967,214) |
| NET ASSETS - 100% | | | $684,333,017 |
Legend
(a) Security or a portion of the security is on loan at period end.
(b) Non-income producing
(c) Security exempt from registration under Rule 144A of the Securities Act of 1933. These securities may be resold in transactions exempt from registration, normally to qualified institutional buyers. At the end of the period, the value of these securities amounted to $496,315 or 0.1% of net assets.
(d) Affiliated fund that is generally available only to investment companies and other accounts managed by Fidelity Investments. The rate quoted is the annualized seven-day yield of the fund at period end. A complete unaudited listing of the fund's holdings as of its most recent quarter end is available upon request. In addition, each Fidelity Central Fund's financial statements are available on the SEC's website or upon request.
(e) Investment made with cash collateral received from securities on loan.
Affiliated Central Funds
Information regarding fiscal year to date income earned by the Fund from investments in Fidelity Central Funds is as follows:
| Fund | Income earned |
| Fidelity Cash Central Fund | $11,204 |
| Fidelity Securities Lending Cash Central Fund | 43,429 |
| Total | $54,633 |
Amounts in the income column in the above table include any capital gain distributions from underlying funds, which are presented in the corresponding line-item in the Statement of Operations, if applicable. Amount for Fidelity Securities Lending Cash Central Fund represents the income earned on investing cash collateral, less rebates paid to borrowers and any lending agent fees associated with the loan, plus any premium payments received for lending certain types of securities.
Investment Valuation
The following is a summary of the inputs used, as of August 31, 2020, involving the Fund's assets and liabilities carried at fair value. The inputs or methodology used for valuing securities may not be an indication of the risk associated with investing in those securities. For more information on valuation inputs, and their aggregation into the levels used below, please refer to the Investment Valuation section in the accompanying Notes to Financial Statements.
| | Valuation Inputs at Reporting Date: |
| Description | Total | Level 1 | Level 2 | Level 3 |
| Investments in Securities: | | | | |
| Common Stocks | $677,736,412 | $677,736,412 | $-- | $-- |
| Money Market Funds | 32,563,819 | 32,563,819 | -- | -- |
| Total Investments in Securities: | $710,300,231 | $710,300,231 | $-- | $-- |
Other Information
Distribution of investments by country or territory of incorporation, as a percentage of Total Net Assets, is as follows (Unaudited):
| United States of America | 82.6% |
| United Kingdom | 8.4% |
| Canada | 4.2% |
| Bermuda | 1.1% |
| Curacao | 1.1% |
| Others (Individually Less Than 1%) | 2.6% |
| | 100.0% |
See accompanying notes which are an integral part of the financial statements.
Energy Portfolio
Financial Statements
Statement of Assets and Liabilities
| | | August 31, 2020 (Unaudited) |
| Assets | | |
Investment in securities, at value (including securities loaned of $28,779,435) — See accompanying schedule:
Unaffiliated issuers (cost $893,167,769) | $677,736,412 | |
| Fidelity Central Funds (cost $32,563,819) | 32,563,819 | |
| Total Investment in Securities (cost $925,731,588) | | $710,300,231 |
| Receivable for fund shares sold | | 1,400,941 |
| Dividends receivable | | 6,123,473 |
| Distributions receivable from Fidelity Central Funds | | 9,728 |
| Prepaid expenses | | 11,548 |
| Other receivables | | 296,851 |
| Total assets | | 718,142,772 |
| Liabilities | | |
| Payable for fund shares redeemed | 1,703,897 | |
| Accrued management fee | 314,985 | |
| Other affiliated payables | 175,177 | |
| Other payables and accrued expenses | 207,371 | |
| Collateral on securities loaned | 31,408,325 | |
| Total liabilities | | 33,809,755 |
| Net Assets | | $684,333,017 |
| Net Assets consist of: | | |
| Paid in capital | | $1,381,632,878 |
| Total accumulated earnings (loss) | | (697,299,861) |
| Net Assets | | $684,333,017 |
| Net Asset Value, offering price and redemption price per share ($684,333,017 ÷ 31,962,801 shares) | | $21.41 |
See accompanying notes which are an integral part of the financial statements.
Statement of Operations
| | | Six months ended August 31, 2020 (Unaudited) |
| Investment Income | | |
| Dividends | | $17,160,250 |
| Income from Fidelity Central Funds (including $43,429 from security lending) | | 54,633 |
| Total income | | 17,214,883 |
| Expenses | | |
| Management fee | $1,763,262 | |
| Transfer agent fees | 872,630 | |
| Accounting fees | 119,669 | |
| Custodian fees and expenses | 6,034 | |
| Independent trustees' fees and expenses | 2,166 | |
| Registration fees | 55,446 | |
| Audit | 34,844 | |
| Legal | 514 | |
| Interest | 164 | |
| Miscellaneous | 26,207 | |
| Total expenses before reductions | 2,880,936 | |
| Expense reductions | (93,795) | |
| Total expenses after reductions | | 2,787,141 |
| Net investment income (loss) | | 14,427,742 |
| Realized and Unrealized Gain (Loss) | | |
| Net realized gain (loss) on: | | |
| Investment securities: | | |
| Unaffiliated issuers | (73,688,166) | |
| Fidelity Central Funds | (547) | |
| Foreign currency transactions | (2,437) | |
| Total net realized gain (loss) | | (73,691,150) |
| Change in net unrealized appreciation (depreciation) on: | | |
| Investment securities: | | |
| Unaffiliated issuers | (49,005,458) | |
| Assets and liabilities in foreign currencies | (274) | |
| Total change in net unrealized appreciation (depreciation) | | (49,005,732) |
| Net gain (loss) | | (122,696,882) |
| Net increase (decrease) in net assets resulting from operations | | $(108,269,140) |
See accompanying notes which are an integral part of the financial statements.
Statement of Changes in Net Assets
| | Six months ended August 31, 2020 (Unaudited) | Year ended February 29, 2020 |
| Increase (Decrease) in Net Assets | | |
| Operations | | |
| Net investment income (loss) | $14,427,742 | $19,564,546 |
| Net realized gain (loss) | (73,691,150) | (47,026,999) |
| Change in net unrealized appreciation (depreciation) | (49,005,732) | (239,088,970) |
| Net increase (decrease) in net assets resulting from operations | (108,269,140) | (266,551,423) |
| Distributions to shareholders | (4,066,017) | (17,018,375) |
| Share transactions | | |
| Proceeds from sales of shares | 308,298,295 | 208,781,170 |
| Reinvestment of distributions | 3,863,469 | 16,049,946 |
| Cost of shares redeemed | (191,805,864) | (417,122,444) |
| Net increase (decrease) in net assets resulting from share transactions | 120,355,900 | (192,291,328) |
| Total increase (decrease) in net assets | 8,020,743 | (475,861,126) |
| Net Assets | | |
| Beginning of period | 676,312,274 | 1,152,173,400 |
| End of period | $684,333,017 | $676,312,274 |
| Other Information | | |
| Shares | | |
| Sold | 15,556,729 | 6,071,489 |
| Issued in reinvestment of distributions | 198,534 | 450,411 |
| Redeemed | (9,040,223) | (12,000,042) |
| Net increase (decrease) | 6,715,040 | (5,478,142) |
See accompanying notes which are an integral part of the financial statements.
Financial Highlights
Energy Portfolio
| | Six months ended (Unaudited) August 31, | Years endedFebruary 28, | | | | |
| | 2020 | 2020 A | 2019 | 2018 | 2017 | 2016 A |
| Selected Per–Share Data | | | | | | |
| Net asset value, beginning of period | $26.79 | $37.50 | $41.01 | $44.10 | $32.63 | $45.64 |
| Income from Investment Operations | | | | | | |
| Net investment income (loss)B | .46 | .71 | .49 | .75C | .18 | .42 |
| Net realized and unrealized gain (loss) | (5.70) | (10.76) | (3.51) | (3.06) | 11.58 | (12.98) |
| Total from investment operations | (5.24) | (10.05) | (3.02) | (2.31) | 11.76 | (12.56) |
| Distributions from net investment income | (.14) | (.64) | (.48) | (.68) | (.24) | (.39) |
| Distributions from net realized gain | – | (.02) | (.01) | (.10) | (.05) | (.07) |
| Total distributions | (.14) | (.66) | (.49) | (.78) | (.29) | (.45)D |
| Redemption fees added to paid in capitalB | – | – | – | – | –E | –E |
| Net asset value, end of period | $21.41 | $26.79 | $37.50 | $41.01 | $44.10 | $32.63 |
| Total ReturnF,G | (19.53)% | (27.24)% | (7.30)% | (5.27)% | 36.05% | (27.61)% |
| Ratios to Average Net AssetsH,I | | | | | | |
| Expenses before reductions | .87%J | .81% | .78% | .79% | .79% | .80% |
| Expenses net of fee waivers, if any | .87%J | .81% | .78% | .79% | .79% | .80% |
| Expenses net of all reductions | .84%J | .80% | .77% | .78% | .78% | .79% |
| Net investment income (loss) | 4.35%J | 2.00% | 1.12% | 1.82%C | .44% | 1.03% |
| Supplemental Data | | | | | | |
| Net assets, end of period (000 omitted) | $684,333 | $676,312 | $1,152,173 | $1,778,436 | $2,289,350 | $1,928,897 |
| Portfolio turnover rateK | 28%J | 79%L | 59%L | 59% | 93%L | 79% |
A For the year ended February 29.
B Calculated based on average shares outstanding during the period.
C Net investment income per share reflects one or more large, non-recurring dividend which amounted to $.48 per share. Excluding such non-recurring dividend, the ratio of net investment income (loss) to average net assets would have been .66%.
D Total distributions of $.45 per share is comprised of distributions from net investment income of $.387 and distributions from net realized gain of $.066 per share.
E Amount represents less than $.005 per share.
F Total returns for periods of less than one year are not annualized.
G Total returns would have been lower if certain expenses had not been reduced during the applicable periods shown.
H Fees and expenses of any underlying mutual funds or exchange-traded funds (ETFs) are not included in the Fund's expense ratio. The Fund indirectly bears its proportionate share of these expenses. For additional expense information related to investments in Fidelity Central Funds, please refer to the "Investments in Fidelity Central Funds" note found in the Notes to Financial Statements section of the most recent Annual or Semi-Annual report.
I Expense ratios reflect operating expenses of the class. Expenses before reductions do not reflect amounts reimbursed, waived, or reduced through arrangements with the investment advisor, brokerage services, or other offset arrangements, if applicable, and do not represent the amount paid by the class during periods when reimbursements, waivers or reductions occur.
J Annualized
K Amount does not include the portfolio activity of any underlying Fidelity Central Funds.
L Portfolio turnover rate excludes securities received or delivered in-kind.
See accompanying notes which are an integral part of the financial statements.
Energy Service Portfolio
Investment Summary (Unaudited)
Top Ten Stocks as of August 31, 2020
| | % of fund's net assets |
| Baker Hughes Co. Class A | 14.2 |
| Schlumberger Ltd. | 13.8 |
| TechnipFMC PLC | 6.2 |
| National Energy Services Reunited Corp. | 5.5 |
| Halliburton Co. | 5.0 |
| Cheniere Energy, Inc. | 5.0 |
| Championx Corp. | 4.9 |
| Cactus, Inc. | 4.8 |
| Dril-Quip, Inc. | 4.2 |
| Tenaris SA sponsored ADR | 3.4 |
| | 67.0 |
Top Industries (% of fund's net assets)
| As of August 31, 2020 |
| | Energy Equipment & Services | 86.1% |
| | Oil, Gas & Consumable Fuels | 11.1% |
| | All Others* | 2.8% |

* Includes short-term investments and net other assets (liabilities).
Energy Service Portfolio
Schedule of Investments August 31, 2020 (Unaudited)
Showing Percentage of Net Assets
| Common Stocks - 97.2% | | | |
| | | Shares | Value |
| Energy Equipment & Services - 86.1% | | | |
| Oil & Gas Drilling - 9.6% | | | |
| Borr Drilling Ltd. (a)(b) | | 95,212 | $83,706 |
| Helmerich & Payne, Inc. | | 208,498 | 3,436,047 |
| Independence Contract Drilling, Inc. (b) | | 74,562 | 207,282 |
| Nabors Industries Ltd. (a) | | 60,341 | 2,412,433 |
| Odfjell Drilling Ltd. (a)(b) | | 3,599,482 | 4,779,696 |
| Patterson-UTI Energy, Inc. | | 795,290 | 3,061,867 |
| Shelf Drilling Ltd. (b)(c) | | 3,743,976 | 1,260,035 |
| Transocean Ltd. (United States) (a)(b) | | 355,200 | 433,344 |
| | | | 15,674,410 |
| Oil & Gas Equipment & Services - 76.5% | | | |
| Archrock, Inc. | | 463,416 | 3,040,009 |
| Baker Hughes Co. Class A (a) | | 1,609,538 | 22,984,199 |
| Cactus, Inc. | | 349,786 | 7,726,773 |
| Championx Corp. (b) | | 771,848 | 7,903,724 |
| Core Laboratories NV (a) | | 42,200 | 883,246 |
| CSI Compressco LP | | 935,457 | 1,066,421 |
| Dril-Quip, Inc. (b) | | 206,800 | 6,851,284 |
| Forum Energy Technologies, Inc. (b) | | 568,197 | 310,861 |
| Frank's International NV (b) | | 464,583 | 1,073,187 |
| Halliburton Co. | | 500,850 | 8,103,753 |
| Helix Energy Solutions Group, Inc. (b) | | 761,729 | 2,726,990 |
| National Oilwell Varco, Inc. | | 295,700 | 3,548,400 |
| Nextier Oilfield Solutions, Inc. (b) | | 1,576,400 | 3,972,528 |
| Oceaneering International, Inc. (b) | | 801,525 | 4,320,220 |
| Oil States International, Inc. (b) | | 227,625 | 999,274 |
| ProPetro Holding Corp. (b) | | 848,500 | 5,328,580 |
| Ranger Energy Services, Inc. Class A (a)(b) | | 687,587 | 1,849,609 |
| RigNet, Inc. (b) | | 244,735 | 1,221,228 |
| Schlumberger Ltd. | | 1,182,711 | 22,483,336 |
| SEACOR Holdings, Inc. (b) | | 30,900 | 976,749 |
| SEACOR Marine Holdings, Inc. (b) | | 100 | 268 |
| Smart Sand, Inc. (a)(b) | | 271,990 | 375,346 |
| TechnipFMC PLC | | 1,305,372 | 10,051,364 |
| Tenaris SA sponsored ADR | | 477,500 | 5,567,650 |
| TETRA Technologies, Inc. (b) | | 1,185,322 | 806,019 |
| TETRA Technologies, Inc. warrants 12/14/21 (b) | | 300,100 | 7 |
| Weatherford International PLC (a)(b) | | 1,499 | 4,542 |
| | | | 124,175,567 |
|
| TOTAL ENERGY EQUIPMENT & SERVICES | | | 139,849,977 |
|
| Oil, Gas & Consumable Fuels - 11.1% | | | |
| Oil & Gas Exploration & Production - 5.5% | | | |
| National Energy Services Reunited Corp. (a)(b) | | 1,178,274 | 8,884,186 |
| Oil & Gas Storage & Transport - 5.6% | | | |
| Cheniere Energy, Inc. (b) | | 154,812 | 8,057,965 |
| Golar LNG Ltd. (b) | | 93,533 | 968,067 |
| | | | 9,026,032 |
|
| TOTAL OIL, GAS & CONSUMABLE FUELS | | | 17,910,218 |
|
| TOTAL COMMON STOCKS | | | |
| (Cost $290,774,422) | | | 157,760,195 |
|
| Money Market Funds - 14.2% | | | |
| Fidelity Cash Central Fund 0.12% (d) | | 4,734,390 | 4,735,337 |
| Fidelity Securities Lending Cash Central Fund 0.11% (d)(e) | | 18,322,202 | 18,324,034 |
| TOTAL MONEY MARKET FUNDS | | | |
| (Cost $23,059,253) | | | 23,059,371 |
| TOTAL INVESTMENT IN SECURITIES - 111.4% | | | |
| (Cost $313,833,675) | | | 180,819,566 |
| NET OTHER ASSETS (LIABILITIES) - (11.4)% | | | (18,435,396) |
| NET ASSETS - 100% | | | $162,384,170 |
Legend
(a) Security or a portion of the security is on loan at period end.
(b) Non-income producing
(c) Security exempt from registration under Rule 144A of the Securities Act of 1933. These securities may be resold in transactions exempt from registration, normally to qualified institutional buyers. At the end of the period, the value of these securities amounted to $1,260,035 or 0.8% of net assets.
(d) Affiliated fund that is generally available only to investment companies and other accounts managed by Fidelity Investments. The rate quoted is the annualized seven-day yield of the fund at period end. A complete unaudited listing of the fund's holdings as of its most recent quarter end is available upon request. In addition, each Fidelity Central Fund's financial statements are available on the SEC's website or upon request.
(e) Investment made with cash collateral received from securities on loan.
Affiliated Central Funds
Information regarding fiscal year to date income earned by the Fund from investments in Fidelity Central Funds is as follows:
| Fund | Income earned |
| Fidelity Cash Central Fund | $4,057 |
| Fidelity Securities Lending Cash Central Fund | 97,053 |
| Total | $101,110 |
Amounts in the income column in the above table include any capital gain distributions from underlying funds, which are presented in the corresponding line-item in the Statement of Operations, if applicable. Amount for Fidelity Securities Lending Cash Central Fund represents the income earned on investing cash collateral, less rebates paid to borrowers and any lending agent fees associated with the loan, plus any premium payments received for lending certain types of securities.
The value, beginning of period, for the Fidelity Cash Central Fund was $2,393,395. Net realized gain (loss) and change in net unrealized appreciation (depreciation) was $(51) and $0, respectively. Purchases and sales of the Fidelity Cash Central Fund were $55,366,462 and $39,435,772, respectively, during the period.
Investment Valuation
The following is a summary of the inputs used, as of August 31, 2020, involving the Fund's assets and liabilities carried at fair value. The inputs or methodology used for valuing securities may not be an indication of the risk associated with investing in those securities. For more information on valuation inputs, and their aggregation into the levels used below, please refer to the Investment Valuation section in the accompanying Notes to Financial Statements.
| | Valuation Inputs at Reporting Date: |
| Description | Total | Level 1 | Level 2 | Level 3 |
| Investments in Securities: | | | | |
| Common Stocks | $157,760,195 | $157,760,188 | $7 | $-- |
| Money Market Funds | 23,059,371 | 23,059,371 | -- | -- |
| Total Investments in Securities: | $180,819,566 | $180,819,559 | $7 | $-- |
Other Information
Distribution of investments by country or territory of incorporation, as a percentage of Total Net Assets, is as follows (Unaudited):
| United States of America | 63.8% |
| Curacao | 13.8% |
| United Kingdom | 6.2% |
| British Virgin Islands | 5.5% |
| Bermuda | 5.0% |
| Luxembourg | 3.4% |
| Netherlands | 1.2% |
| Others (Individually Less Than 1%) | 1.1% |
| | 100.0% |
See accompanying notes which are an integral part of the financial statements.
Energy Service Portfolio
Financial Statements
Statement of Assets and Liabilities
| | | August 31, 2020 (Unaudited) |
| Assets | | |
Investment in securities, at value (including securities loaned of $17,187,593) — See accompanying schedule:
Unaffiliated issuers (cost $290,774,422) | $157,760,195 | |
| Fidelity Central Funds (cost $23,059,253) | 23,059,371 | |
| Total Investment in Securities (cost $313,833,675) | | $180,819,566 |
| Receivable for investments sold | | 1,617,434 |
| Receivable for fund shares sold | | 622,797 |
| Dividends receivable | | 37,443 |
| Distributions receivable from Fidelity Central Funds | | 13,334 |
| Prepaid expenses | | 2,654 |
| Other receivables | | 67,371 |
| Total assets | | 183,180,599 |
| Liabilities | | |
| Payable for investments purchased | $1,698,357 | |
| Payable for fund shares redeemed | 573,061 | |
| Accrued management fee | 75,725 | |
| Other affiliated payables | 42,784 | |
| Other payables and accrued expenses | 81,851 | |
| Collateral on securities loaned | 18,324,651 | |
| Total liabilities | | 20,796,429 |
| Net Assets | | $162,384,170 |
| Net Assets consist of: | | |
| Paid in capital | | $586,858,120 |
| Total accumulated earnings (loss) | | (424,473,950) |
| Net Assets | | $162,384,170 |
| Net Asset Value, offering price and redemption price per share ($162,384,170 ÷ 13,272,686 shares) | | $12.23 |
See accompanying notes which are an integral part of the financial statements.
Statement of Operations
| | | Six months ended August 31, 2020 (Unaudited) |
| Investment Income | | |
| Dividends | | $1,498,772 |
| Income from Fidelity Central Funds (including $97,053 from security lending) | | 101,110 |
| Total income | | 1,599,882 |
| Expenses | | |
| Management fee | $369,648 | |
| Transfer agent fees | 185,522 | |
| Accounting fees | 27,044 | |
| Custodian fees and expenses | 3,868 | |
| Independent trustees' fees and expenses | 456 | |
| Registration fees | 28,757 | |
| Audit | 25,610 | |
| Legal | 113 | |
| Miscellaneous | 7,708 | |
| Total expenses before reductions | 648,726 | |
| Expense reductions | (18,556) | |
| Total expenses after reductions | | 630,170 |
| Net investment income (loss) | | 969,712 |
| Realized and Unrealized Gain (Loss) | | |
| Net realized gain (loss) on: | | |
| Investment securities: | | |
| Unaffiliated issuers | (47,622,884) | |
| Fidelity Central Funds | 45 | |
| Foreign currency transactions | 6,133 | |
| Total net realized gain (loss) | | (47,616,706) |
| Change in net unrealized appreciation (depreciation) on: | | |
| Investment securities: | | |
| Unaffiliated issuers | 6,799,146 | |
| Assets and liabilities in foreign currencies | 225 | |
| Total change in net unrealized appreciation (depreciation) | | 6,799,371 |
| Net gain (loss) | | (40,817,335) |
| Net increase (decrease) in net assets resulting from operations | | $(39,847,623) |
See accompanying notes which are an integral part of the financial statements.
Statement of Changes in Net Assets
| | Six months ended August 31, 2020 (Unaudited) | Year ended February 29, 2020 |
| Increase (Decrease) in Net Assets | | |
| Operations | | |
| Net investment income (loss) | $969,712 | $3,142,678 |
| Net realized gain (loss) | (47,616,706) | (94,157,598) |
| Change in net unrealized appreciation (depreciation) | 6,799,371 | (34,954,625) |
| Net increase (decrease) in net assets resulting from operations | (39,847,623) | (125,969,545) |
| Distributions to shareholders | (658,867) | (4,506,594) |
| Share transactions | | |
| Proceeds from sales of shares | 99,644,307 | 134,993,891 |
| Reinvestment of distributions | 626,975 | 4,269,353 |
| Cost of shares redeemed | (56,510,189) | (153,007,034) |
| Net increase (decrease) in net assets resulting from share transactions | 43,761,093 | (13,743,790) |
| Total increase (decrease) in net assets | 3,254,603 | (144,219,929) |
| Net Assets | | |
| Beginning of period | 159,129,567 | 303,349,496 |
| End of period | $162,384,170 | $159,129,567 |
| Other Information | | |
| Shares | | |
| Sold | 9,120,652 | 5,361,676 |
| Issued in reinvestment of distributions | 64,042 | 176,201 |
| Redeemed | (5,154,196) | (6,204,797) |
| Net increase (decrease) | 4,030,498 | (666,920) |
See accompanying notes which are an integral part of the financial statements.
Financial Highlights
Energy Service Portfolio
| | Six months ended (Unaudited) August 31, | Years endedFebruary 28, | | | | |
| | 2020 | 2020 A | 2019 | 2018 | 2017 | 2016 A |
| Selected Per–Share Data | | | | | | |
| Net asset value, beginning of period | $17.22 | $30.61 | $42.04 | $54.70 | $37.54 | $54.34 |
| Income from Investment Operations | | | | | | |
| Net investment income (loss)B | .08 | .34 | .26 | 1.41C | .17 | .45 |
| Net realized and unrealized gain (loss) | (5.01) | (13.21) | (11.37) | (10.86) | 17.22 | (16.85) |
| Total from investment operations | (4.93) | (12.87) | (11.11) | (9.45) | 17.39 | (16.40) |
| Distributions from net investment income | (.06) | (.52) | (.32) | (1.77) | (.23) | (.40) |
| Distributions from net realized gain | – | – | – | (1.43) | – | – |
| Total distributions | (.06) | (.52) | (.32) | (3.21)D | (.23) | (.40) |
| Redemption fees added to paid in capitalB | – | – | – | –E | –E | –E |
| Net asset value, end of period | $12.23 | $17.22 | $30.61 | $42.04 | $54.70 | $37.54 |
| Total ReturnF,G | (28.54)% | (42.54)% | (26.36)% | (17.41)% | 46.36% | (30.30)% |
| Ratios to Average Net AssetsH,I | | | | | | |
| Expenses before reductions | .93%J | .90% | .84% | .84% | .85% | .85% |
| Expenses net of fee waivers, if any | .93%J | .90% | .84% | .84% | .85% | .84% |
| Expenses net of all reductions | .90%J | .89% | .81% | .82% | .84% | .81% |
| Net investment income (loss) | 1.39%J | 1.38% | .65% | 3.04%C | .36% | .92% |
| Supplemental Data | | | | | | |
| Net assets, end of period (000 omitted) | $162,384 | $159,130 | $303,349 | $413,055 | $734,091 | $435,375 |
| Portfolio turnover rateK | 33%J | 42% | 80% | 62% | 96% | 58% |
A For the year ended February 29.
B Calculated based on average shares outstanding during the period.
C Net investment income per share reflects one or more large, non-recurring dividend which amounted to $1.34 per share. Excluding such non-recurring dividend, the ratio of net investment income (loss) to average net assets would have been .16%.
D Total distributions of $3.21 per share is comprised of distributions from net investment income of $1.774 and distributions from net realized gain of $1.431 per share.
E Amount represents less than $.005 per share.
F Total returns for periods of less than one year are not annualized.
G Total returns would have been lower if certain expenses had not been reduced during the applicable periods shown.
H Fees and expenses of any underlying mutual funds or exchange-traded funds (ETFs) are not included in the Fund's expense ratio. The Fund indirectly bears its proportionate share of these expenses. For additional expense information related to investments in Fidelity Central Funds, please refer to the "Investments in Fidelity Central Funds" note found in the Notes to Financial Statements section of the most recent Annual or Semi-Annual report.
I Expense ratios reflect operating expenses of the class. Expenses before reductions do not reflect amounts reimbursed, waived, or reduced through arrangements with the investment advisor, brokerage services, or other offset arrangements, if applicable, and do not represent the amount paid by the class during periods when reimbursements, waivers or reductions occur.
J Annualized
K Amount does not include the portfolio activity of any underlying Fidelity Central Funds.
See accompanying notes which are an integral part of the financial statements.
Natural Gas Portfolio
Investment Summary (Unaudited)
Top Ten Stocks as of August 31, 2020
| | % of fund's net assets |
| Enbridge, Inc. | 10.5 |
| TC Energy Corp. | 7.8 |
| The Williams Companies, Inc. | 5.4 |
| Kinder Morgan, Inc. | 5.0 |
| Hess Corp. | 4.7 |
| Schlumberger Ltd. | 4.6 |
| Phillips 66 Co. | 4.4 |
| Occidental Petroleum Corp. | 4.2 |
| EOG Resources, Inc. | 3.5 |
| Pioneer Natural Resources Co. | 3.4 |
| | 53.5 |
Top Industries (% of fund's net assets)
| As of August 31, 2020 |
| | Oil, Gas & Consumable Fuels | 75.3% |
| | Energy Equipment & Services | 12.8% |
| | Gas Utilities | 6.6% |
| | Multi-Utilities | 4.3% |
| | Electric Utilities | 0.5% |
| | All Others* | 0.5% |

* Includes short-term investments and net other assets (liabilities).
Natural Gas Portfolio
Schedule of Investments August 31, 2020 (Unaudited)
Showing Percentage of Net Assets
| Common Stocks - 99.5% | | | |
| | | Shares | Value |
| Electric Utilities - 0.5% | | | |
| Electric Utilities - 0.5% | | | |
| PG&E Corp. (a) | | 46,700 | $432,442 |
| Energy Equipment & Services - 12.8% | | | |
| Oil & Gas Equipment & Services - 12.8% | | | |
| Archrock, Inc. | | 75,900 | 497,904 |
| Baker Hughes Co. Class A (b) | | 154,400 | 2,204,832 |
| Cactus, Inc. | | 23,500 | 519,115 |
| Championx Corp. (a) | | 117,600 | 1,204,224 |
| Core Laboratories NV | | 38,700 | 809,991 |
| Oceaneering International, Inc. (a) | | 53,100 | 286,209 |
| SBM Offshore NV | | 57,700 | 997,383 |
| Schlumberger Ltd. | | 219,118 | 4,165,433 |
| TechnipFMC PLC | | 113,200 | 871,640 |
| | | | 11,556,731 |
| Gas Utilities - 6.6% | | | |
| Gas Utilities - 6.6% | | | |
| Atmos Energy Corp. | | 29,051 | 2,899,871 |
| National Fuel Gas Co. | | 4,300 | 196,252 |
| ONE Gas, Inc. | | 9,853 | 730,304 |
| UGI Corp. | | 62,000 | 2,140,860 |
| | | | 5,967,287 |
| Multi-Utilities - 4.3% | | | |
| Multi-Utilities - 4.3% | | | |
| CenterPoint Energy, Inc. | | 142,300 | 2,855,961 |
| NiSource, Inc. | | 46,700 | 1,034,872 |
| | | | 3,890,833 |
| Oil, Gas & Consumable Fuels - 75.3% | | | |
| Integrated Oil & Gas - 6.0% | | | |
| Cenovus Energy, Inc. (Canada) | | 43,718 | 206,465 |
| Occidental Petroleum Corp. | | 298,515 | 3,803,081 |
| Occidental Petroleum Corp. warrants 8/3/27 (a) | | 70,150 | 206,943 |
| Suncor Energy, Inc. | | 74,700 | 1,197,441 |
| | | | 5,413,930 |
| Oil & Gas Exploration & Production - 26.9% | | | |
| Apache Corp. | | 170,400 | 2,521,920 |
| Cabot Oil & Gas Corp. | | 94,904 | 1,800,329 |
| Canadian Natural Resources Ltd. | | 144,280 | 2,837,988 |
| ConocoPhillips Co. | | 54,100 | 2,049,849 |
| EOG Resources, Inc. | | 69,200 | 3,137,528 |
| EQT Corp. | | 98,323 | 1,560,386 |
| Hess Corp. | | 92,300 | 4,249,492 |
| Kosmos Energy Ltd. | | 283,800 | 417,186 |
| Magnolia Oil & Gas Corp. Class A (a) | | 36,400 | 234,416 |
| MEG Energy Corp. (a) | | 154,100 | 427,678 |
| Parsley Energy, Inc. Class A | | 113,929 | 1,224,737 |
| PDC Energy, Inc. (a) | | 48,200 | 729,748 |
| Pioneer Natural Resources Co. | | 29,300 | 3,045,149 |
| | | | 24,236,406 |
| Oil & Gas Refining & Marketing - 5.6% | | | |
| Phillips 66 Co. | | 68,200 | 3,987,654 |
| Reliance Industries Ltd. sponsored GDR (c) | | 17,900 | 1,036,410 |
| | | | 5,024,064 |
| Oil & Gas Storage & Transport - 36.8% | | | |
| Avenir LNG Ltd. (a)(d) | | 1,999,500 | 1,716,663 |
| Enbridge, Inc. | | 295,700 | 9,460,315 |
| Gibson Energy, Inc. | | 57,600 | 1,048,798 |
| Keyera Corp. | | 34,700 | 633,690 |
| Kinder Morgan, Inc. | | 323,400 | 4,469,388 |
| ONEOK, Inc. | | 35,800 | 983,784 |
| Pembina Pipeline Corp. | | 89,400 | 2,213,838 |
| Targa Resources Corp. | | 43,500 | 739,935 |
| TC Energy Corp. | | 150,019 | 7,014,727 |
| The Williams Companies, Inc. | | 235,729 | 4,893,734 |
| | | | 33,174,872 |
|
| TOTAL OIL, GAS & CONSUMABLE FUELS | | | 67,849,272 |
|
| TOTAL COMMON STOCKS | | | |
| (Cost $109,003,892) | | | 89,696,565 |
|
| Money Market Funds - 2.8% | | | |
| Fidelity Cash Central Fund 0.12% (e) | | 221,824 | 221,868 |
| Fidelity Securities Lending Cash Central Fund 0.11% (e)(f) | | 2,352,945 | 2,353,180 |
| TOTAL MONEY MARKET FUNDS | | | |
| (Cost $2,575,048) | | | 2,575,048 |
| TOTAL INVESTMENT IN SECURITIES - 102.3% | | | |
| (Cost $111,578,940) | | | 92,271,613 |
| NET OTHER ASSETS (LIABILITIES) - (2.3)% | | | (2,093,424) |
| NET ASSETS - 100% | | | $90,178,189 |
Legend
(a) Non-income producing
(b) Security or a portion of the security is on loan at period end.
(c) Security exempt from registration under Rule 144A of the Securities Act of 1933. These securities may be resold in transactions exempt from registration, normally to qualified institutional buyers. At the end of the period, the value of these securities amounted to $1,036,410 or 1.1% of net assets.
(d) Level 3 security
(e) Affiliated fund that is generally available only to investment companies and other accounts managed by Fidelity Investments. The rate quoted is the annualized seven-day yield of the fund at period end. A complete unaudited listing of the fund's holdings as of its most recent quarter end is available upon request. In addition, each Fidelity Central Fund's financial statements are available on the SEC's website or upon request.
(f) Investment made with cash collateral received from securities on loan.
Affiliated Central Funds
Information regarding fiscal year to date income earned by the Fund from investments in Fidelity Central Funds is as follows:
| Fund | Income earned |
| Fidelity Cash Central Fund | $2,084 |
| Fidelity Securities Lending Cash Central Fund | 9,389 |
| Total | $11,473 |
Amounts in the income column in the above table include any capital gain distributions from underlying funds, which are presented in the corresponding line-item in the Statement of Operations, if applicable. Amount for Fidelity Securities Lending Cash Central Fund represents the income earned on investing cash collateral, less rebates paid to borrowers and any lending agent fees associated with the loan, plus any premium payments received for lending certain types of securities.
Investment Valuation
The following is a summary of the inputs used, as of August 31, 2020, involving the Fund's assets and liabilities carried at fair value. The inputs or methodology used for valuing securities may not be an indication of the risk associated with investing in those securities. For more information on valuation inputs, and their aggregation into the levels used below, please refer to the Investment Valuation section in the accompanying Notes to Financial Statements.
| | Valuation Inputs at Reporting Date: |
| Description | Total | Level 1 | Level 2 | Level 3 |
| Investments in Securities: | | | | |
| Common Stocks | $89,696,565 | $87,979,902 | $-- | $1,716,663 |
| Money Market Funds | 2,575,048 | 2,575,048 | -- | -- |
| Total Investments in Securities: | $92,271,613 | $90,554,950 | $-- | $1,716,663 |
The following is a reconciliation of Investments in Securities for which Level 3 inputs were used in determining value:
| Investments in Securities: | |
| Common Stocks | |
| Beginning Balance | $-- |
| Total Realized Gain (Loss) | (113) |
| Total Unrealized Gain (Loss) | (98,748) |
| Cost of Purchases | -- |
| Proceeds of Sales | (387) |
| Amortization/Accretion | -- |
| Transfers in to Level 3 | 1,815,911 |
| Transfers out of Level 3 | -- |
| Ending Balance | $1,716,663 |
| The change in unrealized gain (loss) for the period attributable to Level 3 securities held at August 31, 2020 | $(98,748) |
The information used in the above reconciliation represents fiscal year to date activity for any Investments in Securities identified as using Level 3 inputs at either the beginning or the end of the current fiscal period. Cost of purchases and proceeds of sales may include securities received and/or delivered through in-kind transactions. Transfers in or out of Level 3 represent the beginning value of any Security or Instrument where a change in the pricing level occurred from the beginning to the end of the period. The cost of purchases and the proceeds of sales may include securities received or delivered through corporate actions or exchanges. Realized and unrealized gains (losses) disclosed in the reconciliation are included in Net Gain (Loss) on the Fund's Statement of Operations.
Other Information
Distribution of investments by country or territory of incorporation, as a percentage of Total Net Assets, is as follows (Unaudited):
| United States of America | 61.6% |
| Canada | 27.7% |
| Curacao | 4.6% |
| Netherlands | 2.0% |
| Bermuda | 1.9% |
| India | 1.2% |
| United Kingdom | 1.0% |
| | 100.0% |
See accompanying notes which are an integral part of the financial statements.
Natural Gas Portfolio
Financial Statements
Statement of Assets and Liabilities
| | | August 31, 2020 (Unaudited) |
| Assets | | |
Investment in securities, at value (including securities loaned of $2,203,404) — See accompanying schedule:
Unaffiliated issuers (cost $109,003,892) | $89,696,565 | |
| Fidelity Central Funds (cost $2,575,048) | 2,575,048 | |
| Total Investment in Securities (cost $111,578,940) | | $92,271,613 |
| Cash | | 16,126 |
| Receivable for fund shares sold | | 139,090 |
| Dividends receivable | | 301,524 |
| Distributions receivable from Fidelity Central Funds | | 223 |
| Prepaid expenses | | 1,505 |
| Other receivables | | 48,809 |
| Total assets | | 92,778,890 |
| Liabilities | | |
| Payable for fund shares redeemed | 116,903 | |
| Accrued management fee | 41,310 | |
| Other affiliated payables | 23,765 | |
| Other payables and accrued expenses | 65,648 | |
| Collateral on securities loaned | 2,353,075 | |
| Total liabilities | | 2,600,701 |
| Net Assets | | $90,178,189 |
| Net Assets consist of: | | |
| Paid in capital | | $529,003,092 |
| Total accumulated earnings (loss) | | (438,824,903) |
| Net Assets | | $90,178,189 |
| Net Asset Value, offering price and redemption price per share ($90,178,189 ÷ 9,096,091 shares) | | $9.91 |
See accompanying notes which are an integral part of the financial statements.
Statement of Operations
| | | Six months ended August 31, 2020 (Unaudited) |
| Investment Income | | |
| Dividends | | $1,420,866 |
| Income from Fidelity Central Funds (including $9,389 from security lending) | | 11,473 |
| Total income | | 1,432,339 |
| Expenses | | |
| Management fee | $233,907 | |
| Transfer agent fees | 116,865 | |
| Accounting fees | 17,105 | |
| Custodian fees and expenses | 7,046 | |
| Independent trustees' fees and expenses | 317 | |
| Registration fees | 6,987 | |
| Audit | 17,534 | |
| Legal | 83 | |
| Miscellaneous | 6,410 | |
| Total expenses before reductions | 406,254 | |
| Expense reductions | (18,293) | |
| Total expenses after reductions | | 387,961 |
| Net investment income (loss) | | 1,044,378 |
| Realized and Unrealized Gain (Loss) | | |
| Net realized gain (loss) on: | | |
| Investment securities: | | |
| Unaffiliated issuers | (85,408,890) | |
| Fidelity Central Funds | 89 | |
| Foreign currency transactions | (1,013) | |
| Total net realized gain (loss) | | (85,409,814) |
| Change in net unrealized appreciation (depreciation) on: | | |
| Investment securities: | | |
| Unaffiliated issuers | 54,979,475 | |
| Assets and liabilities in foreign currencies | 4,619 | |
| Total change in net unrealized appreciation (depreciation) | | 54,984,094 |
| Net gain (loss) | | (30,425,720) |
| Net increase (decrease) in net assets resulting from operations | | $(29,381,342) |
See accompanying notes which are an integral part of the financial statements.
Statement of Changes in Net Assets
| | Six months ended August 31, 2020 (Unaudited) | Year ended February 29, 2020 |
| Increase (Decrease) in Net Assets | | |
| Operations | | |
| Net investment income (loss) | $1,044,378 | $2,506,777 |
| Net realized gain (loss) | (85,409,814) | (62,167,914) |
| Change in net unrealized appreciation (depreciation) | 54,984,094 | 1,048,778 |
| Net increase (decrease) in net assets resulting from operations | (29,381,342) | (58,612,359) |
| Distributions to shareholders | (560,858) | (1,660,041) |
| Share transactions | | |
| Proceeds from sales of shares | 23,592,555 | 41,679,382 |
| Reinvestment of distributions | 527,294 | 1,560,585 |
| Cost of shares redeemed | (18,629,604) | (69,422,307) |
| Net increase (decrease) in net assets resulting from share transactions | 5,490,245 | (26,182,340) |
| Total increase (decrease) in net assets | (24,451,955) | (86,454,740) |
| Net Assets | | |
| Beginning of period | 114,630,144 | 201,084,884 |
| End of period | $90,178,189 | $114,630,144 |
| Other Information | | |
| Shares | | |
| Sold | 2,493,829 | 2,360,441 |
| Issued in reinvestment of distributions | 58,588 | 87,673 |
| Redeemed | (1,910,692) | (3,826,441) |
| Net increase (decrease) | 641,725 | (1,378,327) |
See accompanying notes which are an integral part of the financial statements.
Financial Highlights
Natural Gas Portfolio
| | Six months ended (Unaudited) August 31, | Years endedFebruary 28, | | | | |
| | 2020 | 2020 A | 2019 | 2018 | 2017 | 2016 A |
| Selected Per–Share Data | | | | | | |
| Net asset value, beginning of period | $13.56 | $20.45 | $21.60 | $27.76 | $17.83 | $32.05 |
| Income from Investment Operations | | | | | | |
| Net investment income (loss)B | .12 | .28 | .24 | .61C | .13 | .33 |
| Net realized and unrealized gain (loss) | (3.71) | (6.98) | (1.27) | (5.83) | 9.98 | (14.16) |
| Total from investment operations | (3.59) | (6.70) | (1.03) | (5.22) | 10.11 | (13.83) |
| Distributions from net investment income | (.06) | (.19) | – | (.65) | (.15) | (.39) |
| Distributions from net realized gain | – | – | (.12) | (.29) | (.03) | – |
| Total distributions | (.06) | (.19) | (.12) | (.94) | (.18) | (.39) |
| Redemption fees added to paid in capitalB | – | – | – | –D | –D | –D |
| Net asset value, end of period | $9.91 | $13.56 | $20.45 | $21.60 | $27.76 | $17.83 |
| Total ReturnE,F | (26.41)% | (32.98)% | (4.82)% | (18.97)% | 56.75% | (43.29)% |
| Ratios to Average Net AssetsG,H | | | | | | |
| Expenses before reductions | .92%I,J | .93% | .89% | .89% | .87% | .89% |
| Expenses net of fee waivers, if any | .92%I,J | .93% | .89% | .89% | .87% | .88% |
| Expenses net of all reductions | .87%I,J | .92% | .86% | .87% | .87% | .88% |
| Net investment income (loss) | 2.38%I,J | 1.51% | 1.02% | 2.52%C | .50% | 1.24% |
| Supplemental Data | | | | | | |
| Net assets, end of period (000 omitted) | $90,178 | $114,630 | $201,085 | $238,368 | $479,879 | $255,990 |
| Portfolio turnover rateK | 179%I | 87% | 86% | 69% | 76% | 62% |
A For the year ended February 29.
B Calculated based on average shares outstanding during the period.
C Net investment income per share reflects one or more large, non-recurring dividend which amounted to $.45 per share. Excluding such non-recurring dividend, the ratio of net investment income (loss) to average net assets would have been .66%.
D Amount represents less than $.005 per share.
E Total returns for periods of less than one year are not annualized.
F Total returns would have been lower if certain expenses had not been reduced during the applicable periods shown.
G Fees and expenses of any underlying mutual funds or exchange-traded funds (ETFs) are not included in the Fund's expense ratio. The Fund indirectly bears its proportionate share of these expenses. For additional expense information related to investments in Fidelity Central Funds, please refer to the "Investments in Fidelity Central Funds" note found in the Notes to Financial Statements section of the most recent Annual or Semi-Annual report.
H Expense ratios reflect operating expenses of the class. Expenses before reductions do not reflect amounts reimbursed, waived, or reduced through arrangements with the investment advisor, brokerage services, or other offset arrangements, if applicable, and do not represent the amount paid by the class during periods when reimbursements, waivers or reductions occur.
I Annualized
J Proxy expenses are not annualized.
K Amount does not include the portfolio activity of any underlying Fidelity Central Funds.
See accompanying notes which are an integral part of the financial statements.
Natural Resources Portfolio
Investment Summary (Unaudited)
Top Ten Stocks as of August 31, 2020
| | % of fund's net assets |
| Chevron Corp. | 8.3 |
| Barrick Gold Corp. | 7.4 |
| Agnico Eagle Mines Ltd. (Canada) | 6.2 |
| Franco-Nevada Corp. | 5.5 |
| The Williams Companies, Inc. | 4.9 |
| Crown Holdings, Inc. | 4.5 |
| Cenovus Energy, Inc. (Canada) | 4.2 |
| Pioneer Natural Resources Co. | 3.8 |
| ConocoPhillips Co. | 3.7 |
| Cheniere Energy, Inc. | 3.7 |
| | 52.2 |
Top Industries (% of fund's net assets)
| As of August 31, 2020 |
| | Oil, Gas & Consumable Fuels | 61.6% |
| | Metals & Mining | 19.1% |
| | Containers & Packaging | 11.8% |
| | Energy Equipment & Services | 4.3% |
| | Construction Materials | 1.8% |
| | All Others* | 1.4% |

* Includes short-term investments and net other assets (liabilities).
Natural Resources Portfolio
Schedule of Investments August 31, 2020 (Unaudited)
Showing Percentage of Net Assets
| Common Stocks - 99.5% | | | |
| | | Shares | Value |
| Construction Materials - 1.8% | | | |
| Construction Materials - 1.8% | | | |
| Eagle Materials, Inc. | | 39,900 | $3,262,623 |
| Summit Materials, Inc. (a) | | 92,700 | 1,380,303 |
| | | | 4,642,926 |
| Containers & Packaging - 11.8% | | | |
| Metal & Glass Containers - 6.7% | | | |
| Aptargroup, Inc. | | 48,700 | 5,765,593 |
| Crown Holdings, Inc. (a) | | 152,300 | 11,704,255 |
| | | | 17,469,848 |
| Paper Packaging - 5.1% | | | |
| Avery Dennison Corp. | | 67,500 | 7,788,825 |
| Graphic Packaging Holding Co. | | 116,600 | 1,630,068 |
| Packaging Corp. of America | | 36,300 | 3,675,012 |
| | | | 13,093,905 |
|
| TOTAL CONTAINERS & PACKAGING | | | 30,563,753 |
|
| Energy Equipment & Services - 4.3% | | | |
| Oil & Gas Drilling - 0.2% | | | |
| Odfjell Drilling Ltd. (a) | | 194,500 | 258,274 |
| Shelf Drilling Ltd. (a)(b) | | 790,300 | 265,975 |
| | | | 524,249 |
| Oil & Gas Equipment & Services - 4.1% | | | |
| Baker Hughes Co. Class A (c) | | 369,700 | 5,279,316 |
| Dril-Quip, Inc. (a) | | 28,425 | 941,720 |
| Halliburton Co. | | 139,600 | 2,258,728 |
| National Oilwell Varco, Inc. | | 53,600 | 643,200 |
| Oceaneering International, Inc. (a) | | 49,500 | 266,805 |
| RigNet, Inc. (a)(c) | | 266,330 | 1,328,987 |
| | | | 10,718,756 |
|
| TOTAL ENERGY EQUIPMENT & SERVICES | | | 11,243,005 |
|
| Metals & Mining - 19.1% | | | |
| Gold - 19.1% | | | |
| Agnico Eagle Mines Ltd. (Canada) (c) | | 195,700 | 16,134,916 |
| Barrick Gold Corp. | | 642,432 | 19,048,109 |
| Franco-Nevada Corp. | | 94,300 | 14,182,413 |
| | | | 49,365,438 |
| Oil, Gas & Consumable Fuels - 61.6% | | | |
| Coal & Consumable Fuels - 0.3% | | | |
| Pinnacle Renewable Energy, Inc. | | 142,300 | 713,491 |
| Integrated Oil & Gas - 15.8% | | | |
| Cenovus Energy, Inc. (Canada) | | 2,291,900 | 10,823,862 |
| Chevron Corp. | | 255,798 | 21,469,125 |
| Suncor Energy, Inc. | | 533,000 | 8,552,681 |
| | | | 40,845,668 |
| Oil & Gas Exploration & Production - 25.1% | | | |
| Brigham Minerals, Inc. Class A | | 44,900 | 530,269 |
| Cabot Oil & Gas Corp. | | 106,700 | 2,024,099 |
| Canadian Natural Resources Ltd. | | 462,200 | 9,113,953 |
| Centennial Resource Development, Inc. Class A (a) | | 270,200 | 196,219 |
| ConocoPhillips Co. | | 255,700 | 9,688,473 |
| Crescent Point Energy Corp. | | 295,400 | 518,623 |
| Diamondback Energy, Inc. | | 88,500 | 3,447,960 |
| EOG Resources, Inc. | | 79,800 | 3,618,132 |
| EQT Corp. | | 139,400 | 2,212,278 |
| Hess Corp. | | 83,000 | 3,821,320 |
| Kosmos Energy Ltd. | | 289,800 | 426,006 |
| Magnolia Oil & Gas Corp. Class A (a) | | 838,800 | 5,401,872 |
| Noble Energy, Inc. | | 493,400 | 4,909,330 |
| Parsley Energy, Inc. Class A | | 559,700 | 6,016,775 |
| PDC Energy, Inc. (a) | | 114,600 | 1,735,044 |
| Pioneer Natural Resources Co. | | 96,000 | 9,977,280 |
| PrairieSky Royalty Ltd. | | 67,438 | 488,070 |
| Viper Energy Partners LP | | 101,500 | 1,033,270 |
| | | | 65,158,973 |
| Oil & Gas Refining & Marketing - 7.4% | | | |
| Delek U.S. Holdings, Inc. | | 170,204 | 2,677,309 |
| Marathon Petroleum Corp. | | 41,398 | 1,467,973 |
| Phillips 66 Co. | | 86,016 | 5,029,356 |
| Reliance Industries Ltd. | | 6,932 | 112,937 |
| Reliance Industries Ltd. | | 103,986 | 2,953,508 |
| Valero Energy Corp. | | 133,400 | 7,015,506 |
| | | | 19,256,589 |
| Oil & Gas Storage & Transport - 13.0% | | | |
| Cheniere Energy, Inc. (a) | | 182,500 | 9,499,125 |
| Enbridge, Inc. | | 26,400 | 844,614 |
| Enterprise Products Partners LP | | 341,200 | 5,991,472 |
| Golar LNG Ltd. (a) | | 116,500 | 1,205,775 |
| Noble Midstream Partners LP | | 200,877 | 1,799,858 |
| TC Energy Corp. | | 34,200 | 1,599,155 |
| The Williams Companies, Inc. | | 617,900 | 12,827,604 |
| | | | 33,767,603 |
|
| TOTAL OIL, GAS & CONSUMABLE FUELS | | | 159,742,324 |
|
| Paper & Forest Products - 0.9% | | | |
| Forest Products - 0.9% | | | |
| Western Forest Products, Inc. (c) | | 2,623,600 | 2,373,480 |
| TOTAL COMMON STOCKS | | | |
| (Cost $316,657,517) | | | 257,930,926 |
|
| Money Market Funds - 3.9% | | | |
| Fidelity Cash Central Fund 0.12% (d) | | 357,528 | 357,600 |
| Fidelity Securities Lending Cash Central Fund 0.11% (d)(e) | | 9,910,684 | 9,911,675 |
| TOTAL MONEY MARKET FUNDS | | | |
| (Cost $10,269,275) | | | 10,269,275 |
| TOTAL INVESTMENT IN SECURITIES - 103.4% | | | |
| (Cost $326,926,792) | | | 268,200,201 |
| NET OTHER ASSETS (LIABILITIES) - (3.4)% | | | (8,936,659) |
| NET ASSETS - 100% | | | $259,263,542 |
Legend
(a) Non-income producing
(b) Security exempt from registration under Rule 144A of the Securities Act of 1933. These securities may be resold in transactions exempt from registration, normally to qualified institutional buyers. At the end of the period, the value of these securities amounted to $265,975 or 0.1% of net assets.
(c) Security or a portion of the security is on loan at period end.
(d) Affiliated fund that is generally available only to investment companies and other accounts managed by Fidelity Investments. The rate quoted is the annualized seven-day yield of the fund at period end. A complete unaudited listing of the fund's holdings as of its most recent quarter end is available upon request. In addition, each Fidelity Central Fund's financial statements are available on the SEC's website or upon request.
(e) Investment made with cash collateral received from securities on loan.
Affiliated Central Funds
Information regarding fiscal year to date income earned by the Fund from investments in Fidelity Central Funds is as follows:
| Fund | Income earned |
| Fidelity Cash Central Fund | $2,587 |
| Fidelity Securities Lending Cash Central Fund | 8,884 |
| Total | $11,471 |
Amounts in the income column in the above table include any capital gain distributions from underlying funds, which are presented in the corresponding line-item in the Statement of Operations, if applicable. Amount for Fidelity Securities Lending Cash Central Fund represents the income earned on investing cash collateral, less rebates paid to borrowers and any lending agent fees associated with the loan, plus any premium payments received for lending certain types of securities.
Investment Valuation
The following is a summary of the inputs used, as of August 31, 2020, involving the Fund's assets and liabilities carried at fair value. The inputs or methodology used for valuing securities may not be an indication of the risk associated with investing in those securities. For more information on valuation inputs, and their aggregation into the levels used below, please refer to the Investment Valuation section in the accompanying Notes to Financial Statements.
| | Valuation Inputs at Reporting Date: |
| Description | Total | Level 1 | Level 2 | Level 3 |
| Investments in Securities: | | | | |
| Common Stocks | $257,930,926 | $257,930,926 | $-- | $-- |
| Money Market Funds | 10,269,275 | 10,269,275 | -- | -- |
| Total Investments in Securities: | $268,200,201 | $268,200,201 | $-- | $-- |
Other Information
Distribution of investments by country or territory of incorporation, as a percentage of Total Net Assets, is as follows (Unaudited):
| United States of America | 65.5% |
| Canada | 32.6% |
| India | 1.2% |
| Others (Individually Less Than 1%) | 0.7% |
| | 100.0% |
See accompanying notes which are an integral part of the financial statements.
Natural Resources Portfolio
Financial Statements
Statement of Assets and Liabilities
| | | August 31, 2020 (Unaudited) |
| Assets | | |
Investment in securities, at value (including securities loaned of $9,358,172) — See accompanying schedule:
Unaffiliated issuers (cost $316,657,517) | $257,930,926 | |
| Fidelity Central Funds (cost $10,269,275) | 10,269,275 | |
| Total Investment in Securities (cost $326,926,792) | | $268,200,201 |
| Foreign currency held at value (cost $7) | | 7 |
| Receivable for investments sold | | 1,291,514 |
| Receivable for fund shares sold | | 253,520 |
| Dividends receivable | | 824,039 |
| Distributions receivable from Fidelity Central Funds | | 950 |
| Prepaid expenses | | 5,681 |
| Other receivables | | 75,415 |
| Total assets | | 270,651,327 |
| Liabilities | | |
| Payable for fund shares redeemed | 1,008,081 | |
| Accrued management fee | 117,666 | |
| Other affiliated payables | 69,535 | |
| Other payables and accrued expenses | 281,323 | |
| Collateral on securities loaned | 9,911,180 | |
| Total liabilities | | 11,387,785 |
| Net Assets | | $259,263,542 |
| Net Assets consist of: | | |
| Paid in capital | | $572,357,286 |
| Total accumulated earnings (loss) | | (313,093,744) |
| Net Assets | | $259,263,542 |
| Net Asset Value, offering price and redemption price per share ($259,263,542 ÷ 13,441,457 shares) | | $19.29 |
See accompanying notes which are an integral part of the financial statements.
Statement of Operations
| | | Six months ended August 31, 2020 (Unaudited) |
| Investment Income | | |
| Dividends | | $3,958,540 |
| Income from Fidelity Central Funds (including $8,884 from security lending) | | 11,471 |
| Total income | | 3,970,011 |
| Expenses | | |
| Management fee | $683,510 | |
| Transfer agent fees | 356,779 | |
| Accounting fees | 49,988 | |
| Custodian fees and expenses | 6,103 | |
| Independent trustees' fees and expenses | 906 | |
| Registration fees | 17,939 | |
| Audit | 29,100 | |
| Legal | 230 | |
| Interest | 987 | |
| Miscellaneous | 15,486 | |
| Total expenses before reductions | 1,161,028 | |
| Expense reductions | (6,719) | |
| Total expenses after reductions | | 1,154,309 |
| Net investment income (loss) | | 2,815,702 |
| Realized and Unrealized Gain (Loss) | | |
| Net realized gain (loss) on: | | |
| Investment securities: | | |
| Unaffiliated issuers | (34,328,877) | |
| Fidelity Central Funds | 304 | |
| Foreign currency transactions | (17) | |
| Total net realized gain (loss) | | (34,328,590) |
| Change in net unrealized appreciation (depreciation) on: | | |
| Investment securities: | | |
| Unaffiliated issuers (net of increase in deferred foreign taxes of $139,226) | 11,005,866 | |
| Assets and liabilities in foreign currencies | (584) | |
| Total change in net unrealized appreciation (depreciation) | | 11,005,282 |
| Net gain (loss) | | (23,323,308) |
| Net increase (decrease) in net assets resulting from operations | | $(20,507,606) |
See accompanying notes which are an integral part of the financial statements.
Statement of Changes in Net Assets
| | Six months ended August 31, 2020 (Unaudited) | Year ended February 29, 2020 |
| Increase (Decrease) in Net Assets | | |
| Operations | | |
| Net investment income (loss) | $2,815,702 | $4,795,973 |
| Net realized gain (loss) | (34,328,590) | (5,822,055) |
| Change in net unrealized appreciation (depreciation) | 11,005,282 | (72,689,969) |
| Net increase (decrease) in net assets resulting from operations | (20,507,606) | (73,716,051) |
| Distributions to shareholders | (188,262) | (6,015,518) |
| Share transactions | | |
| Proceeds from sales of shares | 72,905,976 | 141,880,695 |
| Reinvestment of distributions | 177,220 | 5,281,203 |
| Cost of shares redeemed | (108,657,005) | (176,063,968) |
| Net increase (decrease) in net assets resulting from share transactions | (35,573,809) | (28,902,070) |
| Total increase (decrease) in net assets | (56,269,677) | (108,633,639) |
| Net Assets | | |
| Beginning of period | 315,533,219 | 424,166,858 |
| End of period | $259,263,542 | $315,533,219 |
| Other Information | | |
| Shares | | |
| Sold | 4,454,051 | 5,678,652 |
| Issued in reinvestment of distributions | 11,560 | 202,237 |
| Redeemed | (6,345,235) | (7,159,749) |
| Net increase (decrease) | (1,879,624) | (1,278,860) |
See accompanying notes which are an integral part of the financial statements.
Financial Highlights
Natural Resources Portfolio
| | Six months ended (Unaudited) August 31, | Years endedFebruary 28, | | | | |
| | 2020 | 2020 A | 2019 | 2018 | 2017 | 2016 A |
| Selected Per–Share Data | | | | | | |
| Net asset value, beginning of period | $20.59 | $25.55 | $27.51 | $29.13 | $21.80 | $31.49 |
| Income from Investment Operations | | | | | | |
| Net investment income (loss)B | .19 | .30 | .29 | .43C | .10 | .18 |
| Net realized and unrealized gain (loss) | (1.48) | (4.88) | (1.97) | (1.64) | 7.42 | (9.69) |
| Total from investment operations | (1.29) | (4.58) | (1.68) | (1.21) | 7.52 | (9.51) |
| Distributions from net investment income | (.01) | (.30) | (.28) | (.39) | (.11) | (.18) |
| Distributions from net realized gain | – | (.08) | –D | (.02) | (.08) | – |
| Total distributions | (.01) | (.38) | (.28) | (.41) | (.19) | (.18) |
| Redemption fees added to paid in capitalB | – | – | – | –D | –D | –D |
| Net asset value, end of period | $19.29 | $20.59 | $25.55 | $27.51 | $29.13 | $21.80 |
| Total ReturnE,F | (6.23)% | (18.25)% | (6.06)% | (4.16)% | 34.54% | (30.22)% |
| Ratios to Average Net AssetsG,H | | | | | | |
| Expenses before reductions | .90%I,J | .84% | .81% | .83% | .84% | .86% |
| Expenses net of fee waivers, if any | .90%I,J | .84% | .81% | .83% | .84% | .86% |
| Expenses net of all reductions | .89%I,J | .84% | .80% | .82% | .83% | .85% |
| Net investment income (loss) | 2.19%I,J | 1.18% | 1.02% | 1.54%C | .35% | .66% |
| Supplemental Data | | | | | | |
| Net assets, end of period (000 omitted) | $259,264 | $315,533 | $424,167 | $910,733 | $912,090 | $462,869 |
| Portfolio turnover rateK | 17%I | 8% | 26% | 78% | 84% | 78% |
A For the year ended February 29.
B Calculated based on average shares outstanding during the period.
C Net investment income per share reflects one or more large, non-recurring dividend which amounted to $.31 per share. Excluding such non-recurring dividend, the ratio of net investment income (loss) to average net assets would have been .41%.
D Amount represents less than $.005 per share.
E Total returns for periods of less than one year are not annualized.
F Total returns would have been lower if certain expenses had not been reduced during the applicable periods shown.
G Fees and expenses of any underlying mutual funds or exchange-traded funds (ETFs) are not included in the Fund's expense ratio. The Fund indirectly bears its proportionate share of these expenses. For additional expense information related to investments in Fidelity Central Funds, please refer to the "Investments in Fidelity Central Funds" note found in the Notes to Financial Statements section of the most recent Annual or Semi-Annual report.
H Expense ratios reflect operating expenses of the class. Expenses before reductions do not reflect amounts reimbursed, waived, or reduced through arrangements with the investment advisor, brokerage services, or other offset arrangements, if applicable, and do not represent the amount paid by the class during periods when reimbursements, waivers or reductions occur.
I Annualized
J Proxy expenses not annualized.
K Amount does not include the portfolio activity of any underlying Fidelity Central Funds.
See accompanying notes which are an integral part of the financial statements.
Notes to Financial Statements (Unaudited)
For the period ended August 31, 2020
1. Organization.
Energy Portfolio, Energy Service Portfolio, Natural Gas Portfolio, and Natural Resources Portfolio (the Funds) are non-diversified funds of Fidelity Select Portfolios (the Trust). The Trust is registered under the Investment Company Act of 1940, as amended (the 1940 Act), as an open-end management investment company organized as a Massachusetts business trust. The Funds invest primarily in securities of companies whose principal business activities fall within specific industries. Each Fund is authorized to issue an unlimited number of shares. Share transactions on the Statement of Changes in Net Assets may contain exchanges between affiliated funds. The Natural Resources Portfolio may also invest in certain precious metals.
2. Investments in Fidelity Central Funds.
The Funds invest in Fidelity Central Funds, which are open-end investment companies generally available only to other investment companies and accounts managed by the investment adviser and its affiliates. The Funds' Schedules of Investments list each of the Fidelity Central Funds held as of period end, if any, as an investment of each Fund, but do not include the underlying holdings of each Fidelity Central Fund. As an Investing Fund, each Fund indirectly bears its proportionate share of the expenses of the underlying Fidelity Central Funds.
The Money Market Central Funds seek preservation of capital and current income and are managed by the investment adviser. Annualized expenses of the Money Market Central Funds as of their most recent shareholder report date ranged from less than .005% to .01%.
A complete unaudited list of holdings for each Fidelity Central Fund is available upon request or at the Securities and Exchange Commission (the SEC) website at www.sec.gov. In addition, the financial statements of the Fidelity Central Funds are available on the SEC website or upon request.
3. Significant Accounting Policies.
Each Fund is an investment company and applies the accounting and reporting guidance of the Financial Accounting Standards Board (FASB) Accounting Standards Codification Topic 946 Financial Services – Investment Companies. The financial statements have been prepared in conformity with accounting principles generally accepted in the United States of America (GAAP), which require management to make certain estimates and assumptions at the date of the financial statements. Actual results could differ from those estimates. Subsequent events, if any, through the date that the financial statements were issued have been evaluated in the preparation of the financial statements. The following summarizes the significant accounting policies of the Funds:
Investment Valuation. Investments are valued as of 4:00 p.m. Eastern time on the last calendar day of the period. The Board of Trustees (the Board) has delegated the day to day responsibility for the valuation of each Fund's investments to the Fair Value Committee (the Committee) established by each Fund's investment adviser. In accordance with valuation policies and procedures approved by the Board, each Fund attempts to obtain prices from one or more third party pricing vendors or brokers to value its investments. When current market prices, quotations or currency exchange rates are not readily available or reliable, investments will be fair valued in good faith by the Committee, in accordance with procedures adopted by the Board. Factors used in determining fair value vary by investment type and may include market or investment specific events. The frequency with which these procedures are used cannot be predicted and they may be utilized to a significant extent. The Committee oversees each Fund's valuation policies and procedures and reports to the Board on the Committee's activities and fair value determinations. The Board monitors the appropriateness of the procedures used in valuing each Fund's investments and ratifies the fair value determinations of the Committee.
Each Fund categorizes the inputs to valuation techniques used to value its investments into a disclosure hierarchy consisting of three levels as shown below:
- Level 1 – quoted prices in active markets for identical investments
- Level 2 – other significant observable inputs (including quoted prices for similar investments, interest rates, prepayment speeds, etc.)
- Level 3 – unobservable inputs (including the Fund's own assumptions based on the best information available)
Valuation techniques used to value each Fund's investments by major category are as follows:
Equity securities, including restricted securities, for which market quotations are readily available, are valued at the last reported sale price or official closing price as reported by a third party pricing vendor on the primary market or exchange on which they are traded and are categorized as Level 1 in the hierarchy. In the event there were no sales during the day or closing prices are not available, securities are valued at the last quoted bid price or may be valued using the last available price and are generally categorized as Level 2 in the hierarchy. For foreign equity securities, when market or security specific events arise, comparisons to the valuation of American Depositary Receipts (ADRs), futures contracts, Exchange-Traded Funds (ETFs) and certain indexes as well as quoted prices for similar securities may be used and would be categorized as Level 2 in the hierarchy. For equity securities, including restricted securities, where observable inputs are limited, assumptions about market activity and risk are used and these securities may be categorized as Level 3 in the hierarchy.
Independent prices obtained from a single source or broker are evaluated by management and may be categorized as Level 3 in the hierarchy.
Investments in open-end mutual funds, including the Fidelity Central Funds, are valued at their closing net asset value (NAV) each business day and are categorized as Level 1 in the hierarchy.
Changes in valuation techniques may result in transfers in or out of an assigned level within the disclosure hierarchy. The aggregate value of investments by input level as of August 31, 2020, as well as a roll forward of Level 3 investments, is included at the end of each Fund's Schedule of Investments.
Foreign Currency. Certain Funds may use foreign currency contracts to facilitate transactions in foreign-denominated securities. Gains and losses from these transactions may arise from changes in the value of the foreign currency or if the counterparties do not perform under the contracts' terms.
Foreign-denominated assets, including investment securities, and liabilities are translated into U.S. dollars at the exchange rates at period end. Purchases and sales of investment securities, income and dividends received, and expenses denominated in foreign currencies are translated into U.S. dollars at the exchange rate in effect on the transaction date.
The effects of exchange rate fluctuations on investments are included with the net realized and unrealized gain (loss) on investment securities. Other foreign currency transactions resulting in realized and unrealized gain (loss) are disclosed separately.
Investment Transactions and Income. For financial reporting purposes, the Funds' investment holdings and NAV include trades executed through the end of the last business day of the period. The NAV per share for processing shareholder transactions is calculated as of the close of business of the New York Stock Exchange (NYSE), normally 4:00 p.m. Eastern time and includes trades executed through the end of the prior business day. Gains and losses on securities sold are determined on the basis of identified cost and for certain Funds include proceeds received from litigation. Dividend income is recorded on the ex-dividend date, except for certain dividends from foreign securities where the ex-dividend date may have passed, which are recorded as soon as the Funds are informed of the ex-dividend date. Non-cash dividends included in dividend income, if any, are recorded at the fair market value of the securities received. Income and capital gain distributions from Fidelity Central Funds, if any, are recorded on the ex-dividend date. Certain distributions received by the Funds represent a return of capital or capital gain. The Funds determine the components of these distributions subsequent to the ex-dividend date, based upon receipt of tax filings or other correspondence relating to the underlying investment. These distributions are recorded as a reduction of cost of investments and/or as a realized gain. Investment income is recorded net of foreign taxes withheld where recovery of such taxes is uncertain.
Expenses. Expenses directly attributable to a fund are charged to that fund. Expenses attributable to more than one fund are allocated among the respective funds on the basis of relative net assets or other appropriate methods. Expense estimates are accrued in the period to which they relate and adjustments are made when actual amounts are known.
Deferred Trustee Compensation. Under a Deferred Compensation Plan (the Plan) for the Funds, certain independent Trustees have elected to defer receipt of a portion of their annual compensation. Deferred amounts are invested in a cross-section of Fidelity funds, are marked-to-market and remain in each Fund until distributed in accordance with the Plan. The investment of deferred amounts and the offsetting payable to the Trustees presented below are included in each accompanying Statement of Assets and Liabilities in other receivables and other payables and accrued expenses, respectively.
| Energy Portfolio | $188,032 |
| Energy Service Portfolio | 64,075 |
| Natural Gas Portfolio | 46,532 |
| Natural Resources Portfolio | 73,760 |
Income Tax Information and Distributions to Shareholders. Each year, each Fund intends to qualify as a regulated investment company under Subchapter M of the Internal Revenue Code, including distributing substantially all of its taxable income and realized gains. As a result, no provision for U.S. Federal income taxes is required. Each Fund files a U.S. federal tax return, in addition to state and local tax returns as required. Each Fund's federal income tax returns are subject to examination by the Internal Revenue Service (IRS) for a period of three fiscal years after they are filed. State and local tax returns may be subject to examination for an additional fiscal year depending on the jurisdiction. Foreign taxes are provided for based on each Fund's understanding of the tax rules and rates that exist in the foreign markets in which it invests. An estimated deferred tax liability for net unrealized appreciation on the applicable securities is included in Other payables and accrued expenses on each applicable Fund's Statement of Assets & Liabilities.
Distributions are declared and recorded on the ex-dividend date. Income and capital gain distributions are determined in accordance with income tax regulations, which may differ from GAAP.
Capital accounts within the financial statements are adjusted for permanent book-tax differences. These adjustments have no impact on net assets or the results of operations. Capital accounts are not adjusted for temporary book-tax differences which will reverse in a subsequent period.
Book-tax differences are primarily due to foreign currency transactions, certain foreign taxes, passive foreign investment companies (PFIC), redemptions in kind, partnerships, deferred trustees compensation, capital loss carryforwards and losses deferred due to wash sales and excise tax regulations.
As of period end, the cost and unrealized appreciation (depreciation) in securities, and derivatives if applicable, for federal income tax purposes were as follows for each Fund:
| | Tax cost | Gross unrealized appreciation | Gross unrealized depreciation | Net unrealized appreciation (depreciation) |
| Energy Portfolio | $938,792,612 | $37,223,761 | $(265,716,142) | $(228,492,381) |
| Energy Service Portfolio | 318,043,039 | 12,879,914 | (150,103,387) | (137,223,473) |
| Natural Gas Portfolio | 116,591,784 | 4,207,461 | (28,527,632) | (24,320,171) |
| Natural Resources Portfolio | 328,716,636 | 40,178,219 | (100,694,654) | (60,516,435) |
Capital loss carryforwards are only available to offset future capital gains of the Funds to the extent provided by regulations and may be limited. The capital loss carryforward information presented below, including any applicable limitation, is estimated as of prior fiscal period end and is subject to adjustment.
| | No expiration | | |
| | Short-term | Long-term | Total capital loss carryforward |
| Energy Portfolio | $(266,229,505) | $(144,820,234) | $(411,049,739) |
| Energy Service Portfolio | (56,814,095) | (182,072,322) | (238,886,417) |
| Natural Gas Portfolio | (68,076,638) | (260,560,814) | (328,637,452) |
| Natural Resources Portfolio | (93,793,841) | (125,079,751) | (218,873,592) |
Restricted Securities (including Private Placements). The Funds may invest in securities that are subject to legal or contractual restrictions on resale. These securities generally may be resold in transactions exempt from registration or to the public if the securities are registered. Disposal of these securities may involve time-consuming negotiations and expense, and prompt sale at an acceptable price may be difficult. Information regarding restricted securities is included at the end of each applicable Fund's Schedule of Investments.
4. Purchases and Sales of Investments.
Purchases and sales of securities, other than short-term securities, are noted in the table below.
| | Purchases ($) | Sales ($) |
| Energy Portfolio | 235,265,301 | 92,356,827 |
| Energy Service Portfolio | 68,175,530 | 23,328,166 |
| Natural Gas Portfolio | 89,043,092 | 80,803,402 |
| Natural Resources Portfolio | 22,480,896 | 54,850,969 |
5. Fees and Other Transactions with Affiliates.
Management Fee. Fidelity Management & Research Company LLC (the investment adviser) and its affiliates provide the Funds with investment management related services for which the Funds pay a monthly management fee. The management fee is the sum of an individual fund fee rate and an annualized group fee rate. The individual fund fee rate is applied to each Fund's average net assets. The group fee rate is based upon the monthly average net assets of a group of registered investment companies with which the investment adviser has management contracts. The group fee rate decreases as assets under management increase and increases as assets under management decrease. For the reporting period, each Fund's annualized management fee rate expressed as a percentage of each Fund's average net assets was as follows:
| | Individual Rate | Group Rate | Total |
| Energy Portfolio | .30% | .23% | .53% |
| Energy Service Portfolio | .30% | .23% | .53% |
| Natural Gas Portfolio | .30% | .23% | .53% |
| Natural Resources Portfolio | .30% | .23% | .53% |
Transfer Agent Fees. Fidelity Investments Institutional Operations Company LLC (FIIOC), an affiliate of the investment adviser, is the Funds' transfer, dividend disbursing and shareholder servicing agent. FIIOC receives account fees and asset-based fees that vary according to account size and type of account. FIIOC pays for typesetting, printing and mailing of shareholder reports, except proxy statements. For the period, transfer agent fees were equivalent to the following annualized rates expressed as a percentage of average net assets:
| Energy Portfolio | .26% |
| Energy Service Portfolio | .27% |
| Natural Gas Portfolio | .27% |
| Natural Resources Portfolio | .28% |
Accounting Fees. Fidelity Service Company, Inc. (FSC), an affiliate of the investment adviser, maintains each Fund's accounting records. The accounting fee is based on the level of average net assets for each month. For the period, the fees were equivalent to the following annualized rates:
| | % of Average Net Assets |
| Energy Portfolio | .04 |
| Energy Service Portfolio | .04 |
| Natural Gas Portfolio | .04 |
| Natural Resources Portfolio | .04 |
Brokerage Commissions. A portion of portfolio transactions were placed with brokerage firms which are affiliates of the investment adviser. Brokerage commissions are included in net realized gain (loss) and change in net unrealized appreciation (depreciation) in the Statement of Operations. The commissions paid to these affiliated firms were as follows:
| | Amount |
| Energy Portfolio | $9,978 |
| Energy Service Portfolio | 8,734 |
| Natural Gas Portfolio | 5,752 |
| Natural Resources Portfolio | 1,590 |
Interfund Lending Program. Pursuant to an Exemptive Order issued by the SEC, each fund, along with other registered investment companies having management contracts with Fidelity Management & Research Company LLC (FMR), or other affiliated entities of FMR, may participate in an interfund lending program. This program provides an alternative credit facility allowing each fund to borrow from, or lend money to, other participating affiliated funds. At period end, there were no interfund loans outstanding. Activity in this program during the period for which loans were outstanding was as follows:
| | Borrower or Lender | Average Loan Balance | Weighted Average Interest Rate | Interest Expense |
| Energy Portfolio | Borrower | $6,057,000 | .33% | $164 |
| Natural Resources Portfolio | Borrower | $10,098,000 | .70% | $987 |
Interfund Trades. Funds may purchase from or sell securities to other Fidelity Funds under procedures adopted by the Board. The procedures have been designed to ensure these interfund trades are executed in accordance with Rule 17a-7 of the 1940 Act. Interfund trades are included within the respective purchases and sales amounts shown in the Purchases and Sales of Investments note.
Prior Fiscal Year Affiliated Redemptions In-Kind. During the prior period, 1,155,173 shares of the Energy Portfolio were redeemed in-kind for investments and cash with a value of $37,704,833. The Fund had a net realized gain of $6,179,274 on investments delivered through in-kind redemptions. The amount of the in-kind redemptions is included in share transactions in the accompanying Statement of Changes in Net Assets as well as the Notes to Financial Statements. Energy Portfolio recognized no gain or loss for federal income tax purposes.
6. Committed Line of Credit.
Certain Funds participate with other funds managed by the investment adviser or an affiliate in a $4.25 billion credit facility (the "line of credit") to be utilized for temporary or emergency purposes to fund shareholder redemptions or for other short-term liquidity purposes. The participating funds have agreed to pay commitment fees on their pro-rata portion of the line of credit, which are reflected in Miscellaneous expenses on the Statement of Operations, and are as follows:
| | Amount |
| Energy Portfolio | $882 |
| Energy Service Portfolio | 190 |
| Natural Gas Portfolio | 134 |
| Natural Resources Portfolio | 382 |
During the period, there were no borrowings on this line of credit.
7. Security Lending.
Certain Funds lend portfolio securities from time to time in order to earn additional income. Lending agents are used, including National Financial Services (NFS), an affiliate of the Funds. Pursuant to a securities lending agreement, NFS will receive a fee, which is capped at 9.9% of a Fund's daily lending revenue, for its services as lending agent. The Funds may lend securities to certain qualified borrowers, including NFS. On the settlement date of the loan, each applicable Fund receives collateral (in the form of U.S. Treasury obligations, letters of credit and/or cash) against the loaned securities and maintains collateral in an amount not less than 100% of the market value of the loaned securities during the period of the loan. The market value of the loaned securities is determined at the close of business of the Funds and any additional required collateral is delivered to the Funds on the next business day. The Funds or borrower may terminate the loan at any time, and if the borrower defaults on its obligation to return the securities loaned because of insolvency or other reasons, the Funds may apply collateral received from the borrower against the obligation. The Funds may experience delays and costs in recovering the securities loaned. Any cash collateral received is invested in the Fidelity Securities Lending Cash Central Fund. The value of loaned securities and cash collateral at period end are disclosed on each applicable Fund's Statement of Assets and Liabilities. Security lending income represents the income earned on investing cash collateral, less rebates paid to borrowers and any lending agent fees associated with the loan, plus any premium payments received for lending certain types of securities. Net income from Fidelity Central Funds is presented in the Statement of Operations as a component of income from Fidelity Central Funds. Affiliated security lending activity was as follows:
| | Total Security Lending Income Fees Paid to NFS | Security Lending Income From Securities Loaned to NFS | Value of Securities Loaned to NFS at Period End |
| Energy Portfolio | $2,571 | $– | $– |
| Energy Service Portfolio | $8,489 | $1,326 | $610 |
| Natural Gas Portfolio | $688 | $– | $– |
| Natural Resources Portfolio | $195 | $– | $– |
8. Expense Reductions.
Commissions paid to certain brokers with whom the investment adviser, or its affiliates, places trades on behalf of certain Funds include an amount in addition to trade execution, which may be rebated back to the Funds to offset certain expenses. In addition, through arrangements with each applicable Fund's custodian, credits realized as a result of certain uninvested cash balances were used to reduce each applicable Fund's expenses. All of the applicable expense reductions are noted in the table below.
| | Brokerage service rebates | Custodian credits |
| Energy Portfolio | $91,784 | $219 |
| Energy Service Portfolio | 18,143 | – |
| Natural Gas Portfolio | 17,990 | – |
| Natural Resources Portfolio | 5,900 | – |
In addition, during the period the investment adviser or an affiliate reimbursed and/or waived a portion of operating expenses as follows:
| | Amount |
| Energy Portfolio | $1,792 |
| Energy Service Portfolio | 413 |
| Natural Gas Portfolio | 303 |
| Natural Resources Portfolio | 819 |
9. Other.
The Funds' organizational documents provide former and current trustees and officers with a limited indemnification against liabilities arising in connection with the performance of their duties to the Funds. In the normal course of business, the Funds may also enter into contracts that provide general indemnifications. The Funds' maximum exposure under these arrangements is unknown as this would be dependent on future claims that may be made against the Funds. The risk of material loss from such claims is considered remote.
10. Coronavirus (COVID-19) Pandemic.
An outbreak of COVID-19 first detected in China during December 2019 has since spread globally and was declared a pandemic by the World Health Organization during March 2020. Developments that disrupt global economies and financial markets, such as the COVID-19 pandemic, may magnify factors that affect the Funds' performance.
Shareholder Expense Example
As a shareholder, you incur two types of costs: (1) transaction costs, which may include sales charges (loads) on purchase payments or redemption proceeds, as applicable and (2) ongoing costs, which generally include management fees, distribution and/or service (12b-1) fees and other Fund expenses. This Example is intended to help you understand your ongoing costs (in dollars) of investing in a fund and to compare these costs with the ongoing costs of investing in other mutual funds.
The Example is based on an investment of $1,000 invested at the beginning of the period and held for the entire period (March 1, 2020 to August 31, 2020).
Actual Expenses
The first line of the accompanying table provides information about actual account values and actual expenses. You may use the information in this line, together with the amount you invested, to estimate the expenses that you paid over the period. Simply divide your account value by $1,000.00 (for example, an $8,600 account value divided by $1,000.00 = 8.6), then multiply the result by the number in the first line for a class/Fund under the heading entitled "Expenses Paid During Period" to estimate the expenses you paid on your account during this period. If any fund is a shareholder of any underlying mutual funds or exchange-traded funds (ETFs) (the Underlying Funds), such fund indirectly bears its proportional share of the expenses of the Underlying Funds in addition to the direct expenses incurred presented in the table. These fees and expenses are not included in the annualized expense ratio used to calculate the expense estimate in the table below.
Hypothetical Example for Comparison Purposes
The second line of the accompanying table provides information about hypothetical account values and hypothetical expenses based on the actual expense ratio and an assumed rate of return of 5% per year before expenses, which is not the actual return. The hypothetical account values and expenses may not be used to estimate the actual ending account balance or expenses you paid for the period. You may use this information to compare the ongoing costs of investing in the Fund and other funds. To do so, compare this 5% hypothetical example with the 5% hypothetical examples that appear in the shareholder reports of the other funds. If any fund is a shareholder of any Underlying Funds, such fund indirectly bears its proportional share of the expenses of the Underlying Funds in addition to the direct expenses as presented in the table. These fees and expenses are not included in the annualized expense ratio used to calculate the expense estimate in the table below.
Please note that the expenses shown in the table are meant to highlight your ongoing costs only and do not reflect any transaction costs. Therefore, the second line of the table is useful in comparing ongoing costs only, and will not help you determine the relative total costs of owning different funds. In addition, if these transactional costs were included, your costs would have been higher.
| | Annualized Expense Ratio-A | Beginning
Account Value
March 1, 2020 | Ending
Account Value
August 31, 2020 | Expenses Paid
During Period-B
March 1, 2020
to August 31, 2020 |
| Energy Portfolio | .87% | | | |
| Actual | | $1,000.00 | $804.70 | $3.96 |
| Hypothetical-C | | $1,000.00 | $1,020.82 | $4.43 |
| Energy Service Portfolio | .93% | | | |
| Actual | | $1,000.00 | $714.60 | $4.02 |
| Hypothetical-C | | $1,000.00 | $1,020.52 | $4.74 |
| Natural Gas Portfolio | .92% | | | |
| Actual | | $1,000.00 | $735.90 | $4.03 |
| Hypothetical-C | | $1,000.00 | $1,020.57 | $4.69 |
| Natural Resources Portfolio | .90% | | | |
| Actual | | $1,000.00 | $937.70 | $4.40 |
| Hypothetical-C | | $1,000.00 | $1,020.67 | $4.58 |
A Annualized expense ratio reflects expenses net of applicable fee waivers.
B Expenses are equal to the annualized expense ratio, multiplied by the average account value over the period, multiplied by 184/ 365 (to reflect the one-half year period). The fees and expenses of any Underlying Funds are not included in each annualized expense ratio.
C 5% return per year before expenses
Proxy Voting Results
A special meeting of shareholders was held on June 9, 2020. The results of votes taken among shareholders on the proposal before them are reported below. Each vote reported represents one dollar of net asset value held on the record date for the meeting.
PROPOSAL 1
To elect a Board of Trustees.
| | # of
Votes | % of
Votes |
| Dennis J. Dirks |
| Affirmative | 32,463,705,305.665 | 92.437 |
| Withheld | 2,655,951,104.308 | 7.563 |
| TOTAL | 35,119,656,409.973 | 100.000 |
| Donald F. Donahue |
| Affirmative | 32,446,843,861.354 | 92.389 |
| Withheld | 2,672,812,548.619 | 7.611 |
| TOTAL | 35,119,656,409.973 | 100.000 |
| Bettina Doulton |
| Affirmative | 32,610,463,757.584 | 92.855 |
| Withheld | 2,509,192,652.389 | 7.145 |
| TOTAL | 35,119,656,409.973 | 100.000 |
| Vicki L. Fuller |
| Affirmative | 32,688,213,522.720 | 93.077 |
| Withheld | 2,431,442,887.253 | 6.923 |
| TOTAL | 35,119,656,409.973 | 100.000 |
| Patricia L. Kampling |
| Affirmative | 32,313,755,598.535 | 92.010 |
| Withheld | 2,805,900,811.438 | 7.990 |
| TOTAL | 35,119,656,409.973 | 100.000 |
| Alan J. Lacy |
| Affirmative | 31,990,158,754.948 | 91.089 |
| Withheld | 3,129,497,655.026 | 8.911 |
| TOTAL | 35,119,656,409.973 | 100.000 |
| Ned C. Lautenbach |
| Affirmative | 32,043,019,991.143 | 91.240 |
| Withheld | 3,076,636,418.830 | 8.760 |
| TOTAL | 35,119,656,409.973 | 100.000 |
| Robert A. Lawrence |
| Affirmative | 32,150,842,398.009 | 91.547 |
| Withheld | 2,968,814,011.965 | 8.453 |
| TOTAL | 35,119,656,409.973 | 100.000 |
| Joseph Mauriello |
| Affirmative | 32,082,201,213.166 | 91.351 |
| Withheld | 3,037,455,196.807 | 8.649 |
| TOTAL | 35,119,656,409.973 | 100.000 |
| Cornelia M. Small |
| Affirmative | 32,207,976,835.934 | 91.709 |
| Withheld | 2,911,679,574.039 | 8.291 |
| TOTAL | 35,119,656,409.973 | 100.000 |
| Garnett A. Smith |
| Affirmative | 32,102,654,343.096 | 91.409 |
| Withheld | 3,017,002,066.877 | 8.591 |
| TOTAL | 35,119,656,409.973 | 100.000 |
| David M. Thomas |
| Affirmative | 32,150,749,424.556 | 91.546 |
| Withheld | 2,968,906,985.418 | 8.454 |
| TOTAL | 35,119,656,409.973 | 100.000 |
| Susan Tomasky |
| Affirmative | 32,381,933,484.515 | 92.205 |
| Withheld | 2,737,722,925.459 | 7.795 |
| TOTAL | 35,119,656,409.973 | 100.000 |
| Michael E. Wiley |
| Affirmative | 32,135,064,741.973 | 91.502 |
| Withheld | 2,984,591,668.000 | 8.498 |
| TOTAL | 35,119,656,409.973 | 100.000 |
|
| Proposal 1 reflects trust wide proposal and voting results. |
SELNR-SANN-1020
1.813654.115
Fidelity® Select Portfolios®
Health Care Sector
Biotechnology Portfolio
Health Care Portfolio
Health Care Services Portfolio
Medical Technology and Devices Portfolio
Pharmaceuticals Portfolio
Semi-Annual Report
August 31, 2020
See the inside front cover for important information about access to your fund’s shareholder reports.
Beginning on January 1, 2021, as permitted by regulations adopted by the Securities and Exchange Commission, paper copies of a fund’s shareholder reports will no longer be sent by mail, unless you specifically request paper copies of the reports from the fund or from your financial intermediary, such as a financial advisor, broker-dealer or bank. Instead, the reports will be made available on a website, and you will be notified by mail each time a report is posted and provided with a website link to access the report.
If you already elected to receive shareholder reports electronically, you will not be affected by this change and you need not take any action. You may elect to receive shareholder reports and other communications from a fund electronically, by contacting your financial intermediary. For Fidelity customers, visit Fidelity's web site or call Fidelity using the contact information listed below.
You may elect to receive all future reports in paper free of charge. If you wish to continue receiving paper copies of your shareholder reports, you may contact your financial intermediary or, if you are a Fidelity customer, visit Fidelity’s website, or call Fidelity at the applicable toll-free number listed below. Your election to receive reports in paper will apply to all funds held with the fund complex/your financial intermediary.
| Account Type | Website | Phone Number |
| Brokerage, Mutual Fund, or Annuity Contracts: | fidelity.com/mailpreferences | 1-800-343-3548 |
| Employer Provided Retirement Accounts: | netbenefits.fidelity.com/preferences (choose 'no' under Required Disclosures to continue to print) | 1-800-343-0860 |
| Advisor Sold Accounts Serviced Through Your Financial Intermediary: | Contact Your Financial Intermediary | Your Financial Intermediary's phone number |
| Advisor Sold Accounts Serviced by Fidelity: | institutional.fidelity.com | 1-877-208-0098 |
Contents
To view a fund's proxy voting guidelines and proxy voting record for the 12-month period ended June 30, visit http://www.fidelity.com/proxyvotingresults or visit the Securities and Exchange Commission's (SEC) web site at http://www.sec.gov.
You may also call 1-800-544-8544 to request a free copy of the proxy voting guidelines.
Standard & Poor's, S&P and S&P 500 are registered service marks of The McGraw-Hill Companies, Inc. and have been licensed for use by Fidelity Distributors Corporation.
Other third-party marks appearing herein are the property of their respective owners.
All other marks appearing herein are registered or unregistered trademarks or service marks of FMR LLC or an affiliated company. © 2020 FMR LLC. All rights reserved.
This report and the financial statements contained herein are submitted for the general information of the shareholders of the Funds. This report is not authorized for distribution to prospective investors in the Funds unless preceded or accompanied by an effective prospectus.
A fund files its complete schedule of portfolio holdings with the SEC for the first and third quarters of each fiscal year on Form N-PORT. Forms N-PORT are available on the SEC’s web site at http://www.sec.gov. A fund's Forms N-PORT may be reviewed and copied at the SEC’s Public Reference Room in Washington, DC. Information regarding the operation of the SEC's Public Reference Room may be obtained by calling 1-800-SEC-0330.
For a complete list of a fund's portfolio holdings, view the most recent holdings listing, semiannual report, or annual report on Fidelity's web site at http://www.fidelity.com, http://www.institutional.fidelity.com, or http://www.401k.com, as applicable.
NOT FDIC INSURED •MAY LOSE VALUE •NO BANK GUARANTEE
Neither the Funds nor Fidelity Distributors Corporation is a bank.
Note to Shareholders:
Early in 2020, the outbreak and spread of a new coronavirus emerged as a public health emergency that had a major influence on financial markets, primarily based on its impact on the global economy and the outlook for corporate earnings. The virus causes a respiratory disease known as COVID-19. On March 11, the World Health Organization declared the COVID-19 outbreak a pandemic, citing sustained risk of further global spread.
In the weeks following, as the crisis worsened, we witnessed an escalating human tragedy with wide-scale social and economic consequences from coronavirus-containment measures. The outbreak of COVID-19 prompted a number of measures to limit the spread, including travel and border restrictions, quarantines, and restrictions on large gatherings. In turn, these resulted in lower consumer activity, diminished demand for a wide range of products and services, disruption in manufacturing and supply chains, and – given the wide variability in outcomes regarding the outbreak – significant market uncertainty and volatility. Amid the turmoil, the U.S. government took unprecedented action – in concert with the U.S. Federal Reserve and central banks around the world – to help support consumers, businesses, and the broader economy, and to limit disruption to the financial system.
The situation continues to unfold, and the extent and duration of its impact on financial markets and the economy remain highly uncertain. Extreme events such as the coronavirus crisis are “exogenous shocks” that can have significant adverse effects on mutual funds and their investments. Although multiple asset classes may be affected by market disruption, the duration and impact may not be the same for all types of assets.
Fidelity is committed to helping you stay informed amid news about COVID-19 and during increased market volatility, and we’re taking extra steps to be responsive to customer needs. We encourage you to visit our websites, where we offer ongoing updates, commentary, and analysis on the markets and our funds.
Biotechnology Portfolio
Investment Summary (Unaudited)
Top Ten Stocks as of August 31, 2020
| | % of fund's net assets |
| AbbVie, Inc. | 8.4 |
| Regeneron Pharmaceuticals, Inc. | 6.0 |
| Amgen, Inc. | 6.0 |
| Immunomedics, Inc. | 2.7 |
| Vertex Pharmaceuticals, Inc. | 2.6 |
| Biogen, Inc. | 2.1 |
| Alnylam Pharmaceuticals, Inc. | 2.1 |
| Acceleron Pharma, Inc. | 2.1 |
| Mirati Therapeutics, Inc. | 1.7 |
| Argenx SE ADR | 1.5 |
| | 35.2 |
Top Industries (% of fund's net assets)
| As of August 31, 2020 |
| | Biotechnology | 90.5% |
| | Pharmaceuticals | 7.0% |
| | Life Sciences Tools & Services | 0.6% |
| | Health Care Technology | 0.4% |
| | Health Care Equipment & Supplies | 0.4% |
| | All Others* | 1.1% |

* Includes short-term investments and net other assets (liabilities).
Biotechnology Portfolio
Schedule of Investments August 31, 2020 (Unaudited)
Showing Percentage of Net Assets
| Preferred Securities - 0.1% | | | |
| | | Shares | Value |
| Kronos Bio, Inc. (a)(b) | | | |
| (Cost $8,000,000) | | 8,000,000 | 8,000,000 |
|
| Common Stocks - 97.7% | | | |
| Biotechnology - 89.7% | | | |
| Biotechnology - 89.7% | | | |
| AbbVie, Inc. | | 6,530,917 | 625,465,924 |
| AC Immune SA (c)(d) | | 35,332 | 274,176 |
| ACADIA Pharmaceuticals, Inc. (c) | | 1,493,794 | 59,139,304 |
| Acceleron Pharma, Inc. (c) | | 1,563,353 | 152,380,017 |
| Adaptimmune Therapeutics PLC sponsored ADR (c) | | 945,000 | 8,221,500 |
| ADC Therapeutics SA (c)(d) | | 746,745 | 32,983,727 |
| Aduro Biotech, Inc. (c) | | 579,106 | 1,795,229 |
| Adverum Biotechnologies, Inc. (c) | | 774,442 | 9,448,192 |
| Agios Pharmaceuticals, Inc. (c) | | 997,715 | 40,916,292 |
| Akebia Therapeutics, Inc. (c) | | 1,525,367 | 15,879,070 |
| Akouos, Inc. (c)(d) | | 233,600 | 5,237,312 |
| Albireo Pharma, Inc. (c)(d) | | 235,650 | 6,555,783 |
| Aldeyra Therapeutics, Inc. (c) | | 322,333 | 2,104,834 |
| Alector, Inc. (c)(d) | | 744,582 | 9,619,999 |
| Alexion Pharmaceuticals, Inc. (c) | | 261,057 | 29,817,931 |
| Allakos, Inc. (c)(d) | | 424,331 | 38,011,571 |
| Allena Pharmaceuticals, Inc. (c)(e) | | 1,447,443 | 1,954,048 |
| Allena Pharmaceuticals, Inc. (c)(d) | | 122,740 | 165,699 |
| Allogene Therapeutics, Inc. (c)(d) | | 448,970 | 16,005,781 |
| Allovir, Inc. (c) | | 111,300 | 3,605,007 |
| Alnylam Pharmaceuticals, Inc. (c) | | 1,151,048 | 152,675,007 |
| ALX Oncology Holdings, Inc. (c) | | 92,330 | 3,733,825 |
| Amarin Corp. PLC ADR (c)(d) | | 293,131 | 2,274,697 |
| Amgen, Inc. | | 1,767,634 | 447,777,045 |
| Amicus Therapeutics, Inc. (c) | | 3,282,081 | 47,918,383 |
| AnaptysBio, Inc. (c) | | 213,167 | 3,694,184 |
| Annexon, Inc. (c) | | 461,300 | 11,380,271 |
| Apellis Pharmaceuticals, Inc. (c) | | 262,134 | 8,081,591 |
| Applied Genetic Technologies Corp. (c) | | 129,100 | 663,574 |
| Applied Molecular Transport, Inc. | | 137,144 | 3,513,629 |
| Applied Therapeutics, Inc. (c) | | 973,740 | 23,467,134 |
| Aprea Therapeutics, Inc. | | 535,700 | 14,517,470 |
| Aravive, Inc. (c)(d) | | 575,269 | 3,279,033 |
| Arcturus Therapeutics Holdings, Inc. (c) | | 770,000 | 37,144,800 |
| Arcus Biosciences, Inc. (c) | | 1,335,442 | 31,783,520 |
| Arcutis Biotherapeutics, Inc. (c) | | 733,274 | 18,383,179 |
| Ardelyx, Inc. (c) | | 244,494 | 1,403,396 |
| Arena Pharmaceuticals, Inc. (c) | | 594,673 | 41,520,069 |
| Argenx SE ADR (c) | | 497,286 | 115,007,333 |
| Arrowhead Pharmaceuticals, Inc. (c) | | 1,367,926 | 57,781,194 |
| Ascendis Pharma A/S sponsored ADR (c) | | 659,409 | 97,711,226 |
| Assembly Biosciences, Inc. (c) | | 195,733 | 4,280,681 |
| Atara Biotherapeutics, Inc. (c) | | 1,128,895 | 15,217,505 |
| Athenex, Inc. (c)(d) | | 377,600 | 4,338,624 |
| Atreca, Inc. (c)(d) | | 160,988 | 2,289,249 |
| aTyr Pharma, Inc. (c) | | 407,046 | 1,530,493 |
| Aurinia Pharmaceuticals, Inc. (c)(d) | | 1,434,386 | 21,271,944 |
| Autolus Therapeutics Ltd. ADR (c) | | 46,508 | 682,272 |
| Avidity Biosciences, Inc. (d) | | 235,484 | 6,781,939 |
| AVROBIO, Inc. (c) | | 451,154 | 7,813,987 |
| Axcella Health, Inc. (c) | | 449,149 | 2,245,745 |
| Bicycle Therapeutics PLC ADR (c)(d) | | 211,444 | 3,767,932 |
| BioCryst Pharmaceuticals, Inc. (c)(d) | | 1,398,084 | 5,802,049 |
| Biogen, Inc. (c) | | 551,432 | 158,613,900 |
| Biohaven Pharmaceutical Holding Co. Ltd. (c) | | 1,018,184 | 64,542,684 |
| BioMarin Pharmaceutical, Inc. (c) | | 1,145,386 | 89,374,470 |
| BioNTech SE ADR (c) | | 183,828 | 11,259,465 |
| BioXcel Therapeutics, Inc. (c)(d) | | 221,727 | 9,035,375 |
| Black Diamond Therapeutics, Inc. (c)(d) | | 392,142 | 11,281,925 |
| bluebird bio, Inc. (c) | | 66,184 | 3,924,711 |
| Blueprint Medicines Corp. (c) | | 1,075,476 | 83,274,107 |
| Bridgebio Pharma, Inc. (c)(d) | | 373,345 | 11,148,082 |
| Cabaletta Bio, Inc. (c) | | 89,850 | 947,918 |
| Calithera Biosciences, Inc. (c) | | 11,606 | 46,772 |
| Catabasis Pharmaceuticals, Inc. (c) | | 369,200 | 2,436,720 |
| Cellectis SA sponsored ADR (c) | | 226,965 | 4,187,504 |
| ChemoCentryx, Inc. (c) | | 2,062,222 | 110,328,877 |
| Chimerix, Inc. (c) | | 398,067 | 1,118,568 |
| Clovis Oncology, Inc. (c)(d) | | 255,770 | 1,332,562 |
| Coherus BioSciences, Inc. (c)(d) | | 147,087 | 2,790,240 |
| Constellation Pharmaceuticals, Inc. (c) | | 80,100 | 1,686,105 |
| Corbus Pharmaceuticals Holdings, Inc. (c)(d) | | 1,479,867 | 13,740,565 |
| Cortexyme, Inc. (c)(d) | | 4,847 | 213,123 |
| Crinetics Pharmaceuticals, Inc. (c) | | 1,202,629 | 19,278,143 |
| CRISPR Therapeutics AG (c)(d) | | 479,642 | 44,827,341 |
| Cyclerion Therapeutics, Inc. (c) | | 837,285 | 5,710,284 |
| Cyclerion Therapeutics, Inc. (a)(c) | | 94,809 | 646,597 |
| Cytokinetics, Inc. (c) | | 2,565,744 | 61,475,226 |
| CytomX Therapeutics, Inc. (c) | | 2,100 | 15,330 |
| CytomX Therapeutics, Inc. (c)(e) | | 287,485 | 2,098,641 |
| Deciphera Pharmaceuticals, Inc. (c) | | 213,400 | 9,605,134 |
| Denali Therapeutics, Inc. (c)(d) | | 521,086 | 16,622,643 |
| Dicerna Pharmaceuticals, Inc. (c) | | 722,512 | 13,380,922 |
| Dynavax Technologies Corp. (c)(d) | | 85,598 | 511,876 |
| Editas Medicine, Inc. (c)(d) | | 61,589 | 2,169,780 |
| Eidos Therapeutics, Inc. (c)(d) | | 118,947 | 5,148,026 |
| Emergent BioSolutions, Inc. (c) | | 96,306 | 10,983,699 |
| Epizyme, Inc. (c)(d) | | 1,992,046 | 25,896,598 |
| Equillium, Inc. (c) | | 209,800 | 1,235,722 |
| Esperion Therapeutics, Inc. (c)(d) | | 123,732 | 4,466,725 |
| Evelo Biosciences, Inc. (c) | | 229,599 | 1,019,420 |
| Exact Sciences Corp. (c) | | 332,912 | 25,064,944 |
| Exelixis, Inc. (c) | | 4,112,350 | 91,376,417 |
| Fate Therapeutics, Inc. (c) | | 1,045,687 | 38,063,007 |
| FibroGen, Inc. (c) | | 1,543,640 | 69,201,381 |
| Forma Therapeutics Holdings, Inc. | | 152,200 | 6,686,146 |
| Frequency Therapeutics, Inc. (d) | | 46,456 | 898,459 |
| Fusion Pharmaceuticals, Inc. (c)(d) | | 871,443 | 11,215,471 |
| G1 Therapeutics, Inc. (c) | | 737,500 | 11,320,625 |
| Galapagos Genomics NV sponsored ADR (c) | | 502,457 | 66,907,174 |
| Gamida Cell Ltd. (c) | | 1,465,111 | 6,387,884 |
| Generation Bio Co. | | 103,000 | 3,216,690 |
| Genmab A/S ADR (c) | | 281,690 | 10,636,614 |
| Geron Corp. (c)(d) | | 6,568,541 | 13,465,509 |
| Geron Corp. warrants 12/31/25 (c) | | 2,100,000 | 1,224,136 |
| Gilead Sciences, Inc. | | 1,049,754 | 70,071,080 |
| Global Blood Therapeutics, Inc. (c)(d) | | 1,178,916 | 74,012,346 |
| Gossamer Bio, Inc. (c)(d) | | 60,414 | 839,755 |
| Gritstone Oncology, Inc. (c) | | 435,100 | 1,440,181 |
| Halozyme Therapeutics, Inc. (c) | | 494,277 | 14,331,562 |
| Heron Therapeutics, Inc. (c)(d) | | 905,925 | 12,954,728 |
| Homology Medicines, Inc. (c) | | 375,276 | 3,989,184 |
| Hookipa Pharma, Inc. (c)(d) | | 819,000 | 7,321,860 |
| Idorsia Ltd. (c) | | 1,038,808 | 30,821,208 |
| IGM Biosciences, Inc. (c) | | 49,028 | 2,108,204 |
| Immunic, Inc. (c) | | 391,300 | 6,280,365 |
| ImmunoGen, Inc. (c) | | 1,573,743 | 5,822,849 |
| Immunomedics, Inc. (c)(d) | | 4,432,572 | 197,515,408 |
| Incyte Corp. (c) | | 413,105 | 39,802,667 |
| Inhibrx, Inc. (c) | | 104,400 | 1,825,956 |
| Inovio Pharmaceuticals, Inc. (c)(d) | | 229,400 | 2,750,506 |
| Inozyme Pharma, Inc. (c)(d) | | 609,380 | 18,269,212 |
| Insmed, Inc. (c) | | 1,346,120 | 37,947,123 |
| Intellia Therapeutics, Inc. (c)(d) | | 1,378,401 | 29,745,894 |
| Intercept Pharmaceuticals, Inc. (c)(d) | | 484,825 | 24,183,071 |
| Invitae Corp. (c)(d) | | 106,307 | 3,716,493 |
| Ionis Pharmaceuticals, Inc. (c) | | 1,722,677 | 93,885,897 |
| Iovance Biotherapeutics, Inc. (c)(d) | | 1,632,207 | 54,401,459 |
| Ironwood Pharmaceuticals, Inc. Class A (c)(d) | | 315,574 | 3,187,297 |
| iTeos Therapeutics, Inc. (c) | | 115,900 | 3,361,100 |
| Jounce Therapeutics, Inc. (c)(d) | | 296,774 | 1,436,386 |
| Kalvista Pharmaceuticals, Inc. (c) | | 895,054 | 11,725,207 |
| Karuna Therapeutics, Inc. (c) | | 229,311 | 17,519,360 |
| Karyopharm Therapeutics, Inc. (c)(d) | | 355,510 | 5,407,307 |
| Keros Therapeutics, Inc. | | 262,407 | 14,049,271 |
| Kezar Life Sciences, Inc. (c) | | 1,013,094 | 4,923,637 |
| Kiniksa Pharmaceuticals Ltd. (c)(d) | | 507,140 | 8,961,164 |
| Kodiak Sciences, Inc. (c)(d) | | 351,813 | 18,501,846 |
| Krystal Biotech, Inc. (c)(f) | | 1,329,286 | 63,553,164 |
| Kura Oncology, Inc. (c) | | 1,865,963 | 46,443,819 |
| Kymera Therapeutics, Inc. (c) | | 139,900 | 4,462,810 |
| La Jolla Pharmaceutical Co. (c)(d) | | 53,085 | 222,957 |
| Legend Biotech Corp. ADR (d) | | 91,094 | 3,097,196 |
| Lexicon Pharmaceuticals, Inc. (c)(d) | | 205,504 | 359,632 |
| Ligand Pharmaceuticals, Inc. Class B (c)(d) | | 1,898 | 193,596 |
| Macrogenics, Inc. (c) | | 257,531 | 7,452,947 |
| Madrigal Pharmaceuticals, Inc. (c)(d) | | 34,241 | 3,687,756 |
| MannKind Corp. (c)(d) | | 4,943,162 | 8,601,102 |
| Mersana Therapeutics, Inc. (c) | | 614,906 | 11,781,599 |
| Mesoblast Ltd. (c) | | 442,900 | 1,723,583 |
| Minerva Neurosciences, Inc. (c)(d) | | 782,914 | 2,489,667 |
| Miragen Therapeutics, Inc. (c)(f) | | 3,888,656 | 3,600,507 |
| Mirati Therapeutics, Inc. (c) | | 854,540 | 127,642,640 |
| Mirum Pharmaceuticals, Inc. (c)(d) | | 235,000 | 6,100,600 |
| Moderna, Inc. (c) | | 739,805 | 48,005,946 |
| Molecular Templates, Inc. (c) | | 228,958 | 2,658,202 |
| Morphic Holding, Inc. (c) | | 758,437 | 20,098,581 |
| Morphosys AG (c) | | 139 | 17,492 |
| Morphosys AG sponsored ADR (c) | | 127 | 3,978 |
| Myovant Sciences Ltd. (c) | | 502,466 | 10,240,257 |
| Natera, Inc. (c) | | 343,115 | 21,859,857 |
| Neurocrine Biosciences, Inc. (c) | | 809,151 | 94,201,359 |
| NextCure, Inc. (c)(d) | | 148,490 | 1,334,925 |
| Nkarta, Inc. (c)(d) | | 60,200 | 1,483,328 |
| Novavax, Inc. (c)(d) | | 21,230 | 2,342,518 |
| Nurix Therapeutics, Inc. (c) | | 335,685 | 7,855,029 |
| ObsEva SA (c)(d) | | 1,355,036 | 3,848,302 |
| Oragenics, Inc. (c) | | 155,806 | 113,754 |
| ORIC Pharmaceuticals, Inc. (c)(d) | | 689,974 | 17,283,849 |
| Ovid Therapeutics, Inc. (c)(d) | | 1,822,543 | 10,461,397 |
| Pandion Therapeutics, Inc. (c) | | 333,333 | 6,166,661 |
| Passage Bio, Inc. | | 630,262 | 10,437,139 |
| Poseida Therapeutics, Inc. (c)(d) | | 101,700 | 954,963 |
| Poseida Therapeutics, Inc. | | 513,583 | 4,340,290 |
| Prevail Therapeutics, Inc. (c) | | 742,000 | 9,089,500 |
| ProQR Therapeutics BV (c) | | 253,116 | 1,594,631 |
| Protagonist Therapeutics, Inc. (c) | | 412,463 | 9,239,171 |
| Prothena Corp. PLC (c) | | 534,212 | 6,923,388 |
| PTC Therapeutics, Inc. (c) | | 2,307,744 | 114,060,247 |
| Puma Biotechnology, Inc. (c) | | 25,768 | 265,153 |
| Radius Health, Inc. (c) | | 101,449 | 1,255,939 |
| Regeneron Pharmaceuticals, Inc. (c) | | 724,970 | 449,430,652 |
| REGENXBIO, Inc. (c) | | 63,008 | 1,923,004 |
| Relay Therapeutics, Inc. (c)(d) | | 557,643 | 22,411,672 |
| Repare Therapeutics, Inc. | | 540,250 | 13,365,785 |
| Replimune Group, Inc. (c) | | 918,717 | 24,805,359 |
| Retrophin, Inc. (c) | | 813,699 | 15,940,363 |
| Revolution Medicines, Inc. | | 599,215 | 16,981,753 |
| Rhythm Pharmaceuticals, Inc. (c)(d) | | 118,978 | 3,511,041 |
| Rocket Pharmaceuticals, Inc. (c)(d) | | 829,552 | 21,211,645 |
| Rubius Therapeutics, Inc. (c)(d) | | 82,842 | 398,884 |
| Sage Therapeutics, Inc. (c) | | 836,193 | 43,849,961 |
| Sangamo Therapeutics, Inc. (c)(d) | | 828,127 | 9,138,381 |
| Sarepta Therapeutics, Inc. (c) | | 733,004 | 107,326,446 |
| Scholar Rock Holding Corp. (c)(d)(f) | | 1,528,947 | 23,087,100 |
| Seattle Genetics, Inc. (c) | | 629,941 | 99,744,858 |
| Selecta Biosciences, Inc. (c)(d) | | 2,515,686 | 6,540,784 |
| Seres Therapeutics, Inc. (c)(d) | | 602,847 | 15,969,417 |
| Spero Therapeutics, Inc. (c)(d) | | 21,752 | 236,444 |
| Springworks Therapeutics, Inc. (c)(d) | | 638,173 | 28,341,263 |
| Stoke Therapeutics, Inc. (c)(d) | | 811,136 | 23,823,064 |
| Surface Oncology, Inc. (c) | | 198,365 | 1,289,373 |
| Sutro Biopharma, Inc. (c) | | 338,600 | 3,389,386 |
| Syros Pharmaceuticals, Inc. (c) | | 758,619 | 10,051,702 |
| Syros Pharmaceuticals, Inc. (c)(e) | | 303,621 | 4,022,978 |
| Syros Pharmaceuticals, Inc. warrants 10/10/22 (c) | | 21,625 | 128,263 |
| TCR2 Therapeutics, Inc. (c) | | 388,715 | 7,859,817 |
| TG Therapeutics, Inc. (c)(d) | | 3,505,759 | 86,960,352 |
| Translate Bio, Inc. (c)(d) | | 982,323 | 13,840,931 |
| Turning Point Therapeutics, Inc. (c) | | 890,858 | 69,647,278 |
| Twist Bioscience Corp. (c) | | 654,831 | 45,792,332 |
| Ultragenyx Pharmaceutical, Inc. (c)(d) | | 981,637 | 83,498,043 |
| uniQure B.V. (c) | | 702,608 | 28,645,328 |
| United Therapeutics Corp. (c) | | 218,716 | 23,393,863 |
| UroGen Pharma Ltd. (c)(d) | | 119,603 | 3,000,839 |
| Vaxart, Inc. (c) | | 297,265 | 1,762,781 |
| Vaxcyte, Inc. | | 470,019 | 21,282,460 |
| Verastem, Inc. (c)(d) | | 250,000 | 315,000 |
| Vertex Pharmaceuticals, Inc. (c) | | 693,811 | 193,656,526 |
| Viela Bio, Inc. | | 2,090,732 | 70,436,761 |
| Voyager Therapeutics, Inc. (c)(d) | | 121,029 | 1,426,932 |
| X4 Pharmaceuticals, Inc. (c) | | 367,300 | 3,077,974 |
| X4 Pharmaceuticals, Inc. warrants 4/12/24 (c) | | 450,000 | 880,233 |
| Xencor, Inc. (c) | | 990,843 | 35,422,637 |
| Xenon Pharmaceuticals, Inc. (c) | | 297,342 | 3,612,705 |
| Y-mAbs Therapeutics, Inc. (c) | | 1,114,642 | 47,963,045 |
| Zai Lab Ltd. ADR (c) | | 38,400 | 3,047,808 |
| Zealand Pharma A/S (c) | | 442,144 | 16,870,179 |
| Zentalis Pharmaceuticals, Inc. | | 306,433 | 10,541,295 |
| Zymeworks, Inc. (c) | | 709,195 | 22,992,102 |
| | | | 6,684,860,426 |
| Capital Markets - 0.0% | | | |
| Asset Management & Custody Banks - 0.0% | | | |
| Arix Bioscience PLC (c)(e) | | 1,515,373 | 1,590,155 |
| Health Care Equipment & Supplies - 0.4% | | | |
| Health Care Equipment - 0.4% | | | |
| Novocure Ltd. (c) | | 900 | 74,475 |
| Novocure Ltd. (c)(e) | | 336,313 | 27,829,901 |
| | | | 27,904,376 |
| Health Care Providers & Services - 0.0% | | | |
| Health Care Services - 0.0% | | | |
| Precipio, Inc. (a)(c) | | 525 | 1,145 |
| Life Sciences Tools & Services - 0.6% | | | |
| Life Sciences Tools & Services - 0.6% | | | |
| 10X Genomics, Inc. (c) | | 90,619 | 10,386,750 |
| Adaptive Biotechnologies Corp.(c) | | 36,780 | 1,530,416 |
| Berkeley Lights, Inc. (c) | | 10,200 | 667,080 |
| Bruker Corp. | | 192,400 | 8,084,648 |
| Compugen Ltd. (c)(d) | | 276,160 | 4,774,806 |
| Evotec OAI AG (c)(d) | | 594,300 | 15,886,257 |
| | | | 41,329,957 |
| Personal Products - 0.0% | | | |
| Personal Products - 0.0% | | | |
| MYOS Corp. (c) | | 33,334 | 44,334 |
| Pharmaceuticals - 7.0% | | | |
| Pharmaceuticals - 7.0% | | | |
| Adimab LLC (a)(b)(c)(g) | | 1,954,526 | 81,581,915 |
| Aerie Pharmaceuticals, Inc. (c)(d) | | 213,043 | 2,343,473 |
| Afferent Pharmaceuticals, Inc. rights 12/31/24 (b)(c) | | 8,274,568 | 14,728,731 |
| Aradigm Corp. (b) | | 11,945 | 549 |
| Aradigm Corp. (b)(c) | | 148,009 | 6,808 |
| Arvinas Holding Co. LLC (c) | | 968,821 | 25,140,905 |
| Axsome Therapeutics, Inc. (c) | | 223,309 | 16,370,783 |
| Chiasma, Inc. (c) | | 1,658,899 | 9,107,356 |
| Chiasma, Inc. warrants 12/16/24 (c) | | 382,683 | 533,521 |
| Corcept Therapeutics, Inc. (c)(d) | | 131,759 | 1,673,339 |
| Fulcrum Therapeutics, Inc. (c)(d) | | 171,222 | 1,244,784 |
| GW Pharmaceuticals PLC ADR (c) | | 5,050 | 524,948 |
| Harmony Biosciences Holdings, Inc. (c) | | 30,600 | 1,083,852 |
| Horizon Therapeutics PLC (c) | | 470,319 | 35,330,363 |
| IMARA, Inc. | | 438,691 | 10,195,179 |
| Intra-Cellular Therapies, Inc. (c) | | 892,117 | 16,254,372 |
| Kala Pharmaceuticals, Inc. (c) | | 479,100 | 4,263,990 |
| Kaleido Biosciences, Inc. (c)(d) | | 70,133 | 441,137 |
| Marinus Pharmaceuticals, Inc. (c)(d) | | 1,327,632 | 2,575,606 |
| MyoKardia, Inc. (c) | | 840,640 | 91,999,642 |
| Nektar Therapeutics (c) | | 543,851 | 10,518,078 |
| Ocular Therapeutix, Inc. (c)(d) | | 87,753 | 763,451 |
| OptiNose, Inc. (c) | | 229,115 | 1,042,473 |
| Pliant Therapeutics, Inc. | | 1,006,631 | 25,316,770 |
| Reata Pharmaceuticals, Inc. (c)(d) | | 253,432 | 26,597,688 |
| Revance Therapeutics, Inc. (c) | | 4,000 | 116,920 |
| Royalty Pharma PLC (a)(b) | | 3,976 | 0 |
| Royalty Pharma PLC | | 509,820 | 18,986,716 |
| Stemcentrx, Inc. rights 12/31/21 (b)(c) | | 876,163 | 9 |
| TherapeuticsMD, Inc. (c)(d) | | 385,742 | 563,183 |
| Theravance Biopharma, Inc. (c) | | 371,300 | 6,805,929 |
| Trevi Therapeutics, Inc. (c)(d) | | 792,700 | 3,194,581 |
| UCB SA | | 744,327 | 88,397,906 |
| Urovant Sciences Ltd. (c)(d) | | 568,436 | 5,093,187 |
| Verrica Pharmaceuticals, Inc. (c)(d) | | 334,380 | 3,072,952 |
| Zogenix, Inc. (c) | | 555,472 | 13,148,022 |
| | | | 519,019,118 |
| TOTAL COMMON STOCKS | | | |
| (Cost $4,727,848,833) | | | 7,274,749,511 |
|
| Preferred Stocks - 1.1% | | | |
| Convertible Preferred Stocks - 1.1% | | | |
| Biotechnology - 0.8% | | | |
| Biotechnology - 0.8% | | | |
| 23andMe, Inc. Series E (a)(b)(c) | | 1,340,332 | 14,006,469 |
| Immunocore Ltd. Series A (a)(b)(c) | | 76,348 | 12,157,171 |
| Kinnate Biopharma, Inc. Series C (a)(b) | | 786,605 | 7,538,822 |
| Nuvation Bio, Inc. Series A (a)(b)(c)(h) | | 2,086,600 | 1,961,404 |
| Prelude Therapeutics, Inc. Series C (a)(b) | | 637,261 | 7,999,983 |
| Taysha Gene Therapies, Inc. Series B (a)(b) | | 734,388 | 12,484,596 |
| | | | 56,148,445 |
| Health Care Technology - 0.3% | | | |
| Health Care Technology - 0.3% | | | |
| Codiak Biosciences, Inc.: | | | |
| Series A 8.00% (a)(b)(c) | | 856,366 | 4,418,849 |
| Series B 8.00% (a)(b)(c) | | 2,783,187 | 14,361,245 |
| Vor Biopharma, Inc. (a)(b) | | 5,769,231 | 3,000,000 |
| | | | 21,780,094 |
| Pharmaceuticals - 0.0% | | | |
| Pharmaceuticals - 0.0% | | | |
| Afferent Pharmaceuticals, Inc. Series C (a)(b)(c) | | 8,274,568 | 83 |
| Foghorn Therapeutics, Inc. (a)(b) | | 266,667 | 2,000,003 |
| | | | 2,000,086 |
|
| TOTAL CONVERTIBLE PREFERRED STOCKS | | | 79,928,625 |
|
| Nonconvertible Preferred Stocks - 0.0% | | | |
| Biotechnology - 0.0% | | | |
| Biotechnology - 0.0% | | | |
| Yumanity Holdings LLC Class A (a)(b)(c) | | 588,700 | 2,507,862 |
| TOTAL PREFERRED STOCKS | | | |
| (Cost $76,126,799) | | | 82,436,487 |
|
| Money Market Funds - 7.6% | | | |
| Fidelity Cash Central Fund 0.12% (i) | | 78,485,505 | 78,501,202 |
| Fidelity Securities Lending Cash Central Fund 0.11% (i)(j) | | 488,761,264 | 488,810,140 |
| TOTAL MONEY MARKET FUNDS | | | |
| (Cost $567,273,985) | | | 567,311,342 |
| TOTAL INVESTMENT IN SECURITIES - 106.5% | | | |
| (Cost $5,379,249,617) | | | 7,932,497,340 |
| NET OTHER ASSETS (LIABILITIES) - (6.5)% | | | (482,981,483) |
| NET ASSETS - 100% | | | $7,449,515,857 |
Legend
(a) Restricted securities (including private placements) - Investment in securities not registered under the Securities Act of 1933 (excluding 144A issues). At the end of the period, the value of restricted securities (excluding 144A issues) amounted to $172,666,144 or 2.3% of net assets.
(b) Level 3 security
(c) Non-income producing
(d) Security or a portion of the security is on loan at period end.
(e) Security exempt from registration under Rule 144A of the Securities Act of 1933. These securities may be resold in transactions exempt from registration, normally to qualified institutional buyers. At the end of the period, the value of these securities amounted to $37,495,723 or 0.5% of net assets.
(f) Affiliated company
(g) Investment is owned by a wholly-owned subsidiary (Subsidiary) that is treated as a corporation for U.S. tax purposes.
(h) Security or a portion of the security purchased on a delayed delivery or when-issued basis.
(i) Affiliated fund that is generally available only to investment companies and other accounts managed by Fidelity Investments. The rate quoted is the annualized seven-day yield of the fund at period end. A complete unaudited listing of the fund's holdings as of its most recent quarter end is available upon request. In addition, each Fidelity Central Fund's financial statements are available on the SEC's website or upon request.
(j) Investment made with cash collateral received from securities on loan.
Additional information on each restricted holding is as follows:
| Security | Acquisition Date | Acquisition Cost |
| 23andMe, Inc. Series E | 6/18/15 | $14,512,138 |
| Adimab LLC | 9/17/14 - 6/5/15 | $31,094,459 |
| Afferent Pharmaceuticals, Inc. Series C | 7/1/15 | $0 |
| Codiak Biosciences, Inc. Series A 8.00% | 11/12/15 | $856,366 |
| Codiak Biosciences, Inc. Series B 8.00% | 11/12/15 | $8,349,561 |
| Cyclerion Therapeutics, Inc. | 4/2/19 | $1,404,026 |
| Foghorn Therapeutics, Inc. | 7/17/20 | $2,000,003 |
| Immunocore Ltd. Series A | 7/27/15 | $13,796,921 |
| Kinnate Biopharma, Inc. Series C | 8/24/20 | $7,538,822 |
| Kronos Bio, Inc. | 8/20/20 | $8,000,000 |
| Nuvation Bio, Inc. Series A | 6/17/19 | $1,609,562 |
| Precipio, Inc. | 2/3/12 | $2,828,200 |
| Prelude Therapeutics, Inc. Series C | 8/21/20 | $7,999,983 |
| Royalty Pharma PLC | 5/21/15 | $468,770 |
| Taysha Gene Therapies, Inc. Series B | 7/2/20 | $12,484,596 |
| Vor Biopharma, Inc. | 6/30/20 | $3,000,000 |
| Yumanity Holdings LLC Class A | 2/8/16 | $3,978,847 |
Affiliated Central Funds
Information regarding fiscal year to date income earned by the Fund from investments in Fidelity Central Funds is as follows:
| Fund | Income earned |
| Fidelity Cash Central Fund | $80,405 |
| Fidelity Securities Lending Cash Central Fund | 2,789,735 |
| Total | $2,870,140 |
Amounts in the income column in the above table include any capital gain distributions from underlying funds, which are presented in the corresponding line-item in the Statement of Operations, if applicable. Amount for Fidelity Securities Lending Cash Central Fund represents the income earned on investing cash collateral, less rebates paid to borrowers and any lending agent fees associated with the loan, plus any premium payments received for lending certain types of securities.
The value, beginning of period, for the Fidelity Cash Central Fund was $618,432,642. Net realized gain (loss) and change in net unrealized appreciation (depreciation) was $14,101 and $(420), respectively. Purchases and sales of the Fidelity Cash Central Fund were $1,327,885,171 and $1,457,521,354, respectively, during the period.
Other Affiliated Issuers
An affiliated company is a company in which the Fund has ownership of at least 5% of the voting securities. Fiscal year to date transactions with companies which are or were affiliates are as follows:
| Affiliate | Value, beginning of period | Purchases | Sales Proceeds | Dividend Income | Realized Gain (loss) | Change in Unrealized appreciation (depreciation) | Value, end of period |
| Acorda Therapeutics, Inc. | $3,751,237 | $-- | $2,055,586 | $-- | $(21,408,329) | $19,712,678 | $-- |
| Allena Pharmaceuticals, Inc. | 56,027 | 201,500 | 84,173 | -- | (355,925) | 348,270 | -- |
| Allena Pharmaceuticals, Inc. | 2,851,463 | -- | -- | -- | -- | (897,415) | -- |
| aTyr Pharma, Inc. | 1,510,141 | -- | -- | -- | -- | 20,352 | -- |
| Geron Corp. | 15,417,418 | 2,729,999 | 15,974,260 | -- | 3,047,239 | 8,245,113 | -- |
| Krystal Biotech, Inc. | 61,375,887 | 9,955,000 | -- | -- | -- | (7,777,723) | 63,553,164 |
| Miragen Therapeutics, Inc. | 2,887,327 | -- | -- | -- | -- | 713,180 | 3,600,507 |
| Scholar Rock Holding Corp. | 21,573,442 | -- | -- | -- | -- | 1,513,658 | 23,087,100 |
| X4 Pharmaceuticals, Inc. | 8,808,864 | -- | 3,759,021 | -- | (1,273,479) | (698,390) | -- |
| Total | $118,231,806 | $12,886,499 | $21,873,040 | $-- | $(19,990,494) | $21,179,723 | $90,240,771 |
Investment Valuation
The following is a summary of the inputs used, as of August 31, 2020, involving the Fund's assets and liabilities carried at fair value. The inputs or methodology used for valuing securities may not be an indication of the risk associated with investing in those securities. For more information on valuation inputs, and their aggregation into the levels used below, please refer to the Investment Valuation section in the accompanying Notes to Financial Statements.
| | Valuation Inputs at Reporting Date: |
| Description | Total | Level 1 | Level 2 | Level 3 |
| Investments in Securities: | | | | |
| Common Stocks | $7,274,749,511 | $7,150,614,757 | $27,816,742 | $96,318,012 |
| Preferred Stocks | 82,436,487 | -- | -- | 82,436,487 |
| Money Market Funds | 567,311,342 | 567,311,342 | -- | -- |
| Preferred Securities | 8,000,000 | -- | -- | 8,000,000 |
| Total Investments in Securities: | $7,932,497,340 | $7,717,926,099 | $27,816,742 | $186,754,499 |
The following is a reconciliation of Investments in Securities for which Level 3 inputs were used in determining value:
| Investments in Securities: | |
| Common Stocks | |
| Beginning Balance | $114,638,031 |
| Total Realized Gain (Loss) | 14,178,094 |
| Total Unrealized Gain (Loss) | (11,635,440) |
| Cost of Purchases | -- |
| Proceeds of Sales | (20,878,844) |
| Amortization/Accretion | -- |
| Transfers in to Level 3 | 16,171 |
| Transfers out of Level 3 | -- |
| Ending Balance | $96,318,012 |
| The change in unrealized gain (loss) for the period attributable to Level 3 securities held at August 31, 2020 | $(11,635,440) |
| Preferred Stocks | |
| Beginning Balance | $52,087,895 |
| Total Realized Gain (Loss) | 771,584 |
| Total Unrealized Gain (Loss) | (886,958) |
| Cost of Purchases | 33,023,404 |
| Proceeds of Sales | (2,559,438) |
| Amortization/Accretion | -- |
| Transfers in to Level 3 | -- |
| Transfers out of Level 3 | -- |
| Ending Balance | $82,436,487 |
| The change in unrealized gain (loss) for the period attributable to Level 3 securities held at August 31, 2020 | $(886,958) |
| Other Investments in Securities | |
| Beginning Balance | $-- |
| Total Realized Gain (Loss) | -- |
| Total Unrealized Gain (Loss) | -- |
| Cost of Purchases | 8,000,000 |
| Proceeds of Sales | -- |
| Amortization/Accretion | -- |
| Transfer in to Level 3 | -- |
| Transfer out of Level 3 | -- |
| Ending Balance | $8,000,000 |
| The change in unrealized gain (loss) for the period attributable to Level 3 securities held at August 31, 2020 | $ -- |
The information used in the above reconciliations represents fiscal year to date activity for any Investments in Securities identified as using Level 3 inputs at either the beginning or the end of the current fiscal period. Transfers in or out of Level 3 represent the beginning value of any Security or Instrument where a change in the pricing level occurred from the beginning to the end of the period. The cost of purchases and the proceeds of sales may include securities received or delivered through corporate actions or exchanges. Realized and unrealized gains (losses) disclosed in the reconciliations are included in Net Gain (Loss) on the Fund's Statement of Operations.
Other Information
Distribution of investments by country or territory of incorporation, as a percentage of Total Net Assets, is as follows (Unaudited):
| United States of America | 89.6% |
| Belgium | 2.1% |
| Netherlands | 1.9% |
| Denmark | 1.6% |
| Switzerland | 1.5% |
| Others (Individually Less Than 1%) | 3.3% |
| | 100.0% |
See accompanying notes which are an integral part of the financial statements.
Biotechnology Portfolio
Financial Statements
Statement of Assets and Liabilities
| | | August 31, 2020 (Unaudited) |
| Assets | | |
Investment in securities, at value (including securities loaned of $486,416,571) — See accompanying schedule:
Unaffiliated issuers (cost $4,747,904,879) | $7,274,945,227 | |
| Fidelity Central Funds (cost $567,273,985) | 567,311,342 | |
| Other affiliated issuers (cost $64,070,753) | 90,240,771 | |
| Total Investment in Securities (cost $5,379,249,617) | | $7,932,497,340 |
| Receivable for investments sold | | 22,437,150 |
| Receivable for fund shares sold | | 5,192,281 |
| Dividends receivable | | 2,884,165 |
| Distributions receivable from Fidelity Central Funds | | 961,495 |
| Prepaid expenses | | 67,028 |
| Other receivables | | 987,446 |
| Total assets | | 7,965,026,905 |
| Liabilities | | |
| Payable for investments purchased | | |
| Regular delivery | $3,424,301 | |
| Delayed delivery | 804,781 | |
| Payable for fund shares redeemed | 17,292,924 | |
| Accrued management fee | 3,280,187 | |
| Other affiliated payables | 1,055,176 | |
| Other payables and accrued expenses | 1,004,607 | |
| Collateral on securities loaned | 488,649,072 | |
| Total liabilities | | 515,511,048 |
| Net Assets | | $7,449,515,857 |
| Net Assets consist of: | | |
| Paid in capital | | $4,131,742,970 |
| Total accumulated earnings (loss) | | 3,317,772,887 |
| Net Assets | | $7,449,515,857 |
| Net Asset Value, offering price and redemption price per share ($7,449,515,857 ÷ 315,160,319 shares) | | $23.64 |
See accompanying notes which are an integral part of the financial statements.
Statement of Operations
| | | Six months ended August 31, 2020 (Unaudited) |
| Investment Income | | |
| Dividends | | $22,976,831 |
| Income from Fidelity Central Funds (including $2,789,735 from security lending) | | 2,870,140 |
| Total income | | 25,846,971 |
| Expenses | | |
| Management fee | $18,669,012 | |
| Transfer agent fees | 5,459,550 | |
| Accounting fees | 581,909 | |
| Custodian fees and expenses | 52,355 | |
| Independent trustees' fees and expenses | 21,948 | |
| Registration fees | 74,267 | |
| Audit | 36,103 | |
| Legal | 5,490 | |
| Miscellaneous | 109,471 | |
| Total expenses before reductions | 25,010,105 | |
| Expense reductions | (271,748) | |
| Total expenses after reductions | | 24,738,357 |
| Net investment income (loss) | | 1,108,614 |
| Realized and Unrealized Gain (Loss) | | |
| Net realized gain (loss) on: | | |
| Investment securities: | | |
| Unaffiliated issuers | 815,285,289 | |
| Fidelity Central Funds | 14,879 | |
| Other affiliated issuers | (19,990,494) | |
| Foreign currency transactions | 114,421 | |
| Total net realized gain (loss) | | 795,424,095 |
| Change in net unrealized appreciation (depreciation) on: | | |
| Investment securities: | | |
| Unaffiliated issuers | 362,993,682 | |
| Fidelity Central Funds | (420) | |
| Other affiliated issuers | 21,179,723 | |
| Assets and liabilities in foreign currencies | 4,606 | |
| Total change in net unrealized appreciation (depreciation) | | 384,177,591 |
| Net gain (loss) | | 1,179,601,686 |
| Net increase (decrease) in net assets resulting from operations | | $1,180,710,300 |
See accompanying notes which are an integral part of the financial statements.
Statement of Changes in Net Assets
| | Six months ended August 31, 2020 (Unaudited) | Year ended February 29, 2020 |
| Increase (Decrease) in Net Assets | | |
| Operations | | |
| Net investment income (loss) | $1,108,614 | $15,224,099 |
| Net realized gain (loss) | 795,424,095 | 756,206,173 |
| Change in net unrealized appreciation (depreciation) | 384,177,591 | (244,332,914) |
| Net increase (decrease) in net assets resulting from operations | 1,180,710,300 | 527,097,358 |
| Distributions to shareholders | (322,998,524) | (648,542,988) |
| Share transactions | | |
| Proceeds from sales of shares | 566,134,243 | 456,496,894 |
| Reinvestment of distributions | 304,495,106 | 610,226,532 |
| Cost of shares redeemed | (903,577,338) | (1,904,247,877) |
| Net increase (decrease) in net assets resulting from share transactions | (32,947,989) | (837,524,451) |
| Total increase (decrease) in net assets | 824,763,787 | (958,970,081) |
| Net Assets | | |
| Beginning of period | 6,624,752,070 | 7,583,722,151 |
| End of period | $7,449,515,857 | $6,624,752,070 |
| Other Information | | |
| Shares | | |
| Sold | 25,972,416 | 21,609,310 |
| Issued in reinvestment of distributions | 16,379,511 | 27,974,462 |
| Redeemed | (42,310,222) | (93,189,218) |
| Net increase (decrease) | 41,705 | (43,605,446) |
See accompanying notes which are an integral part of the financial statements.
Financial Highlights
Biotechnology Portfolio
| | Six months ended (Unaudited) August 31, | Years endedFebruary 28, | | | | |
| | 2020 | 2020 A | 2019 B | 2018 B | 2017 B | 2016 A,B |
| Selected Per–Share Data | | | | | | |
| Net asset value, beginning of period | $21.02 | $21.14 | $23.45 | $20.32 | $16.20 | $24.80 |
| Income from Investment Operations | | | | | | |
| Net investment income (loss)C | –D | .05 | (.04) | (.05) | (.08) | (.10) |
| Net realized and unrealized gain (loss) | 3.67 | 1.79 | (.29)E | 3.49 | 4.80 | (6.92) |
| Total from investment operations | 3.67 | 1.84 | (.33) | 3.44 | 4.72 | (7.02) |
| Distributions from net investment income | (.05) | (.03) | – | – | – | – |
| Distributions from net realized gain | (1.00) | (1.93) | (1.98) | (.31) | (.60) | (1.58) |
| Total distributions | (1.05) | (1.96) | (1.98) | (.31) | (.60) | (1.58) |
| Redemption fees added to paid in capitalC | – | – | – | – | –D | –D |
| Net asset value, end of period | $23.64 | $21.02 | $21.14 | $23.45 | $20.32 | $16.20 |
| Total ReturnF,G | 18.83% | 8.57% | (.46)%E | 17.04% | 29.67% | (30.35)% |
| Ratios to Average Net AssetsH,I | | | | | | |
| Expenses before reductions | .71%J | .72% | .72% | .74% | .75% | .73% |
| Expenses net of fee waivers, if any | .71%J | .72% | .72% | .74% | .75% | .73% |
| Expenses net of all reductions | .70%J | .72% | .72% | .73% | .74% | .73% |
| Net investment income (loss) | .03%J | .22% | (.20)% | (.25)% | (.43)% | (.39)% |
| Supplemental Data | | | | | | |
| Net assets, end of period (000 omitted) | $7,449,516 | $6,624,752 | $7,583,722 | $8,940,767 | $9,573,681 | $9,723,599 |
| Portfolio turnover rateK | 81%J | 50% | 37% | 26% | 28% | 35% |
A For the year ended February 29.
B Per share amounts have been adjusted to reflect the impact of the 10 for 1 share split that occurred on August 10, 2018.
C Calculated based on average shares outstanding during the period.
D Amount represents less than $.005 per share.
E Net realized and unrealized gain (loss) per share reflects proceeds received from litigation which amounted to $.01 per share. Excluding these litigation proceeds, the total return would have been (.53)%.
F Total returns for periods of less than one year are not annualized.
G Total returns would have been lower if certain expenses had not been reduced during the applicable periods shown.
H Fees and expenses of any underlying mutual funds or exchange-traded funds (ETFs) are not included in the Fund's expense ratio. The Fund indirectly bears its proportionate share of these expenses. For additional expense information related to investments in Fidelity Central Funds, please refer to the "Investments in Fidelity Central Funds" note found in the Notes to Financial Statements section of the most recent Annual or Semi-Annual report.
I Expense ratios reflect operating expenses of the class. Expenses before reductions do not reflect amounts reimbursed, waived, or reduced through arrangements with the investment advisor, brokerage services, or other offset arrangements, if applicable, and do not represent the amount paid by the class during periods when reimbursements, waivers or reductions occur.
J Annualized
K Amount does not include the portfolio activity of any underlying Fidelity Central Funds.
See accompanying notes which are an integral part of the financial statements.
Health Care Portfolio
Investment Summary (Unaudited)
Top Ten Stocks as of August 31, 2020
| | % of fund's net assets |
| UnitedHealth Group, Inc. | 8.4 |
| Roche Holding AG (participation certificate) | 6.0 |
| Humana, Inc. | 5.1 |
| Regeneron Pharmaceuticals, Inc. | 4.8 |
| AstraZeneca PLC (United Kingdom) | 4.7 |
| Cigna Corp. | 4.6 |
| Becton, Dickinson & Co. | 4.4 |
| Danaher Corp. | 4.0 |
| Eli Lilly & Co. | 4.0 |
| Boston Scientific Corp. | 3.5 |
| | 49.5 |
Top Industries (% of fund's net assets)
| As of August 31, 2020 |
| | Health Care Providers & Services | 25.4% |
| | Health Care Equipment & Supplies | 23.0% |
| | Biotechnology | 22.5% |
| | Pharmaceuticals | 21.6% |
| | Life Sciences Tools & Services | 4.8% |
| | All Others* | 2.7% |

* Includes short-term investments and net other assets (liabilities).
Health Care Portfolio
Schedule of Investments August 31, 2020 (Unaudited)
Showing Percentage of Net Assets
| Common Stocks - 99.3% | | | |
| | | Shares | Value |
| Biotechnology - 22.4% | | | |
| Biotechnology - 22.4% | | | |
| Acceleron Pharma, Inc. (a) | | 530,000 | $51,659,100 |
| ADC Therapeutics SA (a)(b) | | 880,158 | 38,876,579 |
| Alnylam Pharmaceuticals, Inc. (a) | | 828,000 | 109,825,920 |
| Amgen, Inc. | | 128,000 | 32,424,960 |
| Aprea Therapeutics, Inc. | | 600,000 | 16,260,000 |
| Arcutis Biotherapeutics, Inc. (a) | | 600,000 | 15,042,000 |
| Argenx SE ADR (a) | | 600,000 | 138,762,000 |
| Ascendis Pharma A/S sponsored ADR (a) | | 898,725 | 133,173,071 |
| BeiGene Ltd. ADR (a) | | 200,000 | 48,314,000 |
| BioNTech SE ADR (a)(b) | | 512,219 | 31,373,414 |
| Black Diamond Therapeutics, Inc. (a) | | 230,000 | 6,617,100 |
| Blueprint Medicines Corp. (a) | | 400,000 | 30,972,000 |
| Denali Therapeutics, Inc. (a)(b) | | 360,000 | 11,484,000 |
| Exelixis, Inc. (a) | | 1,500,000 | 33,330,000 |
| Forma Therapeutics Holdings, Inc. | | 320,000 | 14,057,600 |
| Fusion Pharmaceuticals, Inc. (a) | | 96,133 | 1,237,232 |
| G1 Therapeutics, Inc. (a) | | 900,000 | 13,815,000 |
| Generation Bio Co. | | 142,537 | 4,451,431 |
| Generation Bio Co. | | 154,622 | 4,345,961 |
| Innovent Biologics, Inc. (a)(c) | | 6,600,000 | 43,850,413 |
| Insmed, Inc. (a) | | 1,370,210 | 38,626,220 |
| Intercept Pharmaceuticals, Inc. (a) | | 280,000 | 13,966,400 |
| Kura Oncology, Inc. (a) | | 1,280,000 | 31,859,200 |
| Kymera Therapeutics, Inc. (a) | | 14,800 | 472,120 |
| Morphic Holding, Inc. (a) | | 260,225 | 6,895,963 |
| Neurocrine Biosciences, Inc. (a) | | 1,080,000 | 125,733,600 |
| ORIC Pharmaceuticals, Inc. (a)(b) | | 659,935 | 16,531,372 |
| Passage Bio, Inc. | | 555,000 | 9,190,800 |
| Poseida Therapeutics, Inc. (a) | | 218,778 | 2,054,325 |
| Poseida Therapeutics, Inc. | | 1,415,125 | 11,959,221 |
| PTC Therapeutics, Inc. (a) | | 423,591 | 20,935,985 |
| Regeneron Pharmaceuticals, Inc. (a) | | 720,000 | 446,349,600 |
| Repare Therapeutics, Inc. | | 500,000 | 12,370,000 |
| Revolution Medicines, Inc. | | 1,290,000 | 36,558,600 |
| Sage Therapeutics, Inc. (a) | | 133,679 | 7,010,127 |
| Sarepta Therapeutics, Inc. (a) | | 690,000 | 101,029,800 |
| Scholar Rock Holding Corp. (a) | | 110,918 | 1,674,862 |
| Stoke Therapeutics, Inc. (a) | | 167,872 | 4,930,401 |
| TG Therapeutics, Inc. (a) | | 1,280,000 | 31,750,400 |
| Turning Point Therapeutics, Inc. (a) | | 470,000 | 36,744,600 |
| uniQure B.V. (a) | | 400,000 | 16,308,000 |
| Vaxcyte, Inc. | | 400,000 | 18,112,000 |
| Vertex Pharmaceuticals, Inc. (a) | | 600,000 | 167,472,000 |
| Viela Bio, Inc. | | 1,080,000 | 36,385,200 |
| Viking Therapeutics, Inc. (a)(b) | | 1,000,000 | 6,690,000 |
| Xencor, Inc. (a) | | 1,200,000 | 42,900,000 |
| Zentalis Pharmaceuticals, Inc. (b) | | 600,000 | 20,640,000 |
| Zymeworks, Inc. (a) | | 867,545 | 28,125,809 |
| | | | 2,073,148,386 |
| Health Care Equipment & Supplies - 23.0% | | | |
| Health Care Equipment - 22.8% | | | |
| Atricure, Inc. (a) | | 1,000,000 | 44,730,000 |
| Becton, Dickinson & Co. | | 1,700,000 | 412,709,000 |
| Boston Scientific Corp. (a) | | 8,000,000 | 328,160,000 |
| Danaher Corp. | | 1,800,000 | 371,646,000 |
| DexCom, Inc. (a) | | 88,000 | 37,436,080 |
| Genmark Diagnostics, Inc. (a) | | 2,000,000 | 25,940,000 |
| Hologic, Inc. (a) | | 931,817 | 55,648,111 |
| Insulet Corp. (a) | | 1,000,000 | 218,250,000 |
| Intuitive Surgical, Inc. (a) | | 195,000 | 142,513,800 |
| Masimo Corp. (a) | | 560,000 | 125,440,000 |
| Penumbra, Inc. (a) | | 1,090,000 | 227,973,500 |
| Shockwave Medical, Inc. (a) | | 610,000 | 38,759,400 |
| Tandem Diabetes Care, Inc. (a) | | 740,000 | 83,412,800 |
| | | | 2,112,618,691 |
| Health Care Supplies - 0.2% | | | |
| Quidel Corp. (a) | | 130,000 | 22,874,800 |
|
| TOTAL HEALTH CARE EQUIPMENT & SUPPLIES | | | 2,135,493,491 |
|
| Health Care Providers & Services - 25.4% | | | |
| Health Care Services - 6.7% | | | |
| 1Life Healthcare, Inc. (a) | | 1,800,000 | 52,506,000 |
| Alignment Healthcare Partners unit (d)(e) | | 2,145,460 | 31,602,626 |
| Cigna Corp. | | 2,400,000 | 425,688,000 |
| Oak Street Health, Inc. | | 2,758,058 | 110,782,916 |
| | | | 620,579,542 |
| Managed Health Care - 18.7% | | | |
| Anthem, Inc. | | 600,000 | 168,912,000 |
| Centene Corp. (a) | | 5,100,000 | 312,732,000 |
| Humana, Inc. | | 1,130,000 | 469,142,100 |
| UnitedHealth Group, Inc. | | 2,500,000 | 781,374,995 |
| | | | 1,732,161,095 |
|
| TOTAL HEALTH CARE PROVIDERS & SERVICES | | | 2,352,740,637 |
|
| Health Care Technology - 1.3% | | | |
| Health Care Technology - 1.3% | | | |
| Castlight Health, Inc. (a) | | 1,845,550 | 2,546,859 |
| Castlight Health, Inc. Class B (a) | | 4,000,000 | 5,520,000 |
| Inspire Medical Systems, Inc. (a) | | 691,100 | 82,551,895 |
| Veeva Systems, Inc. Class A (a) | | 110,000 | 31,049,700 |
| | | | 121,668,454 |
| Life Sciences Tools & Services - 4.8% | | | |
| Life Sciences Tools & Services - 4.8% | | | |
| 10X Genomics, Inc. Class B (c) | | 1,700,000 | 194,854,000 |
| Bio-Rad Laboratories, Inc. Class A (a) | | 90,000 | 45,773,100 |
| Bruker Corp. | | 2,360,000 | 99,167,200 |
| Lonza Group AG | | 170,000 | 105,640,266 |
| | | | 445,434,566 |
| Pharmaceuticals - 21.6% | | | |
| Pharmaceuticals - 21.6% | | | |
| Arvinas Holding Co. LLC (a) | | 500,000 | 12,975,000 |
| AstraZeneca PLC (United Kingdom) | | 3,900,000 | 432,901,005 |
| Eli Lilly & Co. | | 2,500,000 | 370,975,000 |
| Harmony Biosciences Holdings, Inc. | | 2,009,956 | 64,073,377 |
| MyoKardia, Inc. (a) | | 748,965 | 81,966,730 |
| Nektar Therapeutics (a)(b) | | 2,080,000 | 40,227,200 |
| Pliant Therapeutics, Inc. | | 915,200 | 23,017,280 |
| Roche Holding AG (participation certificate) | | 1,600,000 | 559,710,455 |
| Royalty Pharma PLC (d)(e) | | 14,453 | 0 |
| Royalty Pharma PLC | | 320,000 | 13,241,600 |
| Royalty Pharma PLC | | 1,853,000 | 69,009,426 |
| Sanofi SA | | 2,690,000 | 272,466,711 |
| Theravance Biopharma, Inc. (a) | | 1,304,135 | 23,904,795 |
| UCB SA | | 325,000 | 38,597,713 |
| | | | 2,003,066,292 |
| Professional Services - 0.3% | | | |
| Research & Consulting Services - 0.3% | | | |
| Clarivate Analytics PLC (a) | | 1,000,000 | 29,440,000 |
| Software - 0.5% | | | |
| Application Software - 0.5% | | | |
| Nuance Communications, Inc. (a) | | 1,120,000 | 33,555,200 |
| Outset Medical, Inc. (a)(e) | | 3,279,404 | 10,100,564 |
| | | | 43,655,764 |
| TOTAL COMMON STOCKS | | | |
| (Cost $5,858,930,738) | | | 9,204,647,590 |
|
| Convertible Preferred Stocks - 0.4% | | | |
| Biotechnology - 0.1% | | | |
| Biotechnology - 0.1% | | | |
| Shattuck Labs, Inc. Series B1 (d)(e) | | 143,129 | 9,000,025 |
| Software - 0.3% | | | |
| Application Software - 0.3% | | | |
| Outset Medical, Inc.: | | | |
| Series B (a)(e) | | 8,159,125 | 22,600,776 |
| Series E (e) | | 840,909 | 2,590,000 |
| | | | 25,190,776 |
| TOTAL CONVERTIBLE PREFERRED STOCKS | | | |
| (Cost $22,169,995) | | | 34,190,801 |
|
| Money Market Funds - 0.9% | | | |
| Fidelity Cash Central Fund 0.12% (f) | | 32,890,181 | 32,896,759 |
| Fidelity Securities Lending Cash Central Fund 0.11% (f)(g) | | 56,683,518 | 56,689,186 |
| TOTAL MONEY MARKET FUNDS | | | |
| (Cost $89,583,774) | | | 89,585,945 |
| TOTAL INVESTMENT IN SECURITIES - 100.6% | | | |
| (Cost $5,970,684,507) | | | 9,328,424,336 |
| NET OTHER ASSETS (LIABILITIES) - (0.6)% | | | (56,091,975) |
| NET ASSETS - 100% | | | $9,272,332,361 |
Legend
(a) Non-income producing
(b) Security or a portion of the security is on loan at period end.
(c) Security exempt from registration under Rule 144A of the Securities Act of 1933. These securities may be resold in transactions exempt from registration, normally to qualified institutional buyers. At the end of the period, the value of these securities amounted to $238,704,413 or 2.6% of net assets.
(d) Level 3 security
(e) Restricted securities (including private placements) - Investment in securities not registered under the Securities Act of 1933 (excluding 144A issues). At the end of the period, the value of restricted securities (excluding 144A issues) amounted to $75,893,991 or 0.8% of net assets.
(f) Affiliated fund that is generally available only to investment companies and other accounts managed by Fidelity Investments. The rate quoted is the annualized seven-day yield of the fund at period end. A complete unaudited listing of the fund's holdings as of its most recent quarter end is available upon request. In addition, each Fidelity Central Fund's financial statements are available on the SEC's website or upon request.
(g) Investment made with cash collateral received from securities on loan.
Additional information on each restricted holding is as follows:
| Security | Acquisition Date | Acquisition Cost |
| Alignment Healthcare Partners unit | 2/28/20 | $26,000,002 |
| Outset Medical, Inc. | 5/5/15 | $7,180,030 |
| Outset Medical, Inc. Series B | 5/5/15 | $11,319,970 |
| Outset Medical, Inc. Series E | 1/27/20 | $1,850,000 |
| Royalty Pharma PLC | 5/21/15 | $1,704,009 |
| Shattuck Labs, Inc. Series B1 | 6/12/20 | $9,000,025 |
Affiliated Central Funds
Information regarding fiscal year to date income earned by the Fund from investments in Fidelity Central Funds is as follows:
| Fund | Income earned |
| Fidelity Cash Central Fund | $118,814 |
| Fidelity Securities Lending Cash Central Fund | 632,543 |
| Total | $751,357 |
Amounts in the income column in the above table include any capital gain distributions from underlying funds, which are presented in the corresponding line-item in the Statement of Operations, if applicable. Amount for Fidelity Securities Lending Cash Central Fund represents the income earned on investing cash collateral, less rebates paid to borrowers and any lending agent fees associated with the loan, plus any premium payments received for lending certain types of securities.
Investment Valuation
The following is a summary of the inputs used, as of August 31, 2020, involving the Fund's assets and liabilities carried at fair value. The inputs or methodology used for valuing securities may not be an indication of the risk associated with investing in those securities. For more information on valuation inputs, and their aggregation into the levels used below, please refer to the Investment Valuation section in the accompanying Notes to Financial Statements.
| | Valuation Inputs at Reporting Date: |
| Description | Total | Level 1 | Level 2 | Level 3 |
| Investments in Securities: | | | | |
| Common Stocks | $9,204,647,590 | $7,488,204,649 | $1,684,840,315 | $31,602,626 |
| Convertible Preferred Stocks | 34,190,801 | -- | 25,190,776 | 9,000,025 |
| Money Market Funds | 89,585,945 | 89,585,945 | -- | -- |
| Total Investments in Securities: | $9,328,424,336 | $7,577,790,594 | $1,710,031,091 | $40,602,651 |
The following is a reconciliation of Investments in Securities for which Level 3 inputs were used in determining value:
| Investments in Securities: | |
| Beginning Balance | $147,746,791 |
| Total Realized Gain (Loss) | 48,578,778 |
| Total Unrealized Gain (Loss) | (10,546,719) |
| Cost of Purchases | 9,000,025 |
| Proceeds of Sales | (102,378,722) |
| Amortization/Accretion | -- |
| Transfers in to Level 3 | -- |
| Transfers out of Level 3 | (51,797,502) |
| Ending Balance | $40,602,651 |
| The change in unrealized gain (loss) for the period attributable to Level 3 securities held at August 31, 2020 | $(10,546,719) |
The information used in the above reconciliations represents fiscal year to date activity for any Investments in Securities identified as using Level 3 inputs at either the beginning or the end of the current fiscal period. Cost of purchases and proceeds of sales may include securities received and/or delivered through in-kind transactions. Transfers in or out of Level 3 represent the beginning value of any Security or Instrument where a change in the pricing level occurred from the beginning to the end of the period. The cost of purchases and the proceeds of sales may include securities received or delivered through corporate actions or exchanges. Realized and unrealized gains (losses) disclosed in the reconciliations are included in Net Gain (Loss) on the Fund's Statement of Operations.
Other Information
Distribution of investments by country or territory of incorporation, as a percentage of Total Net Assets, is as follows (Unaudited):
| United States of America | 78.4% |
| Switzerland | 7.5% |
| United Kingdom | 5.5% |
| France | 2.9% |
| Netherlands | 1.7% |
| Denmark | 1.4% |
| Cayman Islands | 1.3% |
| Others (Individually Less Than 1%) | 1.3% |
| | 100.0% |
See accompanying notes which are an integral part of the financial statements.
Health Care Portfolio
Financial Statements
Statement of Assets and Liabilities
| | | August 31, 2020 (Unaudited) |
| Assets | | |
Investment in securities, at value (including securities loaned of $53,580,990) — See accompanying schedule:
Unaffiliated issuers (cost $5,881,100,733) | $9,238,838,391 | |
| Fidelity Central Funds (cost $89,583,774) | 89,585,945 | |
| Total Investment in Securities (cost $5,970,684,507) | | $9,328,424,336 |
| Receivable for investments sold | | 5,775,354 |
| Receivable for fund shares sold | | 11,464,123 |
| Dividends receivable | | 12,035,924 |
| Distributions receivable from Fidelity Central Funds | | 166,174 |
| Prepaid expenses | | 58,913 |
| Other receivables | | 730,956 |
| Total assets | | 9,358,655,780 |
| Liabilities | | |
| Payable for investments purchased | $3,733,070 | |
| Payable for fund shares redeemed | 19,922,605 | |
| Accrued management fee | 4,094,593 | |
| Other affiliated payables | 1,193,815 | |
| Other payables and accrued expenses | 711,975 | |
| Collateral on securities loaned | 56,667,361 | |
| Total liabilities | | 86,323,419 |
| Net Assets | | $9,272,332,361 |
| Net Assets consist of: | | |
| Paid in capital | | $5,331,788,497 |
| Total accumulated earnings (loss) | | 3,940,543,864 |
| Net Assets | | $9,272,332,361 |
| Net Asset Value, offering price and redemption price per share ($9,272,332,361 ÷ 294,226,542 shares) | | $31.51 |
See accompanying notes which are an integral part of the financial statements.
Statement of Operations
| | | Six months ended August 31, 2020 (Unaudited) |
| Investment Income | | |
| Dividends | | $37,588,854 |
| Income from Fidelity Central Funds (including $632,543 from security lending) | | 751,357 |
| Total income | | 38,340,211 |
| Expenses | | |
| Management fee | $22,106,435 | |
| Transfer agent fees | 6,046,635 | |
| Accounting fees | 608,414 | |
| Custodian fees and expenses | 87,304 | |
| Independent trustees' fees and expenses | 25,275 | |
| Registration fees | 177,075 | |
| Audit | 27,101 | |
| Legal | 7,390 | |
| Interest | 1,170 | |
| Miscellaneous | 104,857 | |
| Total expenses before reductions | 29,191,656 | |
| Expense reductions | (285,079) | |
| Total expenses after reductions | | 28,906,577 |
| Net investment income (loss) | | 9,433,634 |
| Realized and Unrealized Gain (Loss) | | |
| Net realized gain (loss) on: | | |
| Investment securities: | | |
| Unaffiliated issuers | 634,699,592 | |
| Fidelity Central Funds | (2,597) | |
| Foreign currency transactions | (406,698) | |
| Total net realized gain (loss) | | 634,290,297 |
| Change in net unrealized appreciation (depreciation) on: | | |
| Investment securities: | | |
| Unaffiliated issuers | 1,020,422,729 | |
| Fidelity Central Funds | (212) | |
| Assets and liabilities in foreign currencies | 453,493 | |
| Total change in net unrealized appreciation (depreciation) | | 1,020,876,010 |
| Net gain (loss) | | 1,655,166,307 |
| Net increase (decrease) in net assets resulting from operations | | $1,664,599,941 |
See accompanying notes which are an integral part of the financial statements.
Statement of Changes in Net Assets
| | Six months ended August 31, 2020 (Unaudited) | Year ended February 29, 2020 |
| Increase (Decrease) in Net Assets | | |
| Operations | | |
| Net investment income (loss) | $9,433,634 | $11,611,040 |
| Net realized gain (loss) | 634,290,297 | 416,068,140 |
| Change in net unrealized appreciation (depreciation) | 1,020,876,010 | 215,998,550 |
| Net increase (decrease) in net assets resulting from operations | 1,664,599,941 | 643,677,730 |
| Distributions to shareholders | (214,992,240) | (104,508,735) |
| Share transactions | | |
| Proceeds from sales of shares | 1,462,931,499 | 845,022,583 |
| Reinvestment of distributions | 199,136,817 | 96,915,411 |
| Cost of shares redeemed | (1,059,530,489) | (1,711,627,255) |
| Net increase (decrease) in net assets resulting from share transactions | 602,537,827 | (769,689,261) |
| Total increase (decrease) in net assets | 2,052,145,528 | (230,520,266) |
| Net Assets | | |
| Beginning of period | 7,220,186,833 | 7,450,707,099 |
| End of period | $9,272,332,361 | $7,220,186,833 |
| Other Information | | |
| Shares | | |
| Sold | 51,557,327 | 32,388,556 |
| Issued in reinvestment of distributions | 7,748,511 | 3,395,775 |
| Redeemed | (37,232,513) | (67,969,335) |
| Net increase (decrease) | 22,073,325 | (32,185,004) |
See accompanying notes which are an integral part of the financial statements.
Financial Highlights
Health Care Portfolio
| | Six months ended (Unaudited) August 31, | Years endedFebruary 28, | | | | |
| | 2020 | 2020 A | 2019 B | 2018 B | 2017 B | 2016 A,B |
| Selected Per–Share Data | | | | | | |
| Net asset value, beginning of period | $26.53 | $24.48 | $23.56 | $20.89 | $18.05 | $23.64 |
| Income from Investment Operations | | | | | | |
| Net investment income (loss)C | .03 | .04 | .02 | .05 | .02 | (.01) |
| Net realized and unrealized gain (loss) | 5.74 | 2.40 | 2.90 | 3.17 | 2.93 | (3.16) |
| Total from investment operations | 5.77 | 2.44 | 2.92 | 3.22 | 2.95 | (3.17) |
| Distributions from net investment income | (.06) | (.03) | (.03) | (.04) | (.02) | – |
| Distributions from net realized gain | (.73) | (.36) | (1.97) | (.51) | (.09) | (2.42) |
| Total distributions | (.79) | (.39) | (2.00) | (.55) | (.11) | (2.42) |
| Redemption fees added to paid in capitalC | – | – | – | – | –D | –D |
| Net asset value, end of period | $31.51 | $26.53 | $24.48 | $23.56 | $20.89 | $18.05 |
| Total ReturnE,F | 22.41% | 9.84% | 13.30% | 15.49% | 16.43% | (14.90)% |
| Ratios to Average Net AssetsG,H | | | | | | |
| Expenses before reductions | .70%I | .70% | .71% | .73% | .74% | .73% |
| Expenses net of fee waivers, if any | .70%I | .70% | .71% | .73% | .73% | .73% |
| Expenses net of all reductions | .70%I | .70% | .71% | .72% | .73% | .72% |
| Net investment income (loss) | .23%I | .16% | .10% | .23% | .12% | (.03)% |
| Supplemental Data | | | | | | |
| Net assets, end of period (000 omitted) | $9,272,332 | $7,220,187 | $7,450,707 | $6,923,404 | $6,628,882 | $7,439,085 |
| Portfolio turnover rateJ | 59%I | 36%K | 60%K | 75% | 49%K | 76% |
A For the year ended February 29.
B Per share amounts have been adjusted to reflect the impact of the 10 for 1 share split that occurred on August 10, 2018.
C Calculated based on average shares outstanding during the period.
D Amount represents less than $.005 per share.
E Total returns for periods of less than one year are not annualized.
F Total returns would have been lower if certain expenses had not been reduced during the applicable periods shown.
G Fees and expenses of any underlying mutual funds or exchange-traded funds (ETFs) are not included in the Fund's expense ratio. The Fund indirectly bears its proportionate share of these expenses. For additional expense information related to investments in Fidelity Central Funds, please refer to the "Investments in Fidelity Central Funds" note found in the Notes to Financial Statements section of the most recent Annual or Semi-Annual report.
H Expense ratios reflect operating expenses of the class. Expenses before reductions do not reflect amounts reimbursed, waived, or reduced through arrangements with the investment advisor, brokerage services, or other offset arrangements, if applicable, and do not represent the amount paid by the class during periods when reimbursements, waivers or reductions occur.
I Annualized
J Amount does not include the portfolio activity of any underlying Fidelity Central Funds.
K Portfolio turnover rate excludes securities received or delivered in-kind.
See accompanying notes which are an integral part of the financial statements.
Health Care Services Portfolio
Investment Summary (Unaudited)
Top Ten Stocks as of August 31, 2020
| | % of fund's net assets |
| UnitedHealth Group, Inc. | 24.1 |
| Cigna Corp. | 9.4 |
| Humana, Inc. | 8.2 |
| Centene Corp. | 7.2 |
| Molina Healthcare, Inc. | 4.7 |
| Anthem, Inc. | 4.6 |
| LHC Group, Inc. | 4.3 |
| Amedisys, Inc. | 4.2 |
| Chemed Corp. | 4.1 |
| AmerisourceBergen Corp. | 4.1 |
| | 74.9 |
Top Industries (% of fund's net assets)
| As of August 31, 2020 |
| | Health Care Providers & Services | 91.3% |
| | Insurance | 2.9% |
| | Health Care Technology | 2.0% |
| | Diversified Consumer Services | 1.1% |
| | All Others* | 2.7% |

* Includes short-term investments and net other assets (liabilities).
Health Care Services Portfolio
Schedule of Investments August 31, 2020 (Unaudited)
Showing Percentage of Net Assets
| Common Stocks - 97.3% | | | |
| | | Shares | Value |
| Diversified Consumer Services - 1.1% | | | |
| Specialized Consumer Services - 1.1% | | | |
| Service Corp. International | | 260,700 | $11,900,955 |
| Health Care Providers & Services - 91.3% | | | |
| Health Care Distributors & Services - 5.4% | | | |
| AmerisourceBergen Corp. | | 451,000 | 43,760,530 |
| McKesson Corp. | | 87,053 | 13,357,412 |
| | | | 57,117,942 |
| Health Care Facilities - 6.4% | | | |
| Brookdale Senior Living, Inc. (a) | | 2,707,000 | 7,444,250 |
| HCA Holdings, Inc. | | 158,000 | 21,443,760 |
| Surgery Partners, Inc. (a)(b) | | 854,500 | 16,312,405 |
| U.S. Physical Therapy, Inc. (b) | | 193,100 | 17,166,590 |
| Universal Health Services, Inc. Class B | | 48,300 | 5,329,905 |
| | | | 67,696,910 |
| Health Care Services - 30.5% | | | |
| 1Life Healthcare, Inc. (a) | | 607,036 | 17,707,240 |
| Alignment Healthcare Partners unit (c)(d) | | 181,539 | 2,674,069 |
| Amedisys, Inc. (a) | | 181,400 | 43,880,660 |
| Andlauer Healthcare Group, Inc. | | 45,700 | 1,506,574 |
| BioScrip, Inc. (a) | | 165,900 | 1,927,758 |
| Chemed Corp. | | 84,700 | 43,799,217 |
| Cigna Corp. | | 557,872 | 98,949,757 |
| CVS Health Corp. | | 501,400 | 31,146,968 |
| LHC Group, Inc. (a) | | 215,896 | 45,001,362 |
| Oak Street Health, Inc. (a) | | 1,700 | 75,871 |
| Oak Street Health, Inc. | | 209,227 | 8,404,021 |
| Quest Diagnostics, Inc. | | 239,700 | 26,664,228 |
| | | | 321,737,725 |
| Managed Health Care - 49.0% | | | |
| Anthem, Inc. | | 170,702 | 48,056,027 |
| Centene Corp. (a) | | 1,229,550 | 75,396,006 |
| HealthEquity, Inc. (a) | | 40,700 | 2,339,436 |
| Humana, Inc. | | 207,300 | 86,064,741 |
| Molina Healthcare, Inc. (a) | | 270,100 | 49,960,397 |
| UnitedHealth Group, Inc. | | 813,650 | 254,306,309 |
| | | | 516,122,916 |
|
| TOTAL HEALTH CARE PROVIDERS & SERVICES | | | 962,675,493 |
|
| Health Care Technology - 2.0% | | | |
| Health Care Technology - 2.0% | | | |
| Change Healthcare, Inc. (a) | | 1,327,534 | 18,784,606 |
| Teladoc Health, Inc. (a)(b) | | 11,729 | 2,529,828 |
| | | | 21,314,434 |
| Insurance - 2.9% | | | |
| Insurance Brokers - 2.9% | | | |
| eHealth, Inc. (a)(b) | | 213,900 | 13,501,368 |
| GoHealth, Inc. (a) | | 776,000 | 10,794,160 |
| Selectquote, Inc. (b) | | 321,800 | 5,872,850 |
| | | | 30,168,378 |
| TOTAL COMMON STOCKS | | | |
| (Cost $506,458,566) | | | 1,026,059,260 |
|
| Money Market Funds - 2.7% | | | |
| Fidelity Cash Central Fund 0.12% (e) | | 15,775,231 | 15,778,386 |
| Fidelity Securities Lending Cash Central Fund 0.11% (e)(f) | | 12,690,643 | 12,691,912 |
| TOTAL MONEY MARKET FUNDS | | | |
| (Cost $28,470,298) | | | 28,470,298 |
| TOTAL INVESTMENT IN SECURITIES - 100.0% | | | |
| (Cost $534,928,864) | | | 1,054,529,558 |
| NET OTHER ASSETS (LIABILITIES) - 0.0% | | | 364,958 |
| NET ASSETS - 100% | | | $1,054,894,516 |
Legend
(a) Non-income producing
(b) Security or a portion of the security is on loan at period end.
(c) Level 3 security
(d) Restricted securities (including private placements) - Investment in securities not registered under the Securities Act of 1933 (excluding 144A issues). At the end of the period, the value of restricted securities (excluding 144A issues) amounted to $2,674,069 or 0.3% of net assets.
(e) Affiliated fund that is generally available only to investment companies and other accounts managed by Fidelity Investments. The rate quoted is the annualized seven-day yield of the fund at period end. A complete unaudited listing of the fund's holdings as of its most recent quarter end is available upon request. In addition, each Fidelity Central Fund's financial statements are available on the SEC's website or upon request.
(f) Investment made with cash collateral received from securities on loan.
Additional information on each restricted holding is as follows:
| Security | Acquisition Date | Acquisition Cost |
| Alignment Healthcare Partners unit | 2/28/20 | $2,200,001 |
Affiliated Central Funds
Information regarding fiscal year to date income earned by the Fund from investments in Fidelity Central Funds is as follows:
| Fund | Income earned |
| Fidelity Cash Central Fund | $10,854 |
| Fidelity Securities Lending Cash Central Fund | 92,834 |
| Total | $103,688 |
Amounts in the income column in the above table include any capital gain distributions from underlying funds, which are presented in the corresponding line-item in the Statement of Operations, if applicable. Amount for Fidelity Securities Lending Cash Central Fund represents the income earned on investing cash collateral, less rebates paid to borrowers and any lending agent fees associated with the loan, plus any premium payments received for lending certain types of securities.
Investment Valuation
The following is a summary of the inputs used, as of August 31, 2020, involving the Fund's assets and liabilities carried at fair value. The inputs or methodology used for valuing securities may not be an indication of the risk associated with investing in those securities. For more information on valuation inputs, and their aggregation into the levels used below, please refer to the Investment Valuation section in the accompanying Notes to Financial Statements.
| | Valuation Inputs at Reporting Date: |
| Description | Total | Level 1 | Level 2 | Level 3 |
| Investments in Securities: | | | | |
| Common Stocks | $1,026,059,260 | $1,014,981,170 | $8,404,021 | $2,674,069 |
| Money Market Funds | 28,470,298 | 28,470,298 | -- | -- |
| Total Investments in Securities: | $1,054,529,558 | $1,043,451,468 | $8,404,021 | $2,674,069 |
See accompanying notes which are an integral part of the financial statements.
Health Care Services Portfolio
Financial Statements
Statement of Assets and Liabilities
| | | August 31, 2020 (Unaudited) |
| Assets | | |
Investment in securities, at value (including securities loaned of $12,447,435) — See accompanying schedule:
Unaffiliated issuers (cost $506,458,566) | $1,026,059,260 | |
| Fidelity Central Funds (cost $28,470,298) | 28,470,298 | |
| Total Investment in Securities (cost $534,928,864) | | $1,054,529,558 |
| Receivable for investments sold | | 20,187,592 |
| Receivable for fund shares sold | | 309,067 |
| Dividends receivable | | 259,618 |
| Distributions receivable from Fidelity Central Funds | | 14,328 |
| Prepaid expenses | | 7,018 |
| Other receivables | | 75,678 |
| Total assets | | 1,075,382,859 |
| Liabilities | | |
| Payable for investments purchased | $4,219,881 | |
| Payable for fund shares redeemed | 2,844,771 | |
| Accrued management fee | 474,514 | |
| Other affiliated payables | 172,585 | |
| Other payables and accrued expenses | 88,108 | |
| Collateral on securities loaned | 12,688,484 | |
| Total liabilities | | 20,488,343 |
| Net Assets | | $1,054,894,516 |
| Net Assets consist of: | | |
| Paid in capital | | $589,187,925 |
| Total accumulated earnings (loss) | | 465,706,591 |
| Net Assets | | $1,054,894,516 |
| Net Asset Value, offering price and redemption price per share ($1,054,894,516 ÷ 9,649,626 shares) | | $109.32 |
See accompanying notes which are an integral part of the financial statements.
Statement of Operations
| | | Six months ended August 31, 2020 (Unaudited) |
| Investment Income | | |
| Dividends | | $4,323,678 |
| Income from Fidelity Central Funds (including $92,834 from security lending) | | 103,688 |
| Total income | | 4,427,366 |
| Expenses | | |
| Management fee | $2,738,967 | |
| Transfer agent fees | 854,725 | |
| Accounting fees | 170,093 | |
| Custodian fees and expenses | 3,450 | |
| Independent trustees' fees and expenses | 3,334 | |
| Registration fees | 23,113 | |
| Audit | 18,381 | |
| Legal | 771 | |
| Interest | 407 | |
| Miscellaneous | 18,407 | |
| Total expenses before reductions | 3,831,648 | |
| Expense reductions | (10,409) | |
| Total expenses after reductions | | 3,821,239 |
| Net investment income (loss) | | 606,127 |
| Realized and Unrealized Gain (Loss) | | |
| Net realized gain (loss) on: | | |
| Investment securities: | | |
| Unaffiliated issuers | 17,314,436 | |
| Fidelity Central Funds | (1,560) | |
| Foreign currency transactions | 22 | |
| Total net realized gain (loss) | | 17,312,898 |
| Change in net unrealized appreciation (depreciation) on: | | |
| Investment securities: | | |
| Unaffiliated issuers | 135,624,091 | |
| Assets and liabilities in foreign currencies | 336 | |
| Total change in net unrealized appreciation (depreciation) | | 135,624,427 |
| Net gain (loss) | | 152,937,325 |
| Net increase (decrease) in net assets resulting from operations | | $153,543,452 |
See accompanying notes which are an integral part of the financial statements.
Statement of Changes in Net Assets
| | Six months ended August 31, 2020 (Unaudited) | Year ended February 29, 2020 |
| Increase (Decrease) in Net Assets | | |
| Operations | | |
| Net investment income (loss) | $606,127 | $2,706,224 |
| Net realized gain (loss) | 17,312,898 | (27,521,941) |
| Change in net unrealized appreciation (depreciation) | 135,624,427 | 75,937,774 |
| Net increase (decrease) in net assets resulting from operations | 153,543,452 | 51,122,057 |
| Distributions to shareholders | (8,046,464) | (3,201,281) |
| Share transactions | | |
| Proceeds from sales of shares | 103,244,007 | 234,226,310 |
| Reinvestment of distributions | 7,493,478 | 3,008,611 |
| Cost of shares redeemed | (204,545,988) | (625,019,620) |
| Net increase (decrease) in net assets resulting from share transactions | (93,808,503) | (387,784,699) |
| Total increase (decrease) in net assets | 51,688,485 | (339,863,923) |
| Net Assets | | |
| Beginning of period | 1,003,206,031 | 1,343,069,954 |
| End of period | $1,054,894,516 | $1,003,206,031 |
| Other Information | | |
| Shares | | |
| Sold | 1,055,795 | 2,483,026 |
| Issued in reinvestment of distributions | 79,137 | 28,799 |
| Redeemed | (2,077,085) | (6,963,847) |
| Net increase (decrease) | (942,153) | (4,452,022) |
See accompanying notes which are an integral part of the financial statements.
Financial Highlights
Health Care Services Portfolio
| | Six months ended (Unaudited) August 31, | Years endedFebruary 28, | | | | |
| | 2020 | 2020 A | 2019 | 2018 | 2017 | 2016 A |
| Selected Per–Share Data | | | | | | |
| Net asset value, beginning of period | $94.72 | $89.28 | $92.21 | $89.93 | $78.59 | $87.26 |
| Income from Investment Operations | | | | | | |
| Net investment income (loss)B | .06 | .23 | .13 | .11 | .12 | (.03) |
| Net realized and unrealized gain (loss) | 15.33 | 5.50 | 8.27 | 14.23 | 15.03 | (5.21) |
| Total from investment operations | 15.39 | 5.73 | 8.40 | 14.34 | 15.15 | (5.24) |
| Distributions from net investment income | (.79) | (.29) | (.10) | (.10) | (.13) | (.02) |
| Distributions from net realized gain | – | – | (11.23) | (11.96) | (3.68) | (3.41) |
| Total distributions | (.79) | (.29) | (11.33) | (12.06) | (3.81) | (3.43) |
| Redemption fees added to paid in capitalB | – | – | – | –C | –C | –C |
| Net asset value, end of period | $109.32 | $94.72 | $89.28 | $92.21 | $89.93 | $78.59 |
| Total ReturnD,E | 16.38% | 6.39% | 9.61% | 17.03% | 19.71% | (6.30)% |
| Ratios to Average Net AssetsF,G | | | | | | |
| Expenses before reductions | .74%H | .75% | .76% | .77% | .78% | .77% |
| Expenses net of fee waivers, if any | .74%H | .75% | .76% | .77% | .78% | .77% |
| Expenses net of all reductions | .74%H | .75% | .76% | .76% | .78% | .77% |
| Net investment income (loss) | .12%H | .25% | .14% | .12% | .15% | (.03)% |
| Supplemental Data | | | | | | |
| Net assets, end of period (000 omitted) | $1,054,895 | $1,003,206 | $1,343,070 | $829,692 | $760,108 | $837,518 |
| Portfolio turnover rateI | 29%H | 37% | 60% | 65% | 26% | 39% |
A For the year ended February 29.
B Calculated based on average shares outstanding during the period.
C Amount represents less than $.005 per share.
D Total returns for periods of less than one year are not annualized.
E Total returns would have been lower if certain expenses had not been reduced during the applicable periods shown.
F Fees and expenses of any underlying mutual funds or exchange-traded funds (ETFs) are not included in the Fund's expense ratio. The Fund indirectly bears its proportionate share of these expenses. For additional expense information related to investments in Fidelity Central Funds, please refer to the "Investments in Fidelity Central Funds" note found in the Notes to Financial Statements section of the most recent Annual or Semi-Annual report.
G Expense ratios reflect operating expenses of the class. Expenses before reductions do not reflect amounts reimbursed, waived, or reduced through arrangements with the investment advisor, brokerage services, or other offset arrangements, if applicable, and do not represent the amount paid by the class during periods when reimbursements, waivers or reductions occur.
H Annualized
I Amount does not include the portfolio activity of any underlying Fidelity Central Funds.
See accompanying notes which are an integral part of the financial statements.
Medical Technology and Devices Portfolio
Investment Summary (Unaudited)
Top Ten Stocks as of August 31, 2020
| | % of fund's net assets |
| Thermo Fisher Scientific, Inc. | 11.9 |
| Danaher Corp. | 10.2 |
| Becton, Dickinson & Co. | 8.9 |
| Boston Scientific Corp. | 6.2 |
| Intuitive Surgical, Inc. | 5.0 |
| Insulet Corp. | 3.7 |
| Penumbra, Inc. | 3.6 |
| Hologic, Inc. | 3.0 |
| DexCom, Inc. | 2.9 |
| Masimo Corp. | 2.7 |
| | 58.1 |
Top Industries (% of fund's net assets)
| As of August 31, 2020 |
| | Health Care Equipment & Supplies | 62.3% |
| | Life Sciences Tools & Services | 19.2% |
| | Health Care Providers & Services | 9.7% |
| | Health Care Technology | 4.1% |
| | Biotechnology | 1.9% |
| | All Others* | 2.8% |

* Includes short-term investments and net other assets (liabilities).
Medical Technology and Devices Portfolio
Schedule of Investments August 31, 2020 (Unaudited)
Showing Percentage of Net Assets
| Common Stocks - 98.8% | | | |
| | | Shares | Value |
| Biotechnology - 1.5% | | | |
| Biotechnology - 1.5% | | | |
| Abcam PLC | | 2,000,000 | $33,365,280 |
| Natera, Inc. (a)(b) | | 450,000 | 28,669,500 |
| Twist Bioscience Corp. (a) | | 750,000 | 52,447,500 |
| | | | 114,482,280 |
| Health Care Equipment & Supplies - 62.3% | | | |
| Health Care Equipment - 59.9% | | | |
| Abbott Laboratories | | 1,600,000 | 175,152,000 |
| Atricure, Inc. (a) | | 1,200,000 | 53,676,000 |
| Axonics Modulation Technologies, Inc. (a)(b) | | 1,000,000 | 42,260,000 |
| Becton, Dickinson & Co. | | 2,700,000 | 655,479,000 |
| Boston Scientific Corp. (a) | | 11,000,000 | 451,220,000 |
| Danaher Corp. | | 3,630,000 | 749,486,100 |
| DexCom, Inc. (a) | | 500,000 | 212,705,000 |
| Fisher & Paykel Healthcare Corp. | | 3,080,000 | 76,452,253 |
| Genmark Diagnostics, Inc. (a) | | 2,929,885 | 38,000,608 |
| Hologic, Inc. (a) | | 3,684,400 | 220,032,368 |
| IDEXX Laboratories, Inc. (a) | | 50,000 | 19,553,000 |
| Insulet Corp. (a) | | 1,247,165 | 272,193,761 |
| Intuitive Surgical, Inc. (a) | | 500,000 | 365,420,000 |
| Masimo Corp. (a) | | 880,000 | 197,120,000 |
| Nevro Corp. (a) | | 520,000 | 71,520,800 |
| Penumbra, Inc. (a)(b) | | 1,280,000 | 267,712,000 |
| ResMed, Inc. | | 1,000,000 | 180,780,000 |
| Shockwave Medical, Inc. (a)(b) | | 663,265 | 42,143,858 |
| STERIS PLC | | 128,000 | 20,433,920 |
| Stryker Corp. | | 500,000 | 99,080,000 |
| Tandem Diabetes Care, Inc. (a) | | 1,440,000 | 162,316,800 |
| ViewRay, Inc.(a)(b)(c) | | 8,000,000 | 21,760,000 |
| | | | 4,394,497,468 |
| Health Care Supplies - 2.4% | | | |
| Align Technology, Inc. (a) | | 142,000 | 42,171,160 |
| Nanosonics Ltd. (a)(c) | | 21,703,182 | 97,003,522 |
| Quidel Corp. (a) | | 190,000 | 33,432,400 |
| | | | 172,607,082 |
|
| TOTAL HEALTH CARE EQUIPMENT & SUPPLIES | | | 4,567,104,550 |
|
| Health Care Providers & Services - 9.6% | | | |
| Health Care Services - 3.0% | | | |
| 1Life Healthcare, Inc. (a) | | 1,080,000 | 31,503,600 |
| Cigna Corp. | | 1,060,000 | 188,012,200 |
| | | | 219,515,800 |
| Managed Health Care - 6.6% | | | |
| Centene Corp. (a) | | 1,900,000 | 116,508,000 |
| Humana, Inc. | | 440,000 | 182,674,800 |
| UnitedHealth Group, Inc. | | 600,000 | 187,530,000 |
| | | | 486,712,800 |
|
| TOTAL HEALTH CARE PROVIDERS & SERVICES | | | 706,228,600 |
|
| Health Care Technology - 4.1% | | | |
| Health Care Technology - 4.1% | | | |
| Castlight Health, Inc. (a) | | 983,300 | 1,356,954 |
| Castlight Health, Inc. Class B (a) | | 5,000,000 | 6,900,000 |
| Inspire Medical Systems, Inc. (a) | | 889,407 | 106,239,666 |
| Veeva Systems, Inc. Class A (a) | | 650,000 | 183,475,500 |
| | | | 297,972,120 |
| Insurance - 0.4% | | | |
| Insurance Brokers - 0.4% | | | |
| eHealth, Inc. (a) | | 420,000 | 26,510,400 |
| Life Sciences Tools & Services - 19.2% | | | |
| Life Sciences Tools & Services - 19.2% | | | |
| 10X Genomics, Inc. (a) | | 280,000 | 32,093,600 |
| 10X Genomics, Inc. Class B (d) | | 392,772 | 45,019,527 |
| Bio-Rad Laboratories, Inc. Class A (a) | | 128,000 | 65,099,520 |
| Bruker Corp. | | 3,720,000 | 156,314,400 |
| Lonza Group AG | | 256,000 | 159,081,812 |
| Nanostring Technologies, Inc. (a) | | 340,000 | 13,763,200 |
| Sartorius Stedim Biotech | | 186,139 | 66,594,267 |
| Thermo Fisher Scientific, Inc. | | 2,028,000 | 869,971,441 |
| | | | 1,407,937,767 |
| Pharmaceuticals - 0.7% | | | |
| Pharmaceuticals - 0.7% | | | |
| Intersect ENT, Inc. (a)(c) | | 2,440,044 | 48,996,084 |
| Professional Services - 0.5% | | | |
| Research & Consulting Services - 0.5% | | | |
| Clarivate Analytics PLC (a) | | 1,280,000 | 37,683,200 |
| Software - 0.5% | | | |
| Application Software - 0.5% | | | |
| Nuance Communications, Inc. (a) | | 1,200,000 | 35,952,000 |
| Outset Medical, Inc. (a)(e) | | 1,486,367 | 4,578,010 |
| | | | 40,530,010 |
| TOTAL COMMON STOCKS | | | |
| (Cost $4,130,024,052) | | | 7,247,445,011 |
|
| Convertible Preferred Stocks - 1.0% | | | |
| Biotechnology - 0.4% | | | |
| Biotechnology - 0.4% | | | |
| Element Biosciences, Inc. Series B (e)(f) | | 2,385,223 | 12,236,194 |
| Seer, Inc.: | | | |
| Series D1 (e)(f) | | 3,333,333 | 12,499,999 |
| Series D1 (e)(f) | | 3,333,333 | 503,333 |
| | | | 25,239,526 |
| Health Care Providers & Services - 0.1% | | | |
| Health Care Services - 0.1% | | | |
| Conformal Medical, Inc. Series C (e)(f) | | 2,605,625 | 9,554,996 |
| Software - 0.3% | | | |
| Application Software - 0.3% | | | |
| Outset Medical, Inc.: | | | |
| Series B (a)(e) | | 3,307,754 | 9,162,479 |
| Series D (a)(e) | | 1,607,717 | 6,527,331 |
| Series E (e) | | 1,363,636 | 4,199,999 |
| | | | 19,889,809 |
| Textiles, Apparel & Luxury Goods - 0.2% | | | |
| Textiles - 0.2% | | | |
| Freenome, Inc. Series C (e)(f) | | 2,268,156 | 14,999,996 |
| TOTAL CONVERTIBLE PREFERRED STOCKS | | | |
| (Cost $62,293,803) | | | 69,684,327 |
|
| Money Market Funds - 1.1% | | | |
| Fidelity Cash Central Fund 0.12% (g) | | 27,030,354 | 27,035,760 |
| Fidelity Securities Lending Cash Central Fund 0.11% (g)(h) | | 53,855,479 | 53,860,865 |
| TOTAL MONEY MARKET FUNDS | | | |
| (Cost $80,896,625) | | | 80,896,625 |
| TOTAL INVESTMENT IN SECURITIES - 100.9% | | | |
| (Cost $4,273,214,480) | | | 7,398,025,963 |
| NET OTHER ASSETS (LIABILITIES) - (0.9)% | | | (63,806,925) |
| NET ASSETS - 100% | | | $7,334,219,038 |
Legend
(a) Non-income producing
(b) Security or a portion of the security is on loan at period end.
(c) Affiliated company
(d) Security exempt from registration under Rule 144A of the Securities Act of 1933. These securities may be resold in transactions exempt from registration, normally to qualified institutional buyers. At the end of the period, the value of these securities amounted to $45,019,527 or 0.6% of net assets.
(e) Restricted securities (including private placements) - Investment in securities not registered under the Securities Act of 1933 (excluding 144A issues). At the end of the period, the value of restricted securities (excluding 144A issues) amounted to $74,262,337 or 1.0% of net assets.
(f) Level 3 security
(g) Affiliated fund that is generally available only to investment companies and other accounts managed by Fidelity Investments. The rate quoted is the annualized seven-day yield of the fund at period end. A complete unaudited listing of the fund's holdings as of its most recent quarter end is available upon request. In addition, each Fidelity Central Fund's financial statements are available on the SEC's website or upon request.
(h) Investment made with cash collateral received from securities on loan.
Additional information on each restricted holding is as follows:
| Security | Acquisition Date | Acquisition Cost |
| Conformal Medical, Inc. Series C | 7/24/20 | $9,554,996 |
| Element Biosciences, Inc. Series B | 12/13/19 | $12,500,000 |
| Freenome, Inc. Series C | 8/14/20 | $14,999,996 |
| Outset Medical, Inc. | 5/5/15 - 8/20/18 | $3,264,522 |
| Outset Medical, Inc. Series B | 5/5/15 - 6/5/15 | $4,589,178 |
| Outset Medical, Inc. Series D | 8/20/18 | $4,646,302 |
| Outset Medical, Inc. Series E | 1/27/20 | $2,999,999 |
| Seer, Inc. Series D1 | 5/12/20 | $12,499,999 |
| Seer, Inc. Series D1 | 8/20/20 | $503,333 |
Affiliated Central Funds
Information regarding fiscal year to date income earned by the Fund from investments in Fidelity Central Funds is as follows:
| Fund | Income earned |
| Fidelity Cash Central Fund | $122,980 |
| Fidelity Securities Lending Cash Central Fund | 95,152 |
| Total | $218,132 |
Amounts in the income column in the above table include any capital gain distributions from underlying funds, which are presented in the corresponding line-item in the Statement of Operations, if applicable. Amount for Fidelity Securities Lending Cash Central Fund represents the income earned on investing cash collateral, less rebates paid to borrowers and any lending agent fees associated with the loan, plus any premium payments received for lending certain types of securities.
Other Affiliated Issuers
An affiliated company is a company in which the Fund has ownership of at least 5% of the voting securities. Fiscal year to date transactions with companies which are or were affiliates are as follows:
| Affiliate | Value, beginning of period | Purchases | Sales Proceeds | Dividend Income | Realized Gain (loss) | Change in Unrealized appreciation (depreciation) | Value, end of period |
| Intersect ENT, Inc. | $14,316,000 | $27,304,996 | $-- | $-- | $-- | $7,375,088 | $48,996,084 |
| Nanosonics Ltd. | 92,968,430 | 1,864,197 | -- | -- | -- | 2,170,895 | 97,003,522 |
| ViewRay, Inc. | 16,646,000 | 4,443,334 | -- | -- | -- | 670,666 | 21,760,000 |
| Total | $123,930,430 | $33,612,527 | $-- | $-- | $-- | $10,216,649 | $167,759,606 |
Investment Valuation
The following is a summary of the inputs used, as of August 31, 2020, involving the Fund's assets and liabilities carried at fair value. The inputs or methodology used for valuing securities may not be an indication of the risk associated with investing in those securities. For more information on valuation inputs, and their aggregation into the levels used below, please refer to the Investment Valuation section in the accompanying Notes to Financial Statements.
| | Valuation Inputs at Reporting Date: |
| Description | Total | Level 1 | Level 2 | Level 3 |
| Investments in Securities: | | | | |
| Common Stocks | $7,247,445,011 | $7,083,785,189 | $163,659,822 | $-- |
| Convertible Preferred Stocks | 69,684,327 | -- | 19,889,809 | 49,794,518 |
| Money Market Funds | 80,896,625 | 80,896,625 | -- | -- |
| Total Investments in Securities: | $7,398,025,963 | $7,164,681,814 | $183,549,631 | $49,794,518 |
See accompanying notes which are an integral part of the financial statements.
Medical Technology and Devices Portfolio
Financial Statements
Statement of Assets and Liabilities
| | | August 31, 2020 (Unaudited) |
| Assets | | |
Investment in securities, at value (including securities loaned of $53,170,619) — See accompanying schedule:
Unaffiliated issuers (cost $4,073,337,704) | $7,149,369,732 | |
| Fidelity Central Funds (cost $80,896,625) | 80,896,625 | |
| Other affiliated issuers (cost $118,980,151) | 167,759,606 | |
| Total Investment in Securities (cost $4,273,214,480) | | $7,398,025,963 |
| Receivable for fund shares sold | | 9,471,912 |
| Dividends receivable | | 696,477 |
| Distributions receivable from Fidelity Central Funds | | 14,815 |
| Prepaid expenses | | 36,877 |
| Other receivables | | 273,773 |
| Total assets | | 7,408,519,817 |
| Liabilities | | |
| Payable for investments purchased | $1,069,318 | |
| Payable for fund shares redeemed | 14,938,546 | |
| Accrued management fee | 3,233,556 | |
| Other affiliated payables | 956,949 | |
| Other payables and accrued expenses | 250,110 | |
| Collateral on securities loaned | 53,852,300 | |
| Total liabilities | | 74,300,779 |
| Net Assets | | $7,334,219,038 |
| Net Assets consist of: | | |
| Paid in capital | | $3,917,321,493 |
| Total accumulated earnings (loss) | | 3,416,897,545 |
| Net Assets | | $7,334,219,038 |
| Net Asset Value, offering price and redemption price per share ($7,334,219,038 ÷ 106,503,930 shares) | | $68.86 |
See accompanying notes which are an integral part of the financial statements.
Statement of Operations
| | | Six months ended August 31, 2020 (Unaudited) |
| Investment Income | | |
| Dividends | | $12,200,631 |
| Income from Fidelity Central Funds (including $95,152 from security lending) | | 218,132 |
| Total income | | 12,418,763 |
| Expenses | | |
| Management fee | $16,931,604 | |
| Transfer agent fees | 4,849,494 | |
| Accounting fees | 568,517 | |
| Custodian fees and expenses | 40,886 | |
| Independent trustees' fees and expenses | 19,966 | |
| Registration fees | 33,607 | |
| Audit | 19,166 | |
| Legal | 5,798 | |
| Interest | 472 | |
| Miscellaneous | 94,162 | |
| Total expenses before reductions | 22,563,672 | |
| Expense reductions | (192,260) | |
| Total expenses after reductions | | 22,371,412 |
| Net investment income (loss) | | (9,952,649) |
| Realized and Unrealized Gain (Loss) | | |
| Net realized gain (loss) on: | | |
| Investment securities: | | |
| Unaffiliated issuers | 317,422,803 | |
| Fidelity Central Funds | (9,438) | |
| Foreign currency transactions | (152,973) | |
| Total net realized gain (loss) | | 317,260,392 |
| Change in net unrealized appreciation (depreciation) on: | | |
| Investment securities: | | |
| Unaffiliated issuers | 1,165,543,075 | |
| Affiliated issuers | 10,216,649 | |
| Assets and liabilities in foreign currencies | 7,840 | |
| Total change in net unrealized appreciation (depreciation) | | 1,175,767,564 |
| Net gain (loss) | | 1,493,027,956 |
| Net increase (decrease) in net assets resulting from operations | | $1,483,075,307 |
See accompanying notes which are an integral part of the financial statements.
Statement of Changes in Net Assets
| | Six months ended August 31, 2020 (Unaudited) | Year ended February 29, 2020 |
| Increase (Decrease) in Net Assets | | |
| Operations | | |
| Net investment income (loss) | $(9,952,649) | $(9,728,901) |
| Net realized gain (loss) | 317,260,392 | 276,923,920 |
| Change in net unrealized appreciation (depreciation) | 1,175,767,564 | 196,604,918 |
| Net increase (decrease) in net assets resulting from operations | 1,483,075,307 | 463,799,937 |
| Distributions to shareholders | (134,034,529) | (118,431,567) |
| Share transactions | | |
| Proceeds from sales of shares | 739,950,698 | 705,581,911 |
| Reinvestment of distributions | 126,383,084 | 111,785,832 |
| Cost of shares redeemed | (939,921,099) | (1,891,615,421) |
| Net increase (decrease) in net assets resulting from share transactions | (73,587,317) | (1,074,247,678) |
| Total increase (decrease) in net assets | 1,275,453,461 | (728,879,308) |
| Net Assets | | |
| Beginning of period | 6,058,765,577 | 6,787,644,885 |
| End of period | $7,334,219,038 | $6,058,765,577 |
| Other Information | | |
| Shares | | |
| Sold | 12,284,041 | 12,747,720 |
| Issued in reinvestment of distributions | 2,380,540 | 1,859,380 |
| Redeemed | (16,594,624) | (34,440,758) |
| Net increase (decrease) | (1,930,043) | (19,833,658) |
See accompanying notes which are an integral part of the financial statements.
Financial Highlights
Medical Technology and Devices Portfolio
| | Six months ended (Unaudited) August 31, | Years endedFebruary 28, | | | | |
| | 2020 | 2020 A | 2019 | 2018 | 2017 | 2016 A |
| Selected Per–Share Data | | | | | | |
| Net asset value, beginning of period | $55.88 | $52.92 | $46.09 | $41.48 | $33.75 | $41.90 |
| Income from Investment Operations | | | | | | |
| Net investment income (loss)B | (.09) | (.08) | (.04) | .05 | .01 | (.03) |
| Net realized and unrealized gain (loss) | 14.37 | 4.10 | 10.40 | 7.31 | 9.87 | (2.25) |
| Total from investment operations | 14.28 | 4.02 | 10.36 | 7.36 | 9.88 | (2.28) |
| Distributions from net investment income | – | – | – | (.08) | – | (.01) |
| Distributions from net realized gain | (1.30) | (1.06) | (3.53) | (2.67) | (2.15) | (5.86) |
| Total distributions | (1.30) | (1.06) | (3.53) | (2.75) | (2.15) | (5.87) |
| Redemption fees added to paid in capitalB | – | – | – | – | –C | –C |
| Net asset value, end of period | $68.86 | $55.88 | $52.92 | $46.09 | $41.48 | $33.75 |
| Total ReturnD,E | 26.24% | 7.46% | 23.85% | 18.01% | 30.13% | (6.63)% |
| Ratios to Average Net AssetsF,G | | | | | | |
| Expenses before reductions | .71%H | .71% | .73% | .76% | .76% | .76% |
| Expenses net of fee waivers, if any | .71%H | .71% | .73% | .76% | .76% | .76% |
| Expenses net of all reductions | .70%H | .71% | .73% | .75% | .76% | .75% |
| Net investment income (loss) | (.31)%H | (.15)% | (.07)% | .11% | .01% | (.09)% |
| Supplemental Data | | | | | | |
| Net assets, end of period (000 omitted) | $7,334,219 | $6,058,766 | $6,787,645 | $4,063,926 | $3,134,376 | $1,915,772 |
| Portfolio turnover rateI | 64%H | 35% | 43% | 77% | 55% | 46% |
A For the year ended February 29.
B Calculated based on average shares outstanding during the period.
C Amount represents less than $.005 per share.
D Total returns for periods of less than one year are not annualized.
E Total returns would have been lower if certain expenses had not been reduced during the applicable periods shown.
F Fees and expenses of any underlying mutual funds or exchange-traded funds (ETFs) are not included in the Fund's expense ratio. The Fund indirectly bears its proportionate share of these expenses. For additional expense information related to investments in Fidelity Central Funds, please refer to the "Investments in Fidelity Central Funds" note found in the Notes to Financial Statements section of the most recent Annual or Semi-Annual report.
G Expense ratios reflect operating expenses of the class. Expenses before reductions do not reflect amounts reimbursed, waived, or reduced through arrangements with the investment advisor, brokerage services, or other offset arrangements, if applicable, and do not represent the amount paid by the class during periods when reimbursements, waivers or reductions occur.
H Annualized
I Amount does not include the portfolio activity of any underlying Fidelity Central Funds.
See accompanying notes which are an integral part of the financial statements.
Pharmaceuticals Portfolio
Investment Summary (Unaudited)
Top Ten Stocks as of August 31, 2020
| | % of fund's net assets |
| AstraZeneca PLC sponsored ADR | 10.7 |
| Bristol-Myers Squibb Co. | 9.3 |
| Sanofi SA sponsored ADR | 9.3 |
| Roche Holding AG (participation certificate) | 7.7 |
| Johnson & Johnson | 7.1 |
| Eli Lilly & Co. | 5.9 |
| Merck & Co., Inc. | 4.9 |
| Zoetis, Inc. Class A | 4.4 |
| Novartis AG sponsored ADR | 4.2 |
| Amgen, Inc. | 4.0 |
| | 67.5 |
Top Industries (% of fund's net assets)
| As of August 31, 2020 |
| | Pharmaceuticals | 79.7% |
| | Biotechnology | 16.8% |
| | Health Care Equipment & Supplies | 2.1% |
| | Life Sciences Tools & Services | 0.6% |
| | All Others* | 0.8% |

* Includes short-term investments and net other assets (liabilities).
Pharmaceuticals Portfolio
Schedule of Investments August 31, 2020 (Unaudited)
Showing Percentage of Net Assets
| Common Stocks - 99.2% | | | |
| | | Shares | Value |
| Biotechnology - 16.8% | | | |
| Biotechnology - 16.8% | | | |
| Acceleron Pharma, Inc. (a) | | 178,600 | $17,408,142 |
| Akeso, Inc. | | 1,805,000 | 6,538,007 |
| Allovir, Inc. (a) | | 5,100 | 165,189 |
| Amgen, Inc. | | 141,400 | 35,819,448 |
| Argenx SE (a) | | 17,400 | 4,032,272 |
| Ascendis Pharma A/S sponsored ADR (a) | | 51,300 | 7,601,634 |
| Athenex, Inc. (a)(b) | | 166,800 | 1,916,532 |
| BioNTech SE ADR (a)(b) | | 50,148 | 3,071,565 |
| Blueprint Medicines Corp. (a) | | 60,700 | 4,700,001 |
| ChemoCentryx, Inc. (a) | | 6,000 | 321,000 |
| Cytokinetics, Inc. (a) | | 59,700 | 1,430,412 |
| Galapagos Genomics NV sponsored ADR (a) | | 36,900 | 4,913,604 |
| Generation Bio Co. | | 16,738 | 522,728 |
| Generation Bio Co. | | 7,473 | 210,044 |
| Global Blood Therapeutics, Inc. (a)(b) | | 166,300 | 10,440,314 |
| Immunomedics, Inc. (a) | | 123,400 | 5,498,704 |
| Innovent Biologics, Inc. (a)(c) | | 566,000 | 3,760,505 |
| Kalvista Pharmaceuticals, Inc. (a) | | 99,000 | 1,296,900 |
| Leap Therapeutics, Inc. warrants 1/31/26 (a) | | 606,000 | 436,344 |
| Magenta Therapeutics, Inc. (a) | | 97,400 | 708,098 |
| Mirati Therapeutics, Inc. (a) | | 37,800 | 5,646,186 |
| Moderna, Inc. (a) | | 46,200 | 2,997,918 |
| Momenta Pharmaceuticals, Inc. (a) | | 107,772 | 5,622,465 |
| Olivo Labs (a)(d)(e) | | 6,851 | 0 |
| PTC Therapeutics, Inc. (a) | | 162,500 | 8,031,563 |
| Sarepta Therapeutics, Inc. (a) | | 18,441 | 2,700,131 |
| Translate Bio, Inc. (a)(b) | | 102,900 | 1,449,861 |
| uniQure B.V. (a) | | 65,600 | 2,674,512 |
| Vertex Pharmaceuticals, Inc. (a) | | 33,700 | 9,406,344 |
| Xencor, Inc. (a) | | 49,568 | 1,772,056 |
| | | | 151,092,479 |
| Health Care Equipment & Supplies - 2.1% | | | |
| Health Care Equipment - 2.0% | | | |
| Becton, Dickinson & Co. | | 50,500 | 12,259,885 |
| Boston Scientific Corp. (a) | | 149,600 | 6,136,592 |
| | | | 18,396,477 |
| Health Care Supplies - 0.1% | | | |
| Kangji Medical Holdings Ltd. | | 200,500 | 584,410 |
|
| TOTAL HEALTH CARE EQUIPMENT & SUPPLIES | | | 18,980,887 |
|
| Life Sciences Tools & Services - 0.6% | | | |
| Life Sciences Tools & Services - 0.6% | | | |
| Bruker Corp. | | 117,100 | 4,920,542 |
| Personal Products - 0.0% | | | |
| Personal Products - 0.0% | | | |
| MYOS Corp. (a) | | 40,000 | 53,200 |
| Pharmaceuticals - 79.7% | | | |
| Pharmaceuticals - 79.7% | | | |
| Astellas Pharma, Inc. | | 601,900 | 9,442,702 |
| AstraZeneca PLC sponsored ADR | | 1,711,700 | 95,855,198 |
| Axsome Therapeutics, Inc. (a) | | 43,400 | 3,181,654 |
| Bausch Health Cos., Inc. (Canada) (a) | | 560,600 | 9,305,010 |
| Bristol-Myers Squibb Co. | | 1,347,780 | 83,831,916 |
| Catalent, Inc. (a) | | 75,400 | 6,974,500 |
| Elanco Animal Health, Inc. (a) | | 225,100 | 6,541,406 |
| Eli Lilly & Co. | | 357,561 | 53,058,477 |
| GlaxoSmithKline PLC sponsored ADR | | 628,200 | 24,876,720 |
| Harmony Biosciences Holdings, Inc. (a) | | 3,700 | 131,054 |
| Harmony Biosciences Holdings, Inc. | | 137,426 | 4,380,866 |
| Horizon Therapeutics PLC (a) | | 323,000 | 24,263,760 |
| Intra-Cellular Therapies, Inc. (a) | | 107,000 | 1,949,540 |
| Johnson & Johnson | | 416,650 | 63,918,277 |
| Merck & Co., Inc. | | 517,336 | 44,113,241 |
| MyoKardia, Inc. (a) | | 16,465 | 1,801,930 |
| Nektar Therapeutics (a)(b) | | 368,233 | 7,121,626 |
| Novartis AG sponsored ADR | | 441,496 | 37,995,146 |
| Perrigo Co. PLC | | 257,800 | 13,482,940 |
| Reata Pharmaceuticals, Inc. (a)(b) | | 55,300 | 5,803,735 |
| Richter Gedeon PLC | | 157,700 | 3,847,876 |
| Roche Holding AG (participation certificate) | | 198,096 | 69,297,751 |
| Royalty Pharma PLC | | 14,900 | 616,562 |
| Sanofi SA sponsored ADR | | 1,652,122 | 83,564,331 |
| UCB SA | | 181,600 | 21,567,214 |
| Zoetis, Inc. Class A | | 245,300 | 39,272,530 |
| Zogenix, Inc. (a) | | 31,800 | 752,706 |
| | | | 716,948,668 |
| TOTAL COMMON STOCKS | | | |
| (Cost $624,292,713) | | | 891,995,776 |
|
| Convertible Preferred Stocks - 0.0% | | | |
| Pharmaceuticals - 0.0% | | | |
| Pharmaceuticals - 0.0% | | | |
| Castle Creek Pharmaceutical Holdings, Inc. Series C (d)(e) | | | |
| (Cost $82,370) | | 200 | 96,458 |
|
| Money Market Funds - 2.6% | | | |
| Fidelity Cash Central Fund 0.12% (f) | | 6,258,406 | 6,259,658 |
| Fidelity Securities Lending Cash Central Fund 0.11% (f)(g) | | 17,433,615 | 17,435,358 |
| TOTAL MONEY MARKET FUNDS | | | |
| (Cost $23,695,016) | | | 23,695,016 |
| TOTAL INVESTMENT IN SECURITIES - 101.8% | | | |
| (Cost $648,070,099) | | | 915,787,250 |
| NET OTHER ASSETS (LIABILITIES) - (1.8)% | | | (16,269,385) |
| NET ASSETS - 100% | | | $899,517,865 |
Legend
(a) Non-income producing
(b) Security or a portion of the security is on loan at period end.
(c) Security exempt from registration under Rule 144A of the Securities Act of 1933. These securities may be resold in transactions exempt from registration, normally to qualified institutional buyers. At the end of the period, the value of these securities amounted to $3,760,505 or 0.4% of net assets.
(d) Level 3 security
(e) Restricted securities (including private placements) - Investment in securities not registered under the Securities Act of 1933 (excluding 144A issues). At the end of the period, the value of restricted securities (excluding 144A issues) amounted to $96,458 or 0.0% of net assets.
(f) Affiliated fund that is generally available only to investment companies and other accounts managed by Fidelity Investments. The rate quoted is the annualized seven-day yield of the fund at period end. A complete unaudited listing of the fund's holdings as of its most recent quarter end is available upon request. In addition, each Fidelity Central Fund's financial statements are available on the SEC's website or upon request.
(g) Investment made with cash collateral received from securities on loan.
Additional information on each restricted holding is as follows:
| Security | Acquisition Date | Acquisition Cost |
| Castle Creek Pharmaceutical Holdings, Inc. Series C | 12/9/19 | $82,370 |
| Olivo Labs | 2/8/17 | $8,290 |
Affiliated Central Funds
Information regarding fiscal year to date income earned by the Fund from investments in Fidelity Central Funds is as follows:
| Fund | Income earned |
| Fidelity Cash Central Fund | $17,673 |
| Fidelity Securities Lending Cash Central Fund | 53,061 |
| Total | $70,734 |
Amounts in the income column in the above table include any capital gain distributions from underlying funds, which are presented in the corresponding line-item in the Statement of Operations, if applicable. Amount for Fidelity Securities Lending Cash Central Fund represents the income earned on investing cash collateral, less rebates paid to borrowers and any lending agent fees associated with the loan, plus any premium payments received for lending certain types of securities.
Investment Valuation
The following is a summary of the inputs used, as of August 31, 2020, involving the Fund's assets and liabilities carried at fair value. The inputs or methodology used for valuing securities may not be an indication of the risk associated with investing in those securities. For more information on valuation inputs, and their aggregation into the levels used below, please refer to the Investment Valuation section in the accompanying Notes to Financial Statements.
| | Valuation Inputs at Reporting Date: |
| Description | Total | Level 1 | Level 2 | Level 3 |
| Investments in Securities: | | | | |
| Common Stocks | $891,995,776 | $793,312,875 | $98,682,901 | $-- |
| Convertible Preferred Stocks | 96,458 | -- | -- | 96,458 |
| Money Market Funds | 23,695,016 | 23,695,016 | -- | -- |
| Total Investments in Securities: | $915,787,250 | $817,007,891 | $98,682,901 | $96,458 |
Other Information
Distribution of investments by country or territory of incorporation, as a percentage of Total Net Assets, is as follows (Unaudited):
| United States of America | 52.6% |
| United Kingdom | 13.5% |
| Switzerland | 11.9% |
| France | 9.3% |
| Ireland | 4.2% |
| Belgium | 3.0% |
| Cayman Islands | 1.2% |
| Japan | 1.0% |
| Canada | 1.0% |
| Others (Individually Less Than 1%) | 2.3% |
| | 100.0% |
See accompanying notes which are an integral part of the financial statements.
Pharmaceuticals Portfolio
Financial Statements
Statement of Assets and Liabilities
| | | August 31, 2020 (Unaudited) |
| Assets | | |
Investment in securities, at value (including securities loaned of $16,916,079) — See accompanying schedule:
Unaffiliated issuers (cost $624,375,083) | $892,092,234 | |
| Fidelity Central Funds (cost $23,695,016) | 23,695,016 | |
| Total Investment in Securities (cost $648,070,099) | | $915,787,250 |
| Receivable for fund shares sold | | 1,113,005 |
| Dividends receivable | | 3,525,971 |
| Distributions receivable from Fidelity Central Funds | | 12,467 |
| Prepaid expenses | | 6,228 |
| Other receivables | | 138,088 |
| Total assets | | 920,583,009 |
| Liabilities | | |
| Payable for fund shares redeemed | $2,918,372 | |
| Accrued management fee | 399,758 | |
| Other affiliated payables | 162,667 | |
| Other payables and accrued expenses | 149,697 | |
| Collateral on securities loaned | 17,434,650 | |
| Total liabilities | | 21,065,144 |
| Net Assets | | $899,517,865 |
| Net Assets consist of: | | |
| Paid in capital | | $596,523,068 |
| Total accumulated earnings (loss) | | 302,994,797 |
| Net Assets | | $899,517,865 |
| Net Asset Value, offering price and redemption price per share ($899,517,865 ÷ 36,731,724 shares) | | $24.49 |
See accompanying notes which are an integral part of the financial statements.
Statement of Operations
| | | Six months ended August 31, 2020 (Unaudited) |
| Investment Income | | |
| Dividends | | $10,140,396 |
| Income from Fidelity Central Funds (including $53,061 from security lending) | | 70,734 |
| Total income | | 10,211,130 |
| Expenses | | |
| Management fee | $2,256,193 | |
| Transfer agent fees | 789,691 | |
| Accounting fees | 145,147 | |
| Custodian fees and expenses | 10,878 | |
| Independent trustees' fees and expenses | 2,626 | |
| Registration fees | 47,610 | |
| Audit | 17,538 | |
| Legal | 1,831 | |
| Interest | 550 | |
| Miscellaneous | 15,884 | |
| Total expenses before reductions | 3,287,948 | |
| Expense reductions | (27,251) | |
| Total expenses after reductions | | 3,260,697 |
| Net investment income (loss) | | 6,950,433 |
| Realized and Unrealized Gain (Loss) | | |
| Net realized gain (loss) on: | | |
| Investment securities: | | |
| Unaffiliated issuers | 30,100,412 | |
| Fidelity Central Funds | (230) | |
| Foreign currency transactions | (4,980) | |
| Total net realized gain (loss) | | 30,095,202 |
| Change in net unrealized appreciation (depreciation) on: | | |
| Investment securities: | | |
| Unaffiliated issuers | 87,428,500 | |
| Assets and liabilities in foreign currencies | 74,918 | |
| Total change in net unrealized appreciation (depreciation) | | 87,503,418 |
| Net gain (loss) | | 117,598,620 |
| Net increase (decrease) in net assets resulting from operations | | $124,549,053 |
See accompanying notes which are an integral part of the financial statements.
Statement of Changes in Net Assets
| | Six months ended August 31, 2020 (Unaudited) | Year ended February 29, 2020 |
| Increase (Decrease) in Net Assets | | |
| Operations | | |
| Net investment income (loss) | $6,950,433 | $10,028,605 |
| Net realized gain (loss) | 30,095,202 | 65,450,148 |
| Change in net unrealized appreciation (depreciation) | 87,503,418 | 5,301,157 |
| Net increase (decrease) in net assets resulting from operations | 124,549,053 | 80,779,910 |
| Distributions to shareholders | (22,195,699) | (66,086,434) |
| Share transactions | | |
| Proceeds from sales of shares | 205,191,605 | 129,274,481 |
| Reinvestment of distributions | 21,095,408 | 62,770,076 |
| Cost of shares redeemed | (193,407,055) | (190,057,404) |
| Net increase (decrease) in net assets resulting from share transactions | 32,879,958 | 1,987,153 |
| Total increase (decrease) in net assets | 135,233,312 | 16,680,629 |
| Net Assets | | |
| Beginning of period | 764,284,553 | 747,603,924 |
| End of period | $899,517,865 | $764,284,553 |
| Other Information | | |
| Shares | | |
| Sold | 9,060,672 | 5,749,544 |
| Issued in reinvestment of distributions | 998,363 | 2,784,673 |
| Redeemed | (8,531,525) | (8,808,887) |
| Net increase (decrease) | 1,527,510 | (274,670) |
See accompanying notes which are an integral part of the financial statements.
Financial Highlights
Pharmaceuticals Portfolio
| | Six months ended (Unaudited) August 31, | Years endedFebruary 28, | | | | |
| | 2020 | 2020 A | 2019 | 2018 | 2017 | 2016 A |
| Selected Per–Share DataB | | | | | | |
| Net asset value, beginning of period | $21.71 | $21.07 | $18.82 | $18.11 | $18.20 | $23.08 |
| Income from Investment Operations | | | | | | |
| Net investment income (loss)C | .19 | .29 | .29 | .27 | .22 | .24 |
| Net realized and unrealized gain (loss) | 3.23 | 2.29 | 2.34 | .74 | (.13) | (2.52) |
| Total from investment operations | 3.42 | 2.58 | 2.63 | 1.01 | .09 | (2.28) |
| Distributions from net investment income | (.07) | (.31) | (.28) | (.25) | (.18) | (.17) |
| Distributions from net realized gain | (.56) | (1.64) | (.10) | (.05) | – | (2.43) |
| Total distributions | (.64)B | (1.94)D | (.38) | (.30) | (.18) | (2.60) |
| Redemption fees added to paid in capitalC | – | – | – | – | –E | –E |
| Net asset value, end of period | $24.49 | $21.71 | $21.07 | $18.82 | $18.11 | $18.20 |
| Total ReturnF,G | 16.21% | 12.06% | 14.15% | 5.61% | .57% | (11.33)% |
| Ratios to Average Net AssetsH,I | | | | | | |
| Expenses before reductions | .78%J | .78% | .80% | .81% | .80% | .78% |
| Expenses net of fee waivers, if any | .77%J | .78% | .79% | .81% | .80% | .78% |
| Expenses net of all reductions | .77%J | .77% | .79% | .80% | .79% | .77% |
| Net investment income (loss) | 1.64%J | 1.36% | 1.48% | 1.44% | 1.16% | 1.09% |
| Supplemental Data | | | | | | |
| Net assets, end of period (000 omitted) | $899,518 | $764,285 | $747,604 | $744,563 | $1,000,937 | $1,693,410 |
| Portfolio turnover rateK | 40%J | 52% | 55% | 89% | 77% | 77% |
A For the year ended February 29.
B Total distributions of $.64 per share is comprised of distributions from net investment income of $.074 and distributions from net realized gain of $.563 per share.
C Calculated based on average shares outstanding during the period.
D Total distributions of $1.94 per share is comprised of distributions from net investment income of $.305 and distributions from net realized gain of $1.636 per share.
E Amount represents less than $.005 per share.
F Total returns for periods of less than one year are not annualized.
G Total returns would have been lower if certain expenses had not been reduced during the applicable periods shown.
H Fees and expenses of any underlying mutual funds or exchange-traded funds (ETFs) are not included in the Fund's expense ratio. The Fund indirectly bears its proportionate share of these expenses. For additional expense information related to investments in Fidelity Central Funds, please refer to the "Investments in Fidelity Central Funds" note found in the Notes to Financial Statements section of the most recent Annual or Semi-Annual report.
I Expense ratios reflect operating expenses of the class. Expenses before reductions do not reflect amounts reimbursed, waived, or reduced through arrangements with the investment advisor, brokerage services, or other offset arrangements, if applicable, and do not represent the amount paid by the class during periods when reimbursements, waivers or reductions occur.
J Annualized
K Amount does not include the portfolio activity of any underlying Fidelity Central Funds.
See accompanying notes which are an integral part of the financial statements.
Notes to Financial Statements (Unaudited)
For the period ended August 31, 2020
1. Organization.
Biotechnology Portfolio, Health Care Portfolio, Health Care Services Portfolio, Medical Technology and Devices Portfolio, and Pharmaceuticals Portfolio (the Funds) are non-diversified funds of Fidelity Select Portfolios (the Trust). The Trust is registered under the Investment Company Act of 1940, as amended (the 1940 Act), as an open-end management investment company organized as a Massachusetts business trust. The Funds invest primarily in securities of companies whose principal business activities fall within specific industries. Each Fund is authorized to issue an unlimited number of shares. Share transactions on the Statement of Changes in Net Assets may contain exchanges between affiliated funds.
2. Investments in Fidelity Central Funds.
The Funds invest in Fidelity Central Funds, which are open-end investment companies generally available only to other investment companies and accounts managed by the investment adviser and its affiliates. The Funds' Schedules of Investments list each of the Fidelity Central Funds held as of period end, if any, as an investment of each Fund, but do not include the underlying holdings of each Fidelity Central Fund. As an Investing Fund, each Fund indirectly bears its proportionate share of the expenses of the underlying Fidelity Central Funds.
The Money Market Central Funds seek preservation of capital and current income and are managed by the investment adviser. Annualized expenses of the Money Market Central Funds as of their most recent shareholder report date ranged from less than .005% to .01%.
A complete unaudited list of holdings for each Fidelity Central Fund is available upon request or at the Securities and Exchange Commission (the SEC) website at www.sec.gov. In addition, the financial statements of the Fidelity Central Funds are available on the SEC website or upon request.
3. Significant Accounting Policies.
Each Fund is an investment company and applies the accounting and reporting guidance of the Financial Accounting Standards Board (FASB) Accounting Standards Codification Topic 946 Financial Services – Investment Companies. The financial statements have been prepared in conformity with accounting principles generally accepted in the United States of America (GAAP), which require management to make certain estimates and assumptions at the date of the financial statements. Actual results could differ from those estimates. Subsequent events, if any, through the date that the financial statements were issued have been evaluated in the preparation of the financial statements. The following summarizes the significant accounting policies of the Funds:
Investment Valuation. Investments are valued as of 4:00 p.m. Eastern time on the last calendar day of the period. The Board of Trustees (the Board) has delegated the day to day responsibility for the valuation of each Fund's investments to the Fair Value Committee (the Committee) established by each Fund's investment adviser. In accordance with valuation policies and procedures approved by the Board, each Fund attempts to obtain prices from one or more third party pricing vendors or brokers to value its investments. When current market prices, quotations or currency exchange rates are not readily available or reliable, investments will be fair valued in good faith by the Committee, in accordance with procedures adopted by the Board. Factors used in determining fair value vary by investment type and may include market or investment specific events, changes in interest rates and credit quality. The frequency with which these procedures are used cannot be predicted and they may be utilized to a significant extent. The Committee oversees each Fund's valuation policies and procedures and reports to the Board on the Committee's activities and fair value determinations. The Board monitors the appropriateness of the procedures used in valuing each Fund's investments and ratifies the fair value determinations of the Committee.
Each Fund categorizes the inputs to valuation techniques used to value its investments into a disclosure hierarchy consisting of three levels as shown below:
- Level 1 – quoted prices in active markets for identical investments
- Level 2 – other significant observable inputs (including quoted prices for similar investments, interest rates, prepayment speeds, etc.)
- Level 3 – unobservable inputs (including the Fund's own assumptions based on the best information available)
Valuation techniques used to value each Fund's investments by major category are as follows:
Equity securities, including restricted securities, for which market quotations are readily available, are valued at the last reported sale price or official closing price as reported by a third party pricing vendor on the primary market or exchange on which they are traded and are categorized as Level 1 in the hierarchy. In the event there were no sales during the day or closing prices are not available, securities are valued at the last quoted bid price or may be valued using the last available price and are generally categorized as Level 2 in the hierarchy. For foreign equity securities, when market or security specific events arise, comparisons to the valuation of American Depositary Receipts (ADRs), futures contracts, Exchange-Traded Funds (ETFs) and certain indexes as well as quoted prices for similar securities may be used and would be categorized as Level 2 in the hierarchy. For equity securities, including restricted securities, where observable inputs are limited, assumptions about market activity and risk are used and these securities may be categorized as Level 3 in the hierarchy. Securities, including private placements or other restricted securities, for which observable inputs are not available are valued using alternate valuation approaches, including the market approach, the income approach and cost approach, and are categorized as Level 3 in the hierarchy. The market approach considers factors including the price of recent investments in the same or a similar security or financial metrics of comparable securities. The income approach considers factors including expected future cash flows, security specific risks and corresponding discount rates. The cost approach considers factors including the value of the security's underlying assets and liabilities.
Debt securities, including restricted securities, are valued based on evaluated prices received from third party pricing vendors or from brokers who make markets in such securities. Preferred securities are valued by pricing vendors who utilize matrix pricing which considers yield or price of bonds of comparable quality, coupon, maturity and type or by broker-supplied prices. When independent prices are unavailable or unreliable, debt securities may be valued utilizing pricing methodologies which consider similar factors that would be used by third party pricing vendors. Debt securities are generally categorized as Level 2 in the hierarchy but may be Level 3 depending on the circumstances.
Investments in open-end mutual funds, including the Fidelity Central Funds, are valued at their closing net asset value (NAV) each business day and are categorized as Level 1 in the hierarchy.
The following provides information on Level 3 securities held by the Fund that were valued at period end based on unobservable inputs. These amounts exclude valuations provided by a broker.
Biotechology Portfolio:
| Asset Type | Fair Value | Valuation Technique(s) | Unobservable Input | Amount or Range/Weighted Average | Impact to Valuation from an Increase in Input(a) |
| Equities | $ 178,747,142 | Market comparable | Transaction price | $0.52-$128.58/$29.92 | Increase |
| | | | Premium rate | 21.8%-36.2%/30.8% | Increase |
| | | | Conversion ratio | 1.1 | Increase |
| | | Recovery value | Recovery value | 0.0% | Increase |
| | | Market approach | Transaction price | $10.45 | Increase |
| | | Discounted Cash Flow | Discount Rate | 8.0%-12.0%/11.2% | Decrease |
| | | | Growth rate | 3.5% | Increase |
| | | | Probability rate | 6.3% | Increase |
| Corporate Bonds | $ 8,000,000 | Market approach | Transaction price | $100.00 | Increase |
(a) Represents the directional change in the fair value of the Level 3 investments that could have resulted from an increase in the corresponding input as of period end. A decrease to the unobservable input would have had the opposite effect. Significant changes in these inputs may have resulted in a significantly higher or lower fair value measurement at period end.
Changes in valuation techniques may result in transfers in or out of an assigned level within the disclosure hierarchy. The aggregate value of investments by input level as of August 31, 2020, as well as a roll forward of Level 3 investments, is included at the end of each Fund's Schedule of Investments.
Foreign Currency. Certain Funds may use foreign currency contracts to facilitate transactions in foreign-denominated securities. Gains and losses from these transactions may arise from changes in the value of the foreign currency or if the counterparties do not perform under the contracts' terms.
Foreign-denominated assets, including investment securities, and liabilities are translated into U.S. dollars at the exchange rates at period end. Purchases and sales of investment securities, income and dividends received, and expenses denominated in foreign currencies are translated into U.S. dollars at the exchange rate in effect on the transaction date.
The effects of exchange rate fluctuations on investments are included with the net realized and unrealized gain (loss) on investment securities. Other foreign currency transactions resulting in realized and unrealized gain (loss) are disclosed separately.
Investment Transactions and Income. For financial reporting purposes, the Funds' investment holdings and NAV include trades executed through the end of the last business day of the period. The NAV per share for processing shareholder transactions is calculated as of the close of business of the New York Stock Exchange (NYSE), normally 4:00 p.m. Eastern time and includes trades executed through the end of the prior business day. Gains and losses on securities sold are determined on the basis of identified cost and for certain Funds include proceeds received from litigation. Dividend income is recorded on the ex-dividend date, except for certain dividends from foreign securities where the ex-dividend date may have passed, which are recorded as soon as the Funds are informed of the ex-dividend date. Non-cash dividends included in dividend income, if any, are recorded at the fair market value of the securities received. Income and capital gain distributions from Fidelity Central Funds, if any, are recorded on the ex-dividend date. Certain distributions received by the Funds represent a return of capital or capital gain. The Funds determine the components of these distributions subsequent to the ex-dividend date, based upon receipt of tax filings or other correspondence relating to the underlying investment. These distributions are recorded as a reduction of cost of investments and/or as a realized gain. Investment income is recorded net of foreign taxes withheld where recovery of such taxes is uncertain.
Expenses. Expenses directly attributable to a fund are charged to that fund. Expenses attributable to more than one fund are allocated among the respective funds on the basis of relative net assets or other appropriate methods. Expense estimates are accrued in the period to which they relate and adjustments are made when actual amounts are known.
Deferred Trustee Compensation. Under a Deferred Compensation Plan (the Plan) for the Funds, certain independent Trustees have elected to defer receipt of a portion of their annual compensation. Deferred amounts are invested in a cross-section of Fidelity funds, are marked-to-market and remain in each Fund until distributed in accordance with the Plan. The investment of deferred amounts and the offsetting payable to the Trustees presented below are included in each accompanying Statement of Assets and Liabilities in other receivables and other payables and accrued expenses, respectively.
| Biotechnology Portfolio | $945,305 |
| Health Care Portfolio | 645,302 |
| Health Care Services Portfolio | 70,553 |
| Medical Technology and Devices Portfolio | 210,172 |
| Pharmaceuticals Portfolio | 127,190 |
Income Tax Information and Distributions to Shareholders. Each year, each Fund intends to qualify as a regulated investment company under Subchapter M of the Internal Revenue Code, including distributing substantially all of its taxable income and realized gains. As a result, no provision for U.S. Federal income taxes is required. Each Fund files a U.S. federal tax return, in addition to state and local tax returns as required. Each Fund's federal income tax returns are subject to examination by the Internal Revenue Service (IRS) for a period of three fiscal years after they are filed. State and local tax returns may be subject to examination for an additional fiscal year depending on the jurisdiction. Foreign taxes are provided for based on each Fund's understanding of the tax rules and rates that exist in the foreign markets in which it invests.
Distributions are declared and recorded on the ex-dividend date. Income and capital gain distributions are determined in accordance with income tax regulations, which may differ from GAAP.
Capital accounts within the financial statements are adjusted for permanent book-tax differences. These adjustments have no impact on net assets or the results of operations. Capital accounts are not adjusted for temporary book-tax differences which will reverse in a subsequent period.
Book-tax differences are primarily due to foreign currency transactions, passive foreign investment companies (PFIC), partnerships, deferred trustees compensation, net operating losses, redemption in-kinds, capital loss carryforwards and losses deferred due to wash sales and excise tax regulations.
As of period end, the cost and unrealized appreciation (depreciation) in securities, and derivatives if applicable, for federal income tax purposes were as follows for each Fund:
| | Tax cost | Gross unrealized appreciation | Gross unrealized depreciation | Net unrealized appreciation (depreciation) |
| Biotechnology Portfolio | $5,391,353,678 | $2,873,068,873 | $(331,925,211) | $2,541,143,662 |
| Health Care Portfolio | 6,007,829,800 | 3,485,840,696 | (165,246,159) | 3,320,594,537 |
| Health Care Services Portfolio | 551,323,841 | 521,666,401 | (18,460,684) | 503,205,717 |
| Medical Technology and Devices Portfolio | 4,286,447,682 | 3,184,060,023 | (72,481,742) | 3,111,578,281 |
| Pharmaceuticals Portfolio | 650,656,521 | 282,136,468 | (17,005,739) | 265,130,729 |
Capital loss carryforwards are only available to offset future capital gains of the Funds to the extent provided by regulations and may be limited. The capital loss carryforward information presented below, including any applicable limitation, is estimated as of prior fiscal period end and is subject to adjustment.
| | | | Short-term |
| Health Care Services Portfolio | | | (55,677,868) |
Certain of the Funds elected to defer to the next fiscal year and ordinary losses recognized during the period January 1, 2020 to February 29, 2020. Loss deferrals were as follows:
| | | | | Ordinary losses |
| Medical Technology and Devices Portfolio | | | | $(6,992,400) |
Delayed Delivery Transactions and When-Issued Securities. During the period, certain Funds transacted in securities on a delayed delivery or when-issued basis. Payment and delivery may take place after the customary settlement period for that security. The price of the underlying securities and the date when the securities will be delivered and paid for are fixed at the time the transaction is negotiated. Securities purchased on a delayed delivery or when-issued basis are identified as such in the Schedule of Investments. Compensation for interest forgone in the purchase of a delayed delivery or when-issued debt security may be received. With respect to purchase commitments, each applicable Fund identifies securities as segregated in its records with a value at least equal to the amount of the commitment. Payables and receivables associated with the purchases and sales of delayed delivery securities having the same coupon, settlement date and broker are offset. Delayed delivery or when-issued securities that have been purchased from and sold to different brokers are reflected as both payables and receivables in the Statement of Assets and Liabilities under the caption "Delayed delivery", as applicable. Losses may arise due to changes in the value of the underlying securities or if the counterparty does not perform under the contract's terms, or if the issuer does not issue the securities due to political, economic, or other factors.
Restricted Securities (including Private Placements). The Funds may invest in securities that are subject to legal or contractual restrictions on resale. These securities generally may be resold in transactions exempt from registration or to the public if the securities are registered. Disposal of these securities may involve time-consuming negotiations and expense, and prompt sale at an acceptable price may be difficult. Information regarding restricted securities is included at the end of each applicable Fund's Schedule of Investments.
Consolidated Subsidiary. The Funds included in the table below hold certain investments through a wholly-owned subsidiary ("Subsidiary"), which may be subject to federal and state taxes upon disposition.
As of period end, investments in Subsidiaries were as follows:
| | $ Amount | % of Net Assets |
| Biotechnology Portfolio | 81,581,915 | 1.10 |
The financial statements have been consolidated to include the Subsidiary accounts where applicable. Accordingly, all inter-company transactions and balances have been eliminated.
At period end, any estimated tax liability for these investments is presented as "Deferred taxes" in the Statement of Assets and Liabilities and included in "Change in net unrealized appreciation (depreciation) on investment securities" in the Statement of Operations. The tax liability incurred may differ materially depending on conditions when these investments are disposed. Any cash held by a Subsidiary is restricted as to its use and is presented as "Restricted cash" in the Statement of Assets and Liabilities, if applicable.
4. Purchases and Sales of Investments.
Purchases and sales of securities, other than short-term securities are noted in the table below.
| | Purchases ($) | Sales ($) |
| Biotechnology Portfolio | 2,787,788,955 | 3,155,010,630 |
| Health Care Portfolio | 2,851,969,393 | 2,452,110,268 |
| Health Care Services Portfolio | 148,642,830 | 275,698,580 |
| Medical Technology and Devices Portfolio | 2,048,713,303 | 2,267,385,824 |
| Pharmaceuticals Portfolio | 187,874,851 | 166,961,659 |
5. Fees and Other Transactions with Affiliates.
Management Fee. Fidelity Management & Research Company LLC (the investment adviser) and its affiliates provide the Funds with investment management related services for which the Funds pay a monthly management fee. The management fee is the sum of an individual fund fee rate and an annualized group fee rate. The individual fund fee rate is applied to each Fund's average net assets. The group fee rate is based upon the monthly average net assets of a group of registered investment companies with which the investment adviser has management contracts. The group fee rate decreases as assets under management increase and increases as assets under management decrease. For the reporting period, each Fund's annualized management fee rate expressed as a percentage of each Fund's average net assets was as follows:
| | Individual Rate | Group Rate | Total |
| Biotechnology Portfolio | .30% | .23% | .53% |
| Health Care Portfolio | .30% | .23% | .53% |
| Health Care Services Portfolio | .30% | .23% | .53% |
| Medical Technology and Devices Portfolio | .30% | .23% | .53% |
| Pharmaceuticals Portfolio | .30% | .23% | .53% |
Transfer Agent Fees. Fidelity Investments Institutional Operations Company LLC (FIIOC), an affiliate of the investment adviser, is the Funds' transfer, dividend disbursing and shareholder servicing agent. FIIOC receives account fees and asset-based fees that vary according to account size and type of account. FIIOC pays for typesetting, printing and mailing of shareholder reports, except proxy statements. For the period, transfer agent fees were equivalent to the following annualized rates expressed as a percentage of average net assets:
| Biotechnology Portfolio | .16% |
| Health Care Portfolio | .15% |
| Health Care Services Portfolio | .17% |
| Medical Technology and Devices Portfolio | .15% |
| Pharmaceuticals Portfolio | .19% |
Accounting Fees. Fidelity Service Company, Inc. (FSC), an affiliate of the investment adviser, maintains each Fund's accounting records. The accounting fee is based on the level of average net assets for each month. For the period, the fees were equivalent to the following annualized rates:
| | % of Average Net Assets |
| Biotechnology Portfolio | .02 |
| Health Care Portfolio | .01 |
| Health Care Services Portfolio | .03 |
| Medical Technology and Devices Portfolio | .02 |
| Pharmaceuticals Portfolio | .03 |
Brokerage Commissions. A portion of portfolio transactions were placed with brokerage firms which are affiliates of the investment adviser. Brokerage commissions are included in net realized gain (loss) and change in net unrealized appreciation (depreciation) in the Statement of Operations. The commissions paid to these affiliated firms were as follows:
| | Amount |
| Biotechnology Portfolio | $145,904 |
| Health Care Portfolio | 58,302 |
| Health Care Services Portfolio | 8,367 |
| Medical Technology and Devices Portfolio | 56,715 |
| Pharmaceuticals Portfolio | 5,091 |
Interfund Lending Program. Pursuant to an Exemptive Order issued by the SEC, each fund, along with other registered investment companies having management contracts with Fidelity Management & Research Company LLC (FMR), or other affiliated entities of FMR, may participate in an interfund lending program. This program provides an alternative credit facility allowing each fund to borrow from, or lend money to, other participating affiliated funds. At period end, there were no interfund loans outstanding. Activity in this program during the period for which loans were outstanding was as follows:
| | Borrower or Lender | Average Loan Balance | Weighted Average Interest Rate | Interest Expense |
| Health Care Portfolio | Borrower | $61,964,500 | .34% | $1,170 |
| Health Care Services Portfolio | Borrower | $5,452,000 | 1.34% | $407 |
| Medical Technology and Devices Portfolio | Borrower | $9,985,400 | .34% | $472 |
| Pharmaceuticals Portfolio | Borrower | $4,882,667 | 1.35% | $550 |
Interfund Trades. Funds may purchase from or sell securities to other Fidelity Funds under procedures adopted by the Board. The procedures have been designed to ensure these interfund trades are executed in accordance with Rule 17a-7 of the 1940 Act. Interfund trades are included within the respective purchases and sales amounts shown in the Purchases and Sales of Investments note.
Prior Fiscal Year Affiliated Redemptions In-Kind. During the prior period, 4,971,286 shares of the Health Care Portfolio were redeemed in-kind for investments and cash with a value of $122,939,907. The Fund had a net realized gain of $52,017,323 on investments delivered through in-kind redemptions. The amount of the in-kind redemptions is included in share transactions in the accompanying Statement of Changes in Net Assets. The Health Care Portfolio recognized no gain or loss for federal income tax purposes.
Other. During the period, the investment adviser reimbursed the Funds for certain losses, which are included in Net Realized Gain (Loss) in each Fund's accompanying Statement of Operations, as follows:
| | Amount |
| Biotechnology Portfolio | $16,906 |
6. Committed Line of Credit.
Certain Funds participate with other funds managed by the investment adviser or an affiliate in a $4.25 billion credit facility (the "line of credit") to be utilized for temporary or emergency purposes to fund shareholder redemptions or for other short-term liquidity purposes. The participating funds have agreed to pay commitment fees on their pro-rata portion of the line of credit, which are reflected in Miscellaneous expenses on the Statement of Operations, and are as follows:
| | Amount |
| Biotechnology Portfolio | $8,529 |
| Health Care Portfolio | 9,774 |
| Health Care Services Portfolio | 1,319 |
| Medical Technology and Devices Portfolio | 7,816 |
| Pharmaceuticals Portfolio | 1,025 |
During the period, there were no borrowings on this line of credit.
7. Security Lending.
Certain Funds lend portfolio securities from time to time in order to earn additional income. Lending agents are used, including National Financial Services (NFS), an affiliate of the Funds. Pursuant to a securities lending agreement, NFS will receive a fee, which is capped at 9.9% of a Fund's daily lending revenue, for its services as lending agent. The Funds may lend securities to certain qualified borrowers, including NFS. On the settlement date of the loan, each applicable Fund receives collateral (in the form of U.S. Treasury obligations, letters of credit and/or cash) against the loaned securities and maintains collateral in an amount not less than 100% of the market value of the loaned securities during the period of the loan. The market value of the loaned securities is determined at the close of business of the Funds and any additional required collateral is delivered to the Funds on the next business day. The Funds or borrower may terminate the loan at any time, and if the borrower defaults on its obligation to return the securities loaned because of insolvency or other reasons, the Funds may apply collateral received from the borrower against the obligation. The Funds may experience delays and costs in recovering the securities loaned. Any cash collateral received is invested in the Fidelity Securities Lending Cash Central Fund. The value of loaned securities and cash collateral at period end are disclosed on each applicable Fund's Statement of Assets and Liabilities. Security lending income represents the income earned on investing cash collateral, less rebates paid to borrowers and any lending agent fees associated with the loan, plus any premium payments received for lending certain types of securities. Net income from Fidelity Central Funds is presented in the Statement of Operations as a component of income from Fidelity Central Funds. Affiliated security lending activity was as follows:
| | Total Security Lending Income Fees Paid to NFS | Security Lending Income From Securities Loaned to NFS | Value of Securities Loaned to NFS at Period End |
| Biotechnology Portfolio | $223,207 | $363,386 | $40,023,299 |
| Health Care Portfolio | $49,103 | $131,567 | $16,070,446 |
| Health Care Services Portfolio | $6,747 | $1,960 | $– |
| Medical Technology and Devices Portfolio | $8,289 | $119 | $– |
| Pharmaceuticals Portfolio | $3,568 | $4,797 | $3,068,625 |
8. Expense Reductions.
Commissions paid to certain brokers with whom the investment adviser, or its affiliates, places trades on behalf of certain Funds include an amount in addition to trade execution, which may be rebated back to the Funds to offset certain expenses. In addition, through arrangements with each applicable Fund's custodian and transfer agent, credits realized as a result of certain uninvested cash balances were used to reduce each applicable Fund's expenses. All of the applicable expense reductions are noted in the table below.
| | Brokerage service rebates | Custodian credits |
| Biotechnology Portfolio | $255,785 | $1,544 |
| Health Care Portfolio | 269,393 | 406 |
| Health Care Services Portfolio | 8,124 | – |
| Medical Technology and Devices Portfolio | 178,821 | – |
| Pharmaceuticals Portfolio | 25,529 | 125 |
In addition, during the period the investment adviser or an affiliate reimbursed and/or waived a portion of operating expenses as follows:
| | Amount |
| Biotechnology Portfolio | $14,419 |
| Health Care Portfolio | 15,280 |
| Health Care Services Portfolio | 2,285 |
| Medical Technology and Devices Portfolio | 13,439 |
| Pharmaceuticals Portfolio | 1,597 |
9. Other.
The Funds' organizational documents provide former and current trustees and officers with a limited indemnification against liabilities arising in connection with the performance of their duties to the Funds. In the normal course of business, the Funds may also enter into contracts that provide general indemnifications. The Funds' maximum exposure under these arrangements is unknown as this would be dependent on future claims that may be made against the Funds. The risk of material loss from such claims is considered remote.
10. Coronavirus (COVID-19) Pandemic.
An outbreak of COVID-19 first detected in China during December 2019 has since spread globally and was declared a pandemic by the World Health Organization during March 2020. Developments that disrupt global economies and financial markets, such as the COVID-19 pandemic, may magnify factors that affect the Funds' performance.
Shareholder Expense Example
As a shareholder, you incur two types of costs: (1) transaction costs, which may include sales charges (loads) on purchase payments or redemption proceeds, as applicable and (2) ongoing costs, which generally include management fees, distribution and/or service (12b-1) fees and other Fund expenses. This Example is intended to help you understand your ongoing costs (in dollars) of investing in a fund and to compare these costs with the ongoing costs of investing in other mutual funds.
The Example is based on an investment of $1,000 invested at the beginning of the period and held for the entire period (March 1, 2020 to August 31, 2020).
Actual Expenses
The first line of the accompanying table provides information about actual account values and actual expenses. You may use the information in this line, together with the amount you invested, to estimate the expenses that you paid over the period. Simply divide your account value by $1,000.00 (for example, an $8,600 account value divided by $1,000.00 = 8.6), then multiply the result by the number in the first line for a class/Fund under the heading entitled "Expenses Paid During Period" to estimate the expenses you paid on your account during this period. If any fund is a shareholder of any underlying mutual funds or exchange-traded funds (ETFs) (the Underlying Funds), such fund indirectly bears its proportional share of the expenses of the Underlying Funds in addition to the direct expenses incurred presented in the table. These fees and expenses are not included in the annualized expense ratio used to calculate the expense estimate in the table below.
Hypothetical Example for Comparison Purposes
The second line of the accompanying table provides information about hypothetical account values and hypothetical expenses based on the actual expense ratio and an assumed rate of return of 5% per year before expenses, which is not the actual return. The hypothetical account values and expenses may not be used to estimate the actual ending account balance or expenses you paid for the period. You may use this information to compare the ongoing costs of investing in the Fund and other funds. To do so, compare this 5% hypothetical example with the 5% hypothetical examples that appear in the shareholder reports of the other funds. If any fund is a shareholder of any Underlying Funds, such fund indirectly bears its proportional share of the expenses of the Underlying Funds in addition to the direct expenses as presented in the table. These fees and expenses are not included in the annualized expense ratio used to calculate the expense estimate in the table below.
Please note that the expenses shown in the table are meant to highlight your ongoing costs only and do not reflect any transaction costs. Therefore, the second line of the table is useful in comparing ongoing costs only, and will not help you determine the relative total costs of owning different funds. In addition, if these transactional costs were included, your costs would have been higher.
| | Annualized Expense Ratio-A | Beginning
Account Value
March 1, 2020 | Ending
Account Value
August 31, 2020 | Expenses Paid
During Period-B
March 1, 2020
to August 31, 2020 |
| Biotechnology Portfolio | .71% | | | |
| Actual | | $1,000.00 | $1,188.30 | $3.92 |
| Hypothetical-C | | $1,000.00 | $1,021.63 | $3.62 |
| Health Care Portfolio | .70% | | | |
| Actual | | $1,000.00 | $1,224.10 | $3.92 |
| Hypothetical-C | | $1,000.00 | $1,021.68 | $3.57 |
| Health Care Services Portfolio | .74% | | | |
| Actual | | $1,000.00 | $1,163.80 | $4.04 |
| Hypothetical-C | | $1,000.00 | $1,021.48 | $3.77 |
| Medical Technology and Devices Portfolio | .71% | | | |
| Actual | | $1,000.00 | $1,262.40 | $4.05 |
| Hypothetical-C | | $1,000.00 | $1,021.63 | $3.62 |
| Pharmaceuticals Portfolio | .77% | | | |
| Actual | | $1,000.00 | $1,162.10 | $4.20 |
| Hypothetical-C | | $1,000.00 | $1,021.32 | $3.92 |
A Annualized expense ratio reflects expenses net of applicable fee waivers.
B Expenses are equal to the annualized expense ratio, multiplied by the average account value over the period, multiplied by 184/ 365 (to reflect the one-half year period). The fees and expenses of any Underlying Funds are not included in each annualized expense ratio.
C 5% return per year before expenses
Proxy Voting Results
A special meeting of shareholders was held on June 9, 2020. The results of votes taken among shareholders on the proposal before them are reported below. Each vote reported represents one dollar of net asset value held on the record date for the meeting.
PROPOSAL 1
To elect a Board of Trustees.
| | # of
Votes | % of
Votes |
| Dennis J. Dirks |
| Affirmative | 32,463,705,305.665 | 92.437 |
| Withheld | 2,655,951,104.308 | 7.563 |
| TOTAL | 35,119,656,409.973 | 100.000 |
| Donald F. Donahue |
| Affirmative | 32,446,843,861.354 | 92.389 |
| Withheld | 2,672,812,548.619 | 7.611 |
| TOTAL | 35,119,656,409.973 | 100.000 |
| Bettina Doulton |
| Affirmative | 32,610,463,757.584 | 92.855 |
| Withheld | 2,509,192,652.389 | 7.145 |
| TOTAL | 35,119,656,409.973 | 100.000 |
| Vicki L. Fuller |
| Affirmative | 32,688,213,522.720 | 93.077 |
| Withheld | 2,431,442,887.253 | 6.923 |
| TOTAL | 35,119,656,409.973 | 100.000 |
| Patricia L. Kampling |
| Affirmative | 32,313,755,598.535 | 92.010 |
| Withheld | 2,805,900,811.438 | 7.990 |
| TOTAL | 35,119,656,409.973 | 100.000 |
| Alan J. Lacy |
| Affirmative | 31,990,158,754.948 | 91.089 |
| Withheld | 3,129,497,655.026 | 8.911 |
| TOTAL | 35,119,656,409.973 | 100.000 |
| Ned C. Lautenbach |
| Affirmative | 32,043,019,991.143 | 91.240 |
| Withheld | 3,076,636,418.830 | 8.760 |
| TOTAL | 35,119,656,409.973 | 100.000 |
| Robert A. Lawrence |
| Affirmative | 32,150,842,398.009 | 91.547 |
| Withheld | 2,968,814,011.965 | 8.453 |
| TOTAL | 35,119,656,409.973 | 100.000 |
| Joseph Mauriello |
| Affirmative | 32,082,201,213.166 | 91.351 |
| Withheld | 3,037,455,196.807 | 8.649 |
| TOTAL | 35,119,656,409.973 | 100.000 |
| Cornelia M. Small |
| Affirmative | 32,207,976,835.934 | 91.709 |
| Withheld | 2,911,679,574.039 | 8.291 |
| TOTAL | 35,119,656,409.973 | 100.000 |
| Garnett A. Smith |
| Affirmative | 32,102,654,343.096 | 91.409 |
| Withheld | 3,017,002,066.877 | 8.591 |
| TOTAL | 35,119,656,409.973 | 100.000 |
| David M. Thomas |
| Affirmative | 32,150,749,424.556 | 91.546 |
| Withheld | 2,968,906,985.418 | 8.454 |
| TOTAL | 35,119,656,409.973 | 100.000 |
| Susan Tomasky |
| Affirmative | 32,381,933,484.515 | 92.205 |
| Withheld | 2,737,722,925.459 | 7.795 |
| TOTAL | 35,119,656,409.973 | 100.000 |
| Michael E. Wiley |
| Affirmative | 32,135,064,741.973 | 91.502 |
| Withheld | 2,984,591,668.000 | 8.498 |
| TOTAL | 35,119,656,409.973 | 100.000 |
|
| Proposal 1 reflects trust wide proposal and voting results. |
SELHC-SANN-1020
1.813645.115
Fidelity® Select Portfolios®
Financials Sector
Banking Portfolio
Brokerage and Investment Management Portfolio
Consumer Finance Portfolio
Financial Services Portfolio
Insurance Portfolio
Semi-Annual Report
August 31, 2020
See the inside front cover for important information about access to your fund’s shareholder reports.
Beginning on January 1, 2021, as permitted by regulations adopted by the Securities and Exchange Commission, paper copies of a fund’s shareholder reports will no longer be sent by mail, unless you specifically request paper copies of the reports from the fund or from your financial intermediary, such as a financial advisor, broker-dealer or bank. Instead, the reports will be made available on a website, and you will be notified by mail each time a report is posted and provided with a website link to access the report.
If you already elected to receive shareholder reports electronically, you will not be affected by this change and you need not take any action. You may elect to receive shareholder reports and other communications from a fund electronically, by contacting your financial intermediary. For Fidelity customers, visit Fidelity's web site or call Fidelity using the contact information listed below.
You may elect to receive all future reports in paper free of charge. If you wish to continue receiving paper copies of your shareholder reports, you may contact your financial intermediary or, if you are a Fidelity customer, visit Fidelity’s website, or call Fidelity at the applicable toll-free number listed below. Your election to receive reports in paper will apply to all funds held with the fund complex/your financial intermediary.
| Account Type | Website | Phone Number |
| Brokerage, Mutual Fund, or Annuity Contracts: | fidelity.com/mailpreferences | 1-800-343-3548 |
| Employer Provided Retirement Accounts: | netbenefits.fidelity.com/preferences (choose 'no' under Required Disclosures to continue to print) | 1-800-343-0860 |
| Advisor Sold Accounts Serviced Through Your Financial Intermediary: | Contact Your Financial Intermediary | Your Financial Intermediary's phone number |
| Advisor Sold Accounts Serviced by Fidelity: | institutional.fidelity.com | 1-877-208-0098 |
Contents
To view a fund's proxy voting guidelines and proxy voting record for the 12-month period ended June 30, visit http://www.fidelity.com/proxyvotingresults or visit the Securities and Exchange Commission's (SEC) web site at http://www.sec.gov.
You may also call 1-800-544-8544 to request a free copy of the proxy voting guidelines.
Standard & Poor's, S&P and S&P 500 are registered service marks of The McGraw-Hill Companies, Inc. and have been licensed for use by Fidelity Distributors Corporation.
Other third-party marks appearing herein are the property of their respective owners.
All other marks appearing herein are registered or unregistered trademarks or service marks of FMR LLC or an affiliated company. © 2020 FMR LLC. All rights reserved.
This report and the financial statements contained herein are submitted for the general information of the shareholders of the Funds. This report is not authorized for distribution to prospective investors in the Funds unless preceded or accompanied by an effective prospectus.
A fund files its complete schedule of portfolio holdings with the SEC for the first and third quarters of each fiscal year on Form N-PORT. Forms N-PORT are available on the SEC’s web site at http://www.sec.gov. A fund's Forms N-PORT may be reviewed and copied at the SEC’s Public Reference Room in Washington, DC. Information regarding the operation of the SEC's Public Reference Room may be obtained by calling 1-800-SEC-0330.
For a complete list of a fund's portfolio holdings, view the most recent holdings listing, semiannual report, or annual report on Fidelity's web site at http://www.fidelity.com, http://www.institutional.fidelity.com, or http://www.401k.com, as applicable.
NOT FDIC INSURED •MAY LOSE VALUE •NO BANK GUARANTEE
Neither the Funds nor Fidelity Distributors Corporation is a bank.
Note to Shareholders:
Early in 2020, the outbreak and spread of a new coronavirus emerged as a public health emergency that had a major influence on financial markets, primarily based on its impact on the global economy and the outlook for corporate earnings. The virus causes a respiratory disease known as COVID-19. On March 11, the World Health Organization declared the COVID-19 outbreak a pandemic, citing sustained risk of further global spread.
In the weeks following, as the crisis worsened, we witnessed an escalating human tragedy with wide-scale social and economic consequences from coronavirus-containment measures. The outbreak of COVID-19 prompted a number of measures to limit the spread, including travel and border restrictions, quarantines, and restrictions on large gatherings. In turn, these resulted in lower consumer activity, diminished demand for a wide range of products and services, disruption in manufacturing and supply chains, and – given the wide variability in outcomes regarding the outbreak – significant market uncertainty and volatility. Amid the turmoil, the U.S. government took unprecedented action – in concert with the U.S. Federal Reserve and central banks around the world – to help support consumers, businesses, and the broader economy, and to limit disruption to the financial system.
The situation continues to unfold, and the extent and duration of its impact on financial markets and the economy remain highly uncertain. Extreme events such as the coronavirus crisis are “exogenous shocks” that can have significant adverse effects on mutual funds and their investments. Although multiple asset classes may be affected by market disruption, the duration and impact may not be the same for all types of assets.
Fidelity is committed to helping you stay informed amid news about COVID-19 and during increased market volatility, and we’re taking extra steps to be responsive to customer needs. We encourage you to visit our websites, where we offer ongoing updates, commentary, and analysis on the markets and our funds.
Banking Portfolio
Investment Summary (Unaudited)
Top Ten Stocks as of August 31, 2020
| | % of fund's net assets |
| Bank of America Corp. | 8.6 |
| Citigroup, Inc. | 6.3 |
| Wells Fargo & Co. | 6.3 |
| Truist Financial Corp. | 6.2 |
| U.S. Bancorp | 6.0 |
| Huntington Bancshares, Inc. | 2.9 |
| Wintrust Financial Corp. | 2.8 |
| Capital One Financial Corp. | 2.7 |
| Essent Group Ltd. | 2.6 |
| East West Bancorp, Inc. | 2.5 |
| | 46.9 |
Top Industries (% of fund's net assets)
| As of August 31, 2020 |
| | Banks | 82.8% |
| | Thrifts & Mortgage Finance | 6.4% |
| | Consumer Finance | 5.7% |
| | Capital Markets | 3.8% |
| | IT Services | 0.6% |
| | All Others* | 0.7% |

* Includes short-term investments and net other assets (liabilities).
Banking Portfolio
Schedule of Investments August 31, 2020 (Unaudited)
Showing Percentage of Net Assets
| Common Stocks - 99.5% | | | |
| | | Shares | Value |
| Banks - 82.8% | | | |
| Diversified Banks - 27.2% | | | |
| Bank of America Corp. | | 1,002,676 | $25,808,880 |
| Citigroup, Inc. | | 372,900 | 19,062,648 |
| U.S. Bancorp | | 498,300 | 18,138,120 |
| Wells Fargo & Co. | | 788,692 | 19,046,912 |
| | | | 82,056,560 |
| Regional Banks - 55.6% | | | |
| 1st Source Corp. | | 69,660 | 2,399,787 |
| Amalgamated Bank | | 56,500 | 665,005 |
| American National Bankshares, Inc. | | 120,886 | 2,724,770 |
| Ameris Bancorp | | 116,560 | 2,858,051 |
| Associated Banc-Corp. | | 349,300 | 4,694,592 |
| Bank OZK | | 254,000 | 5,852,160 |
| BayCom Corp. (a) | | 62,182 | 720,378 |
| BOK Financial Corp. | | 91,400 | 5,131,196 |
| Cadence Bancorp Class A | | 596,528 | 5,667,016 |
| Camden National Corp. | | 20,232 | 660,676 |
| Comerica, Inc. | | 135,400 | 5,352,362 |
| Community Trust Bancorp, Inc. | | 101,076 | 3,261,723 |
| ConnectOne Bancorp, Inc. | | 92,300 | 1,395,576 |
| Cullen/Frost Bankers, Inc. | | 16,900 | 1,173,874 |
| East West Bancorp, Inc. | | 203,200 | 7,473,696 |
| First Citizens Bancshares, Inc. | | 1,600 | 629,040 |
| First Hawaiian, Inc. | | 10,100 | 166,953 |
| First Horizon National Corp. | | 710,600 | 6,786,230 |
| First Interstate Bancsystem, Inc. | | 193,300 | 6,340,240 |
| Great Western Bancorp, Inc. | | 250,200 | 3,485,286 |
| Heartland Financial U.S.A., Inc. | | 104,300 | 3,591,049 |
| Hilltop Holdings, Inc. | | 124,300 | 2,560,580 |
| Huntington Bancshares, Inc. | | 917,400 | 8,632,734 |
| KeyCorp | | 511,300 | 6,299,216 |
| Lakeland Financial Corp. | | 80,900 | 3,696,321 |
| M&T Bank Corp. | | 71,100 | 7,341,786 |
| PacWest Bancorp | | 166,236 | 3,171,783 |
| Preferred Bank, Los Angeles | | 73,295 | 2,741,233 |
| Regions Financial Corp. | | 496,900 | 5,744,164 |
| Sierra Bancorp | | 70,600 | 1,261,622 |
| Signature Bank | | 71,290 | 6,917,269 |
| Trico Bancshares | | 100,087 | 2,771,409 |
| Truist Financial Corp. | | 484,150 | 18,789,862 |
| UMB Financial Corp. | | 105,566 | 5,671,006 |
| Univest Corp. of Pennsylvania | | 140,600 | 2,262,254 |
| WesBanco, Inc. | | 262,700 | 5,837,194 |
| Wintrust Financial Corp. | | 192,700 | 8,386,304 |
| Zions Bancorp NA | | 146,950 | 4,725,912 |
| | | | 167,840,309 |
|
| TOTAL BANKS | | | 249,896,869 |
|
| Capital Markets - 3.8% | | | |
| Asset Management & Custody Banks - 3.8% | | | |
| Bank of New York Mellon Corp. | | 102,400 | 3,786,752 |
| Northern Trust Corp. | | 26,000 | 2,129,140 |
| State Street Corp. | | 82,300 | 5,603,807 |
| | | | 11,519,699 |
| Consumer Finance - 5.7% | | | |
| Consumer Finance - 5.7% | | | |
| Capital One Financial Corp. | | 116,200 | 8,021,286 |
| Discover Financial Services | | 58,500 | 3,105,180 |
| OneMain Holdings, Inc. | | 106,600 | 3,099,928 |
| SLM Corp. | | 402,400 | 3,074,336 |
| | | | 17,300,730 |
| Insurance - 0.2% | | | |
| Property & Casualty Insurance - 0.2% | | | |
| First American Financial Corp. | | 9,000 | 473,130 |
| IT Services - 0.6% | | | |
| Data Processing & Outsourced Services - 0.6% | | | |
| Computer Services, Inc. | | 30,000 | 1,815,000 |
| Thrifts & Mortgage Finance - 6.4% | | | |
| Thrifts & Mortgage Finance - 6.4% | | | |
| Essent Group Ltd. | | 220,029 | 7,855,035 |
| MGIC Investment Corp. | | 397,200 | 3,642,324 |
| NMI Holdings, Inc. (a) | | 304,802 | 5,227,354 |
| Radian Group, Inc. | | 161,736 | 2,497,204 |
| | | | 19,221,917 |
| TOTAL COMMON STOCKS | | | |
| (Cost $347,231,185) | | | 300,227,345 |
|
| Money Market Funds - 0.5% | | | |
| Fidelity Cash Central Fund 0.12% (b) | | | |
| (Cost $1,316,612) | | 1,316,349 | 1,316,612 |
| TOTAL INVESTMENT IN SECURITIES - 100.0% | | | |
| (Cost $348,547,797) | | | 301,543,957 |
| NET OTHER ASSETS (LIABILITIES) - 0.0% | | | 129,748 |
| NET ASSETS - 100% | | | $301,673,705 |
Legend
(a) Non-income producing
(b) Affiliated fund that is generally available only to investment companies and other accounts managed by Fidelity Investments. The rate quoted is the annualized seven-day yield of the fund at period end. A complete unaudited listing of the fund's holdings as of its most recent quarter end is available upon request. In addition, each Fidelity Central Fund's financial statements are available on the SEC's website or upon request.
Affiliated Central Funds
Information regarding fiscal year to date income earned by the Fund from investments in Fidelity Central Funds is as follows:
| Fund | Income earned |
| Fidelity Cash Central Fund | $2,110 |
| Fidelity Securities Lending Cash Central Fund | 3,395 |
| Total | $5,505 |
Amounts in the income column in the above table include any capital gain distributions from underlying funds, which are presented in the corresponding line-item in the Statement of Operations, if applicable. Amount for Fidelity Securities Lending Cash Central Fund represents the income earned on investing cash collateral, less rebates paid to borrowers and any lending agent fees associated with the loan, plus any premium payments received for lending certain types of securities.
Investment Valuation
The following is a summary of the inputs used, as of August 31, 2020, involving the Fund's assets and liabilities carried at fair value. The inputs or methodology used for valuing securities may not be an indication of the risk associated with investing in those securities. For more information on valuation inputs, and their aggregation into the levels used below, please refer to the Investment Valuation section in the accompanying Notes to Financial Statements.
| | Valuation Inputs at Reporting Date: |
| Description | Total | Level 1 | Level 2 | Level 3 |
| Investments in Securities: | | | | |
| Common Stocks | $300,227,345 | $300,227,345 | $-- | $-- |
| Money Market Funds | 1,316,612 | 1,316,612 | -- | -- |
| Total Investments in Securities: | $301,543,957 | $301,543,957 | $-- | $-- |
See accompanying notes which are an integral part of the financial statements.
Banking Portfolio
Financial Statements
Statement of Assets and Liabilities
| | | August 31, 2020 (Unaudited) |
| Assets | | |
Investment in securities, at value — See accompanying schedule:
Unaffiliated issuers (cost $347,231,185) | $300,227,345 | |
| Fidelity Central Funds (cost $1,316,612) | 1,316,612 | |
| Total Investment in Securities (cost $348,547,797) | | $301,543,957 |
| Receivable for fund shares sold | | 1,190,700 |
| Dividends receivable | | 691,299 |
| Distributions receivable from Fidelity Central Funds | | 201 |
| Prepaid expenses | | 5,286 |
| Other receivables | | 9,366 |
| Total assets | | 303,440,809 |
| Liabilities | | |
| Payable for investments purchased | $609,293 | |
| Payable for fund shares redeemed | 947,417 | |
| Accrued management fee | 134,050 | |
| Other affiliated payables | 59,346 | |
| Other payables and accrued expenses | 16,998 | |
| Total liabilities | | 1,767,104 |
| Net Assets | | $301,673,705 |
| Net Assets consist of: | | |
| Paid in capital | | $357,712,795 |
| Total accumulated earnings (loss) | | (56,039,090) |
| Net Assets | | $301,673,705 |
| Net Asset Value, offering price and redemption price per share ($301,673,705 ÷ 17,548,172 shares) | | $17.19 |
See accompanying notes which are an integral part of the financial statements.
Statement of Operations
| | | Six months ended August 31, 2020 (Unaudited) |
| Investment Income | | |
| Dividends | | $5,875,084 |
| Income from Fidelity Central Funds (including $3,395 from security lending) | | 5,505 |
| Total income | | 5,880,589 |
| Expenses | | |
| Management fee | $753,734 | |
| Transfer agent fees | 293,646 | |
| Accounting fees | 55,119 | |
| Custodian fees and expenses | 4,192 | |
| Independent trustees' fees and expenses | 1,029 | |
| Registration fees | 25,906 | |
| Audit | 17,896 | |
| Legal | 879 | |
| Miscellaneous | 8,203 | |
| Total expenses before reductions | 1,160,604 | |
| Expense reductions | (17,907) | |
| Total expenses after reductions | | 1,142,697 |
| Net investment income (loss) | | 4,737,892 |
| Realized and Unrealized Gain (Loss) | | |
| Net realized gain (loss) on: | | |
| Investment securities: | | |
| Unaffiliated issuers | (12,522,935) | |
| Fidelity Central Funds | (471) | |
| Total net realized gain (loss) | | (12,523,406) |
| Change in net unrealized appreciation (depreciation) on investment securities | | (62,360,971) |
| Net gain (loss) | | (74,884,377) |
| Net increase (decrease) in net assets resulting from operations | | $(70,146,485) |
See accompanying notes which are an integral part of the financial statements.
Statement of Changes in Net Assets
| | Six months ended August 31, 2020 (Unaudited) | Year ended February 29, 2020 |
| Increase (Decrease) in Net Assets | | |
| Operations | | |
| Net investment income (loss) | $4,737,892 | $10,191,695 |
| Net realized gain (loss) | (12,523,406) | 39,645,121 |
| Change in net unrealized appreciation (depreciation) | (62,360,971) | (72,578,685) |
| Net increase (decrease) in net assets resulting from operations | (70,146,485) | (22,741,869) |
| Distributions to shareholders | (22,808,779) | (30,093,044) |
| Share transactions | | |
| Proceeds from sales of shares | 111,387,171 | 121,977,862 |
| Reinvestment of distributions | 21,711,565 | 28,635,030 |
| Cost of shares redeemed | (100,165,937) | (250,731,343) |
| Net increase (decrease) in net assets resulting from share transactions | 32,932,799 | (100,118,451) |
| Total increase (decrease) in net assets | (60,022,465) | (152,953,364) |
| Net Assets | | |
| Beginning of period | 361,696,170 | 514,649,534 |
| End of period | $301,673,705 | $361,696,170 |
| Other Information | | |
| Shares | | |
| Sold | 6,597,256 | 4,485,997 |
| Issued in reinvestment of distributions | 1,405,279 | 1,050,495 |
| Redeemed | (5,929,165) | (9,539,655) |
| Net increase (decrease) | 2,073,370 | (4,003,163) |
See accompanying notes which are an integral part of the financial statements.
Financial Highlights
Banking Portfolio
| | Six months ended (Unaudited) August 31, | Years endedFebruary 28, | | | | |
| | 2020 | 2020 A | 2019 | 2018 | 2017 | 2016 A |
| Selected Per–Share Data | | | | | | |
| Net asset value, beginning of period | $23.37 | $26.42 | $36.82 | $33.63 | $21.70 | $26.24 |
| Income from Investment Operations | | | | | | |
| Net investment income (loss)B | .28 | .58 | .49 | .42 | .33 | .33 |
| Net realized and unrealized gain (loss) | (4.97) | (1.96) | (3.62) | 3.68 | 11.85 | (3.43) |
| Total from investment operations | (4.69) | (1.38) | (3.13) | 4.10 | 12.18 | (3.10) |
| Distributions from net investment income | (.12) | (.53) | (.54) | (.33) | (.25) | (.28) |
| Distributions from net realized gain | (1.37) | (1.14) | (6.73) | (.58) | – | (1.16) |
| Total distributions | (1.49) | (1.67) | (7.27) | (.91) | (.25) | (1.44) |
| Redemption fees added to paid in capitalB | – | – | – | –C | –C | –C |
| Net asset value, end of period | $17.19 | $23.37 | $26.42 | $36.82 | $33.63 | $21.70 |
| Total ReturnD,E | (19.35)% | (6.05)% | (6.57)% | 12.31% | 56.16% | (12.57)% |
| Ratios to Average Net AssetsF,G | | | | | | |
| Expenses before reductions | .82%H | .77% | .77% | .77% | .79% | .79% |
| Expenses net of fee waivers, if any | .82%H | .77% | .77% | .77% | .79% | .79% |
| Expenses net of all reductions | .80%H | .77% | .76% | .77% | .79% | .79% |
| Net investment income (loss) | 3.33%H | 2.21% | 1.54% | 1.26% | 1.20% | 1.27% |
| Supplemental Data | | | | | | |
| Net assets, end of period (000 omitted) | $301,674 | $361,696 | $514,650 | $830,245 | $1,261,859 | $565,479 |
| Portfolio turnover rateI | 35%H | 31% | 44% | 35% | 34% | 63% |
A For the year ended February 29.
B Calculated based on average shares outstanding during the period.
C Amount represents less than $.005 per share.
D Total returns for periods of less than one year are not annualized.
E Total returns would have been lower if certain expenses had not been reduced during the applicable periods shown.
F Fees and expenses of any underlying mutual funds or exchange-traded funds (ETFs) are not included in the Fund's expense ratio. The Fund indirectly bears its proportionate share of these expenses. For additional expense information related to investments in Fidelity Central Funds, please refer to the "Investments in Fidelity Central Funds" note found in the Notes to Financial Statements section of the most recent Annual or Semi-Annual report.
G Expense ratios reflect operating expenses of the class. Expenses before reductions do not reflect amounts reimbursed, waived, or reduced through arrangements with the investment advisor, brokerage services, or other offset arrangements, if applicable, and do not represent the amount paid by the class during periods when reimbursements, waivers or reductions occur.
H Annualized
I Amount does not include the portfolio activity of any underlying Fidelity Central Funds.
See accompanying notes which are an integral part of the financial statements.
Brokerage and Investment Management Portfolio
Investment Summary (Unaudited)
Top Ten Stocks as of August 31, 2020
| | % of fund's net assets |
| BlackRock, Inc. Class A | 8.8 |
| S&P Global, Inc. | 8.2 |
| Intercontinental Exchange, Inc. | 6.9 |
| Morgan Stanley | 6.4 |
| MSCI, Inc. | 5.6 |
| The NASDAQ OMX Group, Inc. | 5.1 |
| LPL Financial | 4.7 |
| T. Rowe Price Group, Inc. | 4.6 |
| Charles Schwab Corp. | 4.5 |
| CME Group, Inc. | 4.5 |
| | 59.3 |
Top Industries (% of fund's net assets)
| As of August 31, 2020 |
| | Capital Markets | 99.6% |
| | All Others* | 0.4% |

* Includes short-term investments and net other assets (liabilities).
Brokerage and Investment Management Portfolio
Schedule of Investments August 31, 2020 (Unaudited)
Showing Percentage of Net Assets
| Common Stocks - 99.6% | | | |
| | | Shares | Value |
| Capital Markets - 99.6% | | | |
| Asset Management & Custody Banks - 32.5% | | | |
| Affiliated Managers Group, Inc. | | 12,300 | $844,395 |
| AllianceBernstein Holding LP | | 27,000 | 769,230 |
| Ameriprise Financial, Inc. | | 96,200 | 15,084,160 |
| Apollo Global Management LLC Class A | | 284,500 | 13,334,515 |
| Bank of New York Mellon Corp. | | 258,000 | 9,540,840 |
| BlackRock, Inc. Class A | | 49,800 | 29,590,663 |
| Eaton Vance Corp. (non-vtg.) | | 25,400 | 1,041,908 |
| Invesco Ltd. | | 64,500 | 657,900 |
| KKR & Co. LP | | 117,000 | 4,190,940 |
| Northern Trust Corp. | | 70,000 | 5,732,300 |
| State Street Corp. | | 125,400 | 8,538,486 |
| T. Rowe Price Group, Inc. | | 111,900 | 15,577,599 |
| The Blackstone Group LP | | 89,800 | 4,754,910 |
| | | | 109,657,846 |
| Financial Exchanges & Data - 37.9% | | | |
| Cboe Global Markets, Inc. | | 66,638 | 6,116,702 |
| CME Group, Inc. | | 86,100 | 15,142,407 |
| Intercontinental Exchange, Inc. | | 218,300 | 23,190,009 |
| MarketAxess Holdings, Inc. | | 16,300 | 7,920,822 |
| Moody's Corp. | | 40,800 | 12,021,312 |
| MSCI, Inc. | | 50,400 | 18,812,808 |
| S&P Global, Inc. | | 75,200 | 27,554,784 |
| The NASDAQ OMX Group, Inc. | | 127,900 | 17,192,318 |
| | | | 127,951,162 |
| Investment Banking & Brokerage - 29.2% | | | |
| BGC Partners, Inc. Class A | | 400,800 | 1,010,016 |
| Charles Schwab Corp. | | 431,580 | 15,334,037 |
| E*TRADE Financial Corp. | | 180,600 | 9,770,460 |
| Goldman Sachs Group, Inc. | | 39,100 | 8,010,417 |
| LPL Financial | | 192,600 | 15,824,016 |
| Moelis & Co. Class A | | 63,300 | 2,019,903 |
| Morgan Stanley | | 413,400 | 21,604,284 |
| PJT Partners, Inc. | | 96,612 | 5,717,498 |
| Raymond James Financial, Inc. | | 74,100 | 5,610,852 |
| TD Ameritrade Holding Corp. | | 245,900 | 9,437,642 |
| Virtu Financial, Inc. Class A | | 163,600 | 4,225,788 |
| | | | 98,564,913 |
| TOTAL COMMON STOCKS | | | |
| (Cost $229,692,620) | | | 336,173,921 |
|
| Money Market Funds - 0.3% | | | |
| Fidelity Cash Central Fund 0.12% (a) | | | |
| (Cost $1,002,642) | | 1,002,441 | 1,002,642 |
| TOTAL INVESTMENT IN SECURITIES - 99.9% | | | |
| (Cost $230,695,262) | | | 337,176,563 |
| NET OTHER ASSETS (LIABILITIES) - 0.1% | | | 277,165 |
| NET ASSETS - 100% | | | $337,453,728 |
Legend
(a) Affiliated fund that is generally available only to investment companies and other accounts managed by Fidelity Investments. The rate quoted is the annualized seven-day yield of the fund at period end. A complete unaudited listing of the fund's holdings as of its most recent quarter end is available upon request. In addition, each Fidelity Central Fund's financial statements are available on the SEC's website or upon request.
Affiliated Central Funds
Information regarding fiscal year to date income earned by the Fund from investments in Fidelity Central Funds is as follows:
| Fund | Income earned |
| Fidelity Cash Central Fund | $679 |
| Fidelity Securities Lending Cash Central Fund | 1,678 |
| Total | $2,357 |
Amounts in the income column in the above table include any capital gain distributions from underlying funds, which are presented in the corresponding line-item in the Statement of Operations, if applicable. Amount for Fidelity Securities Lending Cash Central Fund represents the income earned on investing cash collateral, less rebates paid to borrowers and any lending agent fees associated with the loan, plus any premium payments received for lending certain types of securities.
Investment Valuation
The following is a summary of the inputs used, as of August 31, 2020, involving the Fund's assets and liabilities carried at fair value. The inputs or methodology used for valuing securities may not be an indication of the risk associated with investing in those securities. For more information on valuation inputs, and their aggregation into the levels used below, please refer to the Investment Valuation section in the accompanying Notes to Financial Statements.
| | Valuation Inputs at Reporting Date: |
| Description | Total | Level 1 | Level 2 | Level 3 |
| Investments in Securities: | | | | |
| Common Stocks | $336,173,921 | $336,173,921 | $-- | $-- |
| Money Market Funds | 1,002,642 | 1,002,642 | -- | -- |
| Total Investments in Securities: | $337,176,563 | $337,176,563 | $-- | $-- |
See accompanying notes which are an integral part of the financial statements.
Brokerage and Investment Management Portfolio
Financial Statements
Statement of Assets and Liabilities
| | | August 31, 2020 (Unaudited) |
| Assets | | |
Investment in securities, at value — See accompanying schedule:
Unaffiliated issuers (cost $229,692,620) | $336,173,921 | |
| Fidelity Central Funds (cost $1,002,642) | 1,002,642 | |
| Total Investment in Securities (cost $230,695,262) | | $337,176,563 |
| Receivable for fund shares sold | | 462,399 |
| Dividends receivable | | 264,106 |
| Distributions receivable from Fidelity Central Funds | | 186 |
| Prepaid expenses | | 3,298 |
| Other receivables | | 44,865 |
| Total assets | | 337,951,417 |
| Liabilities | | |
| Payable for fund shares redeemed | $233,533 | |
| Accrued management fee | 147,090 | |
| Transfer agent fee payable | 45,270 | |
| Other affiliated payables | 10,788 | |
| Other payables and accrued expenses | 61,008 | |
| Total liabilities | | 497,689 |
| Net Assets | | $337,453,728 |
| Net Assets consist of: | | |
| Paid in capital | | $227,530,488 |
| Total accumulated earnings (loss) | | 109,923,240 |
| Net Assets | | $337,453,728 |
| Net Asset Value, offering price and redemption price per share ($337,453,728 ÷ 4,058,574 shares) | | $83.15 |
See accompanying notes which are an integral part of the financial statements.
Statement of Operations
| | | Six months ended August 31, 2020 (Unaudited) |
| Investment Income | | |
| Dividends | | $3,279,853 |
| Income from Fidelity Central Funds (including $1,678 from security lending) | | 2,357 |
| Total income | | 3,282,210 |
| Expenses | | |
| Management fee | $801,158 | |
| Transfer agent fees | 260,041 | |
| Accounting fees | 58,593 | |
| Custodian fees and expenses | 2,110 | |
| Independent trustees' fees and expenses | 974 | |
| Registration fees | 14,713 | |
| Audit | 17,796 | |
| Legal | 227 | |
| Miscellaneous | 5,545 | |
| Total expenses before reductions | 1,161,157 | |
| Expense reductions | (1,423) | |
| Total expenses after reductions | | 1,159,734 |
| Net investment income (loss) | | 2,122,476 |
| Realized and Unrealized Gain (Loss) | | |
| Net realized gain (loss) on: | | |
| Investment securities: | | |
| Unaffiliated issuers | 1,936,624 | |
| Fidelity Central Funds | (352) | |
| Total net realized gain (loss) | | 1,936,272 |
| Change in net unrealized appreciation (depreciation) on: | | |
| Investment securities: | | |
| Unaffiliated issuers | 32,944,293 | |
| Assets and liabilities in foreign currencies | 2,158 | |
| Total change in net unrealized appreciation (depreciation) | | 32,946,451 |
| Net gain (loss) | | 34,882,723 |
| Net increase (decrease) in net assets resulting from operations | | $37,005,199 |
See accompanying notes which are an integral part of the financial statements.
Statement of Changes in Net Assets
| | Six months ended August 31, 2020 (Unaudited) | Year ended February 29, 2020 |
| Increase (Decrease) in Net Assets | | |
| Operations | | |
| Net investment income (loss) | $2,122,476 | $4,319,475 |
| Net realized gain (loss) | 1,936,272 | 11,001,402 |
| Change in net unrealized appreciation (depreciation) | 32,946,451 | 13,075,301 |
| Net increase (decrease) in net assets resulting from operations | 37,005,199 | 28,396,178 |
| Distributions to shareholders | (5,200,153) | (14,519,767) |
| Share transactions | | |
| Proceeds from sales of shares | 30,973,658 | 27,899,331 |
| Reinvestment of distributions | 4,878,028 | 13,537,015 |
| Cost of shares redeemed | (39,291,109) | (73,352,343) |
| Net increase (decrease) in net assets resulting from share transactions | (3,439,423) | (31,915,997) |
| Total increase (decrease) in net assets | 28,365,623 | (18,039,586) |
| Net Assets | | |
| Beginning of period | 309,088,105 | 327,127,691 |
| End of period | $337,453,728 | $309,088,105 |
| Other Information | | |
| Shares | | |
| Sold | 408,897 | 356,153 |
| Issued in reinvestment of distributions | 72,353 | 175,977 |
| Redeemed | (544,671) | (972,124) |
| Net increase (decrease) | (63,421) | (439,994) |
See accompanying notes which are an integral part of the financial statements.
Financial Highlights
Brokerage and Investment Management Portfolio
| | Six months ended (Unaudited) August 31, | Years endedFebruary 28, | | | | |
| | 2020 | 2020 A | 2019 | 2018 | 2017 | 2016 A |
| Selected Per–Share Data | | | | | | |
| Net asset value, beginning of period | $74.99 | $71.71 | $84.47 | $71.13 | $54.65 | $74.78 |
| Income from Investment Operations | | | | | | |
| Net investment income (loss)B | .52 | 1.01 | .77 | 1.15 | .89 | .72 |
| Net realized and unrealized gain (loss) | 8.94 | 5.70 | (7.60) | 17.88 | 16.44 | (16.77) |
| Total from investment operations | 9.46 | 6.71 | (6.83) | 19.03 | 17.33 | (16.05) |
| Distributions from net investment income | (.07) | (.98) | (.96) | (.82) | (.83) | (.74) |
| Distributions from net realized gain | (1.23) | (2.45) | (4.96) | (4.87) | (.01) | (3.34) |
| Total distributions | (1.30) | (3.43) | (5.93)C | (5.69) | (.85)D | (4.08) |
| Redemption fees added to paid in capitalB | – | – | – | –E | –E | –E |
| Net asset value, end of period | $83.15 | $74.99 | $71.71 | $84.47 | $71.13 | $54.65 |
| Total ReturnF,G | 13.02% | 9.28% | (8.04)% | 27.51% | 31.76% | (22.23)% |
| Ratios to Average Net AssetsH,I | | | | | | |
| Expenses before reductions | .77%J | .77% | .78% | .79% | .82% | .79% |
| Expenses net of fee waivers, if any | .77%J | .77% | .77% | .79% | .82% | .79% |
| Expenses net of all reductions | .77%J | .77% | .77% | .78% | .80% | .78% |
| Net investment income (loss) | 1.41%J | 1.33% | 1.01% | 1.49% | 1.43% | 1.02% |
| Supplemental Data | | | | | | |
| Net assets, end of period (000 omitted) | $337,454 | $309,088 | $327,128 | $461,981 | $405,283 | $310,570 |
| Portfolio turnover rateK | 7%J | 9% | 30% | 75% | 146% | 67% |
A For the year ended February 29.
B Calculated based on average shares outstanding during the period.
C Total distributions of $5.93 per share is comprised of distributions from net investment income of $.963 and distributions from net realized gain of $4.962 per share.
D Total distributions of $.85 per share is comprised of distributions from net investment income of $.831 and distributions from net realized gain of $.014 per share.
E Amount represents less than $.005 per share.
F Total returns for periods of less than one year are not annualized.
G Total returns would have been lower if certain expenses had not been reduced during the applicable periods shown.
H Fees and expenses of any underlying mutual funds or exchange-traded funds (ETFs) are not included in the Fund's expense ratio. The Fund indirectly bears its proportionate share of these expenses. For additional expense information related to investments in Fidelity Central Funds, please refer to the "Investments in Fidelity Central Funds" note found in the Notes to Financial Statements section of the most recent Annual or Semi-Annual report.
I Expense ratios reflect operating expenses of the class. Expenses before reductions do not reflect amounts reimbursed, waived, or reduced through arrangements with the investment advisor, brokerage services, or other offset arrangements, if applicable, and do not represent the amount paid by the class during periods when reimbursements, waivers or reductions occur.
J Annualized
K Amount does not include the portfolio activity of any underlying Fidelity central Funds.
See accompanying notes which are an integral part of the financial statements.
Consumer Finance Portfolio
Investment Summary (Unaudited)
Top Ten Stocks as of August 31, 2020
| | % of fund's net assets |
| MasterCard, Inc. Class A | 9.6 |
| Visa, Inc. Class A | 8.9 |
| AGNC Investment Corp. | 8.4 |
| American Express Co. | 6.7 |
| Capital One Financial Corp. | 5.9 |
| Ally Financial, Inc. | 5.4 |
| Synchrony Financial | 5.2 |
| Discover Financial Services | 4.2 |
| OneMain Holdings, Inc. | 3.9 |
| MGIC Investment Corp. | 3.5 |
| | 61.7 |
Top Industries (% of fund's net assets)
| As of August 31, 2020 |
| | Consumer Finance | 43.6% |
| | IT Services | 24.0% |
| | Mortgage Real Estate Investment Trusts | 15.0% |
| | Thrifts & Mortgage Finance | 13.1% |
| | Banks | 3.3% |
| | All Others* | 1.0% |
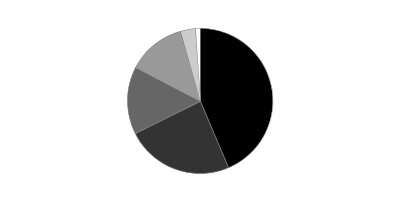
* Includes short-term investments and net other assets (liabilities).
Consumer Finance Portfolio
Schedule of Investments August 31, 2020 (Unaudited)
Showing Percentage of Net Assets
| Common Stocks - 99.5% | | | |
| | | Shares | Value |
| Banks - 3.3% | | | |
| Diversified Banks - 0.5% | | | |
| Wells Fargo & Co. | | 23,100 | $557,865 |
| Regional Banks - 2.8% | | | |
| Huntington Bancshares, Inc. | | 53,400 | 502,494 |
| PNC Financial Services Group, Inc. | | 3,900 | 433,680 |
| Signature Bank | | 21,400 | 2,076,442 |
| | | | 3,012,616 |
|
| TOTAL BANKS | | | 3,570,481 |
|
| Consumer Finance - 43.6% | | | |
| Consumer Finance - 43.6% | | | |
| Ally Financial, Inc. | | 253,300 | 5,795,504 |
| American Express Co. | | 71,000 | 7,212,890 |
| Capital One Financial Corp. | | 91,800 | 6,336,954 |
| Credit Acceptance Corp. (a)(b) | | 9,375 | 3,626,250 |
| Discover Financial Services | | 85,100 | 4,517,108 |
| First Cash Financial Services, Inc. | | 41,211 | 2,462,357 |
| Navient Corp. | | 232,000 | 2,108,880 |
| OneMain Holdings, Inc. | | 141,219 | 4,106,649 |
| Santander Consumer U.S.A. Holdings, Inc. | | 154,800 | 2,664,108 |
| SLM Corp. | | 298,600 | 2,281,304 |
| Synchrony Financial | | 225,500 | 5,594,655 |
| | | | 46,706,659 |
| IT Services - 24.0% | | | |
| Data Processing & Outsourced Services - 24.0% | | | |
| Black Knight, Inc. (a) | | 12,700 | 1,068,070 |
| Fidelity National Information Services, Inc. | | 12,010 | 1,811,709 |
| FleetCor Technologies, Inc. (a) | | 400 | 100,580 |
| Global Payments, Inc. | | 9,969 | 1,760,725 |
| MasterCard, Inc. Class A | | 28,750 | 10,297,961 |
| Network International Holdings PLC (c) | | 32,400 | 162,155 |
| PayPal Holdings, Inc. (a) | | 4,900 | 1,000,286 |
| Repay Holdings Corp. (a) | | 1,200 | 30,360 |
| Visa, Inc. Class A | | 45,036 | 9,547,182 |
| | | | 25,779,028 |
| Mortgage Real Estate Investment Trusts - 15.0% | | | |
| Mortgage REITs - 15.0% | | | |
| AGNC Investment Corp. | | 637,000 | 8,988,070 |
| Annaly Capital Management, Inc. | | 294,215 | 2,162,480 |
| MFA Financial, Inc. | | 429,500 | 1,151,060 |
| New Residential Investment Corp. | | 353,350 | 2,734,929 |
| Redwood Trust, Inc. | | 148,600 | 1,029,798 |
| | | | 16,066,337 |
| Professional Services - 0.5% | | | |
| Research & Consulting Services - 0.5% | | | |
| Dun & Bradstreet Holdings, Inc. (a) | | 3,900 | 98,904 |
| Equifax, Inc. | | 2,900 | 487,983 |
| | | | 586,887 |
| Software - 0.0% | | | |
| Application Software - 0.0% | | | |
| nCino, Inc. (a) | | 200 | 18,590 |
| Thrifts & Mortgage Finance - 13.1% | | | |
| Thrifts & Mortgage Finance - 13.1% | | | |
| Essent Group Ltd. | | 21,500 | 767,550 |
| MGIC Investment Corp. | | 411,728 | 3,775,546 |
| NMI Holdings, Inc. (a) | | 19,800 | 339,570 |
| Pennymac Financial Services, Inc. | | 64,100 | 3,379,352 |
| Radian Group, Inc. | | 5,065 | 78,204 |
| TFS Financial Corp. | | 143,000 | 2,209,350 |
| Washington Federal, Inc. | | 80,700 | 1,892,415 |
| WSFS Financial Corp. | | 53,300 | 1,561,690 |
| | | | 14,003,677 |
| TOTAL COMMON STOCKS | | | |
| (Cost $93,353,954) | | | 106,731,659 |
|
| Money Market Funds - 3.2% | | | |
| Fidelity Cash Central Fund 0.12% (d) | | 158,709 | 158,740 |
| Fidelity Securities Lending Cash Central Fund 0.11% (d)(e) | | 3,234,894 | 3,235,218 |
| TOTAL MONEY MARKET FUNDS | | | |
| (Cost $3,393,958) | | | 3,393,958 |
| TOTAL INVESTMENT IN SECURITIES - 102.7% | | | |
| (Cost $96,747,912) | | | 110,125,617 |
| NET OTHER ASSETS (LIABILITIES) - (2.7)% | | | (2,894,977) |
| NET ASSETS - 100% | | | $107,230,640 |
Legend
(a) Non-income producing
(b) Security or a portion of the security is on loan at period end.
(c) Security exempt from registration under Rule 144A of the Securities Act of 1933. These securities may be resold in transactions exempt from registration, normally to qualified institutional buyers. At the end of the period, the value of these securities amounted to $162,155 or 0.2% of net assets.
(d) Affiliated fund that is generally available only to investment companies and other accounts managed by Fidelity Investments. The rate quoted is the annualized seven-day yield of the fund at period end. A complete unaudited listing of the fund's holdings as of its most recent quarter end is available upon request. In addition, each Fidelity Central Fund's financial statements are available on the SEC's website or upon request.
(e) Investment made with cash collateral received from securities on loan.
Affiliated Central Funds
Information regarding fiscal year to date income earned by the Fund from investments in Fidelity Central Funds is as follows:
| Fund | Income earned |
| Fidelity Cash Central Fund | $1,401 |
| Fidelity Securities Lending Cash Central Fund | 8,270 |
| Total | $9,671 |
Amounts in the income column in the above table include any capital gain distributions from underlying funds, which are presented in the corresponding line-item in the Statement of Operations, if applicable. Amount for Fidelity Securities Lending Cash Central Fund represents the income earned on investing cash collateral, less rebates paid to borrowers and any lending agent fees associated with the loan, plus any premium payments received for lending certain types of securities.
Investment Valuation
The following is a summary of the inputs used, as of August 31, 2020, involving the Fund's assets and liabilities carried at fair value. The inputs or methodology used for valuing securities may not be an indication of the risk associated with investing in those securities. For more information on valuation inputs, and their aggregation into the levels used below, please refer to the Investment Valuation section in the accompanying Notes to Financial Statements.
| | Valuation Inputs at Reporting Date: |
| Description | Total | Level 1 | Level 2 | Level 3 |
| Investments in Securities: | | | | |
| Common Stocks | $106,731,659 | $106,731,659 | $-- | $-- |
| Money Market Funds | 3,393,958 | 3,393,958 | -- | -- |
| Total Investments in Securities: | $110,125,617 | $110,125,617 | $-- | $-- |
See accompanying notes which are an integral part of the financial statements.
Consumer Finance Portfolio
Financial Statements
Statement of Assets and Liabilities
| | | August 31, 2020 (Unaudited) |
| Assets | | |
Investment in securities, at value (including securities loaned of $2,668,920) — See accompanying schedule:
Unaffiliated issuers (cost $93,353,954) | $106,731,659 | |
| Fidelity Central Funds (cost $3,393,958) | 3,393,958 | |
| Total Investment in Securities (cost $96,747,912) | | $110,125,617 |
| Receivable for investments sold | | 749,145 |
| Receivable for fund shares sold | | 101,078 |
| Dividends receivable | | 137,747 |
| Distributions receivable from Fidelity Central Funds | | 2,884 |
| Prepaid expenses | | 818 |
| Other receivables | | 2,019 |
| Total assets | | 111,119,308 |
| Liabilities | | |
| Payable for investments purchased | $269,037 | |
| Payable for fund shares redeemed | 293,533 | |
| Accrued management fee | 47,697 | |
| Other affiliated payables | 27,229 | |
| Other payables and accrued expenses | 16,797 | |
| Collateral on securities loaned | 3,234,375 | |
| Total liabilities | | 3,888,668 |
| Net Assets | | $107,230,640 |
| Net Assets consist of: | | |
| Paid in capital | | $101,367,933 |
| Total accumulated earnings (loss) | | 5,862,707 |
| Net Assets | | $107,230,640 |
| Net Asset Value, offering price and redemption price per share ($107,230,640 ÷ 7,584,924 shares) | | $14.14 |
See accompanying notes which are an integral part of the financial statements.
Statement of Operations
| | | Six months ended August 31, 2020 (Unaudited) |
| Investment Income | | |
| Dividends | | $1,835,076 |
| Income from Fidelity Central Funds (including $8,270 from security lending) | | 9,671 |
| Total income | | 1,844,747 |
| Expenses | | |
| Management fee | $282,756 | |
| Transfer agent fees | 145,433 | |
| Accounting fees | 20,675 | |
| Custodian fees and expenses | 2,635 | |
| Independent trustees' fees and expenses | 390 | |
| Registration fees | 22,528 | |
| Audit | 17,791 | |
| Legal | 1,360 | |
| Miscellaneous | 4,313 | |
| Total expenses before reductions | 497,881 | |
| Expense reductions | (5,451) | |
| Total expenses after reductions | | 492,430 |
| Net investment income (loss) | | 1,352,317 |
| Realized and Unrealized Gain (Loss) | | |
| Net realized gain (loss) on: | | |
| Investment securities: | | |
| Unaffiliated issuers | (8,269,739) | |
| Fidelity Central Funds | 755 | |
| Foreign currency transactions | 82 | |
| Total net realized gain (loss) | | (8,268,902) |
| Change in net unrealized appreciation (depreciation) on investment securities | | (13,118,076) |
| Net gain (loss) | | (21,386,978) |
| Net increase (decrease) in net assets resulting from operations | | $(20,034,661) |
See accompanying notes which are an integral part of the financial statements.
Statement of Changes in Net Assets
| | Six months ended August 31, 2020 (Unaudited) | Year ended February 29, 2020 |
| Increase (Decrease) in Net Assets | | |
| Operations | | |
| Net investment income (loss) | $1,352,317 | $3,451,870 |
| Net realized gain (loss) | (8,268,902) | (62,773) |
| Change in net unrealized appreciation (depreciation) | (13,118,076) | 782,674 |
| Net increase (decrease) in net assets resulting from operations | (20,034,661) | 4,171,771 |
| Distributions to shareholders | (455,155) | (2,870,396) |
| Share transactions | | |
| Proceeds from sales of shares | 29,196,351 | 141,915,304 |
| Reinvestment of distributions | 436,752 | 2,749,682 |
| Cost of shares redeemed | (50,159,980) | (100,053,055) |
| Net increase (decrease) in net assets resulting from share transactions | (20,526,877) | 44,611,931 |
| Total increase (decrease) in net assets | (41,016,693) | 45,913,306 |
| Net Assets | | |
| Beginning of period | 148,247,333 | 102,334,027 |
| End of period | $107,230,640 | $148,247,333 |
| Other Information | | |
| Shares | | |
| Sold | 2,425,832 | 8,358,702 |
| Issued in reinvestment of distributions | 39,597 | 154,483 |
| Redeemed | (4,013,270) | (5,856,956) |
| Net increase (decrease) | (1,547,841) | 2,656,229 |
See accompanying notes which are an integral part of the financial statements.
Financial Highlights
Consumer Finance Portfolio
| | Six months ended (Unaudited) August 31, | Years endedFebruary 28, | | | | |
| | 2020 | 2020 A | 2019 | 2018 | 2017 | 2016 A |
| Selected Per–Share Data | | | | | | |
| Net asset value, beginning of period | $16.23 | $15.80 | $16.29 | $14.02 | $10.94 | $14.01 |
| Income from Investment Operations | | | | | | |
| Net investment income (loss)B | .16 | .39 | .24 | .20 | .21 | .20 |
| Net realized and unrealized gain (loss) | (2.20) | .35 | .43 | 2.33C | 3.38 | (1.99) |
| Total from investment operations | (2.04) | .74 | .67 | 2.53 | 3.59 | (1.79) |
| Distributions from net investment income | (.05) | (.31) | (.20) | (.26) | (.23) | (.20) |
| Distributions from net realized gain | – | (.01) | (.95) | – | (.28) | (1.08) |
| Total distributions | (.05) | (.31)D | (1.16)E | (.26) | (.51) | (1.28) |
| Redemption fees added to paid in capitalB | – | – | – | –F | –F | –F |
| Net asset value, end of period | $14.14 | $16.23 | $15.80 | $16.29 | $14.02 | $10.94 |
| Total ReturnG,H | (12.47)% | 4.54% | 4.83% | 18.07%C | 33.57% | (14.01)% |
| Ratios to Average Net AssetsI,J | | | | | | |
| Expenses before reductions | .93%K | .86% | .87% | .90% | .94% | .90% |
| Expenses net of fee waivers, if any | .93%K | .86% | .87% | .89% | .94% | .89% |
| Expenses net of all reductions | .92%K | .85% | .86% | .89% | .93% | .89% |
| Net investment income (loss) | 2.54%K | 2.29% | 1.57% | 1.38% | 1.72% | 1.53% |
| Supplemental Data | | | | | | |
| Net assets, end of period (000 omitted) | $107,231 | $148,247 | $102,334 | $104,105 | $101,823 | $86,643 |
| Portfolio turnover rateL | 15%K | 20% | 32% | 81% | 44% | 48% |
A For the year ended February 29.
B Calculated based on average shares outstanding during the period.
C Net realized and unrealized gain (loss) per share reflects proceeds from litigation which amounted to $.28 per share. Excluding these litigation proceeds, the total return would have been 16.18%.
D Total distributions of $.31 per share is comprised of distributions from net investment income of $.306 and distributions from net realized gain of $.008 per share.
E Total distributions of $1.16 per share is comprised of distributions from net investment income of $.201 and distributions from net realized gain of $.954 per share.
F Amount represents less than $.005 per share.
G Total returns for periods of less than one year are not annualized.
H Total returns would have been lower if certain expenses had not been reduced during the applicable periods shown.
I Fees and expenses of any underlying mutual funds or exchange-traded funds (ETFs) are not included in the Fund's expense ratio. The Fund indirectly bears its proportionate share of these expenses. For additional expense information related to investments in Fidelity Central Funds, please refer to the "Investments in Fidelity Central Funds" note found in the Notes to Financial Statements section of the most recent Annual or Semi-Annual report.
J Expense ratios reflect operating expenses of the class. Expenses before reductions do not reflect amounts reimbursed, waived, or reduced through arrangements with the investment advisor, brokerage services, or other offset arrangements, if applicable, and do not represent the amount paid by the class during periods when reimbursements, waivers or reductions occur.
K Annualized
L Amount does not include the portfolio activity of any underlying Fidelity Central Funds.
See accompanying notes which are an integral part of the financial statements.
Financial Services Portfolio
Investment Summary (Unaudited)
Top Ten Stocks as of August 31, 2020
| | % of fund's net assets |
| Citigroup, Inc. | 6.3 |
| Bank of America Corp. | 6.0 |
| Morgan Stanley | 5.8 |
| The Travelers Companies, Inc. | 5.4 |
| Wells Fargo & Co. | 4.9 |
| Capital One Financial Corp. | 3.4 |
| U.S. Bancorp | 2.7 |
| Arthur J. Gallagher & Co. | 2.6 |
| Truist Financial Corp. | 2.6 |
| American International Group, Inc. | 2.3 |
| | 42.0 |
Top Industries (% of fund's net assets)
| As of August 31, 2020 |
| | Banks | 33.6% |
| | Insurance | 23.0% |
| | Capital Markets | 21.3% |
| | Consumer Finance | 6.9% |
| | Thrifts & Mortgage Finance | 4.4% |
| | All Others* | 10.8% |
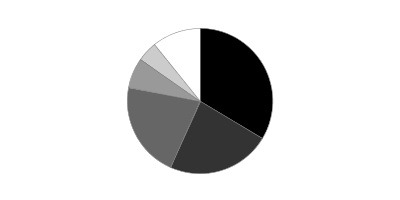
* Includes short-term investments and net other assets (liabilities).
Financial Services Portfolio
Schedule of Investments August 31, 2020 (Unaudited)
Showing Percentage of Net Assets
| Common Stocks - 99.7% | | | |
| | | Shares | Value |
| Banks - 33.6% | | | |
| Diversified Banks - 19.9% | | | |
| Bank of America Corp. | | 958,300 | $24,666,642 |
| Citigroup, Inc. | | 512,000 | 26,173,438 |
| U.S. Bancorp | | 309,300 | 11,258,520 |
| Wells Fargo & Co. | | 847,890 | 20,476,544 |
| | | | 82,575,144 |
| Regional Banks - 13.7% | | | |
| Ameris Bancorp | | 72,800 | 1,785,056 |
| Bank OZK | | 147,000 | 3,386,880 |
| BOK Financial Corp. | | 28,500 | 1,599,990 |
| Cadence Bancorp Class A | | 250,700 | 2,381,650 |
| East West Bancorp, Inc. | | 61,000 | 2,243,580 |
| First Horizon National Corp. | | 477,100 | 4,556,305 |
| First Interstate Bancsystem, Inc. | | 94,100 | 3,086,480 |
| Great Western Bancorp, Inc. | | 79,100 | 1,101,863 |
| Huntington Bancshares, Inc. | | 644,600 | 6,065,686 |
| KeyCorp | | 258,300 | 3,182,256 |
| M&T Bank Corp. | | 43,800 | 4,522,788 |
| Regions Financial Corp. | | 89,900 | 1,039,244 |
| Signature Bank | | 30,700 | 2,978,821 |
| Truist Financial Corp. | | 273,318 | 10,607,472 |
| WesBanco, Inc. | | 109,300 | 2,428,646 |
| Wintrust Financial Corp. | | 90,700 | 3,947,264 |
| Zions Bancorp NA | | 49,100 | 1,579,056 |
| | | | 56,493,037 |
|
| TOTAL BANKS | | | 139,068,181 |
|
| Capital Markets - 21.3% | | | |
| Asset Management & Custody Banks - 9.0% | | | |
| Affiliated Managers Group, Inc. | | 58,500 | 4,016,025 |
| AllianceBernstein Holding LP | | 211,273 | 6,019,168 |
| Bank of New York Mellon Corp. | | 210,200 | 7,773,196 |
| Brookfield Asset Management, Inc. Class A | | 204,500 | 6,899,830 |
| Northern Trust Corp. | | 58,300 | 4,774,187 |
| State Street Corp. | | 112,700 | 7,673,743 |
| | | | 37,156,149 |
| Financial Exchanges & Data - 2.3% | | | |
| Cboe Global Markets, Inc. | | 105,200 | 9,656,308 |
| Investment Banking & Brokerage - 10.0% | | | |
| Goldman Sachs Group, Inc. | | 34,500 | 7,068,015 |
| Morgan Stanley | | 460,700 | 24,076,182 |
| Raymond James Financial, Inc. | | 63,600 | 4,815,792 |
| Virtu Financial, Inc. Class A | | 220,400 | 5,692,932 |
| | | | 41,652,921 |
|
| TOTAL CAPITAL MARKETS | | | 88,465,378 |
|
| Consumer Finance - 6.9% | | | |
| Consumer Finance - 6.9% | | | |
| Capital One Financial Corp. | | 203,700 | 14,061,411 |
| Discover Financial Services | | 105,800 | 5,615,864 |
| OneMain Holdings, Inc. | | 151,400 | 4,402,712 |
| SLM Corp. | | 579,500 | 4,427,380 |
| | | | 28,507,367 |
| Diversified Financial Services - 3.1% | | | |
| Multi-Sector Holdings - 3.1% | | | |
| Berkshire Hathaway, Inc. Class B (a) | | 31,600 | 6,890,064 |
| Cannae Holdings, Inc. (a) | | 155,290 | 5,859,092 |
| | | | 12,749,156 |
| Insurance - 23.0% | | | |
| Insurance Brokers - 4.9% | | | |
| Arthur J. Gallagher & Co. | | 101,100 | 10,645,830 |
| Willis Towers Watson PLC | | 47,269 | 9,715,198 |
| | | | 20,361,028 |
| Life & Health Insurance - 3.5% | | | |
| CNO Financial Group, Inc. (b) | | 278,400 | 4,537,920 |
| MetLife, Inc. | | 169,900 | 6,534,354 |
| Primerica, Inc. | | 26,800 | 3,345,980 |
| | | | 14,418,254 |
| Multi-Line Insurance - 5.1% | | | |
| American International Group, Inc. | | 337,800 | 9,843,492 |
| Assurant, Inc. | | 53,900 | 6,552,084 |
| Hartford Financial Services Group, Inc. | | 125,000 | 5,056,250 |
| | | | 21,451,826 |
| Property & Casualty Insurance - 9.5% | | | |
| Allstate Corp. | | 74,200 | 6,900,600 |
| First American Financial Corp. | | 109,700 | 5,766,929 |
| Old Republic International Corp. | | 260,800 | 4,201,488 |
| The Travelers Companies, Inc. | | 193,600 | 22,465,344 |
| | | | 39,334,361 |
|
| TOTAL INSURANCE | | | 95,565,469 |
|
| IT Services - 3.5% | | | |
| Data Processing & Outsourced Services - 3.5% | | | |
| Black Knight, Inc. (a) | | 32,800 | 2,758,480 |
| Computer Services, Inc. | | 38,681 | 2,340,201 |
| Fidelity National Information Services, Inc. | | 31,000 | 4,676,350 |
| Visa, Inc. Class A | | 23,300 | 4,939,367 |
| | | | 14,714,398 |
| Mortgage Real Estate Investment Trusts - 2.3% | | | |
| Mortgage REITs - 2.3% | | | |
| AGNC Investment Corp. | | 668,600 | 9,433,946 |
| Professional Services - 1.6% | | | |
| Research & Consulting Services - 1.6% | | | |
| Dun & Bradstreet Holdings, Inc. (a) | | 14,800 | 375,328 |
| Equifax, Inc. | | 36,700 | 6,175,509 |
| | | | 6,550,837 |
| Thrifts & Mortgage Finance - 4.4% | | | |
| Thrifts & Mortgage Finance - 4.4% | | | |
| Essent Group Ltd. | | 230,000 | 8,211,000 |
| MGIC Investment Corp. | | 622,500 | 5,708,325 |
| NMI Holdings, Inc. (a) | | 248,700 | 4,265,205 |
| | | | 18,184,530 |
| TOTAL COMMON STOCKS | | | |
| (Cost $418,630,748) | | | 413,239,262 |
|
| Money Market Funds - 0.3% | | | |
| Fidelity Cash Central Fund 0.12% (c) | | 630,066 | 630,192 |
| Fidelity Securities Lending Cash Central Fund 0.11% (c)(d) | | 476,241 | 476,289 |
| TOTAL MONEY MARKET FUNDS | | | |
| (Cost $1,106,481) | | | 1,106,481 |
| TOTAL INVESTMENT IN SECURITIES - 100.0% | | | |
| (Cost $419,737,229) | | | 414,345,743 |
| NET OTHER ASSETS (LIABILITIES) - 0.0% | | | (57,922) |
| NET ASSETS - 100% | | | $414,287,821 |
Legend
(a) Non-income producing
(b) Security or a portion of the security is on loan at period end.
(c) Affiliated fund that is generally available only to investment companies and other accounts managed by Fidelity Investments. The rate quoted is the annualized seven-day yield of the fund at period end. A complete unaudited listing of the fund's holdings as of its most recent quarter end is available upon request. In addition, each Fidelity Central Fund's financial statements are available on the SEC's website or upon request.
(d) Investment made with cash collateral received from securities on loan.
Affiliated Central Funds
Information regarding fiscal year to date income earned by the Fund from investments in Fidelity Central Funds is as follows:
| Fund | Income earned |
| Fidelity Cash Central Fund | $1,924 |
| Fidelity Securities Lending Cash Central Fund | 1,806 |
| Total | $3,730 |
Amounts in the income column in the above table include any capital gain distributions from underlying funds, which are presented in the corresponding line-item in the Statement of Operations, if applicable. Amount for Fidelity Securities Lending Cash Central Fund represents the income earned on investing cash collateral, less rebates paid to borrowers and any lending agent fees associated with the loan, plus any premium payments received for lending certain types of securities.
Investment Valuation
The following is a summary of the inputs used, as of August 31, 2020, involving the Fund's assets and liabilities carried at fair value. The inputs or methodology used for valuing securities may not be an indication of the risk associated with investing in those securities. For more information on valuation inputs, and their aggregation into the levels used below, please refer to the Investment Valuation section in the accompanying Notes to Financial Statements.
| | Valuation Inputs at Reporting Date: |
| Description | Total | Level 1 | Level 2 | Level 3 |
| Investments in Securities: | | | | |
| Common Stocks | $413,239,262 | $413,239,262 | $-- | $-- |
| Money Market Funds | 1,106,481 | 1,106,481 | -- | -- |
| Total Investments in Securities: | $414,345,743 | $414,345,743 | $-- | $-- |
See accompanying notes which are an integral part of the financial statements.
Financial Services Portfolio
Financial Statements
Statement of Assets and Liabilities
| | | August 31, 2020 (Unaudited) |
| Assets | | |
Investment in securities, at value (including securities loaned of $450,271) — See accompanying schedule:
Unaffiliated issuers (cost $418,630,748) | $413,239,262 | |
| Fidelity Central Funds (cost $1,106,481) | 1,106,481 | |
| Total Investment in Securities (cost $419,737,229) | | $414,345,743 |
| Receivable for investments sold | | 838,470 |
| Receivable for fund shares sold | | 636,400 |
| Dividends receivable | | 868,553 |
| Distributions receivable from Fidelity Central Funds | | 286 |
| Prepaid expenses | | 8,194 |
| Other receivables | | 12,000 |
| Total assets | | 416,709,646 |
| Liabilities | | |
| Payable for fund shares redeemed | $1,665,050 | |
| Accrued management fee | 184,284 | |
| Other affiliated payables | 77,431 | |
| Other payables and accrued expenses | 18,546 | |
| Collateral on securities loaned | 476,514 | |
| Total liabilities | | 2,421,825 |
| Net Assets | | $414,287,821 |
| Net Assets consist of: | | |
| Paid in capital | | $428,130,891 |
| Total accumulated earnings (loss) | | (13,843,070) |
| Net Assets | | $414,287,821 |
| Net Asset Value, offering price and redemption price per share ($414,287,821 ÷ 50,261,076 shares) | | $8.24 |
See accompanying notes which are an integral part of the financial statements.
Statement of Operations
| | | Six months ended August 31, 2020 (Unaudited) |
| Investment Income | | |
| Dividends | | $6,720,794 |
| Income from Fidelity Central Funds (including $1,806 from security lending) | | 3,730 |
| Total income | | 6,724,524 |
| Expenses | | |
| Management fee | $1,043,609 | |
| Transfer agent fees | 380,375 | |
| Accounting fees | 76,352 | |
| Custodian fees and expenses | 5,315 | |
| Independent trustees' fees and expenses | 1,373 | |
| Registration fees | 25,005 | |
| Audit | 20,586 | |
| Legal | 966 | |
| Miscellaneous | 9,648 | |
| Total expenses before reductions | 1,563,229 | |
| Expense reductions | (25,559) | |
| Total expenses after reductions | | 1,537,670 |
| Net investment income (loss) | | 5,186,854 |
| Realized and Unrealized Gain (Loss) | | |
| Net realized gain (loss) on: | | |
| Investment securities: | | |
| Unaffiliated issuers | (13,182,767) | |
| Fidelity Central Funds | (467) | |
| Foreign currency transactions | (18,992) | |
| Total net realized gain (loss) | | (13,202,226) |
| Change in net unrealized appreciation (depreciation) on: | | |
| Investment securities: | | |
| Unaffiliated issuers | (34,673,813) | |
| Assets and liabilities in foreign currencies | (15) | |
| Total change in net unrealized appreciation (depreciation) | | (34,673,828) |
| Net gain (loss) | | (47,876,054) |
| Net increase (decrease) in net assets resulting from operations | | $(42,689,200) |
See accompanying notes which are an integral part of the financial statements.
Statement of Changes in Net Assets
| | Six months ended August 31, 2020 (Unaudited) | Year ended February 29, 2020 |
| Increase (Decrease) in Net Assets | | |
| Operations | | |
| Net investment income (loss) | $5,186,854 | $9,837,410 |
| Net realized gain (loss) | (13,202,226) | 50,080,923 |
| Change in net unrealized appreciation (depreciation) | (34,673,828) | (38,602,945) |
| Net increase (decrease) in net assets resulting from operations | (42,689,200) | 21,315,388 |
| Distributions to shareholders | (20,868,602) | (30,387,187) |
| Share transactions | | |
| Proceeds from sales of shares | 90,824,161 | 94,490,608 |
| Reinvestment of distributions | 19,783,647 | 28,305,777 |
| Cost of shares redeemed | (116,098,846) | (188,816,638) |
| Net increase (decrease) in net assets resulting from share transactions | (5,491,038) | (66,020,253) |
| Total increase (decrease) in net assets | (69,048,840) | (75,092,052) |
| Net Assets | | |
| Beginning of period | 483,336,661 | 558,428,713 |
| End of period | $414,287,821 | $483,336,661 |
| Other Information | | |
| Shares | | |
| Sold | 11,762,224 | 8,971,280 |
| Issued in reinvestment of distributions | 2,770,819 | 2,601,634 |
| Redeemed | (15,200,873) | (18,497,880) |
| Net increase (decrease) | (667,830) | (6,924,966) |
See accompanying notes which are an integral part of the financial statements.
Financial Highlights
Financial Services Portfolio
| | Six months ended (Unaudited) August 31, | Years endedFebruary 28, | | | | |
| | 2020 | 2020 A | 2019 B | 2018 B | 2017 B | 2016 A,B |
| Selected Per–Share Data | | | | | | |
| Net asset value, beginning of period | $9.49 | $9.65 | $11.67 | $10.31 | $7.50 | $8.88 |
| Income from Investment Operations | | | | | | |
| Net investment income (loss)C | .10 | .19 | .14 | .09 | .10 | .09 |
| Net realized and unrealized gain (loss) | (.92) | .26 | (1.04) | 1.76 | 2.81 | (1.33) |
| Total from investment operations | (.82) | .45 | (.90) | 1.85 | 2.91 | (1.24) |
| Distributions from net investment income | (.04) | (.16) | (.14) | (.07) | (.10) | (.08) |
| Distributions from net realized gain | (.39) | (.45) | (.98) | (.42) | – | (.06) |
| Total distributions | (.43) | (.61) | (1.12) | (.49) | (.10) | (.14) |
| Redemption fees added to paid in capitalC | – | – | – | – | –D | –D |
| Net asset value, end of period | $8.24 | $9.49 | $9.65 | $11.67 | $10.31 | $7.50 |
| Total ReturnE,F | (7.99)% | 3.81% | (6.91)% | 18.33% | 38.78% | (14.18)% |
| Ratios to Average Net AssetsG,H | | | | | | |
| Expenses before reductions | .79%I | .77% | .76% | .77% | .77% | .76% |
| Expenses net of fee waivers, if any | .79%I | .77% | .76% | .77% | .77% | .76% |
| Expenses net of all reductions | .78%I | .76% | .75% | .76% | .76% | .75% |
| Net investment income (loss) | 2.64%I | 1.81% | 1.28% | .87% | 1.10% | 1.01% |
| Supplemental Data | | | | | | |
| Net assets, end of period (000 omitted) | $414,288 | $483,337 | $558,429 | $1,308,254 | $1,019,656 | $1,043,574 |
| Portfolio turnover rateJ | 68%I | 61%K | 49%K | 54% | 84%K | 55% |
A For the year ended February 29.
B Per share amounts have been adjusted to reflect the impact of the 10 for 1 share split that occurred on August 10, 2018.
C Calculated based on average shares outstanding during the period.
D Amount represents less than $.005 per share.
E Total returns for periods of less than one year are not annualized.
F Total returns would have been lower if certain expenses had not been reduced during the applicable periods shown.
G Fees and expenses of any underlying mutual funds or exchange-traded funds (ETFs) are not included in the Fund's expense ratio. The Fund indirectly bears its proportionate share of these expenses. For additional expense information related to investments in Fidelity Central Funds, please refer to the "Investments in Fidelity Central Funds" note found in the Notes to Financial Statements section of the most recent Annual or Semi-Annual report.
H Expense ratios reflect operating expenses of the class. Expenses before reductions do not reflect amounts reimbursed, waived, or reduced through arrangements with the investment advisor, brokerage services, or other offset arrangements, if applicable, and do not represent the amount paid by the class during periods when reimbursements, waivers or reductions occur.
I Annualized
J Amount does not include the portfolio activity of any underlying Fidelity Central Funds.
K Portfolio turnover rate excludes securities received or delivered in-kind.
See accompanying notes which are an integral part of the financial statements.
Insurance Portfolio
Investment Summary (Unaudited)
Top Ten Stocks as of August 31, 2020
| | % of fund's net assets |
| The Travelers Companies, Inc. | 10.1 |
| Chubb Ltd. | 9.2 |
| Marsh & McLennan Companies, Inc. | 8.2 |
| Berkshire Hathaway, Inc. Class B | 6.2 |
| American International Group, Inc. | 5.6 |
| Allstate Corp. | 4.9 |
| Progressive Corp. | 4.7 |
| Aon PLC | 4.6 |
| MetLife, Inc. | 4.5 |
| Willis Towers Watson PLC | 4.4 |
| | 62.4 |
Top Industries (% of fund's net assets)
| As of August 31, 2020 |
| | Insurance | 86.0% |
| | Diversified Financial Services | 8.5% |
| | Capital Markets | 4.2% |
| | IT Services | 0.8% |
| | Consumer Finance | 0.4% |
| | All Others* | 0.1% |

* Includes short-term investments and net other assets (liabilities).
Insurance Portfolio
Schedule of Investments August 31, 2020 (Unaudited)
Showing Percentage of Net Assets
| Common Stocks - 99.8% | | | |
| | | Shares | Value |
| Capital Markets - 4.2% | | | |
| Asset Management & Custody Banks - 4.2% | | | |
| Apollo Global Management LLC Class A | | 51,344 | $2,406,493 |
| Ares Management Corp. | | 101,314 | 4,098,151 |
| BlackRock, Inc. Class A | | 1,300 | 772,447 |
| | | | 7,277,091 |
| Consumer Finance - 0.4% | | | |
| Consumer Finance - 0.4% | | | |
| OneMain Holdings, Inc. | | 21,800 | 633,944 |
| Diversified Financial Services - 8.5% | | | |
| Multi-Sector Holdings - 6.5% | | | |
| Berkshire Hathaway, Inc. Class B (a) | | 49,000 | 10,683,960 |
| Cannae Holdings, Inc. (a) | | 15,399 | 581,004 |
| | | | 11,264,964 |
| Other Diversified Financial Services - 2.0% | | | |
| Voya Financial, Inc. | | 64,600 | 3,353,386 |
|
| TOTAL DIVERSIFIED FINANCIAL SERVICES | | | 14,618,350 |
|
| Insurance - 85.9% | | | |
| Insurance Brokers - 24.3% | | | |
| Aon PLC | | 39,700 | 7,939,603 |
| Arthur J. Gallagher & Co. | | 70,300 | 7,402,590 |
| Brown & Brown, Inc. | | 105,300 | 4,885,920 |
| Marsh & McLennan Companies, Inc. | | 122,200 | 14,042,002 |
| Willis Towers Watson PLC | | 36,928 | 7,589,812 |
| | | | 41,859,927 |
| Life & Health Insurance - 15.4% | | | |
| AFLAC, Inc. | | 56,400 | 2,048,448 |
| Athene Holding Ltd. (a) | | 17,400 | 636,144 |
| CNO Financial Group, Inc. | | 167,700 | 2,733,510 |
| Globe Life, Inc. | | 11,200 | 923,776 |
| MetLife, Inc. | | 200,575 | 7,714,115 |
| Primerica, Inc. | | 25,100 | 3,133,735 |
| Principal Financial Group, Inc. | | 72,300 | 3,044,553 |
| Prudential Financial, Inc. | | 56,089 | 3,801,152 |
| Prudential PLC | | 35,800 | 577,145 |
| Unum Group | | 105,161 | 1,943,375 |
| | | | 26,555,953 |
| Multi-Line Insurance - 9.2% | | | |
| American International Group, Inc. | | 331,850 | 9,670,109 |
| Assurant, Inc. | | 17,600 | 2,139,456 |
| China Pacific Insurance (Group) Co. Ltd. (H Shares) | | 169,600 | 470,483 |
| Hartford Financial Services Group, Inc. | | 68,600 | 2,774,870 |
| Zurich Insurance Group Ltd. | | 2,206 | 815,663 |
| | | | 15,870,581 |
| Property & Casualty Insurance - 36.6% | | | |
| Allstate Corp. | | 91,400 | 8,500,200 |
| Arch Capital Group Ltd. (a) | | 116,700 | 3,680,718 |
| Assured Guaranty Ltd. | | 66,600 | 1,428,570 |
| Chubb Ltd. | | 127,205 | 15,900,625 |
| First American Financial Corp. | | 38,700 | 2,034,459 |
| FNF Group | | 63,400 | 2,081,422 |
| Loews Corp. | | 58,500 | 2,097,810 |
| Markel Corp. (a) | | 1,820 | 1,978,031 |
| Mercury General Corp. | | 200 | 8,946 |
| Progressive Corp. | | 84,600 | 8,040,384 |
| The Travelers Companies, Inc. | | 149,600 | 17,359,585 |
| | | | 63,110,750 |
| Reinsurance - 0.4% | | | |
| Everest Re Group Ltd. | | 3,300 | 726,264 |
| Maiden Holdings Ltd. (a) | | 400 | 508 |
| | | | 726,772 |
|
| TOTAL INSURANCE | | | 148,123,983 |
|
| IT Services - 0.8% | | | |
| Data Processing & Outsourced Services - 0.8% | | | |
| Black Knight, Inc. (a) | | 17,757 | 1,493,364 |
| TOTAL COMMON STOCKS | | | |
| (Cost $105,185,642) | | | 172,146,732 |
|
| Nonconvertible Preferred Stocks - 0.1% | | | |
| Insurance - 0.1% | | | |
| Life & Health Insurance - 0.1% | | | |
| Globe Life, Inc. 6.125% | | | |
| (Cost $73,591) | | 2,959 | 82,171 |
|
| Money Market Funds - 0.4% | | | |
| Fidelity Cash Central Fund 0.12% (b) | | | |
| (Cost $675,207) | | 675,072 | 675,207 |
| TOTAL INVESTMENT IN SECURITIES - 100.3% | | | |
| (Cost $105,934,440) | | | 172,904,110 |
| NET OTHER ASSETS (LIABILITIES) - (0.3)% | | | (461,571) |
| NET ASSETS - 100% | | | $172,442,539 |
Legend
(a) Non-income producing
(b) Affiliated fund that is generally available only to investment companies and other accounts managed by Fidelity Investments. The rate quoted is the annualized seven-day yield of the fund at period end. A complete unaudited listing of the fund's holdings as of its most recent quarter end is available upon request. In addition, each Fidelity Central Fund's financial statements are available on the SEC's website or upon request.
Affiliated Central Funds
Information regarding fiscal year to date income earned by the Fund from investments in Fidelity Central Funds is as follows:
| Fund | Income earned |
| Fidelity Cash Central Fund | $705 |
| Fidelity Securities Lending Cash Central Fund | 448 |
| Total | $1,153 |
Amounts in the income column in the above table include any capital gain distributions from underlying funds, which are presented in the corresponding line-item in the Statement of Operations, if applicable. Amount for Fidelity Securities Lending Cash Central Fund represents the income earned on investing cash collateral, less rebates paid to borrowers and any lending agent fees associated with the loan, plus any premium payments received for lending certain types of securities.
Investment Valuation
The following is a summary of the inputs used, as of August 31, 2020, involving the Fund's assets and liabilities carried at fair value. The inputs or methodology used for valuing securities may not be an indication of the risk associated with investing in those securities. For more information on valuation inputs, and their aggregation into the levels used below, please refer to the Investment Valuation section in the accompanying Notes to Financial Statements.
| | Valuation Inputs at Reporting Date: |
| Description | Total | Level 1 | Level 2 | Level 3 |
| Investments in Securities: | | | | |
| Common Stocks | $172,146,732 | $170,283,441 | $1,863,291 | $-- |
| Nonconvertible Preferred Stocks | 82,171 | 82,171 | -- | -- |
| Money Market Funds | 675,207 | 675,207 | -- | -- |
| Total Investments in Securities: | $172,904,110 | $171,040,819 | $1,863,291 | $-- |
Other Information
Distribution of investments by country or territory of incorporation, as a percentage of Total Net Assets, is as follows (Unaudited):
| United States of America | 81.4% |
| Switzerland | 9.7% |
| Ireland | 4.6% |
| Bermuda | 3.7% |
| Others (Individually Less Than 1%) | 0.6% |
| | 100.0% |
See accompanying notes which are an integral part of the financial statements.
Insurance Portfolio
Financial Statements
Statement of Assets and Liabilities
| | | August 31, 2020 (Unaudited) |
| Assets | | |
Investment in securities, at value — See accompanying schedule:
Unaffiliated issuers (cost $105,259,233) | $172,228,903 | |
| Fidelity Central Funds (cost $675,207) | 675,207 | |
| Total Investment in Securities (cost $105,934,440) | | $172,904,110 |
| Receivable for fund shares sold | | 122,605 |
| Dividends receivable | | 392,194 |
| Distributions receivable from Fidelity Central Funds | | 100 |
| Prepaid expenses | | 2,281 |
| Other receivables | | 1,946 |
| Total assets | | 173,423,236 |
| Liabilities | | |
| Payable for fund shares redeemed | $847,989 | |
| Accrued management fee | 77,795 | |
| Other affiliated payables | 38,214 | |
| Other payables and accrued expenses | 16,699 | |
| Total liabilities | | 980,697 |
| Net Assets | | $172,442,539 |
| Net Assets consist of: | | |
| Paid in capital | | $100,900,496 |
| Total accumulated earnings (loss) | | 71,542,043 |
| Net Assets | | $172,442,539 |
| Net Asset Value, offering price and redemption price per share ($172,442,539 ÷ 3,271,608 shares) | | $52.71 |
See accompanying notes which are an integral part of the financial statements.
Statement of Operations
| | | Six months ended August 31, 2020 (Unaudited) |
| Investment Income | | |
| Dividends | | $2,247,221 |
| Income from Fidelity Central Funds (including $448 from security lending) | | 1,153 |
| Total income | | 2,248,374 |
| Expenses | | |
| Management fee | $461,036 | |
| Transfer agent fees | 198,938 | |
| Accounting fees | 33,710 | |
| Custodian fees and expenses | 2,129 | |
| Independent trustees' fees and expenses | 618 | |
| Registration fees | 15,605 | |
| Audit | 17,793 | |
| Legal | 155 | |
| Miscellaneous | 5,348 | |
| Total expenses before reductions | 735,332 | |
| Expense reductions | (3,332) | |
| Total expenses after reductions | | 732,000 |
| Net investment income (loss) | | 1,516,374 |
| Realized and Unrealized Gain (Loss) | | |
| Net realized gain (loss) on: | | |
| Investment securities: | | |
| Unaffiliated issuers | 3,578,859 | |
| Fidelity Central Funds | (235) | |
| Foreign currency transactions | 140 | |
| Total net realized gain (loss) | | 3,578,764 |
| Change in net unrealized appreciation (depreciation) on: | | |
| Investment securities: | | |
| Unaffiliated issuers | (18,020,653) | |
| Assets and liabilities in foreign currencies | 3,778 | |
| Total change in net unrealized appreciation (depreciation) | | (18,016,875) |
| Net gain (loss) | | (14,438,111) |
| Net increase (decrease) in net assets resulting from operations | | $(12,921,737) |
See accompanying notes which are an integral part of the financial statements.
Statement of Changes in Net Assets
| | Six months ended August 31, 2020 (Unaudited) | Year ended February 29, 2020 |
| Increase (Decrease) in Net Assets | | |
| Operations | | |
| Net investment income (loss) | $1,516,374 | $3,416,133 |
| Net realized gain (loss) | 3,578,764 | 16,442,918 |
| Change in net unrealized appreciation (depreciation) | (18,016,875) | (7,312,578) |
| Net increase (decrease) in net assets resulting from operations | (12,921,737) | 12,546,473 |
| Distributions to shareholders | (9,329,993) | (16,441,347) |
| Share transactions | | |
| Proceeds from sales of shares | 19,937,519 | 122,036,657 |
| Reinvestment of distributions | 8,855,522 | 15,592,643 |
| Cost of shares redeemed | (53,637,893) | (137,276,331) |
| Net increase (decrease) in net assets resulting from share transactions | (24,844,852) | 352,969 |
| Total increase (decrease) in net assets | (47,096,582) | (3,541,905) |
| Net Assets | | |
| Beginning of period | 219,539,121 | 223,081,026 |
| End of period | $172,442,539 | $219,539,121 |
| Other Information | | |
| Shares | | |
| Sold | 410,261 | 1,926,289 |
| Issued in reinvestment of distributions | 193,479 | 255,136 |
| Redeemed | (1,088,881) | (2,188,784) |
| Net increase (decrease) | (485,141) | (7,359) |
See accompanying notes which are an integral part of the financial statements.
Financial Highlights
Insurance Portfolio
| | Six months ended (Unaudited) August 31, | Years endedFebruary 28, | | | | |
| | 2020 | 2020 A | 2019 | 2018 | 2017 | 2016 A |
| Selected Per–Share Data | | | | | | |
| Net asset value, beginning of period | $58.44 | $59.27 | $78.49 | $80.60 | $63.15 | $66.87 |
| Income from Investment Operations | | | | | | |
| Net investment income (loss)B | .43 | .87 | .98 | 1.08 | .99 | .89 |
| Net realized and unrealized gain (loss) | (3.49) | 2.77 | (2.40) | 6.76 | 18.64 | (2.50) |
| Total from investment operations | (3.06) | 3.64 | (1.42) | 7.84 | 19.63 | (1.61) |
| Distributions from net investment income | (.13) | (.91) | (1.16) | (.96) | (.89) | (.74) |
| Distributions from net realized gain | (2.54) | (3.56) | (16.63) | (8.99) | (1.29) | (1.37) |
| Total distributions | (2.67) | (4.47) | (17.80)C | (9.95) | (2.18) | (2.11) |
| Redemption fees added to paid in capitalB | – | – | – | –D | –D | –D |
| Net asset value, end of period | $52.71 | $58.44 | $59.27 | $78.49 | $80.60 | $63.15 |
| Total ReturnE,F | (4.54)% | 5.95% | (.29)% | 9.62% | 31.60% | (2.54)% |
| Ratios to Average Net AssetsG,H | | | | | | |
| Expenses before reductions | .85%I | .81% | .82% | .79% | .80% | .80% |
| Expenses net of fee waivers, if any | .85%I | .81% | .81% | .79% | .79% | .80% |
| Expenses net of all reductions | .84%I | .80% | .81% | .79% | .79% | .80% |
| Net investment income (loss) | 1.75%I | 1.37% | 1.48% | 1.30% | 1.37% | 1.32% |
| Supplemental Data | | | | | | |
| Net assets, end of period (000 omitted) | $172,443 | $219,539 | $223,081 | $341,743 | $647,787 | $459,854 |
| Portfolio turnover rateJ | 17%I | 28% | 9% | 21% | 16% | 25% |
A For the year ended February 29.
B Calculated based on average shares outstanding during the period.
C Total distributions of $17.80 per share is comprised of distributions from net investment income of $1.162 and distributions from net realized gain of $16.633 per share.
D Amount represents less than $.005 per share.
E Total returns for periods of less than one year are not annualized.
F Total returns would have been lower if certain expenses had not been reduced during the applicable periods shown.
G Fees and expenses of any underlying mutual funds or exchange-traded funds (ETFs) are not included in the Fund's expense ratio. The Fund indirectly bears its proportionate share of these expenses. For additional expense information related to investments in Fidelity Central Funds, please refer to the "Investments in Fidelity Central Funds" note found in the Notes to Financial Statements section of the most recent Annual or Semi-Annual report.
H Expense ratios reflect operating expenses of the class. Expenses before reductions do not reflect amounts reimbursed, waived, or reduced through arrangements with the investment advisor, brokerage services, or other offset arrangements, if applicable, and do not represent the amount paid by the class during periods when reimbursements, waivers or reductions occur.
I Annualized
J Amount does not include the portfolio activity of any underlying Fidelity Central Funds.
See accompanying notes which are an integral part of the financial statements.
Notes to Financial Statements (Unaudited)
For the period ended August 31, 2020
1. Organization.
Banking Portfolio, Brokerage and Investment Management Portfolio, Consumer Finance Portfolio, Financial Services Portfolio, and Insurance Portfolio (the Funds) are non-diversified funds of Fidelity Select Portfolios (the Trust). The Trust is registered under the Investment Company Act of 1940, as amended (the 1940 Act), as an open-end management investment company organized as a Massachusetts business trust. The Funds invest primarily in securities of companies whose principal business activities fall within specific industries. Each Fund is authorized to issue an unlimited number of shares. Share transactions on the Statement of Changes in Net Assets may contain exchanges between affiliated funds.
2. Investments in Fidelity Central Funds.
The Funds invest in Fidelity Central Funds, which are open-end investment companies generally available only to other investment companies and accounts managed by the investment adviser and its affiliates. The Funds' Schedules of Investments list each of the Fidelity Central Funds held as of period end, if any, as an investment of each Fund, but do not include the underlying holdings of each Fidelity Central Fund. As an Investing Fund, each Fund indirectly bears its proportionate share of the expenses of the underlying Fidelity Central Funds.
The Money Market Central Funds seek preservation of capital and current income and are managed by the investment adviser. Annualized expenses of the Money Market Central Funds as of their most recent shareholder report date ranged from less than .005% to .01%.
A complete unaudited list of holdings for each Fidelity Central Fund is available upon request or at the Securities and Exchange Commission (the SEC) website at www.sec.gov. In addition, the financial statements of the Fidelity Central Funds are available on the SEC website or upon request.
3. Significant Accounting Policies.
Each Fund is an investment company and applies the accounting and reporting guidance of the Financial Accounting Standards Board (FASB) Accounting Standards Codification Topic 946 Financial Services – Investment Companies. The financial statements have been prepared in conformity with accounting principles generally accepted in the United States of America (GAAP), which require management to make certain estimates and assumptions at the date of the financial statements. Actual results could differ from those estimates. Subsequent events, if any, through the date that the financial statements were issued have been evaluated in the preparation of the financial statements. The following summarizes the significant accounting policies of the Funds:
Investment Valuation. Investments are valued as of 4:00 p.m. Eastern time on the last calendar day of the period. The Board of Trustees (the Board) has delegated the day to day responsibility for the valuation of each Fund's investments to the Fair Value Committee (the Committee) established by each Fund's investment adviser. In accordance with valuation policies and procedures approved by the Board, each Fund attempts to obtain prices from one or more third party pricing vendors or brokers to value its investments. When current market prices, quotations or currency exchange rates are not readily available or reliable, investments will be fair valued in good faith by the Committee, in accordance with procedures adopted by the Board. Factors used in determining fair value vary by investment type and may include market or investment specific events. The frequency with which these procedures are used cannot be predicted and they may be utilized to a significant extent. The Committee oversees each Fund's valuation policies and procedures and reports to the Board on the Committee's activities and fair value determinations. The Board monitors the appropriateness of the procedures used in valuing each Fund's investments and ratifies the fair value determinations of the Committee.
Each Fund categorizes the inputs to valuation techniques used to value its investments into a disclosure hierarchy consisting of three levels as shown below:
- Level 1 – quoted prices in active markets for identical investments
- Level 2 – other significant observable inputs (including quoted prices for similar investments, interest rates, prepayment speeds, etc.)
- Level 3 – unobservable inputs (including the Fund's own assumptions based on the best information available)
Valuation techniques used to value each Fund's investments by major category are as follows:
Equity securities, including restricted securities, for which market quotations are readily available, are valued at the last reported sale price or official closing price as reported by a third party pricing vendor on the primary market or exchange on which they are traded and are categorized as Level 1 in the hierarchy. In the event there were no sales during the day or closing prices are not available, securities are valued at the last quoted bid price or may be valued using the last available price and are generally categorized as Level 2 in the hierarchy. For foreign equity securities, when market or security specific events arise, comparisons to the valuation of American Depositary Receipts (ADRs), futures contracts, Exchange-Traded Funds (ETFs) and certain indexes as well as quoted prices for similar securities may be used and would be categorized as Level 2 in the hierarchy. For equity securities, including restricted securities, where observable inputs are limited, assumptions about market activity and risk are used and these securities may be categorized as Level 3 in the hierarchy.
Investments in open-end mutual funds, including the Fidelity Central Funds, are valued at their closing net asset value (NAV) each business day and are categorized as Level 1 in the hierarchy.
Changes in valuation techniques may result in transfers in or out of an assigned level within the disclosure hierarchy. The aggregate value of investments by input level as of August 31, 2020 is included at the end of each Fund's Schedule of Investments.
Foreign Currency. Certain Funds may use foreign currency contracts to facilitate transactions in foreign-denominated securities. Gains and losses from these transactions may arise from changes in the value of the foreign currency or if the counterparties do not perform under the contracts' terms.
Foreign-denominated assets, including investment securities, and liabilities are translated into U.S. dollars at the exchange rates at period end. Purchases and sales of investment securities, income and dividends received, and expenses denominated in foreign currencies are translated into U.S. dollars at the exchange rate in effect on the transaction date.
The effects of exchange rate fluctuations on investments are included with the net realized and unrealized gain (loss) on investment securities. Other foreign currency transactions resulting in realized and unrealized gain (loss) are disclosed separately.
Investment Transactions and Income. For financial reporting purposes, the Funds' investment holdings and NAV include trades executed through the end of the last business day of the period. The NAV per share for processing shareholder transactions is calculated as of the close of business of the New York Stock Exchange (NYSE), normally 4:00 p.m. Eastern time and includes trades executed through the end of the prior business day. Gains and losses on securities sold are determined on the basis of identified cost and for certain Funds include proceeds received from litigation. Dividend income is recorded on the ex-dividend date, except for certain dividends from foreign securities where the ex-dividend date may have passed, which are recorded as soon as the Funds are informed of the ex-dividend date. Non-cash dividends included in dividend income, if any, are recorded at the fair market value of the securities received. Income and capital gain distributions from Fidelity Central Funds, if any, are recorded on the ex-dividend date. Certain distributions received by the Funds represent a return of capital or capital gain. The Funds determine the components of these distributions subsequent to the ex-dividend date, based upon receipt of tax filings or other correspondence relating to the underlying investment. These distributions are recorded as a reduction of cost of investments and/or as a realized gain. Investment income is recorded net of foreign taxes withheld where recovery of such taxes is uncertain.
Expenses. Expenses directly attributable to a fund are charged to that fund. Expenses attributable to more than one fund are allocated among the respective funds on the basis of relative net assets or other appropriate methods. Expense estimates are accrued in the period to which they relate and adjustments are made when actual amounts are known.
Deferred Trustee Compensation. Under a Deferred Compensation Plan (the Plan) for Brokerage and Investment Management Portfolio, certain independent Trustees have elected to defer receipt of a portion of their annual compensation. Deferred amounts are invested in a cross-section of Fidelity funds, are marked-to-market and remain in each Fund until distributed in accordance with the Plan. The investment of deferred amounts and the offsetting payable to the Trustees presented below are included in each accompanying Statement of Assets and Liabilities in other receivables and other payables and accrued expenses, respectively.
| Brokerage and Investment Management Portfolio | $44,448 |
Income Tax Information and Distributions to Shareholders. Each year, each Fund intends to qualify as a regulated investment company under Subchapter M of the Internal Revenue Code, including distributing substantially all of its taxable income and realized gains. As a result, no provision for U.S. Federal income taxes is required. Each Fund files a U.S. federal tax return, in addition to state and local tax returns as required. Each Fund's federal income tax returns are subject to examination by the Internal Revenue Service (IRS) for a period of three fiscal years after they are filed. State and local tax returns may be subject to examination for an additional fiscal year depending on the jurisdiction. Foreign taxes are provided for based on each Fund's understanding of the tax rules and rates that exist in the foreign markets in which it invests.
Distributions are declared and recorded on the ex-dividend date. Income and capital gain distributions are determined in accordance with income tax regulations, which may differ from GAAP.
Capital accounts within the financial statements are adjusted for permanent book-tax differences. These adjustments have no impact on net assets or the results of operations. Capital accounts are not adjusted for temporary book-tax differences which will reverse in a subsequent period.
Book-tax differences are primarily due to foreign currency transactions, equity-debt classifications, redemptions in kind, partnerships, deferred trustees compensation, and losses deferred due to wash sales.
As of period end, the cost and unrealized appreciation (depreciation) in securities, and derivatives if applicable, for federal income tax purposes were as follows for each Fund:
| | Tax cost | Gross unrealized appreciation | Gross unrealized depreciation | Net unrealized appreciation (depreciation) |
| Banking Portfolio | $350,390,372 | $27,778,288 | $(76,624,703) | $(48,846,415) |
| Brokerage and Investment Management Portfolio | 231,163,552 | 118,063,509 | (12,050,498) | 106,013,011 |
| Consumer Finance Portfolio | 97,218,000 | 29,841,454 | (16,933,837) | 12,907,617 |
| Financial Services Portfolio | 422,285,476 | 47,257,513 | (55,197,246) | (7,939,733) |
| Insurance Portfolio | 106,409,213 | 69,143,900 | (2,649,003) | 66,494,897 |
Restricted Securities (including Private Placements). The Funds may invest in securities that are subject to legal or contractual restrictions on resale. These securities generally may be resold in transactions exempt from registration or to the public if the securities are registered. Disposal of these securities may involve time-consuming negotiations and expense, and prompt sale at an acceptable price may be difficult. Information regarding restricted securities is included at the end of each applicable Fund's Schedule of Investments.
4. Purchases and Sales of Investments.
Purchases and sales of securities, other than short-term securities, are noted in the table below.
| | Purchases ($) | Sales ($) |
| Banking Portfolio | 65,826,469 | 51,409,688 |
| Brokerage and Investment Management Portfolio | 10,682,674 | 18,318,357 |
| Consumer Finance Portfolio | 8,148,161 | 27,171,350 |
| Financial Services Portfolio | 137,365,357 | 158,495,606 |
| Insurance Portfolio | 15,297,976 | 44,859,876 |
5. Fees and Other Transactions with Affiliates.
Management Fee. Fidelity Management & Research Company LLC (the investment adviser) and its affiliates provide the Funds with investment management related services for which the Funds pay a monthly management fee. The management fee is the sum of an individual fund fee rate and an annualized group fee rate. The individual fund fee rate is applied to each Fund's average net assets. The group fee rate is based upon the monthly average net assets of a group of registered investment companies with which the investment adviser has management contracts. The group fee rate decreases as assets under management increase and increases as assets under management decrease. For the reporting period, each Fund's annualized management fee rate expressed as a percentage of each Fund's average net assets was as follows:
| | Individual Rate | Group Rate | Total |
| Banking Portfolio | .30% | .23% | .53% |
| Brokerage and Investment Management Portfolio | .30% | .23% | .53% |
| Consumer Finance Portfolio | .30% | .23% | .53% |
| Financial Services Portfolio | .30% | .23% | .53% |
| Insurance Portfolio | .30% | .23% | .53% |
Transfer Agent Fees. Fidelity Investments Institutional Operations Company LLC (FIIOC), an affiliate of the investment adviser, is the Funds' transfer, dividend disbursing and shareholder servicing agent. FIIOC receives account fees and asset-based fees that vary according to account size and type of account. FIIOC pays for typesetting, printing and mailing of shareholder reports, except proxy statements. For the period, transfer agent fees were equivalent to the following annualized rates expressed as a percentage of average net assets:
| Banking Portfolio | .21% |
| Brokerage and Investment Management Portfolio | .17% |
| Consumer Finance Portfolio | .27% |
| Financial Services Portfolio | .19% |
| Insurance Portfolio | .23% |
Accounting Fees. Fidelity Service Company, Inc. (FSC), an affiliate of the investment adviser, maintains each Fund's accounting records. The accounting fee is based on the level of average net assets for each month. For the period, the fees were equivalent to the following annualized rates:
| | % of Average Net Assets |
| Banking Portfolio | .04 |
| Brokerage and Investment Management Portfolio | .04 |
| Consumer Finance Portfolio | .04 |
| Financial Services Portfolio | .04 |
| Insurance Portfolio | .04 |
Brokerage Commissions. A portion of portfolio transactions were placed with brokerage firms which are affiliates of the investment adviser. Brokerage commissions are included in net realized gain (loss) and change in net unrealized appreciation (depreciation) in the Statement of Operations. The commissions paid to these affiliated firms were as follows:
| | Amount |
| Banking Portfolio | $2,487 |
| Brokerage and Investment Management Portfolio | 168 |
| Consumer Finance Portfolio | 1,015 |
| Financial Services Portfolio | 4,605 |
| Insurance Portfolio | 370 |
Interfund Trades. Funds may purchase from or sell securities to other Fidelity Funds under procedures adopted by the Board. The procedures have been designed to ensure these interfund trades are executed in accordance with Rule 17a-7 of the 1940 Act. Interfund trades are included within the respective purchases and sales amounts shown in the Purchases and Sales of Investments note.
Prior Fiscal Year Affiliated Redemptions In-Kind. During the prior period, 2,278,421 shares of the Financial Services Portfolio were redeemed in-kind for investments and cash with a value of $22,465,229. The Fund had a net realized gain of $4,465,779 on investments delivered through in-kind redemptions. The amount of the in-kind redemptions is included in share transactions in the accompanying Statement of Changes in Net Assets. Financial Services Portfolio recognized no gain or loss for federal income tax purposes.
6. Committed Line of Credit.
Certain Funds participate with other funds managed by the investment adviser or an affiliate in a $4.25 billion credit facility (the "line of credit") to be utilized for temporary or emergency purposes to fund shareholder redemptions or for other short-term liquidity purposes. The participating funds have agreed to pay commitment fees on their pro-rata portion of the line of credit, which are reflected in Miscellaneous expenses on the Statement of Operations, and are as follows:
| | Amount |
| Banking Portfolio | $428 |
| Brokerage and Investment Management Portfolio | 386 |
| Consumer Finance Portfolio | 162 |
| Financial Services Portfolio | 559 |
| Insurance Portfolio | 252 |
During the period, there were no borrowings on this line of credit.
7. Security Lending.
Certain Funds lend portfolio securities from time to time in order to earn additional income. Lending agents are used, including National Financial Services (NFS), an affiliate of the Funds. Pursuant to a securities lending agreement, NFS will receive a fee, which is capped at 9.9% of a Fund's daily lending revenue, for its services as lending agent. The Funds may lend securities to certain qualified borrowers, including NFS. On the settlement date of the loan, each applicable Fund receives collateral (in the form of U.S. Treasury obligations, letters of credit and/or cash) against the loaned securities and maintains collateral in an amount not less than 100% of the market value of the loaned securities during the period of the loan. The market value of the loaned securities is determined at the close of business of the Funds and any additional required collateral is delivered to the Funds on the next business day. The Funds or borrower may terminate the loan at any time, and if the borrower defaults on its obligation to return the securities loaned because of insolvency or other reasons, the Funds may apply collateral received from the borrower against the obligation. The Funds may experience delays and costs in recovering the securities loaned. Any cash collateral received is invested in the Fidelity Securities Lending Cash Central Fund. The value of loaned securities and cash collateral at period end are disclosed on each applicable Fund's Statement of Assets and Liabilities. At period end, there were no security loans outstanding with NFS, an affiliated borrower. Security lending income represents the income earned on investing cash collateral, less rebates paid to borrowers and any lending agent fees associated with the loan, plus any premium payments received for lending certain types of securities. Net income from Fidelity Central Funds is presented in the Statement of Operations as a component of income from Fidelity Central Funds. Affiliated security lending activity was as follows:
| | Total Security Lending Income Fees Paid to NFS | Security Lending Income From Securities Loaned to NFS |
| Banking Portfolio | $343 | $– |
| Brokerage and Investment Management Portfolio | $173 | $– |
| Consumer Finance Portfolio | $720 | $– |
| Financial Services Portfolio | $166 | $1 |
| Insurance Portfolio | $46 | $– |
8. Expense Reductions.
Commissions paid to certain brokers with whom the investment adviser, or its affiliates, places trades on behalf of certain Funds include an amount in addition to trade execution, which may be rebated back to the Funds to offset certain expenses. In addition, through arrangements with each applicable Fund's custodian and transfer agent, credits realized as a result of certain uninvested cash balances were used to reduce each applicable Fund's expenses. All of the applicable expense reductions are noted in the table below.
| | Brokerage service rebates |
| Banking Portfolio | $16,884 |
| Brokerage and Investment Management Portfolio | 736 |
| Consumer Finance Portfolio | 5,122 |
| Financial Services Portfolio | 24,429 |
| Insurance Portfolio | 2,830 |
In addition, during the period the investment adviser or an affiliate reimbursed and/or waived a portion of operating expenses as follows:
| | Amount |
| Banking Portfolio | $1,023 |
| Brokerage and Investment Management Portfolio | 687 |
| Consumer Finance Portfolio | 329 |
| Financial Services Portfolio | 1,130 |
| Insurance Portfolio | 502 |
9. Other.
The Funds' organizational documents provide former and current trustees and officers with a limited indemnification against liabilities arising in connection with the performance of their duties to the Funds. In the normal course of business, the Funds may also enter into contracts that provide general indemnifications. The Funds' maximum exposure under these arrangements is unknown as this would be dependent on future claims that may be made against the Funds. The risk of material loss from such claims is considered remote.
10. Coronavirus (COVID-19) Pandemic.
An outbreak of COVID-19 first detected in China during December 2019 has since spread globally and was declared a pandemic by the World Health Organization during March 2020. Developments that disrupt global economies and financial markets, such as the COVID-19 pandemic, may magnify factors that affect the Funds' performance.
Shareholder Expense Example
As a shareholder, you incur two types of costs: (1) transaction costs, which may include sales charges (loads) on purchase payments or redemption proceeds, as applicable and (2) ongoing costs, which generally include management fees, distribution and/or service (12b-1) fees and other Fund expenses. This Example is intended to help you understand your ongoing costs (in dollars) of investing in a fund and to compare these costs with the ongoing costs of investing in other mutual funds.
The Example is based on an investment of $1,000 invested at the beginning of the period and held for the entire period (March 1, 2020 to August 31, 2020).
Actual Expenses
The first line of the accompanying table provides information about actual account values and actual expenses. You may use the information in this line, together with the amount you invested, to estimate the expenses that you paid over the period. Simply divide your account value by $1,000.00 (for example, an $8,600 account value divided by $1,000.00 = 8.6), then multiply the result by the number in the first line for a class/Fund under the heading entitled "Expenses Paid During Period" to estimate the expenses you paid on your account during this period. If any fund is a shareholder of any underlying mutual funds or exchange-traded funds (ETFs) (the Underlying Funds), such fund indirectly bears its proportional share of the expenses of the Underlying Funds in addition to the direct expenses incurred presented in the table. These fees and expenses are not included in the annualized expense ratio used to calculate the expense estimate in the table below.
Hypothetical Example for Comparison Purposes
The second line of the accompanying table provides information about hypothetical account values and hypothetical expenses based on the actual expense ratio and an assumed rate of return of 5% per year before expenses, which is not the actual return. The hypothetical account values and expenses may not be used to estimate the actual ending account balance or expenses you paid for the period. You may use this information to compare the ongoing costs of investing in the Fund and other funds. To do so, compare this 5% hypothetical example with the 5% hypothetical examples that appear in the shareholder reports of the other funds. If any fund is a shareholder of any Underlying Funds, such fund indirectly bears its proportional share of the expenses of the Underlying Funds in addition to the direct expenses as presented in the table. These fees and expenses are not included in the annualized expense ratio used to calculate the expense estimate in the table below.
Please note that the expenses shown in the table are meant to highlight your ongoing costs only and do not reflect any transaction costs. Therefore, the second line of the table is useful in comparing ongoing costs only, and will not help you determine the relative total costs of owning different funds. In addition, if these transactional costs were included, your costs would have been higher.
| | Annualized Expense Ratio-A | Beginning
Account Value
March 1, 2020 | Ending
Account Value
August 31, 2020 | Expenses Paid
During Period-B
March 1, 2020
to August 31, 2020 |
| Banking Portfolio | .82% | | | |
| Actual | | $1,000.00 | $806.50 | $3.73 |
| Hypothetical-C | | $1,000.00 | $1,021.07 | $4.18 |
| Brokerage and Investment Management Portfolio | .77% | | | |
| Actual | | $1,000.00 | $1,130.20 | $4.13 |
| Hypothetical-C | | $1,000.00 | $1,021.32 | $3.92 |
| Consumer Finance Portfolio | .93% | | | |
| Actual | | $1,000.00 | $875.30 | $4.40 |
| Hypothetical-C | | $1,000.00 | $1,020.52 | $4.74 |
| Financial Services Portfolio | .79% | | | |
| Actual | | $1,000.00 | $920.10 | $3.82 |
| Hypothetical-C | | $1,000.00 | $1,021.22 | $4.02 |
| Insurance Portfolio | .85% | | | |
| Actual | | $1,000.00 | $954.60 | $4.19 |
| Hypothetical-C | | $1,000.00 | $1,020.92 | $4.33 |
A Annualized expense ratio reflects expenses net of applicable fee waivers.
B Expenses are equal to the annualized expense ratio, multiplied by the average account value over the period, multiplied by 184/ 365 (to reflect the one-half year period). The fees and expenses of any Underlying Funds are not included in each annualized expense ratio.
C 5% return per year before expenses
Proxy Voting Results
A special meeting of shareholders was held on June 9, 2020. The results of votes taken among shareholders on the proposal before them are reported below. Each vote reported represents one dollar of net asset value held on the record date for the meeting.
PROPOSAL 1
To elect a Board of Trustees.
| | # of
Votes | % of
Votes |
| Dennis J. Dirks |
| Affirmative | 32,463,705,305.665 | 92.437 |
| Withheld | 2,655,951,104.308 | 7.563 |
| TOTAL | 35,119,656,409.973 | 100.000 |
| Donald F. Donahue |
| Affirmative | 32,446,843,861.354 | 92.389 |
| Withheld | 2,672,812,548.619 | 7.611 |
| TOTAL | 35,119,656,409.973 | 100.000 |
| Bettina Doulton |
| Affirmative | 32,610,463,757.584 | 92.855 |
| Withheld | 2,509,192,652.389 | 7.145 |
| TOTAL | 35,119,656,409.973 | 100.000 |
| Vicki L. Fuller |
| Affirmative | 32,688,213,522.720 | 93.077 |
| Withheld | 2,431,442,887.253 | 6.923 |
| TOTAL | 35,119,656,409.973 | 100.000 |
| Patricia L. Kampling |
| Affirmative | 32,313,755,598.535 | 92.010 |
| Withheld | 2,805,900,811.438 | 7.990 |
| TOTAL | 35,119,656,409.973 | 100.000 |
| Alan J. Lacy |
| Affirmative | 31,990,158,754.948 | 91.089 |
| Withheld | 3,129,497,655.026 | 8.911 |
| TOTAL | 35,119,656,409.973 | 100.000 |
| Ned C. Lautenbach |
| Affirmative | 32,043,019,991.143 | 91.240 |
| Withheld | 3,076,636,418.830 | 8.760 |
| TOTAL | 35,119,656,409.973 | 100.000 |
| Robert A. Lawrence |
| Affirmative | 32,150,842,398.009 | 91.547 |
| Withheld | 2,968,814,011.965 | 8.453 |
| TOTAL | 35,119,656,409.973 | 100.000 |
| Joseph Mauriello |
| Affirmative | 32,082,201,213.166 | 91.351 |
| Withheld | 3,037,455,196.807 | 8.649 |
| TOTAL | 35,119,656,409.973 | 100.000 |
| Cornelia M. Small |
| Affirmative | 32,207,976,835.934 | 91.709 |
| Withheld | 2,911,679,574.039 | 8.291 |
| TOTAL | 35,119,656,409.973 | 100.000 |
| Garnett A. Smith |
| Affirmative | 32,102,654,343.096 | 91.409 |
| Withheld | 3,017,002,066.877 | 8.591 |
| TOTAL | 35,119,656,409.973 | 100.000 |
| David M. Thomas |
| Affirmative | 32,150,749,424.556 | 91.546 |
| Withheld | 2,968,906,985.418 | 8.454 |
| TOTAL | 35,119,656,409.973 | 100.000 |
| Susan Tomasky |
| Affirmative | 32,381,933,484.515 | 92.205 |
| Withheld | 2,737,722,925.459 | 7.795 |
| TOTAL | 35,119,656,409.973 | 100.000 |
| Michael E. Wiley |
| Affirmative | 32,135,064,741.973 | 91.502 |
| Withheld | 2,984,591,668.000 | 8.498 |
| TOTAL | 35,119,656,409.973 | 100.000 |
|
| Proposal 1 reflects trust wide proposal and voting results. |
SELFIN-SANN-1020
1.813666.115
Fidelity® Select Portfolios®
Industrials Sector
Air Transportation Portfolio
Defense and Aerospace Portfolio
Environment and Alternative Energy Portfolio
Industrials Portfolio
Transportation Portfolio
Semi-Annual Report
August 31, 2020
See the inside front cover for important information about access to your fund’s shareholder reports.
Beginning on January 1, 2021, as permitted by regulations adopted by the Securities and Exchange Commission, paper copies of a fund’s shareholder reports will no longer be sent by mail, unless you specifically request paper copies of the reports from the fund or from your financial intermediary, such as a financial advisor, broker-dealer or bank. Instead, the reports will be made available on a website, and you will be notified by mail each time a report is posted and provided with a website link to access the report.
If you already elected to receive shareholder reports electronically, you will not be affected by this change and you need not take any action. You may elect to receive shareholder reports and other communications from a fund electronically, by contacting your financial intermediary. For Fidelity customers, visit Fidelity's web site or call Fidelity using the contact information listed below.
You may elect to receive all future reports in paper free of charge. If you wish to continue receiving paper copies of your shareholder reports, you may contact your financial intermediary or, if you are a Fidelity customer, visit Fidelity’s website, or call Fidelity at the applicable toll-free number listed below. Your election to receive reports in paper will apply to all funds held with the fund complex/your financial intermediary.
| Account Type | Website | Phone Number |
| Brokerage, Mutual Fund, or Annuity Contracts: | fidelity.com/mailpreferences | 1-800-343-3548 |
| Employer Provided Retirement Accounts: | netbenefits.fidelity.com/preferences (choose 'no' under Required Disclosures to continue to print) | 1-800-343-0860 |
| Advisor Sold Accounts Serviced Through Your Financial Intermediary: | Contact Your Financial Intermediary | Your Financial Intermediary's phone number |
| Advisor Sold Accounts Serviced by Fidelity: | institutional.fidelity.com | 1-877-208-0098 |
Contents
To view a fund's proxy voting guidelines and proxy voting record for the 12-month period ended June 30, visit http://www.fidelity.com/proxyvotingresults or visit the Securities and Exchange Commission's (SEC) web site at http://www.sec.gov.
You may also call 1-800-544-8544 to request a free copy of the proxy voting guidelines.
Standard & Poor's, S&P and S&P 500 are registered service marks of The McGraw-Hill Companies, Inc. and have been licensed for use by Fidelity Distributors Corporation.
Other third-party marks appearing herein are the property of their respective owners.
All other marks appearing herein are registered or unregistered trademarks or service marks of FMR LLC or an affiliated company. © 2020 FMR LLC. All rights reserved.
This report and the financial statements contained herein are submitted for the general information of the shareholders of the Funds. This report is not authorized for distribution to prospective investors in the Funds unless preceded or accompanied by an effective prospectus.
A fund files its complete schedule of portfolio holdings with the SEC for the first and third quarters of each fiscal year on Form N-PORT. Forms N-PORT are available on the SEC’s web site at http://www.sec.gov. A fund's Forms N-PORT may be reviewed and copied at the SEC’s Public Reference Room in Washington, DC. Information regarding the operation of the SEC's Public Reference Room may be obtained by calling 1-800-SEC-0330.
For a complete list of a fund's portfolio holdings, view the most recent holdings listing, semiannual report, or annual report on Fidelity's web site at http://www.fidelity.com, http://www.institutional.fidelity.com, or http://www.401k.com, as applicable.
NOT FDIC INSURED •MAY LOSE VALUE •NO BANK GUARANTEE
Neither the Funds nor Fidelity Distributors Corporation is a bank.
Note to Shareholders:
Early in 2020, the outbreak and spread of a new coronavirus emerged as a public health emergency that had a major influence on financial markets, primarily based on its impact on the global economy and the outlook for corporate earnings. The virus causes a respiratory disease known as COVID-19. On March 11, the World Health Organization declared the COVID-19 outbreak a pandemic, citing sustained risk of further global spread.
In the weeks following, as the crisis worsened, we witnessed an escalating human tragedy with wide-scale social and economic consequences from coronavirus-containment measures. The outbreak of COVID-19 prompted a number of measures to limit the spread, including travel and border restrictions, quarantines, and restrictions on large gatherings. In turn, these resulted in lower consumer activity, diminished demand for a wide range of products and services, disruption in manufacturing and supply chains, and – given the wide variability in outcomes regarding the outbreak – significant market uncertainty and volatility. Amid the turmoil, the U.S. government took unprecedented action – in concert with the U.S. Federal Reserve and central banks around the world – to help support consumers, businesses, and the broader economy, and to limit disruption to the financial system.
The situation continues to unfold, and the extent and duration of its impact on financial markets and the economy remain highly uncertain. Extreme events such as the coronavirus crisis are “exogenous shocks” that can have significant adverse effects on mutual funds and their investments. Although multiple asset classes may be affected by market disruption, the duration and impact may not be the same for all types of assets.
Fidelity is committed to helping you stay informed amid news about COVID-19 and during increased market volatility, and we’re taking extra steps to be responsive to customer needs. We encourage you to visit our websites, where we offer ongoing updates, commentary, and analysis on the markets and our funds.
Air Transportation Portfolio
Investment Summary (Unaudited)
Top Ten Stocks as of August 31, 2020
| | % of fund's net assets |
| United Parcel Service, Inc. Class B | 9.6 |
| Southwest Airlines Co. | 9.3 |
| FedEx Corp. | 6.8 |
| Delta Air Lines, Inc. | 6.2 |
| Expeditors International of Washington, Inc. | 5.5 |
| Raytheon Technologies Corp. | 5.4 |
| United Airlines Holdings, Inc. | 3.9 |
| The Boeing Co. | 3.8 |
| Alaska Air Group, Inc. | 3.7 |
| TransDigm Group, Inc. | 3.6 |
| | 57.8 |
Top Industries (% of fund's net assets)
| As of August 31, 2020 |
| | Airlines | 33.9% |
| | Aerospace & Defense | 28.2% |
| | Air Freight & Logistics | 27.3% |
| | Machinery | 3.4% |
| | Road & Rail | 2.7% |
| | All Others* | 4.5% |
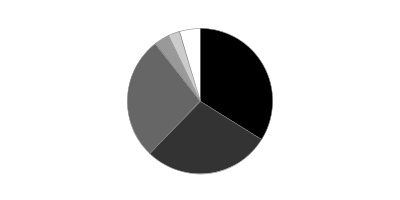
* Includes short-term investments and net other assets (liabilities).
Air Transportation Portfolio
Schedule of Investments August 31, 2020 (Unaudited)
Showing Percentage of Net Assets
| Common Stocks - 97.7% | | | |
| | | Shares | Value |
| Aerospace & Defense - 28.2% | | | |
| Aerospace & Defense - 28.2% | | | |
| CAE, Inc. | | 331,800 | $5,260,570 |
| Elbit Systems Ltd. (Israel) | | 9,600 | 1,296,427 |
| HEICO Corp. Class A | | 45,200 | 4,039,976 |
| Heroux-Devtek, Inc. (a) | | 169,000 | 1,328,056 |
| Howmet Aerospace, Inc. | | 121,800 | 2,133,936 |
| Huntington Ingalls Industries, Inc. | | 5,800 | 878,816 |
| Moog, Inc. Class A | | 78,700 | 4,744,823 |
| Northrop Grumman Corp. | | 11,800 | 4,042,798 |
| Raytheon Technologies Corp. | | 246,000 | 15,006,000 |
| Spirit AeroSystems Holdings, Inc. Class A | | 8,604 | 176,898 |
| Teledyne Technologies, Inc. (a) | | 27,600 | 8,655,636 |
| Textron, Inc. | | 199,500 | 7,866,285 |
| The Boeing Co. | | 62,210 | 10,688,922 |
| TransDigm Group, Inc. | | 19,900 | 9,943,433 |
| Virgin Galactic Holdings, Inc. (a)(b) | | 123,100 | 2,203,490 |
| | | | 78,266,066 |
| Air Freight & Logistics - 27.3% | | | |
| Air Freight & Logistics - 27.3% | | | |
| Air Transport Services Group, Inc. (a) | | 363,600 | 9,242,712 |
| Atlas Air Worldwide Holdings, Inc. (a) | | 24,300 | 1,370,277 |
| C.H. Robinson Worldwide, Inc. | | 6,200 | 609,460 |
| Cargojet, Inc. | | 3,500 | 477,633 |
| Echo Global Logistics, Inc. (a) | | 71,900 | 1,964,308 |
| Expeditors International of Washington, Inc. | | 170,600 | 15,079,334 |
| FedEx Corp. | | 86,200 | 18,950,208 |
| Hub Group, Inc. Class A (a) | | 26,700 | 1,437,528 |
| United Parcel Service, Inc. Class B | | 161,950 | 26,498,257 |
| | | | 75,629,717 |
| Airlines - 33.9% | | | |
| Airlines - 33.9% | | | |
| Air Canada (a) | | 487,700 | 6,580,688 |
| Alaska Air Group, Inc. | | 260,100 | 10,130,895 |
| Allegiant Travel Co. (b) | | 28,300 | 3,639,380 |
| American Airlines Group, Inc. (b) | | 237,100 | 3,094,155 |
| Copa Holdings SA Class A | | 40,900 | 2,177,925 |
| Dart Group PLC | | 39,900 | 380,821 |
| Delta Air Lines, Inc. | | 560,602 | 17,294,572 |
| Hawaiian Holdings, Inc. (b) | | 300 | 4,032 |
| JetBlue Airways Corp. (a) | | 468,900 | 5,401,728 |
| Mesa Air Group, Inc. (a) | | 104,400 | 382,104 |
| SkyWest, Inc. | | 240,600 | 8,096,190 |
| Southwest Airlines Co. | | 682,100 | 25,633,318 |
| Spirit Airlines, Inc. (a)(b) | | 11,500 | 205,620 |
| United Airlines Holdings, Inc. (a) | | 300,400 | 10,814,400 |
| | | | 93,835,828 |
| Building Products - 0.1% | | | |
| Building Products - 0.1% | | | |
| Carrier Global Corp. | | 7,370 | 219,995 |
| Internet & Direct Marketing Retail - 0.6% | | | |
| Internet & Direct Marketing Retail - 0.6% | | | |
| Points International Ltd. (a) | | 156,200 | 1,669,778 |
| IT Services - 0.8% | | | |
| IT Consulting & Other Services - 0.8% | | | |
| CACI International, Inc. Class A (a) | | 9,800 | 2,295,062 |
| Machinery - 3.4% | | | |
| Industrial Machinery - 3.4% | | | |
| Otis Worldwide Corp. | | 3,685 | 231,787 |
| Park-Ohio Holdings Corp. | | 47,990 | 759,202 |
| RBC Bearings, Inc. (a) | | 32,200 | 4,251,688 |
| Woodward, Inc. | | 49,700 | 4,258,793 |
| | | | 9,501,470 |
| Professional Services - 0.6% | | | |
| Research & Consulting Services - 0.6% | | | |
| FTI Consulting, Inc. (a) | | 15,400 | 1,767,304 |
| Road & Rail - 2.7% | | | |
| Railroads - 0.8% | | | |
| Canadian Pacific Railway Ltd. | | 1,600 | 473,358 |
| CSX Corp. | | 9,600 | 734,016 |
| Union Pacific Corp. | | 6,000 | 1,154,640 |
| | | | 2,362,014 |
| Trucking - 1.9% | | | |
| Landstar System, Inc. | | 12,400 | 1,650,316 |
| Ryder System, Inc. | | 3,400 | 139,060 |
| TFI International, Inc. | | 66,500 | 2,941,960 |
| U.S.A. Truck, Inc. (a) | | 15,400 | 171,710 |
| Universal Logistics Holdings, Inc. | | 13,800 | 296,700 |
| | | | 5,199,746 |
|
| TOTAL ROAD & RAIL | | | 7,561,760 |
|
| Trading Companies & Distributors - 0.1% | | | |
| Trading Companies & Distributors - 0.1% | | | |
| Willis Lease Finance Corp. (a) | | 6,000 | 128,280 |
| TOTAL COMMON STOCKS | | | |
| (Cost $231,693,154) | | | 270,875,260 |
|
| Money Market Funds - 4.2% | | | |
| Fidelity Cash Central Fund 0.12% (c) | | 5,910,787 | 5,911,969 |
| Fidelity Securities Lending Cash Central Fund 0.11% (c)(d) | | 5,666,513 | 5,667,080 |
| TOTAL MONEY MARKET FUNDS | | | |
| (Cost $11,578,965) | | | 11,579,049 |
| TOTAL INVESTMENT IN SECURITIES - 101.9% | | | |
| (Cost $243,272,119) | | | 282,454,309 |
| NET OTHER ASSETS (LIABILITIES) - (1.9)% | | | (5,221,507) |
| NET ASSETS - 100% | | | $277,232,802 |
Legend
(a) Non-income producing
(b) Security or a portion of the security is on loan at period end.
(c) Affiliated fund that is generally available only to investment companies and other accounts managed by Fidelity Investments. The rate quoted is the annualized seven-day yield of the fund at period end. A complete unaudited listing of the fund's holdings as of its most recent quarter end is available upon request. In addition, each Fidelity Central Fund's financial statements are available on the SEC's website or upon request.
(d) Investment made with cash collateral received from securities on loan.
Affiliated Central Funds
Information regarding fiscal year to date income earned by the Fund from investments in Fidelity Central Funds is as follows:
| Fund | Income earned |
| Fidelity Cash Central Fund | $8,839 |
| Fidelity Securities Lending Cash Central Fund | 143,803 |
| Total | $152,642 |
Amounts in the income column in the above table include any capital gain distributions from underlying funds, which are presented in the corresponding line-item in the Statement of Operations, if applicable. Amount for Fidelity Securities Lending Cash Central Fund represents the income earned on investing cash collateral, less rebates paid to borrowers and any lending agent fees associated with the loan, plus any premium payments received for lending certain types of securities.
Investment Valuation
The following is a summary of the inputs used, as of August 31, 2020, involving the Fund's assets and liabilities carried at fair value. The inputs or methodology used for valuing securities may not be an indication of the risk associated with investing in those securities. For more information on valuation inputs, and their aggregation into the levels used below, please refer to the Investment Valuation section in the accompanying Notes to Financial Statements.
| | Valuation Inputs at Reporting Date: |
| Description | Total | Level 1 | Level 2 | Level 3 |
| Investments in Securities: | | | | |
| Common Stocks | $270,875,260 | $270,875,260 | $-- | $-- |
| Money Market Funds | 11,579,049 | 11,579,049 | -- | -- |
| Total Investments in Securities: | $282,454,309 | $282,454,309 | $-- | $-- |
See accompanying notes which are an integral part of the financial statements.
Air Transportation Portfolio
Financial Statements
Statement of Assets and Liabilities
| | | August 31, 2020 (Unaudited) |
| Assets | | |
Investment in securities, at value (including securities loaned of $5,417,998) — See accompanying schedule:
Unaffiliated issuers (cost $231,693,154) | $270,875,260 | |
| Fidelity Central Funds (cost $11,578,965) | 11,579,049 | |
| Total Investment in Securities (cost $243,272,119) | | $282,454,309 |
| Receivable for investments sold | | 2,035,636 |
| Receivable for fund shares sold | | 1,695,292 |
| Dividends receivable | | 342,101 |
| Distributions receivable from Fidelity Central Funds | | 21,158 |
| Prepaid expenses | | 2,699 |
| Other receivables | | 662 |
| Total assets | | 286,551,857 |
| Liabilities | | |
| Payable to custodian bank | $114 | |
| Payable for investments purchased | 2,386,481 | |
| Payable for fund shares redeemed | 1,068,320 | |
| Accrued management fee | 116,873 | |
| Other affiliated payables | 59,392 | |
| Other payables and accrued expenses | 21,500 | |
| Collateral on securities loaned | 5,666,375 | |
| Total liabilities | | 9,319,055 |
| Net Assets | | $277,232,802 |
| Net Assets consist of: | | |
| Paid in capital | | $266,808,546 |
| Total accumulated earnings (loss) | | 10,424,256 |
| Net Assets | | $277,232,802 |
| Net Asset Value, offering price and redemption price per share ($277,232,802 ÷ 5,357,427 shares) | | $51.75 |
See accompanying notes which are an integral part of the financial statements.
Statement of Operations
| | | Six months ended August 31, 2020 (Unaudited) |
| Investment Income | | |
| Dividends | | $868,399 |
| Income from Fidelity Central Funds (including $143,803 from security lending) | | 152,642 |
| Total income | | 1,021,041 |
| Expenses | | |
| Management fee | $579,330 | |
| Transfer agent fees | 278,904 | |
| Accounting fees | 42,380 | |
| Custodian fees and expenses | 8,535 | |
| Independent trustees' fees and expenses | 707 | |
| Registration fees | 40,024 | |
| Audit | 17,794 | |
| Legal | 719 | |
| Miscellaneous | 7,356 | |
| Total expenses before reductions | 975,749 | |
| Expense reductions | (18,878) | |
| Total expenses after reductions | | 956,871 |
| Net investment income (loss) | | 64,170 |
| Realized and Unrealized Gain (Loss) | | |
| Net realized gain (loss) on: | | |
| Investment securities: | | |
| Unaffiliated issuers | (26,199,804) | |
| Fidelity Central Funds | 597 | |
| Foreign currency transactions | 1,246 | |
| Total net realized gain (loss) | | (26,197,961) |
| Change in net unrealized appreciation (depreciation) on: | | |
| Investment securities: | | |
| Unaffiliated issuers | 12,076,610 | |
| Assets and liabilities in foreign currencies | 185 | |
| Total change in net unrealized appreciation (depreciation) | | 12,076,795 |
| Net gain (loss) | | (14,121,166) |
| Net increase (decrease) in net assets resulting from operations | | $(14,056,996) |
See accompanying notes which are an integral part of the financial statements.
Statement of Changes in Net Assets
| | Six months ended August 31, 2020 (Unaudited) | Year ended February 29, 2020 |
| Increase (Decrease) in Net Assets | | |
| Operations | | |
| Net investment income (loss) | $64,170 | $3,469,072 |
| Net realized gain (loss) | (26,197,961) | 25,989,344 |
| Change in net unrealized appreciation (depreciation) | 12,076,795 | (62,958,416) |
| Net increase (decrease) in net assets resulting from operations | (14,056,996) | (33,500,000) |
| Distributions to shareholders | (5,293,284) | (26,369,146) |
| Share transactions | | |
| Proceeds from sales of shares | 190,730,704 | 68,675,973 |
| Reinvestment of distributions | 5,072,639 | 25,095,120 |
| Cost of shares redeemed | (115,315,400) | (124,669,961) |
| Net increase (decrease) in net assets resulting from share transactions | 80,487,943 | (30,898,868) |
| Total increase (decrease) in net assets | 61,137,663 | (90,768,014) |
| Net Assets | | |
| Beginning of period | 216,095,139 | 306,863,153 |
| End of period | $277,232,802 | $216,095,139 |
| Other Information | | |
| Shares | | |
| Sold | 4,212,050 | 889,941 |
| Issued in reinvestment of distributions | 121,734 | 339,914 |
| Redeemed | (2,535,219) | (1,681,395) |
| Net increase (decrease) | 1,798,565 | (451,540) |
See accompanying notes which are an integral part of the financial statements.
Financial Highlights
Air Transportation Portfolio
| | Six months ended (Unaudited) August 31, | Years endedFebruary 28, | | | | |
| | 2020 | 2020 A | 2019 | 2018 | 2017 | 2016 A |
| Selected Per–Share Data | | | | | | |
| Net asset value, beginning of period | $60.72 | $76.52 | $82.64 | $76.04 | $60.60 | $73.09 |
| Income from Investment Operations | | | | | | |
| Net investment income (loss)B | .01 | .90C | .54 | .48D | .32 | .18 |
| Net realized and unrealized gain (loss) | (7.67) | (10.09) | 1.73 | 13.85 | 15.61 | (6.82) |
| Total from investment operations | (7.66) | (9.19) | 2.27 | 14.33 | 15.93 | (6.64) |
| Distributions from net investment income | (.32) | (.70) | (.48) | (.38) | (.25) | (.17) |
| Distributions from net realized gain | (1.00) | (5.92) | (7.91) | (7.36) | (.24) | (5.68) |
| Total distributions | (1.31)E | (6.61)F | (8.39) | (7.73)G | (.49) | (5.85) |
| Redemption fees added to paid in capitalB | – | – | – | –H | –H | –H |
| Net asset value, end of period | $51.75 | $60.72 | $76.52 | $82.64 | $76.04 | $60.60 |
| Total ReturnI,J | (12.09)% | (13.48)% | 3.79% | 19.07% | 26.30% | (9.24)% |
| Ratios to Average Net AssetsK,L | | | | | | |
| Expenses before reductions | .89%M | .81% | .81% | .82% | .85% | .83% |
| Expenses net of fee waivers, if any | .89%M | .81% | .81% | .82% | .85% | .83% |
| Expenses net of all reductions | .87%M | .81% | .81% | .82% | .84% | .82% |
| Net investment income (loss) | .06%M | 1.19%C | .70% | .59%D | .48% | .27% |
| Supplemental Data | | | | | | |
| Net assets, end of period (000 omitted) | $277,233 | $216,095 | $306,863 | $382,530 | $394,143 | $325,630 |
| Portfolio turnover rateN | 124%M | 95% | 32% | 86% | 106% | 97% |
A For the year ended February 29.
B Calculated based on average shares outstanding during the period.
C Net investment income per share reflects one or more large, non-recurring dividend(s) which amounted to $.54 per share. Excluding such non-recurring dividend(s), the ratio of net investment income (loss) to average net assets would have been .48%.
D Net investment income per share reflects one or more large, non-recurring dividend(s) which amounted to $.22 per share. Excluding such non-recurring dividend(s), the ratio of net investment income (loss) to average net assets would have been .31%.
E Total distributions of $1.31 per share is comprised of distributions from net investment income of $.316 and distributions from net realized gain of $.995 per share.
F Total distributions of $6.61 per share is comprised of distributions from net investment income of $.699 and distributions from net realized gain of $5.915 per share.
G Total distributions of $7.73 per share is comprised of distributions from net investment income of $.377 and distributions from net realized gain of $7.357 per share.
H Amount represents less than $.005 per share.
I Total returns for periods of less than one year are not annualized.
J Total returns would have been lower if certain expenses had not been reduced during the applicable periods shown.
K Fees and expenses of any underlying mutual funds or exchange-traded funds (ETFs) are not included in the Fund's expense ratio. The Fund indirectly bears its proportionate share of these expenses. For additional expense information related to investments in Fidelity Central Funds, please refer to the "Investments in Fidelity Central Funds" note found in the Notes to Financial Statements section of the most recent Annual or Semi-Annual report.
L Expense ratios reflect operating expenses of the class. Expenses before reductions do not reflect amounts reimbursed, waived, or reduced through arrangements with the investment advisor, brokerage services, or other offset arrangements, if applicable, and do not represent the amount paid by the class during periods when reimbursements, waivers or reductions occur.
M Annualized
N Amount does not include the portfolio activity of any underlying Fidelity Central Funds.
See accompanying notes which are an integral part of the financial statements.
Defense and Aerospace Portfolio
Investment Summary (Unaudited)
Top Ten Stocks as of August 31, 2020
| | % of fund's net assets |
| Northrop Grumman Corp. | 15.6 |
| TransDigm Group, Inc. | 10.6 |
| HEICO Corp. Class A | 7.9 |
| The Boeing Co. | 6.9 |
| Teledyne Technologies, Inc. | 6.4 |
| BWX Technologies, Inc. | 5.1 |
| General Dynamics Corp. | 4.9 |
| Moog, Inc. Class A | 4.9 |
| Lockheed Martin Corp. | 4.9 |
| Huntington Ingalls Industries, Inc. | 4.0 |
| | 71.2 |
Top Industries (% of fund's net assets)
| As of August 31, 2020 |
| | Aerospace & Defense | 90.5% |
| | Machinery | 4.4% |
| | IT Services | 3.2% |
| | Trading Companies & Distributors | 1.7% |
| | All Others* | 0.2% |

* Includes short-term investments and net other assets (liabilities).
Defense and Aerospace Portfolio
Schedule of Investments August 31, 2020 (Unaudited)
Showing Percentage of Net Assets
| Common Stocks - 99.8% | | | |
| | | Shares | Value |
| Aerospace & Defense - 90.5% | | | |
| Aerospace & Defense - 90.5% | | | |
| Airbus Group NV | | 500,000 | $41,118,795 |
| Axon Enterprise, Inc. (a) | | 150,000 | 12,852,000 |
| BWX Technologies, Inc. | | 1,645,000 | 91,478,450 |
| CAE, Inc. | | 1,600,000 | 25,367,424 |
| Curtiss-Wright Corp. | | 30,000 | 3,069,600 |
| Elbit Systems Ltd. (b) | | 326,894 | 43,911,671 |
| General Dynamics Corp. | | 600,000 | 89,610,000 |
| HEICO Corp. Class A | | 1,600,000 | 143,008,000 |
| Huntington Ingalls Industries, Inc. | | 475,400 | 72,032,608 |
| Kaman Corp. | | 250,000 | 11,562,500 |
| Kratos Defense & Security Solutions, Inc. (a) | | 3,500,000 | 68,425,000 |
| Lockheed Martin Corp. | | 225,000 | 87,808,500 |
| Moog, Inc. Class A | | 1,475,000 | 88,927,750 |
| Northrop Grumman Corp. | | 825,000 | 282,653,250 |
| Parsons Corp. (a) | | 1,250,000 | 41,575,000 |
| Raytheon Technologies Corp. | | 1,000,000 | 61,000,000 |
| Spirit AeroSystems Holdings, Inc. Class A | | 50,000 | 1,028,000 |
| Teledyne Technologies, Inc. (a) | | 370,000 | 116,035,700 |
| Textron, Inc. | | 100,000 | 3,943,000 |
| The Boeing Co. | | 725,000 | 124,569,500 |
| TransDigm Group, Inc. | | 385,000 | 192,372,950 |
| Vectrus, Inc. (a) | | 479,844 | 20,830,028 |
| Virgin Galactic Holdings, Inc. (a)(b) | | 800,000 | 14,320,000 |
| | | | 1,637,499,726 |
| IT Services - 3.2% | | | |
| IT Consulting & Other Services - 3.2% | | | |
| CACI International, Inc. Class A (a) | | 250,000 | 58,547,500 |
| Machinery - 4.4% | | | |
| Industrial Machinery - 4.4% | | | |
| ESCO Technologies, Inc. | | 100,000 | 8,992,000 |
| RBC Bearings, Inc. (a) | | 90,000 | 11,883,600 |
| Woodward, Inc. | | 675,000 | 57,840,750 |
| | | | 78,716,350 |
| Trading Companies & Distributors - 1.7% | | | |
| Trading Companies & Distributors - 1.7% | | | |
| AerCap Holdings NV (a) | | 650,000 | 19,220,500 |
| Air Lease Corp. Class A | | 400,000 | 12,432,000 |
| | | | 31,652,500 |
| TOTAL COMMON STOCKS | | | |
| (Cost $1,272,261,129) | | | 1,806,416,076 |
|
| Money Market Funds - 1.5% | | | |
| Fidelity Cash Central Fund 0.12% (c) | | 10,209,402 | 10,211,444 |
| Fidelity Securities Lending Cash Central Fund 0.11% (c)(d) | | 16,093,187 | 16,094,796 |
| TOTAL MONEY MARKET FUNDS | | | |
| (Cost $26,306,240) | | | 26,306,240 |
| TOTAL INVESTMENT IN SECURITIES - 101.3% | | | |
| (Cost $1,298,567,369) | | | 1,832,722,316 |
| NET OTHER ASSETS (LIABILITIES) - (1.3)% | | | (23,375,836) |
| NET ASSETS - 100% | | | $1,809,346,480 |
Legend
(a) Non-income producing
(b) Security or a portion of the security is on loan at period end.
(c) Affiliated fund that is generally available only to investment companies and other accounts managed by Fidelity Investments. The rate quoted is the annualized seven-day yield of the fund at period end. A complete unaudited listing of the fund's holdings as of its most recent quarter end is available upon request. In addition, each Fidelity Central Fund's financial statements are available on the SEC's website or upon request.
(d) Investment made with cash collateral received from securities on loan.
Affiliated Central Funds
Information regarding fiscal year to date income earned by the Fund from investments in Fidelity Central Funds is as follows:
| Fund | Income earned |
| Fidelity Cash Central Fund | $2,606 |
| Fidelity Securities Lending Cash Central Fund | 257,218 |
| Total | $259,824 |
Amounts in the income column in the above table include any capital gain distributions from underlying funds, which are presented in the corresponding line-item in the Statement of Operations, if applicable. Amount for Fidelity Securities Lending Cash Central Fund represents the income earned on investing cash collateral, less rebates paid to borrowers and any lending agent fees associated with the loan, plus any premium payments received for lending certain types of securities.
Investment Valuation
The following is a summary of the inputs used, as of August 31, 2020, involving the Fund's assets and liabilities carried at fair value. The inputs or methodology used for valuing securities may not be an indication of the risk associated with investing in those securities. For more information on valuation inputs, and their aggregation into the levels used below, please refer to the Investment Valuation section in the accompanying Notes to Financial Statements.
| | Valuation Inputs at Reporting Date: |
| Description | Total | Level 1 | Level 2 | Level 3 |
| Investments in Securities: | | | | |
| Common Stocks | $1,806,416,076 | $1,765,297,281 | $41,118,795 | $-- |
| Money Market Funds | 26,306,240 | 26,306,240 | -- | -- |
| Total Investments in Securities: | $1,832,722,316 | $1,791,603,521 | $41,118,795 | $-- |
See accompanying notes which are an integral part of the financial statements.
Defense and Aerospace Portfolio
Financial Statements
Statement of Assets and Liabilities
| | | August 31, 2020 (Unaudited) |
| Assets | | |
Investment in securities, at value (including securities loaned of $15,925,338) — See accompanying schedule:
Unaffiliated issuers (cost $1,272,261,129) | $1,806,416,076 | |
| Fidelity Central Funds (cost $26,306,240) | 26,306,240 | |
| Total Investment in Securities (cost $1,298,567,369) | | $1,832,722,316 |
| Receivable for investments sold | | 8,560,963 |
| Receivable for fund shares sold | | 1,065,731 |
| Dividends receivable | | 3,608,350 |
| Distributions receivable from Fidelity Central Funds | | 91,981 |
| Prepaid expenses | | 21,377 |
| Other receivables | | 109,404 |
| Total assets | | 1,846,180,122 |
| Liabilities | | |
| Payable for investments purchased | $8,701,419 | |
| Payable for fund shares redeemed | 10,736,308 | |
| Accrued management fee | 819,611 | |
| Other affiliated payables | 357,437 | |
| Other payables and accrued expenses | 123,929 | |
| Collateral on securities loaned | 16,094,938 | |
| Total liabilities | | 36,833,642 |
| Net Assets | | $1,809,346,480 |
| Net Assets consist of: | | |
| Paid in capital | | $1,537,410,743 |
| Total accumulated earnings (loss) | | 271,935,737 |
| Net Assets | | $1,809,346,480 |
| Net Asset Value, offering price and redemption price per share ($1,809,346,480 ÷ 128,395,005 shares) | | $14.09 |
See accompanying notes which are an integral part of the financial statements.
Statement of Operations
| | | Six months ended August 31, 2020 (Unaudited) |
| Investment Income | | |
| Dividends | | $7,292,550 |
| Income from Fidelity Central Funds (including $257,218 from security lending) | | 259,824 |
| Total income | | 7,552,374 |
| Expenses | | |
| Management fee | $5,182,060 | |
| Transfer agent fees | 1,995,510 | |
| Accounting fees | 296,323 | |
| Custodian fees and expenses | 8,936 | |
| Independent trustees' fees and expenses | 7,339 | |
| Registration fees | 48,303 | |
| Audit | 17,869 | |
| Legal | 1,920 | |
| Interest | 9,100 | |
| Miscellaneous | 59,228 | |
| Total expenses before reductions | 7,626,588 | |
| Expense reductions | (44,477) | |
| Total expenses after reductions | | 7,582,111 |
| Net investment income (loss) | | (29,737) |
| Realized and Unrealized Gain (Loss) | | |
| Net realized gain (loss) on: | | |
| Investment securities: | | |
| Unaffiliated issuers | (246,681,041) | |
| Fidelity Central Funds | (610) | |
| Foreign currency transactions | 18,613 | |
| Total net realized gain (loss) | | (246,663,038) |
| Change in net unrealized appreciation (depreciation) on: | | |
| Investment securities: | | |
| Unaffiliated issuers | (150,143,060) | |
| Assets and liabilities in foreign currencies | (15,004) | |
| Total change in net unrealized appreciation (depreciation) | | (150,158,064) |
| Net gain (loss) | | (396,821,102) |
| Net increase (decrease) in net assets resulting from operations | | $(396,850,839) |
See accompanying notes which are an integral part of the financial statements.
Statement of Changes in Net Assets
| | Six months ended August 31, 2020 (Unaudited) | Year ended February 29, 2020 |
| Increase (Decrease) in Net Assets | | |
| Operations | | |
| Net investment income (loss) | $(29,737) | $43,682,052 |
| Net realized gain (loss) | (246,663,038) | 96,143,855 |
| Change in net unrealized appreciation (depreciation) | (150,158,064) | (188,436,207) |
| Net increase (decrease) in net assets resulting from operations | (396,850,839) | (48,610,300) |
| Distributions to shareholders | (52,505,082) | (79,290,455) |
| Share transactions | | |
| Proceeds from sales of shares | 219,856,492 | 1,019,400,280 |
| Reinvestment of distributions | 49,624,011 | 75,052,031 |
| Cost of shares redeemed | (739,737,124) | (1,032,851,200) |
| Net increase (decrease) in net assets resulting from share transactions | (470,256,621) | 61,601,111 |
| Total increase (decrease) in net assets | (919,612,542) | (66,299,644) |
| Net Assets | | |
| Beginning of period | 2,728,959,022 | 2,795,258,666 |
| End of period | $1,809,346,480 | $2,728,959,022 |
| Other Information | | |
| Shares | | |
| Sold | 16,358,180 | 56,160,058 |
| Issued in reinvestment of distributions | 3,901,259 | 4,058,280 |
| Redeemed | (56,179,884) | (57,771,315) |
| Net increase (decrease) | (35,920,445) | 2,447,023 |
See accompanying notes which are an integral part of the financial statements.
Financial Highlights
Defense and Aerospace Portfolio
| | Six months ended (Unaudited) August 31, | Years endedFebruary 28, | | | | |
| | 2020 | 2020 A | 2019 B | 2018 B | 2017 B | 2016 A,B |
| Selected Per–Share Data | | | | | | |
| Net asset value, beginning of period | $16.61 | $17.27 | $18.45 | $13.83 | $10.81 | $12.90 |
| Income from Investment Operations | | | | | | |
| Net investment income (loss)C | –D | .27E | .11 | .09F | .13G | .11 |
| Net realized and unrealized gain (loss) | (2.17) | (.45) | .33 | 5.14 | 3.52 | (1.47) |
| Total from investment operations | (2.17) | (.18) | .44 | 5.23 | 3.65 | (1.36) |
| Distributions from net investment income | (.05) | (.22) | (.10) | (.07) | (.12) | (.10) |
| Distributions from net realized gain | (.30) | (.26) | (1.52) | (.54) | (.51) | (.63) |
| Total distributions | (.35) | (.48) | (1.62) | (.61) | (.63) | (.73) |
| Redemption fees added to paid in capitalC | – | – | – | – | –D | –D |
| Net asset value, end of period | $14.09 | $16.61 | $17.27 | $18.45 | $13.83 | $10.81 |
| Total ReturnH,I | (12.86)% | (1.32)% | 3.57% | 38.46% | 34.36% | (11.08)% |
| Ratios to Average Net AssetsJ,K | | | | | | |
| Expenses before reductions | .78%L | .75% | .75% | .76% | .79% | .80% |
| Expenses net of fee waivers, if any | .78%L | .74% | .75% | .76% | .79% | .79% |
| Expenses net of all reductions | .78%L | .74% | .75% | .76% | .79% | .79% |
| Net investment income (loss) | - %L,M | 1.49%E | .66% | .58%F | 1.03%G | .92% |
| Supplemental Data | | | | | | |
| Net assets, end of period (000 omitted) | $1,809,346 | $2,728,959 | $2,795,259 | $3,073,789 | $1,601,468 | $885,398 |
| Portfolio turnover rateN | 33%L | 40% | 44% | 32% | 24% | 52% |
A For the year ended February 29.
B Per share amounts have been adjusted to reflect the impact of the 10 for 1 share split that occurred on August 10, 2018.
C Calculated based on average shares outstanding during the period.
D Amount represents less than $.005 per share.
E Net investment income per share reflects one or more large, non-recurring dividend(s) which amounted to $.18 per share. Excluding such non-recurring dividend(s), the ratio of net investment income (loss) to average net assets would have been .48%.
F Net investment income per share reflects one or more large, non-recurring dividend(s) which amounted to $.07 per share. Excluding such non-recurring dividend(s), the ratio of net investment income (loss) to average net assets would have been .14%.
G Net investment income per share reflects one or more large, non-recurring dividend(s) which amounted to $.05 per share. Excluding such non-recurring dividend(s), the ratio of net investment income (loss) to average net assets would have been .64%.
H Total returns for periods of less than one year are not annualized.
I Total returns would have been lower if certain expenses had not been reduced during the applicable periods shown.
J Fees and expenses of any underlying mutual funds or exchange-traded funds (ETFs) are not included in the Fund's expense ratio. The Fund indirectly bears its proportionate share of these expenses. For additional expense information related to investments in Fidelity Central Funds, please refer to the "Investments in Fidelity Central Funds" note found in the Notes to Financial Statements section of the most recent Annual or Semi-Annual report.
K Expense ratios reflect operating expenses of the class. Expenses before reductions do not reflect amounts reimbursed, waived, or reduced through arrangements with the investment advisor, brokerage services, or other offset arrangements, if applicable, and do not represent the amount paid by the class during periods when reimbursements, waivers or reductions occur.
L Annualized
M Amount represents less than .005%.
N Amount does not include the portfolio activity of any underlying Fidelity Central Funds.
See accompanying notes which are an integral part of the financial statements.
Environment and Alternative Energy Portfolio
Investment Summary (Unaudited)
Top Ten Stocks as of August 31, 2020
| | % of fund's net assets |
| Tesla, Inc. | 12.2 |
| Honeywell International, Inc. | 7.2 |
| 3M Co. | 4.5 |
| Danaher Corp. | 4.5 |
| Eaton Corp. PLC | 4.0 |
| Cummins, Inc. | 3.6 |
| TE Connectivity Ltd. | 3.5 |
| Trane Technologies PLC | 3.3 |
| Linde PLC | 3.1 |
| Dover Corp. | 2.8 |
| | 48.7 |
Top Industries (% of fund's net assets)
| As of August 31, 2020 |
| | Energy Efficiency | 52.3% |
| | Miscellaneous Environmental | 12.2% |
| | Renewable & Alternative Energy | 9.3% |
| | Water Infrastructure & Technologies | 9.0% |
| | Environmental Support Services | 7.7% |
| | All Others* | 9.5% |

* Includes short-term investments and net other assets (liabilities).
Environment and Alternative Energy Portfolio
Schedule of Investments August 31, 2020 (Unaudited)
Showing Percentage of Net Assets
| Common Stocks - 98.0% | | | |
| | | Shares | Value |
| Energy Efficiency - 52.3% | | | |
| Buildings Energy Efficiency - 12.6% | | | |
| A.O. Smith Corp. | | 74,840 | $3,664,915 |
| Acuity Brands, Inc. | | 24,680 | 2,697,277 |
| Carlisle Companies, Inc. | | 29,080 | 3,808,026 |
| Comfort Systems U.S.A., Inc. | | 86,610 | 4,388,529 |
| Owens Corning | | 48,630 | 3,289,333 |
| Trane Technologies PLC | | 54,780 | 6,485,404 |
| | | | 24,333,484 |
| Diversified Energy Efficiency - 7.2% | | | |
| Honeywell International, Inc. | | 84,337 | 13,961,990 |
| Industrial Energy Efficiency - 9.0% | | | |
| EMCOR Group, Inc. | | 67,978 | 5,099,030 |
| Linde PLC | | 24,070 | 6,011,242 |
| Minerals Technologies, Inc. | | 38,970 | 1,977,728 |
| Regal Beloit Corp. | | 44,034 | 4,353,201 |
| | | | 17,441,201 |
| Power Network Efficiency - 6.7% | | | |
| Eaton Corp. PLC | | 76,810 | 7,842,301 |
| Hubbell, Inc. Class B | | 35,500 | 5,144,660 |
| | | | 12,986,961 |
| Transport Energy Efficiency - 16.8% | | | |
| BorgWarner, Inc. | | 120,810 | 4,903,678 |
| Innospec, Inc. | | 52,817 | 3,944,902 |
| Tesla, Inc. (a) | | 47,400 | 23,620,367 |
| | | | 32,468,947 |
|
| TOTAL ENERGY EFFICIENCY | | | 101,192,583 |
|
| Environmental Support Services - 7.7% | | | |
| Diversified Environmental - 7.7% | | | |
| 3M Co. | | 54,012 | 8,805,036 |
| Air Products & Chemicals, Inc. | | 2,690 | 786,179 |
| Dover Corp. | | 48,830 | 5,363,487 |
| | | | 14,954,702 |
| Food Agriculture & Forestry - 1.0% | | | |
| Logistics, Food Safety and Pac - 1.0% | | | |
| Zoetis, Inc. Class A | | 11,750 | 1,881,175 |
| Miscellaneous Environmental - 12.2% | | | |
| Other Environmental - 1.8% | | | |
| Accenture PLC Class A | | 10,170 | 2,440,088 |
| Oracle Corp | | 18,530 | 1,060,287 |
| | | | 3,500,375 |
| Other - 10.4% | | | |
| American Express Co. | | 9,930 | 1,008,789 |
| Amgen, Inc. | | 5,920 | 1,499,654 |
| Bank of New York Mellon Corp. | | 29,210 | 1,080,186 |
| BlackRock, Inc. Class A | | 4,320 | 2,566,901 |
| HCA Holdings, Inc. | | 16,310 | 2,213,593 |
| Microsoft Corp. | | 7,350 | 1,657,646 |
| Procter & Gamble Co. | | 10,920 | 1,510,564 |
| Reliance Steel & Aluminum Co. | | 26,720 | 2,802,126 |
| Robert Half International, Inc. | | 44,840 | 2,385,488 |
| Steelcase, Inc. Class A | | 176,230 | 1,841,604 |
| Visa, Inc. Class A | | 6,650 | 1,409,734 |
| | | | 19,976,285 |
|
| TOTAL MISCELLANEOUS ENVIRONMENTAL | | | 23,476,660 |
|
| Pollution Control - 3.6% | | | |
| Pollution Control Solutions - 3.6% | | | |
| Cummins, Inc. | | 33,862 | 7,017,900 |
| Renewable & Alternative Energy - 9.3% | | | |
| Biofuels - 2.0% | | | |
| Cosan SA Industria e Comercio | | 260,370 | 3,956,521 |
| Renewable Energy Developers an - 7.3% | | | |
| Colbun SA | | 12,213,060 | 1,884,998 |
| Empresa Nacional de Electricidad SA sponsored ADR | | 125,010 | 1,300,104 |
| Enel SpA | | 147,330 | 1,334,102 |
| Hollysys Automation Technologies Ltd. | | 89,061 | 964,531 |
| Iberdrola SA | | 145,610 | 1,833,207 |
| TE Connectivity Ltd. | | 69,700 | 6,733,020 |
| | | | 14,049,962 |
|
| TOTAL RENEWABLE & ALTERNATIVE ENERGY | | | 18,006,483 |
|
| Waste Management & Technologies - 2.9% | | | |
| Recycling and Value Added Wast - 2.9% | | | |
| Schnitzer Steel Industries, Inc. Class A | | 143,050 | 2,823,807 |
| Steel Dynamics, Inc. | | 95,550 | 2,820,636 |
| | | | 5,644,443 |
| Water Infrastructure & Technologies - 9.0% | | | |
| Diversified Water Infrastructu - 4.5% | | | |
| Danaher Corp. | | 41,890 | 8,649,028 |
| Water Infrastructure - 4.5% | | | |
| Crane Co. | | 30,417 | 1,719,777 |
| HD Supply Holdings, Inc. (a) | | 45,110 | 1,789,063 |
| IDEX Corp. | | 29,480 | 5,313,180 |
| | | | 8,822,020 |
|
| TOTAL WATER INFRASTRUCTURE & TECHNOLOGIES | | | 17,471,048 |
|
| TOTAL COMMON STOCKS | | | |
| (Cost $161,851,047) | | | 189,644,994 |
|
| Money Market Funds - 1.9% | | | |
| Fidelity Cash Central Fund 0.12% (b) | | | |
| (Cost $3,718,989) | | 3,718,246 | 3,718,989 |
| TOTAL INVESTMENT IN SECURITIES - 99.9% | | | |
| (Cost $165,570,036) | | | 193,363,983 |
| NET OTHER ASSETS (LIABILITIES) - 0.1% | | | 200,300 |
| NET ASSETS - 100% | | | $193,564,283 |
Legend
(a) Non-income producing
(b) Affiliated fund that is generally available only to investment companies and other accounts managed by Fidelity Investments. The rate quoted is the annualized seven-day yield of the fund at period end. A complete unaudited listing of the fund's holdings as of its most recent quarter end is available upon request. In addition, each Fidelity Central Fund's financial statements are available on the SEC's website or upon request.
Affiliated Central Funds
Information regarding fiscal year to date income earned by the Fund from investments in Fidelity Central Funds is as follows:
| Fund | Income earned |
| Fidelity Cash Central Fund | $3,584 |
| Fidelity Securities Lending Cash Central Fund | 472 |
| Total | $4,056 |
Amounts in the income column in the above table include any capital gain distributions from underlying funds, which are presented in the corresponding line-item in the Statement of Operations, if applicable. Amount for Fidelity Securities Lending Cash Central Fund represents the income earned on investing cash collateral, less rebates paid to borrowers and any lending agent fees associated with the loan, plus any premium payments received for lending certain types of securities.
Investment Valuation
The following is a summary of the inputs used, as of August 31, 2020, involving the Fund's assets and liabilities carried at fair value. The inputs or methodology used for valuing securities may not be an indication of the risk associated with investing in those securities. For more information on valuation inputs, and their aggregation into the levels used below, please refer to the Investment Valuation section in the accompanying Notes to Financial Statements.
| | Valuation Inputs at Reporting Date: |
| Description | Total | Level 1 | Level 2 | Level 3 |
| Investments in Securities: | | | | |
| Common Stocks | $189,644,994 | $188,310,892 | $1,334,102 | $-- |
| Money Market Funds | 3,718,989 | 3,718,989 | -- | -- |
| Total Investments in Securities: | $193,363,983 | $192,029,881 | $1,334,102 | $-- |
Other Information
Distribution of investments by country or territory of incorporation, as a percentage of Total Net Assets, is as follows (Unaudited):
| United States of America | 79.7% |
| Ireland | 11.7% |
| Switzerland | 3.5% |
| Brazil | 2.0% |
| Chile | 1.0% |
| Others (Individually Less Than 1%) | 2.1% |
| | 100.0% |
See accompanying notes which are an integral part of the financial statements.
Environment and Alternative Energy Portfolio
Financial Statements
Statement of Assets and Liabilities
| | | August 31, 2020 (Unaudited) |
| Assets | | |
Investment in securities, at value — See accompanying schedule:
Unaffiliated issuers (cost $161,851,047) | $189,644,994 | |
| Fidelity Central Funds (cost $3,718,989) | 3,718,989 | |
| Total Investment in Securities (cost $165,570,036) | | $193,363,983 |
| Receivable for fund shares sold | | 323,305 |
| Dividends receivable | | 455,691 |
| Distributions receivable from Fidelity Central Funds | | 561 |
| Prepaid expenses | | 1,413 |
| Other receivables | | 6,846 |
| Total assets | | 194,151,799 |
| Liabilities | | |
| Payable for fund shares redeemed | $448,772 | |
| Accrued management fee | 81,595 | |
| Transfer agent fee payable | 34,381 | |
| Other affiliated payables | 5,984 | |
| Other payables and accrued expenses | 16,784 | |
| Total liabilities | | 587,516 |
| Net Assets | | $193,564,283 |
| Net Assets consist of: | | |
| Paid in capital | | $167,515,048 |
| Total accumulated earnings (loss) | | 26,049,235 |
| Net Assets | | $193,564,283 |
| Net Asset Value, offering price and redemption price per share ($193,564,283 ÷ 7,704,092 shares) | | $25.12 |
See accompanying notes which are an integral part of the financial statements.
Statement of Operations
| | | Six months ended August 31, 2020 (Unaudited) |
| Investment Income | | |
| Dividends | | $1,912,967 |
| Income from Fidelity Central Funds (including $472 from security lending) | | 4,056 |
| Total income | | 1,917,023 |
| Expenses | | |
| Management fee | $424,593 | |
| Transfer agent fees | 202,204 | |
| Accounting fees | 31,051 | |
| Custodian fees and expenses | 2,841 | |
| Independent trustees' fees and expenses | 524 | |
| Registration fees | 18,417 | |
| Audit | 25,313 | |
| Legal | 125 | |
| Miscellaneous | 5,445 | |
| Total expenses before reductions | 710,513 | |
| Expense reductions | (9,689) | |
| Total expenses after reductions | | 700,824 |
| Net investment income (loss) | | 1,216,199 |
| Realized and Unrealized Gain (Loss) | | |
| Net realized gain (loss) on: | | |
| Investment securities: | | |
| Unaffiliated issuers | (2,794,138) | |
| Fidelity Central Funds | 280 | |
| Foreign currency transactions | 863 | |
| Total net realized gain (loss) | | (2,792,995) |
| Change in net unrealized appreciation (depreciation) on: | | |
| Investment securities: | | |
| Unaffiliated issuers | 24,589,170 | |
| Assets and liabilities in foreign currencies | 5,930 | |
| Total change in net unrealized appreciation (depreciation) | | 24,595,100 |
| Net gain (loss) | | 21,802,105 |
| Net increase (decrease) in net assets resulting from operations | | $23,018,304 |
See accompanying notes which are an integral part of the financial statements.
Statement of Changes in Net Assets
| | Six months ended August 31, 2020 (Unaudited) | Year ended February 29, 2020 |
| Increase (Decrease) in Net Assets | | |
| Operations | | |
| Net investment income (loss) | $1,216,199 | $1,937,125 |
| Net realized gain (loss) | (2,792,995) | 11,966,522 |
| Change in net unrealized appreciation (depreciation) | 24,595,100 | (20,698,037) |
| Net increase (decrease) in net assets resulting from operations | 23,018,304 | (6,794,390) |
| Distributions to shareholders | (12,152,720) | (4,290,450) |
| Share transactions | | |
| Proceeds from sales of shares | 29,146,594 | 109,059,408 |
| Reinvestment of distributions | 11,518,139 | 4,066,285 |
| Cost of shares redeemed | (39,422,466) | (81,544,645) |
| Net increase (decrease) in net assets resulting from share transactions | 1,242,267 | 31,581,048 |
| Total increase (decrease) in net assets | 12,107,851 | 20,496,208 |
| Net Assets | | |
| Beginning of period | 181,456,432 | 160,960,224 |
| End of period | $193,564,283 | $181,456,432 |
| Other Information | | |
| Shares | | �� |
| Sold | 1,350,849 | 4,278,847 |
| Issued in reinvestment of distributions | 602,098 | 156,342 |
| Redeemed | (1,871,774) | (3,270,425) |
| Net increase (decrease) | 81,173 | 1,164,764 |
See accompanying notes which are an integral part of the financial statements.
Financial Highlights
Environment and Alternative Energy Portfolio
| | Six months ended (Unaudited) August 31, | Years endedFebruary 28, | | | | |
| | 2020 | 2020 A | 2019 | 2018 | 2017 | 2016 A |
| Selected Per–Share Data | | | | | | |
| Net asset value, beginning of period | $23.80 | $24.92 | $26.31 | $23.89 | $18.20 | $20.94 |
| Income from Investment Operations | | | | | | |
| Net investment income (loss)B | .16 | .27 | .24 | .27 | .20 | .17 |
| Net realized and unrealized gain (loss) | 2.89 | (.81) | (.25) | 3.83 | 5.78 | (2.34) |
| Total from investment operations | 3.05 | (.54) | (.01) | 4.10 | 5.98 | (2.17) |
| Distributions from net investment income | (.09) | (.23) | (.22) | (.22) | (.16) | (.13) |
| Distributions from net realized gain | (1.64) | (.35) | (1.16) | (1.46) | (.13) | (.44) |
| Total distributions | (1.73) | (.58) | (1.38) | (1.68) | (.29) | (.57) |
| Redemption fees added to paid in capitalB | – | – | – | –C | –C | –C |
| Net asset value, end of period | $25.12 | $23.80 | $24.92 | $26.31 | $23.89 | $18.20 |
| Total ReturnD,E | 15.10% | (2.35)% | .39% | 17.73% | 33.02% | (10.63)% |
| Ratios to Average Net AssetsF,G | | | | | | |
| Expenses before reductions | .89%H | .85% | .87% | .87% | .94% | .95% |
| Expenses net of fee waivers, if any | .89%H | .85% | .87% | .87% | .94% | .95% |
| Expenses net of all reductions | .88%H | .85% | .87% | .86% | .94% | .95% |
| Net investment income (loss) | 1.52%H | 1.08% | .96% | 1.07% | .94% | .86% |
| Supplemental Data | | | | | | |
| Net assets, end of period (000 omitted) | $193,564 | $181,456 | $160,960 | $188,383 | $137,674 | $73,432 |
| Portfolio turnover rateI | 58%H | 49% | 62% | 47% | 82% | 20% |
A For the year ended February 29.
B Calculated based on average shares outstanding during the period.
C Amount represents less than $.005 per share.
D Total returns for periods of less than one year are not annualized.
E Total returns would have been lower if certain expenses had not been reduced during the applicable periods shown.
F Fees and expenses of any underlying mutual funds or exchange-traded funds (ETFs) are not included in the Fund's expense ratio. The Fund indirectly bears its proportionate share of these expenses. For additional expense information related to investments in Fidelity Central Funds, please refer to the "Investments in Fidelity Central Funds" note found in the Notes to Financial Statements section of the most recent Annual or Semi-Annual report.
G Expense ratios reflect operating expenses of the class. Expenses before reductions do not reflect amounts reimbursed, waived, or reduced through arrangements with the investment advisor, brokerage services, or other offset arrangements, if applicable, and do not represent the amount paid by the class during periods when reimbursements, waivers or reductions occur.
H Annualized
I Amount does not include the portfolio activity of any underlying Fidelity Central Funds.
See accompanying notes which are an integral part of the financial statements.
Industrials Portfolio
Investment Summary (Unaudited)
Top Ten Stocks as of August 31, 2020
| | % of fund's net assets |
| Roper Technologies, Inc. | 8.9 |
| Fortive Corp. | 6.2 |
| Colfax Corp. | 5.8 |
| XPO Logistics, Inc. | 5.6 |
| Regal Beloit Corp. | 4.6 |
| AMETEK, Inc. | 4.5 |
| Union Pacific Corp. | 4.2 |
| Vertiv Holdings Co. | 3.7 |
| Illinois Tool Works, Inc. | 3.6 |
| TransDigm Group, Inc. | 3.4 |
| | 50.5 |
Top Industries (% of fund's net assets)
| As of August 31, 2020 |
| | Machinery | 29.7% |
| | Road & Rail | 16.8% |
| | Electrical Equipment | 15.1% |
| | Industrial Conglomerates | 11.3% |
| | Air Freight & Logistics | 6.0% |
| | All Others* | 21.1% |
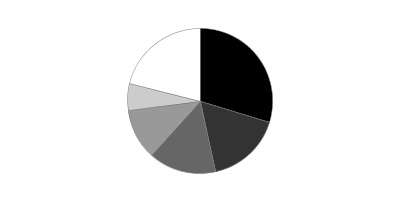
* Includes short-term investments and net other assets (liabilities).
Industrials Portfolio
Schedule of Investments August 31, 2020 (Unaudited)
Showing Percentage of Net Assets
| Common Stocks - 97.8% | | | |
| | | Shares | Value |
| Aerospace & Defense - 5.8% | | | |
| Aerospace & Defense - 5.8% | | | |
| HEICO Corp. Class A | | 64,598 | $5,773,769 |
| Teledyne Technologies, Inc. (a) | | 19,800 | 6,209,478 |
| TransDigm Group, Inc. | | 34,537 | 17,257,103 |
| | | | 29,240,350 |
| Air Freight & Logistics - 6.0% | | | |
| Air Freight & Logistics - 6.0% | | | |
| Air Transport Services Group, Inc. (a) | | 89,600 | 2,277,632 |
| XPO Logistics, Inc. (a) | | 316,725 | 27,957,316 |
| | | | 30,234,948 |
| Building Products - 5.1% | | | |
| Building Products - 5.1% | | | |
| Fortune Brands Home & Security, Inc. | | 79,000 | 6,642,320 |
| Trane Technologies PLC | | 132,265 | 15,658,853 |
| Trex Co., Inc. (a) | | 21,200 | 3,169,188 |
| | | | 25,470,361 |
| Commercial Services & Supplies - 1.9% | | | |
| Diversified Support Services - 1.9% | | | |
| Cintas Corp. | | 28,600 | 9,530,664 |
| Construction & Engineering - 0.2% | | | |
| Construction & Engineering - 0.2% | | | |
| AECOM (a) | | 23,700 | 936,387 |
| Electrical Equipment - 15.1% | | | |
| Electrical Components & Equipment - 15.1% | | | |
| AMETEK, Inc. | | 224,320 | 22,589,024 |
| Regal Beloit Corp. | | 229,551 | 22,693,412 |
| Rockwell Automation, Inc. | | 45,500 | 10,489,115 |
| Vertiv Holdings Co. (a)(b) | | 1,150,800 | 18,677,484 |
| Vertiv Holdings LLC (c) | | 61,271 | 994,428 |
| | | | 75,443,463 |
| Industrial Conglomerates - 11.3% | | | |
| Industrial Conglomerates - 11.3% | | | |
| Honeywell International, Inc. | | 72,898 | 12,068,264 |
| Roper Technologies, Inc. | | 104,668 | 44,713,124 |
| | | | 56,781,388 |
| Machinery - 29.7% | | | |
| Construction Machinery & Heavy Trucks - 2.5% | | | |
| Oshkosh Corp. | | 164,200 | 12,645,042 |
| Industrial Machinery - 27.2% | | | |
| Colfax Corp. (a) | | 874,323 | 29,097,469 |
| Fortive Corp. | | 427,600 | 30,834,236 |
| IDEX Corp. | | 29,507 | 5,318,047 |
| Illinois Tool Works, Inc. | | 90,700 | 17,917,785 |
| Ingersoll Rand, Inc. (a) | | 169,600 | 5,946,176 |
| ITT, Inc. | | 7,145 | 448,777 |
| Nordson Corp. | | 84,200 | 15,702,458 |
| Otis Worldwide Corp. | | 74,200 | 4,667,180 |
| Parker Hannifin Corp. | | 71,000 | 14,626,710 |
| Stanley Black & Decker, Inc. | | 60,500 | 9,758,650 |
| Xylem, Inc. | | 20,600 | 1,651,708 |
| | | | 135,969,196 |
|
| TOTAL MACHINERY | | | 148,614,238 |
|
| Professional Services - 3.8% | | | |
| Human Resource & Employment Services - 2.7% | | | |
| Manpower, Inc. | | 13,400 | 982,354 |
| TriNet Group, Inc. (a) | | 182,081 | 12,352,375 |
| | | | 13,334,729 |
| Research & Consulting Services - 1.1% | | | |
| CoStar Group, Inc. (a) | | 6,500 | 5,515,900 |
|
| TOTAL PROFESSIONAL SERVICES | | | 18,850,629 |
|
| Road & Rail - 16.8% | | | |
| Railroads - 9.8% | | | |
| CSX Corp. | | 175,205 | 13,396,174 |
| Kansas City Southern | | 43,166 | 7,857,939 |
| Norfolk Southern Corp. | | 31,709 | 6,739,114 |
| Union Pacific Corp. | | 109,521 | 21,076,221 |
| | | | 49,069,448 |
| Trucking - 7.0% | | | |
| Knight-Swift Transportation Holdings, Inc. Class A | | 167,007 | 7,592,138 |
| Marten Transport Ltd. | | 8,752 | 158,936 |
| Old Dominion Freight Lines, Inc. | | 56,411 | 11,405,176 |
| Saia, Inc. (a) | | 80,600 | 10,816,520 |
| Uber Technologies, Inc. (a) | | 130,000 | 4,371,900 |
| Werner Enterprises, Inc. | | 19,300 | 887,993 |
| | | | 35,232,663 |
|
| TOTAL ROAD & RAIL | | | 84,302,111 |
|
| Trading Companies & Distributors - 2.1% | | | |
| Trading Companies & Distributors - 2.1% | | | |
| Fastenal Co. | | 116,600 | 5,697,076 |
| HD Supply Holdings, Inc. (a) | | 30,366 | 1,204,316 |
| United Rentals, Inc. (a) | | 19,200 | 3,399,360 |
| | | | 10,300,752 |
| TOTAL COMMON STOCKS | | | |
| (Cost $364,914,169) | | | 489,705,291 |
|
| Money Market Funds - 2.7% | | | |
| Fidelity Cash Central Fund 0.12% (d) | | 45 | 45 |
| Fidelity Securities Lending Cash Central Fund 0.11% (d)(e) | | 13,600,503 | 13,601,863 |
| TOTAL MONEY MARKET FUNDS | | | |
| (Cost $13,601,908) | | | 13,601,908 |
| TOTAL INVESTMENT IN SECURITIES - 100.5% | | | |
| (Cost $378,516,077) | | | 503,307,199 |
| NET OTHER ASSETS (LIABILITIES) - (0.5)% | | | (2,513,139) |
| NET ASSETS - 100% | | | $500,794,060 |
Legend
(a) Non-income producing
(b) Security or a portion of the security is on loan at period end.
(c) Restricted securities (including private placements) - Investment in securities not registered under the Securities Act of 1933 (excluding 144A issues). At the end of the period, the value of restricted securities (excluding 144A issues) amounted to $994,428 or 0.2% of net assets.
(d) Affiliated fund that is generally available only to investment companies and other accounts managed by Fidelity Investments. The rate quoted is the annualized seven-day yield of the fund at period end. A complete unaudited listing of the fund's holdings as of its most recent quarter end is available upon request. In addition, each Fidelity Central Fund's financial statements are available on the SEC's website or upon request.
(e) Investment made with cash collateral received from securities on loan.
Additional information on each restricted holding is as follows:
| Security | Acquisition Date | Acquisition Cost |
| Vertiv Holdings LLC | 2/6/20 | $612,710 |
Affiliated Central Funds
Information regarding fiscal year to date income earned by the Fund from investments in Fidelity Central Funds is as follows:
| Fund | Income earned |
| Fidelity Cash Central Fund | $1,108 |
| Fidelity Securities Lending Cash Central Fund | 10,602 |
| Total | $11,710 |
Amounts in the income column in the above table include any capital gain distributions from underlying funds, which are presented in the corresponding line-item in the Statement of Operations, if applicable. Amount for Fidelity Securities Lending Cash Central Fund represents the income earned on investing cash collateral, less rebates paid to borrowers and any lending agent fees associated with the loan, plus any premium payments received for lending certain types of securities.
Investment Valuation
The following is a summary of the inputs used, as of August 31, 2020, involving the Fund's assets and liabilities carried at fair value. The inputs or methodology used for valuing securities may not be an indication of the risk associated with investing in those securities. For more information on valuation inputs, and their aggregation into the levels used below, please refer to the Investment Valuation section in the accompanying Notes to Financial Statements.
| | Valuation Inputs at Reporting Date: |
| Description | Total | Level 1 | Level 2 | Level 3 |
| Investments in Securities: | | | | |
| Common Stocks | $489,705,291 | $489,705,291 | $-- | $-- |
| Money Market Funds | 13,601,908 | 13,601,908 | -- | -- |
| Total Investments in Securities: | $503,307,199 | $503,307,199 | $-- | $-- |
See accompanying notes which are an integral part of the financial statements.
Industrials Portfolio
Financial Statements
Statement of Assets and Liabilities
| | | August 31, 2020 (Unaudited) |
| Assets | | |
Investment in securities, at value (including securities loaned of $12,987,246) — See accompanying schedule:
Unaffiliated issuers (cost $364,914,169) | $489,705,291 | |
| Fidelity Central Funds (cost $13,601,908) | 13,601,908 | |
| Total Investment in Securities (cost $378,516,077) | | $503,307,199 |
| Receivable for fund shares sold | | 13,236,850 |
| Dividends receivable | | 506,474 |
| Distributions receivable from Fidelity Central Funds | | 1,467 |
| Prepaid expenses | | 6,977 |
| Other receivables | | 110,909 |
| Total assets | | 517,169,876 |
| Liabilities | | |
| Payable for fund shares redeemed | $1,633,054 | |
| Accrued management fee | 218,155 | |
| Notes payable to affiliates | 723,000 | |
| Other affiliated payables | 82,417 | |
| Other payables and accrued expenses | 115,790 | |
| Collateral on securities loaned | 13,603,400 | |
| Total liabilities | | 16,375,816 |
| Net Assets | | $500,794,060 |
| Net Assets consist of: | | |
| Paid in capital | | $415,937,887 |
| Total accumulated earnings (loss) | | 84,856,173 |
| Net Assets | | $500,794,060 |
| Net Asset Value, offering price and redemption price per share ($500,794,060 ÷ 15,265,622 shares) | | $32.81 |
See accompanying notes which are an integral part of the financial statements.
Statement of Operations
| | | Six months ended August 31, 2020 (Unaudited) |
| Investment Income | | |
| Dividends | | $2,153,745 |
| Income from Fidelity Central Funds (including $10,602 from security lending) | | 11,710 |
| Total income | | 2,165,455 |
| Expenses | | |
| Management fee | $1,196,495 | |
| Transfer agent fees | 397,974 | |
| Accounting fees | 87,532 | |
| Custodian fees and expenses | 12,079 | |
| Independent trustees' fees and expenses | 1,540 | |
| Registration fees | 13,579 | |
| Audit | 20,031 | |
| Legal | 2,756 | |
| Interest | 188 | |
| Miscellaneous | 10,161 | |
| Total expenses before reductions | 1,742,335 | |
| Expense reductions | (75,245) | |
| Total expenses after reductions | | 1,667,090 |
| Net investment income (loss) | | 498,365 |
| Realized and Unrealized Gain (Loss) | | |
| Net realized gain (loss) on: | | |
| Investment securities: | | |
| Unaffiliated issuers | (34,587,516) | |
| Fidelity Central Funds | (1,286) | |
| Foreign currency transactions | 7,814 | |
| Total net realized gain (loss) | | (34,580,988) |
| Change in net unrealized appreciation (depreciation) on: | | |
| Investment securities: | | |
| Unaffiliated issuers | 58,696,832 | |
| Assets and liabilities in foreign currencies | (2) | |
| Total change in net unrealized appreciation (depreciation) | | 58,696,830 |
| Net gain (loss) | | 24,115,842 |
| Net increase (decrease) in net assets resulting from operations | | $24,614,207 |
See accompanying notes which are an integral part of the financial statements.
Statement of Changes in Net Assets
| | Six months ended August 31, 2020 (Unaudited) | Year ended February 29, 2020 |
| Increase (Decrease) in Net Assets | | |
| Operations | | |
| Net investment income (loss) | $498,365 | $4,960,230 |
| Net realized gain (loss) | (34,580,988) | 43,925,894 |
| Change in net unrealized appreciation (depreciation) | 58,696,830 | (55,478,292) |
| Net increase (decrease) in net assets resulting from operations | 24,614,207 | (6,592,168) |
| Distributions to shareholders | (16,770,242) | (24,419,475) |
| Share transactions | | |
| Proceeds from sales of shares | 47,079,176 | 75,905,271 |
| Reinvestment of distributions | 15,821,491 | 22,923,326 |
| Cost of shares redeemed | (98,973,579) | (171,263,736) |
| Net increase (decrease) in net assets resulting from share transactions | (36,072,912) | (72,435,139) |
| Total increase (decrease) in net assets | (28,228,947) | (103,446,782) |
| Net Assets | | |
| Beginning of period | 529,023,007 | 632,469,789 |
| End of period | $500,794,060 | $529,023,007 |
| Other Information | | |
| Shares | | |
| Sold | 1,576,584 | 2,169,004 |
| Issued in reinvestment of distributions | 612,524 | 650,311 |
| Redeemed | (3,504,930) | (4,925,986) |
| Net increase (decrease) | (1,315,822) | (2,106,671) |
See accompanying notes which are an integral part of the financial statements.
Financial Highlights
Industrials Portfolio
| | Six months ended (Unaudited) August 31, | Years endedFebruary 28, | | | | |
| | 2020 | 2020 A | 2019 | 2018 | 2017 | 2016 A |
| Selected Per–Share Data | | | | | | |
| Net asset value, beginning of period | $31.90 | $33.84 | $36.96 | $33.72 | $28.10 | $32.69 |
| Income from Investment Operations | | | | | | |
| Net investment income (loss)B | .03 | .28C | .32 | .21 | .26 | .24 |
| Net realized and unrealized gain (loss) | 1.95 | (.76) | (.70) | 4.95 | 6.76 | (2.90) |
| Total from investment operations | 1.98 | (.48) | (.38) | 5.16 | 7.02 | (2.66) |
| Distributions from net investment income | (.07) | (.24) | (.25) | (.22) | (.19) | (.20) |
| Distributions from net realized gain | (1.00) | (1.23) | (2.49) | (1.71) | (1.21) | (1.73) |
| Total distributions | (1.07) | (1.46)D | (2.74) | (1.92)E | (1.40) | (1.93) |
| Redemption fees added to paid in capitalB | – | – | – | – | –F | –F |
| Net asset value, end of period | $32.81 | $31.90 | $33.84 | $36.96 | $33.72 | $28.10 |
| Total ReturnG,H | 7.11% | (1.82)% | (.45)% | 15.73% | 25.18% | (8.29)% |
| Ratios to Average Net AssetsI,J | | | | | | |
| Expenses before reductions | .77%K | .76% | .76% | .77% | .77% | .77% |
| Expenses net of fee waivers, if any | .77%K | .76% | .76% | .77% | .77% | .76% |
| Expenses net of all reductions | .74%K | .75% | .75% | .77% | .77% | .76% |
| Net investment income (loss) | .22%K | .81%C | .92% | .60% | .83% | .79% |
| Supplemental Data | | | | | | |
| Net assets, end of period (000 omitted) | $500,794 | $529,023 | $632,470 | $1,076,950 | $1,006,420 | $978,550 |
| Portfolio turnover rateL | 272%K | 143%M | 88%M | 64%N | 62%M | 75%M |
A For the year ended February 29.
B Calculated based on average shares outstanding during the period.
C Net investment income per share reflects one or more large, non-recurring dividend(s) which amounted to $.06 per share. Excluding such non-recurring dividend(s), the ratio of net investment income (loss) to average net assets would have been .64%.
D Total distributions of $1.46 per share is comprised of distributions from net investment income of $.235 and distributions from net realized gain of $1.229 per share.
E Total distributions of $1.92 per share is comprised of distributions from net investment income of $.216 and distributions from net realized gain of $1.705 per share.
F Amount represents less than $.005 per share.
G Total returns for periods of less than one year are not annualized.
H Total returns would have been lower if certain expenses had not been reduced during the applicable periods shown.
I Fees and expenses of any underlying mutual funds or exchange-traded funds (ETFs) are not included in the Fund's expense ratio. The Fund indirectly bears its proportionate share of these expenses. For additional expense information related to investments in Fidelity Central Funds, please refer to the "Investments in Fidelity Central Funds" note found in the Notes to Financial Statements section of the most recent Annual or Semi-Annual report.
J Expense ratios reflect operating expenses of the class. Expenses before reductions do not reflect amounts reimbursed, waived, or reduced through arrangements with the investment advisor, brokerage services, or other offset arrangements, if applicable, and do not represent the amount paid by the class during periods when reimbursements, waivers or reductions occur.
K Annualized
L Amount does not include the portfolio activity of any underlying Fidelity Central Funds.
M Portfolio turnover rate excludes securities received or delivered in-kind.
N The portfolio turnover rate does not include the assets acquired in the merger.
See accompanying notes which are an integral part of the financial statements.
Transportation Portfolio
Investment Summary (Unaudited)
Top Ten Stocks as of August 31, 2020
| | % of fund's net assets |
| Union Pacific Corp. | 20.4 |
| United Parcel Service, Inc. Class B | 15.1 |
| CSX Corp. | 8.2 |
| FedEx Corp. | 6.8 |
| Southwest Airlines Co. | 4.2 |
| Expeditors International of Washington, Inc. | 3.9 |
| C.H. Robinson Worldwide, Inc. | 3.1 |
| Norfolk Southern Corp. | 2.8 |
| Landstar System, Inc. | 2.8 |
| J.B. Hunt Transport Services, Inc. | 2.7 |
| | 70.0 |
Top Industries (% of fund's net assets)
| As of August 31, 2020 |
| | Road & Rail | 49.0% |
| | Air Freight & Logistics | 36.5% |
| | Airlines | 8.7% |
| | Marine | 0.9% |
| | Aerospace & Defense | 0.8% |
| | All Others* | 4.1% |

* Includes short-term investments and net other assets (liabilities).
Transportation Portfolio
Schedule of Investments August 31, 2020 (Unaudited)
Showing Percentage of Net Assets
| Common Stocks - 98.2% | | | |
| | | Shares | Value |
| Aerospace & Defense - 0.8% | | | |
| Aerospace & Defense - 0.8% | | | |
| Elbit Systems Ltd. (Israel) | | 2,300 | $310,602 |
| Huntington Ingalls Industries, Inc. | | 3,700 | 560,624 |
| Northrop Grumman Corp. | | 4,600 | 1,576,006 |
| | | | 2,447,232 |
| Air Freight & Logistics - 36.5% | | | |
| Air Freight & Logistics - 36.5% | | | |
| Air Transport Services Group, Inc. (a) | | 317,000 | 8,058,140 |
| Atlas Air Worldwide Holdings, Inc. (a) | | 18,300 | 1,031,937 |
| C.H. Robinson Worldwide, Inc. | | 99,196 | 9,750,967 |
| Echo Global Logistics, Inc. (a) | | 202,100 | 5,521,372 |
| Expeditors International of Washington, Inc. | | 141,500 | 12,507,185 |
| FedEx Corp. | | 97,750 | 21,489,360 |
| Forward Air Corp. | | 39,700 | 2,341,903 |
| Hub Group, Inc. Class A (a) | | 82,200 | 4,425,648 |
| United Parcel Service, Inc. Class B | | 292,274 | 47,821,872 |
| XPO Logistics, Inc. (a) | | 33,600 | 2,965,872 |
| | | | 115,914,256 |
| Airlines - 8.7% | | | |
| Airlines - 8.7% | | | |
| Alaska Air Group, Inc. | | 68,800 | 2,679,760 |
| Copa Holdings SA Class A | | 26,200 | 1,395,150 |
| Delta Air Lines, Inc. | | 73,302 | 2,261,367 |
| JetBlue Airways Corp. (a) | | 1,900 | 21,888 |
| SkyWest, Inc. | | 176,900 | 5,952,685 |
| Southwest Airlines Co. | | 352,000 | 13,228,160 |
| United Airlines Holdings, Inc. (a) | | 55,000 | 1,980,000 |
| | | | 27,519,010 |
| Internet & Direct Marketing Retail - 0.5% | | | |
| Internet & Direct Marketing Retail - 0.5% | | | |
| Points International Ltd. (a) | | 163,603 | 1,748,916 |
| IT Services - 0.4% | | | |
| IT Consulting & Other Services - 0.4% | | | |
| CACI International, Inc. Class A (a) | | 5,500 | 1,288,045 |
| Marine - 0.9% | | | |
| Marine - 0.9% | | | |
| A.P. Moller - Maersk A/S Series A | | 1,200 | 1,708,336 |
| Matson, Inc. | | 28,295 | 1,133,781 |
| | | | 2,842,117 |
| Professional Services - 0.5% | | | |
| Research & Consulting Services - 0.5% | | | |
| FTI Consulting, Inc. (a) | | 13,000 | 1,491,880 |
| Road & Rail - 49.0% | | | |
| Railroads - 33.4% | | | |
| Canadian Pacific Railway Ltd. | | 1,700 | 502,942 |
| CSX Corp. | | 340,346 | 26,022,855 |
| Kansas City Southern | | 31,500 | 5,734,260 |
| Norfolk Southern Corp. | | 42,350 | 9,000,646 |
| Union Pacific Corp. | | 337,495 | 64,947,536 |
| | | | 106,208,239 |
| Trucking - 15.6% | | | |
| Covenant Transport Group, Inc. Class A (a) | | 77,900 | 1,427,907 |
| J.B. Hunt Transport Services, Inc. | | 60,400 | 8,488,616 |
| Knight-Swift Transportation Holdings, Inc. Class A | | 100,400 | 4,564,184 |
| Landstar System, Inc. | | 66,500 | 8,850,485 |
| Marten Transport Ltd. | | 30,876 | 560,708 |
| Old Dominion Freight Lines, Inc. | | 9,300 | 1,880,274 |
| Ryder System, Inc. | | 105,025 | 4,295,523 |
| Schneider National, Inc. Class B | | 117,100 | 3,168,726 |
| TFI International, Inc. | | 110,700 | 4,897,368 |
| TFI International, Inc. (Canada) | | 67,500 | 2,983,900 |
| U.S. Xpress Enterprises, Inc. (a) | | 72,800 | 696,696 |
| U.S.A. Truck, Inc. (a) | | 39,000 | 434,850 |
| Uber Technologies, Inc. (a) | | 58,300 | 1,960,629 |
| Universal Logistics Holdings, Inc. | | 72,900 | 1,567,350 |
| Werner Enterprises, Inc. | | 81,883 | 3,767,437 |
| | | | 49,544,653 |
|
| TOTAL ROAD & RAIL | | | 155,752,892 |
|
| Trading Companies & Distributors - 0.1% | | | |
| Trading Companies & Distributors - 0.1% | | | |
| Willis Lease Finance Corp. (a) | | 12,500 | 267,250 |
| Transportation Infrastructure - 0.8% | | | |
| Airport Services - 0.8% | | | |
| Macquarie Infrastructure Co. LLC | | 94,100 | 2,636,682 |
| TOTAL COMMON STOCKS | | | |
| (Cost $170,136,827) | | | 311,908,280 |
|
| Money Market Funds - 1.6% | | | |
| Fidelity Cash Central Fund 0.12% (b) | | | |
| (Cost $5,220,679) | | 5,219,635 | 5,220,679 |
| TOTAL INVESTMENT IN SECURITIES - 99.8% | | | |
| (Cost $175,357,506) | | | 317,128,959 |
| NET OTHER ASSETS (LIABILITIES) - 0.2% | | | 674,744 |
| NET ASSETS - 100% | | | $317,803,703 |
Legend
(a) Non-income producing
(b) Affiliated fund that is generally available only to investment companies and other accounts managed by Fidelity Investments. The rate quoted is the annualized seven-day yield of the fund at period end. A complete unaudited listing of the fund's holdings as of its most recent quarter end is available upon request. In addition, each Fidelity Central Fund's financial statements are available on the SEC's website or upon request.
Affiliated Central Funds
Information regarding fiscal year to date income earned by the Fund from investments in Fidelity Central Funds is as follows:
| Fund | Income earned |
| Fidelity Cash Central Fund | $8,654 |
| Fidelity Securities Lending Cash Central Fund | 7,251 |
| Total | $15,905 |
Amounts in the income column in the above table include any capital gain distributions from underlying funds, which are presented in the corresponding line-item in the Statement of Operations, if applicable. Amount for Fidelity Securities Lending Cash Central Fund represents the income earned on investing cash collateral, less rebates paid to borrowers and any lending agent fees associated with the loan, plus any premium payments received for lending certain types of securities.
Investment Valuation
The following is a summary of the inputs used, as of August 31, 2020, involving the Fund's assets and liabilities carried at fair value. The inputs or methodology used for valuing securities may not be an indication of the risk associated with investing in those securities. For more information on valuation inputs, and their aggregation into the levels used below, please refer to the Investment Valuation section in the accompanying Notes to Financial Statements.
| | Valuation Inputs at Reporting Date: |
| Description | Total | Level 1 | Level 2 | Level 3 |
| Investments in Securities: | | | | |
| Common Stocks | $311,908,280 | $311,908,280 | $-- | $-- |
| Money Market Funds | 5,220,679 | 5,220,679 | -- | -- |
| Total Investments in Securities: | $317,128,959 | $317,128,959 | $-- | $-- |
See accompanying notes which are an integral part of the financial statements.
Transportation Portfolio
Financial Statements
Statement of Assets and Liabilities
| | | August 31, 2020 (Unaudited) |
| Assets | | |
Investment in securities, at value — See accompanying schedule:
Unaffiliated issuers (cost $170,136,827) | $311,908,280 | |
| Fidelity Central Funds (cost $5,220,679) | 5,220,679 | |
| Total Investment in Securities (cost $175,357,506) | | $317,128,959 |
| Foreign currency held at value (cost $313,034) | | 313,034 |
| Receivable for investments sold | | 5,893,118 |
| Receivable for fund shares sold | | 291,730 |
| Dividends receivable | | 860,505 |
| Distributions receivable from Fidelity Central Funds | | 1,235 |
| Prepaid expenses | | 3,418 |
| Other receivables | | 4,589 |
| Total assets | | 324,496,588 |
| Liabilities | | |
| Payable for investments purchased | $5,185,692 | |
| Payable for fund shares redeemed | 1,293,075 | |
| Accrued management fee | 136,729 | |
| Other affiliated payables | 59,025 | |
| Other payables and accrued expenses | 18,364 | |
| Total liabilities | | 6,692,885 |
| Net Assets | | $317,803,703 |
| Net Assets consist of: | | |
| Paid in capital | | $190,055,069 |
| Total accumulated earnings (loss) | | 127,748,634 |
| Net Assets | | $317,803,703 |
| Net Asset Value, offering price and redemption price per share ($317,803,703 ÷ 3,669,091 shares) | | $86.62 |
See accompanying notes which are an integral part of the financial statements.
Statement of Operations
| | | Six months ended August 31, 2020 (Unaudited) |
| Investment Income | | |
| Dividends | | $2,470,589 |
| Income from Fidelity Central Funds (including $7,251 from security lending) | | 15,905 |
| Total income | | 2,486,494 |
| Expenses | | |
| Management fee | $718,479 | |
| Transfer agent fees | 291,040 | |
| Accounting fees | 52,542 | |
| Custodian fees and expenses | 4,419 | |
| Independent trustees' fees and expenses | 926 | |
| Registration fees | 18,292 | |
| Audit | 25,895 | |
| Legal | 3,732 | |
| Miscellaneous | 7,763 | |
| Total expenses before reductions | 1,123,088 | |
| Expense reductions | (15,795) | |
| Total expenses after reductions | | 1,107,293 |
| Net investment income (loss) | | 1,379,201 |
| Realized and Unrealized Gain (Loss) | | |
| Net realized gain (loss) on: | | |
| Investment securities: | | |
| Unaffiliated issuers | (13,523,647) | |
| Fidelity Central Funds | (1,282) | |
| Foreign currency transactions | 85 | |
| Total net realized gain (loss) | | (13,524,844) |
| Change in net unrealized appreciation (depreciation) on: | | |
| Investment securities: | | |
| Unaffiliated issuers | 53,989,289 | |
| Assets and liabilities in foreign currencies | 220 | |
| Total change in net unrealized appreciation (depreciation) | | 53,989,509 |
| Net gain (loss) | | 40,464,665 |
| Net increase (decrease) in net assets resulting from operations | | $41,843,866 |
See accompanying notes which are an integral part of the financial statements.
Statement of Changes in Net Assets
| | Six months ended August 31, 2020 (Unaudited) | Year ended February 29, 2020 |
| Increase (Decrease) in Net Assets | | |
| Operations | | |
| Net investment income (loss) | $1,379,201 | $4,099,350 |
| Net realized gain (loss) | (13,524,844) | 27,932,322 |
| Change in net unrealized appreciation (depreciation) | 53,989,509 | (68,395,892) |
| Net increase (decrease) in net assets resulting from operations | 41,843,866 | (36,364,220) |
| Distributions to shareholders | (24,993,715) | (16,996,996) |
| Share transactions | | |
| Proceeds from sales of shares | 34,694,180 | 36,956,264 |
| Reinvestment of distributions | 23,616,044 | 16,103,156 |
| Cost of shares redeemed | (67,797,613) | (140,448,927) |
| Net increase (decrease) in net assets resulting from share transactions | (9,487,389) | (87,389,507) |
| Total increase (decrease) in net assets | 7,362,762 | (140,750,723) |
| Net Assets | | |
| Beginning of period | 310,440,941 | 451,191,664 |
| End of period | $317,803,703 | $310,440,941 |
| Other Information | | |
| Shares | | |
| Sold | 477,146 | 396,518 |
| Issued in reinvestment of distributions | 369,520 | 168,242 |
| Redeemed | (958,009) | (1,513,069) |
| Net increase (decrease) | (111,343) | (948,309) |
See accompanying notes which are an integral part of the financial statements.
Financial Highlights
Transportation Portfolio
| | Six months ended (Unaudited) August 31, | Years endedFebruary 28, | | | | |
| | 2020 | 2020 A | 2019 | 2018 | 2017 | 2016 A |
| Selected Per–Share Data | | | | | | |
| Net asset value, beginning of period | $82.12 | $95.41 | $99.07 | $92.98 | $73.25 | $94.04 |
| Income from Investment Operations | | | | | | |
| Net investment income (loss)B | .37 | .93 | .85 | .78 | .63 | .50 |
| Net realized and unrealized gain (loss) | 11.17 | (10.43) | 5.05 | 10.83 | 20.86 | (15.81) |
| Total from investment operations | 11.54 | (9.50) | 5.90 | 11.61 | 21.49 | (15.31) |
| Distributions from net investment income | (.17) | (1.10) | (.78) | (.67) | (.38) | (.52) |
| Distributions from net realized gain | (6.88) | (2.70) | (8.78) | (4.85) | (1.39) | (4.95) |
| Total distributions | (7.04)C | (3.79)D | (9.56) | (5.52) | (1.77) | (5.48)E |
| Redemption fees added to paid in capitalB | – | – | – | –F | .01 | –F |
| Net asset value, end of period | $86.62 | $82.12 | $95.41 | $99.07 | $92.98 | $73.25 |
| Total ReturnG,H | 17.10% | (10.49)% | 6.85% | 12.48% | 29.40% | (16.28)% |
| Ratios to Average Net AssetsI,J | | | | | | |
| Expenses before reductions | .83%K | .79% | .79% | .80% | .83% | .81% |
| Expenses net of fee waivers, if any | .83%K | .79% | .79% | .80% | .83% | .81% |
| Expenses net of all reductions | .82%K | .79% | .78% | .80% | .82% | .80% |
| Net investment income (loss) | 1.02%K | 1.00% | .87% | .80% | .76% | .60% |
| Supplemental Data | | | | | | |
| Net assets, end of period (000 omitted) | $317,804 | $310,441 | $451,192 | $512,155 | $643,067 | $408,171 |
| Portfolio turnover rateL | 70%K | 78% | 58% | 47% | 104% | 80% |
A For the year ended February 29.
B Calculated based on average shares outstanding during the period.
C Total distributions of $7.04 per share is comprised of distributions from net investment income of $.167 and distributions from net realized gain of $6.875 per share.
D Total distributions of $3.79 per share is comprised of distributions from net investment income of $1.097 and distributions from net realized gain of $2.695 per share.
E Total distributions of $5.48 per share is comprised of distributions from net investment income of $.521 and distributions from net realized gain of $4.954 per share.
F Amount represents less than $.005 per share.
G Total returns for periods of less than one year are not annualized.
H Total returns would have been lower if certain expenses had not been reduced during the applicable periods shown.
I Fees and expenses of any underlying mutual funds or exchange-traded funds (ETFs) are not included in the Fund's expense ratio. The Fund indirectly bears its proportionate share of these expenses. For additional expense information related to investments in Fidelity Central Funds, please refer to the "Investments in Fidelity Central Funds" note found in the Notes to Financial Statements section of the most recent Annual or Semi-Annual report.
J Expense ratios reflect operating expenses of the class. Expenses before reductions do not reflect amounts reimbursed, waived, or reduced through arrangements with the investment advisor, brokerage services, or other offset arrangements, if applicable, and do not represent the amount paid by the class during periods when reimbursements, waivers or reductions occur.
K Annualized
L Amount does not include the portfolio activity of any underlying Fidelity Central Funds.
See accompanying notes which are an integral part of the financial statements.
Notes to Financial Statements (Unaudited)
For the period ended August 31, 2020
1. Organization.
Air Transportation Portfolio, Defense and Aerospace Portfolio, Environment and Alternative Energy Portfolio, Industrials Portfolio, and Transportation Portfolio (the Funds) are non-diversified funds of Fidelity Select Portfolios (the Trust). The Trust is registered under the Investment Company Act of 1940, as amended (the 1940 Act), as an open-end management investment company organized as a Massachusetts business trust. The Funds invest primarily in securities of companies whose principal business activities fall within specific industries. Each Fund is authorized to issue an unlimited number of shares. Share transactions on the Statement of Changes in Net Assets may contain exchanges between affiliated funds.
2. Investments in Fidelity Central Funds.
The Funds invest in Fidelity Central Funds, which are open-end investment companies generally available only to other investment companies and accounts managed by the investment adviser and its affiliates. The Funds' Schedules of Investments list each of the Fidelity Central Funds held as of period end, if any, as an investment of each Fund, but do not include the underlying holdings of each Fidelity Central Fund. As an Investing Fund, each Fund indirectly bears its proportionate share of the expenses of the underlying Fidelity Central Funds.
The Money Market Central Funds seek preservation of capital and current income and are managed by the investment adviser. Annualized expenses of the Money Market Central Funds as of their most recent shareholder report date ranged from less than .005% to .01%.
A complete unaudited list of holdings for each Fidelity Central Fund is available upon request or at the Securities and Exchange Commission (the SEC) website at www.sec.gov. In addition, the financial statements of the Fidelity Central Funds are available on the SEC website or upon request.
3. Significant Accounting Policies.
Each Fund is an investment company and applies the accounting and reporting guidance of the Financial Accounting Standards Board (FASB) Accounting Standards Codification Topic 946 Financial Services – Investment Companies. The financial statements have been prepared in conformity with accounting principles generally accepted in the United States of America (GAAP), which require management to make certain estimates and assumptions at the date of the financial statements. Actual results could differ from those estimates. Subsequent events, if any, through the date that the financial statements were issued have been evaluated in the preparation of the financial statements. The following summarizes the significant accounting policies of the Funds:
Investment Valuation. Investments are valued as of 4:00 p.m. Eastern time on the last calendar day of the period. The Board of Trustees (the Board) has delegated the day to day responsibility for the valuation of each Fund's investments to the Fair Value Committee (the Committee) established by each Fund's investment adviser. In accordance with valuation policies and procedures approved by the Board, each Fund attempts to obtain prices from one or more third party pricing vendors or brokers to value its investments. When current market prices, quotations or currency exchange rates are not readily available or reliable, investments will be fair valued in good faith by the Committee, in accordance with procedures adopted by the Board. Factors used in determining fair value vary by investment type and may include market or investment specific events. The frequency with which these procedures are used cannot be predicted and they may be utilized to a significant extent. The Committee oversees each Fund's valuation policies and procedures and reports to the Board on the Committee's activities and fair value determinations. The Board monitors the appropriateness of the procedures used in valuing each Fund's investments and ratifies the fair value determinations of the Committee.
Each Fund categorizes the inputs to valuation techniques used to value its investments into a disclosure hierarchy consisting of three levels as shown below:
- Level 1 – quoted prices in active markets for identical investments
- Level 2 – other significant observable inputs (including quoted prices for similar investments, interest rates, prepayment speeds, etc.)
- Level 3 – unobservable inputs (including the Fund's own assumptions based on the best information available)
Valuation techniques used to value each Fund's investments by major category are as follows:
Equity securities, including restricted securities, for which market quotations are readily available, are valued at the last reported sale price or official closing price as reported by a third party pricing vendor on the primary market or exchange on which they are traded and are categorized as Level 1 in the hierarchy. In the event there were no sales during the day or closing prices are not available, securities are valued at the last quoted bid price or may be valued using the last available price and are generally categorized as Level 2 in the hierarchy. For foreign equity securities, when market or security specific events arise, comparisons to the valuation of American Depositary Receipts (ADRs), futures contracts, Exchange-Traded Funds (ETFs) and certain indexes as well as quoted prices for similar securities may be used and would be categorized as Level 2 in the hierarchy. For equity securities, including restricted securities, where observable inputs are limited, assumptions about market activity and risk are used and these securities may be categorized as Level 3 in the hierarchy.
Investments in open-end mutual funds, including the Fidelity Central Funds, are valued at their closing net asset value (NAV) each business day and are categorized as Level 1 in the hierarchy.
Changes in valuation techniques may result in transfers in or out of an assigned level within the disclosure hierarchy. The aggregate value of investments by input level as of August 31, 2020 is included at the end of each Fund's Schedule of Investments.
Foreign Currency. Certain Funds may use foreign currency contracts to facilitate transactions in foreign-denominated securities. Gains and losses from these transactions may arise from changes in the value of the foreign currency or if the counterparties do not perform under the contracts' terms.
Foreign-denominated assets, including investment securities, and liabilities are translated into U.S. dollars at the exchange rates at period end. Purchases and sales of investment securities, income and dividends received, and expenses denominated in foreign currencies are translated into U.S. dollars at the exchange rate in effect on the transaction date.
The effects of exchange rate fluctuations on investments are included with the net realized and unrealized gain (loss) on investment securities. Other foreign currency transactions resulting in realized and unrealized gain (loss) are disclosed separately.
Investment Transactions and Income. For financial reporting purposes, the Funds' investment holdings and NAV include trades executed through the end of the last business day of the period. The NAV per share for processing shareholder transactions is calculated as of the close of business of the New York Stock Exchange (NYSE), normally 4:00 p.m. Eastern time and includes trades executed through the end of the prior business day. Gains and losses on securities sold are determined on the basis of identified cost and for certain Funds include proceeds received from litigation. Dividend income is recorded on the ex-dividend date, except for certain dividends from foreign securities where the ex-dividend date may have passed, which are recorded as soon as the Funds are informed of the ex-dividend date. Non-cash dividends included in dividend income, if any, are recorded at the fair market value of the securities received. Income and capital gain distributions from Fidelity Central Funds, if any, are recorded on the ex-dividend date. Certain distributions received by the Funds represent a return of capital or capital gain. The Funds determine the components of these distributions subsequent to the ex-dividend date, based upon receipt of tax filings or other correspondence relating to the underlying investment. These distributions are recorded as a reduction of cost of investments and/or as a realized gain. During the period, Defense and Aerospace Portfolio, dividend income has been decreased $3,551,100 with a corresponding increase to net unrealized appreciation (depreciation) as a result of a change in the prior period estimate, which had no impact on the total net assets or total return of the Fund. Investment income is recorded net of foreign taxes withheld where recovery of such taxes is uncertain.
Expenses. Expenses directly attributable to a fund are charged to that fund. Expenses attributable to more than one fund are allocated among the respective funds on the basis of relative net assets or other appropriate methods. Expense estimates are accrued in the period to which they relate and adjustments are made when actual amounts are known.
Deferred Trustee Compensation. Under a Deferred Compensation Plan (the Plan) for certain Funds, certain independent Trustees have elected to defer receipt of a portion of their annual compensation. Deferred amounts are invested in a cross-section of Fidelity funds, are marked-to-market and remain in each Fund until distributed in accordance with the Plan. The investment of deferred amounts and the offsetting payable to the Trustees presented below are included in each accompanying Statement of Assets and Liabilities in other receivables and other payables and accrued expenses, respectively.
| Defense and Aerospace Portfolio | $102,846 |
| Industrials Portfolio | 94,096 |
Income Tax Information and Distributions to Shareholders. Each year, each Fund intends to qualify as a regulated investment company under Subchapter M of the Internal Revenue Code, including distributing substantially all of its taxable income and realized gains. As a result, no provision for U.S. Federal income taxes is required. Each Fund files a U.S. federal tax return, in addition to state and local tax returns as required. Each Fund's federal income tax returns are subject to examination by the Internal Revenue Service (IRS) for a period of three fiscal years after they are filed. State and local tax returns may be subject to examination for an additional fiscal year depending on the jurisdiction. Foreign taxes are provided for based on each Fund's understanding of the tax rules and rates that exist in the foreign markets in which it invests.
Distributions are declared and recorded on the ex-dividend date. Income and capital gain distributions are determined in accordance with income tax regulations, which may differ from GAAP.
Capital accounts within the financial statements are adjusted for permanent book-tax differences. These adjustments have no impact on net assets or the results of operations. Capital accounts are not adjusted for temporary book-tax differences which will reverse in a subsequent period.
Book-tax differences are primarily due to foreign currency transactions, redemptions in kind, deferred trustees compensation and certain losses deferred due to wash sales and excise tax regulations.
As of period end, the cost and unrealized appreciation (depreciation) in securities, and derivatives if applicable, for federal income tax purposes were as follows for each Fund:
| | Tax cost | Gross unrealized appreciation | Gross unrealized depreciation | Net unrealized appreciation (depreciation) |
| Air Transportation Portfolio | $254,437,445 | $56,709,012 | $(28,692,148) | $28,016,864 |
| Defense and Aerospace Portfolio | 1,298,704,576 | 607,810,496 | (73,792,756) | 534,017,740 |
| Environment and Alternative Energy Portfolio | 165,726,636 | 36,230,043 | (8,592,696) | 27,637,347 |
| Industrials Portfolio | 387,151,571 | 119,473,172 | (3,317,544) | 116,155,628 |
| Transportation Portfolio | 177,083,892 | 146,458,022 | (6,412,955) | 140,045,067 |
Restricted Securities (including Private Placements). The Funds may invest in securities that are subject to legal or contractual restrictions on resale. These securities generally may be resold in transactions exempt from registration or to the public if the securities are registered. Disposal of these securities may involve time-consuming negotiations and expense, and prompt sale at an acceptable price may be difficult. Information regarding restricted securities is included at the end of each applicable Fund's Schedule of Investments.
4. Purchases and Sales of Investments.
Purchases and sales of securities, other than short-term securities, are noted in the table below.
| | Purchases ($) | Sales ($) |
| Air Transportation Portfolio | 210,602,451 | 135,931,581 |
| Defense and Aerospace Portfolio | 334,481,610 | 855,525,474 |
| Environment and Alternative Energy Portfolio | 47,060,562 | 54,643,203 |
| Industrials Portfolio | 625,442,359 | 687,113,583 |
| Transportation Portfolio | 96,176,929 | 131,052,773 |
5. Fees and Other Transactions with Affiliates.
Management Fee. Fidelity Management & Research Company LLC (the investment adviser) and its affiliates provide the Funds with investment management related services for which the Funds pay a monthly management fee. The management fee is the sum of an individual fund fee rate and an annualized group fee rate. The individual fund fee rate is applied to each Fund's average net assets. The group fee rate is based upon the monthly average net assets of a group of registered investment companies with which the investment adviser has management contracts. The group fee rate decreases as assets under management increase and increases as assets under management decrease. For the reporting period, each Fund's annualized management fee rate expressed as a percentage of each Fund's average net assets was as follows:
| | Individual Rate | Group Rate | Total |
| Air Transportation Portfolio | .30% | .23% | .53% |
| Defense and Aerospace Portfolio | .30% | .23% | .53% |
| Environment and Alternative Energy Portfolio | .30% | .23% | .53% |
| Industrials Portfolio | .30% | .23% | .53% |
| Transportation Portfolio | .30% | .23% | .53% |
Transfer Agent Fees. Fidelity Investments Institutional Operations Company LLC (FIIOC), an affiliate of the investment adviser, is the Funds' transfer, dividend disbursing and shareholder servicing agent. FIIOC receives account fees and asset-based fees that vary according to account size and type of account. FIIOC pays for typesetting, printing and mailing of shareholder reports, except proxy statements. For the period, transfer agent fees were equivalent to the following annualized rates expressed as a percentage of average net assets:
| Air Transportation Portfolio | .25% |
| Defense and Aerospace Portfolio | .20% |
| Environment and Alternative Energy Portfolio | .25% |
| Industrials Portfolio | .18% |
| Transportation Portfolio | .21% |
Accounting Fees. Fidelity Service Company, Inc. (FSC), an affiliate of the investment adviser, maintains each Fund's accounting records. The accounting fee is based on the level of average net assets for each month. For the period, the fees were equivalent to the following annualized rates:
| | % of Average Net Assets |
| Air Transportation Portfolio | .04 |
| Defense and Aerospace Portfolio | .03 |
| Environment and Alternative Energy Portfolio | .04 |
| Industrials Portfolio | .04 |
| Transportation Portfolio | .04 |
Brokerage Commissions. A portion of portfolio transactions were placed with brokerage firms which are affiliates of the investment adviser. Brokerage commissions are included in net realized gain (loss) and change in net unrealized appreciation (depreciation) in the Statement of Operations. The commissions paid to these affiliated firms were as follows:
| | Amount |
| Air Transportation Portfolio | $4,428 |
| Defense and Aerospace Portfolio | 11,182 |
| Environment and Alternative Energy Portfolio | 582 |
| Industrials Portfolio | 18,326 |
| Transportation Portfolio | 3,369 |
Interfund Lending Program. Pursuant to an Exemptive Order issued by the SEC, each fund, along with other registered investment companies having management contracts with Fidelity Management & Research Company LLC (FMR), or other affiliated entities of FMR, may participate in an interfund lending program. This program provides an alternative credit facility allowing each fund to borrow from, or lend money to, other participating affiliated funds. At period end, Industrials Portfolio had interfund loans outstanding. Any open loans, including accrued interest, at period end are presented under the caption "Notes payable to affiliates" in the Statement of Assets and Liabilities. Activity in this program during the period for which loans were outstanding was as follows:
| | Borrower or Lender | Average Loan Balance | Weighted Average Interest Rate | Interest Expense |
| Defense and Aerospace Portfolio | Borrower | $8,865,800 | .95% | $8,765 |
| Industrials Portfolio | Borrower | $5,285,250 | .32% | $188 |
Interfund Trades. Funds may purchase from or sell securities to other Fidelity Funds under procedures adopted by the Board. The procedures have been designed to ensure these interfund trades are executed in accordance with Rule 17a-7 of the 1940 Act. Interfund trades are included within the respective purchases and sales amounts shown in the Purchases and Sales of Investments note.
Prior Fiscal Year Affiliated Redemptions In-Kind. During the prior period, 386,628 shares of the Industrials Portfolio were redeemed in-kind for investments and cash with a value of $13,207,212. The Fund had a net realized gain of $4,051,467 on investments delivered through in-kind redemptions. The amount of the in-kind redemptions is included in share transactions in the accompanying Statement of Changes in Net Assets. Industrials Portfolio recognized no gain or loss for federal income tax purposes.
Committed Line of Credit. Certain Funds participate with other funds managed by the investment adviser or an affiliate in a $4.25 billion credit facility (the "line of credit") to be utilized for temporary or emergency purposes to fund shareholder redemptions or for other short-term liquidity purposes. The participating funds have agreed to pay commitment fees on their pro-rata portion of the line of credit, which are reflected in Miscellaneous expenses on the Statement of Operations, and are as follows:
| | Amount |
| Air Transportation Portfolio | $282 |
| Defense and Aerospace Portfolio | 3,074 |
| Environment and Alternative Energy Portfolio | 210 |
| Industrials Portfolio | 623 |
| Transportation Portfolio | 374 |
During the period, there were no borrowings on this line of credit.
6. Security Lending.
Certain Funds lend portfolio securities from time to time in order to earn additional income. Lending agents are used, including National Financial Services (NFS), an affiliate of the Funds. Pursuant to a securities lending agreement, NFS will receive a fee, which is capped at 9.9% of a Fund's daily lending revenue, for its services as lending agent. The Funds may lend securities to certain qualified borrowers, including NFS. On the settlement date of the loan, each applicable Fund receives collateral (in the form of U.S. Treasury obligations, letters of credit and/or cash) against the loaned securities and maintains collateral in an amount not less than 100% of the market value of the loaned securities during the period of the loan. The market value of the loaned securities is determined at the close of business of the Funds and any additional required collateral is delivered to the Funds on the next business day. The Funds or borrower may terminate the loan at any time, and if the borrower defaults on its obligation to return the securities loaned because of insolvency or other reasons, the Funds may apply collateral received from the borrower against the obligation. The Funds may experience delays and costs in recovering the securities loaned. Any cash collateral received is invested in the Fidelity Securities Lending Cash Central Fund. The value of loaned securities and cash collateral at period end are disclosed on each applicable Fund's Statement of Assets and Liabilities. At period end, there were no security loans outstanding with NFS, an affiliated borrower. Security lending income represents the income earned on investing cash collateral, less rebates paid to borrowers and any lending agent fees associated with the loan, plus any premium payments received for lending certain types of securities. Net income from Fidelity Central Funds is presented in the Statement of Operations as a component of income from Fidelity Central Funds. Affiliated security lending activity was as follows:
| | Total Security Lending Income Fees Paid to NFS | Security Lending Income From Securities Loaned to NFS |
| Air Transportation Portfolio | $13,760 | $111 |
| Defense and Aerospace Portfolio | $21,526 | $– |
| Environment and Alternative Energy Portfolio | $51 | $– |
| Industrials Portfolio | $1,009 | $– |
| Transportation Portfolio | $707 | $– |
7. Bank Borrowings.
Each Fund is permitted to have bank borrowings for temporary or emergency purposes to fund shareholder redemptions or for other short-term liquidity requirements. Each Fund has established borrowing arrangements with certain banks. The interest rate on the borrowings is the bank's base rate, as revised from time to time. Any open loans, including accrued interest, at period end are presented under the caption "Notes payable" in the Statement of Assets and Liabilities, if applicable. Activity in this program during the period for which loans were outstanding was as follows:
| | Average Loan Balance | Weighted Average Interest Rate | Interest Expense |
| Defense and Aerospace Portfolio | $3,175,000 | .63% | $335 |
8. Expense Reductions.
Commissions paid to certain brokers with whom the investment adviser, or its affiliates, places trades on behalf of certain Funds include an amount in addition to trade execution, which may be rebated back to the Funds to offset certain expenses. In addition, through arrangements with each applicable Fund's custodian credits realized as a result of certain uninvested cash balances were used to reduce each applicable Fund's expenses. All of the applicable expense reductions are noted in the table below.
| | Brokerage service rebates | Custodian credits |
| Air Transportation Portfolio | $18,159 | $91 |
| Defense and Aerospace Portfolio | 38,029 | 216 |
| Environment and Alternative Energy Portfolio | 9,315 | – |
| Industrials Portfolio | 74,032 | – |
| Transportation Portfolio | 14,439 | 572 |
In addition, during the period the investment adviser or an affiliate reimbursed and/or waived a portion of operating expenses as follows:
| | Amount |
| Air Transportation Portfolio | $628 |
| Defense and Aerospace Portfolio | 6,232 |
| Environment and Alternative Energy Portfolio | 374 |
| Industrials Portfolio | 1,213 |
| Transportation Portfolio | 784 |
9. Other.
The Funds' organizational documents provide former and current trustees and officers with a limited indemnification against liabilities arising in connection with the performance of their duties to the Funds. In the normal course of business, the Funds may also enter into contracts that provide general indemnifications. The Funds' maximum exposure under these arrangements is unknown as this would be dependent on future claims that may be made against the Funds. The risk of material loss from such claims is considered remote.
10. Coronavirus (COVID-19) Pandemic.
An outbreak of COVID-19 first detected in China during December 2019 has since spread globally and was declared a pandemic by the World Health Organization during March 2020. Developments that disrupt global economies and financial markets, such as the COVID-19 pandemic, may magnify factors that affect the Funds' performance.
Shareholder Expense Example
As a shareholder, you incur two types of costs: (1) transaction costs, which may include sales charges (loads) on purchase payments or redemption proceeds, as applicable and (2) ongoing costs, which generally include management fees, distribution and/or service (12b-1) fees and other Fund expenses. This Example is intended to help you understand your ongoing costs (in dollars) of investing in a fund and to compare these costs with the ongoing costs of investing in other mutual funds.
The Example is based on an investment of $1,000 invested at the beginning of the period and held for the entire period (March 1, 2020 to August 31, 2020).
Actual Expenses
The first line of the accompanying table provides information about actual account values and actual expenses. You may use the information in this line, together with the amount you invested, to estimate the expenses that you paid over the period. Simply divide your account value by $1,000.00 (for example, an $8,600 account value divided by $1,000.00 = 8.6), then multiply the result by the number in the first line for a class/Fund under the heading entitled "Expenses Paid During Period" to estimate the expenses you paid on your account during this period. If any fund is a shareholder of any underlying mutual funds or exchange-traded funds (ETFs) (the Underlying Funds), such fund indirectly bears its proportional share of the expenses of the Underlying Funds in addition to the direct expenses incurred presented in the table. These fees and expenses are not included in the annualized expense ratio used to calculate the expense estimate in the table below.
Hypothetical Example for Comparison Purposes
The second line of the accompanying table provides information about hypothetical account values and hypothetical expenses based on the actual expense ratio and an assumed rate of return of 5% per year before expenses, which is not the actual return. The hypothetical account values and expenses may not be used to estimate the actual ending account balance or expenses you paid for the period. You may use this information to compare the ongoing costs of investing in the Fund and other funds. To do so, compare this 5% hypothetical example with the 5% hypothetical examples that appear in the shareholder reports of the other funds. If any fund is a shareholder of any Underlying Funds, such fund indirectly bears its proportional share of the expenses of the Underlying Funds in addition to the direct expenses as presented in the table. These fees and expenses are not included in the annualized expense ratio used to calculate the expense estimate in the table below.
Please note that the expenses shown in the table are meant to highlight your ongoing costs only and do not reflect any transaction costs. Therefore, the second line of the table is useful in comparing ongoing costs only, and will not help you determine the relative total costs of owning different funds. In addition, if these transactional costs were included, your costs would have been higher.
| | Annualized Expense Ratio-A | Beginning
Account Value
March 1, 2020 | Ending
Account Value
August 31, 2020 | Expenses Paid
During Period-B
March 1, 2020
to August 31, 2020 |
| Air Transportation Portfolio | .89% | | | |
| Actual | | $1,000.00 | $879.10 | $4.22 |
| Hypothetical-C | | $1,000.00 | $1,020.72 | $4.53 |
| Defense and Aerospace Portfolio | .78% | | | |
| Actual | | $1,000.00 | $871.40 | $3.68 |
| Hypothetical-C | | $1,000.00 | $1,021.27 | $3.97 |
| Environment and Alternative Energy Portfolio | .89% | | | |
| Actual | | $1,000.00 | $1,151.00 | $4.83 |
| Hypothetical-C | | $1,000.00 | $1,020.72 | $4.53 |
| Industrials Portfolio | .77% | | | |
| Actual | | $1,000.00 | $1,071.10 | $4.02 |
| Hypothetical-C | | $1,000.00 | $1,021.32 | $3.92 |
| Transportation Portfolio | .83% | | | |
| Actual | | $1,000.00 | $1,171.00 | $4.54 |
| Hypothetical-C | | $1,000.00 | $1,021.02 | $4.23 |
A Annualized expense ratio reflects expenses net of applicable fee waivers.
B Expenses are equal to the annualized expense ratio, multiplied by the average account value over the period, multiplied by 184/ 365 (to reflect the one-half year period). The fees and expenses of any Underlying Funds are not included in each annualized expense ratio.
C 5% return per year before expenses
Proxy Voting Results
A special meeting of shareholders was held on June 9, 2020. The results of votes taken among shareholders on the proposal before them are reported below. Each vote reported represents one dollar of net asset value held on the record date for the meeting.
PROPOSAL 1
To elect a Board of Trustees.
| | # of
Votes | % of
Votes |
| Dennis J. Dirks |
| Affirmative | 32,463,705,305.665 | 92.437 |
| Withheld | 2,655,951,104.308 | 7.563 |
| TOTAL | 35,119,656,409.973 | 100.000 |
| Donald F. Donahue |
| Affirmative | 32,446,843,861.354 | 92.389 |
| Withheld | 2,672,812,548.619 | 7.611 |
| TOTAL | 35,119,656,409.973 | 100.000 |
| Bettina Doulton |
| Affirmative | 32,610,463,757.584 | 92.855 |
| Withheld | 2,509,192,652.389 | 7.145 |
| TOTAL | 35,119,656,409.973 | 100.000 |
| Vicki L. Fuller |
| Affirmative | 32,688,213,522.720 | 93.077 |
| Withheld | 2,431,442,887.253 | 6.923 |
| TOTAL | 35,119,656,409.973 | 100.000 |
| Patricia L. Kampling |
| Affirmative | 32,313,755,598.535 | 92.010 |
| Withheld | 2,805,900,811.438 | 7.990 |
| TOTAL | 35,119,656,409.973 | 100.000 |
| Alan J. Lacy |
| Affirmative | 31,990,158,754.948 | 91.089 |
| Withheld | 3,129,497,655.026 | 8.911 |
| TOTAL | 35,119,656,409.973 | 100.000 |
| Ned C. Lautenbach |
| Affirmative | 32,043,019,991.143 | 91.240 |
| Withheld | 3,076,636,418.830 | 8.760 |
| TOTAL | 35,119,656,409.973 | 100.000 |
| Robert A. Lawrence |
| Affirmative | 32,150,842,398.009 | 91.547 |
| Withheld | 2,968,814,011.965 | 8.453 |
| TOTAL | 35,119,656,409.973 | 100.000 |
| Joseph Mauriello |
| Affirmative | 32,082,201,213.166 | 91.351 |
| Withheld | 3,037,455,196.807 | 8.649 |
| TOTAL | 35,119,656,409.973 | 100.000 |
| Cornelia M. Small |
| Affirmative | 32,207,976,835.934 | 91.709 |
| Withheld | 2,911,679,574.039 | 8.291 |
| TOTAL | 35,119,656,409.973 | 100.000 |
| Garnett A. Smith |
| Affirmative | 32,102,654,343.096 | 91.409 |
| Withheld | 3,017,002,066.877 | 8.591 |
| TOTAL | 35,119,656,409.973 | 100.000 |
| David M. Thomas |
| Affirmative | 32,150,749,424.556 | 91.546 |
| Withheld | 2,968,906,985.418 | 8.454 |
| TOTAL | 35,119,656,409.973 | 100.000 |
| Susan Tomasky |
| Affirmative | 32,381,933,484.515 | 92.205 |
| Withheld | 2,737,722,925.459 | 7.795 |
| TOTAL | 35,119,656,409.973 | 100.000 |
| Michael E. Wiley |
| Affirmative | 32,135,064,741.973 | 91.502 |
| Withheld | 2,984,591,668.000 | 8.498 |
| TOTAL | 35,119,656,409.973 | 100.000 |
|
| Proposal 1 reflects trust wide proposal and voting results. |
SELCI-SANN-1020
1.813660.115
Fidelity® Select Portfolios®
Utilities Sector
Utilities Portfolio
Semi-Annual Report
August 31, 2020
See the inside front cover for important information about access to your fund’s shareholder reports.
Beginning on January 1, 2021, as permitted by regulations adopted by the Securities and Exchange Commission, paper copies of a fund’s shareholder reports will no longer be sent by mail, unless you specifically request paper copies of the reports from the fund or from your financial intermediary, such as a financial advisor, broker-dealer or bank. Instead, the reports will be made available on a website, and you will be notified by mail each time a report is posted and provided with a website link to access the report.
If you already elected to receive shareholder reports electronically, you will not be affected by this change and you need not take any action. You may elect to receive shareholder reports and other communications from a fund electronically, by contacting your financial intermediary. For Fidelity customers, visit Fidelity's web site or call Fidelity using the contact information listed below.
You may elect to receive all future reports in paper free of charge. If you wish to continue receiving paper copies of your shareholder reports, you may contact your financial intermediary or, if you are a Fidelity customer, visit Fidelity’s website, or call Fidelity at the applicable toll-free number listed below. Your election to receive reports in paper will apply to all funds held with the fund complex/your financial intermediary.
| Account Type | Website | Phone Number |
| Brokerage, Mutual Fund, or Annuity Contracts: | fidelity.com/mailpreferences | 1-800-343-3548 |
| Employer Provided Retirement Accounts: | netbenefits.fidelity.com/preferences (choose 'no' under Required Disclosures to continue to print) | 1-800-343-0860 |
| Advisor Sold Accounts Serviced Through Your Financial Intermediary: | Contact Your Financial Intermediary | Your Financial Intermediary's phone number |
| Advisor Sold Accounts Serviced by Fidelity: | institutional.fidelity.com | 1-877-208-0098 |
Contents
To view a fund's proxy voting guidelines and proxy voting record for the 12-month period ended June 30, visit http://www.fidelity.com/proxyvotingresults or visit the Securities and Exchange Commission's (SEC) web site at http://www.sec.gov.
You may also call 1-800-544-8544 to request a free copy of the proxy voting guidelines.
Standard & Poor's, S&P and S&P 500 are registered service marks of The McGraw-Hill Companies, Inc. and have been licensed for use by Fidelity Distributors Corporation.
Other third-party marks appearing herein are the property of their respective owners.
All other marks appearing herein are registered or unregistered trademarks or service marks of FMR LLC or an affiliated company. © 2020 FMR LLC. All rights reserved.
This report and the financial statements contained herein are submitted for the general information of the shareholders of the Fund. This report is not authorized for distribution to prospective investors in the Fund unless preceded or accompanied by an effective prospectus.
A fund files its complete schedule of portfolio holdings with the SEC for the first and third quarters of each fiscal year on Form N-PORT. Forms N-PORT are available on the SEC’s web site at http://www.sec.gov. A fund's Forms N-PORT may be reviewed and copied at the SEC’s Public Reference Room in Washington, DC. Information regarding the operation of the SEC's Public Reference Room may be obtained by calling 1-800-SEC-0330.
For a complete list of a fund's portfolio holdings, view the most recent holdings listing, semiannual report, or annual report on Fidelity's web site at http://www.fidelity.com, http://www.institutional.fidelity.com, or http://www.401k.com, as applicable.
NOT FDIC INSURED •MAY LOSE VALUE •NO BANK GUARANTEE
Neither the Fund nor Fidelity Distributors Corporation is a bank.
Note to Shareholders:
Early in 2020, the outbreak and spread of a new coronavirus emerged as a public health emergency that had a major influence on financial markets, primarily based on its impact on the global economy and the outlook for corporate earnings. The virus causes a respiratory disease known as COVID-19. On March 11, the World Health Organization declared the COVID-19 outbreak a pandemic, citing sustained risk of further global spread.
In the weeks following, as the crisis worsened, we witnessed an escalating human tragedy with wide-scale social and economic consequences from coronavirus-containment measures. The outbreak of COVID-19 prompted a number of measures to limit the spread, including travel and border restrictions, quarantines, and restrictions on large gatherings. In turn, these resulted in lower consumer activity, diminished demand for a wide range of products and services, disruption in manufacturing and supply chains, and – given the wide variability in outcomes regarding the outbreak – significant market uncertainty and volatility. Amid the turmoil, the U.S. government took unprecedented action – in concert with the U.S. Federal Reserve and central banks around the world – to help support consumers, businesses, and the broader economy, and to limit disruption to the financial system.
The situation continues to unfold, and the extent and duration of its impact on financial markets and the economy remain highly uncertain. Extreme events such as the coronavirus crisis are “exogenous shocks” that can have significant adverse effects on mutual funds and their investments. Although multiple asset classes may be affected by market disruption, the duration and impact may not be the same for all types of assets.
Fidelity is committed to helping you stay informed amid news about COVID-19 and during increased market volatility, and we’re taking extra steps to be responsive to customer needs. We encourage you to visit our websites, where we offer ongoing updates, commentary, and analysis on the markets and our funds.
Investment Summary (Unaudited)
Top Ten Stocks
| | % of fund's net assets |
| NextEra Energy, Inc. | 11.8 |
| Dominion Energy, Inc. | 10.5 |
| Edison International | 7.1 |
| Exelon Corp. | 7.0 |
| CenterPoint Energy, Inc. | 5.2 |
| Evergy, Inc. | 5.0 |
| The AES Corp. | 5.0 |
| Southern Co. | 4.9 |
| American Electric Power Co., Inc. | 4.8 |
| Entergy Corp. | 4.8 |
| | 66.1 |
Top Industries (% of fund's net assets)
| As of August 31, 2020 |
| | Electric Utilities | 61.7% |
| | Multi-Utilities | 25.1% |
| | Independent Power and Renewable Electricity Producers | 12.6% |
| | All Others* | 0.6% |

* Includes short-term investments and net other assets (liabilities).
Schedule of Investments August 31, 2020 (Unaudited)
Showing Percentage of Net Assets
| Common Stocks - 99.4% | | | |
| | | Shares | Value |
| Electric Utilities - 61.7% | | | |
| Electric Utilities - 61.7% | | | |
| American Electric Power Co., Inc. | | 576,150 | $45,417,905 |
| Duke Energy Corp. | | 414,779 | 33,323,345 |
| Edison International | | 1,272,926 | 66,803,156 |
| Entergy Corp. | | 457,562 | 45,362,697 |
| Evergy, Inc. | | 880,325 | 46,850,897 |
| Exelon Corp. | | 1,775,689 | 65,540,681 |
| FirstEnergy Corp. | | 1,478,692 | 42,275,804 |
| NextEra Energy, Inc. | | 396,572 | 110,711,004 |
| NRG Energy, Inc. | | 560,706 | 19,293,893 |
| PG&E Corp. (a) | | 719,778 | 6,665,144 |
| PG&E Corp. (b) | | 2,719,168 | 23,920,521 |
| Pinnacle West Capital Corp. | | 119,011 | 8,729,457 |
| PNM Resources, Inc. (c) | | 163,926 | 7,160,288 |
| PPL Corp. | | 413,701 | 11,430,559 |
| Southern Co. | | 878,677 | 45,849,366 |
| | | | 579,334,717 |
| Independent Power and Renewable Electricity Producers - 12.6% | | | |
| Independent Power Producers & Energy Traders - 10.2% | | | |
| Clearway Energy, Inc.: | | | |
| Class A | | 119,624 | 2,888,920 |
| Class C | | 1,128,823 | 28,796,275 |
| The AES Corp. | | 2,631,215 | 46,704,066 |
| Vistra Corp. | | 918,110 | 17,655,255 |
| | | | 96,044,516 |
| Renewable Electricity - 2.4% | | | |
| NextEra Energy Partners LP | | 363,244 | 21,910,878 |
|
| TOTAL INDEPENDENT POWER AND RENEWABLE ELECTRICITY PRODUCERS | | | 117,955,394 |
|
| Multi-Utilities - 25.1% | | | |
| Multi-Utilities - 25.1% | | | |
| Ameren Corp. | | 161,290 | 12,759,652 |
| CenterPoint Energy, Inc. | | 2,443,908 | 49,049,234 |
| Dominion Energy, Inc. | | 1,257,188 | 98,613,827 |
| Public Service Enterprise Group, Inc. | | 698,505 | 36,489,901 |
| Sempra Energy | | 317,708 | 39,284,594 |
| | | | 236,197,208 |
| TOTAL COMMON STOCKS | | | |
| (Cost $823,093,504) | | | 933,487,319 |
|
| Money Market Funds - 0.3% | | | |
| Fidelity Cash Central Fund 0.12% (d) | | 752,545 | 752,695 |
| Fidelity Securities Lending Cash Central Fund 0.11% (d)(e) | | 2,335,791 | 2,336,024 |
| TOTAL MONEY MARKET FUNDS | | | |
| (Cost $3,088,719) | | | 3,088,719 |
| TOTAL INVESTMENT IN SECURITIES - 99.7% | | | |
| (Cost $826,182,223) | | | 936,576,038 |
| NET OTHER ASSETS (LIABILITIES) - 0.3% | | | 2,348,474 |
| NET ASSETS - 100% | | | $938,924,512 |
Legend
(a) Non-income producing
(b) Restricted securities (including private placements) - Investment in securities not registered under the Securities Act of 1933 (excluding 144A issues). At the end of the period, the value of restricted securities (excluding 144A issues) amounted to $23,920,521 or 2.5% of net assets.
(c) Security or a portion of the security is on loan at period end.
(d) Affiliated fund that is generally available only to investment companies and other accounts managed by Fidelity Investments. The rate quoted is the annualized seven-day yield of the fund at period end. A complete unaudited listing of the fund's holdings as of its most recent quarter end is available upon request. In addition, each Fidelity Central Fund's financial statements are available on the SEC's website or upon request.
(e) Investment made with cash collateral received from securities on loan.
Additional information on each restricted holding is as follows:
| Security | Acquisition Date | Acquisition Cost |
| PG&E Corp. | 6/30/20 | $25,832,096 |
Affiliated Central Funds
Information regarding fiscal year to date income earned by the Fund from investments in Fidelity Central Funds is as follows:
| Fund | Income earned |
| Fidelity Cash Central Fund | $11,603 |
| Fidelity Securities Lending Cash Central Fund | 23,193 |
| Total | $34,796 |
Amounts in the income column in the above table include any capital gain distributions from underlying funds, which are presented in the corresponding line-item in the Statement of Operations, if applicable. Amount for Fidelity Securities Lending Cash Central Fund represents the income earned on investing cash collateral, less rebates paid to borrowers and any lending agent fees associated with the loan, plus any premium payments received for lending certain types of securities.
Investment Valuation
The following is a summary of the inputs used, as of August 31, 2020, involving the Fund's assets and liabilities carried at fair value. The inputs or methodology used for valuing securities may not be an indication of the risk associated with investing in those securities. For more information on valuation inputs, and their aggregation into the levels used below, please refer to the Investment Valuation section in the accompanying Notes to Financial Statements.
| | Valuation Inputs at Reporting Date: |
| Description | Total | Level 1 | Level 2 | Level 3 |
| Investments in Securities: | | | | |
| Common Stocks | $933,487,319 | $909,566,798 | $23,920,521 | $-- |
| Money Market Funds | 3,088,719 | 3,088,719 | -- | -- |
| Total Investments in Securities: | $936,576,038 | $912,655,517 | $23,920,521 | $-- |
See accompanying notes which are an integral part of the financial statements.
Financial Statements
Statement of Assets and Liabilities
| | | August 31, 2020 (Unaudited) |
| Assets | | |
Investment in securities, at value (including securities loaned of $2,280,096) — See accompanying schedule:
Unaffiliated issuers (cost $823,093,504) | $933,487,319 | |
| Fidelity Central Funds (cost $3,088,719) | 3,088,719 | |
| Total Investment in Securities (cost $826,182,223) | | $936,576,038 |
| Receivable for investments sold | | 3,738,054 |
| Receivable for fund shares sold | | 1,102,995 |
| Dividends receivable | | 4,985,293 |
| Distributions receivable from Fidelity Central Funds | | 19,465 |
| Prepaid expenses | | 6,204 |
| Other receivables | | 16,064 |
| Total assets | | 946,444,113 |
| Liabilities | | |
| Payable for fund shares redeemed | $4,561,738 | |
| Accrued management fee | 428,211 | |
| Other affiliated payables | 175,825 | |
| Other payables and accrued expenses | 17,877 | |
| Collateral on securities loaned | 2,335,950 | |
| Total liabilities | | 7,519,601 |
| Net Assets | | $938,924,512 |
| Net Assets consist of: | | |
| Paid in capital | | $863,829,587 |
| Total accumulated earnings (loss) | | 75,094,925 |
| Net Assets | | $938,924,512 |
| Net Asset Value, offering price and redemption price per share ($938,924,512 ÷ 11,316,918 shares) | | $82.97 |
See accompanying notes which are an integral part of the financial statements.
Statement of Operations
| | | Six months ended August 31, 2020 (Unaudited) |
| Investment Income | | |
| Dividends | | $16,187,035 |
| Income from Fidelity Central Funds (including $23,193 from security lending) | | 34,796 |
| Total income | | 16,221,831 |
| Expenses | | |
| Management fee | $2,709,863 | |
| Transfer agent fees | 944,149 | |
| Accounting fees | 168,552 | |
| Custodian fees and expenses | 4,629 | |
| Independent trustees' fees and expenses | 3,598 | |
| Registration fees | 48,597 | |
| Audit | 20,337 | |
| Legal | 39,195 | |
| Interest | 961 | |
| Miscellaneous | 23,359 | |
| Total expenses before reductions | 3,963,240 | |
| Expense reductions | (61,640) | |
| Total expenses after reductions | | 3,901,600 |
| Net investment income (loss) | | 12,320,231 |
| Realized and Unrealized Gain (Loss) | | |
| Net realized gain (loss) on: | | |
| Investment securities: | | |
| Unaffiliated issuers | (44,149,349) | |
| Fidelity Central Funds | 801 | |
| Foreign currency transactions | (1,315) | |
| Total net realized gain (loss) | | (44,149,863) |
| Change in net unrealized appreciation (depreciation) on: | | |
| Investment securities: | | |
| Unaffiliated issuers | (57,355,223) | |
| Assets and liabilities in foreign currencies | 1,414 | |
| Total change in net unrealized appreciation (depreciation) | | (57,353,809) |
| Net gain (loss) | | (101,503,672) |
| Net increase (decrease) in net assets resulting from operations | | $(89,183,441) |
See accompanying notes which are an integral part of the financial statements.
Statement of Changes in Net Assets
| | Six months ended August 31, 2020 (Unaudited) | Year ended February 29, 2020 |
| Increase (Decrease) in Net Assets | | |
| Operations | | |
| Net investment income (loss) | $12,320,231 | $27,938,096 |
| Net realized gain (loss) | (44,149,863) | 71,638,581 |
| Change in net unrealized appreciation (depreciation) | (57,353,809) | (2,937,838) |
| Net increase (decrease) in net assets resulting from operations | (89,183,441) | 96,638,839 |
| Distributions to shareholders | (31,922,027) | (29,428,267) |
| Share transactions | | |
| Proceeds from sales of shares | 155,827,765 | 668,747,776 |
| Reinvestment of distributions | 30,029,865 | 27,518,824 |
| Cost of shares redeemed | (372,836,722) | (557,231,194) |
| Net increase (decrease) in net assets resulting from share transactions | (186,979,092) | 139,035,406 |
| Total increase (decrease) in net assets | (308,084,560) | 206,245,978 |
| Net Assets | | |
| Beginning of period | 1,247,009,072 | 1,040,763,094 |
| End of period | $938,924,512 | $1,247,009,072 |
| Other Information | | |
| Shares | | |
| Sold | 1,892,008 | 7,178,573 |
| Issued in reinvestment of distributions | 370,693 | 286,923 |
| Redeemed | (4,619,072) | (5,990,923) |
| Net increase (decrease) | (2,356,371) | 1,474,573 |
See accompanying notes which are an integral part of the financial statements.
Financial Highlights
Utilities Portfolio
| | Six months ended (Unaudited) August 31, | Years endedFebruary 28, | | | | |
| | 2020 | 2020 A | 2019 | 2018 | 2017 | 2016 A |
| Selected Per–Share Data | | | | | | |
| Net asset value, beginning of period | $91.20 | $85.32 | $76.75 | $77.05 | $66.88 | $72.85 |
| Income from Investment Operations | | | | | | |
| Net investment income (loss)B | .99 | 2.09 | 2.06 | 1.62 | 1.52 | 1.39 |
| Net realized and unrealized gain (loss) | (6.72) | 5.99 | 13.35 | 2.56 | 10.44 | (4.49) |
| Total from investment operations | (5.73) | 8.08 | 15.41 | 4.18 | 11.96 | (3.10) |
| Distributions from net investment income | (.16) | (1.94) | (1.37) | (1.29) | (1.77) | (1.60) |
| Distributions from net realized gain | (2.34) | (.26) | (5.46) | (3.19) | (.02) | (1.27) |
| Total distributions | (2.50) | (2.20) | (6.84)C | (4.48) | (1.79) | (2.87) |
| Redemption fees added to paid in capitalB | – | – | – | –D | –D | –D |
| Net asset value, end of period | $82.97 | $91.20 | $85.32 | $76.75 | $77.05 | $66.88 |
| Total ReturnE,F | (6.22)% | 9.34% | 20.17% | 4.99% | 18.21% | (4.19)% |
| Ratios to Average Net AssetsG,H | | | | | | |
| Expenses before reductions | .78%I | .75% | .78% | .78% | .79% | .80% |
| Expenses net of fee waivers, if any | .78%I | .75% | .78% | .78% | .79% | .79% |
| Expenses net of all reductions | .76%I | .74% | .76% | .77% | .78% | .78% |
| Net investment income (loss) | 2.42%I | 2.25% | 2.45% | 2.00% | 2.09% | 2.05% |
| Supplemental Data | | | | | | |
| Net assets, end of period (000 omitted) | $938,925 | $1,247,009 | $1,040,763 | $716,979 | $696,138 | $808,235 |
| Portfolio turnover rateJ | 78%I | 65%K | 97%K | 66%K | 70%K | 74% |
A For the year ended February 29.
B Calculated based on average shares outstanding during the period.
C Total distributions of $6.84 per share is comprised of distributions from net investment income of $1.373 and distributions from net realized gain of $5.463 per share.
D Amount represents less than $.005 per share.
E Total returns for periods of less than one year are not annualized.
F Total returns would have been lower if certain expenses had not been reduced during the applicable periods shown.
G Fees and expenses of any underlying mutual funds or exchange-traded funds (ETFs) are not included in the Fund's expense ratio. The Fund indirectly bears its proportionate share of these expenses. For additional expense information related to investments in Fidelity Central Funds, please refer to the "Investments in Fidelity Central Funds" note found in the Notes to Financial Statements section of the most recent Annual or Semi-Annual report.
H Expense ratios reflect operating expenses of the class. Expenses before reductions do not reflect amounts reimbursed, waived, or reduced through arrangements with the investment advisor, brokerage services, or other offset arrangements, if applicable, and do not represent the amount paid by the class during periods when reimbursements, waivers or reductions occur.
I Annualized
J Amount does not include the portfolio activity of any underlying Fidelity Central Funds.
K Portfolio turnover rate excludes securities received or delivered in-kind.
See accompanying notes which are an integral part of the financial statements.
Notes to Financial Statements (Unaudited)
For the period ended August 31, 2020
1. Organization.
Utilities Portfolio (the Fund) is a non-diversified fund of Fidelity Select Portfolios (the Trust) and is authorized to issue an unlimited number of shares. Share transactions on the Statement of Changes in Net Assets may contain exchanges between affiliated funds. The Trust is registered under the Investment Company Act of 1940, as amended (the 1940 Act), as an open-end management investment company organized as a Massachusetts business trust. The Fund invests primarily in securities of companies whose principal business activities fall within specific industries.
2. Investments in Fidelity Central Funds.
The Fund invests in Fidelity Central Funds, which are open-end investment companies generally available only to other investment companies and accounts managed by the investment adviser and its affiliates. The Fund's Schedule of Investments lists each of the Fidelity Central Funds held as of period end, if any, as an investment of the Fund, but does not include the underlying holdings of each Fidelity Central Fund. As an Investing Fund, the Fund indirectly bears its proportionate share of the expenses of the underlying Fidelity Central Funds.
The Money Market Central Funds seek preservation of capital and current income and are managed by the investment adviser. Annualized expenses of the Money Market Central Funds as of their most recent shareholder report date ranged from less than .005% to .01%.
A complete unaudited list of holdings for each Fidelity Central Fund is available upon request or at the Securities and Exchange Commission (the SEC) website at www.sec.gov. In addition, the financial statements of the Fidelity Central Funds are available on the SEC website or upon request.
3. Significant Accounting Policies.
The Fund is an investment company and applies the accounting and reporting guidance of the Financial Accounting Standards Board (FASB) Accounting Standards Codification Topic 946 Financial Services – Investment Companies. The financial statements have been prepared in conformity with accounting principles generally accepted in the United States of America (GAAP), which require management to make certain estimates and assumptions at the date of the financial statements. Actual results could differ from those estimates. Subsequent events, if any, through the date that the financial statements were issued have been evaluated in the preparation of the financial statements. The following summarizes the significant accounting policies of the Fund:
Investment Valuation. Investments are valued as of 4:00 p.m. Eastern time on the last calendar day of the period. The Board of Trustees (the Board) has delegated the day to day responsibility for the valuation of the Fund's investments to the Fair Value Committee (the Committee) established by the Fund's investment adviser. In accordance with valuation policies and procedures approved by the Board, the Fund attempts to obtain prices from one or more third party pricing vendors or brokers to value its investments. When current market prices, quotations or currency exchange rates are not readily available or reliable, investments will be fair valued in good faith by the Committee, in accordance with procedures adopted by the Board. Factors used in determining fair value vary by investment type and may include market or investment specific events. The frequency with which these procedures are used cannot be predicted and they may be utilized to a significant extent. The Committee oversees the Fund's valuation policies and procedures and reports to the Board on the Committee's activities and fair value determinations. The Board monitors the appropriateness of the procedures used in valuing the Fund's investments and ratifies the fair value determinations of the Committee.
The Fund categorizes the inputs to valuation techniques used to value its investments into a disclosure hierarchy consisting of three levels as shown below:
- Level 1 – quoted prices in active markets for identical investments
- Level 2 – other significant observable inputs (including quoted prices for similar investments, interest rates, prepayment speeds, etc.)
- Level 3 – unobservable inputs (including the Fund's own assumptions based on the best information available)
Valuation techniques used to value the Fund's investments by major category are as follows:
Equity securities, including restricted securities, for which market quotations are readily available, are valued at the last reported sale price or official closing price as reported by a third party pricing vendor on the primary market or exchange on which they are traded and are categorized as Level 1 in the hierarchy. In the event there were no sales during the day or closing prices are not available, securities are valued at the last quoted bid price or may be valued using the last available price and are generally categorized as Level 2 in the hierarchy. For foreign equity securities, when market or security specific events arise, comparisons to the valuation of American Depositary Receipts (ADRs), futures contracts, Exchange-Traded Funds (ETFs) and certain indexes as well as quoted prices for similar securities may be used and would be categorized as Level 2 in the hierarchy. For equity securities, including restricted securities, where observable inputs are limited, assumptions about market activity and risk are used and these securities may be categorized as Level 3 in the hierarchy.
Investments in open-end mutual funds, including the Fidelity Central Funds, are valued at their closing net asset value (NAV) each business day and are categorized as Level 1 in the hierarchy.
Changes in valuation techniques may result in transfers in or out of an assigned level within the disclosure hierarchy. The aggregate value of investments by input level as of August 31, 2020 is included at the end of the Fund's Schedule of Investments.
Foreign Currency. Certain Funds may use foreign currency contracts to facilitate transactions in foreign-denominated securities. Gains and losses from these transactions may arise from changes in the value of the foreign currency or if the counterparties do not perform under the contracts' terms.
Foreign-denominated assets, including investment securities, and liabilities are translated into U.S. dollars at the exchange rates at period end. Purchases and sales of investment securities, income and dividends received, and expenses denominated in foreign currencies are translated into U.S. dollars at the exchange rate in effect on the transaction date.
The effects of exchange rate fluctuations on investments are included with the net realized and unrealized gain (loss) on investment securities. Other foreign currency transactions resulting in realized and unrealized gain (loss) are disclosed separately.
Investment Transactions and Income. For financial reporting purposes, the Fund's investment holdings and NAV include trades executed through the end of the last business day of the period. The NAV per share for processing shareholder transactions is calculated as of the close of business of the New York Stock Exchange (NYSE), normally 4:00 p.m. Eastern time and includes trades executed through the end of the prior business day. Gains and losses on securities sold are determined on the basis of identified cost and include proceeds received from litigation. Dividend income is recorded on the ex-dividend date, except for certain dividends from foreign securities where the ex-dividend date may have passed, which are recorded as soon as the Fund is informed of the ex-dividend date. Non-cash dividends included in dividend income, if any, are recorded at the fair market value of the securities received. Income and capital gain distributions from Fidelity Central Funds, if any, are recorded on the ex-dividend date. Certain distributions received by the Fund represent a return of capital or capital gain. The Fund determines the components of these distributions subsequent to the ex-dividend date, based upon receipt of tax filings or other correspondence relating to the underlying investment. These distributions are recorded as a reduction of cost of investments and/or as a realized gain. Investment income is recorded net of foreign taxes withheld where recovery of such taxes is uncertain.
Expenses. Expenses directly attributable to a fund are charged to that fund. Expenses attributable to more than one fund are allocated among the respective funds on the basis of relative net assets or other appropriate methods. Expense estimates are accrued in the period to which they relate and adjustments are made when actual amounts are known.
Income Tax Information and Distributions to Shareholders. Each year, the Fund intends to qualify as a regulated investment company under Subchapter M of the Internal Revenue Code, including distributing substantially all of its taxable income and realized gains. As a result, no provision for U.S. Federal income taxes is required. The Fund files a U.S. federal tax return, in addition to state and local tax returns as required. The Fund's federal income tax returns are subject to examination by the Internal Revenue Service (IRS) for a period of three fiscal years after they are filed. State and local tax returns may be subject to examination for an additional fiscal year depending on the jurisdiction. Foreign taxes are provided for based on the Fund's understanding of the tax rules and rates that exist in the foreign markets in which it invests.
Distributions are declared and recorded on the ex-dividend date. Income and capital gain distributions are determined in accordance with income tax regulations, which may differ from GAAP.
Capital accounts within the financial statements are adjusted for permanent book-tax differences. These adjustments have no impact on net assets or the results of operations. Capital accounts are not adjusted for temporary book-tax differences which will reverse in a subsequent period.
Book-tax differences are primarily due to foreign currency transactions, redemptions in kind, partnerships, losses deferred due to wash sales and excise tax regulations.
As of period end, the cost and unrealized appreciation (depreciation) in securities, and derivatives if applicable, for federal income tax purposes were as follows:
| Gross unrealized appreciation | $141,063,780 |
| Gross unrealized depreciation | (38,499,341) |
| Net unrealized appreciation (depreciation) | $102,564,439 |
| Tax cost | $834,011,599 |
Restricted Securities (including Private Placements). The Fund may invest in securities that are subject to legal or contractual restrictions on resale. These securities generally may be resold in transactions exempt from registration or to the public if the securities are registered. Disposal of these securities may involve time-consuming negotiations and expense, and prompt sale at an acceptable price may be difficult. Information regarding restricted securities is included at the end of the Fund's Schedule of Investments.
4. Purchases and Sales of Investments.
Purchases and sales of securities, other than short-term securities, are noted in the table below.
| | Purchases ($) | Sales ($) |
| Utilities Portfolio | 400,486,390 | 605,846,436 |
5. Fees and Other Transactions with Affiliates.
Management Fee. Fidelity Management & Research Company LLC (the investment adviser) and its affiliates provide the Fund with investment management related services for which the Fund pays a monthly management fee. The management fee is the sum of an individual fund fee rate that is based on an annual rate of .30% of the Fund's average net assets and an annualized group fee rate that averaged .23% during the period. The group fee rate is based upon the monthly average net assets of a group of registered investment companies with which the investment adviser has management contracts. The group fee rate decreases as assets under management increase and increases as assets under management decrease. For the reporting period, the total annualized management fee rate was .53% of the Fund's average net assets.
Transfer Agent Fees. Fidelity Investments Institutional Operations Company LLC (FIIOC), an affiliate of the investment adviser, is the Fund's transfer, dividend disbursing and shareholder servicing agent. FIIOC receives account fees and asset-based fees that vary according to account size and type of account. FIIOC pays for typesetting, printing and mailing of shareholder reports, except proxy statements. For the period, the transfer agent fees were equivalent to an annualized rate of .19% of average net assets.
Accounting Fees. Fidelity Service Company, Inc. (FSC), an affiliate of the investment adviser, maintains the Fund's accounting records. The accounting fee is based on the level of average net assets for each month. For the period, the fees were equivalent to the following annualized rates:
| | % of Average Net Assets |
| Utilities Portfolio | .03 |
Brokerage Commissions. A portion of portfolio transactions were placed with brokerage firms which are affiliates of the investment adviser. Brokerage commissions are included in net realized gain (loss) and change in net unrealized appreciation (depreciation) in the Statement of Operations. The commissions paid to these affiliated firms were as follows:
| | Amount |
| Utilities Portfolio | 26,754 |
Interfund Lending Program. Pursuant to an Exemptive Order issued by the SEC, the fund, along with other registered investment companies having management contracts with Fidelity Management & Research Company LLC (FMR), or other affiliated entities of FMR, may participate in an interfund lending program. This program provides an alternative credit facility allowing the fund to borrow from, or lend money to, other participating affiliated funds. At period end, no interfund loans outstanding. Activity in this program during the period for which loans were outstanding was as follows:
| | Borrower or Lender | Average Loan Balance | Weighted Average Interest Rate | Interest Expense |
| Utilities Portfolio | Borrower | $11,327,250 | .76% | $961 |
Interfund Trades. Funds may purchase from or sell securities to other Fidelity Funds under procedures adopted by the Board. The procedures have been designed to ensure these interfund trades are executed in accordance with Rule 17a-7 of the 1940 Act. Interfund trades are included within the respective purchases and sales amounts shown in the Purchases and Sales of Investments note.
Prior Fiscal Year Affiliated Redemptions In-Kind. During the prior period, 272,865 shares of the Fund were redeemed in-kind for investments and cash with a value of $24,994,414. The Fund had a net realized gain of $7,538,422 on investments delivered through in-kind redemptions. The amount of the in-kind redemptions is included in share transactions in the accompanying Statement of Changes in Net Assets. The Fund recognized no gain or loss for federal income tax purposes.
6. Committed Line of Credit.
Certain Funds participate with other funds managed by the investment adviser or an affiliate in a $4.25 billion credit facility (the "line of credit") to be utilized for temporary or emergency purposes to fund shareholder redemptions or for other short-term liquidity purposes. The participating funds have agreed to pay commitment fees on their pro-rata portion of the line of credit, which are reflected in Miscellaneous expenses on the Statement of Operations, and are as follows:
| | Amount |
| Utilities Portfolio | $1,441 |
During the period, there were no borrowings on this line of credit.
7. Security Lending.
The Fund lends portfolio securities from time to time in order to earn additional income. Lending agents are used, including National Financial Services (NFS), an affiliate of the Fund. Pursuant to a securities lending agreement, NFS will receive a fee, which is capped at 9.9% of daily lending revenue, for its services as lending agent. The Fund may lend securities to certain qualified borrowers, including NFS. On the settlement date of the loan, the Fund receives collateral (in the form of U.S. Treasury obligations, letters of credit and/or cash) against the loaned securities and maintains collateral in an amount not less than 100% of the market value of the loaned securities during the period of the loan. The market value of the loaned securities is determined at the close of business of the Fund and any additional required collateral is delivered to the Fund on the next business day. The Fund or borrower may terminate the loan at any time, and if the borrower defaults on its obligation to return the securities loaned because of insolvency or other reasons, the Fund may apply collateral received from the borrower against the obligation. The Fund may experience delays and costs in recovering the securities loaned. Any cash collateral received is invested in the Fidelity Securities Lending Cash Central Fund. The value of loaned securities and cash collateral at period end are disclosed on the Fund's Statement of Assets and Liabilities. Total fees paid by the Fund to NFS, as lending agent, amounted to $1,446. Security lending income represents the income earned on investing cash collateral, less rebates paid to borrowers and any lending agent fees associated with the loan, plus any premium payments received for lending certain types of securities. Net income from the Fidelity Securities Lending Cash Central Fund during the period is presented in the Statement of Operations as a component of income from Fidelity Central Funds. During the period, there were no securities loaned to NFS.
8. Expense Reductions.
Commissions paid to certain brokers with whom the investment adviser, or its affiliates, places trades on behalf of the Fund include an amount in addition to trade execution, which may be rebated back to the Fund to offset certain expenses. This amount totaled $59,046 for the period.
In addition, during the period the investment adviser or an affiliate reimbursed and/or waived a portion of operating expenses in the amount of $2,594.
9. Other.
The Fund's organizational documents provide former and current trustees and officers with a limited indemnification against liabilities arising in connection with the performance of their duties to the Fund. In the normal course of business, the Fund may also enter into contracts that provide general indemnifications. The Fund's maximum exposure under these arrangements is unknown as this would be dependent on future claims that may be made against the Fund. The risk of material loss from such claims is considered remote.
10. Coronavirus (COVID-19) Pandemic.
An outbreak of COVID-19 first detected in China during December 2019 has since spread globally and was declared a pandemic by the World Health Organization during March 2020. Developments that disrupt global economies and financial markets, such as the COVID-19 pandemic, may magnify factors that affect the Fund's performance.
Shareholder Expense Example
As a shareholder, you incur two types of costs: (1) transaction costs, which may include sales charges (loads) on purchase payments or redemption proceeds, as applicable and (2) ongoing costs, which generally include management fees, distribution and/or service (12b-1) fees and other Fund expenses. This Example is intended to help you understand your ongoing costs (in dollars) of investing in a fund and to compare these costs with the ongoing costs of investing in other mutual funds.
The Example is based on an investment of $1,000 invested at the beginning of the period and held for the entire period (March 1, 2020 to August 31, 2020).
Actual Expenses
The first line of the accompanying table provides information about actual account values and actual expenses. You may use the information in this line, together with the amount you invested, to estimate the expenses that you paid over the period. Simply divide your account value by $1,000.00 (for example, an $8,600 account value divided by $1,000.00 = 8.6), then multiply the result by the number in the first line for a class/Fund under the heading entitled "Expenses Paid During Period" to estimate the expenses you paid on your account during this period. If any fund is a shareholder of any underlying mutual funds or exchange-traded funds (ETFs) (the Underlying Funds), such fund indirectly bears its proportional share of the expenses of the Underlying Funds in addition to the direct expenses incurred presented in the table. These fees and expenses are not included in the annualized expense ratio used to calculate the expense estimate in the table below.
Hypothetical Example for Comparison Purposes
The second line of the accompanying table provides information about hypothetical account values and hypothetical expenses based on the actual expense ratio and an assumed rate of return of 5% per year before expenses, which is not the actual return. The hypothetical account values and expenses may not be used to estimate the actual ending account balance or expenses you paid for the period. You may use this information to compare the ongoing costs of investing in the Fund and other funds. To do so, compare this 5% hypothetical example with the 5% hypothetical examples that appear in the shareholder reports of the other funds. If any fund is a shareholder of any Underlying Funds, such fund indirectly bears its proportional share of the expenses of the Underlying Funds in addition to the direct expenses as presented in the table. These fees and expenses are not included in the annualized expense ratio used to calculate the expense estimate in the table below.
Please note that the expenses shown in the table are meant to highlight your ongoing costs only and do not reflect any transaction costs. Therefore, the second line of the table is useful in comparing ongoing costs only, and will not help you determine the relative total costs of owning different funds. In addition, if these transactional costs were included, your costs would have been higher.
| | Annualized Expense Ratio-A | Beginning
Account Value
March 1, 2020 | Ending
Account Value
August 31, 2020 | Expenses Paid
During Period-B
March 1, 2020
to August 31, 2020 |
| Utilities Portfolio | .78% | | | |
| Actual | | $1,000.00 | $937.80 | $3.81 |
| Hypothetical-C | | $1,000.00 | $1,021.27 | $3.97 |
A Annualized expense ratio reflects expenses net of applicable fee waivers.
B Expenses are equal to the annualized expense ratio, multiplied by the average account value over the period, multiplied by 184/ 365 (to reflect the one-half year period). The fees and expenses of any Underlying Funds are not included in each annualized expense ratio.
C 5% return per year before expenses
Proxy Voting Results
A special meeting of shareholders was held on June 9, 2020. The results of votes taken among shareholders on the proposal before them are reported below. Each vote reported represents one dollar of net asset value held on the record date for the meeting.
PROPOSAL 1
To elect a Board of Trustees.
| | # of
Votes | % of
Votes |
| Dennis J. Dirks |
| Affirmative | 32,463,705,305.665 | 92.437 |
| Withheld | 2,655,951,104.308 | 7.563 |
| TOTAL | 35,119,656,409.973 | 100.000 |
| Donald F. Donahue |
| Affirmative | 32,446,843,861.354 | 92.389 |
| Withheld | 2,672,812,548.619 | 7.611 |
| TOTAL | 35,119,656,409.973 | 100.000 |
| Bettina Doulton |
| Affirmative | 32,610,463,757.584 | 92.855 |
| Withheld | 2,509,192,652.389 | 7.145 |
| TOTAL | 35,119,656,409.973 | 100.000 |
| Vicki L. Fuller |
| Affirmative | 32,688,213,522.720 | 93.077 |
| Withheld | 2,431,442,887.253 | 6.923 |
| TOTAL | 35,119,656,409.973 | 100.000 |
| Patricia L. Kampling |
| Affirmative | 32,313,755,598.535 | 92.010 |
| Withheld | 2,805,900,811.438 | 7.990 |
| TOTAL | 35,119,656,409.973 | 100.000 |
| Alan J. Lacy |
| Affirmative | 31,990,158,754.948 | 91.089 |
| Withheld | 3,129,497,655.026 | 8.911 |
| TOTAL | 35,119,656,409.973 | 100.000 |
| Ned C. Lautenbach |
| Affirmative | 32,043,019,991.143 | 91.240 |
| Withheld | 3,076,636,418.830 | 8.760 |
| TOTAL | 35,119,656,409.973 | 100.000 |
| Robert A. Lawrence |
| Affirmative | 32,150,842,398.009 | 91.547 |
| Withheld | 2,968,814,011.965 | 8.453 |
| TOTAL | 35,119,656,409.973 | 100.000 |
| Joseph Mauriello |
| Affirmative | 32,082,201,213.166 | 91.351 |
| Withheld | 3,037,455,196.807 | 8.649 |
| TOTAL | 35,119,656,409.973 | 100.000 |
| Cornelia M. Small |
| Affirmative | 32,207,976,835.934 | 91.709 |
| Withheld | 2,911,679,574.039 | 8.291 |
| TOTAL | 35,119,656,409.973 | 100.000 |
| Garnett A. Smith |
| Affirmative | 32,102,654,343.096 | 91.409 |
| Withheld | 3,017,002,066.877 | 8.591 |
| TOTAL | 35,119,656,409.973 | 100.000 |
| David M. Thomas |
| Affirmative | 32,150,749,424.556 | 91.546 |
| Withheld | 2,968,906,985.418 | 8.454 |
| TOTAL | 35,119,656,409.973 | 100.000 |
| Susan Tomasky |
| Affirmative | 32,381,933,484.515 | 92.205 |
| Withheld | 2,737,722,925.459 | 7.795 |
| TOTAL | 35,119,656,409.973 | 100.000 |
| Michael E. Wiley |
| Affirmative | 32,135,064,741.973 | 91.502 |
| Withheld | 2,984,591,668.000 | 8.498 |
| TOTAL | 35,119,656,409.973 | 100.000 |
|
| Proposal 1 reflects trust wide proposal and voting results. |
SELUTL-SANN-1020
1.813630.115
Fidelity® Select Portfolios®
Materials Sector
Chemicals Portfolio
Gold Portfolio
Materials Portfolio
Semi-Annual Report
August 31, 2020
Includes Fidelity and Fidelity Advisor share classes
See the inside front cover for important information about access to your fund’s shareholder reports.
Beginning on January 1, 2021, as permitted by regulations adopted by the Securities and Exchange Commission, paper copies of a fund’s shareholder reports will no longer be sent by mail, unless you specifically request paper copies of the reports from the fund or from your financial intermediary, such as a financial advisor, broker-dealer or bank. Instead, the reports will be made available on a website, and you will be notified by mail each time a report is posted and provided with a website link to access the report.
If you already elected to receive shareholder reports electronically, you will not be affected by this change and you need not take any action. You may elect to receive shareholder reports and other communications from a fund electronically, by contacting your financial intermediary. For Fidelity customers, visit Fidelity's web site or call Fidelity using the contact information listed below.
You may elect to receive all future reports in paper free of charge. If you wish to continue receiving paper copies of your shareholder reports, you may contact your financial intermediary or, if you are a Fidelity customer, visit Fidelity’s website, or call Fidelity at the applicable toll-free number listed below. Your election to receive reports in paper will apply to all funds held with the fund complex/your financial intermediary.
| Account Type | Website | Phone Number |
| Brokerage, Mutual Fund, or Annuity Contracts: | fidelity.com/mailpreferences | 1-800-343-3548 |
| Employer Provided Retirement Accounts: | netbenefits.fidelity.com/preferences (choose 'no' under Required Disclosures to continue to print) | 1-800-343-0860 |
| Advisor Sold Accounts Serviced Through Your Financial Intermediary: | Contact Your Financial Intermediary | Your Financial Intermediary's phone number |
| Advisor Sold Accounts Serviced by Fidelity: | institutional.fidelity.com | 1-877-208-0098 |
Contents
To view a fund's proxy voting guidelines and proxy voting record for the 12-month period ended June 30, visit http://www.fidelity.com/proxyvotingresults or visit the Securities and Exchange Commission's (SEC) web site at http://www.sec.gov.
You may also call 1-800-544-8544 if you’re an individual investing directly with Fidelity, call 1-800-835-5092 if you’re a plan sponsor or participant with Fidelity as your recordkeeper or call 1-877-208-0098 on institutional accounts or if you’re an advisor or invest through one to request a free copy of the proxy voting guidelines.
Standard & Poor's, S&P and S&P 500 are registered service marks of The McGraw-Hill Companies, Inc. and have been licensed for use by Fidelity Distributors Corporation.
Other third-party marks appearing herein are the property of their respective owners.
All other marks appearing herein are registered or unregistered trademarks or service marks of FMR LLC or an affiliated company. © 2020 FMR LLC. All rights reserved.
This report and the financial statements contained herein are submitted for the general information of the shareholders of the Funds. This report is not authorized for distribution to prospective investors in the Funds unless preceded or accompanied by an effective prospectus.
A fund files its complete schedule of portfolio holdings with the SEC for the first and third quarters of each fiscal year on Form N-PORT. Forms N-PORT are available on the SEC’s web site at http://www.sec.gov. A fund's Forms N-PORT may be reviewed and copied at the SEC’s Public Reference Room in Washington, DC. Information regarding the operation of the SEC's Public Reference Room may be obtained by calling 1-800-SEC-0330.
For a complete list of a fund's portfolio holdings, view the most recent holdings listing, semiannual report, or annual report on Fidelity's web site at http://www.fidelity.com, http://www.institutional.fidelity.com, or http://www.401k.com, as applicable.
NOT FDIC INSURED •MAY LOSE VALUE •NO BANK GUARANTEE
Neither the Funds nor Fidelity Distributors Corporation is a bank.
Note to Shareholders:
Early in 2020, the outbreak and spread of a new coronavirus emerged as a public health emergency that had a major influence on financial markets, primarily based on its impact on the global economy and the outlook for corporate earnings. The virus causes a respiratory disease known as COVID-19. On March 11, the World Health Organization declared the COVID-19 outbreak a pandemic, citing sustained risk of further global spread.
In the weeks following, as the crisis worsened, we witnessed an escalating human tragedy with wide-scale social and economic consequences from coronavirus-containment measures. The outbreak of COVID-19 prompted a number of measures to limit the spread, including travel and border restrictions, quarantines, and restrictions on large gatherings. In turn, these resulted in lower consumer activity, diminished demand for a wide range of products and services, disruption in manufacturing and supply chains, and – given the wide variability in outcomes regarding the outbreak – significant market uncertainty and volatility. Amid the turmoil, the U.S. government took unprecedented action – in concert with the U.S. Federal Reserve and central banks around the world – to help support consumers, businesses, and the broader economy, and to limit disruption to the financial system.
The situation continues to unfold, and the extent and duration of its impact on financial markets and the economy remain highly uncertain. Extreme events such as the coronavirus crisis are “exogenous shocks” that can have significant adverse effects on mutual funds and their investments. Although multiple asset classes may be affected by market disruption, the duration and impact may not be the same for all types of assets.
Fidelity is committed to helping you stay informed amid news about COVID-19 and during increased market volatility, and we’re taking extra steps to be responsive to customer needs. We encourage you to visit our websites, where we offer ongoing updates, commentary, and analysis on the markets and our funds.
Chemicals Portfolio
Investment Summary (Unaudited)
Top Ten Stocks as of August 31, 2020
| | % of fund's net assets |
| Linde PLC | 19.7 |
| Sherwin-Williams Co. | 8.9 |
| Air Products & Chemicals, Inc. | 8.1 |
| DuPont de Nemours, Inc. | 7.2 |
| Ecolab, Inc. | 5.6 |
| PPG Industries, Inc. | 5.0 |
| FMC Corp. | 3.4 |
| RPM International, Inc. | 3.1 |
| Huntsman Corp. | 3.1 |
| Celanese Corp. Class A | 3.0 |
| | 67.1 |
Top Industries (% of fund's net assets)
| As of August 31, 2020 |
| | Chemicals | 98.5% |
| | Trading Companies & Distributors | 1.0% |
| | Containers & Packaging | 0.3% |
| | All Others* | 0.2% |

* Includes Short-Term investments and Net Other Assets (Liabilities).
Chemicals Portfolio
Schedule of Investments August 31, 2020 (Unaudited)
Showing Percentage of Net Assets
| Common Stocks - 99.8% | | | |
| | | Shares | Value |
| Chemicals - 98.5% | | | |
| Commodity Chemicals - 10.5% | | | |
| Cabot Corp. | | 258,600 | $9,570,786 |
| Dow, Inc. | | 410,500 | 18,521,760 |
| LyondellBasell Industries NV Class A | | 226,300 | 14,818,124 |
| Olin Corp. | | 148,300 | 1,668,375 |
| Orion Engineered Carbons SA | | 714,426 | 8,680,276 |
| Tronox Holdings PLC | | 1,059,069 | 9,489,258 |
| Westlake Chemical Corp. (a) | | 110,956 | 6,581,910 |
| | | | 69,330,489 |
| Diversified Chemicals - 8.5% | | | |
| Eastman Chemical Co. | | 220,800 | 16,142,688 |
| Huntsman Corp. | | 944,900 | 20,428,738 |
| The Chemours Co. LLC (a) | | 937,359 | 19,365,837 |
| | | | 55,937,263 |
| Fertilizers & Agricultural Chemicals - 8.0% | | | |
| CF Industries Holdings, Inc. | | 191,417 | 6,245,937 |
| Corteva, Inc. | | 465,693 | 13,295,535 |
| FMC Corp. | | 209,116 | 22,346,136 |
| The Mosaic Co. | | 343,900 | 6,269,297 |
| The Scotts Miracle-Gro Co. Class A | | 29,000 | 4,887,370 |
| | | | 53,044,275 |
| Industrial Gases - 27.8% | | | |
| Air Products & Chemicals, Inc. | | 181,811 | 53,136,083 |
| Linde PLC | | 519,816 | 129,818,847 |
| | | | 182,954,930 |
| Specialty Chemicals - 43.7% | | | |
| Albemarle Corp. U.S. (a) | | 19,800 | 1,801,998 |
| Ashland Global Holdings, Inc. | | 156,200 | 11,510,378 |
| Celanese Corp. Class A | | 197,700 | 19,997,355 |
| DuPont de Nemours, Inc. | | 852,493 | 47,535,010 |
| Ecolab, Inc. | | 185,800 | 36,617,464 |
| Element Solutions, Inc. (b) | | 1,371,743 | 14,746,237 |
| H.B. Fuller Co. | | 200,200 | 9,643,634 |
| Innospec, Inc. | | 115,600 | 8,634,164 |
| Livent Corp. (b) | | 200 | 1,696 |
| PolyOne Corp. | | 284,200 | 7,252,784 |
| PPG Industries, Inc. | | 274,900 | 33,097,960 |
| Quaker Chemical Corp. (a) | | 48,900 | 9,291,000 |
| RPM International, Inc. | | 243,100 | 20,607,587 |
| Sherwin-Williams Co. | | 87,333 | 58,604,810 |
| W.R. Grace & Co. | | 208,400 | 8,483,964 |
| | | | 287,826,041 |
|
| TOTAL CHEMICALS | | | 649,092,998 |
|
| Containers & Packaging - 0.3% | | | |
| Metal & Glass Containers - 0.3% | | | |
| O-I Glass, Inc. | | 177,900 | 1,935,552 |
| Trading Companies & Distributors - 1.0% | | | |
| Trading Companies & Distributors - 1.0% | | | |
| Univar, Inc. (b) | | 351,500 | 6,393,785 |
| TOTAL COMMON STOCKS | | | |
| (Cost $501,828,636) | | | 657,422,335 |
|
| Money Market Funds - 1.5% | | | |
| Fidelity Securities Lending Cash Central Fund 0.11% (c)(d) | | | |
| (Cost $10,103,677) | | 10,102,667 | 10,103,677 |
| TOTAL INVESTMENT IN SECURITIES - 101.3% | | | |
| (Cost $511,932,313) | | | 667,526,012 |
| NET OTHER ASSETS (LIABILITIES) - (1.3)% | | | (8,703,875) |
| NET ASSETS - 100% | | | $658,822,137 |
Legend
(a) Security or a portion of the security is on loan at period end.
(b) Non-income producing
(c) Affiliated fund that is generally available only to investment companies and other accounts managed by Fidelity Investments. The rate quoted is the annualized seven-day yield of the fund at period end. A complete unaudited listing of the fund's holdings as of its most recent quarter end is available upon request. In addition, each Fidelity Central Fund's financial statements are available on the SEC's website or upon request.
(d) Investment made with cash collateral received from securities on loan.
Affiliated Central Funds
Information regarding fiscal year to date income earned by the Fund from investments in Fidelity Central Funds is as follows:
| Fund | Income earned |
| Fidelity Cash Central Fund | $5,867 |
| Fidelity Securities Lending Cash Central Fund | 61,597 |
| Total | $67,464 |
Amounts in the income column in the above table include any capital gain distributions from underlying funds, which are presented in the corresponding line-item in the Statement of Operations, if applicable. Amount for Fidelity Securities Lending Cash Central Fund represents the income earned on investing cash collateral, less rebates paid to borrowers and any lending agent fees associated with the loan, plus any premium payments received for lending certain types of securities.
Investment Valuation
The following is a summary of the inputs used, as of August 31, 2020, involving the Fund's assets and liabilities carried at fair value. The inputs or methodology used for valuing securities may not be an indication of the risk associated with investing in those securities. For more information on valuation inputs, and their aggregation into the levels used below, please refer to the Investment Valuation section in the accompanying Notes to Financial Statements.
| | Valuation Inputs at Reporting Date: |
| Description | Total | Level 1 | Level 2 | Level 3 |
| Investments in Securities: | | | | |
| Common Stocks | $657,422,335 | $657,422,335 | $-- | $-- |
| Money Market Funds | 10,103,677 | 10,103,677 | -- | -- |
| Total Investments in Securities: | $667,526,012 | $667,526,012 | $-- | $-- |
Other Information
Distribution of investments by country or territory of incorporation, as a percentage of Total Net Assets, is as follows (Unaudited):
| United States of America | 75.4% |
| Ireland | 19.7% |
| Netherlands | 2.2% |
| United Kingdom | 1.4% |
| Luxembourg | 1.3% |
| | 100.0% |
See accompanying notes which are an integral part of the financial statements.
Chemicals Portfolio
Financial Statements
Statement of Assets and Liabilities
| | | August 31, 2020 (Unaudited) |
| Assets | | |
Investment in securities, at value (including securities loaned of $9,589,695) — See accompanying schedule:
Unaffiliated issuers (cost $501,828,636) | $657,422,335 | |
| Fidelity Central Funds (cost $10,103,677) | 10,103,677 | |
| Total Investment in Securities (cost $511,932,313) | | $667,526,012 |
| Receivable for investments sold | | 1,665,935 |
| Receivable for fund shares sold | | 138,348 |
| Dividends receivable | | 2,199,266 |
| Distributions receivable from Fidelity Central Funds | | 3,929 |
| Prepaid expenses | | 11,290 |
| Other receivables | | 143,327 |
| Total assets | | 671,688,107 |
| Liabilities | | |
| Payable to custodian bank | $1,125 | |
| Payable for fund shares redeemed | 2,198,193 | |
| Accrued management fee | 295,001 | |
| Other affiliated payables | 135,419 | |
| Other payables and accrued expenses | 144,707 | |
| Collateral on securities loaned | 10,091,525 | |
| Total liabilities | | 12,865,970 |
| Net Assets | | $658,822,137 |
| Net Assets consist of: | | |
| Paid in capital | | $555,559,305 |
| Total accumulated earnings (loss) | | 103,262,832 |
| Net Assets | | $658,822,137 |
| Net Asset Value, offering price and redemption price per share ($658,822,137 ÷ 53,662,370 shares) | | $12.28 |
See accompanying notes which are an integral part of the financial statements.
Statement of Operations
| | | Six months ended August 31, 2020 (Unaudited) |
| Investment Income | | |
| Dividends | | $7,260,614 |
| Income from Fidelity Central Funds (including $61,597 from security lending) | | 67,464 |
| Total income | | 7,328,078 |
| Expenses | | |
| Management fee | $1,631,246 | |
| Transfer agent fees | 685,929 | |
| Accounting fees | 112,833 | |
| Custodian fees and expenses | 5,323 | |
| Independent trustees' fees and expenses | 2,064 | |
| Registration fees | 14,572 | |
| Audit | 25,685 | |
| Legal | 2,892 | |
| Miscellaneous | 19,175 | |
| Total expenses before reductions | 2,499,719 | |
| Expense reductions | (67,477) | |
| Total expenses after reductions | | 2,432,242 |
| Net investment income (loss) | | 4,895,836 |
| Realized and Unrealized Gain (Loss) | | |
| Net realized gain (loss) on: | | |
| Investment securities: | | |
| Unaffiliated issuers | (15,914,766) | |
| Fidelity Central Funds | 5,912 | |
| Total net realized gain (loss) | | (15,908,854) |
| Change in net unrealized appreciation (depreciation) on: | | |
| Investment securities: | | |
| Unaffiliated issuers | 107,970,090 | |
| Assets and liabilities in foreign currencies | 26,011 | |
| Total change in net unrealized appreciation (depreciation) | | 107,996,101 |
| Net gain (loss) | | 92,087,247 |
| Net increase (decrease) in net assets resulting from operations | | $96,983,083 |
See accompanying notes which are an integral part of the financial statements.
Statement of Changes in Net Assets
| | Six months ended August 31, 2020 (Unaudited) | Year ended February 29, 2020 |
| Increase (Decrease) in Net Assets | | |
| Operations | | |
| Net investment income (loss) | $4,895,836 | $11,421,771 |
| Net realized gain (loss) | (15,908,854) | (16,186,423) |
| Change in net unrealized appreciation (depreciation) | 107,996,101 | (153,952,494) |
| Net increase (decrease) in net assets resulting from operations | 96,983,083 | (158,717,146) |
| Distributions to shareholders | – | (64,898,786) |
| Share transactions | | |
| Proceeds from sales of shares | 24,521,117 | 51,439,480 |
| Reinvestment of distributions | – | 61,546,519 |
| Cost of shares redeemed | (119,123,265) | (386,307,907) |
| Net increase (decrease) in net assets resulting from share transactions | (94,602,148) | (273,321,908) |
| Total increase (decrease) in net assets | 2,380,935 | (496,937,840) |
| Net Assets | | |
| Beginning of period | 656,441,202 | 1,153,379,042 |
| End of period | $658,822,137 | $656,441,202 |
| Other Information | | |
| Shares | | |
| Sold | 2,412,540 | 4,140,804 |
| Issued in reinvestment of distributions | – | 4,713,661 |
| Redeemed | (11,422,978) | (31,186,535) |
| Net increase (decrease) | (9,010,438) | (22,332,070) |
See accompanying notes which are an integral part of the financial statements.
Financial Highlights
Chemicals Portfolio
| | Six months ended (Unaudited) August 31, | Years endedFebruary 28, | | | | |
| | 2020 | 2020 A | 2019 B | 2018 B | 2017 B | 2016 A,B |
| Selected Per–Share Data | | | | | | |
| Net asset value, beginning of period | $10.47 | $13.57 | $17.34 | $16.24 | $12.32 | $15.33 |
| Income from Investment Operations | | | | | | |
| Net investment income (loss)C | .08 | .15 | .23 | .19 | .18 | .19 |
| Net realized and unrealized gain (loss) | 1.73 | (2.39) | (2.17) | 2.36 | 4.44 | (2.34) |
| Total from investment operations | 1.81 | (2.24) | (1.94) | 2.55 | 4.62 | (2.15) |
| Distributions from net investment income | – | (.20) | (.21) | (.16) | (.17) | (.18) |
| Distributions from net realized gain | – | (.66) | (1.62) | (1.29) | (.53) | (.68) |
| Total distributions | – | (.86) | (1.83) | (1.45) | (.70) | (.86) |
| Redemption fees added to paid in capitalC | – | – | – | – | –D | –D |
| Net asset value, end of period | $12.28 | $10.47 | $13.57 | $17.34 | $16.24 | $12.32 |
| Total ReturnE,F | 17.29% | (17.63)% | (11.10)% | 16.31% | 38.02% | (14.46)% |
| Ratios to Average Net AssetsG,H | | | | | | |
| Expenses before reductions | .81%I | .78% | .77% | .77% | .80% | .80% |
| Expenses net of fee waivers, if any | .81%I | .78% | .77% | .77% | .80% | .80% |
| Expenses net of all reductions | .79%I | .77% | .76% | .77% | .79% | .79% |
| Net investment income (loss) | 1.59%I | 1.21% | 1.50% | 1.12% | 1.26% | 1.36% |
| Supplemental Data | | | | | | |
| Net assets, end of period (000 omitted) | $658,822 | $656,441 | $1,153,379 | $1,790,221 | $1,626,642 | $1,046,827 |
| Portfolio turnover rateJ | 66%I | 77% | 62% | 62% | 85% | 79% |
A For the year ended February 29.
B Per share amounts have been adjusted to reflect the impact of the 10 for 1 share split that occurred on August 10, 2018.
C Calculated based on average shares outstanding during the period.
D Amount represents less than $.005 per share.
E Total returns for periods of less than one year are not annualized.
F Total returns would have been lower if certain expenses had not been reduced during the applicable periods shown.
G Fees and expenses of any underlying mutual funds or exchange-traded funds (ETFs) are not included in the Fund's expense ratio. The Fund indirectly bears its proportionate share of these expenses. For additional expense information related to investments in Fidelity Central Funds, please refer to the "Investments in Fidelity Central Funds" note found in the Notes to Financial Statements section of the most recent Annual or Semi-Annual report.
H Expense ratios reflect operating expenses of the class. Expenses before reductions do not reflect amounts reimbursed, waived, or reduced through arrangements with the investment advisor, brokerage services, or other offset arrangements, if applicable, and do not represent the amount paid by the class during periods when reimbursements, waivers or reductions occur.
I Annualized
J Amount does not include the portfolio activity of any underlying Fidelity Central Funds.
See accompanying notes which are an integral part of the financial statements.
Notes to Financial Statements (Unaudited)
For the period ended August 31, 2020
1. Organization.
Chemicals Portfolio (the Fund) is a non-diversified fund of Fidelity Select Portfolios (the Trust) and is authorized to issue an unlimited number of shares. Share transactions on the Statement of Changes in Net Assets may contain exchanges between affiliated funds. The Trust is registered under the Investment Company Act of 1940, as amended (the 1940 Act), as an open-end management investment company organized as a Massachusetts business trust. The Fund invests primarily in securities of companies whose principal business activities fall within specific industries.
2. Investments in Fidelity Central Funds.
The Fund invests in Fidelity Central Funds, which are open-end investment companies generally available only to other investment companies and accounts managed by the investment adviser and its affiliates. The Fund's Schedule of Investments lists each of the Fidelity Central Funds held as of period end, if any, as an investment of the Fund, but does not include the underlying holdings of each Fidelity Central Fund. As an Investing Fund, the Fund indirectly bears its proportionate share of the expenses of the underlying Fidelity Central Funds.
The Money Market Central Funds seek preservation of capital and current income and are managed by the investment adviser. Annualized expenses of the Money Market Central Funds as of their most recent shareholder report date ranged from less than .005% to .01%.
A complete unaudited list of holdings for each Fidelity Central Fund is available upon request or at the Securities and Exchange Commission (the SEC) website at www.sec.gov. In addition, the financial statements of the Fidelity Central Funds are available on the SEC website or upon request.
3. Significant Accounting Policies.
The Fund is an investment company and applies the accounting and reporting guidance of the Financial Accounting Standards Board (FASB) Accounting Standards Codification Topic 946 Financial Services – Investment Companies. The financial statements have been prepared in conformity with accounting principles generally accepted in the United States of America (GAAP), which require management to make certain estimates and assumptions at the date of the financial statements. Actual results could differ from those estimates. Subsequent events, if any, through the date that the financial statements were issued have been evaluated in the preparation of the financial statements. The following summarizes the significant accounting policies of the Fund:
Investment Valuation. Investments are valued as of 4:00 p.m. Eastern time on the last calendar day of the period. The Board of Trustees (the Board) has delegated the day to day responsibility for the valuation of the Fund's investments to the Fair Value Committee (the Committee) established by the Fund's investment adviser. In accordance with valuation policies and procedures approved by the Board, the Fund attempts to obtain prices from one or more third party pricing vendors or brokers to value its investments. When current market prices, quotations or currency exchange rates are not readily available or reliable, investments will be fair valued in good faith by the Committee, in accordance with procedures adopted by the Board. Factors used in determining fair value vary by investment type and may include market or investment specific events. The frequency with which these procedures are used cannot be predicted and they may be utilized to a significant extent. The Committee oversees the Fund's valuation policies and procedures and reports to the Board on the Committee's activities and fair value determinations. The Board monitors the appropriateness of the procedures used in valuing the Fund's investments and ratifies the fair value determinations of the Committee.
The Fund categorizes the inputs to valuation techniques used to value its investments into a disclosure hierarchy consisting of three levels as shown below:
- Level 1 – quoted prices in active markets for identical investments
- Level 2 – other significant observable inputs (including quoted prices for similar investments, interest rates, prepayment speeds, etc.)
- Level 3 – unobservable inputs (including the Fund's own assumptions based on the best information available)
Valuation techniques used to value the Fund's investments by major category are as follows:
Equity securities, including restricted securities, for which market quotations are readily available, are valued at the last reported sale price or official closing price as reported by a third party pricing vendor on the primary market or exchange on which they are traded and are categorized as Level 1 in the hierarchy. In the event there were no sales during the day or closing prices are not available, securities are valued at the last quoted bid price or may be valued using the last available price and are generally categorized as Level 2 in the hierarchy. For foreign equity securities, when market or security specific events arise, comparisons to the valuation of American Depositary Receipts (ADRs), futures contracts, Exchange-Traded Funds (ETFs) and certain indexes as well as quoted prices for similar securities may be used and would be categorized as Level 2 in the hierarchy. For equity securities, including restricted securities, where observable inputs are limited, assumptions about market activity and risk are used and these securities may be categorized as Level 3 in the hierarchy.
Investments in open-end mutual funds, including the Fidelity Central Funds, are valued at their closing net asset value (NAV) each business day and are categorized as Level 1 in the hierarchy.
Changes in valuation techniques may result in transfers in or out of an assigned level within the disclosure hierarchy. The aggregate value of investments by input level as of August 31, 2020 is included at the end of the Fund's Schedule of Investments.
Foreign Currency. Certain Funds may use foreign currency contracts to facilitate transactions in foreign-denominated securities. Gains and losses from these transactions may arise from changes in the value of the foreign currency or if the counterparties do not perform under the contracts' terms.
Foreign-denominated assets, including investment securities, and liabilities are translated into U.S. dollars at the exchange rates at period end. Purchases and sales of investment securities, income and dividends received, and expenses denominated in foreign currencies are translated into U.S. dollars at the exchange rate in effect on the transaction date.
The effects of exchange rate fluctuations on investments are included with the net realized and unrealized gain (loss) on investment securities. Other foreign currency transactions resulting in realized and unrealized gain (loss) are disclosed separately.
Investment Transactions and Income. For financial reporting purposes, the Fund's investment holdings and NAV include trades executed through the end of the last business day of the period. The NAV per share for processing shareholder transactions is calculated as of the close of business of the New York Stock Exchange (NYSE), normally 4:00 p.m. Eastern time and includes trades executed through the end of the prior business day. Gains and losses on securities sold are determined on the basis of identified cost. Dividend income is recorded on the ex-dividend date. Income and capital gain distributions from Fidelity Central Funds, if any, are recorded on the ex-dividend date, except for certain dividends from foreign securities where the ex-dividend date may have passed, which are recorded as soon as the Fund is informed of the ex-dividend date. Non-cash dividends included in dividend income, if any, are recorded at the fair market value of the securities received. Certain distributions received by the Fund represent a return of capital or capital gain. The Fund determines the components of these distributions subsequent to the ex-dividend date, based upon receipt of tax filings or other correspondence relating to the underlying investment. These distributions are recorded as a reduction of cost of investments and/or as a realized gain. Investment income is recorded net of foreign taxes withheld where recovery of such taxes is uncertain.
Expenses. Expenses directly attributable to a fund are charged to that fund. Expenses attributable to more than one fund are allocated among the respective funds on the basis of relative net assets or other appropriate methods. Expense estimates are accrued in the period to which they relate and adjustments are made when actual amounts are known.
Deferred Trustee Compensation. Under a Deferred Compensation Plan (the Plan) for the Fund, certain independent Trustees have elected to defer receipt of a portion of their annual compensation. Deferred amounts are invested in a cross-section of Fidelity funds, are marked-to-market and remain in the Fund until distributed in accordance with the Plan. The investment of deferred amounts and the offsetting payable to the Trustees of $127,438 are included in the accompanying Statement of Assets and Liabilities in other receivables and other payables and accrued expenses, respectively.
Income Tax Information and Distributions to Shareholders. Each year, the Fund intends to qualify as a regulated investment company under Subchapter M of the Internal Revenue Code, including distributing substantially all of its taxable income and realized gains. As a result, no provision for U.S. Federal income taxes is required. The Fund files a U.S. federal tax return, in addition to state and local tax returns as required. The Fund's federal income tax returns are subject to examination by the Internal Revenue Service (IRS) for a period of three fiscal years after they are filed. State and local tax returns may be subject to examination for an additional fiscal year depending on the jurisdiction. Foreign taxes are provided for based on the Fund's understanding of the tax rules and rates that exist in the foreign markets in which it invests.
Distributions are declared and recorded on the ex-dividend date. Income and capital gain distributions are determined in accordance with income tax regulations, which may differ from GAAP.
Capital accounts within the financial statements are adjusted for permanent book-tax differences. These adjustments have no impact on net assets or the results of operations. Capital accounts are not adjusted for temporary book-tax differences which will reverse in a subsequent period.
Book-tax differences are primarily due to foreign currency transactions, partnerships, deferred trustees compensation and losses deferred due to wash sales and excise tax regulations.
As of period end, the cost and unrealized appreciation (depreciation) in securities, and derivatives if applicable, for federal income tax purposes were as follows:
| Gross unrealized appreciation | $171,486,424 |
| Gross unrealized depreciation | (18,569,927) |
| Net unrealized appreciation (depreciation) | $152,916,497 |
| Tax cost | $514,609,515 |
The Fund elected to defer to its next fiscal year approximately $38,220,028 of capital losses recognized during the period November 1, 2019 to February 29, 2020.
4. Purchases and Sales of Investments.
Purchases and sales of securities, other than short-term securities, are noted in the table below.
| | Purchases ($) | Sales ($) |
| Chemicals Portfolio | 202,377,740 | 279,429,935 |
5. Fees and Other Transactions with Affiliates.
Management Fee. Fidelity Management & Research Company LLC (the investment adviser) and its affiliates provide the Fund with investment management related services for which the Fund pays a monthly management fee. The management fee is the sum of an individual fund fee rate that is based on an annual rate of .30% of the Fund's average net assets and an annualized group fee rate that averaged .23% during the period. The group fee rate is based upon the monthly average net assets of a group of registered investment companies with which the investment adviser has management contracts. The group fee rate decreases as assets under management increase and increases as assets under management decrease. For the reporting period, the total annualized management fee rate was .53% of the Fund's average net assets.
Transfer Agent Fees. Fidelity Investments Institutional Operations Company LLC (FIIOC), an affiliate of the investment adviser, is the Fund's transfer, dividend disbursing and shareholder servicing agent. FIIOC receives account fees and asset-based fees that vary according to account size and type of account. FIIOC pays for typesetting, printing and mailing of shareholder reports, except proxy statements. For the period, the transfer agent fees were equivalent to an annualized rate of .22% of average net assets.
Accounting Fees. Fidelity Service Company, Inc. (FSC), an affiliate of the investment adviser, maintains the Fund's accounting records. The accounting fee is based on the level of average net assets for each month. For the period, the fees were equivalent to the following annualized rates:
| | % of Average Net Assets |
| Chemicals Portfolio | .04 |
Brokerage Commissions. A portion of portfolio transactions were placed with brokerage firms which are affiliates of the investment adviser. Brokerage commissions are included in net realized gain (loss) and change in net unrealized appreciation (depreciation) in the Statement of Operations. The commissions paid to these affiliated firms were as follows:
| | Amount |
| Chemicals Portfolio | $10,285 |
Interfund Trades. Funds may purchase from or sell securities to other Fidelity Funds under procedures adopted by the Board. The procedures have been designed to ensure these interfund trades are executed in accordance with Rule 17a-7 of the 1940 Act. Interfund trades are included within the respective purchases and sales amounts shown in the Purchases and Sales of Investments note.
6. Committed Line of Credit.
Certain Funds participate with other funds managed by the investment adviser or an affiliate in a $4.25 billion credit facility (the "line of credit") to be utilized for temporary or emergency purposes to fund shareholder redemptions or for other short-term liquidity purposes. The participating funds have agreed to pay commitment fees on their pro-rata portion of the line of credit, which are reflected in Miscellaneous expenses on the Statement of Operations, and are as follows:
| | Amount |
| Chemicals Portfolio | $818 |
During the period, there were no borrowings on this line of credit.
7. Security Lending.
The Fund lends portfolio securities from time to time in order to earn additional income. Lending agents are used, including National Financial Services (NFS), an affiliate of the Fund. Pursuant to a securities lending agreement, NFS will receive a fee, which is capped at 9.9% of daily lending revenue, for its services as lending agent. The Fund may lend securities to certain qualified borrowers, including NFS. On the settlement date of the loan, the Fund receives collateral (in the form of U.S. Treasury obligations, letters of credit and/or cash) against the loaned securities and maintains collateral in an amount not less than 100% of the market value of the loaned securities during the period of the loan. The market value of the loaned securities is determined at the close of business of the Fund and any additional required collateral is delivered to the Fund on the next business day. The Fund or borrower may terminate the loan at any time, and if the borrower defaults on its obligation to return the securities loaned because of insolvency or other reasons, the Fund may apply collateral received from the borrower against the obligation. The Fund may experience delays and costs in recovering the securities loaned. Any cash collateral received is invested in the Fidelity Securities Lending Cash Central Fund. The value of loaned securities and cash collateral at period end are disclosed on the Fund's Statement of Assets and Liabilities. At period end, there were no security loans outstanding with NFS, as affiliated borrower. Total fees paid by the Fund to NFS, as lending agent, amounted to $6,125. Security lending income represents the income earned on investing cash collateral, less rebates paid to borrowers and any lending agent fees associated with the loan, plus any premium payments received for lending certain types of securities. Net income from the Fidelity Securities Lending Cash Central Fund during the period is presented in the Statement of Operations as a component of income from Fidelity Central Funds and includes $47 from securities loaned to NFS, as affiliated borrower.
8. Expense Reductions.
Commissions paid to certain brokers with whom the investment adviser, or its affiliates, places trades on behalf of the Fund include an amount in addition to trade execution, which may be rebated back to the Fund to offset certain expenses. This amount totaled $65,774 for the period.
In addition, during the period the investment adviser or an affiliate reimbursed and/or waived a portion of operating expenses in the amount of $1,703.
9. Other.
The Fund's organizational documents provide former and current trustees and officers with a limited indemnification against liabilities arising in connection with the performance of their duties to the Fund. In the normal course of business, the Fund may also enter into contracts that provide general indemnifications. The Fund's maximum exposure under these arrangements is unknown as this would be dependent on future claims that may be made against the Fund. The risk of material loss from such claims is considered remote.
10. Coronavirus (COVID-19) Pandemic.
An outbreak of COVID-19 first detected in China during December 2019 has since spread globally and was declared a pandemic by the World Health Organization during March 2020. Developments that disrupt global economies and financial markets, such as the COVID-19 pandemic, may magnify factors that affect the Fund's performance.
Gold Portfolio
Investment Summary (Unaudited)
The information in the following tables is based on the consolidated investments of the Fund.
Top Ten Holdings as of August 31, 2020
| (excluding repurchase agreements) | % of fund's net assets |
| Barrick Gold Corp. (Canada) | 13.1 |
| Newmont Corp. | 12.8 |
| Franco-Nevada Corp. | 7.7 |
| Wheaton Precious Metals Corp. | 6.9 |
| Agnico Eagle Mines Ltd. (Canada) | 5.5 |
| Yamana Gold, Inc. | 3.2 |
| Northern Star Resources Ltd. | 3.1 |
| Gold Fields Ltd. | 3.1 |
| Royal Gold, Inc. | 3.0 |
| AngloGold Ashanti Ltd. | 3.0 |
| | 61.4 |
Top Industries (% of fund's net assets)
| As of August 31, 2020 |
| | Gold | 91.1% |
| | Silver | 3.5% |
| | Diversified Metals & Mining | 2.9% |
| | Precious Metals & Minerals | 0.9% |
| | Commodities & Related Investments* | 0.5% |
| | All Others** | 1.1% |

* Includes gold bullion and/or silver bullion.
** Includes Short-Term investments and Net Other Assets (Liabilities).
Geographic Diversification (% of fund's net assets)
| As of August 31, 2020 |
| | Canada | 68.0% |
| | United States of America* | 18.3% |
| | South Africa | 7.7% |
| | Australia | 6.0% |

* Includes Short-Term investments and Net Other Assets (Liabilities).
Percentages are based on country or territory of incorporation and are adjusted for the effect of futures contracts, if applicable.
Gold Portfolio
Consolidated Schedule of Investments August 31, 2020 (Unaudited)
Showing Percentage of Net Assets
| Common Stocks - 98.4% | | | |
| | | Shares | Value |
| Australia - 6.0% | | | |
| Metals & Mining - 6.0% | | | |
| Gold - 6.0% | | | |
| Evolution Mining Ltd. | | 13,000,000 | $53,214,233 |
| Newcrest Mining Ltd. | | 1,000,000 | 23,572,098 |
| Northern Star Resources Ltd. | | 8,500,000 | 85,574,239 |
| | | | 162,360,570 |
| Canada - 68.0% | | | |
| Metals & Mining - 68.0% | | | |
| Diversified Metals & Mining - 2.9% | | | |
| New Pacific Holdings Corp. (a)(b) | | 5,000,000 | 24,188,293 |
| Orla Mining Ltd. (b)(c) | | 12,000,000 | 53,727,910 |
| | | | 77,916,203 |
| Gold - 61.6% | | | |
| Agnico Eagle Mines Ltd. (Canada) | | 1,800,000 | 148,404,953 |
| Alamos Gold, Inc. | | 6,000,000 | 62,789,895 |
| B2Gold Corp. | | 9,000,000 | 60,443,899 |
| Barrick Gold Corp. (Canada) | | 12,000,000 | 355,487,409 |
| Centerra Gold, Inc. | | 2,000,000 | 26,051,290 |
| Franco-Nevada Corp. | | 1,400,000 | 210,555,449 |
| Gold Standard Ventures Corp. (b)(c) | | 22,500,000 | 20,354,966 |
| Kirkland Lake Gold Ltd. (b) | | 1,200,000 | 63,939,893 |
| Lundin Gold, Inc. (b) | | 3,000,000 | 25,552,957 |
| Novagold Resources, Inc. (b) | | 5,000,000 | 53,091,578 |
| OceanaGold Corp. (b) | | 20,000,000 | 46,153,256 |
| Osisko Gold Royalties Ltd. | | 3,500,000 | 42,933,262 |
| Premier Gold Mines Ltd. (a)(b) | | 10,000,000 | 21,006,632 |
| Pretium Resources, Inc. (b) | | 3,775,000 | 48,477,211 |
| Pretium Resources, Inc. (b)(d) | | 225,000 | 2,889,370 |
| Pure Gold Mining, Inc. (b) | | 10,000,000 | 16,099,973 |
| Rubicon Minerals Corp. (b) | | 5,000,000 | 7,129,988 |
| Seabridge Gold, Inc. (a)(b) | | 2,000,000 | 38,103,270 |
| SSR Mining, Inc. (b) | | 3,000,000 | 64,353,893 |
| Teranga Gold Corp. (b) | | 1,000,000 | 11,637,981 |
| Torex Gold Resources, Inc. (b) | | 1,500,000 | 23,160,961 |
| Victoria Gold Corp. (a)(b) | | 2,000,000 | 31,739,947 |
| Wesdome Gold Mines, Inc. (b) | | 2,000,000 | 22,110,630 |
| Wheaton Precious Metals Corp. | | 3,500,000 | 186,920,688 |
| Yamana Gold, Inc. | | 14,000,000 | 86,725,189 |
| | | | 1,676,114,540 |
| Precious Metals & Minerals - 0.9% | | | |
| SilverCrest Metals, Inc. (b) | | 2,500,000 | 24,820,792 |
| Silver - 2.6% | | | |
| MAG Silver Corp. (b) | | 2,000,000 | 33,901,944 |
| Pan American Silver Corp. (a) | | 1,000,000 | 36,160,000 |
| | | | 70,061,944 |
| TOTAL METALS & MINING | | | 1,848,913,479 |
| South Africa - 7.7% | | | |
| Metals & Mining - 7.7% | | | |
| Gold - 7.7% | | | |
| AngloGold Ashanti Ltd. | | 2,750,000 | 81,535,786 |
| Gold Fields Ltd. | | 6,500,000 | 85,065,511 |
| Sibanye Stillwater Ltd. | | 14,000,000 | 42,855,638 |
| | | | 209,456,935 |
| United States of America - 16.7% | | | |
| Metals & Mining - 16.7% | | | |
| Gold - 15.8% | | | |
| Newmont Corp. | | 5,200,000 | 349,856,000 |
| Royal Gold, Inc. | | 600,000 | 81,792,000 |
| | | | 431,648,000 |
| Silver - 0.9% | | | |
| Hecla Mining Co. | | 4,000,000 | 24,080,000 |
| TOTAL METALS & MINING | | | 455,728,000 |
| TOTAL COMMON STOCKS | | | |
| (Cost $1,392,553,839) | | | 2,676,458,984 |
|
| Commodities - 0.5% | | | |
| Gold Bullion | | | |
| (Cost $6,051,546) | | 6,980 | 13,743,829 |
|
| Money Market Funds - 2.5% | | | |
| Fidelity Cash Central Fund 0.12% (e) | | 36,952,573 | 36,959,964 |
| Fidelity Securities Lending Cash Central Fund 0.11% (e)(f) | | 30,176,763 | 30,179,780 |
| TOTAL MONEY MARKET FUNDS | | | |
| (Cost $67,139,744) | | | 67,139,744 |
| TOTAL INVESTMENT IN SECURITIES - 101.4% | | | |
| (Cost $1,465,745,129) | | | 2,757,342,557 |
| NET OTHER ASSETS (LIABILITIES) - (1.4)% | | | (36,837,066) |
| NET ASSETS - 100% | | | $2,720,505,491 |
Legend
(a) Security or a portion of the security is on loan at period end.
(b) Non-income producing
(c) Affiliated company
(d) Security exempt from registration under Rule 144A of the Securities Act of 1933. These securities may be resold in transactions exempt from registration, normally to qualified institutional buyers. At the end of the period, the value of these securities amounted to $2,889,370 or 0.1% of net assets.
(e) Affiliated fund that is generally available only to investment companies and other accounts managed by Fidelity Investments. The rate quoted is the annualized seven-day yield of the fund at period end. A complete unaudited listing of the fund's holdings as of its most recent quarter end is available upon request. In addition, each Fidelity Central Fund's financial statements are available on the SEC's website or upon request.
(f) Investment made with cash collateral received from securities on loan.
Affiliated Central Funds
Information regarding fiscal year to date income earned by the Fund from investments in Fidelity Central Funds is as follows:
| Fund | Income earned |
| Fidelity Cash Central Fund | $15,700 |
| Fidelity Securities Lending Cash Central Fund | 154,504 |
| Total | $170,204 |
Amounts in the income column in the above table include any capital gain distributions from underlying funds, which are presented in the corresponding line-item in the Consolidated Statement of Operations, if applicable. Amount for Fidelity Securities Lending Cash Central Fund represents the income earned on investing cash collateral, less rebates paid to borrowers and any lending agent fees associated with the loan, plus any premium payments received for lending certain types of securities.
Consolidated Subsidiary
| Fund | Value, beginning of period | Purchases | Sales Proceeds | Dividend Income | Realized Gain/Loss | Change in Unrealized appreciation (depreciation) | Value, end of period |
| Fidelity Select Cayman Gold Ltd. | $11,033,003 | $537 | $-- | $-- | $-- | $2,733,093 | $13,766,633 |
Other Affiliated Issuers
An affiliated company is a company in which the Fund has ownership of at least 5% of the voting securities. Fiscal year to date transactions with companies which are or were affiliates are as follows:
| Affiliate | Value, beginning of period | Purchases | Sales Proceeds | Dividend Income | Realized Gain (loss) | Change in Unrealized appreciation (depreciation) | Value, end of period |
| Gold Standard Ventures Corp. | $12,871,008 | $1,556,763 | $-- | $-- | $-- | $5,927,195 | $20,354,966 |
| Orla Mining Ltd. | 17,284,411 | 2,899,165 | -- | -- | -- | 33,544,334 | 53,727,910 |
| Total | $30,155,419 | $4,455,928 | $-- | $-- | $-- | $39,471,529 | $74,082,876 |
Investment Valuation
The following is a summary of the inputs used, as of August 31, 2020, involving the Fund's assets and liabilities carried at fair value. The inputs or methodology used for valuing securities may not be an indication of the risk associated with investing in those securities. For more information on valuation inputs, and their aggregation into the levels used below, please refer to the Investment Valuation section in the accompanying Notes to Consolidated Financial Statements.
| | Valuation Inputs at Reporting Date: |
| Description | Total | Level 1 | Level 2 | Level 3 |
| Investments in Securities: | | | | |
| Common Stocks | $2,676,458,984 | $2,467,002,049 | $209,456,935 | $-- |
| Commodities | 13,743,829 | 13,743,829 | -- | -- |
| Money Market Funds | 67,139,744 | 67,139,744 | -- | -- |
| Total Investments in Securities: | $2,757,342,557 | $2,547,885,622 | $209,456,935 | $-- |
See accompanying notes which are an integral part of the consolidated financial statements.
Gold Portfolio
Consolidated Financial Statements
Consolidated Statement of Assets and Liabilities
| | | August 31, 2020 (Unaudited) |
| Assets | | |
Investment in securities, at value (including securities loaned of $29,093,548) — See accompanying schedule:
Unaffiliated issuers (cost $1,352,894,813) | $2,602,376,108 | |
| Fidelity Central Funds (cost $67,139,744) | 67,139,744 | |
| Commodities (cost $6,051,546) | 13,743,829 | |
| Other affiliated issuers (cost $39,659,026) | 74,082,876 | |
| Total Investment in Securities (cost $1,465,745,129) | | $2,757,342,557 |
| Cash | | 23,373 |
| Receivable for investments sold | | 20,553,205 |
| Receivable for fund shares sold | | 19,672,920 |
| Dividends receivable | | 2,004,015 |
| Distributions receivable from Fidelity Central Funds | | 37,323 |
| Prepaid expenses | | 11,936 |
| Other receivables | | 178,034 |
| Total assets | | 2,799,823,363 |
| Liabilities | | |
| Payable to custodian bank | $16,847,340 | |
| Payable for investments purchased | 21,861,300 | |
| Payable for fund shares redeemed | 8,522,992 | |
| Accrued management fee | 1,184,040 | |
| Distribution and service plan fees payable | 100,280 | |
| Other affiliated payables | 440,790 | |
| Other payables and accrued expenses | 180,833 | |
| Collateral on securities loaned | 30,180,297 | |
| Total liabilities | | 79,317,872 |
| Net Assets | | $2,720,505,491 |
| Net Assets consist of: | | |
| Paid in capital | | $3,010,070,175 |
| Total accumulated earnings (loss) | | (289,564,684) |
| Net Assets | | $2,720,505,491 |
| Net Asset Value and Maximum Offering Price | | |
| Class A: | | |
| Net Asset Value and redemption price per share ($110,838,379 ÷ 3,284,637 shares)(a) | | $33.74 |
| Maximum offering price per share (100/94.25 of $33.74) | | $35.80 |
| Class M: | | |
| Net Asset Value and redemption price per share ($34,350,771 ÷ 1,043,213 shares)(a) | | $32.93 |
| Maximum offering price per share (100/96.50 of $32.93) | | $34.12 |
| Class C: | | |
| Net Asset Value and offering price per share ($78,160,966 ÷ 2,507,358 shares)(a) | | $31.17 |
| Gold: | | |
| Net Asset Value, offering price and redemption price per share ($2,137,370,476 ÷ 61,387,895 shares) | | $34.82 |
| Class I: | | |
| Net Asset Value, offering price and redemption price per share ($205,476,278 ÷ 5,900,765 shares) | | $34.82 |
| Class Z: | | |
| Net Asset Value, offering price and redemption price per share ($154,308,621 ÷ 4,427,207 shares) | | $34.85 |
(a) Redemption price per share is equal to net asset value less any applicable contingent deferred sales charge.
See accompanying notes which are an integral part of the consolidated financial statements.
Consolidated Statement of Operations
| | | Six months ended August 31, 2020 (Unaudited) |
| Investment Income | | |
| Dividends | | $9,034,903 |
| Income from Fidelity Central Funds (including $154,504 from security lending) | | 170,204 |
| Total income | | 9,205,107 |
| Expenses | | |
| Management fee | $5,666,035 | |
| Transfer agent fees | 1,817,398 | |
| Distribution and service plan fees | 487,806 | |
| Accounting fees | 467,940 | |
| Custodian fees and expenses | 49,799 | |
| Independent trustees' fees and expenses | 6,074 | |
| Registration fees | 114,778 | |
| Audit | 31,893 | |
| Legal | 1,277 | |
| Interest | 80 | |
| Miscellaneous | 37,107 | |
| Total expenses before reductions | 8,680,187 | |
| Expense reductions | (164,484) | |
| Total expenses after reductions | | 8,515,703 |
| Net investment income (loss) | | 689,404 |
| Realized and Unrealized Gain (Loss) | | |
| Net realized gain (loss) on: | | |
| Investments: | | |
| Unaffiliated issuers | 84,026,340 | |
| Fidelity Central Funds | 2,536 | |
| Foreign currency transactions | 115,506 | |
| Total net realized gain (loss) | | 84,144,382 |
| Change in net unrealized appreciation (depreciation) on: | | |
| Investments: | | |
| Investments | 797,700,891 | |
| Affiliated issuers | 39,471,529 | |
| Assets and liabilities in foreign currencies | 35,813 | |
| Commodities | 2,733,856 | |
| Total change in net unrealized appreciation (depreciation) | | 839,942,089 |
| Net gain (loss) | | 924,086,471 |
| Net increase (decrease) in net assets resulting from operations | | $924,775,875 |
See accompanying notes which are an integral part of the consolidated financial statements.
Consolidated Statement of Changes in Net Assets
| | Six months ended August 31, 2020 (Unaudited) | Year ended February 29, 2020 |
| Increase (Decrease) in Net Assets | | |
| Operations | | |
| Net investment income (loss) | $689,404 | $3,699,988 |
| Net realized gain (loss) | 84,144,382 | (62,236,379) |
| Change in net unrealized appreciation (depreciation) | 839,942,089 | 260,887,436 |
| Net increase (decrease) in net assets resulting from operations | 924,775,875 | 202,351,045 |
| Distributions to shareholders | (11,815,946) | (6,847,722) |
| Share transactions - net increase (decrease) | 167,600,493 | 185,112,852 |
| Total increase (decrease) in net assets | 1,080,560,422 | 380,616,175 |
| Net Assets | | |
| Beginning of period | 1,639,945,069 | 1,259,328,894 |
| End of period | $2,720,505,491 | $1,639,945,069 |
See accompanying notes which are an integral part of the consolidated financial statements.
Consolidated Financial Highlights
Gold Portfolio Class A
| | Six months ended (Unaudited) August 31, | Years endedFebruary 28, | | | | |
| | 2020 | 2020 A | 2019 | 2018 | 2017 | 2016 A |
| Selected Per–Share Data | | | | | | |
| Net asset value, beginning of period | $21.67 | $18.52 | $18.30 | $20.54 | $17.70 | $18.11 |
| Income from Investment Operations | | | | | | |
| Net investment income (loss)B | (.03) | (.01)C | (.03) | (.12) | (.16) | (.06) |
| Net realized and unrealized gain (loss) | 12.25 | 3.20 | .25 | (2.09) | 3.59 | (.35) |
| Total from investment operations | 12.22 | 3.19 | .22 | (2.21) | 3.43 | (.41) |
| Distributions from net investment income | (.15) | (.01) | – | – | – | – |
| Distributions from net realized gain | – | (.03) | – | (.03) | (.60) | – |
| Total distributions | (.15) | (.04) | – | (.03) | (.60) | – |
| Redemption fees added to paid in capitalB | – | – | – | – | .01 | –D |
| Net asset value, end of period | $33.74 | $21.67 | $18.52 | $18.30 | $20.54 | $17.70 |
| Total ReturnE,F,G | 56.82% | 17.23% | 1.20% | (10.77)% | 19.97% | (2.26)% |
| Ratios to Average Net AssetsH,I | | | | | | |
| Expenses before reductions | 1.09%J | 1.13% | 1.19% | 1.18% | 1.19% | 1.23% |
| Expenses net of fee waivers, if any | 1.09%J | 1.13% | 1.18% | 1.16% | 1.16% | 1.20% |
| Expenses net of all reductions | 1.07%J | 1.12% | 1.18% | 1.16% | 1.16% | 1.20% |
| Net investment income (loss) | (.21)%J | (.05)%C | (.15)% | (.58)% | (.71)% | (.44)% |
| Supplemental Data | | | | | | |
| Net assets, end of period (000 omitted) | $110,838 | $64,971 | $50,479 | $61,703 | $83,589 | $53,509 |
| Portfolio turnover rateK | 49%J | 56% | 37% | 13% | 28% | 20% |
A For the year ended February 29.
B Calculated based on average shares outstanding during the period.
C Net investment income per share reflects one or more large, non-recurring dividend(s) which amounted to $.05 per share. Excluding such non-recurring dividend(s), the ratio of net investment income (loss) to average net assets would have been (.26) %.
D Amount represents less than $.005 per share.
E Total returns for periods of less than one year are not annualized.
F Total returns would have been lower if certain expenses had not been reduced during the applicable periods shown.
G Total returns do not include the effect of the sales charges.
H Fees and expenses of any underlying mutual funds or exchange-traded funds (ETFs) are not included in the Fund's expense ratio. The Fund indirectly bears its proportionate share of these expenses. For additional expense information related to investments in Fidelity Central Funds, please refer to the "Investments in Fidelity Central Funds" note found in the Notes to Financial Statements section of the most recent Annual or Semi-Annual report.
I Expense ratios reflect operating expenses of the class. Expenses before reductions do not reflect amounts reimbursed, waived, or reduced through arrangements with the investment adviser, brokerage services, or other offset arrangements, if applicable, and do not represent the amount paid by the class during periods when reimbursements, waivers or reductions occur.
J Annualized
K Amount does not include the portfolio activity of any underlying Fidelity Central Funds.
See accompanying notes which are an integral part of the consolidated financial statements.
Gold Portfolio Class M
| | Six months ended (Unaudited) August 31, | Years endedFebruary 28, | | | | |
| | 2020 | 2020 A | 2019 | 2018 | 2017 | 2016 A |
| Selected Per–Share Data | | | | | | |
| Net asset value, beginning of period | $21.16 | $18.11 | $17.94 | $20.19 | $17.37 | $17.83 |
| Income from Investment Operations | | | | | | |
| Net investment income (loss)B | (.07) | (.07)C | (.07) | (.17) | (.22) | (.11) |
| Net realized and unrealized gain (loss) | 11.98 | 3.12 | .24 | (2.05) | 3.54 | (.35) |
| Total from investment operations | 11.91 | 3.05 | .17 | (2.22) | 3.32 | (.46) |
| Distributions from net investment income | (.14) | – | – | – | – | – |
| Distributions from net realized gain | – | – | – | (.03) | (.51) | – |
| Total distributions | (.14) | – | – | (.03) | (.51) | – |
| Redemption fees added to paid in capitalB | – | – | – | – | .01 | –D |
| Net asset value, end of period | $32.93 | $21.16 | $18.11 | $17.94 | $20.19 | $17.37 |
| Total ReturnE,F,G | 56.67% | 16.84% | .95% | (11.04)% | 19.62% | (2.58)% |
| Ratios to Average Net AssetsH,I | | | | | | |
| Expenses before reductions | 1.38%J | 1.42% | 1.48% | 1.48% | 1.49% | 1.52% |
| Expenses net of fee waivers, if any | 1.38%J | 1.42% | 1.46% | 1.47% | 1.46% | 1.48% |
| Expenses net of all reductions | 1.36%J | 1.41% | 1.46% | 1.47% | 1.46% | 1.48% |
| Net investment income (loss) | (.50)%J | (.34)%C | (.43)% | (.88)% | (1.01)% | (.72)% |
| Supplemental Data | | | | | | |
| Net assets, end of period (000 omitted) | $34,351 | $19,620 | $17,401 | $19,355 | $25,170 | $17,720 |
| Portfolio turnover rateK | 49%J | 56% | 37% | 13% | 28% | 20% |
A For the year ended February 29.
B Calculated based on average shares outstanding during the period.
C Net investment income per share reflects one or more large, non-recurring dividend(s) which amounted to $.04 per share. Excluding such non-recurring dividend(s), the ratio of net investment income (loss) to average net assets would have been (.56) %.
D Amount represents less than $.005 per share.
E Total returns for periods of less than one year are not annualized.
F Total returns would have been lower if certain expenses had not been reduced during the applicable periods shown.
G Total returns do not include the effect of the sales charges.
H Fees and expenses of any underlying mutual funds or exchange-traded funds (ETFs) are not included in the Fund's expense ratio. The Fund indirectly bears its proportionate share of these expenses. For additional expense information related to investments in Fidelity Central Funds, please refer to the "Investments in Fidelity Central Funds" note found in the Notes to Financial Statements section of the most recent Annual or Semi-Annual report.
I Expense ratios reflect operating expenses of the class. Expenses before reductions do not reflect amounts reimbursed, waived, or reduced through arrangements with the investment adviser, brokerage services, or other offset arrangements, if applicable, and do not represent the amount paid by the class during periods when reimbursements, waivers or reductions occur.
J Annualized
K Amount does not include the portfolio activity of any underlying Fidelity Central Funds.
See accompanying notes which are an integral part of the consolidated financial statements.
Gold Portfolio Class C
| | Six months ended (Unaudited) August 31, | Years endedFebruary 28, | | | | |
| | 2020 | 2020 A | 2019 | 2018 | 2017 | 2016 A |
| Selected Per–Share Data | | | | | | |
| Net asset value, beginning of period | $20.07 | $17.24 | $17.15 | $19.36 | $16.68 | $17.20 |
| Income from Investment Operations | | | | | | |
| Net investment income (loss)B | (.12) | (.14)C | (.13) | (.24) | (.29) | (.16) |
| Net realized and unrealized gain (loss) | 11.35 | 2.97 | .22 | (1.95) | 3.42 | (.36) |
| Total from investment operations | 11.23 | 2.83 | .09 | (2.19) | 3.13 | (.52) |
| Distributions from net investment income | (.13) | – | – | – | – | – |
| Distributions from net realized gain | – | – | – | (.02) | (.45) | – |
| Total distributions | (.13) | – | – | (.02) | (.45) | – |
| Redemption fees added to paid in capitalB | – | – | – | – | –D | –D |
| Net asset value, end of period | $31.17 | $20.07 | $17.24 | $17.15 | $19.36 | $16.68 |
| Total ReturnE,F,G | 56.31% | 16.42% | .52% | (11.35)% | 19.19% | (3.02)% |
| Ratios to Average Net AssetsH,I | | | | | | |
| Expenses before reductions | 1.79%J | 1.80% | 1.84% | 1.85% | 1.88% | 1.97% |
| Expenses net of fee waivers, if any | 1.79%J | 1.80% | 1.83% | 1.83% | 1.85% | 1.93% |
| Expenses net of all reductions | 1.78%J | 1.79% | 1.83% | 1.83% | 1.84% | 1.93% |
| Net investment income (loss) | (.91)%J | (.72)%C | (.80)% | (1.25)% | (1.40)% | (1.17)% |
| Supplemental Data | | | | | | |
| Net assets, end of period (000 omitted) | $78,161 | $52,375 | $67,760 | $92,724 | $101,215 | $52,732 |
| Portfolio turnover rateK | 49%J | 56% | 37% | 13% | 28% | 20% |
A For the year ended February 29.
B Calculated based on average shares outstanding during the period.
C Net investment income per share reflects one or more large, non-recurring dividend(s) which amounted to $.04 per share. Excluding such non-recurring dividend(s), the ratio of net investment income (loss) to average net assets would have been (.94) %.
D Amount represents less than $.005 per share.
E Total returns for periods of less than one year are not annualized.
F Total returns would have been lower if certain expenses had not been reduced during the applicable periods shown.
G Total returns do not include the effect of the contingent deferred sales charge.
H Fees and expenses of any underlying mutual funds or exchange-traded funds (ETFs) are not included in the Fund's expense ratio. The Fund indirectly bears its proportionate share of these expenses. For additional expense information related to investments in Fidelity Central Funds, please refer to the "Investments in Fidelity Central Funds" note found in the Notes to Financial Statements section of the most recent Annual or Semi-Annual report.
I Expense ratios reflect operating expenses of the class. Expenses before reductions do not reflect amounts reimbursed, waived, or reduced through arrangements with the investment adviser, brokerage services, or other offset arrangements, if applicable, and do not represent the amount paid by the class during periods when reimbursements, waivers or reductions occur.
J Annualized
K Amount does not include the portfolio activity of any underlying Fidelity Central Funds.
See accompanying notes which are an integral part of the consolidated financial statements.
Gold Portfolio
| | Six months ended (Unaudited) August 31, | Years endedFebruary 28, | | | | |
| | 2020 | 2020 A | 2019 | 2018 | 2017 | 2016 A |
| Selected Per–Share Data | | | | | | |
| Net asset value, beginning of period | $22.33 | $19.07 | $18.78 | $21.02 | $18.12 | $18.50 |
| Income from Investment Operations | | | | | | |
| Net investment income (loss)B | .02 | .06C | .03 | (.05) | (.09) | (.03) |
| Net realized and unrealized gain (loss) | 12.64 | 3.30 | .26 | (2.14) | 3.66 | (.35) |
| Total from investment operations | 12.66 | 3.36 | .29 | (2.19) | 3.57 | (.38) |
| Distributions from net investment income | (.17) | (.06) | – | – | – | – |
| Distributions from net realized gain | – | (.03) | – | (.05) | (.68) | – |
| Total distributions | (.17) | (.10)D | – | (.05) | (.68) | – |
| Redemption fees added to paid in capitalB | – | – | – | – | .01 | –E |
| Net asset value, end of period | $34.82 | $22.33 | $19.07 | $18.78 | $21.02 | $18.12 |
| Total ReturnF,G | 57.11% | 17.60% | 1.54% | (10.47)% | 20.38% | (2.05)% |
| Ratios to Average Net AssetsH,I | | | | | | |
| Expenses before reductions | .77%J | .79% | .86% | .86% | .87% | .97% |
| Expenses net of fee waivers, if any | .77%J | .79% | .85% | .85% | .84% | .93% |
| Expenses net of all reductions | .76%J | .78% | .85% | .84% | .84% | .93% |
| Net investment income (loss) | .11%J | .29%C | .18% | (.26)% | (.39)% | (.17)% |
| Supplemental Data | | | | | | |
| Net assets, end of period (000 omitted) | $2,137,370 | $1,292,204 | $1,035,697 | $1,011,412 | $1,271,458 | $1,076,206 |
| Portfolio turnover rateK | 49%J | 56% | 37% | 13% | 28% | 20% |
A For the year ended February 29.
B Calculated based on average shares outstanding during the period.
C Net investment income per share reflects one or more large, non-recurring dividend(s) which amounted to $.05 per share. Excluding such non-recurring dividend(s), the ratio of net investment income (loss) to average net assets would have been .07%.
D Total distributions of $.10 per share is comprised of distributions from net investment income of $.064 and distributions from net realized gain of $.034 per share.
E Amount represents less than $.005 per share.
F Total returns for periods of less than one year are not annualized.
G Total returns would have been lower if certain expenses had not been reduced during the applicable periods shown.
H Fees and expenses of any underlying mutual funds or exchange-traded funds (ETFs) are not included in the Fund's expense ratio. The Fund indirectly bears its proportionate share of these expenses. For additional expense information related to investments in Fidelity Central Funds, please refer to the "Investments in Fidelity Central Funds" note found in the Notes to Financial Statements section of the most recent Annual or Semi-Annual report.
I Expense ratios reflect operating expenses of the class. Expenses before reductions do not reflect amounts reimbursed, waived, or reduced through arrangements with the investment adviser, brokerage services, or other offset arrangements, if applicable, and do not represent the amount paid by the class during periods when reimbursements, waivers or reductions occur.
J Annualized
K Amount does not include the portfolio activity of any underlying Fidelity Central Funds.
See accompanying notes which are an integral part of the consolidated financial statements.
Gold Portfolio Class I
| | Six months ended (Unaudited) August 31, | Years endedFebruary 28, | | | | |
| | 2020 | 2020 A | 2019 | 2018 | 2017 | 2016 A |
| Selected Per–Share Data | | | | | | |
| Net asset value, beginning of period | $22.33 | $19.07 | $18.78 | $21.02 | $18.13 | $18.50 |
| Income from Investment Operations | | | | | | |
| Net investment income (loss)B | .01 | .06C | .04 | (.05) | (.09) | (.02) |
| Net realized and unrealized gain (loss) | 12.65 | 3.30 | .25 | (2.14) | 3.67 | (.35) |
| Total from investment operations | 12.66 | 3.36 | .29 | (2.19) | 3.58 | (.37) |
| Distributions from net investment income | (.17) | (.07) | – | – | – | – |
| Distributions from net realized gain | – | (.03) | – | (.05) | (.70) | – |
| Total distributions | (.17) | (.10) | – | (.05) | (.70) | – |
| Redemption fees added to paid in capitalB | – | – | – | – | .01 | –D |
| Net asset value, end of period | $34.82 | $22.33 | $19.07 | $18.78 | $21.02 | $18.13 |
| Total ReturnE,F | 57.11% | 17.60% | 1.54% | (10.47)% | 20.41% | (2.00)% |
| Ratios to Average Net AssetsG,H | | | | | | |
| Expenses before reductions | .78%I | .79% | .84% | .85% | .87% | .92% |
| Expenses net of fee waivers, if any | .78%I | .79% | .82% | .83% | .84% | .88% |
| Expenses net of all reductions | .76%I | .77% | .82% | .83% | .84% | .88% |
| Net investment income (loss) | .10%I | .30%C | .21% | (.24)% | (.39)% | (.12)% |
| Supplemental Data | | | | | | |
| Net assets, end of period (000 omitted) | $205,476 | $115,699 | $84,956 | $61,677 | $58,673 | $52,607 |
| Portfolio turnover rateJ | 49%I | 56% | 37% | 13% | 28% | 20% |
A For the year ended February 29.
B Calculated based on average shares outstanding during the period.
C Net investment income per share reflects one or more large, non-recurring dividend(s) which amounted to $.05 per share. Excluding such non-recurring dividend(s), the ratio of net investment income (loss) to average net assets would have been .08%.
D Amount represents less than $.005 per share.
E Total returns for periods of less than one year are not annualized.
F Total returns would have been lower if certain expenses had not been reduced during the applicable periods shown.
G Fees and expenses of any underlying mutual funds or exchange-traded funds (ETFs) are not included in the Fund's expense ratio. The Fund indirectly bears its proportionate share of these expenses. For additional expense information related to investments in Fidelity Central Funds, please refer to the "Investments in Fidelity Central Funds" note found in the Notes to Financial Statements section of the most recent Annual or Semi-Annual report.
H Expense ratios reflect operating expenses of the class. Expenses before reductions do not reflect amounts reimbursed, waived, or reduced through arrangements with the investment adviser, brokerage services, or other offset arrangements, if applicable, and do not represent the amount paid by the class during periods when reimbursements, waivers or reductions occur.
I Annualized
J Amount does not include the portfolio activity of any underlying Fidelity Central Funds.
See accompanying notes which are an integral part of the consolidated financial statements.
Gold Portfolio Class Z
| | Six months ended (Unaudited) August 31, | Years endedFebruary 28, | |
| | 2020 | 2020 A | 2019 B |
| Selected Per–Share Data | | | |
| Net asset value, beginning of period | $22.34 | $19.08 | $16.62 |
| Income from Investment Operations | | | |
| Net investment income (loss)C | .03 | .10D | .07 |
| Net realized and unrealized gain (loss) | 12.65 | 3.29 | 2.39 |
| Total from investment operations | 12.68 | 3.39 | 2.46 |
| Distributions from net investment income | (.17) | (.10) | – |
| Distributions from net realized gain | – | (.03) | – |
| Total distributions | (.17) | (.13) | – |
| Net asset value, end of period | $34.85 | $22.34 | $19.08 |
| Total ReturnE,F | 57.21% | 17.75% | 14.80% |
| Ratios to Average Net AssetsG,H | | | |
| Expenses before reductions | .64%I | .65% | .68%I |
| Expenses net of fee waivers, if any | .64%I | .64% | .68%I |
| Expenses net of all reductions | .63%I | .63% | .67%I |
| Net investment income (loss) | .24%I | .44%D | .97%I |
| Supplemental Data | | | |
| Net assets, end of period (000 omitted) | $154,309 | $95,076 | $3,037 |
| Portfolio turnover rateJ | 49%I | 56% | 37% |
A For the year ended February 29.
B For the period October 2, 2018 (commencement of sale of shares) to February 28, 2019.
C Calculated based on average shares outstanding during the period.
D Net investment income per share reflects one or more large, non-recurring dividend(s) which amounted to $.05 per share. Excluding such non-recurring dividend(s), the ratio of net investment income (loss) to average net assets would have been .22%.
E Total returns for periods of less than one year are not annualized.
F Total returns would have been lower if certain expenses had not been reduced during the applicable periods shown.
G Fees and expenses of any underlying mutual funds or exchange-traded funds (ETFs) are not included in the Fund's expense ratio. The Fund indirectly bears its proportionate share of these expenses. For additional expense information related to investments in Fidelity Central Funds, please refer to the "Investments in Fidelity Central Funds" note found in the Notes to Financial Statements section of the most recent Annual or Semi-Annual report.
H Expense ratios reflect operating expenses of the class. Expenses before reductions do not reflect amounts reimbursed, waived, or reduced through arrangements with the investment adviser, brokerage services, or other offset arrangements, if applicable, and do not represent the amount paid by the class during periods when reimbursements, waivers or reductions occur.
I Annualized
J Amount does not include the portfolio activity of any underlying Fidelity Central Funds.
See accompanying notes which are an integral part of the consolidated financial statements.
Notes to Consolidated Financial Statements (Unaudited)
For the period ended August 31, 2020
1. Organization.
Gold Portfolio (the Fund) is a non-diversified fund of Fidelity Select Portfolios (the Trust) and is authorized to issue an unlimited number of shares. The Trust is registered under the Investment Company Act of 1940, as amended (the 1940 Act), as an open-end management investment company organized as a Massachusetts business trust. The Fund invests primarily in securities of companies whose principal business activities fall within specific industries. The Fund offers Class A, Class M, Class C, Gold, Class I and Class Z shares, each of which has equal rights as to assets and voting privileges. Each class has exclusive voting rights with respect to matters that affect that class. Class C shares will automatically convert to Class A shares after a holding period of ten years from the initial date of purchase, with certain exceptions.
2. Consolidated Subsidiary.
The Funds included in the table below hold certain commodity-related investments through a wholly owned subsidiary (the "Subsidiary"). As of period end, the investments in the Subsidiaries, were as follows:
| | Subsidiary Name | $ Amount | % of Fund's Net Assets |
| Gold Portfolio | Fidelity Select Gold Cayman Ltd. | 13,766,633 | .5 |
The financial statements have been consolidated to include the Subsidiary accounts where applicable. Accordingly, all inter-company transactions and balances have been eliminated.
3. Investments in Fidelity Central Funds.
The Fund invests in Fidelity Central Funds, which are open-end investment companies generally available only to other investment companies and accounts managed by the investment adviser and its affiliates. The Fund's Consolidated Schedule of Investments lists each of the Fidelity Central Funds held as of period end, if any, as an investment of the Fund, but does not include the underlying holdings of each Fidelity Central Fund. As an Investing Fund, the Fund indirectly bears its proportionate share of the expenses of the underlying Fidelity Central Funds.
The Money Market Central Funds seek preservation of capital and current income and are managed by the investment adviser. Annualized expenses of the Money Market Central Funds as of their most recent shareholder report date ranged from less than .005% to .01%.
A complete unaudited list of holdings for each Fidelity Central Fund is available upon request or at the Securities and Exchange Commission (the SEC) website at www.sec.gov. In addition, the financial statements of the Fidelity Central Funds are available on the SEC website or upon request.
4. Significant Accounting Policies.
The Fund is an investment company and applies the accounting and reporting guidance of the Financial Accounting Standards Board (FASB) Accounting Standards Codification Topic 946 Financial Services – Investment Companies. The consolidated financial statements have been prepared in conformity with accounting principles generally accepted in the United States of America (GAAP), which require management to make certain estimates and assumptions at the date of the consolidated financial statements. Actual results could differ from those estimates. Subsequent events, if any, through the date that the consolidated financial statements were issued have been evaluated in the preparation of the consolidated financial statements. The following summarizes the significant accounting policies of the Fund:
Investment Valuation. Investments are valued as of 4:00 p.m. Eastern time on the last calendar day of the period. The Board of Trustees (the Board) has delegated the day to day responsibility for the valuation of the Fund's investments to the Fair Value Committee (the Committee) established by the Fund's investment adviser. In accordance with valuation policies and procedures approved by the Board, the Fund attempts to obtain prices from one or more third party pricing vendors or brokers to value its investments. When current market prices, quotations or currency exchange rates are not readily available or reliable, investments will be fair valued in good faith by the Committee, in accordance with procedures adopted by the Board. Factors used in determining fair value vary by investment type and may include market or investment specific events. The frequency with which these procedures are used cannot be predicted and they may be utilized to a significant extent. The Committee oversees the Fund's valuation policies and procedures and reports to the Board on the Committee's activities and fair value determinations. The Board monitors the appropriateness of the procedures used in valuing the Fund's investments and ratifies the fair value determinations of the Committee.
The Fund categorizes the inputs to valuation techniques used to value its investments into a disclosure hierarchy consisting of three levels as shown below:
- Level 1 – quoted prices in active markets for identical investments
- Level 2 – other significant observable inputs (including quoted prices for similar investments, interest rates, prepayment speeds, etc.)
- Level 3 – unobservable inputs (including the Fund's own assumptions based on the best information available)
Valuation techniques used to value the Fund's investments by major category are as follows:
Equity securities, including restricted securities, for which market quotations are readily available, are valued at the last reported sale price or official closing price as reported by a third party pricing vendor on the primary market or exchange on which they are traded and are categorized as Level 1 in the hierarchy. In the event there were no sales during the day or closing prices are not available, securities are valued at the last quoted bid price or may be valued using the last available price and are generally categorized as Level 2 in the hierarchy. For foreign equity securities, when market or security specific events arise, comparisons to the valuation of American Depositary Receipts (ADRs), futures contracts, Exchange-Traded Funds (ETFs) and certain indexes as well as quoted prices for similar securities may be used and would be categorized as Level 2 in the hierarchy. For equity securities, including restricted securities, where observable inputs are limited, assumptions about market activity and risk are used and these securities may be categorized as Level 3 in the hierarchy.
Investments in commodities are valued at their last traded price at 4:00 p.m. Eastern time each business day and are categorized as Level 1 in the hierarchy. Investments in open-end mutual funds, including the Fidelity Central Funds, are valued at their closing net asset value (NAV) each business day and are categorized as Level 1 in the hierarchy.
Changes in valuation techniques may result in transfers in or out of an assigned level within the disclosure hierarchy. The aggregate value of investments by input level as of August 31, 2020 is included at the end of the Fund's Consolidated Schedule of Investments.
Foreign Currency. Certain Funds may use foreign currency contracts to facilitate transactions in foreign-denominated securities. Gains and losses from these transactions may arise from changes in the value of the foreign currency or if the counterparties do not perform under the contracts' terms.
Foreign-denominated assets, including investment securities, and liabilities are translated into U.S. dollars at the exchange rates at period end. Purchases and sales of investment securities, income and dividends received, and expenses denominated in foreign currencies are translated into U.S. dollars at the exchange rate in effect on the transaction date.
The effects of exchange rate fluctuations on investments are included with the net realized and unrealized gain (loss) on investment securities. Other foreign currency transactions resulting in realized and unrealized gain (loss) are disclosed separately.
Investment Transactions and Income. For financial reporting purposes, the Fund's investment holdings and NAV include trades executed through the end of the last business day of the period. The NAV per share for processing shareholder transactions is calculated as of the close of business of the New York Stock Exchange (NYSE), normally 4:00 p.m. Eastern time and includes trades executed through the end of the prior business day. Gains and losses on securities sold are determined on the basis of identified cost. Dividend income is recorded on the ex-dividend date, except for certain dividends from foreign securities where the ex-dividend date may have passed, which are recorded as soon as the Fund is informed of the ex-dividend date. Non-cash dividends included in dividend income, if any, are recorded at the fair market value of the securities received. Income and capital gain distributions from Fidelity Central Funds, if any, are recorded on the ex-dividend date. Certain distributions received by the Fund represent a return of capital or capital gain. The Fund determines the components of these distributions subsequent to the ex-dividend date, based upon receipt of tax filings or other correspondence relating to the underlying investment. These distributions are recorded as a reduction of cost of investments and/or as a realized gain. Investment income is recorded net of foreign taxes withheld where recovery of such taxes is uncertain.
Class Allocations and Expenses. Investment income, realized and unrealized capital gains and losses, common expenses of the Fund, and certain fund-level expense reductions, if any, are allocated daily on a pro-rata basis to each class based on the relative net assets of each class to the total net assets of the Fund. Each class differs with respect to transfer agent and distribution and service plan fees incurred. Certain expense reductions may also differ by class. For the reporting period, the allocated portion of income and expenses to each class as a percent of its average net assets may vary due to the timing of recording these transactions in relation to fluctuating net assets of the classes. Expenses directly attributable to a fund are charged to that fund. Expenses attributable to more than one fund are allocated among the respective funds on the basis of relative net assets or other appropriate methods. Expense estimates are accrued in the period to which they relate and adjustments are made when actual amounts are known.
Deferred Trustee Compensation. Under a Deferred Compensation Plan (the Plan) for the Fund, certain independent Trustees have elected to defer receipt of a portion of their annual compensation. Deferred amounts are invested in a cross-section of Fidelity funds, are marked-to-market and remain in the Fund until distributed in accordance with the Plan. The investment of deferred amounts and the offsetting payable to the Trustees of $117,926 are included in the accompanying Statement of Assets and Liabilities in other receivables and other payables and accrued expenses, respectively.
Income Tax Information and Distributions to Shareholders. Each year, the Fund intends to qualify as a regulated investment company under Subchapter M of the Internal Revenue Code, including distributing substantially all of its taxable income and realized gains. As a result, no provision for U.S. Federal income taxes is required. The Fund files a U.S. federal tax return, in addition to state and local tax returns as required. The Fund's federal income tax returns are subject to examination by the Internal Revenue Service (IRS) for a period of three fiscal years after they are filed. State and local tax returns may be subject to examination for an additional fiscal year depending on the jurisdiction. Foreign taxes are provided for based on the Fund's understanding of the tax rules and rates that exist in the foreign markets in which it invests.
The Subsidiary is classified as a controlled foreign corporation under Subchapter N of the Internal Revenue Code. Therefore, the Fund is required to increase its taxable income by its share of the Subsidiary's income. Net investment losses of the Subsidiary cannot be deducted by the Fund in the current period nor carried forward to offset taxable income in future periods.
Distributions are declared and recorded on the ex-dividend date. Income and capital gain distributions are declared separately for each class. Income and capital gain distributions are determined in accordance with income tax regulations, which may differ from GAAP.
Capital accounts within the consolidated financial statements are adjusted for permanent book-tax differences. These adjustments have no impact on net assets or the results of operations. Capital accounts are not adjusted for temporary book-tax differences which will reverse in a subsequent period.
Book-tax differences are primarily due to foreign currency transactions, passive foreign investment companies (PFIC), controlled foreign corporations, deferred trustees compensation, capital loss carryforwards and losses deferred due to wash sales.
As of period end, the cost and unrealized appreciation (depreciation) in securities, and derivatives if applicable, for federal income tax purposes on an unconsolidated basis were as follows:
| Gross unrealized appreciation | $ 1,260,205,496 |
| Gross unrealized depreciation | (52,596,484) |
| Net unrealized appreciation (depreciation) | $1,207,609,012 |
| Tax cost | $1,549,756,349 |
Capital loss carryforwards are only available to offset future capital gains of the Fund to the extent provided by regulations and may be limited. The capital loss carryforward information presented below, including any applicable limitation, is estimated as of prior fiscal period end and is subject to adjustment.
| No expiration | |
| Short-term | $(147,641,269) |
| Long-term | (1,443,093,862) |
| Total capital loss carryforward | $(1,590,735,131) |
Restricted Securities (including Private Placements). The Fund may invest in securities that are subject to legal or contractual restrictions on resale. These securities generally may be resold in transactions exempt from registration or to the public if the securities are registered. Disposal of these securities may involve time-consuming negotiations and expense, and prompt sale at an acceptable price may be difficult. Information regarding restricted securities is included at the end of the Fund's Consolidated Schedule of Investments.
5. Purchases and Sales of Investments.
Purchases and sales of securities, other than short-term securities, are noted in the table below.
| | Purchases ($) | Sales ($) |
| Gold Portfolio | 648,212,410 | 516,143,162 |
6. Fees and Other Transactions with Affiliates.
Management Fee. Fidelity Management & Research Company LLC (the investment adviser) and its affiliates provide the Fund with investment management related services for which the Fund pays a monthly management fee. The management fee is the sum of an individual fund fee rate that is based on an annual rate of .30% of the Fund's average net assets and an annualized group fee rate that averaged .23% during the period. The group fee rate is based upon the monthly average net assets of a group of registered investment companies with which the investment adviser has management contracts. The group fee rate decreases as assets under management increase and increases as assets under management decrease. For the reporting period, the total annualized management fee rate was .53% of the Fund's average net assets.
The investment adviser, either through itself or through an affiliate provides investment management related services to the Subsidiary. The Subsidiary does not pay the investment adviser a fee for these services. Under the management contract with the subsidiary, the investment adviser pays all other expenses of the Subsidiary, except custodian fees.
Distribution and Service Plan Fees. In accordance with Rule 12b-1 of the 1940 Act, the Fund has adopted separate Distribution and Service Plans for each class of shares. Certain classes pay Fidelity Distributors Company LLC (FDC), an affiliate of the investment adviser, separate Distribution and Service Fees, each of which is based on an annual percentage of each class' average net assets. In addition, FDC may pay financial intermediaries for selling shares of the Fund and providing shareholder support services. For the period, the Distribution and Service Fee rates, total fees and amounts retained by FDC were as follows:
| | Distribution Fee | Service Fee | Total Fees | Retained by FDC |
| Class A | -% | .25% | $105,395 | $4,110 |
| Class M | .25% | .25% | 65,080 | 90 |
| Class C | .75% | .25% | 317,331 | 24,857 |
| | | | $487,806 | $29,057 |
Sales Load. FDC may receive a front-end sales charge of up to 5.75% for selling Class A shares and 3.50% for selling Class M shares, some of which is paid to financial intermediaries for selling shares of the Fund. Depending on the holding period, FDC may receive contingent deferred sales charges levied on Class A, Class M and Class C redemptions. The deferred sales charges are 1.00% for Class C shares, 1.00% for certain purchases of Class A shares and .25% for certain purchases of Class M shares.
For the period, sales charge amounts retained by FDC were as follows:
| | Retained by FDC |
| Class A | $30,803 |
| Class M | 3,809 |
| Class C(a) | 7,914 |
| | $42,526 |
(a) When Class C shares are initially sold, FDC pays commissions from its own resources to financial intermediaries through which the sales are made.
Transfer Agent Fees. Fidelity Investments Institutional Operations Company LLC (FIIOC), an affiliate of the investment adviser, is the transfer, dividend disbursing and shareholder servicing agent for each class of the Fund. FIIOC receives account fees and asset-based fees that vary according to the account size and type of account of the shareholders of the respective classes of the Fund, except for Class Z. FIIOC receives an asset-based fee of Class Z's average net assets. FIIOC pays for typesetting, printing and mailing of shareholder reports, except proxy statements.
For the period, transfer agent fees for each class were as follows:
| | Amount | % of Class-Level Average Net Assets(a) |
| Class A | $100,726 | .24 |
| Class M | 36,089 | .28 |
| Class C | 60,939 | .19 |
| Gold | 1,451,861 | .17 |
| Class I | 141,884 | .18 |
| Class Z | 25,899 | .04 |
| | $1,817,398 | |
(a) Annualized
Accounting Fees. Fidelity Service Company, Inc. (FSC), an affiliate of the investment adviser, maintains the Fund's accounting records. The accounting fee is based on the level of average net assets for each month. For the period, the fees were equivalent to the following annualized rates:
| | % of Average Net Assets |
| Gold Portfolio | .04 |
Brokerage Commissions. A portion of portfolio transactions were placed with brokerage firms which are affiliates of the investment adviser. Brokerage commissions are included in net realized gain (loss) and change in net unrealized appreciation (depreciation) in the Consolidated Statement of Operations. The commissions paid to these affiliated firms were as follows:
| | Amount |
| Gold Portfolio | $4,514 |
Interfund Lending Program. Pursuant to an Exemptive Order issued by the SEC, the fund, along with other registered investment companies having management contracts with Fidelity Management & Research Company LLC (FMR), or other affiliated entities of FMR, may participate in an interfund lending program. This program provides an alternative credit facility allowing the fund to borrow from, or lend money to, other participating affiliated funds. At period end, there were no interfund loans outstanding. Activity in this program during the period for which loans were outstanding was as follows:
| | Borrower or Lender | Average Loan Balance | Weighted Average Interest Rate | Interest Expense |
| Gold Portfolio | Borrower | $5,366,000 | .27% | $80 |
Interfund Trades. Funds may purchase from or sell securities to other Fidelity Funds under procedures adopted by the Board. The procedures have been designed to ensure these interfund trades are executed in accordance with Rule 17a-7 of the 1940 Act. Interfund trades are included within the respective purchases and sales amounts shown in the Purchases and Sales of Investments note.
7. Committed Line of Credit.
Certain Funds participate with other funds managed by the investment adviser or an affiliate in a $4.25 billion credit facility (the "line of credit") to be utilized for temporary or emergency purposes to fund shareholder redemptions or for other short-term liquidity purposes. The participating funds have agreed to pay commitment fees on their pro-rata portion of the line of credit, which are reflected in Miscellaneous expenses on the Consolidated Statement of Operations, and are as follows:
| | Amount |
| Gold Portfolio | $2,292 |
During the period, there were no borrowings on this line of credit.
8. Security Lending.
The Fund lends portfolio securities from time to time in order to earn additional income. Lending agents are used, including National Financial Services (NFS), an affiliate of the Fund. Pursuant to a securities lending agreement, NFS will receive a fee, which is capped at 9.9% of daily lending revenue, for its services as lending agent. The Fund may lend securities to certain qualified borrowers, including NFS. On the settlement date of the loan, the Fund receives collateral (in the form of U.S. Treasury obligations, letters of credit and/or cash) against the loaned securities and maintains collateral in an amount not less than 100% of the market value of the loaned securities during the period of the loan. The market value of the loaned securities is determined at the close of business of the Fund and any additional required collateral is delivered to the Fund on the next business day. The Fund or borrower may terminate the loan at any time, and if the borrower defaults on its obligation to return the securities loaned because of insolvency or other reasons, the Fund may apply collateral received from the borrower against the obligation. The Fund may experience delays and costs in recovering the securities loaned. Any cash collateral received is invested in the Fidelity Securities Lending Cash Central Fund. The value of loaned securities and cash collateral at period end are disclosed on the Fund's Consolidated Statement of Assets and Liabilities. Total fees paid by the Fund to NFS, as lending agent, amounted to $147. Security lending income represents the income earned on investing cash collateral, less rebates paid to borrowers and any lending agent fees associated with the loan, plus any premium payments received for lending certain types of securities. Net income from the Fidelity Securities Lending Cash Central Fund during the period is presented in the Consolidated Statement of Operations as a component of income from Fidelity Central Funds. During the period, there were no securities loaned to NFS.
9. Expense Reductions.
Commissions paid to certain brokers with whom the investment adviser, or its affiliates, places trades on behalf of the Fund include an amount in addition to trade execution, which may be rebated back to the Fund to offset certain expenses. This amount totaled $161,124 for the period.
In addition, during the period the investment adviser or an affiliate reimbursed and/or waived a portion of fund-level operating expenses in the amount of $3,360.
10. Distributions to Shareholders.
Distributions to shareholders of each class were as follows:
| | Six months ended
August 31, 2020 | Year ended
February 29, 2020 |
| Distributions to shareholders | | |
| Class A | $455,445 | $126,430 |
| Class M | 125,251 | – |
| Class C | 317,201 | – |
| Gold | 9,380,524 | 5,685,007 |
| Class I | 863,741 | 512,501 |
| Class Z | 673,784 | 523,784 |
| Total | $11,815,946 | $6,847,722 |
11. Share Transactions.
Share transactions for each class were as follows and may contain automatic conversions between classes or exchanges between affiliated funds:
| | Shares | Shares | Dollars | Dollars |
| | Six months ended August 31, 2020 | Year ended February 29, 2020 | Six months ended August 31, 2020 | Year ended February 29, 2020 |
| Class A | | | | |
| Shares sold | 977,638 | 1,071,031 | $27,877,872 | $23,081,577 |
| Reinvestment of distributions | 21,155 | 5,541 | 448,905 | 124,685 |
| Shares redeemed | (712,616) | (803,447) | (18,708,178) | (17,157,110) |
| Net increase (decrease) | 286,177 | 273,125 | $9,618,599 | $6,049,152 |
| Class M | | | | |
| Shares sold | 300,590 | 235,440 | $8,287,807 | $4,985,960 |
| Reinvestment of distributions | 6,023 | – | 124,861 | – |
| Shares redeemed | (190,420) | (269,260) | (4,799,063) | (5,455,321) |
| Net increase (decrease) | 116,193 | (33,820) | $3,613,605 | $(469,361) |
| Class C | | | | |
| Shares sold | 364,356 | 447,770 | $9,571,498 | $9,285,024 |
| Reinvestment of distributions | 15,784 | – | 310,162 | – |
| Shares redeemed | (482,192) | (1,768,549) | (11,213,510) | (33,587,608) |
| Net increase (decrease) | (102,052) | (1,320,779) | $(1,331,850) | $(24,302,584) |
| Gold | | | | |
| Shares sold | 23,592,146 | 35,604,152 | $687,375,958 | $801,315,881 |
| Reinvestment of distributions | 411,951 | 237,526 | 9,005,239 | 5,435,729 |
| Shares redeemed | (20,489,138) | (32,282,204) | (571,641,193) | (714,942,656) |
| Net increase (decrease) | 3,514,959 | 3,559,474 | $124,740,004 | $91,808,954 |
| Class I | | | | |
| Shares sold | 1,885,712 | 2,911,958 | $52,134,318 | $63,117,217 |
| Reinvestment of distributions | 37,727 | 21,730 | 825,098 | 497,247 |
| Shares redeemed | (1,203,520) | (2,207,535) | (31,863,149) | (48,726,909) |
| Net increase (decrease) | 719,919 | 726,153 | $21,096,267 | $14,887,555 |
| Class Z | | | | |
| Shares sold | 2,435,062 | 5,524,932 | $70,161,676 | $130,157,436 |
| Reinvestment of distributions | 30,386 | 22,294 | 664,850 | 509,236 |
| Shares redeemed | (2,293,630) | (1,450,995) | (60,962,658) | (33,527,536) |
| Net increase (decrease) | 171,818 | 4,096,231 | $9,863,868 | $97,139,136 |
12. Other.
The Fund's organizational documents provide former and current trustees and officers with a limited indemnification against liabilities arising in connection with the performance of their duties to the Fund. In the normal course of business, the Fund may also enter into contracts that provide general indemnifications. The Fund's maximum exposure under these arrangements is unknown as this would be dependent on future claims that may be made against the Fund. The risk of material loss from such claims is considered remote.
13. Coronavirus (COVID-19) Pandemic.
An outbreak of COVID-19 first detected in China during December 2019 has since spread globally and was declared a pandemic by the World Health Organization during March 2020. Developments that disrupt global economies and financial markets, such as the COVID-19 pandemic, may magnify factors that affect the Fund's performance.
Materials Portfolio
Investment Summary (Unaudited)
Top Ten Stocks as of August 31, 2020
| | % of fund's net assets |
| Linde PLC | 14.5 |
| Air Products & Chemicals, Inc. | 7.1 |
| Sherwin-Williams Co. | 6.6 |
| Newmont Corp. | 6.3 |
| Ecolab, Inc. | 5.4 |
| DuPont de Nemours, Inc. | 4.9 |
| Martin Marietta Materials, Inc. | 4.5 |
| Vulcan Materials Co. | 3.6 |
| First Quantum Minerals Ltd. | 3.2 |
| Ball Corp. | 3.1 |
| | 59.2 |
Top Industries (% of fund's net assets)
| As of August 31, 2020 |
| | Chemicals | 58.4% |
| | Metals & Mining | 19.7% |
| | Containers & Packaging | 10.8% |
| | Construction Materials | 8.6% |
| | Paper & Forest Products | 0.3% |
| | All Others* | 2.2% |

* Includes Short-Term investments and Net Other Assets (Liabilities).
Materials Portfolio
Schedule of Investments August 31, 2020 (Unaudited)
Showing Percentage of Net Assets
| Common Stocks - 97.8% | | | |
| | | Shares | Value |
| Chemicals - 58.4% | | | |
| Commodity Chemicals - 4.8% | | | |
| LyondellBasell Industries NV Class A | | 233,100 | $15,263,388 |
| Tronox Holdings PLC | | 2,040,703 | 18,284,699 |
| | | | 33,548,087 |
| Diversified Chemicals - 0.3% | | | |
| Huntsman Corp. | | 109,500 | 2,367,390 |
| Fertilizers & Agricultural Chemicals - 4.7% | | | |
| CF Industries Holdings, Inc. | | 113,100 | 3,690,453 |
| Corteva, Inc. | | 333,611 | 9,524,594 |
| FMC Corp. | | 127,517 | 13,626,467 |
| The Mosaic Co. | | 193,800 | 3,532,974 |
| The Scotts Miracle-Gro Co. Class A | | 18,400 | 3,100,952 |
| | | | 33,475,440 |
| Industrial Gases - 21.6% | | | |
| Air Products & Chemicals, Inc. | | 170,700 | 49,888,782 |
| Linde PLC | | 409,786 | 102,339,955 |
| | | | 152,228,737 |
| Specialty Chemicals - 27.0% | | | |
| Albemarle Corp. U.S. | | 80,000 | 7,280,800 |
| Ashland Global Holdings, Inc. | | 60,800 | 4,480,352 |
| Balchem Corp. | | 46,000 | 4,494,200 |
| DuPont de Nemours, Inc. | | 622,311 | 34,700,061 |
| Ecolab, Inc. | | 194,510 | 38,334,031 |
| Ingevity Corp. (a) | | 32,900 | 1,847,993 |
| Innospec, Inc. | | 76,300 | 5,698,847 |
| International Flavors & Fragrances, Inc. (b) | | 53,431 | 6,614,223 |
| Livent Corp. (a)(b) | | 347,997 | 2,951,015 |
| PPG Industries, Inc. | | 172,300 | 20,744,920 |
| RPM International, Inc. | | 111,200 | 9,426,424 |
| Sherwin-Williams Co. | | 69,800 | 46,839,290 |
| Stepan Co. | | 19,600 | 2,259,684 |
| Wacker Chemie AG | | 50,800 | 4,963,744 |
| | | | 190,635,584 |
|
| TOTAL CHEMICALS | | | 412,255,238 |
|
| Construction Materials - 8.6% | | | |
| Construction Materials - 8.6% | | | |
| Martin Marietta Materials, Inc. | | 157,700 | 31,992,599 |
| Summit Materials, Inc. (a) | | 228,800 | 3,406,832 |
| Vulcan Materials Co. | | 211,700 | 25,404,000 |
| | | | 60,803,431 |
| Containers & Packaging - 10.8% | | | |
| Metal & Glass Containers - 8.4% | | | |
| Aptargroup, Inc. | | 137,800 | 16,314,142 |
| Ball Corp. | | 273,700 | 21,997,269 |
| Crown Holdings, Inc. (a) | | 274,059 | 21,061,434 |
| | | | 59,372,845 |
| Paper Packaging - 2.4% | | | |
| Avery Dennison Corp. | | 93,600 | 10,800,504 |
| Packaging Corp. of America | | 58,400 | 5,912,416 |
| | | | 16,712,920 |
|
| TOTAL CONTAINERS & PACKAGING | | | 76,085,765 |
|
| Metals & Mining - 19.7% | | | |
| Copper - 6.3% | | | |
| First Quantum Minerals Ltd. | | 2,271,400 | 22,481,523 |
| Freeport-McMoRan, Inc. | | 332,400 | 5,188,764 |
| Lundin Mining Corp. | | 2,689,700 | 16,847,356 |
| | | | 44,517,643 |
| Diversified Metals & Mining - 1.2% | | | |
| MMC Norilsk Nickel PJSC sponsored ADR | | 321,700 | 8,380,285 |
| Gold - 9.2% | | | |
| Newmont Corp. | | 664,700 | 44,721,016 |
| Royal Gold, Inc. | | 63,400 | 8,642,688 |
| Wheaton Precious Metals Corp. | | 222,400 | 11,877,475 |
| | | | 65,241,179 |
| Steel - 3.0% | | | |
| Commercial Metals Co. | | 380,600 | 7,943,122 |
| Reliance Steel & Aluminum Co. | | 78,300 | 8,211,321 |
| Steel Dynamics, Inc. | | 178,800 | 5,278,176 |
| | | | 21,432,619 |
|
| TOTAL METALS & MINING | | | 139,571,726 |
|
| Paper & Forest Products - 0.3% | | | |
| Forest Products - 0.3% | | | |
| Louisiana-Pacific Corp. | | 63,500 | 2,091,690 |
| TOTAL COMMON STOCKS | | | |
| (Cost $553,644,306) | | | 690,807,850 |
|
| Money Market Funds - 1.0% | | | |
| Fidelity Cash Central Fund 0.12% (c) | | 1,595,070 | 1,595,389 |
| Fidelity Securities Lending Cash Central Fund 0.11% (c)(d) | | 5,561,249 | 5,561,805 |
| TOTAL MONEY MARKET FUNDS | | | |
| (Cost $7,157,194) | | | 7,157,194 |
| TOTAL INVESTMENT IN SECURITIES - 98.8% | | | |
| (Cost $560,801,500) | | | 697,965,044 |
| NET OTHER ASSETS (LIABILITIES) - 1.2% | | | 8,388,130 |
| NET ASSETS - 100% | | | $706,353,174 |
Legend
(a) Non-income producing
(b) Security or a portion of the security is on loan at period end.
(c) Affiliated fund that is generally available only to investment companies and other accounts managed by Fidelity Investments. The rate quoted is the annualized seven-day yield of the fund at period end. A complete unaudited listing of the fund's holdings as of its most recent quarter end is available upon request. In addition, each Fidelity Central Fund's financial statements are available on the SEC's website or upon request.
(d) Investment made with cash collateral received from securities on loan.
Affiliated Central Funds
Information regarding fiscal year to date income earned by the Fund from investments in Fidelity Central Funds is as follows:
| Fund | Income earned |
| Fidelity Cash Central Fund | $6,118 |
| Fidelity Securities Lending Cash Central Fund | 16,098 |
| Total | $22,216 |
Amounts in the income column in the above table include any capital gain distributions from underlying funds, which are presented in the corresponding line-item in the Statement of Operations, if applicable. Amount for Fidelity Securities Lending Cash Central Fund represents the income earned on investing cash collateral, less rebates paid to borrowers and any lending agent fees associated with the loan, plus any premium payments received for lending certain types of securities.
Investment Valuation
The following is a summary of the inputs used, as of August 31, 2020, involving the Fund's assets and liabilities carried at fair value. The inputs or methodology used for valuing securities may not be an indication of the risk associated with investing in those securities. For more information on valuation inputs, and their aggregation into the levels used below, please refer to the Investment Valuation section in the accompanying Notes to Financial Statements.
| | Valuation Inputs at Reporting Date: |
| Description | Total | Level 1 | Level 2 | Level 3 |
| Investments in Securities: | | | | |
| Common Stocks | $690,807,850 | $690,807,850 | $-- | $-- |
| Money Market Funds | 7,157,194 | 7,157,194 | -- | -- |
| Total Investments in Securities: | $697,965,044 | $697,965,044 | $-- | $-- |
Other Information
Distribution of investments by country or territory of incorporation, as a percentage of Total Net Assets, is as follows (Unaudited):
| United States of America | 71.5% |
| Ireland | 14.5% |
| Canada | 7.3% |
| United Kingdom | 2.6% |
| Netherlands | 2.2% |
| Russia | 1.2% |
| Others (Individually Less Than 1%) | 0.7% |
| | 100.0% |
See accompanying notes which are an integral part of the financial statements.
Materials Portfolio
Financial Statements
Statement of Assets and Liabilities
| | | August 31, 2020 (Unaudited) |
| Assets | | |
Investment in securities, at value (including securities loaned of $5,390,016) — See accompanying schedule:
Unaffiliated issuers (cost $553,644,306) | $690,807,850 | |
| Fidelity Central Funds (cost $7,157,194) | 7,157,194 | |
| Total Investment in Securities (cost $560,801,500) | | $697,965,044 |
| Foreign currency held at value (cost $19,027) | | 19,743 |
| Receivable for investments sold | | 17,777,667 |
| Receivable for fund shares sold | | 453,026 |
| Dividends receivable | | 1,447,316 |
| Distributions receivable from Fidelity Central Funds | | 3,130 |
| Prepaid expenses | | 11,856 |
| Other receivables | | 176,599 |
| Total assets | | 717,854,381 |
| Liabilities | | |
| Payable for investments purchased | $3,609,789 | |
| Payable for fund shares redeemed | 1,670,888 | |
| Accrued management fee | 314,022 | |
| Distribution and service plan fees payable | 44,716 | |
| Other affiliated payables | 143,280 | |
| Other payables and accrued expenses | 173,212 | |
| Collateral on securities loaned | 5,545,300 | |
| Total liabilities | | 11,501,207 |
| Net Assets | | $706,353,174 |
| Net Assets consist of: | | |
| Paid in capital | | $676,072,884 |
| Total accumulated earnings (loss) | | 30,280,290 |
| Net Assets | | $706,353,174 |
| Net Asset Value and Maximum Offering Price | | |
| Class A: | | |
| Net Asset Value and redemption price per share ($80,904,537 ÷ 1,152,114 shares)(a) | | $70.22 |
| Maximum offering price per share (100/94.25 of $70.22) | | $74.50 |
| Class M: | | |
| Net Asset Value and redemption price per share ($20,953,661 ÷ 301,607 shares)(a) | | $69.47 |
| Maximum offering price per share (100/96.50 of $69.47) | | $71.99 |
| Class C: | | |
| Net Asset Value and offering price per share ($22,284,848 ÷ 330,120 shares)(a) | | $67.51 |
| Materials: | | |
| Net Asset Value, offering price and redemption price per share ($419,549,785 ÷ 5,942,360 shares) | | $70.60 |
| Class I: | | |
| Net Asset Value, offering price and redemption price per share ($144,166,233 ÷ 2,045,572 shares) | | $70.48 |
| Class Z: | | |
| Net Asset Value, offering price and redemption price per share ($18,494,110 ÷ 262,712 shares) | | $70.40 |
(a) Redemption price per share is equal to net asset value less any applicable contingent deferred sales charge.
See accompanying notes which are an integral part of the financial statements.
Statement of Operations
| | | Six months ended August 31, 2020 (Unaudited) |
| Investment Income | | |
| Dividends | | $5,983,032 |
| Income from Fidelity Central Funds (including $16,098 from security lending) | | 22,216 |
| Total income | | 6,005,248 |
| Expenses | | |
| Management fee | $1,718,979 | |
| Transfer agent fees | 714,691 | |
| Distribution and service plan fees | 247,558 | |
| Accounting fees | 117,369 | |
| Custodian fees and expenses | 5,329 | |
| Independent trustees' fees and expenses | 2,145 | |
| Registration fees | 36,013 | |
| Audit | 21,081 | |
| Legal | 2,908 | |
| Miscellaneous | 32,633 | |
| Total expenses before reductions | 2,898,706 | |
| Expense reductions | (51,007) | |
| Total expenses after reductions | | 2,847,699 |
| Net investment income (loss) | | 3,157,549 |
| Realized and Unrealized Gain (Loss) | | |
| Net realized gain (loss) on: | | |
| Investment securities: | | |
| Unaffiliated issuers | (4,653,601) | |
| Fidelity Central Funds | 9,250 | |
| Foreign currency transactions | (26,922) | |
| Total net realized gain (loss) | | (4,671,273) |
| Change in net unrealized appreciation (depreciation) on: | | |
| Investment securities: | | |
| Unaffiliated issuers | 111,828,544 | |
| Assets and liabilities in foreign currencies | 22,204 | |
| Total change in net unrealized appreciation (depreciation) | | 111,850,748 |
| Net gain (loss) | | 107,179,475 |
| Net increase (decrease) in net assets resulting from operations | | $110,337,024 |
See accompanying notes which are an integral part of the financial statements.
Statement of Changes in Net Assets
| | Six months ended August 31, 2020 (Unaudited) | Year ended February 29, 2020 |
| Increase (Decrease) in Net Assets | | |
| Operations | | |
| Net investment income (loss) | $3,157,549 | $9,745,085 |
| Net realized gain (loss) | (4,671,273) | (91,670,706) |
| Change in net unrealized appreciation (depreciation) | 111,850,748 | (34,457,826) |
| Net increase (decrease) in net assets resulting from operations | 110,337,024 | (116,383,447) |
| Distributions to shareholders | – | (9,657,928) |
| Share transactions - net increase (decrease) | (81,336,566) | (292,920,936) |
| Total increase (decrease) in net assets | 29,000,458 | (418,962,311) |
| Net Assets | | |
| Beginning of period | 677,352,716 | 1,096,315,027 |
| End of period | $706,353,174 | $677,352,716 |
See accompanying notes which are an integral part of the financial statements.
Financial Highlights
Materials Portfolio Class A
| | Six months ended (Unaudited) August 31, | Years endedFebruary 28, | | | | |
| | 2020 | 2020 A | 2019 | 2018 | 2017 | 2016 A |
| Selected Per–Share Data | | | | | | |
| Net asset value, beginning of period | $59.39 | $69.57 | $88.50 | $81.27 | $62.94 | $80.43 |
| Income from Investment Operations | | | | | | |
| Net investment income (loss)B | .23 | .58 | .84 | .55 | .70 | .79 |
| Net realized and unrealized gain (loss) | 10.60 | (10.10) | (12.01) | 11.18 | 18.26 | (16.80) |
| Total from investment operations | 10.83 | (9.52) | (11.17) | 11.73 | 18.96 | (16.01) |
| Distributions from net investment income | – | (.66) | (.67) | (.50) | (.63) | (.58) |
| Distributions from net realized gain | – | – | (7.09) | (4.00) | – | (.91) |
| Total distributions | – | (.66) | (7.76) | (4.50) | (.63) | (1.48)C |
| Redemption fees added to paid in capitalB | – | – | – | – | –D | –D |
| Net asset value, end of period | $70.22 | $59.39 | $69.57 | $88.50 | $81.27 | $62.94 |
| Total ReturnE,F,G | 18.24% | (13.81)% | (12.59)% | 14.65% | 30.18% | (20.01)% |
| Ratios to Average Net AssetsH,I | | | | | | |
| Expenses before reductions | 1.10%J | 1.08% | 1.06% | 1.07% | 1.08% | 1.06% |
| Expenses net of fee waivers, if any | 1.10%J | 1.08% | 1.06% | 1.07% | 1.08% | 1.06% |
| Expenses net of all reductions | 1.08%J | 1.07% | 1.05% | 1.06% | 1.07% | 1.06% |
| Net investment income (loss) | .77%J | .87% | 1.08% | .64% | .96% | 1.09% |
| Supplemental Data | | | | | | |
| Net assets, end of period (000 omitted) | $80,905 | $76,869 | $126,182 | $201,933 | $229,086 | $202,747 |
| Portfolio turnover rateK | 19%J | 69% | 77%L | 67% | 49%L | 64% |
A For the year ended February 29.
B Calculated based on average shares outstanding during the period.
C Total distributions of $1.48 per share is comprised of distributions from net investment income of $.575 and distributions from net realized gain of $.906 per share.
D Amount represents less than $.005 per share.
E Total returns for periods of less than one year are not annualized.
F Total returns would have been lower if certain expenses had not been reduced during the applicable periods shown.
G Total returns do not include the effect of the sales charges.
H Fees and expenses of any underlying mutual funds or exchange-traded funds (ETFs) are not included in the Fund's expense ratio. The Fund indirectly bears its proportionate share of these expenses. For additional expense information related to investments in Fidelity Central Funds, please refer to the "Investments in Fidelity Central Funds" note found in the Notes to Financial Statements section of the most recent Annual or Semi-Annual report.
I Expense ratios reflect operating expenses of the class. Expenses before reductions do not reflect amounts reimbursed, waived, or reduced through arrangements with the investment adviser, brokerage services, or other offset arrangements, if applicable, and do not represent the amount paid by the class during periods when reimbursements, waivers or reductions occur.
J Annualized
K Amount does not include the portfolio activity of any underlying Fidelity Central Funds.
L Portfolio turnover rate excludes securities received or delivered in-kind.
See accompanying notes which are an integral part of the financial statements.
Materials Portfolio Class M
| | Six months ended (Unaudited) August 31, | Years endedFebruary 28, | | | | |
| | 2020 | 2020 A | 2019 | 2018 | 2017 | 2016 A |
| Selected Per–Share Data | | | | | | |
| Net asset value, beginning of period | $58.84 | $68.98 | $87.79 | $80.66 | $62.52 | $79.95 |
| Income from Investment Operations | | | | | | |
| Net investment income (loss)B | .15 | .39 | .61 | .30 | .47 | .56 |
| Net realized and unrealized gain (loss) | 10.48 | (10.01) | (11.88) | 11.08 | 18.12 | (16.69) |
| Total from investment operations | 10.63 | (9.62) | (11.27) | 11.38 | 18.59 | (16.13) |
| Distributions from net investment income | – | (.52) | (.45) | (.25) | (.45) | (.40) |
| Distributions from net realized gain | – | – | (7.09) | (4.00) | – | (.91) |
| Total distributions | – | (.52) | (7.54) | (4.25) | (.45) | (1.30)C |
| Redemption fees added to paid in capitalB | – | – | – | – | –D | –D |
| Net asset value, end of period | $69.47 | $58.84 | $68.98 | $87.79 | $80.66 | $62.52 |
| Total ReturnE,F,G | 18.07% | (14.05)% | (12.84)% | 14.30% | 29.78% | (20.27)% |
| Ratios to Average Net AssetsH,I | | | | | | |
| Expenses before reductions | 1.37%J | 1.37% | 1.35% | 1.36% | 1.39% | 1.38% |
| Expenses net of fee waivers, if any | 1.37%J | 1.36% | 1.35% | 1.36% | 1.39% | 1.37% |
| Expenses net of all reductions | 1.36%J | 1.36% | 1.34% | 1.35% | 1.38% | 1.37% |
| Net investment income (loss) | .50%J | .58% | .79% | .35% | .65% | .77% |
| Supplemental Data | | | | | | |
| Net assets, end of period (000 omitted) | $20,954 | $19,423 | $27,436 | $40,107 | $40,935 | $30,118 |
| Portfolio turnover rateK | 19%J | 69% | 77%L | 67% | 49%L | 64% |
A For the year ended February 29.
B Calculated based on average shares outstanding during the period.
C Total distributions of $1.30 per share is comprised of distributions from net investment income of $.395 and distributions from net realized gain of $.906 per share.
D Amount represents less than $.005 per share.
E Total returns for periods of less than one year are not annualized.
F Total returns would have been lower if certain expenses had not been reduced during the applicable periods shown.
G Total returns do not include the effect of the sales charges.
H Fees and expenses of any underlying mutual funds or exchange-traded funds (ETFs) are not included in the Fund's expense ratio. The Fund indirectly bears its proportionate share of these expenses. For additional expense information related to investments in Fidelity Central Funds, please refer to the "Investments in Fidelity Central Funds" note found in the Notes to Financial Statements section of the most recent Annual or Semi-Annual report.
I Expense ratios reflect operating expenses of the class. Expenses before reductions do not reflect amounts reimbursed, waived, or reduced through arrangements with the investment adviser, brokerage services, or other offset arrangements, if applicable, and do not represent the amount paid by the class during periods when reimbursements, waivers or reductions occur.
J Annualized
K Amount does not include the portfolio activity of any underlying Fidelity Central Funds.
L Portfolio turnover rate excludes securities received or delivered in-kind.
See accompanying notes which are an integral part of the financial statements.
Materials Portfolio Class C
| | Six months ended (Unaudited) August 31, | Years endedFebruary 28, | | | | |
| | 2020 | 2020 A | 2019 | 2018 | 2017 | 2016 A |
| Selected Per–Share Data | | | | | | |
| Net asset value, beginning of period | $57.30 | $67.13 | $85.52 | $78.72 | $61.09 | $78.12 |
| Income from Investment Operations | | | | | | |
| Net investment income (loss)B | .01 | .08 | .25 | (.09) | .15 | .24 |
| Net realized and unrealized gain (loss) | 10.20 | (9.76) | (11.50) | 10.80 | 17.68 | (16.28) |
| Total from investment operations | 10.21 | (9.68) | (11.25) | 10.71 | 17.83 | (16.04) |
| Distributions from net investment income | – | (.15) | (.04) | (.02) | (.20) | (.08) |
| Distributions from net realized gain | – | – | (7.09) | (3.89) | – | (.91) |
| Total distributions | – | (.15) | (7.14)C | (3.91) | (.20) | (.99) |
| Redemption fees added to paid in capitalB | – | – | – | – | –D | –D |
| Net asset value, end of period | $67.51 | $57.30 | $67.13 | $85.52 | $78.72 | $61.09 |
| Total ReturnE,F,G | 17.82% | (14.46)% | (13.24)% | 13.78% | 29.21% | (20.61)% |
| Ratios to Average Net AssetsH,I | | | | | | |
| Expenses before reductions | 1.85%J | 1.82% | 1.81% | 1.82% | 1.83% | 1.81% |
| Expenses net of fee waivers, if any | 1.84%J | 1.82% | 1.81% | 1.82% | 1.82% | 1.81% |
| Expenses net of all reductions | 1.83%J | 1.81% | 1.79% | 1.82% | 1.82% | 1.81% |
| Net investment income (loss) | .03%J | .12% | .33% | (.11)% | .21% | .34% |
| Supplemental Data | | | | | | |
| Net assets, end of period (000 omitted) | $22,285 | $24,239 | $51,659 | $85,792 | $80,225 | $66,896 |
| Portfolio turnover rateK | 19%J | 69% | 77%L | 67% | 49%L | 64% |
A For the year ended February 29.
B Calculated based on average shares outstanding during the period.
C Total distributions of $7.14 per share is comprised of distributions from net investment income of $.042 and distributions from net realized gain of $7.094 per share.
D Amount represents less than $.005 per share.
E Total returns for periods of less than one year are not annualized.
F Total returns would have been lower if certain expenses had not been reduced during the applicable periods shown.
G Total returns do not include the effect of the contingent deferred sales charge.
H Fees and expenses of any underlying mutual funds or exchange-traded funds (ETFs) are not included in the Fund's expense ratio. The Fund indirectly bears its proportionate share of these expenses. For additional expense information related to investments in Fidelity Central Funds, please refer to the "Investments in Fidelity Central Funds" note found in the Notes to Financial Statements section of the most recent Annual or Semi-Annual report.
I Expense ratios reflect operating expenses of the class. Expenses before reductions do not reflect amounts reimbursed, waived, or reduced through arrangements with the investment adviser, brokerage services, or other offset arrangements, if applicable, and do not represent the amount paid by the class during periods when reimbursements, waivers or reductions occur.
J Annualized
K Amount does not include the portfolio activity of any underlying Fidelity Central Funds.
L Portfolio turnover rate excludes securities received or delivered in-kind.
See accompanying notes which are an integral part of the financial statements.
Materials Portfolio
| | Six months ended (Unaudited) August 31, | Years endedFebruary 28, | | | | |
| | 2020 | 2020 A | 2019 | 2018 | 2017 | 2016 A |
| Selected Per–Share Data | | | | | | |
| Net asset value, beginning of period | $59.63 | $69.84 | $88.90 | $81.64 | $63.20 | $80.77 |
| Income from Investment Operations | | | | | | |
| Net investment income (loss)B | .32 | .77 | 1.06 | .79 | .90 | .98 |
| Net realized and unrealized gain (loss) | 10.65 | (10.14) | (12.09) | 11.24 | 18.34 | (16.89) |
| Total from investment operations | 10.97 | (9.37) | (11.03) | 12.03 | 19.24 | (15.91) |
| Distributions from net investment income | – | (.84) | (.93) | (.77) | (.80) | (.76) |
| Distributions from net realized gain | – | – | (7.09) | (4.00) | – | (.91) |
| Total distributions | – | (.84) | (8.03)C | (4.77) | (.80) | (1.66)D |
| Redemption fees added to paid in capitalB | – | – | – | – | –E | –E |
| Net asset value, end of period | $70.60 | $59.63 | $69.84 | $88.90 | $81.64 | $63.20 |
| Total ReturnF,G | 18.40% | (13.57)% | (12.35)% | 14.96% | 30.52% | (19.81)% |
| Ratios to Average Net AssetsH,I | | | | | | |
| Expenses before reductions | .82%J | .80% | .79% | .79% | .81% | .81% |
| Expenses net of fee waivers, if any | .82%J | .80% | .79% | .79% | .81% | .81% |
| Expenses net of all reductions | .81%J | .79% | .78% | .79% | .81% | .80% |
| Net investment income (loss) | 1.05%J | 1.14% | 1.35% | .91% | 1.22% | 1.34% |
| Supplemental Data | | | | | | |
| Net assets, end of period (000 omitted) | $419,550 | $405,668 | $626,759 | $1,043,704 | $882,504 | $711,985 |
| Portfolio turnover rateK | 19%J | 69% | 77%L | 67% | 49%L | 64% |
A For the year ended February 29.
B Calculated based on average shares outstanding during the period.
C Total distributions of $8.03 per share is comprised of distributions from net investment income of $.932 and distributions from net realized gain of $7.094 per share.
D Total distributions of $1.66 per share is comprised of distributions from net investment income of $.756 and distributions from net realized gain of $.906 per share.
E Amount represents less than $.005 per share.
F Total returns for periods of less than one year are not annualized.
G Total returns would have been lower if certain expenses had not been reduced during the applicable periods shown.
H Fees and expenses of any underlying mutual funds or exchange-traded funds (ETFs) are not included in the Fund's expense ratio. The Fund indirectly bears its proportionate share of these expenses. For additional expense information related to investments in Fidelity Central Funds, please refer to the "Investments in Fidelity Central Funds" note found in the Notes to Financial Statements section of the most recent Annual or Semi-Annual report.
I Expense ratios reflect operating expenses of the class. Expenses before reductions do not reflect amounts reimbursed, waived, or reduced through arrangements with the investment adviser, brokerage services, or other offset arrangements, if applicable, and do not represent the amount paid by the class during periods when reimbursements, waivers or reductions occur.
J Annualized
K Amount does not include the portfolio activity of any underlying Fidelity Central Funds.
L Portfolio turnover rate excludes securities received or delivered in-kind.
See accompanying notes which are an integral part of the financial statements.
Materials Portfolio Class I
| | Six months ended (Unaudited) August 31, | Years endedFebruary 28, | | | | |
| | 2020 | 2020 A | 2019 | 2018 | 2017 | 2016 A |
| Selected Per–Share Data | | | | | | |
| Net asset value, beginning of period | $59.52 | $69.70 | $88.73 | $81.49 | $63.07 | $80.60 |
| Income from Investment Operations | | | | | | |
| Net investment income (loss)B | .33 | .78 | 1.07 | .80 | .91 | 1.00 |
| Net realized and unrealized gain (loss) | 10.63 | (10.12) | (12.08) | 11.22 | 18.31 | (16.86) |
| Total from investment operations | 10.96 | (9.34) | (11.01) | 12.02 | 19.22 | (15.86) |
| Distributions from net investment income | – | (.84) | (.93) | (.78) | (.80) | (.77) |
| Distributions from net realized gain | – | – | (7.09) | (4.00) | – | (.91) |
| Total distributions | – | (.84) | (8.02) | (4.78) | (.80) | (1.67)C |
| Redemption fees added to paid in capitalB | – | – | – | – | –D | –D |
| Net asset value, end of period | $70.48 | $59.52 | $69.70 | $88.73 | $81.49 | $63.07 |
| Total ReturnE,F | 18.41% | (13.55)% | (12.34)% | 14.97% | 30.55% | (19.79)% |
| Ratios to Average Net AssetsG,H | | | | | | |
| Expenses before reductions | .80%I | .79% | .78% | .79% | .79% | .78% |
| Expenses net of fee waivers, if any | .80%I | .79% | .78% | .79% | .79% | .78% |
| Expenses net of all reductions | .78%I | .78% | .77% | .78% | .78% | .78% |
| Net investment income (loss) | 1.07%I | 1.16% | 1.36% | .92% | 1.25% | 1.37% |
| Supplemental Data | | | | | | |
| Net assets, end of period (000 omitted) | $144,166 | $137,887 | $254,240 | $511,062 | $335,124 | $306,145 |
| Portfolio turnover rateJ | 19%I | 69% | 77%K | 67% | 49%K | 64% |
A For the year ended February 29.
B Calculated based on average shares outstanding during the period.
C Total distributions of $1.67 per share is comprised of distributions from net investment income of $.767 and distributions from net realized gain of $.906 per share.
D Amount represents less than $.005 per share.
E Total returns for periods of less than one year are not annualized.
F Total returns would have been lower if certain expenses had not been reduced during the applicable periods shown.
G Fees and expenses of any underlying mutual funds or exchange-traded funds (ETFs) are not included in the Fund's expense ratio. The Fund indirectly bears its proportionate share of these expenses. For additional expense information related to investments in Fidelity Central Funds, please refer to the "Investments in Fidelity Central Funds" note found in the Notes to Financial Statements section of the most recent Annual or Semi-Annual report.
H Expense ratios reflect operating expenses of the class. Expenses before reductions do not reflect amounts reimbursed, waived, or reduced through arrangements with the investment adviser, brokerage services, or other offset arrangements, if applicable, and do not represent the amount paid by the class during periods when reimbursements, waivers or reductions occur.
I Annualized
J Amount does not include the portfolio activity of any underlying Fidelity Central Funds.
K Portfolio turnover rate excludes securities received or delivered in-kind.
See accompanying notes which are an integral part of the financial statements.
Materials Portfolio Class Z
| | Six months ended (Unaudited) August 31, | Years endedFebruary 28, | |
| | 2020 | 2020 A | 2019 B |
| Selected Per–Share Data | | | |
| Net asset value, beginning of period | $59.40 | $69.58 | $79.81 |
| Income from Investment Operations | | | |
| Net investment income (loss)C | .37 | .88 | .62 |
| Net realized and unrealized gain (loss) | 10.63 | (10.10) | (6.96) |
| Total from investment operations | 11.00 | (9.22) | (6.34) |
| Distributions from net investment income | – | (.96) | (.96) |
| Distributions from net realized gain | – | – | (2.93) |
| Total distributions | – | (.96) | (3.89) |
| Net asset value, end of period | $70.40 | $59.40 | $69.58 |
| Total ReturnD,E | 18.52% | (13.43)% | (7.35)% |
| Ratios to Average Net AssetsF,G | | | |
| Expenses before reductions | .64%H | .63% | .63%H |
| Expenses net of fee waivers, if any | .64%H | .63% | .62%H |
| Expenses net of all reductions | .63%H | .62% | .61%H |
| Net investment income (loss) | 1.23%H | 1.31% | 2.27%H |
| Supplemental Data | | | |
| Net assets, end of period (000 omitted) | $18,494 | $13,267 | $10,039 |
| Portfolio turnover rateI | 19%H | 69% | 77%J |
A For the year ended February 29.
B For the period October 2, 2018 (commencement of sale of shares) to February 28, 2019.
C Calculated based on average shares outstanding during the period.
D Total returns for periods of less than one year are not annualized.
E Total returns would have been lower if certain expenses had not been reduced during the applicable periods shown.
F Fees and expenses of any underlying mutual funds or exchange-traded funds (ETFs) are not included in the Fund's expense ratio. The Fund indirectly bears its proportionate share of these expenses. For additional expense information related to investments in Fidelity Central Funds, please refer to the "Investments in Fidelity Central Funds" note found in the Notes to Financial Statements section of the most recent Annual or Semi-Annual report.
G Expense ratios reflect operating expenses of the class. Expenses before reductions do not reflect amounts reimbursed, waived, or reduced through arrangements with the investment adviser, brokerage services, or other offset arrangements, if applicable, and do not represent the amount paid by the class during periods when reimbursements, waivers or reductions occur.
H Annualized
I Amount does not include the portfolio activity of any underlying Fidelity Central Funds.
J Portfolio turnover rate excludes securities received or delivered in-kind.
See accompanying notes which are an integral part of the financial statements.
Notes to Financial Statements (Unaudited)
For the period ended August 31, 2020
1. Organization.
Materials Portfolio (the Fund) is a non-diversified fund of Fidelity Select Portfolios (the Trust) and is authorized to issue an unlimited number of shares. The Trust is registered under the Investment Company Act of 1940, as amended (the 1940 Act), as an open-end management investment company organized as a Massachusetts business trust. The Fund invests primarily in securities of companies whose principal business activities fall within specific industries. The Fund offers Class A, Class M, Class C, Materials, Class I and Class Z shares, each of which has equal rights as to assets and voting privileges. Each class has exclusive voting rights with respect to matters that affect that class. Class C shares will automatically convert to Class A shares after a holding period of ten years from the initial date of purchase, with certain exceptions.
2. Investments in Fidelity Central Funds.
The Fund invests in Fidelity Central Funds, which are open-end investment companies generally available only to other investment companies and accounts managed by the investment adviser and its affiliates. The Fund's Schedule of Investments lists each of the Fidelity Central Funds held as of period end, if any, as an investment of the Fund, but does not include the underlying holdings of each Fidelity Central Fund. As an Investing Fund, the Fund indirectly bears its proportionate share of the expenses of the underlying Fidelity Central Funds.
The Money Market Central Funds seek preservation of capital and current income and are managed by the investment adviser. Annualized expenses of the Money Market Central Funds as of their most recent shareholder report date ranged from less than .005% to .01%.
A complete unaudited list of holdings for each Fidelity Central Fund is available upon request or at the Securities and Exchange Commission (the SEC) website at www.sec.gov. In addition, the financial statements of the Fidelity Central Funds are available on the SEC website or upon request.
3. Significant Accounting Policies.
The Fund is an investment company and applies the accounting and reporting guidance of the Financial Accounting Standards Board (FASB) Accounting Standards Codification Topic 946 Financial Services – Investment Companies. The financial statements have been prepared in conformity with accounting principles generally accepted in the United States of America (GAAP), which require management to make certain estimates and assumptions at the date of the financial statements. Actual results could differ from those estimates. Subsequent events, if any, through the date that the financial statements were issued have been evaluated in the preparation of the financial statements. The following summarizes the significant accounting policies of the Fund:
Investment Valuation. Investments are valued as of 4:00 p.m. Eastern time on the last calendar day of the period. The Board of Trustees (the Board) has delegated the day to day responsibility for the valuation of the Fund's investments to the Fair Value Committee (the Committee) established by the Fund's investment adviser. In accordance with valuation policies and procedures approved by the Board, the Fund attempts to obtain prices from one or more third party pricing vendors or brokers to value its investments. When current market prices, quotations or currency exchange rates are not readily available or reliable, investments will be fair valued in good faith by the Committee, in accordance with procedures adopted by the Board. Factors used in determining fair value vary by investment type and may include market or investment specific events. The frequency with which these procedures are used cannot be predicted and they may be utilized to a significant extent. The Committee oversees the Fund's valuation policies and procedures and reports to the Board on the Committee's activities and fair value determinations. The Board monitors the appropriateness of the procedures used in valuing the Fund's investments and ratifies the fair value determinations of the Committee.
The Fund categorizes the inputs to valuation techniques used to value its investments into a disclosure hierarchy consisting of three levels as shown below:
- Level 1 – quoted prices in active markets for identical investments
- Level 2 – other significant observable inputs (including quoted prices for similar investments, interest rates, prepayment speeds, etc.)
- Level 3 – unobservable inputs (including the Fund's own assumptions based on the best information available)
Valuation techniques used to value the Fund's investments by major category are as follows:
Equity securities, including restricted securities, for which market quotations are readily available, are valued at the last reported sale price or official closing price as reported by a third party pricing vendor on the primary market or exchange on which they are traded and are categorized as Level 1 in the hierarchy. In the event there were no sales during the day or closing prices are not available, securities are valued at the last quoted bid price or may be valued using the last available price and are generally categorized as Level 2 in the hierarchy. For foreign equity securities, when market or security specific events arise, comparisons to the valuation of American Depositary Receipts (ADRs), futures contracts, Exchange-Traded Funds (ETFs) and certain indexes as well as quoted prices for similar securities may be used and would be categorized as Level 2 in the hierarchy. For equity securities, including restricted securities, where observable inputs are limited, assumptions about market activity and risk are used and these securities may be categorized as Level 3 in the hierarchy.
Investments in open-end mutual funds, including the Fidelity Central Funds, are valued at their closing net asset value (NAV) each business day and are categorized as Level 1 in the hierarchy.
Changes in valuation techniques may result in transfers in or out of an assigned level within the disclosure hierarchy. The aggregate value of investments by input level as of August 31, 2020 is included at the end of the Fund's Schedule of Investments.
Foreign Currency. Certain Funds may use foreign currency contracts to facilitate transactions in foreign-denominated securities. Gains and losses from these transactions may arise from changes in the value of the foreign currency or if the counterparties do not perform under the contracts' terms.
Foreign-denominated assets, including investment securities, and liabilities are translated into U.S. dollars at the exchange rates at period end. Purchases and sales of investment securities, income and dividends received, and expenses denominated in foreign currencies are translated into U.S. dollars at the exchange rate in effect on the transaction date.
The effects of exchange rate fluctuations on investments are included with the net realized and unrealized gain (loss) on investment securities. Other foreign currency transactions resulting in realized and unrealized gain (loss) are disclosed separately.
Investment Transactions and Income. For financial reporting purposes, the Fund's investment holdings and NAV include trades executed through the end of the last business day of the period. The NAV per share for processing shareholder transactions is calculated as of the close of business of the New York Stock Exchange (NYSE), normally 4:00 p.m. Eastern time and includes trades executed through the end of the prior business day. Gains and losses on securities sold are determined on the basis of identified cost and include proceeds received from litigation. Dividend income is recorded on the ex-dividend date, except for certain dividends from foreign securities where the ex-dividend date may have passed, which are recorded as soon as the Fund is informed of the ex-dividend date. Non-cash dividends included in dividend income, if any, are recorded at the fair market value of the securities received. Income and capital gain distributions from Fidelity Central Funds, if any, are recorded on the ex-dividend date. Certain distributions received by the Fund represent a return of capital or capital gain. The Fund determines the components of these distributions subsequent to the ex-dividend date, based upon receipt of tax filings or other correspondence relating to the underlying investment. These distributions are recorded as a reduction of cost of investments and/or as a realized gain. Investment income is recorded net of foreign taxes withheld where recovery of such taxes is uncertain.
Class Allocations and Expenses. Investment income, realized and unrealized capital gains and losses, common expenses of the Fund, and certain fund-level expense reductions, if any, are allocated daily on a pro-rata basis to each class based on the relative net assets of each class to the total net assets of the Fund. Each class differs with respect to transfer agent and distribution and service plan fees incurred. Certain expense reductions may also differ by class. For the reporting period, the allocated portion of income and expenses to each class as a percent of its average net assets may vary due to the timing of recording these transactions in relation to fluctuating net assets of the classes. Expenses directly attributable to a fund are charged to that fund. Expenses attributable to more than one fund are allocated among the respective funds on the basis of relative net assets or other appropriate methods. Expense estimates are accrued in the period to which they relate and adjustments are made when actual amounts are known.
Deferred Trustee Compensation. Under a Deferred Compensation Plan (the Plan) for the Fund, certain independent Trustees have elected to defer receipt of a portion of their annual compensation. Deferred amounts are invested in a cross-section of Fidelity funds, are marked-to-market and remain in the Fund until distributed in accordance with the Plan. The investment of deferred amounts and the offsetting payable to the Trustees of $152,215 are included in the accompanying Statement of Assets and Liabilities in other receivables and other payables and accrued expenses, respectively.
Income Tax Information and Distributions to Shareholders. Each year, the Fund intends to qualify as a regulated investment company under Subchapter M of the Internal Revenue Code, including distributing substantially all of its taxable income and realized gains. As a result, no provision for U.S. Federal income taxes is required. The Fund files a U.S. federal tax return, in addition to state and local tax returns as required. The Fund's federal income tax returns are subject to examination by the Internal Revenue Service (IRS) for a period of three fiscal years after they are filed. State and local tax returns may be subject to examination for an additional fiscal year depending on the jurisdiction. Foreign taxes are provided for based on the Fund's understanding of the tax rules and rates that exist in the foreign markets in which it invests.
Distributions are declared and recorded on the ex-dividend date. Income and capital gain distributions are declared separately for each class. Income and capital gain distributions are determined in accordance with income tax regulations, which may differ from GAAP.
Capital accounts within the financial statements are adjusted for permanent book-tax differences. These adjustments have no impact on net assets or the results of operations. Capital accounts are not adjusted for temporary book-tax differences which will reverse in a subsequent period.
Book-tax differences are primarily due to foreign currency transactions, deferred trustees compensation, partnerships, capital loss carryforwards and losses deferred due to wash sales, and excise tax regulations.
As of period end, the cost and unrealized appreciation (depreciation) in securities, and derivatives if applicable, for federal income tax purposes were as follows:
| Gross unrealized appreciation | $164,144,920 |
| Gross unrealized depreciation | (28,467,936) |
| Net unrealized appreciation (depreciation) | $135,676,984 |
| Tax cost | $562,288,060 |
Capital loss carryforwards are only available to offset future capital gains of the Fund to the extent provided by regulations and may be limited. The capital loss carryforward information presented below, including any applicable limitation, is estimated as of prior fiscal period end and is subject to adjustment.
| No expiration | |
| Short-term | $(34,373,469) |
| Long-term | (69,502,615) |
| Total capital loss carryforward | $(103,876,084) |
4. Purchases and Sales of Investments.
Purchases and sales of securities, other than short-term securities, are noted in the table below.
| | Purchases ($) | Sales ($) |
| Materials Portfolio | 60,113,742 | 152,862,744 |
5. Fees and Other Transactions with Affiliates.
Management Fee. Fidelity Management & Research Company LLC (the investment adviser) and its affiliates provide the Fund with investment management related services for which the Fund pays a monthly management fee. The management fee is the sum of an individual fund fee rate that is based on an annual rate of .30% of the Fund's average net assets and an annualized group fee rate that averaged .23% during the period. The group fee rate is based upon the monthly average net assets of a group of registered investment companies with which the investment adviser has management contracts. The group fee rate decreases as assets under management increase and increases as assets under management decrease. For the reporting period, the total annualized management fee rate was .53% of the Fund's average net assets.
Distribution and Service Plan Fees. In accordance with Rule 12b-1 of the 1940 Act, the Fund has adopted separate Distribution and Service Plans for each class of shares. Certain classes pay Fidelity Distributors Company LLC (FDC), an affiliate of the investment adviser, separate Distribution and Service Fees, each of which is based on an annual percentage of each class' average net assets. In addition, FDC may pay financial intermediaries for selling shares of the Fund and providing shareholder support services. For the period, the Distribution and Service Fee rates, total fees and amounts retained by FDC were as follows:
| | Distribution Fee | Service Fee | Total Fees | Retained by FDC |
| Class A | -% | .25% | $93,566 | $349 |
| Class M | .25% | .25% | 46,496 | – |
| Class C | .75% | .25% | 107,496 | 3,112 |
| | | | $247,558 | $3,461 |
Sales Load. FDC may receive a front-end sales charge of up to 5.75% for selling Class A shares and 3.50% for selling Class M shares, some of which is paid to financial intermediaries for selling shares of the Fund. Depending on the holding period, FDC may receive contingent deferred sales charges levied on Class A, Class M and Class C redemptions. The deferred sales charges are 1.00% for Class C shares, 1.00% for certain purchases of Class A shares and .25% for certain purchases of Class M shares.
For the period, sales charge amounts retained by FDC were as follows:
| | Retained by FDC |
| Class A | $8,614 |
| Class M | 915 |
| Class C(a) | 469 |
| | $9,998 |
(a) When Class C shares are initially sold, FDC pays commissions from its own resources to financial intermediaries through which the sales are made.
Transfer Agent Fees. Fidelity Investments Institutional Operations Company LLC (FIIOC), an affiliate of the investment adviser, is the transfer, dividend disbursing and shareholder servicing agent for each class of the Fund. FIIOC receives account fees and asset-based fees that vary according to the account size and type of account of the shareholders of the respective classes of the Fund, except for Class Z. FIIOC receives an asset-based fee of Class Z's average net assets. FIIOC pays for typesetting, printing and mailing of shareholder reports, except proxy statements.
For the period, transfer agent fees for each class were as follows:
| | Amount | % of Class-Level Average Net Assets(a) |
| Class A | $94,620 | .25 |
| Class M | 25,790 | .28 |
| Class C | 26,780 | .25 |
| Materials | 432,719 | .23 |
| Class I | 131,207 | .20 |
| Class Z | 3,575 | .04 |
| | $714,691 | |
(a) Annualized
Accounting Fees. Fidelity Service Company, Inc. (FSC), an affiliate of the investment adviser, maintains the Fund's accounting records. The accounting fee is based on the level of average net assets for each month. For the period, the fees were equivalent to the following annualized rates:
| | % of Average Net Assets |
| Materials Portfolio | .04 |
Brokerage Commissions. A portion of portfolio transactions were placed with brokerage firms which are affiliates of the investment adviser. Brokerage commissions are included in net realized gain (loss) and change in net unrealized appreciation (depreciation) in the Statement of Operations. The commissions paid to these affiliated firms were as follows:
| | Amount |
| Materials Portfolio | $3,205 |
Interfund Trades. Funds may purchase from or sell securities to other Fidelity Funds under procedures adopted by the Board. The procedures have been designed to ensure these interfund trades are executed in accordance with Rule 17a-7 of the 1940 Act. Interfund trades are included within the respective purchases and sales amounts shown in the Purchases and Sales of Investments note.
6. Committed Line of Credit.
Certain Funds participate with other funds managed by the investment adviser or an affiliate in a $4.25 billion credit facility (the "line of credit") to be utilized for temporary or emergency purposes to fund shareholder redemptions or for other short-term liquidity purposes. The participating funds have agreed to pay commitment fees on their pro-rata portion of the line of credit, which are reflected in Miscellaneous expenses on the Statement of Operations, and are as follows:
| | Amount |
| Materials Portfolio | $847 |
During the period, there were no borrowings on this line of credit.
7. Security Lending.
The Fund lends portfolio securities from time to time in order to earn additional income. Lending agents are used, including National Financial Services (NFS), an affiliate of the Fund. Pursuant to a securities lending agreement, NFS will receive a fee, which is capped at 9.9% of daily lending revenue, for its services as lending agent. The Fund may lend securities to certain qualified borrowers, including NFS. On the settlement date of the loan, the Fund receives collateral (in the form of U.S. Treasury obligations, letters of credit and/or cash) against the loaned securities and maintains collateral in an amount not less than 100% of the market value of the loaned securities during the period of the loan. The market value of the loaned securities is determined at the close of business of the Fund and any additional required collateral is delivered to the Fund on the next business day. The Fund or borrower may terminate the loan at any time, and if the borrower defaults on its obligation to return the securities loaned because of insolvency or other reasons, the Fund may apply collateral received from the borrower against the obligation. The Fund may experience delays and costs in recovering the securities loaned. Any cash collateral received is invested in the Fidelity Securities Lending Cash Central Fund. The value of loaned securities and cash collateral at period end are disclosed on the Fund's Statement of Assets and Liabilities. At period end, there were no security loans outstanding with NFS, as affiliated borrower. Total fees paid by the Fund to NFS, as lending agent, amounted to $1,556. Security lending income represents the income earned on investing cash collateral, less rebates paid to borrowers and any lending agent fees associated with the loan, plus any premium payments received for lending certain types of securities. Net income from the Fidelity Securities Lending Cash Central Fund during the period is presented in the Statement of Operations as a component of income from Fidelity Central Funds and includes $21 from securities loaned to NFS, as affiliated borrower.
8. Expense Reductions.
Commissions paid to certain brokers with whom the investment adviser, or its affiliates, places trades on behalf of the Fund include an amount in addition to trade execution, which may be rebated back to the Fund to offset certain expenses. This amount totaled $49,320 for the period.
In addition, during the period the investment adviser or an affiliate reimbursed and/or waived a portion of fund-level operating expenses in the amount of $1,687.
9. Distributions to Shareholders.
Distributions to shareholders of each class were as follows:
| | Six months ended
August 31, 2020 | Year ended
February 29, 2020 |
| Distributions to shareholders | | |
| Class A | $– | $898,677 |
| Class M | – | 184,051 |
| Class C | – | 66,737 |
| Materials | – | 6,084,056 |
| Class I | – | 2,187,246 |
| Class Z | – | 237,161 |
| Total | $– | $9,657,928 |
10. Share Transactions.
Share transactions for each class were as follows and may contain automatic conversions between classes or exchanges between affiliated funds:
| | Shares | Shares | Dollars | Dollars |
| | Six months ended August 31, 2020 | Year ended February 29, 2020 | Six months ended August 31, 2020 | Year ended February 29, 2020 |
| Class A | | | | |
| Shares sold | 107,166 | 244,450 | $6,380,789 | $16,509,685 |
| Reinvestment of distributions | – | 12,915 | – | 880,535 |
| Shares redeemed | (249,358) | (776,678) | (15,236,454) | (52,530,774) |
| Net increase (decrease) | (142,192) | (519,313) | $(8,855,665) | $(35,140,554) |
| Class M | | | | |
| Shares sold | 40,165 | 35,457 | $2,565,363 | $2,382,633 |
| Reinvestment of distributions | – | 2,714 | – | 183,413 |
| Shares redeemed | (68,669) | (105,772) | (4,090,419) | (7,006,735) |
| Net increase (decrease) | (28,504) | (67,601) | $(1,525,056) | $(4,440,689) |
| Class C | | | | |
| Shares sold | 4,958 | 17,268 | $288,666 | $1,120,535 |
| Reinvestment of distributions | – | 966 | – | 63,603 |
| Shares redeemed | (97,826) | (364,770) | (5,534,118) | (23,591,304) |
| Net increase (decrease) | (92,868) | (346,536) | $(5,245,452) | $(22,407,166) |
| Materials | | | | |
| Shares sold | 286,575 | 436,712 | $17,287,125 | $29,584,388 |
| Reinvestment of distributions | – | 82,761 | – | 5,662,504 |
| Shares redeemed | (1,147,368) | (2,690,491) | (68,040,779) | (181,389,398) |
| Net increase (decrease) | (860,793) | (2,171,018) | $(50,753,654) | $(146,142,506) |
| Class I | | | | |
| Shares sold | 412,019 | 507,369 | $23,629,381 | $34,230,110 |
| Reinvestment of distributions | – | 30,204 | – | 2,062,607 |
| Shares redeemed | (683,272) | (1,868,270) | (40,013,981) | (125,984,780) |
| Net increase (decrease) | (271,253) | (1,330,697) | $(16,384,600) | $(89,692,063) |
| Class Z | | | | |
| Shares sold | 176,003 | 212,839 | $9,375,259 | $13,863,966 |
| Reinvestment of distributions | – | 3,047 | – | 207,591 |
| Shares redeemed | (136,643) | (136,815) | (7,947,398) | (9,169,515) |
| Net increase (decrease) | 39,360 | 79,071 | $1,427,861 | $4,902,042 |
11. Other.
The Fund's organizational documents provide former and current trustees and officers with a limited indemnification against liabilities arising in connection with the performance of their duties to the Fund. In the normal course of business, the Fund may also enter into contracts that provide general indemnifications. The Fund's maximum exposure under these arrangements is unknown as this would be dependent on future claims that may be made against the Fund. The risk of material loss from such claims is considered remote.
12. Coronavirus (COVID-19) Pandemic.
An outbreak of COVID-19 first detected in China during December 2019 has since spread globally and was declared a pandemic by the World Health Organization during March 2020. Developments that disrupt global economies and financial markets, such as the COVID-19 pandemic, may magnify factors that affect the Fund's performance.
Shareholder Expense Example
As a shareholder, you incur two types of costs: (1) transaction costs, which may include sales charges (loads) on purchase payments or redemption proceeds, as applicable and (2) ongoing costs, which generally include management fees, distribution and/or service (12b-1) fees and other Fund expenses. This Example is intended to help you understand your ongoing costs (in dollars) of investing in a fund and to compare these costs with the ongoing costs of investing in other mutual funds.
The Example is based on an investment of $1,000 invested at the beginning of the period and held for the entire period (March 1, 2020 to August 31, 2020).
Actual Expenses
The first line of the accompanying table provides information about actual account values and actual expenses. You may use the information in this line, together with the amount you invested, to estimate the expenses that you paid over the period. Simply divide your account value by $1,000.00 (for example, an $8,600 account value divided by $1,000.00 = 8.6), then multiply the result by the number in the first line for a class/Fund under the heading entitled "Expenses Paid During Period" to estimate the expenses you paid on your account during this period. If any fund is a shareholder of any underlying mutual funds or exchange-traded funds (ETFs) (the Underlying Funds), such fund indirectly bears its proportional share of the expenses of the Underlying Funds in addition to the direct expenses incurred presented in the table. These fees and expenses are not included in the annualized expense ratio used to calculate the expense estimate in the table below.
Hypothetical Example for Comparison Purposes
The second line of the accompanying table provides information about hypothetical account values and hypothetical expenses based on the actual expense ratio and an assumed rate of return of 5% per year before expenses, which is not the actual return. The hypothetical account values and expenses may not be used to estimate the actual ending account balance or expenses you paid for the period. You may use this information to compare the ongoing costs of investing in the Fund and other funds. To do so, compare this 5% hypothetical example with the 5% hypothetical examples that appear in the shareholder reports of the other funds. If any fund is a shareholder of any Underlying Funds, such fund indirectly bears its proportional share of the expenses of the Underlying Funds in addition to the direct expenses as presented in the table. These fees and expenses are not included in the annualized expense ratio used to calculate the expense estimate in the table below.
Please note that the expenses shown in the table are meant to highlight your ongoing costs only and do not reflect any transaction costs. Therefore, the second line of the table is useful in comparing ongoing costs only, and will not help you determine the relative total costs of owning different funds. In addition, if these transactional costs were included, your costs would have been higher.
| | Annualized Expense Ratio-A | Beginning
Account Value
March 1, 2020 | Ending
Account Value
August 31, 2020 | Expenses Paid
During Period-B
March 1, 2020
to August 31, 2020 |
| Chemicals Portfolio | .81% | | | |
| Actual | | $1,000.00 | $1,172.90 | $4.44 |
| Hypothetical-C | | $1,000.00 | $1,021.12 | $4.13 |
| Gold Portfolio | | | | |
| Class A | 1.09% | | | |
| Actual | | $1,000.00 | $1,568.20 | $7.06 |
| Hypothetical-C | | $1,000.00 | $1,019.71 | $5.55 |
| Class M | 1.38% | | | |
| Actual | | $1,000.00 | $1,566.70 | $8.93 |
| Hypothetical-C | | $1,000.00 | $1,018.25 | $7.02 |
| Class C | 1.79% | | | |
| Actual | | $1,000.00 | $1,563.10 | $11.56 |
| Hypothetical-C | | $1,000.00 | $1,016.18 | $9.10 |
| Gold | .77% | | | |
| Actual | | $1,000.00 | $1,571.10 | $4.99 |
| Hypothetical-C | | $1,000.00 | $1,021.32 | $3.92 |
| Class I | .78% | | | |
| Actual | | $1,000.00 | $1,571.10 | $5.05 |
| Hypothetical-C | | $1,000.00 | $1,021.27 | $3.97 |
| Class Z | .64% | | | |
| Actual | | $1,000.00 | $1,572.10 | $4.15 |
| Hypothetical-C | | $1,000.00 | $1,021.98 | $3.26 |
| Materials Portfolio | | | | |
| Class A | 1.10% | | | |
| Actual | | $1,000.00 | $1,182.40 | $6.05 |
| Hypothetical-C | | $1,000.00 | $1,019.66 | $5.60 |
| Class M | 1.37% | | | |
| Actual | | $1,000.00 | $1,180.70 | $7.53 |
| Hypothetical-C | | $1,000.00 | $1,018.30 | $6.97 |
| Class C | 1.84% | | | |
| Actual | | $1,000.00 | $1,178.20 | $10.10 |
| Hypothetical-C | | $1,000.00 | $1,015.93 | $9.35 |
| Materials | .82% | | | |
| Actual | | $1,000.00 | $1,184.00 | $4.51 |
| Hypothetical-C | | $1,000.00 | $1,021.07 | $4.18 |
| Class I | .80% | | | |
| Actual | | $1,000.00 | $1,184.10 | $4.40 |
| Hypothetical-C | | $1,000.00 | $1,021.17 | $4.08 |
| Class Z | .64% | | | |
| Actual | | $1,000.00 | $1,185.20 | $3.53 |
| Hypothetical-C | | $1,000.00 | $1,021.98 | $3.26 |
A Annualized expense ratio reflects expenses net of applicable fee waivers.
B Expenses are equal to the annualized expense ratio, multiplied by the average account value over the period, multiplied by 184/ 365 (to reflect the one-half year period). The fees and expenses of any Underlying Funds are not included in each annualized expense ratio.
C 5% return per year before expenses
Proxy Voting Results
A special meeting of shareholders was held on June 9, 2020. The results of votes taken among shareholders on the proposal before them are reported below. Each vote reported represents one dollar of net asset value held on the record date for the meeting.
PROPOSAL 1
To elect a Board of Trustees.
| | # of
Votes | % of
Votes |
| Dennis J. Dirks |
| Affirmative | 32,463,705,305.665 | 92.437 |
| Withheld | 2,655,951,104.308 | 7.563 |
| TOTAL | 35,119,656,409.973 | 100.000 |
| Donald F. Donahue |
| Affirmative | 32,446,843,861.354 | 92.389 |
| Withheld | 2,672,812,548.619 | 7.611 |
| TOTAL | 35,119,656,409.973 | 100.000 |
| Bettina Doulton |
| Affirmative | 32,610,463,757.584 | 92.855 |
| Withheld | 2,509,192,652.389 | 7.145 |
| TOTAL | 35,119,656,409.973 | 100.000 |
| Vicki L. Fuller |
| Affirmative | 32,688,213,522.720 | 93.077 |
| Withheld | 2,431,442,887.253 | 6.923 |
| TOTAL | 35,119,656,409.973 | 100.000 |
| Patricia L. Kampling |
| Affirmative | 32,313,755,598.535 | 92.010 |
| Withheld | 2,805,900,811.438 | 7.990 |
| TOTAL | 35,119,656,409.973 | 100.000 |
| Alan J. Lacy |
| Affirmative | 31,990,158,754.948 | 91.089 |
| Withheld | 3,129,497,655.026 | 8.911 |
| TOTAL | 35,119,656,409.973 | 100.000 |
| Ned C. Lautenbach |
| Affirmative | 32,043,019,991.143 | 91.240 |
| Withheld | 3,076,636,418.830 | 8.760 |
| TOTAL | 35,119,656,409.973 | 100.000 |
| Robert A. Lawrence |
| Affirmative | 32,150,842,398.009 | 91.547 |
| Withheld | 2,968,814,011.965 | 8.453 |
| TOTAL | 35,119,656,409.973 | 100.000 |
| Joseph Mauriello |
| Affirmative | 32,082,201,213.166 | 91.351 |
| Withheld | 3,037,455,196.807 | 8.649 |
| TOTAL | 35,119,656,409.973 | 100.000 |
| Cornelia M. Small |
| Affirmative | 32,207,976,835.934 | 91.709 |
| Withheld | 2,911,679,574.039 | 8.291 |
| TOTAL | 35,119,656,409.973 | 100.000 |
| Garnett A. Smith |
| Affirmative | 32,102,654,343.096 | 91.409 |
| Withheld | 3,017,002,066.877 | 8.591 |
| TOTAL | 35,119,656,409.973 | 100.000 |
| David M. Thomas |
| Affirmative | 32,150,749,424.556 | 91.546 |
| Withheld | 2,968,906,985.418 | 8.454 |
| TOTAL | 35,119,656,409.973 | 100.000 |
| Susan Tomasky |
| Affirmative | 32,381,933,484.515 | 92.205 |
| Withheld | 2,737,722,925.459 | 7.795 |
| TOTAL | 35,119,656,409.973 | 100.000 |
| Michael E. Wiley |
| Affirmative | 32,135,064,741.973 | 91.502 |
| Withheld | 2,984,591,668.000 | 8.498 |
| TOTAL | 35,119,656,409.973 | 100.000 |
|
| Proposal 1 reflects trust wide proposal and voting results. |
SELMT-SANN-1020
1.846035.113
Fidelity® Select Portfolios®
Telecommunications Services Sector
Telecommunications Portfolio
Wireless Portfolio
Semi-Annual Report
August 31, 2020
Includes Fidelity and Fidelity Advisor share classes
See the inside front cover for important information about access to your fund’s shareholder reports.
Beginning on January 1, 2021, as permitted by regulations adopted by the Securities and Exchange Commission, paper copies of a fund’s shareholder reports will no longer be sent by mail, unless you specifically request paper copies of the reports from the fund or from your financial intermediary, such as a financial advisor, broker-dealer or bank. Instead, the reports will be made available on a website, and you will be notified by mail each time a report is posted and provided with a website link to access the report.
If you already elected to receive shareholder reports electronically, you will not be affected by this change and you need not take any action. You may elect to receive shareholder reports and other communications from a fund electronically, by contacting your financial intermediary. For Fidelity customers, visit Fidelity's web site or call Fidelity using the contact information listed below.
You may elect to receive all future reports in paper free of charge. If you wish to continue receiving paper copies of your shareholder reports, you may contact your financial intermediary or, if you are a Fidelity customer, visit Fidelity’s website, or call Fidelity at the applicable toll-free number listed below. Your election to receive reports in paper will apply to all funds held with the fund complex/your financial intermediary.
| Account Type | Website | Phone Number |
| Brokerage, Mutual Fund, or Annuity Contracts: | fidelity.com/mailpreferences | 1-800-343-3548 |
| Employer Provided Retirement Accounts: | netbenefits.fidelity.com/preferences (choose 'no' under Required Disclosures to continue to print) | 1-800-343-0860 |
| Advisor Sold Accounts Serviced Through Your Financial Intermediary: | Contact Your Financial Intermediary | Your Financial Intermediary's phone number |
| Advisor Sold Accounts Serviced by Fidelity: | institutional.fidelity.com | 1-877-208-0098 |
Contents
To view a fund's proxy voting guidelines and proxy voting record for the 12-month period ended June 30, visit http://www.fidelity.com/proxyvotingresults or visit the Securities and Exchange Commission's (SEC) web site at http://www.sec.gov.
You may also call 1-800-544-8544 if you’re an individual investing directly with Fidelity, call 1-800-835-5092 if you’re a plan sponsor or participant with Fidelity as your recordkeeper or call 1-877-208-0098 on institutional accounts or if you’re an advisor or invest through one to request a free copy of the proxy voting guidelines.
Standard & Poor's, S&P and S&P 500 are registered service marks of The McGraw-Hill Companies, Inc. and have been licensed for use by Fidelity Distributors Corporation.
Other third-party marks appearing herein are the property of their respective owners.
All other marks appearing herein are registered or unregistered trademarks or service marks of FMR LLC or an affiliated company. © 2020 FMR LLC. All rights reserved.
This report and the financial statements contained herein are submitted for the general information of the shareholders of the Funds. This report is not authorized for distribution to prospective investors in the Funds unless preceded or accompanied by an effective prospectus.
A fund files its complete schedule of portfolio holdings with the SEC for the first and third quarters of each fiscal year on Form N-PORT. Forms N-PORT are available on the SEC’s web site at http://www.sec.gov. A fund's Forms N-PORT may be reviewed and copied at the SEC’s Public Reference Room in Washington, DC. Information regarding the operation of the SEC's Public Reference Room may be obtained by calling 1-800-SEC-0330.
For a complete list of a fund's portfolio holdings, view the most recent holdings listing, semiannual report, or annual report on Fidelity's web site at http://www.fidelity.com, http://www.institutional.fidelity.com, or http://www.401k.com, as applicable.
NOT FDIC INSURED •MAY LOSE VALUE •NO BANK GUARANTEE
Neither the Funds nor Fidelity Distributors Corporation is a bank.
Note to Shareholders:
Early in 2020, the outbreak and spread of a new coronavirus emerged as a public health emergency that had a major influence on financial markets, primarily based on its impact on the global economy and the outlook for corporate earnings. The virus causes a respiratory disease known as COVID-19. On March 11, the World Health Organization declared the COVID-19 outbreak a pandemic, citing sustained risk of further global spread.
In the weeks following, as the crisis worsened, we witnessed an escalating human tragedy with wide-scale social and economic consequences from coronavirus-containment measures. The outbreak of COVID-19 prompted a number of measures to limit the spread, including travel and border restrictions, quarantines, and restrictions on large gatherings. In turn, these resulted in lower consumer activity, diminished demand for a wide range of products and services, disruption in manufacturing and supply chains, and – given the wide variability in outcomes regarding the outbreak – significant market uncertainty and volatility. Amid the turmoil, the U.S. government took unprecedented action – in concert with the U.S. Federal Reserve and central banks around the world – to help support consumers, businesses, and the broader economy, and to limit disruption to the financial system.
The situation continues to unfold, and the extent and duration of its impact on financial markets and the economy remain highly uncertain. Extreme events such as the coronavirus crisis are “exogenous shocks” that can have significant adverse effects on mutual funds and their investments. Although multiple asset classes may be affected by market disruption, the duration and impact may not be the same for all types of assets.
Fidelity is committed to helping you stay informed amid news about COVID-19 and during increased market volatility, and we’re taking extra steps to be responsive to customer needs. We encourage you to visit our websites, where we offer ongoing updates, commentary, and analysis on the markets and our funds.
Telecommunications Portfolio
Investment Summary (Unaudited)
Top Ten Stocks as of August 31, 2020
| | % of fund's net assets |
| Verizon Communications, Inc. | 16.6 |
| AT&T, Inc. | 14.4 |
| T-Mobile U.S., Inc. | 10.1 |
| GCI Liberty, Inc. | 5.0 |
| Vonage Holdings Corp. | 4.8 |
| Liberty Global PLC Class C | 4.7 |
| Iridium Communications, Inc. | 4.2 |
| Bandwidth, Inc. | 3.9 |
| Cogent Communications Group, Inc. | 3.9 |
| Reliance Industries Ltd. | 3.2 |
| | 70.8 |
Top Industries (% of fund's net assets)
| As of August 31, 2020 |
| | Diversified Telecommunication Services | 65.5% |
| | Wireless Telecommunication Services | 16.3% |
| | Media | 7.2% |
| | Oil, Gas & Consumable Fuels | 3.3% |
| | Communications Equipment | 2.4% |
| | All Others* | 5.3% |

* Includes short-term investments and net other assets (liabilities).
Telecommunications Portfolio
Schedule of Investments August 31, 2020 (Unaudited)
Showing Percentage of Net Assets
| Common Stocks - 100.1% | | | |
| | | Shares | Value |
| Communications Equipment - 2.4% | | | |
| Communications Equipment - 2.4% | | | |
| CommScope Holding Co., Inc. (a) | | 258,500 | $2,662,550 |
| EchoStar Holding Corp. Class A (a) | | 77,900 | 2,288,702 |
| Harmonic, Inc. (a) | | 550,600 | 3,248,540 |
| | | | 8,199,792 |
| Construction & Engineering - 1.0% | | | |
| Construction & Engineering - 1.0% | | | |
| Dycom Industries, Inc. (a) | | 54,600 | 3,358,446 |
| Diversified Telecommunication Services - 65.5% | | | |
| Alternative Carriers - 30.4% | | | |
| Bandwidth, Inc. (a)(b) | | 84,400 | 13,291,312 |
| Cogent Communications Group, Inc. | | 194,339 | 13,071,241 |
| GCI Liberty, Inc. (a) | | 210,400 | 16,996,112 |
| Iliad SA (b) | | 17,967 | 3,837,925 |
| Iridium Communications, Inc. (a) | | 510,811 | 14,307,816 |
| Liberty Global PLC Class C (a) | | 690,336 | 15,884,631 |
| Liberty Latin America Ltd. Class C (a)(b) | | 846,834 | 8,078,796 |
| ORBCOMM, Inc. (a) | | 370,949 | 1,487,505 |
| Vonage Holdings Corp. (a) | | 1,436,171 | 16,444,158 |
| | | | 103,399,496 |
| Integrated Telecommunication Services - 35.1% | | | |
| AT&T, Inc. | | 1,635,120 | 48,742,927 |
| ATN International, Inc. | | 83,500 | 4,843,000 |
| Bezeq The Israel Telecommunication Corp. Ltd. (a) | | 5,108,400 | 5,837,171 |
| Consolidated Communications Holdings, Inc. (a) | | 10,300 | 80,134 |
| Masmovil Ibercom SA (a) | | 128,100 | 3,430,361 |
| Verizon Communications, Inc. | | 950,997 | 56,365,595 |
| | | | 119,299,188 |
|
| TOTAL DIVERSIFIED TELECOMMUNICATION SERVICES | | | 222,698,684 |
|
| Entertainment - 2.4% | | | |
| Interactive Home Entertainment - 2.4% | | | |
| Activision Blizzard, Inc. | | 76,300 | 6,372,576 |
| Electronic Arts, Inc. (a) | | 13,100 | 1,827,057 |
| | | | 8,199,633 |
| Media - 7.2% | | | |
| Cable & Satellite - 7.2% | | | |
| Charter Communications, Inc. Class A (a) | | 17,600 | 10,834,736 |
| Comcast Corp. Class A | | 179,400 | 8,038,914 |
| Liberty Broadband Corp. Class A (a) | | 34,000 | 4,698,460 |
| Megacable Holdings S.A.B. de CV unit | | 335,800 | 966,641 |
| | | | 24,538,751 |
| Oil, Gas & Consumable Fuels - 3.3% | | | |
| Oil & Gas Refining & Marketing - 3.3% | | | |
| Reliance Industries Ltd. | | 385,000 | 10,935,132 |
| Reliance Industries Ltd. | | 25,666 | 418,152 |
| | | | 11,353,284 |
| Road & Rail - 1.1% | | | |
| Trucking - 1.1% | | | |
| Lyft, Inc. (a) | | 120,400 | 3,572,268 |
| Software - 0.9% | | | |
| Application Software - 0.9% | | | |
| RingCentral, Inc. (a) | | 9,900 | 2,878,623 |
| Zoom Video Communications, Inc. Class A (a) | | 300 | 97,530 |
| | | | 2,976,153 |
| Wireless Telecommunication Services - 16.3% | | | |
| Wireless Telecommunication Services - 16.3% | | | |
| Boingo Wireless, Inc. (a) | | 146,900 | 1,908,231 |
| Millicom International Cellular SA | | 91,400 | 2,700,870 |
| Shenandoah Telecommunications Co. | | 85,423 | 4,723,892 |
| T-Mobile U.S., Inc. | | 295,624 | 34,493,408 |
| Telephone & Data Systems, Inc. | | 242,664 | 5,612,818 |
| U.S. Cellular Corp. (a) | | 167,000 | 6,075,460 |
| | | | 55,514,679 |
| TOTAL COMMON STOCKS | | | |
| (Cost $251,104,758) | | | 340,411,690 |
|
| Money Market Funds - 3.8% | | | |
| Fidelity Cash Central Fund 0.12% (c) | | 734,857 | 735,004 |
| Fidelity Securities Lending Cash Central Fund 0.11% (c)(d) | | 12,333,133 | 12,334,366 |
| TOTAL MONEY MARKET FUNDS | | | |
| (Cost $13,069,280) | | | 13,069,370 |
| TOTAL INVESTMENT IN SECURITIES - 103.9% | | | |
| (Cost $264,174,038) | | | 353,481,060 |
| NET OTHER ASSETS (LIABILITIES) - (3.9)% | | | (13,222,226) |
| NET ASSETS - 100% | | | $340,258,834 |
Legend
(a) Non-income producing
(b) Security or a portion of the security is on loan at period end.
(c) Affiliated fund that is generally available only to investment companies and other accounts managed by Fidelity Investments. The rate quoted is the annualized seven-day yield of the fund at period end. A complete unaudited listing of the fund's holdings as of its most recent quarter end is available upon request. In addition, each Fidelity Central Fund's financial statements are available on the SEC's website or upon request.
(d) Investment made with cash collateral received from securities on loan.
Affiliated Central Funds
Information regarding fiscal year to date income earned by the Fund from investments in Fidelity Central Funds is as follows:
| Fund | Income earned |
| Fidelity Cash Central Fund | $2,594 |
| Fidelity Securities Lending Cash Central Fund | 13,538 |
| Total | $16,132 |
Amounts in the income column in the above table include any capital gain distributions from underlying funds, which are presented in the corresponding line-item in the Statement of Operations, if applicable. Amount for Fidelity Securities Lending Cash Central Fund represents the income earned on investing cash collateral, less rebates paid to borrowers and any lending agent fees associated with the loan, plus any premium payments received for lending certain types of securities.
Investment Valuation
The following is a summary of the inputs used, as of August 31, 2020, involving the Fund's assets and liabilities carried at fair value. The inputs or methodology used for valuing securities may not be an indication of the risk associated with investing in those securities. For more information on valuation inputs, and their aggregation into the levels used below, please refer to the Investment Valuation section in the accompanying Notes to Financial Statements.
| | Valuation Inputs at Reporting Date: |
| Description | Total | Level 1 | Level 2 | Level 3 |
| Investments in Securities: | | | | |
| Common Stocks | $340,411,690 | $340,411,690 | $-- | $-- |
| Money Market Funds | 13,069,370 | 13,069,370 | -- | -- |
| Total Investments in Securities: | $353,481,060 | $353,481,060 | $-- | $-- |
Other Information
Distribution of investments by country or territory of incorporation, as a percentage of Total Net Assets, is as follows (Unaudited):
| United States of America | 85.5% |
| United Kingdom | 4.7% |
| India | 3.3% |
| Bermuda | 2.4% |
| Israel | 1.7% |
| France | 1.1% |
| Spain | 1.0% |
| Others (Individually Less Than 1%) | 0.3% |
| | 100.0% |
See accompanying notes which are an integral part of the financial statements.
Telecommunications Portfolio
Financial Statements
Statement of Assets and Liabilities
| | | August 31, 2020 (Unaudited) |
| Assets | | |
Investment in securities, at value (including securities loaned of $12,128,063) — See accompanying schedule:
Unaffiliated issuers (cost $251,104,758) | $340,411,690 | |
| Fidelity Central Funds (cost $13,069,280) | 13,069,370 | |
| Total Investment in Securities (cost $264,174,038) | | $353,481,060 |
| Receivable for fund shares sold | | 517,146 |
| Dividends receivable | | 137,010 |
| Distributions receivable from Fidelity Central Funds | | 4,410 |
| Prepaid expenses | | 2,759 |
| Other receivables | | 24,107 |
| Total assets | | 354,166,492 |
| Liabilities | | |
| Payable for fund shares redeemed | $323,773 | |
| Accrued management fee | 150,017 | |
| Distribution and service plan fees payable | 15,206 | |
| Other affiliated payables | 59,341 | |
| Other payables and accrued expenses | 1,025,431 | |
| Collateral on securities loaned | 12,333,890 | |
| Total liabilities | | 13,907,658 |
| Net Assets | | $340,258,834 |
| Net Assets consist of: | | |
| Paid in capital | | $243,906,648 |
| Total accumulated earnings (loss) | | 96,352,186 |
| Net Assets | | $340,258,834 |
| Net Asset Value and Maximum Offering Price | | |
| Class A: | | |
| Net Asset Value and redemption price per share ($25,722,627 ÷ 373,797 shares)(a) | | $68.81 |
| Maximum offering price per share (100/94.25 of $68.81) | | $73.01 |
| Class M: | | |
| Net Asset Value and redemption price per share ($8,615,976 ÷ 126,031 shares)(a) | | $68.36 |
| Maximum offering price per share (100/96.50 of $68.36) | | $70.84 |
| Class C: | | |
| Net Asset Value and offering price per share ($7,904,613 ÷ 115,685 shares)(a) | | $68.33 |
| Telecommunications: | | |
| Net Asset Value, offering price and redemption price per share ($244,271,358 ÷ 3,523,080 shares) | | $69.33 |
| Class I: | | |
| Net Asset Value, offering price and redemption price per share ($23,757,031 ÷ 343,367 shares) | | $69.19 |
| Class Z: | | |
| Net Asset Value, offering price and redemption price per share ($29,987,229 ÷ 434,034 shares) | | $69.09 |
(a) Redemption price per share is equal to net asset value less any applicable contingent deferred sales charge.
See accompanying notes which are an integral part of the financial statements.
Statement of Operations
| | | Six months ended August 31, 2020 (Unaudited) |
| Investment Income | | |
| Dividends | | $3,375,863 |
| Income from Fidelity Central Funds (including $13,538 from security lending) | | 16,132 |
| Total income | | 3,391,995 |
| Expenses | | |
| Management fee | $829,823 | |
| Transfer agent fees | 286,423 | |
| Distribution and service plan fees | 78,428 | |
| Accounting fees | 60,685 | |
| Custodian fees and expenses | 10,592 | |
| Independent trustees' fees and expenses | 972 | |
| Registration fees | 47,592 | |
| Audit | 28,114 | |
| Legal | 215 | |
| Interest | 140 | |
| Miscellaneous | 9,600 | |
| Total expenses before reductions | 1,352,584 | |
| Expense reductions | (58,886) | |
| Total expenses after reductions | | 1,293,698 |
| Net investment income (loss) | | 2,098,297 |
| Realized and Unrealized Gain (Loss) | | |
| Net realized gain (loss) on: | | |
| Investment securities: | | |
| Unaffiliated issuers | 8,117,863 | |
| Fidelity Central Funds | (619) | |
| Foreign currency transactions | (9,294) | |
| Total net realized gain (loss) | | 8,107,950 |
| Change in net unrealized appreciation (depreciation) on: | | |
| Investment securities: | | |
| Unaffiliated issuers (net of increase in deferred foreign taxes of $1,001,187) | 36,811,108 | |
| Fidelity Central Funds | (1) | |
| Assets and liabilities in foreign currencies | (4,141) | |
| Total change in net unrealized appreciation (depreciation) | | 36,806,966 |
| Net gain (loss) | | 44,914,916 |
| Net increase (decrease) in net assets resulting from operations | | $47,013,213 |
See accompanying notes which are an integral part of the financial statements.
Statement of Changes in Net Assets
| | Six months ended August 31, 2020 (Unaudited) | Year ended February 29, 2020 |
| Increase (Decrease) in Net Assets | | |
| Operations | | |
| Net investment income (loss) | $2,098,297 | $5,137,407 |
| Net realized gain (loss) | 8,107,950 | 16,201,250 |
| Change in net unrealized appreciation (depreciation) | 36,806,966 | 12,375,034 |
| Net increase (decrease) in net assets resulting from operations | 47,013,213 | 33,713,691 |
| Distributions to shareholders | (5,169,800) | (9,566,584) |
| Share transactions - net increase (decrease) | 6,124,862 | (18,459,242) |
| Total increase (decrease) in net assets | 47,968,275 | 5,687,865 |
| Net Assets | | |
| Beginning of period | 292,290,559 | 286,602,694 |
| End of period | $340,258,834 | $292,290,559 |
See accompanying notes which are an integral part of the financial statements.
Financial Highlights
Telecommunications Portfolio Class A
| | Six months ended (Unaudited) August 31, | Years endedFebruary 28, | | | | |
| | 2020 | 2020 A | 2019 | 2018 | 2017 | 2016 A |
| Selected Per–Share Data | | | | | | |
| Net asset value, beginning of period | $60.60 | $55.68 | $55.58 | $69.61 | $62.32 | $63.26 |
| Income from Investment Operations | | | | | | |
| Net investment income (loss)B | .34 | .87 | 1.10C | 1.05 | .88 | .81 |
| Net realized and unrealized gain (loss) | 8.87 | 5.86 | .56 | (3.38) | 10.68 | (.76) |
| Total from investment operations | 9.21 | 6.73 | 1.66 | (2.33) | 11.56 | .05 |
| Distributions from net investment income | (.14) | (.96) | (.94) | (1.31) | (1.11) | (.54) |
| Distributions from net realized gain | (.86) | (.85) | (.62) | (10.39) | (3.16) | (.45) |
| Total distributions | (1.00) | (1.81) | (1.56) | (11.70) | (4.27) | (.99) |
| Redemption fees added to paid in capitalB | – | – | – | – | –D | –D |
| Net asset value, end of period | $68.81 | $60.60 | $55.68 | $55.58 | $69.61 | $62.32 |
| Total ReturnE,F,G | 15.52% | 12.12% | 3.03% | (4.06)% | 18.65% | .16% |
| Ratios to Average Net AssetsH,I | | | | | | |
| Expenses before reductions | 1.13%J | 1.18% | 1.18% | 1.14% | 1.14% | 1.15% |
| Expenses net of fee waivers, if any | 1.13%J | 1.17% | 1.17% | 1.14% | 1.14% | 1.15% |
| Expenses net of all reductions | 1.10%J | 1.17% | 1.16% | 1.12% | 1.12% | 1.15% |
| Net investment income (loss) | 1.08%J | 1.47% | 1.96%C | 1.59% | 1.28% | 1.33% |
| Supplemental Data | | | | | | |
| Net assets, end of period (000 omitted) | $25,723 | $21,376 | $20,589 | $17,816 | $31,966 | $13,032 |
| Portfolio turnover rateK | 69%J | 58% | 64%L | 66% | 105%L | 51% |
A For the year ended February 29.
B Calculated based on average shares outstanding during the period.
C Net investment income per share reflects one or more large, non-recurring dividend(s) which amounted to $.25 per share. Excluding such non-recurring dividend(s), the ratio of net investment income (loss) to average net assets would have been 1.52%.
D Amount represents less than $.005 per share.
E Total returns for periods of less than one year are not annualized.
F Total returns would have been lower if certain expenses had not been reduced during the applicable periods shown.
G Total returns do not include the effect of the sales charges.
H Fees and expenses of any underlying mutual funds or exchange-traded funds (ETFs) are not included in the Fund's expense ratio. The Fund indirectly bears its proportionate share of these expenses. For additional expense information related to investments in Fidelity Central Funds, please refer to the "Investments in Fidelity Central Funds" note found in the Notes to Financial Statements section of the most recent Annual or Semi-Annual report.
I Expense ratios reflect operating expenses of the class. Expenses before reductions do not reflect amounts reimbursed, waived, or reduced through arrangements with the investment adviser, brokerage services, or other offset arrangements, if applicable, and do not represent the amount paid by the class during periods when reimbursements, waivers or reductions occur.
J Annualized
K Amount does not include the portfolio activity of any underlying Fidelity Central Funds.
L Portfolio turnover rate excludes securities received or delivered in-kind.
See accompanying notes which are an integral part of the financial statements.
Telecommunications Portfolio Class M
| | Six months ended (Unaudited) August 31, | Years endedFebruary 28, | | | | |
| | 2020 | 2020A | 2019 | 2018 | 2017 | 2016 A |
| Selected Per–Share Data | | | | | | |
| Net asset value, beginning of period | $60.25 | $55.40 | $55.31 | $69.33 | $61.95 | $63.04 |
| Income from Investment Operations | | | | | | |
| Net investment income (loss)B | .25 | .70 | .92C | .81 | .65 | .61 |
| Net realized and unrealized gain (loss) | 8.82 | 5.83 | .55 | (3.36) | 10.62 | (.76) |
| Total from investment operations | 9.07 | 6.53 | 1.47 | (2.55) | 11.27 | (.15) |
| Distributions from net investment income | (.10) | (.83) | (.76) | (1.07) | (.73) | (.49) |
| Distributions from net realized gain | (.86) | (.85) | (.62) | (10.39) | (3.16) | (.45) |
| Total distributions | (.96) | (1.68) | (1.38) | (11.47)D | (3.89) | (.94) |
| Redemption fees added to paid in capitalB | – | – | – | – | –E | –E |
| Net asset value, end of period | $68.36 | $60.25 | $55.40 | $55.31 | $69.33 | $61.95 |
| Total ReturnF,G,H | 15.37% | 11.81% | 2.69% | (4.40)% | 18.26% | (.16)% |
| Ratios to Average Net AssetsI,J | | | | | | |
| Expenses before reductions | 1.41%K | 1.46% | 1.50% | 1.49% | 1.46% | 1.47% |
| Expenses net of fee waivers, if any | 1.41%K | 1.46% | 1.49% | 1.49% | 1.46% | 1.47% |
| Expenses net of all reductions | 1.37%K | 1.45% | 1.48% | 1.48% | 1.44% | 1.46% |
| Net investment income (loss) | .80%K | 1.19% | 1.64%C | 1.24% | .96% | 1.01% |
| Supplemental Data | | | | | | |
| Net assets, end of period (000 omitted) | $8,616 | $6,919 | $6,018 | $4,847 | $6,933 | $8,280 |
| Portfolio turnover rateL | 69%K | 58% | 64%M | 66% | 105%M | 51% |
A For the year ended February 29.
B Calculated based on average shares outstanding during the period.
C Net investment income per share reflects one or more large, non-recurring dividend(s) which amounted to $.25 per share. Excluding such non-recurring dividend(s), the ratio of net investment income (loss) to average net assets would have been 1.19%.
D Total distributions of $11.47 per share is comprised of distributions from net investment income of $1.073 and distributions from net realized gain of $10.393 per share.
E Amount represents less than $.005 per share.
F Total returns for periods of less than one year are not annualized.
G Total returns would have been lower if certain expenses had not been reduced during the applicable periods shown.
H Total returns do not include the effect of the sales charges.
I Fees and expenses of any underlying mutual funds or exchange-traded funds (ETFs) are not included in the Fund's expense ratio. The Fund indirectly bears its proportionate share of these expenses. For additional expense information related to investments in Fidelity Central Funds, please refer to the "Investments in Fidelity Central Funds" note found in the Notes to Financial Statements section of the most recent Annual or Semi-Annual report.
J Expense ratios reflect operating expenses of the class. Expenses before reductions do not reflect amounts reimbursed, waived, or reduced through arrangements with the investment adviser, brokerage services, or other offset arrangements, if applicable, and do not represent the amount paid by the class during periods when reimbursements, waivers or reductions occur.
K Annualized
L Amount does not include the portfolio activity of any underlying Fidelity Central Funds.
M Portfolio turnover rate excludes securities received or delivered in-kind.
See accompanying notes which are an integral part of the financial statements.
Telecommunications Portfolio Class C
| | Six months ended (Unaudited) August 31, | Years endedFebruary 28, | | | | |
| | 2020 | 2020A | 2019 | 2018 | 2017 | 2016 A |
| Selected Per–Share Data | | | | | | |
| Net asset value, beginning of period | $60.32 | $55.45 | $55.29 | $69.24 | $62.10 | $63.04 |
| Income from Investment Operations | | | | | | |
| Net investment income (loss)B | .11 | .46 | .70C | .57 | .37 | .36 |
| Net realized and unrealized gain (loss) | 8.83 | 5.82 | .56 | (3.36) | 10.62 | (.75) |
| Total from investment operations | 8.94 | 6.28 | 1.26 | (2.79) | 10.99 | (.39) |
| Distributions from net investment income | (.07) | (.56) | (.48) | (.77) | (.69) | (.10) |
| Distributions from net realized gain | (.86) | (.85) | (.62) | (10.39) | (3.16) | (.45) |
| Total distributions | (.93) | (1.41) | (1.10) | (11.16) | (3.85) | (.55) |
| Redemption fees added to paid in capitalB | – | – | – | – | –D | –D |
| Net asset value, end of period | $68.33 | $60.32 | $55.45 | $55.29 | $69.24 | $62.10 |
| Total ReturnE,F,G | 15.11% | 11.34% | 2.30% | (4.75)% | 17.77% | (.57)% |
| Ratios to Average Net AssetsH,I | | | | | | |
| Expenses before reductions | 1.87%J | 1.88% | 1.88% | 1.86% | 1.88% | 1.89% |
| Expenses net of fee waivers, if any | 1.87%J | 1.87% | 1.88% | 1.86% | 1.88% | 1.89% |
| Expenses net of all reductions | 1.83%J | 1.87% | 1.86% | 1.85% | 1.86% | 1.88% |
| Net investment income (loss) | .35%J | .77% | 1.26%C | .87% | .54% | .60% |
| Supplemental Data | | | | | | |
| Net assets, end of period (000 omitted) | $7,905 | $6,491 | $6,994 | $8,396 | $13,528 | $7,735 |
| Portfolio turnover rateK | 69%J | 58% | 64%L | 66% | 105%L | 51% |
A For the year ended February 29.
B Calculated based on average shares outstanding during the period.
C Net investment income per share reflects one or more large, non-recurring dividend(s) which amounted to $.25 per share. Excluding such non-recurring dividend(s), the ratio of net investment income (loss) to average net assets would have been .81%.
D Amount represents less than $.005 per share.
E Total returns for periods of less than one year are not annualized.
F Total returns would have been lower if certain expenses had not been reduced during the applicable periods shown.
G Total returns do not include the effect of the contingent deferred sales charge.
H Fees and expenses of any underlying mutual funds or exchange-traded funds (ETFs) are not included in the Fund's expense ratio. The Fund indirectly bears its proportionate share of these expenses. For additional expense information related to investments in Fidelity Central Funds, please refer to the "Investments in Fidelity Central Funds" note found in the Notes to Financial Statements section of the most recent Annual or Semi-Annual report.
I Expense ratios reflect operating expenses of the class. Expenses before reductions do not reflect amounts reimbursed, waived, or reduced through arrangements with the investment adviser, brokerage services, or other offset arrangements, if applicable, and do not represent the amount paid by the class during periods when reimbursements, waivers or reductions occur.
J Annualized
K Amount does not include the portfolio activity of any underlying Fidelity Central Funds.
L Portfolio turnover rate excludes securities received or delivered in-kind.
See accompanying notes which are an integral part of the financial statements.
Telecommunications Portfolio
| | Six months ended (Unaudited) August 31, | Years endedFebruary 28, | | | | |
| | 2020 | 2020A | 2019 | 2018 | 2017 | 2016 A |
| Selected Per–Share Data | | | | | | |
| Net asset value, beginning of period | $60.99 | $56.04 | $55.88 | $69.97 | $62.58 | $63.54 |
| Income from Investment Operations | | | | | | |
| Net investment income (loss)B | .43 | 1.09 | 1.30C | 1.28 | 1.12 | 1.02 |
| Net realized and unrealized gain (loss) | 8.95 | 5.90 | .56 | (3.42) | 10.74 | (.77) |
| Total from investment operations | 9.38 | 6.99 | 1.86 | (2.14) | 11.86 | .25 |
| Distributions from net investment income | (.18) | (1.19) | (1.08) | (1.56) | (1.31) | (.76) |
| Distributions from net realized gain | (.86) | (.85) | (.62) | (10.39) | (3.16) | (.45) |
| Total distributions | (1.04) | (2.04) | (1.70) | (11.95) | (4.47) | (1.21) |
| Redemption fees added to paid in capitalB | – | – | – | – | –D | –D |
| Net asset value, end of period | $69.33 | $60.99 | $56.04 | $55.88 | $69.97 | $62.58 |
| Total ReturnE,F | 15.72% | 12.50% | 3.38% | (3.76)% | 19.06% | .49% |
| Ratios to Average Net AssetsG,H | | | | | | |
| Expenses before reductions | .82%I | .83% | .84% | .82% | .80% | .82% |
| Expenses net of fee waivers, if any | .82%I | .82% | .83% | .82% | .80% | .81% |
| Expenses net of all reductions | .79%I | .82% | .82% | .80% | .78% | .81% |
| Net investment income (loss) | 1.39%I | 1.82% | 2.30%C | 1.92% | 1.62% | 1.67% |
| Supplemental Data | | | | | | |
| Net assets, end of period (000 omitted) | $244,271 | $219,854 | $227,438 | $320,908 | $690,720 | $689,600 |
| Portfolio turnover rateJ | 69%I | 58% | 64%K | 66% | 105%K | 51% |
A For the year ended February 29.
B Calculated based on average shares outstanding during the period.
C Net investment income per share reflects one or more large, non-recurring dividend(s) which amounted to $.25 per share. Excluding such non-recurring dividend(s), the ratio of net investment income (loss) to average net assets would have been 1.85%.
D Amount represents less than $.005 per share.
E Total returns for periods of less than one year are not annualized.
F Total returns would have been lower if certain expenses had not been reduced during the applicable periods shown.
G Fees and expenses of any underlying mutual funds or exchange-traded funds (ETFs) are not included in the Fund's expense ratio. The Fund indirectly bears its proportionate share of these expenses. For additional expense information related to investments in Fidelity Central Funds, please refer to the "Investments in Fidelity Central Funds" note found in the Notes to Financial Statements section of the most recent Annual or Semi-Annual report.
H Expense ratios reflect operating expenses of the class. Expenses before reductions do not reflect amounts reimbursed, waived, or reduced through arrangements with the investment adviser, brokerage services, or other offset arrangements, if applicable, and do not represent the amount paid by the class during periods when reimbursements, waivers or reductions occur.
I Annualized
J Amount does not include the portfolio activity of any underlying Fidelity Central Funds.
K Portfolio turnover rate excludes securities received or delivered in-kind.
See accompanying notes which are an integral part of the financial statements.
Telecommunications Portfolio Class I
| | Six months ended (Unaudited) August 31, | Years endedFebruary 28, | | | | |
| | 2020 | 2020 A | 2019 | 2018 | 2017 | 2016 A |
| Selected Per–Share Data | | | | | | |
| Net asset value, beginning of period | $60.86 | $55.84 | $55.74 | $69.82 | $62.46 | $63.38 |
| Income from Investment Operations | | | | | | |
| Net investment income (loss)B | .44 | 1.04 | 1.27C | 1.26 | 1.12 | 1.02 |
| Net realized and unrealized gain (loss) | 8.93 | 5.91 | .57 | (3.39) | 10.70 | (.76) |
| Total from investment operations | 9.37 | 6.95 | 1.84 | (2.13) | 11.82 | .26 |
| Distributions from net investment income | (.18) | (1.08) | (1.12) | (1.56) | (1.30) | (.73) |
| Distributions from net realized gain | (.86) | (.85) | (.62) | (10.39) | (3.16) | (.45) |
| Total distributions | (1.04) | (1.93) | (1.74) | (11.95) | (4.46) | (1.18) |
| Redemption fees added to paid in capitalB | – | – | – | – | –D | –D |
| Net asset value, end of period | $69.19 | $60.86 | $55.84 | $55.74 | $69.82 | $62.46 |
| Total ReturnE,F | 15.74% | 12.47% | 3.35% | (3.75)% | 19.03% | .51% |
| Ratios to Average Net AssetsG,H | | | | | | |
| Expenses before reductions | .80%I | .88% | .91% | .82% | .80% | .82% |
| Expenses net of fee waivers, if any | .80%I | .88% | .90% | .82% | .80% | .82% |
| Expenses net of all reductions | .76%I | .88% | .88% | .80% | .78% | .81% |
| Net investment income (loss) | 1.41%I | 1.76% | 2.23%C | 1.91% | 1.62% | 1.67% |
| Supplemental Data | | | | | | |
| Net assets, end of period (000 omitted) | $23,757 | $12,428 | $25,181 | $8,332 | $14,550 | $6,197 |
| Portfolio turnover rateJ | 69%I | 58% | 64%K | 66% | 105%K | 51% |
A For the year ended February 29.
B Calculated based on average shares outstanding during the period.
C Net investment income per share reflects one or more large, non-recurring dividend(s) which amounted to $.25 per share. Excluding such non-recurring dividend(s), the ratio of net investment income (loss) to average net assets would have been 1.79%.
D Amount represents less than $.005 per share.
E Total returns for periods of less than one year are not annualized.
F Total returns would have been lower if certain expenses had not been reduced during the applicable periods shown.
G Fees and expenses of any underlying mutual funds or exchange-traded funds (ETFs) are not included in the Fund's expense ratio. The Fund indirectly bears its proportionate share of these expenses. For additional expense information related to investments in Fidelity Central Funds, please refer to the "Investments in Fidelity Central Funds" note found in the Notes to Financial Statements section of the most recent Annual or Semi-Annual report.
H Expense ratios reflect operating expenses of the class. Expenses before reductions do not reflect amounts reimbursed, waived, or reduced through arrangements with the investment adviser, brokerage services, or other offset arrangements, if applicable, and do not represent the amount paid by the class during periods when reimbursements, waivers or reductions occur.
I Annualized
J Amount does not include the portfolio activity of any underlying Fidelity Central Funds.
K Portfolio turnover rate excludes securities received or delivered in-kind.
See accompanying notes which are an integral part of the financial statements.
Telecommunications Portfolio Class Z
| | Six months ended (Unaudited) August 31, | Years endedFebruary 28, | |
| | 2020 | 2020 A | 2019 B |
| Selected Per–Share Data | | | |
| Net asset value, beginning of period | $60.75 | $55.84 | $60.97 |
| Income from Investment Operations | | | |
| Net investment income (loss)C | .48 | 1.20 | .39D |
| Net realized and unrealized gain (loss) | 8.92 | 5.86 | (4.55) |
| Total from investment operations | 9.40 | 7.06 | (4.16) |
| Distributions from net investment income | (.20) | (1.30) | (.97) |
| Distributions from net realized gain | (.86) | (.85) | – |
| Total distributions | (1.06) | (2.15) | (.97) |
| Net asset value, end of period | $69.09 | $60.75 | $55.84 |
| Total ReturnE,F | 15.81% | 12.68% | (6.80)% |
| Ratios to Average Net AssetsG,H | | | |
| Expenses before reductions | .68%I | .68% | .68%I |
| Expenses net of fee waivers, if any | .68%I | .67% | .66%I |
| Expenses net of all reductions | .64%I | .67% | .64%I |
| Net investment income (loss) | 1.53%I | 1.97% | 1.67%D,I |
| Supplemental Data | | | |
| Net assets, end of period (000 omitted) | $29,987 | $25,223 | $383 |
| Portfolio turnover rateJ | 69%I | 58% | 64%K |
A For the year ended February 29.
B For the period October 2, 2018 (commencement of sale of shares) to February 28, 2019.
C Calculated based on average shares outstanding during the period.
D Net investment income per share reflects one or more large, non-recurring dividend(s) which amounted to $.10 per share. Excluding such non-recurring dividend(s), the ratio of net investment income (loss) to average net assets would have been 1.23%.
E Total returns for periods of less than one year are not annualized.
F Total returns would have been lower if certain expenses had not been reduced during the applicable periods shown.
G Fees and expenses of any underlying mutual funds or exchange-traded funds (ETFs) are not included in the Fund's expense ratio. The Fund indirectly bears its proportionate share of these expenses. For additional expense information related to investments in Fidelity Central Funds, please refer to the "Investments in Fidelity Central Funds" note found in the Notes to Financial Statements section of the most recent Annual or Semi-Annual report.
H Expense ratios reflect operating expenses of the class. Expenses before reductions do not reflect amounts reimbursed, waived, or reduced through arrangements with the investment adviser, brokerage services, or other offset arrangements, if applicable, and do not represent the amount paid by the class during periods when reimbursements, waivers or reductions occur.
I Annualized
J Amount does not include the portfolio activity of any underlying Fidelity Central Funds.
K Portfolio turnover rate excludes securities received or delivered in-kind.
See accompanying notes which are an integral part of the financial statements.
Notes to Financial Statements (Unaudited)
For the period ended August 31, 2020
1. Organization.
Telecommunications Portfolio (the Fund) is a non-diversified fund of Fidelity Select Portfolios (the Trust) and is authorized to issue an unlimited number of shares. The Trust is registered under the Investment Company Act of 1940, as amended (the 1940 Act), as an open-end management investment company organized as a Massachusetts business trust. The Fund invests primarily in securities of companies whose principal business activities fall within specific industries. The Fund offers Class A, Class M, Class C, Telecommunications, Class I and Class Z shares, each of which has equal rights as to assets and voting privileges. Each class has exclusive voting rights with respect to matters that affect that class. Class C shares will automatically convert to Class A shares after a holding period of ten years from the initial date of purchase, with certain exceptions.
2. Investments in Fidelity Central Funds.
The Fund invests in Fidelity Central Funds, which are open-end investment companies generally available only to other investment companies and accounts managed by the investment adviser and its affiliates. The Fund's Schedule of Investments lists each of the Fidelity Central Funds held as of period end, if any, as an investment of the Fund, but does not include the underlying holdings of each Fidelity Central Fund. As an Investing Fund, the Fund indirectly bears its proportionate share of the expenses of the underlying Fidelity Central Funds.
The Money Market Central Funds seek preservation of capital and current income and are managed by the investment adviser. Annualized expenses of the Money Market Central Funds as of their most recent shareholder report date ranged from less than .005% to .01%.
A complete unaudited list of holdings for each Fidelity Central Fund is available upon request or at the Securities and Exchange Commission (the SEC) website at www.sec.gov. In addition, the financial statements of the Fidelity Central Funds are available on the SEC website or upon request.
3. Significant Accounting Policies.
The Fund is an investment company and applies the accounting and reporting guidance of the Financial Accounting Standards Board (FASB) Accounting Standards Codification Topic 946 Financial Services – Investment Companies. The financial statements have been prepared in conformity with accounting principles generally accepted in the United States of America (GAAP), which require management to make certain estimates and assumptions at the date of the financial statements. Actual results could differ from those estimates. Subsequent events, if any, through the date that the financial statements were issued have been evaluated in the preparation of the financial statements. The following summarizes the significant accounting policies of the Fund:
Investment Valuation. Investments are valued as of 4:00 p.m. Eastern time on the last calendar day of the period. The Board of Trustees (the Board) has delegated the day to day responsibility for the valuation of the Fund's investments to the Fair Value Committee (the Committee) established by the Fund's investment adviser. In accordance with valuation policies and procedures approved by the Board, the Fund attempts to obtain prices from one or more third party pricing vendors or brokers to value its investments. When current market prices, quotations or currency exchange rates are not readily available or reliable, investments will be fair valued in good faith by the Committee, in accordance with procedures adopted by the Board. Factors used in determining fair value vary by investment type and may include market or investment specific events. The frequency with which these procedures are used cannot be predicted and they may be utilized to a significant extent. The Committee oversees the Fund's valuation policies and procedures and reports to the Board on the Committee's activities and fair value determinations. The Board monitors the appropriateness of the procedures used in valuing the Fund's investments and ratifies the fair value determinations of the Committee.
The Fund categorizes the inputs to valuation techniques used to value its investments into a disclosure hierarchy consisting of three levels as shown below:
- Level 1 – quoted prices in active markets for identical investments
- Level 2 – other significant observable inputs (including quoted prices for similar investments, interest rates, prepayment speeds, etc.)
- Level 3 – unobservable inputs (including the Fund's own assumptions based on the best information available)
Valuation techniques used to value the Fund's investments by major category are as follows:
Equity securities, including restricted securities, for which market quotations are readily available, are valued at the last reported sale price or official closing price as reported by a third party pricing vendor on the primary market or exchange on which they are traded and are categorized as Level 1 in the hierarchy. In the event there were no sales during the day or closing prices are not available, securities are valued at the last quoted bid price or may be valued using the last available price and are generally categorized as Level 2 in the hierarchy. For foreign equity securities, when market or security specific events arise, comparisons to the valuation of American Depositary Receipts (ADRs), futures contracts, Exchange-Traded Funds (ETFs) and certain indexes as well as quoted prices for similar securities may be used and would be categorized as Level 2 in the hierarchy. For equity securities, including restricted securities, where observable inputs are limited, assumptions about market activity and risk are used and these securities may be categorized as Level 3 in the hierarchy.
Investments in open-end mutual funds, including the Fidelity Central Funds, are valued at their closing net asset value (NAV) each business day and are categorized as Level 1 in the hierarchy.
Changes in valuation techniques may result in transfers in or out of an assigned level within the disclosure hierarchy. The aggregate value of investments by input level as of August 31, 2020 is included at the end of the Fund's Schedule of Investments.
Foreign Currency. Certain Funds may use foreign currency contracts to facilitate transactions in foreign-denominated securities. Gains and losses from these transactions may arise from changes in the value of the foreign currency or if the counterparties do not perform under the contracts' terms.
Foreign-denominated assets, including investment securities, and liabilities are translated into U.S. dollars at the exchange rates at period end. Purchases and sales of investment securities, income and dividends received, and expenses denominated in foreign currencies are translated into U.S. dollars at the exchange rate in effect on the transaction date.
The effects of exchange rate fluctuations on investments are included with the net realized and unrealized gain (loss) on investment securities. Other foreign currency transactions resulting in realized and unrealized gain (loss) are disclosed separately.
Investment Transactions and Income. For financial reporting purposes, the Fund's investment holdings and NAV include trades executed through the end of the last business day of the period. The NAV per share for processing shareholder transactions is calculated as of the close of business of the New York Stock Exchange (NYSE), normally 4:00 p.m. Eastern time and includes trades executed through the end of the prior business day. Gains and losses on securities sold are determined on the basis of identified cost. Dividend income is recorded on the ex-dividend date, except for certain dividends from foreign securities where the ex-dividend date may have passed, which are recorded as soon as the Fund is informed of the ex-dividend date. Non-cash dividends included in dividend income, if any, are recorded at the fair market value of the securities received. Income and capital gain distributions from Fidelity Central Funds, if any, are recorded on the ex-dividend date. Certain distributions received by the Fund represent a return of capital or capital gain. The Fund determines the components of these distributions subsequent to the ex-dividend date, based upon receipt of tax filings or other correspondence relating to the underlying investment. These distributions are recorded as a reduction of cost of investments and/or as a realized gain. Investment income is recorded net of foreign taxes withheld where recovery of such taxes is uncertain.
Class Allocations and Expenses. Investment income, realized and unrealized capital gains and losses, common expenses of the Fund, and certain fund-level expense reductions, if any, are allocated daily on a pro-rata basis to each class based on the relative net assets of each class to the total net assets of the Fund. Each class differs with respect to transfer agent and distribution and service plan fees incurred. Certain expense reductions may also differ by class. For the reporting period, the allocated portion of income and expenses to each class as a percent of its average net assets may vary due to the timing of recording these transactions in relation to fluctuating net assets of the classes. Expenses directly attributable to a fund are charged to that fund. Expenses attributable to more than one fund are allocated among the respective funds on the basis of relative net assets or other appropriate methods. Expense estimates are accrued in the period to which they relate and adjustments are made when actual amounts are known.
Income Tax Information and Distributions to Shareholders. Each year, the Fund intends to qualify as a regulated investment company under Subchapter M of the Internal Revenue Code, including distributing substantially all of its taxable income and realized gains. As a result, no provision for U.S. Federal income taxes is required. The Fund files a U.S. federal tax return, in addition to state and local tax returns as required. The Fund's federal income tax returns are subject to examination by the Internal Revenue Service (IRS) for a period of three fiscal years after they are filed. State and local tax returns may be subject to examination for an additional fiscal year depending on the jurisdiction. Foreign taxes are provided for based on the Fund's understanding of the tax rules and rates that exist in the foreign markets in which it invests. The Fund is subject to a tax imposed on capital gains by certain countries in which it invests. An estimated deferred tax liability for net unrealized appreciation on the applicable securities is included in Other payables and accrued expenses on the Statement of Assets & Liabilities.
Distributions are declared and recorded on the ex-dividend date. Income and capital gain distributions are declared separately for each class. Income and capital gain distributions are determined in accordance with income tax regulations, which may differ from GAAP.
Capital accounts within the financial statements are adjusted for permanent book-tax differences. These adjustments have no impact on net assets or the results of operations. Capital accounts are not adjusted for temporary book-tax differences which will reverse in a subsequent period.
Book-tax differences are primarily due to foreign currency transactions, capital loss carryforwards and losses deferred due to wash sales.
As of period end, the cost and unrealized appreciation (depreciation) in securities, and derivatives if applicable, for federal income tax purposes were as follows:
| Gross unrealized appreciation | $102,501,335 |
| Gross unrealized depreciation | (15,564,984) |
| Net unrealized appreciation (depreciation) | $86,936,351 |
| Tax cost | $266,544,709 |
4. Purchases and Sales of Investments.
Purchases and sales of securities, other than short-term securities, are noted in the table below.
| | Purchases ($) | Sales ($) |
| Telecommunications Portfolio | 111,913,466 | 106,796,063 |
5. Fees and Other Transactions with Affiliates.
Management Fee. Fidelity Management & Research Company LLC (the investment adviser) and its affiliates provide the Fund with investment management related services for which the Fund pays a monthly management fee. The management fee is the sum of an individual fund fee rate that is based on an annual rate of .30% of the Fund's average net assets and an annualized group fee rate that averaged .23% during the period. The group fee rate is based upon the monthly average net assets of a group of registered investment companies with which the investment adviser has management contracts. The group fee rate decreases as assets under management increase and increases as assets under management decrease. For the reporting period, the total annualized management fee rate was .53% of the Fund's average net assets.
Distribution and Service Plan Fees. In accordance with Rule 12b-1 of the 1940 Act, the Fund has adopted separate Distribution and Service Plans for each class of shares. Certain classes pay Fidelity Distributors Company LLC (FDC), an affiliate of the investment adviser, separate Distribution and Service Fees, each of which is based on an annual percentage of each class' average net assets. In addition, FDC may pay financial intermediaries for selling shares of the Fund and providing shareholder support services. For the period, the Distribution and Service Fee rates, total fees and amounts retained by FDC were as follows:
| | Distribution Fee | Service Fee | Total Fees | Retained by FDC |
| Class A | -% | .25% | $26,530 | $605 |
| Class M | .25% | .25% | 17,230 | – |
| Class C | .75% | .25% | 34,668 | 6,107 |
| | | | $78,428 | $6,712 |
Sales Load. FDC may receive a front-end sales charge of up to 5.75% for selling Class A shares and 3.50% for selling Class M shares, some of which is paid to financial intermediaries for selling shares of the Fund. Depending on the holding period, FDC may receive contingent deferred sales charges levied on Class A, Class M and Class C redemptions. The deferred sales charges are 1.00% for Class C shares, 1.00% for certain purchases of Class A shares and .25% for certain purchases of Class M shares.
For the period, sales charge amounts retained by FDC were as follows:
| | Retained by FDC |
| Class A | $13,533 |
| Class M | 1,052 |
| Class C(a) | 253 |
| | $14,838 |
(a) When Class C shares are initially sold, FDC pays commissions from its own resources to financial intermediaries through which the sales are made.
Transfer Agent Fees. Fidelity Investments Institutional Operations Company LLC (FIIOC), an affiliate of the investment adviser, is the transfer, dividend disbursing and shareholder servicing agent for each class of the Fund. FIIOC receives account fees and asset-based fees that vary according to the account size and type of account of the shareholders of the respective classes of the Fund, except for Class Z. FIIOC receives an asset-based fee of Class Z's average net assets. FIIOC pays for typesetting, printing and mailing of shareholder reports, except proxy statements.
For the period, transfer agent fees for each class were as follows:
| | Amount | % of Class-Level Average Net Assets(a) |
| Class A | $26,678 | .25 |
| Class M | 9,637 | .28 |
| Class C | 8,104 | .23 |
| Telecommunications | 219,815 | .19 |
| Class I | 16,305 | .17 |
| Class Z | 5,884 | .04 |
| | $286,423 | |
(a) Annualized
Accounting Fees. Fidelity Service Company, Inc. (FSC), an affiliate of the investment adviser, maintains the Fund's accounting records. The accounting fee is based on the level of average net assets for each month. For the period, the fees were equivalent to the following annualized rates:
| | % of Average Net Assets |
| Telecommunications Portfolio | .04 |
Brokerage Commissions. A portion of portfolio transactions were placed with brokerage firms which are affiliates of the investment adviser. Brokerage commissions are included in net realized gain (loss) and change in net unrealized appreciation (depreciation) in the Statement of Operations. The commissions paid to these affiliated firms were as follows:
| | Amount |
| Telecommunications Portfolio | $7,483 |
Interfund Lending Program. Pursuant to an Exemptive Order issued by the SEC, the fund, along with other registered investment companies having management contracts with Fidelity Management & Research Company LLC (FMR), or other affiliated entities of FMR, may participate in an interfund lending program. This program provides an alternative credit facility allowing the fund to borrow from, or lend money to, other participating affiliated funds. At period end, there were no interfund loans outstanding. Activity in this program during the period for which loans were outstanding was as follows:
| | Borrower or Lender | Average Loan Balance | Weighted Average Interest Rate | Interest Expense |
| Telecommunications Portfolio | Borrower | $5,305,000 | .32% | $140 |
Interfund Trades. Funds may purchase from or sell securities to other Fidelity Funds under procedures adopted by the Board. The procedures have been designed to ensure these interfund trades are executed in accordance with Rule 17a-7 of the 1940 Act. Interfund trades are included within the respective purchases and sales amounts shown in the Purchases and Sales of Investments note.
6. Committed Line of Credit.
Certain Funds participate with other funds managed by the investment adviser or an affiliate in a $4.25 billion credit facility (the "line of credit") to be utilized for temporary or emergency purposes to fund shareholder redemptions or for other short-term liquidity purposes. The participating funds have agreed to pay commitment fees on their pro-rata portion of the line of credit, which are reflected in Miscellaneous expenses on the Statement of Operations, and are as follows:
| | Amount |
| Telecommunications Portfolio | $374 |
During the period, there were no borrowings on this line of credit.
7. Security Lending.
The Fund lends portfolio securities from time to time in order to earn additional income. Lending agents are used, including National Financial Services (NFS), an affiliate of the Fund. Pursuant to a securities lending agreement, NFS will receive a fee, which is capped at 9.9% of daily lending revenue, for its services as lending agent. The Fund may lend securities to certain qualified borrowers, including NFS. On the settlement date of the loan, the Fund receives collateral (in the form of U.S. Treasury obligations, letters of credit and/or cash) against the loaned securities and maintains collateral in an amount not less than 100% of the market value of the loaned securities during the period of the loan. The market value of the loaned securities is determined at the close of business of the Fund and any additional required collateral is delivered to the Fund on the next business day. The Fund or borrower may terminate the loan at any time, and if the borrower defaults on its obligation to return the securities loaned because of insolvency or other reasons, the Fund may apply collateral received from the borrower against the obligation. The Fund may experience delays and costs in recovering the securities loaned. Any cash collateral received is invested in the Fidelity Securities Lending Cash Central Fund. The value of loaned securities and cash collateral at period end are disclosed on the Fund's Statement of Assets and Liabilities. Total fees paid by the Fund to NFS, as lending agent, amounted to $708. Security lending income represents the income earned on investing cash collateral, less rebates paid to borrowers and any lending agent fees associated with the loan, plus any premium payments received for lending certain types of securities. Net income from the Fidelity Securities Lending Cash Central Fund during the period is presented in the Statement of Operations as a component of income from Fidelity Central Funds. During the period, there were no securities loaned to NFS.
8. Expense Reductions.
Commissions paid to certain brokers with whom the investment adviser, or its affiliates, places trades on behalf of the Fund include an amount in addition to trade execution, which may be rebated back to the Fund to offset certain expenses. This amount totaled $58,301 for the period.
In addition, during the period the investment adviser or an affiliate reimbursed and/or waived a portion of fund-level operating expenses in the amount of $585.
9. Distributions to Shareholders.
Distributions to shareholders of each class were as follows:
| | Six months ended
August 31, 2020 | Year ended
February 29, 2020 |
| Distributions to shareholders | | |
| Class A | $318,732 | $604,045 |
| Class M | 94,944 | 187,105 |
| Class C | 97,338 | 153,979 |
| Telecommunications | 3,922,539 | 7,412,079 |
| Class I | 263,477 | 463,300 |
| Class Z | 472,770 | 746,076 |
| Total | $5,169,800 | $9,566,584 |
10. Share Transactions.
Share transactions for each class were as follows and may contain automatic conversions between classes or exchanges between affiliated funds:
| | Shares | Shares | Dollars | Dollars |
| | Six months ended August 31, 2020 | Year ended February 29, 2020 | Six months ended August 31, 2020 | Year ended February 29, 2020 |
| Class A | | | | |
| Shares sold | 120,895 | 131,076 | $7,608,476 | $7,742,577 |
| Reinvestment of distributions | 5,309 | 9,514 | 305,840 | 574,157 |
| Shares redeemed | (105,170) | (157,632) | (6,448,253) | (9,303,325) |
| Net increase (decrease) | 21,034 | (17,042) | $1,466,063 | $(986,591) |
| Class M | | | | |
| Shares sold | 45,974 | 39,034 | $2,878,580 | $2,290,232 |
| Reinvestment of distributions | 1,648 | 3,102 | 94,414 | 186,377 |
| Shares redeemed | (36,439) | (35,902) | (2,222,557) | (2,107,496) |
| Net increase (decrease) | 11,183 | 6,234 | $750,437 | $369,113 |
| Class C | | | | |
| Shares sold | 34,483 | 20,297 | $2,114,724 | $1,201,861 |
| Reinvestment of distributions | 1,595 | 2,359 | 91,493 | 141,967 |
| Shares redeemed | (28,017) | (41,159) | (1,724,389) | (2,410,442) |
| Net increase (decrease) | 8,061 | (18,503) | $481,828 | $(1,066,614) |
| Telecommunications | | | | |
| Shares sold | 698,564 | 518,015 | $41,178,923 | $31,128,263 |
| Reinvestment of distributions | 62,650 | 114,924 | 3,632,418 | 6,977,492 |
| Shares redeemed | (842,763) | (1,086,758) | (50,664,642) | (64,730,175) |
| Net increase (decrease) | (81,549) | (453,819) | $(5,853,301) | $(26,624,420) |
| Class I | | | | |
| Shares sold | 292,770 | 156,686 | $17,107,486 | $9,424,886 |
| Reinvestment of distributions | 4,213 | 6,643 | 243,765 | 401,406 |
| Shares redeemed | (157,818) | (410,057) | (8,985,188) | (24,520,400) |
| Net increase (decrease) | 139,165 | (246,728) | $8,366,063 | $(14,694,108) |
| Class Z | | | | |
| Shares sold | 90,724 | 468,706 | $5,271,521 | $28,191,952 |
| Reinvestment of distributions | 5,853 | 9,319 | 338,028 | 565,974 |
| Shares redeemed | (77,725) | (69,698) | (4,695,777) | (4,214,548) |
| Net increase (decrease) | 18,852 | 408,327 | $913,772 | $24,543,378 |
11. Other.
The Fund's organizational documents provide former and current trustees and officers with a limited indemnification against liabilities arising in connection with the performance of their duties to the Fund. In the normal course of business, the Fund may also enter into contracts that provide general indemnifications. The Fund's maximum exposure under these arrangements is unknown as this would be dependent on future claims that may be made against the Fund. The risk of material loss from such claims is considered remote.
12. Coronavirus (COVID-19) Pandemic.
An outbreak of COVID-19 first detected in China during December 2019 has since spread globally and was declared a pandemic by the World Health Organization during March 2020. Developments that disrupt global economies and financial markets, such as the COVID-19 pandemic, may magnify factors that affect the Fund's performance.
Wireless Portfolio
Investment Summary (Unaudited)
Top Ten Stocks as of August 31, 2020
| | % of fund's net assets |
| Apple, Inc. | 17.2 |
| T-Mobile U.S., Inc. | 7.2 |
| American Tower Corp. | 6.9 |
| Verizon Communications, Inc. | 6.2 |
| Marvell Technology Group Ltd. | 3.8 |
| Reliance Industries Ltd. | 3.4 |
| Ericsson (B Shares) | 3.4 |
| RingCentral, Inc. | 3.0 |
| Activision Blizzard, Inc. | 2.8 |
| Orange SA ADR | 2.7 |
| | 56.6 |
Top Industries (% of fund's net assets)
| As of August 31, 2020 |
| | Diversified Telecommunication Services | 22.2% |
| | Technology Hardware, Storage & Peripherals | 18.7% |
| | Wireless Telecommunication Services | 11.2% |
| | Semiconductors & Semiconductor Equipment | 9.7% |
| | Equity Real Estate Investment Trusts (Reits) | 8.5% |
| | All Others* | 29.7% |
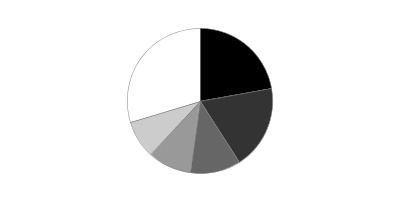
* Includes short-term investments and net other assets (liabilities).
Wireless Portfolio
Schedule of Investments August 31, 2020 (Unaudited)
Showing Percentage of Net Assets
| Common Stocks - 97.2% | | | |
| | | Shares | Value |
| Communications Equipment - 8.1% | | | |
| Communications Equipment - 8.1% | | | |
| CommScope Holding Co., Inc. (a) | | 496,900 | $5,118,070 |
| EchoStar Holding Corp. Class A (a) | | 105,400 | 3,096,652 |
| Ericsson: | | | |
| (B Shares) | | 165,200 | 1,926,218 |
| (B Shares) sponsored ADR (b) | | 1,124,700 | 13,102,755 |
| Motorola Solutions, Inc. | | 49,968 | 7,732,548 |
| Nokia Corp. sponsored ADR | | 479,800 | 2,351,020 |
| ViaSat, Inc. (a) | | 68,401 | 2,719,624 |
| | | | 36,046,887 |
| Diversified Telecommunication Services - 22.2% | | | |
| Alternative Carriers - 5.9% | | | |
| GCI Liberty, Inc. (a) | | 120,800 | 9,758,224 |
| Iliad SA (b) | | 38,795 | 8,286,986 |
| Liberty Global PLC Class A (a) | | 307,700 | 7,190,949 |
| Liberty Latin America Ltd. Class C (a)(b) | | 138,300 | 1,319,382 |
| | | | 26,555,541 |
| Integrated Telecommunication Services - 16.3% | | | |
| AT&T, Inc. | | 334,100 | 9,959,521 |
| BCE, Inc. (b) | | 139,100 | 5,978,415 |
| Bezeq The Israel Telecommunication Corp. Ltd. (a) | | 8,589,900 | 9,815,346 |
| Masmovil Ibercom SA (a) | | 163,350 | 4,374,313 |
| Orange SA ADR | | 1,074,500 | 11,959,185 |
| Telefonica SA sponsored ADR (b) | | 738,063 | 2,915,349 |
| Verizon Communications, Inc. | | 463,201 | 27,453,923 |
| | | | 72,456,052 |
|
| TOTAL DIVERSIFIED TELECOMMUNICATION SERVICES | | | 99,011,593 |
|
| Entertainment - 4.0% | | | |
| Interactive Home Entertainment - 3.5% | | | |
| Activision Blizzard, Inc. | | 149,600 | 12,494,592 |
| Electronic Arts, Inc. (a) | | 21,800 | 3,040,446 |
| | | | 15,535,038 |
| Movies & Entertainment - 0.5% | | | |
| Spotify Technology SA (a) | | 7,200 | 2,031,552 |
|
| TOTAL ENTERTAINMENT | | | 17,566,590 |
|
| Equity Real Estate Investment Trusts (REITs) - 8.5% | | | |
| Specialized REITs - 8.5% | | | |
| American Tower Corp. | | 124,392 | 30,992,267 |
| Crown Castle International Corp. | | 21,401 | 3,493,713 |
| SBA Communications Corp. Class A | | 11,400 | 3,489,198 |
| | | | 37,975,178 |
| Interactive Media & Services - 2.0% | | | |
| Interactive Media & Services - 2.0% | | | |
| Facebook, Inc. Class A (a) | | 30,000 | 8,796,000 |
| Internet & Direct Marketing Retail - 1.7% | | | |
| Internet & Direct Marketing Retail - 1.7% | | | |
| Amazon.com, Inc. (a) | | 2,200 | 7,592,112 |
| Media - 1.1% | | | |
| Cable & Satellite - 1.1% | | | |
| DISH Network Corp. Class A (a) | | 132,149 | 4,693,932 |
| Oil, Gas & Consumable Fuels - 3.5% | | | |
| Oil & Gas Refining & Marketing - 3.5% | | | |
| Reliance Industries Ltd. | | 531,800 | 15,104,684 |
| Reliance Industries Ltd. | | 35,453 | 577,603 |
| | | | 15,682,287 |
| Road & Rail - 1.6% | | | |
| Trucking - 1.6% | | | |
| Lyft, Inc. (a) | | 237,100 | 7,034,757 |
| Semiconductors & Semiconductor Equipment - 9.7% | | | |
| Semiconductors - 9.7% | | | |
| Marvell Technology Group Ltd. | | 430,800 | 16,706,424 |
| NXP Semiconductors NV | | 33,200 | 4,175,232 |
| Qualcomm, Inc. | | 85,850 | 10,224,735 |
| Skyworks Solutions, Inc. | | 62,500 | 9,053,125 |
| Synaptics, Inc. (a) | | 37,700 | 3,216,941 |
| | | | 43,376,457 |
| Software - 4.9% | | | |
| Application Software - 4.8% | | | |
| LivePerson, Inc. (a)(b) | | 131,500 | 7,845,290 |
| RingCentral, Inc. (a) | | 45,800 | 13,317,266 |
| Zoom Video Communications, Inc. Class A (a) | | 300 | 97,530 |
| | | | 21,260,086 |
| Systems Software - 0.1% | | | |
| BlackBerry Ltd. (a) | | 76,401 | 398,303 |
|
| TOTAL SOFTWARE | | | 21,658,389 |
|
| Technology Hardware, Storage & Peripherals - 18.7% | | | |
| Technology Hardware, Storage & Peripherals - 18.7% | | | |
| Apple, Inc. | | 591,620 | 76,342,645 |
| Samsung Electronics Co. Ltd. | | 150,350 | 6,836,940 |
| | | | 83,179,585 |
| Wireless Telecommunication Services - 11.2% | | | |
| Wireless Telecommunication Services - 11.2% | | | |
| China Mobile Ltd. sponsored ADR | | 186,200 | 6,522,586 |
| Millicom International Cellular SA (b) | | 174,600 | 5,159,430 |
| Shenandoah Telecommunications Co. | | 300 | 16,590 |
| Spok Holdings, Inc. | | 1 | 11 |
| T-Mobile U.S., Inc. | | 274,416 | 32,018,859 |
| Vodafone Group PLC sponsored ADR | | 428,281 | 6,325,710 |
| | | | 50,043,186 |
| TOTAL COMMON STOCKS | | | |
| (Cost $284,132,132) | | | 432,656,953 |
|
| Money Market Funds - 6.1% | | | |
| Fidelity Cash Central Fund 0.12% (c) | | 8,424,293 | 8,425,978 |
| Fidelity Securities Lending Cash Central Fund 0.11% (c)(d) | | 18,830,656 | 18,832,539 |
| TOTAL MONEY MARKET FUNDS | | | |
| (Cost $27,258,517) | | | 27,258,517 |
| TOTAL INVESTMENT IN SECURITIES - 103.3% | | | |
| (Cost $311,390,649) | | | 459,915,470 |
| NET OTHER ASSETS (LIABILITIES) - (3.3)% | | | (14,621,897) |
| NET ASSETS - 100% | | | $445,293,573 |
Legend
(a) Non-income producing
(b) Security or a portion of the security is on loan at period end.
(c) Affiliated fund that is generally available only to investment companies and other accounts managed by Fidelity Investments. The rate quoted is the annualized seven-day yield of the fund at period end. A complete unaudited listing of the fund's holdings as of its most recent quarter end is available upon request. In addition, each Fidelity Central Fund's financial statements are available on the SEC's website or upon request.
(d) Investment made with cash collateral received from securities on loan.
Affiliated Central Funds
Information regarding fiscal year to date income earned by the Fund from investments in Fidelity Central Funds is as follows:
| Fund | Income earned |
| Fidelity Cash Central Fund | $2,685 |
| Fidelity Securities Lending Cash Central Fund | 38,588 |
| Total | $41,273 |
Amounts in the income column in the above table include any capital gain distributions from underlying funds, which are presented in the corresponding line-item in the Statement of Operations, if applicable. Amount for Fidelity Securities Lending Cash Central Fund represents the income earned on investing cash collateral, less rebates paid to borrowers and any lending agent fees associated with the loan, plus any premium payments received for lending certain types of securities.
Investment Valuation
The following is a summary of the inputs used, as of August 31, 2020, involving the Fund's assets and liabilities carried at fair value. The inputs or methodology used for valuing securities may not be an indication of the risk associated with investing in those securities. For more information on valuation inputs, and their aggregation into the levels used below, please refer to the Investment Valuation section in the accompanying Notes to Financial Statements.
| | Valuation Inputs at Reporting Date: |
| Description | Total | Level 1 | Level 2 | Level 3 |
| Investments in Securities: | | | | |
| Common Stocks | $432,656,953 | $430,730,735 | $1,926,218 | $-- |
| Money Market Funds | 27,258,517 | 27,258,517 | -- | -- |
| Total Investments in Securities: | $459,915,470 | $457,989,252 | $1,926,218 | $-- |
Other Information
Distribution of investments by country or territory of incorporation, as a percentage of Total Net Assets, is as follows (Unaudited):
| United States of America | 71.3% |
| France | 4.5% |
| Bermuda | 4.1% |
| India | 3.5% |
| Sweden | 3.4% |
| United Kingdom | 3.0% |
| Israel | 2.2% |
| Spain | 1.7% |
| Korea (South) | 1.5% |
| Hong Kong | 1.5% |
| Canada | 1.4% |
| Others (Individually Less Than 1%) | 1.9% |
| | 100.0% |
See accompanying notes which are an integral part of the financial statements.
Wireless Portfolio
Financial Statements
Statement of Assets and Liabilities
| | | August 31, 2020 (Unaudited) |
| Assets | | |
Investment in securities, at value (including securities loaned of $18,043,413) — See accompanying schedule:
Unaffiliated issuers (cost $284,132,132) | $432,656,953 | |
| Fidelity Central Funds (cost $27,258,517) | 27,258,517 | |
| Total Investment in Securities (cost $311,390,649) | | $459,915,470 |
| Receivable for investments sold | | 8,771,358 |
| Receivable for fund shares sold | | 1,434,521 |
| Dividends receivable | | 253,837 |
| Distributions receivable from Fidelity Central Funds | | 11,590 |
| Prepaid expenses | | 2,430 |
| Other receivables | | 46,220 |
| Total assets | | 470,435,426 |
| Liabilities | | |
| Payable for investments purchased | $4,007,296 | |
| Payable for fund shares redeemed | 639,183 | |
| Accrued management fee | 189,069 | |
| Other affiliated payables | 76,121 | |
| Other payables and accrued expenses | 1,397,575 | |
| Collateral on securities loaned | 18,832,609 | |
| Total liabilities | | 25,141,853 |
| Net Assets | | $445,293,573 |
| Net Assets consist of: | | |
| Paid in capital | | $300,027,663 |
| Total accumulated earnings (loss) | | 145,265,910 |
| Net Assets | | $445,293,573 |
| Net Asset Value, offering price and redemption price per share ($445,293,573 ÷ 34,451,880 shares) | | $12.93 |
See accompanying notes which are an integral part of the financial statements.
Statement of Operations
| | | Six months ended August 31, 2020 (Unaudited) |
| Investment Income | | |
| Dividends | | $3,147,252 |
| Income from Fidelity Central Funds (including $38,588 from security lending) | | 41,273 |
| Total income | | 3,188,525 |
| Expenses | | |
| Management fee | $968,106 | |
| Transfer agent fees | 351,938 | |
| Accounting fees | 70,805 | |
| Custodian fees and expenses | 10,514 | |
| Independent trustees' fees and expenses | 1,134 | |
| Registration fees | 39,690 | |
| Audit | 24,791 | |
| Legal | 257 | |
| Miscellaneous | 7,264 | |
| Total expenses before reductions | 1,474,499 | |
| Expense reductions | (75,161) | |
| Total expenses after reductions | | 1,399,338 |
| Net investment income (loss) | | 1,789,187 |
| Realized and Unrealized Gain (Loss) | | |
| Net realized gain (loss) on: | | |
| Investment securities: | | |
| Unaffiliated issuers | (2,576,579) | |
| Fidelity Central Funds | (265) | |
| Foreign currency transactions | (65,778) | |
| Total net realized gain (loss) | | (2,642,622) |
| Change in net unrealized appreciation (depreciation) on: | | |
| Investment securities: | | |
| Unaffiliated issuers (net of increase in deferred foreign taxes of $1,376,210) | 95,930,431 | |
| Assets and liabilities in foreign currencies | 15,756 | |
| Total change in net unrealized appreciation (depreciation) | | 95,946,187 |
| Net gain (loss) | | 93,303,565 |
| Net increase (decrease) in net assets resulting from operations | | $95,092,752 |
See accompanying notes which are an integral part of the financial statements.
Statement of Changes in Net Assets
| | Six months ended August 31, 2020 (Unaudited) | Year ended February 29, 2020 |
| Increase (Decrease) in Net Assets | | |
| Operations | | |
| Net investment income (loss) | $1,789,187 | $4,155,382 |
| Net realized gain (loss) | (2,642,622) | 30,802,567 |
| Change in net unrealized appreciation (depreciation) | 95,946,187 | 19,583,994 |
| Net increase (decrease) in net assets resulting from operations | 95,092,752 | 54,541,943 |
| Distributions to shareholders | (20,242,086) | (9,722,332) |
| Share transactions | | |
| Proceeds from sales of shares | 92,200,421 | 170,798,888 |
| Reinvestment of distributions | 18,946,943 | 9,037,221 |
| Cost of shares redeemed | (96,013,146) | (107,253,657) |
| Net increase (decrease) in net assets resulting from share transactions | 15,134,218 | 72,582,452 |
| Total increase (decrease) in net assets | 89,984,884 | 117,402,063 |
| Net Assets | | |
| Beginning of period | 355,308,689 | 237,906,626 |
| End of period | $445,293,573 | $355,308,689 |
| Other Information | | |
| Shares | | |
| Sold | 8,452,127 | 16,059,963 |
| Issued in reinvestment of distributions | 1,951,281 | 812,700 |
| Redeemed | (9,173,823) | (10,283,730) |
| Net increase (decrease) | 1,229,585 | 6,588,933 |
See accompanying notes which are an integral part of the financial statements.
Financial Highlights
Wireless Portfolio
| | Six months ended (Unaudited) August 31, | Years endedFebruary 28, | | | | |
| | 2020 | 2020 A | 2019 | 2018 | 2017 | 2016 A |
| Selected Per–Share Data | | | | | | |
| Net asset value, beginning of period | $10.69 | $8.93 | $10.29 | $9.11 | $7.85 | $9.54 |
| Income from Investment Operations | | | | | | |
| Net investment income (loss)B | .05 | .14 | .20C | .16 | .10 | .11 |
| Net realized and unrealized gain (loss) | 2.84 | 1.93 | (.24)D | 1.39 | 1.71 | (1.11) |
| Total from investment operations | 2.89 | 2.07 | (.04) | 1.55 | 1.81 | (1.00) |
| Distributions from net investment income | (.01) | (.12) | (.19) | (.14) | (.09) | (.12) |
| Distributions from net realized gain | (.64) | (.19) | (1.13) | (.24) | (.46) | (.57) |
| Total distributions | (.65) | (.31) | (1.32) | (.37)E | (.55) | (.69) |
| Redemption fees added to paid in capitalB | – | – | – | –F | –F | –F |
| Net asset value, end of period | $12.93 | $10.69 | $8.93 | $10.29 | $9.11 | $7.85 |
| Total ReturnG,H | 29.01% | 23.01% | .21%D | 17.21% | 24.09% | (11.07)% |
| Ratios to Average Net AssetsI,J | | | | | | |
| Expenses before reductions | .81%K | .81% | .83% | .83% | .87% | .86% |
| Expenses net of fee waivers, if any | .81%K | .81% | .83% | .83% | .87% | .86% |
| Expenses net of all reductions | .77%K | .81% | .82% | .82% | .86% | .85% |
| Net investment income (loss) | .98%K | 1.39% | 2.07%C | 1.61% | 1.23% | 1.23% |
| Supplemental Data | | | | | | |
| Net assets, end of period (000 omitted) | $445,294 | $355,309 | $237,907 | $275,742 | $239,359 | $207,492 |
| Portfolio turnover rateL | 40%K | 78% | 54% | 85% | 98% | 78% |
A For the year ended February 29.
B Calculated based on average shares outstanding during the period.
C Net investment income per share reflects one or more large, non-recurring dividend(s) which amounted to $.03 per share. Excluding such non-recurring dividend(s), the ratio of net investment income (loss) to average net assets would have been 1.74%.
D Net realized and unrealized gain (loss) per share reflects proceeds received from litigation which amounted to $.01 per share. Excluding these litigation proceeds, the total return would have been .12%.
E Total distributions of $.37 per share is comprised of distributions from net investment income of $.136 and distributions from net realized gain of $.235 per share.
F Amount represents less than $.005 per share.
G Total returns for periods of less than one year are not annualized.
H Total returns would have been lower if certain expenses had not been reduced during the applicable periods shown.
I Fees and expenses of any underlying mutual funds or exchange-traded funds (ETFs) are not included in the Fund's expense ratio. The Fund indirectly bears its proportionate share of these expenses. For additional expense information related to investments in Fidelity Central Funds, please refer to the "Investments in Fidelity Central Funds" note found in the Notes to Financial Statements section of the most recent Annual or Semi-Annual report.
J Expense ratios reflect operating expenses of the class. Expenses before reductions do not reflect amounts reimbursed, waived, or reduced through arrangements with the investment advisor, brokerage services, or other offset arrangements, if applicable, and do not represent the amount paid by the class during periods when reimbursements, waivers or reductions occur.
K Annualized
L Amount does not include the portfolio activity of any underlying Fidelity Central Funds.
See accompanying notes which are an integral part of the financial statements.
Notes to Financial Statements (Unaudited)
For the period ended August 31, 2020
1. Organization.
Wireless Portfolio (the Fund) is a non-diversified fund of Fidelity Select Portfolios (the Trust) and is authorized to issue an unlimited number of shares. Share transactions on the Statement of Changes in Net Assets may contain exchanges between affiliated funds. The Trust is registered under the Investment Company Act of 1940, as amended (the 1940 Act), as an open-end management investment company organized as a Massachusetts business trust. The Fund invests primarily in securities of companies whose principal business activities fall within specific industries.
2. Investments in Fidelity Central Funds.
The Fund invests in Fidelity Central Funds, which are open-end investment companies generally available only to other investment companies and accounts managed by the investment adviser and its affiliates. The Fund's Schedule of Investments lists each of the Fidelity Central Funds held as of period end, if any, as an investment of the Fund, but does not include the underlying holdings of each Fidelity Central Fund. As an Investing Fund, the Fund indirectly bears its proportionate share of the expenses of the underlying Fidelity Central Funds.
The Money Market Central Funds seek preservation of capital and current income and are managed by the investment adviser. Annualized expenses of the Money Market Central Funds as of their most recent shareholder report date ranged from less than .005% to .01%.
A complete unaudited list of holdings for each Fidelity Central Fund is available upon request or at the Securities and Exchange Commission (the SEC) website at www.sec.gov. In addition, the financial statements of the Fidelity Central Funds are available on the SEC website or upon request.
3. Significant Accounting Policies.
The Fund is an investment company and applies the accounting and reporting guidance of the Financial Accounting Standards Board (FASB) Accounting Standards Codification Topic 946 Financial Services – Investment Companies. The financial statements have been prepared in conformity with accounting principles generally accepted in the United States of America (GAAP), which require management to make certain estimates and assumptions at the date of the financial statements. Actual results could differ from those estimates. Subsequent events, if any, through the date that the financial statements were issued have been evaluated in the preparation of the financial statements. The following summarizes the significant accounting policies of the Fund:
Investment Valuation. Investments are valued as of 4:00 p.m. Eastern time on the last calendar day of the period. The Board of Trustees (the Board) has delegated the day to day responsibility for the valuation of the Fund's investments to the Fair Value Committee (the Committee) established by the Fund's investment adviser. In accordance with valuation policies and procedures approved by the Board, the Fund attempts to obtain prices from one or more third party pricing vendors or brokers to value its investments. When current market prices, quotations or currency exchange rates are not readily available or reliable, investments will be fair valued in good faith by the Committee, in accordance with procedures adopted by the Board. Factors used in determining fair value vary by investment type and may include market or investment specific events. The frequency with which these procedures are used cannot be predicted and they may be utilized to a significant extent. The Committee oversees the Fund's valuation policies and procedures and reports to the Board on the Committee's activities and fair value determinations. The Board monitors the appropriateness of the procedures used in valuing the Fund's investments and ratifies the fair value determinations of the Committee.
The Fund categorizes the inputs to valuation techniques used to value its investments into a disclosure hierarchy consisting of three levels as shown below:
- Level 1 – quoted prices in active markets for identical investments
- Level 2 – other significant observable inputs (including quoted prices for similar investments, interest rates, prepayment speeds, etc.)
- Level 3 – unobservable inputs (including the Fund's own assumptions based on the best information available)
Valuation techniques used to value the Fund's investments by major category are as follows:
Equity securities, including restricted securities, for which market quotations are readily available, are valued at the last reported sale price or official closing price as reported by a third party pricing vendor on the primary market or exchange on which they are traded and are categorized as Level 1 in the hierarchy. In the event there were no sales during the day or closing prices are not available, securities are valued at the last quoted bid price or may be valued using the last available price and are generally categorized as Level 2 in the hierarchy. For foreign equity securities, when market or security specific events arise, comparisons to the valuation of American Depositary Receipts (ADRs), futures contracts, Exchange-Traded Funds (ETFs) and certain indexes as well as quoted prices for similar securities may be used and would be categorized as Level 2 in the hierarchy. For equity securities, including restricted securities, where observable inputs are limited, assumptions about market activity and risk are used and these securities may be categorized as Level 3 in the hierarchy.
Investments in open-end mutual funds, including the Fidelity Central Funds, are valued at their closing net asset value (NAV) each business day and are categorized as Level 1 in the hierarchy.
Changes in valuation techniques may result in transfers in or out of an assigned level within the disclosure hierarchy. The aggregate value of investments by input level as of August 31, 2020 is included at the end of the Fund's Schedule of Investments.
Foreign Currency. Certain Funds may use foreign currency contracts to facilitate transactions in foreign-denominated securities. Gains and losses from these transactions may arise from changes in the value of the foreign currency or if the counterparties do not perform under the contracts' terms.
Foreign-denominated assets, including investment securities, and liabilities are translated into U.S. dollars at the exchange rates at period end. Purchases and sales of investment securities, income and dividends received, and expenses denominated in foreign currencies are translated into U.S. dollars at the exchange rate in effect on the transaction date.
The effects of exchange rate fluctuations on investments are included with the net realized and unrealized gain (loss) on investment securities. Other foreign currency transactions resulting in realized and unrealized gain (loss) are disclosed separately.
Investment Transactions and Income. For financial reporting purposes, the Fund's investment holdings and NAV include trades executed through the end of the last business day of the period. The NAV per share for processing shareholder transactions is calculated as of the close of business of the New York Stock Exchange (NYSE), normally 4:00 p.m. Eastern time and includes trades executed through the end of the prior business day. Gains and losses on securities sold are determined on the basis of identified cost and include proceeds received from litigation. Dividend income is recorded on the ex-dividend date, except for certain dividends from foreign securities where the ex-dividend date may have passed, which are recorded as soon as the Fund is informed of the ex-dividend date. Non-cash dividends included in dividend income, if any, are recorded at the fair market value of the securities received. Income and capital gain distributions from Fidelity Central Funds, if any, are recorded on the ex-dividend date. Certain distributions received by the Fund represent a return of capital or capital gain. The Fund determines the components of these distributions subsequent to the ex-dividend date, based upon receipt of tax filings or other correspondence relating to the underlying investment. These distributions are recorded as a reduction of cost of investments and/or as a realized gain. Investment income is recorded net of foreign taxes withheld where recovery of such taxes is uncertain.
Expenses. Expenses directly attributable to a fund are charged to that fund. Expenses attributable to more than one fund are allocated among the respective funds on the basis of relative net assets or other appropriate methods. Expense estimates are accrued in the period to which they relate and adjustments are made when actual amounts are known.
Income Tax Information and Distributions to Shareholders. Each year, the Fund intends to qualify as a regulated investment company under Subchapter M of the Internal Revenue Code, including distributing substantially all of its taxable income and realized gains. As a result, no provision for U.S. Federal income taxes is required. The Fund files a U.S. federal tax return, in addition to state and local tax returns as required. The Fund's federal income tax returns are subject to examination by the Internal Revenue Service (IRS) for a period of three fiscal years after they are filed. State and local tax returns may be subject to examination for an additional fiscal year depending on the jurisdiction. Foreign taxes are provided for based on the Fund's understanding of the tax rules and rates that exist in the foreign markets in which it invests. The Fund is subject to a tax imposed on capital gains by certain countries in which it invests. An estimated deferred tax liability for net unrealized appreciation on the applicable securities is included in Other payables and accrued expenses on the Statement of Assets & Liabilities.
Distributions are declared and recorded on the ex-dividend date. Income and capital gain distributions are determined in accordance with income tax regulations, which may differ from GAAP.
Capital accounts within the financial statements are adjusted for permanent book-tax differences. These adjustments have no impact on net assets or the results of operations. Capital accounts are not adjusted for temporary book-tax differences which will reverse in a subsequent period.
Book-tax differences are primarily due to foreign currency transactions and losses deferred due to wash sales and excise tax regulations.
As of period end, the cost and unrealized appreciation (depreciation) in securities, and derivatives if applicable, for federal income tax purposes were as follows:
| Gross unrealized appreciation | $173,590,992 |
| Gross unrealized depreciation | (27,418,368) |
| Net unrealized appreciation (depreciation) | $146,172,624 |
| Tax cost | $313,742,846 |
4. Purchases and Sales of Investments.
Purchases and sales of securities, other than short-term securities, are noted in the table below.
| | Purchases ($) | Sales ($) |
| Wireless Portfolio | 73,160,971 | 90,984,522 |
5. Fees and Other Transactions with Affiliates.
Management Fee. Fidelity Management & Research Company LLC (the investment adviser) and its affiliates provide the Fund with investment management related services for which the Fund pays a monthly management fee. The management fee is the sum of an individual fund fee rate that is based on an annual rate of .30% of the Fund's average net assets and an annualized group fee rate that averaged .23% during the period. The group fee rate is based upon the monthly average net assets of a group of registered investment companies with which the investment adviser has management contracts. The group fee rate decreases as assets under management increase and increases as assets under management decrease. For the reporting period, the total annualized management fee rate was .53% of the Fund's average net assets.
Transfer Agent Fees. Fidelity Investments Institutional Operations Company LLC (FIIOC), an affiliate of the investment adviser, is the Fund's transfer, dividend disbursing and shareholder servicing agent. FIIOC receives account fees and asset-based fees that vary according to account size and type of account. FIIOC pays for typesetting, printing and mailing of shareholder reports, except proxy statements. For the period, the transfer agent fees were equivalent to an annualized rate of .19% of average net assets.
Accounting Fees. Fidelity Service Company, Inc. (FSC), an affiliate of the investment adviser, maintains the Fund's accounting records. The accounting fee is based on the level of average net assets for each month. For the period, the fees were equivalent to the following annualized rates:
| | % of Average Net Assets |
| Wireless Portfolio | .04 |
Brokerage Commissions. A portion of portfolio transactions were placed with brokerage firms which are affiliates of the investment adviser. Brokerage commissions are included in net realized gain (loss) and change in net unrealized appreciation (depreciation) in the Statement of Operations. The commissions paid to these affiliated firms were as follows:
| | Amount |
| Wireless Portfolio | $2,425 |
Interfund Trades. Funds may purchase from or sell securities to other Fidelity Funds under procedures adopted by the Board. The procedures have been designed to ensure these interfund trades are executed in accordance with Rule 17a-7 of the 1940 Act. Interfund trades are included within the respective purchases and sales amounts shown in the Purchases and Sales of Investments note.
6. Committed Line of Credit.
Certain Funds participate with other funds managed by the investment adviser or an affiliate in a $4.25 billion credit facility (the "line of credit") to be utilized for temporary or emergency purposes to fund shareholder redemptions or for other short-term liquidity purposes. The participating funds have agreed to pay commitment fees on their pro-rata portion of the line of credit, which are reflected in Miscellaneous expenses on the Statement of Operations, and are as follows:
| | Amount |
| Wireless Portfolio | $445 |
During the period, there were no borrowings on this line of credit.
7. Security Lending.
The Fund lends portfolio securities from time to time in order to earn additional income. Lending agents are used, including National Financial Services (NFS), an affiliate of the Fund. Pursuant to a securities lending agreement, NFS will receive a fee, which is capped at 9.9% of daily lending revenue, for its services as lending agent. The Fund may lend securities to certain qualified borrowers, including NFS. On the settlement date of the loan, the Fund receives collateral (in the form of U.S. Treasury obligations, letters of credit and/or cash) against the loaned securities and maintains collateral in an amount not less than 100% of the market value of the loaned securities during the period of the loan. The market value of the loaned securities is determined at the close of business of the Fund and any additional required collateral is delivered to the Fund on the next business day. The Fund or borrower may terminate the loan at any time, and if the borrower defaults on its obligation to return the securities loaned because of insolvency or other reasons, the Fund may apply collateral received from the borrower against the obligation. The Fund may experience delays and costs in recovering the securities loaned. Any cash collateral received is invested in the Fidelity Securities Lending Cash Central Fund. The value of loaned securities and cash collateral at period end are disclosed on the Fund's Statement of Assets and Liabilities. Total fees paid by the Fund to NFS, as lending agent, amounted to $2,439. Security lending income represents the income earned on investing cash collateral, less rebates paid to borrowers and any lending agent fees associated with the loan, plus any premium payments received for lending certain types of securities. Net income from the Fidelity Securities Lending Cash Central Fund during the period is presented in the Statement of Operations as a component of income from Fidelity Central Funds. During the period, there were no securities loaned to NFS.
8. Expense Reductions.
Commissions paid to certain brokers with whom the investment adviser, or its affiliates, places trades on behalf of the Fund include an amount in addition to trade execution, which may be rebated back to the Fund to offset certain expenses. This amount totaled $74,455 for the period.
In addition, during the period the investment adviser or an affiliate reimbursed and/or waived a portion of operating expenses in the amount of $706.
9. Other.
The Fund's organizational documents provide former and current trustees and officers with a limited indemnification against liabilities arising in connection with the performance of their duties to the Fund. In the normal course of business, the Fund may also enter into contracts that provide general indemnifications. The Fund's maximum exposure under these arrangements is unknown as this would be dependent on future claims that may be made against the Fund. The risk of material loss from such claims is considered remote.
10. Coronavirus (COVID-19) Pandemic.
An outbreak of COVID-19 first detected in China during December 2019 has since spread globally and was declared a pandemic by the World Health Organization during March 2020. Developments that disrupt global economies and financial markets, such as the COVID-19 pandemic, may magnify factors that affect the Fund's performance.
Shareholder Expense Example
As a shareholder, you incur two types of costs: (1) transaction costs, which may include sales charges (loads) on purchase payments or redemption proceeds, as applicable and (2) ongoing costs, which generally include management fees, distribution and/or service (12b-1) fees and other Fund expenses. This Example is intended to help you understand your ongoing costs (in dollars) of investing in a fund and to compare these costs with the ongoing costs of investing in other mutual funds.
The Example is based on an investment of $1,000 invested at the beginning of the period and held for the entire period (March 1, 2020 to August 31, 2020).
Actual Expenses
The first line of the accompanying table provides information about actual account values and actual expenses. You may use the information in this line, together with the amount you invested, to estimate the expenses that you paid over the period. Simply divide your account value by $1,000.00 (for example, an $8,600 account value divided by $1,000.00 = 8.6), then multiply the result by the number in the first line for a class/Fund under the heading entitled "Expenses Paid During Period" to estimate the expenses you paid on your account during this period. If any fund is a shareholder of any underlying mutual funds or exchange-traded funds (ETFs) (the Underlying Funds), such fund indirectly bears its proportional share of the expenses of the Underlying Funds in addition to the direct expenses incurred presented in the table. These fees and expenses are not included in the annualized expense ratio used to calculate the expense estimate in the table below.
Hypothetical Example for Comparison Purposes
The second line of the accompanying table provides information about hypothetical account values and hypothetical expenses based on the actual expense ratio and an assumed rate of return of 5% per year before expenses, which is not the actual return. The hypothetical account values and expenses may not be used to estimate the actual ending account balance or expenses you paid for the period. You may use this information to compare the ongoing costs of investing in the Fund and other funds. To do so, compare this 5% hypothetical example with the 5% hypothetical examples that appear in the shareholder reports of the other funds. If any fund is a shareholder of any Underlying Funds, such fund indirectly bears its proportional share of the expenses of the Underlying Funds in addition to the direct expenses as presented in the table. These fees and expenses are not included in the annualized expense ratio used to calculate the expense estimate in the table below.
Please note that the expenses shown in the table are meant to highlight your ongoing costs only and do not reflect any transaction costs. Therefore, the second line of the table is useful in comparing ongoing costs only, and will not help you determine the relative total costs of owning different funds. In addition, if these transactional costs were included, your costs would have been higher.
| | Annualized Expense Ratio-A | Beginning
Account Value
March 1, 2020 | Ending
Account Value
August 31, 2020 | Expenses Paid
During Period-B
March 1, 2020
to August 31, 2020 |
| Telecommunications Portfolio | | | | |
| Class A | 1.13% | | | |
| Actual | | $1,000.00 | $1,155.20 | $6.14 |
| Hypothetical-C | | $1,000.00 | $1,019.51 | $5.75 |
| Class M | 1.41% | | | |
| Actual | | $1,000.00 | $1,153.70 | $7.65 |
| Hypothetical-C | | $1,000.00 | $1,018.10 | $7.17 |
| Class C | 1.87% | | | |
| Actual | | $1,000.00 | $1,151.10 | $10.14 |
| Hypothetical-C | | $1,000.00 | $1,015.78 | $9.50 |
| Telecommunications | .82% | | | |
| Actual | | $1,000.00 | $1,157.20 | $4.46 |
| Hypothetical-C | | $1,000.00 | $1,021.07 | $4.18 |
| Class I | .80% | | | |
| Actual | | $1,000.00 | $1,157.40 | $4.35 |
| Hypothetical-C | | $1,000.00 | $1,021.17 | $4.08 |
| Class Z | .68% | | | |
| Actual | | $1,000.00 | $1,158.10 | $3.70 |
| Hypothetical-C | | $1,000.00 | $1,021.78 | $3.47 |
| Wireless Portfolio | .81% | | | |
| Actual | | $1,000.00 | $1,290.10 | $4.68 |
| Hypothetical-C | | $1,000.00 | $1,021.12 | $4.13 |
A Annualized expense ratio reflects expenses net of applicable fee waivers.
B Expenses are equal to the annualized expense ratio, multiplied by the average account value over the period, multiplied by 184/ 365 (to reflect the one-half year period). The fees and expenses of any Underlying Funds are not included in each annualized expense ratio.
C 5% return per year before expenses
Proxy Voting Results
A special meeting of shareholders was held on June 9, 2020. The results of votes taken among shareholders on the proposal before them are reported below. Each vote reported represents one dollar of net asset value held on the record date for the meeting.
PROPOSAL 1
To elect a Board of Trustees.
| | # of
Votes | % of
Votes |
| Dennis J. Dirks |
| Affirmative | 32,463,705,305.665 | 92.437 |
| Withheld | 2,655,951,104.308 | 7.563 |
| TOTAL | 35,119,656,409.973 | 100.000 |
| Donald F. Donahue |
| Affirmative | 32,446,843,861.354 | 92.389 |
| Withheld | 2,672,812,548.619 | 7.611 |
| TOTAL | 35,119,656,409.973 | 100.000 |
| Bettina Doulton |
| Affirmative | 32,610,463,757.584 | 92.855 |
| Withheld | 2,509,192,652.389 | 7.145 |
| TOTAL | 35,119,656,409.973 | 100.000 |
| Vicki L. Fuller |
| Affirmative | 32,688,213,522.720 | 93.077 |
| Withheld | 2,431,442,887.253 | 6.923 |
| TOTAL | 35,119,656,409.973 | 100.000 |
| Patricia L. Kampling |
| Affirmative | 32,313,755,598.535 | 92.010 |
| Withheld | 2,805,900,811.438 | 7.990 |
| TOTAL | 35,119,656,409.973 | 100.000 |
| Alan J. Lacy |
| Affirmative | 31,990,158,754.948 | 91.089 |
| Withheld | 3,129,497,655.026 | 8.911 |
| TOTAL | 35,119,656,409.973 | 100.000 |
| Ned C. Lautenbach |
| Affirmative | 32,043,019,991.143 | 91.240 |
| Withheld | 3,076,636,418.830 | 8.760 |
| TOTAL | 35,119,656,409.973 | 100.000 |
| Robert A. Lawrence |
| Affirmative | 32,150,842,398.009 | 91.547 |
| Withheld | 2,968,814,011.965 | 8.453 |
| TOTAL | 35,119,656,409.973 | 100.000 |
| Joseph Mauriello |
| Affirmative | 32,082,201,213.166 | 91.351 |
| Withheld | 3,037,455,196.807 | 8.649 |
| TOTAL | 35,119,656,409.973 | 100.000 |
| Cornelia M. Small |
| Affirmative | 32,207,976,835.934 | 91.709 |
| Withheld | 2,911,679,574.039 | 8.291 |
| TOTAL | 35,119,656,409.973 | 100.000 |
| Garnett A. Smith |
| Affirmative | 32,102,654,343.096 | 91.409 |
| Withheld | 3,017,002,066.877 | 8.591 |
| TOTAL | 35,119,656,409.973 | 100.000 |
| David M. Thomas |
| Affirmative | 32,150,749,424.556 | 91.546 |
| Withheld | 2,968,906,985.418 | 8.454 |
| TOTAL | 35,119,656,409.973 | 100.000 |
| Susan Tomasky |
| Affirmative | 32,381,933,484.515 | 92.205 |
| Withheld | 2,737,722,925.459 | 7.795 |
| TOTAL | 35,119,656,409.973 | 100.000 |
| Michael E. Wiley |
| Affirmative | 32,135,064,741.973 | 91.502 |
| Withheld | 2,984,591,668.000 | 8.498 |
| TOTAL | 35,119,656,409.973 | 100.000 |
|
| Proposal 1 reflects trust wide proposal and voting results. |
SELTS-SANN-1020
1.846053.113
Fidelity® Select Portfolios®
Information Technology Sector
Communications Equipment Portfolio
Computers Portfolio
IT Services Portfolio
Semiconductors Portfolio
Software and IT Services Portfolio
Technology Portfolio
Semi-Annual Report
August 31, 2020
See the inside front cover for important information about access to your fund’s shareholder reports.
Beginning on January 1, 2021, as permitted by regulations adopted by the Securities and Exchange Commission, paper copies of a fund’s shareholder reports will no longer be sent by mail, unless you specifically request paper copies of the reports from the fund or from your financial intermediary, such as a financial advisor, broker-dealer or bank. Instead, the reports will be made available on a website, and you will be notified by mail each time a report is posted and provided with a website link to access the report.
If you already elected to receive shareholder reports electronically, you will not be affected by this change and you need not take any action. You may elect to receive shareholder reports and other communications from a fund electronically, by contacting your financial intermediary. For Fidelity customers, visit Fidelity's web site or call Fidelity using the contact information listed below.
You may elect to receive all future reports in paper free of charge. If you wish to continue receiving paper copies of your shareholder reports, you may contact your financial intermediary or, if you are a Fidelity customer, visit Fidelity’s website, or call Fidelity at the applicable toll-free number listed below. Your election to receive reports in paper will apply to all funds held with the fund complex/your financial intermediary.
| Account Type | Website | Phone Number |
| Brokerage, Mutual Fund, or Annuity Contracts: | fidelity.com/mailpreferences | 1-800-343-3548 |
| Employer Provided Retirement Accounts: | netbenefits.fidelity.com/preferences (choose 'no' under Required Disclosures to continue to print) | 1-800-343-0860 |
| Advisor Sold Accounts Serviced Through Your Financial Intermediary: | Contact Your Financial Intermediary | Your Financial Intermediary's phone number |
| Advisor Sold Accounts Serviced by Fidelity: | institutional.fidelity.com | 1-877-208-0098 |
Contents
To view a fund's proxy voting guidelines and proxy voting record for the 12-month period ended June 30, visit http://www.fidelity.com/proxyvotingresults or visit the Securities and Exchange Commission's (SEC) web site at http://www.sec.gov.
You may also call 1-800-544-8544 to request a free copy of the proxy voting guidelines.
Standard & Poor's, S&P and S&P 500 are registered service marks of The McGraw-Hill Companies, Inc. and have been licensed for use by Fidelity Distributors Corporation.
Other third-party marks appearing herein are the property of their respective owners.
All other marks appearing herein are registered or unregistered trademarks or service marks of FMR LLC or an affiliated company. © 2020 FMR LLC. All rights reserved.
This report and the financial statements contained herein are submitted for the general information of the shareholders of the Funds. This report is not authorized for distribution to prospective investors in the Funds unless preceded or accompanied by an effective prospectus.
A fund files its complete schedule of portfolio holdings with the SEC for the first and third quarters of each fiscal year on Form N-PORT. Forms N-PORT are available on the SEC’s web site at http://www.sec.gov. A fund's Forms N-PORT may be reviewed and copied at the SEC’s Public Reference Room in Washington, DC. Information regarding the operation of the SEC's Public Reference Room may be obtained by calling 1-800-SEC-0330.
For a complete list of a fund's portfolio holdings, view the most recent holdings listing, semiannual report, or annual report on Fidelity's web site at http://www.fidelity.com, http://www.institutional.fidelity.com, or http://www.401k.com, as applicable.
NOT FDIC INSURED •MAY LOSE VALUE •NO BANK GUARANTEE
Neither the Funds nor Fidelity Distributors Corporation is a bank.
Note to Shareholders:
Early in 2020, the outbreak and spread of a new coronavirus emerged as a public health emergency that had a major influence on financial markets, primarily based on its impact on the global economy and the outlook for corporate earnings. The virus causes a respiratory disease known as COVID-19. On March 11, the World Health Organization declared the COVID-19 outbreak a pandemic, citing sustained risk of further global spread.
In the weeks following, as the crisis worsened, we witnessed an escalating human tragedy with wide-scale social and economic consequences from coronavirus-containment measures. The outbreak of COVID-19 prompted a number of measures to limit the spread, including travel and border restrictions, quarantines, and restrictions on large gatherings. In turn, these resulted in lower consumer activity, diminished demand for a wide range of products and services, disruption in manufacturing and supply chains, and – given the wide variability in outcomes regarding the outbreak – significant market uncertainty and volatility. Amid the turmoil, the U.S. government took unprecedented action – in concert with the U.S. Federal Reserve and central banks around the world – to help support consumers, businesses, and the broader economy, and to limit disruption to the financial system.
The situation continues to unfold, and the extent and duration of its impact on financial markets and the economy remain highly uncertain. Extreme events such as the coronavirus crisis are “exogenous shocks” that can have significant adverse effects on mutual funds and their investments. Although multiple asset classes may be affected by market disruption, the duration and impact may not be the same for all types of assets.
Fidelity is committed to helping you stay informed amid news about COVID-19 and during increased market volatility, and we’re taking extra steps to be responsive to customer needs. We encourage you to visit our websites, where we offer ongoing updates, commentary, and analysis on the markets and our funds.
Communications Equipment Portfolio
Investment Summary (Unaudited)
Top Ten Stocks as of August 31, 2020
| | % of fund's net assets |
| Ericsson (B Shares) sponsored ADR | 22.4 |
| Cisco Systems, Inc. | 17.3 |
| Nokia Corp. sponsored ADR | 6.2 |
| F5 Networks, Inc. | 5.0 |
| Ciena Corp. | 4.8 |
| Juniper Networks, Inc. | 4.8 |
| Motorola Solutions, Inc. | 4.5 |
| Lumentum Holdings, Inc. | 3.5 |
| EchoStar Holding Corp. Class A | 3.0 |
| Viavi Solutions, Inc. | 3.0 |
| | 74.5 |
Top Industries (% of fund's net assets)
| As of August 31, 2020 |
| | Communications Equipment | 92.9% |
| | Software | 5.6% |
| | Electronic Equipment & Components | 1.1% |
| | IT Services | 0.4% |

Communications Equipment Portfolio
Schedule of Investments August 31, 2020 (Unaudited)
Showing Percentage of Net Assets
| Common Stocks - 100.0% | | | |
| | | Shares | Value |
| Communications Equipment - 92.9% | | | |
| Communications Equipment - 92.9% | | | |
| Acacia Communications, Inc. (a) | | 64,446 | $4,348,816 |
| ADTRAN, Inc. | | 81,825 | 907,439 |
| Arista Networks, Inc. (a) | | 15,371 | 3,434,650 |
| Calix Networks, Inc. (a) | | 171,619 | 3,337,990 |
| Casa Systems, Inc. (a) | | 49,003 | 222,964 |
| Ciena Corp. (a) | | 127,319 | 7,227,900 |
| Cisco Systems, Inc. | | 617,614 | 26,075,663 |
| CommScope Holding Co., Inc. (a) | | 193,714 | 1,995,254 |
| EchoStar Holding Corp. Class A (a) | | 156,578 | 4,600,262 |
| Ericsson (B Shares) sponsored ADR (b) | | 2,904,956 | 33,842,735 |
| Evertz Technologies Ltd. | | 45,496 | 414,726 |
| Extreme Networks, Inc. (a) | | 202,678 | 885,703 |
| F5 Networks, Inc. (a) | | 56,662 | 7,498,082 |
| Harmonic, Inc. (a) | | 163,768 | 966,231 |
| Inseego Corp. (a)(b) | | 75,731 | 869,392 |
| InterDigital, Inc. | | 54,324 | 3,321,913 |
| Juniper Networks, Inc. | | 287,529 | 7,188,225 |
| Lumentum Holdings, Inc. (a) | | 60,938 | 5,240,668 |
| Motorola Solutions, Inc. | | 43,456 | 6,724,816 |
| NetScout Systems, Inc. (a) | | 124,959 | 2,891,551 |
| Nokia Corp. sponsored ADR (b) | | 1,902,290 | 9,321,221 |
| Radware Ltd. (a) | | 8 | 207 |
| Sierra Wireless, Inc. (a) | | 64,211 | 797,007 |
| Sonus Networks, Inc. (a) | | 102,327 | 437,960 |
| ViaSat, Inc. (a)(b) | | 77,068 | 3,064,224 |
| Viavi Solutions, Inc. (a) | | 334,169 | 4,456,144 |
| | | | 140,071,743 |
| Electronic Equipment & Components - 1.1% | | | |
| Electronic Components - 1.1% | | | |
| Corning, Inc. | | 49,900 | 1,619,754 |
| IT Services - 0.4% | | | |
| Internet Services & Infrastructure - 0.4% | | | |
| Rackspace Technology, Inc. (a)(b) | | 25,600 | 546,560 |
| Software - 5.6% | | | |
| Application Software - 0.0% | | | |
| Citrix Systems, Inc. | | 13 | 1,888 |
| Systems Software - 5.6% | | | |
| Cloudflare, Inc. (a) | | 39,413 | 1,507,941 |
| CommVault Systems, Inc. (a) | | 29,230 | 1,263,613 |
| Fortinet, Inc. (a) | | 3,100 | 409,216 |
| Palo Alto Networks, Inc. (a) | | 6,000 | 1,544,460 |
| Ping Identity Holding Corp. (a) | | 48,500 | 1,671,795 |
| Rapid7, Inc. (a) | | 13,098 | 845,738 |
| Tenable Holdings, Inc. (a) | | 34,000 | 1,279,760 |
| | | | 8,522,523 |
|
| TOTAL SOFTWARE | | | 8,524,411 |
|
| TOTAL COMMON STOCKS | | | |
| (Cost $110,852,746) | | | 150,762,468 |
|
| Money Market Funds - 14.2% | | | |
| Fidelity Cash Central Fund 0.12% (c) | | 368,548 | 368,622 |
| Fidelity Securities Lending Cash Central Fund 0.11% (c)(d) | | 21,072,481 | 21,074,589 |
| TOTAL MONEY MARKET FUNDS | | | |
| (Cost $21,443,211) | | | 21,443,211 |
| TOTAL INVESTMENT IN SECURITIES - 114.2% | | | |
| (Cost $132,295,957) | | | 172,205,679 |
| NET OTHER ASSETS (LIABILITIES) - (14.2)% | | | (21,417,025) |
| NET ASSETS - 100% | | | $150,788,654 |
Legend
(a) Non-income producing
(b) Security or a portion of the security is on loan at period end.
(c) Affiliated fund that is generally available only to investment companies and other accounts managed by Fidelity Investments. The rate quoted is the annualized seven-day yield of the fund at period end. A complete unaudited listing of the fund's holdings as of its most recent quarter end is available upon request. In addition, each Fidelity Central Fund's financial statements are available on the SEC's website or upon request.
(d) Investment made with cash collateral received from securities on loan.
Affiliated Central Funds
Information regarding fiscal year to date income earned by the Fund from investments in Fidelity Central Funds is as follows:
| Fund | Income earned |
| Fidelity Cash Central Fund | $3,638 |
| Fidelity Securities Lending Cash Central Fund | 71,855 |
| Total | $75,493 |
Amounts in the income column in the above table include any capital gain distributions from underlying funds, which are presented in the corresponding line-item in the Statement of Operations, if applicable. Amount for Fidelity Securities Lending Cash Central Fund represents the income earned on investing cash collateral, less rebates paid to borrowers and any lending agent fees associated with the loan, plus any premium payments received for lending certain types of securities.
The value, beginning of period, for the Fidelity Securities Lending Cash Central Fund was $4,504,391. Net realized gain (loss) and change in net unrealized appreciation (depreciation) was $208 and $0. Purchases and sales of the Fidelity Securities Lending Cash Central Fund were $94,131,096 and $77,561,106, respectively, during the period.
Investment Valuation
The following is a summary of the inputs used, as of August 31, 2020, involving the Fund's assets and liabilities carried at fair value. The inputs or methodology used for valuing securities may not be an indication of the risk associated with investing in those securities. For more information on valuation inputs, and their aggregation into the levels used below, please refer to the Investment Valuation section in the accompanying Notes to Financial Statements.
| | Valuation Inputs at Reporting Date: |
| Description | Total | Level 1 | Level 2 | Level 3 |
| Investments in Securities: | | | | |
| Common Stocks | $150,762,468 | $150,762,468 | $-- | $-- |
| Money Market Funds | 21,443,211 | 21,443,211 | -- | -- |
| Total Investments in Securities: | $172,205,679 | $172,205,679 | $-- | $-- |
Other Information
Distribution of investments by country or territory of incorporation, as a percentage of Total Net Assets, is as follows (Unaudited):
| United States of America | 70.6% |
| Sweden | 22.4% |
| Finland | 6.2% |
| Others (Individually Less Than 1%) | 0.8% |
| | 100.0% |
See accompanying notes which are an integral part of the financial statements.
Communications Equipment Portfolio
Financial Statements
Statement of Assets and Liabilities
| | | August 31, 2020 (Unaudited) |
| Assets | | |
Investment in securities, at value (including securities loaned of $20,448,615) — See accompanying schedule:
Unaffiliated issuers (cost $110,852,746) | $150,762,468 | |
| Fidelity Central Funds (cost $21,443,211) | 21,443,211 | |
| Total Investment in Securities (cost $132,295,957) | | $172,205,679 |
| Receivable for fund shares sold | | 18,197 |
| Dividends receivable | | 75,849 |
| Distributions receivable from Fidelity Central Funds | | 34,702 |
| Prepaid expenses | | 1,462 |
| Other receivables | | 12,548 |
| Total assets | | 172,348,437 |
| Liabilities | | |
| Payable for fund shares redeemed | $367,652 | |
| Accrued management fee | 68,414 | |
| Other affiliated payables | 32,198 | |
| Other payables and accrued expenses | 17,194 | |
| Collateral on securities loaned | 21,074,325 | |
| Total liabilities | | 21,559,783 |
| Net Assets | | $150,788,654 |
| Net Assets consist of: | | |
| Paid in capital | | $116,407,846 |
| Total accumulated earnings (loss) | | 34,380,808 |
| Net Assets | | $150,788,654 |
| Net Asset Value, offering price and redemption price per share ($150,788,654 ÷ 4,299,226 shares) | | $35.07 |
See accompanying notes which are an integral part of the financial statements.
Statement of Operations
| | | Six months ended August 31, 2020 (Unaudited) |
| Investment Income | | |
| Dividends | | $871,342 |
| Income from Fidelity Central Funds (including $71,855 from security lending) | | 75,493 |
| Total income | | 946,835 |
| Expenses | | |
| Management fee | $378,755 | |
| Transfer agent fees | 161,995 | |
| Accounting fees | 27,697 | |
| Custodian fees and expenses | 5,976 | |
| Independent trustees' fees and expenses | 466 | |
| Registration fees | 10,779 | |
| Audit | 17,805 | |
| Legal | 111 | |
| Miscellaneous | 4,150 | |
| Total expenses before reductions | 607,734 | |
| Expense reductions | (38,959) | |
| Total expenses after reductions | | 568,775 |
| Net investment income (loss) | | 378,060 |
| Realized and Unrealized Gain (Loss) | | |
| Net realized gain (loss) on: | | |
| Investment securities: | | |
| Unaffiliated issuers | (2,700,300) | |
| Fidelity Central Funds | 195 | |
| Foreign currency transactions | (353) | |
| Total net realized gain (loss) | | (2,700,458) |
| Change in net unrealized appreciation (depreciation) on investment securities | | 19,334,950 |
| Net gain (loss) | | 16,634,492 |
| Net increase (decrease) in net assets resulting from operations | | $17,012,552 |
See accompanying notes which are an integral part of the financial statements.
Statement of Changes in Net Assets
| | Six months ended August 31, 2020 (Unaudited) | Year ended February 29, 2020 |
| Increase (Decrease) in Net Assets | | |
| Operations | | |
| Net investment income (loss) | $378,060 | $969,116 |
| Net realized gain (loss) | (2,700,458) | 4,124,762 |
| Change in net unrealized appreciation (depreciation) | 19,334,950 | (42,282,905) |
| Net increase (decrease) in net assets resulting from operations | 17,012,552 | (37,189,027) |
| Distributions to shareholders | (68,201) | (9,589,306) |
| Share transactions | | |
| Proceeds from sales of shares | 4,448,433 | 43,801,317 |
| Reinvestment of distributions | 63,888 | 9,043,238 |
| Cost of shares redeemed | (15,805,447) | (79,873,603) |
| Net increase (decrease) in net assets resulting from share transactions | (11,293,126) | (27,029,048) |
| Total increase (decrease) in net assets | 5,651,225 | (73,807,381) |
| Net Assets | | |
| Beginning of period | 145,137,429 | 218,944,810 |
| End of period | $150,788,654 | $145,137,429 |
| Other Information | | |
| Shares | | |
| Sold | 142,373 | 1,090,635 |
| Issued in reinvestment of distributions | 2,120 | 241,125 |
| Redeemed | (503,061) | (2,098,473) |
| Net increase (decrease) | (358,568) | (766,713) |
See accompanying notes which are an integral part of the financial statements.
Financial Highlights
Communications Equipment Portfolio
| | Six months ended (Unaudited) August 31, | Years endedFebruary 28, | | | | |
| | 2020 | 2020 A | 2019 | 2018 | 2017 | 2016 A |
| Selected Per–Share Data | | | | | | |
| Net asset value, beginning of period | $31.16 | $40.36 | $39.13 | $34.12 | $26.71 | $32.99 |
| Income from Investment Operations | | | | | | |
| Net investment income (loss)B | .08 | .19 | .25 | .17 | .38 | .31 |
| Net realized and unrealized gain (loss) | 3.85 | (7.51) | 3.76 | 5.45C | 7.39 | (5.64) |
| Total from investment operations | 3.93 | (7.32) | 4.01 | 5.62 | 7.77 | (5.33) |
| Distributions from net investment income | (.02) | (.20) | (.17)D | (.33) | (.36) | (.30) |
| Distributions from net realized gain | – | (1.69) | (2.61)D | (.28) | – | (.65) |
| Total distributions | (.02) | (1.88)E | (2.78) | (.61) | (.36) | (.95) |
| Redemption fees added to paid in capitalB | – | – | – | –F | –F | –F |
| Net asset value, end of period | $35.07 | $31.16 | $40.36 | $39.13 | $34.12 | $26.71 |
| Total ReturnG,H | 12.60% | (18.84)% | 11.11% | 16.71%C | 29.24% | (16.38)% |
| Ratios to Average Net AssetsI,J | | | | | | |
| Expenses before reductions | .85%K | .83% | .84% | .85% | .88% | .90% |
| Expenses net of fee waivers, if any | .85%K | .83% | .84% | .85% | .88% | .89% |
| Expenses net of all reductions | .80%K | .82% | .83% | .85% | .88% | .89% |
| Net investment income (loss) | .53%K | .50% | .66% | .48% | 1.27% | 1.04% |
| Supplemental Data | | | | | | |
| Net assets, end of period (000 omitted) | $150,789 | $145,137 | $218,945 | $209,178 | $204,651 | $169,455 |
| Portfolio turnover rateL | 177%K | 108% | 71% | 56% | 38% | 30% |
A For the year ended February 29.
B Calculated based on average shares outstanding during the period.
C Net realized and unrealized gain (loss) per share reflects proceeds received from litigation which amounted to $.01 per share. Excluding these litigation proceeds, the total return would have been 16.67%.
D The amounts shown reflect certain reclassifications related to book to tax differences that were made in the year shown.
E Total distributions of $1.88 per share is comprised of distributions from net investment income of $.197 and distributions from net realized gain of $1.687 per share.
F Amount represents less than $.005 per share.
G Total returns for periods of less than one year are not annualized.
H Total returns would have been lower if certain expenses had not been reduced during the applicable periods shown.
I Fees and expenses of any underlying mutual funds or exchange-traded funds (ETFs) are not included in the Fund's expense ratio. The Fund indirectly bears its proportionate share of these expenses. For additional expense information related to investments in Fidelity Central Funds, please refer to the "Investments in Fidelity Central Funds" note found in the Notes to Financial Statements section of the most recent Annual or Semi-Annual report.
J Expense ratios reflect operating expenses of the class. Expenses before reductions do not reflect amounts reimbursed, waived, or reduced through arrangements with the investment advisor, brokerage services, or other offset arrangements, if applicable, and do not represent the amount paid by the class during periods when reimbursements, waivers or reductions occur.
K Annualized
L Amount does not include the portfolio activity of any underlying Fidelity Central Funds.
See accompanying notes which are an integral part of the financial statements.
Computers Portfolio
Investment Summary (Unaudited)
Top Ten Stocks as of August 31, 2020
| | % of fund's net assets |
| Apple, Inc. | 21.8 |
| Sony Corp. | 15.9 |
| Samsung Electronics Co. Ltd. | 11.4 |
| Xiaomi Corp. Class B | 4.9 |
| Dell Technologies, Inc. | 4.9 |
| Logitech International SA (Reg.) | 4.4 |
| HP, Inc. | 3.7 |
| Fujifilm Holdings Corp. | 3.6 |
| Western Digital Corp. | 2.4 |
| Kornit Digital Ltd. | 2.2 |
| | 75.2 |
Top Industries (% of fund's net assets)
| As of August 31, 2020 |
| | Technology Hardware, Storage & Peripherals | 65.9% |
| | Household Durables | 17.1% |
| | Software | 5.1% |
| | Machinery | 2.2% |
| | Electronic Equipment & Components | 2.0% |
| | All Others* | 7.7% |

* Includes short-term investments and net other assets (liabilities).
Computers Portfolio
Schedule of Investments August 31, 2020 (Unaudited)
Showing Percentage of Net Assets
| Common Stocks - 98.3% | | | |
| | | Shares | Value |
| Electronic Equipment & Components - 2.0% | | | |
| Electronic Components - 2.0% | | | |
| Kyocera Corp. | | 208,669 | $11,992,335 |
| Equity Real Estate Investment Trusts (REITs) - 0.7% | | | |
| Specialized REITs - 0.7% | | | |
| Equinix, Inc. | | 5,380 | 4,249,016 |
| Household Durables - 17.1% | | | |
| Consumer Electronics - 15.9% | | | |
| Sony Corp. | | 1,214,882 | 95,130,610 |
| Household Appliances - 1.2% | | | |
| Haier Smart Home Co. Ltd. (A Shares) | | 2,255,528 | 7,344,476 |
|
| TOTAL HOUSEHOLD DURABLES | | | 102,475,086 |
|
| Interactive Media & Services - 2.0% | | | |
| Interactive Media & Services - 2.0% | | | |
| Tencent Holdings Ltd. sponsored ADR | | 174,557 | 11,929,225 |
| Internet & Direct Marketing Retail - 1.6% | | | |
| Internet & Direct Marketing Retail - 1.6% | | | |
| MercadoLibre, Inc. (a) | | 8,291 | 9,688,780 |
| IT Services - 0.7% | | | |
| IT Consulting & Other Services - 0.7% | | | |
| Gartner, Inc. (a) | | 31,524 | 4,092,446 |
| Machinery - 2.2% | | | |
| Industrial Machinery - 2.2% | | | |
| Kornit Digital Ltd. (a) | | 216,970 | 13,436,952 |
| Semiconductors & Semiconductor Equipment - 1.0% | | | |
| Semiconductor Equipment - 1.0% | | | |
| ASML Holding NV | | 15,246 | 5,704,748 |
| Software - 5.1% | | | |
| Application Software - 0.0% | | | |
| Jamf Holding Corp. (a)(b) | | 700 | 27,020 |
| Systems Software - 5.1% | | | |
| Microsoft Corp. | | 26,632 | 6,006,315 |
| Nortonlifelock, Inc. | | 531,745 | 12,506,642 |
| Ping Identity Holding Corp. (a)(b) | | 155,214 | 5,350,227 |
| SailPoint Technologies Holding, Inc. (a) | | 164,956 | 6,471,224 |
| | | | 30,334,408 |
|
| TOTAL SOFTWARE | | | 30,361,428 |
|
| Technology Hardware, Storage & Peripherals - 65.9% | | | |
| Technology Hardware, Storage & Peripherals - 65.9% | | | |
| Apple, Inc. | | 1,011,124 | 130,475,442 |
| Canon, Inc. | | 530,158 | 9,093,098 |
| Dell Technologies, Inc. (a) | | 442,237 | 29,223,021 |
| Diebold Nixdorf, Inc. (a)(b) | | 872 | 7,272 |
| Fujifilm Holdings Corp. | | 451,723 | 21,520,977 |
| Hewlett Packard Enterprise Co. | | 1,043,861 | 10,094,136 |
| HP, Inc. | | 1,132,342 | 22,137,286 |
| Logitech International SA (Reg.) | | 359,984 | 26,610,024 |
| NetApp, Inc. | | 199,916 | 9,474,019 |
| Pure Storage, Inc. Class A (a) | | 459,256 | 7,008,247 |
| Samsung Electronics Co. Ltd. | | 1,504,214 | 68,401,864 |
| Seagate Technology LLC | | 241,352 | 11,582,482 |
| Western Digital Corp. | | 374,163 | 14,375,342 |
| Xerox Holdings Corp. | | 290,371 | 5,476,397 |
| Xiaomi Corp. Class B (a)(c) | | 9,535,568 | 29,529,763 |
| | | | 395,009,370 |
| TOTAL COMMON STOCKS | | | |
| (Cost $344,457,684) | | | 588,939,386 |
|
| Money Market Funds - 2.2% | | | |
| Fidelity Cash Central Fund 0.12% (d) | | 10,167,720 | 10,169,754 |
| Fidelity Securities Lending Cash Central Fund 0.11% (d)(e) | | 3,041,678 | 3,041,982 |
| TOTAL MONEY MARKET FUNDS | | | |
| (Cost $13,211,736) | | | 13,211,736 |
| TOTAL INVESTMENT IN SECURITIES - 100.5% | | | |
| (Cost $357,669,420) | | | 602,151,122 |
| NET OTHER ASSETS (LIABILITIES) - (0.5)% | | | (3,188,799) |
| NET ASSETS - 100% | | | $598,962,323 |
Legend
(a) Non-income producing
(b) Security or a portion of the security is on loan at period end.
(c) Security exempt from registration under Rule 144A of the Securities Act of 1933. These securities may be resold in transactions exempt from registration, normally to qualified institutional buyers. At the end of the period, the value of these securities amounted to $29,529,763 or 4.9% of net assets.
(d) Affiliated fund that is generally available only to investment companies and other accounts managed by Fidelity Investments. The rate quoted is the annualized seven-day yield of the fund at period end. A complete unaudited listing of the fund's holdings as of its most recent quarter end is available upon request. In addition, each Fidelity Central Fund's financial statements are available on the SEC's website or upon request.
(e) Investment made with cash collateral received from securities on loan.
Affiliated Central Funds
Information regarding fiscal year to date income earned by the Fund from investments in Fidelity Central Funds is as follows:
| Fund | Income earned |
| Fidelity Cash Central Fund | $21,374 |
| Fidelity Securities Lending Cash Central Fund | 28,103 |
| Total | $49,477 |
Amounts in the income column in the above table include any capital gain distributions from underlying funds, which are presented in the corresponding line-item in the Statement of Operations, if applicable. Amount for Fidelity Securities Lending Cash Central Fund represents the income earned on investing cash collateral, less rebates paid to borrowers and any lending agent fees associated with the loan, plus any premium payments received for lending certain types of securities.
Investment Valuation
The following is a summary of the inputs used, as of August 31, 2020, involving the Fund's assets and liabilities carried at fair value. The inputs or methodology used for valuing securities may not be an indication of the risk associated with investing in those securities. For more information on valuation inputs, and their aggregation into the levels used below, please refer to the Investment Valuation section in the accompanying Notes to Financial Statements.
| | Valuation Inputs at Reporting Date: |
| Description | Total | Level 1 | Level 2 | Level 3 |
| Investments in Securities: | | | | |
| Common Stocks | $588,939,386 | $455,185,915 | $133,753,471 | $-- |
| Money Market Funds | 13,211,736 | 13,211,736 | -- | -- |
| Total Investments in Securities: | $602,151,122 | $468,397,651 | $133,753,471 | $-- |
Other Information
Distribution of investments by country or territory of incorporation, as a percentage of Total Net Assets, is as follows (Unaudited):
| United States of America | 48.0% |
| Japan | 23.0% |
| Korea (South) | 11.4% |
| Cayman Islands | 6.9% |
| Switzerland | 4.4% |
| Israel | 2.2% |
| Ireland | 1.9% |
| China | 1.2% |
| Netherlands | 1.0% |
| | 100.0% |
See accompanying notes which are an integral part of the financial statements.
Computers Portfolio
Financial Statements
Statement of Assets and Liabilities
| | | August 31, 2020 (Unaudited) |
| Assets | | |
Investment in securities, at value (including securities loaned of $2,933,985) — See accompanying schedule:
Unaffiliated issuers (cost $344,457,684) | $588,939,386 | |
| Fidelity Central Funds (cost $13,211,736) | 13,211,736 | |
| Total Investment in Securities (cost $357,669,420) | | $602,151,122 |
| Receivable for fund shares sold | | 389,486 |
| Dividends receivable | | 244,947 |
| Distributions receivable from Fidelity Central Funds | | 1,894 |
| Prepaid expenses | | 4,163 |
| Other receivables | | 219,388 |
| Total assets | | 603,011,000 |
| Liabilities | | |
| Payable for fund shares redeemed | $588,695 | |
| Accrued management fee | 256,227 | |
| Other affiliated payables | 87,348 | |
| Other payables and accrued expenses | 74,332 | |
| Collateral on securities loaned | 3,042,075 | |
| Total liabilities | | 4,048,677 |
| Net Assets | | $598,962,323 |
| Net Assets consist of: | | |
| Paid in capital | | $347,654,854 |
| Total accumulated earnings (loss) | | 251,307,469 |
| Net Assets | | $598,962,323 |
| Net Asset Value, offering price and redemption price per share ($598,962,323 ÷ 6,461,676 shares) | | $92.69 |
See accompanying notes which are an integral part of the financial statements.
Statement of Operations
| | | Six months ended August 31, 2020 (Unaudited) |
| Investment Income | | |
| Dividends | | $4,211,616 |
| Income from Fidelity Central Funds (including $28,103 from security lending) | | 49,477 |
| Total income | | 4,261,093 |
| Expenses | | |
| Management fee | $1,356,732 | |
| Transfer agent fees | 405,595 | |
| Accounting fees | 97,984 | |
| Custodian fees and expenses | 15,475 | |
| Independent trustees' fees and expenses | 1,654 | |
| Registration fees | 17,406 | |
| Audit | 18,787 | |
| Legal | 390 | |
| Interest | 511 | |
| Miscellaneous | 8,459 | |
| Total expenses before reductions | 1,922,993 | |
| Expense reductions | (105,135) | |
| Total expenses after reductions | | 1,817,858 |
| Net investment income (loss) | | 2,443,235 |
| Realized and Unrealized Gain (Loss) | | |
| Net realized gain (loss) on: | | |
| Investment securities: | | |
| Unaffiliated issuers | 9,035,562 | |
| Fidelity Central Funds | (1,534) | |
| Foreign currency transactions | (265,088) | |
| Total net realized gain (loss) | | 8,768,940 |
| Change in net unrealized appreciation (depreciation) on: | | |
| Investment securities: | | |
| Unaffiliated issuers | 104,975,127 | |
| Assets and liabilities in foreign currencies | 20,040 | |
| Total change in net unrealized appreciation (depreciation) | | 104,995,167 |
| Net gain (loss) | | 113,764,107 |
| Net increase (decrease) in net assets resulting from operations | | $116,207,342 |
See accompanying notes which are an integral part of the financial statements.
Statement of Changes in Net Assets
| | Six months ended August 31, 2020 (Unaudited) | Year ended February 29, 2020 |
| Increase (Decrease) in Net Assets | | |
| Operations | | |
| Net investment income (loss) | $2,443,235 | $10,071,727 |
| Net realized gain (loss) | 8,768,940 | 41,250,368 |
| Change in net unrealized appreciation (depreciation) | 104,995,167 | 28,116,018 |
| Net increase (decrease) in net assets resulting from operations | 116,207,342 | 79,438,113 |
| Distributions to shareholders | (26,149,427) | (66,135,088) |
| Share transactions | | |
| Proceeds from sales of shares | 27,158,417 | 97,658,347 |
| Reinvestment of distributions | 24,915,416 | 63,117,629 |
| Cost of shares redeemed | (76,961,984) | (132,066,756) |
| Net increase (decrease) in net assets resulting from share transactions | (24,888,151) | 28,709,220 |
| Total increase (decrease) in net assets | 65,169,764 | 42,012,245 |
| Net Assets | | |
| Beginning of period | 533,792,559 | 491,780,314 |
| End of period | $598,962,323 | $533,792,559 |
| Other Information | | |
| Shares | | |
| Sold | 343,086 | 1,202,453 |
| Issued in reinvestment of distributions | 359,063 | 818,801 |
| Redeemed | (1,028,500) | (1,718,015) |
| Net increase (decrease) | (326,351) | 303,239 |
See accompanying notes which are an integral part of the financial statements.
Financial Highlights
Computers Portfolio
| | Six months ended (Unaudited) August 31, | Years endedFebruary 28, | | | | |
| | 2020 | 2020 A | 2019 | 2018 | 2017 | 2016 A |
| Selected Per–Share Data | | | | | | |
| Net asset value, beginning of period | $78.64 | $75.84 | $92.81 | $83.01 | $62.46 | $83.28 |
| Income from Investment Operations | | | | | | |
| Net investment income (loss)B | .37 | 1.51C | .81 | .67 | .73 | .69 |
| Net realized and unrealized gain (loss) | 17.70 | 11.48 | (1.67) | 19.24 | 24.69 | (18.42) |
| Total from investment operations | 18.07 | 12.99 | (.86) | 19.91 | 25.42 | (17.73) |
| Distributions from net investment income | (1.15) | (.77) | (.88)D | (.73)D | (.88) | (.80) |
| Distributions from net realized gain | (2.87) | (9.42) | (15.23)D | (9.38)D | (4.00) | (2.29) |
| Total distributions | (4.02) | (10.19) | (16.11) | (10.11) | (4.87)E | (3.09) |
| Redemption fees added to paid in capitalB | – | – | – | –F | –F | –F |
| Net asset value, end of period | $92.69 | $78.64 | $75.84 | $92.81 | $83.01 | $62.46 |
| Total ReturnG,H | 24.69% | 17.80% | .54% | 24.82% | 41.57% | (21.56)% |
| Ratios to Average Net AssetsI,J | | | | | | |
| Expenses before reductions | .75%K | .76% | .77% | .79% | .81% | .80% |
| Expenses net of fee waivers, if any | .75%K | .76% | .77% | .79% | .81% | .80% |
| Expenses net of all reductions | .71%K | .75% | .77% | .78% | .81% | .79% |
| Net investment income (loss) | .96%K | 1.95%C | .90% | .75% | 1.01% | .91% |
| Supplemental Data | | | | | | |
| Net assets, end of period (000 omitted) | $598,962 | $533,793 | $491,780 | $538,332 | $472,745 | $388,554 |
| Portfolio turnover rateL | 82%K | 116% | 81% | 57% | 49% | 31% |
A For the year ended February 29.
B Calculated based on average shares outstanding during the period.
C Net investment income per share reflects one or more large, non-recurring dividend(s) which amounted to $.78 per share. Excluding such non-recurring dividend(s), the ratio of net investment income (loss) to average net assets would have been .94%.
D The amounts shown reflect certain reclassifications related to book to tax differences that were made in the year shown.
E Total distributions of $4.87 per share is comprised of distributions from net investment income of $.879 and distributions from net realized gain of $3.995 per share.
F Amount represents less than $.005 per share.
G Total returns for periods of less than one year are not annualized.
H Total returns would have been lower if certain expenses had not been reduced during the applicable periods shown.
I Fees and expenses of any underlying mutual funds or exchange-traded funds (ETFs) are not included in the Fund's expense ratio. The Fund indirectly bears its proportionate share of these expenses. For additional expense information related to investments in Fidelity Central Funds, please refer to the "Investments in Fidelity Central Funds" note found in the Notes to Financial Statements section of the most recent Annual or Semi-Annual report.
J Expense ratios reflect operating expenses of the class. Expenses before reductions do not reflect amounts reimbursed, waived, or reduced through arrangements with the investment advisor, brokerage services, or other offset arrangements, if applicable, and do not represent the amount paid by the class during periods when reimbursements, waivers or reductions occur.
K Annualized
L Amount does not include the portfolio activity of any underlying Fidelity Central Funds.
See accompanying notes which are an integral part of the financial statements.
IT Services Portfolio
Investment Summary (Unaudited)
Top Ten Stocks as of August 31, 2020
| | % of fund's net assets |
| MasterCard, Inc. Class A | 18.4 |
| Visa, Inc. Class A | 15.6 |
| PayPal Holdings, Inc. | 8.5 |
| Fidelity National Information Services, Inc. | 7.2 |
| Fiserv, Inc. | 3.7 |
| EPAM Systems, Inc. | 2.9 |
| IBM Corp. | 2.8 |
| Genpact Ltd. | 2.7 |
| Twilio, Inc. Class A | 2.5 |
| GoDaddy, Inc. | 2.4 |
| | 66.7 |
Top Industries (% of fund's net assets)
| As of August 31, 2020 |
| | IT Services | 86.0% |
| | Software | 7.7% |
| | Professional Services | 1.3% |
| | Interactive Media & Services | 1.2% |
| | Media | 0.8% |
| | All Others* | 3.0% |

* Includes short-term investments and net other assets (liabilities).
IT Services Portfolio
Schedule of Investments August 31, 2020 (Unaudited)
Showing Percentage of Net Assets
| Common Stocks - 99.3% | | | |
| | | Shares | Value |
| Aerospace & Defense - 0.2% | | | |
| Aerospace & Defense - 0.2% | | | |
| Axon Enterprise, Inc. (a) | | 89,000 | $7,625,520 |
| Diversified Financial Services - 0.5% | | | |
| Multi-Sector Holdings - 0.5% | | | |
| Cannae Holdings, Inc. (a) | | 552,000 | 20,826,960 |
| Entertainment - 0.5% | | | |
| Interactive Home Entertainment - 0.5% | | | |
| Activision Blizzard, Inc. | | 156,600 | 13,079,232 |
| Electronic Arts, Inc. (a) | | 62,600 | 8,730,822 |
| | | | 21,810,054 |
| Interactive Media & Services - 1.2% | | | |
| Interactive Media & Services - 1.2% | | | |
| Facebook, Inc. Class A (a) | | 59,500 | 17,445,400 |
| Match Group, Inc. (a) | | 326,630 | 36,478,038 |
| | | | 53,923,438 |
| Internet & Direct Marketing Retail - 0.5% | | | |
| Internet & Direct Marketing Retail - 0.5% | | | |
| MercadoLibre, Inc. (a) | | 18,500 | 21,618,915 |
| IT Services - 86.0% | | | |
| Data Processing & Outsourced Services - 67.5% | | | |
| Adyen BV (a)(b) | | 5,700 | 9,608,217 |
| Amadeus IT Holding SA Class A | | 352,500 | 19,732,967 |
| Automatic Data Processing, Inc. | | 634,275 | 88,221,310 |
| Black Knight, Inc. (a) | | 864,200 | 72,679,220 |
| Fidelity National Information Services, Inc. | | 2,037,097 | 307,296,082 |
| Fiserv, Inc. (a) | | 1,596,317 | 158,961,247 |
| FleetCor Technologies, Inc. (a) | | 94,800 | 23,837,460 |
| Genpact Ltd. | | 2,727,480 | 115,045,106 |
| Global Payments, Inc. | | 532,303 | 94,015,356 |
| MasterCard, Inc. Class A | | 2,200,200 | 788,089,639 |
| PayPal Holdings, Inc. (a) | | 1,770,200 | 361,368,628 |
| Square, Inc. (a) | | 498,600 | 79,556,616 |
| StoneCo Ltd. Class A (a) | | 438,000 | 22,338,000 |
| The Western Union Co. | | 4,800 | 113,232 |
| Ttec Holdings, Inc. | | 2,000 | 113,380 |
| Visa, Inc. Class A (c) | | 3,138,648 | 665,361,990 |
| WEX, Inc. (a) | | 700 | 111,797 |
| WNS Holdings Ltd. sponsored ADR (a) | | 1,166,261 | 77,381,417 |
| | | | 2,883,831,664 |
| Internet Services & Infrastructure - 6.0% | | | |
| Akamai Technologies, Inc. (a) | | 77,600 | 9,034,968 |
| GoDaddy, Inc. (a) | | 1,208,627 | 101,137,907 |
| MongoDB, Inc. Class A (a)(c) | | 88,600 | 20,714,680 |
| Twilio, Inc. Class A (a) | | 404,600 | 109,144,896 |
| VeriSign, Inc. (a) | | 72,000 | 15,465,600 |
| | | | 255,498,051 |
| IT Consulting & Other Services - 12.5% | | | |
| Accenture PLC Class A | | 44,280 | 10,624,100 |
| Amdocs Ltd. | | 123,300 | 7,549,659 |
| Booz Allen Hamilton Holding Corp. Class A | | 427,100 | 37,610,426 |
| Cognizant Technology Solutions Corp. Class A | | 847,932 | 56,692,734 |
| DXC Technology Co. | | 1,093,400 | 21,846,132 |
| Endava PLC ADR (a) | | 618,361 | 33,694,491 |
| EPAM Systems, Inc. (a) | | 376,600 | 123,185,860 |
| Gartner, Inc. (a) | | 351,400 | 45,618,748 |
| IBM Corp. | | 956,350 | 117,927,519 |
| Leidos Holdings, Inc. | | 501,725 | 45,401,095 |
| Reply SpA | | 271,557 | 30,137,817 |
| Science Applications International Corp. | | 800 | 66,768 |
| Unisys Corp. (a) | | 167,753 | 1,956,000 |
| | | | 532,311,349 |
|
| TOTAL IT SERVICES | | | 3,671,641,064 |
|
| Media - 0.8% | | | |
| Advertising - 0.8% | | | |
| S4 Capital PLC (a) | | 6,861,196 | 32,834,699 |
| Professional Services - 1.3% | | | |
| Research & Consulting Services - 1.3% | | | |
| CoreLogic, Inc. | | 2,700 | 179,280 |
| Equifax, Inc. | | 125,700 | 21,151,539 |
| ICF International, Inc. | | 161,411 | 11,025,985 |
| Verisk Analytics, Inc. | | 119,100 | 22,232,397 |
| | | | 54,589,201 |
| Real Estate Management & Development - 0.1% | | | |
| Real Estate Services - 0.1% | | | |
| KE Holdings, Inc. ADR (a) | | 86,900 | 4,457,101 |
| Road & Rail - 0.5% | | | |
| Trucking - 0.5% | | | |
| Uber Technologies, Inc. (a) | | 651,500 | 21,909,945 |
| Software - 7.7% | | | |
| Application Software - 7.3% | | | |
| Adobe, Inc. (a) | | 139,169 | 71,447,973 |
| Ceridian HCM Holding, Inc. (a) | | 258,773 | 20,577,629 |
| Intuit, Inc. | | 177,800 | 61,410,342 |
| Netcompany Group A/S (a)(b) | | 341,026 | 29,522,984 |
| NICE Systems Ltd. sponsored ADR (a) | | 54,700 | 12,572,795 |
| Paycom Software, Inc. (a) | | 14,700 | 4,402,062 |
| SAP SE sponsored ADR (c) | | 211,900 | 35,050,379 |
| Slack Technologies, Inc. Class A (a)(c) | | 133,100 | 4,371,004 |
| SS&C Technologies Holdings, Inc. | | 510,250 | 32,513,130 |
| Temenos Group AG | | 4,990 | 804,848 |
| Workday, Inc. Class A (a) | | 97,300 | 23,323,783 |
| Xero Ltd. (a) | | 196,605 | 14,641,258 |
| | | | 310,638,187 |
| Systems Software - 0.4% | | | |
| Blue Prism Group PLC (a)(c) | | 814,390 | 17,265,764 |
|
| TOTAL SOFTWARE | | | 327,903,951 |
|
| TOTAL COMMON STOCKS | | | |
| (Cost $1,921,155,709) | | | 4,239,140,848 |
|
| Money Market Funds - 4.5% | | | |
| Fidelity Cash Central Fund 0.12% (d) | | 1,864,057 | 1,864,429 |
| Fidelity Securities Lending Cash Central Fund 0.11% (d)(e) | | 190,563,805 | 190,582,861 |
| TOTAL MONEY MARKET FUNDS | | | |
| (Cost $192,447,290) | | | 192,447,290 |
| TOTAL INVESTMENT IN SECURITIES - 103.8% | | | |
| (Cost $2,113,602,999) | | | 4,431,588,138 |
| NET OTHER ASSETS (LIABILITIES) - (3.8)% | | | (161,268,507) |
| NET ASSETS - 100% | | | $4,270,319,631 |
Legend
(a) Non-income producing
(b) Security exempt from registration under Rule 144A of the Securities Act of 1933. These securities may be resold in transactions exempt from registration, normally to qualified institutional buyers. At the end of the period, the value of these securities amounted to $39,131,201 or 0.9% of net assets.
(c) Security or a portion of the security is on loan at period end.
(d) Affiliated fund that is generally available only to investment companies and other accounts managed by Fidelity Investments. The rate quoted is the annualized seven-day yield of the fund at period end. A complete unaudited listing of the fund's holdings as of its most recent quarter end is available upon request. In addition, each Fidelity Central Fund's financial statements are available on the SEC's website or upon request.
(e) Investment made with cash collateral received from securities on loan.
Affiliated Central Funds
Information regarding fiscal year to date income earned by the Fund from investments in Fidelity Central Funds is as follows:
| Fund | Income earned |
| Fidelity Cash Central Fund | $98,262 |
| Fidelity Securities Lending Cash Central Fund | 1,258,460 |
| Total | $1,356,722 |
Amounts in the income column in the above table include any capital gain distributions from underlying funds, which are presented in the corresponding line-item in the Statement of Operations, if applicable. Amount for Fidelity Securities Lending Cash Central Fund represents the income earned on investing cash collateral, less rebates paid to borrowers and any lending agent fees associated with the loan, plus any premium payments received for lending certain types of securities.
Investment Valuation
The following is a summary of the inputs used, as of August 31, 2020, involving the Fund's assets and liabilities carried at fair value. The inputs or methodology used for valuing securities may not be an indication of the risk associated with investing in those securities. For more information on valuation inputs, and their aggregation into the levels used below, please refer to the Investment Valuation section in the accompanying Notes to Financial Statements.
| | Valuation Inputs at Reporting Date: |
| Description | Total | Level 1 | Level 2 | Level 3 |
| Investments in Securities: | | | | |
| Common Stocks | $4,239,140,848 | $4,229,532,631 | $9,608,217 | $-- |
| Money Market Funds | 192,447,290 | 192,447,290 | -- | -- |
| Total Investments in Securities: | $4,431,588,138 | $4,421,979,921 | $9,608,217 | $-- |
Other Information
Distribution of investments by country or territory of incorporation, as a percentage of Total Net Assets, is as follows (Unaudited):
| United States of America | 89.3% |
| Bermuda | 2.7% |
| United Kingdom | 2.0% |
| Bailiwick of Jersey | 1.8% |
| Others (Individually Less Than 1%) | 4.2% |
| | 100.0% |
See accompanying notes which are an integral part of the financial statements.
IT Services Portfolio
Financial Statements
Statement of Assets and Liabilities
| | | August 31, 2020 (Unaudited) |
| Assets | | |
Investment in securities, at value (including securities loaned of $183,758,221) — See accompanying schedule:
Unaffiliated issuers (cost $1,921,155,709) | $4,239,140,848 | |
| Fidelity Central Funds (cost $192,447,290) | 192,447,290 | |
| Total Investment in Securities (cost $2,113,602,999) | | $4,431,588,138 |
| Receivable for investments sold | | 36,809,734 |
| Receivable for fund shares sold | | 3,954,322 |
| Dividends receivable | | 2,736,016 |
| Distributions receivable from Fidelity Central Funds | | 61,802 |
| Prepaid expenses | | 21,910 |
| Other receivables | | 60,971 |
| Total assets | | 4,475,232,893 |
| Liabilities | | |
| Payable for fund shares redeemed | $11,868,822 | |
| Accrued management fee | 1,829,938 | |
| Other affiliated payables | 613,623 | |
| Other payables and accrued expenses | 34,954 | |
| Collateral on securities loaned | 190,565,925 | |
| Total liabilities | | 204,913,262 |
| Net Assets | | $4,270,319,631 |
| Net Assets consist of: | | |
| Paid in capital | | $1,853,585,168 |
| Total accumulated earnings (loss) | | 2,416,734,463 |
| Net Assets | | $4,270,319,631 |
| Net Asset Value, offering price and redemption price per share ($4,270,319,631 ÷ 47,581,411 shares) | | $89.75 |
See accompanying notes which are an integral part of the financial statements.
Statement of Operations
| | | Six months ended August 31, 2020 (Unaudited) |
| Investment Income | | |
| Dividends | | $13,883,880 |
| Income from Fidelity Central Funds (including $1,258,460 from security lending) | | 1,356,722 |
| Total income | | 15,240,602 |
| Expenses | | |
| Management fee | $10,207,101 | |
| Transfer agent fees | 3,151,572 | |
| Accounting fees | 516,312 | |
| Custodian fees and expenses | 25,520 | |
| Independent trustees' fees and expenses | 12,557 | |
| Registration fees | 79,999 | |
| Audit | 25,588 | |
| Legal | 2,927 | |
| Interest | 1,391 | |
| Miscellaneous | 65,412 | |
| Total expenses before reductions | 14,088,379 | |
| Expense reductions | (113,466) | |
| Total expenses after reductions | | 13,974,913 |
| Net investment income (loss) | | 1,265,689 |
| Realized and Unrealized Gain (Loss) | | |
| Net realized gain (loss) on: | | |
| Investment securities: | | |
| Unaffiliated issuers | 110,663,834 | |
| Fidelity Central Funds | 13,507 | |
| Foreign currency transactions | 46,196 | |
| Total net realized gain (loss) | | 110,723,537 |
| Change in net unrealized appreciation (depreciation) on: | | |
| Investment securities: | | |
| Unaffiliated issuers | 665,832,919 | |
| Assets and liabilities in foreign currencies | 44,254 | |
| Total change in net unrealized appreciation (depreciation) | | 665,877,173 |
| Net gain (loss) | | 776,600,710 |
| Net increase (decrease) in net assets resulting from operations | | $777,866,399 |
See accompanying notes which are an integral part of the financial statements.
Statement of Changes in Net Assets
| | Six months ended August 31, 2020 (Unaudited) | Year ended February 29, 2020 |
| Increase (Decrease) in Net Assets | | |
| Operations | | |
| Net investment income (loss) | $1,265,689 | $1,576,906 |
| Net realized gain (loss) | 110,723,537 | 102,599,566 |
| Change in net unrealized appreciation (depreciation) | 665,877,173 | 386,226,885 |
| Net increase (decrease) in net assets resulting from operations | 777,866,399 | 490,403,357 |
| Distributions to shareholders | (24,769,573) | (92,016,949) |
| Share transactions | | |
| Proceeds from sales of shares | 524,679,141 | 2,205,695,282 |
| Reinvestment of distributions | 23,494,560 | 87,345,122 |
| Cost of shares redeemed | (1,130,064,955) | (1,459,634,052) |
| Net increase (decrease) in net assets resulting from share transactions | (581,891,254) | 833,406,352 |
| Total increase (decrease) in net assets | 171,205,572 | 1,231,792,760 |
| Net Assets | | |
| Beginning of period | 4,099,114,059 | 2,867,321,299 |
| End of period | $4,270,319,631 | $4,099,114,059 |
| Other Information | | |
| Shares | | |
| Sold | 7,288,597 | 30,329,506 |
| Issued in reinvestment of distributions | 352,985 | 1,178,021 |
| Redeemed | (15,737,931) | (19,968,785) |
| Net increase (decrease) | (8,096,349) | 11,538,742 |
See accompanying notes which are an integral part of the financial statements.
Financial Highlights
IT Services Portfolio
| | Six months ended (Unaudited) August 31, | Years endedFebruary 28, | | | | |
| | 2020 | 2020 A | 2019 | 2018 | 2017 | 2016 A |
| Selected Per–Share Data | | | | | | |
| Net asset value, beginning of period | $73.62 | $64.96 | $58.69 | $44.84 | $37.16 | $38.88 |
| Income from Investment Operations | | | | | | |
| Net investment income (loss)B | .02 | .03 | .04 | .04 | .13C | (.02) |
| Net realized and unrealized gain (loss) | 16.58 | 10.36 | 8.92 | 15.50 | 7.68 | (.15) |
| Total from investment operations | 16.60 | 10.39 | 8.96 | 15.54 | 7.81 | (.17) |
| Distributions from net investment income | (.01) | (.03) | (.03) | (.02) | (.13) | – |
| Distributions from net realized gain | (.47) | (1.70) | (2.66) | (1.67) | – | (1.55) |
| Total distributions | (.47)D | (1.73) | (2.69) | (1.69) | (.13) | (1.55) |
| Redemption fees added to paid in capitalB | – | – | – | – | –E | –E |
| Net asset value, end of period | $89.75 | $73.62 | $64.96 | $58.69 | $44.84 | $37.16 |
| Total ReturnF,G | 22.77% | 15.99% | 16.04% | 35.17% | 21.05% | (.59)% |
| Ratios to Average Net AssetsH,I | | | | | | |
| Expenses before reductions | .73%J | .73% | .74% | .77% | .79% | .81% |
| Expenses net of fee waivers, if any | .73%J | .73% | .74% | .77% | .79% | .81% |
| Expenses net of all reductions | .73%J | .73% | .74% | .77% | .79% | .80% |
| Net investment income (loss) | .07%J | .04% | .06% | .08% | .33%C | (.06)% |
| Supplemental Data | | | | | | |
| Net assets, end of period (000 omitted) | $4,270,320 | $4,099,114 | $2,867,321 | $2,284,152 | $1,663,802 | $1,894,175 |
| Portfolio turnover rateK | 34%J | 24% | 26% | 26% | 27% | 24% |
A For the year ended February 29.
B Calculated based on average shares outstanding during the period.
C Net investment income per share reflects one or more large, non-recurring dividend(s) which amounted to $.13 per share. Excluding such non-recurring dividend(s), the ratio of net investment income (loss) to average net assets would have been .02%.
D Total distributions of $.47 per share is comprised of distributions from net investment income of $.006 and distributions from net realized gain of $.466 per share.
E Amount represents less than $.005 per share.
F Total returns for periods of less than one year are not annualized.
G Total returns would have been lower if certain expenses had not been reduced during the applicable periods shown.
H Fees and expenses of any underlying mutual funds or exchange-traded funds (ETFs) are not included in the Fund's expense ratio. The Fund indirectly bears its proportionate share of these expenses. For additional expense information related to investments in Fidelity Central Funds, please refer to the "Investments in Fidelity Central Funds" note found in the Notes to Financial Statements section of the most recent Annual or Semi-Annual report.
I Expense ratios reflect operating expenses of the class. Expenses before reductions do not reflect amounts reimbursed, waived, or reduced through arrangements with the investment advisor, brokerage services, or other offset arrangements, if applicable, and do not represent the amount paid by the class during periods when reimbursements, waivers or reductions occur.
J Annualized
K Amount does not include the portfolio activity of any underlying Fidelity Central Funds.
See accompanying notes which are an integral part of the financial statements.
Semiconductors Portfolio
Investment Summary (Unaudited)
Top Ten Stocks as of August 31, 2020
| | % of fund's net assets |
| NVIDIA Corp. | 22.9 |
| Qualcomm, Inc. | 8.2 |
| Intel Corp. | 7.1 |
| Broadcom, Inc. | 6.3 |
| NXP Semiconductors NV | 5.2 |
| Marvell Technology Group Ltd. | 4.7 |
| Microchip Technology, Inc. | 4.5 |
| Lam Research Corp. | 4.4 |
| Micron Technology, Inc. | 4.2 |
| ON Semiconductor Corp. | 3.8 |
| | 71.3 |
Top Industries (% of fund's net assets)
| As of August 31, 2020 |
| | Semiconductors & Semiconductor Equipment | 91.8% |
| | Electronic Equipment & Components | 6.1% |
| | Technology Hardware, Storage & Peripherals | 0.9% |
| | All Others* | 1.2% |

* Includes short-term investments and net other assets (liabilities).
Semiconductors Portfolio
Schedule of Investments August 31, 2020 (Unaudited)
Showing Percentage of Net Assets
| Common Stocks - 98.7% | | | |
| | | Shares | Value |
| Electronic Equipment & Components - 6.1% | | | |
| Electronic Components - 0.7% | | | |
| II-VI, Inc. (a)(b) | | 653,400 | $29,076,300 |
| Electronic Manufacturing Services - 5.4% | | | |
| Flextronics International Ltd. (a) | | 5,457,600 | 59,269,536 |
| Jabil, Inc. (b) | | 3,685,158 | 125,848,146 |
| TTM Technologies, Inc. (a) | | 3,950,967 | 45,278,082 |
| | | | 230,395,764 |
|
| TOTAL ELECTRONIC EQUIPMENT & COMPONENTS | | | 259,472,064 |
|
| Semiconductors & Semiconductor Equipment - 91.7% | | | |
| Semiconductor Equipment - 8.0% | | | |
| Advanced Energy Industries, Inc. (a) | | 388,464 | 28,792,952 |
| Applied Materials, Inc. | | 901,200 | 55,513,920 |
| Enphase Energy, Inc. (a) | | 869,400 | 67,143,762 |
| Lam Research Corp. | | 553,573 | 186,188,743 |
| | | | 337,639,377 |
| Semiconductors - 83.7% | | | |
| Advanced Micro Devices, Inc. (a) | | 138,300 | 12,560,406 |
| Alpha & Omega Semiconductor Ltd. (a) | | 742,296 | 10,058,111 |
| Ambarella, Inc. (a) | | 101,700 | 5,359,590 |
| Analog Devices, Inc. | | 517,296 | 60,461,556 |
| ASE Technology Holding Co. Ltd. ADR | | 1,396,600 | 5,740,026 |
| Broadcom, Inc. | | 774,350 | 268,815,603 |
| Cirrus Logic, Inc. (a) | | 1,311,560 | 79,467,420 |
| Diodes, Inc. (a) | | 326,400 | 15,947,904 |
| Inphi Corp. (a) | | 180,500 | 20,573,390 |
| Intel Corp. | | 5,905,142 | 300,866,985 |
| Marvell Technology Group Ltd. | | 5,154,893 | 199,906,751 |
| Maxim Integrated Products, Inc. | | 53,972 | 3,693,844 |
| MaxLinear, Inc. Class A (a) | | 817,731 | 19,911,750 |
| MediaTek, Inc. | | 57,000 | 1,078,656 |
| Microchip Technology, Inc. | | 1,743,037 | 191,211,159 |
| Micron Technology, Inc. (a) | | 3,903,360 | 177,641,914 |
| NVIDIA Corp. | | 1,813,492 | 970,181,947 |
| NXP Semiconductors NV | | 1,745,593 | 219,525,776 |
| ON Semiconductor Corp. (a) | | 7,485,840 | 159,972,401 |
| Qualcomm, Inc. | | 2,932,388 | 349,247,411 |
| Semtech Corp. (a) | | 282,470 | 16,566,866 |
| Silicon Motion Technology Corp. sponsored ADR | | 90,000 | 3,411,900 |
| SMART Global Holdings, Inc. (a) | | 641,000 | 16,153,200 |
| Synaptics, Inc. (a) | | 266,364 | 22,728,840 |
| Taiwan Semiconductor Manufacturing Co. Ltd. sponsored ADR | | 752,000 | 59,596,000 |
| Texas Instruments, Inc. | | 1,055,300 | 150,010,895 |
| Universal Display Corp. | | 305,687 | 53,648,069 |
| Xilinx, Inc. | | 1,508,566 | 157,132,235 |
| | | | 3,551,470,605 |
|
| TOTAL SEMICONDUCTORS & SEMICONDUCTOR EQUIPMENT | | | 3,889,109,982 |
|
| Technology Hardware, Storage & Peripherals - 0.9% | | | |
| Technology Hardware, Storage & Peripherals - 0.9% | | | |
| Samsung Electronics Co. Ltd. | | 323,460 | 14,708,856 |
| Western Digital Corp. | | 652,400 | 25,065,208 |
| | | | 39,774,064 |
| TOTAL COMMON STOCKS | | | |
| (Cost $2,604,291,429) | | | 4,188,356,110 |
| | | Principal Amount | Value |
|
| Convertible Bonds - 0.1% | | | |
| Semiconductors & Semiconductor Equipment - 0.1% | | | |
| Semiconductors - 0.1% | | | |
| SMART Global Holdings, Inc. 2.25% 2/15/26(c) | | | |
| (Cost $3,590,000) | | 3,590,000 | 3,201,921 |
| | | Shares | Value |
|
| Money Market Funds - 1.8% | | | |
| Fidelity Cash Central Fund 0.12% (d) | | 42,297,087 | 42,305,546 |
| Fidelity Securities Lending Cash Central Fund 0.11% (d)(e) | | 33,981,306 | 33,984,704 |
| TOTAL MONEY MARKET FUNDS | | | |
| (Cost $76,290,015) | | | 76,290,250 |
| TOTAL INVESTMENT IN SECURITIES - 100.6% | | | |
| (Cost $2,684,171,444) | | | 4,267,848,281 |
| NET OTHER ASSETS (LIABILITIES) - (0.6)% | | | (26,596,903) |
| NET ASSETS - 100% | | | $4,241,251,378 |
Legend
(a) Non-income producing
(b) Security or a portion of the security is on loan at period end.
(c) Security exempt from registration under Rule 144A of the Securities Act of 1933. These securities may be resold in transactions exempt from registration, normally to qualified institutional buyers. At the end of the period, the value of these securities amounted to $3,201,921 or 0.1% of net assets.
(d) Affiliated fund that is generally available only to investment companies and other accounts managed by Fidelity Investments. The rate quoted is the annualized seven-day yield of the fund at period end. A complete unaudited listing of the fund's holdings as of its most recent quarter end is available upon request. In addition, each Fidelity Central Fund's financial statements are available on the SEC's website or upon request.
(e) Investment made with cash collateral received from securities on loan.
Affiliated Central Funds
Information regarding fiscal year to date income earned by the Fund from investments in Fidelity Central Funds is as follows:
| Fund | Income earned |
| Fidelity Cash Central Fund | $94,195 |
| Fidelity Securities Lending Cash Central Fund | 35,512 |
| Total | $129,707 |
Amounts in the income column in the above table include any capital gain distributions from underlying funds, which are presented in the corresponding line-item in the Statement of Operations, if applicable. Amount for Fidelity Securities Lending Cash Central Fund represents the income earned on investing cash collateral, less rebates paid to borrowers and any lending agent fees associated with the loan, plus any premium payments received for lending certain types of securities.
Other Affiliated Issuers
An affiliated company is a company in which the Fund has ownership of at least 5% of the voting securities. Fiscal year to date transactions with companies which are or were affiliates are as follows:
| Affiliate | Value, beginning of period | Purchases | Sales Proceeds | Dividend Income | Realized Gain (loss) | Change in Unrealized appreciation (depreciation) | Value, end of period |
| CommScope Holding Co., Inc. | $128,371,095 | $2,078,594 | $102,656,731 | $-- | $(46,832,883) | $26,234,382 | $-- |
| Total | $128,371,095 | $2,078,594 | $102,656,731 | $-- | $(46,832,883) | $26,234,382 | $-- |
Investment Valuation
The following is a summary of the inputs used, as of August 31, 2020, involving the Fund's assets and liabilities carried at fair value. The inputs or methodology used for valuing securities may not be an indication of the risk associated with investing in those securities. For more information on valuation inputs, and their aggregation into the levels used below, please refer to the Investment Valuation section in the accompanying Notes to Financial Statements.
| | Valuation Inputs at Reporting Date: |
| Description | Total | Level 1 | Level 2 | Level 3 |
| Investments in Securities: | | | | |
| Common Stocks | $4,188,356,110 | $4,188,356,110 | $-- | $-- |
| Convertible Bonds | 3,201,921 | -- | 3,201,921 | -- |
| Money Market Funds | 76,290,250 | 76,290,250 | -- | -- |
| Total Investments in Securities: | $4,267,848,281 | $4,264,646,360 | $3,201,921 | $-- |
Other Information
Distribution of investments by country or territory of incorporation, as a percentage of Total Net Assets, is as follows (Unaudited):
| United States of America | 86.4% |
| Netherlands | 5.2% |
| Bermuda | 4.9% |
| Taiwan | 1.5% |
| Singapore | 1.4% |
| Others (Individually Less Than 1%) | 0.6% |
| | 100.0% |
See accompanying notes which are an integral part of the financial statements.
Semiconductors Portfolio
Financial Statements
Statement of Assets and Liabilities
| | | August 31, 2020 (Unaudited) |
| Assets | | |
Investment in securities, at value (including securities loaned of $33,255,225) — See accompanying schedule:
Unaffiliated issuers (cost $2,607,881,429) | $4,191,558,031 | |
| Fidelity Central Funds (cost $76,290,015) | 76,290,250 | |
| Total Investment in Securities (cost $2,684,171,444) | | $4,267,848,281 |
| Receivable for investments sold | | 21,045,705 |
| Receivable for fund shares sold | | 2,540,601 |
| Dividends receivable | | 4,405,224 |
| Interest receivable | | 3,590 |
| Distributions receivable from Fidelity Central Funds | | 10,851 |
| Prepaid expenses | | 29,562 |
| Other receivables | | 444,287 |
| Total assets | | 4,296,328,101 |
| Liabilities | | |
| Payable for investments purchased | $10,467,090 | |
| Payable for fund shares redeemed | 8,019,499 | |
| Accrued management fee | 1,827,269 | |
| Other affiliated payables | 563,690 | |
| Other payables and accrued expenses | 227,350 | |
| Collateral on securities loaned | 33,971,825 | |
| Total liabilities | | 55,076,723 |
| Net Assets | | $4,241,251,378 |
| Net Assets consist of: | | |
| Paid in capital | | $2,565,663,439 |
| Total accumulated earnings (loss) | | 1,675,587,939 |
| Net Assets | | $4,241,251,378 |
| Net Asset Value, offering price and redemption price per share ($4,241,251,378 ÷ 313,910,636 shares) | | $13.51 |
See accompanying notes which are an integral part of the financial statements.
Statement of Operations
| | | Six months ended August 31, 2020 (Unaudited) |
| Investment Income | | |
| Dividends | | $30,010,748 |
| Interest | | 41,144 |
| Income from Fidelity Central Funds (including $35,512 from security lending) | | 129,707 |
| Total income | | 30,181,599 |
| Expenses | | |
| Management fee | $9,853,749 | |
| Transfer agent fees | 2,734,036 | |
| Accounting fees | 505,099 | |
| Custodian fees and expenses | 24,550 | |
| Independent trustees' fees and expenses | 11,897 | |
| Registration fees | 57,405 | |
| Audit | 18,047 | |
| Legal | 2,766 | |
| Interest | 5,523 | |
| Miscellaneous | 51,549 | |
| Total expenses before reductions | 13,264,621 | |
| Expense reductions | (427,180) | |
| Total expenses after reductions | | 12,837,441 |
| Net investment income (loss) | | 17,344,158 |
| Realized and Unrealized Gain (Loss) | | |
| Net realized gain (loss) on: | | |
| Investment securities: | | |
| Unaffiliated issuers | 136,471,013 | |
| Fidelity Central Funds | 12,042 | |
| Other affiliated issuers | (46,832,883) | |
| Foreign currency transactions | 165,661 | |
| Total net realized gain (loss) | | 89,815,833 |
| Change in net unrealized appreciation (depreciation) on: | | |
| Investment securities: | | |
| Unaffiliated issuers | 746,205,124 | |
| Fidelity Central Funds | (46) | |
| Other affiliated issuers | 26,234,382 | |
| Assets and liabilities in foreign currencies | (95,049) | |
| Total change in net unrealized appreciation (depreciation) | | 772,344,411 |
| Net gain (loss) | | 862,160,244 |
| Net increase (decrease) in net assets resulting from operations | | $879,504,402 |
See accompanying notes which are an integral part of the financial statements.
Statement of Changes in Net Assets
| | Six months ended August 31, 2020 (Unaudited) | Year ended February 29, 2020 |
| Increase (Decrease) in Net Assets | | |
| Operations | | |
| Net investment income (loss) | $17,344,158 | $30,185,284 |
| Net realized gain (loss) | 89,815,833 | 423,622,859 |
| Change in net unrealized appreciation (depreciation) | 772,344,411 | 300,175,424 |
| Net increase (decrease) in net assets resulting from operations | 879,504,402 | 753,983,567 |
| Distributions to shareholders | (228,759,621) | (137,447,610) |
| Share transactions | | |
| Proceeds from sales of shares | 371,391,242 | 1,132,808,025 |
| Reinvestment of distributions | 219,020,909 | 131,251,931 |
| Cost of shares redeemed | (778,462,336) | (1,154,544,829) |
| Net increase (decrease) in net assets resulting from share transactions | (188,050,185) | 109,515,127 |
| Total increase (decrease) in net assets | 462,694,596 | 726,051,084 |
| Net Assets | | |
| Beginning of period | 3,778,556,782 | 3,052,505,698 |
| End of period | $4,241,251,378 | $3,778,556,782 |
| Other Information | | |
| Shares | | |
| Sold | 33,643,114 | 100,264,558 |
| Issued in reinvestment of distributions | 21,706,732 | 10,533,281 |
| Redeemed | (70,860,850) | (105,721,572) |
| Net increase (decrease) | (15,511,004) | 5,076,267 |
See accompanying notes which are an integral part of the financial statements.
Financial Highlights
Semiconductors Portfolio
| | Six months ended (Unaudited) August 31, | Years endedFebruary 29, | | | | |
| | 2020 | 2020 A | 2019 B | 2018 B | 2017 B | 2016 A,B |
| Selected Per–Share Data | | | | | | |
| Net asset value, beginning of period | $11.47 | $9.41 | $11.77 | $10.12 | $6.99 | $8.95 |
| Income from Investment Operations | | | | | | |
| Net investment income (loss)C | .05 | .09 | .10 | .05 | .10 | .07 |
| Net realized and unrealized gain (loss) | 2.72 | 2.39 | (.35) | 3.24 | 3.40 | (.88) |
| Total from investment operations | 2.77 | 2.48 | (.25) | 3.29 | 3.50 | (.81) |
| Distributions from net investment income | –D | (.10) | (.06) | (.12) | (.07) | (.08) |
| Distributions from net realized gain | (.73) | (.33) | (2.05) | (1.52) | (.30) | (1.07) |
| Total distributions | (.73) | (.42)E | (2.11) | (1.64) | (.37) | (1.15) |
| Redemption fees added to paid in capitalC | – | – | – | –D | –D | –D |
| Net asset value, end of period | $13.51 | $11.47 | $9.41 | $11.77 | $10.12 | $6.99 |
| Total ReturnF,G | 26.32% | 26.01% | .19% | 34.20% | 51.79% | (10.44)% |
| Ratios to Average Net AssetsH,I | | | | | | |
| Expenses before reductions | .71%J | .72% | .73% | .75% | .77% | .77% |
| Expenses net of fee waivers, if any | .71%J | .72% | .73% | .75% | .77% | .77% |
| Expenses net of all reductions | .69%J | .71% | .72% | .74% | .75% | .74% |
| Net investment income (loss) | .93%J | .85% | .92% | .47% | 1.19% | .88% |
| Supplemental Data | | | | | | |
| Net assets, end of period (000 omitted) | $4,241,251 | $3,778,557 | $3,052,506 | $3,652,565 | $3,012,372 | $1,338,175 |
| Portfolio turnover rateK | 131%J | 114% | 130% | 110% | 110% | 179% |
A For the year ended February 29.
B Per share amounts have been adjusted to reflect the impact of the 10 for 1 share split that occurred on May 11, 2018.
C Calculated based on average shares outstanding during the period.
D Amount represents less than $.005 per share.
E Total distributions of $.42 per share is comprised of distributions from net investment income of $.095 and distributions from net realized gain of $.326 per share.
F Total returns for periods of less than one year are not annualized.
G Total returns would have been lower if certain expenses had not been reduced during the applicable periods shown.
H Fees and expenses of any underlying mutual funds or exchange-traded funds (ETFs) are not included in the Fund's expense ratio. The Fund indirectly bears its proportionate share of these expenses. For additional expense information related to investments in Fidelity Central Funds, please refer to the "Investments in Fidelity Central Funds" note found in the Notes to Financial Statements section of the most recent Annual or Semi-Annual report.
I Expense ratios reflect operating expenses of the class. Expenses before reductions do not reflect amounts reimbursed, waived, or reduced through arrangements with the investment advisor, brokerage services, or other offset arrangements, if applicable, and do not represent the amount paid by the class during periods when reimbursements, waivers or reductions occur.
J Annualized
K Amount does not include the portfolio activity of any underlying Fidelity Central Funds.
See accompanying notes which are an integral part of the financial statements.
Software and IT Services Portfolio
Investment Summary (Unaudited)
Top Ten Stocks as of August 31, 2020
| | % of fund's net assets |
| Microsoft Corp. | 23.9 |
| Visa, Inc. Class A | 6.5 |
| Adobe, Inc. | 6.3 |
| Salesforce.com, Inc. | 6.0 |
| MasterCard, Inc. Class A | 5.6 |
| PayPal Holdings, Inc. | 4.8 |
| Alphabet, Inc. Class A | 2.4 |
| Cognizant Technology Solutions Corp. Class A | 2.0 |
| Oracle Corp. | 2.0 |
| Autodesk, Inc. | 2.0 |
| | 61.5 |
Top Industries (% of fund's net assets)
| As of August 31, 2020 |
| | Software | 56.8% |
| | IT Services | 31.0% |
| | Interactive Media & Services | 4.2% |
| | Entertainment | 1.6% |
| | Internet & Direct Marketing Retail | 0.9% |
| | All Others* | 5.5% |

* Includes short-term investments and net other assets (liabilities).
Software and IT Services Portfolio
Schedule of Investments August 31, 2020 (Unaudited)
Showing Percentage of Net Assets
| Common Stocks - 95.9% | | | |
| | | Shares | Value |
| Electronic Equipment & Components - 0.6% | | | |
| Electronic Equipment & Instruments - 0.6% | | | |
| Trimble, Inc. (a) | | 1,289,200 | $67,566,972 |
| Entertainment - 1.6% | | | |
| Interactive Home Entertainment - 1.6% | | | |
| Activision Blizzard, Inc. | | 952,800 | 79,577,856 |
| Electronic Arts, Inc. (a) | | 762,400 | 106,331,928 |
| | | | 185,909,784 |
| Interactive Media & Services - 4.2% | | | |
| Interactive Media & Services - 4.2% | | | |
| Alphabet, Inc. Class A (a) | | 169,000 | 275,390,570 |
| Facebook, Inc. Class A (a) | | 420,300 | 123,231,960 |
| Twitter, Inc. (a) | | 2,118,100 | 85,952,498 |
| | | | 484,575,028 |
| Internet & Direct Marketing Retail - 0.9% | | | |
| Internet & Direct Marketing Retail - 0.9% | | | |
| Alibaba Group Holding Ltd. sponsored ADR (a) | | 352,800 | 101,264,184 |
| IT Services - 31.0% | | | |
| Data Processing & Outsourced Services - 20.4% | | | |
| Automatic Data Processing, Inc. | | 314,800 | 43,785,532 |
| ExlService Holdings, Inc. (a) | | 731,500 | 46,589,235 |
| Fidelity National Information Services, Inc. | | 103,800 | 15,658,230 |
| Fiserv, Inc. (a) | | 241,900 | 24,088,402 |
| FleetCor Technologies, Inc. (a) | | 153,200 | 38,522,140 |
| Global Payments, Inc. | | 939,870 | 165,999,839 |
| MasterCard, Inc. Class A | | 1,808,700 | 647,858,253 |
| Paychex, Inc. | | 643,400 | 49,200,798 |
| PayPal Holdings, Inc. (a) | | 2,698,000 | 550,769,720 |
| Visa, Inc. Class A (b) | | 3,547,320 | 751,996,367 |
| WEX, Inc. (a) | | 189,700 | 30,296,987 |
| | | | 2,364,765,503 |
| Internet Services & Infrastructure - 2.8% | | | |
| Akamai Technologies, Inc. (a) | | 925,300 | 107,732,679 |
| GoDaddy, Inc. (a) | | 1,353,600 | 113,269,248 |
| Twilio, Inc. Class A (a) | | 391,400 | 105,584,064 |
| | | | 326,585,991 |
| IT Consulting & Other Services - 7.8% | | | |
| Accenture PLC Class A | | 649,900 | 155,930,507 |
| CACI International, Inc. Class A (a) | | 12,000 | 2,810,280 |
| Capgemini SA | | 969,200 | 134,165,000 |
| Cognizant Technology Solutions Corp. Class A | | 3,566,700 | 238,469,562 |
| DXC Technology Co. | | 1,118,400 | 22,345,632 |
| Gartner, Inc. (a) | | 974,000 | 126,444,680 |
| IBM Corp. | | 1,473,500 | 181,697,285 |
| Liveramp Holdings, Inc. (a) | | 889,700 | 49,680,848 |
| | | | 911,543,794 |
|
| TOTAL IT SERVICES | | | 3,602,895,288 |
|
| Media - 0.3% | | | |
| Publishing - 0.3% | | | |
| The New York Times Co. Class A | | 808,600 | 35,036,638 |
| Road & Rail - 0.4% | | | |
| Trucking - 0.4% | | | |
| Uber Technologies, Inc. (a) | | 1,463,900 | 49,230,957 |
| Software - 56.8% | | | |
| Application Software - 27.2% | | | |
| Adobe, Inc. (a) | | 1,420,500 | 729,270,495 |
| Alteryx, Inc. Class A (a)(b) | | 243,700 | 29,446,271 |
| Anaplan, Inc. (a) | | 2,426,600 | 148,629,250 |
| Aspen Technology, Inc. (a) | | 486,100 | 61,749,283 |
| Autodesk, Inc. (a) | | 923,900 | 227,002,230 |
| Blackbaud, Inc. | | 749,100 | 47,830,035 |
| Box, Inc. Class A (a) | | 445,600 | 8,747,128 |
| Ceridian HCM Holding, Inc. (a) | | 36,900 | 2,934,288 |
| Citrix Systems, Inc. | | 204,950 | 29,758,740 |
| Constellation Software, Inc. | | 27,200 | 31,488,272 |
| Dropbox, Inc. Class A (a) | | 743,000 | 15,729,310 |
| Elastic NV (a) | | 776,400 | 84,301,512 |
| HubSpot, Inc. (a) | | 299,200 | 89,664,256 |
| Intuit, Inc. | | 263,800 | 91,113,882 |
| Micro Focus International PLC | | 2,089,564 | 8,289,887 |
| Mimecast Ltd. (a) | | 789,400 | 38,870,056 |
| New Relic, Inc. (a) | | 994,900 | 61,116,707 |
| Parametric Technology Corp. (a) | | 1,147,700 | 104,911,257 |
| Pluralsight, Inc. (a)(b) | | 4,730,200 | 90,536,028 |
| RealPage, Inc. (a) | | 982,400 | 61,517,888 |
| Salesforce.com, Inc. (a) | | 2,568,326 | 700,254,084 |
| Slack Technologies, Inc. Class A (a)(b) | | 3,209,780 | 105,409,175 |
| Smartsheet, Inc. (a) | | 940,300 | 51,274,559 |
| Workday, Inc. Class A (a) | | 785,500 | 188,292,205 |
| Workiva, Inc. (a) | | 862,200 | 50,869,800 |
| Zendesk, Inc. (a) | | 1,045,200 | 100,736,376 |
| | | | 3,159,742,974 |
| Systems Software - 29.6% | | | |
| FireEye, Inc. (a)(b) | | 3,422,300 | 50,239,364 |
| Microsoft Corp. | | 12,308,600 | 2,775,958,559 |
| Nortonlifelock, Inc. | | 4,032,300 | 94,839,696 |
| Oracle Corp. | | 4,003,727 | 229,093,259 |
| Palo Alto Networks, Inc. (a) | | 492,300 | 126,722,943 |
| Proofpoint, Inc. (a) | | 463,881 | 50,873,829 |
| Talend SA ADR (a)(b) | | 734,685 | 30,254,328 |
| Tenable Holdings, Inc. (a) | | 1,617,600 | 60,886,464 |
| Zuora, Inc. (a) | | 1,709,300 | 23,229,387 |
| | | | 3,442,097,829 |
|
| TOTAL SOFTWARE | | | 6,601,840,803 |
|
| Technology Hardware, Storage & Peripherals - 0.1% | | | |
| Technology Hardware, Storage & Peripherals - 0.1% | | | |
| Apple, Inc. | | 127,100 | 16,400,984 |
| TOTAL COMMON STOCKS | | | |
| (Cost $5,453,558,653) | | | 11,144,720,638 |
|
| Money Market Funds - 8.6% | | | |
| Fidelity Cash Central Fund 0.12% (c) | | 437,309,868 | 437,397,330 |
| Fidelity Securities Lending Cash Central Fund 0.11% (c)(d) | | 564,392,902 | 564,449,341 |
| TOTAL MONEY MARKET FUNDS | | | |
| (Cost $1,001,842,826) | | | 1,001,846,671 |
| TOTAL INVESTMENT IN SECURITIES - 104.5% | | | |
| (Cost $6,455,401,479) | | | 12,146,567,309 |
| NET OTHER ASSETS (LIABILITIES) - (4.5)% | | | (525,251,391) |
| NET ASSETS - 100% | | | $11,621,315,918 |
Legend
(a) Non-income producing
(b) Security or a portion of the security is on loan at period end.
(c) Affiliated fund that is generally available only to investment companies and other accounts managed by Fidelity Investments. The rate quoted is the annualized seven-day yield of the fund at period end. A complete unaudited listing of the fund's holdings as of its most recent quarter end is available upon request. In addition, each Fidelity Central Fund's financial statements are available on the SEC's website or upon request.
(d) Investment made with cash collateral received from securities on loan.
Affiliated Central Funds
Information regarding fiscal year to date income earned by the Fund from investments in Fidelity Central Funds is as follows:
| Fund | Income earned |
| Fidelity Cash Central Fund | $314,865 |
| Fidelity Securities Lending Cash Central Fund | 388,808 |
| Total | $703,673 |
Amounts in the income column in the above table include any capital gain distributions from underlying funds, which are presented in the corresponding line-item in the Statement of Operations, if applicable. Amount for Fidelity Securities Lending Cash Central Fund represents the income earned on investing cash collateral, less rebates paid to borrowers and any lending agent fees associated with the loan, plus any premium payments received for lending certain types of securities.
Investment Valuation
The following is a summary of the inputs used, as of August 31, 2020, involving the Fund's assets and liabilities carried at fair value. The inputs or methodology used for valuing securities may not be an indication of the risk associated with investing in those securities. For more information on valuation inputs, and their aggregation into the levels used below, please refer to the Investment Valuation section in the accompanying Notes to Financial Statements.
| | Valuation Inputs at Reporting Date: |
| Description | Total | Level 1 | Level 2 | Level 3 |
| Investments in Securities: | | | | |
| Common Stocks | $11,144,720,638 | $11,136,430,751 | $8,289,887 | $-- |
| Money Market Funds | 1,001,846,671 | 1,001,846,671 | -- | -- |
| Total Investments in Securities: | $12,146,567,309 | $12,138,277,422 | $8,289,887 | $-- |
See accompanying notes which are an integral part of the financial statements.
Software and IT Services Portfolio
Financial Statements
Statement of Assets and Liabilities
| | | August 31, 2020 (Unaudited) |
| Assets | | |
Investment in securities, at value (including securities loaned of $547,739,704) — See accompanying schedule:
Unaffiliated issuers (cost $5,453,558,653) | $11,144,720,638 | |
| Fidelity Central Funds (cost $1,001,842,826) | 1,001,846,671 | |
| Total Investment in Securities (cost $6,455,401,479) | | $12,146,567,309 |
| Receivable for investments sold | | 27,501,935 |
| Receivable for forward foreign currency contracts | | 4,430,895 |
| Receivable for fund shares sold | | 29,054,295 |
| Dividends receivable | | 10,247,425 |
| Distributions receivable from Fidelity Central Funds | | 133,841 |
| Prepaid expenses | | 53,481 |
| Other receivables | | 449,050 |
| Total assets | | 12,218,438,231 |
| Liabilities | | |
| Payable for investments purchased | $7,423,320 | |
| Payable for forward foreign currency contracts | 4,430,924 | |
| Payable for fund shares redeemed | 14,330,932 | |
| Accrued management fee | 4,803,715 | |
| Other affiliated payables | 1,360,855 | |
| Other payables and accrued expenses | 343,899 | |
| Collateral on securities loaned | 564,428,668 | |
| Total liabilities | | 597,122,313 |
| Net Assets | | $11,621,315,918 |
| Net Assets consist of: | | |
| Paid in capital | | $5,639,147,330 |
| Total accumulated earnings (loss) | | 5,982,168,588 |
| Net Assets | | $11,621,315,918 |
| Net Asset Value, offering price and redemption price per share ($11,621,315,918 ÷ 444,753,923 shares) | | $26.13 |
See accompanying notes which are an integral part of the financial statements.
Statement of Operations
| | | Six months ended August 31, 2020 (Unaudited) |
| Investment Income | | |
| Dividends | | $28,321,956 |
| Income from Fidelity Central Funds (including $388,808 from security lending) | | 703,673 |
| Total income | | 29,025,629 |
| Expenses | | |
| Management fee | $24,105,245 | |
| Transfer agent fees | 6,800,625 | |
| Accounting fees | 623,844 | |
| Custodian fees and expenses | 31,149 | |
| Independent trustees' fees and expenses | 27,049 | |
| Registration fees | 266,932 | |
| Audit | 25,143 | |
| Legal | 5,810 | |
| Miscellaneous | 114,636 | |
| Total expenses before reductions | 32,000,433 | |
| Expense reductions | (146,551) | |
| Total expenses after reductions | | 31,853,882 |
| Net investment income (loss) | | (2,828,253) |
| Realized and Unrealized Gain (Loss) | | |
| Net realized gain (loss) on: | | |
| Investment securities: | | |
| Unaffiliated issuers | 299,088,426 | |
| Fidelity Central Funds | (3,865) | |
| Foreign currency transactions | 18,803 | |
| Total net realized gain (loss) | | 299,103,364 |
| Change in net unrealized appreciation (depreciation) on: | | |
| Investment securities: | | |
| Unaffiliated issuers | 2,643,232,259 | |
| Assets and liabilities in foreign currencies | (1,071) | |
| Total change in net unrealized appreciation (depreciation) | | 2,643,231,188 |
| Net gain (loss) | | 2,942,334,552 |
| Net increase (decrease) in net assets resulting from operations | | $2,939,506,299 |
See accompanying notes which are an integral part of the financial statements.
Statement of Changes in Net Assets
| | Six months ended August 31, 2020 (Unaudited) | Year ended February 29, 2020 |
| Increase (Decrease) in Net Assets | | |
| Operations | | |
| Net investment income (loss) | $(2,828,253) | $72,771,236 |
| Net realized gain (loss) | 299,103,364 | 418,200,625 |
| Change in net unrealized appreciation (depreciation) | 2,643,231,188 | 879,024,590 |
| Net increase (decrease) in net assets resulting from operations | 2,939,506,299 | 1,369,996,451 |
| Distributions to shareholders | (222,739,128) | (906,376,597) |
| Share transactions | | |
| Proceeds from sales of shares | 2,217,672,697 | 1,845,099,056 |
| Reinvestment of distributions | 210,957,171 | 859,465,256 |
| Cost of shares redeemed | (1,555,991,951) | (1,677,168,985) |
| Net increase (decrease) in net assets resulting from share transactions | 872,637,917 | 1,027,395,327 |
| Total increase (decrease) in net assets | 3,589,405,088 | 1,491,015,181 |
| Net Assets | | |
| Beginning of period | 8,031,910,830 | 6,540,895,649 |
| End of period | $11,621,315,918 | $8,031,910,830 |
| Other Information | | |
| Shares | | |
| Sold | 106,099,883 | 94,168,380 |
| Issued in reinvestment of distributions | 11,622,985 | 46,835,753 |
| Redeemed | (76,640,857) | (86,927,730) |
| Net increase (decrease) | 41,082,011 | 54,076,403 |
See accompanying notes which are an integral part of the financial statements.
Financial Highlights
Software and IT Services Portfolio
| | Six months ended (Unaudited) August 31, | Years endedFebruary 29, | | | | |
| | 2020 | 2020 A | 2019 B | 2018 B | 2017 B | 2016 A,B |
| Selected Per–Share Data | | | | | | |
| Net asset value, beginning of period | $19.90 | $18.71 | $17.89 | $14.09 | $11.11 | $11.94 |
| Income from Investment Operations | | | | | | |
| Net investment income (loss)C | (.01) | .19D | .02 | (.02) | (.01) | .01 |
| Net realized and unrealized gain (loss) | 6.80 | 3.52 | 1.81 | 5.01 | 3.50 | (.20) |
| Total from investment operations | 6.79 | 3.71 | 1.83 | 4.99 | 3.49 | (.19) |
| Distributions from net investment income | (.15) | (.05) | (.01) | – | (.01) | (.01) |
| Distributions from net realized gain | (.41) | (2.47) | (1.00) | (1.19) | (.50) | (.63) |
| Total distributions | (.56) | (2.52) | (1.01) | (1.19) | (.51) | (.64) |
| Redemption fees added to paid in capitalC | – | – | – | – | –E | –E |
| Net asset value, end of period | $26.13 | $19.90 | $18.71 | $17.89 | $14.09 | $11.11 |
| Total ReturnF,G | 35.35% | 21.33% | 10.90% | 36.76% | 31.83% | (1.84)% |
| Ratios to Average Net AssetsH,I | | | | | | |
| Expenses before reductions | .70%J | .70% | .72% | .73% | .76% | .77% |
| Expenses net of fee waivers, if any | .70%J | .70% | .72% | .73% | .76% | .76% |
| Expenses net of all reductions | .70%J | .70% | .71% | .73% | .75% | .76% |
| Net investment income (loss) | (.06)%J | .98%D | .10% | (.09)% | (.11)% | .10% |
| Supplemental Data | | | | | | |
| Net assets, end of period (000 omitted) | $11,621,316 | $8,031,911 | $6,540,896 | $5,539,357 | $4,155,435 | $2,971,370 |
| Portfolio turnover rateK | 30%J | 23% | 48% | 31% | 44% | 36% |
A For the year ended February 29.
B Per share amounts have been adjusted to reflect the impact of the 10 for 1 share split that occurred on May 11, 2018.
C Calculated based on average shares outstanding during the period.
D Net investment income per share reflects one or more large, non-recurring dividend(s) which amounted to $.15 per share. Excluding such non-recurring dividend(s), the ratio of net investment income (loss) to average net assets would have been .22%.
E Amount represents less than $.005 per share.
F Total returns for periods of less than one year are not annualized.
G Total returns would have been lower if certain expenses had not been reduced during the applicable periods shown.
H Fees and expenses of any underlying mutual funds or exchange-traded funds (ETFs) are not included in the Fund's expense ratio. The Fund indirectly bears its proportionate share of these expenses. For additional expense information related to investments in Fidelity Central Funds, please refer to the "Investments in Fidelity Central Funds" note found in the Notes to Financial Statements section of the most recent Annual or Semi-Annual report.
I Expense ratios reflect operating expenses of the class. Expenses before reductions do not reflect amounts reimbursed, waived, or reduced through arrangements with the investment advisor, brokerage services, or other offset arrangements, if applicable, and do not represent the amount paid by the class during periods when reimbursements, waivers or reductions occur.
J Annualized
K Amount does not include the portfolio activity of any underlying Fidelity Central Funds.
See accompanying notes which are an integral part of the financial statements.
Technology Portfolio
Investment Summary (Unaudited)
Top Ten Stocks as of August 31, 2020
| | % of fund's net assets |
| Microsoft Corp. | 18.5 |
| Apple, Inc. | 13.0 |
| MasterCard, Inc. Class A | 4.6 |
| NVIDIA Corp. | 3.3 |
| Uber Technologies, Inc. | 3.2 |
| Salesforce.com, Inc. | 3.0 |
| Alibaba Group Holding Ltd. sponsored ADR | 2.9 |
| Visa, Inc. Class A | 2.3 |
| Fidelity National Information Services, Inc. | 2.2 |
| Vivint Solar, Inc. | 2.1 |
| | 55.1 |
Top Industries (% of fund's net assets)
| As of August 31, 2020 |
| | Software | 37.9% |
| | IT Services | 17.5% |
| | Technology Hardware, Storage & Peripherals | 13.2% |
| | Semiconductors & Semiconductor Equipment | 10.2% |
| | Road & Rail | 3.6% |
| | All Others* | 17.6% |
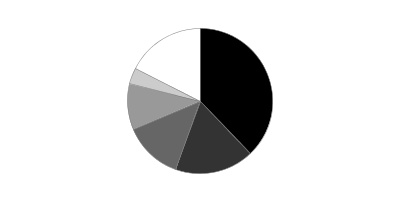
* Includes short-term investments and net other assets (liabilities).
Technology Portfolio
Schedule of Investments August 31, 2020 (Unaudited)
Showing Percentage of Net Assets
| Common Stocks - 99.2% | | | |
| | | Shares | Value |
| Aerospace & Defense - 0.6% | | | |
| Aerospace & Defense - 0.6% | | | |
| Axon Enterprise, Inc. (a)(b) | | 710,802 | $60,901,515 |
| Automobiles - 0.1% | | | |
| Automobile Manufacturers - 0.1% | | | |
| XPeng, Inc. ADR (a) | | 613,600 | 12,578,800 |
| Chemicals - 0.7% | | | |
| Commodity Chemicals - 0.4% | | | |
| LG Chemical Ltd. | | 68,790 | 42,866,851 |
| Specialty Chemicals - 0.3% | | | |
| Amyris, Inc. (a)(b) | | 7,840,300 | 25,716,184 |
| Livent Corp. (a) | | 639,500 | 5,422,960 |
| | | | 31,139,144 |
|
| TOTAL CHEMICALS | | | 74,005,995 |
|
| Communications Equipment - 0.4% | | | |
| Communications Equipment - 0.4% | | | |
| Ericsson (B Shares) sponsored ADR | | 3,211,800 | 37,417,470 |
| Construction & Engineering - 0.1% | | | |
| Construction & Engineering - 0.1% | | | |
| Dycom Industries, Inc. (a) | | 133,223 | 8,194,547 |
| Diversified Telecommunication Services - 0.1% | | | |
| Alternative Carriers - 0.1% | | | |
| Vonage Holdings Corp. (a) | | 1,127,800 | 12,913,310 |
| Electrical Equipment - 2.6% | | | |
| Electrical Components & Equipment - 2.6% | | | |
| Sunrun, Inc. (a) | | 950,458 | 53,753,152 |
| Vivint Solar, Inc. (a)(c) | | 7,130,200 | 220,180,576 |
| | | | 273,933,728 |
| Electronic Equipment & Components - 2.4% | | | |
| Electronic Components - 0.4% | | | |
| II-VI, Inc. (a)(b) | | 846,925 | 37,688,163 |
| Electronic Manufacturing Services - 1.7% | | | |
| Flextronics International Ltd. (a) | | 9,504,396 | 103,217,741 |
| Jabil, Inc. | | 2,308,416 | 78,832,406 |
| | | | 182,050,147 |
| Technology Distributors - 0.3% | | | |
| Avnet, Inc. | | 391,018 | 10,756,905 |
| CDW Corp. | | 158,500 | 18,013,525 |
| | | | 28,770,430 |
|
| TOTAL ELECTRONIC EQUIPMENT & COMPONENTS | | | 248,508,740 |
|
| Entertainment - 0.2% | | | |
| Interactive Home Entertainment - 0.2% | | | |
| Bilibili, Inc. ADR (a) | | 430,200 | 20,326,950 |
| Equity Real Estate Investment Trusts (REITs) - 0.5% | | | |
| Diversified REITs - 0.5% | | | |
| Ant International Co. Ltd. Class C (a)(d)(e) | | 4,366,389 | 48,204,935 |
| Health Care Providers & Services - 0.2% | | | |
| Health Care Services - 0.2% | | | |
| Ontrak, Inc. (a)(b) | | 228,300 | 16,654,485 |
| Household Durables - 0.9% | | | |
| Consumer Electronics - 0.9% | | | |
| Sony Corp. | | 1,115,300 | 87,332,901 |
| Sony Corp. sponsored ADR | | 115,300 | 9,067,192 |
| | | | 96,400,093 |
| Interactive Media & Services - 3.1% | | | |
| Interactive Media & Services - 3.1% | | | |
| Eventbrite, Inc. (a)(b) | | 2,030,563 | 21,828,552 |
| Facebook, Inc. Class A (a) | | 533,000 | 156,275,600 |
| Wise Talent Information Technology Co. Ltd. (a) | | 14,586,926 | 36,593,682 |
| Yahoo! Japan Corp. | | 11,418,538 | 76,004,997 |
| Zoominfo Technologies, Inc. | | 904,100 | 35,097,162 |
| | | | 325,799,993 |
| Internet & Direct Marketing Retail - 3.1% | | | |
| Internet & Direct Marketing Retail - 3.1% | | | |
| Alibaba Group Holding Ltd. | | 413,400 | 14,880,272 |
| Alibaba Group Holding Ltd. sponsored ADR (a) | | 1,066,200 | 306,031,386 |
| | | | 320,911,658 |
| IT Services - 17.5% | | | |
| Data Processing & Outsourced Services - 14.1% | | | |
| Fidelity National Information Services, Inc. | | 1,532,827 | 231,226,953 |
| Fiserv, Inc. (a) | | 819,885 | 81,644,148 |
| Genpact Ltd. | | 3,592,200 | 151,518,996 |
| Global Payments, Inc. | | 203,030 | 35,859,159 |
| MasterCard, Inc. Class A | | 1,327,836 | 475,617,577 |
| PagSeguro Digital Ltd. (a) | | 207,100 | 8,727,194 |
| PayPal Holdings, Inc. (a) | | 899,700 | 183,664,758 |
| Sabre Corp. | | 1,188,500 | 8,307,615 |
| Square, Inc. (a) | | 296,000 | 47,229,760 |
| Visa, Inc. Class A | | 1,140,200 | 241,710,998 |
| | | | 1,465,507,158 |
| Internet Services & Infrastructure - 1.7% | | | |
| GoDaddy, Inc. (a) | | 802,800 | 67,178,304 |
| MongoDB, Inc. Class A (a)(b) | | 168,000 | 39,278,400 |
| Twilio, Inc. Class A (a) | | 265,400 | 71,594,304 |
| | | | 178,051,008 |
| IT Consulting & Other Services - 1.7% | | | |
| Capgemini SA | | 741,000 | 102,575,593 |
| Cognizant Technology Solutions Corp. Class A | | 871,500 | 58,268,490 |
| DXC Technology Co. | | 498,000 | 9,950,040 |
| | | | 170,794,123 |
|
| TOTAL IT SERVICES | | | 1,814,352,289 |
|
| Life Sciences Tools & Services - 0.0% | | | |
| Life Sciences Tools & Services - 0.0% | | | |
| JHL Biotech, Inc. (a)(e) | | 1,015,442 | 0 |
| Oil, Gas & Consumable Fuels - 0.9% | | | |
| Oil & Gas Refining & Marketing - 0.9% | | | |
| Reliance Industries Ltd. | | 3,127,200 | 88,821,675 |
| Reliance Industries Ltd. (a) | | 206,153 | 3,358,659 |
| Reliance Industries Ltd. sponsored GDR (f) | | 79,100 | 4,579,890 |
| | | | 96,760,224 |
| Pharmaceuticals - 0.0% | | | |
| Pharmaceuticals - 0.0% | | | |
| Chime Biologics Ltd. (e) | | 1,015,442 | 528,873 |
| Real Estate Management & Development - 0.1% | | | |
| Real Estate Services - 0.1% | | | |
| KE Holdings, Inc. ADR (a) | | 197,900 | 10,150,291 |
| Road & Rail - 3.6% | | | |
| Trucking - 3.6% | | | |
| Lyft, Inc. (a) | | 1,283,006 | 38,066,788 |
| Uber Technologies, Inc. (a) | | 10,042,396 | 337,725,777 |
| | | | 375,792,565 |
| Semiconductors & Semiconductor Equipment - 10.2% | | | |
| Semiconductors - 10.2% | | | |
| Advanced Micro Devices, Inc. (a) | | 1,248,300 | 113,370,606 |
| Cirrus Logic, Inc. (a) | | 230,545 | 13,968,722 |
| Marvell Technology Group Ltd. | | 4,321,554 | 167,589,864 |
| MediaTek, Inc. | | 758,000 | 14,344,236 |
| Micron Technology, Inc. (a) | | 2,284,700 | 103,976,697 |
| NVIDIA Corp. | | 636,550 | 340,541,519 |
| NXP Semiconductors NV | | 610,248 | 76,744,788 |
| ON Semiconductor Corp. (a) | | 3,272,600 | 69,935,462 |
| Qualcomm, Inc. | | 865,300 | 103,057,230 |
| Semtech Corp. (a) | | 16,700 | 979,455 |
| Taiwan Semiconductor Manufacturing Co. Ltd. | | 1,421,000 | 20,683,346 |
| Universal Display Corp. | | 79,700 | 13,987,350 |
| Xilinx, Inc. | | 251,100 | 26,154,576 |
| | | | 1,065,333,851 |
| Software - 37.9% | | | |
| Application Software - 14.7% | | | |
| Adobe, Inc. (a) | | 377,039 | 193,568,052 |
| Autodesk, Inc. (a) | | 591,800 | 145,405,260 |
| Citrix Systems, Inc. | | 123,600 | 17,946,720 |
| Digital Turbine, Inc. (a) | | 65,400 | 1,582,026 |
| Elastic NV (a) | | 1,020,500 | 110,805,890 |
| HubSpot, Inc. (a) | | 59,800 | 17,920,864 |
| LivePerson, Inc. (a)(b) | | 1,762,078 | 105,125,573 |
| Nuance Communications, Inc. (a) | | 830,700 | 24,887,772 |
| Nutanix, Inc. Class B (a)(f) | | 72,872 | 2,092,155 |
| Pluralsight, Inc. (a) | | 1,697,700 | 32,493,978 |
| RealPage, Inc. (a) | | 217,017 | 13,589,605 |
| RingCentral, Inc. (a) | | 125,700 | 36,549,789 |
| Salesforce.com, Inc. (a) | | 1,139,088 | 310,572,343 |
| Snowflake Computing, Inc. Class B (d) | | 5,220 | 202,379 |
| Splunk, Inc. (a) | | 124,000 | 27,196,920 |
| SS&C Technologies Holdings, Inc. | | 998,300 | 63,611,676 |
| SurveyMonkey (a) | | 3,892,426 | 96,882,483 |
| Workday, Inc. Class A (a) | | 687,433 | 164,784,564 |
| Workiva, Inc. (a) | | 305,548 | 18,027,332 |
| Yext, Inc. (a)(b) | | 2,744,600 | 54,507,756 |
| Zendesk, Inc. (a) | | 992,400 | 95,647,512 |
| | | | 1,533,400,649 |
| Systems Software - 23.2% | | | |
| Cloudflare, Inc. (a) | | 2,031,000 | 77,706,060 |
| Crowdstrike Holdings, Inc. (a) | | 8,900 | 1,118,997 |
| Microsoft Corp. | | 8,509,140 | 1,919,066,346 |
| Nortonlifelock, Inc. | | 6,509,606 | 153,105,933 |
| Oracle Corp. | | 1,874,700 | 107,270,334 |
| Rapid7, Inc. (a)(b) | | 1,075,709 | 69,458,530 |
| Tenable Holdings, Inc. (a) | | 2,144,230 | 80,708,817 |
| | | | 2,408,435,017 |
|
| TOTAL SOFTWARE | | | 3,941,835,666 |
|
| Specialty Retail - 0.1% | | | |
| Specialty Stores - 0.1% | | | |
| Musti Group OYJ | | 295,400 | 6,369,957 |
| Technology Hardware, Storage & Peripherals - 13.2% | | | |
| Technology Hardware, Storage & Peripherals - 13.2% | | | |
| Apple, Inc. | | 10,451,888 | 1,348,711,628 |
| Samsung Electronics Co. Ltd. | | 380,900 | 17,320,853 |
| Western Digital Corp. | | 252,300 | 9,693,366 |
| | | | 1,375,725,847 |
| Wireless Telecommunication Services - 0.7% | | | |
| Wireless Telecommunication Services - 0.7% | | | |
| T-Mobile U.S., Inc. | | 637,300 | 74,360,164 |
| TOTAL COMMON STOCKS | | | |
| (Cost $6,756,011,156) | | | 10,317,961,946 |
|
| Convertible Preferred Stocks - 0.3% | | | |
| Food & Staples Retailing - 0.2% | | | |
| Food Retail - 0.2% | | | |
| Roofoods Ltd. Series F(a)(d)(e) | | 41,041 | 15,807,352 |
| Internet & Direct Marketing Retail - 0.1% | | | |
| Internet & Direct Marketing Retail - 0.1% | | | |
| Reddit, Inc. Series D (a)(d)(e) | | 250,861 | 12,299,715 |
| Road & Rail - 0.0% | | | |
| Trucking - 0.0% | | | |
| Convoy, Inc. Series D (d)(e) | | 203,844 | 2,939,430 |
| Software - 0.0% | | | |
| Application Software - 0.0% | | | |
| UiPath, Inc.: | | | |
| Series A1 (a)(d)(e) | | 76,971 | 1,431,157 |
| Series B1 (a)(d)(e) | | 3,834 | 71,287 |
| Series B2 (a)(d)(e) | | 19,095 | 355,042 |
| | | | 1,857,486 |
| TOTAL CONVERTIBLE PREFERRED STOCKS | | | |
| (Cost $24,021,597) | | | 32,903,983 |
|
| Money Market Funds - 2.7% | | | |
| Fidelity Cash Central Fund 0.12% (g) | | 165,338,885 | 165,371,953 |
| Fidelity Securities Lending Cash Central Fund 0.11% (g)(h) | | 111,168,495 | 111,179,612 |
| TOTAL MONEY MARKET FUNDS | | | |
| (Cost $276,551,565) | | | 276,551,565 |
| TOTAL INVESTMENT IN SECURITIES - 102.2% | | | |
| (Cost $7,056,584,318) | | | 10,627,417,494 |
| NET OTHER ASSETS (LIABILITIES) - (2.2)% | | | (227,870,351) |
| NET ASSETS - 100% | | | $10,399,547,143 |
Legend
(a) Non-income producing
(b) Security or a portion of the security is on loan at period end.
(c) Affiliated company
(d) Restricted securities (including private placements) - Investment in securities not registered under the Securities Act of 1933 (excluding 144A issues). At the end of the period, the value of restricted securities (excluding 144A issues) amounted to $81,311,297 or 0.8% of net assets.
(e) Level 3 security
(f) Security exempt from registration under Rule 144A of the Securities Act of 1933. These securities may be resold in transactions exempt from registration, normally to qualified institutional buyers. At the end of the period, the value of these securities amounted to $6,672,045 or 0.1% of net assets.
(g) Affiliated fund that is generally available only to investment companies and other accounts managed by Fidelity Investments. The rate quoted is the annualized seven-day yield of the fund at period end. A complete unaudited listing of the fund's holdings as of its most recent quarter end is available upon request. In addition, each Fidelity Central Fund's financial statements are available on the SEC's website or upon request.
(h) Investment made with cash collateral received from securities on loan.
Additional information on each restricted holding is as follows:
| Security | Acquisition Date | Acquisition Cost |
| Ant International Co. Ltd. Class C | 5/16/18 | $24,495,442 |
| Convoy, Inc. Series D | 10/30/19 | $2,760,048 |
| Reddit, Inc. Series D | 2/4/19 | $5,440,247 |
| Roofoods Ltd. Series F | 9/12/17 | $14,510,890 |
| Snowflake Computing, Inc. Class B | 3/19/20 | $202,466 |
| UiPath, Inc. Series A1 | 6/14/19 | $1,009,647 |
| UiPath, Inc. Series B1 | 6/14/19 | $50,291 |
| UiPath, Inc. Series B2 | 6/14/19 | $250,474 |
Affiliated Central Funds
Information regarding fiscal year to date income earned by the Fund from investments in Fidelity Central Funds is as follows:
| Fund | Income earned |
| Fidelity Cash Central Fund | $76,564 |
| Fidelity Securities Lending Cash Central Fund | 259,556 |
| Total | $336,120 |
Amounts in the income column in the above table include any capital gain distributions from underlying funds, which are presented in the corresponding line-item in the Statement of Operations, if applicable. Amount for Fidelity Securities Lending Cash Central Fund represents the income earned on investing cash collateral, less rebates paid to borrowers and any lending agent fees associated with the loan, plus any premium payments received for lending certain types of securities.
Other Affiliated Issuers
An affiliated company is a company in which the Fund has ownership of at least 5% of the voting securities. Fiscal year to date transactions with companies which are or were affiliates are as follows:
| Affiliate | Value, beginning of period | Purchases | Sales Proceeds | Dividend Income | Realized Gain (loss) | Change in Unrealized appreciation (depreciation) | Value, end of period |
| Vivint Solar, Inc. | $-- | $165,632,260 | $8,468,477 | $-- | $488,527 | $62,528,266 | $220,180,576 |
| Total | $-- | $165,632,260 | $8,468,477 | $-- | $488,527 | $62,528,266 | $220,180,576 |
Investment Valuation
The following is a summary of the inputs used, as of August 31, 2020, involving the Fund's assets and liabilities carried at fair value. The inputs or methodology used for valuing securities may not be an indication of the risk associated with investing in those securities. For more information on valuation inputs, and their aggregation into the levels used below, please refer to the Investment Valuation section in the accompanying Notes to Financial Statements.
| | Valuation Inputs at Reporting Date: |
| Description | Total | Level 1 | Level 2 | Level 3 |
| Investments in Securities: | | | | |
| Common Stocks | $10,317,961,946 | $10,109,535,558 | $159,692,580 | $48,733,808 |
| Convertible Preferred Stocks | 32,903,983 | -- | -- | 32,903,983 |
| Money Market Funds | 276,551,565 | 276,551,565 | -- | -- |
| Total Investments in Securities: | $10,627,417,494 | $10,386,087,123 | $159,692,580 | $81,637,791 |
Other Information
Distribution of investments by country or territory of incorporation, as a percentage of Total Net Assets, is as follows (Unaudited):
| United States of America | 84.6% |
| Cayman Islands | 4.5% |
| Bermuda | 3.1% |
| Netherlands | 1.8% |
| Japan | 1.6% |
| Singapore | 1.0% |
| France | 1.0% |
| Others (Individually Less Than 1%) | 2.4% |
| | 100.0% |
See accompanying notes which are an integral part of the financial statements.
Technology Portfolio
Financial Statements
Statement of Assets and Liabilities
| | | August 31, 2020 (Unaudited) |
| Assets | | |
Investment in securities, at value (including securities loaned of $109,189,973) — See accompanying schedule:
Unaffiliated issuers (cost $6,622,380,443) | $10,130,685,353 | |
| Fidelity Central Funds (cost $276,551,565) | 276,551,565 | |
| Other affiliated issuers (cost $157,652,310) | 220,180,576 | |
| Total Investment in Securities (cost $7,056,584,318) | | $10,627,417,494 |
| Receivable for investments sold | | 110,328,229 |
| Receivable for fund shares sold | | 47,544,144 |
| Dividends receivable | | 5,230,362 |
| Distributions receivable from Fidelity Central Funds | | 237,227 |
| Prepaid expenses | | 59,093 |
| Other receivables | | 391,606 |
| Total assets | | 10,791,208,155 |
| Liabilities | | |
| Payable for investments purchased | $249,211,034 | |
| Payable for fund shares redeemed | 18,124,563 | |
| Accrued management fee | 4,224,168 | |
| Other affiliated payables | 1,102,223 | |
| Other payables and accrued expenses | 7,834,604 | |
| Collateral on securities loaned | 111,164,420 | |
| Total liabilities | | 391,661,012 |
| Net Assets | | $10,399,547,143 |
| Net Assets consist of: | | |
| Paid in capital | | $5,438,103,519 |
| Total accumulated earnings (loss) | | 4,961,443,624 |
| Net Assets | | $10,399,547,143 |
| Net Asset Value, offering price and redemption price per share ($10,399,547,143 ÷ 373,194,191 shares) | | $27.87 |
See accompanying notes which are an integral part of the financial statements.
Statement of Operations
| | | Six months ended August 31, 2020 (Unaudited) |
| Investment Income | | |
| Dividends | | $23,997,118 |
| Income from Fidelity Central Funds (including $259,556 from security lending) | | 336,120 |
| Total income | | 24,333,238 |
| Expenses | | |
| Management fee | $20,092,217 | |
| Transfer agent fees | 5,393,549 | |
| Accounting fees | 592,912 | |
| Custodian fees and expenses | 54,476 | |
| Independent trustees' fees and expenses | 22,217 | |
| Registration fees | 213,072 | |
| Audit | 22,649 | |
| Legal | 5,340 | |
| Interest | 14,306 | |
| Miscellaneous | 87,465 | |
| Total expenses before reductions | 26,498,203 | |
| Expense reductions | (199,691) | |
| Total expenses after reductions | | 26,298,512 |
| Net investment income (loss) | | (1,965,274) |
| Realized and Unrealized Gain (Loss) | | |
| Net realized gain (loss) on: | | |
| Investment securities: | | |
| Unaffiliated issuers | 1,414,671,257 | |
| Fidelity Central Funds | 17,993 | |
| Other affiliated issuers | 488,527 | |
| Foreign currency transactions | 114,372 | |
| Total net realized gain (loss) | | 1,415,292,149 |
| Change in net unrealized appreciation (depreciation) on: | | |
| Investment securities: | | |
| Unaffiliated issuers (net of increase in deferred foreign taxes of $7,257,181) | 1,725,305,567 | |
| Affiliated issuers | 62,528,266 | |
| Assets and liabilities in foreign currencies | (243,050) | |
| Total change in net unrealized appreciation (depreciation) | | 1,787,590,783 |
| Net gain (loss) | | 3,202,882,932 |
| Net increase (decrease) in net assets resulting from operations | | $3,200,917,658 |
See accompanying notes which are an integral part of the financial statements.
Statement of Changes in Net Assets
| | Six months ended August 31, 2020 (Unaudited) | Year ended February 29, 2020 |
| Increase (Decrease) in Net Assets | | |
| Operations | | |
| Net investment income (loss) | $(1,965,274) | $17,587,012 |
| Net realized gain (loss) | 1,415,292,149 | 433,691,557 |
| Change in net unrealized appreciation (depreciation) | 1,787,590,783 | 981,336,641 |
| Net increase (decrease) in net assets resulting from operations | 3,200,917,658 | 1,432,615,210 |
| Distributions to shareholders | (239,423,831) | (116,939,082) |
| Share transactions | | |
| Proceeds from sales of shares | 2,116,547,000 | 1,714,479,733 |
| Reinvestment of distributions | 227,976,797 | 111,024,657 |
| Cost of shares redeemed | (1,465,048,784) | (1,706,723,713) |
| Net increase (decrease) in net assets resulting from share transactions | 879,475,013 | 118,780,677 |
| Total increase (decrease) in net assets | 3,840,968,840 | 1,434,456,805 |
| Net Assets | | |
| Beginning of period | 6,558,578,303 | 5,124,121,498 |
| End of period | $10,399,547,143 | $6,558,578,303 |
| Other Information | | |
| Shares | | |
| Sold | 98,371,467 | 89,932,658 |
| Issued in reinvestment of distributions | 12,829,308 | 5,624,350 |
| Redeemed | (71,697,374) | (93,619,847) |
| Net increase (decrease) | 39,503,401 | 1,937,161 |
See accompanying notes which are an integral part of the financial statements.
Financial Highlights
Technology Portfolio
| | Six months ended (Unaudited) August 31, | Years endedFebruary 29, | | | | |
| | 2020 | 2020 A | 2019 B | 2018 B | 2017 B | 2016 A,B |
| Selected Per–Share Data | | | | | | |
| Net asset value, beginning of period | $19.65 | $15.45 | $19.36 | $14.70 | $10.78 | $12.09 |
| Income from Investment Operations | | | | | | |
| Net investment income (loss)C | (.01) | .05 | .06 | – | .01 | .01 |
| Net realized and unrealized gain (loss) | 8.96 | 4.52 | (.78) | 6.15 | 4.11 | (.82) |
| Total from investment operations | 8.95 | 4.57 | (.72) | 6.15 | 4.12 | (.81) |
| Distributions from net investment income | (.03) | (.05) | (.02) | – | (.01) | (.01) |
| Distributions from net realized gain | (.70) | (.32) | (3.17) | (1.49) | (.19) | (.49) |
| Total distributions | (.73) | (.37) | (3.19) | (1.49) | (.20) | (.50) |
| Redemption fees added to paid in capitalC | – | – | – | – | –D | –D |
| Net asset value, end of period | $27.87 | $19.65 | $15.45 | $19.36 | $14.70 | $10.78 |
| Total ReturnE,F | 47.63% | 29.57% | (3.03)% | 43.71% | 38.52% | (7.16)% |
| Ratios to Average Net AssetsG,H | | | | | | |
| Expenses before reductions | .70%I | .71% | .72% | .75% | .77% | .78% |
| Expenses net of fee waivers, if any | .70%I | .71% | .72% | .75% | .77% | .77% |
| Expenses net of all reductions | .69%I | .71% | .71% | .74% | .76% | .76% |
| Net investment income (loss) | (.05)%I | .30% | .34% | .01% | .11% | .11% |
| Supplemental Data | | | | | | |
| Net assets, end of period (000 omitted) | $10,399,547 | $6,558,578 | $5,124,121 | $7,242,300 | $4,119,489 | $2,777,346 |
| Portfolio turnover rateJ | 110%I | 32%K | 126%K | 71% | 82% | 130% |
A For the year ended February 29.
B Per share amounts have been adjusted to reflect the impact of the 10 for 1 share split that occurred on August 10, 2018.
C Calculated based on average shares outstanding during the period.
D Amount represents less than $.005 per share.
E Total returns for periods of less than one year are not annualized.
F Total returns would have been lower if certain expenses had not been reduced during the applicable periods shown.
G Fees and expenses of any underlying mutual funds or exchange-traded funds (ETFs) are not included in the Fund's expense ratio. The Fund indirectly bears its proportionate share of these expenses. For additional expense information related to investments in Fidelity Central Funds, please refer to the "Investments in Fidelity Central Funds" note found in the Notes to Financial Statements section of the most recent Annual or Semi-Annual report.
H Expense ratios reflect operating expenses of the class. Expenses before reductions do not reflect amounts reimbursed, waived, or reduced through arrangements with the investment advisor, brokerage services, or other offset arrangements, if applicable, and do not represent the amount paid by the class during periods when reimbursements, waivers or reductions occur.
I Annualized
J Amount does not include the portfolio activity of any underlying Fidelity Central Funds.
K Portfolio turnover rate excludes securities received or delivered in-kind.
See accompanying notes which are an integral part of the financial statements.
Notes to Financial Statements (Unaudited)
For the period ended August 31, 2020
1. Organization.
Communications Equipment Portfolio, Computers Portfolio, IT Services Portfolio, Semiconductors Portfolio, Software and IT Services Portfolio, and Technology Portfolio (the Funds) are non-diversified funds of Fidelity Select Portfolios (the Trust). The Trust is registered under the Investment Company Act of 1940, as amended (the 1940 Act), as an open-end management investment company organized as a Massachusetts business trust. The Funds invest primarily in securities of companies whose principal business activities fall within specific industries. Each Fund is authorized to issue an unlimited number of shares. Share transactions on the Statement of Changes in Net Assets may contain exchanges between affiliated funds.
2. Investments in Fidelity Central Funds.
The Funds invest in Fidelity Central Funds, which are open-end investment companies generally available only to other investment companies and accounts managed by the investment adviser and its affiliates. The Funds' Schedules of Investments list each of the Fidelity Central Funds held as of period end, if any, as an investment of each Fund, but do not include the underlying holdings of each Fidelity Central Fund. As an Investing Fund, each Fund indirectly bears its proportionate share of the expenses of the underlying Fidelity Central Funds.
The Money Market Central Funds seek preservation of capital and current income and are managed by the investment adviser. Annualized expenses of the Money Market Central Funds as of their most recent shareholder report date ranged from less than .005% to .01%.
A complete unaudited list of holdings for each Fidelity Central Fund is available upon request or at the Securities and Exchange Commission (the SEC) website at www.sec.gov. In addition, the financial statements of the Fidelity Central Funds are available on the SEC website or upon request.
3. Significant Accounting Policies.
Each Fund is an investment company and applies the accounting and reporting guidance of the Financial Accounting Standards Board (FASB) Accounting Standards Codification Topic 946 Financial Services – Investment Companies. The financial statements have been prepared in conformity with accounting principles generally accepted in the United States of America (GAAP), which require management to make certain estimates and assumptions at the date of the financial statements. Actual results could differ from those estimates. Subsequent events, if any, through the date that the financial statements were issued have been evaluated in the preparation of the financial statements. The following summarizes the significant accounting policies of the Funds:
Investment Valuation. Investments are valued as of 4:00 p.m. Eastern time on the last calendar day of the period. The Board of Trustees (the Board) has delegated the day to day responsibility for the valuation of each Fund's investments to the Fair Value Committee (the Committee) established by each Fund's investment adviser. In accordance with valuation policies and procedures approved by the Board, each Fund attempts to obtain prices from one or more third party pricing vendors or brokers to value its investments. When current market prices, quotations or currency exchange rates are not readily available or reliable, investments will be fair valued in good faith by the Committee, in accordance with procedures adopted by the Board. Factors used in determining fair value vary by investment type and may include market or investment specific events, changes in interest rates and credit quality. The frequency with which these procedures are used cannot be predicted and they may be utilized to a significant extent. The Committee oversees each Fund's valuation policies and procedures and reports to the Board on the Committee's activities and fair value determinations. The Board monitors the appropriateness of the procedures used in valuing each Fund's investments and ratifies the fair value determinations of the Committee.
Each Fund categorizes the inputs to valuation techniques used to value its investments into a disclosure hierarchy consisting of three levels as shown below:
- Level 1 – quoted prices in active markets for identical investments
- Level 2 – other significant observable inputs (including quoted prices for similar investments, interest rates, prepayment speeds, etc.)
- Level 3 – unobservable inputs (including the Fund's own assumptions based on the best information available)
Valuation techniques used to value each Fund's investments by major category are as follows:
Equity securities, including restricted securities, for which market quotations are readily available, are valued at the last reported sale price or official closing price as reported by a third party pricing vendor on the primary market or exchange on which they are traded and are categorized as Level 1 in the hierarchy. In the event there were no sales during the day or closing prices are not available, securities are valued at the last quoted bid price or may be valued using the last available price and are generally categorized as Level 2 in the hierarchy. For foreign equity securities, when market or security specific events arise, comparisons to the valuation of American Depositary Receipts (ADRs), futures contracts, Exchange-Traded Funds (ETFs) and certain indexes as well as quoted prices for similar securities may be used and would be categorized as Level 2 in the hierarchy. For equity securities, including restricted securities, where observable inputs are limited, assumptions about market activity and risk are used and these securities may be categorized as Level 3 in the hierarchy. Securities, including private placements or other restricted securities, for which observable inputs are not available are valued using alternate valuation approaches, including the market approach, the income approach and cost approach, and are categorized as Level 3 in the hierarchy. The market approach considers factors including the price of recent investments in the same or a similar security or financial metrics of comparable securities. The income approach considers factors including expected future cash flows, security specific risks and corresponding discount rates. The cost approach considers factors including the value of the security's underlying assets and liabilities.
Debt securities, including restricted securities, are valued based on evaluated prices received from third party pricing vendors or from brokers who make markets in such securities. Corporate bonds are valued by pricing vendors who utilize matrix pricing which considers yield or price of bonds of comparable quality, coupon, maturity and type or by broker-supplied prices. When independent prices are unavailable or unreliable, debt securities may be valued utilizing pricing methodologies which consider similar factors that would be used by third party pricing vendors. Debt securities are generally categorized as Level 2 in the hierarchy but may be Level 3 depending on the circumstances.
Investments in open-end mutual funds, including the Fidelity Central Funds, are valued at their closing net asset value (NAV) each business day and are categorized as Level 1 in the hierarchy.
Changes in valuation techniques may result in transfers in or out of an assigned level within the disclosure hierarchy. The aggregate value of investments by input level as of August 31, 2020 is included at the end of each Fund's Schedule of Investments.
Foreign Currency. Certain Funds may use foreign currency contracts to facilitate transactions in foreign-denominated securities. Gains and losses from these transactions may arise from changes in the value of the foreign currency or if the counterparties do not perform under the contracts' terms.
Foreign-denominated assets, including investment securities, and liabilities are translated into U.S. dollars at the exchange rates at period end. Purchases and sales of investment securities, income and dividends received, and expenses denominated in foreign currencies are translated into U.S. dollars at the exchange rate in effect on the transaction date.
The effects of exchange rate fluctuations on investments are included with the net realized and unrealized gain (loss) on investment securities. Other foreign currency transactions resulting in realized and unrealized gain (loss) are disclosed separately.
Investment Transactions and Income. For financial reporting purposes, the Funds' investment holdings and NAV include trades executed through the end of the last business day of the period. The NAV per share for processing shareholder transactions is calculated as of the close of business of the New York Stock Exchange (NYSE), normally 4:00 p.m. Eastern time and includes trades executed through the end of the prior business day. Gains and losses on securities sold are determined on the basis of identified cost and for certain Funds include proceeds received from litigation. Dividend income is recorded on the ex-dividend date, except for certain dividends from foreign securities where the ex-dividend date may have passed, which are recorded as soon as the Funds are informed of the ex-dividend date. Non-cash dividends included in dividend income, if any, are recorded at the fair market value of the securities received. Income and capital gain distributions from Fidelity Central Funds, if any, are recorded on the ex-dividend date. Certain distributions received by the Funds represent a return of capital or capital gain. The Funds determine the components of these distributions subsequent to the ex-dividend date, based upon receipt of tax filings or other correspondence relating to the underlying investment. These distributions are recorded as a reduction of cost of investments and/or as a realized gain. Interest income is accrued as earned and includes coupon interest and amortization of premium and accretion of discount on debt securities as applicable. Investment income is recorded net of foreign taxes withheld where recovery of such taxes is uncertain.
Expenses. Expenses directly attributable to a fund are charged to that fund. Expenses attributable to more than one fund are allocated among the respective funds on the basis of relative net assets or other appropriate methods. Expense estimates are accrued in the period to which they relate and adjustments are made when actual amounts are known.
Deferred Trustee Compensation. Under a Deferred Compensation Plan (the Plan) for certain Funds, certain independent Trustees have elected to defer receipt of a portion of their annual compensation. Deferred amounts are invested in a cross-section of Fidelity funds, are marked-to-market and remain in each Fund until distributed in accordance with the Plan. The investment of deferred amounts and the offsetting payable to the Trustees presented below are included in each accompanying Statement of Assets and Liabilities in other receivables and other payables and accrued expenses, respectively.
| Computers Portfolio | $49,129 |
| Semiconductors Portfolio | 198,339 |
| Software and IT Services Portfolio | 306,169 |
| Technology Portfolio | 294,113 |
Income Tax Information and Distributions to Shareholders. Each year, each Fund intends to qualify as a regulated investment company under Subchapter M of the Internal Revenue Code, including distributing substantially all of its taxable income and realized gains. As a result, no provision for U.S. Federal income taxes is required. Each Fund files a U.S. federal tax return, in addition to state and local tax returns as required. Each Fund's federal income tax returns are subject to examination by the Internal Revenue Service (IRS) for a period of three fiscal years after they are filed. State and local tax returns may be subject to examination for an additional fiscal year depending on the jurisdiction. Foreign taxes are provided for based on each Fund's understanding of the tax rules and rates that exist in the foreign markets in which it invests. Technology Portfolio is subject to a tax imposed on capital gains by certain countries in which it invests. An estimated deferred tax liability for net unrealized appreciation on the applicable securities is included in Other payables and accrued expenses on each applicable Fund's Statement of Assets & Liabilities.
Distributions are declared and recorded on the ex-dividend date. Income and capital gain distributions are determined in accordance with income tax regulations, which may differ from GAAP.
Capital accounts within the financial statements are adjusted for permanent book-tax differences. These adjustments have no impact on net assets or the results of operations. Capital accounts are not adjusted for temporary book-tax differences which will reverse in a subsequent period.
Book-tax differences are primarily due to in-kind transactions, foreign currency transactions, passive foreign investment companies (PFIC), deferred trustees compensation and losses deferred due to wash sales and excise tax regulations.
As of period end, the cost and unrealized appreciation (depreciation) in securities, and derivatives if applicable, for federal income tax purposes were as follows for each Fund:
| | Tax cost | Gross unrealized appreciation | Gross unrealized depreciation | Net unrealized appreciation (depreciation) |
| Communications Equipment Portfolio | $133,758,604 | $40,271,307 | $(1,824,232) | $38,447,075 |
| Computers Portfolio | 365,380,760 | 254,553,170 | (17,782,808) | 236,770,362 |
| IT Services Portfolio | 2,123,372,914 | 2,352,631,109 | (44,415,885) | 2,308,215,224 |
| Semiconductors Portfolio | 2,696,342,296 | 1,626,429,940 | (54,923,955) | 1,571,505,985 |
| Software and IT Services Portfolio | 6,459,855,144 | 5,787,110,378 | (100,398,213) | 5,686,712,165 |
| Technology Portfolio | 7,066,002,167 | 3,658,684,007 | (97,268,680) | 3,561,415,327 |
In addition, certain of the Funds elected to defer to the next fiscal year capital losses recognized during the period November 1, 2018 to February 29, 2020. Loss deferrals were as follows:
| | Capital losses |
| Communications Equipment Portfolio | $(2,244,736) |
Restricted Securities (including Private Placements). The Funds may invest in securities that are subject to legal or contractual restrictions on resale. These securities generally may be resold in transactions exempt from registration or to the public if the securities are registered. Disposal of these securities may involve time-consuming negotiations and expense, and prompt sale at an acceptable price may be difficult. Information regarding restricted securities is included at the end of each applicable Fund's Schedule of Investments.
4. Purchases and Sales of Investments.
Purchases and sales of securities, other than short-term securities are noted in the table below.
| | Purchases ($) | Sales ($) |
| Communications Equipment Portfolio | 125,130,730 | 129,029,211 |
| Computers Portfolio | 208,007,342 | 260,804,179 |
| IT Services Portfolio | 658,869,807 | 1,191,530,949 |
| Semiconductors Portfolio | 2,419,219,967 | 2,841,534,025 |
| Software and IT Services Portfolio | 1,633,175,716 | 1,326,476,165 |
| Technology Portfolio | 4,830,428,839 | 4,248,440,964 |
5. Fees and Other Transactions with Affiliates.
Management Fee. Fidelity Management & Research Company LLC (the investment adviser) and its affiliates provide the Funds with investment management related services for which the Funds pay a monthly management fee. The management fee is the sum of an individual fund fee rate and an annualized group fee rate. The individual fund fee rate is applied to each Fund's average net assets. The group fee rate is based upon the monthly average net assets of a group of registered investment companies with which the investment adviser has management contracts. The group fee rate decreases as assets under management increase and increases as assets under management decrease. For the reporting period, each Fund's annualized management fee rate expressed as a percentage of each Fund's average net assets was as follows:
| | Individual Rate | Group Rate | Total |
| Communications Equipment Portfolio | .30% | .23% | .53% |
| Computers Portfolio | .30% | .23% | .53% |
| IT Services Portfolio | .30% | .23% | .53% |
| Semiconductors Portfolio | .30% | .23% | .53% |
| Software and IT Services Portfolio | .30% | .23% | .53% |
| Technology Portfolio | .30% | .23% | .53% |
Transfer Agent Fees. Fidelity Investments Institutional Operations Company LLC (FIIOC), an affiliate of the investment adviser, is the Funds' transfer, dividend disbursing and shareholder servicing agent. FIIOC receives account fees and asset-based fees that vary according to account size and type of account. FIIOC pays for typesetting, printing and mailing of shareholder reports, except proxy statements. For the period, transfer agent fees were equivalent to the following annualized rates expressed as a percentage of average net assets:
| Communications Equipment Portfolio | .23% |
| Computers Portfolio | .16% |
| IT Services Portfolio | .16% |
| Semiconductors Portfolio | .15% |
| Software and IT Services Portfolio | .15% |
| Technology Portfolio | .14% |
Accounting Fees. Fidelity Service Company, Inc. (FSC), an affiliate of the investment adviser, maintains each Fund's accounting records. The accounting fee is based on the level of average net assets for each month. For the period, the fees were equivalent to the following annualized rates:
| | % of Average Net Assets |
| Communications Equipment Portfolio | .04 |
| Computers Portfolio | .04 |
| IT Services Portfolio | .03 |
| Semiconductors Portfolio | .03 |
| Software and IT Services Portfolio | .01 |
| Technology Portfolio | .02 |
Brokerage Commissions. A portion of portfolio transactions were placed with brokerage firms which are affiliates of the investment adviser. Brokerage commissions are included in net realized gain (loss) and change in net unrealized appreciation (depreciation) in the Statement of Operations. The commissions paid to these affiliated firms were as follows:
| | Amount |
| Communications Equipment Portfolio | $9,733 |
| Computers Portfolio | 9,996 |
| IT Services Portfolio | 22,479 |
| Semiconductors Portfolio | 99,782 |
| Software and IT Services Portfolio | 48,466 |
| Technology Portfolio | 96,689 |
Interfund Lending Program. Pursuant to an Exemptive Order issued by the SEC, each fund, along with other registered investment companies having management contracts with Fidelity Management & Research Company LLC (FMR), or other affiliated entities of FMR, may participate in an interfund lending program. This program provides an alternative credit facility allowing each fund to borrow from, or lend money to, other participating affiliated funds. At period end, Computers Portfolio, IT Services Portfolio, Semiconductors Portfolio and Technology Portfolio had no interfund loans outstanding. Activity in this program during the period for which loans were outstanding was as follows:
| | Borrower or Lender | Average Loan Balance | Weighted Average Interest Rate | Interest Expense |
| Computers Portfolio | Borrower | $5,009,500 | 1.84% | $511 |
| IT Services Portfolio | Borrower | $7,425,350 | .34% | $1,391 |
| Semiconductors Portfolio | Borrower | $31,172,500 | 1.59% | $5,523 |
| Technology Portfolio | Borrower | $32,863,727 | 1.11% | $14,306 |
Interfund Trades. Funds may purchase from or sell securities to other Fidelity Funds under procedures adopted by the Board. The procedures have been designed to ensure these interfund trades are executed in accordance with Rule 17a-7 of the 1940 Act. Interfund trades are included within the respective purchases and sales amounts shown in the Purchases and Sales of Investments note.
Prior Fiscal Year Affiliated Redemptions In-Kind. During the prior period,5,658,948 shares of Technology Portfolio were redeemed in-kind for investments and cash with a value of $97,220,739. The Fund had a net realized gain of $44,795,304 on investments delivered through in-kind redemptions. The amount of the in-kind redemptions is included in share transactions in the accompanying Statement of Changes in Net Assets. Technology Portfolio recognized no gain or loss for federal income tax purposes.
6. Committed Line of Credit.
Certain Funds participate with other funds managed by the investment adviser or an affiliate in a $4.25 billion credit facility (the "line of credit") to be utilized for temporary or emergency purposes to fund shareholder redemptions or for other short-term liquidity purposes. The participating funds have agreed to pay commitment fees on their pro-rata portion of the line of credit, which are reflected in Miscellaneous expenses on the Statement of Operations, and are as follows:
| | Amount |
| Communications Equipment Portfolio | $184 |
| Computers Portfolio | 656 |
| IT Services Portfolio | 5,000 |
| Semiconductors Portfolio | 4,739 |
| Software and IT Services Portfolio | 10,415 |
| Technology Portfolio | 8,568 |
During the period, there were no borrowings on this line of credit.
7. Security Lending.
Certain Funds lend portfolio securities from time to time in order to earn additional income. Lending agents are used, including National Financial Services (NFS), an affiliate of the Funds. Pursuant to a securities lending agreement, NFS will receive a fee, which is capped at 9.9% of a Fund's daily lending revenue, for its services as lending agent. The Funds may lend securities to certain qualified borrowers, including NFS. On the settlement date of the loan, each applicable Fund receives collateral (in the form of U.S. Treasury obligations, letters of credit and/or cash) against the loaned securities and maintains collateral in an amount not less than 100% of the market value of the loaned securities during the period of the loan. The market value of the loaned securities is determined at the close of business of the Funds and any additional required collateral is delivered to the Funds on the next business day. The Funds or borrower may terminate the loan at any time, and if the borrower defaults on its obligation to return the securities loaned because of insolvency or other reasons, the Funds may apply collateral received from the borrower against the obligation. The Funds may experience delays and costs in recovering the securities loaned. Any cash collateral received is invested in the Fidelity Securities Lending Cash Central Fund. The value of loaned securities and cash collateral at period end are disclosed on each applicable Fund's Statement of Assets and Liabilities. Security lending income represents the income earned on investing cash collateral, less rebates paid to borrowers and any lending agent fees associated with the loan, plus any premium payments received for lending certain types of securities. Net income from Fidelity Central Funds is presented in the Statement of Operations as a component of income from Fidelity Central Funds. Affiliated security lending activity was as follows:
| | Total Security Lending Income Fees Paid to NFS | Security Lending Income From Securities Loaned to NFS | Value of Securities Loaned to NFS at Period End |
| Communications Equipment Portfolio | $5,510 | $1,761 | $– |
| Computers Portfolio | 146 | – | – |
| IT Services Portfolio | 110,786 | 10,760 | – |
| Semiconductors Portfolio | 3,663 | – | – |
| Software and IT Services Portfolio | 35,577 | – | – |
| Technology Portfolio | 17,180 | 1,934 | 596,632 |
8. Expense Reductions.
Commissions paid to certain brokers with whom the investment adviser, or its affiliates, places trades on behalf of certain Funds include an amount in addition to trade execution, which may be rebated back to the Funds to offset certain expenses. In addition, through arrangements with each applicable Fund's custodian, credits realized as a result of certain uninvested cash balances were used to reduce each applicable Fund's expenses. All of the applicable expense reductions are noted in the table below.
| | Brokerage service rebates | Custodian credits |
| Communications Equipment Portfolio | $38,622 | $– |
| Computers Portfolio | 104,042 | – |
| IT Services Portfolio | 105,157 | 2 |
| Semiconductors Portfolio | 418,777 | 291 |
| Software and IT Services Portfolio | 127,747 | 3,293 |
| Technology Portfolio | 187,191 | 97 |
In addition, during the period the investment adviser or an affiliate reimbursed and/or waived a portion of operating expenses as follows:
| | Amount |
| Communications Equipment Portfolio | $337 |
| Computers Portfolio | 1,093 |
| IT Services Portfolio | 8,307 |
| Semiconductors Portfolio | 8,112 |
| Software and IT Services Portfolio | 15,511 |
| Technology Portfolio | 12,403 |
9. Other.
The Funds' organizational documents provide former and current trustees and officers with a limited indemnification against liabilities arising in connection with the performance of their duties to the Funds. In the normal course of business, the Funds may also enter into contracts that provide general indemnifications. The Funds' maximum exposure under these arrangements is unknown as this would be dependent on future claims that may be made against the Funds. The risk of material loss from such claims is considered remote.
10. Coronavirus (COVID-19) Pandemic.
An outbreak of COVID-19 first detected in China during December 2019 has since spread globally and was declared a pandemic by the World Health Organization during March 2020. Developments that disrupt global economies and financial markets, such as the COVID-19 pandemic, may magnify factors that affect the Funds' performance.
Shareholder Expense Example
As a shareholder, you incur two types of costs: (1) transaction costs, which may include sales charges (loads) on purchase payments or redemption proceeds, as applicable and (2) ongoing costs, which generally include management fees, distribution and/or service (12b-1) fees and other Fund expenses. This Example is intended to help you understand your ongoing costs (in dollars) of investing in a fund and to compare these costs with the ongoing costs of investing in other mutual funds.
The Example is based on an investment of $1,000 invested at the beginning of the period and held for the entire period (March 1, 2020 to August 31, 2020).
Actual Expenses
The first line of the accompanying table provides information about actual account values and actual expenses. You may use the information in this line, together with the amount you invested, to estimate the expenses that you paid over the period. Simply divide your account value by $1,000.00 (for example, an $8,600 account value divided by $1,000.00 = 8.6), then multiply the result by the number in the first line for a class/Fund under the heading entitled "Expenses Paid During Period" to estimate the expenses you paid on your account during this period. If any fund is a shareholder of any underlying mutual funds or exchange-traded funds (ETFs) (the Underlying Funds), such fund indirectly bears its proportional share of the expenses of the Underlying Funds in addition to the direct expenses incurred presented in the table. These fees and expenses are not included in the annualized expense ratio used to calculate the expense estimate in the table below.
Hypothetical Example for Comparison Purposes
The second line of the accompanying table provides information about hypothetical account values and hypothetical expenses based on the actual expense ratio and an assumed rate of return of 5% per year before expenses, which is not the actual return. The hypothetical account values and expenses may not be used to estimate the actual ending account balance or expenses you paid for the period. You may use this information to compare the ongoing costs of investing in the Fund and other funds. To do so, compare this 5% hypothetical example with the 5% hypothetical examples that appear in the shareholder reports of the other funds. If any fund is a shareholder of any Underlying Funds, such fund indirectly bears its proportional share of the expenses of the Underlying Funds in addition to the direct expenses as presented in the table. These fees and expenses are not included in the annualized expense ratio used to calculate the expense estimate in the table below.
Please note that the expenses shown in the table are meant to highlight your ongoing costs only and do not reflect any transaction costs. Therefore, the second line of the table is useful in comparing ongoing costs only, and will not help you determine the relative total costs of owning different funds. In addition, if these transactional costs were included, your costs would have been higher.
| | Annualized Expense Ratio-A | Beginning
Account Value
March 1, 2020 | Ending
Account Value
August 31, 2020 | Expenses Paid
During Period-B
March 1, 2020
to August 31, 2020 |
| Communications Equipment Portfolio | .85% | | | |
| Actual | | $1,000.00 | $1,126.00 | $4.55 |
| Hypothetical-C | | $1,000.00 | $1,020.92 | $4.33 |
| Computers Portfolio | .75% | | | |
| Actual | | $1,000.00 | $1,246.90 | $4.25 |
| Hypothetical-C | | $1,000.00 | $1,021.42 | $3.82 |
| IT Services Portfolio | .73% | | | |
| Actual | | $1,000.00 | $1,227.70 | $4.10 |
| Hypothetical-C | | $1,000.00 | $1,021.53 | $3.72 |
| Semiconductors Portfolio | .71% | | | |
| Actual | | $1,000.00 | $1,263.20 | $4.05 |
| Hypothetical-C | | $1,000.00 | $1,021.63 | $3.62 |
| Software and IT Services Portfolio | .70% | | | |
| Actual | | $1,000.00 | $1,353.50 | $4.15 |
| Hypothetical-C | | $1,000.00 | $1,021.68 | $3.57 |
| Technology Portfolio | .70% | | | |
| Actual | | $1,000.00 | $1,476.30 | $4.37 |
| Hypothetical-C | | $1,000.00 | $1,021.68 | $3.57 |
A Annualized expense ratio reflects expenses net of applicable fee waivers.
B Expenses are equal to the annualized expense ratio, multiplied by the average account value over the period, multiplied by 184/ 365 (to reflect the one-half year period). The fees and expenses of any Underlying Funds are not included in each annualized expense ratio.
C 5% return per year before expenses
Proxy Voting Results
A special meeting of shareholders was held on June 9, 2020. The results of votes taken among shareholders on the proposal before them are reported below. Each vote reported represents one dollar of net asset value held on the record date for the meeting.
PROPOSAL 1
To elect a Board of Trustees.
| | # of
Votes | % of
Votes |
| Dennis J. Dirks |
| Affirmative | 32,463,705,305.665 | 92.437 |
| Withheld | 2,655,951,104.308 | 7.563 |
| TOTAL | 35,119,656,409.973 | 100.000 |
| Donald F. Donahue |
| Affirmative | 32,446,843,861.354 | 92.389 |
| Withheld | 2,672,812,548.619 | 7.611 |
| TOTAL | 35,119,656,409.973 | 100.000 |
| Bettina Doulton |
| Affirmative | 32,610,463,757.584 | 92.855 |
| Withheld | 2,509,192,652.389 | 7.145 |
| TOTAL | 35,119,656,409.973 | 100.000 |
| Vicki L. Fuller |
| Affirmative | 32,688,213,522.720 | 93.077 |
| Withheld | 2,431,442,887.253 | 6.923 |
| TOTAL | 35,119,656,409.973 | 100.000 |
| Patricia L. Kampling |
| Affirmative | 32,313,755,598.535 | 92.010 |
| Withheld | 2,805,900,811.438 | 7.990 |
| TOTAL | 35,119,656,409.973 | 100.000 |
| Alan J. Lacy |
| Affirmative | 31,990,158,754.948 | 91.089 |
| Withheld | 3,129,497,655.026 | 8.911 |
| TOTAL | 35,119,656,409.973 | 100.000 |
| Ned C. Lautenbach |
| Affirmative | 32,043,019,991.143 | 91.240 |
| Withheld | 3,076,636,418.830 | 8.760 |
| TOTAL | 35,119,656,409.973 | 100.000 |
| Robert A. Lawrence |
| Affirmative | 32,150,842,398.009 | 91.547 |
| Withheld | 2,968,814,011.965 | 8.453 |
| TOTAL | 35,119,656,409.973 | 100.000 |
| Joseph Mauriello |
| Affirmative | 32,082,201,213.166 | 91.351 |
| Withheld | 3,037,455,196.807 | 8.649 |
| TOTAL | 35,119,656,409.973 | 100.000 |
| Cornelia M. Small |
| Affirmative | 32,207,976,835.934 | 91.709 |
| Withheld | 2,911,679,574.039 | 8.291 |
| TOTAL | 35,119,656,409.973 | 100.000 |
| Garnett A. Smith |
| Affirmative | 32,102,654,343.096 | 91.409 |
| Withheld | 3,017,002,066.877 | 8.591 |
| TOTAL | 35,119,656,409.973 | 100.000 |
| David M. Thomas |
| Affirmative | 32,150,749,424.556 | 91.546 |
| Withheld | 2,968,906,985.418 | 8.454 |
| TOTAL | 35,119,656,409.973 | 100.000 |
| Susan Tomasky |
| Affirmative | 32,381,933,484.515 | 92.205 |
| Withheld | 2,737,722,925.459 | 7.795 |
| TOTAL | 35,119,656,409.973 | 100.000 |
| Michael E. Wiley |
| Affirmative | 32,135,064,741.973 | 91.502 |
| Withheld | 2,984,591,668.000 | 8.498 |
| TOTAL | 35,119,656,409.973 | 100.000 |
|
| Proposal 1 reflects trust wide proposal and voting results. |
SELTEC-SANN-1020
1.813673.115
Fidelity® Select Portfolios®
Consumer Staples Sector
Consumer Staples Portfolio
Semi-Annual Report
August 31, 2020
Includes Fidelity and Fidelity Advisor share classes
See the inside front cover for important information about access to your fund’s shareholder reports.
Beginning on January 1, 2021, as permitted by regulations adopted by the Securities and Exchange Commission, paper copies of a fund’s shareholder reports will no longer be sent by mail, unless you specifically request paper copies of the reports from the fund or from your financial intermediary, such as a financial advisor, broker-dealer or bank. Instead, the reports will be made available on a website, and you will be notified by mail each time a report is posted and provided with a website link to access the report.
If you already elected to receive shareholder reports electronically, you will not be affected by this change and you need not take any action. You may elect to receive shareholder reports and other communications from a fund electronically, by contacting your financial intermediary. For Fidelity customers, visit Fidelity's web site or call Fidelity using the contact information listed below.
You may elect to receive all future reports in paper free of charge. If you wish to continue receiving paper copies of your shareholder reports, you may contact your financial intermediary or, if you are a Fidelity customer, visit Fidelity’s website, or call Fidelity at the applicable toll-free number listed below. Your election to receive reports in paper will apply to all funds held with the fund complex/your financial intermediary.
| Account Type | Website | Phone Number |
| Brokerage, Mutual Fund, or Annuity Contracts: | fidelity.com/mailpreferences | 1-800-343-3548 |
| Employer Provided Retirement Accounts: | netbenefits.fidelity.com/preferences (choose 'no' under Required Disclosures to continue to print) | 1-800-343-0860 |
| Advisor Sold Accounts Serviced Through Your Financial Intermediary: | Contact Your Financial Intermediary | Your Financial Intermediary's phone number |
| Advisor Sold Accounts Serviced by Fidelity: | institutional.fidelity.com | 1-877-208-0098 |
Contents
To view a fund's proxy voting guidelines and proxy voting record for the 12-month period ended June 30, visit http://www.fidelity.com/proxyvotingresults or visit the Securities and Exchange Commission's (SEC) web site at http://www.sec.gov.
You may also call 1-800-544-8544 if you’re an individual investing directly with Fidelity, call 1-800-835-5092 if you’re a plan sponsor or participant with Fidelity as your recordkeeper or call 1-877-208-0098 on institutional accounts or if you’re an advisor or invest through one to request a free copy of the proxy voting guidelines.
Standard & Poor's, S&P and S&P 500 are registered service marks of The McGraw-Hill Companies, Inc. and have been licensed for use by Fidelity Distributors Corporation.
Other third-party marks appearing herein are the property of their respective owners.
All other marks appearing herein are registered or unregistered trademarks or service marks of FMR LLC or an affiliated company. © 2020 FMR LLC. All rights reserved.
This report and the financial statements contained herein are submitted for the general information of the shareholders of the Fund. This report is not authorized for distribution to prospective investors in the Fund unless preceded or accompanied by an effective prospectus.
A fund files its complete schedule of portfolio holdings with the SEC for the first and third quarters of each fiscal year on Form N-PORT. Forms N-PORT are available on the SEC’s web site at http://www.sec.gov. A fund's Forms N-PORT may be reviewed and copied at the SEC’s Public Reference Room in Washington, DC. Information regarding the operation of the SEC's Public Reference Room may be obtained by calling 1-800-SEC-0330.
For a complete list of a fund's portfolio holdings, view the most recent holdings listing, semiannual report, or annual report on Fidelity's web site at http://www.fidelity.com, http://www.institutional.fidelity.com, or http://www.401k.com, as applicable.
NOT FDIC INSURED •MAY LOSE VALUE •NO BANK GUARANTEE
Neither the Fund nor Fidelity Distributors Corporation is a bank.
Note to Shareholders:
Early in 2020, the outbreak and spread of a new coronavirus emerged as a public health emergency that had a major influence on financial markets, primarily based on its impact on the global economy and the outlook for corporate earnings. The virus causes a respiratory disease known as COVID-19. On March 11, the World Health Organization declared the COVID-19 outbreak a pandemic, citing sustained risk of further global spread.
In the weeks following, as the crisis worsened, we witnessed an escalating human tragedy with wide-scale social and economic consequences from coronavirus-containment measures. The outbreak of COVID-19 prompted a number of measures to limit the spread, including travel and border restrictions, quarantines, and restrictions on large gatherings. In turn, these resulted in lower consumer activity, diminished demand for a wide range of products and services, disruption in manufacturing and supply chains, and – given the wide variability in outcomes regarding the outbreak – significant market uncertainty and volatility. Amid the turmoil, the U.S. government took unprecedented action – in concert with the U.S. Federal Reserve and central banks around the world – to help support consumers, businesses, and the broader economy, and to limit disruption to the financial system.
The situation continues to unfold, and the extent and duration of its impact on financial markets and the economy remain highly uncertain. Extreme events such as the coronavirus crisis are “exogenous shocks” that can have significant adverse effects on mutual funds and their investments. Although multiple asset classes may be affected by market disruption, the duration and impact may not be the same for all types of assets.
Fidelity is committed to helping you stay informed amid news about COVID-19 and during increased market volatility, and we’re taking extra steps to be responsive to customer needs. We encourage you to visit our websites, where we offer ongoing updates, commentary, and analysis on the markets and our funds.
Investment Summary (Unaudited)
Top Ten Stocks as of August 31, 2020
| | % of fund's net assets |
| Procter & Gamble Co. | 17.9 |
| The Coca-Cola Co. | 11.3 |
| PepsiCo, Inc. | 7.9 |
| Mondelez International, Inc. | 6.8 |
| Walmart, Inc. | 6.0 |
| Altria Group, Inc. | 4.7 |
| Monster Beverage Corp. | 4.3 |
| Kroger Co. | 3.5 |
| Kimberly-Clark Corp. | 3.3 |
| Costco Wholesale Corp. | 3.3 |
| | 69.0 |
Top Industries (% of fund's net assets)
| As of August 31, 2020 |
| | Beverages | 30.5% |
| | Household Products | 24.3% |
| | Food Products | 17.8% |
| | Food & Staples Retailing | 15.3% |
| | Tobacco | 7.6% |
| | All Others* | 4.5% |
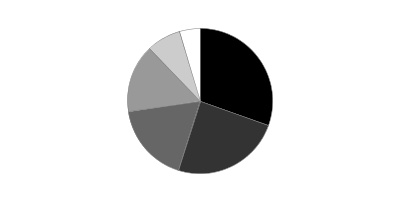
* Includes short-term investments and net other assets (liabilities).
Schedule of Investments August 31, 2020 (Unaudited)
Showing Percentage of Net Assets
| Common Stocks - 99.9% | | | |
| | | Shares | Value |
| Beverages - 30.5% | | | |
| Brewers - 0.2% | | | |
| Budweiser Brewing Co. APAC Ltd. (a) | | 627,600 | $2,114,423 |
| Molson Coors Beverage Co. Class B | | 49,300 | 1,855,652 |
| | | | 3,970,075 |
| Distillers & Vintners - 3.3% | | | |
| Constellation Brands, Inc. Class A (sub. vtg.) | | 149,400 | 27,561,312 |
| Diageo PLC | | 611,700 | 20,437,596 |
| | | | 47,998,908 |
| Soft Drinks - 27.0% | | | |
| Coca-Cola Bottling Co. Consolidated | | 1,800 | 491,940 |
| Coca-Cola European Partners PLC | | 173,453 | 7,139,325 |
| Keurig Dr. Pepper, Inc. (b) | | 1,446,100 | 43,137,163 |
| Monster Beverage Corp. (c) | | 747,402 | 62,677,132 |
| PepsiCo, Inc. | | 824,500 | 115,479,470 |
| The Coca-Cola Co. | | 3,333,518 | 165,109,147 |
| | | | 394,034,177 |
|
| TOTAL BEVERAGES | | | 446,003,160 |
|
| Food & Staples Retailing - 15.3% | | | |
| Drug Retail - 0.1% | | | |
| Walgreens Boots Alliance, Inc. | | 34,000 | 1,292,680 |
| Food Distributors - 2.0% | | | |
| Sysco Corp. | | 145,700 | 8,762,398 |
| U.S. Foods Holding Corp. (c) | | 843,016 | 20,527,440 |
| | | | 29,289,838 |
| Food Retail - 3.9% | | | |
| Albertsons Companies, Inc. (b)(c) | | 366,700 | 5,056,793 |
| Grocery Outlet Holding Corp. (c) | | 26,600 | 1,094,058 |
| Kroger Co. | | 1,431,770 | 51,085,554 |
| | | | 57,236,405 |
| Hypermarkets & Super Centers - 9.3% | | | |
| Costco Wholesale Corp. | | 139,200 | 48,394,272 |
| Walmart, Inc. | | 627,000 | 87,058,950 |
| | | | 135,453,222 |
|
| TOTAL FOOD & STAPLES RETAILING | | | 223,272,145 |
|
| Food Products - 17.8% | | | |
| Agricultural Products - 0.7% | | | |
| Bunge Ltd. | | 25,200 | 1,149,624 |
| Darling Ingredients, Inc. (c) | | 274,500 | 8,775,765 |
| | | | 9,925,389 |
| Packaged Foods & Meats - 17.1% | | | |
| Conagra Brands, Inc. | | 409,800 | 15,719,928 |
| Danone SA | | 196,791 | 12,940,304 |
| Farmer Brothers Co. (c) | | 116,431 | 732,351 |
| Freshpet, Inc. (c) | | 54,600 | 6,202,560 |
| General Mills, Inc. | | 18,300 | 1,170,285 |
| JDE Peet's BV | | 188,500 | 8,302,774 |
| Lamb Weston Holdings, Inc. | | 411,400 | 25,856,490 |
| Mondelez International, Inc. | | 1,695,858 | 99,072,024 |
| Nomad Foods Ltd. (c) | | 717,800 | 17,700,948 |
| Post Holdings, Inc. (c) | | 239,600 | 21,089,592 |
| Sanderson Farms, Inc. | | 22,100 | 2,584,816 |
| The Kraft Heinz Co. | | 461,100 | 16,156,944 |
| The Simply Good Foods Co. (c) | | 46,000 | 1,143,100 |
| TreeHouse Foods, Inc. (c) | | 56,000 | 2,397,360 |
| Tyson Foods, Inc. Class A | | 297,600 | 18,689,280 |
| | | | 249,758,756 |
|
| TOTAL FOOD PRODUCTS | | | 259,684,145 |
|
| Hotels, Restaurants & Leisure - 0.9% | | | |
| Restaurants - 0.9% | | | |
| Compass Group PLC | | 791,500 | 12,808,025 |
| Household Durables - 0.1% | | | |
| Housewares & Specialties - 0.1% | | | |
| Tupperware Brands Corp. | | 80,200 | 1,306,458 |
| Household Products - 24.3% | | | |
| Household Products - 24.3% | | | |
| Colgate-Palmolive Co. | | 83,100 | 6,586,506 |
| Energizer Holdings, Inc. (b) | | 112,100 | 5,189,109 |
| Kimberly-Clark Corp. | | 308,400 | 48,653,184 |
| Procter & Gamble Co. | | 1,889,150 | 261,326,117 |
| Spectrum Brands Holdings, Inc. | | 551,576 | 32,873,930 |
| | | | 354,628,846 |
| Internet & Direct Marketing Retail - 0.3% | | | |
| Internet & Direct Marketing Retail - 0.3% | | | |
| JD.com, Inc. Class A | | 15,800 | 629,408 |
| The Honest Co., Inc. (c)(d)(e) | | 212,235 | 3,714,113 |
| | | | 4,343,521 |
| Multiline Retail - 0.3% | | | |
| General Merchandise Stores - 0.3% | | | |
| Dollar Tree, Inc. (c) | | 39,900 | 3,841,173 |
| Personal Products - 2.8% | | | |
| Personal Products - 2.8% | | | |
| Edgewell Personal Care Co. (c) | | 566,891 | 16,275,441 |
| Estee Lauder Companies, Inc. Class A | | 40,839 | 9,054,823 |
| Herbalife Nutrition Ltd. (c) | | 145,000 | 7,126,750 |
| Unilever NV | | 143,330 | 8,328,424 |
| | | | 40,785,438 |
| Tobacco - 7.6% | | | |
| Tobacco - 7.6% | | | |
| Altria Group, Inc. | | 1,575,645 | 68,918,712 |
| Philip Morris International, Inc. | | 534,891 | 42,678,953 |
| | | | 111,597,665 |
| TOTAL COMMON STOCKS | | | |
| (Cost $1,138,685,106) | | | 1,458,270,576 |
|
| Money Market Funds - 1.4% | | | |
| Fidelity Cash Central Fund 0.12% (f) | | 1,900,611 | 1,900,991 |
| Fidelity Securities Lending Cash Central Fund 0.11% (f)(g) | | 18,958,258 | 18,960,154 |
| TOTAL MONEY MARKET FUNDS | | | |
| (Cost $20,861,145) | | | 20,861,145 |
| TOTAL INVESTMENT IN SECURITIES - 101.3% | | | |
| (Cost $1,159,546,251) | | | 1,479,131,721 |
| NET OTHER ASSETS (LIABILITIES) - (1.3)% | | | (18,482,112) |
| NET ASSETS - 100% | | | $1,460,649,609 |
Legend
(a) Security exempt from registration under Rule 144A of the Securities Act of 1933. These securities may be resold in transactions exempt from registration, normally to qualified institutional buyers. At the end of the period, the value of these securities amounted to $2,114,423 or 0.1% of net assets.
(b) Security or a portion of the security is on loan at period end.
(c) Non-income producing
(d) Restricted securities (including private placements) - Investment in securities not registered under the Securities Act of 1933 (excluding 144A issues). At the end of the period, the value of restricted securities (excluding 144A issues) amounted to $3,714,113 or 0.3% of net assets.
(e) Level 3 security
(f) Affiliated fund that is generally available only to investment companies and other accounts managed by Fidelity Investments. The rate quoted is the annualized seven-day yield of the fund at period end. A complete unaudited listing of the fund's holdings as of its most recent quarter end is available upon request. In addition, each Fidelity Central Fund's financial statements are available on the SEC's website or upon request.
(g) Investment made with cash collateral received from securities on loan.
Additional information on each restricted holding is as follows:
| Security | Acquisition Date | Acquisition Cost |
| The Honest Co., Inc. | 8/28/18 | $2,381,277 |
Affiliated Central Funds
Information regarding fiscal year to date income earned by the Fund from investments in Fidelity Central Funds is as follows:
| Fund | Income earned |
| Fidelity Cash Central Fund | $10,414 |
| Fidelity Securities Lending Cash Central Fund | 38,142 |
| Total | $48,556 |
Amounts in the income column in the above table include any capital gain distributions from underlying funds, which are presented in the corresponding line-item in the Statement of Operations, if applicable. Amount for Fidelity Securities Lending Cash Central Fund represents the income earned on investing cash collateral, less rebates paid to borrowers and any lending agent fees associated with the loan, plus any premium payments received for lending certain types of securities.
Investment Valuation
The following is a summary of the inputs used, as of August 31, 2020, involving the Fund's assets and liabilities carried at fair value. The inputs or methodology used for valuing securities may not be an indication of the risk associated with investing in those securities. For more information on valuation inputs, and their aggregation into the levels used below, please refer to the Investment Valuation section in the accompanying Notes to Financial Statements.
| | Valuation Inputs at Reporting Date: |
| Description | Total | Level 1 | Level 2 | Level 3 |
| Investments in Securities: | | | | |
| Common Stocks | $1,458,270,576 | $1,397,298,283 | $57,258,180 | $3,714,113 |
| Money Market Funds | 20,861,145 | 20,861,145 | -- | -- |
| Total Investments in Securities: | $1,479,131,721 | $1,418,159,428 | $57,258,180 | $3,714,113 |
See accompanying notes which are an integral part of the financial statements.
Financial Statements
Statement of Assets and Liabilities
| | | August 31, 2020 (Unaudited) |
| Assets | | |
Investment in securities, at value (including securities loaned of $18,245,345) — See accompanying schedule:
Unaffiliated issuers (cost $1,138,685,106) | $1,458,270,576 | |
| Fidelity Central Funds (cost $20,861,145) | 20,861,145 | |
| Total Investment in Securities (cost $1,159,546,251) | | $1,479,131,721 |
| Receivable for investments sold | | 3,184,065 |
| Receivable for fund shares sold | | 2,852,085 |
| Dividends receivable | | 2,473,245 |
| Distributions receivable from Fidelity Central Funds | | 6,398 |
| Prepaid expenses | | 15,196 |
| Other receivables | | 262,630 |
| Total assets | | 1,487,925,340 |
| Liabilities | | |
| Payable for investments purchased | $3,408,229 | |
| Payable for fund shares redeemed | 3,586,676 | |
| Accrued management fee | 635,283 | |
| Distribution and service plan fees payable | 176,300 | |
| Other affiliated payables | 243,924 | |
| Other payables and accrued expenses | 265,394 | |
| Collateral on securities loaned | 18,959,925 | |
| Total liabilities | | 27,275,731 |
| Net Assets | | $1,460,649,609 |
| Net Assets consist of: | | |
| Paid in capital | | $1,150,216,877 |
| Total accumulated earnings (loss) | | 310,432,732 |
| Net Assets | | $1,460,649,609 |
| Net Asset Value and Maximum Offering Price | | |
| Class A: | | |
| Net Asset Value and redemption price per share ($259,007,968 ÷ 2,893,294 shares)(a) | | $89.52 |
| Maximum offering price per share (100/94.25 of $89.52) | | $94.98 |
| Class M: | | |
| Net Asset Value and redemption price per share ($60,033,616 ÷ 678,375 shares)(a) | | $88.50 |
| Maximum offering price per share (100/96.50 of $88.50) | | $91.71 |
| Class C: | | |
| Net Asset Value and offering price per share ($119,534,046 ÷ 1,378,827 shares)(a) | | $86.69 |
| Consumer Staples: | | |
| Net Asset Value, offering price and redemption price per share ($812,221,096 ÷ 8,968,051 shares) | | $90.57 |
| Class I: | | |
| Net Asset Value, offering price and redemption price per share ($156,945,562 ÷ 1,737,019 shares) | | $90.35 |
| Class Z: | | |
| Net Asset Value, offering price and redemption price per share ($52,907,321 ÷ 585,999 shares) | | $90.29 |
(a) Redemption price per share is equal to net asset value less any applicable contingent deferred sales charge.
See accompanying notes which are an integral part of the financial statements.
Statement of Operations
| | | Six months ended August 31, 2020 (Unaudited) |
| Investment Income | | |
| Dividends | | $17,875,555 |
| Income from Fidelity Central Funds (including $38,142 from security lending) | | 48,556 |
| Total income | | 17,924,111 |
| Expenses | | |
| Management fee | $3,570,996 | |
| Transfer agent fees | 1,225,048 | |
| Distribution and service plan fees | 1,000,056 | |
| Accounting fees | 213,096 | |
| Custodian fees and expenses | 8,411 | |
| Independent trustees' fees and expenses | 4,401 | |
| Registration fees | 64,709 | |
| Audit | 31,751 | |
| Legal | 1,032 | |
| Miscellaneous | 43,586 | |
| Total expenses before reductions | 6,163,086 | |
| Expense reductions | (90,720) | |
| Total expenses after reductions | | 6,072,366 |
| Net investment income (loss) | | 11,851,745 |
| Realized and Unrealized Gain (Loss) | | |
| Net realized gain (loss) on: | | |
| Investment securities: | | |
| Unaffiliated issuers | (10,370,123) | |
| Fidelity Central Funds | (1,066) | |
| Foreign currency transactions | (99,657) | |
| Total net realized gain (loss) | | (10,470,846) |
| Change in net unrealized appreciation (depreciation) on: | | |
| Investment securities: | | |
| Unaffiliated issuers | 181,534,184 | |
| Assets and liabilities in foreign currencies | 46,450 | |
| Total change in net unrealized appreciation (depreciation) | | 181,580,634 |
| Net gain (loss) | | 171,109,788 |
| Net increase (decrease) in net assets resulting from operations | | $182,961,533 |
See accompanying notes which are an integral part of the financial statements.
Statement of Changes in Net Assets
| | Six months ended August 31, 2020 (Unaudited) | Year ended February 29, 2020 |
| Increase (Decrease) in Net Assets | | |
| Operations | | |
| Net investment income (loss) | $11,851,745 | $26,852,529 |
| Net realized gain (loss) | (10,470,846) | 53,490,769 |
| Change in net unrealized appreciation (depreciation) | 181,580,634 | 13,961,676 |
| Net increase (decrease) in net assets resulting from operations | 182,961,533 | 94,304,974 |
| Distributions to shareholders | (19,191,214) | (40,720,449) |
| Share transactions - net increase (decrease) | (80,049,833) | (101,581,970) |
| Total increase (decrease) in net assets | 83,720,486 | (47,997,445) |
| Net Assets | | |
| Beginning of period | 1,376,929,123 | 1,424,926,568 |
| End of period | $1,460,649,609 | $1,376,929,123 |
See accompanying notes which are an integral part of the financial statements.
Financial Highlights
Consumer Staples Portfolio Class A
| | Six months ended (Unaudited) August 31, | Years endedFebruary 29, | | | | |
| | 2020 | 2020 A | 2019 | 2018 | 2017 | 2016 A |
| Selected Per–Share Data | | | | | | |
| Net asset value, beginning of period | $79.57 | $76.88 | $87.07 | $96.18 | $89.78 | $101.33 |
| Income from Investment Operations | | | | | | |
| Net investment income (loss)B | .65 | 1.40 | 2.08C | 1.54 | 1.28 | 1.34 |
| Net realized and unrealized gain (loss) | 10.42 | 3.54 | (2.64) | (2.80) | 9.12 | (4.86) |
| Total from investment operations | 11.07 | 4.94 | (.56) | (1.26) | 10.40 | (3.52) |
| Distributions from net investment income | (.07) | (1.35) | (2.11) | (1.55) | (1.37) | (1.31) |
| Distributions from net realized gain | (1.04) | (.90) | (7.53) | (6.30) | (2.64) | (6.72) |
| Total distributions | (1.12)D | (2.25) | (9.63)E | (7.85) | (4.00)F | (8.03) |
| Redemption fees added to paid in capitalB | – | – | – | – | –G | –G |
| Net asset value, end of period | $89.52 | $79.57 | $76.88 | $87.07 | $96.18 | $89.78 |
| Total ReturnH,I,J | 14.16% | 6.17% | (.32)% | (1.68)% | 11.91% | (3.51)% |
| Ratios to Average Net AssetsK,L | | | | | | |
| Expenses before reductions | 1.05%M | 1.04% | 1.05% | 1.05% | 1.04% | 1.04% |
| Expenses net of fee waivers, if any | 1.05%M | 1.04% | 1.05% | 1.05% | 1.04% | 1.04% |
| Expenses net of all reductions | 1.03%M | 1.04% | 1.04% | 1.04% | 1.03% | 1.04% |
| Net investment income (loss) | 1.63%M | 1.67% | 2.65%C | 1.60% | 1.37% | 1.45% |
| Supplemental Data | | | | | | |
| Net assets, end of period (000 omitted) | $259,008 | $239,067 | $232,020 | $317,366 | $522,014 | $470,249 |
| Portfolio turnover rateN | 49%M | 40% | 41%O | 76% | 56%O | 63% |
A For the year ended February 29.
B Calculated based on average shares outstanding during the period.
C Net investment income per share reflects one or more large, non-recurring dividend(s) which amounted to $.69 per share. Excluding such non-recurring dividend(s), the ratio of net investment income (loss) to average net assets would have been 1.78%.
D Total distributions of $1.12 per share is comprised of distributions from net investment income of $.074 and distributions from net realized gain of $1.043 per share.
E Total distributions of $9.63 per share is comprised of distributions from net investment income of $2.105 and distributions from net realized gain of $7.525 per share.
F Total distributions of $4.00 per share is comprised of distributions from net investment income of $1.365 and distributions from net realized gain of $2.636 per share.
G Amount represents less than $.005 per share.
H Total returns for periods of less than one year are not annualized.
I Total returns would have been lower if certain expenses had not been reduced during the applicable periods shown.
J Total returns do not include the effect of the sales charges.
K Fees and expenses of any underlying mutual funds or exchange-traded funds (ETFs) are not included in the Fund's expense ratio. The Fund indirectly bears its proportionate share of these expenses. For additional expense information related to investments in Fidelity Central Funds, please refer to the "Investments in Fidelity Central Funds" note found in the Notes to Financial Statements section of the most recent Annual or Semi-Annual report.
L Expense ratios reflect operating expenses of the class. Expenses before reductions do not reflect amounts reimbursed, waived, or reduced through arrangements with the investment adviser, brokerage services, or other offset arrangements, if applicable, and do not represent the amount paid by the class during periods when reimbursements, waivers or reductions occur.
M Annualized
N Amount does not include the portfolio activity of any underlying Fidelity Central Funds.
O Portfolio turnover rate excludes securities received or delivered in-kind.
See accompanying notes which are an integral part of the financial statements.
Consumer Staples Portfolio Class M
| | Six months ended (Unaudited) August 31, | Years endedFebruary 29, | | | | |
| | 2020 | 2020 A | 2019 | 2018 | 2017 | 2016 A |
| Selected Per–Share Data | | | | | | |
| Net asset value, beginning of period | $78.74 | $76.13 | $86.30 | $95.42 | $89.10 | $100.61 |
| Income from Investment Operations | | | | | | |
| Net investment income (loss)B | .54 | 1.16 | 1.85C | 1.27 | 1.01 | 1.08 |
| Net realized and unrealized gain (loss) | 10.30 | 3.50 | (2.61) | (2.78) | 9.07 | (4.83) |
| Total from investment operations | 10.84 | 4.66 | (.76) | (1.51) | 10.08 | (3.75) |
| Distributions from net investment income | (.04) | (1.15) | (1.88) | (1.31) | (1.12) | (1.04) |
| Distributions from net realized gain | (1.04) | (.90) | (7.53) | (6.30) | (2.64) | (6.72) |
| Total distributions | (1.08) | (2.05) | (9.41) | (7.61) | (3.76) | (7.76) |
| Redemption fees added to paid in capitalB | – | – | – | – | –D | –D |
| Net asset value, end of period | $88.50 | $78.74 | $76.13 | $86.30 | $95.42 | $89.10 |
| Total ReturnE,F,G | 14.01% | 5.88% | (.59)% | (1.94)% | 11.61% | (3.78)% |
| Ratios to Average Net AssetsH,I | | | | | | |
| Expenses before reductions | 1.32%J | 1.31% | 1.33% | 1.32% | 1.32% | 1.32% |
| Expenses net of fee waivers, if any | 1.32%J | 1.31% | 1.32% | 1.32% | 1.32% | 1.32% |
| Expenses net of all reductions | 1.31%J | 1.31% | 1.31% | 1.31% | 1.31% | 1.31% |
| Net investment income (loss) | 1.36%J | 1.40% | 2.37%C | 1.33% | 1.09% | 1.17% |
| Supplemental Data | | | | | | |
| Net assets, end of period (000 omitted) | $60,034 | $55,954 | $60,069 | $76,572 | $89,925 | $76,586 |
| Portfolio turnover rateK | 49%J | 40% | 41%L | 76% | 56%L | 63% |
A For the year ended February 29.
B Calculated based on average shares outstanding during the period.
C Net investment income per share reflects one or more large, non-recurring dividend(s) which amounted to $.68 per share. Excluding such non-recurring dividend(s), the ratio of net investment income (loss) to average net assets would have been 1.50%.
D Amount represents less than $.005 per share.
E Total returns for periods of less than one year are not annualized.
F Total returns would have been lower if certain expenses had not been reduced during the applicable periods shown.
G Total returns do not include the effect of the sales charges.
H Fees and expenses of any underlying mutual funds or exchange-traded funds (ETFs) are not included in the Fund's expense ratio. The Fund indirectly bears its proportionate share of these expenses. For additional expense information related to investments in Fidelity Central Funds, please refer to the "Investments in Fidelity Central Funds" note found in the Notes to Financial Statements section of the most recent Annual or Semi-Annual report.
I Expense ratios reflect operating expenses of the class. Expenses before reductions do not reflect amounts reimbursed, waived, or reduced through arrangements with the investment adviser, brokerage services, or other offset arrangements, if applicable, and do not represent the amount paid by the class during periods when reimbursements, waivers or reductions occur.
J Annualized
K Amount does not include the portfolio activity of any underlying Fidelity Central Funds.
L Portfolio turnover rate excludes securities received or delivered in-kind.
See accompanying notes which are an integral part of the financial statements.
See accompanying notes which are an integral part of the financial statements.
Consumer Staples Portfolio Class C
| | Six months ended (Unaudited) August 31, | Years endedFebruary 29, | | | | |
| | 2020 | 2020 A | 2019 | 2018 | 2017 | 2016 A |
| Selected Per–Share Data | | | | | | |
| Net asset value, beginning of period | $77.27 | $74.79 | $84.85 | $93.89 | $87.77 | $99.27 |
| Income from Investment Operations | | | | | | |
| Net investment income (loss)B | .34 | .75 | 1.46C | .81 | .56 | .63 |
| Net realized and unrealized gain (loss) | 10.09 | 3.44 | (2.57) | (2.73) | 8.92 | (4.75) |
| Total from investment operations | 10.43 | 4.19 | (1.11) | (1.92) | 9.48 | (4.12) |
| Distributions from net investment income | – | (.81) | (1.43) | (.82) | (.73) | (.65) |
| Distributions from net realized gain | (1.01) | (.90) | (7.53) | (6.30) | (2.64) | (6.72) |
| Total distributions | (1.01) | (1.71) | (8.95)D | (7.12) | (3.36)E | (7.38)F |
| Redemption fees added to paid in capitalB | – | – | – | – | –G | –G |
| Net asset value, end of period | $86.69 | $77.27 | $74.79 | $84.85 | $93.89 | $87.77 |
| Total ReturnH,I,J | 13.73% | 5.39% | (1.05)% | (2.41)% | 11.07% | (4.23)% |
| Ratios to Average Net AssetsK,L | | | | | | |
| Expenses before reductions | 1.79%M | 1.79% | 1.79% | 1.79% | 1.80% | 1.80% |
| Expenses net of fee waivers, if any | 1.79%M | 1.79% | 1.79% | 1.79% | 1.79% | 1.80% |
| Expenses net of all reductions | 1.78%M | 1.79% | 1.78% | 1.78% | 1.79% | 1.79% |
| Net investment income (loss) | .89%M | .92% | 1.91%C | .86% | .61% | .69% |
| Supplemental Data | | | | | | |
| Net assets, end of period (000 omitted) | $119,534 | $117,328 | $150,822 | $228,874 | $308,350 | $250,576 |
| Portfolio turnover rateN | 49%M | 40% | 41%O | 76% | 56%O | 63% |
A For the year ended February 29.
B Calculated based on average shares outstanding during the period.
C Net investment income per share reflects one or more large, non-recurring dividend(s) which amounted to $.67 per share. Excluding such non-recurring dividend(s), the ratio of net investment income (loss) to average net assets would have been 1.04%.
D Total distributions of $8.95 per share is comprised of distributions from net investment income of $1.427 and distributions from net realized gain of $7.525 per share.
E Total distributions of $3.36 per share is comprised of distributions from net investment income of $.726 and distributions from net realized gain of $2.636 per share.
F Total distributions of $7.38 per share is comprised of distributions from net investment income of $.651 and distributions from net realized gain of $6.724 per share.
G Amount represents less than $.005 per share.
H Total returns for periods of less than one year are not annualized.
I Total returns would have been lower if certain expenses had not been reduced during the applicable periods shown.
J Total returns do not include the effect of the contingent deferred sales charge.
K Fees and expenses of any underlying mutual funds or exchange-traded funds (ETFs) are not included in the Fund's expense ratio. The Fund indirectly bears its proportionate share of these expenses. For additional expense information related to investments in Fidelity Central Funds, please refer to the "Investments in Fidelity Central Funds" note found in the Notes to Financial Statements section of the most recent Annual or Semi-Annual report.
L Expense ratios reflect operating expenses of the class. Expenses before reductions do not reflect amounts reimbursed, waived, or reduced through arrangements with the investment adviser, brokerage services, or other offset arrangements, if applicable, and do not represent the amount paid by the class during periods when reimbursements, waivers or reductions occur.
M Annualized
N Amount does not include the portfolio activity of any underlying Fidelity Central Funds.
O Portfolio turnover rate excludes securities received or delivered in-kind.
See accompanying notes which are an integral part of the financial statements.
Consumer Staples Portfolio
| | Six months ended (Unaudited) August 31, | Years endedFebruary 29, | | | | |
| | 2020 | 2020 A | 2019 | 2018 | 2017 | 2016 A |
| Selected Per–Share Data | | | | | | |
| Net asset value, beginning of period | $80.42 | $77.63 | $87.85 | $97.01 | $90.48 | $102.03 |
| Income from Investment Operations | | | | | | |
| Net investment income (loss)B | .77 | 1.66 | 2.34C | 1.82 | 1.56 | 1.61 |
| Net realized and unrealized gain (loss) | 10.54 | 3.59 | (2.67) | (2.82) | 9.20 | (4.89) |
| Total from investment operations | 11.31 | 5.25 | (.33) | (1.00) | 10.76 | (3.28) |
| Distributions from net investment income | (.12) | (1.55) | (2.36) | (1.86) | (1.60) | (1.55) |
| Distributions from net realized gain | (1.04) | (.90) | (7.53) | (6.30) | (2.64) | (6.72) |
| Total distributions | (1.16) | (2.46)D | (9.89) | (8.16) | (4.23)E | (8.27) |
| Redemption fees added to paid in capitalB | – | – | – | – | –F | –F |
| Net asset value, end of period | $90.57 | $80.42 | $77.63 | $87.85 | $97.01 | $90.48 |
| Total ReturnG,H | 14.33% | 6.48% | (.03)% | (1.40)% | 12.24% | (3.25)% |
| Ratios to Average Net AssetsI,J | | | | | | |
| Expenses before reductions | .76%K | .75% | .77% | .76% | .76% | .77% |
| Expenses net of fee waivers, if any | .76%K | .75% | .76% | .76% | .76% | .77% |
| Expenses net of all reductions | .75%K | .75% | .75% | .76% | .76% | .76% |
| Net investment income (loss) | 1.92%K | 1.96% | 2.94%C | 1.89% | 1.64% | 1.72% |
| Supplemental Data | | | | | | |
| Net assets, end of period (000 omitted) | $812,221 | $773,437 | $814,350 | $1,328,696 | $1,665,604 | $2,039,983 |
| Portfolio turnover rateL | 49%K | 40% | 41%M | 76% | 56%M | 63% |
A For the year ended February 29.
B Calculated based on average shares outstanding during the period.
C Net investment income per share reflects one or more large, non-recurring dividend(s) which amounted to $.69 per share. Excluding such non-recurring dividend(s), the ratio of net investment income (loss) to average net assets would have been 2.07%.
D Total distributions of $2.46 per share is comprised of distributions from net investment income of $1.552 and distributions from net realized gain of $.903 per share.
E Total distributions of $4.23 per share is comprised of distributions from net investment income of $1.596 and distributions from net realized gain of $2.636 per share.
F Amount represents less than $.005 per share.
G Total returns for periods of less than one year are not annualized.
H Total returns would have been lower if certain expenses had not been reduced during the applicable periods shown.
I Fees and expenses of any underlying mutual funds or exchange-traded funds (ETFs) are not included in the Fund's expense ratio. The Fund indirectly bears its proportionate share of these expenses. For additional expense information related to investments in Fidelity Central Funds, please refer to the "Investments in Fidelity Central Funds" note found in the Notes to Financial Statements section of the most recent Annual or Semi-Annual report.
J Expense ratios reflect operating expenses of the class. Expenses before reductions do not reflect amounts reimbursed, waived, or reduced through arrangements with the investment adviser, brokerage services, or other offset arrangements, if applicable, and do not represent the amount paid by the class during periods when reimbursements, waivers or reductions occur.
K Annualized
L Amount does not include the portfolio activity of any underlying Fidelity Central Funds.
M Portfolio turnover rate excludes securities received or delivered in-kind.
See accompanying notes which are an integral part of the financial statements.
Consumer Staples Portfolio Class I
| | Six months ended (Unaudited) August 31, | Years endedFebruary 29, | | | | |
| | 2020 | 2020 A | 2019 | 2018 | 2017 | 2016 A |
| Selected Per–Share Data | | | | | | |
| Net asset value, beginning of period | $80.23 | $77.45 | $87.68 | $96.82 | $90.34 | $101.91 |
| Income from Investment Operations | | | | | | |
| Net investment income (loss)B | .77 | 1.65 | 2.33C | 1.81 | 1.54 | 1.60 |
| Net realized and unrealized gain (loss) | 10.51 | 3.58 | (2.68) | (2.82) | 9.19 | (4.89) |
| Total from investment operations | 11.28 | 5.23 | (.35) | (1.01) | 10.73 | (3.29) |
| Distributions from net investment income | (.11) | (1.55) | (2.36) | (1.83) | (1.61) | (1.55) |
| Distributions from net realized gain | (1.04) | (.90) | (7.53) | (6.30) | (2.64) | (6.72) |
| Total distributions | (1.16)D | (2.45) | (9.88)E | (8.13) | (4.25) | (8.28)F |
| Redemption fees added to paid in capitalB | – | – | – | – | –G | –G |
| Net asset value, end of period | $90.35 | $80.23 | $77.45 | $87.68 | $96.82 | $90.34 |
| Total ReturnH,I | 14.32% | 6.48% | (.04)% | (1.41)% | 12.22% | (3.26)% |
| Ratios to Average Net AssetsJ,K | | | | | | |
| Expenses before reductions | .76%L | .76% | .77% | .78% | .78% | .78% |
| Expenses net of fee waivers, if any | .76%L | .76% | .77% | .78% | .78% | .77% |
| Expenses net of all reductions | .75%L | .76% | .76% | .77% | .77% | .77% |
| Net investment income (loss) | 1.92%L | 1.95% | 2.93%C | 1.88% | 1.63% | 1.71% |
| Supplemental Data | | | | | | |
| Net assets, end of period (000 omitted) | $156,946 | $149,514 | $159,614 | $240,605 | $275,616 | $216,836 |
| Portfolio turnover rateM | 49%L | 40% | 41%N | 76% | 56%N | 63% |
A For the year ended February 29.
B Calculated based on average shares outstanding during the period.
C Net investment income per share reflects one or more large, non-recurring dividend(s) which amounted to $.69 per share. Excluding such non-recurring dividend(s), the ratio of net investment income (loss) to average net assets would have been 2.06%.
D Total distributions of $1.16 per share is comprised of distributions from net investment income of $.113 and distributions from net realized gain of $1.043 per share.
E Total distributions of $9.88 per share is comprised of distributions from net investment income of $2.357 and distributions from net realized gain of $7.525 per share.
F Total distributions of $8.28 per share is comprised of distributions from net investment income of $1.553 and distributions from net realized gain of $6.724 per share.
G Amount represents less than $.005 per share.
H Total returns for periods of less than one year are not annualized.
I Total returns would have been lower if certain expenses had not been reduced during the applicable periods shown.
J Fees and expenses of any underlying mutual funds or exchange-traded funds (ETFs) are not included in the Fund's expense ratio. The Fund indirectly bears its proportionate share of these expenses. For additional expense information related to investments in Fidelity Central Funds, please refer to the "Investments in Fidelity Central Funds" note found in the Notes to Financial Statements section of the most recent Annual or Semi-Annual report.
K Expense ratios reflect operating expenses of the class. Expenses before reductions do not reflect amounts reimbursed, waived, or reduced through arrangements with the investment adviser, brokerage services, or other offset arrangements, if applicable, and do not represent the amount paid by the class during periods when reimbursements, waivers or reductions occur.
L Annualized
M Amount does not include the portfolio activity of any underlying Fidelity Central Funds.
N Portfolio turnover rate excludes securities received or delivered in-kind.
See accompanying notes which are an integral part of the financial statements.
Consumer Staples Portfolio Class Z
| | Six months ended (Unaudited) August 31, | Years endedFebruary 29, | |
| | 2020 | 2020 A | 2019 B |
| Selected Per–Share Data | | | |
| Net asset value, beginning of period | $80.14 | $77.36 | $81.61 |
| Income from Investment Operations | | | |
| Net investment income (loss)C | .82 | 1.78 | .05D |
| Net realized and unrealized gain (loss) | 10.51 | 3.56 | .33E |
| Total from investment operations | 11.33 | 5.34 | .38 |
| Distributions from net investment income | (.14) | (1.66) | (2.23) |
| Distributions from net realized gain | (1.04) | (.90) | (2.40) |
| Total distributions | (1.18) | (2.56) | (4.63) |
| Redemption fees added to paid in capitalC | – | – | – |
| Net asset value, end of period | $90.29 | $80.14 | $77.36 |
| Total ReturnF,G | 14.41% | 6.61% | .79% |
| Ratios to Average Net AssetsH,I | | | |
| Expenses before reductions | .63%J | .63% | .63%J |
| Expenses net of fee waivers, if any | .63%J | .63% | .62%J |
| Expenses net of all reductions | .62%J | .62% | .61%J |
| Net investment income (loss) | 2.05%J | 2.08% | .16%D,J |
| Supplemental Data | | | |
| Net assets, end of period (000 omitted) | $52,907 | $41,629 | $8,052 |
| Portfolio turnover rateK | 49%J | 40% | 41%L |
A For the year ended February 29.
B For the period October 2, 2018 (commencement of sale of shares) to February 28, 2019.
C Calculated based on average shares outstanding during the period.
D Net investment income per share reflects one or more large, non-recurring dividend(s) which amounted to $.26 per share. Excluding such non-recurring dividend(s), the ratio of net investment income (loss) to average net assets would have been (.69) %.
E The amount shown for a share outstanding does not correspond with the aggregate net gain (loss) on investments for the period due to the timing of sales and repurchases of shares in relation to fluctuating market values of the investments of the Fund.
F Total returns for periods of less than one year are not annualized.
G Total returns would have been lower if certain expenses had not been reduced during the applicable periods shown.
H Fees and expenses of any underlying mutual funds or exchange-traded funds (ETFs) are not included in the Fund's expense ratio. The Fund indirectly bears its proportionate share of these expenses. For additional expense information related to investments in Fidelity Central Funds, please refer to the "Investments in Fidelity Central Funds" note found in the Notes to Financial Statements section of the most recent Annual or Semi-Annual report.
I Expense ratios reflect operating expenses of the class. Expenses before reductions do not reflect amounts reimbursed, waived, or reduced through arrangements with the investment adviser, brokerage services, or other offset arrangements, if applicable, and do not represent the amount paid by the class during periods when reimbursements, waivers or reductions occur.
J Annualized
K Amount does not include the portfolio activity of any underlying Fidelity Central Funds.
L Portfolio turnover rate excludes securities received or delivered in-kind.
See accompanying notes which are an integral part of the financial statements.
Notes to Financial Statements (Unaudited)
For the period ended August 31, 2020
1. Organization.
Consumer Staples Portfolio (the Fund) is a non-diversified fund of Fidelity Select Portfolios (the Trust) and is authorized to issue an unlimited number of shares. The Trust is registered under the Investment Company Act of 1940, as amended (the 1940 Act), as an open-end management investment company organized as a Massachusetts business trust. The Fund invests primarily in securities of companies whose principal business activities fall within specific industries. The Fund offers Class A, Class M, Class C, Consumer Staples, Class I and Class Z shares, each of which has equal rights as to assets and voting privileges. Each class has exclusive voting rights with respect to matters that affect that class. Class C shares will automatically convert to Class A shares after a holding period of ten years from the initial date of purchase, with certain exceptions.
2. Investments in Fidelity Central Funds.
The Fund invests in Fidelity Central Funds, which are open-end investment companies generally available only to other investment companies and accounts managed by the investment adviser and its affiliates. The Fund's Schedule of Investments lists each of the Fidelity Central Funds held as of period end, if any, as an investment of the Fund, but does not include the underlying holdings of each Fidelity Central Fund. As an Investing Fund, the Fund indirectly bears its proportionate share of the expenses of the underlying Fidelity Central Funds.
The Money Market Central Funds seek preservation of capital and current income and are managed by the investment adviser. Annualized expenses of the Money Market Central Funds as of their most recent shareholder report date ranged from less than .005% to .01%.
A complete unaudited list of holdings for each Fidelity Central Fund is available upon request or at the Securities and Exchange Commission (the SEC) website at www.sec.gov. In addition, the financial statements of the Fidelity Central Funds are available on the SEC website or upon request.
3. Significant Accounting Policies.
The Fund is an investment company and applies the accounting and reporting guidance of the Financial Accounting Standards Board (FASB) Accounting Standards Codification Topic 946 Financial Services – Investment Companies. The financial statements have been prepared in conformity with accounting principles generally accepted in the United States of America (GAAP), which require management to make certain estimates and assumptions at the date of the financial statements. Actual results could differ from those estimates. Subsequent events, if any, through the date that the financial statements were issued have been evaluated in the preparation of the financial statements. The following summarizes the significant accounting policies of the Fund:
Investment Valuation. Investments are valued as of 4:00 p.m. Eastern time on the last calendar day of the period. The Board of Trustees (the Board) has delegated the day to day responsibility for the valuation of the Fund's investments to the Fair Value Committee (the Committee) established by the Fund's investment adviser. In accordance with valuation policies and procedures approved by the Board, the Fund attempts to obtain prices from one or more third party pricing vendors or brokers to value its investments. When current market prices, quotations or currency exchange rates are not readily available or reliable, investments will be fair valued in good faith by the Committee, in accordance with procedures adopted by the Board. Factors used in determining fair value vary by investment type and may include market or investment specific events. The frequency with which these procedures are used cannot be predicted and they may be utilized to a significant extent. The Committee oversees the Fund's valuation policies and procedures and reports to the Board on the Committee's activities and fair value determinations. The Board monitors the appropriateness of the procedures used in valuing the Fund's investments and ratifies the fair value determinations of the Committee.
The Fund categorizes the inputs to valuation techniques used to value its investments into a disclosure hierarchy consisting of three levels as shown below:
- Level 1 – quoted prices in active markets for identical investments
- Level 2 – other significant observable inputs (including quoted prices for similar investments, interest rates, prepayment speeds, etc.)
- Level 3 – unobservable inputs (including the Fund's own assumptions based on the best information available)
Valuation techniques used to value the Fund's investments by major category are as follows:
Equity securities, including restricted securities, for which market quotations are readily available, are valued at the last reported sale price or official closing price as reported by a third party pricing vendor on the primary market or exchange on which they are traded and are categorized as Level 1 in the hierarchy. In the event there were no sales during the day or closing prices are not available, securities are valued at the last quoted bid price or may be valued using the last available price and are generally categorized as Level 2 in the hierarchy. For foreign equity securities, when market or security specific events arise, comparisons to the valuation of American Depositary Receipts (ADRs), futures contracts, Exchange-Traded Funds (ETFs) and certain indexes as well as quoted prices for similar securities may be used and would be categorized as Level 2 in the hierarchy. For equity securities, including restricted securities, where observable inputs are limited, assumptions about market activity and risk are used and these securities may be categorized as Level 3 in the hierarchy.
Investments in open-end mutual funds, including the Fidelity Central Funds, are valued at their closing net asset value (NAV) each business day and are categorized as Level 1 in the hierarchy.
Changes in valuation techniques may result in transfers in or out of an assigned level within the disclosure hierarchy. The aggregate value of investments by input level as of August 31, 2020 is included at the end of the Fund's Schedule of Investments.
Foreign Currency. Certain Funds may use foreign currency contracts to facilitate transactions in foreign-denominated securities. Gains and losses from these transactions may arise from changes in the value of the foreign currency or if the counterparties do not perform under the contracts' terms.
Foreign-denominated assets, including investment securities, and liabilities are translated into U.S. dollars at the exchange rates at period end. Purchases and sales of investment securities, income and dividends received, and expenses denominated in foreign currencies are translated into U.S. dollars at the exchange rate in effect on the transaction date.
The effects of exchange rate fluctuations on investments are included with the net realized and unrealized gain (loss) on investment securities. Other foreign currency transactions resulting in realized and unrealized gain (loss) are disclosed separately.
Investment Transactions and Income. For financial reporting purposes, the Fund's investment holdings and NAV include trades executed through the end of the last business day of the period. The NAV per share for processing shareholder transactions is calculated as of the close of business of the New York Stock Exchange (NYSE), normally 4:00 p.m. Eastern time and includes trades executed through the end of the prior business day. Gains and losses on securities sold are determined on the basis of identified cost and include proceeds received from litigation. Dividend income is recorded on the ex-dividend date, except for certain dividends from foreign securities where the ex-dividend date may have passed, which are recorded as soon as the Fund is informed of the ex-dividend date. Non-cash dividends included in dividend income, if any, are recorded at the fair market value of the securities received. Income and capital gain distributions from Fidelity Central Funds, if any, are recorded on the ex-dividend date. Certain distributions received by the Fund represent a return of capital or capital gain. The Fund determines the components of these distributions subsequent to the ex-dividend date, based upon receipt of tax filings or other correspondence relating to the underlying investment. These distributions are recorded as a reduction of cost of investments and/or as a realized gain. Investment income is recorded net of foreign taxes withheld where recovery of such taxes is uncertain.
Class Allocations and Expenses. Investment income, realized and unrealized capital gains and losses, common expenses of the Fund, and certain fund-level expense reductions, if any, are allocated daily on a pro-rata basis to each class based on the relative net assets of each class to the total net assets of the Fund. Each class differs with respect to transfer agent and distribution and service plan fees incurred. Certain expense reductions may also differ by class. For the reporting period, the allocated portion of income and expenses to each class as a percent of its average net assets may vary due to the timing of recording these transactions in relation to fluctuating net assets of the classes. Expenses directly attributable to a fund are charged to that fund. Expenses attributable to more than one fund are allocated among the respective funds on the basis of relative net assets or other appropriate methods. Expense estimates are accrued in the period to which they relate and adjustments are made when actual amounts are known.
Deferred Trustee Compensation. Under a Deferred Compensation Plan (the Plan) for the Fund, certain independent Trustees have elected to defer receipt of a portion of their annual compensation. Deferred amounts are invested in a cross-section of Fidelity funds, are marked-to-market and remain in the Fund until distributed in accordance with the Plan. The investment of deferred amounts and the offsetting payable to the Trustees of $241,418 are included in the accompanying Statement of Assets and Liabilities in other receivables and other payables and accrued expenses, respectively.
Income Tax Information and Distributions to Shareholders. Each year, the Fund intends to qualify as a regulated investment company under Subchapter M of the Internal Revenue Code, including distributing substantially all of its taxable income and realized gains. As a result, no provision for U.S. Federal income taxes is required. The Fund files a U.S. federal tax return, in addition to state and local tax returns as required. The Fund's federal income tax returns are subject to examination by the Internal Revenue Service (IRS) for a period of three fiscal years after they are filed. State and local tax returns may be subject to examination for an additional fiscal year depending on the jurisdiction. Foreign taxes are provided for based on the Fund's understanding of the tax rules and rates that exist in the foreign markets in which it invests.
Distributions are declared and recorded on the ex-dividend date. Income and capital gain distributions are declared separately for each class. Income and capital gain distributions are determined in accordance with income tax regulations, which may differ from GAAP.
Capital accounts within the financial statements are adjusted for permanent book-tax differences. These adjustments have no impact on net assets or the results of operations. Capital accounts are not adjusted for temporary book-tax differences which will reverse in a subsequent period.
Book-tax differences are primarily due to foreign currency transactions, deferred trustees compensation and losses deferred due to wash sales and excise tax regulations.
As of period end, the cost and unrealized appreciation (depreciation) in securities, and derivatives if applicable, for federal income tax purposes were as follows:
| Gross unrealized appreciation | $364,841,404 |
| Gross unrealized depreciation | (53,536,214) |
| Net unrealized appreciation (depreciation) | $311,305,190 |
| Tax cost | $1,167,826,531 |
Restricted Securities (including Private Placements). The Fund may invest in securities that are subject to legal or contractual restrictions on resale. These securities generally may be resold in transactions exempt from registration or to the public if the securities are registered. Disposal of these securities may involve time-consuming negotiations and expense, and prompt sale at an acceptable price may be difficult. Information regarding restricted securities is included at the end of the Fund's Schedule of Investments.
4. Purchases and Sales of Investments.
Purchases and sales of securities, other than short-term securities, are noted in the table below.
| | Purchases ($) | Sales ($) |
| Consumer Staples Portfolio | 331,669,823 | 405,256,304 |
5. Fees and Other Transactions with Affiliates.
Management Fee. Fidelity Management & Research Company LLC (the investment adviser) and its affiliates provide the Fund with investment management related services for which the Fund pays a monthly management fee. The management fee is the sum of an individual fund fee rate that is based on an annual rate of .30% of the Fund's average net assets and an annualized group fee rate that averaged .23% during the period. The group fee rate is based upon the monthly average net assets of a group of registered investment companies with which the investment adviser has management contracts. The group fee rate decreases as assets under management increase and increases as assets under management decrease. For the reporting period, the total annualized management fee rate was .53% of the Fund's average net assets.
Distribution and Service Plan Fees. In accordance with Rule 12b-1 of the 1940 Act, the Fund has adopted separate Distribution and Service Plans for each class of shares. Certain classes pay Fidelity Distributors Company LLC (FDC), an affiliate of the investment adviser, separate Distribution and Service Fees, each of which is based on an annual percentage of each class' average net assets. In addition, FDC may pay financial intermediaries for selling shares of the Fund and providing shareholder support services. For the period, the Distribution and Service Fee rates, total fees and amounts retained by FDC were as follows:
| | Distribution Fee | Service Fee | Total Fees | Retained by FDC |
| Class A | -% | .25% | $294,001 | $2,918 |
| Class M | .25% | .25% | 138,800 | – |
| Class C | .75% | .25% | 567,255 | 49,383 |
| | | | $1,000,056 | $52,301 |
Sales Load. FDC may receive a front-end sales charge of up to 5.75% for selling Class A shares and 3.50% for selling Class M shares, some of which is paid to financial intermediaries for selling shares of the Fund. Depending on the holding period, FDC may receive contingent deferred sales charges levied on Class A, Class M and Class C redemptions. The deferred sales charges are 1.00% for Class C shares, 1.00% for certain purchases of Class A shares and .25% for certain purchases of Class M shares.
For the period, sales charge amounts retained by FDC were as follows:
| | Retained by FDC |
| Class A | $39,956 |
| Class M | 5,077 |
| Class C(a) | 5,006 |
| | $50,039 |
(a) When Class C shares are initially sold, FDC pays commissions from its own resources to financial intermediaries through which the sales are made.
Transfer Agent Fees. Fidelity Investments Institutional Operations Company LLC (FIIOC), an affiliate of the investment adviser, is the transfer, dividend disbursing and shareholder servicing agent for each class of the Fund. FIIOC receives account fees and asset-based fees that vary according to the account size and type of account of the shareholders of the respective classes of the Fund, except for Class Z. FIIOC receives an asset-based fee of Class Z's average net assets. FIIOC pays for typesetting, printing and mailing of shareholder reports, except proxy statements.
For the period, transfer agent fees for each class were as follows:
| | Amount | % of Class-Level Average Net Assets(a) |
| Class A | $250,198 | .21 |
| Class M | 64,849 | .23 |
| Class C | 119,021 | .21 |
| Consumer Staples | 655,287 | .17 |
| Class I | 126,118 | .18 |
| Class Z | 9,575 | .04 |
| | $1,225,048 | |
(a) Annualized
Accounting Fees. Fidelity Service Company, Inc. (FSC), an affiliate of the investment adviser, maintains the Fund's accounting records. The accounting fee is based on the level of average net assets for each month. For the period, the fees were equivalent to the following annualized rates:
| | % of Average Net Assets |
| Consumer Staples Portfolio | .03 |
Brokerage Commissions. A portion of portfolio transactions were placed with brokerage firms which are affiliates of the investment adviser. Brokerage commissions are included in net realized gain (loss) and change in net unrealized appreciation (depreciation) in the Statement of Operations. The commissions paid to these affiliated firms were as follows:
| | Amount |
| Consumer Staples Portfolio | $12,262 |
Interfund Trades. Funds may purchase from or sell securities to other Fidelity Funds under procedures adopted by the Board. The procedures have been designed to ensure these interfund trades are executed in accordance with Rule 17a-7 of the 1940 Act. Interfund trades are included within the respective purchases and sales amounts shown in the Purchases and Sales of Investments note.
6. Committed Line of Credit.
Certain Funds participate with other funds managed by the investment adviser or an affiliate in a $4.25 billion credit facility (the "line of credit") to be utilized for temporary or emergency purposes to fund shareholder redemptions or for other short-term liquidity purposes. The participating funds have agreed to pay commitment fees on their pro-rata portion of the line of credit, which are reflected in Miscellaneous expenses on the Statement of Operations, and are as follows:
| | Amount |
| Consumer Staples Portfolio | $1,729 |
During the period, there were no borrowings on this line of credit.
7. Security Lending.
The Fund lends portfolio securities from time to time in order to earn additional income. Lending agents are used, including National Financial Services (NFS), an affiliate of the Fund. Pursuant to a securities lending agreement, NFS will receive a fee, which is capped at 9.9% of daily lending revenue, for its services as lending agent. The Fund may lend securities to certain qualified borrowers, including NFS. On the settlement date of the loan, the Fund receives collateral (in the form of U.S. Treasury obligations, letters of credit and/or cash) against the loaned securities and maintains collateral in an amount not less than 100% of the market value of the loaned securities during the period of the loan. The market value of the loaned securities is determined at the close of business of the Fund and any additional required collateral is delivered to the Fund on the next business day. The Fund or borrower may terminate the loan at any time, and if the borrower defaults on its obligation to return the securities loaned because of insolvency or other reasons, the Fund may apply collateral received from the borrower against the obligation. The Fund may experience delays and costs in recovering the securities loaned. Any cash collateral received is invested in the Fidelity Securities Lending Cash Central Fund. The value of loaned securities and cash collateral at period end are disclosed on the Fund's Statement of Assets and Liabilities. Total fees paid by the Fund to NFS, as lending agent, amounted to $2,679. Security lending income represents the income earned on investing cash collateral, less rebates paid to borrowers and any lending agent fees associated with the loan, plus any premium payments received for lending certain types of securities. Net income from the Fidelity Securities Lending Cash Central Fund during the period is presented in the Statement of Operations as a component of income from Fidelity Central Funds. During the period, there were no securities loaned to NFS.
8. Expense Reductions.
Commissions paid to certain brokers with whom the investment adviser, or its affiliates, places trades on behalf of the Fund include an amount in addition to trade execution, which may be rebated back to the Fund to offset certain expenses. This amount totaled $87,313 for the period. In addition, through arrangements with the Fund's custodian and each class' transfer agent, credits realized as a result of certain uninvested cash balances were used to reduce the Fund's expenses. During the period, custodian credits reduced the Fund's expenses by $310.
In addition, during the period the investment adviser or an affiliate reimbursed and/or waived a portion of fund-level operating expenses in the amount of $3,097.
9. Distributions to Shareholders.
Distributions to shareholders of each class were as follows:
| | Six months ended
August 31, 2020 | Year ended
February 29, 2020 |
| Distributions to shareholders | | |
| Class A | $3,284,468 | $6,696,405 |
| Class M | 764,252 | 1,461,199 |
| Class C | 1,507,253 | 2,610,802 |
| Consumer Staples | 10,953,264 | 23,815,786 |
| Class I | 2,045,545 | 4,878,027 |
| Class Z | 636,432 | 1,258,230 |
| Total | $19,191,214 | $40,720,449 |
10. Share Transactions.
Share transactions for each class were as follows and may contain automatic conversions between classes or exchanges between affiliated funds:
| | Shares | Shares | Dollars | Dollars |
| | Six months ended August 31, 2020 | Year ended February 29, 2020 | Six months ended August 31, 2020 | Year ended February 29, 2020 |
| Class A | | | | |
| Shares sold | 323,186 | 673,280 | $25,082,450 | $55,409,168 |
| Reinvestment of distributions | 42,217 | 74,433 | 3,197,083 | 6,499,464 |
| Shares redeemed | (476,507) | (761,324) | (37,275,279) | (63,492,568) |
| Net increase (decrease) | (111,104) | (13,611) | $(8,995,746) | $(1,583,936) |
| Class M | | | | |
| Shares sold | 52,828 | 96,558 | $4,008,246 | $8,040,205 |
| Reinvestment of distributions | 10,140 | 16,736 | 759,967 | 1,447,176 |
| Shares redeemed | (95,192) | (191,768) | (7,438,602) | (15,887,658) |
| Net increase (decrease) | (32,224) | (78,474) | $(2,670,389) | $(6,400,277) |
| Class C | | | | |
| Shares sold | 96,926 | 172,528 | $7,257,890 | $14,091,994 |
| Reinvestment of distributions | 19,773 | 29,580 | 1,454,487 | 2,512,849 |
| Shares redeemed | (256,312) | (700,216) | (19,775,369) | (55,637,531) |
| Net increase (decrease) | (139,613) | (498,108) | $(11,062,992) | $(39,032,688) |
| Consumer Staples | | | | |
| Shares sold | 980,624 | 1,681,521 | $76,716,518 | $142,087,479 |
| Reinvestment of distributions | 131,116 | 246,658 | 10,034,298 | 21,760,149 |
| Shares redeemed | (1,760,987) | (2,801,634) | (139,109,340) | (236,743,124) |
| Net increase (decrease) | (649,247) | (873,455) | $(52,358,524) | $(72,895,496) |
| Class I | | | | |
| Shares sold | 593,785 | 1,013,976 | $45,709,485 | $85,980,860 |
| Reinvestment of distributions | 24,743 | 50,832 | 1,889,121 | 4,473,725 |
| Shares redeemed | (745,153) | (1,262,032) | (58,046,909) | (106,844,142) |
| Net increase (decrease) | (126,625) | (197,224) | $(10,448,303) | $(16,389,557) |
| Class Z | | | | |
| Shares sold | 198,133 | 503,808 | $16,000,514 | $42,214,998 |
| Reinvestment of distributions | 7,921 | 13,623 | 604,056 | 1,197,347 |
| Shares redeemed | (139,504) | (102,066) | (11,118,449) | (8,692,361) |
| Net increase (decrease) | 66,550 | 415,365 | $5,486,121 | $34,719,984 |
11. Other.
The Fund's organizational documents provide former and current trustees and officers with a limited indemnification against liabilities arising in connection with the performance of their duties to the Fund. In the normal course of business, the Fund may also enter into contracts that provide general indemnifications. The Fund's maximum exposure under these arrangements is unknown as this would be dependent on future claims that may be made against the Fund. The risk of material loss from such claims is considered remote.
12. Coronavirus (COVID-19) Pandemic.
An outbreak of COVID-19 first detected in China during December 2019 has since spread globally and was declared a pandemic by the World Health Organization during March 2020. Developments that disrupt global economies and financial markets, such as the COVID-19 pandemic, may magnify factors that affect the Fund's performance.
Shareholder Expense Example
As a shareholder, you incur two types of costs: (1) transaction costs, which may include sales charges (loads) on purchase payments or redemption proceeds, as applicable and (2) ongoing costs, which generally include management fees, distribution and/or service (12b-1) fees and other Fund expenses. This Example is intended to help you understand your ongoing costs (in dollars) of investing in a fund and to compare these costs with the ongoing costs of investing in other mutual funds.
The Example is based on an investment of $1,000 invested at the beginning of the period and held for the entire period (March 1, 2020 to August 31, 2020).
Actual Expenses
The first line of the accompanying table provides information about actual account values and actual expenses. You may use the information in this line, together with the amount you invested, to estimate the expenses that you paid over the period. Simply divide your account value by $1,000.00 (for example, an $8,600 account value divided by $1,000.00 = 8.6), then multiply the result by the number in the first line for a class/Fund under the heading entitled "Expenses Paid During Period" to estimate the expenses you paid on your account during this period. If any fund is a shareholder of any underlying mutual funds or exchange-traded funds (ETFs) (the Underlying Funds), such fund indirectly bears its proportional share of the expenses of the Underlying Funds in addition to the direct expenses incurred presented in the table. These fees and expenses are not included in the annualized expense ratio used to calculate the expense estimate in the table below.
Hypothetical Example for Comparison Purposes
The second line of the accompanying table provides information about hypothetical account values and hypothetical expenses based on the actual expense ratio and an assumed rate of return of 5% per year before expenses, which is not the actual return. The hypothetical account values and expenses may not be used to estimate the actual ending account balance or expenses you paid for the period. You may use this information to compare the ongoing costs of investing in the Fund and other funds. To do so, compare this 5% hypothetical example with the 5% hypothetical examples that appear in the shareholder reports of the other funds. If any fund is a shareholder of any Underlying Funds, such fund indirectly bears its proportional share of the expenses of the Underlying Funds in addition to the direct expenses as presented in the table. These fees and expenses are not included in the annualized expense ratio used to calculate the expense estimate in the table below.
Please note that the expenses shown in the table are meant to highlight your ongoing costs only and do not reflect any transaction costs. Therefore, the second line of the table is useful in comparing ongoing costs only, and will not help you determine the relative total costs of owning different funds. In addition, if these transactional costs were included, your costs would have been higher.
| | Annualized Expense Ratio-A | Beginning
Account Value
March 1, 2020 | Ending
Account Value
August 31, 2020 | Expenses Paid
During Period-B
March 1, 2020
to August 31, 2020 |
| Consumer Staples Portfolio | | | | |
| Class A | 1.05% | | | |
| Actual | | $1,000.00 | $1,141.60 | $5.67 |
| Hypothetical-C | | $1,000.00 | $1,019.91 | $5.35 |
| Class M | 1.32% | | | |
| Actual | | $1,000.00 | $1,140.10 | $7.12 |
| Hypothetical-C | | $1,000.00 | $1,018.55 | $6.72 |
| Class C | 1.79% | | | |
| Actual | | $1,000.00 | $1,137.30 | $9.64 |
| Hypothetical-C | | $1,000.00 | $1,016.18 | $9.10 |
| Consumer Staples | .76% | | | |
| Actual | | $1,000.00 | $1,143.30 | $4.11 |
| Hypothetical-C | | $1,000.00 | $1,021.37 | $3.87 |
| Class I | .76% | | | |
| Actual | | $1,000.00 | $1,143.20 | $4.11 |
| Hypothetical-C | | $1,000.00 | $1,021.37 | $3.87 |
| Class Z | .63% | | | |
| Actual | | $1,000.00 | $1,144.10 | $3.40 |
| Hypothetical-C | | $1,000.00 | $1,022.03 | $3.21 |
A Annualized expense ratio reflects expenses net of applicable fee waivers.
B Expenses are equal to the annualized expense ratio, multiplied by the average account value over the period, multiplied by 184/ 365 (to reflect the one-half year period). The fees and expenses of any Underlying Funds are not included in each annualized expense ratio.
C 5% return per year before expenses
SELCS-SANN-1020
1.846045.113
Item 2.
Code of Ethics
Not applicable.
Item 3.
Audit Committee Financial Expert
Not applicable.
Item 4.
Principal Accountant Fees and Services
Not applicable.
Item 5.
Audit Committee of Listed Registrants
Not applicable.
Item 6.
Investments
(a)
Not applicable.
(b)
Not applicable
Item 7.
Disclosure of Proxy Voting Policies and Procedures for Closed-End Management Investment Companies
Not applicable.
Item 8.
Portfolio Managers of Closed-End Management Investment Companies
Not applicable.
Item 9.
Purchase of Equity Securities by Closed-End Management Investment Company and Affiliated Purchasers
Not applicable.
Item 10.
Submission of Matters to a Vote of Security Holders
There were no material changes to the procedures by which shareholders may recommend nominees to the Fidelity Select Portfolios’s Board of Trustees.
Item 11.
Controls and Procedures
(a)(i) The President and Treasurer and the Chief Financial Officer have concluded that the Fidelity Select Portfolios’s (the “Trust”) disclosure controls and procedures (as
defined in Rule 30a-3(c) under the Investment Company Act) provide reasonable assurances that material information relating to the Trust is made known to them by the appropriate persons, based on their evaluation of these controls and procedures as of a date within 90 days of the filing date of this report.
(a)(ii) There was no change in the Trust’s internal control over financial reporting (as defined in Rule 30a-3(d) under the Investment Company Act) that occurred during the period covered by this report that has materially affected, or is reasonably likely to materially affect, the Trust’s internal control over financial reporting.
Item 12.
Disclosure of Securities Lending Activities for Closed-End Management
Investment Companies
Not applicable.
Item 13.
Exhibits
SIGNATURES
Pursuant to the requirements of the Securities Exchange Act of 1934 and the Investment Company Act of 1940, the registrant has duly caused this report to be signed on its behalf by the undersigned, thereunto duly authorized.
Fidelity Select Portfolios
| |
By: | /s/Stacie M. Smith |
| Stacie M. Smith |
| President and Treasurer |
|
|
Date: | October 19, 2020 |
Pursuant to the requirements of the Securities Exchange Act of 1934 and the Investment Company Act of 1940, this report has been signed below by the following persons on behalf of the registrant and in the capacities and on the dates indicated.
| |
By: | /s/Stacie M. Smith |
| Stacie M. Smith |
| President and Treasurer |
|
|
Date: | October 19, 2020 |
| |
By: | /s/John J. Burke III |
| John J. Burke III |
| Chief Financial Officer |
|
|
Date: | October 19, 2020 |