UNITED STATES
SECURITIES AND EXCHANGE COMMISSION
Washington, D.C. 20549
FORM N-CSR
CERTIFIED SHAREHOLDER REPORT OF REGISTERED
MANAGEMENT INVESTMENT COMPANIES
Investment Company Act file number 811-03114
Fidelity Select Portfolios
(Exact name of registrant as specified in charter)
245 Summer St., Boston, Massachusetts 02210
(Address of principal executive offices) (Zip code)
Cynthia Lo Bessette, Secretary
245 Summer St.
Boston, Massachusetts 02210
(Name and address of agent for service)
Registrant's telephone number, including area code:
617-563-7000
| |
Date of fiscal year end: | July 31 |
|
|
Date of reporting period: | July 31, 2020 |
Item 1.
Reports to Stockholders
Fidelity Flex® Funds
Fidelity Flex® Real Estate Fund
Annual Report
July 31, 2020

See the inside front cover for important information about access to your fund’s shareholder reports.

Beginning on January 1, 2021, as permitted by regulations adopted by the Securities and Exchange Commission, paper copies of a fund’s shareholder reports will no longer be sent by mail, unless you specifically request paper copies of the reports from the fund or from your financial intermediary, such as a financial advisor, broker-dealer or bank. Instead, the reports will be made available on a website, and you will be notified by mail each time a report is posted and provided with a website link to access the report.
If you already elected to receive shareholder reports electronically, you will not be affected by this change and you need not take any action. You may elect to receive shareholder reports and other communications from a fund electronically, by contacting your financial intermediary. For Fidelity customers, visit Fidelity's web site or call Fidelity using the contact information listed below.
You may elect to receive all future reports in paper free of charge. If you wish to continue receiving paper copies of your shareholder reports, you may contact your financial intermediary or, if you are a Fidelity customer, visit Fidelity’s website, or call Fidelity at the applicable toll-free number listed below. Your election to receive reports in paper will apply to all funds held with the fund complex/your financial intermediary.
| Account Type | Website | Phone Number |
| Brokerage, Mutual Fund, or Annuity Contracts: | fidelity.com/mailpreferences | 1-800-343-3548 |
| Employer Provided Retirement Accounts: | netbenefits.fidelity.com/preferences (choose 'no' under Required Disclosures to continue to print) | 1-800-343-0860 |
| Advisor Sold Accounts Serviced Through Your Financial Intermediary: | Contact Your Financial Intermediary | Your Financial Intermediary's phone number |
| Advisor Sold Accounts Serviced by Fidelity: | institutional.fidelity.com | 1-877-208-0098 |
Contents
To view a fund's proxy voting guidelines and proxy voting record for the 12-month period ended June 30, visit http://www.fidelity.com/proxyvotingresults or visit the Securities and Exchange Commission's (SEC) web site at http://www.sec.gov.
You may also call 1-800-544-3455 (for managed account clients) or 1-800-835-5092 (for retirement plan participants) to request a free copy of the proxy voting guidelines.
Standard & Poor's, S&P and S&P 500 are registered service marks of The McGraw-Hill Companies, Inc. and have been licensed for use by Fidelity Distributors Corporation.
Other third-party marks appearing herein are the property of their respective owners.
All other marks appearing herein are registered or unregistered trademarks or service marks of FMR LLC or an affiliated company. © 2020 FMR LLC. All rights reserved.
This report and the financial statements contained herein are submitted for the general information of the shareholders of the Fund. This report is not authorized for distribution to prospective investors in the Fund unless preceded or accompanied by an effective prospectus.
A fund files its complete schedule of portfolio holdings with the SEC for the first and third quarters of each fiscal year on Form N-PORT. Forms N-PORT are available on the SEC’s web site at http://www.sec.gov. A fund's Forms N-PORT may be reviewed and copied at the SEC’s Public Reference Room in Washington, DC. Information regarding the operation of the SEC's Public Reference Room may be obtained by calling 1-800-SEC-0330.
For a complete list of a fund's portfolio holdings, view the most recent holdings listing, semiannual report, or annual report on Fidelity's web site at http://www.fidelity.com, http://www.institutional.fidelity.com, or http://www.401k.com, as applicable.
NOT FDIC INSURED •MAY LOSE VALUE •NO BANK GUARANTEE
Neither the Fund nor Fidelity Distributors Corporation is a bank.
Note to Shareholders:
Early in 2020, the outbreak and spread of a new coronavirus emerged as a public health emergency that had a major influence on financial markets, primarily based on its impact on the global economy and the outlook for corporate earnings. The virus causes a respiratory disease known as COVID-19. On March 11, the World Health Organization declared the COVID-19 outbreak a pandemic, citing sustained risk of further global spread.
In the weeks following, as the crisis worsened, we witnessed an escalating human tragedy with wide-scale social and economic consequences from coronavirus-containment measures. The outbreak of COVID-19 prompted a number of measures to limit the spread, including travel and border restrictions, quarantines, and restrictions on large gatherings. In turn, these resulted in lower consumer activity, diminished demand for a wide range of products and services, disruption in manufacturing and supply chains, and – given the wide variability in outcomes regarding the outbreak – significant market uncertainty and volatility. Amid the turmoil, the U.S. government took unprecedented action – in concert with the U.S. Federal Reserve and central banks around the world – to help support consumers, businesses, and the broader economy, and to limit disruption to the financial system.
The situation continues to unfold, and the extent and duration of its impact on financial markets and the economy remain highly uncertain. Extreme events such as the coronavirus crisis are “exogenous shocks” that can have significant adverse effects on mutual funds and their investments. Although multiple asset classes may be affected by market disruption, the duration and impact may not be the same for all types of assets.
Fidelity is committed to helping you stay informed amid news about COVID-19 and during increased market volatility, and we’re taking extra steps to be responsive to customer needs. We encourage you to visit our websites, where we offer ongoing updates, commentary, and analysis on the markets and our funds.
Performance: The Bottom Line
Average annual total return reflects the change in the value of an investment, assuming reinvestment of distributions from dividend income and capital gains (the profits earned upon the sale of securities that have grown in value, if any) and assuming a constant rate of performance each year. The hypothetical investment and the average annual total returns do not reflect the deduction of taxes that a shareholder would pay on fund distributions or the redemption of fund shares. During periods of reimbursement by Fidelity, a fund’s total return will be greater than it would be had the reimbursement not occurred. How a fund did yesterday is no guarantee of how it will do tomorrow.
Average Annual Total Returns
| For the periods ended July 31, 2020 | Past 1 year | Life of fundA |
| Fidelity Flex® Real Estate Fund | (7.33)% | 3.52% |
A From March 8, 2017
$10,000 Over Life of Fund
Let's say hypothetically that $10,000 was invested in Fidelity Flex® Real Estate Fund on March 8, 2017, when the fund started.
The chart shows how the value of your investment would have changed, and also shows how the Dow Jones U.S. Select Real Estate Securities Index℠ performed over the same period.
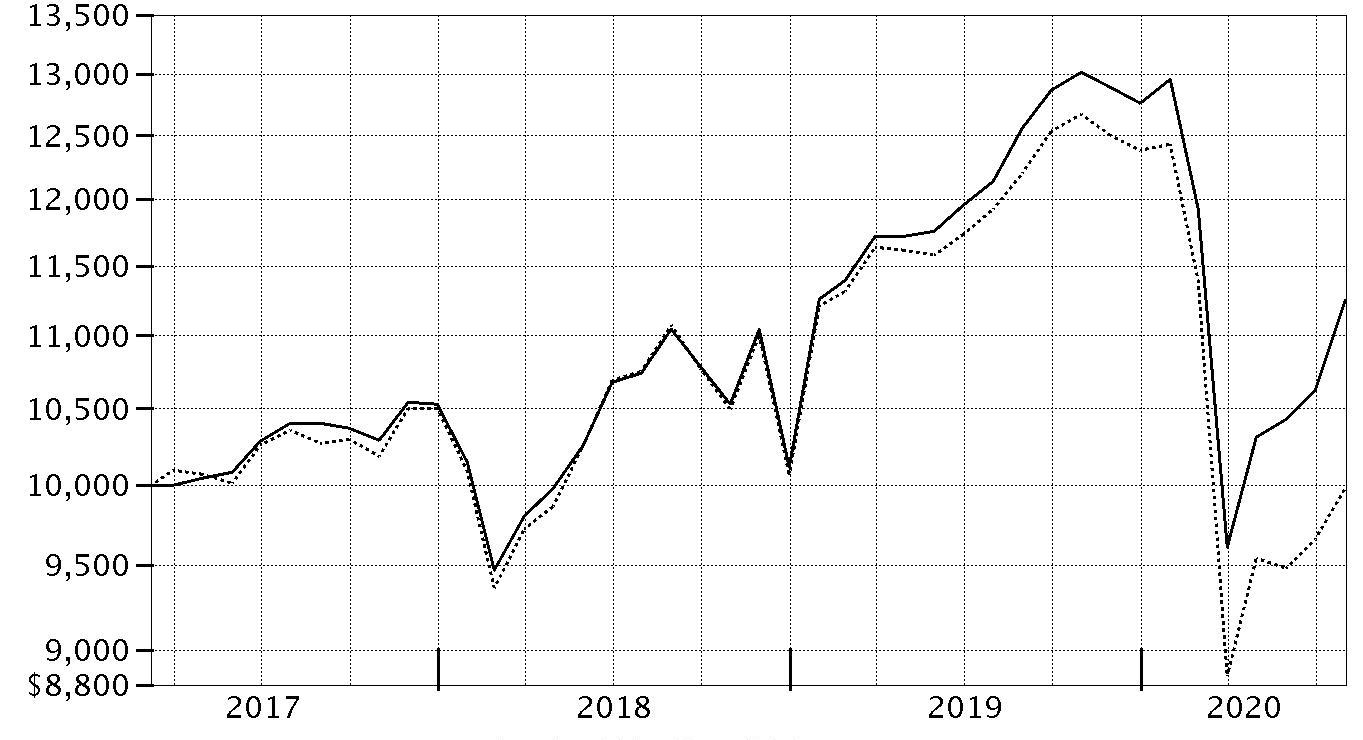
| Period Ending Values |
| $11,248 | Fidelity Flex® Real Estate Fund |
| $9,979 | Dow Jones U.S. Select Real Estate Securities Index℠ |
Management's Discussion of Fund Performance
Market Recap: The S&P 500
® index gained 11.96% for the 12 months ending July 31, 2020, in what was a bumpy ride for U.S. equity investors, marked by a steep but brief decline due to the early-2020 outbreak and spread of the coronavirus, followed by a historic rebound. Declared a pandemic on March 11, the COVID-19 crisis and containment efforts caused broad contraction in economic activity, along with extreme uncertainty, volatility and dislocation in financial markets. By mid-March, U.S. stocks entered bear-market territory less than a month after hitting an all-time high and extending the longest-running bull market in American history. Stocks slid in late February, after a surge in COVID-19 cases outside China. The sudden downtrend continued in March (-12%), capping the index’s worst quarter since 2008. A historically rapid and expansive U.S. monetary/fiscal-policy response provided a partial offset to the economic disruption and fueled a sharp uptrend. Aggressive support for financial markets by the U.S. Federal Reserve, plans for reopening the economy and improving infection data boosted stocks in April (+13%) and May (+5%). In June and July, the index gained amid progress on potential treatments and signs of an early recovery in economic activity. For the full 12 months, growth stocks widely topped value, while large-caps handily bested smaller-caps. The information technology sector (+39%) led the way, followed by consumer discretionary (+22%). In contrast, energy (-38%) fell hard along with the price of crude oil.
Comments from Portfolio Manager Steven Buller: For the fiscal year ending July 31, 2020, the fund returned -7.33%, significantly outperforming the -16.30% result of the Dow Jones U.S. Select Real Estate Securities Index℠. A combination of favorable positioning and security selection lifted relative performance the past 12 months. The fund benefited significantly from its significant underweighting in retail REITs, especially malls, whose existing competitive challenges worsened with the emergence of the COVID-19 pandemic. Investment choices in the category also added value, due primarily to our significant underweighting in Simon Property Group, which returned about -61% within the portfolio. We sold our stake in Simon, the country's largest mall owner, in March due to our ongoing concerns about the business prospects for the retail property sector. The fund's overweighting, coupled with favorable picks in the strong-performing industrial category, also lifted the portfolio's relative result. Standout performers in this group included an overweight stake in data center REITs Digital Realty Trust (+50%) and an out-of-benchmark position in Equinix (+64%), which benefited as people working from home boosted demand for data-management facilities, as well as larger-than-benchmark positions in warehouse operators Duke Realty (+26%) and Prologis (+36%), whose business benefits from growth in e-commerce. All four of these stocks, save Equinix, were among the fund's largest holdings on July 31. In contrast, only the portfolio's positioning among health care REITs had a notably negative impact on relative performance. More specifically, the fund's biggest individual detractor by far was health care REIT Ventas (-44%). The company's shares fell last fall, after Ventas announced weak quarterly earnings related to challenges with its senior-housing operations. More recently, concern about the impact of COVID-19 on the firm's senior housing business further weighed on investors' expectations for the stock. Coronavirus worries also pressured hotel REITs, with Diamondrock Hospitality weighing the most on relative performance. The firm, one of the portfolio's few remaining positions in the hotel sector as of July 31, returned -61%. Boston Properties (-30%), an owner of office properties, was another meaningful relative detractor this period.
The views expressed above reflect those of the portfolio manager(s) only through the end of the period as stated on the cover of this report and do not necessarily represent the views of Fidelity or any other person in the Fidelity organization. Any such views are subject to change at any time based upon market or other conditions and Fidelity disclaims any responsibility to update such views. These views may not be relied on as investment advice and, because investment decisions for a Fidelity fund are based on numerous factors, may not be relied on as an indication of trading intent on behalf of any Fidelity fund.
Note to shareholders: On October 1, 2020, the fund's benchmark will change from Dow Jones U.S. Select Real Estate Securities Index to the MSCI US IMI Real Estate 25/50 Index, which is a better representation of the overall real estate market.
Investment Summary (Unaudited)
Top Ten Stocks as of July 31, 2020
| | % of fund's net assets |
| Prologis (REIT), Inc. | 13.3 |
| Digital Realty Trust, Inc. | 9.1 |
| Duke Realty Corp. | 6.4 |
| UDR, Inc. | 4.9 |
| Crown Castle International Corp. | 4.9 |
| Equity Lifestyle Properties, Inc. | 4.3 |
| Welltower, Inc. | 4.2 |
| Invitation Homes, Inc. | 3.2 |
| Sun Communities, Inc. | 3.2 |
| Mid-America Apartment Communities, Inc. | 2.8 |
| | 56.3 |
Top Five REIT Sectors as of July 31, 2020
| | % of fund's net assets |
| REITs - Diversified | 26.5 |
| REITs - Apartments | 16.9 |
| REITs - Warehouse/Industrial | 15.0 |
| REITs - Health Care | 9.4 |
| REITs - Office Property | 8.2 |
Asset Allocation (% of fund's net assets)
| As of July 31, 2020* |
| | Stocks | 99.1% |
| | Short-Term Investments and Net Other Assets (Liabilities) | 0.9% |

* Foreign investments - 1.1%
Schedule of Investments July 31, 2020
Showing Percentage of Net Assets
| Common Stocks - 99.1% | | | |
| | | Shares | Value |
| Equity Real Estate Investment Trusts (REITs) - 97.8% | | | |
| REITs - Apartments - 16.9% | | | |
| American Homes 4 Rent Class A | | 1,274 | $36,946 |
| Apartment Investment & Management Co. Class A | | 613 | 23,797 |
| Equity Residential (SBI) | | 402 | 21,559 |
| Invitation Homes, Inc. | | 1,506 | 44,909 |
| Mid-America Apartment Communities, Inc. | | 321 | 38,260 |
| UDR, Inc. | | 1,869 | 67,658 |
| | | | 233,129 |
| REITs - Diversified - 26.5% | | | |
| Crown Castle International Corp. | | 403 | 67,180 |
| Digital Realty Trust, Inc. | | 785 | 126,024 |
| Duke Realty Corp. | | 2,199 | 88,378 |
| Equinix, Inc. | | 33 | 25,921 |
| Gaming & Leisure Properties | | 433 | 15,679 |
| SBA Communications Corp. Class A | | 78 | 24,300 |
| VICI Properties, Inc. | | 281 | 6,101 |
| Washington REIT (SBI) | | 543 | 12,141 |
| | | | 365,724 |
| REITs - Health Care - 9.4% | | | |
| Healthcare Trust of America, Inc. | | 1,177 | 32,497 |
| Ventas, Inc. | | 994 | 38,130 |
| Welltower, Inc. | | 1,093 | 58,541 |
| | | | 129,168 |
| REITs - Hotels - 0.9% | | | |
| DiamondRock Hospitality Co. | | 1,627 | 7,517 |
| RLJ Lodging Trust | | 662 | 5,303 |
| | | | 12,820 |
| REITs - Management/Investment - 3.8% | | | |
| American Assets Trust, Inc. | | 326 | 8,802 |
| Lexington Corporate Properties Trust | | 1,581 | 18,340 |
| National Retail Properties, Inc. | | 729 | 25,843 |
| | | | 52,985 |
| REITs - Manufactured Homes - 7.5% | | | |
| Equity Lifestyle Properties, Inc. | | 861 | 58,824 |
| Sun Communities, Inc. | | 293 | 43,929 |
| | | | 102,753 |
| REITs - Office Property - 8.2% | | | |
| Boston Properties, Inc. | | 344 | 30,647 |
| Brandywine Realty Trust (SBI) | | 1,348 | 14,599 |
| Highwoods Properties, Inc. (SBI) | | 446 | 17,100 |
| Mack-Cali Realty Corp. | | 618 | 8,912 |
| Piedmont Office Realty Trust, Inc. Class A | | 857 | 13,892 |
| VEREIT, Inc. | | 4,275 | 27,830 |
| | | | 112,980 |
| REITs - Shopping Centers - 2.9% | | | |
| Acadia Realty Trust (SBI) | | 411 | 4,948 |
| Kimco Realty Corp. | | 1,362 | 15,186 |
| Regency Centers Corp. | | 495 | 20,310 |
| | | | 40,444 |
| REITs - Single Tenant - 1.2% | | | |
| Spirit Realty Capital, Inc. | | 489 | 16,851 |
| REITs - Storage - 5.5% | | | |
| CubeSmart | | 1,026 | 30,441 |
| Extra Space Storage, Inc. | | 369 | 38,132 |
| Iron Mountain, Inc. | | 281 | 7,921 |
| | | | 76,494 |
| REITs - Warehouse/Industrial - 15.0% | | | |
| Americold Realty Trust | | 583 | 23,524 |
| Prologis (REIT), Inc. | | 1,741 | 183,536 |
| | | | 207,060 |
|
| TOTAL EQUITY REAL ESTATE INVESTMENT TRUSTS (REITS) | | | 1,350,408 |
|
| Media - 0.2% | | | |
| Advertising - 0.2% | | | |
| Clear Channel Outdoor Holdings, Inc. (a) | | 2,701 | 2,475 |
| Real Estate Management & Development - 1.1% | | | |
| Real Estate Development - 1.1% | | | |
| Instone Real Estate Group BV (a)(b) | | 578 | 14,843 |
| TOTAL COMMON STOCKS | | | |
| (Cost $1,292,124) | | | 1,367,726 |
| TOTAL INVESTMENT IN SECURITIES - 99.1% | | | |
| (Cost $1,292,124) | | | 1,367,726 |
| NET OTHER ASSETS (LIABILITIES) - 0.9% | | | 12,231 |
| NET ASSETS - 100% | | | $1,379,957 |
Legend
(a) Non-income producing
(b) Security exempt from registration under Rule 144A of the Securities Act of 1933. These securities may be resold in transactions exempt from registration, normally to qualified institutional buyers. At the end of the period, the value of these securities amounted to $14,843 or 1.1% of net assets.
Affiliated Central Funds
Information regarding fiscal year to date income earned by the Fund from investments in Fidelity Central Funds is as follows:
| Fund | Income earned |
| Fidelity Cash Central Fund | $229 |
| Total | $229 |
Amounts in the income column in the above table include any capital gain distributions from underlying funds, which are presented in the corresponding line-item in the Statement of Operations, if applicable.
Investment Valuation
The following is a summary of the inputs used, as of July 31, 2020, involving the Fund's assets and liabilities carried at fair value. The inputs or methodology used for valuing securities may not be an indication of the risk associated with investing in those securities. For more information on valuation inputs, and their aggregation into the levels used below, please refer to the Investment Valuation section in the accompanying Notes to Financial Statements.
| | Valuation Inputs at Reporting Date: |
| Description | Total | Level 1 | Level 2 | Level 3 |
| Investments in Securities: | | | | |
| Common Stocks | $1,367,726 | $1,367,726 | $-- | $-- |
| Total Investments in Securities: | $1,367,726 | $1,367,726 | $-- | $-- |
See accompanying notes which are an integral part of the financial statements.
Financial Statements
Statement of Assets and Liabilities
| | | July 31, 2020 |
| Assets | | |
Investment in securities, at value — See accompanying schedule:
Unaffiliated issuers (cost $1,292,124) | | $1,367,726 |
| Receivable for investments sold | | 56,107 |
| Receivable for fund shares sold | | 1,331 |
| Dividends receivable | | 380 |
| Distributions receivable from Fidelity Central Funds | | 1 |
| Receivable from investment adviser for expense reductions | | 21 |
| Total assets | | 1,425,566 |
| Liabilities | | |
| Payable to custodian bank | $2,926 | |
| Payable for investments purchased | 42,662 | |
| Other payables and accrued expenses | 21 | |
| Total liabilities | | 45,609 |
| Net Assets | | $1,379,957 |
| Net Assets consist of: | | |
| Paid in capital | | $1,658,030 |
| Total accumulated earnings (loss) | | (278,073) |
| Net Assets | | $1,379,957 |
| Net Asset Value, offering price and redemption price per share ($1,379,957 ÷ 134,929 shares) | | $10.23 |
See accompanying notes which are an integral part of the financial statements.
Statement of Operations
| | | Year ended July 31, 2020 |
| Investment Income | | |
| Dividends | | $47,192 |
| Income from Fidelity Central Funds | | 229 |
| Total income | | 47,421 |
| Expenses | | |
| Independent trustees' fees and expenses | $10 | |
| Proxy | 21 | |
| Miscellaneous | 4 | |
| Total expenses before reductions | 35 | |
| Expense reductions | (21) | |
| Total expenses after reductions | | 14 |
| Net investment income (loss) | | 47,407 |
| Realized and Unrealized Gain (Loss) | | |
| Net realized gain (loss) on: | | |
| Investment securities: | | |
| Unaffiliated issuers | (342,673) | |
| Fidelity Central Funds | (2) | |
| Foreign currency transactions | (8) | |
| Total net realized gain (loss) | | (342,683) |
| Change in net unrealized appreciation (depreciation) on investment securities | | (55,633) |
| Net gain (loss) | | (398,316) |
| Net increase (decrease) in net assets resulting from operations | | $(350,909) |
See accompanying notes which are an integral part of the financial statements.
Statement of Changes in Net Assets
| | Year ended July 31, 2020 | Year ended July 31, 2019 |
| Increase (Decrease) in Net Assets | | |
| Operations | | |
| Net investment income (loss) | $47,407 | $27,158 |
| Net realized gain (loss) | (342,683) | 1,810 |
| Change in net unrealized appreciation (depreciation) | (55,633) | 76,047 |
| Net increase (decrease) in net assets resulting from operations | (350,909) | 105,015 |
| Distributions to shareholders | (44,980) | (24,159) |
| Share transactions | | |
| Proceeds from sales of shares | 1,075,884 | 918,998 |
| Reinvestment of distributions | 44,980 | 24,159 |
| Cost of shares redeemed | (830,052) | (251,584) |
| Net increase (decrease) in net assets resulting from share transactions | 290,812 | 691,573 |
| Total increase (decrease) in net assets | (105,077) | 772,429 |
| Net Assets | | |
| Beginning of period | 1,485,034 | 712,605 |
| End of period | $1,379,957 | $1,485,034 |
| Other Information | | |
| Shares | | |
| Sold | 95,566 | 83,983 |
| Issued in reinvestment of distributions | 3,977 | 2,284 |
| Redeemed | (95,420) | (24,138) |
| Net increase (decrease) | 4,123 | 62,129 |
See accompanying notes which are an integral part of the financial statements.
Financial Highlights
Fidelity Flex Real Estate Fund
| | | | | |
| Years ended July 31, | 2020 | 2019 | 2018 | 2017 A |
| Selected Per–Share Data | | | | |
| Net asset value, beginning of period | $11.35 | $10.38 | $10.35 | $10.00 |
| Income from Investment Operations | | | | |
| Net investment income (loss)B | .32 | .34 | .28 | .11 |
| Net realized and unrealized gain (loss) | (1.12) | .98 | .05 | .29 |
| Total from investment operations | (.80) | 1.32 | .33 | .40 |
| Distributions from net investment income | (.32) | (.32) | (.26) | (.05) |
| Distributions from net realized gain | – | (.02) | (.04) | – |
| Total distributions | (.32) | (.35)C | (.30) | (.05) |
| Net asset value, end of period | $10.23 | $11.35 | $10.38 | $10.35 |
| Total ReturnD,E | (7.33)% | 13.00% | 3.28% | 4.01% |
| Ratios to Average Net AssetsF,G | | | | |
| Expenses before reductions | - %H | - %H | .01% | - %H,I |
| Expenses net of fee waivers, if any | - %H | - %H | .01% | - %H,I |
| Expenses net of all reductions | - %H | - %H | .01% | - %H,I |
| Net investment income (loss) | 2.89% | 3.16% | 2.78% | 2.64%I |
| Supplemental Data | | | | |
| Net assets, end of period (000 omitted) | $1,380 | $1,485 | $713 | $265 |
| Portfolio turnover rateJ | 80% | 45% | 91% | 9%I,K |
A For the period March 8, 2017 (commencement of operations) to July 31, 2017.
B Calculated based on average shares outstanding during the period.
C Total distributions of $.35 per share is comprised of distributions from net investment income of $.324 and distributions from net realized gain of $.021 per share.
D Total returns for periods of less than one year are not annualized.
E Total returns would have been lower if certain expenses had not been reduced during the applicable periods shown.
F Fees and expenses of any underlying mutual funds or exchange-traded funds (ETFs) are not included in the Fund's expense ratio. The Fund indirectly bears its proportionate share of these expenses. For additional expense information related to investments in Fidelity Central Funds, please refer to the "Investments in Fidelity Central Funds" note found in the Notes to Financial Statements section of the most recent Annual or Semi-Annual report.
G Expense ratios reflect operating expenses of the Fund. Expenses before reductions do not reflect amounts reimbursed by the investment adviser or reductions from expense offset arrangements and do not represent the amount paid by the Fund during periods when reimbursements or reductions occur. Expenses net of fee waivers reflect expenses after reimbursement by the investment adviser but prior to reductions from expense offset arrangements. Expenses net of all reductions represent the net expenses paid by the Fund.
H Amount represents less than .005%.
I Annualized
J Amount does not include the portfolio activity of any underlying Fidelity Central Funds.
K Amount not annualized.
See accompanying notes which are an integral part of the financial statements.
Notes to Financial Statements
For the period ended July 31, 2020
1. Organization.
Fidelity Flex Real Estate Fund (the Fund) is a non-diversified fund of Fidelity Select Portfolios (the Trust) and is authorized to issue an unlimited number of shares. Share transactions on the Statement of Changes in Net Assets may contain exchanges between affiliated funds. The Trust is registered under the Investment Company Act of 1940, as amended (the 1940 Act), as an open-end management investment company organized as a Massachusetts business trust. The Fund is available only to certain fee-based accounts offered by Fidelity.
Effective January 1, 2020:
Investment advisers Fidelity Investments Money Management, Inc., FMR Co., Inc., and Fidelity SelectCo, LLC, merged with and into Fidelity Management & Research Company. In connection with the merger transactions, the resulting, merged investment adviser was then redomiciled from Massachusetts to Delaware, changed its corporate structure from a corporation to a limited liability company, and changed its name to "Fidelity Management & Research Company LLC".
2. Investments in Fidelity Central Funds.
The Fund invests in Fidelity Central Funds, which are open-end investment companies generally available only to other investment companies and accounts managed by the investment adviser and its affiliates. The Fund's Schedule of Investments lists each of the Fidelity Central Funds held as of period end, if any, as an investment of the Fund, but does not include the underlying holdings of each Fidelity Central Fund. As an Investing Fund, the Fund indirectly bears its proportionate share of the expenses of the underlying Fidelity Central Funds.
The Money Market Central Funds seek preservation of capital and current income and are managed by the investment adviser. Annualized expenses of the Money Market Central Funds as of their most recent shareholder report date ranged from less than .005% to .01%.
A complete unaudited list of holdings for each Fidelity Central Fund is available upon request or at the Securities and Exchange Commission (the SEC) website at www.sec.gov. In addition, the financial statements of the Fidelity Central Funds, which are not covered by the Fund's Report of Independent Registered Public Accounting Firm, are available on the SEC website or upon request.
3. Significant Accounting Policies.
The Fund is an investment company and applies the accounting and reporting guidance of the Financial Accounting Standards Board (FASB) Accounting Standards Codification Topic 946 Financial Services – Investment Companies. The financial statements have been prepared in conformity with accounting principles generally accepted in the United States of America (GAAP), which require management to make certain estimates and assumptions at the date of the financial statements. Actual results could differ from those estimates. Subsequent events, if any, through the date that the financial statements were issued have been evaluated in the preparation of the financial statements. The following summarizes the significant accounting policies of the Fund:
Investment Valuation. Investments are valued as of 4:00 p.m. Eastern time on the last calendar day of the period. The Board of Trustees (the Board) has delegated the day to day responsibility for the valuation of the Fund's investments to the Fair Value Committee (the Committee) established by the Fund's investment adviser. In accordance with valuation policies and procedures approved by the Board, the Fund attempts to obtain prices from one or more third party pricing vendors or brokers to value its investments. When current market prices, quotations or currency exchange rates are not readily available or reliable, investments will be fair valued in good faith by the Committee, in accordance with procedures adopted by the Board. Factors used in determining fair value vary by investment type and may include market or investment specific events. The frequency with which these procedures are used cannot be predicted and they may be utilized to a significant extent. The Committee oversees the Fund's valuation policies and procedures and reports to the Board on the Committee's activities and fair value determinations. The Board monitors the appropriateness of the procedures used in valuing the Fund's investments and ratifies the fair value determinations of the Committee.
The Fund categorizes the inputs to valuation techniques used to value its investments into a disclosure hierarchy consisting of three levels as shown below:
- Level 1 – quoted prices in active markets for identical investments
- Level 2 – other significant observable inputs (including quoted prices for similar investments, interest rates, prepayment speeds, etc.)
- Level 3 – unobservable inputs (including the Fund's own assumptions based on the best information available)
Valuation techniques used to value the Fund's investments by major category are as follows:
Equity securities, including restricted securities, for which market quotations are readily available, are valued at the last reported sale price or official closing price as reported by a third party pricing vendor on the primary market or exchange on which they are traded and are categorized as Level 1 in the hierarchy. In the event there were no sales during the day or closing prices are not available, securities are valued at the last quoted bid price or may be valued using the last available price and are generally categorized as Level 2 in the hierarchy. For foreign equity securities, when market or security specific events arise, comparisons to the valuation of American Depositary Receipts (ADRs), futures contracts, Exchange-Traded Funds (ETFs) and certain indexes as well as quoted prices for similar securities may be used and would be categorized as Level 2 in the hierarchy. For equity securities, including restricted securities, where observable inputs are limited, assumptions about market activity and risk are used and these securities may be categorized as Level 3 in the hierarchy.
Changes in valuation techniques may result in transfers in or out of an assigned level within the disclosure hierarchy. The aggregate value of investments by input level as of July 31, 2020 is included at the end of the Fund's Schedule of Investments.
Foreign Currency. The Fund may use foreign currency contracts to facilitate transactions in foreign-denominated securities. Gains and losses from these transactions may arise from changes in the value of the foreign currency or if the counterparties do not perform under the contracts' terms.
Foreign-denominated assets, including investment securities, and liabilities are translated into U.S. dollars at the exchange rates at period end. Purchases and sales of investment securities, income and dividends received and expenses denominated in foreign currencies are translated into U.S. dollars at the exchange rate in effect on the transaction date.
The effects of exchange rate fluctuations on investments are included with the net realized and unrealized gain (loss) on investment securities. Other foreign currency transactions resulting in realized and unrealized gain (loss) are disclosed separately.
Investment Transactions and Income. For financial reporting purposes, the Fund's investment holdings and NAV include trades executed through the end of the last business day of the period. The NAV per share for processing shareholder transactions is calculated as of the close of business of the New York Stock Exchange (NYSE), normally 4:00 p.m. Eastern time and includes trades executed through the end of the prior business day. Gains and losses on securities sold are determined on the basis of identified cost. Dividend income is recorded on the ex-dividend date. Income and capital gain distributions from Fidelity Central Funds, if any, are recorded on the ex-dividend date. Certain distributions received by the Fund represent a return of capital or capital gain. The Fund determines the components of these distributions subsequent to the ex-dividend date, based upon receipt of tax filings or other correspondence relating to the underlying investment. These distributions are recorded as a reduction of cost of investments and/or as a realized gain. Investment income is recorded net of foreign taxes withheld where recovery of such taxes is uncertain.
Expenses. Expenses directly attributable to a fund are charged to that fund. Expenses attributable to more than one fund are allocated among the respective funds on the basis of relative net assets or other appropriate methods. Expense estimates are accrued in the period to which they relate and adjustments are made when actual amounts are known.
Income Tax Information and Distributions to Shareholders. Each year, the Fund intends to qualify as a regulated investment company under Subchapter M of the Internal Revenue Code, including distributing substantially all of its taxable income and realized gains. As a result, no provision for U.S. Federal income taxes is required. As of July 31, 2020, the Fund did not have any unrecognized tax benefits in the financial statements; nor is the Fund aware of any tax positions for which it is reasonably possible that the total amounts of unrecognized tax benefits will significantly change in the next twelve months. The Fund files a U.S. federal tax return, in addition to state and local tax returns as required. The Fund's federal income tax returns are subject to examination by the Internal Revenue Service (IRS) for a period of three fiscal years after they are filed. State and local tax returns may be subject to examination for an additional fiscal year depending on the jurisdiction. Foreign taxes are provided for based on the Fund's understanding of the tax rules and rates that exist in the foreign markets in which it invests.
Distributions are declared and recorded on the ex-dividend date. Income and capital gain distributions are determined in accordance with income tax regulations, which may differ from GAAP.
Capital accounts within the financial statements are adjusted for permanent book-tax differences. These adjustments have no impact on net assets or the results of operations. Capital accounts are not adjusted for temporary book-tax differences which will reverse in a subsequent period.
Book-tax differences are primarily due to foreign currency transactions, capital loss carryforwards and losses deferred due to wash sales.
As of period end, the cost and unrealized appreciation (depreciation) in securities, and derivatives if applicable, for federal income tax purposes were as follows:
| Gross unrealized appreciation | $204,226 |
| Gross unrealized depreciation | (161,125) |
| Net unrealized appreciation (depreciation) | $43,101 |
| Tax Cost | $1,324,625 |
The tax-based components of distributable earnings as of period end were as follows:
| Undistributed ordinary income | $7,937 |
| Capital loss carryforward | $(329,112) |
| Net unrealized appreciation (depreciation) on securities and other investments | $43,101 |
Capital loss carryforwards are only available to offset future capital gains of the Fund to the extent provided by regulations and may be limited. The capital loss carryforward information presented below, including any applicable limitation, is estimated as of fiscal period end and is subject to adjustment.
| No expiration | |
| Short-term | $(289,645) |
| Long-term | (39,467) |
| Total capital loss carryforward | $(329,112) |
Due to large redemptions in the period, approximately $237,573 of the Fund's realized capital losses are subject to limitation. Due to this limitation, the Fund will only be permitted to use approximately $17,432 of those capital losses per year to offset capital gains. Additionally, the Fund is subject to an annual limit on its use of some of its unrealized capital losses to offset capital gains in future periods. If those capital losses are realized and the limitation prevents the Fund from using any of those capital losses in a future period, those capital losses will be available to offset capital gains in subsequent periods.
The tax character of distributions paid was as follows:
| | July 31, 2020 | July 31, 2019 |
| Ordinary Income | $44,980 | $ 23,328 |
| Long-term Capital Gains | – | 831 |
| Total | $44,980 | $ 24,159 |
Restricted Securities (including Private Placements). The Fund may invest in securities that are subject to legal or contractual restrictions on resale. These securities generally may be resold in transactions exempt from registration or to the public if the securities are registered. Disposal of these securities may involve time-consuming negotiations and expense, and prompt sale at an acceptable price may be difficult. Information regarding restricted securities is included at the end of the Fund's Schedule of Investments.
4. Purchases and Sales of Investments.
Purchases and sales of securities, other than short-term securities, are noted in the table below.
| | Purchases ($) | Sales ($) |
| Fidelity Flex Real Estate Fund | 1,571,850 | 1,271,902 |
5. Fees and Other Transactions with Affiliates.
Management Fee. Fidelity Management & Research Company LLC (the investment adviser) and its affiliates provide the Fund with investment management related services and the Fund does not pay any fees for these services. Under the management contract, the investment adviser or an affiliate pays all other expenses of the Fund, excluding fees and expenses of the independent Trustees, and certain miscellaneous expenses such as proxy and shareholder meeting expenses.
Brokerage Commissions. A portion of portfolio transactions were placed with brokerage firms which are affiliates of the investment adviser. Brokerage commissions are included in net realized gain (loss) and change in net unrealized appreciation (depreciation) in the Statement of Operations. The commissions paid to these affiliated firms were as follows:
| | Amount |
| Fidelity Flex Real Estate Fund | $54 |
Interfund Trades. Funds may purchase from or sell securities to other Fidelity Funds under procedures adopted by the Board. The procedures have been designed to ensure these interfund trades are executed in accordance with Rule 17a-7 of the 1940 Act. Interfund trades are included within the respective purchases and sales amounts shown in the Purchases and Sales of Investments note.
6. Committed Line of Credit.
Certain Funds participate with other funds managed by the investment adviser or an affiliate in a $4.25 billion credit facility (the "line of credit") to be utilized for temporary or emergency purposes to fund shareholder redemptions or for other short-term liquidity purposes. The participating funds have agreed to pay commitment fees on their pro-rata portion of the line of credit, which are reflected in Miscellaneous expenses on the Statement of Operations, and are as follows:
| | Amount |
| Fidelity Flex Real Estate Fund | $4 |
During the period, there were no borrowings on this line of credit.
7. Expense Reductions.
During the period, the investment advisor or an affiliate reimbursed and/or waived a portion of operating expenses in the amount of $21.
8. Other.
The Fund's organizational documents provide former and current trustees and officers with a limited indemnification against liabilities arising in connection with the performance of their duties to the Fund. In the normal course of business, the Fund may also enter into contracts that provide general indemnifications. The Fund's maximum exposure under these arrangements is unknown as this would be dependent on future claims that may be made against the Fund. The risk of material loss from such claims is considered remote.
At the end of the period, the investment advisor or its affiliates were the owners of record of 20% of the total outstanding shares of the Fund.
9. Coronavirus (COVID-19) Pandemic.
An outbreak of COVID-19 first detected in China during December 2019 has since spread globally and was declared a pandemic by the World Health Organization during March 2020. Developments that disrupt global economies and financial markets, such as the COVID-19 pandemic, may magnify factors that affect the Fund's performance.
Report of Independent Registered Public Accounting Firm
To the Board of Trustees of Fidelity Select Portfolios and Shareholders of Fidelity Flex Real Estate Fund:
Opinion on the Financial Statements and Financial Highlights
We have audited the accompanying statement of assets and liabilities of Fidelity Flex Real Estate Fund (the "Fund"), a fund of Fidelity Select Portfolios, including the schedule of investments, as of July 31, 2020, the related statement of operations for the year then ended, the statement of changes in net assets for each of the two years in the period then ended, the financial highlights for each of the three years in the period then ended and for the period from March 8, 2017 (commencement of operations) through July 31, 2017, and the related notes. In our opinion, the financial statements and financial highlights present fairly, in all material respects, the financial position of the Fund as of July 31, 2020, and the results of its operations for the year then ended, the changes in its net assets for each of the two years in the period then ended, and the financial highlights for each of the three years in the period then ended and for the period from March 8, 2017 (commencement of operations) through July 31, 2017 in conformity with accounting principles generally accepted in the United States of America.
Basis for Opinion
These financial statements and financial highlights are the responsibility of the Fund's management. Our responsibility is to express an opinion on the Fund's financial statements and financial highlights based on our audits. We are a public accounting firm registered with the Public Company Accounting Oversight Board (United States) (PCAOB) and are required to be independent with respect to the Fund in accordance with the U.S. federal securities laws and the applicable rules and regulations of the Securities and Exchange Commission and the PCAOB.
We conducted our audits in accordance with the standards of the PCAOB. Those standards require that we plan and perform the audit to obtain reasonable assurance about whether the financial statements and financial highlights are free of material misstatement, whether due to error or fraud. The Fund is not required to have, nor were we engaged to perform, an audit of its internal control over financial reporting. As part of our audits we are required to obtain an understanding of internal control over financial reporting but not for the purpose of expressing an opinion on the effectiveness of the Fund’s internal control over financial reporting. Accordingly, we express no such opinion.
Our audits included performing procedures to assess the risks of material misstatement of the financial statements and financial highlights, whether due to error or fraud, and performing procedures that respond to those risks. Such procedures included examining, on a test basis, evidence regarding the amounts and disclosures in the financial statements and financial highlights. Our audits also included evaluating the accounting principles used and significant estimates made by management, as well as evaluating the overall presentation of the financial statements and financial highlights. Our procedures included confirmation of securities owned as of July 31, 2020, by correspondence with the custodian and brokers; when replies were not received from brokers, we performed other auditing procedures. We believe that our audits provide a reasonable basis for our opinion.
/s/ Deloitte & Touche LLP
Boston, Massachusetts
September 10, 2020
We have served as the auditor of one or more of the Fidelity investment companies since 1999.
Trustees and Officers
The Trustees, Members of the Advisory Board (if any), and officers of the trust and fund, as applicable, are listed below. The Board of Trustees governs the fund and is responsible for protecting the interests of shareholders. The Trustees are experienced executives who meet periodically throughout the year to oversee the fund's activities, review contractual arrangements with companies that provide services to the fund, oversee management of the risks associated with such activities and contractual arrangements, and review the fund's performance. Except for Bettina Doulton, each of the Trustees oversees 311 funds. Ms. Doulton oversees 210 funds.
The Trustees hold office without limit in time except that (a) any Trustee may resign; (b) any Trustee may be removed by written instrument, signed by at least two-thirds of the number of Trustees prior to such removal; (c) any Trustee who requests to be retired or who has become incapacitated by illness or injury may be retired by written instrument signed by a majority of the other Trustees; and (d) any Trustee may be removed at any special meeting of shareholders by a two-thirds vote of the outstanding voting securities of the trust. Each Trustee who is not an interested person (as defined in the 1940 Act) of the trust and the fund is referred to herein as an Independent Trustee. Each Independent Trustee shall retire not later than the last day of the calendar year in which his or her 75th birthday occurs. The Independent Trustees may waive this mandatory retirement age policy with respect to individual Trustees. Officers and Advisory Board Members hold office without limit in time, except that any officer or Advisory Board Member may resign or may be removed by a vote of a majority of the Trustees at any regular meeting or any special meeting of the Trustees. Except as indicated, each individual has held the office shown or other offices in the same company for the past five years.
The fund’s Statement of Additional Information (SAI) includes more information about the Trustees. To request a free copy, call Fidelity at 1-800-544-3455 (for managed account clients) or 1-800-835-5092 (for retirement plan participants).
Experience, Skills, Attributes, and Qualifications of the Trustees. The Governance and Nominating Committee has adopted a statement of policy that describes the experience, qualifications, attributes, and skills that are necessary and desirable for potential Independent Trustee candidates (Statement of Policy). The Board believes that each Trustee satisfied at the time he or she was initially elected or appointed a Trustee, and continues to satisfy, the standards contemplated by the Statement of Policy. The Governance and Nominating Committee also engages professional search firms to help identify potential Independent Trustee candidates who have the experience, qualifications, attributes, and skills consistent with the Statement of Policy. From time to time, additional criteria based on the composition and skills of the current Independent Trustees, as well as experience or skills that may be appropriate in light of future changes to board composition, business conditions, and regulatory or other developments, have also been considered by the professional search firms and the Governance and Nominating Committee. In addition, the Board takes into account the Trustees' commitment and participation in Board and committee meetings, as well as their leadership of standing and ad hoc committees throughout their tenure.
In determining that a particular Trustee was and continues to be qualified to serve as a Trustee, the Board has considered a variety of criteria, none of which, in isolation, was controlling. The Board believes that, collectively, the Trustees have balanced and diverse experience, qualifications, attributes, and skills, which allow the Board to operate effectively in governing the fund and protecting the interests of shareholders. Information about the specific experience, skills, attributes, and qualifications of each Trustee, which in each case led to the Board's conclusion that the Trustee should serve (or continue to serve) as a trustee of the fund, is provided below.
Board Structure and Oversight Function. Robert A. Lawrence is an interested person and currently serves as Acting Chairman. The Trustees have determined that an interested Chairman is appropriate and benefits shareholders because an interested Chairman has a personal and professional stake in the quality and continuity of services provided to the fund. Independent Trustees exercise their informed business judgment to appoint an individual of their choosing to serve as Chairman, regardless of whether the Trustee happens to be independent or a member of management. The Independent Trustees have determined that they can act independently and effectively without having an Independent Trustee serve as Chairman and that a key structural component for assuring that they are in a position to do so is for the Independent Trustees to constitute a substantial majority for the Board. The Independent Trustees also regularly meet in executive session. Ned C. Lautenbach and David M. Thomas serve as Co-Lead Independent Trustees and as such each (i) acts as a liaison between the Independent Trustees and management with respect to matters important to the Independent Trustees and (ii) with management prepares agendas for Board meetings.
Fidelity® funds are overseen by different Boards of Trustees. The fund's Board oversees Fidelity's high income and certain equity funds, and other Boards oversee Fidelity's investment-grade bond, money market, asset allocation, and other equity funds. The asset allocation funds may invest in Fidelity® funds overseen by the fund's Board. The use of separate Boards, each with its own committee structure, allows the Trustees of each group of Fidelity® funds to focus on the unique issues of the funds they oversee, including common research, investment, and operational issues. On occasion, the separate Boards establish joint committees to address issues of overlapping consequences for the Fidelity® funds overseen by each Board.
The Trustees operate using a system of committees to facilitate the timely and efficient consideration of all matters of importance to the Trustees, the fund, and fund shareholders and to facilitate compliance with legal and regulatory requirements and oversight of the fund's activities and associated risks. The Board, acting through its committees, has charged FMR and its affiliates with (i) identifying events or circumstances the occurrence of which could have demonstrably adverse effects on the fund's business and/or reputation; (ii) implementing processes and controls to lessen the possibility that such events or circumstances occur or to mitigate the effects of such events or circumstances if they do occur; and (iii) creating and maintaining a system designed to evaluate continuously business and market conditions in order to facilitate the identification and implementation processes described in (i) and (ii) above. Because the day-to-day operations and activities of the fund are carried out by or through FMR, its affiliates, and other service providers, the fund's exposure to risks is mitigated but not eliminated by the processes overseen by the Trustees. While each of the Board's committees has responsibility for overseeing different aspects of the fund's activities, oversight is exercised primarily through the Operations, Audit, and Compliance Committees. Appropriate personnel, including but not limited to the fund's Chief Compliance Officer (CCO), FMR's internal auditor, the independent accountants, the fund's Treasurer and portfolio management personnel, make periodic reports to the Board's committees, as appropriate, including an annual review of Fidelity's risk management program for the Fidelity® funds. The responsibilities of each standing committee, including their oversight responsibilities, are described further under "Standing Committees of the Trustees."
Interested Trustees*:
Correspondence intended for a Trustee who is an interested person may be sent to Fidelity Investments, 245 Summer Street, Boston, Massachusetts 02210.
Name, Year of Birth; Principal Occupations and Other Relevant Experience+
Bettina Doulton (1964)
Year of Election or Appointment: 2020
Trustee
Ms. Doulton also serves as Trustee of other Fidelity® funds. Prior to her retirement, Ms. Doulton served in a variety of positions at Fidelity Investments, including as a managing director of research (2006-2007), portfolio manager to certain Fidelity® funds (1993-2005), equity analyst and portfolio assistant (1990-1993), and research assistant (1987-1990). Ms. Doulton currently owns and operates Phi Builders + Architects and Cellardoor Winery. Previously, Ms. Doulton served as a member of the Board of Brown Capital Management, LLC (2013-2018).
Robert A. Lawrence (1952)
Year of Election or Appointment: 2020
Trustee
Acting Chairman of the Board of Trustees
Mr. Lawrence also serves as Trustee of other funds. Previously, Mr. Lawrence served as a Member of the Advisory Board of certain funds. Prior to his retirement in 2008, Mr. Lawrence served as Vice President of certain Fidelity® funds (2006-2008), Senior Vice President, Head of High Income Division of Fidelity Management & Research Company (investment adviser firm, 2006-2008), and President of Fidelity Strategic Investments (investment adviser firm, 2002-2005).
* Determined to be an “Interested Trustee” by virtue of, among other things, his or her affiliation with the trust or various entities under common control with FMR.
+ The information includes the Trustee's principal occupation during the last five years and other information relating to the experience, attributes, and skills relevant to the Trustee's qualifications to serve as a Trustee, which led to the conclusion that the Trustee should serve as a Trustee for the fund.
Independent Trustees:
Correspondence intended for an Independent Trustee may be sent to Fidelity Investments, P.O. Box 55235, Boston, Massachusetts 02205-5235.
Name, Year of Birth; Principal Occupations and Other Relevant Experience+
Dennis J. Dirks (1948)
Year of Election or Appointment: 2018
Trustee
Mr. Dirks also serves as Trustee of other Fidelity® funds. Prior to his retirement in May 2003, Mr. Dirks served as Chief Operating Officer and as a member of the Board of The Depository Trust & Clearing Corporation (financial markets infrastructure), President, Chief Operating Officer and a member of the Board of The Depository Trust Company (DTC), President and a member of the Board of the National Securities Clearing Corporation (NSCC), Chief Executive Officer and a member of the Board of the Government Securities Clearing Corporation and Chief Executive Officer and a member of the Board of the Mortgage-Backed Securities Clearing Corporation. Mr. Dirks currently serves as a member of the Finance Committee (2016-present) and Board (2017-present) and is Treasurer (2018-present) of the Asolo Repertory Theatre.
Donald F. Donahue (1950)
Year of Election or Appointment: 2018
Trustee
Mr. Donahue also serves as Trustee of other Fidelity® funds. Mr. Donahue serves as President and Chief Executive Officer of Miranda Partners, LLC (risk consulting for the financial services industry, 2012-present). Previously, Mr. Donahue served as Chief Executive Officer (2006-2012), Chief Operating Officer (2003-2006) and Managing Director, Customer Marketing and Development (1999-2003) of The Depository Trust & Clearing Corporation (financial markets infrastructure). Mr. Donahue currently serves as a member (2007-present) and Co-Chairman (2016-present) of the Board of United Way of New York, a member of the Board of NYC Leadership Academy (2012-present) and a member of the Board of Advisors of Ripple Labs, Inc. (financial services, 2015-present). Mr. Donahue previously served as a member of the Advisory Board of certain Fidelity® funds (2015-2018).
Vicki L. Fuller (1957)
Year of Election or Appointment: 2020
Trustee
Ms. Fuller also serves as Trustee of other Fidelity® funds. Previously, Ms. Fuller served as a member of the Advisory Board of certain Fidelity® funds (2018-2020), Chief Investment Officer of the New York State Common Retirement Fund (2012-2018) and held a variety of positions at AllianceBernstein L.P. (global asset management, 1985-2012), including Managing Director (2006-2012) and Senior Vice President and Senior Portfolio Manager (2001-2006). Ms. Fuller currently serves as a member of the Board, Audit Committee and Nominating and Governance Committee of The Williams Companies, Inc. (natural gas infrastructure, 2018-present) and as a member of the Board of Treliant, LLC (consulting, 2019-present).
Patricia L. Kampling (1959)
Year of Election or Appointment: 2020
Trustee
Ms. Kampling also serves as Trustee of other Fidelity® funds. Prior to her retirement, Ms. Kampling served as Chairman of the Board and Chief Executive Officer (2012-2019), President and Chief Operating Officer (2011-2012) and Executive Vice President and Chief Financial Officer (2010-2011) of Alliant Energy Corporation. Ms. Kampling currently serves as a member of the Board, Compensation Committee and Executive Committee and as Chair of the Audit Committee of Briggs & Stratton Corporation (manufacturing, 2011-present) and as a member of the Board, Audit, Finance and Risk Committee and Safety, Environmental, Technology and Operations Committee of American Water Works Company, Inc. (utilities company, 2019-present). In addition, Ms. Kampling currently serves as a member of the Board of the Nature Conservancy, Wisconsin Chapter (2019-present). Previously, Ms. Kampling served as a Member of the Advisory Board of certain Fidelity® funds (2020), a member of the Board of Interstate Power and Light Company (2012-2019) and Wisconsin Power and Light Company (2012-2019) (each a subsidiary of Alliant Energy Corporation) and as a member of the Board and Workforce Development Committee of the Business Roundtable (2018-2019).
Alan J. Lacy (1953)
Year of Election or Appointment: 2018
Trustee
Mr. Lacy also serves as Trustee of other Fidelity® funds. Previously, Mr. Lacy served as Senior Adviser (2007-2014) of Oak Hill Capital Partners, L.P. (private equity), Chief Executive Officer (2005) and Vice Chairman (2005-2006) of Sears Holdings Corporation (retail), Chief Executive Officer and Chairman of the Board of Sears, Roebuck and Co. (retail, 2000-2005), Chairman (2014-2017) and a member of the Board (2010-2017) of Dave & Buster’s Entertainment, Inc. (restaurant and entertainment complexes) and a member of the Board of Bristol-Myers Squibb Company (global pharmaceuticals, 2008-2020). Mr. Lacy currently serves as a Trustee of the California Chapter of The Nature Conservancy (2015-present) and a member of the Board of the Center for Advanced Study in the Behavioral Sciences at Stanford University (2015-present).
Ned C. Lautenbach (1944)
Year of Election or Appointment: 2018
Trustee
Co-Lead Independent Trustee
Mr. Lautenbach also serves as Trustee of other Fidelity® funds. Mr. Lautenbach currently serves as Chair of the Board of Governors, State University System of Florida (2013-present) and is a member of the Council on Foreign Relations (1994-present). He is also a member and has in the past served as Chairman of the Board of Directors of Artis-Naples (2012-present). Previously, Mr. Lautenbach served as a member and then Lead Director of the Board of Directors of Eaton Corporation (diversified industrial, 1997-2016). He was also a Partner at Clayton, Dubilier & Rice, LLC (private equity investment, 1998-2010); as well as Director of Sony Corporation (2006-2007). In addition, Mr. Lautenbach had a 30-year career with IBM (technology company), during which time he served as Senior Vice President and as a member of the Corporate Executive Committee (1968-1998).
Joseph Mauriello (1944)
Year of Election or Appointment: 2018
Trustee
Mr. Mauriello also serves as Trustee of other Fidelity® funds. Prior to his retirement in January 2006, Mr. Mauriello served in numerous senior management positions including Deputy Chairman and Chief Operating Officer (2004-2005), and Vice Chairman of Financial Services (2002-2004) of KPMG LLP US (professional services, 1965-2005). Mr. Mauriello currently serves as a member of the Independent Directors Council Governing Council (2015-present). Previously, Mr. Mauriello served as a member of the Board of XL Group plc. (global insurance and re-insurance, 2006-2018).
Cornelia M. Small (1944)
Year of Election or Appointment: 2018
Trustee
Ms. Small also serves as Trustee of other Fidelity® funds. Previously, Ms. Small served as Chief Investment Officer, Director of Global Equity Investments and a member of Scudder, Stevens & Clark and Scudder Kemper Investments. Ms. Small previously served as a member of the Board (2009-2019) and Chair of the Investment Committee (2010-2019) of the Teagle Foundation and a member of the Investment Committee of the Berkshire Taconic Community Foundation (2008-2019).
Garnett A. Smith (1947)
Year of Election or Appointment: 2013
Trustee
Mr. Smith also serves as Trustee of other Fidelity® funds. Prior to his retirement, Mr. Smith served as Chairman and Chief Executive Officer (1990-1997) and President (1986-1990) of Inbrand Corp. (manufacturer of personal absorbent products). Prior to his employment with Inbrand Corp., he was employed by a retail fabric chain and North Carolina National Bank (now Bank of America). Mr. Smith previously served as a member of the Advisory Board of certain Fidelity® funds (2012-2013).
David M. Thomas (1949)
Year of Election or Appointment: 2018
Trustee
Co-Lead Independent Trustee
Mr. Thomas also serves as Trustee of other Fidelity® funds. Previously, Mr. Thomas served as Executive Chairman (2005-2006) and Chairman and Chief Executive Officer (2000-2005) of IMS Health, Inc. (pharmaceutical and healthcare information solutions). Mr. Thomas currently serves as Non-Executive Chairman of the Board of Fortune Brands Home and Security (home and security products, 2011-present), and a member of the Board (2004-present) and Presiding Director (2013-present) of Interpublic Group of Companies, Inc. (marketing communication).
Susan Tomasky (1953)
Year of Election or Appointment: 2020
Trustee
Ms. Tomasky also serves as Trustee of other Fidelity® funds. Prior to her retirement, Ms. Tomasky served in various executive officer positions at American Electric Power Company, Inc. (1998-2011), including most recently as President of AEP Transmission (2007-2011). Ms. Tomasky currently serves as a member of the Board and Sustainability Committee and as Chair of the Audit Committee of Marathon Petroleum Corporation (2018-present) and as a member of the Board, Corporate Governance Committee and Organization and Compensation Committee and as Chair of the Audit Committee of Public Service Enterprise Group, Inc. (utilities company, 2012-present). In addition, Ms. Tomasky currently serves as a member of the Board of the Columbus Regional Airport Authority (2007-present), as a member of the Board of the Royal Shakespeare Company – America (2009-present), as a member of the Board of the Columbus Association for the Performing Arts (2011-present) and as a member of the Board of Kenyon College (2016-present). Previously, Ms. Tomasky served as a Member of the Advisory Board of certain Fidelity® funds (2020), a member of the Board (2011-2019) and as Lead Independent Director (2015-2018) of Andeavor Corporation (previously Tesoro Corporation) (independent oil refiner and marketer) and as a member of the Board of Summit Midstream Partners LP (energy, 2012-2018).
Michael E. Wiley (1950)
Year of Election or Appointment: 2008
Trustee
Mr. Wiley also serves as Trustee of other Fidelity® funds. Previously, Mr. Wiley served as a member of the Advisory Board of certain Fidelity® funds (2018-2020), Chairman, President and CEO of Baker Hughes, Inc. (oilfield services, 2000-2004). Mr. Wiley also previously served as a member of the Board of Andeavor Corporation (independent oil refiner and marketer, 2005-2018), a member of the Board of Andeavor Logistics LP (natural resources logistics, 2015-2018) and a member of the Board of High Point Resources (exploration and production, 2005-2020).
+ The information includes the Trustee's principal occupation during the last five years and other information relating to the experience, attributes, and skills relevant to the Trustee's qualifications to serve as a Trustee, which led to the conclusion that the Trustee should serve as a Trustee for the fund.
Advisory Board Members and Officers:
Correspondence intended for a Member of the Advisory Board (if any) may be sent to Fidelity Investments, P.O. Box 55235, Boston, Massachusetts 02205-5235. Correspondence intended for an officer or Peter S. Lynch may be sent to Fidelity Investments, 245 Summer Street, Boston, Massachusetts 02210. Officers appear below in alphabetical order.
Name, Year of Birth; Principal Occupation
Peter S. Lynch (1944)
Year of Election or Appointment: 2018
Member of the Advisory Board
Mr. Lynch also serves as a Member of the Advisory Board of other Fidelity® funds. Mr. Lynch is Vice Chairman and a Director of Fidelity Management & Research Company LLC (investment adviser firm). In addition, Mr. Lynch serves as a Trustee of Boston College and as the Chairman of the Inner-City Scholarship Fund. Previously, Mr. Lynch served as Vice Chairman and a Director of FMR Co., Inc. (investment adviser firm) and on the Special Olympics International Board of Directors (1997-2006).
Elizabeth Paige Baumann (1968)
Year of Election or Appointment: 2017
Anti-Money Laundering (AML) Officer
Ms. Baumann also serves as AML Officer of other funds. She is Chief AML Officer (2012-present) and Senior Vice President (2014-present) of FMR LLC (diversified financial services company) and is an employee of Fidelity Investments. Previously, Ms. Baumann served as AML Officer of certain funds (2017-2019), as AML Officer of the funds (2012-2016), and Vice President (2007-2014) and Deputy Anti-Money Laundering Officer (2007-2012) of FMR LLC.
Craig S. Brown (1977)
Year of Election or Appointment: 2019
Assistant Treasurer
Mr. Brown also serves as Assistant Treasurer of other funds. Mr. Brown is an employee of Fidelity Investments (2013-present).
John J. Burke III (1964)
Year of Election or Appointment: 2018
Chief Financial Officer
Mr. Burke also serves as Chief Financial Officer of other funds. Mr. Burke serves as Head of Investment Operations for Fidelity Fund and Investment Operations (2018-present) and is an employee of Fidelity Investments (1998-present). Previously Mr. Burke served as head of Asset Management Investment Operations (2012-2018).
William C. Coffey (1969)
Year of Election or Appointment: 2019
Assistant Secretary
Mr. Coffey also serves as Assistant Secretary of other funds. He is Senior Vice President and Deputy General Counsel of FMR LLC (diversified financial services company, 2010-present), and is an employee of Fidelity Investments. Previously, Mr. Coffey served as Secretary and CLO of certain funds (2018-2019); CLO, Secretary, and Senior Vice President of Fidelity Management & Research Company and FMR Co., Inc. (investment adviser firms, 2018-2019); Secretary of Fidelity SelectCo, LLC and Fidelity Investments Money Management, Inc. (investment adviser firms, 2018-2019); CLO of Fidelity Management & Research (Hong Kong) Limited, FMR Investment Management (UK) Limited, and Fidelity Management & Research (Japan) Limited (investment adviser firms, 2018-2019); and Assistant Secretary of certain funds (2009-2018).
Timothy M. Cohen (1969)
Year of Election or Appointment: 2018
Vice President
Mr. Cohen also serves as Vice President of other funds. Mr. Cohen serves as Co-Head of Equity (2018-present), a Director of Fidelity Management & Research (Japan) Limited (investment adviser firm, 2016-present), and is an employee of Fidelity Investments. Previously, Mr. Cohen served as Executive Vice President of Fidelity SelectCo, LLC (2019), Head of Global Equity Research (2016-2018), Chief Investment Officer - Equity and a Director of Fidelity Management & Research (U.K.) Inc. (investment adviser firm, 2013-2015) and as a Director of Fidelity Management & Research (Hong Kong) Limited (investment adviser firm, 2017).
Jonathan Davis (1968)
Year of Election or Appointment: 2010
Assistant Treasurer
Mr. Davis also serves as Assistant Treasurer of other funds. Mr. Davis serves as Assistant Treasurer of FMR Capital, Inc. (2017-present) and is an employee of Fidelity Investments. Previously, Mr. Davis served as Vice President and Associate General Counsel of FMR LLC (diversified financial services company, 2003-2010).
Laura M. Del Prato (1964)
Year of Election or Appointment: 2018
Assistant Treasurer
Ms. Del Prato also serves as an officer of other funds. Ms. Del Prato is an employee of Fidelity Investments (2017-present). Previously, Ms. Del Prato served as President and Treasurer of The North Carolina Capital Management Trust: Cash Portfolio and Term Portfolio (2018-2020). Prior to joining Fidelity Investments, Ms. Del Prato served as a Managing Director and Treasurer of the JPMorgan Mutual Funds (2014-2017). Prior to JPMorgan, Ms. Del Prato served as a partner at Cohen Fund Audit Services (accounting firm, 2012-2013) and KPMG LLP (accounting firm, 2004-2012).
Colm A. Hogan (1973)
Year of Election or Appointment: 2020
Assistant Treasurer
Mr. Hogan also serves as an officer of other funds. Mr. Hogan serves as Assistant Treasurer of FMR Capital, Inc. (2017-present) and is an employee of Fidelity Investments (2005-present). Previously, Mr. Hogan served as Deputy Treasurer of certain Fidelity® funds (2016-2020) and Assistant Treasurer of certain Fidelity® funds (2016-2018).
Pamela R. Holding (1964)
Year of Election or Appointment: 2018
Vice President
Ms. Holding also serves as Vice President of other funds. Ms. Holding serves as Co-Head of Equity (2018-present) and is an employee of Fidelity Investments (2013-present). Previously, Ms. Holding served as Executive Vice President of Fidelity SelectCo, LLC (2019) and as Chief Investment Officer of Fidelity Institutional Asset Management (2013-2018).
Cynthia Lo Bessette (1969)
Year of Election or Appointment: 2019
Secretary and Chief Legal Officer (CLO)
Ms. Lo Bessette also serves as an officer of other funds. Ms. Lo Bessette serves as CLO, Secretary, and Senior Vice President of Fidelity Management & Research Company LLC (investment adviser firm, 2019-present); and CLO of Fidelity Management & Research (Hong Kong) Limited, FMR Investment Management (UK) Limited, and Fidelity Management & Research (Japan) Limited (investment adviser firms, 2019-present). She is a Senior Vice President and Deputy General Counsel of FMR LLC (diversified financial services company, 2019-present), and is an employee of Fidelity Investments. Previously, Ms. Lo Bessette served as CLO, Secretary, and Senior Vice President of FMR Co., Inc. (investment adviser firm, 2019); Secretary of Fidelity SelectCo, LLC and Fidelity Investments Money Management, Inc. (investment adviser firms, 2019). Prior to joining Fidelity Investments, Ms. Lo Bessette was Executive Vice President, General Counsel (2016-2019) and Senior Vice President, Deputy General Counsel (2015-2016) of OppenheimerFunds (investment management company) and Deputy Chief Legal Officer (2013-2015) of Jennison Associates LLC (investment adviser firm).
Chris Maher (1972)
Year of Election or Appointment: 2020
Deputy Treasurer
Mr. Maher also serves as an officer of other funds. Mr. Maher serves as Assistant Treasurer of FMR Capital, Inc. (2017-present), and is an employee of Fidelity Investments (2008-present). Previously, Mr. Maher served as Assistant Treasurer of certain funds (2013-2020); Vice President of Asset Management Compliance (2013), Vice President of the Program Management Group of FMR (investment adviser firm, 2010-2013), and Vice President of Valuation Oversight (2008-2010).
Jason P. Pogorelec (1975)
Year of Election or Appointment: 2020
Chief Compliance Officer
Mr. Pogorelec also serves as Chief Compliance Officer of other funds. Mr. Pogorelec is a senior Vice President of Asset Management Compliance for Fidelity Investments and is an employee of Fidelity Investments (2006-present). Previously, Mr. Pogorelec served as Vice President, Associate General Counsel for Fidelity Investments (2010-2020) and Assistant Secretary of certain Fidelity funds (2015-2020).
Stacie M. Smith (1974)
Year of Election or Appointment: 2018
President and Treasurer
Ms. Smith also serves as an officer of other funds. Ms. Smith serves as Assistant Treasurer of FMR Capital, Inc. (2017-present), is an employee of Fidelity Investments (2009-present), and has served in other fund officer roles. Prior to joining Fidelity Investments, Ms. Smith served as Senior Audit Manager of Ernst & Young LLP (accounting firm, 1996-2009). Previously, Ms. Smith served as Assistant Treasurer (2013-2019) and Deputy Treasurer (2013-2016) of certain Fidelity® funds.
Marc L. Spector (1972)
Year of Election or Appointment: 2017
Assistant Treasurer
Mr. Spector also serves as an officer of other funds. Mr. Spector serves as Assistant Treasurer of FMR Capital, Inc. (2017-present) and is an employee of Fidelity Investments (2016-present). Prior to joining Fidelity Investments, Mr. Spector served as Director at the Siegfried Group (accounting firm, 2013-2016), and prior to Siegfried Group as audit senior manager at Deloitte & Touche LLP (accounting firm, 2005-2013).
Jim Wegmann (1979)
Year of Election or Appointment: 2019
Assistant Treasurer
Mr. Wegmann also serves as Assistant Treasurer of other funds. Mr. Wegmann is an employee of Fidelity Investments (2011-present).
Shareholder Expense Example
As a shareholder, you incur two types of costs: (1) transaction costs, which may include sales charges (loads) on purchase payments or redemption proceeds, as applicable and (2) ongoing costs, which generally include management fees, distribution and/or service (12b-1) fees and other Fund expenses. This Example is intended to help you understand your ongoing costs (in dollars) of investing in a fund and to compare these costs with the ongoing costs of investing in other mutual funds.
The Example is based on an investment of $1,000 invested at the beginning of the period and held for the entire period (February 1, 2020 to July 31, 2020).
Actual Expenses
The first line of the accompanying table provides information about actual account values and actual expenses. You may use the information in this line, together with the amount you invested, to estimate the expenses that you paid over the period. Simply divide your account value by $1,000.00 (for example, an $8,600 account value divided by $1,000.00 = 8.6), then multiply the result by the number in the first line for a class/Fund under the heading entitled "Expenses Paid During Period" to estimate the expenses you paid on your account during this period. If any fund is a shareholder of any underlying mutual funds or exchange-traded funds (ETFs) (the Underlying Funds), such fund indirectly bears its proportional share of the expenses of the Underlying Funds in addition to the direct expenses incurred presented in the table. These fees and expenses are not included in the annualized expense ratio used to calculate the expense estimate in the table below.
Hypothetical Example for Comparison Purposes
The second line of the accompanying table provides information about hypothetical account values and hypothetical expenses based on the actual expense ratio and an assumed rate of return of 5% per year before expenses, which is not the actual return. The hypothetical account values and expenses may not be used to estimate the actual ending account balance or expenses you paid for the period. You may use this information to compare the ongoing costs of investing in the Fund and other funds. To do so, compare this 5% hypothetical example with the 5% hypothetical examples that appear in the shareholder reports of the other funds. If any fund is a shareholder of any Underlying Funds, such fund indirectly bears its proportional share of the expenses of the Underlying Funds in addition to the direct expenses as presented in the table. These fees and expenses are not included in the annualized expense ratio used to calculate the expense estimate in the table below.
Please note that the expenses shown in the table are meant to highlight your ongoing costs only and do not reflect any transaction costs. Therefore, the second line of the table is useful in comparing ongoing costs only, and will not help you determine the relative total costs of owning different funds.
| | Annualized Expense Ratio-A | Beginning
Account Value
February 1, 2020 | Ending
Account Value
July 31, 2020 | Expenses Paid
During Period-B
February 1, 2020
to July 31, 2020 |
| Fidelity Flex Real Estate Fund | - %-C | | | |
| Actual | | $1,000.00 | $868.00 | $--D |
| Hypothetical-E | | $1,000.00 | $1,024.86 | $--D |
A Annualized expense ratio reflects expenses net of applicable fee waivers.
B Expenses are equal to the annualized expense ratio, multiplied by the average account value over the period, multiplied by 182/ 366 (to reflect the one-half year period). The fees and expenses of any Underlying Funds are not included in each annualized expense ratio.
C Amount represents less than .005%.
D Amount represents less than $.005.
E 5% return per year before expenses
Distributions (Unaudited)
A total of 0.11% of the dividends distributed during the fiscal year was derived from interest on U.S. Government securities which is generally exempt from state income tax.
The fund designates 1% of the dividends distributed during the fiscal year as amounts which may be taken into account as a dividend for the purposes of the maximum rate under section 1(h)(11) of the Internal Revenue Code.
The fund designates 100% and 97% of the dividends distributed in September and December, respectively during the fiscal year as a section 199A dividend.
The fund will notify shareholders in January 2021 of amounts for use in preparing 2020 income tax returns.
Liquidity Risk Management Program
The Securities and Exchange Commission adopted Rule 22e-4 under the Investment Company Act of 1940 (the Liquidity Rule) to promote effective liquidity risk management throughout the open-end investment company industry, thereby reducing the risk that funds will be unable to meet their redemption obligations and mitigating dilution of the interests of fund shareholders.
The Fund has adopted and implemented a liquidity risk management program pursuant to the Liquidity Rule (the Program) effective December 1, 2018. The Program is reasonably designed to assess and manage the Fund’s liquidity risk and to comply with the requirements of the Liquidity Rule. The Fund’s Board of Trustees (the Board) has designated the Fund’s investment adviser as administrator of the Program. The Fidelity advisers have established a Liquidity Risk Management Committee (the LRM Committee) to manage the Program for each of the Fidelity Funds. The LRM Committee monitors the adequacy and effectiveness of implementation of the Program and on a periodic basis assesses each Fund’s liquidity risk based on a variety of factors including (1) the Fund’s investment strategy, (2) portfolio liquidity and cash flow projections during normal and reasonably foreseeable stressed conditions, (3) shareholder redemptions, (4) borrowings and other funding sources and (5) in the case of exchange-traded funds, certain additional factors including the effect of the Fund’s prices and spreads, market participants, and basket compositions on the overall liquidity of the Fund’s portfolio, as applicable.
In accordance with the Program, each of the Fund’s portfolio investments is classified into one of four liquidity categories described below based on a determination of a reasonable expectation for how long it would take to convert the investment to cash (or sell or dispose of the investment) without significantly changing its market value.
- Highly liquid investments – cash or convertible to cash within three business days or less
- Moderately liquid investments – convertible to cash in three to seven calendar days
- Less liquid investments – can be sold or disposed of, but not settled, within seven calendar days
- Illiquid investments – cannot be sold or disposed of within seven calendar days
Liquidity classification determinations take into account a variety of factors including various market, trading and investment-specific considerations, as well as market depth, and generally utilize analysis from a third-party liquidity metrics service.
The Liquidity Rule places a 15% limit on a fund’s illiquid investments and requires funds that do not primarily hold assets that are highly liquid investments to determine and maintain a minimum percentage of the fund’s net assets to be invested in highly liquid investments (highly liquid investment minimum or HLIM). The Program includes provisions reasonably designed to comply with the 15% limit on illiquid investments and for determining, periodically reviewing and complying with the HLIM requirement as applicable.
At a recent meeting of the Fund’s Board of Trustees, the LRM Committee provided a written report to the Board pertaining to the operation, adequacy, and effectiveness of implementation of the Program for the annual period from December 1, 2018 through November 30, 2019. The report concluded that the Program has been implemented and is operating effectively and is reasonably designed to assess and manage the Fund’s liquidity risk.
Proxy Voting Results
A special meeting of shareholders was held on June 9, 2020. The results of votes taken among shareholders on the proposal before them are reported below. Each vote reported represents one dollar of net asset value held on the record date for the meeting.
PROPOSAL 1
To elect a Board of Trustees.
| | # of
Votes | % of
Votes |
| Dennis J. Dirks |
| Affirmative | 32,463,705,305.665 | 92.437 |
| Withheld | 2,655,951,104.308 | 7.563 |
| TOTAL | 35,119,656,409.973 | 100.000 |
| Donald F. Donahue |
| Affirmative | 32,446,843,861.354 | 92.389 |
| Withheld | 2,672,812,548.619 | 7.611 |
| TOTAL | 35,119,656,409.973 | 100.000 |
| Bettina Doulton |
| Affirmative | 32,610,463,757.584 | 92.855 |
| Withheld | 2,509,192,652.389 | 7.145 |
| TOTAL | 35,119,656,409.973 | 100.000 |
| Vicki L. Fuller |
| Affirmative | 32,688,213,522.720 | 93.077 |
| Withheld | 2,431,442,887.253 | 6.923 |
| TOTAL | 35,119,656,409.973 | 100.000 |
| Patricia L. Kampling |
| Affirmative | 32,313,755,598.535 | 92.010 |
| Withheld | 2,805,900,811.438 | 7.990 |
| TOTAL | 35,119,656,409.973 | 100.000 |
| Alan J. Lacy |
| Affirmative | 31,990,158,754.948 | 91.089 |
| Withheld | 3,129,497,655.026 | 8.911 |
| TOTAL | 35,119,656,409.973 | 100.000 |
| Ned C. Lautenbach |
| Affirmative | 32,043,019,991.143 | 91.240 |
| Withheld | 3,076,636,418.830 | 8.760 |
| TOTAL | 35,119,656,409.973 | 100.000 |
| Robert A. Lawrence |
| Affirmative | 32,150,842,398.009 | 91.547 |
| Withheld | 2,968,814,011.965 | 8.453 |
| TOTAL | 35,119,656,409.973 | 100.000 |
| Joseph Mauriello |
| Affirmative | 32,082,201,213.166 | 91.351 |
| Withheld | 3,037,455,196.807 | 8.649 |
| TOTAL | 35,119,656,409.973 | 100.000 |
| Cornelia M. Small |
| Affirmative | 32,207,976,835.934 | 91.709 |
| Withheld | 2,911,679,574.039 | 8.291 |
| TOTAL | 35,119,656,409.973 | 100.000 |
| Garnett A. Smith |
| Affirmative | 32,102,654,343.096 | 91.409 |
| Withheld | 3,017,002,066.877 | 8.591 |
| TOTAL | 35,119,656,409.973 | 100.000 |
| David M. Thomas |
| Affirmative | 32,150,749,424.556 | 91.546 |
| Withheld | 2,968,906,985.418 | 8.454 |
| TOTAL | 35,119,656,409.973 | 100.000 |
| Susan Tomasky |
| Affirmative | 32,381,933,484.515 | 92.205 |
| Withheld | 2,737,722,925.459 | 7.795 |
| TOTAL | 35,119,656,409.973 | 100.000 |
| Michael E. Wiley |
| Affirmative | 32,135,064,741.973 | 91.502 |
| Withheld | 2,984,591,668.000 | 8.498 |
| TOTAL | 35,119,656,409.973 | 100.000 |
|
| Proposal 1 reflects trust wide proposal and voting results. |

ZXL-ANN-0920
1.9881647.103
Fidelity® International Real Estate Fund
Annual Report
July 31, 2020
Includes Fidelity and Fidelity Advisor share classes
See the inside front cover for important information about access to your fund’s shareholder reports.
Beginning on January 1, 2021, as permitted by regulations adopted by the Securities and Exchange Commission, paper copies of a fund’s shareholder reports will no longer be sent by mail, unless you specifically request paper copies of the reports from the fund or from your financial intermediary, such as a financial advisor, broker-dealer or bank. Instead, the reports will be made available on a website, and you will be notified by mail each time a report is posted and provided with a website link to access the report.
If you already elected to receive shareholder reports electronically, you will not be affected by this change and you need not take any action. You may elect to receive shareholder reports and other communications from a fund electronically, by contacting your financial intermediary. For Fidelity customers, visit Fidelity's web site or call Fidelity using the contact information listed below.
You may elect to receive all future reports in paper free of charge. If you wish to continue receiving paper copies of your shareholder reports, you may contact your financial intermediary or, if you are a Fidelity customer, visit Fidelity’s website, or call Fidelity at the applicable toll-free number listed below. Your election to receive reports in paper will apply to all funds held with the fund complex/your financial intermediary.
| Account Type | Website | Phone Number |
| Brokerage, Mutual Fund, or Annuity Contracts: | fidelity.com/mailpreferences | 1-800-343-3548 |
| Employer Provided Retirement Accounts: | netbenefits.fidelity.com/preferences (choose 'no' under Required Disclosures to continue to print) | 1-800-343-0860 |
| Advisor Sold Accounts Serviced Through Your Financial Intermediary: | Contact Your Financial Intermediary | Your Financial Intermediary's phone number |
| Advisor Sold Accounts Serviced by Fidelity: | institutional.fidelity.com | 1-877-208-0098 |
Contents
To view a fund's proxy voting guidelines and proxy voting record for the 12-month period ended June 30, visit http://www.fidelity.com/proxyvotingresults or visit the Securities and Exchange Commission's (SEC) web site at http://www.sec.gov.
You may also call 1-800-544-8544 if you’re an individual investing directly with Fidelity, call 1-800-835-5092 if you’re a plan sponsor or participant with Fidelity as your recordkeeper or call 1-877-208-0098 on institutional accounts or if you’re an advisor or invest through one to request a free copy of the proxy voting guidelines.
Standard & Poor's, S&P and S&P 500 are registered service marks of The McGraw-Hill Companies, Inc. and have been licensed for use by Fidelity Distributors Corporation.
Other third-party marks appearing herein are the property of their respective owners.
All other marks appearing herein are registered or unregistered trademarks or service marks of FMR LLC or an affiliated company. © 2020 FMR LLC. All rights reserved.
This report and the financial statements contained herein are submitted for the general information of the shareholders of the Fund. This report is not authorized for distribution to prospective investors in the Fund unless preceded or accompanied by an effective prospectus.
A fund files its complete schedule of portfolio holdings with the SEC for the first and third quarters of each fiscal year on Form N-PORT. Forms N-PORT are available on the SEC’s web site at http://www.sec.gov. A fund's Forms N-PORT may be reviewed and copied at the SEC’s Public Reference Room in Washington, DC. Information regarding the operation of the SEC's Public Reference Room may be obtained by calling 1-800-SEC-0330.
For a complete list of a fund's portfolio holdings, view the most recent holdings listing, semiannual report, or annual report on Fidelity's web site at http://www.fidelity.com, http://www.institutional.fidelity.com, or http://www.401k.com, as applicable.
NOT FDIC INSURED •MAY LOSE VALUE •NO BANK GUARANTEE
Neither the Fund nor Fidelity Distributors Corporation is a bank.
Note to Shareholders:
Early in 2020, the outbreak and spread of a new coronavirus emerged as a public health emergency that had a major influence on financial markets, primarily based on its impact on the global economy and the outlook for corporate earnings. The virus causes a respiratory disease known as COVID-19. On March 11, the World Health Organization declared the COVID-19 outbreak a pandemic, citing sustained risk of further global spread.
In the weeks following, as the crisis worsened, we witnessed an escalating human tragedy with wide-scale social and economic consequences from coronavirus-containment measures. The outbreak of COVID-19 prompted a number of measures to limit the spread, including travel and border restrictions, quarantines, and restrictions on large gatherings. In turn, these resulted in lower consumer activity, diminished demand for a wide range of products and services, disruption in manufacturing and supply chains, and – given the wide variability in outcomes regarding the outbreak – significant market uncertainty and volatility. Amid the turmoil, the U.S. government took unprecedented action – in concert with the U.S. Federal Reserve and central banks around the world – to help support consumers, businesses, and the broader economy, and to limit disruption to the financial system.
The situation continues to unfold, and the extent and duration of its impact on financial markets and the economy remain highly uncertain. Extreme events such as the coronavirus crisis are “exogenous shocks” that can have significant adverse effects on mutual funds and their investments. Although multiple asset classes may be affected by market disruption, the duration and impact may not be the same for all types of assets.
Fidelity is committed to helping you stay informed amid news about COVID-19 and during increased market volatility, and we’re taking extra steps to be responsive to customer needs. We encourage you to visit our websites, where we offer ongoing updates, commentary, and analysis on the markets and our funds.
Performance: The Bottom Line
Average annual total return reflects the change in the value of an investment, assuming reinvestment of distributions from dividend income and capital gains (the profits earned upon the sale of securities that have grown in value, if any) and assuming a constant rate of performance each year. The hypothetical investment and the average annual total returns do not reflect the deduction of taxes that a shareholder would pay on fund distributions or the redemption of fund shares. During periods of reimbursement by Fidelity, a fund’s total return will be greater than it would be had the reimbursement not occurred. How a fund did yesterday is no guarantee of how it will do tomorrow.
Average Annual Total Returns
| For the periods ended July 31, 2020 | Past 1 year | Past 5 years | Past 10 years |
| Class A (incl. 5.75% sales charge) | (4.14)% | 4.24% | 7.13% |
| Class M (incl. 3.50% sales charge) | (2.14)% | 4.40% | 7.07% |
| Class C (incl. contingent deferred sales charge) | (0.11)% | 4.70% | 6.97% |
| Fidelity® International Real Estate Fund | 1.98% | 5.75% | 8.04% |
| Class I | 2.09% | 5.87% | 8.12% |
| Class Z | 2.12% | 5.91% | 8.14% |
Class C shares' contingent deferred sales charges included in the past one year, past five years and past ten years total return figures are 1%, 0% and 0%, respectively.
The initial offering of Class Z shares took place on October 2, 2018. Returns prior to October 2, 2018 are those of Class I.
$10,000 Over 10 Years
Let's say hypothetically that $10,000 was invested in Fidelity® International Real Estate Fund, a class of the fund, on July 31, 2010.
The chart shows how the value of your investment would have changed, and also shows how the MSCI EAFE Index performed over the same period.
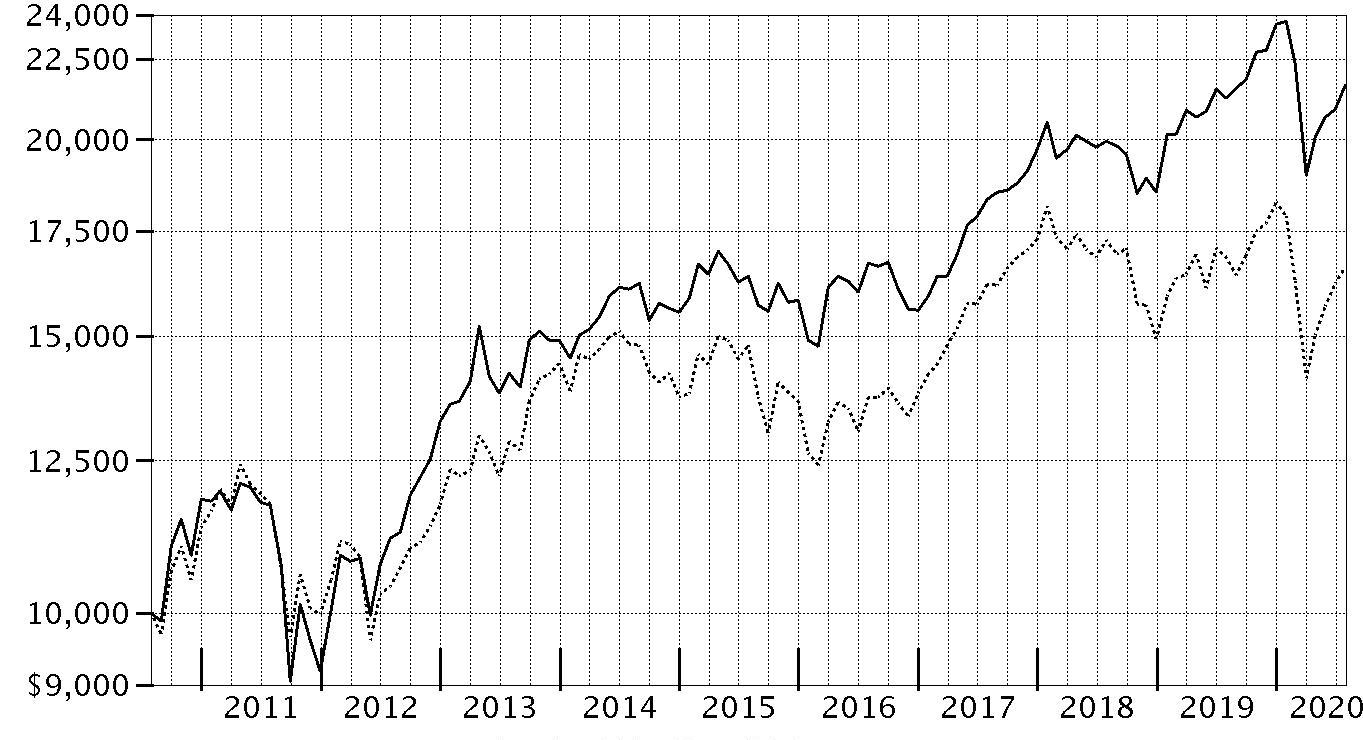
| Period Ending Values |
| $21,661 | Fidelity® International Real Estate Fund |
| $16,588 | MSCI EAFE Index |
Management's Discussion of Fund Performance
Market Recap: For the 12 months ending July 31, 2020, global real estate stocks returned -13.40%, according to the FTSE
® EPRA℠ /NAREIT
® Developed Index. For roughly the first half of the reporting period, global real estate securities steadily gained. Beginning in late February, however, conditions became tumultuous, as the COVID-19 pandemic forced economic shutdowns around the world. This situation led to questions about whether certain segments of the real estate market –retail, hotels and offices in particular – would experience long-term challenges stemming from concern about social gathering. Meanwhile, other property types whose business models remained largely intact despite the pandemic – such as industrial, data center and mobile communication tower real estate investment trusts (REITs) – stood to benefit from similar worries. In this environment, real estate securities fell sharply between late February and mid-March. As economies reopened, however, and global central banks pursued aggressive economic stimulus efforts, the real estate market bounced back sharply, and the index regained a portion of its value through the end of July. Despite some groups experiencing serious fundamental challenges – highlighted by brick-and-mortar retail, whose existing difficulties, which included mounting competition from e-commerce, only accelerated along with the pandemic – the fundamental backdrop for global real estate was often favorable. Access to debt and equity capital remained often positive, while supply was constrained in certain segments and markets.
Comments from Portfolio Manager Guillermo de las Casas: For the fiscal year ending July 31, 2020, the fund's shares classes (excluding sales charges, if applicable) gained roughly between 1% and 2%, significantly outpacing the -12.25% result of the FTSE
® EPRA℠/NAREIT
® Developed Ex North America Index. Versus the FTSE EPRA/NAREIT index, positive security selection and market allocations drove the fund’s outperformance. By country, investment choices and underweight positions among poor-performing real estate stocks in France, Japan and Australia were a significant positive for the fund’s performance this period. The portfolio’s top individual contributors included an out-of-index stake in Argan, a French warehouse owner specializing in logistics real estate. Not owning France-based mall firm and index component Unibail-Rodamco-Westfield, which underperformed amid coronavirus concerns and the closure of non-essential businesses, also helped. A non-benchmark stake in Parkway Life REIT was another plus as health care REITs, such as this Singapore-based firm, outperformed on contract renegotiations from its hospital operator. The fund’s cash position of 5%, on average, this period also contributed notably in a declining market. Turning to detractors, it hurt to not own several index components including Deutsche Wohnen, a German property company, and U.K. property and development firm Segro.
The views expressed above reflect those of the portfolio manager(s) only through the end of the period as stated on the cover of this report and do not necessarily represent the views of Fidelity or any other person in the Fidelity organization. Any such views are subject to change at any time based upon market or other conditions and Fidelity disclaims any responsibility to update such views. These views may not be relied on as investment advice and, because investment decisions for a Fidelity fund are based on numerous factors, may not be relied on as an indication of trading intent on behalf of any Fidelity fund.
Investment Summary (Unaudited)
Top Ten Stocks as of July 31, 2020
| | % of fund's net assets |
| Vonovia SE | 7.1 |
| Mitsubishi Estate Co. Ltd. | 5.4 |
| Advance Residence Investment Corp. | 3.4 |
| LaSalle Logiport REIT | 3.3 |
| LEG Immobilien AG | 3.2 |
| Daiwa Securities Living Invest | 3.1 |
| Cheung Kong Property Holdings Ltd. | 3.0 |
| ARGAN SA | 2.9 |
| Irish Residential Properties REIT PLC | 2.6 |
| PSP Swiss Property AG | 2.5 |
| | 36.5 |
Top Five Countries as of July 31, 2020
| (excluding cash equivalents) | % of fund's net assets |
| Japan | 23.3 |
| Germany | 10.6 |
| United Kingdom | 10.3 |
| Singapore | 7.9 |
| Australia | 6.3 |
Top Five REIT Sectors as of July 31, 2020
| | % of fund's net assets |
| REITs - Diversified | 16.2 |
| REITs - Apartments | 8.5 |
| REITs - Warehouse/Industrial | 4.8 |
| REITs - Health Care | 4.1 |
| REITs - Industrial Buildings | 2.5 |
Asset Allocation (% of fund's net assets)
| As of July 31, 2020 * |
| | Stocks | 95.3% |
| | Short-Term Investments and Net Other Assets (Liabilities) | 4.7% |

* Foreign investments - 93.6%
Schedule of Investments July 31, 2020
Showing Percentage of Net Assets
| Common Stocks - 95.3% | | | |
| | | Shares | Value |
| Australia - 6.3% | | | |
| 360 Capital Group Ltd. unit | | 3,856,668 | $2,369,641 |
| Arena (REIT) unit | | 3,893,858 | 6,259,425 |
| Charter Hall Group unit | | 566,216 | 4,255,687 |
| DEXUS Property Group unit | | 1,150,938 | 6,997,668 |
| Ingenia Communities Group unit | | 1,897,156 | 6,438,260 |
| National Storage (REIT) unit | | 4,081,203 | 5,248,468 |
|
| TOTAL AUSTRALIA | | | 31,569,149 |
|
| Bailiwick of Guernsey - 0.9% | | | |
| Sirius Real Estate Ltd. | | 4,492,185 | 4,321,999 |
| Belgium - 3.2% | | | |
| Home Invest Belgium SA | | 31,753 | 4,245,291 |
| Montea SICAFI SCA | | 37,200 | 4,140,965 |
| VGP NV | | 18,956 | 2,621,450 |
| Warehouses de Pauw | | 152,376 | 4,873,189 |
|
| TOTAL BELGIUM | | | 15,880,895 |
|
| Bermuda - 3.2% | | | |
| Great Eagle Holdings Ltd. | | 3,089,164 | 6,991,205 |
| Tai Cheung Holdings Ltd. | | 9,456,000 | 5,978,401 |
| Wing Tai Properties Ltd. | | 5,812,000 | 2,887,140 |
|
| TOTAL BERMUDA | | | 15,856,746 |
|
| Cayman Islands - 3.0% | | | |
| Cheung Kong Property Holdings Ltd. | | 2,680,500 | 14,889,169 |
| France - 4.0% | | | |
| ARGAN SA (a) | | 143,290 | 14,414,534 |
| Covivio | | 80,372 | 5,803,528 |
|
| TOTAL FRANCE | | | 20,218,062 |
|
| Germany - 10.6% | | | |
| LEG Immobilien AG | | 113,078 | 15,752,259 |
| Scout24 AG (b) | | 15,900 | 1,375,675 |
| Vonovia SE | | 549,626 | 35,725,296 |
|
| TOTAL GERMANY | | | 52,853,230 |
|
| Hong Kong - 1.7% | | | |
| Hysan Development Co. Ltd. | | 902,000 | 2,490,587 |
| Magnificent Hotel Investment Ltd. | | 158,863,000 | 2,111,259 |
| Sino Land Ltd. | | 3,069,561 | 3,718,976 |
|
| TOTAL HONG KONG | | | 8,320,822 |
|
| Ireland - 3.4% | | | |
| Dalata Hotel Group PLC | | 542,600 | 1,665,001 |
| Irish Residential Properties REIT PLC | | 7,631,400 | 13,034,641 |
| Yew Grove REIT PLC | | 2,274,900 | 2,197,369 |
|
| TOTAL IRELAND | | | 16,897,011 |
|
| Italy - 0.8% | | | |
| COIMA RES SpA (b) | | 347,187 | 2,511,069 |
| Infrastrutture Wireless Italiane SpA (b) | | 165,000 | 1,664,708 |
|
| TOTAL ITALY | | | 4,175,777 |
|
| Japan - 23.3% | | | |
| Advance Residence Investment Corp. | | 5,204 | 16,764,102 |
| Daiwa Securities Living Invest | | 15,414 | 15,580,728 |
| Goldcrest Co. Ltd. | | 161,000 | 1,986,359 |
| Health Care & Medical Investment Corp. | | 7,627 | 8,314,731 |
| Ichigo Real Estate Investment Corp. | | 5,000 | 3,263,899 |
| Katitas Co. Ltd. | | 98,700 | 2,232,184 |
| Kenedix Residential Investment Corp. | | 3,000 | 5,478,249 |
| Kenedix, Inc. | | 1,905,900 | 8,660,317 |
| LaSalle Logiport REIT | | 9,000 | 16,383,732 |
| Mitsubishi Estate Co. Ltd. | | 1,888,700 | 27,131,723 |
| Mitsui Fudosan Co. Ltd. | | 900 | 14,071 |
| Nomura Real Estate Holdings, Inc. | | 548,400 | 9,076,537 |
| Park24 Co. Ltd. | | 105,800 | 1,419,262 |
|
| TOTAL JAPAN | | | 116,305,894 |
|
| Mexico - 0.3% | | | |
| Corporacion Inmobiliaria Vesta S.A.B. de CV | | 1,087,562 | 1,624,379 |
| New Zealand - 1.9% | | | |
| Arvida Group Ltd. | | 3,784,000 | 4,015,278 |
| Auckland International Airport Ltd. | | 848,897 | 3,591,867 |
| Stride Property Group unit | | 1,464,400 | 1,893,821 |
|
| TOTAL NEW ZEALAND | | | 9,500,966 |
|
| Norway - 1.7% | | | |
| Entra ASA (b) | | 612,100 | 8,614,733 |
| Singapore - 7.9% | | | |
| Keppel DC (REIT) | | 3,458,200 | 7,515,904 |
| Parkway Life REIT | | 4,555,700 | 11,821,907 |
| United Industrial Corp. Ltd. | | 5,252,800 | 8,013,255 |
| Wing Tai Holdings Ltd. | | 9,786,681 | 12,189,973 |
|
| TOTAL SINGAPORE | | | 39,541,039 |
|
| Spain - 1.8% | | | |
| Arima Real Estate SOCIMI SA (c) | | 515,200 | 5,401,231 |
| Cellnex Telecom SA (b) | | 39,600 | 2,482,544 |
| Cellnex Telecom SA rights 8/7/20 (c) | | 39,600 | 165,596 |
| Melia Hotels International SA | | 199,903 | 740,336 |
|
| TOTAL SPAIN | | | 8,789,707 |
|
| Sweden - 6.3% | | | |
| Amasten Fastighets AB (c) | | 4,946,813 | 4,011,402 |
| Catena AB | | 99,700 | 4,099,142 |
| Fastighets AB Balder (c) | | 145,600 | 5,987,969 |
| Genova Property Group AB (c) | | 200,000 | 1,719,759 |
| Heba Fastighets AB (B Shares) | | 273,600 | 2,686,049 |
| John Mattson Fastighetsforetag (c) | | 95,300 | 1,606,369 |
| NP3 Fastigheter AB | | 246,700 | 2,565,255 |
| Sagax AB | | 163,800 | 2,477,437 |
| Torslanda Property Investment AB | | 936,000 | 1,694,976 |
| Wihlborgs Fastigheter AB | | 279,530 | 4,673,531 |
|
| TOTAL SWEDEN | | | 31,521,889 |
|
| Switzerland - 3.0% | | | |
| Flughafen Zuerich AG (c) | | 20,320 | 2,555,136 |
| PSP Swiss Property AG | | 113,374 | 12,632,235 |
|
| TOTAL SWITZERLAND | | | 15,187,371 |
|
| United Kingdom - 10.3% | | | |
| Big Yellow Group PLC | | 388,400 | 5,180,755 |
| Derwent London PLC | | 117,900 | 4,438,562 |
| Grainger Trust PLC | | 3,153,592 | 11,979,607 |
| Helical Bar PLC | | 1,274,397 | 5,079,625 |
| Helios Towers PLC (c) | | 323,000 | 659,579 |
| Londonmetric Properity PLC | | 1,611,793 | 4,873,724 |
| Rightmove PLC | | 352,900 | 2,546,825 |
| Safestore Holdings PLC | | 319,265 | 3,194,982 |
| Shaftesbury PLC | | 547,600 | 3,680,811 |
| UK Coal PLC | | 2,298,400 | 3,083,821 |
| Urban Logistics REIT PLC | | 2,124,700 | 4,018,881 |
| Warehouse (REIT) PLC | | 1,800,000 | 2,591,820 |
|
| TOTAL UNITED KINGDOM | | | 51,328,992 |
|
| United States of America - 1.7% | | | |
| CoStar Group, Inc. (c) | | 1,800 | 1,529,568 |
| Prologis (REIT), Inc. | | 67,900 | 7,158,018 |
|
| TOTAL UNITED STATES OF AMERICA | | | 8,687,586 |
|
| TOTAL COMMON STOCKS | | | |
| (Cost $450,888,422) | | | 476,085,416 |
|
| Money Market Funds - 4.3% | | | |
| Fidelity Cash Central Fund 0.14% (d) | | 21,212,148 | 21,218,511 |
| Fidelity Securities Lending Cash Central Fund 0.13% (d)(e) | | 20,399 | 20,401 |
| TOTAL MONEY MARKET FUNDS | | | |
| (Cost $21,236,680) | | | 21,238,912 |
| TOTAL INVESTMENT IN SECURITIES - 99.6% | | | |
| (Cost $472,125,102) | | | 497,324,328 |
| NET OTHER ASSETS (LIABILITIES) - 0.4% | | | 2,236,478 |
| NET ASSETS - 100% | | | $499,560,806 |
Categorizations in the Schedule of Investments are based on country or territory of incorporation.
Legend
(a) Security or a portion of the security is on loan at period end.
(b) Security exempt from registration under Rule 144A of the Securities Act of 1933. These securities may be resold in transactions exempt from registration, normally to qualified institutional buyers. At the end of the period, the value of these securities amounted to $16,648,729 or 3.3% of net assets.
(c) Non-income producing
(d) Affiliated fund that is generally available only to investment companies and other accounts managed by Fidelity Investments. The rate quoted is the annualized seven-day yield of the fund at period end. A complete unaudited listing of the fund's holdings as of its most recent quarter end is available upon request. In addition, each Fidelity Central Fund's financial statements, which are not covered by the Fund's Report of Independent Registered Public Accounting Firm, are available on the SEC's website or upon request.
(e) Investment made with cash collateral received from securities on loan.
Affiliated Central Funds
Information regarding fiscal year to date income earned by the Fund from investments in Fidelity Central Funds is as follows:
| Fund | Income earned |
| Fidelity Cash Central Fund | $294,089 |
| Fidelity Securities Lending Cash Central Fund | 44,721 |
| Total | $338,810 |
Amounts in the income column in the above table include any capital gain distributions from underlying funds, which are presented in the corresponding line-item in the Statement of Operations, if applicable. Amount for Fidelity Securities Lending Cash Central Fund represents the income earned on investing cash collateral, less rebates paid to borrowers and any lending agent fees associated with the loan, plus any premium payments received for lending certain types of securities.
Investment Valuation
The following is a summary of the inputs used, as of July 31, 2020, involving the Fund's assets and liabilities carried at fair value. The inputs or methodology used for valuing securities may not be an indication of the risk associated with investing in those securities. For more information on valuation inputs, and their aggregation into the levels used below, please refer to the Investment Valuation section in the accompanying Notes to Financial Statements.
| | Valuation Inputs at Reporting Date: |
| Description | Total | Level 1 | Level 2 | Level 3 |
| Investments in Securities: | | | | |
| Equities: | | | | |
| Communication Services | $8,894,927 | $6,348,102 | $2,546,825 | $-- |
| Consumer Discretionary | 4,516,596 | 4,516,596 | -- | -- |
| Health Care | 4,015,278 | 4,015,278 | -- | -- |
| Industrials | 9,095,833 | 9,095,833 | -- | -- |
| Real Estate | 449,562,782 | 382,875,949 | 66,686,833 | -- |
| Money Market Funds | 21,238,912 | 21,238,912 | -- | -- |
| Total Investments in Securities: | $497,324,328 | $428,090,670 | $69,233,658 | $-- |
See accompanying notes which are an integral part of the financial statements.
Financial Statements
Statement of Assets and Liabilities
| | | July 31, 2020 |
| Assets | | |
Investment in securities, at value (including securities loaned of $19,591) — See accompanying schedule:
Unaffiliated issuers (cost $450,888,422) | $476,085,416 | |
| Fidelity Central Funds (cost $21,236,680) | 21,238,912 | |
| Total Investment in Securities (cost $472,125,102) | | $497,324,328 |
| Foreign currency held at value (cost $26,332) | | 26,339 |
| Receivable for fund shares sold | | 1,241,475 |
| Dividends receivable | | 2,233,777 |
| Distributions receivable from Fidelity Central Funds | | 4,990 |
| Prepaid expenses | | 3,153 |
| Other receivables | | 352 |
| Total assets | | 500,834,414 |
| Liabilities | | |
| Payable for fund shares redeemed | $843,694 | |
| Accrued management fee | 281,600 | |
| Transfer agent fee payable | 65,219 | |
| Distribution and service plan fees payable | 7,028 | |
| Other affiliated payables | 21,423 | |
| Other payables and accrued expenses | 34,555 | |
| Collateral on securities loaned | 20,089 | |
| Total liabilities | | 1,273,608 |
| Net Assets | | $499,560,806 |
| Net Assets consist of: | | |
| Paid in capital | | $504,347,506 |
| Total accumulated earnings (loss) | | (4,786,700) |
| Net Assets | | $499,560,806 |
| Net Asset Value and Maximum Offering Price | | |
| Class A: | | |
| Net Asset Value and redemption price per share ($11,710,136 ÷ 997,829 shares)(a) | | $11.74 |
| Maximum offering price per share (100/94.25 of $11.74) | | $12.46 |
| Class M: | | |
| Net Asset Value and redemption price per share ($2,975,823 ÷ 255,707 shares)(a) | | $11.64 |
| Maximum offering price per share (100/96.50 of $11.64) | | $12.06 |
| Class C: | | |
| Net Asset Value and offering price per share ($3,835,999 ÷ 335,554 shares)(a) | | $11.43 |
| International Real Estate: | | |
| Net Asset Value, offering price and redemption price per share ($224,266,451 ÷ 18,845,253 shares) | | $11.90 |
| Class I: | | |
| Net Asset Value, offering price and redemption price per share ($145,964,444 ÷ 12,343,248 shares) | | $11.83 |
| Class Z: | | |
| Net Asset Value, offering price and redemption price per share ($110,807,953 ÷ 9,376,333 shares) | | $11.82 |
(a) Redemption price per share is equal to net asset value less any applicable contingent deferred sales charge.
See accompanying notes which are an integral part of the financial statements.
Statement of Operations
| | | Year ended July 31, 2020 |
| Investment Income | | |
| Dividends | | $14,926,442 |
| Income from Fidelity Central Funds (including $44,721 from security lending) | | 338,810 |
| Income before foreign taxes withheld | | 15,265,252 |
| Less foreign taxes withheld | | (872,122) |
| Total income | | 14,393,130 |
| Expenses | | |
| Management fee | $3,706,555 | |
| Transfer agent fees | 821,198 | |
| Distribution and service plan fees | 89,033 | |
| Accounting fees | 276,108 | |
| Custodian fees and expenses | 88,992 | |
| Independent trustees' fees and expenses | 3,477 | |
| Registration fees | 102,731 | |
| Audit | 74,919 | |
| Legal | 1,027 | |
| Miscellaneous | 16,719 | |
| Total expenses before reductions | 5,180,759 | |
| Expense reductions | (54,349) | |
| Total expenses after reductions | | 5,126,410 |
| Net investment income (loss) | | 9,266,720 |
| Realized and Unrealized Gain (Loss) | | |
| Net realized gain (loss) on: | | |
| Investment securities: | | |
| Unaffiliated issuers (net of foreign taxes of $156,661) | (6,197,826) | |
| Fidelity Central Funds | 854 | |
| Foreign currency transactions | 181,897 | |
| Total net realized gain (loss) | | (6,015,075) |
| Change in net unrealized appreciation (depreciation) on: | | |
| Investment securities: | | |
| Unaffiliated issuers (net of decrease in deferred foreign taxes of $104,528) | (2,673,942) | |
| Fidelity Central Funds | 2,121 | |
| Assets and liabilities in foreign currencies | 91,860 | |
| Total change in net unrealized appreciation (depreciation) | | (2,579,961) |
| Net gain (loss) | | (8,595,036) |
| Net increase (decrease) in net assets resulting from operations | | $671,684 |
See accompanying notes which are an integral part of the financial statements.
Statement of Changes in Net Assets
| | Year ended July 31, 2020 | Year ended July 31, 2019 |
| Increase (Decrease) in Net Assets | | |
| Operations | | |
| Net investment income (loss) | $9,266,720 | $10,195,011 |
| Net realized gain (loss) | (6,015,075) | (5,967,988) |
| Change in net unrealized appreciation (depreciation) | (2,579,961) | 27,092,050 |
| Net increase (decrease) in net assets resulting from operations | 671,684 | 31,319,073 |
| Distributions to shareholders | (30,291,248) | (11,430,699) |
| Share transactions - net increase (decrease) | (38,736,344) | (67,131,164) |
| Total increase (decrease) in net assets | (68,355,908) | (47,242,790) |
| Net Assets | | |
| Beginning of period | 567,916,714 | 615,159,504 |
| End of period | $499,560,806 | $567,916,714 |
See accompanying notes which are an integral part of the financial statements.
Financial Highlights
Fidelity International Real Estate Fund Class A
| Years ended July 31, | 2020 | 2019 | 2018 | 2017 | 2016 |
| Selected Per–Share Data | | | | | |
| Net asset value, beginning of period | $12.14 | $11.63 | $11.03 | $10.46 | $10.56 |
| Income from Investment Operations | | | | | |
| Net investment income (loss)A | .17 | .16 | .23 | .16 | .15 |
| Net realized and unrealized gain (loss) | .05B | .55 | .69 | .79 | .02 |
| Total from investment operations | .22 | .71 | .92 | .95 | .17 |
| Distributions from net investment income | (.24) | (.17) | (.21) | (.13) | (.15) |
| Distributions from net realized gain | (.38) | (.03) | (.11) | (.25) | (.12) |
| Total distributions | (.62) | (.20) | (.32) | (.38) | (.27) |
| Redemption fees added to paid in capitalA | – | – | –C | –C | –C |
| Net asset value, end of period | $11.74 | $12.14 | $11.63 | $11.03 | $10.46 |
| Total ReturnD,E | 1.71% | 6.21% | 8.49% | 9.48% | 1.75% |
| Ratios to Average Net AssetsF,G | | | | | |
| Expenses before reductions | 1.27% | 1.32% | 1.36% | 1.35% | 1.35% |
| Expenses net of fee waivers, if any | 1.27% | 1.32% | 1.36% | 1.35% | 1.35% |
| Expenses net of all reductions | 1.26% | 1.31% | 1.35% | 1.35% | 1.33% |
| Net investment income (loss) | 1.40% | 1.35% | 2.03% | 1.60% | 1.51% |
| Supplemental Data | | | | | |
| Net assets, end of period (000 omitted) | $11,710 | $12,564 | $11,319 | $10,170 | $14,020 |
| Portfolio turnover rateH | 69% | 52% | 56% | 55% | 71% |
A Calculated based on average shares outstanding during the period.
B The amount shown for a share outstanding does not correspond with the aggregate net gain (loss) on investments for the period due to the timing of sales and repurchases of shares in relation to fluctuating market values of the investments of the Fund.
C Amount represents less than $.005 per share.
D Total returns would have been lower if certain expenses had not been reduced during the applicable periods shown.
E Total returns do not include the effect of the sales charges.
F Fees and expenses of any underlying mutual funds or exchange-traded funds (ETFs) are not included in the Fund's expense ratio. The Fund indirectly bears its proportionate share of these expenses. For additional expense information related to investments in Fidelity Central Funds, please refer to the "Investments in Fidelity Central Funds" note found in the Notes to Financial Statements section of the most recent Annual or Semi-Annual report.
G Expense ratios reflect operating expenses of the class. Expenses before reductions do not reflect amounts reimbursed by the investment adviser or reductions from brokerage service arrangements or reductions from other expense offset arrangements and do not represent the amount paid by the class during periods when reimbursements or reductions occur. Expenses net of fee waivers reflect expenses after reimbursement by the investment adviser but prior to reductions from brokerage service arrangements or other expense offset arrangements. Expenses net of all reductions represent the net expenses paid by the class.
H Amount does not include the portfolio activity of any underlying Fidelity Central Funds.
See accompanying notes which are an integral part of the financial statements.
Fidelity International Real Estate Fund Class M
| Years ended July 31, | 2020 | 2019 | 2018 | 2017 | 2016 |
| Selected Per–Share Data | | | | | |
| Net asset value, beginning of period | $12.02 | $11.53 | $10.93 | $10.39 | $10.49 |
| Income from Investment Operations | | | | | |
| Net investment income (loss)A | .13 | .12 | .20 | .13 | .12 |
| Net realized and unrealized gain (loss) | .05B | .54 | .68 | .77 | .02 |
| Total from investment operations | .18 | .66 | .88 | .90 | .14 |
| Distributions from net investment income | (.18) | (.14) | (.17) | (.12) | (.11) |
| Distributions from net realized gain | (.38) | (.03) | (.11) | (.25) | (.12) |
| Total distributions | (.56) | (.17) | (.28) | (.36)C | (.24)D |
| Redemption fees added to paid in capitalA | – | – | –E | –E | –E |
| Net asset value, end of period | $11.64 | $12.02 | $11.53 | $10.93 | $10.39 |
| Total ReturnF,G | 1.41% | 5.86% | 8.19% | 9.07% | 1.43% |
| Ratios to Average Net AssetsH,I | | | | | |
| Expenses before reductions | 1.59% | 1.62% | 1.65% | 1.65% | 1.66% |
| Expenses net of fee waivers, if any | 1.58% | 1.62% | 1.65% | 1.65% | 1.66% |
| Expenses net of all reductions | 1.58% | 1.61% | 1.65% | 1.65% | 1.64% |
| Net investment income (loss) | 1.08% | 1.06% | 1.74% | 1.31% | 1.20% |
| Supplemental Data | | | | | |
| Net assets, end of period (000 omitted) | $2,976 | $3,703 | $4,360 | $4,147 | $4,545 |
| Portfolio turnover rateJ | 69% | 52% | 56% | 55% | 71% |
A Calculated based on average shares outstanding during the period.
B The amount shown for a share outstanding does not correspond with the aggregate net gain (loss) on investments for the period due to the timing of sales and repurchases of shares in relation to fluctuating market values of the investments of the Fund.
C Total distributions of $.36 per share is comprised of distributions from net investment income of $.115 and distributions from net realized gain of $.246 per share.
D Total distributions of $.24 per share is comprised of distributions from net investment income of $.114 and distributions from net realized gain of $.121 per share.
E Amount represents less than $.005 per share.
F Total returns would have been lower if certain expenses had not been reduced during the applicable periods shown.
G Total returns do not include the effect of the sales charges.
H Fees and expenses of any underlying mutual funds or exchange-traded funds (ETFs) are not included in the Fund's expense ratio. The Fund indirectly bears its proportionate share of these expenses. For additional expense information related to investments in Fidelity Central Funds, please refer to the "Investments in Fidelity Central Funds" note found in the Notes to Financial Statements section of the most recent Annual or Semi-Annual report.
I Expense ratios reflect operating expenses of the class. Expenses before reductions do not reflect amounts reimbursed by the investment adviser or reductions from brokerage service arrangements or reductions from other expense offset arrangements and do not represent the amount paid by the class during periods when reimbursements or reductions occur. Expenses net of fee waivers reflect expenses after reimbursement by the investment adviser but prior to reductions from brokerage service arrangements or other expense offset arrangements. Expenses net of all reductions represent the net expenses paid by the class.
J Amount does not include the portfolio activity of any underlying Fidelity Central Funds.
See accompanying notes which are an integral part of the financial statements.
Fidelity International Real Estate Fund Class C
| Years ended July 31, | 2020 | 2019 | 2018 | 2017 | 2016 |
| Selected Per–Share Data | | | | | |
| Net asset value, beginning of period | $11.80 | $11.33 | $10.73 | $10.21 | $10.32 |
| Income from Investment Operations | | | | | |
| Net investment income (loss)A | .07 | .07 | .15 | .09 | .07 |
| Net realized and unrealized gain (loss) | .04B | .55 | .67 | .76 | .02 |
| Total from investment operations | .11 | .62 | .82 | .85 | .09 |
| Distributions from net investment income | (.10) | (.12) | (.10) | (.09) | (.07) |
| Distributions from net realized gain | (.38) | (.03) | (.11) | (.25) | (.12) |
| Total distributions | (.48) | (.15) | (.22)C | (.33)D | (.20)E |
| Redemption fees added to paid in capitalA | – | – | –F | –F | –F |
| Net asset value, end of period | $11.43 | $11.80 | $11.33 | $10.73 | $10.21 |
| Total ReturnG,H | .85% | 5.56% | 7.70% | 8.69% | .93% |
| Ratios to Average Net AssetsI,J | | | | | |
| Expenses before reductions | 2.04% | 2.02% | 2.05% | 2.09% | 2.10% |
| Expenses net of fee waivers, if any | 2.03% | 2.02% | 2.04% | 2.08% | 2.10% |
| Expenses net of all reductions | 2.03% | 2.01% | 2.04% | 2.08% | 2.09% |
| Net investment income (loss) | .63% | .66% | 1.35% | .87% | .75% |
| Supplemental Data | | | | | |
| Net assets, end of period (000 omitted) | $3,836 | $3,869 | $4,894 | $4,818 | $5,668 |
| Portfolio turnover rateK | 69% | 52% | 56% | 55% | 71% |
A Calculated based on average shares outstanding during the period.
B The amount shown for a share outstanding does not correspond with the aggregate net gain (loss) on investments for the period due to the timing of sales and repurchases of shares in relation to fluctuating market values of the investments of the Fund.
C Total distributions of $.22 per share is comprised of distributions from net investment income of $.103 and distributions from net realized gain of $.112 per share.
D Total distributions of $.33 per share is comprised of distributions from net investment income of $.085 and distributions from net realized gain of $.246 per share.
E Total distributions of $.20 per share is comprised of distributions from net investment income of $.074 and distributions from net realized gain of $.121 per share.
F Amount represents less than $.005 per share.
G Total returns would have been lower if certain expenses had not been reduced during the applicable periods shown.
H Total returns do not include the effect of the contingent deferred sales charge.
I Fees and expenses of any underlying mutual funds or exchange-traded funds (ETFs) are not included in the Fund's expense ratio. The Fund indirectly bears its proportionate share of these expenses. For additional expense information related to investments in Fidelity Central Funds, please refer to the "Investments in Fidelity Central Funds" note found in the Notes to Financial Statements section of the most recent Annual or Semi-Annual report.
J Expense ratios reflect operating expenses of the class. Expenses before reductions do not reflect amounts reimbursed by the investment adviser or reductions from brokerage service arrangements or reductions from other expense offset arrangements and do not represent the amount paid by the class during periods when reimbursements or reductions occur. Expenses net of fee waivers reflect expenses after reimbursement by the investment adviser but prior to reductions from brokerage service arrangements or other expense offset arrangements. Expenses net of all reductions represent the net expenses paid by the class.
K Amount does not include the portfolio activity of any underlying Fidelity Central Funds.
See accompanying notes which are an integral part of the financial statements.
Fidelity International Real Estate Fund
| Years ended July 31, | 2020 | 2019 | 2018 | 2017 | 2016 |
| Selected Per–Share Data | | | | | |
| Net asset value, beginning of period | $12.31 | $11.78 | $11.17 | $10.58 | $10.68 |
| Income from Investment Operations | | | | | |
| Net investment income (loss)A | .20 | .19 | .27 | .19 | .17 |
| Net realized and unrealized gain (loss) | .05B | .56 | .70 | .79 | .02 |
| Total from investment operations | .25 | .75 | .97 | .98 | .19 |
| Distributions from net investment income | (.28) | (.19) | (.24) | (.15) | (.17) |
| Distributions from net realized gain | (.38) | (.03) | (.11) | (.25) | (.12) |
| Total distributions | (.66) | (.22) | (.36)C | (.39)D | (.29) |
| Redemption fees added to paid in capitalA | – | – | –E | –E | –E |
| Net asset value, end of period | $11.90 | $12.31 | $11.78 | $11.17 | $10.58 |
| Total ReturnF | 1.98% | 6.49% | 8.84% | 9.74% | 1.94% |
| Ratios to Average Net AssetsG,H | | | | | |
| Expenses before reductions | 1.00% | 1.02% | 1.05% | 1.12% | 1.13% |
| Expenses net of fee waivers, if any | 1.00% | 1.02% | 1.05% | 1.12% | 1.13% |
| Expenses net of all reductions | .99% | 1.01% | 1.04% | 1.11% | 1.11% |
| Net investment income (loss) | 1.67% | 1.65% | 2.34% | 1.84% | 1.73% |
| Supplemental Data | | | | | |
| Net assets, end of period (000 omitted) | $224,266 | $251,947 | $244,195 | $226,027 | $341,407 |
| Portfolio turnover rateI | 69% | 52% | 56% | 55% | 71% |
A Calculated based on average shares outstanding during the period.
B The amount shown for a share outstanding does not correspond with the aggregate net gain (loss) on investments for the period due to the timing of sales and repurchases of shares in relation to fluctuating market values of the investments of the Fund.
C Total distributions of $.36 per share is comprised of distributions from net investment income of $.244 and distributions from net realized gain of $.112 per share.
D Total distributions of $.39 per share is comprised of distributions from net investment income of $.147 and distributions from net realized gain of $.246 per share.
E Amount represents less than $.005 per share.
F Total returns would have been lower if certain expenses had not been reduced during the applicable periods shown.
G Fees and expenses of any underlying mutual funds or exchange-traded funds (ETFs) are not included in the Fund's expense ratio. The Fund indirectly bears its proportionate share of these expenses. For additional expense information related to investments in Fidelity Central Funds, please refer to the "Investments in Fidelity Central Funds" note found in the Notes to Financial Statements section of the most recent Annual or Semi-Annual report.
H Expense ratios reflect operating expenses of the class. Expenses before reductions do not reflect amounts reimbursed by the investment adviser or reductions from brokerage service arrangements or reductions from other expense offset arrangements and do not represent the amount paid by the class during periods when reimbursements or reductions occur. Expenses net of fee waivers reflect expenses after reimbursement by the investment adviser but prior to reductions from brokerage service arrangements or other expense offset arrangements. Expenses net of all reductions represent the net expenses paid by the class.
I Amount does not include the portfolio activity of any underlying Fidelity Central Funds.
See accompanying notes which are an integral part of the financial statements.
Fidelity International Real Estate Fund Class I
| Years ended July 31, | 2020 | 2019 | 2018 | 2017 | 2016 |
| Selected Per–Share Data | | | | | |
| Net asset value, beginning of period | $12.23 | $11.70 | $11.13 | $10.54 | $10.64 |
| Income from Investment Operations | | | | | |
| Net investment income (loss)A | .21 | .20 | .28 | .20 | .19 |
| Net realized and unrealized gain (loss) | .06B | .55 | .68 | .79 | .02 |
| Total from investment operations | .27 | .75 | .96 | .99 | .21 |
| Distributions from net investment income | (.28) | (.19) | (.28) | (.16) | (.19) |
| Distributions from net realized gain | (.38) | (.03) | (.11) | (.25) | (.12) |
| Total distributions | (.67)C | (.22) | (.39) | (.40)D | (.31) |
| Redemption fees added to paid in capitalA | – | – | –E | –E | –E |
| Net asset value, end of period | $11.83 | $12.23 | $11.70 | $11.13 | $10.54 |
| Total ReturnF | 2.09% | 6.61% | 8.88% | 9.89% | 2.15% |
| Ratios to Average Net AssetsG,H | | | | | |
| Expenses before reductions | .93% | .94% | .96% | .95% | .97% |
| Expenses net of fee waivers, if any | .93% | .94% | .96% | .95% | .97% |
| Expenses net of all reductions | .92% | .93% | .95% | .95% | .96% |
| Net investment income (loss) | 1.73% | 1.74% | 2.44% | 2.00% | 1.89% |
| Supplemental Data | | | | | |
| Net assets, end of period (000 omitted) | $145,964 | $137,778 | $350,392 | $171,444 | $98,238 |
| Portfolio turnover rateI | 69% | 52% | 56% | 55% | 71% |
A Calculated based on average shares outstanding during the period.
B The amount shown for a share outstanding does not correspond with the aggregate net gain (loss) on investments for the period due to the timing of sales and repurchases of shares in relation to fluctuating market values of the investments of the Fund.
C Total distributions of $.67 per share is comprised of distributions from net investment income of $.284 and distributions from net realized gain of $.381 per share.
D Total distributions of $.40 per share is comprised of distributions from net investment income of $.157 and distributions from net realized gain of $.246 per share.
E Amount represents less than $.005 per share.
F Total returns would have been lower if certain expenses had not been reduced during the applicable periods shown.
G Fees and expenses of any underlying mutual funds or exchange-traded funds (ETFs) are not included in the Fund's expense ratio. The Fund indirectly bears its proportionate share of these expenses. For additional expense information related to investments in Fidelity Central Funds, please refer to the "Investments in Fidelity Central Funds" note found in the Notes to Financial Statements section of the most recent Annual or Semi-Annual report.
H Expense ratios reflect operating expenses of the class. Expenses before reductions do not reflect amounts reimbursed by the investment adviser or reductions from brokerage service arrangements or reductions from other expense offset arrangements and do not represent the amount paid by the class during periods when reimbursements or reductions occur. Expenses net of fee waivers reflect expenses after reimbursement by the investment adviser but prior to reductions from brokerage service arrangements or other expense offset arrangements. Expenses net of all reductions represent the net expenses paid by the class.
I Amount does not include the portfolio activity of any underlying Fidelity Central Funds.
See accompanying notes which are an integral part of the financial statements.
Fidelity International Real Estate Fund Class Z
| Years ended July 31, | 2020 | 2019 A |
| Selected Per–Share Data | | |
| Net asset value, beginning of period | $12.25 | $11.16 |
| Income from Investment Operations | | |
| Net investment income (loss)B | .22 | .30 |
| Net realized and unrealized gain (loss) | .05C | .79 |
| Total from investment operations | .27 | 1.09 |
| Distributions from net investment income | (.32) | – |
| Distributions from net realized gain | (.38) | – |
| Total distributions | (.70) | – |
| Net asset value, end of period | $11.82 | $12.25 |
| Total ReturnD,E | 2.12% | 9.77% |
| Ratios to Average Net AssetsF,G | | |
| Expenses before reductions | .83% | .84%H |
| Expenses net of fee waivers, if any | .83% | .84%H |
| Expenses net of all reductions | .82% | .83%H |
| Net investment income (loss) | 1.83% | 3.02%H |
| Supplemental Data | | |
| Net assets, end of period (000 omitted) | $110,808 | $158,056 |
| Portfolio turnover rateI | 69% | 52% |
A For the period October 2, 2018 (commencement of sale of shares) to July 31, 2019.
B Calculated based on average shares outstanding during the period.
C The amount shown for a share outstanding does not correspond with the aggregate net gain (loss) on investments for the period due to the timing of sales and repurchases of shares in relation to fluctuating market values of the investments of the Fund.
D Total returns for periods of less than one year are not annualized.
E Total returns would have been lower if certain expenses had not been reduced during the applicable periods shown.
F Fees and expenses of any underlying mutual funds or exchange-traded funds (ETFs) are not included in the Fund's expense ratio. The Fund indirectly bears its proportionate share of these expenses. For additional expense information related to investments in Fidelity Central Funds, please refer to the "Investments in Fidelity Central Funds" note found in the Notes to Financial Statements section of the most recent Annual or Semi-Annual report.
G Expense ratios reflect operating expenses of the class. Expenses before reductions do not reflect amounts reimbursed by the investment adviser or reductions from brokerage service arrangements or reductions from other expense offset arrangements and do not represent the amount paid by the class during periods when reimbursements or reductions occur. Expense ratios before reductions for start-up periods may not be representative of longer-term operating periods. Expenses net of fee waivers reflect expenses after reimbursement by the investment adviser but prior to reductions from brokerage service arrangements or other expense offset arrangements. Expenses net of all reductions represent the net expenses paid by the class.
H Annualized
I Amount does not include the portfolio activity of any underlying Fidelity Central Funds.
See accompanying notes which are an integral part of the financial statements.
Notes to Financial Statements
For the period ended July 31, 2020
1. Organization.
Fidelity International Real Estate Fund (the Fund) is a non-diversified fund of Fidelity Select Portfolios (the Trust) and is authorized to issue an unlimited number of shares. The Trust is registered under the Investment Company Act of 1940, as amended (the 1940 Act), as an open-end management investment company organized as a Massachusetts business trust. The Fund offers Class A, Class M, Class C, International Real Estate, Class I and Class Z shares, each of which has equal rights as to assets and voting privileges. Each class has exclusive voting rights with respect to matters that affect that class. Class C shares will automatically convert to Class A shares after a holding period of ten years from the initial date of purchase, with certain exceptions.
Effective January 1, 2020:
Investment advisers Fidelity Investments Money Management, Inc., FMR Co., Inc., and Fidelity SelectCo, LLC, merged with and into Fidelity Management & Research Company. In connection with the merger transactions, the resulting, merged investment adviser was then redomiciled from Massachusetts to Delaware, changed its corporate structure from a corporation to a limited liability company, and changed its name to "Fidelity Management & Research Company LLC".
Broker-dealer Fidelity Distributors Corporation merged with and into Fidelity Investments Institutional Services Company, Inc. ("FIISC"). FIISC was then redomiciled from Massachusetts to Delaware, changed its corporate structure from a corporation to a limited liability company, and changed its name to "Fidelity Distributors Company LLC".
Fidelity Investments Institutional Operations Company, Inc. converted from a Massachusetts corporation to a Massachusetts LLC, and changed its name to "Fidelity Investments Institutional Operations Company LLC".
2. Investments in Fidelity Central Funds.
The Fund invests in Fidelity Central Funds, which are open-end investment companies generally available only to other investment companies and accounts managed by the investment adviser and its affiliates. The Fund's Schedule of Investments lists each of the Fidelity Central Funds held as of period end, if any, as an investment of the Fund, but does not include the underlying holdings of each Fidelity Central Fund. As an Investing Fund, the Fund indirectly bears its proportionate share of the expenses of the underlying Fidelity Central Funds.
The Money Market Central Funds seek preservation of capital and current income and are managed by the investment adviser. Annualized expenses of the Money Market Central Funds as of their most recent shareholder report date ranged from less than .005% to .01%.
A complete unaudited list of holdings for each Fidelity Central Fund is available upon request or at the Securities and Exchange Commission (the SEC) website at www.sec.gov. In addition, the financial statements of the Fidelity Central Funds, which are not covered by the Fund's Report of Independent Registered Public Accounting Firm, are available on the SEC website or upon request.
3. Significant Accounting Policies.
The Fund is an investment company and applies the accounting and reporting guidance of the Financial Accounting Standards Board (FASB) Accounting Standards Codification Topic 946 Financial Services – Investment Companies. The financial statements have been prepared in conformity with accounting principles generally accepted in the United States of America (GAAP), which require management to make certain estimates and assumptions at the date of the financial statements. Actual results could differ from those estimates. Subsequent events, if any, through the date that the financial statements were issued have been evaluated in the preparation of the financial statements. The following summarizes the significant accounting policies of the Fund:
Investment Valuation. Investments are valued as of 4:00 p.m. Eastern time on the last calendar day of the period. The Board of Trustees (the Board) has delegated the day to day responsibility for the valuation of the Fund's investments to the Fair Value Committee (the Committee) established by the Fund's investment adviser. In accordance with valuation policies and procedures approved by the Board, the Fund attempts to obtain prices from one or more third party pricing vendors or brokers to value its investments. When current market prices, quotations or currency exchange rates are not readily available or reliable, investments will be fair valued in good faith by the Committee, in accordance with procedures adopted by the Board. Factors used in determining fair value vary by investment type and may include market or investment specific events. The frequency with which these procedures are used cannot be predicted and they may be utilized to a significant extent. The Committee oversees the Fund's valuation policies and procedures and reports to the Board on the Committee's activities and fair value determinations. The Board monitors the appropriateness of the procedures used in valuing the Fund's investments and ratifies the fair value determinations of the Committee.
The Fund categorizes the inputs to valuation techniques used to value its investments into a disclosure hierarchy consisting of three levels as shown below:
- Level 1 – quoted prices in active markets for identical investments
- Level 2 – other significant observable inputs (including quoted prices for similar investments, interest rates, prepayment speeds, etc.)
- Level 3 – unobservable inputs (including the Fund's own assumptions based on the best information available)
Valuation techniques used to value the Fund's investments by major category are as follows:
Equity securities, including restricted securities, for which market quotations are readily available, are valued at the last reported sale price or official closing price as reported by a third party pricing vendor on the primary market or exchange on which they are traded and are categorized as Level 1 in the hierarchy. In the event there were no sales during the day or closing prices are not available, securities are valued at the last quoted bid price or may be valued using the last available price and are generally categorized as Level 2 in the hierarchy. For foreign equity securities, when market or security specific events arise, comparisons to the valuation of American Depositary Receipts (ADRs), futures contracts, Exchange-Traded Funds (ETFs) and certain indexes as well as quoted prices for similar securities may be used and would be categorized as Level 2 in the hierarchy. For equity securities, including restricted securities, where observable inputs are limited, assumptions about market activity and risk are used and these securities may be categorized as Level 3 in the hierarchy.
Investments in open-end mutual funds, including the Fidelity Central Funds, are valued at their closing net asset value (NAV) each business day and are categorized as Level 1 in the hierarchy.
Changes in valuation techniques may result in transfers in or out of an assigned level within the disclosure hierarchy. The aggregate value of investments by input level as of July 31, 2020 is included at the end of the Fund's Schedule of Investments.
Foreign Currency. The Fund may use foreign currency contracts to facilitate transactions in foreign-denominated securities. Gains and losses from these transactions may arise from changes in the value of the foreign currency or if the counterparties do not perform under the contracts' terms.
Foreign-denominated assets, including investment securities, and liabilities are translated into U.S. dollars at the exchange rates at period end. Purchases and sales of investment securities, income and dividends received and expenses denominated in foreign currencies are translated into U.S. dollars at the exchange rate in effect on the transaction date.
The effects of exchange rate fluctuations on investments are included with the net realized and unrealized gain (loss) on investment securities. Other foreign currency transactions resulting in realized and unrealized gain (loss) are disclosed separately.
Investment Transactions and Income. For financial reporting purposes, the Fund's investment holdings and NAV include trades executed through the end of the last business day of the period. The NAV per share for processing shareholder transactions is calculated as of the close of business of the New York Stock Exchange (NYSE), normally 4:00 p.m. Eastern time and includes trades executed through the end of the prior business day. Gains and losses on securities sold are determined on the basis of identified cost and include proceeds received from litigation. Dividend income is recorded on the ex-dividend date, except for certain dividends from foreign securities where the ex-dividend date may have passed, which are recorded as soon as the Fund is informed of the ex-dividend date. Non-cash dividends included in dividend income, if any, are recorded at the fair market value of the securities received. Income and capital gain distributions from Fidelity Central Funds, if any, are recorded on the ex-dividend date. Investment income is recorded net of foreign taxes withheld where recovery of such taxes is uncertain.
Class Allocations and Expenses. Investment income, realized and unrealized capital gains and losses, common expenses of the Fund, and certain fund-level expense reductions, if any, are allocated daily on a pro-rata basis to each class based on the relative net assets of each class to the total net assets of the Fund. Each class differs with respect to transfer agent and distribution and service plan fees incurred. Certain expense reductions may also differ by class. For the reporting period, the allocated portion of income and expenses to each class as a percent of its average net assets may vary due to the timing of recording these transactions in relation to fluctuating net assets of the classes. Expenses directly attributable to a fund are charged to that fund. Expenses attributable to more than one fund are allocated among the respective funds on the basis of relative net assets or other appropriate methods. Expense estimates are accrued in the period to which they relate and adjustments are made when actual amounts are known.
Income Tax Information and Distributions to Shareholders. Each year, the Fund intends to qualify as a regulated investment company under Subchapter M of the Internal Revenue Code, including distributing substantially all of its taxable income and realized gains. As a result, no provision for U.S. Federal income taxes is required. As of July 31, 2020, the Fund did not have any unrecognized tax benefits in the financial statements; nor is the Fund aware of any tax positions for which it is reasonably possible that the total amounts of unrecognized tax benefits will significantly change in the next twelve months. The Fund files a U.S. federal tax return, in addition to state and local tax returns as required. The Fund's federal income tax returns are subject to examination by the Internal Revenue Service (IRS) for a period of three fiscal years after they are filed. State and local tax returns may be subject to examination for an additional fiscal year depending on the jurisdiction. Foreign taxes are provided for based on the Fund's understanding of the tax rules and rates that exist in the foreign markets in which it invests. The Fund is subject to a tax imposed on capital gains by certain countries in which it invests.
Distributions are declared and recorded on the ex-dividend date. Income and capital gain distributions are declared separately for each class. Income and capital gain distributions are determined in accordance with income tax regulations, which may differ from GAAP.
Capital accounts within the financial statements are adjusted for permanent book-tax differences. These adjustments have no impact on net assets or the results of operations. Capital accounts are not adjusted for temporary book-tax differences which will reverse in a subsequent period.
Book-tax differences are primarily due to foreign currency transactions, certain foreign taxes, passive foreign investment companies (PFIC), capital loss carryforwards and losses deferred due to wash sales.
As of period end, the cost and unrealized appreciation (depreciation) in securities, and derivatives if applicable, for federal income tax purposes were as follows:
| Gross unrealized appreciation | $58,932,412 |
| Gross unrealized depreciation | (52,875,222) |
| Net unrealized appreciation (depreciation) | $6,057,190 |
| Tax Cost | $491,267,138 |
The tax-based components of distributable earnings as of period end were as follows:
| Undistributed ordinary income | $9,348,203 |
| Capital loss carryforward | $(20,257,412) |
| Net unrealized appreciation (depreciation) on securities and other investments | $6,122,508 |
Capital loss carryforwards are only available to offset future capital gains of the Fund to the extent provided by regulations and may be limited. The capital loss carryforward information presented below, including any applicable limitation, is estimated as of fiscal period end and is subject to adjustment.
| No expiration | |
| Short-term | $(17,878,629) |
| Long-term | (2,378,783) |
| Total capital loss carryforward | $(20,257,412) |
The tax character of distributions paid was as follows:
| | July 31, 2020 | July 31, 2019 |
| Ordinary Income | $30,291,248 | $ 11,430,699 |
Restricted Securities (including Private Placements). The Fund may invest in securities that are subject to legal or contractual restrictions on resale. These securities generally may be resold in transactions exempt from registration or to the public if the securities are registered. Disposal of these securities may involve time-consuming negotiations and expense, and prompt sale at an acceptable price may be difficult. Information regarding restricted securities is included at the end of the Fund's Schedule of Investments.
4. Purchases and Sales of Investments.
Purchases and sales of securities, other than short-term securities, are noted in the table below.
| | Purchases ($) | Sales ($) |
| Fidelity International Real Estate Fund | 356,732,995 | 422,897,503 |
5. Fees and Other Transactions with Affiliates.
Management Fee. Fidelity Management & Research Company LLC (the investment adviser) and its affiliates provide the Fund with investment management related services for which the Fund pays a monthly management fee. The management fee is the sum of an individual fund fee rate that is based on an annual rate of .45% of the Fund's average net assets and an annualized group fee rate that averaged .23% during the period. The group fee rate is based upon the monthly average net assets of a group of registered investment companies with which the investment adviser has management contracts. The group fee rate decreases as assets under management increase and increases as assets under management decrease. For the reporting period, the total annual management fee rate was .68% of the Fund's average net assets.
Distribution and Service Plan Fees. In accordance with Rule 12b-1 of the 1940 Act, the Fund has adopted separate Distribution and Service Plans for each class of shares. Certain classes pay Fidelity Distributors Company LLC (FDC), an affiliate of the investment adviser, separate Distribution and Service Fees, each of which is based on an annual percentage of each class' average net assets. In addition, FDC may pay financial intermediaries for selling shares of the Fund and providing shareholder support services. For the period, the Distribution and Service Fee rates, total fees and amounts retained by FDC were as follows:
| | Distribution Fee | Service Fee | Total Fees | Retained by FDC |
| Class A | -% | .25% | $30,415 | $966 |
| Class M | .25% | .25% | 17,674 | 16 |
| Class C | .75% | .25% | 40,944 | 2,907 |
| | | | $89,033 | $3,889 |
Sales Load. FDC may receive a front-end sales charge of up to 5.75% for selling Class A shares and 3.50% for selling Class M shares, some of which is paid to financial intermediaries for selling shares of the Fund. Depending on the holding period, FDC may receive contingent deferred sales charges levied on Class A, Class M and Class C redemptions. The deferred sales charges are 1.00% for Class C shares, 1.00% for certain purchases of Class A shares and .25% for certain purchases of Class M shares.
For the period, sales charge amounts retained by FDC were as follows:
| | Retained by FDC |
| Class A | $6,844 |
| Class M | 362 |
| Class C(a) | 251 |
| | $7,457 |
(a) When Class C shares are initially sold, FDC pays commissions from its own resources to financial intermediaries through which the sales are made.
Transfer Agent Fees. Fidelity Investments Institutional Operations Company LLC (FIIOC), an affiliate of the investment adviser, is the transfer, dividend disbursing and shareholder servicing agent for each class of the Fund. FIIOC receives account fees and asset-based fees that vary according to the account size and type of account of the shareholders of the respective classes of the Fund, except for Class Z. FIIOC receives an asset-based fee of Class Z's average net assets. FIIOC pays for typesetting, printing and mailing of shareholder reports, except proxy statements. Effective February 1, 2020, the Board approved to change the fee for Class Z from .046% to .044%.
For the period, transfer agent fees for each class were as follows:
| | Amount | % of Class-Level Average Net Assets |
| Class A | $28,175 | .23 |
| Class M | 10,451 | .30 |
| Class C | 10,063 | .25 |
| International Real Estate | 493,600 | .21 |
| Class I | 219,145 | .14 |
| Class Z | 59,764 | .04 |
| | $821,198 | |
Accounting Fees. Fidelity Service Company, Inc. (FSC), an affiliate of the investment adviser, maintains the Fund's accounting records. The accounting fee is based on the level of average net assets for each month. For the period, the fees were equivalent to the following annual rates:
| | % of Average Net Assets |
| Fidelity International Real Estate Fund | .05 |
Brokerage Commissions. A portion of portfolio transactions were placed with brokerage firms which are affiliates of the investment adviser. Brokerage commissions are included in net realized gain (loss) and change in net unrealized appreciation (depreciation) in the Statement of Operations. The commissions paid to these affiliated firms were as follows:
| | Amount |
| Fidelity International Real Estate Fund | $7 |
Interfund Trades. Funds may purchase from or sell securities to other Fidelity Funds under procedures adopted by the Board. The procedures have been designed to ensure these interfund trades are executed in accordance with Rule 17a-7 of the 1940 Act. Interfund trades are included within the respective purchases and sales amounts shown in the Purchases and Sales of Investments note.
6. Committed Line of Credit.
Certain Funds participate with other funds managed by the investment adviser or an affiliate in a $4.25 billion credit facility (the "line of credit") to be utilized for temporary or emergency purposes to fund shareholder redemptions or for other short-term liquidity purposes. The participating funds have agreed to pay commitment fees on their pro-rata portion of the line of credit, which are reflected in Miscellaneous expenses on the Statement of Operations, and are as follows:
| | Amount |
| Fidelity International Real Estate Fund | $1,344 |
During the period, there were no borrowings on this line of credit.
7. Security Lending.
The Fund lends portfolio securities from time to time in order to earn additional income. Lending agents are used, including National Financial Services (NFS), an affiliate of the Fund. Pursuant to a securities lending agreement, NFS will receive a fee, which is capped at 9.9% of daily lending revenue, for its services as lending agent. The Fund may lend securities to certain qualified borrowers, including NFS. On the settlement date of the loan, the Fund receives collateral (in the form of U.S. Treasury obligations, letters of credit and/or cash) against the loaned securities and maintains collateral in an amount not less than 100% of the market value of the loaned securities during the period of the loan. The market value of the loaned securities is determined at the close of business of the Fund and any additional required collateral is delivered to the Fund on the next business day. The Fund or borrower may terminate the loan at any time, and if the borrower defaults on its obligation to return the securities loaned because of insolvency or other reasons, the Fund may apply collateral received from the borrower against the obligation. The Fund may experience delays and costs in recovering the securities loaned. Any cash collateral received is invested in the Fidelity Securities Lending Cash Central Fund. The value of loaned securities and cash collateral at period end are disclosed on the Fund's Statement of Assets and Liabilities. Security lending income represents the income earned on investing cash collateral, less rebates paid to borrowers and any lending agent fees associated with the loan, plus any premium payments received for lending certain types of securities. Net income from the Fidelity Securities Lending Cash Central Fund during the period is presented in the Statement of Operations as a component of income from Fidelity Central Funds. During the period, there were no securities loaned to NFS.
8. Expense Reductions.
Commissions paid to certain brokers with whom the investment adviser, or its affiliates, places trades on behalf of the Fund include an amount in addition to trade execution, which may be rebated back to the Fund to offset certain expenses. This amount totaled $43,464 for the period. In addition, through arrangements with the Fund's custodian, credits realized as a result of certain uninvested cash balances were used to reduce the Fund's expenses. During the period, custodian credits reduced the Fund's expenses by $170.
In addition, during the period the investment adviser or an affiliate reimbursed and/or waived a portion of fund-level operating expenses in the amount of $2,365.
In addition, during the period the investment adviser or an affiliate reimbursed the Fund $8,350 for an operational error which is included in the accompanying Statement of Operations.
9. Distributions to Shareholders.
Distributions to shareholders of each class were as follows:
| | Year ended
July 31, 2020 | Year ended
July 31, 2019(a) |
| Distributions to shareholders | | |
| Class A | $630,346 | $196,960 |
| Class M | 173,347 | 62,893 |
| Class C | 159,947 | 65,239 |
| International Real Estate | 12,840,614 | 4,435,790 |
| Class I | 7,773,385 | 6,669,817 |
| Class Z | 8,713,609 | – |
| Total | $30,291,248 | $11,430,699 |
(a) Distributions for Class Z are for the period October 2, 2018 (commencement of sale of shares) to July 31, 2019.
10. Share Transactions.
Share transactions for each class were as follows and may contain automatic conversions between classes or exchanges between affiliated funds:
| | Shares | Shares | Dollars | Dollars |
| | Year ended July 31, 2020 | Year ended July 31, 2019(a) | Year ended July 31, 2020 | Year ended July 31, 2019(a) |
| Class A | | | | |
| Shares sold | 272,050 | 472,994 | $3,260,167 | $5,313,193 |
| Reinvestment of distributions | 51,661 | 17,333 | 622,640 | 194,298 |
| Shares redeemed | (360,879) | (428,760) | (4,177,735) | (4,759,683) |
| Net increase (decrease) | (37,168) | 61,567 | $(294,928) | $747,808 |
| Class M | | | | |
| Shares sold | 23,672 | 23,497 | $283,476 | $267,526 |
| Reinvestment of distributions | 14,421 | 5,638 | 172,674 | 62,748 |
| Shares redeemed | (90,418) | (99,377) | (1,029,449) | (1,119,109) |
| Net increase (decrease) | (52,325) | (70,242) | $(573,299) | $(788,835) |
| Class C | | | | |
| Shares sold | 153,011 | 42,567 | $1,862,017 | $479,546 |
| Reinvestment of distributions | 12,184 | 5,468 | 143,640 | 59,927 |
| Shares redeemed | (157,633) | (151,808) | (1,789,640) | (1,704,243) |
| Net increase (decrease) | 7,562 | (103,773) | $216,017 | $(1,164,770) |
| International Real Estate | | | | |
| Shares sold | 4,712,954 | 4,174,499 | $56,389,087 | $48,652,179 |
| Reinvestment of distributions | 991,983 | 370,043 | 12,108,255 | 4,196,287 |
| Shares redeemed | (7,320,623) | (4,817,564) | (84,136,761) | (55,757,179) |
| Net increase (decrease) | (1,615,686) | (273,022) | $(15,639,419) | $(2,908,713) |
| Class I | | | | |
| Shares sold | 5,517,626 | 6,400,193 | $66,706,193 | $72,117,647 |
| Reinvestment of distributions | 601,564 | 224,016 | 7,304,060 | 2,522,420 |
| Shares redeemed | (5,038,927) | (25,306,136) | (55,671,887) | (291,874,610) |
| Net increase (decrease) | 1,080,263 | (18,681,927) | $18,338,366 | $(217,234,543) |
| Class Z | | | | |
| Shares sold | 3,160,230 | 14,322,745 | $36,578,678 | $171,342,506 |
| Reinvestment of distributions | 100,687 | – | 1,220,108 | – |
| Shares redeemed | (6,790,542) | (1,416,787) | (78,581,867) | (17,124,617) |
| Net increase (decrease) | (3,529,625) | 12,905,958 | $(40,783,081) | $154,217,889 |
(a) Share transactions for Class Z are for the period October 2, 2018(commencement of sale of shares) to July 31, 2019
11. Other.
The Fund's organizational documents provide former and current trustees and officers with a limited indemnification against liabilities arising in connection with the performance of their duties to the Fund. In the normal course of business, the Fund may also enter into contracts that provide general indemnifications. The Fund's maximum exposure under these arrangements is unknown as this would be dependent on future claims that may be made against the Fund. The risk of material loss from such claims is considered remote.
At the end of the period, Strategic Advisers Fidelity International Fund was the owner of record of approximately 18% of the total outstanding shares of the Fund.
12. Coronavirus (COVID-19) Pandemic.
An outbreak of COVID-19 first detected in China during December 2019 has since spread globally and was declared a pandemic by the World Health Organization during March 2020. Developments that disrupt global economies and financial markets, such as the COVID-19 pandemic, may magnify factors that affect the Fund's performance.
Report of Independent Registered Public Accounting Firm
To the Board of Trustees of Fidelity Select Portfolios and Shareholders of Fidelity International Real Estate Fund
Opinion on the Financial Statements and Financial Highlights
We have audited the accompanying statement of assets and liabilities of Fidelity International Real Estate Fund (the "Fund"), a fund of Fidelity Select Portfolios, including the schedule of investments, as of July 31, 2020, the related statement of operations for the year then ended, the statement of changes in net assets for each of the two years in the period then ended, the financial highlights for each of the five years in the period then ended, and the related notes. In our opinion, the financial statements and financial highlights present fairly, in all material respects, the financial position of the Fund as of July 31, 2020, and the results of its operations for the year then ended, the changes in its net assets for each of the two years in the period then ended, and the financial highlights for each of the five years in the period then ended in conformity with accounting principles generally accepted in the United States of America.
Basis for Opinion
These financial statements and financial highlights are the responsibility of the Fund's management. Our responsibility is to express an opinion on the Fund's financial statements and financial highlights based on our audits. We are a public accounting firm registered with the Public Company Accounting Oversight Board (United States) (PCAOB) and are required to be independent with respect to the Fund in accordance with the U.S. federal securities laws and the applicable rules and regulations of the Securities and Exchange Commission and the PCAOB.
We conducted our audits in accordance with the standards of the PCAOB. Those standards require that we plan and perform the audit to obtain reasonable assurance about whether the financial statements and financial highlights are free of material misstatement, whether due to error or fraud. The Fund is not required to have, nor were we engaged to perform, an audit of its internal control over financial reporting. As part of our audits we are required to obtain an understanding of internal control over financial reporting but not for the purpose of expressing an opinion on the effectiveness of the Fund’s internal control over financial reporting. Accordingly, we express no such opinion.
Our audits included performing procedures to assess the risks of material misstatement of the financial statements and financial highlights, whether due to error or fraud, and performing procedures that respond to those risks. Such procedures included examining, on a test basis, evidence regarding the amounts and disclosures in the financial statements and financial highlights. Our audits also included evaluating the accounting principles used and significant estimates made by management, as well as evaluating the overall presentation of the financial statements and financial highlights. Our procedures included confirmation of securities owned as of July 31, 2020, by correspondence with the custodian and brokers; when replies were not received from brokers, we performed other auditing procedures. We believe that our audits provide a reasonable basis for our opinion.
/s/ Deloitte & Touche LLP
Boston, Massachusetts
September 14, 2020
We have served as the auditor of one or more of the Fidelity investment companies since 1999.
Trustees and Officers
The Trustees, Members of the Advisory Board (if any), and officers of the trust and fund, as applicable, are listed below. The Board of Trustees governs the fund and is responsible for protecting the interests of shareholders. The Trustees are experienced executives who meet periodically throughout the year to oversee the fund's activities, review contractual arrangements with companies that provide services to the fund, oversee management of the risks associated with such activities and contractual arrangements, and review the fund's performance. Except for Bettina Doulton, each of the Trustees oversees 311 funds. Ms. Doulton oversees 210 funds.
The Trustees hold office without limit in time except that (a) any Trustee may resign; (b) any Trustee may be removed by written instrument, signed by at least two-thirds of the number of Trustees prior to such removal; (c) any Trustee who requests to be retired or who has become incapacitated by illness or injury may be retired by written instrument signed by a majority of the other Trustees; and (d) any Trustee may be removed at any special meeting of shareholders by a two-thirds vote of the outstanding voting securities of the trust. Each Trustee who is not an interested person (as defined in the 1940 Act) of the trust and the fund is referred to herein as an Independent Trustee. Each Independent Trustee shall retire not later than the last day of the calendar year in which his or her 75th birthday occurs. The Independent Trustees may waive this mandatory retirement age policy with respect to individual Trustees. Officers and Advisory Board Members hold office without limit in time, except that any officer or Advisory Board Member may resign or may be removed by a vote of a majority of the Trustees at any regular meeting or any special meeting of the Trustees. Except as indicated, each individual has held the office shown or other offices in the same company for the past five years.
The fund's Statement of Additional Information (SAI) includes more information about the Trustees. To request a free copy, call Fidelity at 1-800-544-8544 if you’re an individual investing directly with Fidelity, call 1-800-835-5092 if you’re a plan sponsor or participant with Fidelity as your recordkeeper or call 1-877-208-0098 on institutional accounts or if you’re an advisor or invest through one.
Experience, Skills, Attributes, and Qualifications of the Trustees. The Governance and Nominating Committee has adopted a statement of policy that describes the experience, qualifications, attributes, and skills that are necessary and desirable for potential Independent Trustee candidates (Statement of Policy). The Board believes that each Trustee satisfied at the time he or she was initially elected or appointed a Trustee, and continues to satisfy, the standards contemplated by the Statement of Policy. The Governance and Nominating Committee also engages professional search firms to help identify potential Independent Trustee candidates who have the experience, qualifications, attributes, and skills consistent with the Statement of Policy. From time to time, additional criteria based on the composition and skills of the current Independent Trustees, as well as experience or skills that may be appropriate in light of future changes to board composition, business conditions, and regulatory or other developments, have also been considered by the professional search firms and the Governance and Nominating Committee. In addition, the Board takes into account the Trustees' commitment and participation in Board and committee meetings, as well as their leadership of standing and ad hoc committees throughout their tenure.
In determining that a particular Trustee was and continues to be qualified to serve as a Trustee, the Board has considered a variety of criteria, none of which, in isolation, was controlling. The Board believes that, collectively, the Trustees have balanced and diverse experience, qualifications, attributes, and skills, which allow the Board to operate effectively in governing the fund and protecting the interests of shareholders. Information about the specific experience, skills, attributes, and qualifications of each Trustee, which in each case led to the Board's conclusion that the Trustee should serve (or continue to serve) as a trustee of the fund, is provided below.
Board Structure and Oversight Function. Robert A. Lawrence is an interested person and currently serves as Acting Chairman. The Trustees have determined that an interested Chairman is appropriate and benefits shareholders because an interested Chairman has a personal and professional stake in the quality and continuity of services provided to the fund. Independent Trustees exercise their informed business judgment to appoint an individual of their choosing to serve as Chairman, regardless of whether the Trustee happens to be independent or a member of management. The Independent Trustees have determined that they can act independently and effectively without having an Independent Trustee serve as Chairman and that a key structural component for assuring that they are in a position to do so is for the Independent Trustees to constitute a substantial majority for the Board. The Independent Trustees also regularly meet in executive session. Ned C. Lautenbach and David M. Thomas serve as Co-Lead Independent Trustees and as such each (i) acts as a liaison between the Independent Trustees and management with respect to matters important to the Independent Trustees and (ii) with management prepares agendas for Board meetings.
Fidelity® funds are overseen by different Boards of Trustees. The fund's Board oversees Fidelity's high income and certain equity funds, and other Boards oversee Fidelity's investment-grade bond, money market, asset allocation, and other equity funds. The asset allocation funds may invest in Fidelity® funds overseen by the fund's Board. The use of separate Boards, each with its own committee structure, allows the Trustees of each group of Fidelity® funds to focus on the unique issues of the funds they oversee, including common research, investment, and operational issues. On occasion, the separate Boards establish joint committees to address issues of overlapping consequences for the Fidelity® funds overseen by each Board.
The Trustees operate using a system of committees to facilitate the timely and efficient consideration of all matters of importance to the Trustees, the fund, and fund shareholders and to facilitate compliance with legal and regulatory requirements and oversight of the fund's activities and associated risks. The Board, acting through its committees, has charged FMR and its affiliates with (i) identifying events or circumstances the occurrence of which could have demonstrably adverse effects on the fund's business and/or reputation; (ii) implementing processes and controls to lessen the possibility that such events or circumstances occur or to mitigate the effects of such events or circumstances if they do occur; and (iii) creating and maintaining a system designed to evaluate continuously business and market conditions in order to facilitate the identification and implementation processes described in (i) and (ii) above. Because the day-to-day operations and activities of the fund are carried out by or through FMR, its affiliates, and other service providers, the fund's exposure to risks is mitigated but not eliminated by the processes overseen by the Trustees. While each of the Board's committees has responsibility for overseeing different aspects of the fund's activities, oversight is exercised primarily through the Operations, Audit, and Compliance Committees. Appropriate personnel, including but not limited to the fund's Chief Compliance Officer (CCO), FMR's internal auditor, the independent accountants, the fund's Treasurer and portfolio management personnel, make periodic reports to the Board's committees, as appropriate, including an annual review of Fidelity's risk management program for the Fidelity® funds. The responsibilities of each standing committee, including their oversight responsibilities, are described further under "Standing Committees of the Trustees."
Interested Trustees*:
Correspondence intended for a Trustee who is an interested person may be sent to Fidelity Investments, 245 Summer Street, Boston, Massachusetts 02210.
Name, Year of Birth; Principal Occupations and Other Relevant Experience+
Bettina Doulton (1964)
Year of Election or Appointment: 2020
Trustee
Ms. Doulton also serves as Trustee of other Fidelity® funds. Prior to her retirement, Ms. Doulton served in a variety of positions at Fidelity Investments, including as a managing director of research (2006-2007), portfolio manager to certain Fidelity® funds (1993-2005), equity analyst and portfolio assistant (1990-1993), and research assistant (1987-1990). Ms. Doulton currently owns and operates Phi Builders + Architects and Cellardoor Winery. Previously, Ms. Doulton served as a member of the Board of Brown Capital Management, LLC (2013-2018).
Robert A. Lawrence (1952)
Year of Election or Appointment: 2020
Trustee
Acting Chairman of the Board of Trustees
Mr. Lawrence also serves as Trustee of other funds. Previously, Mr. Lawrence served as a Member of the Advisory Board of certain funds. Prior to his retirement in 2008, Mr. Lawrence served as Vice President of certain Fidelity® funds (2006-2008), Senior Vice President, Head of High Income Division of Fidelity Management & Research Company (investment adviser firm, 2006-2008), and President of Fidelity Strategic Investments (investment adviser firm, 2002-2005).
* Determined to be an “Interested Trustee” by virtue of, among other things, his or her affiliation with the trust or various entities under common control with FMR.
+ The information includes the Trustee's principal occupation during the last five years and other information relating to the experience, attributes, and skills relevant to the Trustee's qualifications to serve as a Trustee, which led to the conclusion that the Trustee should serve as a Trustee for the fund.
Independent Trustees:
Correspondence intended for an Independent Trustee may be sent to Fidelity Investments, P.O. Box 55235, Boston, Massachusetts 02205-5235.
Name, Year of Birth; Principal Occupations and Other Relevant Experience+
Dennis J. Dirks (1948)
Year of Election or Appointment: 2018
Trustee
Mr. Dirks also serves as Trustee of other Fidelity® funds. Prior to his retirement in May 2003, Mr. Dirks served as Chief Operating Officer and as a member of the Board of The Depository Trust & Clearing Corporation (financial markets infrastructure), President, Chief Operating Officer and a member of the Board of The Depository Trust Company (DTC), President and a member of the Board of the National Securities Clearing Corporation (NSCC), Chief Executive Officer and a member of the Board of the Government Securities Clearing Corporation and Chief Executive Officer and a member of the Board of the Mortgage-Backed Securities Clearing Corporation. Mr. Dirks currently serves as a member of the Finance Committee (2016-present) and Board (2017-present) and is Treasurer (2018-present) of the Asolo Repertory Theatre.
Donald F. Donahue (1950)
Year of Election or Appointment: 2018
Trustee
Mr. Donahue also serves as Trustee of other Fidelity® funds. Mr. Donahue serves as President and Chief Executive Officer of Miranda Partners, LLC (risk consulting for the financial services industry, 2012-present). Previously, Mr. Donahue served as Chief Executive Officer (2006-2012), Chief Operating Officer (2003-2006) and Managing Director, Customer Marketing and Development (1999-2003) of The Depository Trust & Clearing Corporation (financial markets infrastructure). Mr. Donahue currently serves as a member (2007-present) and Co-Chairman (2016-present) of the Board of United Way of New York, a member of the Board of NYC Leadership Academy (2012-present) and a member of the Board of Advisors of Ripple Labs, Inc. (financial services, 2015-present). Mr. Donahue previously served as a member of the Advisory Board of certain Fidelity® funds (2015-2018).
Vicki L. Fuller (1957)
Year of Election or Appointment: 2020
Trustee
Ms. Fuller also serves as Trustee of other Fidelity® funds. Previously, Ms. Fuller served as a member of the Advisory Board of certain Fidelity® funds (2018-2020), Chief Investment Officer of the New York State Common Retirement Fund (2012-2018) and held a variety of positions at AllianceBernstein L.P. (global asset management, 1985-2012), including Managing Director (2006-2012) and Senior Vice President and Senior Portfolio Manager (2001-2006). Ms. Fuller currently serves as a member of the Board, Audit Committee and Nominating and Governance Committee of The Williams Companies, Inc. (natural gas infrastructure, 2018-present) and as a member of the Board of Treliant, LLC (consulting, 2019-present).
Patricia L. Kampling (1959)
Year of Election or Appointment: 2020
Trustee
Ms. Kampling also serves as Trustee of other Fidelity® funds. Prior to her retirement, Ms. Kampling served as Chairman of the Board and Chief Executive Officer (2012-2019), President and Chief Operating Officer (2011-2012) and Executive Vice President and Chief Financial Officer (2010-2011) of Alliant Energy Corporation. Ms. Kampling currently serves as a member of the Board, Compensation Committee and Executive Committee and as Chair of the Audit Committee of Briggs & Stratton Corporation (manufacturing, 2011-present) and as a member of the Board, Audit, Finance and Risk Committee and Safety, Environmental, Technology and Operations Committee of American Water Works Company, Inc. (utilities company, 2019-present). In addition, Ms. Kampling currently serves as a member of the Board of the Nature Conservancy, Wisconsin Chapter (2019-present). Previously, Ms. Kampling served as a Member of the Advisory Board of certain Fidelity® funds (2020), a member of the Board of Interstate Power and Light Company (2012-2019) and Wisconsin Power and Light Company (2012-2019) (each a subsidiary of Alliant Energy Corporation) and as a member of the Board and Workforce Development Committee of the Business Roundtable (2018-2019).
Alan J. Lacy (1953)
Year of Election or Appointment: 2018
Trustee
Mr. Lacy also serves as Trustee of other Fidelity® funds. Previously, Mr. Lacy served as Senior Adviser (2007-2014) of Oak Hill Capital Partners, L.P. (private equity), Chief Executive Officer (2005) and Vice Chairman (2005-2006) of Sears Holdings Corporation (retail), Chief Executive Officer and Chairman of the Board of Sears, Roebuck and Co. (retail, 2000-2005), Chairman (2014-2017) and a member of the Board (2010-2017) of Dave & Buster’s Entertainment, Inc. (restaurant and entertainment complexes) and a member of the Board of Bristol-Myers Squibb Company (global pharmaceuticals, 2008-2020). Mr. Lacy currently serves as a Trustee of the California Chapter of The Nature Conservancy (2015-present) and a member of the Board of the Center for Advanced Study in the Behavioral Sciences at Stanford University (2015-present).
Ned C. Lautenbach (1944)
Year of Election or Appointment: 2018
Trustee
Co-Lead Independent Trustee
Mr. Lautenbach also serves as Trustee of other Fidelity® funds. Mr. Lautenbach currently serves as Chair of the Board of Governors, State University System of Florida (2013-present) and is a member of the Council on Foreign Relations (1994-present). He is also a member and has in the past served as Chairman of the Board of Directors of Artis-Naples (2012-present). Previously, Mr. Lautenbach served as a member and then Lead Director of the Board of Directors of Eaton Corporation (diversified industrial, 1997-2016). He was also a Partner at Clayton, Dubilier & Rice, LLC (private equity investment, 1998-2010); as well as Director of Sony Corporation (2006-2007). In addition, Mr. Lautenbach had a 30-year career with IBM (technology company), during which time he served as Senior Vice President and as a member of the Corporate Executive Committee (1968-1998).
Joseph Mauriello (1944)
Year of Election or Appointment: 2018
Trustee
Mr. Mauriello also serves as Trustee of other Fidelity® funds. Prior to his retirement in January 2006, Mr. Mauriello served in numerous senior management positions including Deputy Chairman and Chief Operating Officer (2004-2005), and Vice Chairman of Financial Services (2002-2004) of KPMG LLP US (professional services, 1965-2005). Mr. Mauriello currently serves as a member of the Independent Directors Council Governing Council (2015-present). Previously, Mr. Mauriello served as a member of the Board of XL Group plc. (global insurance and re-insurance, 2006-2018).
Cornelia M. Small (1944)
Year of Election or Appointment: 2018
Trustee
Ms. Small also serves as Trustee of other Fidelity® funds. Previously, Ms. Small served as Chief Investment Officer, Director of Global Equity Investments and a member of Scudder, Stevens & Clark and Scudder Kemper Investments. Ms. Small previously served as a member of the Board (2009-2019) and Chair of the Investment Committee (2010-2019) of the Teagle Foundation and a member of the Investment Committee of the Berkshire Taconic Community Foundation (2008-2019).
Garnett A. Smith (1947)
Year of Election or Appointment: 2013
Trustee
Mr. Smith also serves as Trustee of other Fidelity® funds. Prior to his retirement, Mr. Smith served as Chairman and Chief Executive Officer (1990-1997) and President (1986-1990) of Inbrand Corp. (manufacturer of personal absorbent products). Prior to his employment with Inbrand Corp., he was employed by a retail fabric chain and North Carolina National Bank (now Bank of America). Mr. Smith previously served as a member of the Advisory Board of certain Fidelity® funds (2012-2013).
David M. Thomas (1949)
Year of Election or Appointment: 2018
Trustee
Co-Lead Independent Trustee
Mr. Thomas also serves as Trustee of other Fidelity® funds. Previously, Mr. Thomas served as Executive Chairman (2005-2006) and Chairman and Chief Executive Officer (2000-2005) of IMS Health, Inc. (pharmaceutical and healthcare information solutions). Mr. Thomas currently serves as Non-Executive Chairman of the Board of Fortune Brands Home and Security (home and security products, 2011-present), and a member of the Board (2004-present) and Presiding Director (2013-present) of Interpublic Group of Companies, Inc. (marketing communication).
Susan Tomasky (1953)
Year of Election or Appointment: 2020
Trustee
Ms. Tomasky also serves as Trustee of other Fidelity® funds. Prior to her retirement, Ms. Tomasky served in various executive officer positions at American Electric Power Company, Inc. (1998-2011), including most recently as President of AEP Transmission (2007-2011). Ms. Tomasky currently serves as a member of the Board and Sustainability Committee and as Chair of the Audit Committee of Marathon Petroleum Corporation (2018-present) and as a member of the Board, Corporate Governance Committee and Organization and Compensation Committee and as Chair of the Audit Committee of Public Service Enterprise Group, Inc. (utilities company, 2012-present). In addition, Ms. Tomasky currently serves as a member of the Board of the Columbus Regional Airport Authority (2007-present), as a member of the Board of the Royal Shakespeare Company – America (2009-present), as a member of the Board of the Columbus Association for the Performing Arts (2011-present) and as a member of the Board of Kenyon College (2016-present). Previously, Ms. Tomasky served as a Member of the Advisory Board of certain Fidelity® funds (2020), a member of the Board (2011-2019) and as Lead Independent Director (2015-2018) of Andeavor Corporation (previously Tesoro Corporation) (independent oil refiner and marketer) and as a member of the Board of Summit Midstream Partners LP (energy, 2012-2018).
Michael E. Wiley (1950)
Year of Election or Appointment: 2008
Trustee
Mr. Wiley also serves as Trustee of other Fidelity® funds. Previously, Mr. Wiley served as a member of the Advisory Board of certain Fidelity® funds (2018-2020), Chairman, President and CEO of Baker Hughes, Inc. (oilfield services, 2000-2004). Mr. Wiley also previously served as a member of the Board of Andeavor Corporation (independent oil refiner and marketer, 2005-2018), a member of the Board of Andeavor Logistics LP (natural resources logistics, 2015-2018) and a member of the Board of High Point Resources (exploration and production, 2005-2020).
+ The information includes the Trustee's principal occupation during the last five years and other information relating to the experience, attributes, and skills relevant to the Trustee's qualifications to serve as a Trustee, which led to the conclusion that the Trustee should serve as a Trustee for the fund.
Advisory Board Members and Officers:
Correspondence intended for a Member of the Advisory Board (if any) may be sent to Fidelity Investments, P.O. Box 55235, Boston, Massachusetts 02205-5235. Correspondence intended for an officer or Peter S. Lynch may be sent to Fidelity Investments, 245 Summer Street, Boston, Massachusetts 02210. Officers appear below in alphabetical order.
Name, Year of Birth; Principal Occupation
Peter S. Lynch (1944)
Year of Election or Appointment: 2018
Member of the Advisory Board
Mr. Lynch also serves as a Member of the Advisory Board of other Fidelity® funds. Mr. Lynch is Vice Chairman and a Director of Fidelity Management & Research Company LLC (investment adviser firm). In addition, Mr. Lynch serves as a Trustee of Boston College and as the Chairman of the Inner-City Scholarship Fund. Previously, Mr. Lynch served as Vice Chairman and a Director of FMR Co., Inc. (investment adviser firm) and on the Special Olympics International Board of Directors (1997-2006).
Elizabeth Paige Baumann (1968)
Year of Election or Appointment: 2017
Anti-Money Laundering (AML) Officer
Ms. Baumann also serves as AML Officer of other funds. She is Chief AML Officer (2012-present) and Senior Vice President (2014-present) of FMR LLC (diversified financial services company) and is an employee of Fidelity Investments. Previously, Ms. Baumann served as AML Officer of certain funds (2017-2019), as AML Officer of the funds (2012-2016), and Vice President (2007-2014) and Deputy Anti-Money Laundering Officer (2007-2012) of FMR LLC.
Craig S. Brown (1977)
Year of Election or Appointment: 2019
Assistant Treasurer
Mr. Brown also serves as Assistant Treasurer of other funds. Mr. Brown is an employee of Fidelity Investments (2013-present).
John J. Burke III (1964)
Year of Election or Appointment: 2018
Chief Financial Officer
Mr. Burke also serves as Chief Financial Officer of other funds. Mr. Burke serves as Head of Investment Operations for Fidelity Fund and Investment Operations (2018-present) and is an employee of Fidelity Investments (1998-present). Previously Mr. Burke served as head of Asset Management Investment Operations (2012-2018).
William C. Coffey (1969)
Year of Election or Appointment: 2019
Assistant Secretary
Mr. Coffey also serves as Assistant Secretary of other funds. He is Senior Vice President and Deputy General Counsel of FMR LLC (diversified financial services company, 2010-present), and is an employee of Fidelity Investments. Previously, Mr. Coffey served as Secretary and CLO of certain funds (2018-2019); CLO, Secretary, and Senior Vice President of Fidelity Management & Research Company and FMR Co., Inc. (investment adviser firms, 2018-2019); Secretary of Fidelity SelectCo, LLC and Fidelity Investments Money Management, Inc. (investment adviser firms, 2018-2019); CLO of Fidelity Management & Research (Hong Kong) Limited, FMR Investment Management (UK) Limited, and Fidelity Management & Research (Japan) Limited (investment adviser firms, 2018-2019); and Assistant Secretary of certain funds (2009-2018).
Timothy M. Cohen (1969)
Year of Election or Appointment: 2018
Vice President
Mr. Cohen also serves as Vice President of other funds. Mr. Cohen serves as Co-Head of Equity (2018-present), a Director of Fidelity Management & Research (Japan) Limited (investment adviser firm, 2016-present), and is an employee of Fidelity Investments. Previously, Mr. Cohen served as Executive Vice President of Fidelity SelectCo, LLC (2019), Head of Global Equity Research (2016-2018), Chief Investment Officer - Equity and a Director of Fidelity Management & Research (U.K.) Inc. (investment adviser firm, 2013-2015) and as a Director of Fidelity Management & Research (Hong Kong) Limited (investment adviser firm, 2017).
Jonathan Davis (1968)
Year of Election or Appointment: 2010
Assistant Treasurer
Mr. Davis also serves as Assistant Treasurer of other funds. Mr. Davis serves as Assistant Treasurer of FMR Capital, Inc. (2017-present) and is an employee of Fidelity Investments. Previously, Mr. Davis served as Vice President and Associate General Counsel of FMR LLC (diversified financial services company, 2003-2010).
Laura M. Del Prato (1964)
Year of Election or Appointment: 2018
Assistant Treasurer
Ms. Del Prato also serves as an officer of other funds. Ms. Del Prato is an employee of Fidelity Investments (2017-present). Previously, Ms. Del Prato served as President and Treasurer of The North Carolina Capital Management Trust: Cash Portfolio and Term Portfolio (2018-2020). Prior to joining Fidelity Investments, Ms. Del Prato served as a Managing Director and Treasurer of the JPMorgan Mutual Funds (2014-2017). Prior to JPMorgan, Ms. Del Prato served as a partner at Cohen Fund Audit Services (accounting firm, 2012-2013) and KPMG LLP (accounting firm, 2004-2012).
Colm A. Hogan (1973)
Year of Election or Appointment: 2020
Assistant Treasurer
Mr. Hogan also serves as an officer of other funds. Mr. Hogan serves as Assistant Treasurer of FMR Capital, Inc. (2017-present) and is an employee of Fidelity Investments (2005-present). Previously, Mr. Hogan served as Deputy Treasurer of certain Fidelity® funds (2016-2020) and Assistant Treasurer of certain Fidelity® funds (2016-2018).
Pamela R. Holding (1964)
Year of Election or Appointment: 2018
Vice President
Ms. Holding also serves as Vice President of other funds. Ms. Holding serves as Co-Head of Equity (2018-present) and is an employee of Fidelity Investments (2013-present). Previously, Ms. Holding served as Executive Vice President of Fidelity SelectCo, LLC (2019) and as Chief Investment Officer of Fidelity Institutional Asset Management (2013-2018).
Cynthia Lo Bessette (1969)
Year of Election or Appointment: 2019
Secretary and Chief Legal Officer (CLO)
Ms. Lo Bessette also serves as an officer of other funds. Ms. Lo Bessette serves as CLO, Secretary, and Senior Vice President of Fidelity Management & Research Company LLC (investment adviser firm, 2019-present); and CLO of Fidelity Management & Research (Hong Kong) Limited, FMR Investment Management (UK) Limited, and Fidelity Management & Research (Japan) Limited (investment adviser firms, 2019-present). She is a Senior Vice President and Deputy General Counsel of FMR LLC (diversified financial services company, 2019-present), and is an employee of Fidelity Investments. Previously, Ms. Lo Bessette served as CLO, Secretary, and Senior Vice President of FMR Co., Inc. (investment adviser firm, 2019); Secretary of Fidelity SelectCo, LLC and Fidelity Investments Money Management, Inc. (investment adviser firms, 2019). Prior to joining Fidelity Investments, Ms. Lo Bessette was Executive Vice President, General Counsel (2016-2019) and Senior Vice President, Deputy General Counsel (2015-2016) of OppenheimerFunds (investment management company) and Deputy Chief Legal Officer (2013-2015) of Jennison Associates LLC (investment adviser firm).
Chris Maher (1972)
Year of Election or Appointment: 2020
Deputy Treasurer
Mr. Maher also serves as an officer of other funds. Mr. Maher serves as Assistant Treasurer of FMR Capital, Inc. (2017-present), and is an employee of Fidelity Investments (2008-present). Previously, Mr. Maher served as Assistant Treasurer of certain funds (2013-2020); Vice President of Asset Management Compliance (2013), Vice President of the Program Management Group of FMR (investment adviser firm, 2010-2013), and Vice President of Valuation Oversight (2008-2010).
Jason P. Pogorelec (1975)
Year of Election or Appointment: 2020
Chief Compliance Officer
Mr. Pogorelec also serves as Chief Compliance Officer of other funds. Mr. Pogorelec is a senior Vice President of Asset Management Compliance for Fidelity Investments and is an employee of Fidelity Investments (2006-present). Previously, Mr. Pogorelec served as Vice President, Associate General Counsel for Fidelity Investments (2010-2020) and Assistant Secretary of certain Fidelity funds (2015-2020).
Stacie M. Smith (1974)
Year of Election or Appointment: 2018
President and Treasurer
Ms. Smith also serves as an officer of other funds. Ms. Smith serves as Assistant Treasurer of FMR Capital, Inc. (2017-present), is an employee of Fidelity Investments (2009-present), and has served in other fund officer roles. Prior to joining Fidelity Investments, Ms. Smith served as Senior Audit Manager of Ernst & Young LLP (accounting firm, 1996-2009). Previously, Ms. Smith served as Assistant Treasurer (2013-2019) and Deputy Treasurer (2013-2016) of certain Fidelity® funds.
Marc L. Spector (1972)
Year of Election or Appointment: 2017
Assistant Treasurer
Mr. Spector also serves as an officer of other funds. Mr. Spector serves as Assistant Treasurer of FMR Capital, Inc. (2017-present) and is an employee of Fidelity Investments (2016-present). Prior to joining Fidelity Investments, Mr. Spector served as Director at the Siegfried Group (accounting firm, 2013-2016), and prior to Siegfried Group as audit senior manager at Deloitte & Touche LLP (accounting firm, 2005-2013).
Jim Wegmann (1979)
Year of Election or Appointment: 2019
Assistant Treasurer
Mr. Wegmann also serves as Assistant Treasurer of other funds. Mr. Wegmann is an employee of Fidelity Investments (2011-present).
Shareholder Expense Example
As a shareholder, you incur two types of costs: (1) transaction costs, which may include sales charges (loads) on purchase payments or redemption proceeds, as applicable and (2) ongoing costs, which generally include management fees, distribution and/or service (12b-1) fees and other Fund expenses. This Example is intended to help you understand your ongoing costs (in dollars) of investing in a fund and to compare these costs with the ongoing costs of investing in other mutual funds.
The Example is based on an investment of $1,000 invested at the beginning of the period and held for the entire period (February 1, 2020 to July 31, 2020).
Actual Expenses
The first line of the accompanying table provides information about actual account values and actual expenses. You may use the information in this line, together with the amount you invested, to estimate the expenses that you paid over the period. Simply divide your account value by $1,000.00 (for example, an $8,600 account value divided by $1,000.00 = 8.6), then multiply the result by the number in the first line for a class/Fund under the heading entitled "Expenses Paid During Period" to estimate the expenses you paid on your account during this period. If any fund is a shareholder of any underlying mutual funds or exchange-traded funds (ETFs) (the Underlying Funds), such fund indirectly bears its proportional share of the expenses of the Underlying Funds in addition to the direct expenses incurred presented in the table. These fees and expenses are not included in the annualized expense ratio used to calculate the expense estimate in the table below.
Hypothetical Example for Comparison Purposes
The second line of the accompanying table provides information about hypothetical account values and hypothetical expenses based on the actual expense ratio and an assumed rate of return of 5% per year before expenses, which is not the actual return. The hypothetical account values and expenses may not be used to estimate the actual ending account balance or expenses you paid for the period. You may use this information to compare the ongoing costs of investing in the Fund and other funds. To do so, compare this 5% hypothetical example with the 5% hypothetical examples that appear in the shareholder reports of the other funds. If any fund is a shareholder of any Underlying Funds, such fund indirectly bears its proportional share of the expenses of the Underlying Funds in addition to the direct expenses as presented in the table. These fees and expenses are not included in the annualized expense ratio used to calculate the expense estimate in the table below.
Please note that the expenses shown in the table are meant to highlight your ongoing costs only and do not reflect any transaction costs. Therefore, the second line of the table is useful in comparing ongoing costs only, and will not help you determine the relative total costs of owning different funds. In addition, if these transactional costs were included, your costs would have been higher.
| | Annualized Expense Ratio-A | Beginning
Account Value
February 1, 2020 | Ending
Account Value
July 31, 2020 | Expenses Paid
During Period-B
February 1, 2020
to July 31, 2020 |
| Fidelity International Real Estate Fund | | | | |
| Class A | 1.28% | | | |
| Actual | | $1,000.00 | $909.40 | $6.08 |
| Hypothetical-C | | $1,000.00 | $1,018.50 | $6.42 |
| Class M | 1.58% | | | |
| Actual | | $1,000.00 | $908.00 | $7.50 |
| Hypothetical-C | | $1,000.00 | $1,017.01 | $7.92 |
| Class C | 2.08% | | | |
| Actual | | $1,000.00 | $905.00 | $9.85 |
| Hypothetical-C | | $1,000.00 | $1,014.52 | $10.42 |
| International Real Estate | 1.02% | | | |
| Actual | | $1,000.00 | $910.50 | $4.85 |
| Hypothetical-C | | $1,000.00 | $1,019.79 | $5.12 |
| Class I | .94% | | | |
| Actual | | $1,000.00 | $910.70 | $4.47 |
| Hypothetical-C | | $1,000.00 | $1,020.19 | $4.72 |
| Class Z | .84% | | | |
| Actual | | $1,000.00 | $911.30 | $3.99 |
| Hypothetical-C | | $1,000.00 | $1,020.69 | $4.22 |
A Annualized expense ratio reflects expenses net of applicable fee waivers.
B Expenses are equal to the annualized expense ratio, multiplied by the average account value over the period, multiplied by 182/ 366 (to reflect the one-half year period). The fees and expenses of any Underlying Funds are not included in each annualized expense ratio.
C 5% return per year before expenses
Distributions (Unaudited)
Class A designates 34% and 24%; Class M designates 37% and 27%; Class C designates 43% and 30%; International Real Estate designates 32% and 22%; Class I designates 32% and 22% and Class Z designates 31% and 21%; of the dividends distributed in September and December, respectively during the fiscal year as amounts which may be taken into account as a dividend for purposes of the maximum rate under section 1(h)(11) of the Internal Revenue Code.
Class A, Class M, Class C, International Real Estate, Class I, and Class Z designates 1% and 2% of the dividends distributed in September and December respectively during the fiscal year as a section 199A dividend.
The amounts per share which represent income derived from sources within, and taxes paid to, foreign countries or possessions of the United States are as follows:
| | Pay Date | Income | Taxes |
| Fidelity International Real Estate Fund | | | |
| Class A | 09/16/19 | $0.3001 | $0.0293 |
| | 12/16/19 | $0.0734 | $0.0073 |
| Class M | 09/16/19 | $0.2735 | $0.0293 |
| | 12/16/19 | $0.0670 | $0.0073 |
| Class C | 09/16/19 | $0.2375 | $0.0293 |
| | 12/16/19 | $0.0584 | $0.0073 |
| International Real Estate | 09/16/19 | $0.3193 | $0.0293 |
| | 12/16/19 | $0.0799 | $0.0073 |
| Class I | 09/16/19 | $0.3181 | $0.0293 |
| | 12/16/19 | $0.0812 | $0.0073 |
| Class Z | 09/16/19 | $0.3361 | $0.0293 |
| | 12/16/19 | $0.0834 | $0.0073 |
|
The fund will notify shareholders in January 2021 of amounts for use in preparing 2020 income tax returns.
Liquidity Risk Management Program
The Securities and Exchange Commission adopted Rule 22e-4 under the Investment Company Act of 1940 (the Liquidity Rule) to promote effective liquidity risk management throughout the open-end investment company industry, thereby reducing the risk that funds will be unable to meet their redemption obligations and mitigating dilution of the interests of fund shareholders.
The Fund has adopted and implemented a liquidity risk management program pursuant to the Liquidity Rule (the Program) effective December 1, 2018. The Program is reasonably designed to assess and manage the Fund’s liquidity risk and to comply with the requirements of the Liquidity Rule. The Fund’s Board of Trustees (the Board) has designated the Fund’s investment adviser as administrator of the Program. The Fidelity advisers have established a Liquidity Risk Management Committee (the LRM Committee) to manage the Program for each of the Fidelity Funds. The LRM Committee monitors the adequacy and effectiveness of implementation of the Program and on a periodic basis assesses each Fund’s liquidity risk based on a variety of factors including (1) the Fund’s investment strategy, (2) portfolio liquidity and cash flow projections during normal and reasonably foreseeable stressed conditions, (3) shareholder redemptions, (4) borrowings and other funding sources and (5) in the case of exchange-traded funds, certain additional factors including the effect of the Fund’s prices and spreads, market participants, and basket compositions on the overall liquidity of the Fund’s portfolio, as applicable.
In accordance with the Program, each of the Fund’s portfolio investments is classified into one of four liquidity categories described below based on a determination of a reasonable expectation for how long it would take to convert the investment to cash (or sell or dispose of the investment) without significantly changing its market value.
- Highly liquid investments – cash or convertible to cash within three business days or less
- Moderately liquid investments – convertible to cash in three to seven calendar days
- Less liquid investments – can be sold or disposed of, but not settled, within seven calendar days
- Illiquid investments – cannot be sold or disposed of within seven calendar days
Liquidity classification determinations take into account a variety of factors including various market, trading and investment-specific considerations, as well as market depth, and generally utilize analysis from a third-party liquidity metrics service.
The Liquidity Rule places a 15% limit on a fund’s illiquid investments and requires funds that do not primarily hold assets that are highly liquid investments to determine and maintain a minimum percentage of the fund’s net assets to be invested in highly liquid investments (highly liquid investment minimum or HLIM). The Program includes provisions reasonably designed to comply with the 15% limit on illiquid investments and for determining, periodically reviewing and complying with the HLIM requirement as applicable.
At a recent meeting of the Fund’s Board of Trustees, the LRM Committee provided a written report to the Board pertaining to the operation, adequacy, and effectiveness of implementation of the Program for the annual period from December 1, 2018 through November 30, 2019. The report concluded that the Program has been implemented and is operating effectively and is reasonably designed to assess and manage the Fund’s liquidity risk.
Proxy Voting Results
A special meeting of shareholders was held on June 9, 2020. The results of votes taken among shareholders on the proposal before them are reported below. Each vote reported represents one dollar of net asset value held on the record date for the meeting.
PROPOSAL 1
To elect a Board of Trustees.
| | # of
Votes | % of
Votes |
| Dennis J. Dirks |
| Affirmative | 32,463,705,305.665 | 92.437 |
| Withheld | 2,655,951,104.308 | 7.563 |
| TOTAL | 35,119,656,409.973 | 100.000 |
| Donald F. Donahue |
| Affirmative | 32,446,843,861.354 | 92.389 |
| Withheld | 2,672,812,548.619 | 7.611 |
| TOTAL | 35,119,656,409.973 | 100.000 |
| Bettina Doulton |
| Affirmative | 32,610,463,757.584 | 92.855 |
| Withheld | 2,509,192,652.389 | 7.145 |
| TOTAL | 35,119,656,409.973 | 100.000 |
| Vicki L. Fuller |
| Affirmative | 32,688,213,522.720 | 93.077 |
| Withheld | 2,431,442,887.253 | 6.923 |
| TOTAL | 35,119,656,409.973 | 100.000 |
| Patricia L. Kampling |
| Affirmative | 32,313,755,598.535 | 92.010 |
| Withheld | 2,805,900,811.438 | 7.990 |
| TOTAL | 35,119,656,409.973 | 100.000 |
| Alan J. Lacy |
| Affirmative | 31,990,158,754.948 | 91.089 |
| Withheld | 3,129,497,655.026 | 8.911 |
| TOTAL | 35,119,656,409.973 | 100.000 |
| Ned C. Lautenbach |
| Affirmative | 32,043,019,991.143 | 91.240 |
| Withheld | 3,076,636,418.830 | 8.760 |
| TOTAL | 35,119,656,409.973 | 100.000 |
| Robert A. Lawrence |
| Affirmative | 32,150,842,398.009 | 91.547 |
| Withheld | 2,968,814,011.965 | 8.453 |
| TOTAL | 35,119,656,409.973 | 100.000 |
| Joseph Mauriello |
| Affirmative | 32,082,201,213.166 | 91.351 |
| Withheld | 3,037,455,196.807 | 8.649 |
| TOTAL | 35,119,656,409.973 | 100.000 |
| Cornelia M. Small |
| Affirmative | 32,207,976,835.934 | 91.709 |
| Withheld | 2,911,679,574.039 | 8.291 |
| TOTAL | 35,119,656,409.973 | 100.000 |
| Garnett A. Smith |
| Affirmative | 32,102,654,343.096 | 91.409 |
| Withheld | 3,017,002,066.877 | 8.591 |
| TOTAL | 35,119,656,409.973 | 100.000 |
| David M. Thomas |
| Affirmative | 32,150,749,424.556 | 91.546 |
| Withheld | 2,968,906,985.418 | 8.454 |
| TOTAL | 35,119,656,409.973 | 100.000 |
| Susan Tomasky |
| Affirmative | 32,381,933,484.515 | 92.205 |
| Withheld | 2,737,722,925.459 | 7.795 |
| TOTAL | 35,119,656,409.973 | 100.000 |
| Michael E. Wiley |
| Affirmative | 32,135,064,741.973 | 91.502 |
| Withheld | 2,984,591,668.000 | 8.498 |
| TOTAL | 35,119,656,409.973 | 100.000 |
|
| Proposal 1 reflects trust wide proposal and voting results. |
IRE-ANN-0920
1.801328.115
Fidelity® Real Estate Investment Portfolio
Annual Report
July 31, 2020
See the inside front cover for important information about access to your fund’s shareholder reports.
Beginning on January 1, 2021, as permitted by regulations adopted by the Securities and Exchange Commission, paper copies of a fund’s shareholder reports will no longer be sent by mail, unless you specifically request paper copies of the reports from the fund or from your financial intermediary, such as a financial advisor, broker-dealer or bank. Instead, the reports will be made available on a website, and you will be notified by mail each time a report is posted and provided with a website link to access the report.
If you already elected to receive shareholder reports electronically, you will not be affected by this change and you need not take any action. You may elect to receive shareholder reports and other communications from a fund electronically, by contacting your financial intermediary. For Fidelity customers, visit Fidelity's web site or call Fidelity using the contact information listed below.
You may elect to receive all future reports in paper free of charge. If you wish to continue receiving paper copies of your shareholder reports, you may contact your financial intermediary or, if you are a Fidelity customer, visit Fidelity’s website, or call Fidelity at the applicable toll-free number listed below. Your election to receive reports in paper will apply to all funds held with the fund complex/your financial intermediary.
| Account Type | Website | Phone Number |
| Brokerage, Mutual Fund, or Annuity Contracts: | fidelity.com/mailpreferences | 1-800-343-3548 |
| Employer Provided Retirement Accounts: | netbenefits.fidelity.com/preferences (choose 'no' under Required Disclosures to continue to print) | 1-800-343-0860 |
| Advisor Sold Accounts Serviced Through Your Financial Intermediary: | Contact Your Financial Intermediary | Your Financial Intermediary's phone number |
| Advisor Sold Accounts Serviced by Fidelity: | institutional.fidelity.com | 1-877-208-0098 |
Contents
To view a fund's proxy voting guidelines and proxy voting record for the 12-month period ended June 30, visit http://www.fidelity.com/proxyvotingresults or visit the Securities and Exchange Commission's (SEC) web site at http://www.sec.gov.
You may also call 1-800-544-8544 to request a free copy of the proxy voting guidelines.
Standard & Poor's, S&P and S&P 500 are registered service marks of The McGraw-Hill Companies, Inc. and have been licensed for use by Fidelity Distributors Corporation.
Other third-party marks appearing herein are the property of their respective owners.
All other marks appearing herein are registered or unregistered trademarks or service marks of FMR LLC or an affiliated company. © 2020 FMR LLC. All rights reserved.
This report and the financial statements contained herein are submitted for the general information of the shareholders of the Fund. This report is not authorized for distribution to prospective investors in the Fund unless preceded or accompanied by an effective prospectus.
A fund files its complete schedule of portfolio holdings with the SEC for the first and third quarters of each fiscal year on Form N-PORT. Forms N-PORT are available on the SEC’s web site at http://www.sec.gov. A fund's Forms N-PORT may be reviewed and copied at the SEC’s Public Reference Room in Washington, DC. Information regarding the operation of the SEC's Public Reference Room may be obtained by calling 1-800-SEC-0330.
For a complete list of a fund's portfolio holdings, view the most recent holdings listing, semiannual report, or annual report on Fidelity's web site at http://www.fidelity.com, http://www.institutional.fidelity.com, or http://www.401k.com, as applicable.
NOT FDIC INSURED •MAY LOSE VALUE •NO BANK GUARANTEE
Neither the Fund nor Fidelity Distributors Corporation is a bank.
Note to Shareholders:
Early in 2020, the outbreak and spread of a new coronavirus emerged as a public health emergency that had a major influence on financial markets, primarily based on its impact on the global economy and the outlook for corporate earnings. The virus causes a respiratory disease known as COVID-19. On March 11, the World Health Organization declared the COVID-19 outbreak a pandemic, citing sustained risk of further global spread.
In the weeks following, as the crisis worsened, we witnessed an escalating human tragedy with wide-scale social and economic consequences from coronavirus-containment measures. The outbreak of COVID-19 prompted a number of measures to limit the spread, including travel and border restrictions, quarantines, and restrictions on large gatherings. In turn, these resulted in lower consumer activity, diminished demand for a wide range of products and services, disruption in manufacturing and supply chains, and – given the wide variability in outcomes regarding the outbreak – significant market uncertainty and volatility. Amid the turmoil, the U.S. government took unprecedented action – in concert with the U.S. Federal Reserve and central banks around the world – to help support consumers, businesses, and the broader economy, and to limit disruption to the financial system.
The situation continues to unfold, and the extent and duration of its impact on financial markets and the economy remain highly uncertain. Extreme events such as the coronavirus crisis are “exogenous shocks” that can have significant adverse effects on mutual funds and their investments. Although multiple asset classes may be affected by market disruption, the duration and impact may not be the same for all types of assets.
Fidelity is committed to helping you stay informed amid news about COVID-19 and during increased market volatility, and we’re taking extra steps to be responsive to customer needs. We encourage you to visit our websites, where we offer ongoing updates, commentary, and analysis on the markets and our funds.
Performance: The Bottom Line
Average annual total return reflects the change in the value of an investment, assuming reinvestment of distributions from dividend income and capital gains (the profits earned upon the sale of securities that have grown in value, if any) and assuming a constant rate of performance each year. The hypothetical investment and the average annual total returns do not reflect the deduction of taxes that a shareholder would pay on fund distributions or the redemption of fund shares. During periods of reimbursement by Fidelity, a fund’s total return will be greater than it would be had the reimbursement not occurred. How a fund did yesterday is no guarantee of how it will do tomorrow.
Average Annual Total Returns
| For the periods ended July 31, 2020 | Past 1 year | Past 5 years | Past 10 years |
| Fidelity® Real Estate Investment Portfolio | (6.15)% | 5.08% | 9.21% |
$10,000 Over 10 Years
Let's say hypothetically that $10,000 was invested in Fidelity® Real Estate Investment Portfolio on July 31, 2010.
The chart shows how the value of your investment would have changed, and also shows how the S&P 500® Index performed over the same period.
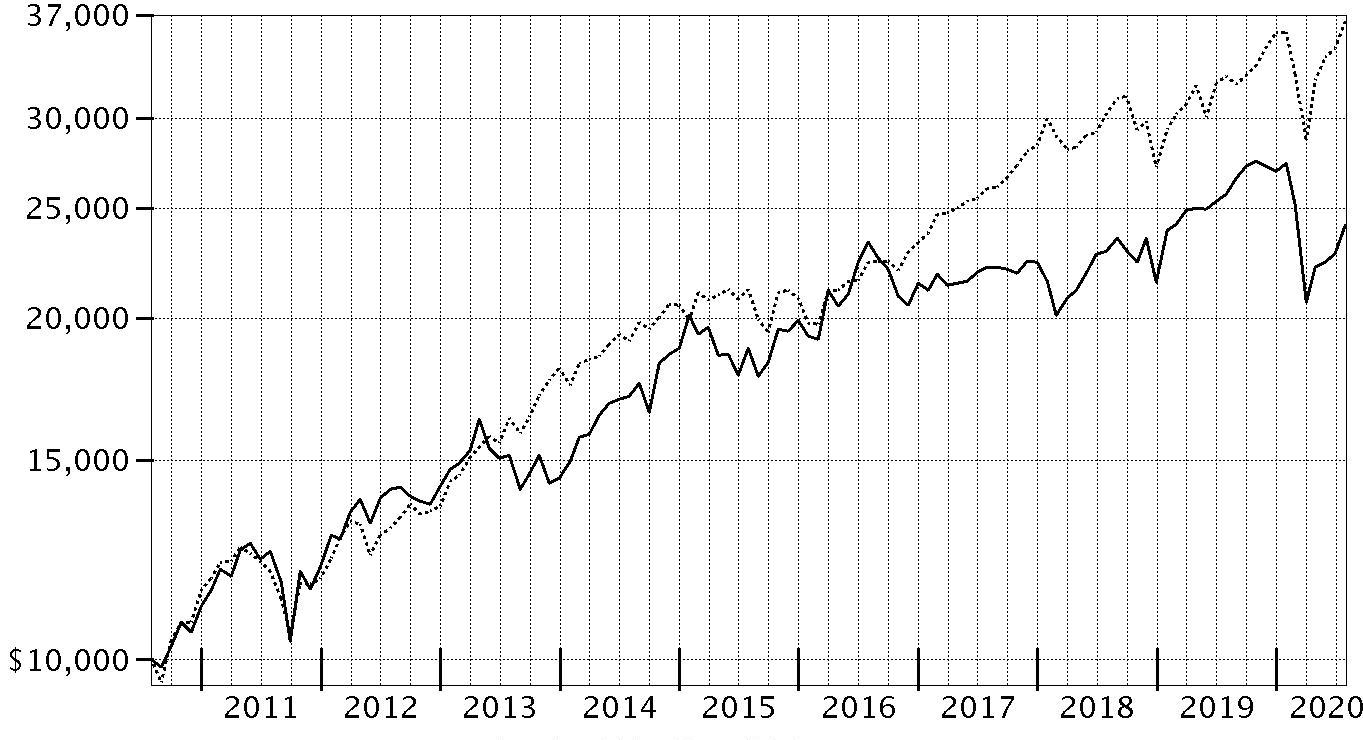
| Period Ending Values |
| $24,127 | Fidelity® Real Estate Investment Portfolio |
| $36,558 | S&P 500® Index |
Management's Discussion of Fund Performance
Market Recap: The S&P 500
® index gained 11.96% for the 12 months ending July 31, 2020, in what was a bumpy ride for U.S. equity investors, marked by a steep but brief decline due to the early-2020 outbreak and spread of the coronavirus, followed by a historic rebound. Declared a pandemic on March 11, the COVID-19 crisis and containment efforts caused broad contraction in economic activity, along with extreme uncertainty, volatility and dislocation in financial markets. By mid-March, U.S. stocks entered bear-market territory less than a month after hitting an all-time high and extending the longest-running bull market in American history. Stocks slid in late February, after a surge in COVID-19 cases outside China. The sudden downtrend continued in March (-12%), capping the index’s worst quarter since 2008. A historically rapid and expansive U.S. monetary/fiscal-policy response provided a partial offset to the economic disruption and fueled a sharp uptrend. Aggressive support for financial markets by the U.S. Federal Reserve, plans for reopening the economy and improving infection data boosted stocks in April (+13%) and May (+5%). In June and July, the index gained amid progress on potential treatments and signs of an early recovery in economic activity. For the full 12 months, growth stocks widely topped value, while large-caps handily bested smaller-caps. The information technology sector (+39%) led the way, followed by consumer discretionary (+22%). In contrast, energy (-38%) fell hard along with the price of crude oil.
Comments from Portfolio Manager Steven Buller: For the fiscal year ending July 31, 2020, the fund returned -6.15%, significantly outperforming the -16.30% return of the Dow Jones U.S. Select Real Estate Securities Index℠. A combination of favorable sector positioning and security selection lifted the portfolio's relative performance. Specifically, the fund benefited from a significant underweighting in retail REITs, especially malls, whose existing competitive challenges worsened with the emergence of the COVID-19 pandemic. Investment choices within the category also added value, due primarily to our significant underweighting in Simon Property Group, which returned about -60% for the fund. We sold our stake in Simon, the country's largest mall owner, in March due to ongoing concerns about the business prospects for the retail property sector. An overweighting coupled with stock selection in the strong-performing industrial category also lifted the portfolio's relative result. Standout performers in this group included an overweight stake in data-center REITs Digital Realty Trust (returning +47% for the fund) and an out-of-benchmark position in Equinix (+60%), which was aided by people working from home that, in turn, boosted demand for data-management facilities. This situation also propelled warehouse operators Duke Realty (+24%) and Prologis (+34%) – both overweight positions – whose business benefits from growth in e-commerce. All four of these stocks, save Equinix, were among the fund's largest holdings on July 31. In contrast, the fund's biggest individual detractor by far was a larger-than-benchmark position in health care REIT Ventas. The company's shares fell last fall, after Ventas announced weak quarterly earnings related to challenges with its senior-housing operations. More recently, investors' concern about the impact of COVID-19 on the firm's senior housing business further weighed on expectations for the stock. Coronavirus worries also pressured hotel REITs, with an overweighting in Diamondrock Hospitality detracting from relative performance. The firm, one of the portfolio's few remaining positions in the hotel sector as of July 31, returned -54% this period. An underweight stake in Mid-America Apartment Communities (-13%), an owner of apartment properties and a large fund holding on July 31, further hampered the fund's relative return.
The views expressed above reflect those of the portfolio manager(s) only through the end of the period as stated on the cover of this report and do not necessarily represent the views of Fidelity or any other person in the Fidelity organization. Any such views are subject to change at any time based upon market or other conditions and Fidelity disclaims any responsibility to update such views. These views may not be relied on as investment advice and, because investment decisions for a Fidelity fund are based on numerous factors, may not be relied on as an indication of trading intent on behalf of any Fidelity fund.
Note to shareholders: On October 1, 2020, the fund’s supplemental benchmark will change from the Dow Jones U.S. Select Real Estate Securities Index to the MSCI US IMI Real Estate 25/50 Index, which is a better representation of the overall real estate market.
Investment Summary (Unaudited)
Top Ten Stocks as of July 31, 2020
| | % of fund's net assets |
| Prologis (REIT), Inc. | 13.3 |
| Digital Realty Trust, Inc. | 9.1 |
| Duke Realty Corp. | 6.4 |
| UDR, Inc. | 4.9 |
| Crown Castle International Corp. | 4.9 |
| Welltower, Inc. | 4.2 |
| Equity Lifestyle Properties, Inc. | 4.2 |
| Invitation Homes, Inc. | 3.2 |
| Sun Communities, Inc. | 3.1 |
| Mid-America Apartment Communities, Inc. | 2.8 |
| | 56.1 |
Top Five REIT Sectors as of July 31, 2020
| | % of fund's net assets |
| REITs - Diversified | 26.3 |
| REITs - Apartments | 16.8 |
| REITs - Warehouse/Industrial | 15.0 |
| REITs - Health Care | 9.2 |
| REITs - Office Property | 8.1 |
Asset Allocation (% of fund's net assets)
| As of July 31, 2020* |
| | Stocks | 98.3% |
| | Short-Term Investments and Net Other Assets (Liabilities) | 1.7% |

* Foreign investments - 1.1%
Schedule of Investments July 31, 2020
Showing Percentage of Net Assets
| Common Stocks - 98.3% | | | |
| | | Shares | Value (000s) |
| Equity Real Estate Investment Trusts (REITs) - 97.0% | | | |
| REITs - Apartments - 16.8% | | | |
| American Homes 4 Rent Class A | | 3,821,500 | $110,824 |
| Apartment Investment & Management Co. Class A | | 1,857,103 | 72,093 |
| Equity Residential (SBI) | | 1,229,100 | 65,917 |
| Invitation Homes, Inc. | | 4,563,400 | 136,081 |
| Mid-America Apartment Communities, Inc. | | 973,300 | 116,008 |
| UDR, Inc. | | 5,696,641 | 206,218 |
| | | | 707,141 |
| REITs - Diversified - 26.3% | | | |
| Crown Castle International Corp. | | 1,232,800 | 205,508 |
| Digital Realty Trust, Inc. (a) | | 2,388,200 | 383,402 |
| Duke Realty Corp. | | 6,705,600 | 269,498 |
| Equinix, Inc. | | 99,200 | 77,920 |
| Gaming & Leisure Properties | | 1,271,609 | 46,045 |
| SBA Communications Corp. Class A | | 238,400 | 74,271 |
| VICI Properties, Inc. | | 837,200 | 18,176 |
| Washington REIT (SBI) | | 1,600,300 | 35,783 |
| | | | 1,110,603 |
| REITs - Health Care - 9.2% | | | |
| Healthcare Trust of America, Inc. | | 3,513,700 | 97,013 |
| Ventas, Inc. | | 2,969,154 | 113,897 |
| Welltower, Inc. | | 3,287,140 | 176,059 |
| | | | 386,969 |
| REITs - Hotels - 0.9% | | | |
| DiamondRock Hospitality Co. | | 4,982,600 | 23,020 |
| RLJ Lodging Trust | | 1,973,700 | 15,809 |
| | | | 38,829 |
| REITs - Management/Investment - 3.8% | | | |
| American Assets Trust, Inc. | | 949,200 | 25,628 |
| Lexington Corporate Properties Trust | | 4,905,300 | 56,901 |
| National Retail Properties, Inc. | | 2,201,800 | 78,054 |
| | | | 160,583 |
| REITs - Manufactured Homes - 7.3% | | | |
| Equity Lifestyle Properties, Inc. | | 2,569,574 | 175,553 |
| Sun Communities, Inc. | | 872,363 | 130,793 |
| | | | 306,346 |
| REITs - Office Property - 8.1% | | | |
| Boston Properties, Inc. | | 1,057,000 | 94,168 |
| Brandywine Realty Trust (SBI) | | 4,080,600 | 44,193 |
| Highwoods Properties, Inc. (SBI) | | 1,338,323 | 51,311 |
| Mack-Cali Realty Corp. | | 1,868,100 | 26,938 |
| Piedmont Office Realty Trust, Inc. Class A | | 2,560,300 | 41,502 |
| VEREIT, Inc. | | 12,909,100 | 84,038 |
| | | | 342,150 |
| REITs - Shopping Centers - 2.9% | | | |
| Acadia Realty Trust (SBI) | | 1,274,723 | 15,348 |
| Kimco Realty Corp. | | 3,986,590 | 44,450 |
| Regency Centers Corp. | | 1,485,500 | 60,950 |
| | | | 120,748 |
| REITs - Single Tenant - 1.2% | | | |
| Spirit Realty Capital, Inc. | | 1,470,700 | 50,680 |
| REITs - Storage - 5.5% | | | |
| CubeSmart | | 3,102,500 | 92,051 |
| Extra Space Storage, Inc. | | 1,118,540 | 115,590 |
| Iron Mountain, Inc. | | 848,900 | 23,930 |
| | | | 231,571 |
| REITs - Warehouse/Industrial - 15.0% | | | |
| Americold Realty Trust | | 1,738,700 | 70,157 |
| Prologis (REIT), Inc. | | 5,319,330 | 560,763 |
| | | | 630,920 |
|
| TOTAL EQUITY REAL ESTATE INVESTMENT TRUSTS (REITS) | | | 4,086,540 |
|
| Media - 0.2% | | | |
| Advertising - 0.2% | | | |
| Clear Channel Outdoor Holdings, Inc. (b) | | 9,246,800 | 8,475 |
| Real Estate Management & Development - 1.1% | | | |
| Real Estate Development - 1.1% | | | |
| Instone Real Estate Group BV (b)(c) | | 1,759,545 | 45,184 |
| TOTAL COMMON STOCKS | | | |
| (Cost $3,239,902) | | | 4,140,199 |
|
| Money Market Funds - 6.7% | | | |
| Fidelity Cash Central Fund 0.14% (d) | | 257,277,637 | 257,355 |
| Fidelity Securities Lending Cash Central Fund 0.13% (d)(e) | | 24,797,473 | 24,800 |
| TOTAL MONEY MARKET FUNDS | | | |
| (Cost $282,147) | | | 282,155 |
| TOTAL INVESTMENT IN SECURITIES - 105.0% | | | |
| (Cost $3,522,049) | | | 4,422,354 |
| NET OTHER ASSETS (LIABILITIES) - (5.0)% | | | (209,194) |
| NET ASSETS - 100% | | | $4,213,160 |
Legend
(a) Security or a portion of the security is on loan at period end.
(b) Non-income producing
(c) Security exempt from registration under Rule 144A of the Securities Act of 1933. These securities may be resold in transactions exempt from registration, normally to qualified institutional buyers. At the end of the period, the value of these securities amounted to $45,184,000 or 1.1% of net assets.
(d) Affiliated fund that is generally available only to investment companies and other accounts managed by Fidelity Investments. The rate quoted is the annualized seven-day yield of the fund at period end. A complete unaudited listing of the fund's holdings as of its most recent quarter end is available upon request. In addition, each Fidelity Central Fund's financial statements, which are not covered by the Fund's Report of Independent Registered Public Accounting Firm, are available on the SEC's website or upon request.
(e) Investment made with cash collateral received from securities on loan.
Affiliated Central Funds
Information regarding fiscal year to date income earned by the Fund from investments in Fidelity Central Funds is as follows:
| Fund | Income earned |
| | (Amounts in thousands) |
| Fidelity Cash Central Fund | $664 |
| Fidelity Securities Lending Cash Central Fund | 31 |
| Total | $695 |
Amounts in the income column in the above table include any capital gain distributions from underlying funds, which are presented in the corresponding line-item in the Statement of Operations, if applicable. Amount for Fidelity Securities Lending Cash Central Fund represents the income earned on investing cash collateral, less rebates paid to borrowers and any lending agent fees associated with the loan, plus any premium payments received for lending certain types of securities.
Investment Valuation
The following is a summary of the inputs used, as of July 31, 2020, involving the Fund's assets and liabilities carried at fair value. The inputs or methodology used for valuing securities may not be an indication of the risk associated with investing in those securities. For more information on valuation inputs, and their aggregation into the levels used below, please refer to the Investment Valuation section in the accompanying Notes to Financial Statements.
| | Valuation Inputs at Reporting Date: |
| Description | Total | Level 1 | Level 2 | Level 3 |
| (Amounts in thousands) | | | | |
| Investments in Securities: | | | | |
| Common Stocks | $4,140,199 | $4,140,199 | $-- | $-- |
| Money Market Funds | 282,155 | 282,155 | -- | -- |
| Total Investments in Securities: | $4,422,354 | $4,422,354 | $-- | $-- |
See accompanying notes which are an integral part of the financial statements.
Financial Statements
Statement of Assets and Liabilities
| Amounts in thousands (except per-share amount) | | July 31, 2020 |
| Assets | | |
Investment in securities, at value (including securities loaned of $24,579) — See accompanying schedule:
Unaffiliated issuers (cost $3,239,902) | $4,140,199 | |
| Fidelity Central Funds (cost $282,147) | 282,155 | |
| Total Investment in Securities (cost $3,522,049) | | $4,422,354 |
| Receivable for investments sold | | 7,439 |
| Receivable for fund shares sold | | 11,513 |
| Dividends receivable | | 1,092 |
| Distributions receivable from Fidelity Central Funds | | 19 |
| Prepaid expenses | | 21 |
| Other receivables | | 413 |
| Total assets | | 4,442,851 |
| Liabilities | | |
| Payable for investments purchased | $197,934 | |
| Payable for fund shares redeemed | 4,244 | |
| Accrued management fee | 1,677 | |
| Other affiliated payables | 636 | |
| Other payables and accrued expenses | 398 | |
| Collateral on securities loaned | 24,802 | |
| Total liabilities | | 229,691 |
| Net Assets | | $4,213,160 |
| Net Assets consist of: | | |
| Paid in capital | | $3,298,266 |
| Total accumulated earnings (loss) | | 914,894 |
| Net Assets | | $4,213,160 |
| Net Asset Value, offering price and redemption price per share ($4,213,160 ÷ 104,905 shares) | | $40.16 |
See accompanying notes which are an integral part of the financial statements.
Statement of Operations
| Amounts in thousands | | Year ended July 31, 2020 |
| Investment Income | | |
| Dividends | | $115,795 |
| Income from Fidelity Central Funds (including $31 from security lending) | | 695 |
| Total income | | 116,490 |
| Expenses | | |
| Management fee | $21,261 | |
| Transfer agent fees | 6,768 | |
| Accounting fees | 1,025 | |
| Custodian fees and expenses | 32 | |
| Independent trustees' fees and expenses | 25 | |
| Registration fees | 144 | |
| Audit | 52 | |
| Legal | 8 | |
| Miscellaneous | 79 | |
| Total expenses before reductions | 29,394 | |
| Expense reductions | (138) | |
| Total expenses after reductions | | 29,256 |
| Net investment income (loss) | | 87,234 |
| Realized and Unrealized Gain (Loss) | | |
| Net realized gain (loss) on: | | |
| Investment securities: | | |
| Unaffiliated issuers | 115,288 | |
| Fidelity Central Funds | (9) | |
| Total net realized gain (loss) | | 115,279 |
| Change in net unrealized appreciation (depreciation) on: | | |
| Investment securities: | | |
| Unaffiliated issuers | (482,117) | |
| Fidelity Central Funds | 6 | |
| Total change in net unrealized appreciation (depreciation) | | (482,111) |
| Net gain (loss) | | (366,832) |
| Net increase (decrease) in net assets resulting from operations | | $(279,598) |
See accompanying notes which are an integral part of the financial statements.
Statement of Changes in Net Assets
| Amounts in thousands | Year ended July 31, 2020 | Year ended July 31, 2019 |
| Increase (Decrease) in Net Assets | | |
| Operations | | |
| Net investment income (loss) | $87,234 | $97,986 |
| Net realized gain (loss) | 115,279 | 141,846 |
| Change in net unrealized appreciation (depreciation) | (482,111) | 218,711 |
| Net increase (decrease) in net assets resulting from operations | (279,598) | 458,543 |
| Distributions to shareholders | (271,659) | (174,814) |
| Share transactions | | |
| Proceeds from sales of shares | 1,414,992 | 667,239 |
| Reinvestment of distributions | 255,135 | 164,334 |
| Cost of shares redeemed | (1,209,917) | (749,846) |
| Net increase (decrease) in net assets resulting from share transactions | 460,210 | 81,727 |
| Total increase (decrease) in net assets | (91,047) | 365,456 |
| Net Assets | | |
| Beginning of period | 4,304,207 | 3,938,751 |
| End of period | $4,213,160 | $4,304,207 |
| Other Information | | |
| Shares | | |
| Sold | 34,900 | 15,336 |
| Issued in reinvestment of distributions | 5,690 | 3,892 |
| Redeemed | (30,041) | (17,591) |
| Net increase (decrease) | 10,549 | 1,637 |
See accompanying notes which are an integral part of the financial statements.
Financial Highlights
Fidelity Real Estate Investment Portfolio
| | | | | | |
| Years ended July 31, | 2020 | 2019 | 2018 | 2017 | 2016 |
| Selected Per–Share Data | | | | | |
| Net asset value, beginning of period | $45.62 | $42.48 | $42.92 | $47.35 | $40.80 |
| Income from Investment Operations | | | | | |
| Net investment income (loss)A | .93 | 1.06 | .81 | .72 | .75 |
| Net realized and unrealized gain (loss) | (3.48) | 3.98 | .49 | (3.12) | 8.36 |
| Total from investment operations | (2.55) | 5.04 | 1.30 | (2.40) | 9.11 |
| Distributions from net investment income | (.87) | (1.04) | (.82) | (.71) | (.73) |
| Distributions from net realized gain | (2.04) | (.87) | (.92) | (1.32) | (1.83) |
| Total distributions | (2.91) | (1.90)B | (1.74) | (2.03) | (2.56) |
| Redemption fees added to paid in capitalA | – | – | – | –C | –C |
| Net asset value, end of period | $40.16 | $45.62 | $42.48 | $42.92 | $47.35 |
| Total ReturnD | (6.15)% | 12.29% | 3.13% | (4.94)% | 24.00% |
| Ratios to Average Net AssetsE,F | | | | | |
| Expenses before reductions | .74% | .74% | .76% | .76% | .78% |
| Expenses net of fee waivers, if any | .74% | .74% | .75% | .76% | .77% |
| Expenses net of all reductions | .73% | .74% | .75% | .76% | .77% |
| Net investment income (loss) | 2.19% | 2.46% | 1.99% | 1.69% | 1.81% |
| Supplemental Data | | | | | |
| Net assets, end of period (in millions) | $4,213 | $4,304 | $3,939 | $4,321 | $5,567 |
| Portfolio turnover rateG | 38% | 23% | 20%H | 15% | 24% |
A Calculated based on average shares outstanding during the period.
B Total distributions of $1.90 per share is comprised of distributions from net investment income of $1.036 and distributions from net realized gain of $.865 per share.
C Amount represents less than $.005 per share.
D Total returns would have been lower if certain expenses had not been reduced during the applicable periods shown.
E Fees and expenses of any underlying mutual funds or exchange-traded funds (ETFs) are not included in the Fund's expense ratio. The Fund indirectly bears its proportionate share of these expenses. For additional expense information related to investments in Fidelity Central Funds, please refer to the "Investments in Fidelity Central Funds" note found in the Notes to Financial Statements section of the most recent Annual or Semi-Annual report.
F Expense ratios reflect operating expenses of the Fund. Expenses before reductions do not reflect amounts reimbursed by the investment adviser or reductions from brokerage service arrangements or reductions from other expense offset arrangements and do not represent the amount paid by the Fund during periods when reimbursements or reductions occur. Expenses net of fee waivers reflect expenses after reimbursement by the investment adviser but prior to reductions from brokerage service arrangements or other expense offset arrangements. Expenses net of all reductions represent the net expenses paid by the Fund.
G Amount does not include the portfolio activity of any underlying Fidelity Central Funds.
H Portfolio turnover rate excludes securities received or delivered in-kind.
See accompanying notes which are an integral part of the financial statements.
Notes to Financial Statements
For the period ended July 31, 2020
(Amounts in thousands except percentages)
1. Organization.
Fidelity Real Estate Investment Portfolio (the Fund) is a non-diversified fund of Fidelity Select Portfolios (the Trust) and is authorized to issue an unlimited number of shares. Share transactions on the Statement of Changes in Net Assets may contain exchanges between affiliated funds. The Trust is registered under the Investment Company Act of 1940, as amended (the 1940 Act), as an open-end management investment company organized as a Massachusetts business trust.
Effective January 1, 2020:
Investment advisers Fidelity Investments Money Management, Inc., FMR Co., Inc., and Fidelity SelectCo, LLC, merged with and into Fidelity Management & Research Company. In connection with the merger transactions, the resulting, merged investment adviser was then redomiciled from Massachusetts to Delaware, changed its corporate structure from a corporation to a limited liability company, and changed its name to "Fidelity Management & Research Company LLC".
Fidelity Investments Institutional Operations Company, Inc. converted from a Massachusetts corporation to a Massachusetts LLC, and changed its name to "Fidelity Investments Institutional Operations Company LLC".
2. Investments in Fidelity Central Funds.
The Fund invests in Fidelity Central Funds, which are open-end investment companies generally available only to other investment companies and accounts managed by the investment adviser and its affiliates. The Fund's Schedule of Investments lists each of the Fidelity Central Funds held as of period end, if any, as an investment of the Fund, but does not include the underlying holdings of each Fidelity Central Fund. As an Investing Fund, the Fund indirectly bears its proportionate share of the expenses of the underlying Fidelity Central Funds.
The Money Market Central Funds seek preservation of capital and current income and are managed by the investment adviser. Annualized expenses of the Money Market Central Funds as of their most recent shareholder report date ranged from less than .005% to .01%.
A complete unaudited list of holdings for each Fidelity Central Fund is available upon request or at the Securities and Exchange Commission (the SEC) website at www.sec.gov. In addition, the financial statements of the Fidelity Central Funds, which are not covered by the Fund's Report of Independent Registered Public Accounting Firm, are available on the SEC website or upon request.
3. Significant Accounting Policies.
The Fund is an investment company and applies the accounting and reporting guidance of the Financial Accounting Standards Board (FASB) Accounting Standards Codification Topic 946 Financial Services – Investment Companies. The financial statements have been prepared in conformity with accounting principles generally accepted in the United States of America (GAAP), which require management to make certain estimates and assumptions at the date of the financial statements. Actual results could differ from those estimates. Subsequent events, if any, through the date that the financial statements were issued have been evaluated in the preparation of the financial statements. The following summarizes the significant accounting policies of the Fund:
Investment Valuation. Investments are valued as of 4:00 p.m. Eastern time on the last calendar day of the period. The Board of Trustees (the Board) has delegated the day to day responsibility for the valuation of the Fund's investments to the Fair Value Committee (the Committee) established by the Fund's investment adviser. In accordance with valuation policies and procedures approved by the Board, the Fund attempts to obtain prices from one or more third party pricing vendors or brokers to value its investments. When current market prices, quotations or currency exchange rates are not readily available or reliable, investments will be fair valued in good faith by the Committee, in accordance with procedures adopted by the Board. Factors used in determining fair value vary by investment type and may include market or investment specific events. The frequency with which these procedures are used cannot be predicted and they may be utilized to a significant extent. The Committee oversees the Fund's valuation policies and procedures and reports to the Board on the Committee's activities and fair value determinations. The Board monitors the appropriateness of the procedures used in valuing the Fund's investments and ratifies the fair value determinations of the Committee.
The Fund categorizes the inputs to valuation techniques used to value its investments into a disclosure hierarchy consisting of three levels as shown below:
- Level 1 – quoted prices in active markets for identical investments
- Level 2 – other significant observable inputs (including quoted prices for similar investments, interest rates, prepayment speeds, etc.)
- Level 3 – unobservable inputs (including the Fund's own assumptions based on the best information available)
Valuation techniques used to value the Fund's investments by major category are as follows:
Equity securities, including restricted securities, for which market quotations are readily available, are valued at the last reported sale price or official closing price as reported by a third party pricing vendor on the primary market or exchange on which they are traded and are categorized as Level 1 in the hierarchy. In the event there were no sales during the day or closing prices are not available, securities are valued at the last quoted bid price or may be valued using the last available price and are generally categorized as Level 2 in the hierarchy. For foreign equity securities, when market or security specific events arise, comparisons to the valuation of American Depositary Receipts (ADRs), futures contracts, Exchange-Traded Funds (ETFs) and certain indexes as well as quoted prices for similar securities may be used and would be categorized as Level 2 in the hierarchy. For equity securities, including restricted securities, where observable inputs are limited, assumptions about market activity and risk are used and these securities may be categorized as Level 3 in the hierarchy.
Investments in open-end mutual funds, including the Fidelity Central Funds, are valued at their closing net asset value (NAV) each business day and are categorized as Level 1 in the hierarchy.
Changes in valuation techniques may result in transfers in or out of an assigned level within the disclosure hierarchy. The aggregate value of investments by input level as of July 31, 2020 is included at the end of the Fund's Schedule of Investments.
Foreign Currency. The Fund may use foreign currency contracts to facilitate transactions in foreign-denominated securities. Gains and losses from these transactions may arise from changes in the value of the foreign currency or if the counterparties do not perform under the contracts' terms.
Foreign-denominated assets, including investment securities, and liabilities are translated into U.S. dollars at the exchange rates at period end. Purchases and sales of investment securities, income and dividends received and expenses denominated in foreign currencies are translated into U.S. dollars at the exchange rate in effect on the transaction date.
The effects of exchange rate fluctuations on investments are included with the net realized and unrealized gain (loss) on investment securities. Other foreign currency transactions resulting in realized and unrealized gain (loss) are disclosed separately.
Investment Transactions and Income. For financial reporting purposes, the Fund's investment holdings and NAV include trades executed through the end of the last business day of the period. The NAV per share for processing shareholder transactions is calculated as of the close of business of the New York Stock Exchange (NYSE), normally 4:00 p.m. Eastern time and includes trades executed through the end of the prior business day. Gains and losses on securities sold are determined on the basis of identified cost. Dividend income is recorded on the ex-dividend date, except for certain dividends from foreign securities where the ex-dividend date may have passed, which are recorded as soon as the Fund is informed of the ex-dividend date. Non-cash dividends included in dividend income, if any, are recorded at the fair market value of the securities received. Income and capital gain distributions from Fidelity Central Funds, if any, are recorded on the ex-dividend date. Certain distributions received by the Fund represent a return of capital or capital gain. The Fund determines the components of these distributions subsequent to the ex-dividend date, based upon receipt of tax filings or other correspondence relating to the underlying investment. These distributions are recorded as a reduction of cost of investments and/or as a realized gain. Investment income is recorded net of foreign taxes withheld where recovery of such taxes is uncertain.
Expenses. Expenses directly attributable to a fund are charged to that fund. Expenses attributable to more than one fund are allocated among the respective funds on the basis of relative net assets or other appropriate methods. Expense estimates are accrued in the period to which they relate and adjustments are made when actual amounts are known.
Deferred Trustee Compensation. Under a Deferred Compensation Plan (the Plan) for the Fund, certain independent Trustees have elected to defer receipt of a portion of their annual compensation. Deferred amounts are invested in a cross-section of Fidelity funds, are marked-to-market and remain in the Fund until distributed in accordance with the Plan. The investment of deferred amounts and the offsetting payable to the Trustees of $363 are included in the accompanying Statement of Assets and Liabilities in other receivables and other payables and accrued expenses, respectively.
Income Tax Information and Distributions to Shareholders. Each year, the Fund intends to qualify as a regulated investment company under Subchapter M of the Internal Revenue Code, including distributing substantially all of its taxable income and realized gains. As a result, no provision for U.S. Federal income taxes is required. As of July 31, 2020, the Fund did not have any unrecognized tax benefits in the financial statements; nor is the Fund aware of any tax positions for which it is reasonably possible that the total amounts of unrecognized tax benefits will significantly change in the next twelve months. The Fund files a U.S. federal tax return, in addition to state and local tax returns as required. The Fund's federal income tax returns are subject to examination by the Internal Revenue Service (IRS) for a period of three fiscal years after they are filed. State and local tax returns may be subject to examination for an additional fiscal year depending on the jurisdiction. Foreign taxes are provided for based on the Fund's understanding of the tax rules and rates that exist in the foreign markets in which it invests.
Distributions are declared and recorded on the ex-dividend date. Income and capital gain distributions are determined in accordance with income tax regulations, which may differ from GAAP. In addition, the Fund claimed a portion of the payment made to redeeming shareholders as a distribution for income tax purposes.
Capital accounts within the financial statements are adjusted for permanent book-tax differences. These adjustments have no impact on net assets or the results of operations. Capital accounts are not adjusted for temporary book-tax differences which will reverse in a subsequent period.
Book-tax differences are primarily due to foreign currency transactions, deferred trustees compensation, and losses deferred due to wash sales and excise tax regulations.
As of period end, the cost and unrealized appreciation (depreciation) in securities, and derivatives if applicable, for federal income tax purposes were as follows:
| Gross unrealized appreciation | $1,179,657 |
| Gross unrealized depreciation | (310,893) |
| Net unrealized appreciation (depreciation) | $868,764 |
| Tax Cost | $3,553,590 |
The tax-based components of distributable earnings as of period end were as follows:
| Undistributed ordinary income | $15,346 |
| Undistributed long-term capital gain | $77,162 |
| Net unrealized appreciation (depreciation) on securities and other investments | $868,764 |
The Fund intends to elect to defer to its next fiscal year $46,014 of capital losses recognized during the period November 1, 2019 to July 31, 2020.
The tax character of distributions paid was as follows:
| | July 31, 2020 | July 31,2019 |
| Ordinary Income | $87,049 | $ 95,276 |
| Long-term Capital Gains | 184,610 | 79,538 |
| Total | $271,659 | $ 174,814 |
Restricted Securities (including Private Placements). The Fund may invest in securities that are subject to legal or contractual restrictions on resale. These securities generally may be resold in transactions exempt from registration or to the public if the securities are registered. Disposal of these securities may involve time-consuming negotiations and expense, and prompt sale at an acceptable price may be difficult. Information regarding restricted securities is included at the end of the Fund's Schedule of Investments.
4. Purchases and Sales of Investments.
Purchases and sales of securities, other than short-term securities are noted in the table below.
| | Purchases ($) | Sales ($) |
| Fidelity Real Estate Investment Portfolio | 1,731,308 | 1,494,518 |
5. Fees and Other Transactions with Affiliates.
Management Fee. Fidelity Management & Research Company LLC (the investment adviser) and its affiliates provide the Fund with investment management related services for which the Fund pays a monthly management fee. The management fee is the sum of an individual fund fee rate that is based on an annual rate of .30% of the Fund's average net assets and an annualized group fee rate that averaged .23% during the period. The group fee rate is based upon the monthly average net assets of a group of registered investment companies with which the investment adviser has management contracts. The group fee rate decreases as assets under management increase and increases as assets under management decrease. For the reporting period, the total annual management fee rate was .53% of the Fund's average net assets.
Transfer Agent Fees. Fidelity Investments Institutional Operations Company LLC (FIIOC), an affiliate of the investment adviser, is the Fund's transfer, dividend disbursing and shareholder servicing agent. FIIOC receives account fees and asset-based fees that vary according to account size and type of account. FIIOC pays for typesetting, printing and mailing of shareholder reports, except proxy statements. For the period, the transfer agent fees were equivalent to an annual rate of .17% of average net assets.
Accounting Fees. Fidelity Service Company, Inc. (FSC), an affiliate of the investment adviser, maintains the Fund's accounting records. The accounting fee is based on the level of average net assets for each month. For the period, the fees were equivalent to the following annual rates:
| | % of Average Net Assets |
| Fidelity Real Estate Investment Portfolio | .03 |
Brokerage Commissions. A portion of portfolio transactions were placed with brokerage firms which are affiliates of the investment adviser. Brokerage commissions are included in net realized gain (loss) and change in net unrealized appreciation (depreciation) in the Statement of Operations. The commissions paid to these affiliated firms were as follows:
| | Amount |
| Fidelity Real Estate Investment Portfolio | $48 |
Interfund Trades. Funds may purchase from or sell securities to other Fidelity Funds under procedures adopted by the Board. The procedures have been designed to ensure these interfund trades are executed in accordance with Rule 17a-7 of the 1940 Act. Interfund trades are included within the respective purchases and sales amounts shown in the Purchases and Sales of Investments note.
6. Committed Line of Credit.
Certain Funds participate with other funds managed by the investment adviser or an affiliate in a $4.25 billion credit facility (the "line of credit") to be utilized for temporary or emergency purposes to fund shareholder redemptions or for other short-term liquidity purposes. The participating funds have agreed to pay commitment fees on their pro-rata portion of the line of credit, which are reflected in Miscellaneous expenses on the Statement of Operations, and are as follows:
| | Amount |
| Fidelity Real Estate Investment Portfolio | $10 |
During the period, there were no borrowings on this line of credit.
7. Security Lending.
The Fund lends portfolio securities from time to time in order to earn additional income. Lending agents are used, including National Financial Services (NFS), an affiliate of the Fund. Pursuant to a securities lending agreement, NFS will receive a fee, which is capped at 9.9% of daily lending revenue, for its services as lending agent. The Fund may lend securities to certain qualified borrowers, including NFS. On the settlement date of the loan, the Fund receives collateral (in the form of U.S. Treasury obligations, letters of credit and/or cash) against the loaned securities and maintains collateral in an amount not less than 100% of the market value of the loaned securities during the period of the loan. The market value of the loaned securities is determined at the close of business of the Fund and any additional required collateral is delivered to the Fund on the next business day. The Fund or borrower may terminate the loan at any time, and if the borrower defaults on its obligation to return the securities loaned because of insolvency or other reasons, the Fund may apply collateral received from the borrower against the obligation. The Fund may experience delays and costs in recovering the securities loaned. Any cash collateral received is invested in the Fidelity Securities Lending Cash Central Fund. The value of loaned securities and cash collateral at period end are disclosed on the Fund's Statement of Assets and Liabilities. At period end, there were no security loans outstanding with NFS, as affiliated borrower. Total fees paid by the Fund to NFS, as lending agent, amounted to $3. Security lending income represents the income earned on investing cash collateral, less rebates paid to borrowers and any lending agent fees associated with the loan, plus any premium payments received for lending certain types of securities. Net income from the Fidelity Securities Lending Cash Central Fund during the period is presented in the Statement of Operations as a component of income from Fidelity Central Funds (and includes an amount of less than five hundred dollars from securities loaned to NFS, as affiliated borrower).
8. Expense Reductions.
Commissions paid to certain brokers with whom the investment adviser, or its affiliates, places trades on behalf of the Fund include an amount in addition to trade execution, which may be rebated back to the Fund to offset certain expenses. This amount totaled $121 for the period. Through arrangements with the Fund's transfer agent, credits realized as a result of certain uninvested cash balances were used to reduce the Fund's expenses by an amount of less than five hundred dollars.
In addition, during the period the investment adviser or an affiliate reimbursed and/or waived a portion of operating expenses in the amount of $17.
9. Other.
The Fund's organizational documents provide former and current trustees and officers with a limited indemnification against liabilities arising in connection with the performance of their duties to the Fund. In the normal course of business, the Fund may also enter into contracts that provide general indemnifications. The Fund's maximum exposure under these arrangements is unknown as this would be dependent on future claims that may be made against the Fund. The risk of material loss from such claims is considered remote.
10. Coronavirus (COVID-19) Pandemic.
An outbreak of COVID-19 first detected in China during December 2019 has since spread globally and was declared a pandemic by the World Health Organization during March 2020. Developments that disrupt global economies and financial markets, such as the COVID-19 pandemic, may magnify factors that affect the Fund's performance.
Report of Independent Registered Public Accounting Firm
To the Board of Trustees of Fidelity Select Portfolios and Shareholders of Fidelity Real Estate Investment Portfolio
Opinion on the Financial Statements and Financial Highlights
We have audited the accompanying statement of assets and liabilities of Fidelity Real Estate Investment Portfolio (the "Fund"), a fund of Fidelity Select Portfolios, including the schedule of investments, as of July 31, 2020, the related statement of operations for the year then ended, the statement of changes in net assets for each of the two years in the period then ended, the financial highlights for each of the five years in the period then ended, and the related notes. In our opinion, the financial statements and financial highlights present fairly, in all material respects, the financial position of the Fund as of July 31, 2020, and the results of its operations for the year then ended, the changes in its net assets for each of the two years in the period then ended, and the financial highlights for each of the five years in the period then ended in conformity with accounting principles generally accepted in the United States of America.
Basis for Opinion
These financial statements and financial highlights are the responsibility of the Fund's management. Our responsibility is to express an opinion on the Fund's financial statements and financial highlights based on our audits. We are a public accounting firm registered with the Public Company Accounting Oversight Board (United States) (PCAOB) and are required to be independent with respect to the Fund in accordance with the U.S. federal securities laws and the applicable rules and regulations of the Securities and Exchange Commission and the PCAOB.
We conducted our audits in accordance with the standards of the PCAOB. Those standards require that we plan and perform the audit to obtain reasonable assurance about whether the financial statements and financial highlights are free of material misstatement, whether due to error or fraud. The Fund is not required to have, nor were we engaged to perform, an audit of its internal control over financial reporting. As part of our audits we are required to obtain an understanding of internal control over financial reporting but not for the purpose of expressing an opinion on the effectiveness of the Fund’s internal control over financial reporting. Accordingly, we express no such opinion.
Our audits included performing procedures to assess the risks of material misstatement of the financial statements and financial highlights, whether due to error or fraud, and performing procedures that respond to those risks. Such procedures included examining, on a test basis, evidence regarding the amounts and disclosures in the financial statements and financial highlights. Our audits also included evaluating the accounting principles used and significant estimates made by management, as well as evaluating the overall presentation of the financial statements and financial highlights. Our procedures included confirmation of securities owned as of July 31, 2020, by correspondence with the custodian and brokers; when replies were not received from brokers, we performed other auditing procedures. We believe that our audits provide a reasonable basis for our opinion.
/s/ Deloitte & Touche LLP
Boston, Massachusetts
September 9, 2020
We have served as the auditor of one or more of the Fidelity investment companies since 1999.
Trustees and Officers
The Trustees, Members of the Advisory Board (if any), and officers of the trust and fund, as applicable, are listed below. The Board of Trustees governs the fund and is responsible for protecting the interests of shareholders. The Trustees are experienced executives who meet periodically throughout the year to oversee the fund's activities, review contractual arrangements with companies that provide services to the fund, oversee management of the risks associated with such activities and contractual arrangements, and review the fund's performance. Except for Bettina Doulton, each of the Trustees oversees 311 funds. Mrs. Doulton oversees 210 funds.
The Trustees hold office without limit in time except that (a) any Trustee may resign; (b) any Trustee may be removed by written instrument, signed by at least two-thirds of the number of Trustees prior to such removal; (c) any Trustee who requests to be retired or who has become incapacitated by illness or injury may be retired by written instrument signed by a majority of the other Trustees; and (d) any Trustee may be removed at any special meeting of shareholders by a two-thirds vote of the outstanding voting securities of the trust. Each Trustee who is not an interested person (as defined in the 1940 Act) of the trust and the fund is referred to herein as an Independent Trustee. Each Independent Trustee shall retire not later than the last day of the calendar year in which his or her 75th birthday occurs. The Independent Trustees may waive this mandatory retirement age policy with respect to individual Trustees. Officers and Advisory Board Members hold office without limit in time, except that any officer or Advisory Board Member may resign or may be removed by a vote of a majority of the Trustees at any regular meeting or any special meeting of the Trustees. Except as indicated, each individual has held the office shown or other offices in the same company for the past five years.
The fund’s Statement of Additional Information (SAI) includes more information about the Trustees. To request a free copy, call Fidelity at 1-800-544-8544.
Experience, Skills, Attributes, and Qualifications of the Trustees. The Governance and Nominating Committee has adopted a statement of policy that describes the experience, qualifications, attributes, and skills that are necessary and desirable for potential Independent Trustee candidates (Statement of Policy). The Board believes that each Trustee satisfied at the time he or she was initially elected or appointed a Trustee, and continues to satisfy, the standards contemplated by the Statement of Policy. The Governance and Nominating Committee also engages professional search firms to help identify potential Independent Trustee candidates who have the experience, qualifications, attributes, and skills consistent with the Statement of Policy. From time to time, additional criteria based on the composition and skills of the current Independent Trustees, as well as experience or skills that may be appropriate in light of future changes to board composition, business conditions, and regulatory or other developments, have also been considered by the professional search firms and the Governance and Nominating Committee. In addition, the Board takes into account the Trustees' commitment and participation in Board and committee meetings, as well as their leadership of standing and ad hoc committees throughout their tenure.
In determining that a particular Trustee was and continues to be qualified to serve as a Trustee, the Board has considered a variety of criteria, none of which, in isolation, was controlling. The Board believes that, collectively, the Trustees have balanced and diverse experience, qualifications, attributes, and skills, which allow the Board to operate effectively in governing the fund and protecting the interests of shareholders. Information about the specific experience, skills, attributes, and qualifications of each Trustee, which in each case led to the Board's conclusion that the Trustee should serve (or continue to serve) as a trustee of the fund, is provided below.
Board Structure and Oversight Function. Robert A. Lawrence is an interested person and currently serves as Acting Chairman. The Trustees have determined that an interested Chairman is appropriate and benefits shareholders because an interested Chairman has a personal and professional stake in the quality and continuity of services provided to the fund. Independent Trustees exercise their informed business judgment to appoint an individual of their choosing to serve as Chairman, regardless of whether the Trustee happens to be independent or a member of management. The Independent Trustees have determined that they can act independently and effectively without having an Independent Trustee serve as Chairman and that a key structural component for assuring that they are in a position to do so is for the Independent Trustees to constitute a substantial majority for the Board. The Independent Trustees also regularly meet in executive session. Ned C. Lautenbach and David M. Thomas serve as Co-Lead Independent Trustees and as such each (i) acts as a liaison between the Independent Trustees and management with respect to matters important to the Independent Trustees and (ii) with management prepares agendas for Board meetings.
Fidelity® funds are overseen by different Boards of Trustees. The fund's Board oversees Fidelity's high income and certain equity funds, and other Boards oversee Fidelity's investment-grade bond, money market, asset allocation, and other equity funds. The asset allocation funds may invest in Fidelity® funds overseen by the fund's Board. The use of separate Boards, each with its own committee structure, allows the Trustees of each group of Fidelity® funds to focus on the unique issues of the funds they oversee, including common research, investment, and operational issues. On occasion, the separate Boards establish joint committees to address issues of overlapping consequences for the Fidelity® funds overseen by each Board.
The Trustees operate using a system of committees to facilitate the timely and efficient consideration of all matters of importance to the Trustees, the fund, and fund shareholders and to facilitate compliance with legal and regulatory requirements and oversight of the fund's activities and associated risks. The Board, acting through its committees, has charged FMR and its affiliates with (i) identifying events or circumstances the occurrence of which could have demonstrably adverse effects on the fund's business and/or reputation; (ii) implementing processes and controls to lessen the possibility that such events or circumstances occur or to mitigate the effects of such events or circumstances if they do occur; and (iii) creating and maintaining a system designed to evaluate continuously business and market conditions in order to facilitate the identification and implementation processes described in (i) and (ii) above. Because the day-to-day operations and activities of the fund are carried out by or through FMR, its affiliates, and other service providers, the fund's exposure to risks is mitigated but not eliminated by the processes overseen by the Trustees. While each of the Board's committees has responsibility for overseeing different aspects of the fund's activities, oversight is exercised primarily through the Operations, Audit, and Compliance Committees. Appropriate personnel, including but not limited to the fund's Chief Compliance Officer (CCO), FMR's internal auditor, the independent accountants, the fund's Treasurer and portfolio management personnel, make periodic reports to the Board's committees, as appropriate, including an annual review of Fidelity's risk management program for the Fidelity® funds. The responsibilities of each standing committee, including their oversight responsibilities, are described further under "Standing Committees of the Trustees."
Interested Trustees*:
Correspondence intended for a Trustee who is an interested person may be sent to Fidelity Investments, 245 Summer Street, Boston, Massachusetts 02210.
Name, Year of Birth; Principal Occupations and Other Relevant Experience+
Bettina Doulton (1964)
Year of Election or Appointment: 2020
Trustee
Ms. Doulton also serves as Trustee of other Fidelity® funds. Prior to her retirement, Ms. Doulton served in a variety of positions at Fidelity Investments, including as a managing director of research (2006-2007), portfolio manager to certain Fidelity® funds (1993-2005), equity analyst and portfolio assistant (1990-1993), and research assistant (1987-1990). Ms. Doulton currently owns and operates Phi Builders + Architects and Cellardoor Winery. Previously, Ms. Doulton served as a member of the Board of Brown Capital Management, LLC (2013-2018).
Robert A. Lawrence (1952)
Year of Election or Appointment: 2020
Trustee
Acting Chairman of the Board of Trustees
Mr. Lawrence also serves as Trustee of other funds. Previously, Mr. Lawrence served as a Member of the Advisory Board of certain funds. Prior to his retirement in 2008, Mr. Lawrence served as Vice President of certain Fidelity® funds (2006-2008), Senior Vice President, Head of High Income Division of Fidelity Management & Research Company (investment adviser firm, 2006-2008), and President of Fidelity Strategic Investments (investment adviser firm, 2002-2005).
* Determined to be an “Interested Trustee” by virtue of, among other things, his or her affiliation with the trust or various entities under common control with FMR.
+ The information includes the Trustee's principal occupation during the last five years and other information relating to the experience, attributes, and skills relevant to the Trustee's qualifications to serve as a Trustee, which led to the conclusion that the Trustee should serve as a Trustee for the fund.
Independent Trustees:
Correspondence intended for an Independent Trustee may be sent to Fidelity Investments, P.O. Box 55235, Boston, Massachusetts 02205-5235.
Name, Year of Birth; Principal Occupations and Other Relevant Experience+
Dennis J. Dirks (1948)
Year of Election or Appointment: 2018
Trustee
Mr. Dirks also serves as Trustee of other Fidelity® funds. Prior to his retirement in May 2003, Mr. Dirks served as Chief Operating Officer and as a member of the Board of The Depository Trust & Clearing Corporation (financial markets infrastructure), President, Chief Operating Officer and a member of the Board of The Depository Trust Company (DTC), President and a member of the Board of the National Securities Clearing Corporation (NSCC), Chief Executive Officer and a member of the Board of the Government Securities Clearing Corporation and Chief Executive Officer and a member of the Board of the Mortgage-Backed Securities Clearing Corporation. Mr. Dirks currently serves as a member of the Finance Committee (2016-present) and Board (2017-present) and is Treasurer (2018-present) of the Asolo Repertory Theatre.
Donald F. Donahue (1950)
Year of Election or Appointment: 2018
Trustee
Mr. Donahue also serves as Trustee of other Fidelity® funds. Mr. Donahue serves as President and Chief Executive Officer of Miranda Partners, LLC (risk consulting for the financial services industry, 2012-present). Previously, Mr. Donahue served as Chief Executive Officer (2006-2012), Chief Operating Officer (2003-2006) and Managing Director, Customer Marketing and Development (1999-2003) of The Depository Trust & Clearing Corporation (financial markets infrastructure). Mr. Donahue currently serves as a member (2007-present) and Co-Chairman (2016-present) of the Board of United Way of New York, a member of the Board of NYC Leadership Academy (2012-present) and a member of the Board of Advisors of Ripple Labs, Inc. (financial services, 2015-present). Mr. Donahue previously served as a member of the Advisory Board of certain Fidelity® funds (2015-2018).
Vicki L. Fuller (1957)
Year of Election or Appointment: 2020
Trustee
Ms. Fuller also serves as Trustee of other Fidelity® funds. Previously, Ms. Fuller served as a member of the Advisory Board of certain Fidelity® funds (2018-2020), Chief Investment Officer of the New York State Common Retirement Fund (2012-2018) and held a variety of positions at AllianceBernstein L.P. (global asset management, 1985-2012), including Managing Director (2006-2012) and Senior Vice President and Senior Portfolio Manager (2001-2006). Ms. Fuller currently serves as a member of the Board, Audit Committee and Nominating and Governance Committee of The Williams Companies, Inc. (natural gas infrastructure, 2018-present) and as a member of the Board of Treliant, LLC (consulting, 2019-present).
Patricia L. Kampling (1959)
Year of Election or Appointment: 2020
Trustee
Ms. Kampling also serves as Trustee of other Fidelity® funds. Prior to her retirement, Ms. Kampling served as Chairman of the Board and Chief Executive Officer (2012-2019), President and Chief Operating Officer (2011-2012) and Executive Vice President and Chief Financial Officer (2010-2011) of Alliant Energy Corporation. Ms. Kampling currently serves as a member of the Board, Compensation Committee and Executive Committee and as Chair of the Audit Committee of Briggs & Stratton Corporation (manufacturing, 2011-present) and as a member of the Board, Audit, Finance and Risk Committee and Safety, Environmental, Technology and Operations Committee of American Water Works Company, Inc. (utilities company, 2019-present). In addition, Ms. Kampling currently serves as a member of the Board of the Nature Conservancy, Wisconsin Chapter (2019-present). Previously, Ms. Kampling served as a Member of the Advisory Board of certain Fidelity® funds (2020), a member of the Board of Interstate Power and Light Company (2012-2019) and Wisconsin Power and Light Company (2012-2019) (each a subsidiary of Alliant Energy Corporation) and as a member of the Board and Workforce Development Committee of the Business Roundtable (2018-2019).
Alan J. Lacy (1953)
Year of Election or Appointment: 2018
Trustee
Mr. Lacy also serves as Trustee of other Fidelity® funds. Previously, Mr. Lacy served as Senior Adviser (2007-2014) of Oak Hill Capital Partners, L.P. (private equity), Chief Executive Officer (2005) and Vice Chairman (2005-2006) of Sears Holdings Corporation (retail), Chief Executive Officer and Chairman of the Board of Sears, Roebuck and Co. (retail, 2000-2005), Chairman (2014-2017) and a member of the Board (2010-2017) of Dave & Buster’s Entertainment, Inc. (restaurant and entertainment complexes) and a member of the Board of Bristol-Myers Squibb Company (global pharmaceuticals, 2008-2020). Mr. Lacy currently serves as a Trustee of the California Chapter of The Nature Conservancy (2015-present) and a member of the Board of the Center for Advanced Study in the Behavioral Sciences at Stanford University (2015-present).
Ned C. Lautenbach (1944)
Year of Election or Appointment: 2018
Trustee
Co-Lead Independent Trustee
Mr. Lautenbach also serves as Trustee of other Fidelity® funds. Mr. Lautenbach currently serves as Chair of the Board of Governors, State University System of Florida (2013-present) and is a member of the Council on Foreign Relations (1994-present). He is also a member and has in the past served as Chairman of the Board of Directors of Artis-Naples (2012-present). Previously, Mr. Lautenbach served as a member and then Lead Director of the Board of Directors of Eaton Corporation (diversified industrial, 1997-2016). He was also a Partner at Clayton, Dubilier & Rice, LLC (private equity investment, 1998-2010); as well as Director of Sony Corporation (2006-2007). In addition, Mr. Lautenbach had a 30-year career with IBM (technology company), during which time he served as Senior Vice President and as a member of the Corporate Executive Committee (1968-1998).
Joseph Mauriello (1944)
Year of Election or Appointment: 2018
Trustee
Mr. Mauriello also serves as Trustee of other Fidelity® funds. Prior to his retirement in January 2006, Mr. Mauriello served in numerous senior management positions including Deputy Chairman and Chief Operating Officer (2004-2005), and Vice Chairman of Financial Services (2002-2004) of KPMG LLP US (professional services, 1965-2005). Mr. Mauriello currently serves as a member of the Independent Directors Council Governing Council (2015-present). Previously, Mr. Mauriello served as a member of the Board of XL Group plc. (global insurance and re-insurance, 2006-2018).
Cornelia M. Small (1944)
Year of Election or Appointment: 2018
Trustee
Ms. Small also serves as Trustee of other Fidelity® funds. Previously, Ms. Small served as Chief Investment Officer, Director of Global Equity Investments and a member of Scudder, Stevens & Clark and Scudder Kemper Investments. Ms. Small previously served as a member of the Board (2009-2019) and Chair of the Investment Committee (2010-2019) of the Teagle Foundation and a member of the Investment Committee of the Berkshire Taconic Community Foundation (2008-2019).
Garnett A. Smith (1947)
Year of Election or Appointment: 2013
Trustee
Mr. Smith also serves as Trustee of other Fidelity® funds. Prior to his retirement, Mr. Smith served as Chairman and Chief Executive Officer (1990-1997) and President (1986-1990) of Inbrand Corp. (manufacturer of personal absorbent products). Prior to his employment with Inbrand Corp., he was employed by a retail fabric chain and North Carolina National Bank (now Bank of America). Mr. Smith previously served as a member of the Advisory Board of certain Fidelity® funds (2012-2013).
David M. Thomas (1949)
Year of Election or Appointment: 2018
Trustee
Co-Lead Independent Trustee
Mr. Thomas also serves as Trustee of other Fidelity® funds. Previously, Mr. Thomas served as Executive Chairman (2005-2006) and Chairman and Chief Executive Officer (2000-2005) of IMS Health, Inc. (pharmaceutical and healthcare information solutions). Mr. Thomas currently serves as Non-Executive Chairman of the Board of Fortune Brands Home and Security (home and security products, 2011-present), and a member of the Board (2004-present) and Presiding Director (2013-present) of Interpublic Group of Companies, Inc. (marketing communication).
Susan Tomasky (1953)
Year of Election or Appointment: 2020
Trustee
Ms. Tomasky also serves as Trustee of other Fidelity® funds. Prior to her retirement, Ms. Tomasky served in various executive officer positions at American Electric Power Company, Inc. (1998-2011), including most recently as President of AEP Transmission (2007-2011). Ms. Tomasky currently serves as a member of the Board and Sustainability Committee and as Chair of the Audit Committee of Marathon Petroleum Corporation (2018-present) and as a member of the Board, Corporate Governance Committee and Organization and Compensation Committee and as Chair of the Audit Committee of Public Service Enterprise Group, Inc. (utilities company, 2012-present). In addition, Ms. Tomasky currently serves as a member of the Board of the Columbus Regional Airport Authority (2007-present), as a member of the Board of the Royal Shakespeare Company – America (2009-present), as a member of the Board of the Columbus Association for the Performing Arts (2011-present) and as a member of the Board of Kenyon College (2016-present). Previously, Ms. Tomasky served as a Member of the Advisory Board of certain Fidelity® funds (2020), a member of the Board (2011-2019) and as Lead Independent Director (2015-2018) of Andeavor Corporation (previously Tesoro Corporation) (independent oil refiner and marketer) and as a member of the Board of Summit Midstream Partners LP (energy, 2012-2018).
Michael E. Wiley (1950)
Year of Election or Appointment: 2008
Trustee
Mr. Wiley also serves as Trustee of other Fidelity® funds. Previously, Mr. Wiley served as a member of the Advisory Board of certain Fidelity® funds (2018-2020), Chairman, President and CEO of Baker Hughes, Inc. (oilfield services, 2000-2004). Mr. Wiley also previously served as a member of the Board of Andeavor Corporation (independent oil refiner and marketer, 2005-2018), a member of the Board of Andeavor Logistics LP (natural resources logistics, 2015-2018) and a member of the Board of High Point Resources (exploration and production, 2005-2020).
+ The information includes the Trustee's principal occupation during the last five years and other information relating to the experience, attributes, and skills relevant to the Trustee's qualifications to serve as a Trustee, which led to the conclusion that the Trustee should serve as a Trustee for the fund.
Advisory Board Members and Officers:
Correspondence intended for a Member of the Advisory Board (if any) may be sent to Fidelity Investments, P.O. Box 55235, Boston, Massachusetts 02205-5235. Correspondence intended for an officer or Peter S. Lynch may be sent to Fidelity Investments, 245 Summer Street, Boston, Massachusetts 02210. Officers appear below in alphabetical order.
Name, Year of Birth; Principal Occupation
Peter S. Lynch (1944)
Year of Election or Appointment: 2018
Member of the Advisory Board
Mr. Lynch also serves as a Member of the Advisory Board of other Fidelity® funds. Mr. Lynch is Vice Chairman and a Director of Fidelity Management & Research Company LLC (investment adviser firm). In addition, Mr. Lynch serves as a Trustee of Boston College and as the Chairman of the Inner-City Scholarship Fund. Previously, Mr. Lynch served as Vice Chairman and a Director of FMR Co., Inc. (investment adviser firm) and on the Special Olympics International Board of Directors (1997-2006).
Elizabeth Paige Baumann (1968)
Year of Election or Appointment: 2017
Anti-Money Laundering (AML) Officer
Ms. Baumann also serves as AML Officer of other funds. She is Chief AML Officer (2012-present) and Senior Vice President (2014-present) of FMR LLC (diversified financial services company) and is an employee of Fidelity Investments. Previously, Ms. Baumann served as AML Officer of certain funds (2017-2019), as AML Officer of the funds (2012-2016), and Vice President (2007-2014) and Deputy Anti-Money Laundering Officer (2007-2012) of FMR LLC.
Craig S. Brown (1977)
Year of Election or Appointment: 2019
Assistant Treasurer
Mr. Brown also serves as Assistant Treasurer of other funds. Mr. Brown is an employee of Fidelity Investments (2013-present).
John J. Burke III (1964)
Year of Election or Appointment: 2018
Chief Financial Officer
Mr. Burke also serves as Chief Financial Officer of other funds. Mr. Burke serves as Head of Investment Operations for Fidelity Fund and Investment Operations (2018-present) and is an employee of Fidelity Investments (1998-present). Previously Mr. Burke served as head of Asset Management Investment Operations (2012-2018).
William C. Coffey (1969)
Year of Election or Appointment: 2019
Assistant Secretary
Mr. Coffey also serves as Assistant Secretary of other funds. He is Senior Vice President and Deputy General Counsel of FMR LLC (diversified financial services company, 2010-present), and is an employee of Fidelity Investments. Previously, Mr. Coffey served as Secretary and CLO of certain funds (2018-2019); CLO, Secretary, and Senior Vice President of Fidelity Management & Research Company and FMR Co., Inc. (investment adviser firms, 2018-2019); Secretary of Fidelity SelectCo, LLC and Fidelity Investments Money Management, Inc. (investment adviser firms, 2018-2019); CLO of Fidelity Management & Research (Hong Kong) Limited, FMR Investment Management (UK) Limited, and Fidelity Management & Research (Japan) Limited (investment adviser firms, 2018-2019); and Assistant Secretary of certain funds (2009-2018).
Timothy M. Cohen (1969)
Year of Election or Appointment: 2018
Vice President
Mr. Cohen also serves as Vice President of other funds. Mr. Cohen serves as Co-Head of Equity (2018-present), a Director of Fidelity Management & Research (Japan) Limited (investment adviser firm, 2016-present), and is an employee of Fidelity Investments. Previously, Mr. Cohen served as Executive Vice President of Fidelity SelectCo, LLC (2019), Head of Global Equity Research (2016-2018), Chief Investment Officer - Equity and a Director of Fidelity Management & Research (U.K.) Inc. (investment adviser firm, 2013-2015) and as a Director of Fidelity Management & Research (Hong Kong) Limited (investment adviser firm, 2017).
Jonathan Davis (1968)
Year of Election or Appointment: 2010
Assistant Treasurer
Mr. Davis also serves as Assistant Treasurer of other funds. Mr. Davis serves as Assistant Treasurer of FMR Capital, Inc. (2017-present) and is an employee of Fidelity Investments. Previously, Mr. Davis served as Vice President and Associate General Counsel of FMR LLC (diversified financial services company, 2003-2010).
Laura M. Del Prato (1964)
Year of Election or Appointment: 2018
Assistant Treasurer
Ms. Del Prato also serves as an officer of other funds. Ms. Del Prato is an employee of Fidelity Investments (2017-present). Previously, Ms. Del Prato served as President and Treasurer of The North Carolina Capital Management Trust: Cash Portfolio and Term Portfolio (2018-2020). Prior to joining Fidelity Investments, Ms. Del Prato served as a Managing Director and Treasurer of the JPMorgan Mutual Funds (2014-2017). Prior to JPMorgan, Ms. Del Prato served as a partner at Cohen Fund Audit Services (accounting firm, 2012-2013) and KPMG LLP (accounting firm, 2004-2012).
Colm A. Hogan (1973)
Year of Election or Appointment: 2020
Assistant Treasurer
Mr. Hogan also serves as an officer of other funds. Mr. Hogan serves as Assistant Treasurer of FMR Capital, Inc. (2017-present) and is an employee of Fidelity Investments (2005-present). Previously, Mr. Hogan served as Deputy Treasurer of certain Fidelity® funds (2016-2020) and Assistant Treasurer of certain Fidelity® funds (2016-2018).
Pamela R. Holding (1964)
Year of Election or Appointment: 2018
Vice President
Ms. Holding also serves as Vice President of other funds. Ms. Holding serves as Co-Head of Equity (2018-present) and is an employee of Fidelity Investments (2013-present). Previously, Ms. Holding served as Executive Vice President of Fidelity SelectCo, LLC (2019) and as Chief Investment Officer of Fidelity Institutional Asset Management (2013-2018).
Cynthia Lo Bessette (1969)
Year of Election or Appointment: 2019
Secretary and Chief Legal Officer (CLO)
Ms. Lo Bessette also serves as an officer of other funds. Ms. Lo Bessette serves as CLO, Secretary, and Senior Vice President of Fidelity Management & Research Company LLC (investment adviser firm, 2019-present); and CLO of Fidelity Management & Research (Hong Kong) Limited, FMR Investment Management (UK) Limited, and Fidelity Management & Research (Japan) Limited (investment adviser firms, 2019-present). She is a Senior Vice President and Deputy General Counsel of FMR LLC (diversified financial services company, 2019-present), and is an employee of Fidelity Investments. Previously, Ms. Lo Bessette served as CLO, Secretary, and Senior Vice President of FMR Co., Inc. (investment adviser firm, 2019); Secretary of Fidelity SelectCo, LLC and Fidelity Investments Money Management, Inc. (investment adviser firms, 2019). Prior to joining Fidelity Investments, Ms. Lo Bessette was Executive Vice President, General Counsel (2016-2019) and Senior Vice President, Deputy General Counsel (2015-2016) of OppenheimerFunds (investment management company) and Deputy Chief Legal Officer (2013-2015) of Jennison Associates LLC (investment adviser firm).
Chris Maher (1972)
Year of Election or Appointment: 2020
Deputy Treasurer
Mr. Maher also serves as an officer of other funds. Mr. Maher serves as Assistant Treasurer of FMR Capital, Inc. (2017-present), and is an employee of Fidelity Investments (2008-present). Previously, Mr. Maher served as Assistant Treasurer of certain funds (2013-2020); Vice President of Asset Management Compliance (2013), Vice President of the Program Management Group of FMR (investment adviser firm, 2010-2013), and Vice President of Valuation Oversight (2008-2010).
Jason P. Pogorelec (1975)
Year of Election or Appointment: 2020
Chief Compliance Officer
Mr. Pogorelec also serves as Chief Compliance Officer of other funds. Mr. Pogorelec is a senior Vice President of Asset Management Compliance for Fidelity Investments and is an employee of Fidelity Investments (2006-present). Previously, Mr. Pogorelec served as Vice President, Associate General Counsel for Fidelity Investments (2010-2020) and Assistant Secretary of certain Fidelity funds (2015-2020).
Stacie M. Smith (1974)
Year of Election or Appointment: 2018
President and Treasurer
Ms. Smith also serves as an officer of other funds. Ms. Smith serves as Assistant Treasurer of FMR Capital, Inc. (2017-present), is an employee of Fidelity Investments (2009-present), and has served in other fund officer roles. Prior to joining Fidelity Investments, Ms. Smith served as Senior Audit Manager of Ernst & Young LLP (accounting firm, 1996-2009). Previously, Ms. Smith served as Assistant Treasurer (2013-2019) and Deputy Treasurer (2013-2016) of certain Fidelity® funds.
Marc L. Spector (1972)
Year of Election or Appointment: 2017
Assistant Treasurer
Mr. Spector also serves as an officer of other funds. Mr. Spector serves as Assistant Treasurer of FMR Capital, Inc. (2017-present) and is an employee of Fidelity Investments (2016-present). Prior to joining Fidelity Investments, Mr. Spector served as Director at the Siegfried Group (accounting firm, 2013-2016), and prior to Siegfried Group as audit senior manager at Deloitte & Touche LLP (accounting firm, 2005-2013).
Jim Wegmann (1979)
Year of Election or Appointment: 2019
Assistant Treasurer
Mr. Wegmann also serves as Assistant Treasurer of other funds. Mr. Wegmann is an employee of Fidelity Investments (2011-present).
Shareholder Expense Example
As a shareholder, you incur two types of costs: (1) transaction costs, which may include sales charges (loads) on purchase payments or redemption proceeds, as applicable and (2) ongoing costs, which generally include management fees, distribution and/or service (12b-1) fees and other Fund expenses. This Example is intended to help you understand your ongoing costs (in dollars) of investing in a fund and to compare these costs with the ongoing costs of investing in other mutual funds.
The Example is based on an investment of $1,000 invested at the beginning of the period and held for the entire period (February 1, 2020 to July 31, 2020).
Actual Expenses
The first line of the accompanying table provides information about actual account values and actual expenses. You may use the information in this line, together with the amount you invested, to estimate the expenses that you paid over the period. Simply divide your account value by $1,000.00 (for example, an $8,600 account value divided by $1,000.00 = 8.6), then multiply the result by the number in the first line for a class/Fund under the heading entitled "Expenses Paid During Period" to estimate the expenses you paid on your account during this period. If any fund is a shareholder of any underlying mutual funds or exchange-traded funds (ETFs) (the Underlying Funds), such fund indirectly bears its proportional share of the expenses of the Underlying Funds in addition to the direct expenses incurred presented in the table. These fees and expenses are not included in the annualized expense ratio used to calculate the expense estimate in the table below.
Hypothetical Example for Comparison Purposes
The second line of the accompanying table provides information about hypothetical account values and hypothetical expenses based on the actual expense ratio and an assumed rate of return of 5% per year before expenses, which is not the actual return. The hypothetical account values and expenses may not be used to estimate the actual ending account balance or expenses you paid for the period. You may use this information to compare the ongoing costs of investing in the Fund and other funds. To do so, compare this 5% hypothetical example with the 5% hypothetical examples that appear in the shareholder reports of the other funds. If any fund is a shareholder of any Underlying Funds, such fund indirectly bears its proportional share of the expenses of the Underlying Funds in addition to the direct expenses as presented in the table. These fees and expenses are not included in the annualized expense ratio used to calculate the expense estimate in the table below.
Please note that the expenses shown in the table are meant to highlight your ongoing costs only and do not reflect any transaction costs. Therefore, the second line of the table is useful in comparing ongoing costs only, and will not help you determine the relative total costs of owning different funds.
| | Annualized Expense Ratio-A | Beginning
Account Value
February 1, 2020 | Ending
Account Value
July 31, 2020 | Expenses Paid
During Period-B
February 1, 2020
to July 31, 2020 |
| Fidelity Real Estate Investment Portfolio | .75% | | | |
| Actual | | $1,000.00 | $881.40 | $3.51 |
| Hypothetical-C | | $1,000.00 | $1,021.13 | $3.77 |
A Annualized expense ratio reflects expenses net of applicable fee waivers.
B Expenses are equal to the annualized expense ratio, multiplied by the average account value over the period, multiplied by 182/ 366 (to reflect the one-half year period). The fees and expenses of any Underlying Funds are not included in each annualized expense ratio.
C 5% return per year before expenses
Distributions (Unaudited)
The Board of Trustees of Fidelity Real Estate Investment Portfolio voted to pay on September 8, 2020, to shareholders of record at the opening of business on September 4, 2020, a distribution of $0.724 per share derived from capital gains realized from sales of portfolio securities and a dividend of $0.197 per share from net investment income.
The fund hereby designates as a capital gain dividend with respect to the taxable year ended July 31, 2020, $ 177,958,486 or, if subsequently determined to be different, the net capital gain of such year.
A total of 0.13% of the dividends distributed during the fiscal year was derived from interest on U.S. Government securities which is generally exempt from state income tax.
The fund designates 1% of the dividends distributed in September and December, respectively during the fiscal year as amounts which may be taken into account as a dividend for the purposes of the maximum rate under section 1(h)(11) of the Internal Revenue Code.
The fund designates 98% and 91% of the dividends distributed in September and December, respectively during the fiscal year as a section 199A dividend.
The fund will notify shareholders in January 2021 of amounts for use in preparing 2020 income tax returns.
Liquidity Risk Management Program
The Securities and Exchange Commission adopted Rule 22e-4 under the Investment Company Act of 1940 (the Liquidity Rule) to promote effective liquidity risk management throughout the open-end investment company industry, thereby reducing the risk that funds will be unable to meet their redemption obligations and mitigating dilution of the interests of fund shareholders.
The Fund has adopted and implemented a liquidity risk management program pursuant to the Liquidity Rule (the Program) effective December 1, 2018. The Program is reasonably designed to assess and manage the Fund’s liquidity risk and to comply with the requirements of the Liquidity Rule. The Fund’s Board of Trustees (the Board) has designated the Fund’s investment adviser as administrator of the Program. The Fidelity advisers have established a Liquidity Risk Management Committee (the LRM Committee) to manage the Program for each of the Fidelity Funds. The LRM Committee monitors the adequacy and effectiveness of implementation of the Program and on a periodic basis assesses each Fund’s liquidity risk based on a variety of factors including (1) the Fund’s investment strategy, (2) portfolio liquidity and cash flow projections during normal and reasonably foreseeable stressed conditions, (3) shareholder redemptions, (4) borrowings and other funding sources and (5) in the case of exchange-traded funds, certain additional factors including the effect of the Fund’s prices and spreads, market participants, and basket compositions on the overall liquidity of the Fund’s portfolio, as applicable.
In accordance with the Program, each of the Fund’s portfolio investments is classified into one of four liquidity categories described below based on a determination of a reasonable expectation for how long it would take to convert the investment to cash (or sell or dispose of the investment) without significantly changing its market value.
- Highly liquid investments – cash or convertible to cash within three business days or less
- Moderately liquid investments – convertible to cash in three to seven calendar days
- Less liquid investments – can be sold or disposed of, but not settled, within seven calendar days
- Illiquid investments – cannot be sold or disposed of within seven calendar days
Liquidity classification determinations take into account a variety of factors including various market, trading and investment-specific considerations, as well as market depth, and generally utilize analysis from a third-party liquidity metrics service.
The Liquidity Rule places a 15% limit on a fund’s illiquid investments and requires funds that do not primarily hold assets that are highly liquid investments to determine and maintain a minimum percentage of the fund’s net assets to be invested in highly liquid investments (highly liquid investment minimum or HLIM). The Program includes provisions reasonably designed to comply with the 15% limit on illiquid investments and for determining, periodically reviewing and complying with the HLIM requirement as applicable.
At a recent meeting of the Fund’s Board of Trustees, the LRM Committee provided a written report to the Board pertaining to the operation, adequacy, and effectiveness of implementation of the Program for the annual period from December 1, 2018 through November 30, 2019. The report concluded that the Program has been implemented and is operating effectively and is reasonably designed to assess and manage the Fund’s liquidity risk.
Proxy Voting Results
A special meeting of shareholders was held on June 9, 2020. The results of votes taken among shareholders on the proposal before them are reported below. Each vote reported represents one dollar of net asset value held on the record date for the meeting.
PROPOSAL 1
To elect a Board of Trustees.
| | # of
Votes | % of
Votes |
| Dennis J. Dirks |
| Affirmative | 32,463,705,305.665 | 92.437 |
| Withheld | 2,655,951,104.308 | 7.563 |
| TOTAL | 35,119,656,409.973 | 100.000 |
| Donald F. Donahue |
| Affirmative | 32,446,843,861.354 | 92.389 |
| Withheld | 2,672,812,548.619 | 7.611 |
| TOTAL | 35,119,656,409.973 | 100.000 |
| Bettina Doulton |
| Affirmative | 32,610,463,757.584 | 92.855 |
| Withheld | 2,509,192,652.389 | 7.145 |
| TOTAL | 35,119,656,409.973 | 100.000 |
| Vicki L. Fuller |
| Affirmative | 32,688,213,522.720 | 93.077 |
| Withheld | 2,431,442,887.253 | 6.923 |
| TOTAL | 35,119,656,409.973 | 100.000 |
| Patricia L. Kampling |
| Affirmative | 32,313,755,598.535 | 92.010 |
| Withheld | 2,805,900,811.438 | 7.990 |
| TOTAL | 35,119,656,409.973 | 100.000 |
| Alan J. Lacy |
| Affirmative | 31,990,158,754.948 | 91.089 |
| Withheld | 3,129,497,655.026 | 8.911 |
| TOTAL | 35,119,656,409.973 | 100.000 |
| Ned C. Lautenbach |
| Affirmative | 32,043,019,991.143 | 91.240 |
| Withheld | 3,076,636,418.830 | 8.760 |
| TOTAL | 35,119,656,409.973 | 100.000 |
| Robert A. Lawrence |
| Affirmative | 32,150,842,398.009 | 91.547 |
| Withheld | 2,968,814,011.965 | 8.453 |
| TOTAL | 35,119,656,409.973 | 100.000 |
| Joseph Mauriello |
| Affirmative | 32,082,201,213.166 | 91.351 |
| Withheld | 3,037,455,196.807 | 8.649 |
| TOTAL | 35,119,656,409.973 | 100.000 |
| Cornelia M. Small |
| Affirmative | 32,207,976,835.934 | 91.709 |
| Withheld | 2,911,679,574.039 | 8.291 |
| TOTAL | 35,119,656,409.973 | 100.000 |
| Garnett A. Smith |
| Affirmative | 32,102,654,343.096 | 91.409 |
| Withheld | 3,017,002,066.877 | 8.591 |
| TOTAL | 35,119,656,409.973 | 100.000 |
| David M. Thomas |
| Affirmative | 32,150,749,424.556 | 91.546 |
| Withheld | 2,968,906,985.418 | 8.454 |
| TOTAL | 35,119,656,409.973 | 100.000 |
| Susan Tomasky |
| Affirmative | 32,381,933,484.515 | 92.205 |
| Withheld | 2,737,722,925.459 | 7.795 |
| TOTAL | 35,119,656,409.973 | 100.000 |
| Michael E. Wiley |
| Affirmative | 32,135,064,741.973 | 91.502 |
| Withheld | 2,984,591,668.000 | 8.498 |
| TOTAL | 35,119,656,409.973 | 100.000 |
|
| Proposal 1 reflects trust wide proposal and voting results. |
REA-ANN-0920
1.700141.123
Item 2.
Code of Ethics
As of the end of the period, July 31, 2020, Fidelity Select Portfolios (the trust) has adopted a code of ethics, as defined in Item 2 of Form N-CSR, that applies to its President and Treasurer and its Chief Financial Officer. A copy of the code of ethics is filed as an exhibit to this Form N-CSR.
Item 3.
Audit Committee Financial Expert
The Board of Trustees of the trust has determined that Joseph Mauriello is an audit committee financial expert, as defined in Item 3 of Form N-CSR. Mr. Mauriello is independent for purposes of Item 3 of Form N-CSR.
Item 4.
Principal Accountant Fees and Services
Fees and Services
The following table presents fees billed by Deloitte & Touche LLP, the member firms of Deloitte Touche Tohmatsu, and their respective affiliates (collectively, “Deloitte Entities”) in each of the last two fiscal years for services rendered to Fidelity Flex Real Estate Fund, Fidelity International Real Estate Fund and Fidelity Real Estate Investment Portfolio (the “Funds”):
Services Billed by Deloitte Entities
July 31, 2020 FeesA
| | | | |
| Audit Fees | Audit-Related Fees | Tax Fees | All Other Fees |
Fidelity Flex Real Estate Fund | $37,600 | $- | $8,300 | $800 |
Fidelity International Real Estate Fund | $43,500 | $- | $8,700 | $1,000 |
Fidelity Real Estate Investment Portfolio | $37,700 | $- | $8,000 | $800 |
| | | | |
| Audit Fees | Audit-Related Fees | Tax Fees | All Other Fees |
Fidelity Flex Real Estate Fund | $40,000 | $100 | $6,000 | $1,200 |
Fidelity International Real Estate Fund | $46,000 | $100 | $6,200 | $1,300 |
Fidelity Real Estate Investment Portfolio | $43,000 | $100 | $5,700 | $1,200 |
A Amounts may reflect rounding.
The following table(s) present(s) fees billed by Deloitte Entities that were required to be approved by the Audit Committee for services that relate directly to the operations and financial reporting of the Fund(s) and that are rendered on behalf of Fidelity Management & Research Company LLC ("FMR") and entities controlling, controlled by, or under common control with FMR (not including any sub-adviser whose role is primarily portfolio management and is subcontracted with or overseen by another investment adviser) that provide ongoing services to the Fund(s) (“Fund Service Providers”):
Services Billed by Deloitte Entities
| | |
| July 31, 2020A | July 31, 2019A |
Audit-Related Fees | $- | $290,000 |
Tax Fees | $3,000 | $- |
All Other Fees | $- | $- |
A Amounts may reflect rounding.
“Audit-Related Fees” represent fees billed for assurance and related services that are reasonably related to the performance of the fund audit or the review of the fund's financial statements and that are not reported under Audit Fees.
“Tax Fees” represent fees billed for tax compliance, tax advice or tax planning that relate directly to the operations and financial reporting of the fund.
“All Other Fees” represent fees billed for services provided to the fund or Fund Service Provider, a significant portion of which are assurance related, that relate directly to the operations and financial reporting of the fund, excluding those services that are reported under Audit Fees, Audit-Related Fees or Tax Fees.
Assurance services must be performed by an independent public accountant.
* * *
The aggregate non-audit fees billed by Deloitte Entities for services rendered to the Fund(s), FMR (not including any sub-adviser whose role is primarily portfolio management and is subcontracted with or overseen by another investment adviser), and any Fund Service Provider for each of the last two fiscal years of the Fund(s) are as follows:
| | |
Billed By | July 31, 2020A | July 31, 2019A |
Deloitte Entities | $532,200 | $720,000 |
A Amounts may reflect rounding.
The trust's Audit Committee has considered non-audit services that were not pre-approved that were provided by Deloitte Entities to Fund Service Providers to be compatible with maintaining the independence of Deloitte Entities in its(their) audit of the Fund(s), taking into account representations from Deloitte Entities, in accordance with Public Company Accounting Oversight Board rules, regarding its independence from the Fund(s) and its(their) related entities and FMR’s review of the appropriateness and permissibility under applicable law of such non-audit services prior to their provision to the Fund(s) Service Providers.
Audit Committee Pre-Approval Policies and Procedures
The trust’s Audit Committee must pre-approve all audit and non-audit services provided by a fund’s independent registered public accounting firm relating to the operations or financial reporting of the fund. Prior to the commencement of any audit or non-audit services to a fund, the Audit Committee reviews the services to determine whether they are appropriate and permissible under applicable law.
The Audit Committee has adopted policies and procedures to, among other purposes, provide a framework for the Committee’s consideration of non-audit services by the audit firms that audit the Fidelity funds. The policies and procedures require that any non-audit service provided by a fund audit firm to a Fidelity fund and any non-audit service provided by a fund auditor to a Fund Service Provider that relates directly to the operations and financial reporting of a Fidelity fund (“Covered Service”) are subject to approval by the Audit Committee before such service is provided.
All Covered Services must be approved in advance of provision of the service either: (i) by formal resolution of the Audit Committee, or (ii) by oral or written approval of the service by the Chair of the Audit Committee (or if the Chair is unavailable, such other member of the Audit Committee as may be designated by the Chair to act in the Chair’s absence). The approval contemplated by (ii) above is permitted where the Treasurer determines that action on such an engagement is necessary before the next meeting of the Audit Committee.
Non-audit services provided by a fund audit firm to a Fund Service Provider that do not relate directly to the operations and financial reporting of a Fidelity fund are reported to the Audit Committee periodically.
Non-Audit Services Approved Pursuant to Rule 2-01(c)(7)(i)(C) and (ii) of Regulation S-X (“De Minimis Exception”)
There were no non-audit services approved or required to be approved by the Audit Committee pursuant to the De Minimis Exception during the Fund’s(s’) last two fiscal
years relating to services provided to (i) the Fund(s) or (ii) any Fund Service Provider that relate directly to the operations and financial reporting of the Fund(s).
Item 5.
Audit Committee of Listed Registrants
Not applicable.
Item 6.
Investments
(a)
Not applicable.
(b)
Not applicable.
Item 7.
Disclosure of Proxy Voting Policies and Procedures for Closed-End Management Investment Companies
Not applicable.
Item 8.
Portfolio Managers of Closed-End Management Investment Companies
Not applicable.
Item 9.
Purchase of Equity Securities by Closed-End Management Investment Company and Affiliated Purchasers
Not applicable.
Item 10.
Submission of Matters to a Vote of Security Holders
There were no material changes to the procedures by which shareholders may recommend nominees to the trust’s Board of Trustees.
Item 11.
Controls and Procedures
(a)(i) The President and Treasurer and the Chief Financial Officer have concluded that the trust’s disclosure controls and procedures (as defined in Rule 30a-3(c) under the Investment Company Act) provide reasonable assurances that material information relating to the trust is made known to them by the appropriate persons, based on their evaluation of these controls and procedures as of a date within 90 days of the filing date of this report.
(a)(ii) There was no change in the trust’s internal control over financial reporting (as defined in Rule 30a-3(d) under the Investment Company Act) that occurred during the period covered by this report that has materially affected, or is reasonably likely to materially affect, the trust’s internal control over financial reporting.
Item 12.
Disclosure of Securities Lending Activities for Closed-End Management
Investment Companies
Not applicable.
Item 13.
Exhibits
SIGNATURES
Pursuant to the requirements of the Securities Exchange Act of 1934 and the Investment Company Act of 1940, the registrant has duly caused this report to be signed on its behalf by the undersigned, thereunto duly authorized.
Fidelity Select Portfolios
| |
By: | /s/Stacie M. Smith |
| Stacie M. Smith |
| President and Treasurer |
|
|
Date: | September 21, 2020 |
Pursuant to the requirements of the Securities Exchange Act of 1934 and the Investment Company Act of 1940, this report has been signed below by the following persons on behalf of the registrant and in the capacities and on the dates indicated.
| |
By: | /s/Stacie M. Smith |
| Stacie M. Smith |
| President and Treasurer |
|
|
Date: | September 21, 2020 |
| |
By: | /s/John J. Burke III |
| John J. Burke III |
| Chief Financial Officer |
|
|
Date: | September 21, 2020 |