UNITED STATES
SECURITIES AND EXCHANGE COMMISSION
Washington, D.C. 20549
FORM N-CSR
CERTIFIED SHAREHOLDER REPORT OF REGISTERED
MANAGEMENT INVESTMENT COMPANIES
Investment Company Act file number 811-03114
Fidelity Select Portfolios
(Exact name of registrant as specified in charter)
245 Summer St., Boston, Massachusetts 02210
(Address of principal executive offices) (Zip code)
Cynthia Lo Bessette, Secretary
245 Summer St.
Boston, Massachusetts 02210
(Name and address of agent for service)
Registrant's telephone number, including area code:
617-563-7000
| |
Date of fiscal year end: | February 28 |
|
|
Date of reporting period: | February 28, 2021 |
Item 1.
Reports to Stockholders
Fidelity® Select Portfolios®
Consumer Discretionary Sector
Automotive Portfolio
Communication Services Portfolio
Construction and Housing Portfolio
Consumer Discretionary Portfolio
Leisure Portfolio
Retailing Portfolio
Annual Report
February 28, 2021
Includes Fidelity and Fidelity Advisor share classes


Contents
To view a fund's proxy voting guidelines and proxy voting record for the 12-month period ended June 30, visit http://www.fidelity.com/proxyvotingresults or visit the Securities and Exchange Commission's (SEC) web site at http://www.sec.gov.
You may also call 1-800-544-8544 if you’re an individual investing directly with Fidelity, call 1-800-835-5092 if you’re a plan sponsor or participant with Fidelity as your recordkeeper or call 1-877-208-0098 on institutional accounts or if you’re an advisor or invest through one to request a free copy of the proxy voting guidelines.
Standard & Poor's, S&P and S&P 500 are registered service marks of The McGraw-Hill Companies, Inc. and have been licensed for use by Fidelity Distributors Corporation.
Other third-party marks appearing herein are the property of their respective owners.
All other marks appearing herein are registered or unregistered trademarks or service marks of FMR LLC or an affiliated company. © 2021 FMR LLC. All rights reserved.
This report and the financial statements contained herein are submitted for the general information of the shareholders of the Funds. This report is not authorized for distribution to prospective investors in the Funds unless preceded or accompanied by an effective prospectus.
A fund files its complete schedule of portfolio holdings with the SEC for the first and third quarters of each fiscal year on Form N-PORT. Forms N-PORT are available on the SEC’s web site at http://www.sec.gov. A fund's Forms N-PORT may be reviewed and copied at the SEC’s Public Reference Room in Washington, DC. Information regarding the operation of the SEC's Public Reference Room may be obtained by calling 1-800-SEC-0330.
For a complete list of a fund's portfolio holdings, view the most recent holdings listing, semiannual report, or annual report on Fidelity's web site at http://www.fidelity.com, http://www.institutional.fidelity.com, or http://www.401k.com, as applicable.
NOT FDIC INSURED •MAY LOSE VALUE •NO BANK GUARANTEE
Neither the Funds nor Fidelity Distributors Corporation is a bank.
Note to Shareholders:
Early in 2020, the outbreak and spread of a new coronavirus emerged as a public health emergency that had a major influence on financial markets, primarily based on its impact on the global economy and the outlook for corporate earnings. The virus causes a respiratory disease known as COVID-19. On March 11, 2020 the World Health Organization declared the COVID-19 outbreak a pandemic, citing sustained risk of further global spread.
In the weeks following, as the crisis worsened, we witnessed an escalating human tragedy with wide-scale social and economic consequences from coronavirus-containment measures. The outbreak of COVID-19 prompted a number of measures to limit the spread, including travel and border restrictions, quarantines, and restrictions on large gatherings. In turn, these resulted in lower consumer activity, diminished demand for a wide range of products and services, disruption in manufacturing and supply chains, and – given the wide variability in outcomes regarding the outbreak – significant market uncertainty and volatility. Amid the turmoil, global governments and central banks took unprecedented action to help support consumers, businesses, and the broader economies, and to limit disruption to financial systems.
The situation continues to unfold, and the extent and duration of its impact on financial markets and the economy remain highly uncertain. Extreme events such as the coronavirus crisis are “exogenous shocks” that can have significant adverse effects on mutual funds and their investments. Although multiple asset classes may be affected by market disruption, the duration and impact may not be the same for all types of assets.
Fidelity is committed to helping you stay informed amid news about COVID-19 and during increased market volatility, and we’re taking extra steps to be responsive to customer needs. We encourage you to visit our websites, where we offer ongoing updates, commentary, and analysis on the markets and our funds.
Automotive Portfolio
Performance: The Bottom Line
Average annual total return reflects the change in the value of an investment, assuming reinvestment of distributions from dividend income and capital gains (the profits earned upon the sale of securities that have grown in value, if any) and assuming a constant rate of performance each year. The hypothetical investment and the average annual total returns do not reflect the deduction of taxes that a shareholder would pay on fund distributions or the redemption of fund shares. During periods of reimbursement by Fidelity, a fund’s total return will be greater than it would be had the reimbursement not occurred. How a fund did yesterday is no guarantee of how it will do tomorrow.
Average Annual Total Returns
| For the periods ended February 28, 2021 | Past 1 year | Past 5 years | Past 10 years |
| Automotive Portfolio | 78.19% | 20.86% | 11.50% |
$10,000 Over 10 Years
Let's say hypothetically that $10,000 was invested in Automotive Portfolio on February 28, 2011 .
The chart shows how the value of your investment would have changed, and also shows how the S&P 500® Index performed over the same period.
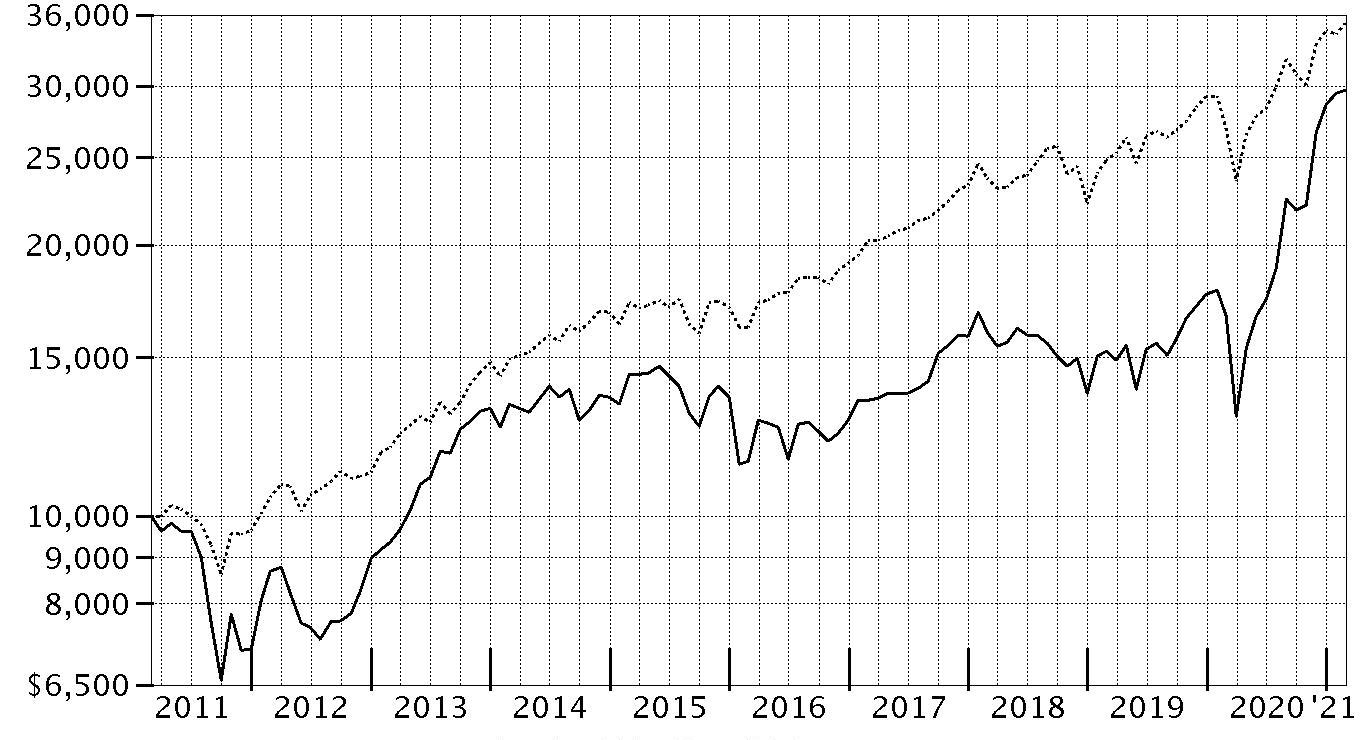
| Period Ending Values |
| $29,692 | Automotive Portfolio |
| $35,259 | S&P 500® Index |
Automotive Portfolio
Management's Discussion of Fund Performance
Market Recap: The S&P 500
® index gained 31.29% for the 12 months ending February 28, 2021, a volatile but productive period for U.S. risk assets. The early-2020 outbreak and spread of COVID-19 resulted in stocks suffering one of the quickest declines on record, through March 23, followed by a historic rebound that included the index closing 2020 at an all-time high and gaining modest ground in the first two months of the new year. The crisis and containment efforts caused broad contraction in economic activity, along with extreme uncertainty and dislocation in financial markets. A rapid and expansive U.S. monetary/fiscal-policy response partially offset the economic disruption and fueled the market surge, as did resilient corporate earnings. The rally slowed in September, when stocks began a two-month retreat amid Congress’s inability to reach a deal on additional fiscal stimulus, as well as concerns about election uncertainty, indications the U.S. economic recovery could be slowing and a new wave of COVID-19 cases. A shift in momentum began in October and accelerated following the U.S. elections, with the approval of three breakthrough COVID-19 vaccines and prospects for additional government stimulus fueling the “reflation trade” through February 28. By sector for the full 12 months, information technology (+50%) and consumer discretionary (+43%) led all gainers. Materials (+42%) and communication services (+37%) also stood out. In contrast, the defensive utilities (-3%) and real estate sectors (+5%) notably lagged.
Comments from Portfolio Manager Elliot Mattingly: For the fiscal year ending February 28, 2021, the fund gained 78.19%, outperforming the 77.33% advance of the FactSet Automotive Linked Index, as well as the broad-based S&P 500
® index. The top contributor to performance versus the industry index was security selection in automotive retail. An overweighting in the construction machinery & heavy trucks group, along with strong picks among automobile manufacturers, further bolstered the fund's relative result. The biggest individual relative contributor was an underweight position in Honda Motor (+9%), which was among the portfolio’s biggest holdings. Also adding value was our overweighting in Carvana, which gained 249% and was position I increased exposure to the past 12 months. Another notable relative contributor was an outsized stake in Tesla (+384%), the fund's largest holding overall. In contrast, the primary detractor from performance versus the industry index was subpar stock selection in construction machinery & heavy trucks. An underweighting in automobile manufacturers, as well as investment choices in trucking, further hampered the portfolio’s relative return. Weighing on performance most from a stock-specific standpoint was an underweight stake in NIO (+545%). This was a newly established holding within the portfolio the past 12 months. A non-index stake in Allison Transmission was another notable relative detractor, due to its roughly -5% result. We added to our stake in the company this period. Also hampering performance was a sizable underweighting in Tata Motors, which gained about 140% and was not held at period end. Notable changes in positioning include reduced exposure to the distributors group and a higher allocation to automotive retail firms.
The views expressed above reflect those of the portfolio manager(s) only through the end of the period as stated on the cover of this report and do not necessarily represent the views of Fidelity or any other person in the Fidelity organization. Any such views are subject to change at any time based upon market or other conditions and Fidelity disclaims any responsibility to update such views. These views may not be relied on as investment advice and, because investment decisions for a Fidelity fund are based on numerous factors, may not be relied on as an indication of trading intent on behalf of any Fidelity fund.
Automotive Portfolio
Investment Summary (Unaudited)
Top Ten Stocks as of February 28, 2021
| | % of fund's net assets |
| Tesla, Inc. | 11.4 |
| General Motors Co. | 11.1 |
| Toyota Motor Corp. sponsored ADR | 11.1 |
| NIO, Inc. sponsored ADR | 7.7 |
| Aptiv PLC | 5.4 |
| Copart, Inc. | 4.0 |
| Honda Motor Co. Ltd. sponsored ADR | 3.3 |
| Lear Corp. | 3.2 |
| O'Reilly Automotive, Inc. | 3.1 |
| Carvana Co. Class A | 3.0 |
| | 63.3 |
Top Industries (% of fund's net assets)
| As of February 28, 2021 |
| | Automobiles | 52.2% |
| | Specialty Retail | 17.1% |
| | Auto Components | 14.6% |
| | Commercial Services & Supplies | 5.6% |
| | Distributors | 3.8% |
| | All Others* | 6.7% |

* Includes short-term investments and net other assets (liabilities).
Automotive Portfolio
Schedule of Investments February 28, 2021
Showing Percentage of Net Assets
| Common Stocks - 95.9% | | | |
| | | Shares | Value |
| Auto Components - 14.6% | | | |
| Auto Parts & Equipment - 14.6% | | | |
| Adient PLC (a) | | 90,610 | $3,359,819 |
| Aptiv PLC | | 71,997 | 10,788,030 |
| Autoliv, Inc. | | 6,903 | 621,270 |
| BorgWarner, Inc. | | 103,739 | 4,668,255 |
| Gentex Corp. | | 27,127 | 959,753 |
| Lear Corp. | | 37,870 | 6,289,828 |
| Magna International, Inc. Class A (sub. vtg.) | | 26,921 | 2,267,533 |
| | | | 28,954,488 |
| Automobiles - 50.8% | | | |
| Automobile Manufacturers - 50.2% | | | |
| Ferrari NV | | 20,448 | 4,036,026 |
| Ford Motor Co. | | 357,047 | 4,177,450 |
| General Motors Co. | | 428,454 | 21,992,544 |
| Honda Motor Co. Ltd. sponsored ADR (b) | | 237,890 | 6,582,416 |
| NIO, Inc. sponsored ADR (a) | | 332,324 | 15,213,793 |
| Stellantis NV (b) | | 122,987 | 2,014,527 |
| Tata Motors Ltd. sponsored ADR (a) | | 44,700 | 982,953 |
| Tesla, Inc. (a) | | 33,472 | 22,610,337 |
| Toyota Motor Corp. sponsored ADR (b) | | 148,388 | 21,951,037 |
| | | | 99,561,083 |
| Motorcycle Manufacturers - 0.6% | | | |
| Harley-Davidson, Inc. | | 29,705 | 1,059,577 |
|
| TOTAL AUTOMOBILES | | | 100,620,660 |
|
| Commercial Services & Supplies - 5.6% | | | |
| Diversified Support Services - 5.6% | | | |
| Copart, Inc. (a) | | 73,220 | 7,992,695 |
| IAA Spinco, Inc. (a) | | 49,007 | 2,873,280 |
| KAR Auction Services, Inc. | | 13,683 | 190,331 |
| | | | 11,056,306 |
| Distributors - 3.8% | | | |
| Distributors - 3.8% | | | |
| Genuine Parts Co. | | 25,882 | 2,726,669 |
| LKQ Corp. (a) | | 119,520 | 4,707,893 |
| | | | 7,434,562 |
| Electrical Equipment - 1.0% | | | |
| Electrical Components & Equipment - 1.0% | | | |
| Sensata Technologies, Inc. PLC (a) | | 34,500 | 1,976,505 |
| Machinery - 0.6% | | | |
| Construction Machinery & Heavy Trucks - 0.6% | | | |
| Allison Transmission Holdings, Inc. | | 33,925 | 1,286,436 |
| Road & Rail - 2.4% | | | |
| Trucking - 2.4% | | | |
| Lyft, Inc. (a) | | 21,793 | 1,213,870 |
| Uber Technologies, Inc. (a) | | 67,675 | 3,502,181 |
| | | | 4,716,051 |
| Specialty Retail - 17.1% | | | |
| Automotive Retail - 17.1% | | | |
| Advance Auto Parts, Inc. | | 17,705 | 2,838,997 |
| AutoZone, Inc. (a) | | 5,072 | 5,883,114 |
| CarLotz, Inc. (c) | | 13,786 | 116,823 |
| CarMax, Inc. (a) | | 32,484 | 3,882,163 |
| Carvana Co. Class A (a)(b) | | 21,292 | 6,036,282 |
| Group 1 Automotive, Inc. | | 16,017 | 2,441,631 |
| Lithia Motors, Inc. Class A (sub. vtg.) | | 12,195 | 4,560,320 |
| O'Reilly Automotive, Inc. (a) | | 13,858 | 6,199,099 |
| Shift Technologies, Inc. (c) | | 4,698 | 41,577 |
| Vroom, Inc. | | 44,151 | 1,953,682 |
| | | | 33,953,688 |
| TOTAL COMMON STOCKS | | | |
| (Cost $147,192,331) | | | 189,998,696 |
|
| Nonconvertible Preferred Stocks - 1.4% | | | |
| Automobiles - 1.4% | | | |
| Automobile Manufacturers - 1.4% | | | |
| Porsche Automobil Holding SE (Germany) | | 12,566 | 1,006,537 |
| Volkswagen AG | | 8,930 | 1,864,203 |
| | | | |
| TOTAL NONCONVERTIBLE PREFERRED STOCKS | | | |
| (Cost $2,327,998) | | | 2,870,740 |
|
| Money Market Funds - 12.9% | | | |
| Fidelity Cash Central Fund 0.07% (d) | | 1,184,096 | 1,184,333 |
| Fidelity Securities Lending Cash Central Fund 0.08%(d)(e) | | 24,346,570 | 24,349,005 |
| TOTAL MONEY MARKET FUNDS | | | |
| (Cost $25,533,338) | | | 25,533,338 |
| TOTAL INVESTMENT IN SECURITIES - 110.2% | | | |
| (Cost $175,053,667) | | | 218,402,774 |
| NET OTHER ASSETS (LIABILITIES) - (10.2)% | | | (20,178,050) |
| NET ASSETS - 100% | | | $198,224,724 |
Legend
(a) Non-income producing
(b) Security or a portion of the security is on loan at period end.
(c) Restricted securities (including private placements) - Investment in securities not registered under the Securities Act of 1933 (excluding 144A issues). At the end of the period, the value of restricted securities (excluding 144A issues) amounted to $158,400 or 0.1% of net assets.
(d) Affiliated fund that is generally available only to investment companies and other accounts managed by Fidelity Investments. The rate quoted is the annualized seven-day yield of the fund at period end. A complete unaudited listing of the fund's holdings as of its most recent quarter end is available upon request. In addition, each Fidelity Central Fund's financial statements, which are not covered by the Fund's Report of Independent Registered Public Accounting Firm, are available on the SEC's website or upon request.
(e) Investment made with cash collateral received from securities on loan.
Additional information on each restricted holding is as follows:
| Security | Acquisition Date | Acquisition Cost |
| CarLotz, Inc. | 1/21/21 | $137,860 |
| Shift Technologies, Inc. | 10/13/20 | $46,980 |
Affiliated Central Funds
Information regarding fiscal year to date income earned by the Fund from investments in Fidelity Central Funds is as follows:
| Fund | Income earned |
| Fidelity Cash Central Fund | $1,096 |
| Fidelity Securities Lending Cash Central Fund | 9,623 |
| Total | $10,719 |
Amounts in the income column in the above table include any capital gain distributions from underlying funds, which are presented in the corresponding line-item in the Statement of Operations, if applicable. Amount for Fidelity Securities Lending Cash Central Fund represents the income earned on investing cash collateral, less rebates paid to borrowers and any lending agent fees associated with the loan, plus any premium payments received for lending certain types of securities.
The value, beginning of period, for the Fidelity Securities Lending Cash Central Fund was $535,945. Net realized gain (loss) and change in net unrealized appreciation (depreciation) on Fidelity Securities Lending Cash Central Fund is presented in the Statement of Operations, if applicable. Purchases and sales of the Fidelity Securities Lending Cash Central Fund were $78,654,599 and $54,841,429, respectively, during the period.
Investment Valuation
The following is a summary of the inputs used, as of February 28, 2021, involving the Fund's assets and liabilities carried at fair value. The inputs or methodology used for valuing securities may not be an indication of the risk associated with investing in those securities. For more information on valuation inputs, and their aggregation into the levels used below, please refer to the Investment Valuation section in the accompanying Notes to Financial Statements.
| | Valuation Inputs at Reporting Date: |
| Description | Total | Level 1 | Level 2 | Level 3 |
| Investments in Securities: | | | | |
| Common Stocks | $189,998,696 | $189,881,873 | $116,823 | $-- |
| Nonconvertible Preferred Stocks | 2,870,740 | 1,864,203 | 1,006,537 | -- |
| Money Market Funds | 25,533,338 | 25,533,338 | -- | -- |
| Total Investments in Securities: | $218,402,774 | $217,279,414 | $1,123,360 | $-- |
| Net unrealized appreciation on unfunded commitments | $360,479 | $-- | $360,479 | $-- |
Other Information
Distribution of investments by country or territory of incorporation, as a percentage of Total Net Assets, is as follows (Unaudited):
| United States of America | 63.8% |
| Japan | 14.4% |
| Cayman Islands | 7.7% |
| Bailiwick of Jersey | 5.4% |
| Netherlands | 3.0% |
| Ireland | 1.7% |
| Germany | 1.4% |
| Canada | 1.1% |
| United Kingdom | 1.0% |
| Others (Individually Less Than 1%) | 0.5% |
| | 100.0% |
See accompanying notes which are an integral part of the financial statements.
Automotive Portfolio
Financial Statements
Statement of Assets and Liabilities
| | | February 28, 2021 |
| Assets | | |
Investment in securities, at value (including securities loaned of $23,895,145) — See accompanying schedule:
Unaffiliated issuers (cost $149,520,329) | $192,869,436 | |
| Fidelity Central Funds (cost $25,533,338) | 25,533,338 | |
| Total Investment in Securities (cost $175,053,667) | | $218,402,774 |
| Receivable for investments sold | | 15,567,738 |
| Net unrealized appreciation on unfunded commitments | | 365,479 |
| Receivable for fund shares sold | | 516,291 |
| Dividends receivable | | 78,899 |
| Distributions receivable from Fidelity Central Funds | | 2,295 |
| Prepaid expenses | | 313 |
| Other receivables | | 2,512 |
| Total assets | | 234,936,301 |
| Liabilities | | |
| Payable for investments purchased | $10,192,381 | |
| Net unrealized depreciation on unfunded commitments | 5,000 | |
| Payable for fund shares redeemed | 2,004,085 | |
| Accrued management fee | 93,082 | |
| Other affiliated payables | 33,191 | |
| Other payables and accrued expenses | 35,243 | |
| Collateral on securities loaned | 24,348,595 | |
| Total liabilities | | 36,711,577 |
| Net Assets | | $198,224,724 |
| Net Assets consist of: | | |
| Paid in capital | | $154,886,028 |
| Total accumulated earnings (loss) | | 43,338,696 |
| Net Assets | | $198,224,724 |
| Net Asset Value, offering price and redemption price per share ($198,224,724 ÷ 3,656,624 shares) | | $54.21 |
See accompanying notes which are an integral part of the financial statements.
Statement of Operations
| | | Year ended February 28, 2021 |
| Investment Income | | |
| Dividends | | $501,721 |
| Special dividends | | 247,610 |
| Income from Fidelity Central Funds (including $9,623 from security lending) | | 10,719 |
| Total income | | 760,050 |
| Expenses | | |
| Management fee | $422,451 | |
| Transfer agent fees | 151,623 | |
| Accounting fees | 31,090 | |
| Custodian fees and expenses | 8,480 | |
| Independent trustees' fees and expenses | 310 | |
| Registration fees | 28,919 | |
| Audit | 38,789 | |
| Legal | 44 | |
| Interest | 86 | |
| Miscellaneous | 1,259 | |
| Total expenses before reductions | 683,051 | |
| Expense reductions | (4,336) | |
| Total expenses after reductions | | 678,715 |
| Net investment income (loss) | | 81,335 |
| Realized and Unrealized Gain (Loss) | | |
| Net realized gain (loss) on: | | |
| Investment securities: | | |
| Unaffiliated issuers | 4,642,806 | |
| Fidelity Central Funds | (206) | |
| Foreign currency transactions | (490) | |
| Total net realized gain (loss) | | 4,642,110 |
| Change in net unrealized appreciation (depreciation) on: | | |
| Investment securities: | | |
| Unaffiliated issuers | 34,320,453 | |
| Unfunded commitments | 360,479 | |
| Assets and liabilities in foreign currencies | 1,098 | |
| Total change in net unrealized appreciation (depreciation) | | 34,682,030 |
| Net gain (loss) | | 39,324,140 |
| Net increase (decrease) in net assets resulting from operations | | $39,405,475 |
See accompanying notes which are an integral part of the financial statements.
Statement of Changes in Net Assets
| | Year ended February 28, 2021 | Year ended February 29, 2020 |
| Increase (Decrease) in Net Assets | | |
| Operations | | |
| Net investment income (loss) | $81,335 | $493,545 |
| Net realized gain (loss) | 4,642,110 | 4,080,200 |
| Change in net unrealized appreciation (depreciation) | 34,682,030 | (1,479,820) |
| Net increase (decrease) in net assets resulting from operations | 39,405,475 | 3,093,925 |
| Distributions to shareholders | (6,816,480) | (1,655,954) |
| Share transactions | | |
| Proceeds from sales of shares | 177,484,001 | 14,390,055 |
| Reinvestment of distributions | 6,545,736 | 1,571,589 |
| Cost of shares redeemed | (54,873,788) | (21,701,036) |
| Net increase (decrease) in net assets resulting from share transactions | 129,155,949 | (5,739,392) |
| Total increase (decrease) in net assets | 161,744,944 | (4,301,421) |
| Net Assets | | |
| Beginning of period | 36,479,780 | 40,781,201 |
| End of period | $198,224,724 | $36,479,780 |
| Other Information | | |
| Shares | | |
| Sold | 3,627,198 | 396,128 |
| Issued in reinvestment of distributions | 178,794 | 42,404 |
| Redeemed | (1,194,382) | (618,672) |
| Net increase (decrease) | 2,611,610 | (180,140) |
See accompanying notes which are an integral part of the financial statements.
Financial Highlights
Automotive Portfolio
| | | | | | |
| Years ended February 28, | 2021 | 2020 A | 2019 | 2018 | 2017 |
| Selected Per–Share Data | | | | | |
| Net asset value, beginning of period | $34.91 | $33.29 | $37.52 | $36.78 | $33.72 |
| Income from Investment Operations | | | | | |
| Net investment income (loss)B | .05C | .46D | .36 | .39E | .33 |
| Net realized and unrealized gain (loss) | 23.73 | 2.67F | (2.15) | 6.11 | 5.22 |
| Total from investment operations | 23.78 | 3.13 | (1.79) | 6.50 | 5.55 |
| Distributions from net investment income | (.01) | (.49)G | (.38) | (.20) | (.52) |
| Distributions from net realized gain | (4.47) | (1.02)G | (2.06) | (5.56) | (1.98) |
| Total distributions | (4.48) | (1.51) | (2.44) | (5.76) | (2.49)H |
| Redemption fees added to paid in capitalB | – | – | – | –I | –I |
| Net asset value, end of period | $54.21 | $34.91 | $33.29 | $37.52 | $36.78 |
| Total ReturnJ | 78.19% | 9.14%F | (4.66)% | 19.08% | 16.80% |
| Ratios to Average Net AssetsK,L | | | | | |
| Expenses before reductions | .88% | 1.00% | .97% | .97% | .96% |
| Expenses net of fee waivers, if any | .88% | 1.00% | .97% | .96% | .96% |
| Expenses net of all reductions | .87% | .99% | .97% | .96% | .95% |
| Net investment income (loss) | .10%C | 1.33%D | 1.04% | 1.04%E | .92% |
| Supplemental Data | | | | | |
| Net assets, end of period (000 omitted) | $198,225 | $36,480 | $40,781 | $56,139 | $54,069 |
| Portfolio turnover rateM | 56% | 45% | 31% | 117% | 83% |
A For the year ended February 29.
B Calculated based on average shares outstanding during the period.
C Net investment income per share reflects one or more large, non-recurring dividend(s) which amounted to $.14 per share. Excluding such non-recurring dividend(s), the ratio of net investment income (loss) to average net assets would have been (.21) %.
D Net investment income per share reflects one or more large, non-recurring dividend(s) which amounted to $.09 per share. Excluding such non-recurring dividend(s), the ratio of net investment income (loss) to average net assets would have been 1.07%.
E Net investment income per share reflects one or more large, non-recurring dividend(s) which amounted to $.08 per share. Excluding such non-recurring dividend(s), the ratio of net investment income (loss) to average net assets would have been .83%.
F Net realized and unrealized gain (loss) per share reflects proceeds received from litigation which amounted to $.19 per share. Excluding these litigation proceeds, the total return would have been 8.58%.
G The amounts shown reflect certain reclassifications related to book to tax differences that were made in the year shown.
H Total distributions per share do not sum due to rounding.
I Amount represents less than $.005 per share.
J Total returns would have been lower if certain expenses had not been reduced during the applicable periods shown.
K Fees and expenses of any underlying mutual funds or exchange-traded funds (ETFs) are not included in the Fund's expense ratio. The Fund indirectly bears its proportionate share of these expenses. For additional expense information related to investments in Fidelity Central Funds, please refer to the "Investments in Fidelity Central Funds" note found in the Notes to Financial Statements section of the most recent Annual or Semi-Annual report.
L Expense ratios reflect operating expenses of the class. Expenses before reductions do not reflect amounts reimbursed, waived, or reduced through arrangements with the investment advisor, brokerage services, or other offset arrangements, if applicable, and do not represent the amount paid by the class during periods when reimbursements, waivers or reductions occur.
M Amount does not include the portfolio activity of any underlying mutual funds or exchange-traded funds (ETFs).
See accompanying notes which are an integral part of the financial statements.
Communication Services Portfolio
Performance: The Bottom Line
Average annual total return reflects the change in the value of an investment, assuming reinvestment of distributions from dividend income and capital gains (the profits earned upon the sale of securities that have grown in value, if any) and assuming a constant rate of performance each year. The hypothetical investment and the average annual total returns do not reflect the deduction of taxes that a shareholder would pay on fund distributions or the redemption of fund shares. During periods of reimbursement by Fidelity, a fund’s total return will be greater than it would be had the reimbursement not occurred. How a fund did yesterday is no guarantee of how it will do tomorrow.
Average Annual Total Returns
| For the periods ended February 28, 2021 | Past 1 year | Past 5 years | Past 10 years |
| Class A (incl. 5.75% sales charge) | 42.14% | 17.82% | 14.91% |
| Class M (incl. 3.50% sales charge) | 45.20% | 18.24% | 15.11% |
| Class C (incl. contingent deferred sales charge) | 48.77% | 18.83% | 15.40% |
| Communication Services Portfolio | 51.29% | 19.39% | 15.67% |
| Class I | 51.31% | 19.39% | 15.67% |
| Class Z | 51.48% | 19.46% | 15.70% |
Class C shares' contingent deferred sales charges included in the past one year, past five years and past ten years total return figures are 1%, 0% and 0%, respectively.
The initial offering of Class Z shares took place on August 13, 2013. Returns prior to August 13, 2013, are those of Class I.
$10,000 Over 10 Years
Let's say hypothetically that $10,000 was invested in Communication Services Portfolio, a class of the fund, on February 28, 2011.
The chart shows how the value of your investment would have changed, and also shows how the S&P 500® Index performed over the same period.
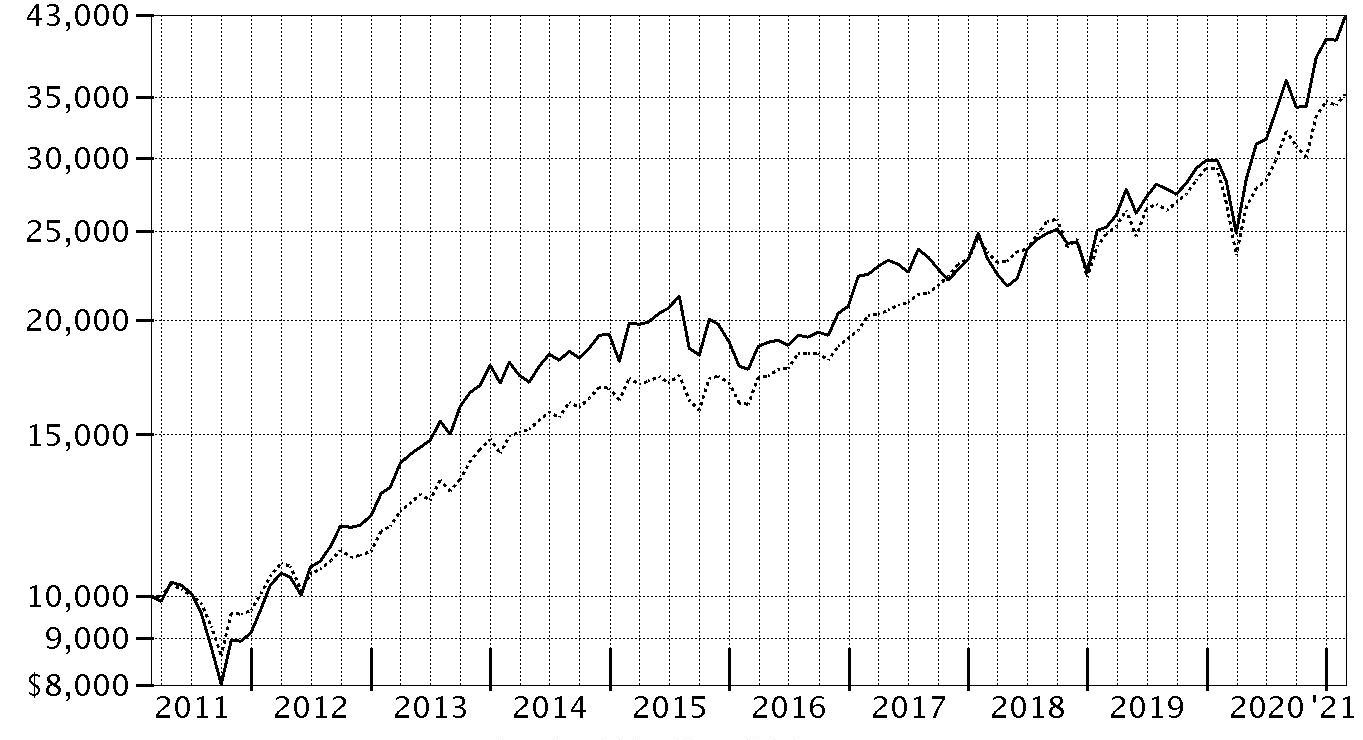
| Period Ending Values |
| $42,865 | Communication Services Portfolio |
| $35,259 | S&P 500® Index |
Communication Services Portfolio
Management's Discussion of Fund Performance
Market Recap: The S&P 500
® index gained 31.29% for the 12 months ending February 28, 2021, a volatile but productive period for U.S. risk assets. The early-2020 outbreak and spread of COVID-19 resulted in stocks suffering one of the quickest declines on record, through March 23, followed by a historic rebound that included the index closing 2020 at an all-time high and gaining modest ground in the first two months of the new year. The crisis and containment efforts caused broad contraction in economic activity, along with extreme uncertainty and dislocation in financial markets. A rapid and expansive U.S. monetary/fiscal-policy response partially offset the economic disruption and fueled the market surge, as did resilient corporate earnings. The rally slowed in September, when stocks began a two-month retreat amid Congress’s inability to reach a deal on additional fiscal stimulus, as well as concerns about election uncertainty, indications the U.S. economic recovery could be slowing and a new wave of COVID-19 cases. A shift in momentum began in October and accelerated following the U.S. elections, with the approval of three breakthrough COVID-19 vaccines and prospects for additional government stimulus fueling the “reflation trade” through February 28. By sector for the full 12 months, information technology (+50%) and consumer discretionary (+43%) led all gainers. Materials (+42%) and communication services (+37%) also stood out. In contrast, the defensive utilities (-3%) and real estate sectors (+5%) notably lagged.
Comments from Portfolio Manager Matthew Drukker: For the fiscal year ending February 28, 2021, the fund's share classes (excluding sales charges, if applicable) gained about 50% to 51%, outperforming the 45.41% advance of the sector benchmark, the MSCI U.S. IMI Communication Services 25/50 (Media Linked) Index, as well as the broad-based S&P 500
® index. Versus the sector benchmark, market selection added the most value, especially underweighting the integrated telecommunication services category. An overweighting and security selection in interactive home entertainment and stock picks in movies & entertainment also helped. Among individual stocks, underweighting industry heavyweight AT&T (-3% for the fund) contributed more versus the sector benchmark than any other security choice. A lighter-than-index stake in Verizon Communications (+11% for the fund), which we sold by period end, and an overweighting in Cinemark Holdings (+188%), a position we established during the 12 months, also aided fund performance versus the sector benchmark. Conversely, stock selection in interactive media & services and communications equipment detracted, as did positioning in wireless telecommunication services. Not owning social media company Pinterest (+313%) and streaming movies and entertainment provider Roku (+248%) particularly hurt. Notable changes in fund positioning for the period included reduced exposure to the interactive home entertainment subindustry and a higher allocation to wireless telecommunication services.
The views expressed above reflect those of the portfolio manager(s) only through the end of the period as stated on the cover of this report and do not necessarily represent the views of Fidelity or any other person in the Fidelity organization. Any such views are subject to change at any time based upon market or other conditions and Fidelity disclaims any responsibility to update such views. These views may not be relied on as investment advice and, because investment decisions for a Fidelity fund are based on numerous factors, may not be relied on as an indication of trading intent on behalf of any Fidelity fund.
Communication Services Portfolio
Investment Summary (Unaudited)
Top Ten Stocks as of February 28, 2021
| | % of fund's net assets |
| Alphabet, Inc. Class A | 24.8 |
| Facebook, Inc. Class A | 17.4 |
| The Walt Disney Co. | 6.2 |
| Activision Blizzard, Inc. | 4.2 |
| Comcast Corp. Class A | 4.1 |
| T-Mobile U.S., Inc. | 3.9 |
| Liberty Global PLC Class C | 3.2 |
| Netflix, Inc. | 3.1 |
| AT&T, Inc. | 3.0 |
| Lyft, Inc. | 2.5 |
| | 72.4 |
Top Industries (% of fund's net assets)
| As of February 28, 2021 |
| | Interactive Media & Services | 47.1% |
| | Entertainment | 21.3% |
| | Media | 12.0% |
| | Diversified Telecommunication Services | 7.4% |
| | Wireless Telecommunication Services | 5.2% |
| | All Others* | 7.0% |

* Includes short-term investments and net other assets (liabilities).
Communication Services Portfolio
Schedule of Investments February 28, 2021
Showing Percentage of Net Assets
| Common Stocks - 97.7% | | | |
| | | Shares | Value |
| Communications Equipment - 0.3% | | | |
| Communications Equipment - 0.3% | | | |
| EchoStar Holding Corp. Class A (a) | | 113,300 | $2,571,910 |
| Diversified Telecommunication Services - 7.4% | | | |
| Alternative Carriers - 4.4% | | | |
| Liberty Global PLC Class C (a) | | 1,218,900 | 29,619,270 |
| Liberty Latin America Ltd. Class C (a) | | 547,186 | 5,997,159 |
| Vonage Holdings Corp. (a) | | 376,100 | 4,972,042 |
| | | | 40,588,471 |
| Integrated Telecommunication Services - 3.0% | | | |
| AT&T, Inc. | | 999,600 | 27,878,844 |
|
| TOTAL DIVERSIFIED TELECOMMUNICATION SERVICES | | | 68,467,315 |
|
| Entertainment - 21.3% | | | |
| Interactive Home Entertainment - 8.4% | | | |
| Activision Blizzard, Inc. | | 408,500 | 39,056,685 |
| Electronic Arts, Inc. | | 154,500 | 20,698,365 |
| Motorsport Games, Inc. Class A | | 4,300 | 115,455 |
| Skillz, Inc. (a) | | 26,600 | 840,826 |
| Take-Two Interactive Software, Inc. (a) | | 42,000 | 7,747,320 |
| Zynga, Inc. (a) | | 866,600 | 9,662,590 |
| | | | 78,121,241 |
| Movies & Entertainment - 12.9% | | | |
| Cinemark Holdings, Inc. (b) | | 482,313 | 10,827,927 |
| Lions Gate Entertainment Corp.: | | | |
| Class A (a)(b) | | 34,500 | 500,940 |
| Class B (a) | | 373,234 | 4,680,354 |
| Marcus Corp. (b) | | 226,800 | 4,454,352 |
| Netflix, Inc. (a) | | 53,800 | 28,990,130 |
| Spotify Technology SA (a) | | 9,300 | 2,858,634 |
| The Walt Disney Co. (a) | | 303,971 | 57,462,678 |
| World Wrestling Entertainment, Inc. Class A | | 194,500 | 9,608,300 |
| | | | 119,383,315 |
|
| TOTAL ENTERTAINMENT | | | 197,504,556 |
|
| Equity Real Estate Investment Trusts (REITs) - 1.2% | | | |
| Specialized REITs - 1.2% | | | |
| Lamar Advertising Co. Class A | | 56,300 | 4,875,017 |
| Outfront Media, Inc. | | 313,563 | 6,359,058 |
| | | | 11,234,075 |
| Household Durables - 0.6% | | | |
| Consumer Electronics - 0.6% | | | |
| Sony Corp. | | 55,600 | 5,871,426 |
| Interactive Media & Services - 47.1% | | | |
| Interactive Media & Services - 47.1% | | | |
| Alphabet, Inc. Class A (a) | | 113,600 | 229,688,974 |
| ANGI Homeservices, Inc. Class A (a) | | 330,300 | 4,936,334 |
| Facebook, Inc. Class A (a) | | 624,800 | 160,960,976 |
| IAC (a) | | 16,700 | 4,088,661 |
| Match Group, Inc. (a) | | 48,270 | 7,378,070 |
| Snap, Inc. Class A (a) | | 197,700 | 12,980,982 |
| Twitter, Inc. (a) | | 97,200 | 7,490,232 |
| Zillow Group, Inc. Class A (a) | | 46,600 | 7,913,612 |
| | | | 435,437,841 |
| Internet & Direct Marketing Retail - 0.1% | | | |
| Internet & Direct Marketing Retail - 0.1% | | | |
| Doordash, Inc. (b) | | 2,400 | 406,776 |
| Media - 12.0% | | | |
| Advertising - 0.2% | | | |
| S4 Capital PLC (a) | | 117,000 | 723,740 |
| TechTarget, Inc. (a) | | 12,100 | 1,011,923 |
| | | | 1,735,663 |
| Broadcasting - 3.2% | | | |
| Fox Corp. Class A | | 226,900 | 7,558,039 |
| Liberty Media Corp.: | | | |
| Liberty Media Class A (a) | | 230,662 | 8,942,766 |
| Liberty SiriusXM Series A (a) | | 279,200 | 12,399,272 |
| Liberty SiriusXM Series C (a) | | 24,070 | 1,061,968 |
| | | | 29,962,045 |
| Cable & Satellite - 8.6% | | | |
| Comcast Corp. Class A | | 715,400 | 37,715,888 |
| DISH Network Corp. Class A (a) | | 148,639 | 4,683,615 |
| Liberty Broadband Corp.: | | | |
| Class A (a) | | 147,223 | 21,400,335 |
| Class C (a) | | 103,716 | 15,506,579 |
| | | | 79,306,417 |
|
| TOTAL MEDIA | | | 111,004,125 |
|
| Road & Rail - 2.5% | | | |
| Trucking - 2.5% | | | |
| Lyft, Inc. (a) | | 413,000 | 23,004,100 |
| Software - 0.0% | | | |
| Application Software - 0.0% | | | |
| Viant Technology, Inc. | | 1,200 | 59,508 |
| Wireless Telecommunication Services - 5.2% | | | |
| Wireless Telecommunication Services - 5.2% | | | |
| Millicom International Cellular SA (a)(b) | | 316,000 | 11,831,040 |
| T-Mobile U.S., Inc. | | 305,450 | 36,644,837 |
| | | | 48,475,877 |
| TOTAL COMMON STOCKS | | | |
| (Cost $553,888,074) | | | 904,037,509 |
|
| Money Market Funds - 2.5% | | | |
| Fidelity Cash Central Fund 0.07% (c) | | 12,089,436 | 12,091,854 |
| Fidelity Securities Lending Cash Central Fund 0.08% (c)(d) | | 10,914,103 | 10,915,194 |
| TOTAL MONEY MARKET FUNDS | | | |
| (Cost $23,007,048) | | | 23,007,048 |
| TOTAL INVESTMENT IN SECURITIES - 100.2% | | | |
| (Cost $576,895,122) | | | 927,044,557 |
| NET OTHER ASSETS (LIABILITIES) - (0.2)% | | | (1,632,004) |
| NET ASSETS - 100% | | | $925,412,553 |
Legend
(a) Non-income producing
(b) Security or a portion of the security is on loan at period end.
(c) Affiliated fund that is generally available only to investment companies and other accounts managed by Fidelity Investments. The rate quoted is the annualized seven-day yield of the fund at period end. A complete unaudited listing of the fund's holdings as of its most recent quarter end is available upon request. In addition, each Fidelity Central Fund's financial statements, which are not covered by the Fund's Report of Independent Registered Public Accounting Firm, are available on the SEC's website or upon request.
(d) Investment made with cash collateral received from securities on loan.
Affiliated Central Funds
Information regarding fiscal year to date income earned by the Fund from investments in Fidelity Central Funds is as follows:
| Fund | Income earned |
| Fidelity Cash Central Fund | $9,495 |
| Fidelity Securities Lending Cash Central Fund | 252,713 |
| Total | $262,208 |
Amounts in the income column in the above table include any capital gain distributions from underlying funds, which are presented in the corresponding line-item in the Statement of Operations, if applicable. Amount for Fidelity Securities Lending Cash Central Fund represents the income earned on investing cash collateral, less rebates paid to borrowers and any lending agent fees associated with the loan, plus any premium payments received for lending certain types of securities.
Investment Valuation
The following is a summary of the inputs used, as of February 28, 2021, involving the Fund's assets and liabilities carried at fair value. The inputs or methodology used for valuing securities may not be an indication of the risk associated with investing in those securities. For more information on valuation inputs, and their aggregation into the levels used below, please refer to the Investment Valuation section in the accompanying Notes to Financial Statements.
| | Valuation Inputs at Reporting Date: |
| Description | Total | Level 1 | Level 2 | Level 3 |
| Investments in Securities: | | | | |
| Common Stocks | $904,037,509 | $898,166,083 | $5,871,426 | $-- |
| Money Market Funds | 23,007,048 | 23,007,048 | -- | -- |
| Total Investments in Securities: | $927,044,557 | $921,173,131 | $5,871,426 | $-- |
See accompanying notes which are an integral part of the financial statements.
Communication Services Portfolio
Financial Statements
Statement of Assets and Liabilities
| | | February 28, 2021 |
| Assets | | |
Investment in securities, at value (including securities loaned of $10,576,987) — See accompanying schedule:
Unaffiliated issuers (cost $553,888,074) | $904,037,509 | |
| Fidelity Central Funds (cost $23,007,048) | 23,007,048 | |
| Total Investment in Securities (cost $576,895,122) | | $927,044,557 |
| Receivable for investments sold | | 9,162,871 |
| Receivable for fund shares sold | | 1,361,343 |
| Distributions receivable from Fidelity Central Funds | | 3,653 |
| Prepaid expenses | | 3,112 |
| Other receivables | | 3,983 |
| Total assets | | 937,579,519 |
| Liabilities | | |
| Payable for fund shares redeemed | $648,831 | |
| Accrued management fee | 409,115 | |
| Distribution and service plan fees payable | 12,666 | |
| Other affiliated payables | 143,265 | |
| Other payables and accrued expenses | 38,789 | |
| Collateral on securities loaned | 10,914,300 | |
| Total liabilities | | 12,166,966 |
| Net Assets | | $925,412,553 |
| Net Assets consist of: | | |
| Paid in capital | | $540,138,011 |
| Total accumulated earnings (loss) | | 385,274,542 |
| Net Assets | | $925,412,553 |
| Net Asset Value and Maximum Offering Price | | |
| Class A: | | |
| Net Asset Value and redemption price per share ($22,962,111 ÷ 262,982 shares)(a) | | $87.31 |
| Maximum offering price per share (100/94.25 of $87.31) | | $92.64 |
| Class M: | | |
| Net Asset Value and redemption price per share ($5,386,004 ÷ 61,951 shares)(a) | | $86.94 |
| Maximum offering price per share (100/96.50 of $86.94) | | $90.09 |
| Class C: | | |
| Net Asset Value and offering price per share ($6,855,788 ÷ 79,676 shares)(a) | | $86.05 |
| Communication Services: | | |
| Net Asset Value, offering price and redemption price per share ($859,870,709 ÷ 9,784,439 shares) | | $87.88 |
| Class I: | | |
| Net Asset Value, offering price and redemption price per share ($26,521,157 ÷ 301,847 shares) | | $87.86 |
| Class Z: | | |
| Net Asset Value, offering price and redemption price per share ($3,816,784 ÷ 43,351 shares) | | $88.04 |
(a) Redemption price per share is equal to net asset value less any applicable contingent deferred sales charge.
See accompanying notes which are an integral part of the financial statements.
Statement of Operations
| | | Year ended February 28, 2021 |
| Investment Income | | |
| Dividends | | $1,577,286 |
| Income from Fidelity Central Funds (including $252,713 from security lending) | | 262,208 |
| Total income | | 1,839,494 |
| Expenses | | |
| Management fee | $3,783,393 | |
| Transfer agent fees | 1,238,165 | |
| Distribution and service plan fees | 102,775 | |
| Accounting fees | 253,433 | |
| Custodian fees and expenses | 19,762 | |
| Independent trustees' fees and expenses | 3,733 | |
| Registration fees | 117,321 | |
| Audit | 44,077 | |
| Legal | 731 | |
| Interest | 69 | |
| Miscellaneous | 14,794 | |
| Total expenses before reductions | 5,578,253 | |
| Expense reductions | (35,666) | |
| Total expenses after reductions | | 5,542,587 |
| Net investment income (loss) | | (3,703,093) |
| Realized and Unrealized Gain (Loss) | | |
| Net realized gain (loss) on: | | |
| Investment securities: | | |
| Unaffiliated issuers | 60,417,832 | |
| Fidelity Central Funds | (1,641) | |
| Foreign currency transactions | (12,173) | |
| Total net realized gain (loss) | | 60,404,018 |
| Change in net unrealized appreciation (depreciation) on investment securities | | 240,367,274 |
| Net gain (loss) | | 300,771,292 |
| Net increase (decrease) in net assets resulting from operations | | $297,068,199 |
See accompanying notes which are an integral part of the financial statements.
Statement of Changes in Net Assets
| | Year ended February 28, 2021 | Year ended February 29, 2020 |
| Increase (Decrease) in Net Assets | | |
| Operations | | |
| Net investment income (loss) | $(3,703,093) | $(1,158,013) |
| Net realized gain (loss) | 60,404,018 | 57,254,598 |
| Change in net unrealized appreciation (depreciation) | 240,367,274 | 13,008,631 |
| Net increase (decrease) in net assets resulting from operations | 297,068,199 | 69,105,216 |
| Distributions to shareholders | (30,372,833) | (180,128,842) |
| Share transactions - net increase (decrease) | 63,041,939 | 141,718,647 |
| Total increase (decrease) in net assets | 329,737,305 | 30,695,021 |
| Net Assets | | |
| Beginning of period | 595,675,248 | 564,980,227 |
| End of period | $925,412,553 | $595,675,248 |
See accompanying notes which are an integral part of the financial statements.
Financial Highlights
Communication Services Portfolio Class A
| Years ended February 28, | 2021 | 2020 A | 2019 B |
| Selected Per–Share Data | | | |
| Net asset value, beginning of period | $60.63 | $74.85 | $78.20 |
| Income from Investment Operations | | | |
| Net investment income (loss)C | (.59) | (.30) | (.12) |
| Net realized and unrealized gain (loss) | 30.37 | 8.77 | 2.68 |
| Total from investment operations | 29.78 | 8.47 | 2.56 |
| Distributions from net investment income | – | – | (.14) |
| Distributions from net realized gain | (3.10) | (22.69) | (5.77) |
| Total distributions | (3.10) | (22.69) | (5.91) |
| Net asset value, end of period | $87.31 | $60.63 | $74.85 |
| Total ReturnD,E,F | 50.81% | 11.90% | 3.83% |
| Ratios to Average Net AssetsG,H | | | |
| Expenses before reductions | 1.08% | 1.07% | 1.13%I |
| Expenses net of fee waivers, if any | 1.08% | 1.07% | 1.12%I |
| Expenses net of all reductions | 1.07% | 1.06% | 1.11%I |
| Net investment income (loss) | (.81)% | (.47)% | (.68)%I |
| Supplemental Data | | | |
| Net assets, end of period (000 omitted) | $22,962 | $9,947 | $715 |
| Portfolio turnover rateJ | 63% | 73% | 107% |
A For the year ended February 29.
B For the period November 30, 2018 (commencement of sale of shares) to February 28, 2019.
C Calculated based on average shares outstanding during the period.
D Total returns for periods of less than one year are not annualized.
E Total returns would have been lower if certain expenses had not been reduced during the applicable periods shown.
F Total returns do not include the effect of the sales charges.
G Fees and expenses of any underlying mutual funds or exchange-traded funds (ETFs) are not included in the Fund's expense ratio. The Fund indirectly bears its proportionate share of these expenses. For additional expense information related to investments in Fidelity Central Funds, please refer to the "Investments in Fidelity Central Funds" note found in the Notes to Financial Statements section of the most recent Annual or Semi-Annual report.
H Expense ratios reflect operating expenses of the class. Expenses before reductions do not reflect amounts reimbursed, waived, or reduced through arrangements with the investment adviser, brokerage services, or other offset arrangements, if applicable, and do not represent the amount paid by the class during periods when reimbursements, waivers or reductions occur.
I Annualized
J Amount does not include the portfolio activity of any underlying mutual funds or exchange-traded funds (ETFs).
See accompanying notes which are an integral part of the financial statements.
Communication Services Portfolio Class M
| Years ended February 28, | 2021 | 2020 A | 2019 B |
| Selected Per–Share Data | | | |
| Net asset value, beginning of period | $60.52 | $74.82 | $78.20 |
| Income from Investment Operations | | | |
| Net investment income (loss)C | (.77) | (.48) | (.16) |
| Net realized and unrealized gain (loss) | 30.29 | 8.75 | 2.67 |
| Total from investment operations | 29.52 | 8.27 | 2.51 |
| Distributions from net investment income | – | – | (.12) |
| Distributions from net realized gain | (3.10) | (22.57) | (5.77) |
| Total distributions | (3.10) | (22.57) | (5.89) |
| Net asset value, end of period | $86.94 | $60.52 | $74.82 |
| Total ReturnD,E,F | 50.47% | 11.58% | 3.76% |
| Ratios to Average Net AssetsG,H | | | |
| Expenses before reductions | 1.32% | 1.35% | 1.36%I |
| Expenses net of fee waivers, if any | 1.32% | 1.35% | 1.35%I |
| Expenses net of all reductions | 1.32% | 1.34% | 1.34%I |
| Net investment income (loss) | (1.06)% | (.75)% | (.90)%I |
| Supplemental Data | | | |
| Net assets, end of period (000 omitted) | $5,386 | $2,264 | $485 |
| Portfolio turnover rateJ | 63% | 73% | 107% |
A For the year ended February 29.
B For the period November 30, 2018 (commencement of sale of shares) to February 28, 2019.
C Calculated based on average shares outstanding during the period.
D Total returns for periods of less than one year are not annualized.
E Total returns would have been lower if certain expenses had not been reduced during the applicable periods shown.
F Total returns do not include the effect of the sales charges.
G Fees and expenses of any underlying mutual funds or exchange-traded funds (ETFs) are not included in the Fund's expense ratio. The Fund indirectly bears its proportionate share of these expenses. For additional expense information related to investments in Fidelity Central Funds, please refer to the "Investments in Fidelity Central Funds" note found in the Notes to Financial Statements section of the most recent Annual or Semi-Annual report.
H Expense ratios reflect operating expenses of the class. Expenses before reductions do not reflect amounts reimbursed, waived, or reduced through arrangements with the investment adviser, brokerage services, or other offset arrangements, if applicable, and do not represent the amount paid by the class during periods when reimbursements, waivers or reductions occur.
I Annualized
J Amount does not include the portfolio activity of any underlying mutual funds or exchange-traded funds (ETFs).
See accompanying notes which are an integral part of the financial statements.
Communication Services Portfolio Class C
| Years ended February 28, | 2021 | 2020 A | 2019 B |
| Selected Per–Share Data | | | |
| Net asset value, beginning of period | $60.20 | $74.76 | $78.20 |
| Income from Investment Operations | | | |
| Net investment income (loss)C | (1.12) | (.81) | (.25) |
| Net realized and unrealized gain (loss) | 30.07 | 8.74 | 2.67 |
| Total from investment operations | 28.95 | 7.93 | 2.42 |
| Distributions from net investment income | – | – | (.09) |
| Distributions from net realized gain | (3.10) | (22.49) | (5.77) |
| Total distributions | (3.10) | (22.49) | (5.86) |
| Net asset value, end of period | $86.05 | $60.20 | $74.76 |
| Total ReturnD,E,F | 49.77% | 11.01% | 3.63% |
| Ratios to Average Net AssetsG,H | | | |
| Expenses before reductions | 1.80% | 1.86% | 1.87%I |
| Expenses net of fee waivers, if any | 1.80% | 1.86% | 1.85%I |
| Expenses net of all reductions | 1.79% | 1.85% | 1.84%I |
| Net investment income (loss) | (1.53)% | (1.26)% | (1.37)%I |
| Supplemental Data | | | |
| Net assets, end of period (000 omitted) | $6,856 | $1,982 | $377 |
| Portfolio turnover rateJ | 63% | 73% | 107% |
A For the year ended February 29.
B For the period November 30, 2018 (commencement of sale of shares) to February 28, 2019.
C Calculated based on average shares outstanding during the period.
D Total returns for periods of less than one year are not annualized.
E Total returns would have been lower if certain expenses had not been reduced during the applicable periods shown.
F Total returns do not include the effect of the contingent deferred sales charge.
G Fees and expenses of any underlying mutual funds or exchange-traded funds (ETFs) are not included in the Fund's expense ratio. The Fund indirectly bears its proportionate share of these expenses. For additional expense information related to investments in Fidelity Central Funds, please refer to the "Investments in Fidelity Central Funds" note found in the Notes to Financial Statements section of the most recent Annual or Semi-Annual report.
H Expense ratios reflect operating expenses of the class. Expenses before reductions do not reflect amounts reimbursed, waived, or reduced through arrangements with the investment adviser, brokerage services, or other offset arrangements, if applicable, and do not represent the amount paid by the class during periods when reimbursements, waivers or reductions occur.
I Annualized
J Amount does not include the portfolio activity of any underlying mutual funds or exchange-traded funds (ETFs).
See accompanying notes which are an integral part of the financial statements.
Communication Services Portfolio
| Years ended February 28, | 2021 | 2020 A | 2019 | 2018 | 2017 |
| Selected Per–Share Data | | | | | |
| Net asset value, beginning of period | $60.82 | $74.88 | $79.70 | $80.75 | $68.59 |
| Income from Investment Operations | | | | | |
| Net investment income (loss)B | (.36) | (.12) | .13 | .21 | .22 |
| Net realized and unrealized gain (loss) | 30.52 | 8.79 | 5.31 | 3.14 | 17.53 |
| Total from investment operations | 30.16 | 8.67 | 5.44 | 3.35 | 17.75 |
| Distributions from net investment income | – | – | (.20) | (.16) | (.33) |
| Distributions from net realized gain | (3.10) | (22.73) | (10.06) | (4.23) | (5.26) |
| Total distributions | (3.10) | (22.73) | (10.26) | (4.40)C | (5.59) |
| Redemption fees added to paid in capitalB | – | – | – | –D | –D |
| Net asset value, end of period | $87.88 | $60.82 | $74.88 | $79.70 | $80.75 |
| Total ReturnE | 51.29% | 12.22% | 8.12% | 4.16% | 26.85% |
| Ratios to Average Net AssetsF,G | | | | | |
| Expenses before reductions | .77% | .78% | .82% | .80% | .82% |
| Expenses net of fee waivers, if any | .77% | .78% | .81% | .80% | .82% |
| Expenses net of all reductions | .76% | .77% | .80% | .79% | .82% |
| Net investment income (loss) | (.51)% | (.18)% | .17% | .26% | .30% |
| Supplemental Data | | | | | |
| Net assets, end of period (000 omitted) | $859,871 | $577,157 | $562,422 | $509,375 | $680,392 |
| Portfolio turnover rateH | 63% | 73% | 107% | 22% | 33% |
A For the year ended February 29.
B Calculated based on average shares outstanding during the period.
C Total distributions per share do not sum due to rounding.
D Amount represents less than $.005 per share.
E Total returns would have been lower if certain expenses had not been reduced during the applicable periods shown.
F Fees and expenses of any underlying mutual funds or exchange-traded funds (ETFs) are not included in the Fund's expense ratio. The Fund indirectly bears its proportionate share of these expenses. For additional expense information related to investments in Fidelity Central Funds, please refer to the "Investments in Fidelity Central Funds" note found in the Notes to Financial Statements section of the most recent Annual or Semi-Annual report.
G Expense ratios reflect operating expenses of the class. Expenses before reductions do not reflect amounts reimbursed, waived, or reduced through arrangements with the investment adviser, brokerage services, or other offset arrangements, if applicable, and do not represent the amount paid by the class during periods when reimbursements, waivers or reductions occur.
H Amount does not include the portfolio activity of any underlying mutual funds or exchange-traded funds (ETFs).
See accompanying notes which are an integral part of the financial statements.
Communication Services Portfolio Class I
| Years ended February 28, | 2021 | 2020 A | 2019 B |
| Selected Per–Share Data | | | |
| Net asset value, beginning of period | $60.80 | $74.89 | $78.20 |
| Income from Investment Operations | | | |
| Net investment income (loss)C | (.39) | (.11) | (.06) |
| Net realized and unrealized gain (loss) | 30.55 | 8.78 | 2.67 |
| Total from investment operations | 30.16 | 8.67 | 2.61 |
| Distributions from net investment income | – | – | (.15) |
| Distributions from net realized gain | (3.10) | (22.76) | (5.77) |
| Total distributions | (3.10) | (22.76) | (5.92) |
| Net asset value, end of period | $87.86 | $60.80 | $74.89 |
| Total ReturnD,E | 51.31% | 12.22% | 3.91% |
| Ratios to Average Net AssetsF,G | | | |
| Expenses before reductions | .78% | .77% | .70%H |
| Expenses net of fee waivers, if any | .77% | .77% | .69%H |
| Expenses net of all reductions | .77% | .76% | .68%H |
| Net investment income (loss) | (.51)% | (.17)% | (.30)%H |
| Supplemental Data | | | |
| Net assets, end of period (000 omitted) | $26,521 | $2,493 | $452 |
| Portfolio turnover rateI | 63% | 73% | 107% |
A For the year ended February 29.
B For the period November 30, 2018 (commencement of sale of shares) to February 28, 2019.
C Calculated based on average shares outstanding during the period.
D Total returns for periods of less than one year are not annualized.
E Total returns would have been lower if certain expenses had not been reduced during the applicable periods shown.
F Fees and expenses of any underlying mutual funds or exchange-traded funds (ETFs) are not included in the Fund's expense ratio. The Fund indirectly bears its proportionate share of these expenses. For additional expense information related to investments in Fidelity Central Funds, please refer to the "Investments in Fidelity Central Funds" note found in the Notes to Financial Statements section of the most recent Annual or Semi-Annual report.
G Expense ratios reflect operating expenses of the class. Expenses before reductions do not reflect amounts reimbursed, waived, or reduced through arrangements with the investment adviser, brokerage services, or other offset arrangements, if applicable, and do not represent the amount paid by the class during periods when reimbursements, waivers or reductions occur.
H Annualized
I Amount does not include the portfolio activity of any underlying mutual funds or exchange-traded funds (ETFs).
See accompanying notes which are an integral part of the financial statements.
Communication Services Portfolio Class Z
| Years ended February 28, | 2021 | 2020 A | 2019 B |
| Selected Per–Share Data | | | |
| Net asset value, beginning of period | $60.85 | $74.89 | $78.20 |
| Income from Investment Operations | | | |
| Net investment income (loss)C | (.28) | (.03) | (.03) |
| Net realized and unrealized gain (loss) | 30.57 | 8.80 | 2.65 |
| Total from investment operations | 30.29 | 8.77 | 2.62 |
| Distributions from net investment income | – | – | (.16) |
| Distributions from net realized gain | (3.10) | (22.81) | (5.77) |
| Total distributions | (3.10) | (22.81) | (5.93) |
| Net asset value, end of period | $88.04 | $60.85 | $74.89 |
| Total ReturnD,E | 51.48% | 12.38% | 3.92% |
| Ratios to Average Net AssetsF,G | | | |
| Expenses before reductions | .64% | .65% | .64%H |
| Expenses net of fee waivers, if any | .64% | .65% | .62%H |
| Expenses net of all reductions | .63% | .64% | .61%H |
| Net investment income (loss) | (.38)% | (.05)% | (.16)%H |
| Supplemental Data | | | |
| Net assets, end of period (000 omitted) | $3,817 | $1,833 | $529 |
| Portfolio turnover rateI | 63% | 73% | 107% |
A For the year ended February 29.
B For the period November 30, 2018 (commencement of sale of shares) to February 28, 2019.
C Calculated based on average shares outstanding during the period.
D Total returns for periods of less than one year are not annualized.
E Total returns would have been lower if certain expenses had not been reduced during the applicable periods shown.
F Fees and expenses of any underlying mutual funds or exchange-traded funds (ETFs) are not included in the Fund's expense ratio. The Fund indirectly bears its proportionate share of these expenses. For additional expense information related to investments in Fidelity Central Funds, please refer to the "Investments in Fidelity Central Funds" note found in the Notes to Financial Statements section of the most recent Annual or Semi-Annual report.
G Expense ratios reflect operating expenses of the class. Expenses before reductions do not reflect amounts reimbursed, waived, or reduced through arrangements with the investment adviser, brokerage services, or other offset arrangements, if applicable, and do not represent the amount paid by the class during periods when reimbursements, waivers or reductions occur.
H Annualized
I Amount does not include the portfolio activity of any underlying mutual funds or exchange-traded funds (ETFs).
See accompanying notes which are an integral part of the financial statements.
Construction and Housing Portfolio
Performance: The Bottom Line
Average annual total return reflects the change in the value of an investment, assuming reinvestment of distributions from dividend income and capital gains (the profits earned upon the sale of securities that have grown in value, if any) and assuming a constant rate of performance each year. The hypothetical investment and the average annual total returns do not reflect the deduction of taxes that a shareholder would pay on fund distributions or the redemption of fund shares. During periods of reimbursement by Fidelity, a fund’s total return will be greater than it would be had the reimbursement not occurred. How a fund did yesterday is no guarantee of how it will do tomorrow.
Average Annual Total Returns
| For the periods ended February 28, 2021 | Past 1 year | Past 5 years | Past 10 years |
| Construction and Housing Portfolio | 41.70% | 18.18% | 15.47% |
$10,000 Over 10 Years
Let's say hypothetically that $10,000 was invested in Construction and Housing Portfolio on February 28, 2011.
The chart shows how the value of your investment would have changed, and also shows how the S&P 500® Index performed over the same period.
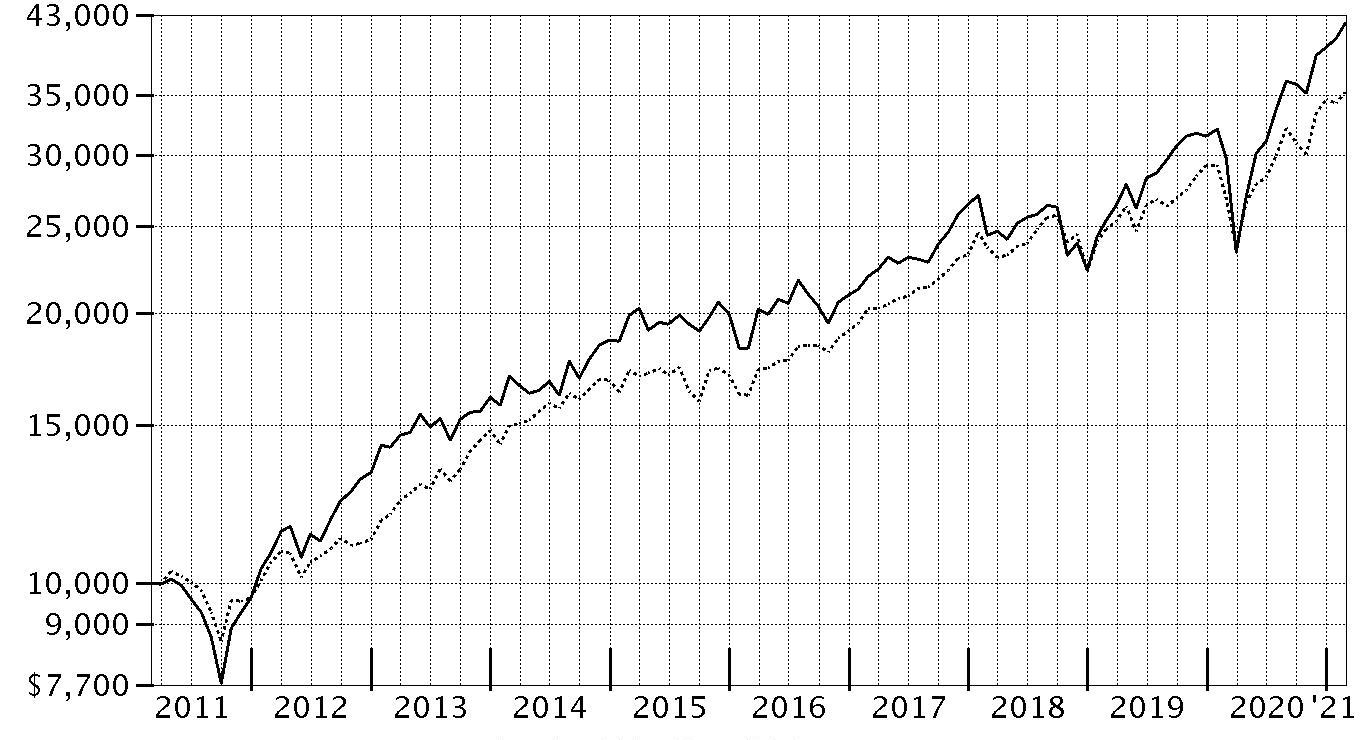
| Period Ending Values |
| $42,135 | Construction and Housing Portfolio |
| $35,259 | S&P 500® Index |
Construction and Housing Portfolio
Management's Discussion of Fund Performance
Market Recap: The S&P 500
® index gained 31.29% for the 12 months ending February 28, 2021, a volatile but productive period for U.S. risk assets. The early-2020 outbreak and spread of COVID-19 resulted in stocks suffering one of the quickest declines on record, through March 23, followed by a historic rebound that included the index closing 2020 at an all-time high and gaining modest ground in the first two months of the new year. The crisis and containment efforts caused broad contraction in economic activity, along with extreme uncertainty and dislocation in financial markets. A rapid and expansive U.S. monetary/fiscal-policy response partially offset the economic disruption and fueled the market surge, as did resilient corporate earnings. The rally slowed in September, when stocks began a two-month retreat amid Congress’s inability to reach a deal on additional fiscal stimulus, as well as concerns about election uncertainty, indications the U.S. economic recovery could be slowing and a new wave of COVID-19 cases. A shift in momentum began in October and accelerated following the U.S. elections, with the approval of three breakthrough COVID-19 vaccines and prospects for additional government stimulus fueling the “reflation trade” through February 28. By sector for the full 12 months, information technology (+50%) and consumer discretionary (+43%) led all gainers. Materials (+42%) and communication services (+37%) also stood out. In contrast, the defensive utilities (-3%) and real estate sectors (+5%) notably lagged.
Comments from Portfolio Manager Neil Nabar: For the fiscal year ending February 28, 2021, the fund gained 41.70%, outperforming the 31.85% return of the MSCI US IMI Construction & Housing 25/50 Index, as well as the broad-based S&P 500
® index. The primary contributor to performance versus the industry index was an underweighting and security selection in residential REITs (real estate investment trusts). Security selection in specialized REITs and trading companies & distributors, groups that are not in the industry index, and positioning in the homebuilding and home improvement retail segments also bolstered the fund's relative result. The fund's largest individual relative contributor was Equity Residential REIT, a new addition to the portfolio that gained roughly 23%. The stock was among the fund's biggest holdings at period end. Another top relative contributor was an out-of-index stake in Digital Realty Trust (+18%), which we eliminated from the portfolio before period end. Avoiding index component AvalonBay Communities (-9%) also aided relative performance. Conversely, the primary detractor from performance versus the industry index was stock selection in mortgage REITs. Stock picks in office REITs also hampered the fund's relative result. Our largest individual detractor versus the industry index was an out-of-index stake in MFA Financial (-80%), which was not held at period end. Also holding back performance was our overweighting in Essex Property Trust (-8%), one of the fund's biggest holdings the past 12 months. We reduced our stake in Essex by period end. Further hindering relative performance was UDR (+2%), which was not held at period end. Notable changes in positioning include increased exposure to the building products subindustry and a lower allocation to residential REITs.
The views expressed above reflect those of the portfolio manager(s) only through the end of the period as stated on the cover of this report and do not necessarily represent the views of Fidelity or any other person in the Fidelity organization. Any such views are subject to change at any time based upon market or other conditions and Fidelity disclaims any responsibility to update such views. These views may not be relied on as investment advice and, because investment decisions for a Fidelity fund are based on numerous factors, may not be relied on as an indication of trading intent on behalf of any Fidelity fund.
Construction and Housing Portfolio
Investment Summary (Unaudited)
Top Ten Stocks as of February 28, 2021
| | % of fund's net assets |
| Lowe's Companies, Inc. | 16.8 |
| The Home Depot, Inc. | 14.4 |
| Equity Residential (SBI) | 8.3 |
| Johnson Controls International PLC | 5.8 |
| Vulcan Materials Co. | 4.0 |
| Builders FirstSource, Inc. | 3.5 |
| NVR, Inc. | 3.0 |
| PulteGroup, Inc. | 2.7 |
| Toll Brothers, Inc. | 2.6 |
| Invitation Homes, Inc. | 2.4 |
| | 63.5 |
Top Industries (% of fund's net assets)
| As of February 28, 2021 |
| | Specialty Retail | 31.2% |
| | Building Products | 21.7% |
| | Equity Real Estate Investment Trusts (Reits) | 18.1% |
| | Household Durables | 11.1% |
| | Construction & Engineering | 8.0% |
| | All Others* | 9.9% |

* Includes short-term investments and net other assets (liabilities).
Construction and Housing Portfolio
Schedule of Investments February 28, 2021
Showing Percentage of Net Assets
| Common Stocks - 99.4% | | | |
| | | Shares | Value |
| Building Products - 21.7% | | | |
| Building Products - 21.7% | | | |
| Advanced Drain Systems, Inc. | | 50,100 | $5,512,002 |
| Allegion PLC | | 60,731 | 6,606,318 |
| Builders FirstSource, Inc. (a) | | 276,981 | 11,983,583 |
| Carrier Global Corp. | | 142,900 | 5,220,137 |
| Fortune Brands Home & Security, Inc. | | 18,387 | 1,528,695 |
| Johnson Controls International PLC | | 355,351 | 19,825,032 |
| Masonite International Corp. (a) | | 24,500 | 2,688,140 |
| Resideo Technologies, Inc. (a) | | 122,100 | 2,932,842 |
| Simpson Manufacturing Co. Ltd. | | 35,500 | 3,459,830 |
| The AZEK Co., Inc. | | 65,900 | 2,906,849 |
| Trane Technologies PLC | | 51,100 | 7,830,564 |
| UFP Industries, Inc. | | 66,007 | 4,026,427 |
| | | | 74,520,419 |
| Construction & Engineering - 8.0% | | | |
| Construction & Engineering - 8.0% | | | |
| Comfort Systems U.S.A., Inc. | | 60,829 | 3,767,748 |
| Dycom Industries, Inc. (a) | | 28,054 | 2,148,375 |
| EMCOR Group, Inc. | | 58,070 | 5,654,276 |
| Granite Construction, Inc. | | 73,018 | 2,510,359 |
| Quanta Services, Inc. | | 91,699 | 7,688,961 |
| Willscot Mobile Mini Holdings (a) | | 204,750 | 5,677,718 |
| | | | 27,447,437 |
| Construction Materials - 5.1% | | | |
| Construction Materials - 5.1% | | | |
| Summit Materials, Inc. (a) | | 141,114 | 3,910,269 |
| Vulcan Materials Co. | | 81,676 | 13,639,075 |
| | | | 17,549,344 |
| Electrical Equipment - 0.5% | | | |
| Electrical Components & Equipment - 0.5% | | | |
| Atkore, Inc. (a) | | 24,501 | 1,657,493 |
| Equity Real Estate Investment Trusts (REITs) - 18.1% | | | |
| Health Care REITs - 1.9% | | | |
| Welltower, Inc. | | 97,400 | 6,613,460 |
| Residential REITs - 12.4% | | | |
| Equity Lifestyle Properties, Inc. | | 20,200 | 1,245,330 |
| Equity Residential (SBI) | | 438,800 | 28,701,908 |
| Essex Property Trust, Inc. | | 18,072 | 4,604,565 |
| Invitation Homes, Inc. | | 279,400 | 8,141,716 |
| | | | 42,693,519 |
| Specialized REITs - 3.8% | | | |
| CyrusOne, Inc. | | 90,615 | 5,947,062 |
| Lamar Advertising Co. Class A | | 81,600 | 7,065,744 |
| | | | 13,012,806 |
|
| TOTAL EQUITY REAL ESTATE INVESTMENT TRUSTS (REITS) | | | 62,319,785 |
|
| Household Durables - 11.1% | | | |
| Homebuilding - 11.1% | | | |
| Blu Investments LLC (b)(c) | | 11,990,913 | 3,717 |
| D.R. Horton, Inc. | | 74,256 | 5,708,059 |
| NVR, Inc. (a) | | 2,309 | 10,392,440 |
| PulteGroup, Inc. | | 209,185 | 9,436,335 |
| Taylor Morrison Home Corp. (a) | | 86,455 | 2,378,377 |
| Toll Brothers, Inc. | | 166,200 | 8,878,404 |
| TopBuild Corp. (a) | | 7,458 | 1,420,078 |
| | | | 38,217,410 |
| Real Estate Management & Development - 2.9% | | | |
| Diversified Real Estate Activities - 0.6% | | | |
| The RMR Group, Inc. | | 51,960 | 2,088,272 |
| Real Estate Development - 0.8% | | | |
| Howard Hughes Corp. (a) | | 28,506 | 2,704,364 |
| Real Estate Services - 1.5% | | | |
| Cushman & Wakefield PLC (a) | | 164,795 | 2,551,027 |
| Realogy Holdings Corp. (a) | | 165,300 | 2,492,724 |
| | | | 5,043,751 |
|
| TOTAL REAL ESTATE MANAGEMENT & DEVELOPMENT | | | 9,836,387 |
|
| Specialty Retail - 31.2% | | | |
| Home Improvement Retail - 31.2% | | | |
| Lowe's Companies, Inc. | | 359,995 | 57,509,202 |
| The Home Depot, Inc. | | 191,990 | 49,598,697 |
| | | | 107,107,899 |
| Trading Companies & Distributors - 0.8% | | | |
| Trading Companies & Distributors - 0.8% | | | |
| Beacon Roofing Supply, Inc. (a) | | 57,503 | 2,750,368 |
| TOTAL COMMON STOCKS | | | |
| (Cost $189,349,394) | | | 341,406,542 |
|
| Money Market Funds - 0.9% | | | |
| Fidelity Cash Central Fund 0.07% (d) | | 2,984,024 | 2,984,621 |
| TOTAL MONEY MARKET FUNDS | | | |
| (Cost $2,984,621) | | | 2,984,621 |
| TOTAL INVESTMENT IN SECURITIES - 100.3% | | | |
| (Cost $192,334,015) | | | 344,391,163 |
| NET OTHER ASSETS (LIABILITIES) - (0.3)% | | | (929,730) |
| NET ASSETS - 100% | | | $343,461,433 |
Legend
(a) Non-income producing
(b) Restricted securities (including private placements) - Investment in securities not registered under the Securities Act of 1933 (excluding 144A issues). At the end of the period, the value of restricted securities (excluding 144A issues) amounted to $3,717 or 0.0% of net assets.
(c) Level 3 security
(d) Affiliated fund that is generally available only to investment companies and other accounts managed by Fidelity Investments. The rate quoted is the annualized seven-day yield of the fund at period end. A complete unaudited listing of the fund's holdings as of its most recent quarter end is available upon request. In addition, each Fidelity Central Fund's financial statements, which are not covered by the Fund's Report of Independent Registered Public Accounting Firm, are available on the SEC's website or upon request.
Additional information on each restricted holding is as follows:
| Security | Acquisition Date | Acquisition Cost |
| Blu Investments LLC | 5/21/20 | $20,739 |
Affiliated Central Funds
Information regarding fiscal year to date income earned by the Fund from investments in Fidelity Central Funds is as follows:
| Fund | Income earned |
| Fidelity Cash Central Fund | $2,316 |
| Fidelity Securities Lending Cash Central Fund | 1,681 |
| Total | $3,997 |
Amounts in the income column in the above table include any capital gain distributions from underlying funds, which are presented in the corresponding line-item in the Statement of Operations, if applicable. Amount for Fidelity Securities Lending Cash Central Fund represents the income earned on investing cash collateral, less rebates paid to borrowers and any lending agent fees associated with the loan, plus any premium payments received for lending certain types of securities.
Investment Valuation
The following is a summary of the inputs used, as of February 28, 2021, involving the Fund's assets and liabilities carried at fair value. The inputs or methodology used for valuing securities may not be an indication of the risk associated with investing in those securities. For more information on valuation inputs, and their aggregation into the levels used below, please refer to the Investment Valuation section in the accompanying Notes to Financial Statements.
| | Valuation Inputs at Reporting Date: |
| Description | Total | Level 1 | Level 2 | Level 3 |
| Investments in Securities: | | | | |
| Common Stocks | $341,406,542 | $341,402,825 | $-- | $3,717 |
| Money Market Funds | 2,984,621 | 2,984,621 | -- | -- |
| Total Investments in Securities: | $344,391,163 | $344,387,446 | $-- | $3,717 |
| Net unrealized depreciation on unfunded commitments | $(162,200) | $-- | $(162,200) | $-- |
Other Information
Distribution of investments by country or territory of incorporation, as a percentage of Total Net Assets, is as follows (Unaudited):
| United States of America | 88.4% |
| Ireland | 10.0% |
| Others (Individually Less Than 1%) | 1.6% |
| | 100.0% |
See accompanying notes which are an integral part of the financial statements.
Construction and Housing Portfolio
Financial Statements
Statement of Assets and Liabilities
| | | February 28, 2021 |
| Assets | | |
Investment in securities, at value — See accompanying schedule:
Unaffiliated issuers (cost $189,349,394) | $341,406,542 | |
| Fidelity Central Funds (cost $2,984,621) | 2,984,621 | |
| Total Investment in Securities (cost $192,334,015) | | $344,391,163 |
| Receivable for investments sold | | 1,023,225 |
| Receivable for fund shares sold | | 629,852 |
| Dividends receivable | | 49,493 |
| Distributions receivable from Fidelity Central Funds | | 147 |
| Prepaid expenses | | 1,894 |
| Other receivables | | 2,623 |
| Total assets | | 346,098,397 |
| Liabilities | | |
| Payable for investments purchased | $1,787,870 | |
| Net unrealized depreciation on unfunded commitments | 162,200 | |
| Payable for fund shares redeemed | 443,854 | |
| Accrued management fee | 152,257 | |
| Other affiliated payables | 56,854 | |
| Other payables and accrued expenses | 33,929 | |
| Total liabilities | | 2,636,964 |
| Net Assets | | $343,461,433 |
| Net Assets consist of: | | |
| Paid in capital | | $182,648,881 |
| Total accumulated earnings (loss) | | 160,812,552 |
| Net Assets | | $343,461,433 |
| Net Asset Value, offering price and redemption price per share ($343,461,433 ÷ 4,430,106 shares) | | $77.53 |
See accompanying notes which are an integral part of the financial statements.
Statement of Operations
| | | Year ended February 28, 2021 |
| Investment Income | | |
| Dividends | | $5,034,200 |
| Income from Fidelity Central Funds (including $1,681 from security lending) | | 3,997 |
| Total income | | 5,038,197 |
| Expenses | | |
| Management fee | $1,566,666 | |
| Transfer agent fees | 532,078 | |
| Accounting fees | 115,038 | |
| Custodian fees and expenses | 15,084 | |
| Independent trustees' fees and expenses | 1,664 | |
| Registration fees | 37,374 | |
| Audit | 37,484 | |
| Legal | 2,177 | |
| Interest | 1,551 | |
| Miscellaneous | 7,354 | |
| Total expenses before reductions | 2,316,470 | |
| Expense reductions | (42,719) | |
| Total expenses after reductions | | 2,273,751 |
| Net investment income (loss) | | 2,764,446 |
| Realized and Unrealized Gain (Loss) | | |
| Net realized gain (loss) on: | | |
| Investment securities: | | |
| Unaffiliated issuers | 11,232,339 | |
| Fidelity Central Funds | 144 | |
| Total net realized gain (loss) | | 11,232,483 |
| Change in net unrealized appreciation (depreciation) on: | | |
| Investment securities: | | |
| Unaffiliated issuers | 80,541,838 | |
| Unfunded commitments | (162,200) | |
| Total change in net unrealized appreciation (depreciation) | | 80,379,638 |
| Net gain (loss) | | 91,612,121 |
| Net increase (decrease) in net assets resulting from operations | | $94,376,567 |
See accompanying notes which are an integral part of the financial statements.
Statement of Changes in Net Assets
| | Year ended February 28, 2021 | Year ended February 29, 2020 |
| Increase (Decrease) in Net Assets | | |
| Operations | | |
| Net investment income (loss) | $2,764,446 | $2,713,972 |
| Net realized gain (loss) | 11,232,483 | 32,794,214 |
| Change in net unrealized appreciation (depreciation) | 80,379,638 | 3,334,280 |
| Net increase (decrease) in net assets resulting from operations | 94,376,567 | 38,842,466 |
| Distributions to shareholders | (15,851,989) | (24,490,216) |
| Share transactions | | |
| Proceeds from sales of shares | 111,965,826 | 299,727,079 |
| Reinvestment of distributions | 15,043,485 | 22,923,116 |
| Cost of shares redeemed | (180,977,827) | (243,352,371) |
| Net increase (decrease) in net assets resulting from share transactions | (53,968,516) | 79,297,824 |
| Total increase (decrease) in net assets | 24,556,062 | 93,650,074 |
| Net Assets | | |
| Beginning of period | 318,905,371 | 225,255,297 |
| End of period | $343,461,433 | $318,905,371 |
| Other Information | | |
| Shares | | |
| Sold | 1,731,273 | 4,813,223 |
| Issued in reinvestment of distributions | 305,680 | 383,278 |
| Redeemed | (3,052,385) | (3,905,073) |
| Net increase (decrease) | (1,015,432) | 1,291,428 |
See accompanying notes which are an integral part of the financial statements.
Financial Highlights
Construction and Housing Portfolio
| | | | | | |
| Years ended February 28, | 2021 | 2020 A | 2019 | 2018 | 2017 |
| Selected Per–Share Data | | | | | |
| Net asset value, beginning of period | $58.56 | $54.22 | $59.88 | $61.70 | $53.16 |
| Income from Investment Operations | | | | | |
| Net investment income (loss)B | .59 | .53 | .49 | .44 | .37 |
| Net realized and unrealized gain (loss) | 21.82 | 8.71 | 1.32 | 6.58 | 10.29 |
| Total from investment operations | 22.41 | 9.24 | 1.81 | 7.02 | 10.66 |
| Distributions from net investment income | (.61) | (.60) | (.55) | (.30) | (.45) |
| Distributions from net realized gain | (2.83) | (4.31) | (6.92) | (8.53) | (1.67) |
| Total distributions | (3.44) | (4.90)C | (7.47) | (8.84)C | (2.12) |
| Redemption fees added to paid in capitalB | – | – | – | –D | –D |
| Net asset value, end of period | $77.53 | $58.56 | $54.22 | $59.88 | $61.70 |
| Total ReturnE | 41.70% | 17.10% | 4.03% | 11.07% | 20.23% |
| Ratios to Average Net AssetsF,G | | | | | |
| Expenses before reductions | .78% | .79% | .80% | .80% | .80% |
| Expenses net of fee waivers, if any | .78% | .79% | .80% | .80% | .80% |
| Expenses net of all reductions | .77% | .79% | .79% | .79% | .79% |
| Net investment income (loss) | .94% | .88% | .86% | .69% | .62% |
| Supplemental Data | | | | | |
| Net assets, end of period (000 omitted) | $343,461 | $318,905 | $225,255 | $331,418 | $404,526 |
| Portfolio turnover rateH | 93% | 161% | 90% | 56% | 87% |
A For the year ended February 29.
B Calculated based on average shares outstanding during the period.
C Total distributions per share do not sum due to rounding.
D Amount represents less than $.005 per share.
E Total returns would have been lower if certain expenses had not been reduced during the applicable periods shown.
F Fees and expenses of any underlying mutual funds or exchange-traded funds (ETFs) are not included in the Fund's expense ratio. The Fund indirectly bears its proportionate share of these expenses. For additional expense information related to investments in Fidelity Central Funds, please refer to the "Investments in Fidelity Central Funds" note found in the Notes to Financial Statements section of the most recent Annual or Semi-Annual report.
G Expense ratios reflect operating expenses of the class. Expenses before reductions do not reflect amounts reimbursed, waived, or reduced through arrangements with the investment advisor, brokerage services, or other offset arrangements, if applicable, and do not represent the amount paid by the class during periods when reimbursements, waivers or reductions occur.
H Amount does not include the portfolio activity of any underlying mutual funds or exchange-traded funds (ETFs).
See accompanying notes which are an integral part of the financial statements.
Consumer Discretionary Portfolio
Performance: The Bottom Line
Average annual total return reflects the change in the value of an investment, assuming reinvestment of distributions from dividend income and capital gains (the profits earned upon the sale of securities that have grown in value, if any) and assuming a constant rate of performance each year. The hypothetical investment and the average annual total returns do not reflect the deduction of taxes that a shareholder would pay on fund distributions or the redemption of fund shares. During periods of reimbursement by Fidelity, a fund’s total return will be greater than it would be had the reimbursement not occurred. How a fund did yesterday is no guarantee of how it will do tomorrow.
Average Annual Total Returns
| For the periods ended February 28, 2021 | Past 1 year | Past 5 years | Past 10 years |
| Consumer Discretionary Portfolio | 50.96% | 18.72% | 15.65% |
$10,000 Over 10 Years
Let's say hypothetically that $10,000 was invested in Consumer Discretionary Portfolio on February 28, 2011.
The chart shows how the value of your investment would have changed, and also shows how the S&P 500® Index performed over the same period.
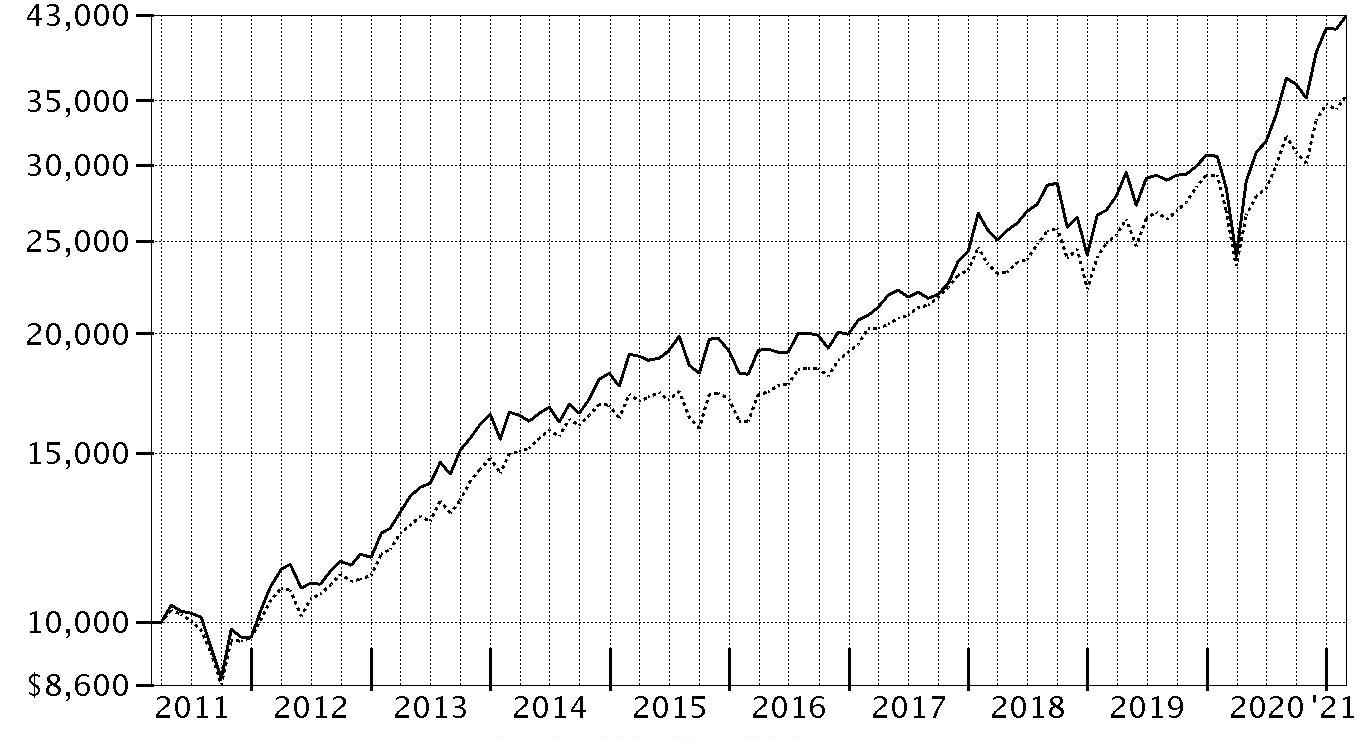
| Period Ending Values |
| $42,797 | Consumer Discretionary Portfolio |
| $35,259 | S&P 500® Index |
Consumer Discretionary Portfolio
Management's Discussion of Fund Performance
Market Recap: The S&P 500
® index gained 31.29% for the 12 months ending February 28, 2021, a volatile but productive period for U.S. risk assets. The early-2020 outbreak and spread of COVID-19 resulted in stocks suffering one of the quickest declines on record, through March 23, followed by a historic rebound that included the index closing 2020 at an all-time high and gaining modest ground in the first two months of the new year. The crisis and containment efforts caused broad contraction in economic activity, along with extreme uncertainty and dislocation in financial markets. A rapid and expansive U.S. monetary/fiscal-policy response partially offset the economic disruption and fueled the market surge, as did resilient corporate earnings. The rally slowed in September, when stocks began a two-month retreat amid Congress’s inability to reach a deal on additional fiscal stimulus, as well as concerns about election uncertainty, indications the U.S. economic recovery could be slowing and a new wave of COVID-19 cases. A shift in momentum began in October and accelerated following the U.S. elections, with the approval of three breakthrough COVID-19 vaccines and prospects for additional government stimulus fueling the “reflation trade” through February 28. By sector for the full 12 months, information technology (+50%) and consumer discretionary (+43%) led all gainers. Materials (+42%) and communication services (+37%) also stood out. In contrast, the defensive utilities (-3%) and real estate sectors (+5%) notably lagged.
Comments from Portfolio Manager Katherine Shaw: For the fiscal year ending February 28, 2021, the fund gained 50.96%, trailing the 64.02% advance of the MSCI US IMI Consumer Discretionary 25/50 Index, but outperforming the broad-based S&P 500
® index. Versus the sector index, industry positioning was the primary detractor, especially an underweighting in automobile manufacturers. An overweighting and security selection in the apparel retail segment and stock selection in internet & direct marketing retail group also hurt. The biggest individual relative detractor was an underweight position in Tesla (+406%), though it was among our largest holdings. Also hurting performance was our overweighting in Burlington Stores, which gained approximately 19%. Burlington Stores was one of our biggest holdings the past 12 months. Also holding back performance was an underweighting in MercadoLibre, which gained 166%. This was a position we established the past year. In contrast, the top contributor to performance versus the sector index was stock selection in apparel, accessories & luxury goods. An overweighting and stock picks in casinos & gaming and an underweighting in hotels, resorts & cruise lines also helped. The fund's biggest individual relative contributor was an outsized stake in Expedia, which gained 105% the past 12 months. The company was among the largest holdings as of February 28. Also lifting performance was our overweighting in Capri Holdings, which gained 82%. Capri Holdings was among the biggest holdings as of February 28. Another notable relative contributor was an outsized stake in Tapestry (+81%), which was one of our largest holdings at period end. Notable changes in positioning include increased exposure to the apparel, accessories & luxury goods industry and a lower allocation to restaurants.
The views expressed above reflect those of the portfolio manager(s) only through the end of the period as stated on the cover of this report and do not necessarily represent the views of Fidelity or any other person in the Fidelity organization. Any such views are subject to change at any time based upon market or other conditions and Fidelity disclaims any responsibility to update such views. These views may not be relied on as investment advice and, because investment decisions for a Fidelity fund are based on numerous factors, may not be relied on as an indication of trading intent on behalf of any Fidelity fund.
Consumer Discretionary Portfolio
Investment Summary (Unaudited)
Top Ten Stocks as of February 28, 2021
| | % of fund's net assets |
| Amazon.com, Inc. | 19.4 |
| Tesla, Inc. | 7.3 |
| The Home Depot, Inc. | 5.4 |
| NIKE, Inc. Class B | 3.8 |
| Starbucks Corp. | 3.0 |
| Capri Holdings Ltd. | 3.0 |
| Lowe's Companies, Inc. | 3.0 |
| Tapestry, Inc. | 2.2 |
| PVH Corp. | 2.0 |
| Expedia, Inc. | 2.0 |
| | 51.1 |
Top Industries (% of fund's net assets)
| As of February 28, 2021 |
| | Internet & Direct Marketing Retail | 25.4% |
| | Specialty Retail | 19.1% |
| | Hotels, Restaurants & Leisure | 17.1% |
| | Textiles, Apparel & Luxury Goods | 15.5% |
| | Automobiles | 7.7% |
| | All Others* | 15.2% |

* Includes short-term investments and net other assets (liabilities).
Consumer Discretionary Portfolio
Schedule of Investments February 28, 2021
Showing Percentage of Net Assets
| Common Stocks - 99.5% | | | |
| | | Shares | Value |
| Automobiles - 7.7% | | | |
| Automobile Manufacturers - 7.7% | | | |
| Ferrari NV | | 12,614 | $2,489,751 |
| Tesla, Inc. (a) | | 63,100 | 42,624,050 |
| | | | 45,113,801 |
| Commercial Services & Supplies - 0.4% | | | |
| Diversified Support Services - 0.4% | | | |
| Copart, Inc. (a) | | 20,458 | 2,233,195 |
| Diversified Consumer Services - 0.5% | | | |
| Education Services - 0.5% | | | |
| Grand Canyon Education, Inc. (a) | | 12,964 | 1,357,201 |
| New Oriental Education & Technology Group, Inc. sponsored ADR (a) | | 7,843 | 1,393,074 |
| | | | 2,750,275 |
| Entertainment - 1.0% | | | |
| Movies & Entertainment - 1.0% | | | |
| Cinemark Holdings, Inc. | | 133,200 | 2,990,340 |
| Live Nation Entertainment, Inc. (a) | | 32,500 | 2,887,950 |
| | | | 5,878,290 |
| Food & Staples Retailing - 1.7% | | | |
| Food Distributors - 1.4% | | | |
| Performance Food Group Co. (a) | | 82,992 | 4,501,486 |
| U.S. Foods Holding Corp. (a) | | 97,600 | 3,558,496 |
| | | | 8,059,982 |
| Hypermarkets & Super Centers - 0.3% | | | |
| BJ's Wholesale Club Holdings, Inc. (a) | | 49,832 | 2,002,250 |
|
| TOTAL FOOD & STAPLES RETAILING | | | 10,062,232 |
|
| Hotels, Restaurants & Leisure - 17.1% | | | |
| Casinos & Gaming - 4.7% | | | |
| Caesars Entertainment, Inc. (a) | | 120,849 | 11,292,131 |
| Churchill Downs, Inc. | | 29,346 | 6,768,068 |
| MGM Resorts International | | 9,900 | 374,121 |
| Penn National Gaming, Inc. (a) | | 77,489 | 8,971,676 |
| | | | 27,405,996 |
| Hotels, Resorts & Cruise Lines - 4.1% | | | |
| Airbnb, Inc. Class A (b) | | 11,800 | 2,434,930 |
| Extended Stay America, Inc. unit | | 180,600 | 2,905,854 |
| Hilton Worldwide Holdings, Inc. | | 81,100 | 10,030,448 |
| Lindblad Expeditions Holdings (a) | | 4,123 | 85,882 |
| Marriott International, Inc. Class A | | 29,300 | 4,338,451 |
| Marriott Vacations Worldwide Corp. | | 23,905 | 4,056,918 |
| | | | 23,852,483 |
| Leisure Facilities - 1.0% | | | |
| Planet Fitness, Inc. (a) | | 30,309 | 2,609,302 |
| Vail Resorts, Inc. | | 10,412 | 3,219,182 |
| | | | 5,828,484 |
| Restaurants - 7.3% | | | |
| ARAMARK Holdings Corp. | | 78,168 | 2,901,596 |
| Chipotle Mexican Grill, Inc. (a) | | 4,772 | 6,881,224 |
| McDonald's Corp. | | 49,816 | 10,269,070 |
| Noodles & Co. (a) | | 171,100 | 1,615,184 |
| Restaurant Brands International, Inc. | | 48,400 | 2,903,011 |
| Ruth's Hospitality Group, Inc. | | 5,500 | 125,428 |
| Starbucks Corp. | | 165,187 | 17,845,152 |
| | | | 42,540,665 |
|
| TOTAL HOTELS, RESTAURANTS & LEISURE | | | 99,627,628 |
|
| Household Durables - 3.0% | | | |
| Home Furnishings - 0.3% | | | |
| Purple Innovation, Inc. (a) | | 12,040 | 442,952 |
| Tempur Sealy International, Inc. | | 33,900 | 1,132,599 |
| | | | 1,575,551 |
| Homebuilding - 2.7% | | | |
| D.R. Horton, Inc. | | 80,281 | 6,171,200 |
| Lennar Corp. Class A | | 57,393 | 4,761,897 |
| NVR, Inc. (a) | | 1,117 | 5,027,438 |
| | | | 15,960,535 |
|
| TOTAL HOUSEHOLD DURABLES | | | 17,536,086 |
|
| Interactive Media & Services - 0.9% | | | |
| Interactive Media & Services - 0.9% | | | |
| Alphabet, Inc. Class A (a) | | 1,444 | 2,919,638 |
| Facebook, Inc. Class A (a) | | 8,500 | 2,189,770 |
| | | | 5,109,408 |
| Internet & Direct Marketing Retail - 25.4% | | | |
| Internet & Direct Marketing Retail - 25.4% | | | |
| Alibaba Group Holding Ltd. sponsored ADR (a) | | 7,800 | 1,854,528 |
| Amazon.com, Inc. (a) | | 36,685 | 113,464,139 |
| Expedia, Inc. | | 72,200 | 11,624,200 |
| Farfetch Ltd. Class A (a) | | 36,900 | 2,430,972 |
| MercadoLibre, Inc. (a) | | 3,800 | 6,224,818 |
| The Booking Holdings, Inc. (a) | | 3,200 | 7,451,232 |
| The RealReal, Inc. (a) | | 120,000 | 3,064,800 |
| Wayfair LLC Class A (a) | | 6,912 | 1,997,430 |
| | | | 148,112,119 |
| IT Services - 0.2% | | | |
| Data Processing & Outsourced Services - 0.2% | | | |
| Visa, Inc. Class A | | 6,100 | 1,295,579 |
| Multiline Retail - 6.3% | | | |
| Department Stores - 0.7% | | | |
| Kohl's Corp. | | 17,389 | 960,742 |
| Nordstrom, Inc. | | 83,800 | 3,054,510 |
| | | | 4,015,252 |
| General Merchandise Stores - 5.6% | | | |
| B&M European Value Retail SA | | 133,886 | 1,019,200 |
| Dollar General Corp. | | 61,371 | 11,598,505 |
| Dollar Tree, Inc. (a) | | 77,612 | 7,621,498 |
| Ollie's Bargain Outlet Holdings, Inc. (a) | | 48,982 | 4,049,832 |
| Target Corp. | | 47,500 | 8,713,400 |
| | | | 33,002,435 |
|
| TOTAL MULTILINE RETAIL | | | 37,017,687 |
|
| Personal Products - 0.0% | | | |
| Personal Products - 0.0% | | | |
| Herbalife Nutrition Ltd. (a) | | 5,100 | 229,398 |
| Road & Rail - 0.7% | | | |
| Trucking - 0.7% | | | |
| Lyft, Inc. (a) | | 39,800 | 2,216,860 |
| Uber Technologies, Inc. (a) | | 33,000 | 1,707,750 |
| | | | 3,924,610 |
| Specialty Retail - 19.1% | | | |
| Apparel Retail - 6.2% | | | |
| American Eagle Outfitters, Inc. | | 168,106 | 4,320,324 |
| Aritzia LP (a) | | 27,300 | 643,350 |
| Burlington Stores, Inc. (a) | | 40,400 | 10,456,328 |
| L Brands, Inc. | | 16,700 | 912,822 |
| Ross Stores, Inc. | | 78,127 | 9,112,733 |
| TJX Companies, Inc. | | 159,513 | 10,526,263 |
| | | | 35,971,820 |
| Automotive Retail - 0.7% | | | |
| Carvana Co. Class A (a) | | 4,000 | 1,134,000 |
| O'Reilly Automotive, Inc.(a) | | 7,284 | 3,258,352 |
| | | | 4,392,352 |
| Computer & Electronics Retail - 0.6% | | | |
| Best Buy Co., Inc. | | 35,513 | 3,563,730 |
| Home Improvement Retail - 9.2% | | | |
| Floor & Decor Holdings, Inc. Class A (a) | | 50,649 | 4,816,213 |
| Lowe's Companies, Inc. | | 108,034 | 17,258,432 |
| The Home Depot, Inc. | | 121,817 | 31,470,204 |
| | | | 53,544,849 |
| Specialty Stores - 2.4% | | | |
| Dick's Sporting Goods, Inc. | | 37,700 | 2,690,649 |
| Five Below, Inc. (a) | | 24,679 | 4,593,255 |
| JD Sports Fashion PLC (a) | | 26,300 | 304,268 |
| National Vision Holdings, Inc. (a) | | 36,853 | 1,750,149 |
| Sally Beauty Holdings, Inc. (a) | | 63,100 | 1,015,910 |
| Ulta Beauty, Inc. (a) | | 11,400 | 3,674,562 |
| | | | 14,028,793 |
|
| TOTAL SPECIALTY RETAIL | | | 111,501,544 |
|
| Textiles, Apparel & Luxury Goods - 15.5% | | | |
| Apparel, Accessories & Luxury Goods - 10.4% | | | |
| adidas AG | | 6,505 | 2,267,463 |
| Canada Goose Holdings, Inc. (a) | | 20,434 | 915,885 |
| Capri Holdings Ltd. (a) | | 370,230 | 17,278,634 |
| G-III Apparel Group Ltd. (a) | | 54,397 | 1,566,090 |
| Hermes International SCA | | 723 | 805,340 |
| Levi Strauss & Co. Class A (b) | | 71,300 | 1,658,438 |
| lululemon athletica, Inc. (a) | | 11,930 | 3,718,342 |
| LVMH Moet Hennessy Louis Vuitton SE | | 6,484 | 4,108,385 |
| PVH Corp. | | 117,173 | 11,712,613 |
| Ralph Lauren Corp. | | 35,738 | 4,184,205 |
| Tapestry, Inc. | | 300,182 | 12,649,669 |
| | | | 60,865,064 |
| Footwear - 5.1% | | | |
| Crocs, Inc. (a) | | 2,000 | 153,440 |
| Deckers Outdoor Corp. (a) | | 20,627 | 6,726,671 |
| NIKE, Inc. Class B | | 165,230 | 22,269,699 |
| Skechers U.S.A., Inc. Class A (sub. vtg.) (a) | | 21,700 | 794,220 |
| | | | 29,944,030 |
|
| TOTAL TEXTILES, APPAREL & LUXURY GOODS | | | 90,809,094 |
|
| TOTAL COMMON STOCKS | | | |
| (Cost $320,880,822) | | | 581,200,946 |
|
| Convertible Preferred Stocks - 0.0% | | | |
| Food & Staples Retailing - 0.0% | | | |
| Food Retail - 0.0% | | | |
| Roofoods Ltd. Series H (c)(d) | | | |
| (Cost $87,775) | | 100 | 87,775 |
|
| Money Market Funds - 1.1% | | | |
| Fidelity Cash Central Fund 0.07% (e) | | 2,465,400 | 2,465,893 |
| Fidelity Securities Lending Cash Central Fund 0.08% (e)(f) | | 3,700,244 | 3,700,614 |
| TOTAL MONEY MARKET FUNDS | | | |
| (Cost $6,166,507) | | | 6,166,507 |
| TOTAL INVESTMENT IN SECURITIES - 100.6% | | | |
| (Cost $327,135,104) | | | 587,455,228 |
| NET OTHER ASSETS (LIABILITIES) - (0.6)% | | | (3,517,324) |
| NET ASSETS - 100% | | | $583,937,904 |
Legend
(a) Non-income producing
(b) Security or a portion of the security is on loan at period end.
(c) Level 3 security
(d) Restricted securities (including private placements) - Investment in securities not registered under the Securities Act of 1933 (excluding 144A issues). At the end of the period, the value of restricted securities (excluding 144A issues) amounted to $87,775 or 0.0% of net assets.
(e) Affiliated fund that is generally available only to investment companies and other accounts managed by Fidelity Investments. The rate quoted is the annualized seven-day yield of the fund at period end. A complete unaudited listing of the fund's holdings as of its most recent quarter end is available upon request. In addition, each Fidelity Central Fund's financial statements, which are not covered by the Fund's Report of Independent Registered Public Accounting Firm, are available on the SEC's website or upon request.
(f) Investment made with cash collateral received from securities on loan.
Additional information on each restricted holding is as follows:
| Security | Acquisition Date | Acquisition Cost |
| Roofoods Ltd. Series H | 1/15/21 | $87,775 |
Affiliated Central Funds
Information regarding fiscal year to date income earned by the Fund from investments in Fidelity Central Funds is as follows:
| Fund | Income earned |
| Fidelity Cash Central Fund | $2,980 |
| Fidelity Securities Lending Cash Central Fund | 17,951 |
| Total | $20,931 |
Amounts in the income column in the above table include any capital gain distributions from underlying funds, which are presented in the corresponding line-item in the Statement of Operations, if applicable. Amount for Fidelity Securities Lending Cash Central Fund represents the income earned on investing cash collateral, less rebates paid to borrowers and any lending agent fees associated with the loan, plus any premium payments received for lending certain types of securities.
Investment Valuation
The following is a summary of the inputs used, as of February 28, 2021, involving the Fund's assets and liabilities carried at fair value. The inputs or methodology used for valuing securities may not be an indication of the risk associated with investing in those securities. For more information on valuation inputs, and their aggregation into the levels used below, please refer to the Investment Valuation section in the accompanying Notes to Financial Statements.
| | Valuation Inputs at Reporting Date: |
| Description | Total | Level 1 | Level 2 | Level 3 |
| Investments in Securities: | | | | |
| Common Stocks | $581,200,946 | $577,092,561 | $4,108,385 | $-- |
| Convertible Preferred Stocks | 87,775 | -- | -- | 87,775 |
| Money Market Funds | 6,166,507 | 6,166,507 | -- | -- |
| Total Investments in Securities: | $587,455,228 | $583,259,068 | $4,108,385 | $87,775 |
See accompanying notes which are an integral part of the financial statements.
Consumer Discretionary Portfolio
Financial Statements
Statement of Assets and Liabilities
| | | February 28, 2021 |
| Assets | | |
Investment in securities, at value (including securities loaned of $3,864,057) — See accompanying schedule:
Unaffiliated issuers (cost $320,968,597) | $581,288,721 | |
| Fidelity Central Funds (cost $6,166,507) | 6,166,507 | |
| Total Investment in Securities (cost $327,135,104) | | $587,455,228 |
| Cash | | 103,459 |
| Receivable for investments sold | | 3,340,238 |
| Receivable for fund shares sold | | 1,101,509 |
| Dividends receivable | | 281,650 |
| Distributions receivable from Fidelity Central Funds | | 230 |
| Prepaid expenses | | 4,443 |
| Other receivables | | 17,107 |
| Total assets | | 592,303,864 |
| Liabilities | | |
| Payable for investments purchased | $3,436,711 | |
| Payable for fund shares redeemed | 845,608 | |
| Accrued management fee | 261,332 | |
| Other affiliated payables | 89,789 | |
| Other payables and accrued expenses | 36,195 | |
| Collateral on securities loaned | 3,696,325 | |
| Total liabilities | | 8,365,960 |
| Net Assets | | $583,937,904 |
| Net Assets consist of: | | |
| Paid in capital | | $299,681,132 |
| Total accumulated earnings (loss) | | 284,256,772 |
| Net Assets | | $583,937,904 |
| Net Asset Value, offering price and redemption price per share ($583,937,904 ÷ 8,586,483 shares) | | $68.01 |
See accompanying notes which are an integral part of the financial statements.
Statement of Operations
| | | Year ended February 28, 2021 |
| Investment Income | | |
| Dividends | | $3,163,129 |
| Income from Fidelity Central Funds (including $17,951 from security lending) | | 20,931 |
| Total income | | 3,184,060 |
| Expenses | | |
| Management fee | $2,447,164 | |
| Transfer agent fees | 737,153 | |
| Accounting fees | 177,867 | |
| Custodian fees and expenses | 13,789 | |
| Independent trustees' fees and expenses | 2,448 | |
| Registration fees | 44,432 | |
| Audit | 46,716 | |
| Legal | 2,121 | |
| Interest | 2,241 | |
| Miscellaneous | 8,589 | |
| Total expenses before reductions | 3,482,520 | |
| Expense reductions | (13,708) | |
| Total expenses after reductions | | 3,468,812 |
| Net investment income (loss) | | (284,752) |
| Realized and Unrealized Gain (Loss) | | |
| Net realized gain (loss) on: | | |
| Investment securities: | | |
| Unaffiliated issuers | 36,446,291 | |
| Fidelity Central Funds | 203 | |
| Foreign currency transactions | 28 | |
| Total net realized gain (loss) | | 36,446,522 |
| Change in net unrealized appreciation (depreciation) on: | | |
| Investment securities: | | |
| Unaffiliated issuers | 148,644,067 | |
| Assets and liabilities in foreign currencies | (611) | |
| Total change in net unrealized appreciation (depreciation) | | 148,643,456 |
| Net gain (loss) | | 185,089,978 |
| Net increase (decrease) in net assets resulting from operations | | $184,805,226 |
See accompanying notes which are an integral part of the financial statements.
Statement of Changes in Net Assets
| | Year ended February 28, 2021 | Year ended February 29, 2020 |
| Increase (Decrease) in Net Assets | | |
| Operations | | |
| Net investment income (loss) | $(284,752) | $1,050,157 |
| Net realized gain (loss) | 36,446,522 | 8,088,931 |
| Change in net unrealized appreciation (depreciation) | 148,643,456 | 14,436,079 |
| Net increase (decrease) in net assets resulting from operations | 184,805,226 | 23,575,167 |
| Distributions to shareholders | (6,311,869) | (10,526,325) |
| Share transactions | | |
| Proceeds from sales of shares | 211,985,501 | 141,736,274 |
| Reinvestment of distributions | 5,968,009 | 9,985,146 |
| Cost of shares redeemed | (214,912,312) | (195,554,961) |
| Net increase (decrease) in net assets resulting from share transactions | 3,041,198 | (43,833,541) |
| Total increase (decrease) in net assets | 181,534,555 | (30,784,699) |
| Net Assets | | |
| Beginning of period | 402,403,349 | 433,188,048 |
| End of period | $583,937,904 | $402,403,349 |
| Other Information | | |
| Shares | | |
| Sold | 3,649,920 | 2,990,069 |
| Issued in reinvestment of distributions | 90,837 | 214,717 |
| Redeemed | (3,983,299) | (4,151,320) |
| Net increase (decrease) | (242,542) | (946,534) |
See accompanying notes which are an integral part of the financial statements.
Financial Highlights
Consumer Discretionary Portfolio
| | | | | | |
| Years ended February 28, | 2021 | 2020 A | 2019 | 2018 | 2017 |
| Selected Per–Share Data | | | | | |
| Net asset value, beginning of period | $45.58 | $44.31 | $43.65 | $37.00 | $32.38 |
| Income from Investment Operations | | | | | |
| Net investment income (loss)B | (.03) | .11 | .12 | .16 | .21 |
| Net realized and unrealized gain (loss) | 23.23 | 2.26 | 1.87 | 8.17 | 4.73 |
| Total from investment operations | 23.20 | 2.37 | 1.99 | 8.33 | 4.94 |
| Distributions from net investment income | – | (.11) | (.15) | (.14) | (.32) |
| Distributions from net realized gain | (.77) | (.99) | (1.18) | (1.54) | – |
| Total distributions | (.77) | (1.10) | (1.33) | (1.68) | (.32) |
| Redemption fees added to paid in capitalB | – | – | – | – | –C |
| Net asset value, end of period | $68.01 | $45.58 | $44.31 | $43.65 | $37.00 |
| Total ReturnD | 50.96% | 5.30% | 4.81% | 22.79% | 15.29% |
| Ratios to Average Net AssetsE,F | | | | | |
| Expenses before reductions | .76% | .76% | .78% | .78% | .76% |
| Expenses net of fee waivers, if any | .76% | .76% | .77% | .78% | .76% |
| Expenses net of all reductions | .75% | .76% | .77% | .77% | .76% |
| Net investment income (loss) | (.06)% | .23% | .27% | .40% | .60% |
| Supplemental Data | | | | | |
| Net assets, end of period (000 omitted) | $583,938 | $402,403 | $433,188 | $819,937 | $828,992 |
| Portfolio turnover rateG | 55% | 41%H | 46%H | 74% | 39%H |
A For the year ended February 29.
B Calculated based on average shares outstanding during the period.
C Amount represents less than $.005 per share.
D Total returns would have been lower if certain expenses had not been reduced during the applicable periods shown.
E Fees and expenses of any underlying mutual funds or exchange-traded funds (ETFs) are not included in the Fund's expense ratio. The Fund indirectly bears its proportionate share of these expenses. For additional expense information related to investments in Fidelity Central Funds, please refer to the "Investments in Fidelity Central Funds" note found in the Notes to Financial Statements section of the most recent Annual or Semi-Annual report.
F Expense ratios reflect operating expenses of the class. Expenses before reductions do not reflect amounts reimbursed, waived, or reduced through arrangements with the investment advisor, brokerage services, or other offset arrangements, if applicable, and do not represent the amount paid by the class during periods when reimbursements, waivers or reductions occur.
G Amount does not include the portfolio activity of any underlying mutual funds or exchange-traded funds (ETFs).
H Portfolio turnover rate excludes securities received or delivered in-kind.
See accompanying notes which are an integral part of the financial statements.
Leisure Portfolio
Performance: The Bottom Line
Average annual total return reflects the change in the value of an investment, assuming reinvestment of distributions from dividend income and capital gains (the profits earned upon the sale of securities that have grown in value, if any) and assuming a constant rate of performance each year. The hypothetical investment and the average annual total returns do not reflect the deduction of taxes that a shareholder would pay on fund distributions or the redemption of fund shares. During periods of reimbursement by Fidelity, a fund’s total return will be greater than it would be had the reimbursement not occurred. How a fund did yesterday is no guarantee of how it will do tomorrow.
Average Annual Total Returns
| For the periods ended February 28, 2021 | Past 1 year | Past 5 years | Past 10 years |
| Leisure Portfolio | 41.30% | 15.83% | 14.42% |
$10,000 Over 10 Years
Let's say hypothetically that $10,000 was invested in Leisure Portfolio on February 28, 2011.
The chart shows how the value of your investment would have changed, and also shows how the S&P 500® Index performed over the same period.
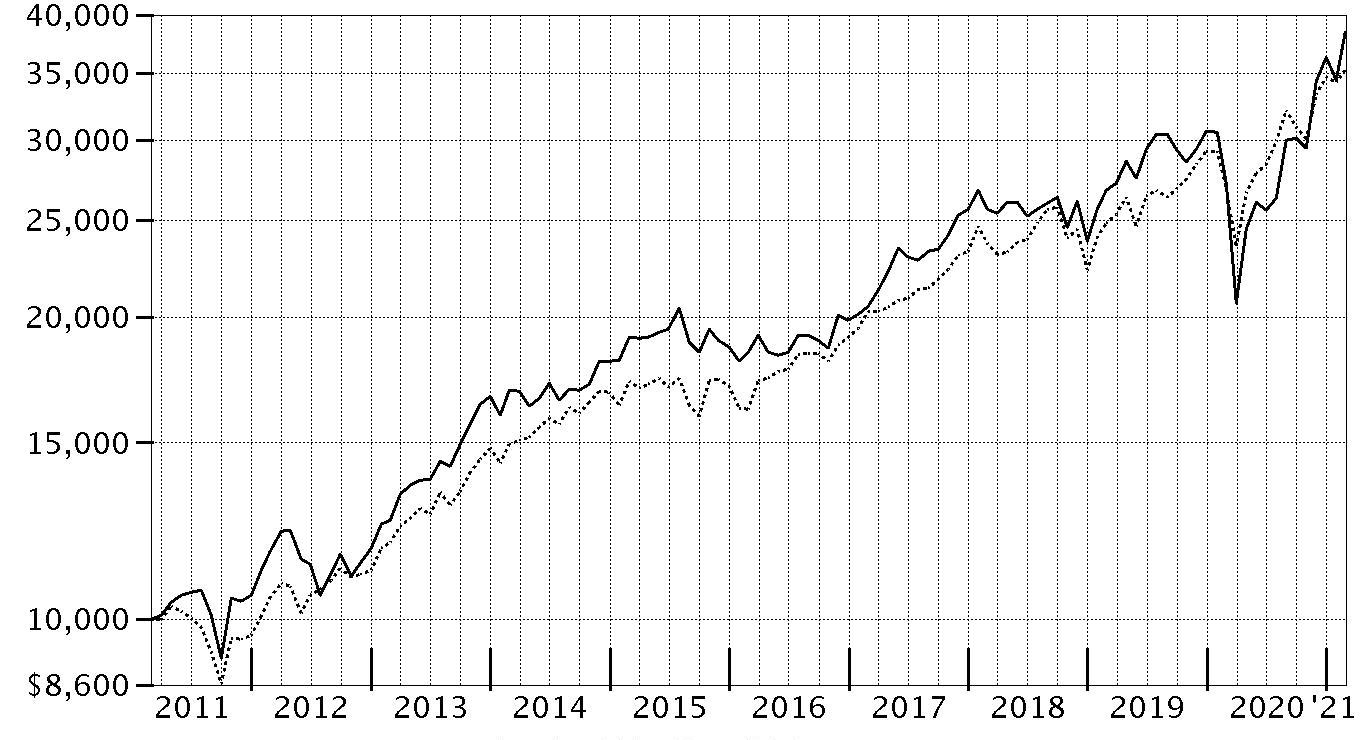
| Period Ending Values |
| $38,463 | Leisure Portfolio |
| $35,259 | S&P 500® Index |
Leisure Portfolio
Management's Discussion of Fund Performance
Market Recap: The S&P 500
® index gained 31.29% for the 12 months ending February 28, 2021, a volatile but productive period for U.S. risk assets. The early-2020 outbreak and spread of COVID-19 resulted in stocks suffering one of the quickest declines on record, through March 23, followed by a historic rebound that included the index closing 2020 at an all-time high and gaining modest ground in the first two months of the new year. The crisis and containment efforts caused broad contraction in economic activity, along with extreme uncertainty and dislocation in financial markets. A rapid and expansive U.S. monetary/fiscal-policy response partially offset the economic disruption and fueled the market surge, as did resilient corporate earnings. The rally slowed in September, when stocks began a two-month retreat amid Congress’s inability to reach a deal on additional fiscal stimulus, as well as concerns about election uncertainty, indications the U.S. economic recovery could be slowing and a new wave of COVID-19 cases. A shift in momentum began in October and accelerated following the U.S. elections, with the approval of three breakthrough COVID-19 vaccines and prospects for additional government stimulus fueling the “reflation trade” through February 28. By sector for the full 12 months, information technology (+50%) and consumer discretionary (+43%) led all gainers. Materials (+42%) and communication services (+37%) also stood out. In contrast, the defensive utilities (-3%) and real estate sectors (+5%) notably lagged.
Comments from Portfolio Manager Will Hilkert: For the fiscal year ending February 28, 2021, the fund gained 41.30%, outperforming the 30.42% gain of the MSCI US IMI Consumer Services 25/50 Index, as well as the broad-based S&P 500
® index. The primary contributor to performance versus the industry index was our stock picks in casinos & gaming. An underweighting and stock selection in hotels, resorts & cruise lines and security selection in restaurants also helped. The biggest individual relative contributor was an underweight position in McDonalds (+9%), which was among our biggest holdings. Also lifting performance was our overweighting in Marriott International, which gained about 19%. We added to our position the past 12 months. Penn National Gaming gained approximately 285% the past year and bolstered relative performance. We reduced our stake in the company. In contrast, the biggest detractor from performance versus the industry index was our stock selection in food distributors. Our lighter-than-index stake in Dominos Pizza (-11%), a position we established this period, was the fund's largest individual relative detractor. Also hurting performance was our lighter-than-index stake in SeaWorld Entertainment, which gained about 83%. SeaWorld was not held at period end. Another notable relative detractor was an out-of-index stake in Performance Food Group (-13%). This was a position that was not held at the end of the period. Notable changes in positioning include increased exposure to the hotels, resorts & cruise lines industry group.
The views expressed above reflect those of the portfolio manager(s) only through the end of the period as stated on the cover of this report and do not necessarily represent the views of Fidelity or any other person in the Fidelity organization. Any such views are subject to change at any time based upon market or other conditions and Fidelity disclaims any responsibility to update such views. These views may not be relied on as investment advice and, because investment decisions for a Fidelity fund are based on numerous factors, may not be relied on as an indication of trading intent on behalf of any Fidelity fund.
Note to shareholders: On March 1, 2021, Will Hilkert became sole manager of the fund after having served as co-manager with Becky Baker since August 2020.
Leisure Portfolio
Investment Summary (Unaudited)
Top Ten Stocks as of February 28, 2021
| | % of fund's net assets |
| Starbucks Corp. | 16.6 |
| McDonald's Corp. | 15.6 |
| Marriott International, Inc. Class A | 8.6 |
| Hilton Worldwide Holdings, Inc. | 5.4 |
| Domino's Pizza, Inc. | 4.5 |
| The Booking Holdings, Inc. | 3.7 |
| Chipotle Mexican Grill, Inc. | 3.6 |
| Caesars Entertainment, Inc. | 3.5 |
| Restaurant Brands International, Inc. | 3.5 |
| MGM Resorts International | 3.3 |
| | 68.3 |
Top Industries (% of fund's net assets)
| As of February 28, 2021 |
| | Hotels, Restaurants & Leisure | 83.0% |
| | Internet & Direct Marketing Retail | 4.4% |
| | Diversified Consumer Services | 3.3% |
| | Entertainment | 1.7% |
| | Food & Staples Retailing | 1.7% |
| | All Others* | 5.9% |

* Includes short-term investments and net other assets (liabilities).
Leisure Portfolio
Schedule of Investments February 28, 2021
Showing Percentage of Net Assets
| Common Stocks - 99.6% | | | |
| | | Shares | Value |
| Beverages - 0.8% | | | |
| Soft Drinks - 0.8% | | | |
| The Coca-Cola Co. | | 107,100 | $5,246,829 |
| Chemicals - 0.9% | | | |
| Specialty Chemicals - 0.9% | | | |
| Ecolab, Inc. | | 27,800 | 5,820,208 |
| Diversified Consumer Services - 3.3% | | | |
| Education Services - 3.3% | | | |
| Bright Horizons Family Solutions, Inc. (a) | | 111,500 | 17,802,090 |
| Graham Holdings Co. | | 6,700 | 4,025,561 |
| | | | 21,827,651 |
| Entertainment - 1.7% | | | |
| Movies & Entertainment - 1.7% | | | |
| Live Nation Entertainment, Inc. (a) | | 124,800 | 11,089,728 |
| Food & Staples Retailing - 1.7% | | | |
| Food Retail - 1.7% | | | |
| Alimentation Couche-Tard, Inc. Class B (sub. vtg.) | | 360,500 | 10,835,396 |
| Health Care Providers & Services - 0.4% | | | |
| Health Care Facilities - 0.4% | | | |
| The Joint Corp. (a) | | 70,900 | 2,822,529 |
| Hotels, Restaurants & Leisure - 83.0% | | | |
| Casinos & Gaming - 13.4% | | | |
| Boyd Gaming Corp. (a) | | 500 | 29,350 |
| Caesars Entertainment, Inc. (a) | | 244,300 | 22,827,392 |
| Churchill Downs, Inc. | | 58,400 | 13,468,792 |
| Evolution Gaming Group AB (b) | | 15,400 | 1,917,728 |
| Galaxy Entertainment Group Ltd. | | 570,000 | 5,210,244 |
| Las Vegas Sands Corp. | | 193,400 | 12,106,840 |
| MGM Resorts International | | 566,400 | 21,404,256 |
| Penn National Gaming, Inc. (a) | | 91,609 | 10,606,490 |
| | | | 87,571,092 |
| Hotels, Resorts & Cruise Lines - 19.2% | | | |
| Airbnb, Inc. Class A (c) | | 24,100 | 4,973,035 |
| Extended Stay America, Inc. unit | | 456,900 | 7,351,521 |
| Hilton Worldwide Holdings, Inc. | | 283,497 | 35,062,909 |
| Lindblad Expeditions Holdings (a) | | 126,600 | 2,637,078 |
| Marriott International, Inc. Class A | | 381,843 | 56,539,493 |
| Marriott Vacations Worldwide Corp. | | 57,300 | 9,724,383 |
| Royal Caribbean Cruises Ltd. | | 101,090 | 9,428,664 |
| | | | 125,717,083 |
| Leisure Facilities - 2.3% | | | |
| Vail Resorts, Inc. | | 48,200 | 14,902,476 |
| Restaurants - 48.1% | | | |
| Chipotle Mexican Grill, Inc. (a) | | 16,250 | 23,432,500 |
| Compass Group PLC | | 336,000 | 6,823,139 |
| Domino's Pizza, Inc. | | 85,500 | 29,626,605 |
| McDonald's Corp. | | 494,608 | 101,958,493 |
| Noodles & Co. (a) | | 204,600 | 1,931,424 |
| Restaurant Brands International, Inc. | | 377,700 | 22,654,283 |
| Ruth's Hospitality Group, Inc. | | 118,200 | 2,695,551 |
| Starbucks Corp. | | 1,006,400 | 108,721,393 |
| Wendy's Co. | | 312,200 | 6,378,246 |
| Wingstop, Inc. | | 60,100 | 8,182,615 |
| Yum! Brands, Inc. | | 21,100 | 2,184,483 |
| | | | 314,588,732 |
|
| TOTAL HOTELS, RESTAURANTS & LEISURE | | | 542,779,383 |
|
| Internet & Direct Marketing Retail - 4.4% | | | |
| Internet & Direct Marketing Retail - 4.4% | | | |
| Expedia, Inc. | | 26,500 | 4,266,500 |
| The Booking Holdings, Inc. (a) | | 10,500 | 24,449,355 |
| | | | 28,715,855 |
| IT Services - 0.9% | | | |
| Data Processing & Outsourced Services - 0.9% | | | |
| Amadeus IT Holding SA Class A (a) | | 78,600 | 5,487,637 |
| Road & Rail - 1.7% | | | |
| Trucking - 1.7% | | | |
| Uber Technologies, Inc. (a) | | 212,300 | 10,986,525 |
| Specialty Retail - 0.2% | | | |
| Automotive Retail - 0.2% | | | |
| Diversified Royalty Corp. | | 762,300 | 1,515,495 |
| Textiles, Apparel & Luxury Goods - 0.6% | | | |
| Apparel, Accessories & Luxury Goods - 0.6% | | | |
| LVMH Moet Hennessy Louis Vuitton SE | | 6,000 | 3,801,714 |
| TOTAL COMMON STOCKS | | | |
| (Cost $389,344,460) | | | 650,928,950 |
|
| Money Market Funds - 2.1% | | | |
| Fidelity Cash Central Fund 0.07% (d) | | 9,738,313 | 9,740,260 |
| Fidelity Securities Lending Cash Central Fund 0.08% (d)(e) | | 4,457,554 | 4,458,000 |
| TOTAL MONEY MARKET FUNDS | | | |
| (Cost $14,198,260) | | | 14,198,260 |
| TOTAL INVESTMENT IN SECURITIES - 101.7% | | | |
| (Cost $403,542,720) | | | 665,127,210 |
| NET OTHER ASSETS (LIABILITIES) - (1.7)% | | | (11,418,440) |
| NET ASSETS - 100% | | | $653,708,770 |
Legend
(a) Non-income producing
(b) Security exempt from registration under Rule 144A of the Securities Act of 1933. These securities may be resold in transactions exempt from registration, normally to qualified institutional buyers. At the end of the period, the value of these securities amounted to $1,917,728 or 0.3% of net assets.
(c) Security or a portion of the security is on loan at period end.
(d) Affiliated fund that is generally available only to investment companies and other accounts managed by Fidelity Investments. The rate quoted is the annualized seven-day yield of the fund at period end. A complete unaudited listing of the fund's holdings as of its most recent quarter end is available upon request. In addition, each Fidelity Central Fund's financial statements, which are not covered by the Fund's Report of Independent Registered Public Accounting Firm, are available on the SEC's website or upon request.
(e) Investment made with cash collateral received from securities on loan.
Affiliated Central Funds
Information regarding fiscal year to date income earned by the Fund from investments in Fidelity Central Funds is as follows:
| Fund | Income earned |
| Fidelity Cash Central Fund | $3,923 |
| Fidelity Securities Lending Cash Central Fund | 33,189 |
| Total | $37,112 |
Amounts in the income column in the above table include any capital gain distributions from underlying funds, which are presented in the corresponding line-item in the Statement of Operations, if applicable. Amount for Fidelity Securities Lending Cash Central Fund represents the income earned on investing cash collateral, less rebates paid to borrowers and any lending agent fees associated with the loan, plus any premium payments received for lending certain types of securities.
Investment Valuation
The following is a summary of the inputs used, as of February 28, 2021, involving the Fund's assets and liabilities carried at fair value. The inputs or methodology used for valuing securities may not be an indication of the risk associated with investing in those securities. For more information on valuation inputs, and their aggregation into the levels used below, please refer to the Investment Valuation section in the accompanying Notes to Financial Statements.
| | Valuation Inputs at Reporting Date: |
| Description | Total | Level 1 | Level 2 | Level 3 |
| Investments in Securities: | | | | |
| Common Stocks | $650,928,950 | $634,816,460 | $16,112,490 | $-- |
| Money Market Funds | 14,198,260 | 14,198,260 | -- | -- |
| Total Investments in Securities: | $665,127,210 | $649,014,720 | $16,112,490 | $-- |
Other Information
Distribution of investments by country or territory of incorporation, as a percentage of Total Net Assets, is as follows (Unaudited):
| United States of America | 89.6% |
| Canada | 5.4% |
| Liberia | 1.4% |
| United Kingdom | 1.0% |
| Others (Individually Less Than 1%) | 2.6% |
| | 100.0% |
See accompanying notes which are an integral part of the financial statements.
Leisure Portfolio
Financial Statements
Statement of Assets and Liabilities
| | | February 28, 2021 |
| Assets | | |
Investment in securities, at value (including securities loaned of $4,952,400) — See accompanying schedule:
Unaffiliated issuers (cost $389,344,460) | $650,928,950 | |
| Fidelity Central Funds (cost $14,198,260) | 14,198,260 | |
| Total Investment in Securities (cost $403,542,720) | | $665,127,210 |
| Cash | | 251,795 |
| Foreign currency held at value (cost $566) | | 574 |
| Receivable for investments sold | | 7,878,159 |
| Receivable for fund shares sold | | 2,410,971 |
| Dividends receivable | | 1,156,006 |
| Distributions receivable from Fidelity Central Funds | | 338 |
| Prepaid expenses | | 3,083 |
| Other receivables | | 135 |
| Total assets | | 676,828,271 |
| Liabilities | | |
| Payable for investments purchased | $18,049,359 | |
| Payable for fund shares redeemed | 212,161 | |
| Accrued management fee | 269,937 | |
| Other affiliated payables | 95,229 | |
| Other payables and accrued expenses | 34,815 | |
| Collateral on securities loaned | 4,458,000 | |
| Total liabilities | | 23,119,501 |
| Net Assets | | $653,708,770 |
| Net Assets consist of: | | |
| Paid in capital | | $360,295,721 |
| Total accumulated earnings (loss) | | 293,413,049 |
| Net Assets | | $653,708,770 |
| Net Asset Value, offering price and redemption price per share ($653,708,770 ÷ 34,507,165 shares) | | $18.94 |
See accompanying notes which are an integral part of the financial statements.
Statement of Operations
| | | Year ended February 28, 2021 |
| Investment Income | | |
| Dividends | | $5,669,371 |
| Income from Fidelity Central Funds (including $33,189 from security lending) | | 37,112 |
| Total income | | 5,706,483 |
| Expenses | | |
| Management fee | $2,445,206 | |
| Transfer agent fees | 794,927 | |
| Accounting fees | 176,968 | |
| Custodian fees and expenses | 11,635 | |
| Independent trustees' fees and expenses | 2,463 | |
| Registration fees | 57,630 | |
| Audit | 38,290 | |
| Legal | 505 | |
| Miscellaneous | 9,845 | |
| Total expenses before reductions | 3,537,469 | |
| Expense reductions | (37,635) | |
| Total expenses after reductions | | 3,499,834 |
| Net investment income (loss) | | 2,206,649 |
| Realized and Unrealized Gain (Loss) | | |
| Net realized gain (loss) on: | | |
| Investment securities: | | |
| Unaffiliated issuers | 35,106,869 | |
| Fidelity Central Funds | (1,537) | |
| Foreign currency transactions | (40,039) | |
| Total net realized gain (loss) | | 35,065,293 |
| Change in net unrealized appreciation (depreciation) on: | | |
| Investment securities: | | |
| Unaffiliated issuers | 136,340,256 | |
| Assets and liabilities in foreign currencies | 10 | |
| Total change in net unrealized appreciation (depreciation) | | 136,340,266 |
| Net gain (loss) | | 171,405,559 |
| Net increase (decrease) in net assets resulting from operations | | $173,612,208 |
See accompanying notes which are an integral part of the financial statements.
Statement of Changes in Net Assets
| | Year ended February 28, 2021 | Year ended February 29, 2020 |
| Increase (Decrease) in Net Assets | | |
| Operations | | |
| Net investment income (loss) | $2,206,649 | $3,993,037 |
| Net realized gain (loss) | 35,065,293 | 44,807,931 |
| Change in net unrealized appreciation (depreciation) | 136,340,266 | (38,596,433) |
| Net increase (decrease) in net assets resulting from operations | 173,612,208 | 10,204,535 |
| Distributions to shareholders | (12,967,558) | (31,042,814) |
| Share transactions | | |
| Proceeds from sales of shares | 240,729,438 | 119,782,717 |
| Reinvestment of distributions | 12,074,974 | 28,804,554 |
| Cost of shares redeemed | (190,886,060) | (169,526,142) |
| Net increase (decrease) in net assets resulting from share transactions | 61,918,352 | (20,938,871) |
| Total increase (decrease) in net assets | 222,563,002 | (41,777,150) |
| Net Assets | | |
| Beginning of period | 431,145,768 | 472,922,918 |
| End of period | $653,708,770 | $431,145,768 |
| Other Information | | |
| Shares | | |
| Sold | 16,202,316 | 7,488,013 |
| Issued in reinvestment of distributions | 1,034,599 | 1,846,047 |
| Redeemed | (13,765,059) | (10,835,961) |
| Net increase (decrease) | 3,471,856 | (1,501,901) |
See accompanying notes which are an integral part of the financial statements.
Financial Highlights
Leisure Portfolio
| | | | | | |
| Years ended February 28, | 2021 | 2020 A | 2019 B | 2018 B | 2017 B |
| Selected Per–Share Data | | | | | |
| Net asset value, beginning of period | $13.89 | $14.53 | $16.58 | $14.14 | $12.83 |
| Income from Investment Operations | | | | | |
| Net investment income (loss)C | .07 | .12 | .16 | .18 | .16 |
| Net realized and unrealized gain (loss) | 5.40 | .25 | .39 | 3.31 | 1.29 |
| Total from investment operations | 5.47 | .37 | .55 | 3.49 | 1.45 |
| Distributions from net investment income | (.08) | (.11) | (.16) | (.14) | (.14) |
| Distributions from net realized gain | (.34) | (.89) | (2.44) | (.91) | – |
| Total distributions | (.42) | (1.01)D | (2.60) | (1.05) | (.14) |
| Redemption fees added to paid in capitalC | – | – | –E | –E | –E |
| Net asset value, end of period | $18.94 | $13.89 | $14.53 | $16.58 | $14.14 |
| Total ReturnF | 41.30% | 1.76% | 4.48% | 24.75% | 11.26% |
| Ratios to Average Net AssetsG,H | | | | | |
| Expenses before reductions | .77% | .76% | .76% | .77% | .80% |
| Expenses net of fee waivers, if any | .77% | .75% | .76% | .77% | .79% |
| Expenses net of all reductions | .76% | .75% | .76% | .77% | .79% |
| Net investment income (loss) | .48% | .79% | 1.05% | 1.09% | 1.17% |
| Supplemental Data | | | | | |
| Net assets, end of period (000 omitted) | $653,709 | $431,146 | $472,923 | $544,540 | $402,941 |
| Portfolio turnover rateI | 72% | 53% | 41% | 56% | 23% |
A For the year ended February 29.
B Per share amounts have been adjusted to reflect the impact of the 10 for 1 share split that occurred on August 10, 2018.
C Calculated based on average shares outstanding during the period.
D Total distributions per share do not sum due to rounding.
E Amount represents less than $.005 per share.
F Total returns would have been lower if certain expenses had not been reduced during the applicable periods shown.
G Fees and expenses of any underlying mutual funds or exchange-traded funds (ETFs) are not included in the Fund's expense ratio. The Fund indirectly bears its proportionate share of these expenses. For additional expense information related to investments in Fidelity Central Funds, please refer to the "Investments in Fidelity Central Funds" note found in the Notes to Financial Statements section of the most recent Annual or Semi-Annual report.
H Expense ratios reflect operating expenses of the class. Expenses before reductions do not reflect amounts reimbursed, waived, or reduced through arrangements with the investment advisor, brokerage services, or other offset arrangements, if applicable, and do not represent the amount paid by the class during periods when reimbursements, waivers or reductions occur.
I Amount does not include the portfolio activity of any underlying mutual funds or exchange-traded funds (ETFs).
See accompanying notes which are an integral part of the financial statements.
Retailing Portfolio
Performance: The Bottom Line
Average annual total return reflects the change in the value of an investment, assuming reinvestment of distributions from dividend income and capital gains (the profits earned upon the sale of securities that have grown in value, if any) and assuming a constant rate of performance each year. The hypothetical investment and the average annual total returns do not reflect the deduction of taxes that a shareholder would pay on fund distributions or the redemption of fund shares. During periods of reimbursement by Fidelity, a fund’s total return will be greater than it would be had the reimbursement not occurred. How a fund did yesterday is no guarantee of how it will do tomorrow.
Average Annual Total Returns
| For the periods ended February 28, 2021 | Past 1 year | Past 5 years | Past 10 years |
| Retailing Portfolio | 59.90% | 22.48% | 20.31% |
$10,000 Over 10 Years
Let's say hypothetically that $10,000 was invested in Retailing Portfolio on February 28, 2011.
The chart shows how the value of your investment would have changed, and also shows how the S&P 500® Index performed over the same period.

| Period Ending Values |
| $63,545 | Retailing Portfolio |
| $35,259 | S&P 500® Index |
Retailing Portfolio
Management's Discussion of Fund Performance
Market Recap: The S&P 500
® index gained 31.29% for the 12 months ending February 28, 2021, a volatile but productive period for U.S. risk assets. The early-2020 outbreak and spread of COVID-19 resulted in stocks suffering one of the quickest declines on record, through March 23, followed by a historic rebound that included the index closing 2020 at an all-time high and gaining modest ground in the first two months of the new year. The crisis and containment efforts caused broad contraction in economic activity, along with extreme uncertainty and dislocation in financial markets. A rapid and expansive U.S. monetary/fiscal-policy response partially offset the economic disruption and fueled the market surge, as did resilient corporate earnings. The rally slowed in September, when stocks began a two-month retreat amid Congress’s inability to reach a deal on additional fiscal stimulus, as well as concerns about election uncertainty, indications the U.S. economic recovery could be slowing and a new wave of COVID-19 cases. A shift in momentum began in October and accelerated following the U.S. elections, with the approval of three breakthrough COVID-19 vaccines and prospects for additional government stimulus fueling the “reflation trade” through February 28. By sector for the full 12 months, information technology (+50%) and consumer discretionary (+43%) led all gainers. Materials (+42%) and communication services (+37%) also stood out. In contrast, the defensive utilities (-3%) and real estate sectors (+5%) notably lagged.
Comments from Portfolio Manager Boris Shepov: For the fiscal year ending February 28, 2021, the fund gained 59.90%, underperforming the 61.55% increase in the MSCI U.S. IMI Retailing 25/50 Index, but notably outperforming the broad-based S&P 500
® index. The primary detractor from performance versus the industry index was security selection and an underweighting in apparel retail. Subpar picks among computer & electronics retail firms, along with a lack of meaningful exposure to home furnishing retail stocks, further hampered the fund's relative result. Not owning Etsy, an index component that gained 281%, was the biggest individual relative detractor. Also weighing on the portfolio’s return versus the index was a lighter-than-index stake – due to internal capacity limits and regulatory considerations – in Wayfair, which gained 357%. This was a holding we established the 12 months. Another notable relative detractor was an overweighting in The Children’s Place (-64%), a position that was sold during the period. In contrast, the leading contributor to performance versus the industry index was an underweighting in department stores. Security selection among internet & direct marketing retail companies, as well as hypermarkets & super centers, also boosted the fund's relative performance. The top individual relative contributor was an out-of-index stake in Farfetch (+463%), a position we established this period. The portfolio’s outsized position in Nordstrom added value too, gaining about 176%. This was a holding we initiated the past 12 months. Amazon.com, one of the fund's largest positions, rose approximately 63% the during the reporting period and further bolstered relative performance. Notable changes in positioning include a lower allocation to the apparel retail and home improvement retail groups.
The views expressed above reflect those of the portfolio manager(s) only through the end of the period as stated on the cover of this report and do not necessarily represent the views of Fidelity or any other person in the Fidelity organization. Any such views are subject to change at any time based upon market or other conditions and Fidelity disclaims any responsibility to update such views. These views may not be relied on as investment advice and, because investment decisions for a Fidelity fund are based on numerous factors, may not be relied on as an indication of trading intent on behalf of any Fidelity fund.
Retailing Portfolio
Investment Summary (Unaudited)
Top Ten Stocks as of February 28, 2021
| | % of fund's net assets |
| Amazon.com, Inc. | 18.8 |
| The Home Depot, Inc. | 10.1 |
| Lowe's Companies, Inc. | 5.4 |
| Target Corp. | 4.7 |
| The Booking Holdings, Inc. | 4.1 |
| MercadoLibre, Inc. | 4.0 |
| Expedia, Inc. | 3.2 |
| Burlington Stores, Inc. | 2.9 |
| Dollar Tree, Inc. | 2.8 |
| Ross Stores, Inc. | 2.5 |
| | 58.5 |
Top Industries (% of fund's net assets)
| As of February 28, 2021 |
| | Internet & Direct Marketing Retail | 34.0% |
| | Specialty Retail | 32.8% |
| | Multiline Retail | 14.3% |
| | Textiles, Apparel & Luxury Goods | 6.0% |
| | Food & Staples Retailing | 3.5% |
| | All Others* | 9.4% |

* Includes short-term investments and net other assets (liabilities).
Retailing Portfolio
Schedule of Investments February 28, 2021
Showing Percentage of Net Assets
| Common Stocks - 99.7% | | | |
| | | Shares | Value |
| Entertainment - 0.9% | | | |
| Movies & Entertainment - 0.9% | | | |
| Cinemark Holdings, Inc. (a) | | 1,612,500 | $36,200,625 |
| Food & Staples Retailing - 3.5% | | | |
| Food Distributors - 2.6% | | | |
| Performance Food Group Co. (b) | | 889,936 | 48,270,129 |
| U.S. Foods Holding Corp. (b) | | 1,600,200 | 58,343,292 |
| | | | 106,613,421 |
| Hypermarkets & Super Centers - 0.9% | | | |
| BJ's Wholesale Club Holdings, Inc. (b) | | 478,640 | 19,231,755 |
| Costco Wholesale Corp. | | 48,600 | 16,086,600 |
| | | | 35,318,355 |
|
| TOTAL FOOD & STAPLES RETAILING | | | 141,931,776 |
|
| Hotels, Restaurants & Leisure - 2.9% | | | |
| Casinos & Gaming - 1.0% | | | |
| Caesars Entertainment, Inc. (b) | | 430,700 | 40,244,608 |
| Hotels, Resorts & Cruise Lines - 1.9% | | | |
| Airbnb, Inc. Class A (a) | | 12,200 | 2,517,470 |
| Marriott International, Inc. Class A | | 495,900 | 73,427,913 |
| | | | 75,945,383 |
|
| TOTAL HOTELS, RESTAURANTS & LEISURE | | | 116,189,991 |
|
| Interactive Media & Services - 1.4% | | | |
| Interactive Media & Services - 1.4% | | | |
| Alphabet, Inc. Class A (b) | | 15,900 | 32,148,369 |
| Facebook, Inc. Class A (b) | | 103,300 | 26,612,146 |
| | | | 58,760,515 |
| Internet & Direct Marketing Retail - 34.0% | | | |
| Internet & Direct Marketing Retail - 34.0% | | | |
| Alibaba Group Holding Ltd. sponsored ADR (b) | | 100,300 | 23,847,328 |
| Amazon.com, Inc. (b) | | 246,730 | 763,118,621 |
| Expedia, Inc. | | 800,900 | 128,944,900 |
| Farfetch Ltd. Class A (b) | | 1,195,700 | 78,772,716 |
| MercadoLibre, Inc. (b) | | 98,400 | 161,190,024 |
| The Booking Holdings, Inc. (b) | | 71,940 | 167,513,009 |
| The RealReal, Inc. (a)(b) | | 1,856,515 | 47,415,393 |
| Wayfair LLC Class A (b) | | 23,100 | 6,675,438 |
| | | | 1,377,477,429 |
| Multiline Retail - 14.3% | | | |
| Department Stores - 3.6% | | | |
| Kohl's Corp. | | 1,619,900 | 89,499,475 |
| Nordstrom, Inc. (a) | | 1,573,900 | 57,368,655 |
| | | | 146,868,130 |
| General Merchandise Stores - 10.7% | | | |
| Dollar General Corp. | | 512,500 | 96,857,375 |
| Dollar Tree, Inc. (b) | | 1,142,700 | 112,213,140 |
| Ollie's Bargain Outlet Holdings, Inc. (b) | | 391,335 | 32,355,578 |
| Target Corp. | | 1,039,800 | 190,740,912 |
| | | | 432,167,005 |
|
| TOTAL MULTILINE RETAIL | | | 579,035,135 |
|
| Oil, Gas & Consumable Fuels - 0.4% | | | |
| Oil & Gas Refining & Marketing - 0.4% | | | |
| Reliance Industries Ltd. sponsored GDR (c) | | 291,395 | 16,726,073 |
| Road & Rail - 1.9% | | | |
| Trucking - 1.9% | | | |
| Lyft, Inc. (b) | | 728,000 | 40,549,600 |
| Uber Technologies, Inc. (b) | | 727,500 | 37,648,125 |
| | | | 78,197,725 |
| Software - 1.6% | | | |
| Application Software - 1.6% | | | |
| HubSpot, Inc. (b) | | 61,700 | 31,775,500 |
| Manhattan Associates, Inc. (b) | | 272,100 | 33,454,695 |
| | | | 65,230,195 |
| Specialty Retail - 32.8% | | | |
| Apparel Retail - 8.5% | | | |
| American Eagle Outfitters, Inc. (a) | | 1,750,900 | 44,998,130 |
| Aritzia LP (b) | | 681,204 | 16,053,204 |
| Burlington Stores, Inc. (b) | | 454,594 | 117,658,019 |
| MYT Netherlands Parent BV ADR (a) | | 17,800 | 514,242 |
| Ross Stores, Inc. | | 856,700 | 99,925,488 |
| TJX Companies, Inc. | | 978,100 | 64,544,819 |
| | | | 343,693,902 |
| Automotive Retail - 1.9% | | | |
| Carvana Co. Class A (a)(b) | | 267,500 | 75,836,250 |
| Computer & Electronics Retail - 1.8% | | | |
| Best Buy Co., Inc. | | 735,800 | 73,837,530 |
| Home Improvement Retail - 17.0% | | | |
| Floor & Decor Holdings, Inc. Class A (b) | | 632,737 | 60,166,961 |
| Lowe's Companies, Inc. | | 1,370,300 | 218,905,425 |
| The Home Depot, Inc. | | 1,590,100 | 410,786,434 |
| | | | 689,858,820 |
| Specialty Stores - 3.6% | | | |
| Five Below, Inc. (b) | | 337,900 | 62,889,948 |
| Ulta Beauty, Inc. (b) | | 265,800 | 85,675,314 |
| | | | 148,565,262 |
|
| TOTAL SPECIALTY RETAIL | | | 1,331,791,764 |
|
| Textiles, Apparel & Luxury Goods - 6.0% | | | |
| Apparel, Accessories & Luxury Goods - 5.2% | | | |
| Canada Goose Holdings, Inc. (a)(b) | | 306,600 | 13,742,310 |
| Capri Holdings Ltd. (b) | | 1,264,800 | 59,028,216 |
| G-III Apparel Group Ltd. (a)(b) | | 966,128 | 27,814,825 |
| lululemon athletica, Inc. (b) | | 82,457 | 25,700,198 |
| LVMH Moet Hennessy Louis Vuitton SE | | 56,500 | 35,799,471 |
| PVH Corp. | | 478,339 | 47,814,766 |
| | | | 209,899,786 |
| Footwear - 0.8% | | | |
| Deckers Outdoor Corp. (b) | | 100,200 | 32,676,222 |
|
| TOTAL TEXTILES, APPAREL & LUXURY GOODS | | | 242,576,008 |
|
| TOTAL COMMON STOCKS | | | |
| (Cost $1,833,332,758) | | | 4,044,117,236 |
|
| Convertible Preferred Stocks - 0.0% | | | |
| Food & Staples Retailing - 0.0% | | | |
| Food Retail - 0.0% | | | |
| Roofoods Ltd. Series H (d)(e) | | | |
| (Cost $877,751) | | 1,000 | 877,751 |
|
| Money Market Funds - 3.9% | | | |
| Fidelity Cash Central Fund 0.07% (f) | | 17,051,077 | 17,054,488 |
| Fidelity Securities Lending Cash Central Fund 0.08% (f)(g) | | 140,864,756 | 140,878,842 |
| TOTAL MONEY MARKET FUNDS | | | |
| (Cost $157,933,330) | | | 157,933,330 |
| TOTAL INVESTMENT IN SECURITIES - 103.6% | | | |
| (Cost $1,992,143,839) | | | 4,202,928,317 |
| NET OTHER ASSETS (LIABILITIES) - (3.6)% | | | (146,989,488) |
| NET ASSETS - 100% | | | $4,055,938,829 |
Legend
(a) Security or a portion of the security is on loan at period end.
(b) Non-income producing
(c) Security exempt from registration under Rule 144A of the Securities Act of 1933. These securities may be resold in transactions exempt from registration, normally to qualified institutional buyers. At the end of the period, the value of these securities amounted to $16,726,073 or 0.4% of net assets.
(d) Level 3 security
(e) Restricted securities (including private placements) - Investment in securities not registered under the Securities Act of 1933 (excluding 144A issues). At the end of the period, the value of restricted securities (excluding 144A issues) amounted to $877,751 or 0.0% of net assets.
(f) Affiliated fund that is generally available only to investment companies and other accounts managed by Fidelity Investments. The rate quoted is the annualized seven-day yield of the fund at period end. A complete unaudited listing of the fund's holdings as of its most recent quarter end is available upon request. In addition, each Fidelity Central Fund's financial statements, which are not covered by the Fund's Report of Independent Registered Public Accounting Firm, are available on the SEC's website or upon request.
(g) Investment made with cash collateral received from securities on loan.
Additional information on each restricted holding is as follows:
| Security | Acquisition Date | Acquisition Cost |
| Roofoods Ltd. Series H | 1/15/21 | $877,751 |
Affiliated Central Funds
Information regarding fiscal year to date income earned by the Fund from investments in Fidelity Central Funds is as follows:
| Fund | Income earned |
| Fidelity Cash Central Fund | $13,896 |
| Fidelity Securities Lending Cash Central Fund | 359,633 |
| Total | $373,529 |
Amounts in the income column in the above table include any capital gain distributions from underlying funds, which are presented in the corresponding line-item in the Statement of Operations, if applicable. Amount for Fidelity Securities Lending Cash Central Fund represents the income earned on investing cash collateral, less rebates paid to borrowers and any lending agent fees associated with the loan, plus any premium payments received for lending certain types of securities.
Other Affiliated Issuers
An affiliated company is a company in which the Fund has ownership of at least 5% of the voting securities. Fiscal year to date transactions with companies which are or were affiliates are as follows:
| Affiliate | Value, beginning of period | Purchases | Sales Proceeds | Dividend Income | Realized Gain (loss) | Change in Unrealized appreciation (depreciation) | Value, end of period |
| Drive Shack, Inc. | $9,998,274 | $-- | $4,390,046 | $-- | $(11,712,122) | $6,103,894 | $-- |
| Total | $9,998,274 | $-- | $4,390,046 | $-- | $(11,712,122) | $6,103,894 | $-- |
Investment Valuation
The following is a summary of the inputs used, as of February 28, 2021, involving the Fund's assets and liabilities carried at fair value. The inputs or methodology used for valuing securities may not be an indication of the risk associated with investing in those securities. For more information on valuation inputs, and their aggregation into the levels used below, please refer to the Investment Valuation section in the accompanying Notes to Financial Statements.
| | Valuation Inputs at Reporting Date: |
| Description | Total | Level 1 | Level 2 | Level 3 |
| Investments in Securities: | | | | |
| Common Stocks | $4,044,117,236 | $4,008,317,765 | $35,799,471 | $-- |
| Convertible Preferred Stocks | 877,751 | -- | -- | 877,751 |
| Money Market Funds | 157,933,330 | 157,933,330 | -- | -- |
| Total Investments in Securities: | $4,202,928,317 | $4,166,251,095 | $35,799,471 | $877,751 |
See accompanying notes which are an integral part of the financial statements.
Retailing Portfolio
Financial Statements
Statement of Assets and Liabilities
| | | February 28, 2021 |
| Assets | | |
Investment in securities, at value (including securities loaned of $142,552,494) — See accompanying schedule:
Unaffiliated issuers (cost $1,834,210,509) | $4,044,994,987 | |
| Fidelity Central Funds (cost $157,933,330) | 157,933,330 | |
| Total Investment in Securities (cost $1,992,143,839) | | $4,202,928,317 |
| Receivable for investments sold | | 6,116,821 |
| Receivable for fund shares sold | | 3,854,350 |
| Dividends receivable | | 990,336 |
| Distributions receivable from Fidelity Central Funds | | 18,446 |
| Prepaid expenses | | 14,164 |
| Total assets | | 4,213,922,434 |
| Liabilities | | |
| Payable for investments purchased | $11,038,807 | |
| Payable for fund shares redeemed | 3,609,374 | |
| Accrued management fee | 1,825,425 | |
| Other affiliated payables | 587,460 | |
| Other payables and accrued expenses | 48,031 | |
| Collateral on securities loaned | 140,874,508 | |
| Total liabilities | | 157,983,605 |
| Net Assets | | $4,055,938,829 |
| Net Assets consist of: | | |
| Paid in capital | | $1,617,060,408 |
| Total accumulated earnings (loss) | | 2,438,878,421 |
| Net Assets | | $4,055,938,829 |
| Net Asset Value, offering price and redemption price per share ($4,055,938,829 ÷ 172,620,042 shares) | | $23.50 |
See accompanying notes which are an integral part of the financial statements.
Statement of Operations
| | | Year ended February 28, 2021 |
| Investment Income | | |
| Dividends | | $20,944,943 |
| Income from Fidelity Central Funds (including $359,633 from security lending) | | 373,529 |
| Total income | | 21,318,472 |
| Expenses | | |
| Management fee | $17,365,207 | |
| Transfer agent fees | 5,314,962 | |
| Accounting fees | 926,532 | |
| Custodian fees and expenses | 22,570 | |
| Independent trustees' fees and expenses | 17,216 | |
| Registration fees | 115,625 | |
| Audit | 40,663 | |
| Legal | 4,994 | |
| Interest | 13,802 | |
| Miscellaneous | 61,019 | |
| Total expenses before reductions | 23,882,590 | |
| Expense reductions | (159,204) | |
| Total expenses after reductions | | 23,723,386 |
| Net investment income (loss) | | (2,404,914) |
| Realized and Unrealized Gain (Loss) | | |
| Net realized gain (loss) on: | | |
| Investment securities: | | |
| Unaffiliated issuers | 541,436,181 | |
| Fidelity Central Funds | 8,153 | |
| Other affiliated issuers | (11,712,122) | |
| Foreign currency transactions | 5,377 | |
| Total net realized gain (loss) | | 529,737,589 |
| Change in net unrealized appreciation (depreciation) on: | | |
| Investment securities: | | |
| Unaffiliated issuers | 933,557,098 | |
| Affiliated issuers | 6,103,894 | |
| Assets and liabilities in foreign currencies | (2,390) | |
| Total change in net unrealized appreciation (depreciation) | | 939,658,602 |
| Net gain (loss) | | 1,469,396,191 |
| Net increase (decrease) in net assets resulting from operations | | $1,466,991,277 |
See accompanying notes which are an integral part of the financial statements.
Statement of Changes in Net Assets
| | Year ended February 28, 2021 | Year ended February 29, 2020 |
| Increase (Decrease) in Net Assets | | |
| Operations | | |
| Net investment income (loss) | $(2,404,914) | $8,073,263 |
| Net realized gain (loss) | 529,737,589 | 34,252,880 |
| Change in net unrealized appreciation (depreciation) | 939,658,602 | 180,411,347 |
| Net increase (decrease) in net assets resulting from operations | 1,466,991,277 | 222,737,490 |
| Distributions to shareholders | (251,762,516) | (70,573,195) |
| Share transactions | | |
| Proceeds from sales of shares | 893,605,318 | 537,224,260 |
| Reinvestment of distributions | 238,817,402 | 67,160,431 |
| Cost of shares redeemed | (990,710,293) | (1,093,141,870) |
| Net increase (decrease) in net assets resulting from share transactions | 141,712,427 | (488,757,179) |
| Total increase (decrease) in net assets | 1,356,941,188 | (336,592,884) |
| Net Assets | | |
| Beginning of period | 2,698,997,641 | 3,035,590,525 |
| End of period | $4,055,938,829 | $2,698,997,641 |
| Other Information | | |
| Shares | | |
| Sold | 43,628,691 | 33,219,799 |
| Issued in reinvestment of distributions | 10,603,061 | 4,207,150 |
| Redeemed | (53,402,342) | (67,831,907) |
| Net increase (decrease) | 829,410 | (30,404,958) |
See accompanying notes which are an integral part of the financial statements.
Financial Highlights
Retailing Portfolio
| | | | | | |
| Years ended February 28, | 2021 | 2020 A | 2019 B | 2018 B | 2017 B |
| Selected Per–Share Data | | | | | |
| Net asset value, beginning of period | $15.71 | $15.01 | $14.35 | $11.56 | $9.88 |
| Income from Investment Operations | | | | | |
| Net investment income (loss)C | (.01) | .04 | .03 | .04 | .01 |
| Net realized and unrealized gain (loss) | 9.35 | 1.02 | .93 | 3.23 | 1.69 |
| Total from investment operations | 9.34 | 1.06 | .96 | 3.27 | 1.70 |
| Distributions from net investment income | – | (.05) | (.02) | (.03) | (.02) |
| Distributions from net realized gain | (1.55) | (.31) | (.27) | (.45) | – |
| Total distributions | (1.55) | (.36) | (.30)D | (.48) | (.02) |
| Redemption fees added to paid in capitalC | – | – | – | – | –E |
| Net asset value, end of period | $23.50 | $15.71 | $15.01 | $14.35 | $11.56 |
| Total ReturnF | 59.90% | 7.02% | 6.83% | 28.66% | 17.20% |
| Ratios to Average Net AssetsG,H | | | | | |
| Expenses before reductions | .73% | .74% | .76% | .78% | .78% |
| Expenses net of fee waivers, if any | .73% | .74% | .75% | .77% | .78% |
| Expenses net of all reductions | .73% | .74% | .75% | .77% | .78% |
| Net investment income (loss) | (.07)% | .26% | .20% | .29% | .07% |
| Supplemental Data | | | | | |
| Net assets, end of period (000 omitted) | $4,055,939 | $2,698,998 | $3,035,591 | $2,329,366 | $1,924,403 |
| Portfolio turnover rateI | 46% | 17% | 34% | 24% | 17% |
A For the year ended February 29.
B Per share amounts have been adjusted to reflect the impact of the 10 for 1 share split that occurred on May 11, 2018.
C Calculated based on average shares outstanding during the period.
D Total distributions per share do not sum due to rounding.
E Amount represents less than $.005 per share.
F Total returns would have been lower if certain expenses had not been reduced during the applicable periods shown.
G Fees and expenses of any underlying mutual funds or exchange-traded funds (ETFs) are not included in the Fund's expense ratio. The Fund indirectly bears its proportionate share of these expenses. For additional expense information related to investments in Fidelity Central Funds, please refer to the "Investments in Fidelity Central Funds" note found in the Notes to Financial Statements section of the most recent Annual or Semi-Annual report.
H Expense ratios reflect operating expenses of the class. Expenses before reductions do not reflect amounts reimbursed, waived, or reduced through arrangements with the investment advisor, brokerage services, or other offset arrangements, if applicable, and do not represent the amount paid by the class during periods when reimbursements, waivers or reductions occur.
I Amount does not include the portfolio activity of any underlying mutual funds or exchange-traded funds (ETFs).
See accompanying notes which are an integral part of the financial statements.
Notes to Financial Statements
For the period ended February 28, 2021
1. Organization.
Automotive Portfolio, Communication Services Portfolio, Construction and Housing Portfolio, Consumer Discretionary Portfolio, Leisure Portfolio, and Retailing Portfolio (the Funds) are non-diversified funds of Fidelity Select Portfolios (the Trust). The Trust is registered under the Investment Company Act of 1940, as amended (the 1940 Act), as an open-end management investment company organized as a Massachusetts business trust. Each Fund is authorized to issue an unlimited number of shares. Each Fund offers a single class of shares, with the exception of Communication Services Portfolio. Communication Services Portfolio offers Class A, Class M, Class C, Communication Services, Class I and Class Z shares. Communication Services Portfolio commenced sale of Class A, Class M, Class C, Class I and Class Z on November 30, 2018. Each class of Communication Services Portfolio has equal rights as to assets and voting privileges, and each class has exclusive voting rights with respect to matters that affect that class. Class C shares will automatically convert to Class A shares after a holding period of ten years from the initial date of purchase, with certain exceptions. The Funds invest primarily in securities of companies whose principal business activities fall within specific industries. Share transactions on the Statement of Changes in Net Assets and Share Transactions note may contain exchanges between affiliated funds.
2. Investments in Fidelity Central Funds.
The Funds invest in Fidelity Central Funds, which are open-end investment companies generally available only to other investment companies and accounts managed by the investment adviser and its affiliates. The Funds' Schedules of Investments list each of the Fidelity Central Funds held as of period end, if any, as an investment of each Fund, but do not include the underlying holdings of each Fidelity Central Fund. As an Investing Fund, each Fund indirectly bears its proportionate share of the expenses of the underlying Fidelity Central Funds.
The Money Market Central Funds seek preservation of capital and current income and are managed by the investment adviser. Annualized expenses of the Money Market Central Funds as of their most recent shareholder report date ranged from less than .005% to .01%.
A complete unaudited list of holdings for each Fidelity Central Fund is available upon request or at the Securities and Exchange Commission (the SEC) website at www.sec.gov. In addition, the financial statements of the Fidelity Central Funds, which are not covered by the Funds' Report of Independent Registered Public Accounting Firm, are available on the SEC website or upon request.
3. Significant Accounting Policies.
Each Fund is an investment company and applies the accounting and reporting guidance of the Financial Accounting Standards Board (FASB) Accounting Standards Codification Topic 946 Financial Services - Investment Companies. The financial statements have been prepared in conformity with accounting principles generally accepted in the United States of America (GAAP), which require management to make certain estimates and assumptions at the date of the financial statements. Actual results could differ from those estimates. Subsequent events, if any, through the date that the financial statements were issued have been evaluated in the preparation of the financial statements. The following summarizes the significant accounting policies of the Funds:
Investment Valuation. Investments are valued as of 4:00 p.m. Eastern time on the last calendar day of the period. The Board of Trustees (the Board) has delegated the day to day responsibility for the valuation of each Fund's investments to the Fair Value Committee (the Committee) established by each Fund's investment adviser. In accordance with valuation policies and procedures approved by the Board, each Fund attempts to obtain prices from one or more third party pricing vendors or brokers to value its investments. When current market prices, quotations or currency exchange rates are not readily available or reliable, investments will be fair valued in good faith by the Committee, in accordance with procedures adopted by the Board. Factors used in determining fair value vary by investment type and may include market or investment specific events. The frequency with which these procedures are used cannot be predicted and they may be utilized to a significant extent. The Committee oversees each Fund's valuation policies and procedures and reports to the Board on the Committee's activities and fair value determinations. The Board monitors the appropriateness of the procedures used in valuing each Fund's investments and ratifies the fair value determinations of the Committee.
Each Fund categorizes the inputs to valuation techniques used to value its investments into a disclosure hierarchy consisting of three levels as shown below:
- Level 1 – quoted prices in active markets for identical investments
- Level 2 – other significant observable inputs (including quoted prices for similar investments, interest rates, prepayment speeds, etc.)
- Level 3 – unobservable inputs (including the Fund's own assumptions based on the best information available)
Valuation techniques used to value each Fund's investments by major category are as follows:
Equity securities, including restricted securities, for which market quotations are readily available, are valued at the last reported sale price or official closing price as reported by a third party pricing vendor on the primary market or exchange on which they are traded and are categorized as Level 1 in the hierarchy. In the event there were no sales during the day or closing prices are not available, securities are valued at the last quoted bid price or may be valued using the last available price and are generally categorized as Level 2 in the hierarchy. For foreign equity securities, when market or security specific events arise, comparisons to the valuation of American Depositary Receipts (ADRs), futures contracts, Exchange-Traded Funds (ETFs) and certain indexes as well as quoted prices for similar securities may be used and would be categorized as Level 2 in the hierarchy. For equity securities, including restricted securities, where observable inputs are limited, assumptions about market activity and risk are used and these securities may be categorized as Level 3 in the hierarchy.
Investments in open-end mutual funds, including the Fidelity Central Funds, are valued at their closing net asset value (NAV) each business day and are categorized as Level 1 in the hierarchy.
Changes in valuation techniques may result in transfers in or out of an assigned level within the disclosure hierarchy. The aggregate value of investments by input level as of February 28, 2021 is included at the end of each Fund's Schedule of Investments.
Foreign Currency. Certain Funds may use foreign currency contracts to facilitate transactions in foreign-denominated securities. Gains and losses from these transactions may arise from changes in the value of the foreign currency or if the counterparties do not perform under the contracts' terms.
Foreign-denominated assets, including investment securities, and liabilities are translated into U.S. dollars at the exchange rates at period end. Purchases and sales of investment securities, income and dividends received, and expenses denominated in foreign currencies are translated into U.S. dollars at the exchange rate in effect on the transaction date.
The effects of exchange rate fluctuations on investments are included with the net realized and unrealized gain (loss) on investment securities. Other foreign currency transactions resulting in realized and unrealized gain (loss) are disclosed separately.
Investment Transactions and Income. For financial reporting purposes, the Funds' investment holdings and NAV include trades executed through the end of the last business day of the period. The NAV per share for processing shareholder transactions is calculated as of the close of business of the New York Stock Exchange (NYSE), normally 4:00 p.m. Eastern time and includes trades executed through the end of the prior business day. Gains and losses on securities sold are determined on the basis of identified cost and for certain Funds include proceeds received from litigation. Dividend income is recorded on the ex-dividend date, except for certain dividends from foreign securities where the ex-dividend date may have passed, which are recorded as soon as the Funds are informed of the ex-dividend date. Non-cash dividends included in dividend income, if any, are recorded at the fair market value of the securities received. Income and capital gain distributions from Fidelity Central Funds, if any, are recorded on the ex-dividend date. Certain distributions received by the Funds represent a return of capital or capital gain. The Funds determine the components of these distributions subsequent to the ex-dividend date, based upon receipt of tax filings or other correspondence relating to the underlying investment. These distributions are recorded as a reduction of cost of investments and/or as a realized gain. Large, non-recurring dividends recognized by the Funds are presented separately on the Statement of Operations as "Special Dividends" and the impact of these dividends is presented in the Financial Highlights. Investment income is recorded net of foreign taxes withheld where recovery of such taxes is uncertain.
Class Allocations and Expenses. Expenses directly attributable to a fund are charged to that fund. Expenses attributable to more than one fund are allocated among the respective funds on the basis of relative net assets or other appropriate methods. Expense estimates are accrued in the period to which they relate and adjustments are made when actual amounts are known.
For Communication Services Portfolio, investment income, realized and unrealized capital gains and losses, common expenses of the Fund, and certain fund-level expense reductions, if any, are allocated daily on a pro-rata basis to each class based on the relative net assets of each class to the total net assets of the Fund. Each class differs with respect to transfer agent and distribution and service plan fees incurred. Certain expense reductions may also differ by class. For the reporting period, the allocated portion of income and expenses to each class as a percent of its average net assets may vary due to the timing of recording these transactions in relation to fluctuating net assets of the classes.
Income Tax Information and Distributions to Shareholders. Each year, each Fund intends to qualify as a regulated investment company under Subchapter M of the Internal Revenue Code, including distributing substantially all of its taxable income and realized gains. As a result, no provision for U.S. Federal income taxes is required. As of February 28, 2021, each Fund did not have any unrecognized tax benefits in the financial statements; nor is each Fund aware of any tax positions for which it is reasonably possible that the total amounts of unrecognized tax benefits will significantly change in the next twelve months. Each Fund files a U.S. federal tax return, in addition to state and local tax returns as required. Each Fund's federal income tax returns are subject to examination by the Internal Revenue Service (IRS) for a period of three fiscal years after they are filed. State and local tax returns may be subject to examination for an additional fiscal year depending on the jurisdiction. Foreign taxes are provided for based on each Fund's understanding of the tax rules and rates that exist in the foreign markets in which it invests.
Distributions are declared and recorded on the ex-dividend date. Income and capital gain distributions are declared separately for each class. Income and capital gain distributions are determined in accordance with income tax regulations, which may differ from GAAP. In addition, certain Funds claimed a portion of the payment made to redeeming shareholders as a distribution for income tax purposes.
Capital accounts within the financial statements are adjusted for permanent book-tax differences. These adjustments have no impact on net assets or the results of operations. Capital accounts are not adjusted for temporary book-tax differences which will reverse in a subsequent period.
Book-tax differences are primarily due to foreign currency transactions, passive foreign investment companies (PFIC), partnerships, net operating losses, capital loss carryforwards and losses deferred due to wash sales and excise tax regulations.
As of period end, the cost and unrealized appreciation (depreciation) in securities, and derivatives if applicable, for federal income tax purposes were as follows for each Fund:
| | Tax cost | Gross unrealized appreciation | Gross unrealized depreciation | Net unrealized appreciation (depreciation) |
| Automotive Portfolio | $175,855,799 | $45,813,383 | $(2,905,929) | $42,907,454 |
| Communication Services Portfolio | 582,764,548 | 352,501,296 | (8,221,287) | 344,280,009 |
| Construction and Housing Portfolio | 193,191,854 | 153,542,248 | (2,505,139) | 151,037,109 |
| Consumer Discretionary Portfolio | 328,843,908 | 261,497,034 | (2,885,714) | 258,611,320 |
| Leisure Portfolio | 406,772,632 | 264,039,529 | (5,684,951) | 258,354,578 |
| Retailing Portfolio | 1,994,118,718 | 2,216,624,164 | (7,814,565) | 2,208,809,599 |
The tax-based components of distributable earnings as of period end were as follows for each Fund:
| | Undistributed ordinary income | Undistributed long-term capital gain | Net unrealized appreciation (depreciation) on securities and other investments |
| Automotive Portfolio | $25,267 | $406,659 | $42,906,771 |
| Communication Services Portfolio | 29,774,831 | 11,219,703 | 344,280,009 |
| Construction and Housing Portfolio | – | 10,182,029 | 151,037,109 |
| Consumer Discretionary Portfolio | – | 25,842,601 | 258,609,285 |
| Leisure Portfolio | 4,293,777 | 30,764,685 | 258,354,586 |
| Retailing Portfolio | 47,179,574 | 182,887,190 | 2,208,811,658 |
Certain of the Funds intend to elect to defer to the next fiscal year ordinary losses recognized during the period January 1, 2021 to February 28, 2021. Loss deferrals were as follows:
| | Ordinary losses |
| Construction and Housing Portfolio | $406,589 |
| Consumer Discretionary Portfolio | 195,112 |
The tax character of distributions paid was as follows:
| February 28, 2021 | | | |
| | Ordinary Income | Long-term Capital Gains | Total |
| Automotive Portfolio | $33,769 | $6,782,711 | $6,816,480 |
| Communication Services Portfolio | – | 30,372,833 | 30,372,833 |
| Construction and Housing Portfolio | 8,353,411 | 7,498,578 | 15,851,989 |
| Consumer Discretionary Portfolio | – | 6,311,869 | 6,311,869 |
| Leisure Portfolio | 2,584,978 | 10,382,580 | 12,967,558 |
| Retailing Portfolio | – | 251,762,516 | 251,762,516 |
| February 29, 2020 | | | |
| | Ordinary Income | Long-term Capital Gains | Total |
| Automotive Portfolio | $546,146 | $1,109,808 | $1,655,954 |
| Communication Services Portfolio | 10,346,104 | 169,782,738 | 180,128,842 |
| Construction and Housing Portfolio | 8,920,109 | 15,570,107 | 24,490,216 |
| Consumer Discretionary Portfolio | 995,530 | 9,530,795 | 10,526,325 |
| Leisure Portfolio | 3,429,665 | 27,613,149 | 31,042,814 |
| Retailing Portfolio | 8,725,812 | 61,847,383 | 70,573,195 |
Restricted Securities (including Private Placements). The Funds may invest in securities that are subject to legal or contractual restrictions on resale. These securities generally may be resold in transactions exempt from registration or to the public if the securities are registered. Disposal of these securities may involve time-consuming negotiations and expense, and prompt sale at an acceptable price may be difficult. Information regarding restricted securities is included at the end of each applicable Fund's Schedule of Investments.
Special Purpose Acquisition Companies. Funds may invest in stock, warrants, and other securities of special purpose acquisition companies (SPACs) or similar special purpose entities. A SPAC is a publicly traded company that raises investment capital via an initial public offering (IPO) for the purpose of acquiring the equity securities of one or more existing companies via merger, business combination, acquisition or other similar transactions within a designated time frame.
Private Investment in Public Equity. Funds may acquire equity securities of an issuer through a private investment in a public equity (PIPE) transaction, including through commitments to purchase securities on a when-issued basis. A PIPE typically involves the purchase of securities directly from a publicly traded company in a private placement transaction. Securities purchased through PIPE transactions will be restricted from trading and considered illiquid until a resale registration statement for the shares is filed and declared effective.
At period end, Automotive Portfolio and Construction and Housing Portfolio had commitments to purchase when-issued securities through PIPE transactions with SPACs. The commitments are contingent upon the SPACs acquiring the securities of target companies. Unrealized appreciation (depreciation) on these commitments is separately presented in the Statements of Assets and Liabilities as Unrealized appreciation (depreciation) on unfunded commitments, and in the Statement of Operations as Change in unrealized appreciation (depreciation) on unfunded commitments.
4. Purchases and Sales of Investments.
Purchases and sales of securities, other than short-term securities, are noted in the table below.
| | Purchases ($) | Sales ($) |
| Automotive Portfolio | 161,272,595 | 43,677,717 |
| Communication Services Portfolio | 458,409,327 | 447,341,535 |
| Construction and Housing Portfolio | 274,445,488 | 341,730,129 |
| Consumer Discretionary Portfolio | 252,841,166 | 264,303,306 |
| Leisure Portfolio | 379,736,209 | 332,094,930 |
| Retailing Portfolio | 1,490,656,493 | 1,642,515,300 |
5. Fees and Other Transactions with Affiliates.
Management Fee. Fidelity Management & Research Company LLC (the investment adviser) and its affiliates provide the Funds with investment management related services for which the Funds pay a monthly management fee. The management fee is the sum of an individual fund fee rate and an annualized group fee rate. The individual fund fee rate is applied to each Fund's average net assets. The group fee rate is based upon the monthly average net assets of a group of registered investment companies with which the investment adviser has management contracts. The group fee rate decreases as assets under management increase and increases as assets under management decrease. For the reporting period, each Fund's annual management fee rate expressed as a percentage of each Fund's average net assets was as follows:
| | Individual Rate | Group Rate | Total |
| Automotive Portfolio | .30% | .23% | .54% |
| Communication Services Portfolio | .30% | .23% | .53% |
| Construction and Housing Portfolio | .30% | .23% | .53% |
| Consumer Discretionary Portfolio | .30% | .23% | .53% |
| Leisure Portfolio | .30% | .23% | .53% |
| Retailing Portfolio | .30% | .23% | .53% |
Distribution and Service Plan Fees. In accordance with Rule 12b-1 of the 1940 Act, Communication Services Portfolio has adopted separate Distribution and Service Plans for each class of shares. Certain classes pay Fidelity Distributors Company LLC (FDC), an affiliate of the investment adviser, separate Distribution and Service Fees, each of which is based on an annual percentage of each class' average net assets. In addition, FDC may pay financial intermediaries for selling shares of each Fund and providing shareholder support services. For the period, the Distribution and Service Fee rates, total fees and amounts retained by FDC were as follows:
| | Distribution Fee | Service Fee | Total Fees | Retained by FDC |
| Communication Services Portfolio | | | | |
| Class A | -% | .25% | $43,261 | $3,041 |
| Class M | .25% | .25% | 19,638 | 310 |
| Class C | .75% | .25% | 39,876 | 20,750 |
| | | | $102,775 | $24,101 |
Sales Load. For Communication Services Portfolio, FDC may receive a front-end sales charge of up to 5.75% for selling Class A shares and 3.50% for selling Class M shares, some of which is paid to financial intermediaries for selling shares of the Fund. Depending on the holding period, FDC may receive contingent deferred sales charges levied on Class A, Class M and Class C redemptions. The deferred sales charges are 1.00% for Class C shares, 1.00% for certain purchases of Class A shares and .25% for certain purchases of Class M shares.
For the period, sales charge amounts retained by FDC were as follows:
| | Retained by FDC |
| Communication Services Portfolio | |
| Class A | $34,234 |
| Class M | 2,026 |
| Class C(a) | 909 |
| | $37,169 |
(a) When Class C shares are initially sold, FDC pays commissions from its own resources to financial intermediaries through which the sales are made.
Transfer Agent Fees. Fidelity Investments Institutional Operations Company LLC (FIIOC), an affiliate of the investment adviser, is the transfer, dividend disbursing and shareholder servicing agent for each class (Communication Services Portfolio) or Fund (all other Funds). FIIOC receives account fees and asset-based fees that vary according to the account size and type of account of the shareholders of the respective class or Fund, except for Class Z. FIIOC receives an asset-based fee of Class Z's average net assets. FIIOC pays for typesetting, printing and mailing of shareholder reports, except proxy statements. For the period, transfer agent fees were as follows:
| | Amount | % of Average Net Assets |
| Automotive Portfolio | $151,623 | .19 |
| Communication Services Portfolio | | |
| Class A | 39,459 | .23 |
| Class M | 8,753 | .22 |
| Class C | 7,526 | .19 |
| Communication Services | 1,153,471 | .17 |
| Class I | 26,108 | .18 |
| Class Z | 2,848 | .04 |
| | 1,238,165 | |
| Construction and Housing Portfolio | 532,078 | .18 |
| Consumer Discretionary Portfolio | 737,153 | .16 |
| Leisure Portfolio | 794,927 | .17 |
| Retailing Portfolio | 5,314,962 | .16 |
Accounting Fees. Fidelity Service Company, Inc. (FSC), an affiliate of the investment adviser, maintains each Fund's accounting records. The accounting fee is based on the level of average net assets for each month. For the period, the fees were equivalent to the following annual rates:
| | % of Average Net Assets |
| Automotive Portfolio | .04 |
| Communication Services Portfolio | .04 |
| Construction and Housing Portfolio | .04 |
| Consumer Discretionary Portfolio | .04 |
| Leisure Portfolio | .04 |
| Retailing Portfolio | .03 |
Brokerage Commissions. A portion of portfolio transactions were placed with brokerage firms which are affiliates of the investment adviser. Brokerage commissions are included in net realized gain (loss) and change in net unrealized appreciation (depreciation) in the Statement of Operations. The commissions paid to these affiliated firms were as follows:
| | Amount |
| Automotive Portfolio | $1,422 |
| Communication Services Portfolio | 11,601 |
| Construction and Housing Portfolio | 4,925 |
| Consumer Discretionary Portfolio | 2,007 |
| Leisure Portfolio | 4,898 |
| Retailing Portfolio | 18,158 |
Interfund Lending Program. Pursuant to an Exemptive Order issued by the SEC, each Fund, along with other registered investment companies having management contracts with Fidelity Management & Research Company LLC (FMR), or other affiliated entities of FMR, may participate in an interfund lending program. This program provides an alternative credit facility allowing each Fund to borrow from, or lend money to, other participating affiliated funds. At period end, there were no interfund loans outstanding. Activity in this program during the period for which loans were outstanding was as follows:
| | Borrower or Lender | Average Loan Balance | Weighted Average Interest Rate | Interest Expense |
| Automotive Portfolio | Borrower | $4,559,000 | .34% | $86 |
| Communication Services Portfolio | Borrower | $3,623,500 | .34% | $69 |
| Construction and Housing Portfolio | Borrower | $5,209,875 | 1.34% | $1,551 |
| Consumer Discretionary Portfolio | Borrower | $3,660,160 | .67% | $1,693 |
| Retailing Portfolio | Borrower | $13,996,000 | .76% | $13,802 |
Interfund Trades. Funds may purchase from or sell securities to other Fidelity Funds under procedures adopted by the Board. The procedures have been designed to ensure these interfund trades are executed in accordance with Rule 17a-7 of the 1940 Act. Any interfund trades are included within the respective purchases and sales amounts shown in the Purchases and Sales of Investments note and are noted in the table below.
| | Purchases ($) | Sales ($) |
| Automotive Portfolio | 3,749,668 | 329,200 |
| Communication Services Portfolio | 38,838,807 | 31,990,705 |
| Construction and Housing Portfolio | 21,390,223 | 27,710,700 |
| Consumer Discretionary Portfolio | 27,060,315 | 17,402,321 |
| Leisure Portfolio | 22,853,217 | 35,969,228 |
| Retailing Portfolio | 99,953,761 | 93,192,467 |
Prior Fiscal Year Affiliated Redemptions In-Kind. During the prior period, 233,442 shares of the Consumer Discretionary Portfolio were redeemed in-kind for investments and cash with a value of $10,509,560. The Fund had a net realized gain of $4,367,344 on investments delivered through in-kind redemptions. The amount of the in-kind redemptions is included in share transactions in the accompanying Statement of Changes in Net Assets. Consumer Discretionary Portfolio recognized no gain or loss for federal income tax purposes.
6. Committed Line of Credit.
Certain Funds participate with other funds managed by the investment adviser or an affiliate in a $4.25 billion credit facility (the "line of credit") to be utilized for temporary or emergency purposes to fund shareholder redemptions or for other short-term liquidity purposes. The participating funds have agreed to pay commitment fees on their pro-rata portion of the line of credit, which are reflected in Miscellaneous expenses on the Statement of Operations, and are listed below.
| | Amount |
| Automotive Portfolio | $117 |
| Communication Services Portfolio | 1,517 |
| Construction and Housing Portfolio | 684 |
| Consumer Discretionary Portfolio | 995 |
| Leisure Portfolio | 1,011 |
| Retailing Portfolio | 6,983 |
During the period, there were no borrowings on this line of credit.
7. Security Lending.
Funds lend portfolio securities from time to time in order to earn additional income. Lending agents are used, including National Financial Services (NFS), an affiliate of the investment adviser. Pursuant to a securities lending agreement, NFS will receive a fee, which is capped at 9.9% of a fund's daily lending revenue, for its services as lending agent. A fund may lend securities to certain qualified borrowers, including NFS. On the settlement date of the loan, a fund receives collateral (in the form of U.S. Treasury obligations, letters of credit and/or cash) against the loaned securities and maintains collateral in an amount not less than 100% of the market value of the loaned securities during the period of the loan. The market value of the loaned securities is determined at the close of business of a fund and any additional required collateral is delivered to a fund on the next business day. A fund or borrower may terminate the loan at any time, and if the borrower defaults on its obligation to return the securities loaned because of insolvency or other reasons, a fund may apply collateral received from the borrower against the obligation. A fund may experience delays and costs in recovering the securities loaned. Any cash collateral received is invested in the Fidelity Securities Lending Cash Central Fund. Any loaned securities are identified as such in the Schedule of Investments, and the value of loaned securities and cash collateral at period end, as applicable, are presented in the Statement of Assets and Liabilities. Security lending income represents the income earned on investing cash collateral, less rebates paid to borrowers and any lending agent fees associated with the loan, plus any premium payments received for lending certain types of securities. Security lending income is presented in the Statement of Operations as a component of income from Fidelity Central Funds. Affiliated security lending activity, if any, was as follows:
| | Total Security Lending Income Fees Paid to NFS | Security Lending Income From Securities Loaned to NFS | Value of Securities Loaned to NFS at Period End |
| Automotive Portfolio | $1,000 | $– | $– |
| Communication Services Portfolio | $25,889 | $959 | $– |
| Construction and Housing Portfolio | $159 | $– | $– |
| Consumer Discretionary Portfolio | $1,655 | $89 | $– |
| Leisure Portfolio | $3,252 | $– | $– |
| Retailing Portfolio | $34,749 | $– | $– |
8. Bank Borrowings.
Each Fund is permitted to have bank borrowings for temporary or emergency purposes to fund shareholder redemptions or for other short-term liquidity requirements. Each Fund has established borrowing arrangements with certain banks. The interest rate on the borrowings is the bank's base rate, as revised from time to time. Any open loans, including accrued interest, at period end are presented under the caption "Notes payable" in the Statement of Assets and Liabilities, if applicable. Activity in this program during the period for which loans were outstanding was as follows:
| | Average Loan Balance | Weighted Average Interest Rate | Interest Expense |
| Consumer Discretionary Portfolio | $1,436,538 | 1.06% | $548 |
9. Expense Reductions.
Commissions paid to certain brokers with whom the investment adviser, or its affiliates, places trades on behalf of certain Funds include an amount in addition to trade execution, which may be rebated back to the Funds to offset expenses. All of the applicable expense reductions are noted in the table below.
| | Brokerage service rebates |
| Automotive Portfolio | $4,058 |
| Communication Services Portfolio | 33,124 |
| Construction and Housing Portfolio | 41,476 |
| Consumer Discretionary Portfolio | 12,004 |
| Leisure Portfolio | 35,769 |
| Retailing Portfolio | 147,221 |
In addition, during the period the investment adviser or an affiliate reimbursed and/or waived a portion of operating expenses as follows:
| | Amount |
| Automotive Portfolio | $278 |
| Construction and Housing Portfolio | 1,243 |
| Consumer Discretionary Portfolio | 1,704 |
| Leisure Portfolio | 1,866 |
| Retailing Portfolio | 11,983 |
In addition, during the period the investment adviser or an affiliate reimbursed and/or waived a portion of fund-level operating expenses as follows:
| | Fund-Level Amount |
| Communication Services Portfolio | $2,542 |
10. Distributions to Shareholders.
Distributions to shareholders of each class were as follows:
| | Year ended
February 28, 2021 | Year ended
February 29, 2020 |
| Communication Services Portfolio | | |
| Distributions to shareholders | | |
| Class A | $635,984 | $798,640 |
| Class M | 164,640 | 242,564 |
| Class C | 167,834 | 201,206 |
| Communication Services | 28,584,094 | 178,269,893 |
| Class I | 512,611 | 316,058 |
| Class Z | 307,670 | 300,481 |
| Total | $30,372,833 | $180,128,842 |
11. Share Transactions.
Share transactions for each class were as follows and may contain automatic conversions between classes or exchanges between affiliated funds:
| | Shares | Shares | Dollars | Dollars |
| | Year ended February 28, 2021 | Year ended February 29, 2020 | Year ended February 28, 2021 | Year ended February 29, 2020 |
| Communication Services Portfolio | | | | |
| Class A | | | | |
| Shares sold | 268,026 | 163,941 | $17,593,964 | $10,592,862 |
| Reinvestment of distributions | 9,103 | 12,499 | 632,897 | 794,118 |
| Shares redeemed | (178,220) | (21,919) | (12,053,875) | (1,385,300) |
| Net increase (decrease) | 98,909 | 154,521 | $6,172,986 | $10,001,680 |
| Class M | | | | |
| Shares sold | 60,603 | 40,632 | $4,303,282 | $2,626,137 |
| Reinvestment of distributions | 2,265 | 3,855 | 162,557 | 242,564 |
| Shares redeemed | (38,319) | (13,568) | (2,745,690) | (861,553) |
| Net increase (decrease) | 24,549 | 30,919 | $1,720,149 | $2,007,148 |
| Class C | | | | |
| Shares sold | 56,901 | 32,141 | $4,065,760 | $2,084,369 |
| Reinvestment of distributions | 2,360 | 3,184 | 167,219 | 199,573 |
| Shares redeemed | (12,513) | (7,441) | (829,994) | (459,981) |
| Net increase (decrease) | 46,748 | 27,884 | $3,402,985 | $1,823,961 |
| Communication Services | | | | |
| Shares sold | 2,744,272 | 2,955,352 | $201,655,702 | $190,171,586 |
| Reinvestment of distributions | 412,314 | 2,705,020 | 27,550,747 | 169,393,115 |
| Shares redeemed | (2,861,981) | (3,681,065) | (194,981,100) | (235,496,213) |
| Net increase (decrease) | 294,605 | 1,979,307 | $34,225,349 | $124,068,488 |
| Class I | | | | |
| Shares sold | 395,855 | 63,284 | $28,329,531 | $4,090,035 |
| Reinvestment of distributions | 6,359 | 4,990 | 498,174 | 315,170 |
| Shares redeemed | (141,365) | (33,315) | (10,652,768) | (2,081,507) |
| Net increase (decrease) | 260,849 | 34,959 | $18,174,937 | $2,323,698 |
| Class Z | | | | |
| Shares sold | 159,779 | 25,004 | $11,122,518 | $1,643,568 |
| Reinvestment of distributions | 1,640 | 4,650 | 115,109 | 293,270 |
| Shares redeemed | (148,188) | (6,601) | (11,892,094) | (443,166) |
| Net increase (decrease) | 13,231 | 23,053 | $(654,467) | $1,493,672 |
12. Other.
The Funds' organizational documents provide former and current trustees and officers with a limited indemnification against liabilities arising in connection with the performance of their duties to the Funds. In the normal course of business, the Funds may also enter into contracts that provide general indemnifications. The Funds' maximum exposure under these arrangements is unknown as this would be dependent on future claims that may be made against the Funds. The risk of material loss from such claims is considered remote.
13. Coronavirus (COVID-19) Pandemic.
An outbreak of COVID-19 first detected in China during December 2019 has since spread globally and was declared a pandemic by the World Health Organization during March 2020. Developments that disrupt global economies and financial markets, such as the COVID-19 pandemic, may magnify factors that affect the Funds' performance.
Report of Independent Registered Public Accounting Firm
To the Board of Trustees of Fidelity Select Portfolios and the Shareholders of Automotive Portfolio, Communication Services Portfolio, Construction and Housing Portfolio, Consumer Discretionary Portfolio, Leisure Portfolio and Retailing Portfolio
Opinions on the Financial Statements
We have audited the accompanying statements of assets and liabilities, including the schedules of investments, of Automotive Portfolio, Communication Services Portfolio, Construction and Housing Portfolio, Consumer Discretionary Portfolio, Leisure Portfolio and Retailing Portfolio (six of the funds constituting Fidelity Select Portfolios, hereafter collectively referred to as the “Funds”) as of February 28, 2021, the related statements of operations for the year ended February 28, 2021, the statements of changes in net assets for each of the two years in the period ended February 28, 2021, including the related notes, and the financial highlights for each of the periods indicated therein (collectively referred to as the “financial statements”). In our opinion, the financial statements present fairly, in all material respects, the financial position of each of the Funds as of February 28, 2021, the results of each of their operations for the year then ended, the changes in each of their net assets for each of the two years in the period ended February 28, 2021 and each of the financial highlights for each of the periods indicated therein in conformity with accounting principles generally accepted in the United States of America.
Basis for Opinions
These financial statements are the responsibility of the Funds’ management. Our responsibility is to express an opinion on the Funds’ financial statements based on our audits. We are a public accounting firm registered with the Public Company Accounting Oversight Board (United States) (PCAOB) and are required to be independent with respect to the Funds in accordance with the U.S. federal securities laws and the applicable rules and regulations of the Securities and Exchange Commission and the PCAOB.
We conducted our audits of these financial statements in accordance with the standards of the PCAOB. Those standards require that we plan and perform the audit to obtain reasonable assurance about whether the financial statements are free of material misstatement, whether due to error or fraud.
Our audits included performing procedures to assess the risks of material misstatement of the financial statements, whether due to error or fraud, and performing procedures that respond to those risks. Such procedures included examining, on a test basis, evidence regarding the amounts and disclosures in the financial statements. Our audits also included evaluating the accounting principles used and significant estimates made by management, as well as evaluating the overall presentation of the financial statements. Our procedures included confirmation of securities owned as of February 28, 2021 by correspondence with the custodian, issuers of privately offered securities and brokers; when replies were not received from brokers, we performed other auditing procedures. We believe that our audits provide a reasonable basis for our opinion.
/s/ PricewaterhouseCoopers LLP
Boston, Massachusetts
April 16, 2021
We have served as the auditor of one or more investment companies in the Fidelity group of funds since 1932.
Trustees and Officers
The Trustees, Members of the Advisory Board (if any), and officers of the trust and funds, as applicable, are listed below. The Board of Trustees governs each fund and is responsible for protecting the interests of shareholders. The Trustees are experienced executives who meet periodically throughout the year to oversee each fund's activities, review contractual arrangements with companies that provide services to each fund, oversee management of the risks associated with such activities and contractual arrangements, and review each fund's performance. Each of the Trustees oversees 309 funds.
The Trustees hold office without limit in time except that (a) any Trustee may resign; (b) any Trustee may be removed by written instrument, signed by at least two-thirds of the number of Trustees prior to such removal; (c) any Trustee who requests to be retired or who has become incapacitated by illness or injury may be retired by written instrument signed by a majority of the other Trustees; and (d) any Trustee may be removed at any special meeting of shareholders by a two-thirds vote of the outstanding voting securities of the trust. Each Trustee who is not an interested person (as defined in the 1940 Act) of the trust and the funds is referred to herein as an Independent Trustee. Each Independent Trustee shall retire not later than the last day of the calendar year in which his or her 75th birthday occurs. The Independent Trustees may waive this mandatory retirement age policy with respect to individual Trustees. Officers and Advisory Board Members hold office without limit in time, except that any officer or Advisory Board Member may resign or may be removed by a vote of a majority of the Trustees at any regular meeting or any special meeting of the Trustees. Except as indicated, each individual has held the office shown or other offices in the same company for the past five years.
Each fund's Statement of Additional Information (SAI) includes more information about the Trustees. To request a free copy, call Fidelity at 1-800-544-8544 if you’re an individual investing directly with Fidelity, call 1-800-835-5092 if you’re a plan sponsor or participant with Fidelity as your recordkeeper or call 1-877-208-0098 on institutional accounts or if you’re an advisor or invest through one.
Experience, Skills, Attributes, and Qualifications of the Trustees. The Governance and Nominating Committee has adopted a statement of policy that describes the experience, qualifications, attributes, and skills that are necessary and desirable for potential Independent Trustee candidates (Statement of Policy). The Board believes that each Trustee satisfied at the time he or she was initially elected or appointed a Trustee, and continues to satisfy, the standards contemplated by the Statement of Policy. The Governance and Nominating Committee also engages professional search firms to help identify potential Independent Trustee candidates who have the experience, qualifications, attributes, and skills consistent with the Statement of Policy. From time to time, additional criteria based on the composition and skills of the current Independent Trustees, as well as experience or skills that may be appropriate in light of future changes to board composition, business conditions, and regulatory or other developments, have also been considered by the professional search firms and the Governance and Nominating Committee. In addition, the Board takes into account the Trustees' commitment and participation in Board and committee meetings, as well as their leadership of standing and ad hoc committees throughout their tenure.
In determining that a particular Trustee was and continues to be qualified to serve as a Trustee, the Board has considered a variety of criteria, none of which, in isolation, was controlling. The Board believes that, collectively, the Trustees have balanced and diverse experience, qualifications, attributes, and skills, which allow the Board to operate effectively in governing each fund and protecting the interests of shareholders. Information about the specific experience, skills, attributes, and qualifications of each Trustee, which in each case led to the Board's conclusion that the Trustee should serve (or continue to serve) as a trustee of the funds, is provided below.
Board Structure and Oversight Function. Robert A. Lawrence is an interested person and currently serves as Acting Chairman. The Trustees have determined that an interested Chairman is appropriate and benefits shareholders because an interested Chairman has a personal and professional stake in the quality and continuity of services provided to the funds. Independent Trustees exercise their informed business judgment to appoint an individual of their choosing to serve as Chairman, regardless of whether the Trustee happens to be independent or a member of management. The Independent Trustees have determined that they can act independently and effectively without having an Independent Trustee serve as Chairman and that a key structural component for assuring that they are in a position to do so is for the Independent Trustees to constitute a substantial majority for the Board. The Independent Trustees also regularly meet in executive session. David M. Thomas serves as Lead Independent Trustee and as such (i) acts as a liaison between the Independent Trustees and management with respect to matters important to the Independent Trustees and (ii) with management prepares agendas for Board meetings.
Fidelity® funds are overseen by different Boards of Trustees. The funds' Board oversees Fidelity's high income and certain equity funds, and other Boards oversee Fidelity's investment-grade bond, money market, asset allocation, and other equity funds. The asset allocation funds may invest in Fidelity® funds overseen by the funds' Board. The use of separate Boards, each with its own committee structure, allows the Trustees of each group of Fidelity® funds to focus on the unique issues of the funds they oversee, including common research, investment, and operational issues. On occasion, the separate Boards establish joint committees to address issues of overlapping consequences for the Fidelity® funds overseen by each Board.
The Trustees operate using a system of committees to facilitate the timely and efficient consideration of all matters of importance to the Trustees, each fund, and fund shareholders and to facilitate compliance with legal and regulatory requirements and oversight of the funds' activities and associated risks. The Board, acting through its committees, has charged FMR and its affiliates with (i) identifying events or circumstances the occurrence of which could have demonstrably adverse effects on the funds' business and/or reputation; (ii) implementing processes and controls to lessen the possibility that such events or circumstances occur or to mitigate the effects of such events or circumstances if they do occur; and (iii) creating and maintaining a system designed to evaluate continuously business and market conditions in order to facilitate the identification and implementation processes described in (i) and (ii) above. Because the day-to-day operations and activities of the funds are carried out by or through FMR, its affiliates, and other service providers, the funds' exposure to risks is mitigated but not eliminated by the processes overseen by the Trustees. While each of the Board's committees has responsibility for overseeing different aspects of the funds' activities, oversight is exercised primarily through the Operations, Audit, and Compliance Committees. Appropriate personnel, including but not limited to the funds' Chief Compliance Officer (CCO), FMR's internal auditor, the independent accountants, the funds' Treasurer and portfolio management personnel, make periodic reports to the Board's committees, as appropriate, including an annual review of Fidelity's risk management program for the Fidelity® funds. The responsibilities of each standing committee, including their oversight responsibilities, are described further under "Standing Committees of the Trustees."
Interested Trustees*:
Correspondence intended for a Trustee who is an interested person may be sent to Fidelity Investments, 245 Summer Street, Boston, Massachusetts 02210.
Name, Year of Birth; Principal Occupations and Other Relevant Experience+
Bettina Doulton (1964)
Year of Election or Appointment: 2020
Trustee
Ms. Doulton also serves as Trustee of other Fidelity® funds. Prior to her retirement, Ms. Doulton served in a variety of positions at Fidelity Investments, including as a managing director of research (2006-2007), portfolio manager to certain Fidelity® funds (1993-2005), equity analyst and portfolio assistant (1990-1993), and research assistant (1987-1990). Ms. Doulton currently owns and operates Phi Builders + Architects and Cellardoor Winery. Previously, Ms. Doulton served as a member of the Board of Brown Capital Management, LLC (2013-2018).
Robert A. Lawrence (1952)
Year of Election or Appointment: 2020
Trustee
Acting Chairman of the Board of Trustees
Mr. Lawrence also serves as Trustee of other funds. Previously, Mr. Lawrence served as a Member of the Advisory Board of certain funds. Prior to his retirement in 2008, Mr. Lawrence served as Vice President of certain Fidelity® funds (2006-2008), Senior Vice President, Head of High Income Division of Fidelity Management & Research Company (investment adviser firm, 2006-2008), and President of Fidelity Strategic Investments (investment adviser firm, 2002-2005).
* Determined to be an “Interested Trustee” by virtue of, among other things, his or her affiliation with the trust or various entities under common control with FMR.
+ The information includes the Trustee's principal occupation during the last five years and other information relating to the experience, attributes, and skills relevant to the Trustee's qualifications to serve as a Trustee, which led to the conclusion that the Trustee should serve as a Trustee for each fund.
Independent Trustees:
Correspondence intended for an Independent Trustee may be sent to Fidelity Investments, P.O. Box 55235, Boston, Massachusetts 02205-5235.
Name, Year of Birth; Principal Occupations and Other Relevant Experience+
Dennis J. Dirks (1948)
Year of Election or Appointment: 2018
Trustee
Mr. Dirks also serves as Trustee of other Fidelity® funds. Prior to his retirement in May 2003, Mr. Dirks served as Chief Operating Officer and as a member of the Board of The Depository Trust & Clearing Corporation (financial markets infrastructure), President, Chief Operating Officer and a member of the Board of The Depository Trust Company (DTC), President and a member of the Board of the National Securities Clearing Corporation (NSCC), Chief Executive Officer and a member of the Board of the Government Securities Clearing Corporation and Chief Executive Officer and a member of the Board of the Mortgage-Backed Securities Clearing Corporation. Mr. Dirks currently serves as a member of the Finance Committee (2016-present) and Board (2017-present) and is Treasurer (2018-present) of the Asolo Repertory Theatre.
Donald F. Donahue (1950)
Year of Election or Appointment: 2018
Trustee
Mr. Donahue also serves as Trustee of other Fidelity® funds. Mr. Donahue serves as President and Chief Executive Officer of Miranda Partners, LLC (risk consulting for the financial services industry, 2012-present). Previously, Mr. Donahue served as Chief Executive Officer (2006-2012), Chief Operating Officer (2003-2006) and Managing Director, Customer Marketing and Development (1999-2003) of The Depository Trust & Clearing Corporation (financial markets infrastructure). Mr. Donahue currently serves as a member (2007-present) and Co-Chairman (2016-present) of the Board of United Way of New York, a member of the Board of NYC Leadership Academy (2012-present) and a member of the Board of Advisors of Ripple Labs, Inc. (financial services, 2015-present). Mr. Donahue previously served as a member of the Advisory Board of certain Fidelity® funds (2015-2018).
Vicki L. Fuller (1957)
Year of Election or Appointment: 2020
Trustee
Ms. Fuller also serves as Trustee of other Fidelity® funds. Previously, Ms. Fuller served as a member of the Advisory Board of certain Fidelity® funds (2018-2020), Chief Investment Officer of the New York State Common Retirement Fund (2012-2018) and held a variety of positions at AllianceBernstein L.P. (global asset management, 1985-2012), including Managing Director (2006-2012) and Senior Vice President and Senior Portfolio Manager (2001-2006). Ms. Fuller currently serves as a member of the Board, Audit Committee and Nominating and Governance Committee of The Williams Companies, Inc. (natural gas infrastructure, 2018-present), as a member of the Board, Audit Committee and Nominating and Governance Committee of two Blackstone business development companies (2020-present) and as a member of the Board of Treliant, LLC (consulting, 2019-present).
Patricia L. Kampling (1959)
Year of Election or Appointment: 2020
Trustee
Ms. Kampling also serves as Trustee of other Fidelity® funds. Prior to her retirement, Ms. Kampling served as Chairman of the Board and Chief Executive Officer (2012-2019), President and Chief Operating Officer (2011-2012) and Executive Vice President and Chief Financial Officer (2010-2011) of Alliant Energy Corporation. Ms. Kampling currently serves as a member of the Board, Compensation Committee and Executive Committee and as Chair of the Audit Committee of Briggs & Stratton Corporation (manufacturing, 2011-present) and as a member of the Board, Audit, Finance and Risk Committee and Safety, Environmental, Technology and Operations Committee of American Water Works Company, Inc. (utilities company, 2019-present). In addition, Ms. Kampling currently serves as a member of the Board of the Nature Conservancy, Wisconsin Chapter (2019-present). Previously, Ms. Kampling served as a Member of the Advisory Board of certain Fidelity® funds (2020), a member of the Board of Interstate Power and Light Company (2012-2019) and Wisconsin Power and Light Company (2012-2019) (each a subsidiary of Alliant Energy Corporation) and as a member of the Board and Workforce Development Committee of the Business Roundtable (2018-2019).
Thomas A. Kennedy (1955)
Year of Election or Appointment: 2021
Trustee
Mr. Kennedy also serves as Trustee of other Fidelity® funds. Previously, Mr. Kennedy served as a Member of the Advisory Board of certain Fidelity® funds (2020) and held a variety of positions at Raytheon Company (aerospace and defense, 1983-2020), including Chairman and Chief Executive Officer (2014-2020) and Executive Vice President and Chief Operating Officer (2013-2014). Mr. Kennedy currently serves as Executive Chairman of the Board of Directors of Raytheon Technologies Corporation (aerospace and defense, 2020-present). He is also a member of the Rutgers School of Engineering Industry Advisory Board (2011-present) and a member of the UCLA Engineering Dean’s Executive Board (2016-present).
Garnett A. Smith (1947)
Year of Election or Appointment: 2013
Trustee
Mr. Smith also serves as Trustee of other Fidelity® funds. Prior to his retirement, Mr. Smith served as Chairman and Chief Executive Officer (1990-1997) and President (1986-1990) of Inbrand Corp. (manufacturer of personal absorbent products). Prior to his employment with Inbrand Corp., he was employed by a retail fabric chain and North Carolina National Bank (now Bank of America). Mr. Smith previously served as a member of the Advisory Board of certain Fidelity® funds (2012-2013).
David M. Thomas (1949)
Year of Election or Appointment: 2018
Trustee
Lead Independent Trustee
Mr. Thomas also serves as Trustee of other Fidelity® funds. Previously, Mr. Thomas served as Executive Chairman (2005-2006) and Chairman and Chief Executive Officer (2000-2005) of IMS Health, Inc. (pharmaceutical and healthcare information solutions). Mr. Thomas currently serves as Non-Executive Chairman of the Board of Fortune Brands Home and Security (home and security products, 2011-present), and a member of the Board (2004-present) and Presiding Director (2013-present) of Interpublic Group of Companies, Inc. (marketing communication).
Susan Tomasky (1953)
Year of Election or Appointment: 2020
Trustee
Ms. Tomasky also serves as Trustee of other Fidelity® funds. Prior to her retirement, Ms. Tomasky served in various executive officer positions at American Electric Power Company, Inc. (1998-2011), including most recently as President of AEP Transmission (2007-2011). Ms. Tomasky currently serves as a member of the Board and Sustainability Committee and as Chair of the Audit Committee of Marathon Petroleum Corporation (2018-present) and as a member of the Board, Corporate Governance Committee and Organization and Compensation Committee and as Chair of the Audit Committee of Public Service Enterprise Group, Inc. (utilities company, 2012-present). In addition, Ms. Tomasky currently serves as a member of the Board of the Columbus Regional Airport Authority (2007-present), as a member of the Board of the Royal Shakespeare Company – America (2009-present), as a member of the Board of the Columbus Association for the Performing Arts (2011-present) and as a member of the Board of Kenyon College (2016-present). Previously, Ms. Tomasky served as a Member of the Advisory Board of certain Fidelity® funds (2020), a member of the Board (2011-2019) and as Lead Independent Director (2015-2018) of Andeavor Corporation (previously Tesoro Corporation) (independent oil refiner and marketer) and as a member of the Board of Summit Midstream Partners LP (energy, 2012-2018).
Michael E. Wiley (1950)
Year of Election or Appointment: 2008
Trustee
Mr. Wiley also serves as Trustee of other Fidelity® funds. Previously, Mr. Wiley served as a member of the Advisory Board of certain Fidelity® funds (2018-2020), Chairman, President and CEO of Baker Hughes, Inc. (oilfield services, 2000-2004). Mr. Wiley also previously served as a member of the Board of Andeavor Corporation (independent oil refiner and marketer, 2005-2018), a member of the Board of Andeavor Logistics LP (natural resources logistics, 2015-2018) and a member of the Board of High Point Resources (exploration and production, 2005-2020).
+ The information includes the Trustee's principal occupation during the last five years and other information relating to the experience, attributes, and skills relevant to the Trustee's qualifications to serve as a Trustee, which led to the conclusion that the Trustee should serve as a Trustee for each fund.
Advisory Board Members and Officers:
Correspondence intended for a Member of the Advisory Board (if any) may be sent to Fidelity Investments, P.O. Box 55235, Boston, Massachusetts 02205-5235. Correspondence intended for an officer or Peter S. Lynch may be sent to Fidelity Investments, 245 Summer Street, Boston, Massachusetts 02210. Officers appear below in alphabetical order.
Name, Year of Birth; Principal Occupation
Ned C. Lautenbach (1944)
Year of Election or Appointment: 2021
Member of the Advisory Board
Mr. Lautenbach also serves as a Member of the Advisory Board of other Fidelity® funds. Mr. Lautenbach currently serves as Chair of the Board of Governors, State University System of Florida (2013-present) and is a member of the Council on Foreign Relations (1994-present). He is also a member and has in the past served as Chairman of the Board of Directors of Artis-Naples (2012-present). Previously, Mr. Lautenbach served as a Trustee of certain Fidelity® funds (2000-2020) and a member and then Lead Director of the Board of Directors of Eaton Corporation (diversified industrial, 1997-2016). He was also a Partner at Clayton, Dubilier & Rice, LLC (private equity investment, 1998-2010); as well as Director of Sony Corporation (2006-2007). In addition, Mr. Lautenbach had a 30-year career with IBM (technology company), during which time he served as Senior Vice President and as a member of the Corporate Executive Committee (1968-1998).
Peter S. Lynch (1944)
Year of Election or Appointment: 2018
Member of the Advisory Board
Mr. Lynch also serves as a Member of the Advisory Board of other Fidelity® funds. Mr. Lynch is Vice Chairman and a Director of Fidelity Management & Research Company LLC (investment adviser firm). In addition, Mr. Lynch serves as a Trustee of Boston College and as the Chairman of the Inner-City Scholarship Fund. Previously, Mr. Lynch served as Vice Chairman and a Director of FMR Co., Inc. (investment adviser firm) and on the Special Olympics International Board of Directors (1997-2006).
Craig S. Brown (1977)
Year of Election or Appointment: 2019
Assistant Treasurer
Mr. Brown also serves as Assistant Treasurer of other funds. Mr. Brown is an employee of Fidelity Investments (2013-present).
John J. Burke III (1964)
Year of Election or Appointment: 2018
Chief Financial Officer
Mr. Burke also serves as Chief Financial Officer of other funds. Mr. Burke serves as Head of Investment Operations for Fidelity Fund and Investment Operations (2018-present) and is an employee of Fidelity Investments (1998-present). Previously Mr. Burke served as head of Asset Management Investment Operations (2012-2018).
William C. Coffey (1969)
Year of Election or Appointment: 2019
Assistant Secretary
Mr. Coffey also serves as Assistant Secretary of other funds. He is Senior Vice President and Deputy General Counsel of FMR LLC (diversified financial services company, 2010-present), and is an employee of Fidelity Investments. Previously, Mr. Coffey served as Secretary and CLO of certain funds (2018-2019); CLO, Secretary, and Senior Vice President of Fidelity Management & Research Company and FMR Co., Inc. (investment adviser firms, 2018-2019); Secretary of Fidelity SelectCo, LLC and Fidelity Investments Money Management, Inc. (investment adviser firms, 2018-2019); CLO of Fidelity Management & Research (Hong Kong) Limited, FMR Investment Management (UK) Limited, and Fidelity Management & Research (Japan) Limited (investment adviser firms, 2018-2019); and Assistant Secretary of certain funds (2009-2018).
Timothy M. Cohen (1969)
Year of Election or Appointment: 2018
Vice President
Mr. Cohen also serves as Vice President of other funds. Mr. Cohen serves as Co-Head of Equity (2018-present), a Director of Fidelity Management & Research (Japan) Limited (investment adviser firm, 2016-present), and is an employee of Fidelity Investments. Previously, Mr. Cohen served as Executive Vice President of Fidelity SelectCo, LLC (2019), Head of Global Equity Research (2016-2018), Chief Investment Officer - Equity and a Director of Fidelity Management & Research (U.K.) Inc. (investment adviser firm, 2013-2015) and as a Director of Fidelity Management & Research (Hong Kong) Limited (investment adviser firm, 2017).
Jonathan Davis (1968)
Year of Election or Appointment: 2010
Assistant Treasurer
Mr. Davis also serves as Assistant Treasurer of other funds. Mr. Davis serves as Assistant Treasurer of FMR Capital, Inc. (2017-present) and is an employee of Fidelity Investments. Previously, Mr. Davis served as Vice President and Associate General Counsel of FMR LLC (diversified financial services company, 2003-2010).
Laura M. Del Prato (1964)
Year of Election or Appointment: 2018
Assistant Treasurer
Ms. Del Prato also serves as an officer of other funds. Ms. Del Prato is an employee of Fidelity Investments (2017-present). Previously, Ms. Del Prato served as President and Treasurer of The North Carolina Capital Management Trust: Cash Portfolio and Term Portfolio (2018-2020). Prior to joining Fidelity Investments, Ms. Del Prato served as a Managing Director and Treasurer of the JPMorgan Mutual Funds (2014-2017). Prior to JPMorgan, Ms. Del Prato served as a partner at Cohen Fund Audit Services (accounting firm, 2012-2013) and KPMG LLP (accounting firm, 2004-2012).
Colm A. Hogan (1973)
Year of Election or Appointment: 2020
Assistant Treasurer
Mr. Hogan also serves as an officer of other funds. Mr. Hogan serves as Assistant Treasurer of FMR Capital, Inc. (2017-present) and is an employee of Fidelity Investments (2005-present). Previously, Mr. Hogan served as Deputy Treasurer of certain Fidelity® funds (2016-2020) and Assistant Treasurer of certain Fidelity® funds (2016-2018).
Pamela R. Holding (1964)
Year of Election or Appointment: 2018
Vice President
Ms. Holding also serves as Vice President of other funds. Ms. Holding serves as Co-Head of Equity (2018-present) and is an employee of Fidelity Investments (2013-present). Previously, Ms. Holding served as Executive Vice President of Fidelity SelectCo, LLC (2019) and as Chief Investment Officer of Fidelity Institutional Asset Management (2013-2018).
Cynthia Lo Bessette (1969)
Year of Election or Appointment: 2019
Secretary and Chief Legal Officer (CLO)
Ms. Lo Bessette also serves as an officer of other funds. Ms. Lo Bessette serves as CLO, Secretary, and Senior Vice President of Fidelity Management & Research Company LLC (investment adviser firm, 2019-present); and CLO of Fidelity Management & Research (Hong Kong) Limited, FMR Investment Management (UK) Limited, and Fidelity Management & Research (Japan) Limited (investment adviser firms, 2019-present). She is a Senior Vice President and Deputy General Counsel of FMR LLC (diversified financial services company, 2019-present), and is an employee of Fidelity Investments. Previously, Ms. Lo Bessette served as CLO, Secretary, and Senior Vice President of FMR Co., Inc. (investment adviser firm, 2019); Secretary of Fidelity SelectCo, LLC and Fidelity Investments Money Management, Inc. (investment adviser firms, 2019). Prior to joining Fidelity Investments, Ms. Lo Bessette was Executive Vice President, General Counsel (2016-2019) and Senior Vice President, Deputy General Counsel (2015-2016) of OppenheimerFunds (investment management company) and Deputy Chief Legal Officer (2013-2015) of Jennison Associates LLC (investment adviser firm).
Chris Maher (1972)
Year of Election or Appointment: 2020
Deputy Treasurer
Mr. Maher also serves as an officer of other funds. Mr. Maher serves as Assistant Treasurer of FMR Capital, Inc. (2017-present), and is an employee of Fidelity Investments (2008-present). Previously, Mr. Maher served as Assistant Treasurer of certain funds (2013-2020); Vice President of Asset Management Compliance (2013), Vice President of the Program Management Group of FMR (investment adviser firm, 2010-2013), and Vice President of Valuation Oversight (2008-2010).
Jason P. Pogorelec (1975)
Year of Election or Appointment: 2020
Chief Compliance Officer
Mr. Pogorelec also serves as Chief Compliance Officer of other funds. Mr. Pogorelec is a senior Vice President of Asset Management Compliance for Fidelity Investments and is an employee of Fidelity Investments (2006-present). Previously, Mr. Pogorelec served as Vice President, Associate General Counsel for Fidelity Investments (2010-2020) and Assistant Secretary of certain Fidelity funds (2015-2020).
Brett Segaloff (1972)
Year of Election or Appointment: 2021
Anti-Money Laundering (AML) Officer
Mr. Segaloff also serves as an AML Officer of other funds and other related entities. He is Director, Anti-Money Laundering (2007-present) of FMR LLC (diversified financial services company) and is an employee of Fidelity Investments (1996-present).
Stacie M. Smith (1974)
Year of Election or Appointment: 2018
President and Treasurer
Ms. Smith also serves as an officer of other funds. Ms. Smith serves as Assistant Treasurer of FMR Capital, Inc. (2017-present), is an employee of Fidelity Investments (2009-present), and has served in other fund officer roles. Prior to joining Fidelity Investments, Ms. Smith served as Senior Audit Manager of Ernst & Young LLP (accounting firm, 1996-2009). Previously, Ms. Smith served as Assistant Treasurer (2013-2019) and Deputy Treasurer (2013-2016) of certain Fidelity® funds.
Marc L. Spector (1972)
Year of Election or Appointment: 2017
Assistant Treasurer
Mr. Spector also serves as an officer of other funds. Mr. Spector serves as Assistant Treasurer of FMR Capital, Inc. (2017-present) and is an employee of Fidelity Investments (2016-present). Prior to joining Fidelity Investments, Mr. Spector served as Director at the Siegfried Group (accounting firm, 2013-2016), and prior to Siegfried Group as audit senior manager at Deloitte & Touche LLP (accounting firm, 2005-2013).
Jim Wegmann (1979)
Year of Election or Appointment: 2019
Assistant Treasurer
Mr. Wegmann also serves as Assistant Treasurer of other funds. Mr. Wegmann is an employee of Fidelity Investments (2011-present).
Shareholder Expense Example
As a shareholder, you incur two types of costs: (1) transaction costs, which may include sales charges (loads) on purchase payments or redemption proceeds, as applicable and (2) ongoing costs, which generally include management fees, distribution and/or service (12b-1) fees and other Fund expenses. This Example is intended to help you understand your ongoing costs (in dollars) of investing in a fund and to compare these costs with the ongoing costs of investing in other mutual funds.
The Example is based on an investment of $1,000 invested at the beginning of the period and held for the entire period (September 1, 2020 to February 28, 2021).
Actual Expenses
The first line of the accompanying table provides information about actual account values and actual expenses. You may use the information in this line, together with the amount you invested, to estimate the expenses that you paid over the period. Simply divide your account value by $1,000.00 (for example, an $8,600 account value divided by $1,000.00 = 8.6), then multiply the result by the number in the first line for a class/Fund under the heading entitled "Expenses Paid During Period" to estimate the expenses you paid on your account during this period. If any fund is a shareholder of any underlying mutual funds or exchange-traded funds (ETFs) (the Underlying Funds), such fund indirectly bears its proportional share of the expenses of the Underlying Funds in addition to the direct expenses incurred presented in the table. These fees and expenses are not included in the annualized expense ratio used to calculate the expense estimate in the table below.
Hypothetical Example for Comparison Purposes
The second line of the accompanying table provides information about hypothetical account values and hypothetical expenses based on the actual expense ratio and an assumed rate of return of 5% per year before expenses, which is not the actual return. The hypothetical account values and expenses may not be used to estimate the actual ending account balance or expenses you paid for the period. You may use this information to compare the ongoing costs of investing in the Fund and other funds. To do so, compare this 5% hypothetical example with the 5% hypothetical examples that appear in the shareholder reports of the other funds. If any fund is a shareholder of any Underlying Funds, such fund indirectly bears its proportional share of the expenses of the Underlying Funds in addition to the direct expenses as presented in the table. These fees and expenses are not included in the annualized expense ratio used to calculate the expense estimate in the table below.
Please note that the expenses shown in the table are meant to highlight your ongoing costs only and do not reflect any transaction costs. Therefore, the second line of the table is useful in comparing ongoing costs only, and will not help you determine the relative total costs of owning different funds. In addition, if these transactional costs were included, your costs would have been higher.
| | Annualized Expense Ratio-A | Beginning
Account Value
September 1, 2020 | Ending
Account Value
February 28, 2021 | Expenses Paid
During Period-B
September 1, 2020
to February 28, 2021 |
| Automotive Portfolio | .83% | | | |
| Actual | | $1,000.00 | $1,321.30 | $4.78 |
| Hypothetical-C | | $1,000.00 | $1,020.68 | $4.16 |
| Communication Services Portfolio | | | | |
| Class A | 1.06% | | | |
| Actual | | $1,000.00 | $1,171.20 | $5.71 |
| Hypothetical-C | | $1,000.00 | $1,019.54 | $5.31 |
| Class M | 1.30% | | | |
| Actual | | $1,000.00 | $1,169.80 | $6.99 |
| Hypothetical-C | | $1,000.00 | $1,018.35 | $6.51 |
| Class C | 1.78% | | | |
| Actual | | $1,000.00 | $1,167.20 | $9.56 |
| Hypothetical-C | | $1,000.00 | $1,015.97 | $8.90 |
| Communication Services | .76% | | | |
| Actual | | $1,000.00 | $1,173.00 | $4.09 |
| Hypothetical-C | | $1,000.00 | $1,021.03 | $3.81 |
| Class I | .77% | | | |
| Actual | | $1,000.00 | $1,172.90 | $4.15 |
| Hypothetical-C | | $1,000.00 | $1,020.98 | $3.86 |
| Class Z | .63% | | | |
| Actual | | $1,000.00 | $1,173.70 | $3.40 |
| Hypothetical-C | | $1,000.00 | $1,021.67 | $3.16 |
| Construction and Housing Portfolio | .76% | | | |
| Actual | | $1,000.00 | $1,161.30 | $4.07 |
| Hypothetical-C | | $1,000.00 | $1,021.03 | $3.81 |
| Consumer Discretionary Portfolio | .74% | | | |
| Actual | | $1,000.00 | $1,158.00 | $3.96 |
| Hypothetical-C | | $1,000.00 | $1,021.12 | $3.71 |
| Leisure Portfolio | .75% | | | |
| Actual | | $1,000.00 | $1,282.30 | $4.24 |
| Hypothetical-C | | $1,000.00 | $1,021.08 | $3.76 |
| Retailing Portfolio | .72% | | | |
| Actual | | $1,000.00 | $1,150.70 | $3.84 |
| Hypothetical-C | | $1,000.00 | $1,021.22 | $3.61 |
A Annualized expense ratio reflects expenses net of applicable fee waivers.
B Expenses are equal to the annualized expense ratio, multiplied by the average account value over the period, multiplied by 181/ 365 (to reflect the one-half year period). The fees and expenses of any Underlying Funds are not included in each annualized expense ratio.
C 5% return per year before expenses
Distributions (Unaudited)
The Board of Trustees of each fund voted to pay to shareholders of record at the opening of business on record date, the following distributions per share derived from capital gains realized from sales of portfolio securities, and dividends derived from net investment income:
| | Pay Date | Record Date | Dividends | Capital Gains |
| Automotive Portfolio | 04/12/21 | 04/09/21 | $0.008 | $0.114 |
| Communication Services Portfolio | | | | |
| Class A | 04/12/21 | 04/09/21 | $0.000 | $3.542 |
| Class M | 04/12/21 | 04/09/21 | $0.000 | $3.409 |
| Class C | 04/12/21 | 04/09/21 | $0.000 | $3.280 |
| Communication Services | 04/12/21 | 04/09/21 | $0.000 | $3.722 |
| Class I | 04/12/21 | 04/09/21 | $0.000 | $3.750 |
| Class Z | 04/12/21 | 04/09/21 | $0.000 | $3.772 |
| Construction and Housing Portfolio | 04/12/21 | 04/09/21 | $0.000 | $1.993 |
| Consumer Discretionary Portfolio | 04/12/21 | 04/09/21 | $0.000 | $2.979 |
| Leisure Portfolio | 04/12/21 | 04/09/21 | $0.006 | $0.896 |
| Retailing Portfolio | 04/12/21 | 04/09/21 | $0.000 | $1.320 |
|
The funds hereby designate as capital gain dividend the amounts noted below for the taxable year ended February 28, 2021, or, if subsequently determined to be different, the net capital gain of such year.
| Automotive Portfolio | $5,185,511 |
| Communication Services Portfolio | $28,427,470 |
| Construction and Housing Portfolio | $10,622,807 |
| Consumer Discretionary Portfolio | $34,917,548 |
| Leisure Portfolio | $30,815,396 |
| Retailing Portfolio | $432,658,580 |
|
A percentage of the dividends distributed during the fiscal year for the following funds qualify for the dividends–received deduction for corporate shareholders:
| | April 2020 | December 2020 |
| Automotive Portfolio | – | 100% |
| Construction and Housing Portfolio | 8% | 87% |
| Leisure Portfolio | 100% | 100% |
|
A percentage of the dividends distributed during the fiscal year for the following funds may be taken into account as a dividend for purposes of the maximum rate under section 1(h)(11) of the Internal Revenue Code.
| | April 2020 | December 2020 |
| Automotive Portfolio | – | 100% |
| Construction and Housing Portfolio | 9% | 100% |
| Leisure Portfolio | 100% | 100% |
|
The funds hereby designate the percentages noted below of the short-term capital gain dividends distributed during the fiscal year as qualifying to be taxed as short-term capital gain dividends for nonresident alien shareholders:
| | April 2020 |
| Construction and Housing Portfolio | 100% |
|
The funds will notify shareholders in January 2022 of amounts for use in preparing 2021 income tax returns.
Board Approval of Investment Advisory Contracts
Automotive PortfolioCommunication Services PortfolioConstruction and Housing PortfolioConsumer Discretionary PortfolioLeisure PortfolioRetailing PortfolioAt its January 2021 meeting, the Board of Trustees, including the Independent Trustees (together, the Board), voted to continue the management contract with Fidelity Management & Research Company LLC (FMR), and the sub-advisory agreements and sub-subadvisory agreements, in each case, where applicable (together, the Advisory Contracts) for each fund for four months from February 1, 2021 through May 31, 2021, in connection with changes to the Board's meeting calendar.
The Board considered that the approval of each fund's Advisory Contracts will not result in any changes in (i) the investment process or strategies employed in the management of each fund's assets; (ii) the fees and expenses paid by shareholders; (iii) the nature, extent or quality of services provided under each fund's Advisory Contracts; or (iv) the day-to-day management of each fund or the persons primarily responsible for such management. The Board also considered that since its last approval of each fund's Advisory Contracts, FMR had provided additional information on each fund in support of the annual contract renewal process, including competitive analyses on total expenses and management fees and in-depth reviews of fund performance and fund profitability information. The Board also considered the findings of certain ad hoc committees that had been previously formed to discuss matters relevant to all of the Fidelity funds, including economies of scale, fall-out benefits and retail vs. institutional funds. The Board concluded that each fund's Advisory Contracts are fair and reasonable, and that each fund's Advisory Contracts should be renewed, without modification, through May 31, 2021, with the understanding that the Board will consider the annual renewal for a full one year period in May 2021.
In connection with its consideration of future renewals of each fund's Advisory Contracts, the Board will consider: (i) the nature, extent and quality of services provided to the funds, including shareholder and administrative services and investment performance; (ii) the competitiveness of the management fee and total expenses for each fund; (iii) the costs of the services and profitability, including the revenues earned and the expenses incurred in conducting the business of developing, marketing, distributing, managing, administering, and servicing each fund and its shareholders, to the extent applicable; and (iv) whether there have been economies of scale in respect of the Fidelity funds, whether the Fidelity funds (including the funds) have appropriately benefited from any such economies of scale, and whether there is the potential for realization of any further economies.
Based on its evaluation of all of the conclusions noted above, and after considering all factors it believed relevant, the Board ultimately concluded that each fund's management fee structures are fair and reasonable, and that the continuation of the funds' Advisory Contracts should be approved for four months from February 1, 2021 through May 31, 2021.
Liquidity Risk Management Program
The Securities and Exchange Commission adopted Rule 22e-4 under the Investment Company Act of 1940 (the Liquidity Rule) to promote effective liquidity risk management throughout the open-end investment company industry, thereby reducing the risk that funds will be unable to meet their redemption obligations and mitigating dilution of the interests of fund shareholders.
The Funds have adopted and implemented a liquidity risk management program pursuant to the Liquidity Rule (the Program) effective December 1, 2018. The Program is reasonably designed to assess and manage each Fund’s liquidity risk and to comply with the requirements of the Liquidity Rule. Each Fund’s Board of Trustees (the Board) has designated each Fund’s investment adviser as administrator of the Program. The Fidelity advisers have established a Liquidity Risk Management Committee (the LRM Committee) to manage the Program for each of the Fidelity Funds. The LRM Committee monitors the adequacy and effectiveness of implementation of the Program and on a periodic basis assesses each Fund’s liquidity risk based on a variety of factors including (1) the Fund’s investment strategy, (2) portfolio liquidity and cash flow projections during normal and reasonably foreseeable stressed conditions, (3) shareholder redemptions, (4) borrowings and other funding sources and (5) in the case of exchange-traded funds, certain additional factors including the effect of the Fund’s prices and spreads, market participants, and basket compositions on the overall liquidity of the Fund’s portfolio, as applicable.
In accordance with the Program, each of the Fund’s portfolio investments is classified into one of four liquidity categories described below based on a determination of a reasonable expectation for how long it would take to convert the investment to cash (or sell or dispose of the investment) without significantly changing its market value.
- Highly liquid investments – cash or convertible to cash within three business days or less
- Moderately liquid investments – convertible to cash in three to seven calendar days
- Less liquid investments – can be sold or disposed of, but not settled, within seven calendar days
- Illiquid investments – cannot be sold or disposed of within seven calendar days
Liquidity classification determinations take into account a variety of factors including various market, trading and investment-specific considerations, as well as market depth, and generally utilize analysis from a third-party liquidity metrics service.
The Liquidity Rule places a 15% limit on a fund’s illiquid investments and requires funds that do not primarily hold assets that are highly liquid investments to determine and maintain a minimum percentage of the fund’s net assets to be invested in highly liquid investments (highly liquid investment minimum or HLIM). The Program includes provisions reasonably designed to comply with the 15% limit on illiquid investments and for determining, periodically reviewing and complying with the HLIM requirement as applicable.
At a recent meeting of the Fund’s Board of Trustees, the LRM Committee provided a written report to the Board pertaining to the operation, adequacy, and effectiveness of implementation of the Program for the annual period from December 1, 2019 through November 30, 2020. The report concluded that the Program has been implemented and is operating effectively and is reasonably designed to assess and manage the Fund’s liquidity risk.
Proxy Voting Results
A special meeting of shareholders was held on June 9, 2020. The results of votes taken among shareholders on the proposal before them are reported below. Each vote reported represents one dollar of net asset value held on the record date for the meeting.
PROPOSAL 1
To elect a Board of Trustees.
| | # of
Votes | % of
Votes |
| Dennis J. Dirks |
| Affirmative | 32,463,705,305.665 | 92.437 |
| Withheld | 2,655,951,104.308 | 7.563 |
| TOTAL | 35,119,656,409.973 | 100.000 |
| Donald F. Donahue |
| Affirmative | 32,446,843,861.354 | 92.389 |
| Withheld | 2,672,812,548.619 | 7.611 |
| TOTAL | 35,119,656,409.973 | 100.000 |
| Bettina Doulton |
| Affirmative | 32,610,463,757.584 | 92.855 |
| Withheld | 2,509,192,652.389 | 7.145 |
| TOTAL | 35,119,656,409.973 | 100.000 |
| Vicki L. Fuller |
| Affirmative | 32,688,213,522.720 | 93.077 |
| Withheld | 2,431,442,887.253 | 6.923 |
| TOTAL | 35,119,656,409.973 | 100.000 |
| Patricia L. Kampling |
| Affirmative | 32,313,755,598.535 | 92.010 |
| Withheld | 2,805,900,811.438 | 7.990 |
| TOTAL | 35,119,656,409.973 | 100.000 |
| Alan J. Lacy |
| Affirmative | 31,990,158,754.948 | 91.089 |
| Withheld | 3,129,497,655.026 | 8.911 |
| TOTAL | 35,119,656,409.973 | 100.000 |
| Ned C. Lautenbach |
| Affirmative | 32,043,019,991.143 | 91.240 |
| Withheld | 3,076,636,418.830 | 8.760 |
| TOTAL | 35,119,656,409.973 | 100.000 |
| Robert A. Lawrence |
| Affirmative | 32,150,842,398.009 | 91.547 |
| Withheld | 2,968,814,011.965 | 8.453 |
| TOTAL | 35,119,656,409.973 | 100.000 |
| Joseph Mauriello |
| Affirmative | 32,082,201,213.166 | 91.351 |
| Withheld | 3,037,455,196.807 | 8.649 |
| TOTAL | 35,119,656,409.973 | 100.000 |
| Cornelia M. Small |
| Affirmative | 32,207,976,835.934 | 91.709 |
| Withheld | 2,911,679,574.039 | 8.291 |
| TOTAL | 35,119,656,409.973 | 100.000 |
| Garnett A. Smith |
| Affirmative | 32,102,654,343.096 | 91.409 |
| Withheld | 3,017,002,066.877 | 8.591 |
| TOTAL | 35,119,656,409.973 | 100.000 |
| David M. Thomas |
| Affirmative | 32,150,749,424.556 | 91.546 |
| Withheld | 2,968,906,985.418 | 8.454 |
| TOTAL | 35,119,656,409.973 | 100.000 |
| Susan Tomasky |
| Affirmative | 32,381,933,484.515 | 92.205 |
| Withheld | 2,737,722,925.459 | 7.795 |
| TOTAL | 35,119,656,409.973 | 100.000 |
| Michael E. Wiley |
| Affirmative | 32,135,064,741.973 | 91.502 |
| Withheld | 2,984,591,668.000 | 8.498 |
| TOTAL | 35,119,656,409.973 | 100.000 |
|
| Proposal 1 reflects trust wide proposal and voting results. |

SELCON-ANN-0421
1.813633.116
Fidelity® Select Portfolios®
Energy Sector
Energy Portfolio
Energy Service Portfolio
Natural Gas Portfolio
Natural Resources Portfolio (to be renamed Fidelity Natural Resources Fund effective May 1, 2021)
Annual Report
February 28, 2021
Contents
To view a fund's proxy voting guidelines and proxy voting record for the 12-month period ended June 30, visit http://www.fidelity.com/proxyvotingresults or visit the Securities and Exchange Commission's (SEC) web site at http://www.sec.gov.
You may also call 1-800-544-8544 to request a free copy of the proxy voting guidelines.
Standard & Poor's, S&P and S&P 500 are registered service marks of The McGraw-Hill Companies, Inc. and have been licensed for use by Fidelity Distributors Corporation.
Other third-party marks appearing herein are the property of their respective owners.
All other marks appearing herein are registered or unregistered trademarks or service marks of FMR LLC or an affiliated company. © 2021 FMR LLC. All rights reserved.
This report and the financial statements contained herein are submitted for the general information of the shareholders of the Funds. This report is not authorized for distribution to prospective investors in the Funds unless preceded or accompanied by an effective prospectus.
A fund files its complete schedule of portfolio holdings with the SEC for the first and third quarters of each fiscal year on Form N-PORT. Forms N-PORT are available on the SEC’s web site at http://www.sec.gov. A fund's Forms N-PORT may be reviewed and copied at the SEC’s Public Reference Room in Washington, DC. Information regarding the operation of the SEC's Public Reference Room may be obtained by calling 1-800-SEC-0330.
For a complete list of a fund's portfolio holdings, view the most recent holdings listing, semiannual report, or annual report on Fidelity's web site at http://www.fidelity.com, http://www.institutional.fidelity.com, or http://www.401k.com, as applicable.
NOT FDIC INSURED •MAY LOSE VALUE •NO BANK GUARANTEE
Neither the Funds nor Fidelity Distributors Corporation is a bank.
Note to Shareholders:
Early in 2020, the outbreak and spread of a new coronavirus emerged as a public health emergency that had a major influence on financial markets, primarily based on its impact on the global economy and the outlook for corporate earnings. The virus causes a respiratory disease known as COVID-19. On March 11, 2020 the World Health Organization declared the COVID-19 outbreak a pandemic, citing sustained risk of further global spread.
In the weeks following, as the crisis worsened, we witnessed an escalating human tragedy with wide-scale social and economic consequences from coronavirus-containment measures. The outbreak of COVID-19 prompted a number of measures to limit the spread, including travel and border restrictions, quarantines, and restrictions on large gatherings. In turn, these resulted in lower consumer activity, diminished demand for a wide range of products and services, disruption in manufacturing and supply chains, and – given the wide variability in outcomes regarding the outbreak – significant market uncertainty and volatility. Amid the turmoil, global governments and central banks took unprecedented action to help support consumers, businesses, and the broader economies, and to limit disruption to financial systems.
The situation continues to unfold, and the extent and duration of its impact on financial markets and the economy remain highly uncertain. Extreme events such as the coronavirus crisis are “exogenous shocks” that can have significant adverse effects on mutual funds and their investments. Although multiple asset classes may be affected by market disruption, the duration and impact may not be the same for all types of assets.
Fidelity is committed to helping you stay informed amid news about COVID-19 and during increased market volatility, and we’re taking extra steps to be responsive to customer needs. We encourage you to visit our websites, where we offer ongoing updates, commentary, and analysis on the markets and our funds.
Energy Portfolio
Performance: The Bottom Line
Average annual total return reflects the change in the value of an investment, assuming reinvestment of distributions from dividend income and capital gains (the profits earned upon the sale of securities that have grown in value, if any) and assuming a constant rate of performance each year. The hypothetical investment and the average annual total returns do not reflect the deduction of taxes that a shareholder would pay on fund distributions or the redemption of fund shares. During periods of reimbursement by Fidelity, a fund’s total return will be greater than it would be had the reimbursement not occurred. How a fund did yesterday is no guarantee of how it will do tomorrow.
Average Annual Total Returns
| For the periods ended February 28, 2021 | Past 1 year | Past 5 years | Past 10 years |
| Energy Portfolio | 13.03% | (0.35)% | (3.79)% |
$10,000 Over 10 Years
Let's say hypothetically that $10,000 was invested in Energy Portfolio on February 28, 2011.
The chart shows how the value of your investment would have changed, and also shows how the S&P 500® Index performed over the same period.
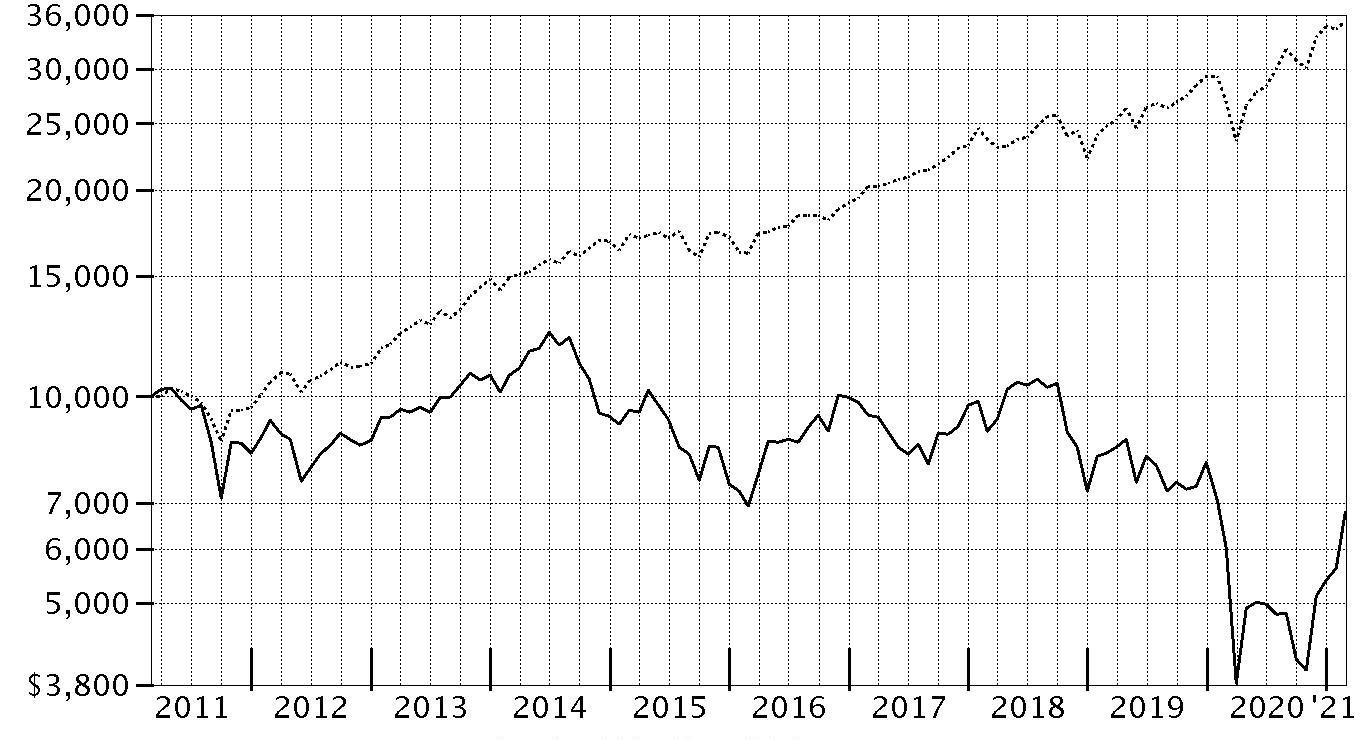
| Period Ending Values |
| $6,794 | Energy Portfolio |
| $35,259 | S&P 500® Index |
Energy Portfolio
Management's Discussion of Fund Performance
Market Recap: The S&P 500
® index gained 31.29% for the 12 months ending February 28, 2021, a volatile but productive period for U.S. risk assets. The early-2020 outbreak and spread of COVID-19 resulted in stocks suffering one of the quickest declines on record, through March 23, followed by a historic rebound that included the index closing 2020 at an all-time high and gaining modest ground in the first two months of the new year. The crisis and containment efforts caused broad contraction in economic activity, along with extreme uncertainty and dislocation in financial markets. A rapid and expansive U.S. monetary/fiscal-policy response partially offset the economic disruption and fueled the market surge, as did resilient corporate earnings. The rally slowed in September, when stocks began a two-month retreat amid Congress’s inability to reach a deal on additional fiscal stimulus, as well as concerns about election uncertainty, indications the U.S. economic recovery could be slowing and a new wave of COVID-19 cases. A shift in momentum began in October and accelerated following the U.S. elections, with the approval of three breakthrough COVID-19 vaccines and prospects for additional government stimulus fueling the “reflation trade” through February 28. By sector for the full 12 months, information technology (+50%) and consumer discretionary (+43%) led all gainers. Materials (+42%) and communication services (+37%) also stood out. In contrast, the defensive utilities (-3%) and real estate sectors (+5%) notably lagged.
Comments from Portfolio Manager Maurice FitzMaurice: For the fiscal year ending February 28, 2021, the fund gained 13.03%, trailing the 14.60% advance of the MSCI US IMI Energy 25/50 Index, as well as the broad-based S&P 500
® index. Versus the sector index, security selection was the primary detractor, especially within the integrated oil & gas group. Stock selection and an underweighting in the oil & gas exploration & production category, and security selection in independent power producers & energy traders, which is not part of the sector benchmark, also hurt. Our non-index stake in BP was the fund's largest individual relative detractor, due to its -16% result. This was among the fund's biggest holdings. Also hindering performance was an underweighting in Occidental Petroleum, which returned roughly -13%. We pared our stake in Occidental the past 12 months. The fund's non-index stake in Suncor Energy returned -26%. We added to our position in Suncor the past year. In contrast, the biggest contributor to performance versus the sector index was stock selection and an overweighting in the oil & gas storage & transportation group. Security selection in the oil & gas equipment & services segment also lifted the fund's relative performance. Not owning Kinder Morgan, an index component that returned -17%, was the biggest individual relative contributor. Also adding value was our overweighting in Baker Hughes, which gained roughly 60%. Although we pared our stake in Baker Hughes the past year, it was among the fund's largest holdings at period end. Avoiding ONEOK, an index component that returned about -25%, also helped relative performance. Notable changes in positioning include increased exposure to the oil & gas equipment & services industry and a lower allocation to oil & gas refining & marketing.
The views expressed above reflect those of the portfolio manager(s) only through the end of the period as stated on the cover of this report and do not necessarily represent the views of Fidelity or any other person in the Fidelity organization. Any such views are subject to change at any time based upon market or other conditions and Fidelity disclaims any responsibility to update such views. These views may not be relied on as investment advice and, because investment decisions for a Fidelity fund are based on numerous factors, may not be relied on as an indication of trading intent on behalf of any Fidelity fund.
Energy Portfolio
Investment Summary (Unaudited)
Top Ten Stocks as of February 28, 2021
| | % of fund's net assets |
| Chevron Corp. | 12.7 |
| Exxon Mobil Corp. | 12.2 |
| BP PLC sponsored ADR | 5.4 |
| Cheniere Energy, Inc. | 4.9 |
| Pioneer Natural Resources Co. | 4.8 |
| Royal Dutch Shell PLC Class B sponsored ADR | 4.0 |
| ConocoPhillips Co. | 3.8 |
| EOG Resources, Inc. | 3.8 |
| Marathon Petroleum Corp. | 3.7 |
| Valero Energy Corp. | 3.4 |
| | 58.7 |
Top Industries (% of fund's net assets)
| As of February 28, 2021 |
| | Oil, Gas & Consumable Fuels | 84.7% |
| | Energy Equipment & Services | 11.1% |
| | Independent Power and Renewable Electricity Producers | 2.0% |
| | Food Products | 0.5% |
| | All Others* | 1.7% |

* Includes short-term investments and net other assets (liabilities).
Energy Portfolio
Schedule of Investments February 28, 2021
Showing Percentage of Net Assets
| Common Stocks - 98.3% | | | |
| | | Shares | Value |
| Energy Equipment & Services - 11.1% | | | |
| Oil & Gas Drilling - 1.1% | | | |
| Nabors Industries Ltd. | | 34,558 | $3,836,284 |
| Odfjell Drilling Ltd. (a) | | 1,835,680 | 4,562,418 |
| Patterson-UTI Energy, Inc. | | 200,700 | 1,485,180 |
| Shelf Drilling Ltd. (a)(b) | | 1,474,713 | 761,967 |
| | | | 10,645,849 |
| Oil & Gas Equipment & Services - 10.0% | | | |
| Baker Hughes Co. Class A | | 1,184,640 | 28,999,987 |
| Cactus, Inc. | | 97,400 | 3,104,138 |
| Championx Corp. (a) | | 272,000 | 5,785,440 |
| Nextier Oilfield Solutions, Inc. (a) | | 1,811,600 | 8,423,940 |
| Oceaneering International, Inc. (a) | | 465,200 | 5,489,360 |
| ProPetro Holding Corp. (a) | | 1,053,700 | 12,085,939 |
| RigNet, Inc. (a) | | 221,801 | 2,056,095 |
| Schlumberger Ltd. | | 472,158 | 13,177,930 |
| Technip Energies NV (a) | | 361,380 | 4,658,906 |
| TechnipFMC PLC | | 1,709,100 | 14,048,802 |
| | | | 97,830,537 |
|
| TOTAL ENERGY EQUIPMENT & SERVICES | | | 108,476,386 |
|
| Food Products - 0.5% | | | |
| Agricultural Products - 0.5% | | | |
| Darling Ingredients, Inc. (a) | | 84,900 | 5,352,096 |
| Independent Power and Renewable Electricity Producers - 2.0% | | | |
| Independent Power Producers & Energy Traders - 2.0% | | | |
| The AES Corp. | | 69,500 | 1,845,920 |
| Vistra Corp. | | 1,007,900 | 17,386,275 |
| | | | 19,232,195 |
| Oil, Gas & Consumable Fuels - 84.7% | | | |
| Coal & Consumable Fuels - 0.2% | | | |
| Enviva Partners LP | | 38,700 | 2,052,261 |
| Integrated Oil & Gas - 38.9% | | | |
| BP PLC sponsored ADR | | 2,167,000 | 52,896,470 |
| Chevron Corp. | | 1,243,390 | 124,339,000 |
| Exxon Mobil Corp. | | 2,204,448 | 119,855,838 |
| Occidental Petroleum Corp. | | 560,200 | 14,906,922 |
| Occidental Petroleum Corp. warrants 8/3/27 (a) | | 63,600 | 763,200 |
| Royal Dutch Shell PLC Class B sponsored ADR | | 1,011,900 | 39,342,672 |
| Suncor Energy, Inc. | | 891,600 | 17,704,488 |
| Total SA sponsored ADR | | 252,800 | 11,729,920 |
| | | | 381,538,510 |
| Oil & Gas Exploration & Production - 26.9% | | | |
| Apache Corp. | | 1,226,900 | 24,206,737 |
| Callon Petroleum Co. (a)(c) | | 76,900 | 1,966,333 |
| Canadian Natural Resources Ltd. | | 755,200 | 20,597,982 |
| Cimarex Energy Co. | | 270,000 | 15,657,300 |
| ConocoPhillips Co. | | 722,066 | 37,554,653 |
| Devon Energy Corp. | | 1,009,300 | 21,740,322 |
| EOG Resources, Inc. | | 577,464 | 37,281,076 |
| Hess Corp. | | 236,900 | 15,524,057 |
| Magnolia Oil & Gas Corp. Class A (a) | | 429,800 | 5,183,388 |
| National Energy Services Reunited Corp. (a) | | 910,200 | 12,060,150 |
| Northern Oil & Gas, Inc. (a) | | 148,460 | 1,971,549 |
| PDC Energy, Inc. (a) | | 547,151 | 19,122,927 |
| Pioneer Natural Resources Co. | | 318,666 | 47,344,208 |
| Viper Energy Partners LP | | 225,159 | 3,530,493 |
| | | | 263,741,175 |
| Oil & Gas Refining & Marketing - 9.9% | | | |
| Marathon Petroleum Corp. | | 665,192 | 36,332,787 |
| Phillips 66 Co. | | 286,373 | 23,783,278 |
| Renewable Energy Group, Inc. (a) | | 43,100 | 3,351,887 |
| Valero Energy Corp. | | 433,100 | 33,340,038 |
| | | | 96,807,990 |
| Oil & Gas Storage & Transport - 8.8% | | | |
| Cheniere Energy, Inc. (a) | | 709,500 | 47,813,205 |
| Enterprise Products Partners LP | | 428,600 | 9,137,752 |
| Golar LNG Ltd. (a) | | 405,700 | 4,580,353 |
| Noble Midstream Partners LP | | 307,314 | 4,302,396 |
| Teekay LNG Partners LP | | 354,500 | 4,789,295 |
| The Williams Companies, Inc. | | 711,300 | 16,246,092 |
| | | | 86,869,093 |
|
| TOTAL OIL, GAS & CONSUMABLE FUELS | | | 831,009,029 |
|
| TOTAL COMMON STOCKS | | | |
| (Cost $860,977,307) | | | 964,069,706 |
|
| Money Market Funds - 1.5% | | | |
| Fidelity Cash Central Fund 0.07% (d) | | 14,450,080 | 14,452,970 |
| Fidelity Securities Lending Cash Central Fund 0.08% (d)(e) | | 559,677 | 559,733 |
| TOTAL MONEY MARKET FUNDS | | | |
| (Cost $15,012,703) | | | 15,012,703 |
| TOTAL INVESTMENT IN SECURITIES - 99.8% | | | |
| (Cost $875,990,010) | | | 979,082,409 |
| NET OTHER ASSETS (LIABILITIES) - 0.2% | | | 1,561,237 |
| NET ASSETS - 100% | | | $980,643,646 |
Legend
(a) Non-income producing
(b) Security exempt from registration under Rule 144A of the Securities Act of 1933. These securities may be resold in transactions exempt from registration, normally to qualified institutional buyers. At the end of the period, the value of these securities amounted to $761,967 or 0.1% of net assets.
(c) Security or a portion of the security is on loan at period end.
(d) Affiliated fund that is generally available only to investment companies and other accounts managed by Fidelity Investments. The rate quoted is the annualized seven-day yield of the fund at period end. A complete unaudited listing of the fund's holdings as of its most recent quarter end is available upon request. In addition, each Fidelity Central Fund's financial statements, which are not covered by the Fund's Report of Independent Registered Public Accounting Firm, are available on the SEC's website or upon request.
(e) Investment made with cash collateral received from securities on loan.
Affiliated Central Funds
Information regarding fiscal year to date income earned by the Fund from investments in Fidelity Central Funds is as follows:
| Fund | Income earned |
| Fidelity Cash Central Fund | $12,873 |
| Fidelity Securities Lending Cash Central Fund | 64,694 |
| Total | $77,567 |
Amounts in the income column in the above table include any capital gain distributions from underlying funds, which are presented in the corresponding line-item in the Statement of Operations, if applicable. Amount for Fidelity Securities Lending Cash Central Fund represents the income earned on investing cash collateral, less rebates paid to borrowers and any lending agent fees associated with the loan, plus any premium payments received for lending certain types of securities.
Investment Valuation
The following is a summary of the inputs used, as of February 28, 2021, involving the Fund's assets and liabilities carried at fair value. The inputs or methodology used for valuing securities may not be an indication of the risk associated with investing in those securities. For more information on valuation inputs, and their aggregation into the levels used below, please refer to the Investment Valuation section in the accompanying Notes to Financial Statements.
| | Valuation Inputs at Reporting Date: |
| Description | Total | Level 1 | Level 2 | Level 3 |
| Investments in Securities: | | | | |
| Common Stocks | $964,069,706 | $964,069,706 | $-- | $-- |
| Money Market Funds | 15,012,703 | 15,012,703 | -- | -- |
| Total Investments in Securities: | $979,082,409 | $979,082,409 | $-- | $-- |
Other Information
Distribution of investments by country or territory of incorporation, as a percentage of Total Net Assets, is as follows (Unaudited):
| United States of America | 79.1% |
| United Kingdom | 10.8% |
| Canada | 3.9% |
| Bermuda | 1.4% |
| Curacao | 1.3% |
| British Virgin Islands | 1.2% |
| France | 1.2% |
| Others (Individually Less Than 1%) | 1.1% |
| | 100.0% |
See accompanying notes which are an integral part of the financial statements.
Energy Portfolio
Financial Statements
Statement of Assets and Liabilities
| | | February 28, 2021 |
| Assets | | |
Investment in securities, at value (including securities loaned of $544,641) — See accompanying schedule:
Unaffiliated issuers (cost $860,977,307) | $964,069,706 | |
| Fidelity Central Funds (cost $15,012,703) | 15,012,703 | |
| Total Investment in Securities (cost $875,990,010) | | $979,082,409 |
| Receivable for fund shares sold | | 9,336,721 |
| Dividends receivable | | 5,983,149 |
| Distributions receivable from Fidelity Central Funds | | 1,035 |
| Prepaid expenses | | 9,542 |
| Other receivables | | 282,803 |
| Total assets | | 994,695,659 |
| Liabilities | | |
| Payable for investments purchased | $10,451,828 | |
| Payable for fund shares redeemed | 2,209,256 | |
| Accrued management fee | 390,825 | |
| Other affiliated payables | 178,084 | |
| Other payables and accrued expenses | 262,895 | |
| Collateral on securities loaned | 559,125 | |
| Total liabilities | | 14,052,013 |
| Net Assets | | $980,643,646 |
| Net Assets consist of: | | |
| Paid in capital | | $1,435,094,357 |
| Total accumulated earnings (loss) | | (454,450,711) |
| Net Assets | | $980,643,646 |
| Net Asset Value, offering price and redemption price per share ($980,643,646 ÷ 33,524,698 shares) | | $29.25 |
See accompanying notes which are an integral part of the financial statements.
Statement of Operations
| | | Year ended February 28, 2021 |
| Investment Income | | |
| Dividends | | $31,979,834 |
| Non-Cash dividends | | 4,672,519 |
| Income from Fidelity Central Funds (including $64,694 from security lending) | | 77,567 |
| Total income | | 36,729,920 |
| Expenses | | |
| Management fee | $3,657,903 | |
| Transfer agent fees | 1,745,226 | |
| Accounting fees | 246,864 | |
| Custodian fees and expenses | 10,039 | |
| Independent trustees' fees and expenses | 3,817 | |
| Registration fees | 76,538 | |
| Audit | 57,502 | |
| Legal | 1,392 | |
| Interest | 164 | |
| Miscellaneous | 29,105 | |
| Total expenses before reductions | 5,828,550 | |
| Expense reductions | (72,787) | |
| Total expenses after reductions | | 5,755,763 |
| Net investment income (loss) | | 30,974,157 |
| Realized and Unrealized Gain (Loss) | | |
| Net realized gain (loss) on: | | |
| Investment securities: | | |
| Unaffiliated issuers | (142,962,502) | |
| Fidelity Central Funds | (601) | |
| Foreign currency transactions | (5,495) | |
| Total net realized gain (loss) | | (142,968,598) |
| Change in net unrealized appreciation (depreciation) on: | | |
| Investment securities: | | |
| Unaffiliated issuers | 269,518,298 | |
| Assets and liabilities in foreign currencies | (1,730) | |
| Total change in net unrealized appreciation (depreciation) | | 269,516,568 |
| Net gain (loss) | | 126,547,970 |
| Net increase (decrease) in net assets resulting from operations | | $157,522,127 |
See accompanying notes which are an integral part of the financial statements.
Statement of Changes in Net Assets
| | Year ended February 28, 2021 | Year ended February 29, 2020 |
| Increase (Decrease) in Net Assets | | |
| Operations | | |
| Net investment income (loss) | $30,974,157 | $19,564,546 |
| Net realized gain (loss) | (142,968,598) | (47,026,999) |
| Change in net unrealized appreciation (depreciation) | 269,516,568 | (239,088,970) |
| Net increase (decrease) in net assets resulting from operations | 157,522,127 | (266,551,423) |
| Distributions to shareholders | (24,866,401) | (17,018,375) |
| Share transactions | | |
| Proceeds from sales of shares | 546,805,883 | 208,781,170 |
| Reinvestment of distributions | 23,686,159 | 16,049,946 |
| Cost of shares redeemed | (398,816,396) | (417,122,444) |
| Net increase (decrease) in net assets resulting from share transactions | 171,675,646 | (192,291,328) |
| Total increase (decrease) in net assets | 304,331,372 | (475,861,126) |
| Net Assets | | |
| Beginning of period | 676,312,274 | 1,152,173,400 |
| End of period | $980,643,646 | $676,312,274 |
| Other Information | | |
| Shares | | |
| Sold | 25,409,225 | 6,071,489 |
| Issued in reinvestment of distributions | 1,036,348 | 450,411 |
| Redeemed | (18,168,636) | (12,000,042) |
| Net increase (decrease) | 8,276,937 | (5,478,142) |
See accompanying notes which are an integral part of the financial statements.
Financial Highlights
Energy Portfolio
| | | | | | |
| Years ended February 28, | 2021 | 2020 A | 2019 | 2018 | 2017 |
| Selected Per–Share Data | | | | | |
| Net asset value, beginning of period | $26.79 | $37.50 | $41.01 | $44.10 | $32.63 |
| Income from Investment Operations | | | | | |
| Net investment income (loss)B | .99C | .71 | .49 | .75D | .18 |
| Net realized and unrealized gain (loss) | 2.27 | (10.76) | (3.51) | (3.06) | 11.58 |
| Total from investment operations | 3.26 | (10.05) | (3.02) | (2.31) | 11.76 |
| Distributions from net investment income | (.80) | (.64) | (.48) | (.68) | (.24) |
| Distributions from net realized gain | – | (.02) | (.01) | (.10) | (.05) |
| Total distributions | (.80) | (.66) | (.49) | (.78) | (.29) |
| Redemption fees added to paid in capitalB | – | – | – | – | –E |
| Net asset value, end of period | $29.25 | $26.79 | $37.50 | $41.01 | $44.10 |
| Total ReturnF | 13.03% | (27.24)% | (7.30)% | (5.27)% | 36.05% |
| Ratios to Average Net AssetsG,H | | | | | |
| Expenses before reductions | .85% | .81% | .78% | .79% | .79% |
| Expenses net of fee waivers, if any | .85% | .81% | .78% | .79% | .79% |
| Expenses net of all reductions | .84% | .80% | .77% | .78% | .78% |
| Net investment income (loss) | 4.50%C | 2.00% | 1.12% | 1.82%D | .44% |
| Supplemental Data | | | | | |
| Net assets, end of period (000 omitted) | $980,644 | $676,312 | $1,152,173 | $1,778,436 | $2,289,350 |
| Portfolio turnover rateI | 31% | 79%J | 59%J | 59% | 93%J |
A For the year ended February 29.
B Calculated based on average shares outstanding during the period.
C Net investment income per share reflects one or more large, non-recurring dividend which amounted to $.15 per share. Excluding such non-recurring dividend, the ratio of net investment income (loss) to average net assets would have been 3.82%.
D Net investment income per share reflects one or more large, non-recurring dividend which amounted to $.48 per share. Excluding such non-recurring dividend, the ratio of net investment income (loss) to average net assets would have been .66%.
E Amount represents less than $.005 per share.
F Total returns would have been lower if certain expenses had not been reduced during the applicable periods shown.
G Fees and expenses of any underlying mutual funds or exchange-traded funds (ETFs) are not included in the Fund's expense ratio. The Fund indirectly bears its proportionate share of these expenses. For additional expense information related to investments in Fidelity Central Funds, please refer to the "Investments in Fidelity Central Funds" note found in the Notes to Financial Statements section of the most recent Annual or Semi-Annual report.
H Expense ratios reflect operating expenses of the class. Expenses before reductions do not reflect amounts reimbursed, waived, or reduced through arrangements with the investment advisor, brokerage services, or other offset arrangements, if applicable, and do not represent the amount paid by the class during periods when reimbursements, waivers or reductions occur.
I Amount does not include the portfolio activity of any underlying mutual funds or exchange-traded funds (ETFs).
J Portfolio turnover rate excludes securities received or delivered in-kind.
See accompanying notes which are an integral part of the financial statements.
Energy Service Portfolio
Performance: The Bottom Line
Average annual total return reflects the change in the value of an investment, assuming reinvestment of distributions from dividend income and capital gains (the profits earned upon the sale of securities that have grown in value, if any) and assuming a constant rate of performance each year. The hypothetical investment and the average annual total returns do not reflect the deduction of taxes that a shareholder would pay on fund distributions or the redemption of fund shares. During periods of reimbursement by Fidelity, a fund’s total return will be greater than it would be had the reimbursement not occurred. How a fund did yesterday is no guarantee of how it will do tomorrow.
Average Annual Total Returns
| For the periods ended February 28, 2021 | Past 1 year | Past 5 years | Past 10 years |
| Energy Service Portfolio | 17.85% | (9.63)% | (11.20)% |
$10,000 Over 10 Years
Let's say hypothetically that $10,000 was invested in Energy Service Portfolio on February 28, 2011.
The chart shows how the value of your investment would have changed, and also shows how the S&P 500® Index performed over the same period.
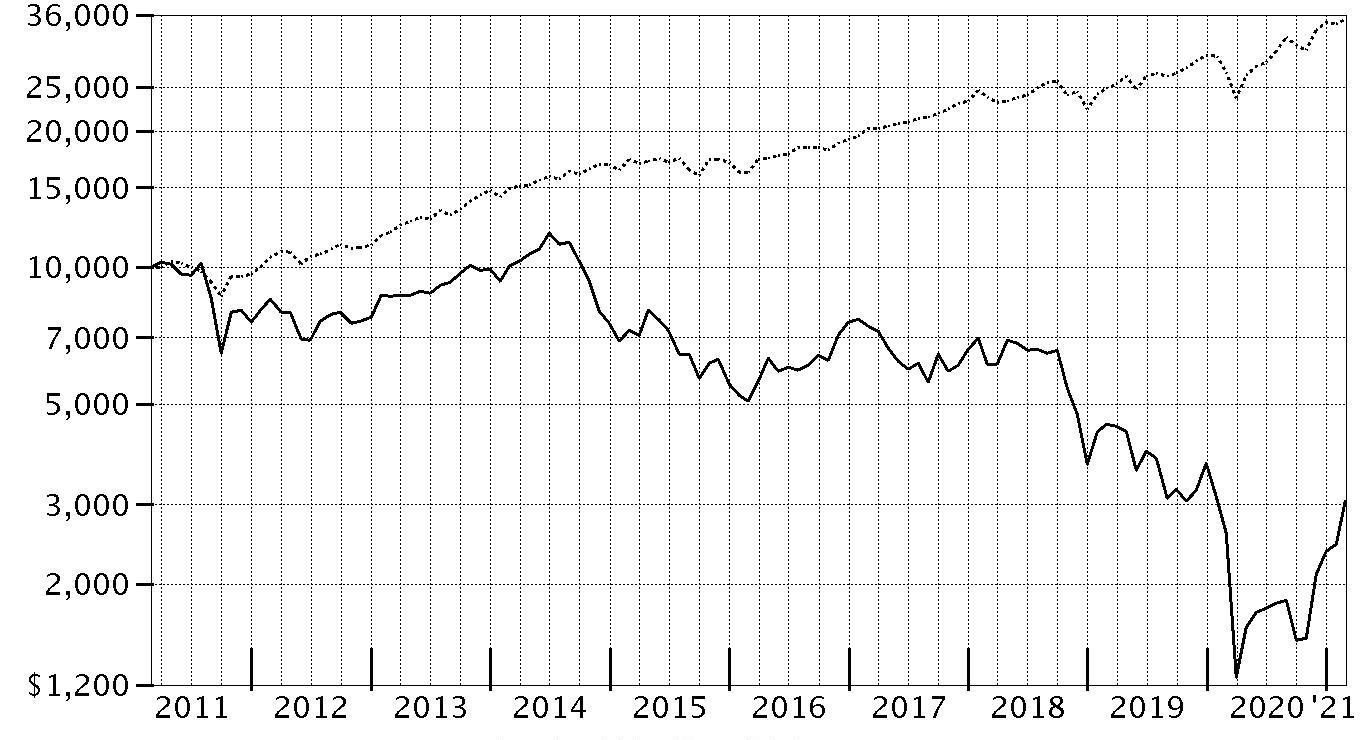
| Period Ending Values |
| $3,048 | Energy Service Portfolio |
| $35,259 | S&P 500® Index |
Energy Service Portfolio
Management's Discussion of Fund Performance
Market Recap: The S&P 500
® index gained 31.29% for the 12 months ending February 28, 2021, a volatile but productive period for U.S. risk assets. The early-2020 outbreak and spread of COVID-19 resulted in stocks suffering one of the quickest declines on record, through March 23, followed by a historic rebound that included the index closing 2020 at an all-time high and gaining modest ground in the first two months of the new year. The crisis and containment efforts caused broad contraction in economic activity, along with extreme uncertainty and dislocation in financial markets. A rapid and expansive U.S. monetary/fiscal-policy response partially offset the economic disruption and fueled the market surge, as did resilient corporate earnings. The rally slowed in September, when stocks began a two-month retreat amid Congress’s inability to reach a deal on additional fiscal stimulus, as well as concerns about election uncertainty, indications the U.S. economic recovery could be slowing and a new wave of COVID-19 cases. A shift in momentum began in October and accelerated following the U.S. elections, with the approval of three breakthrough COVID-19 vaccines and prospects for additional government stimulus fueling the “reflation trade” through February 28. By sector for the full 12 months, information technology (+50%) and consumer discretionary (+43%) led all gainers. Materials (+42%) and communication services (+37%) also stood out. In contrast, the defensive utilities (-3%) and real estate sectors (+5%) notably lagged.
Comments from Portfolio Manager Maurice FitzMaurice: For the fiscal year ending February 28, 2021, the fund gained 17.85%, outperforming the 14.58% gain of the MSCI US IMI Energy Equipment & Service 25/50 Index, but underperforming the broad-based S&P 500
® index. The primary contributor to performance versus the industry index was our stock picks in oil & gas storage & transportation. An overweighting in oil & gas drilling and stock selection in oil & gas equipment & services also boosted the fund's relative result. Our top individual relative contributor was an out-of-index stake in National Energy Services Reunited (+60%), which was among our biggest holdings. Also adding value was our outsized stake in Baker Hughes, which gained 59%. Baker Hughes was among the fund's largest holdings. Another key contributor was our out-of-index position in Cheniere Energy. This was among the fund's biggest holdings the past 12 months, even though we pared our stake. Conversely, the largest detractor from performance versus the industry index was our security selection in oil & gas drilling. An underweighting in oil & gas equipment & services and stock picks in the marine segment also hurt the fund's relative result. Our largest individual detractor versus the industry index was an out-of-index stake in Shelf Drilling (-70%). Another notable relative detractor was our lighter-than-index stake in Halliburton (+31%). The company was among our biggest holdings. Also hurting performance was our underweighting in U.S. Silica Holdings, which gained 195%. U.S. Silica Holdings was not held at period end
The views expressed above reflect those of the portfolio manager(s) only through the end of the period as stated on the cover of this report and do not necessarily represent the views of Fidelity or any other person in the Fidelity organization. Any such views are subject to change at any time based upon market or other conditions and Fidelity disclaims any responsibility to update such views. These views may not be relied on as investment advice and, because investment decisions for a Fidelity fund are based on numerous factors, may not be relied on as an indication of trading intent on behalf of any Fidelity fund.
Energy Service Portfolio
Investment Summary (Unaudited)
Top Ten Stocks as of February 28, 2021
| | % of fund's net assets |
| Schlumberger Ltd. | 16.1 |
| Baker Hughes Co. Class A | 12.0 |
| Halliburton Co. | 5.7 |
| Championx Corp. | 5.4 |
| TechnipFMC PLC | 4.8 |
| Cactus, Inc. | 4.5 |
| ProPetro Holding Corp. | 4.4 |
| Oceaneering International, Inc. | 4.2 |
| National Energy Services Reunited Corp. | 4.1 |
| Nextier Oilfield Solutions, Inc. | 3.7 |
| | 64.9 |
Top Industries (% of fund's net assets)
| As of February 28, 2021 |
| | Energy Equipment & Services | 91.0% |
| | Oil, Gas & Consumable Fuels | 6.3% |
| | All Others* | 2.7% |

* Includes short-term investments and net other assets (liabilities).
Energy Service Portfolio
Schedule of Investments February 28, 2021
Showing Percentage of Net Assets
| Common Stocks - 97.3% | | | |
| | | Shares | Value |
| Energy Equipment & Services - 91.0% | | | |
| Oil & Gas Drilling - 13.3% | | | |
| Borr Drilling Ltd. (a)(b) | | 95,212 | $109,920 |
| Helmerich & Payne, Inc. | | 263,198 | 7,561,679 |
| Independence Contract Drilling, Inc. (a)(b) | | 47,362 | 296,960 |
| Nabors Industries Ltd. | | 66,641 | 7,397,817 |
| Odfjell Drilling Ltd. (a) | | 2,912,282 | 7,238,216 |
| Patterson-UTI Energy, Inc. | | 1,011,190 | 7,482,806 |
| Shelf Drilling Ltd. (a)(c) | | 3,143,876 | 1,624,405 |
| Transocean Ltd. (United States) (a)(b) | | 1,986,200 | 6,892,114 |
| | | | 38,603,917 |
| Oil & Gas Equipment & Services - 77.7% | | | |
| Archrock, Inc. | | 477,416 | 4,922,159 |
| Baker Hughes Co. Class A | | 1,416,638 | 34,679,298 |
| Cactus, Inc. | | 411,386 | 13,110,872 |
| Championx Corp. (a) | | 733,048 | 15,591,931 |
| Core Laboratories NV (b) | | 99,000 | 3,518,460 |
| CSI Compressco LP | | 665,757 | 1,291,569 |
| Dril-Quip, Inc. (a) | | 169,800 | 5,766,408 |
| Forum Energy Technologies, Inc. (a)(b) | | 15,304 | 326,740 |
| Frank's International NV (a) | | 620,483 | 2,810,788 |
| Halliburton Co. | | 756,292 | 16,509,854 |
| Helix Energy Solutions Group, Inc. (a) | | 1,112,729 | 5,452,372 |
| Liberty Oilfield Services, Inc. Class A | | 237,900 | 2,781,051 |
| Nextier Oilfield Solutions, Inc. (a) | | 2,305,000 | 10,718,250 |
| NOV, Inc. | | 309,700 | 4,676,470 |
| Oceaneering International, Inc. (a) | | 1,027,925 | 12,129,515 |
| Oil States International, Inc. (a) | | 308,225 | 2,259,289 |
| ProPetro Holding Corp. (a) | | 1,107,800 | 12,706,466 |
| Ranger Energy Services, Inc. Class A (a) | | 671,187 | 3,698,240 |
| RigNet, Inc. (a) | | 110,835 | 1,027,440 |
| Schlumberger Ltd. | | 1,668,111 | 46,556,977 |
| SEACOR Marine Holdings, Inc. (a) | | 100 | 396 |
| Smart Sand, Inc. (a)(b) | | 190,890 | 622,301 |
| Solaris Oilfield Infrastructure, Inc. Class A | | 138,000 | 1,629,780 |
| Technip Energies NV (a) | | 315,854 | 4,071,986 |
| TechnipFMC PLC | | 1,681,872 | 13,824,988 |
| Tenaris SA sponsored ADR | | 68,900 | 1,443,455 |
| TETRA Technologies, Inc. (a) | | 940,622 | 2,351,555 |
| TETRA Technologies, Inc. warrants 12/14/21 (a) | | 300,100 | 6,065 |
| Weatherford International PLC (a) | | 1,499 | 17,538 |
| | | | 224,502,213 |
|
| TOTAL ENERGY EQUIPMENT & SERVICES | | | 263,106,130 |
|
| Oil, Gas & Consumable Fuels - 6.3% | | | |
| Oil & Gas Exploration & Production - 4.1% | | | |
| National Energy Services Reunited Corp. (a)(b) | | 896,374 | 11,876,956 |
| Oil & Gas Storage & Transport - 2.2% | | | |
| Cheniere Energy, Inc. (a) | | 82,812 | 5,580,701 |
| Golar LNG Ltd. (a) | | 60,033 | 677,773 |
| | | | 6,258,474 |
|
| TOTAL OIL, GAS & CONSUMABLE FUELS | | | 18,135,430 |
|
| TOTAL COMMON STOCKS | | | |
| (Cost $293,491,617) | | | 281,241,560 |
|
| Money Market Funds - 5.0% | | | |
| Fidelity Cash Central Fund 0.07% (d) | | 4,415,235 | 4,416,118 |
| Fidelity Securities Lending Cash Central Fund 0.08% (d)(e) | | 9,890,922 | 9,891,911 |
| TOTAL MONEY MARKET FUNDS | | | |
| (Cost $14,307,911) | | | 14,308,029 |
| TOTAL INVESTMENT IN SECURITIES - 102.3% | | | |
| (Cost $307,799,528) | | | 295,549,589 |
| NET OTHER ASSETS (LIABILITIES) - (2.3)% | | | (6,631,294) |
| NET ASSETS - 100% | | | $288,918,295 |
Legend
(a) Non-income producing
(b) Security or a portion of the security is on loan at period end.
(c) Security exempt from registration under Rule 144A of the Securities Act of 1933. These securities may be resold in transactions exempt from registration, normally to qualified institutional buyers. At the end of the period, the value of these securities amounted to $1,624,405 or 0.6% of net assets.
(d) Affiliated fund that is generally available only to investment companies and other accounts managed by Fidelity Investments. The rate quoted is the annualized seven-day yield of the fund at period end. A complete unaudited listing of the fund's holdings as of its most recent quarter end is available upon request. In addition, each Fidelity Central Fund's financial statements, which are not covered by the Fund's Report of Independent Registered Public Accounting Firm, are available on the SEC's website or upon request.
(e) Investment made with cash collateral received from securities on loan.
Affiliated Central Funds
Information regarding fiscal year to date income earned by the Fund from investments in Fidelity Central Funds is as follows:
| Fund | Income earned |
| Fidelity Cash Central Fund | $4,808 |
| Fidelity Securities Lending Cash Central Fund | 123,522 |
| Total | $128,330 |
Amounts in the income column in the above table include any capital gain distributions from underlying funds, which are presented in the corresponding line-item in the Statement of Operations, if applicable. Amount for Fidelity Securities Lending Cash Central Fund represents the income earned on investing cash collateral, less rebates paid to borrowers and any lending agent fees associated with the loan, plus any premium payments received for lending certain types of securities.
Investment Valuation
The following is a summary of the inputs used, as of February 28, 2021, involving the Fund's assets and liabilities carried at fair value. The inputs or methodology used for valuing securities may not be an indication of the risk associated with investing in those securities. For more information on valuation inputs, and their aggregation into the levels used below, please refer to the Investment Valuation section in the accompanying Notes to Financial Statements.
| | Valuation Inputs at Reporting Date: |
| Description | Total | Level 1 | Level 2 | Level 3 |
| Investments in Securities: | | | | |
| Common Stocks | $281,241,560 | $281,235,495 | $6,065 | $-- |
| Money Market Funds | 14,308,029 | 14,308,029 | -- | -- |
| Total Investments in Securities: | $295,549,589 | $295,543,524 | $6,065 | $-- |
Other Information
Distribution of investments by country or territory of incorporation, as a percentage of Total Net Assets, is as follows (Unaudited):
| United States of America | 62.6% |
| Curacao | 16.1% |
| Bermuda | 5.3% |
| United Kingdom | 4.8% |
| British Virgin Islands | 4.1% |
| Netherlands | 3.6% |
| Switzerland | 2.4% |
| Others (Individually Less Than 1%) | 1.1% |
| | 100.0% |
See accompanying notes which are an integral part of the financial statements.
Energy Service Portfolio
Financial Statements
Statement of Assets and Liabilities
| | | February 28, 2021 |
| Assets | | |
Investment in securities, at value (including securities loaned of $9,329,941) — See accompanying schedule:
Unaffiliated issuers (cost $293,491,617) | $281,241,560 | |
| Fidelity Central Funds (cost $14,307,911) | 14,308,029 | |
| Total Investment in Securities (cost $307,799,528) | | $295,549,589 |
| Receivable for fund shares sold | | 4,041,550 |
| Dividends receivable | | 305,425 |
| Distributions receivable from Fidelity Central Funds | | 2,802 |
| Prepaid expenses | | 2,205 |
| Other receivables | | 76,165 |
| Total assets | | 299,977,736 |
| Liabilities | | |
| Payable for fund shares redeemed | $888,295 | |
| Accrued management fee | 111,386 | |
| Other affiliated payables | 56,614 | |
| Other payables and accrued expenses | 110,618 | |
| Collateral on securities loaned | 9,892,528 | |
| Total liabilities | | 11,059,441 |
| Net Assets | | $288,918,295 |
| Net Assets consist of: | | |
| Paid in capital | | $618,102,295 |
| Total accumulated earnings (loss) | | (329,184,000) |
| Net Assets | | $288,918,295 |
| Net Asset Value, offering price and redemption price per share ($288,918,295 ÷ 14,520,112 shares) | | $19.90 |
See accompanying notes which are an integral part of the financial statements.
Statement of Operations
| | | Year ended February 28, 2021 |
| Investment Income | | |
| Dividends | | $2,969,671 |
| Non-Cash dividends | | 4,590,748 |
| Income from Fidelity Central Funds (including $123,522 from security lending) | | 128,330 |
| Total income | | 7,688,749 |
| Expenses | | |
| Management fee | $853,865 | |
| Transfer agent fees | 429,239 | |
| Accounting fees | 62,730 | |
| Custodian fees and expenses | 8,013 | |
| Independent trustees' fees and expenses | 850 | |
| Registration fees | 42,042 | |
| Audit | 46,575 | |
| Legal | 740 | |
| Miscellaneous | 8,432 | |
| Total expenses before reductions | 1,452,486 | |
| Expense reductions | (25,435) | |
| Total expenses after reductions | | 1,427,051 |
| Net investment income (loss) | | 6,261,698 |
| Realized and Unrealized Gain (Loss) | | |
| Net realized gain (loss) on: | | |
| Investment securities: | | |
| Unaffiliated issuers | (75,413,684) | |
| Fidelity Central Funds | 23 | |
| Foreign currency transactions | 5,337 | |
| Total net realized gain (loss) | | (75,408,324) |
| Change in net unrealized appreciation (depreciation) on: | | |
| Investment securities: | | |
| Unaffiliated issuers | 127,563,316 | |
| Assets and liabilities in foreign currencies | 563 | |
| Total change in net unrealized appreciation (depreciation) | | 127,563,879 |
| Net gain (loss) | | 52,155,555 |
| Net increase (decrease) in net assets resulting from operations | | $58,417,253 |
See accompanying notes which are an integral part of the financial statements.
Statement of Changes in Net Assets
| | Year ended February 28, 2021 | Year ended February 29, 2020 |
| Increase (Decrease) in Net Assets | | |
| Operations | | |
| Net investment income (loss) | $6,261,698 | $3,142,678 |
| Net realized gain (loss) | (75,408,324) | (94,157,598) |
| Change in net unrealized appreciation (depreciation) | 127,563,879 | (34,954,625) |
| Net increase (decrease) in net assets resulting from operations | 58,417,253 | (125,969,545) |
| Distributions to shareholders | (3,350,025) | (4,506,594) |
| Share transactions | | |
| Proceeds from sales of shares | 211,693,911 | 134,993,891 |
| Reinvestment of distributions | 3,185,845 | 4,269,353 |
| Cost of shares redeemed | (140,158,256) | (153,007,034) |
| Net increase (decrease) in net assets resulting from share transactions | 74,721,500 | (13,743,790) |
| Total increase (decrease) in net assets | 129,788,728 | (144,219,929) |
| Net Assets | | |
| Beginning of period | 159,129,567 | 303,349,496 |
| End of period | $288,918,295 | $159,129,567 |
| Other Information | | |
| Shares | | |
| Sold | 16,108,333 | 5,361,676 |
| Issued in reinvestment of distributions | 227,132 | 176,201 |
| Redeemed | (11,057,541) | (6,204,797) |
| Net increase (decrease) | 5,277,924 | (666,920) |
See accompanying notes which are an integral part of the financial statements.
Financial Highlights
Energy Service Portfolio
| | | | | | |
| Years ended February 28, | 2021 | 2020 A | 2019 | 2018 | 2017 |
| Selected Per–Share Data | | | | | |
| Net asset value, beginning of period | $17.22 | $30.61 | $42.04 | $54.70 | $37.54 |
| Income from Investment Operations | | | | | |
| Net investment income (loss)B | .50C | .34 | .26 | 1.41D | .17 |
| Net realized and unrealized gain (loss) | 2.45 | (13.21) | (11.37) | (10.86) | 17.22 |
| Total from investment operations | 2.95 | (12.87) | (11.11) | (9.45) | 17.39 |
| Distributions from net investment income | (.27) | (.52) | (.32) | (1.77) | (.23) |
| Distributions from net realized gain | – | – | – | (1.43) | – |
| Total distributions | (.27) | (.52) | (.32) | (3.21)E | (.23) |
| Redemption fees added to paid in capitalB | – | – | – | –F | –F |
| Net asset value, end of period | $19.90 | $17.22 | $30.61 | $42.04 | $54.70 |
| Total ReturnG | 17.85% | (42.54)% | (26.36)% | (17.41)% | 46.36% |
| Ratios to Average Net AssetsH,I | | | | | |
| Expenses before reductions | .91% | .90% | .84% | .84% | .85% |
| Expenses net of fee waivers, if any | .91% | .90% | .84% | .84% | .85% |
| Expenses net of all reductions | .89% | .89% | .81% | .82% | .84% |
| Net investment income (loss) | 3.91%C | 1.38% | .65% | 3.04%D | .36% |
| Supplemental Data | | | | | |
| Net assets, end of period (000 omitted) | $288,918 | $159,130 | $303,349 | $413,055 | $734,091 |
| Portfolio turnover rateJ | 38% | 42% | 80% | 62% | 96% |
A For the year ended February 29.
B Calculated based on average shares outstanding during the period.
C Net investment income per share reflects one or more large, non-recurring dividend which amounted to $.37 per share. Excluding such non-recurring dividend, the ratio of net investment income (loss) to average net assets would have been 1.04%.
D Net investment income per share reflects one or more large, non-recurring dividend which amounted to $1.34 per share. Excluding such non-recurring dividend, the ratio of net investment income (loss) to average net assets would have been .16%.
E Total distributions per share do not sum due to rounding.
F Amount represents less than $.005 per share.
G Total returns would have been lower if certain expenses had not been reduced during the applicable periods shown.
H Fees and expenses of any underlying mutual funds or exchange-traded funds (ETFs) are not included in the Fund's expense ratio. The Fund indirectly bears its proportionate share of these expenses. For additional expense information related to investments in Fidelity Central Funds, please refer to the "Investments in Fidelity Central Funds" note found in the Notes to Financial Statements section of the most recent Annual or Semi-Annual report.
I Expense ratios reflect operating expenses of the class. Expenses before reductions do not reflect amounts reimbursed, waived, or reduced through arrangements with the investment advisor, brokerage services, or other offset arrangements, if applicable, and do not represent the amount paid by the class during periods when reimbursements, waivers or reductions occur.
J Amount does not include the portfolio activity of any underlying mutual funds or exchange-traded funds (ETFs).
See accompanying notes which are an integral part of the financial statements.
Natural Gas Portfolio
Performance: The Bottom Line
Average annual total return reflects the change in the value of an investment, assuming reinvestment of distributions from dividend income and capital gains (the profits earned upon the sale of securities that have grown in value, if any) and assuming a constant rate of performance each year. The hypothetical investment and the average annual total returns do not reflect the deduction of taxes that a shareholder would pay on fund distributions or the redemption of fund shares. During periods of reimbursement by Fidelity, a fund’s total return will be greater than it would be had the reimbursement not occurred. How a fund did yesterday is no guarantee of how it will do tomorrow.
Average Annual Total Returns
| For the periods ended February 28, 2021 | Past 1 year | Past 5 years | Past 10 years |
| Natural Gas Portfolio | (5.72)% | (5.24)% | (8.77)% |
$10,000 Over 10 Years
Let's say hypothetically that $10,000 was invested in Natural Gas Portfolio on February 28, 2011.
The chart shows how the value of your investment would have changed, and also shows how the S&P 500® Index performed over the same period.
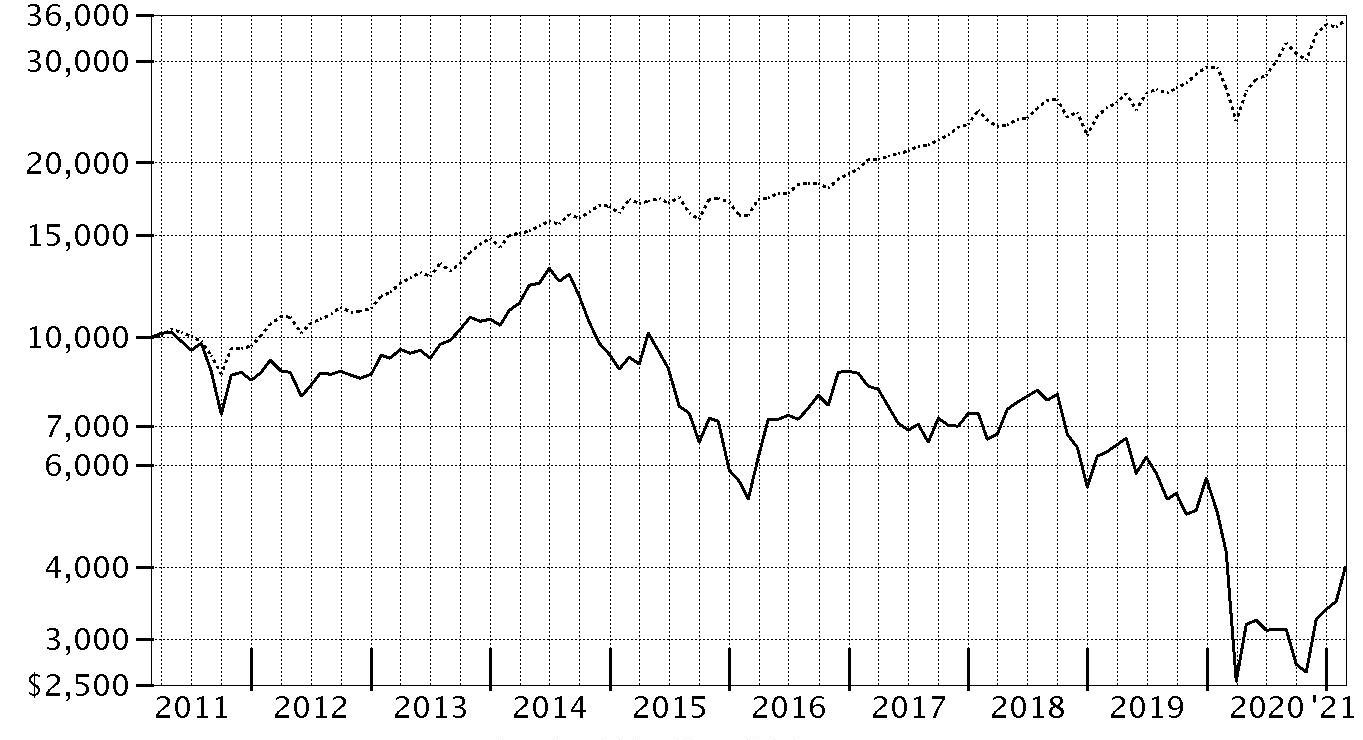
| Period Ending Values |
| $3,994 | Natural Gas Portfolio |
| $35,259 | S&P 500® Index |
Natural Gas Portfolio
Management's Discussion of Fund Performance
Market Recap: The S&P 500
® index gained 31.29% for the 12 months ending February 28, 2021, a volatile but productive period for U.S. risk assets. The early-2020 outbreak and spread of COVID-19 resulted in stocks suffering one of the quickest declines on record, through March 23, followed by a historic rebound that included the index closing 2020 at an all-time high and gaining modest ground in the first two months of the new year. The crisis and containment efforts caused broad contraction in economic activity, along with extreme uncertainty and dislocation in financial markets. A rapid and expansive U.S. monetary/fiscal-policy response partially offset the economic disruption and fueled the market surge, as did resilient corporate earnings. The rally slowed in September, when stocks began a two-month retreat amid Congress’s inability to reach a deal on additional fiscal stimulus, as well as concerns about election uncertainty, indications the U.S. economic recovery could be slowing and a new wave of COVID-19 cases. A shift in momentum began in October and accelerated following the U.S. elections, with the approval of three breakthrough COVID-19 vaccines and prospects for additional government stimulus fueling the “reflation trade” through February 28. By sector for the full 12 months, information technology (+50%) and consumer discretionary (+43%) led all gainers. Materials (+42%) and communication services (+37%) also stood out. In contrast, the defensive utilities (-3%) and real estate sectors (+5%) notably lagged.
Comments from Portfolio Manager Peter Belisle: For the fiscal year ending February 28, 2021, the fund returned -5.72%, trailing the 5.64% advance of the FactSet Natural Gas Linked Index, as well as the broad-based S&P 500
® index. The largest detractor from performance versus the industry index were stock picks and an underweighting in the oil & gas exploration & production group. Security selection and an underweighting in oil & gas storage & transportation and stock selection in integrated oil & gas also hindered the fund's relative result. The fund's biggest individual relative detractor was an outsized stake in PDC Energy, which returned approximately -55% the past 12 months. We reduced our stake in this company. Another key detractor was our out-of-index position in Shelf Drilling (-81%), a position not held at period end. Also hindering performance was an underweighting in Ovintiv, which gained roughly 112%. Ovintiv was not held at period end. The fund’s foreign holdings detracted overall, despite the tailwind of broad U.S.-dollar weakness. Conversely, the top contributor to performance versus the industry index was an overweighting in integrated oil & gas. Also bolstering the fund's relative performance was an underweighting in gas utilities and an overweighting in multi-utilities. Our non-index stake in Canadian Natural Resources, a position we established this period, was the fund's biggest individual relative contributor, driven by an about 81% advance. Our second-largest contributor this period was Williams Companies, which gained 30% and boosted relative performance. We decreased our position in the past year. Another notable relative contributor was our overweighting in Championx (+402%), a stake we established this period. Notable changes in positioning include increased exposure to the oil & gas equipment & services industry and a lower allocation to oil & gas exploration & production.
The views expressed above reflect those of the portfolio manager(s) only through the end of the period as stated on the cover of this report and do not necessarily represent the views of Fidelity or any other person in the Fidelity organization. Any such views are subject to change at any time based upon market or other conditions and Fidelity disclaims any responsibility to update such views. These views may not be relied on as investment advice and, because investment decisions for a Fidelity fund are based on numerous factors, may not be relied on as an indication of trading intent on behalf of any Fidelity fund.
Note to shareholders: On July 1, 2020, Ben Shuleva exited the fund, leaving Peter Belisle as sole portfolio manager.
Natural Gas Portfolio
Investment Summary (Unaudited)
Top Ten Stocks as of February 28, 2021
| | % of fund's net assets |
| Enbridge, Inc. | 7.9 |
| Phillips 66 Co. | 5.7 |
| Pioneer Natural Resources Co. | 5.5 |
| Schlumberger Ltd. | 4.9 |
| Hess Corp. | 4.7 |
| Occidental Petroleum Corp. | 4.0 |
| Baker Hughes Co. Class A | 3.5 |
| Kinder Morgan, Inc. | 3.3 |
| TC Energy Corp. | 3.2 |
| Canadian Natural Resources Ltd. | 3.1 |
| | 45.8 |
Top Industries (% of fund's net assets)
| As of February 28, 2021 |
| | Oil, Gas & Consumable Fuels | 78.9% |
| | Energy Equipment & Services | 16.4% |
| | Multi-Utilities | 1.6% |
| | Gas Utilities | 1.4% |
| | Electric Utilities | 0.6% |
| | All Others* | 1.1% |

* Includes short-term investments and net other assets (liabilities).
Natural Gas Portfolio
Schedule of Investments February 28, 2021
Showing Percentage of Net Assets
| Common Stocks - 98.9% | | | |
| | | Shares | Value |
| Electric Utilities - 0.6% | | | |
| Electric Utilities - 0.6% | | | |
| PG&E Corp. (a) | | 72,600 | $763,026 |
| Energy Equipment & Services - 16.4% | | | |
| Oil & Gas Equipment & Services - 16.4% | | | |
| Baker Hughes Co. Class A | | 169,200 | 4,142,016 |
| Cactus, Inc. | | 24,100 | 768,067 |
| Championx Corp. (a) | | 104,500 | 2,222,715 |
| Core Laboratories NV (b) | | 35,900 | 1,275,886 |
| Halliburton Co. | | 88,900 | 1,940,687 |
| NOV, Inc. | | 18,200 | 274,820 |
| Schlumberger Ltd. | | 202,818 | 5,660,650 |
| Technip Energies NV (a) | | 42,020 | 541,721 |
| TechnipFMC PLC | | 273,700 | 2,249,814 |
| | | | 19,076,376 |
| Food Products - 0.4% | | | |
| Agricultural Products - 0.4% | | | |
| Bunge Ltd. | | 6,200 | 474,796 |
| Gas Utilities - 1.4% | | | |
| Gas Utilities - 1.4% | | | |
| Brookfield Infrastructure Corp. A Shares | | 5,552 | 367,653 |
| UGI Corp. | | 32,200 | 1,233,582 |
| | | | 1,601,235 |
| Multi-Utilities - 1.6% | | | |
| Multi-Utilities - 1.6% | | | |
| CenterPoint Energy, Inc. | | 96,200 | 1,870,128 |
| Oil, Gas & Consumable Fuels - 78.5% | | | |
| Integrated Oil & Gas - 10.2% | | | |
| Exxon Mobil Corp. | | 23,300 | 1,266,821 |
| Occidental Petroleum Corp. | | 177,615 | 4,726,335 |
| Occidental Petroleum Corp. warrants 8/3/27 (a) | | 35,950 | 431,400 |
| Royal Dutch Shell PLC Class B sponsored ADR | | 39,200 | 1,524,096 |
| Suncor Energy, Inc. | | 127,400 | 2,530,164 |
| Total SA sponsored ADR | | 29,900 | 1,387,360 |
| | | | 11,866,176 |
| Oil & Gas Exploration & Production - 29.8% | | | |
| Apache Corp. | | 185,600 | 3,661,888 |
| ARC Resources Ltd. | | 175,800 | 1,052,645 |
| Cabot Oil & Gas Corp. | | 92,504 | 1,712,249 |
| Canadian Natural Resources Ltd. | | 134,280 | 3,664,501 |
| ConocoPhillips Co. | | 61,500 | 3,198,615 |
| Devon Energy Corp. | | 95,000 | 2,046,300 |
| EOG Resources, Inc. | | 37,000 | 2,388,720 |
| EQT Corp. | | 119,623 | 2,128,093 |
| Hess Corp. | | 83,400 | 5,465,202 |
| Kosmos Energy Ltd. | | 117,600 | 362,208 |
| MEG Energy Corp. (a) | | 162,454 | 838,695 |
| PDC Energy, Inc. (a) | | 21,500 | 751,425 |
| Pioneer Natural Resources Co. | | 43,250 | 6,425,653 |
| Viper Energy Partners LP | | 68,400 | 1,072,512 |
| | | | 34,768,706 |
| Oil & Gas Refining & Marketing - 7.8% | | | |
| HollyFrontier Corp. | | 45,400 | 1,719,752 |
| Phillips 66 Co. | | 80,700 | 6,702,135 |
| Valero Energy Corp. | | 8,600 | 662,028 |
| | | | 9,083,915 |
| Oil & Gas Storage & Transport - 30.7% | | | |
| Avenir LNG Ltd. (a)(c) | | 1,999,500 | 1,268,338 |
| Cheniere Energy, Inc. (a) | | 7,700 | 518,903 |
| Enbridge, Inc. | | 273,300 | 9,230,264 |
| Energy Transfer Equity LP | | 132,800 | 1,014,592 |
| Enterprise Products Partners LP | | 89,700 | 1,912,404 |
| Equitrans Midstream Corp. | | 145,700 | 1,053,411 |
| Gibson Energy, Inc. (b) | | 86,500 | 1,472,254 |
| Keyera Corp. (b) | | 16,200 | 314,045 |
| Kinder Morgan, Inc. | | 263,300 | 3,870,510 |
| Magellan Midstream Partners LP | | 52,800 | 2,200,176 |
| ONEOK, Inc. | | 37,900 | 1,678,591 |
| Pembina Pipeline Corp. | | 134,400 | 3,417,558 |
| Plains GP Holdings LP Class A | | 114,700 | 988,714 |
| Targa Resources Corp. | | 14,400 | 445,392 |
| TC Energy Corp. | | 89,519 | 3,749,303 |
| The Williams Companies, Inc. | | 116,929 | 2,670,658 |
| | | | 35,805,113 |
|
| TOTAL OIL, GAS & CONSUMABLE FUELS | | | 91,523,910 |
|
| TOTAL COMMON STOCKS | | | |
| (Cost $104,212,306) | | | 115,309,471 |
|
| Nonconvertible Preferred Stocks - 0.4% | | | |
| Oil, Gas & Consumable Fuels - 0.4% | | | |
| Integrated Oil & Gas - 0.4% | | | |
| Petroleo Brasileiro SA - Petrobras sponsored ADR | | | |
| (Cost $584,750) | | 54,500 | 432,185 |
|
| Money Market Funds - 1.7% | | | |
| Fidelity Cash Central Fund 0.07% (d) | | 181,618 | 181,654 |
| Fidelity Securities Lending Cash Central Fund 0.08% (d)(e) | | 1,775,635 | 1,775,813 |
| TOTAL MONEY MARKET FUNDS | | | |
| (Cost $1,957,467) | | | 1,957,467 |
| TOTAL INVESTMENT IN SECURITIES - 101.0% | | | |
| (Cost $106,754,523) | | | 117,699,123 |
| NET OTHER ASSETS (LIABILITIES) - (1.0)% | | | (1,118,320) |
| NET ASSETS - 100% | | | $116,580,803 |
Legend
(a) Non-income producing
(b) Security or a portion of the security is on loan at period end.
(c) Level 3 security
(d) Affiliated fund that is generally available only to investment companies and other accounts managed by Fidelity Investments. The rate quoted is the annualized seven-day yield of the fund at period end. A complete unaudited listing of the fund's holdings as of its most recent quarter end is available upon request. In addition, each Fidelity Central Fund's financial statements, which are not covered by the Fund's Report of Independent Registered Public Accounting Firm, are available on the SEC's website or upon request.
(e) Investment made with cash collateral received from securities on loan.
Affiliated Central Funds
Information regarding fiscal year to date income earned by the Fund from investments in Fidelity Central Funds is as follows:
| Fund | Income earned |
| Fidelity Cash Central Fund | $2,230 |
| Fidelity Securities Lending Cash Central Fund | 14,734 |
| Total | $16,964 |
Amounts in the income column in the above table include any capital gain distributions from underlying funds, which are presented in the corresponding line-item in the Statement of Operations, if applicable. Amount for Fidelity Securities Lending Cash Central Fund represents the income earned on investing cash collateral, less rebates paid to borrowers and any lending agent fees associated with the loan, plus any premium payments received for lending certain types of securities.
Investment Valuation
The following is a summary of the inputs used, as of February 28, 2021, involving the Fund's assets and liabilities carried at fair value. The inputs or methodology used for valuing securities may not be an indication of the risk associated with investing in those securities. For more information on valuation inputs, and their aggregation into the levels used below, please refer to the Investment Valuation section in the accompanying Notes to Financial Statements.
| | Valuation Inputs at Reporting Date: |
| Description | Total | Level 1 | Level 2 | Level 3 |
| Investments in Securities: | | | | |
| Common Stocks | $115,309,471 | $114,041,133 | $-- | $1,268,338 |
| Nonconvertible Preferred Stocks | 432,185 | 432,185 | -- | -- |
| Money Market Funds | 1,957,467 | 1,957,467 | -- | -- |
| Total Investments in Securities: | $117,699,123 | $116,430,785 | $-- | $1,268,338 |
The following is a reconciliation of Investments in Securities for which Level 3 inputs were used in determining value:
| Investments in Securities: | |
| Beginning Balance | $-- |
| Total Realized Gain (Loss) | (113) |
| Total Unrealized Gain (Loss) | (547,073) |
| Cost of Purchases | -- |
| Proceeds of Sales | (387) |
| Amortization/Accretion | -- |
| Transfers in to Level 3 | 1,815,911 |
| Transfers out of Level 3 | -- |
| Ending Balance | $1,268,338 |
| The change in unrealized gain (loss) for the period attributable to Level 3 securities held at February 28, 2021 | $(547,073) |
The information used in the above reconciliation represents fiscal year to date activity for any Investments in Securities identified as using Level 3 inputs at either the beginning or the end of the current fiscal period. Cost of purchases and proceeds of sales may include securities received and/or delivered through in-kind transactions. Transfers in or out of Level 3 represent the beginning value of any Security or Instrument where a change in the pricing level occurred from the beginning to the end of the period. The cost of purchases and the proceeds of sales may include securities received or delivered through corporate actions or exchanges. Realized and unrealized gains (losses) disclosed in the reconciliation are included in Net Gain (Loss) on the Fund's Statement of Operations.
Other Information
Distribution of investments by country or territory of incorporation, as a percentage of Total Net Assets, is as follows (Unaudited):
| United States of America | 64.4% |
| Canada | 22.8% |
| Curacao | 4.9% |
| United Kingdom | 3.2% |
| Netherlands | 1.6% |
| Bermuda | 1.5% |
| France | 1.2% |
| Others (Individually Less Than 1%) | 0.4% |
| | 100.0% |
See accompanying notes which are an integral part of the financial statements.
Natural Gas Portfolio
Financial Statements
Statement of Assets and Liabilities
| | | February 28, 2021 |
| Assets | | |
Investment in securities, at value (including securities loaned of $1,643,993) — See accompanying schedule:
Unaffiliated issuers (cost $104,797,056) | $115,741,656 | |
| Fidelity Central Funds (cost $1,957,467) | 1,957,467 | |
| Total Investment in Securities (cost $106,754,523) | | $117,699,123 |
| Receivable for investments sold | | 1,068,709 |
| Receivable for fund shares sold | | 478,480 |
| Dividends receivable | | 440,030 |
| Distributions receivable from Fidelity Central Funds | | 4,191 |
| Prepaid expenses | | 1,270 |
| Other receivables | | 55,539 |
| Total assets | | 119,747,342 |
| Liabilities | | |
| Payable for investments purchased | $971,586 | |
| Payable for fund shares redeemed | 253,904 | |
| Accrued management fee | 49,185 | |
| Other affiliated payables | 28,773 | |
| Other payables and accrued expenses | 87,383 | |
| Collateral on securities loaned | 1,775,708 | |
| Total liabilities | | 3,166,539 |
| Net Assets | | $116,580,803 |
| Net Assets consist of: | | |
| Paid in capital | | $532,103,952 |
| Total accumulated earnings (loss) | | (415,523,149) |
| Net Assets | | $116,580,803 |
| Net Asset Value, offering price and redemption price per share ($116,580,803 ÷ 9,335,664 shares) | | $12.49 |
See accompanying notes which are an integral part of the financial statements.
Statement of Operations
| | | Year ended February 28, 2021 |
| Investment Income | | |
| Dividends | | $3,008,372 |
| Non-Cash dividends | | 610,735 |
| Income from Fidelity Central Funds (including $14,734 from security lending) | | 16,964 |
| Total income | | 3,636,071 |
| Expenses | | |
| Management fee | $483,493 | |
| Transfer agent fees | 249,518 | |
| Accounting fees | 35,496 | |
| Custodian fees and expenses | 9,409 | |
| Independent trustees' fees and expenses | 535 | |
| Registration fees | 17,932 | |
| Audit | 37,912 | |
| Legal | 684 | |
| Miscellaneous | 6,842 | |
| Total expenses before reductions | 841,821 | |
| Expense reductions | (22,437) | |
| Total expenses after reductions | | 819,384 |
| Net investment income (loss) | | 2,816,687 |
| Realized and Unrealized Gain (Loss) | | |
| Net realized gain (loss) on: | | |
| Investment securities: | | |
| Unaffiliated issuers | (92,530,982) | |
| Fidelity Central Funds | 90 | |
| Foreign currency transactions | 4,429 | |
| Total net realized gain (loss) | | (92,526,463) |
| Change in net unrealized appreciation (depreciation) on: | | |
| Investment securities: | | |
| Unaffiliated issuers | 85,231,402 | |
| Assets and liabilities in foreign currencies | 1,413 | |
| Total change in net unrealized appreciation (depreciation) | | 85,232,815 |
| Net gain (loss) | | (7,293,648) |
| Net increase (decrease) in net assets resulting from operations | | $(4,476,961) |
See accompanying notes which are an integral part of the financial statements.
Statement of Changes in Net Assets
| | Year ended February 28, 2021 | Year ended February 29, 2020 |
| Increase (Decrease) in Net Assets | | |
| Operations | | |
| Net investment income (loss) | $2,816,687 | $2,506,777 |
| Net realized gain (loss) | (92,526,463) | (62,167,914) |
| Change in net unrealized appreciation (depreciation) | 85,232,815 | 1,048,778 |
| Net increase (decrease) in net assets resulting from operations | (4,476,961) | (58,612,359) |
| Distributions to shareholders | (2,175,969) | (1,660,041) |
| Share transactions | | |
| Proceeds from sales of shares | 52,382,909 | 41,679,382 |
| Reinvestment of distributions | 2,046,977 | 1,560,585 |
| Cost of shares redeemed | (45,826,297) | (69,422,307) |
| Net increase (decrease) in net assets resulting from share transactions | 8,603,589 | (26,182,340) |
| Total increase (decrease) in net assets | 1,950,659 | (86,454,740) |
| Net Assets | | |
| Beginning of period | 114,630,144 | 201,084,884 |
| End of period | $116,580,803 | $114,630,144 |
| Other Information | | |
| Shares | | |
| Sold | 5,141,965 | 2,360,441 |
| Issued in reinvestment of distributions | 198,651 | 87,673 |
| Redeemed | (4,459,318) | (3,826,441) |
| Net increase (decrease) | 881,298 | (1,378,327) |
See accompanying notes which are an integral part of the financial statements.
Financial Highlights
Natural Gas Portfolio
| | | | | | |
| Years ended February 28, | 2021 | 2020 A | 2019 | 2018 | 2017 |
| Selected Per–Share Data | | | | | |
| Net asset value, beginning of period | $13.56 | $20.45 | $21.60 | $27.76 | $17.83 |
| Income from Investment Operations | | | | | |
| Net investment income (loss)B | .31C | .28 | .24 | .61D | .13 |
| Net realized and unrealized gain (loss) | (1.14) | (6.98) | (1.27) | (5.83) | 9.98 |
| Total from investment operations | (.83) | (6.70) | (1.03) | (5.22) | 10.11 |
| Distributions from net investment income | (.24) | (.19) | – | (.65) | (.15) |
| Distributions from net realized gain | – | – | (.12) | (.29) | (.03) |
| Total distributions | (.24) | (.19) | (.12) | (.94) | (.18) |
| Redemption fees added to paid in capitalB | – | – | – | –E | –E |
| Net asset value, end of period | $12.49 | $13.56 | $20.45 | $21.60 | $27.76 |
| Total ReturnF | (5.72)% | (32.98)% | (4.82)% | (18.97)% | 56.75% |
| Ratios to Average Net AssetsG,H | | | | | |
| Expenses before reductions | .92% | .93% | .89% | .89% | .87% |
| Expenses net of fee waivers, if any | .92% | .93% | .89% | .89% | .87% |
| Expenses net of all reductions | .90% | .92% | .86% | .87% | .87% |
| Net investment income (loss) | 3.09%C | 1.51% | 1.02% | 2.52%D | .50% |
| Supplemental Data | | | | | |
| Net assets, end of period (000 omitted) | $116,581 | $114,630 | $201,085 | $238,368 | $479,879 |
| Portfolio turnover rateI | 127% | 87% | 86% | 69% | 76% |
A For the year ended February 29.
B Calculated based on average shares outstanding during the period.
C Net investment income per share reflects one or more large, non-recurring dividend which amounted to $.07 per share. Excluding such non-recurring dividend, the ratio of net investment income (loss) to average net assets would have been 2.42%.
D Net investment income per share reflects one or more large, non-recurring dividend which amounted to $.45 per share. Excluding such non-recurring dividend, the ratio of net investment income (loss) to average net assets would have been .66%.
E Amount represents less than $.005 per share.
F Total returns would have been lower if certain expenses had not been reduced during the applicable periods shown.
G Fees and expenses of any underlying mutual funds or exchange-traded funds (ETFs) are not included in the Fund's expense ratio. The Fund indirectly bears its proportionate share of these expenses. For additional expense information related to investments in Fidelity Central Funds, please refer to the "Investments in Fidelity Central Funds" note found in the Notes to Financial Statements section of the most recent Annual or Semi-Annual report.
H Expense ratios reflect operating expenses of the class. Expenses before reductions do not reflect amounts reimbursed, waived, or reduced through arrangements with the investment advisor, brokerage services, or other offset arrangements, if applicable, and do not represent the amount paid by the class during periods when reimbursements, waivers or reductions occur.
I Amount does not include the portfolio activity of any underlying mutual funds or exchange-traded funds (ETFs).
See accompanying notes which are an integral part of the financial statements.
Natural Resources Portfolio
Performance: The Bottom Line
Average annual total return reflects the change in the value of an investment, assuming reinvestment of distributions from dividend income and capital gains (the profits earned upon the sale of securities that have grown in value, if any) and assuming a constant rate of performance each year. The hypothetical investment and the average annual total returns do not reflect the deduction of taxes that a shareholder would pay on fund distributions or the redemption of fund shares. During periods of reimbursement by Fidelity, a fund’s total return will be greater than it would be had the reimbursement not occurred. How a fund did yesterday is no guarantee of how it will do tomorrow.
Average Annual Total Returns
| For the periods ended February 28, 2021 | Past 1 year | Past 5 years | Past 10 years |
| Natural Resources Portfolio | 14.76% | 2.59% | (3.41)% |
$10,000 Over 10 Years
Let's say hypothetically that $10,000 was invested in Natural Resources Portfolio on February 28, 2011.
The chart shows how the value of your investment would have changed, and also shows how the S&P 500® Index performed over the same period.
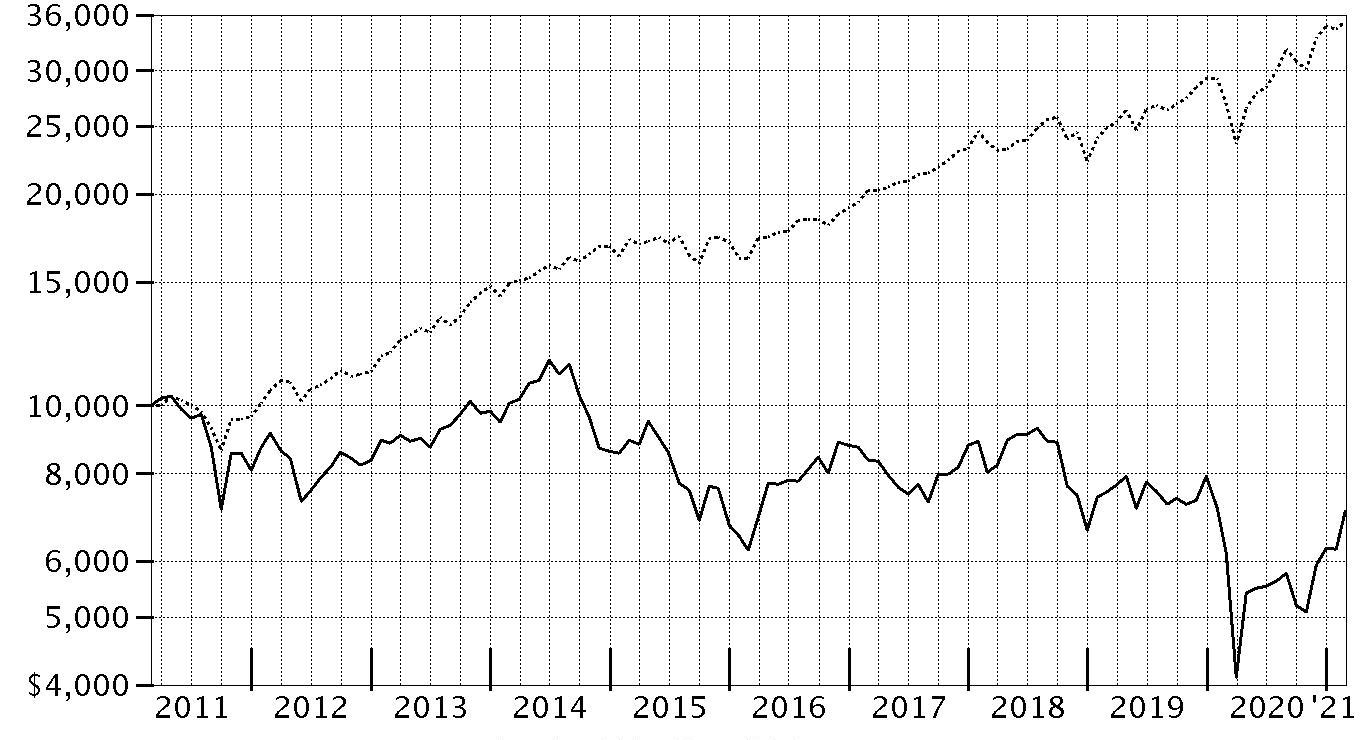
| Period Ending Values |
| $7,072 | Natural Resources Portfolio |
| $35,259 | S&P 500® Index |
Natural Resources Portfolio
Management's Discussion of Fund Performance
Market Recap: The S&P 500
® index gained 31.29% for the 12 months ending February 28, 2021, a volatile but productive period for U.S. risk assets. The early-2020 outbreak and spread of COVID-19 resulted in stocks suffering one of the quickest declines on record, through March 23, followed by a historic rebound that included the index closing 2020 at an all-time high and gaining modest ground in the first two months of the new year. The crisis and containment efforts caused broad contraction in economic activity, along with extreme uncertainty and dislocation in financial markets. A rapid and expansive U.S. monetary/fiscal-policy response partially offset the economic disruption and fueled the market surge, as did resilient corporate earnings. The rally slowed in September, when stocks began a two-month retreat amid Congress’s inability to reach a deal on additional fiscal stimulus, as well as concerns about election uncertainty, indications the U.S. economic recovery could be slowing and a new wave of COVID-19 cases. A shift in momentum began in October and accelerated following the U.S. elections, with the approval of three breakthrough COVID-19 vaccines and prospects for additional government stimulus fueling the “reflation trade” through February 28. By sector for the full 12 months, information technology (+50%) and consumer discretionary (+43%) led all gainers. Materials (+42%) and communication services (+37%) also stood out. In contrast, the defensive utilities (-3%) and real estate sectors (+5%) notably lagged.
Comments from Portfolio Manager Ashley Fernandes: For the fiscal year ending February 28, 2021, the fund gained 14.76%, underperforming the 15.09% gain of the S&P North American Natural Resources Sector Index, as well as the broad-based S&P 500
® index. The primary detractor from performance versus the industry index were stock picks and an overweighting in oil & gas exploration & production. Security selection in gold and an underweighting in copper also hurt. The biggest individual relative detractor was an underweight position in Freeport McMoRan (+240%), which was among the largest holdings at period end. Also holding back performance was an underweighting in Chevron, which gained about 13%. Chevron was not held at period end. Also hurting performance was our lighter-than-index stake in ConocoPhillips, which gained 12%. ConocoPhillips was not held at period end. In contrast, the biggest contributor to performance versus the industry index was stock selection and an underweighting in oil & gas storage & transportation. Also lifting the fund's relative result was an overweighting in gold and an underweighting in integrated oil & gas. The fund's top individual relative contributor was our lighter-than-index stake in Exxon Mobil, which gained approximately 14% the past year. The company was the fund's biggest holding as of February 28. Also boosting value was our outsized stake in Apache, which gained about 34%. This was a position we established the past 12 months. Another notable relative contributor was an outsized stake in Crown Holdings (+35%). This period we reduced our holdings in the stock. The fund's foreign holdings contributed overall, aided in part by a broadly weaker U.S. dollar. Notable changes in positioning include decreased exposure to the oil & gas storage & transportation group and a higher allocation to integrated oil & gas.
The views expressed above reflect those of the portfolio manager(s) only through the end of the period as stated on the cover of this report and do not necessarily represent the views of Fidelity or any other person in the Fidelity organization. Any such views are subject to change at any time based upon market or other conditions and Fidelity disclaims any responsibility to update such views. These views may not be relied on as investment advice and, because investment decisions for a Fidelity fund are based on numerous factors, may not be relied on as an indication of trading intent on behalf of any Fidelity fund.
Note to shareholders: On January 1, 2021, Ashley Fernandes assumed portfolio management responsibilities for the fund, succeeding Nathan Strik.
Natural Resources Portfolio
Investment Summary (Unaudited)
Top Ten Stocks as of February 28, 2021
| | % of fund's net assets |
| Exxon Mobil Corp. | 16.6 |
| Canadian Natural Resources Ltd. | 7.4 |
| Hess Corp. | 6.0 |
| Freeport-McMoRan, Inc. | 5.4 |
| Phillips 66 Co. | 4.6 |
| Valero Energy Corp. | 4.1 |
| Apache Corp. | 3.5 |
| Franco-Nevada Corp. | 3.5 |
| Avery Dennison Corp. | 3.3 |
| Barrick Gold Corp. | 3.1 |
| | 57.5 |
Top Industries (% of fund's net assets)
| As of February 28, 2021 |
| | Oil, Gas & Consumable Fuels | 61.3% |
| | Metals & Mining | 18.2% |
| | Containers & Packaging | 10.6% |
| | Energy Equipment & Services | 5.0% |
| | Construction Materials | 3.0% |
| | All Others* | 1.9% |

* Includes short-term investments and net other assets (liabilities).
Natural Resources Portfolio
Schedule of Investments February 28, 2021
Showing Percentage of Net Assets
| Common Stocks - 99.5% | | | |
| | | Shares | Value |
| Commercial Services & Supplies - 0.2% | | | |
| Environmental & Facility Services - 0.2% | | | |
| Clean TeQ Holdings Ltd. (a) | | 3,099,138 | $691,543 |
| Construction Materials - 3.0% | | | |
| Construction Materials - 3.0% | | | |
| Eagle Materials, Inc. | | 36,500 | 4,576,370 |
| Summit Materials, Inc. (a) | | 148,500 | 4,114,935 |
| | | | 8,691,305 |
| Containers & Packaging - 10.6% | | | |
| Metal & Glass Containers - 5.1% | | | |
| Aptargroup, Inc. | | 26,800 | 3,485,876 |
| Berry Global Group, Inc. (a) | | 67,500 | 3,739,500 |
| Crown Holdings, Inc. | | 80,800 | 7,721,248 |
| | | | 14,946,624 |
| Paper Packaging - 5.5% | | | |
| Avery Dennison Corp. | | 55,500 | 9,724,155 |
| Graphic Packaging Holding Co. | | 110,100 | 1,747,287 |
| Packaging Corp. of America | | 34,400 | 4,541,488 |
| | | | 16,012,930 |
|
| TOTAL CONTAINERS & PACKAGING | | | 30,959,554 |
|
| Energy Equipment & Services - 5.0% | | | |
| Oil & Gas Equipment & Services - 5.0% | | | |
| Baker Hughes Co. Class A | | 173,500 | 4,247,280 |
| Halliburton Co. | | 78,500 | 1,713,655 |
| Oceaneering International, Inc. (a) | | 72,700 | 857,860 |
| SBM Offshore NV | | 109,800 | 1,945,457 |
| Subsea 7 SA | | 563,700 | 5,875,857 |
| | | | 14,640,109 |
| Metals & Mining - 18.2% | | | |
| Copper - 6.6% | | | |
| Antofagasta PLC | | 89,600 | 2,225,108 |
| First Quantum Minerals Ltd. | | 60,800 | 1,310,501 |
| Freeport-McMoRan, Inc. | | 467,100 | 15,839,361 |
| | | | 19,374,970 |
| Diversified Metals & Mining - 1.6% | | | |
| Canada Nickel Co., Inc. (a) | | 586,000 | 1,611,661 |
| Lynas Rare Earths Ltd. (a) | | 364,754 | 1,678,347 |
| MMC Norilsk Nickel PJSC ADR (b) | | 42,100 | 1,321,519 |
| | | | 4,611,527 |
| Gold - 9.7% | | | |
| Agnico Eagle Mines Ltd. (Canada) | | 96,100 | 5,364,564 |
| Barrick Gold Corp. | | 486,632 | 9,085,419 |
| Franco-Nevada Corp. | | 94,300 | 10,096,902 |
| Newmont Corp. | | 70,000 | 3,806,600 |
| | | | 28,353,485 |
| Silver - 0.3% | | | |
| Pan American Silver Corp. | | 30,400 | 1,003,808 |
|
| TOTAL METALS & MINING | | | 53,343,790 |
|
| Oil, Gas & Consumable Fuels - 61.3% | | | |
| Integrated Oil & Gas - 25.9% | | | |
| Cenovus Energy, Inc. (Canada) | | 305,800 | 2,263,583 |
| Exxon Mobil Corp. | | 892,300 | 48,514,352 |
| Royal Dutch Shell PLC Class B sponsored ADR | | 188,200 | 7,317,216 |
| Suncor Energy, Inc. | | 446,200 | 8,860,187 |
| Total SA | | 192,300 | 8,966,973 |
| | | | 75,922,311 |
| Oil & Gas Exploration & Production - 20.1% | | | |
| Africa Oil Corp. (a) | | 3,514,300 | 3,507,120 |
| Apache Corp. | | 526,400 | 10,385,872 |
| Canadian Natural Resources Ltd. | | 791,200 | 21,591,848 |
| EnQuest PLC (a) | | 3,746,509 | 1,018,873 |
| Hess Corp. | | 269,500 | 17,660,335 |
| Kosmos Energy Ltd. | | 268,400 | 826,672 |
| MEG Energy Corp. (a) | | 588,337 | 3,037,383 |
| Tullow Oil PLC (a) | | 1,211,300 | 741,187 |
| | | | 58,769,290 |
| Oil & Gas Refining & Marketing - 9.6% | | | |
| HollyFrontier Corp. | | 72,600 | 2,750,088 |
| Phillips 66 Co. | | 162,616 | 13,505,259 |
| Valero Energy Corp. | | 154,400 | 11,885,712 |
| | | | 28,141,059 |
| Oil & Gas Storage & Transport - 5.7% | | | |
| Cheniere Energy, Inc. (a) | | 75,600 | 5,094,684 |
| Enbridge, Inc. | | 119,100 | 4,026,771 |
| Magellan Midstream Partners LP | | 183,000 | 7,625,610 |
| | | | 16,747,065 |
|
| TOTAL OIL, GAS & CONSUMABLE FUELS | | | 179,579,725 |
|
| Paper & Forest Products - 1.2% | | | |
| Forest Products - 1.2% | | | |
| Western Forest Products, Inc. (b) | | 2,623,600 | 3,463,498 |
| TOTAL COMMON STOCKS | | | |
| (Cost $248,682,299) | | | 291,369,524 |
|
| Money Market Funds - 0.9% | | | |
| Fidelity Cash Central Fund 0.07% (c) | | 1,865,963 | 1,866,336 |
| Fidelity Securities Lending Cash Central Fund 0.08% (c)(d) | | 868,114 | 868,201 |
| TOTAL MONEY MARKET FUNDS | | | |
| (Cost $2,734,537) | | | 2,734,537 |
| TOTAL INVESTMENT IN SECURITIES - 100.4% | | | |
| (Cost $251,416,836) | | | 294,104,061 |
| NET OTHER ASSETS (LIABILITIES) - (0.4)% | | | (1,217,041) |
| NET ASSETS - 100% | | | $292,887,020 |
Legend
(a) Non-income producing
(b) Security or a portion of the security is on loan at period end.
(c) Affiliated fund that is generally available only to investment companies and other accounts managed by Fidelity Investments. The rate quoted is the annualized seven-day yield of the fund at period end. A complete unaudited listing of the fund's holdings as of its most recent quarter end is available upon request. In addition, each Fidelity Central Fund's financial statements, which are not covered by the Fund's Report of Independent Registered Public Accounting Firm, are available on the SEC's website or upon request.
(d) Investment made with cash collateral received from securities on loan.
Affiliated Central Funds
Information regarding fiscal year to date income earned by the Fund from investments in Fidelity Central Funds is as follows:
| Fund | Income earned |
| Fidelity Cash Central Fund | $3,156 |
| Fidelity Securities Lending Cash Central Fund | 22,412 |
| Total | $25,568 |
Amounts in the income column in the above table include any capital gain distributions from underlying funds, which are presented in the corresponding line-item in the Statement of Operations, if applicable. Amount for Fidelity Securities Lending Cash Central Fund represents the income earned on investing cash collateral, less rebates paid to borrowers and any lending agent fees associated with the loan, plus any premium payments received for lending certain types of securities.
Investment Valuation
The following is a summary of the inputs used, as of February 28, 2021, involving the Fund's assets and liabilities carried at fair value. The inputs or methodology used for valuing securities may not be an indication of the risk associated with investing in those securities. For more information on valuation inputs, and their aggregation into the levels used below, please refer to the Investment Valuation section in the accompanying Notes to Financial Statements.
| | Valuation Inputs at Reporting Date: |
| Description | Total | Level 1 | Level 2 | Level 3 |
| Investments in Securities: | | | | |
| Common Stocks | $291,369,524 | $282,402,551 | $8,966,973 | $-- |
| Money Market Funds | 2,734,537 | 2,734,537 | -- | -- |
| Total Investments in Securities: | $294,104,061 | $285,137,088 | $8,966,973 | $-- |
Other Information
Distribution of investments by country or territory of incorporation, as a percentage of Total Net Assets, is as follows (Unaudited):
| United States of America | 63.4% |
| Canada | 25.6% |
| United Kingdom | 4.0% |
| France | 3.0% |
| Luxembourg | 2.0% |
| Others (Individually Less Than 1%) | 2.0% |
| | 100.0% |
See accompanying notes which are an integral part of the financial statements.
Natural Resources Portfolio
Financial Statements
Statement of Assets and Liabilities
| | | February 28, 2021 |
| Assets | | |
Investment in securities, at value (including securities loaned of $844,995) — See accompanying schedule:
Unaffiliated issuers (cost $248,682,299) | $291,369,524 | |
| Fidelity Central Funds (cost $2,734,537) | 2,734,537 | |
| Total Investment in Securities (cost $251,416,836) | | $294,104,061 |
| Receivable for investments sold | | 1,833,113 |
| Receivable for fund shares sold | | 1,501,677 |
| Dividends receivable | | 1,270,583 |
| Distributions receivable from Fidelity Central Funds | | 573 |
| Prepaid expenses | | 4,789 |
| Other receivables | | 92,426 |
| Total assets | | 298,807,222 |
| Liabilities | | |
| Payable for investments purchased | $4,339,010 | |
| Payable for fund shares redeemed | 402,533 | |
| Accrued management fee | 123,168 | |
| Other affiliated payables | 66,911 | |
| Other payables and accrued expenses | 120,874 | |
| Collateral on securities loaned | 867,706 | |
| Total liabilities | | 5,920,202 |
| Net Assets | | $292,887,020 |
| Net Assets consist of: | | |
| Paid in capital | | $559,975,248 |
| Total accumulated earnings (loss) | | (267,088,228) |
| Net Assets | | $292,887,020 |
| Net Asset Value, offering price and redemption price per share ($292,887,020 ÷ 12,619,198 shares) | | $23.21 |
See accompanying notes which are an integral part of the financial statements.
Statement of Operations
| | | Year ended February 28, 2021 |
| Investment Income | | |
| Dividends | | $6,319,247 |
| Income from Fidelity Central Funds (including $22,412 from security lending) | | 25,568 |
| Total income | | 6,344,815 |
| Expenses | | |
| Management fee | $1,345,780 | |
| Transfer agent fees | 694,277 | |
| Accounting fees | 98,781 | |
| Custodian fees and expenses | 11,310 | |
| Independent trustees' fees and expenses | 1,513 | |
| Registration fees | 33,180 | |
| Audit | 49,431 | |
| Legal | 1,787 | |
| Interest | 1,463 | |
| Miscellaneous | 16,784 | |
| Total expenses before reductions | 2,254,306 | |
| Expense reductions | (16,725) | |
| Total expenses after reductions | | 2,237,581 |
| Net investment income (loss) | | 4,107,234 |
| Realized and Unrealized Gain (Loss) | | |
| Net realized gain (loss) on: | | |
| Investment securities: | | |
| Unaffiliated issuers (net of foreign taxes of $168,881) | (86,995,796) | |
| Fidelity Central Funds | 373 | |
| Foreign currency transactions | 64,499 | |
| Total net realized gain (loss) | | (86,930,924) |
| Change in net unrealized appreciation (depreciation) on: | | |
| Investment securities: | | |
| Unaffiliated issuers (net of decrease in deferred foreign taxes of $49,748) | 112,608,656 | |
| Assets and liabilities in foreign currencies | (854) | |
| Total change in net unrealized appreciation (depreciation) | | 112,607,802 |
| Net gain (loss) | | 25,676,878 |
| Net increase (decrease) in net assets resulting from operations | | $29,784,112 |
See accompanying notes which are an integral part of the financial statements.
Statement of Changes in Net Assets
| | Year ended February 28, 2021 | Year ended February 29, 2020 |
| Increase (Decrease) in Net Assets | | |
| Operations | | |
| Net investment income (loss) | $4,107,234 | $4,795,973 |
| Net realized gain (loss) | (86,930,924) | (5,822,055) |
| Change in net unrealized appreciation (depreciation) | 112,607,802 | (72,689,969) |
| Net increase (decrease) in net assets resulting from operations | 29,784,112 | (73,716,051) |
| Distributions to shareholders | (4,520,020) | (6,015,518) |
| Share transactions | | |
| Proceeds from sales of shares | 119,747,809 | 141,880,695 |
| Reinvestment of distributions | 4,308,576 | 5,281,203 |
| Cost of shares redeemed | (171,966,676) | (176,063,968) |
| Net increase (decrease) in net assets resulting from share transactions | (47,910,291) | (28,902,070) |
| Total increase (decrease) in net assets | (22,646,199) | (108,633,639) |
| Net Assets | | |
| Beginning of period | 315,533,219 | 424,166,858 |
| End of period | $292,887,020 | $315,533,219 |
| Other Information | | |
| Shares | | |
| Sold | 6,708,913 | 5,678,652 |
| Issued in reinvestment of distributions | 210,950 | 202,237 |
| Redeemed | (9,621,746) | (7,159,749) |
| Net increase (decrease) | (2,701,883) | (1,278,860) |
See accompanying notes which are an integral part of the financial statements.
Financial Highlights
Natural Resources Portfolio
| | | | | | |
| Years ended February 28, | 2021 | 2020 A | 2019 | 2018 | 2017 |
| Selected Per–Share Data | | | | | |
| Net asset value, beginning of period | $20.59 | $25.55 | $27.51 | $29.13 | $21.80 |
| Income from Investment Operations | | | | | |
| Net investment income (loss)B | .30 | .30 | .29 | .43C | .10 |
| Net realized and unrealized gain (loss) | 2.69 | (4.88) | (1.97) | (1.64) | 7.42 |
| Total from investment operations | 2.99 | (4.58) | (1.68) | (1.21) | 7.52 |
| Distributions from net investment income | (.37) | (.30) | (.28) | (.39) | (.11) |
| Distributions from net realized gain | – | (.08) | –D | (.02) | (.08) |
| Total distributions | (.37) | (.38) | (.28) | (.41) | (.19) |
| Redemption fees added to paid in capitalB | – | – | – | –D | –D |
| Net asset value, end of period | $23.21 | $20.59 | $25.55 | $27.51 | $29.13 |
| Total ReturnE | 14.76% | (18.25)% | (6.06)% | (4.16)% | 34.54% |
| Ratios to Average Net AssetsF,G | | | | | |
| Expenses before reductions | .89% | .84% | .81% | .83% | .84% |
| Expenses net of fee waivers, if any | .89% | .84% | .81% | .83% | .84% |
| Expenses net of all reductions | .88% | .84% | .80% | .82% | .83% |
| Net investment income (loss) | 1.62% | 1.18% | 1.02% | 1.54%C | .35% |
| Supplemental Data | | | | | |
| Net assets, end of period (000 omitted) | $292,887 | $315,533 | $424,167 | $910,733 | $912,090 |
| Portfolio turnover rateH | 90% | 8% | 26% | 78% | 84% |
A For the year ended February 29.
B Calculated based on average shares outstanding during the period.
C Net investment income per share reflects one or more large, non-recurring dividend which amounted to $.31 per share. Excluding such non-recurring dividend, the ratio of net investment income (loss) to average net assets would have been .41%.
D Amount represents less than $.005 per share.
E Total returns would have been lower if certain expenses had not been reduced during the applicable periods shown.
F Fees and expenses of any underlying mutual funds or exchange-traded funds (ETFs) are not included in the Fund's expense ratio. The Fund indirectly bears its proportionate share of these expenses. For additional expense information related to investments in Fidelity Central Funds, please refer to the "Investments in Fidelity Central Funds" note found in the Notes to Financial Statements section of the most recent Annual or Semi-Annual report.
G Expense ratios reflect operating expenses of the class. Expenses before reductions do not reflect amounts reimbursed, waived, or reduced through arrangements with the investment advisor, brokerage services, or other offset arrangements, if applicable, and do not represent the amount paid by the class during periods when reimbursements, waivers or reductions occur.
H Amount does not include the portfolio activity of any underlying mutual funds or exchange-traded funds (ETFs).
See accompanying notes which are an integral part of the financial statements.
Notes to Financial Statements
For the period ended February 28, 2021
1. Organization.
Energy Portfolio, Energy Service Portfolio, Natural Gas Portfolio, and Natural Resources Portfolio (the Funds) are non-diversified funds of Fidelity Select Portfolios (the Trust). The Trust is registered under the Investment Company Act of 1940, as amended (the 1940 Act), as an open-end management investment company organized as a Massachusetts business trust. The Funds invest primarily in securities of companies whose principal business activities fall within specific industries. Each Fund is authorized to issue an unlimited number of shares. Share transactions on the Statement of Changes in Net Assets may contain exchanges between affiliated funds. The Natural Resources Portfolio may also invest in certain precious metals.
In April 2021, the Board of Trustees approved a change in the name of Natural Resources Portfolio to Fidelity Natural Resources Fund effective May 1, 2021.
2. Investments in Fidelity Central Funds.
The Funds invests in Fidelity Central Funds, which are open-end investment companies generally available only to other investment companies and accounts managed by the investment adviser and its affiliates. The Funds' Schedules of Investments list each of the Fidelity Central Funds held as of period end, if any, as an investment of each Fund, but do not include the underlying holdings of each Fidelity Central Fund. As an Investing Fund, each Fund indirectly bears its proportionate share of the expenses of the underlying Fidelity Central Funds.
The Money Market Central Funds seek preservation of capital and current income and are managed by the investment adviser. Annualized expenses of the Money Market Central Funds as of their most recent shareholder report date ranged from less than .005% to .01%.
A complete unaudited list of holdings for each Fidelity Central Fund is available upon request or at the Securities and Exchange Commission (the SEC) website at www.sec.gov. In addition, the financial statements of the Fidelity Central Funds, which are not covered by the Funds' Report of Independent Registered Public Accounting Firm, are available on the SEC website or upon request.
3. Significant Accounting Policies.
Each Fund is an investment company and applies the accounting and reporting guidance of the Financial Accounting Standards Board (FASB) Accounting Standards Codification Topic 946 Financial Services - Investment Companies. The financial statements have been prepared in conformity with accounting principles generally accepted in the United States of America (GAAP), which require management to make certain estimates and assumptions at the date of the financial statements. Actual results could differ from those estimates. Subsequent events, if any, through the date that the financial statements were issued have been evaluated in the preparation of the financial statements. The following summarizes the significant accounting policies of the Funds:
Investment Valuation. Investments are valued as of 4:00 p.m. Eastern time on the last calendar day of the period. The Board of Trustees (the Board) has delegated the day to day responsibility for the valuation of each Fund's investments to the Fair Value Committee (the Committee) established by each Fund's investment adviser. In accordance with valuation policies and procedures approved by the Board, each Fund attempts to obtain prices from one or more third party pricing vendors or brokers to value its investments. When current market prices, quotations or currency exchange rates are not readily available or reliable, investments will be fair valued in good faith by the Committee, in accordance with procedures adopted by the Board. Factors used in determining fair value vary by investment type and may include market or investment specific events. The frequency with which these procedures are used cannot be predicted and they may be utilized to a significant extent. The Committee oversees each Fund's valuation policies and procedures and reports to the Board on the Committee's activities and fair value determinations. The Board monitors the appropriateness of the procedures used in valuing each Fund's investments and ratifies the fair value determinations of the Committee.
Each Fund categorizes the inputs to valuation techniques used to value its investments into a disclosure hierarchy consisting of three levels as shown below:
- Level 1 – quoted prices in active markets for identical investments
- Level 2 – other significant observable inputs (including quoted prices for similar investments, interest rates, prepayment speeds, etc.)
- Level 3 – unobservable inputs (including the Fund's own assumptions based on the best information available)
Valuation techniques used to value each Fund's investments by major category are as follows:
Equity securities, including restricted securities, for which market quotations are readily available, are valued at the last reported sale price or official closing price as reported by a third party pricing vendor on the primary market or exchange on which they are traded and are categorized as Level 1 in the hierarchy. In the event there were no sales during the day or closing prices are not available, securities are valued at the last quoted bid price or may be valued using the last available price and are generally categorized as Level 2 in the hierarchy. For foreign equity securities, when market or security specific events arise, comparisons to the valuation of American Depositary Receipts (ADRs), futures contracts, Exchange-Traded Funds (ETFs) and certain indexes as well as quoted prices for similar securities may be used and would be categorized as Level 2 in the hierarchy. For equity securities, including restricted securities, where observable inputs are limited, assumptions about market activity and risk are used and these securities may be categorized as Level 3 in the hierarchy.
Independent prices obtained from a single source or broker are evaluated by management and may be categorized as Level 3 in the hierarchy.
Investments in open-end mutual funds, including the Fidelity Central Funds, are valued at their closing net asset value (NAV) each business day and are categorized as Level 1 in the hierarchy.
Changes in valuation techniques may result in transfers in or out of an assigned level within the disclosure hierarchy. The aggregate value of investments by input level as of February 28, 2021, as well as a roll forward of Level 3 investments, is included at the end of each Fund's Schedule of Investments.
Foreign Currency. Certain Funds may use foreign currency contracts to facilitate transactions in foreign-denominated securities. Gains and losses from these transactions may arise from changes in the value of the foreign currency or if the counterparties do not perform under the contracts' terms.
Foreign-denominated assets, including investment securities, and liabilities are translated into U.S. dollars at the exchange rates at period end. Purchases and sales of investment securities, income and dividends received, and expenses denominated in foreign currencies are translated into U.S. dollars at the exchange rate in effect on the transaction date.
The effects of exchange rate fluctuations on investments are included with the net realized and unrealized gain (loss) on investment securities. Other foreign currency transactions resulting in realized and unrealized gain (loss) are disclosed separately.
Investment Transactions and Income. For financial reporting purposes, the Funds' investment holdings and NAV include trades executed through the end of the last business day of the period. The NAV per share for processing shareholder transactions is calculated as of the close of business of the New York Stock Exchange (NYSE), normally 4:00 p.m. Eastern time and includes trades executed through the end of the prior business day. Gains and losses on securities sold are determined on the basis of identified cost and for certain Funds include proceeds received from litigation. Dividend income is recorded on the ex-dividend date, except for certain dividends from foreign securities where the ex-dividend date may have passed, which are recorded as soon as the Funds are informed of the ex-dividend date. Non-cash dividends included in dividend income, if any, are recorded at the fair market value of the securities received. Income and capital gain distributions from Fidelity Central Funds, if any, are recorded on the ex-dividend date. Certain distributions received by the Funds represent a return of capital or capital gain. The Funds determine the components of these distributions subsequent to the ex-dividend date, based upon receipt of tax filings or other correspondence relating to the underlying investment. These distributions are recorded as a reduction of cost of investments and/or as a realized gain. Large, non-recurring dividends recognized by the Funds are presented separately on the Statement of Operations in "Non-cash dividends" and the impact of these dividends is presented in the Financial Highlights. Investment income is recorded net of foreign taxes withheld where recovery of such taxes is uncertain.
Expenses. Expenses directly attributable to a fund are charged to that fund. Expenses attributable to more than one fund are allocated among the respective funds on the basis of relative net assets or other appropriate methods. Expense estimates are accrued in the period to which they relate and adjustments are made when actual amounts are known.
Deferred Trustee Compensation. Under a Deferred Compensation Plan (the Plan) for certain Funds, certain independent Trustees have elected to defer receipt of a portion of their annual compensation. Deferred amounts are invested in affiliated mutual funds, are marked-to-market and remain in a fund until distributed in accordance with the Plan. The investment of deferred amounts and the offsetting payable to the Trustees presented below are included in the accompanying Statement of Assets and Liabilities in other receivables and other payables and accrued expenses, as applicable.
| Energy Portfolio | $222,196 |
| Energy Service Portfolio | 76,165 |
| Natural Gas Portfolio | 55,379 |
| Natural Resources Portfolio | 87,162 |
Income Tax Information and Distributions to Shareholders. Each year, each Fund intends to qualify as a regulated investment company under Subchapter M of the Internal Revenue Code, including distributing substantially all of its taxable income and realized gains. As a result, no provision for U.S. Federal income taxes is required. As of February 28, 2021, each Fund did not have any unrecognized tax benefits in the financial statements; nor is each Fund aware of any tax positions for which it is reasonably possible that the total amounts of unrecognized tax benefits will significantly change in the next twelve months. Each Fund files a U.S. federal tax return, in addition to state and local tax returns as required. Each Fund's federal income tax returns are subject to examination by the Internal Revenue Service (IRS) for a period of three fiscal years after they are filed. State and local tax returns may be subject to examination for an additional fiscal year depending on the jurisdiction. Foreign taxes are provided for based on each Fund's understanding of the tax rules and rates that exist in the foreign markets in which it invests.
Distributions are declared and recorded on the ex-dividend date. Income and capital gain distributions are determined in accordance with income tax regulations, which may differ from GAAP. In addition, certain Funds claimed a portion of the payment made to redeeming shareholders as a distribution for income tax purposes.
Capital accounts within the financial statements are adjusted for permanent book-tax differences. These adjustments have no impact on net assets or the results of operations. Capital accounts are not adjusted for temporary book-tax differences which will reverse in a subsequent period.
Book-tax differences are primarily due to foreign currency transactions, certain foreign taxes, passive foreign investment companies (PFIC), partnerships, deferred trustees compensation, capital loss carryforwards and losses deferred due to wash sales and excise tax regulations.
As of period end, the cost and unrealized appreciation (depreciation) in securities, and derivatives if applicable, for federal income tax purposes were as follows for each Fund:
| | Tax cost | Gross unrealized appreciation | Gross unrealized depreciation | Net unrealized appreciation (depreciation) |
| Energy Portfolio | $887,884,351 | $177,022,039 | $(85,823,981) | $91,198,058 |
| Energy Service Portfolio | 315,312,271 | 63,775,262 | (83,537,944) | (19,762,682) |
| Natural Gas Portfolio | 109,033,056 | 21,159,523 | (12,493,456) | 8,666,067 |
| Natural Resources Portfolio | 257,692,338 | 48,408,773 | (11,997,050) | 36,411,723 |
The tax-based components of distributable earnings as of period end were as follows for each Fund:
| | Undistributed ordinary income | Capital loss carryforward | Net unrealized appreciation (depreciation) on securities and other investments |
| Energy Portfolio | $8,868,824 | $(545,757,582) | $82,660,244 |
| Energy Service Portfolio | 6,220,102 | (309,513,871) | (25,814,067) |
| Natural Gas Portfolio | 2,783,018 | (425,612,977) | 7,362,188 |
| Natural Resources Portfolio | – | (302,154,374) | 36,411,684 |
Natural Resources Portfolio intends to elect to defer to its next fiscal year $1,258,378 of ordinary losses recognized during the period January 1, 2021 to February 28, 2021.
Capital loss carryforwards are only available to offset future capital gains of the Funds to the extent provided by regulations and may be limited. The capital loss carryforward information presented below, including any applicable limitation, is estimated as of fiscal period end and is subject to adjustment.
| | No expiration | | |
| | Short-term | Long-term | Total capital loss carryfoward |
| Energy Portfolio | $(318,163,884) | $(227,593,698) | $(545,757,582) |
| Energy Service Portfolio | (61,356,240) | (248,157,631) | (309,513,871) |
| Natural Gas Portfolio | (90,706,831) | (334,906,146) | (425,612,977) |
| Natural Resources Portfolio | (94,745,607) | (207,408,767) | (302,154,374) |
The tax character of distributions paid was as follows:
| February 28, 2021 | | |
| | Ordinary Income | Total |
| Energy Portfolio | $24,866,401 | $24,866,401 |
| Energy Service Portfolio | 3,350,025 | 3,350,025 |
| Natural Gas Portfolio | 2,175,969 | 2,175,969 |
| Natural Resources Portfolio | 4,520,020 | 4,520,020 |
| February 29,2020 | | |
| | Ordinary Income | Total |
| Energy Portfolio | $17,018,375 | $17,018,375 |
| Energy Service Portfolio | 4,506,594 | 4,506,594 |
| Natural Gas Portfolio | 1,660,041 | 1,660,041 |
| Natural Resources Portfolio | 6,015,518 | 6,015,518 |
Restricted Securities (including Private Placements). The Funds may invest in securities that are subject to legal or contractual restrictions on resale. These securities generally may be resold in transactions exempt from registration or to the public if the securities are registered. Disposal of these securities may involve time-consuming negotiations and expense, and prompt sale at an acceptable price may be difficult. Information regarding restricted securities is included at the end of each applicable Fund's Schedule of Investments.
4. Purchases and Sales of Investments.
Purchases and sales of securities, other than short-term securities, are noted in the table below.
| | Purchases ($) | Sales ($) |
| Energy Portfolio | 392,749,194 | 211,428,820 |
| Energy Service Portfolio | 136,046,535 | 60,691,165 |
| Natural Gas Portfolio | 127,585,912 | 116,079,542 |
| Natural Resources Portfolio | 227,902,139 | 274,163,820 |
5. Fees and Other Transactions with Affiliates.
Management Fee. Fidelity Management & Research Company LLC (the investment adviser) and its affiliates provide the Funds with investment management related services for which the Funds pay a monthly management fee. The management fee is the sum of an individual fund fee rate and an annualized group fee rate. The individual fund fee rate is applied to each Fund's average net assets. The group fee rate is based upon the monthly average net assets of a group of registered investment companies with which the investment adviser has management contracts. The group fee rate decreases as assets under management increase and increases as assets under management decrease. For the reporting period, each Fund's annual management fee rate expressed as a percentage of each Fund's average net assets was as follows:
| | Individual Rate | Group Rate | Total |
| Energy Portfolio | .30% | .23% | .53% |
| Energy Service Portfolio | .30% | .23% | .53% |
| Natural Gas Portfolio | .30% | .23% | .53% |
| Natural Resources Portfolio | .30% | .23% | .53% |
Transfer Agent Fees. Fidelity Investments Institutional Operations Company LLC (FIIOC), an affiliate of the investment adviser, is the Funds' transfer, dividend disbursing and shareholder servicing agent. FIIOC receives account fees and asset-based fees that vary according to account size and type of account. FIIOC pays for typesetting, printing and mailing of shareholder reports, except proxy statements. For the period, transfer agent fees were equivalent to the following annual rates expressed as a percentage of average net assets:
| Energy Portfolio | .25% |
| Energy Service Portfolio | .27% |
| Natural Gas Portfolio | .27% |
| Natural Resources Portfolio | .27% |
Accounting Fees. Fidelity Service Company, Inc. (FSC), an affiliate of the investment adviser, maintains each Fund's accounting records. The accounting fee is based on the level of average net assets for each month. For the period, the fees were equivalent to the following annual rates:
| | % of Average Net Assets |
| Energy Portfolio | .04 |
| Energy Service Portfolio | .04 |
| Natural Gas Portfolio | .04 |
| Natural Resources Portfolio | .04 |
Brokerage Commissions. A portion of portfolio transactions were placed with brokerage firms which are affiliates of the investment adviser. Brokerage commissions are included in net realized gain (loss) and change in net unrealized appreciation (depreciation) in the Statement of Operations. The commissions paid to these affiliated firms were as follows:
| | Amount |
| Energy Portfolio | $23,004 |
| Energy Service Portfolio | 18,213 |
| Natural Gas Portfolio | 6,807 |
| Natural Resources Portfolio | 7,252 |
Interfund Lending Program. Pursuant to an Exemptive Order issued by the SEC, each Fund, along with other registered investment companies having management contracts with Fidelity Management & Research Company LLC (FMR), or other affiliated entities of FMR, may participate in an interfund lending program. This program provides an alternative credit facility allowing each Fund to borrow from, or lend money to, other participating affiliated funds. At period end, there were no interfund loans outstanding. Activity in this program during the period for which loans were outstanding was as follows:
| | Borrower or Lender | Average Loan Balance | Weighted Average Interest Rate | Interest Expense |
| Energy Portfolio | Borrower | $6,057,000 | .33% | $164 |
| Natural Resources Portfolio | Borrower | $6,770,067 | .52% | $1,463 |
Interfund Trades. Funds may purchase from or sell securities to other Fidelity Funds under procedures adopted by the Board. The procedures have been designed to ensure these interfund trades are executed in accordance with Rule 17a-7 of the 1940 Act. Any interfund trades are included within the respective purchases and sales amounts shown in the Purchases and Sales of Investments note and are noted in the table below.
| | Purchases ($) | Sales ($) |
| Energy Portfolio | 36,807,993 | 11,173,133 |
| Energy Service Portfolio | 3,992,142 | 3,031,734 |
| Natural Gas Portfolio | 6,518,516 | 6,637,438 |
| Natural Resources Portfolio | 10,125,402 | 14,807,292 |
Prior Fiscal Year Affiliated Redemptions In-Kind. During the prior period, 1,155,173 shares of the Energy Portfolio were redeemed in-kind for investments and cash with a value of $37,704,833. Energy Portfolio had a net realized gain of $6,179,274 on investments delivered through in-kind redemptions. The amount of the in-kind redemptions is included in share transactions in the accompanying Statement of Changes in Net Assets as well as the Notes to Financial Statements. Energy Portfolio recognized no gain or loss for federal income tax purposes.
6. Committed Line of Credit.
Certain Funds participate with other funds managed by the investment adviser or an affiliate in a $4.25 billion credit facility (the "line of credit") to be utilized for temporary or emergency purposes to fund shareholder redemptions or for other short-term liquidity purposes. The participating funds have agreed to pay commitment fees on their pro-rata portion of the line of credit, which are reflected in Miscellaneous expenses on the Statement of Operations, and are listed below.
| | Amount |
| Energy Portfolio | $1,568 |
| Energy Service Portfolio | 353 |
| Natural Gas Portfolio | 225 |
| Natural Resources Portfolio | 635 |
During the period, there were no borrowings on this line of credit.
7. Security Lending.
Funds lend portfolio securities from time to time in order to earn additional income. Lending agents are used, including National Financial Services (NFS), an affiliate of the investment adviser. Pursuant to a securities lending agreement, NFS will receive a fee, which is capped at 9.9% of a fund's daily lending revenue, for its services as lending agent. A fund may lend securities to certain qualified borrowers, including NFS. On the settlement date of the loan, a fund receives collateral (in the form of U.S. Treasury obligations, letters of credit and/or cash) against the loaned securities and maintains collateral in an amount not less than 100% of the market value of the loaned securities during the period of the loan. The market value of the loaned securities is determined at the close of business of a fund and any additional required collateral is delivered to a fund on the next business day. A fund or borrower may terminate the loan at any time, and if the borrower defaults on its obligation to return the securities loaned because of insolvency or other reasons, a fund may apply collateral received from the borrower against the obligation. A fund may experience delays and costs in recovering the securities loaned. Any cash collateral received is invested in the Fidelity Securities Lending Cash Central Fund. Any loaned securities are identified as such in the Schedule of Investments, and the value of loaned securities and cash collateral at period end, as applicable, are presented in the Statement of Assets and Liabilities. Security lending income represents the income earned on investing cash collateral, less rebates paid to borrowers and any lending agent fees associated with the loan, plus any premium payments received for lending certain types of securities. Security lending income is presented in the Statement of Operations as a component of income from Fidelity Central Funds. Affiliated security lending activity, if any, was as follows:
| | Total Security Lending Income Fees Paid to NFS | Security Lending Income From Securities Loaned to NFS | Value of Securities Loaned to NFS at Period End |
| Energy Portfolio | $4,986 | $– | $– |
| Energy Service Portfolio | $10,462 | $1,562 | $– |
| Natural Gas Portfolio | $766 | $– | $– |
| Natural Resources Portfolio | $1,484 | $– | $– |
8. Expense Reductions.
Commissions paid to certain brokers with whom the investment adviser, or its affiliates, places trades on behalf of certain Funds include an amount in addition to trade execution, which may be rebated back to the Funds to offset expenses. In addition, through arrangements with each applicable Fund's custodian, credits realized as a result of certain uninvested cash balances were used to reduce each applicable Fund's expenses. All of the applicable expense reductions are noted in the table below.
| | Brokerage service rebates | Custodian credits |
| Energy Portfolio | $69,692 | $170 |
| Energy Service Portfolio | 24,726 | – |
| Natural Gas Portfolio | 21,985 | – |
| Natural Resources Portfolio | 15,522 | – |
In addition, during the period the investment adviser or an affiliate reimbursed and/or waived a portion of operating expenses as follows:
| | Amount |
| Energy Portfolio | $2,925 |
| Energy Service Portfolio | 709 |
| Natural Gas Portfolio | 452 |
| Natural Resources Portfolio | 1,203 |
9. Other.
The Funds' organizational documents provide former and current trustees and officers with a limited indemnification against liabilities arising in connection with the performance of their duties to the Funds. In the normal course of business, the Funds may also enter into contracts that provide general indemnifications. The Funds' maximum exposure under these arrangements is unknown as this would be dependent on future claims that may be made against the Funds. The risk of material loss from such claims is considered remote.
10. Coronavirus (COVID-19) Pandemic.
An outbreak of COVID-19 first detected in China during December 2019 has since spread globally and was declared a pandemic by the World Health Organization during March 2020. Developments that disrupt global economies and financial markets, such as the COVID-19 pandemic, may magnify factors that affect the Funds' performance.
Report of Independent Registered Public Accounting Firm
To the Board of Trustees of Fidelity Select Portfolios and the Shareholders of Energy Portfolio, Energy Service Portfolio, Natural Gas Portfolio and Natural Resources Portfolio
Opinions on the Financial Statements
We have audited the accompanying statements of assets and liabilities, including the schedules of investments, of Energy Portfolio, Energy Service Portfolio, Natural Gas Portfolio and Natural Resources Portfolio (four of the funds constituting Fidelity Select Portfolios, hereafter collectively referred to as the “Funds”) as of February 28, 2021, the related statements of operations for the year ended February 28, 2021, the statements of changes in net assets for each of the two years in the period ended February 28, 2021, including the related notes, and the financial highlights for each of the five years in the period ended February 28, 2021 (collectively referred to as the “financial statements”). In our opinion, the financial statements present fairly, in all material respects, the financial position of each of the Funds as of February 28, 2021, the results of each of their operations for the year then ended, the changes in each of their net assets for each of the two years in the period ended February 28, 2021 and each of the financial highlights for each of the five years in the period ended February 28, 2021 in conformity with accounting principles generally accepted in the United States of America.
Basis for Opinions
These financial statements are the responsibility of the Funds’ management. Our responsibility is to express an opinion on the Funds’ financial statements based on our audits. We are a public accounting firm registered with the Public Company Accounting Oversight Board (United States) (PCAOB) and are required to be independent with respect to the Funds in accordance with the U.S. federal securities laws and the applicable rules and regulations of the Securities and Exchange Commission and the PCAOB.
We conducted our audits of these financial statements in accordance with the standards of the PCAOB. Those standards require that we plan and perform the audit to obtain reasonable assurance about whether the financial statements are free of material misstatement, whether due to error or fraud.
Our audits included performing procedures to assess the risks of material misstatement of the financial statements, whether due to error or fraud, and performing procedures that respond to those risks. Such procedures included examining, on a test basis, evidence regarding the amounts and disclosures in the financial statements. Our audits also included evaluating the accounting principles used and significant estimates made by management, as well as evaluating the overall presentation of the financial statements. Our procedures included confirmation of securities owned as of February 28, 2021 by correspondence with the custodian and brokers; when replies were not received from brokers, we performed other auditing procedures. We believe that our audits provide a reasonable basis for our opinions.
/s/ PricewaterhouseCoopers LLP
Boston, Massachusetts
April 15, 2021
We have served as the auditor of one or more investment companies in the Fidelity group of funds since 1932.
Trustees and Officers
The Trustees, Members of the Advisory Board (if any), and officers of the trust and funds, as applicable, are listed below. The Board of Trustees governs each fund and is responsible for protecting the interests of shareholders. The Trustees are experienced executives who meet periodically throughout the year to oversee each fund's activities, review contractual arrangements with companies that provide services to each fund, oversee management of the risks associated with such activities and contractual arrangements, and review each fund's performance. Each of the Trustees oversees 309 funds.
The Trustees hold office without limit in time except that (a) any Trustee may resign; (b) any Trustee may be removed by written instrument, signed by at least two-thirds of the number of Trustees prior to such removal; (c) any Trustee who requests to be retired or who has become incapacitated by illness or injury may be retired by written instrument signed by a majority of the other Trustees; and (d) any Trustee may be removed at any special meeting of shareholders by a two-thirds vote of the outstanding voting securities of the trust. Each Trustee who is not an interested person (as defined in the 1940 Act) of the trust and the funds is referred to herein as an Independent Trustee. Each Independent Trustee shall retire not later than the last day of the calendar year in which his or her 75th birthday occurs. The Independent Trustees may waive this mandatory retirement age policy with respect to individual Trustees. Officers and Advisory Board Members hold office without limit in time, except that any officer or Advisory Board Member may resign or may be removed by a vote of a majority of the Trustees at any regular meeting or any special meeting of the Trustees. Except as indicated, each individual has held the office shown or other offices in the same company for the past five years.
Each fund’s Statement of Additional Information (SAI) includes more information about the Trustees. To request a free copy, call Fidelity at 1-800-544-8544.
Experience, Skills, Attributes, and Qualifications of the Trustees. The Governance and Nominating Committee has adopted a statement of policy that describes the experience, qualifications, attributes, and skills that are necessary and desirable for potential Independent Trustee candidates (Statement of Policy). The Board believes that each Trustee satisfied at the time he or she was initially elected or appointed a Trustee, and continues to satisfy, the standards contemplated by the Statement of Policy. The Governance and Nominating Committee also engages professional search firms to help identify potential Independent Trustee candidates who have the experience, qualifications, attributes, and skills consistent with the Statement of Policy. From time to time, additional criteria based on the composition and skills of the current Independent Trustees, as well as experience or skills that may be appropriate in light of future changes to board composition, business conditions, and regulatory or other developments, have also been considered by the professional search firms and the Governance and Nominating Committee. In addition, the Board takes into account the Trustees' commitment and participation in Board and committee meetings, as well as their leadership of standing and ad hoc committees throughout their tenure.
In determining that a particular Trustee was and continues to be qualified to serve as a Trustee, the Board has considered a variety of criteria, none of which, in isolation, was controlling. The Board believes that, collectively, the Trustees have balanced and diverse experience, qualifications, attributes, and skills, which allow the Board to operate effectively in governing each fund and protecting the interests of shareholders. Information about the specific experience, skills, attributes, and qualifications of each Trustee, which in each case led to the Board's conclusion that the Trustee should serve (or continue to serve) as a trustee of the funds, is provided below.
Board Structure and Oversight Function. Robert A. Lawrence is an interested person and currently serves as Acting Chairman. The Trustees have determined that an interested Chairman is appropriate and benefits shareholders because an interested Chairman has a personal and professional stake in the quality and continuity of services provided to the funds. Independent Trustees exercise their informed business judgment to appoint an individual of their choosing to serve as Chairman, regardless of whether the Trustee happens to be independent or a member of management. The Independent Trustees have determined that they can act independently and effectively without having an Independent Trustee serve as Chairman and that a key structural component for assuring that they are in a position to do so is for the Independent Trustees to constitute a substantial majority for the Board. The Independent Trustees also regularly meet in executive session. David M. Thomas serves as Lead Independent Trustee and as such (i) acts as a liaison between the Independent Trustees and management with respect to matters important to the Independent Trustees and (ii) with management prepares agendas for Board meetings.
Fidelity® funds are overseen by different Boards of Trustees. The funds' Board oversees Fidelity's high income and certain equity funds, and other Boards oversee Fidelity's investment-grade bond, money market, asset allocation, and other equity funds. The asset allocation funds may invest in Fidelity® funds overseen by the funds' Board. The use of separate Boards, each with its own committee structure, allows the Trustees of each group of Fidelity® funds to focus on the unique issues of the funds they oversee, including common research, investment, and operational issues. On occasion, the separate Boards establish joint committees to address issues of overlapping consequences for the Fidelity® funds overseen by each Board.
The Trustees operate using a system of committees to facilitate the timely and efficient consideration of all matters of importance to the Trustees, each fund, and fund shareholders and to facilitate compliance with legal and regulatory requirements and oversight of the funds' activities and associated risks. The Board, acting through its committees, has charged FMR and its affiliates with (i) identifying events or circumstances the occurrence of which could have demonstrably adverse effects on the funds' business and/or reputation; (ii) implementing processes and controls to lessen the possibility that such events or circumstances occur or to mitigate the effects of such events or circumstances if they do occur; and (iii) creating and maintaining a system designed to evaluate continuously business and market conditions in order to facilitate the identification and implementation processes described in (i) and (ii) above. Because the day-to-day operations and activities of the funds are carried out by or through FMR, its affiliates, and other service providers, the funds' exposure to risks is mitigated but not eliminated by the processes overseen by the Trustees. While each of the Board's committees has responsibility for overseeing different aspects of the funds' activities, oversight is exercised primarily through the Operations, Audit, and Compliance Committees. Appropriate personnel, including but not limited to the funds' Chief Compliance Officer (CCO), FMR's internal auditor, the independent accountants, the funds' Treasurer and portfolio management personnel, make periodic reports to the Board's committees, as appropriate, including an annual review of Fidelity's risk management program for the Fidelity® funds. The responsibilities of each standing committee, including their oversight responsibilities, are described further under "Standing Committees of the Trustees."
Interested Trustees*:
Correspondence intended for a Trustee who is an interested person may be sent to Fidelity Investments, 245 Summer Street, Boston, Massachusetts 02210.
Name, Year of Birth; Principal Occupations and Other Relevant Experience+
Bettina Doulton (1964)
Year of Election or Appointment: 2020
Trustee
Ms. Doulton also serves as Trustee of other Fidelity® funds. Prior to her retirement, Ms. Doulton served in a variety of positions at Fidelity Investments, including as a managing director of research (2006-2007), portfolio manager to certain Fidelity® funds (1993-2005), equity analyst and portfolio assistant (1990-1993), and research assistant (1987-1990). Ms. Doulton currently owns and operates Phi Builders + Architects and Cellardoor Winery. Previously, Ms. Doulton served as a member of the Board of Brown Capital Management, LLC (2013-2018).
Robert A. Lawrence (1952)
Year of Election or Appointment: 2020
Trustee
Acting Chairman of the Board of Trustees
Mr. Lawrence also serves as Trustee of other funds. Previously, Mr. Lawrence served as a Member of the Advisory Board of certain funds. Prior to his retirement in 2008, Mr. Lawrence served as Vice President of certain Fidelity® funds (2006-2008), Senior Vice President, Head of High Income Division of Fidelity Management & Research Company (investment adviser firm, 2006-2008), and President of Fidelity Strategic Investments (investment adviser firm, 2002-2005).
* Determined to be an “Interested Trustee” by virtue of, among other things, his or her affiliation with the trust or various entities under common control with FMR.
+ The information includes the Trustee's principal occupation during the last five years and other information relating to the experience, attributes, and skills relevant to the Trustee's qualifications to serve as a Trustee, which led to the conclusion that the Trustee should serve as a Trustee for each fund.
Independent Trustees:
Correspondence intended for an Independent Trustee may be sent to Fidelity Investments, P.O. Box 55235, Boston, Massachusetts 02205-5235.
Name, Year of Birth; Principal Occupations and Other Relevant Experience+
Dennis J. Dirks (1948)
Year of Election or Appointment: 2018
Trustee
Mr. Dirks also serves as Trustee of other Fidelity® funds. Prior to his retirement in May 2003, Mr. Dirks served as Chief Operating Officer and as a member of the Board of The Depository Trust & Clearing Corporation (financial markets infrastructure), President, Chief Operating Officer and a member of the Board of The Depository Trust Company (DTC), President and a member of the Board of the National Securities Clearing Corporation (NSCC), Chief Executive Officer and a member of the Board of the Government Securities Clearing Corporation and Chief Executive Officer and a member of the Board of the Mortgage-Backed Securities Clearing Corporation. Mr. Dirks currently serves as a member of the Finance Committee (2016-present) and Board (2017-present) and is Treasurer (2018-present) of the Asolo Repertory Theatre.
Donald F. Donahue (1950)
Year of Election or Appointment: 2018
Trustee
Mr. Donahue also serves as Trustee of other Fidelity® funds. Mr. Donahue serves as President and Chief Executive Officer of Miranda Partners, LLC (risk consulting for the financial services industry, 2012-present). Previously, Mr. Donahue served as Chief Executive Officer (2006-2012), Chief Operating Officer (2003-2006) and Managing Director, Customer Marketing and Development (1999-2003) of The Depository Trust & Clearing Corporation (financial markets infrastructure). Mr. Donahue currently serves as a member (2007-present) and Co-Chairman (2016-present) of the Board of United Way of New York, a member of the Board of NYC Leadership Academy (2012-present) and a member of the Board of Advisors of Ripple Labs, Inc. (financial services, 2015-present). Mr. Donahue previously served as a member of the Advisory Board of certain Fidelity® funds (2015-2018).
Vicki L. Fuller (1957)
Year of Election or Appointment: 2020
Trustee
Ms. Fuller also serves as Trustee of other Fidelity® funds. Previously, Ms. Fuller served as a member of the Advisory Board of certain Fidelity® funds (2018-2020), Chief Investment Officer of the New York State Common Retirement Fund (2012-2018) and held a variety of positions at AllianceBernstein L.P. (global asset management, 1985-2012), including Managing Director (2006-2012) and Senior Vice President and Senior Portfolio Manager (2001-2006). Ms. Fuller currently serves as a member of the Board, Audit Committee and Nominating and Governance Committee of The Williams Companies, Inc. (natural gas infrastructure, 2018-present), as a member of the Board, Audit Committee and Nominating and Governance Committee of two Blackstone business development companies (2020-present) and as a member of the Board of Treliant, LLC (consulting, 2019-present).
Patricia L. Kampling (1959)
Year of Election or Appointment: 2020
Trustee
Ms. Kampling also serves as Trustee of other Fidelity® funds. Prior to her retirement, Ms. Kampling served as Chairman of the Board and Chief Executive Officer (2012-2019), President and Chief Operating Officer (2011-2012) and Executive Vice President and Chief Financial Officer (2010-2011) of Alliant Energy Corporation. Ms. Kampling currently serves as a member of the Board, Compensation Committee and Executive Committee and as Chair of the Audit Committee of Briggs & Stratton Corporation (manufacturing, 2011-present) and as a member of the Board, Audit, Finance and Risk Committee and Safety, Environmental, Technology and Operations Committee of American Water Works Company, Inc. (utilities company, 2019-present). In addition, Ms. Kampling currently serves as a member of the Board of the Nature Conservancy, Wisconsin Chapter (2019-present). Previously, Ms. Kampling served as a Member of the Advisory Board of certain Fidelity® funds (2020), a member of the Board of Interstate Power and Light Company (2012-2019) and Wisconsin Power and Light Company (2012-2019) (each a subsidiary of Alliant Energy Corporation) and as a member of the Board and Workforce Development Committee of the Business Roundtable (2018-2019).
Thomas A. Kennedy (1955)
Year of Election or Appointment: 2021
Trustee
Mr. Kennedy also serves as Trustee of other Fidelity® funds. Previously, Mr. Kennedy served as a Member of the Advisory Board of certain Fidelity® funds (2020) and held a variety of positions at Raytheon Company (aerospace and defense, 1983-2020), including Chairman and Chief Executive Officer (2014-2020) and Executive Vice President and Chief Operating Officer (2013-2014). Mr. Kennedy currently serves as Executive Chairman of the Board of Directors of Raytheon Technologies Corporation (aerospace and defense, 2020-present). He is also a member of the Rutgers School of Engineering Industry Advisory Board (2011-present) and a member of the UCLA Engineering Dean’s Executive Board (2016-present).
Garnett A. Smith (1947)
Year of Election or Appointment: 2013
Trustee
Mr. Smith also serves as Trustee of other Fidelity® funds. Prior to his retirement, Mr. Smith served as Chairman and Chief Executive Officer (1990-1997) and President (1986-1990) of Inbrand Corp. (manufacturer of personal absorbent products). Prior to his employment with Inbrand Corp., he was employed by a retail fabric chain and North Carolina National Bank (now Bank of America). Mr. Smith previously served as a member of the Advisory Board of certain Fidelity® funds (2012-2013).
David M. Thomas (1949)
Year of Election or Appointment: 2018
Trustee
Lead Independent Trustee
Mr. Thomas also serves as Trustee of other Fidelity® funds. Previously, Mr. Thomas served as Executive Chairman (2005-2006) and Chairman and Chief Executive Officer (2000-2005) of IMS Health, Inc. (pharmaceutical and healthcare information solutions). Mr. Thomas currently serves as Non-Executive Chairman of the Board of Fortune Brands Home and Security (home and security products, 2011-present), and a member of the Board (2004-present) and Presiding Director (2013-present) of Interpublic Group of Companies, Inc. (marketing communication).
Susan Tomasky (1953)
Year of Election or Appointment: 2020
Trustee
Ms. Tomasky also serves as Trustee of other Fidelity® funds. Prior to her retirement, Ms. Tomasky served in various executive officer positions at American Electric Power Company, Inc. (1998-2011), including most recently as President of AEP Transmission (2007-2011). Ms. Tomasky currently serves as a member of the Board and Sustainability Committee and as Chair of the Audit Committee of Marathon Petroleum Corporation (2018-present) and as a member of the Board, Corporate Governance Committee and Organization and Compensation Committee and as Chair of the Audit Committee of Public Service Enterprise Group, Inc. (utilities company, 2012-present). In addition, Ms. Tomasky currently serves as a member of the Board of the Columbus Regional Airport Authority (2007-present), as a member of the Board of the Royal Shakespeare Company – America (2009-present), as a member of the Board of the Columbus Association for the Performing Arts (2011-present) and as a member of the Board of Kenyon College (2016-present). Previously, Ms. Tomasky served as a Member of the Advisory Board of certain Fidelity® funds (2020), a member of the Board (2011-2019) and as Lead Independent Director (2015-2018) of Andeavor Corporation (previously Tesoro Corporation) (independent oil refiner and marketer) and as a member of the Board of Summit Midstream Partners LP (energy, 2012-2018).
Michael E. Wiley (1950)
Year of Election or Appointment: 2008
Trustee
Mr. Wiley also serves as Trustee of other Fidelity® funds. Previously, Mr. Wiley served as a member of the Advisory Board of certain Fidelity® funds (2018-2020), Chairman, President and CEO of Baker Hughes, Inc. (oilfield services, 2000-2004). Mr. Wiley also previously served as a member of the Board of Andeavor Corporation (independent oil refiner and marketer, 2005-2018), a member of the Board of Andeavor Logistics LP (natural resources logistics, 2015-2018) and a member of the Board of High Point Resources (exploration and production, 2005-2020).
+ The information includes the Trustee's principal occupation during the last five years and other information relating to the experience, attributes, and skills relevant to the Trustee's qualifications to serve as a Trustee, which led to the conclusion that the Trustee should serve as a Trustee for each fund.
Advisory Board Members and Officers:
Correspondence intended for a Member of the Advisory Board (if any) may be sent to Fidelity Investments, P.O. Box 55235, Boston, Massachusetts 02205-5235. Correspondence intended for an officer or Peter S. Lynch may be sent to Fidelity Investments, 245 Summer Street, Boston, Massachusetts 02210. Officers appear below in alphabetical order.
Name, Year of Birth; Principal Occupation
Ned C. Lautenbach (1944)
Year of Election or Appointment: 2021
Member of the Advisory Board
Mr. Lautenbach also serves as a Member of the Advisory Board of other Fidelity® funds. Mr. Lautenbach currently serves as Chair of the Board of Governors, State University System of Florida (2013-present) and is a member of the Council on Foreign Relations (1994-present). He is also a member and has in the past served as Chairman of the Board of Directors of Artis-Naples (2012-present). Previously, Mr. Lautenbach served as a Trustee of certain Fidelity® funds (2000-2020) and a member and then Lead Director of the Board of Directors of Eaton Corporation (diversified industrial, 1997-2016). He was also a Partner at Clayton, Dubilier & Rice, LLC (private equity investment, 1998-2010); as well as Director of Sony Corporation (2006-2007). In addition, Mr. Lautenbach had a 30-year career with IBM (technology company), during which time he served as Senior Vice President and as a member of the Corporate Executive Committee (1968-1998).
Peter S. Lynch (1944)
Year of Election or Appointment: 2018
Member of the Advisory Board
Mr. Lynch also serves as a Member of the Advisory Board of other Fidelity® funds. Mr. Lynch is Vice Chairman and a Director of Fidelity Management & Research Company LLC (investment adviser firm). In addition, Mr. Lynch serves as a Trustee of Boston College and as the Chairman of the Inner-City Scholarship Fund. Previously, Mr. Lynch served as Vice Chairman and a Director of FMR Co., Inc. (investment adviser firm) and on the Special Olympics International Board of Directors (1997-2006).
Craig S. Brown (1977)
Year of Election or Appointment: 2019
Assistant Treasurer
Mr. Brown also serves as Assistant Treasurer of other funds. Mr. Brown is an employee of Fidelity Investments (2013-present).
John J. Burke III (1964)
Year of Election or Appointment: 2018
Chief Financial Officer
Mr. Burke also serves as Chief Financial Officer of other funds. Mr. Burke serves as Head of Investment Operations for Fidelity Fund and Investment Operations (2018-present) and is an employee of Fidelity Investments (1998-present). Previously Mr. Burke served as head of Asset Management Investment Operations (2012-2018).
William C. Coffey (1969)
Year of Election or Appointment: 2019
Assistant Secretary
Mr. Coffey also serves as Assistant Secretary of other funds. He is Senior Vice President and Deputy General Counsel of FMR LLC (diversified financial services company, 2010-present), and is an employee of Fidelity Investments. Previously, Mr. Coffey served as Secretary and CLO of certain funds (2018-2019); CLO, Secretary, and Senior Vice President of Fidelity Management & Research Company and FMR Co., Inc. (investment adviser firms, 2018-2019); Secretary of Fidelity SelectCo, LLC and Fidelity Investments Money Management, Inc. (investment adviser firms, 2018-2019); CLO of Fidelity Management & Research (Hong Kong) Limited, FMR Investment Management (UK) Limited, and Fidelity Management & Research (Japan) Limited (investment adviser firms, 2018-2019); and Assistant Secretary of certain funds (2009-2018).
Timothy M. Cohen (1969)
Year of Election or Appointment: 2018
Vice President
Mr. Cohen also serves as Vice President of other funds. Mr. Cohen serves as Co-Head of Equity (2018-present), a Director of Fidelity Management & Research (Japan) Limited (investment adviser firm, 2016-present), and is an employee of Fidelity Investments. Previously, Mr. Cohen served as Executive Vice President of Fidelity SelectCo, LLC (2019), Head of Global Equity Research (2016-2018), Chief Investment Officer - Equity and a Director of Fidelity Management & Research (U.K.) Inc. (investment adviser firm, 2013-2015) and as a Director of Fidelity Management & Research (Hong Kong) Limited (investment adviser firm, 2017).
Jonathan Davis (1968)
Year of Election or Appointment: 2010
Assistant Treasurer
Mr. Davis also serves as Assistant Treasurer of other funds. Mr. Davis serves as Assistant Treasurer of FMR Capital, Inc. (2017-present) and is an employee of Fidelity Investments. Previously, Mr. Davis served as Vice President and Associate General Counsel of FMR LLC (diversified financial services company, 2003-2010).
Laura M. Del Prato (1964)
Year of Election or Appointment: 2018
Assistant Treasurer
Ms. Del Prato also serves as an officer of other funds. Ms. Del Prato is an employee of Fidelity Investments (2017-present). Previously, Ms. Del Prato served as President and Treasurer of The North Carolina Capital Management Trust: Cash Portfolio and Term Portfolio (2018-2020). Prior to joining Fidelity Investments, Ms. Del Prato served as a Managing Director and Treasurer of the JPMorgan Mutual Funds (2014-2017). Prior to JPMorgan, Ms. Del Prato served as a partner at Cohen Fund Audit Services (accounting firm, 2012-2013) and KPMG LLP (accounting firm, 2004-2012).
Colm A. Hogan (1973)
Year of Election or Appointment: 2020
Assistant Treasurer
Mr. Hogan also serves as an officer of other funds. Mr. Hogan serves as Assistant Treasurer of FMR Capital, Inc. (2017-present) and is an employee of Fidelity Investments (2005-present). Previously, Mr. Hogan served as Deputy Treasurer of certain Fidelity® funds (2016-2020) and Assistant Treasurer of certain Fidelity® funds (2016-2018).
Pamela R. Holding (1964)
Year of Election or Appointment: 2018
Vice President
Ms. Holding also serves as Vice President of other funds. Ms. Holding serves as Co-Head of Equity (2018-present) and is an employee of Fidelity Investments (2013-present). Previously, Ms. Holding served as Executive Vice President of Fidelity SelectCo, LLC (2019) and as Chief Investment Officer of Fidelity Institutional Asset Management (2013-2018).
Cynthia Lo Bessette (1969)
Year of Election or Appointment: 2019
Secretary and Chief Legal Officer (CLO)
Ms. Lo Bessette also serves as an officer of other funds. Ms. Lo Bessette serves as CLO, Secretary, and Senior Vice President of Fidelity Management & Research Company LLC (investment adviser firm, 2019-present); and CLO of Fidelity Management & Research (Hong Kong) Limited, FMR Investment Management (UK) Limited, and Fidelity Management & Research (Japan) Limited (investment adviser firms, 2019-present). She is a Senior Vice President and Deputy General Counsel of FMR LLC (diversified financial services company, 2019-present), and is an employee of Fidelity Investments. Previously, Ms. Lo Bessette served as CLO, Secretary, and Senior Vice President of FMR Co., Inc. (investment adviser firm, 2019); Secretary of Fidelity SelectCo, LLC and Fidelity Investments Money Management, Inc. (investment adviser firms, 2019). Prior to joining Fidelity Investments, Ms. Lo Bessette was Executive Vice President, General Counsel (2016-2019) and Senior Vice President, Deputy General Counsel (2015-2016) of OppenheimerFunds (investment management company) and Deputy Chief Legal Officer (2013-2015) of Jennison Associates LLC (investment adviser firm).
Chris Maher (1972)
Year of Election or Appointment: 2020
Deputy Treasurer
Mr. Maher also serves as an officer of other funds. Mr. Maher serves as Assistant Treasurer of FMR Capital, Inc. (2017-present), and is an employee of Fidelity Investments (2008-present). Previously, Mr. Maher served as Assistant Treasurer of certain funds (2013-2020); Vice President of Asset Management Compliance (2013), Vice President of the Program Management Group of FMR (investment adviser firm, 2010-2013), and Vice President of Valuation Oversight (2008-2010).
Jason P. Pogorelec (1975)
Year of Election or Appointment: 2020
Chief Compliance Officer
Mr. Pogorelec also serves as Chief Compliance Officer of other funds. Mr. Pogorelec is a senior Vice President of Asset Management Compliance for Fidelity Investments and is an employee of Fidelity Investments (2006-present). Previously, Mr. Pogorelec served as Vice President, Associate General Counsel for Fidelity Investments (2010-2020) and Assistant Secretary of certain Fidelity funds (2015-2020).
Brett Segaloff (1972)
Year of Election or Appointment: 2021
Anti-Money Laundering (AML) Officer
Mr. Segaloff also serves as an AML Officer of other funds and other related entities. He is Director, Anti-Money Laundering (2007-present) of FMR LLC (diversified financial services company) and is an employee of Fidelity Investments (1996-present).
Stacie M. Smith (1974)
Year of Election or Appointment: 2018
President and Treasurer
Ms. Smith also serves as an officer of other funds. Ms. Smith serves as Assistant Treasurer of FMR Capital, Inc. (2017-present), is an employee of Fidelity Investments (2009-present), and has served in other fund officer roles. Prior to joining Fidelity Investments, Ms. Smith served as Senior Audit Manager of Ernst & Young LLP (accounting firm, 1996-2009). Previously, Ms. Smith served as Assistant Treasurer (2013-2019) and Deputy Treasurer (2013-2016) of certain Fidelity® funds.
Marc L. Spector (1972)
Year of Election or Appointment: 2017
Assistant Treasurer
Mr. Spector also serves as an officer of other funds. Mr. Spector serves as Assistant Treasurer of FMR Capital, Inc. (2017-present) and is an employee of Fidelity Investments (2016-present). Prior to joining Fidelity Investments, Mr. Spector served as Director at the Siegfried Group (accounting firm, 2013-2016), and prior to Siegfried Group as audit senior manager at Deloitte & Touche LLP (accounting firm, 2005-2013).
Jim Wegmann (1979)
Year of Election or Appointment: 2019
Assistant Treasurer
Mr. Wegmann also serves as Assistant Treasurer of other funds. Mr. Wegmann is an employee of Fidelity Investments (2011-present).
Shareholder Expense Example
As a shareholder, you incur two types of costs: (1) transaction costs, which may include sales charges (loads) on purchase payments or redemption proceeds, as applicable and (2) ongoing costs, which generally include management fees, distribution and/or service (12b-1) fees and other Fund expenses. This Example is intended to help you understand your ongoing costs (in dollars) of investing in a fund and to compare these costs with the ongoing costs of investing in other mutual funds.
The Example is based on an investment of $1,000 invested at the beginning of the period and held for the entire period (September 1, 2020 to February 28, 2021).
Actual Expenses
The first line of the accompanying table provides information about actual account values and actual expenses. You may use the information in this line, together with the amount you invested, to estimate the expenses that you paid over the period. Simply divide your account value by $1,000.00 (for example, an $8,600 account value divided by $1,000.00 = 8.6), then multiply the result by the number in the first line for a class/Fund under the heading entitled "Expenses Paid During Period" to estimate the expenses you paid on your account during this period. If any fund is a shareholder of any underlying mutual funds or exchange-traded funds (ETFs) (the Underlying Funds), such fund indirectly bears its proportional share of the expenses of the Underlying Funds in addition to the direct expenses incurred presented in the table. These fees and expenses are not included in the annualized expense ratio used to calculate the expense estimate in the table below.
Hypothetical Example for Comparison Purposes
The second line of the accompanying table provides information about hypothetical account values and hypothetical expenses based on the actual expense ratio and an assumed rate of return of 5% per year before expenses, which is not the actual return. The hypothetical account values and expenses may not be used to estimate the actual ending account balance or expenses you paid for the period. You may use this information to compare the ongoing costs of investing in the Fund and other funds. To do so, compare this 5% hypothetical example with the 5% hypothetical examples that appear in the shareholder reports of the other funds. If any fund is a shareholder of any Underlying Funds, such fund indirectly bears its proportional share of the expenses of the Underlying Funds in addition to the direct expenses as presented in the table. These fees and expenses are not included in the annualized expense ratio used to calculate the expense estimate in the table below.
Please note that the expenses shown in the table are meant to highlight your ongoing costs only and do not reflect any transaction costs. Therefore, the second line of the table is useful in comparing ongoing costs only, and will not help you determine the relative total costs of owning different funds. In addition, if these transactional costs were included, your costs would have been higher.
| | Annualized Expense Ratio-A | Beginning
Account Value
September 1, 2020 | Ending
Account Value
February 28, 2021 | Expenses Paid
During Period-B
September 1, 2020
to February 28, 2021 |
| Energy Portfolio | .83% | | | |
| Actual | | $1,000.00 | $1,404.50 | $4.95 |
| Hypothetical-C | | $1,000.00 | $1,020.68 | $4.16 |
| Energy Service Portfolio | .88% | | | |
| Actual | | $1,000.00 | $1,649.00 | $5.78 |
| Hypothetical-C | | $1,000.00 | $1,020.43 | $4.41 |
| Natural Gas Portfolio | .93% | | | |
| Actual | | $1,000.00 | $1,281.00 | $5.26 |
| Hypothetical-C | | $1,000.00 | $1,020.18 | $4.66 |
| Natural Resources Portfolio | .87% | | | |
| Actual | | $1,000.00 | $1,223.90 | $4.80 |
| Hypothetical-C | | $1,000.00 | $1,020.48 | $4.36 |
A Annualized expense ratio reflects expenses net of applicable fee waivers.
B Expenses are equal to the annualized expense ratio, multiplied by the average account value over the period, multiplied by 181/ 365 (to reflect the one-half year period). The fees and expenses of any Underlying Funds are not included in each annualized expense ratio.
C 5% return per year before expenses
Distributions (Unaudited)
A percentage of the dividends distributed during the fiscal year for the following funds qualify for the dividends–received deduction for corporate shareholders:
| | April 2020 | December 2020 |
| Energy Portfolio | 100% | 96% |
| Energy Service Portfolio | 58% | 63% |
| Natural Gas Portfolio | 99% | 66% |
| Natural Resources Portfolio | 100% | 89% |
A percentage of the dividends distributed during the fiscal year for the following funds may be taken into account as a dividend for purposes of the maximum rate under section 1(h)(11) of the Internal Revenue Code.
| | April 2020 | December 2020 |
| Energy Portfolio | 100% | 100% |
| Energy Service Portfolio | 100% | 85% |
| Natural Gas Portfolio | 100% | 100% |
| Natural Resources Portfolio | 100% | 100% |
The funds will notify shareholders in January 2022 of amounts for use in preparing 2021 income tax returns.
Board Approval of Investment Advisory Contracts
Energy Portfolio
Energy Service Portfolio
Natural Gas Portfolio
Natural Resources Portfolio
At its January 2021 meeting, the Board of Trustees, including the Independent Trustees (together, the Board), voted to continue the management contract with Fidelity Management & Research Company LLC (FMR), and the sub-advisory agreements and sub-subadvisory agreements, in each case, where applicable (together, the Advisory Contracts) for each fund for four months from February 1, 2021 through May 31, 2021, in connection with changes to the Board's meeting calendar.
The Board considered that the approval of each fund's Advisory Contracts will not result in any changes in (i) the investment process or strategies employed in the management of each fund's assets; (ii) the fees and expenses paid by shareholders; (iii) the nature, extent or quality of services provided under each fund's Advisory Contracts; or (iv) the day-to-day management of each fund or the persons primarily responsible for such management. The Board also considered that since its last approval of each fund's Advisory Contracts, FMR had provided additional information on each fund in support of the annual contract renewal process, including competitive analyses on total expenses and management fees and in-depth reviews of fund performance and fund profitability information. The Board also considered the findings of certain ad hoc committees that had been previously formed to discuss matters relevant to all of the Fidelity funds, including economies of scale, fall-out benefits and retail vs. institutional funds. The Board concluded that each fund's Advisory Contracts are fair and reasonable, and that each fund's Advisory Contracts should be renewed, without modification, through May 31, 2021, with the understanding that the Board will consider the annual renewal for a full one year period in May 2021.
In connection with its consideration of future renewals of each fund's Advisory Contracts, the Board will consider: (i) the nature, extent and quality of services provided to the funds, including shareholder and administrative services and investment performance; (ii) the competitiveness of the management fee and total expenses for each fund; (iii) the costs of the services and profitability, including the revenues earned and the expenses incurred in conducting the business of developing, marketing, distributing, managing, administering, and servicing each fund and its shareholders, to the extent applicable; and (iv) whether there have been economies of scale in respect of the Fidelity funds, whether the Fidelity funds (including the funds) have appropriately benefited from any such economies of scale, and whether there is the potential for realization of any further economies.
Based on its evaluation of all of the conclusions noted above, and after considering all factors it believed relevant, the Board ultimately concluded that each fund's management fee structures are fair and reasonable, and that the continuation of the funds' Advisory Contracts should be approved for four months from February 1, 2021 through May 31, 2021.
Liquidity Risk Management Program
The Securities and Exchange Commission adopted Rule 22e-4 under the Investment Company Act of 1940 (the Liquidity Rule) to promote effective liquidity risk management throughout the open-end investment company industry, thereby reducing the risk that funds will be unable to meet their redemption obligations and mitigating dilution of the interests of fund shareholders.
The Funds have adopted and implemented a liquidity risk management program pursuant to the Liquidity Rule (the Program) effective December 1, 2018. The Program is reasonably designed to assess and manage each Fund’s liquidity risk and to comply with the requirements of the Liquidity Rule. Each Fund’s Board of Trustees (the Board) has designated each Fund’s investment adviser as administrator of the Program. The Fidelity advisers have established a Liquidity Risk Management Committee (the LRM Committee) to manage the Program for each of the Fidelity Funds. The LRM Committee monitors the adequacy and effectiveness of implementation of the Program and on a periodic basis assesses each Fund’s liquidity risk based on a variety of factors including (1) the Fund’s investment strategy, (2) portfolio liquidity and cash flow projections during normal and reasonably foreseeable stressed conditions, (3) shareholder redemptions, (4) borrowings and other funding sources and (5) in the case of exchange-traded funds, certain additional factors including the effect of the Fund’s prices and spreads, market participants, and basket compositions on the overall liquidity of the Fund’s portfolio, as applicable.
In accordance with the Program, each of the Fund’s portfolio investments is classified into one of four liquidity categories described below based on a determination of a reasonable expectation for how long it would take to convert the investment to cash (or sell or dispose of the investment) without significantly changing its market value.
- Highly liquid investments – cash or convertible to cash within three business days or less
- Moderately liquid investments – convertible to cash in three to seven calendar days
- Less liquid investments – can be sold or disposed of, but not settled, within seven calendar days
- Illiquid investments – cannot be sold or disposed of within seven calendar days
Liquidity classification determinations take into account a variety of factors including various market, trading and investment-specific considerations, as well as market depth, and generally utilize analysis from a third-party liquidity metrics service.
The Liquidity Rule places a 15% limit on a fund’s illiquid investments and requires funds that do not primarily hold assets that are highly liquid investments to determine and maintain a minimum percentage of the fund’s net assets to be invested in highly liquid investments (highly liquid investment minimum or HLIM). The Program includes provisions reasonably designed to comply with the 15% limit on illiquid investments and for determining, periodically reviewing and complying with the HLIM requirement as applicable.
At a recent meeting of the Fund’s Board of Trustees, the LRM Committee provided a written report to the Board pertaining to the operation, adequacy, and effectiveness of implementation of the Program for the annual period from December 1, 2019 through November 30, 2020. The report concluded that the Program has been implemented and is operating effectively and is reasonably designed to assess and manage the Fund’s liquidity risk.
Proxy Voting Results
A special meeting of shareholders was held on June 9, 2020. The results of votes taken among shareholders on the proposal before them are reported below. Each vote reported represents one dollar of net asset value held on the record date for the meeting.
PROPOSAL 1
To elect a Board of Trustees.
| | # of
Votes | % of
Votes |
| Dennis J. Dirks |
| Affirmative | 32,463,705,305.665 | 92.437 |
| Withheld | 2,655,951,104.308 | 7.563 |
| TOTAL | 35,119,656,409.973 | 100.000 |
| Donald F. Donahue |
| Affirmative | 32,446,843,861.354 | 92.389 |
| Withheld | 2,672,812,548.619 | 7.611 |
| TOTAL | 35,119,656,409.973 | 100.000 |
| Bettina Doulton |
| Affirmative | 32,610,463,757.584 | 92.855 |
| Withheld | 2,509,192,652.389 | 7.145 |
| TOTAL | 35,119,656,409.973 | 100.000 |
| Vicki L. Fuller |
| Affirmative | 32,688,213,522.720 | 93.077 |
| Withheld | 2,431,442,887.253 | 6.923 |
| TOTAL | 35,119,656,409.973 | 100.000 |
| Patricia L. Kampling |
| Affirmative | 32,313,755,598.535 | 92.010 |
| Withheld | 2,805,900,811.438 | 7.990 |
| TOTAL | 35,119,656,409.973 | 100.000 |
| Alan J. Lacy |
| Affirmative | 31,990,158,754.948 | 91.089 |
| Withheld | 3,129,497,655.026 | 8.911 |
| TOTAL | 35,119,656,409.973 | 100.000 |
| Ned C. Lautenbach |
| Affirmative | 32,043,019,991.143 | 91.240 |
| Withheld | 3,076,636,418.830 | 8.760 |
| TOTAL | 35,119,656,409.973 | 100.000 |
| Robert A. Lawrence |
| Affirmative | 32,150,842,398.009 | 91.547 |
| Withheld | 2,968,814,011.965 | 8.453 |
| TOTAL | 35,119,656,409.973 | 100.000 |
| Joseph Mauriello |
| Affirmative | 32,082,201,213.166 | 91.351 |
| Withheld | 3,037,455,196.807 | 8.649 |
| TOTAL | 35,119,656,409.973 | 100.000 |
| Cornelia M. Small |
| Affirmative | 32,207,976,835.934 | 91.709 |
| Withheld | 2,911,679,574.039 | 8.291 |
| TOTAL | 35,119,656,409.973 | 100.000 |
| Garnett A. Smith |
| Affirmative | 32,102,654,343.096 | 91.409 |
| Withheld | 3,017,002,066.877 | 8.591 |
| TOTAL | 35,119,656,409.973 | 100.000 |
| David M. Thomas |
| Affirmative | 32,150,749,424.556 | 91.546 |
| Withheld | 2,968,906,985.418 | 8.454 |
| TOTAL | 35,119,656,409.973 | 100.000 |
| Susan Tomasky |
| Affirmative | 32,381,933,484.515 | 92.205 |
| Withheld | 2,737,722,925.459 | 7.795 |
| TOTAL | 35,119,656,409.973 | 100.000 |
| Michael E. Wiley |
| Affirmative | 32,135,064,741.973 | 91.502 |
| Withheld | 2,984,591,668.000 | 8.498 |
| TOTAL | 35,119,656,409.973 | 100.000 |
|
| Proposal 1 reflects trust wide proposal and voting results. |
SELNR-ANN-0421
1.813649.116
Fidelity® Select Portfolios®
Financials Sector
Banking Portfolio
Brokerage and Investment Management Portfolio
Consumer Finance Portfolio
Financial Services Portfolio
Insurance Portfolio
Annual Report
February 28, 2021
Contents
To view a fund's proxy voting guidelines and proxy voting record for the 12-month period ended June 30, visit http://www.fidelity.com/proxyvotingresults or visit the Securities and Exchange Commission's (SEC) web site at http://www.sec.gov.
You may also call 1-800-544-8544 to request a free copy of the proxy voting guidelines.
Standard & Poor's, S&P and S&P 500 are registered service marks of The McGraw-Hill Companies, Inc. and have been licensed for use by Fidelity Distributors Corporation.
Other third-party marks appearing herein are the property of their respective owners.
All other marks appearing herein are registered or unregistered trademarks or service marks of FMR LLC or an affiliated company. © 2021 FMR LLC. All rights reserved.
This report and the financial statements contained herein are submitted for the general information of the shareholders of the Funds. This report is not authorized for distribution to prospective investors in the Funds unless preceded or accompanied by an effective prospectus.
A fund files its complete schedule of portfolio holdings with the SEC for the first and third quarters of each fiscal year on Form N-PORT. Forms N-PORT are available on the SEC’s web site at http://www.sec.gov. A fund's Forms N-PORT may be reviewed and copied at the SEC’s Public Reference Room in Washington, DC. Information regarding the operation of the SEC's Public Reference Room may be obtained by calling 1-800-SEC-0330.
For a complete list of a fund's portfolio holdings, view the most recent holdings listing, semiannual report, or annual report on Fidelity's web site at http://www.fidelity.com, http://www.institutional.fidelity.com, or http://www.401k.com, as applicable.
NOT FDIC INSURED •MAY LOSE VALUE •NO BANK GUARANTEE
Neither the Funds nor Fidelity Distributors Corporation is a bank.
Note to Shareholders:
Early in 2020, the outbreak and spread of a new coronavirus emerged as a public health emergency that had a major influence on financial markets, primarily based on its impact on the global economy and the outlook for corporate earnings. The virus causes a respiratory disease known as COVID-19. On March 11, 2020 the World Health Organization declared the COVID-19 outbreak a pandemic, citing sustained risk of further global spread.
In the weeks following, as the crisis worsened, we witnessed an escalating human tragedy with wide-scale social and economic consequences from coronavirus-containment measures. The outbreak of COVID-19 prompted a number of measures to limit the spread, including travel and border restrictions, quarantines, and restrictions on large gatherings. In turn, these resulted in lower consumer activity, diminished demand for a wide range of products and services, disruption in manufacturing and supply chains, and – given the wide variability in outcomes regarding the outbreak – significant market uncertainty and volatility. Amid the turmoil, global governments and central banks took unprecedented action to help support consumers, businesses, and the broader economies, and to limit disruption to financial systems.
The situation continues to unfold, and the extent and duration of its impact on financial markets and the economy remain highly uncertain. Extreme events such as the coronavirus crisis are “exogenous shocks” that can have significant adverse effects on mutual funds and their investments. Although multiple asset classes may be affected by market disruption, the duration and impact may not be the same for all types of assets.
Fidelity is committed to helping you stay informed amid news about COVID-19 and during increased market volatility, and we’re taking extra steps to be responsive to customer needs. We encourage you to visit our websites, where we offer ongoing updates, commentary, and analysis on the markets and our funds.
Banking Portfolio
Performance: The Bottom Line
Average annual total return reflects the change in the value of an investment, assuming reinvestment of distributions from dividend income and capital gains (the profits earned upon the sale of securities that have grown in value, if any) and assuming a constant rate of performance each year. The hypothetical investment and the average annual total returns do not reflect the deduction of taxes that a shareholder would pay on fund distributions or the redemption of fund shares. During periods of reimbursement by Fidelity, a fund’s total return will be greater than it would be had the reimbursement not occurred. How a fund did yesterday is no guarantee of how it will do tomorrow.
Average Annual Total Returns
| For the periods ended February 28, 2021 | Past 1 year | Past 5 years | Past 10 years |
| Banking Portfolio | 25.90% | 14.15% | 9.93% |
$10,000 Over 10 Years
Let's say hypothetically that $10,000 was invested in Banking Portfolio on February 28, 2011.
The chart shows how the value of your investment would have changed, and also shows how the S&P 500® Index performed over the same period.
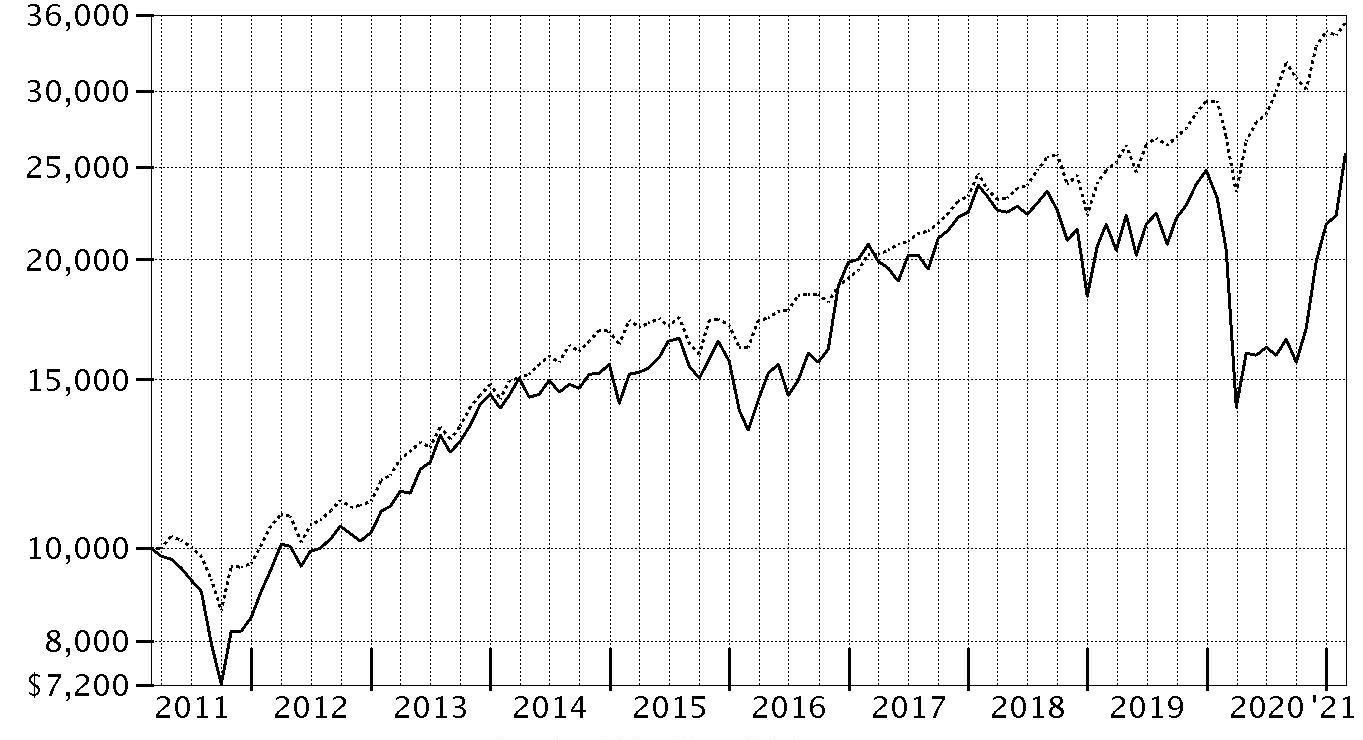
| Period Ending Values |
| $25,762 | Banking Portfolio |
| $35,259 | S&P 500® Index |
Banking Portfolio
Management's Discussion of Fund Performance
Market Recap: The S&P 500
® index gained 31.29% for the 12 months ending February 28, 2021, a volatile but productive period for U.S. risk assets. The early-2020 outbreak and spread of COVID-19 resulted in stocks suffering one of the quickest declines on record, through March 23, followed by a historic rebound that included the index closing 2020 at an all-time high and gaining modest ground in the first two months of the new year. The crisis and containment efforts caused broad contraction in economic activity, along with extreme uncertainty and dislocation in financial markets. A rapid and expansive U.S. monetary/fiscal-policy response partially offset the economic disruption and fueled the market surge, as did resilient corporate earnings. The rally slowed in September, when stocks began a two-month retreat amid Congress’s inability to reach a deal on additional fiscal stimulus, as well as concerns about election uncertainty, indications the U.S. economic recovery could be slowing and a new wave of COVID-19 cases. A shift in momentum began in October and accelerated following the U.S. elections, with the approval of three breakthrough COVID-19 vaccines and prospects for additional government stimulus fueling the “reflation trade” through February 28. By sector for the full 12 months, information technology (+50%) and consumer discretionary (+43%) led all gainers. Materials (+42%) and communication services (+37%) also stood out. In contrast, the defensive utilities (-3%) and real estate sectors (+5%) notably lagged.
Comments from Portfolio Manager Matthew Reed: For the fiscal year ending February 28, 2021, the fund gained 25.90%, trailing the 29.41% advance of the MSCI US IMI Banks 5% Capped Linked Index, as well as the broad-based S&P 500
® index. The largest detractor from performance versus the industry index was stock picking and an overweighting in diversified banks. Weak security selection among thrifts & mortgage finance firms and asset management & custody banks also hurt. The fund's biggest individual relative detractor was an overweighting in Wells Fargo, which returned about -9% the past 12 months and was among our largest holdings. Further hampering relative performance this period was not owning SVB Financial Group, an index component that gained 143%. Another key detractor was the portfolio’s non-index position in Bank of New York Mellon (+11%), a holding we established this period. Conversely, the top contributor to performance versus the industry index was security selection in consumer finance. A notable underweighting among thrifts & mortgage finance companies, along with investment choices in regional banks, also boosted the fund's relative result. The biggest individual relative contributor was an outsized stake in East West Bancorp, which gained 94% the past 12 months. The company was among the fund's biggest holdings as of February 28. Also boosting value was our overweighting in Signature Bank, which gained 78%. Adding further value versus the index was our overweighting in Truist Financial (+7%), a position not held at period end. Notable changes in positioning include increased exposure to thrifts & mortgage finance stocks and a lower allocation to consumer finance.
The views expressed above reflect those of the portfolio manager(s) only through the end of the period as stated on the cover of this report and do not necessarily represent the views of Fidelity or any other person in the Fidelity organization. Any such views are subject to change at any time based upon market or other conditions and Fidelity disclaims any responsibility to update such views. These views may not be relied on as investment advice and, because investment decisions for a Fidelity fund are based on numerous factors, may not be relied on as an indication of trading intent on behalf of any Fidelity fund.
Banking Portfolio
Investment Summary (Unaudited)
Top Ten Stocks as of February 28, 2021
| | % of fund's net assets |
| Bank of America Corp. | 6.4 |
| PNC Financial Services Group, Inc. | 5.8 |
| U.S. Bancorp | 5.7 |
| Wells Fargo & Co. | 5.3 |
| Citigroup, Inc. | 4.9 |
| M&T Bank Corp. | 3.3 |
| First Horizon National Corp. | 3.2 |
| Huntington Bancshares, Inc. | 3.0 |
| East West Bancorp, Inc. | 2.9 |
| KeyCorp | 2.8 |
| | 43.3 |
Top Industries (% of fund's net assets)
| As of February 28, 2021 |
| | Banks | 83.6% |
| | Thrifts & Mortgage Finance | 7.2% |
| | Consumer Finance | 4.4% |
| | Capital Markets | 3.8% |
| | IT Services | 0.3% |
| | All Others* | 0.7% |

* Includes short-term investments and net other assets (liabilities).
Banking Portfolio
Schedule of Investments February 28, 2021
Showing Percentage of Net Assets
| Common Stocks - 99.3% | | | |
| | | Shares | Value |
| Banks - 83.6% | | | |
| Diversified Banks - 22.3% | | | |
| Bank of America Corp. | | 993,176 | $34,473,138 |
| Citigroup, Inc. | | 402,200 | 26,496,936 |
| U.S. Bancorp | | 610,500 | 30,525,000 |
| Wells Fargo & Co. | | 788,692 | 28,526,990 |
| | | | 120,022,064 |
| Regional Banks - 61.3% | | | |
| 1st Source Corp. | | 134,660 | 5,974,864 |
| Amalgamated Bank | | 40,100 | 704,156 |
| American National Bankshares, Inc. | | 150,024 | 4,650,744 |
| Ameris Bancorp | | 115,360 | 5,495,750 |
| Associated Banc-Corp. | | 566,100 | 11,406,915 |
| Bank OZK | | 251,700 | 10,375,074 |
| BayCom Corp. (a) | | 49,682 | 849,065 |
| BOK Financial Corp. | | 157,300 | 13,537,238 |
| Cadence Bancorp Class A | | 542,228 | 11,126,519 |
| Camden National Corp. | | 9,632 | 390,385 |
| Comerica, Inc. | | 141,500 | 9,636,150 |
| Community Trust Bancorp, Inc. | | 129,268 | 5,281,890 |
| ConnectOne Bancorp, Inc. | | 92,300 | 2,144,129 |
| Cullen/Frost Bankers, Inc. | | 12,500 | 1,305,000 |
| East West Bancorp, Inc. | | 214,800 | 15,499,968 |
| Eastern Bankshares, Inc. | | 128,600 | 2,264,646 |
| First Citizens Bancshares, Inc. | | 1,600 | 1,180,624 |
| First Horizon National Corp. | | 1,059,500 | 17,163,900 |
| First Interstate Bancsystem, Inc. | | 166,500 | 7,562,430 |
| First Midwest Bancorp, Inc., Delaware | | 282,300 | 5,583,894 |
| Great Western Bancorp, Inc. | | 368,262 | 9,880,469 |
| Heartland Financial U.S.A., Inc. | | 173,200 | 8,095,368 |
| Hilltop Holdings, Inc. | | 85,600 | 2,828,224 |
| Huntington Bancshares, Inc. | | 1,053,700 | 16,163,758 |
| KeyCorp | | 747,600 | 15,056,664 |
| Lakeland Financial Corp. | | 80,100 | 5,522,895 |
| M&T Bank Corp. | | 115,800 | 17,478,852 |
| PacWest Bancorp | | 296,436 | 10,742,841 |
| Peoples United Financial, Inc. | | 689,500 | 12,369,630 |
| PNC Financial Services Group, Inc. | | 184,500 | 31,062,420 |
| Preferred Bank, Los Angeles | | 122,528 | 7,100,498 |
| Sierra Bancorp | | 80,000 | 1,908,000 |
| Signature Bank | | 65,390 | 14,277,253 |
| Trico Bancshares | | 98,887 | 4,259,063 |
| UMB Financial Corp. | | 100,166 | 8,451,005 |
| Univest Corp. of Pennsylvania | | 191,600 | 4,818,740 |
| WesBanco, Inc. | | 252,600 | 8,153,928 |
| Wintrust Financial Corp. | | 173,800 | 12,802,108 |
| Zions Bancorp NA | | 125,850 | 6,691,445 |
| | | | 329,796,502 |
|
| TOTAL BANKS | | | 449,818,566 |
|
| Capital Markets - 3.8% | | | |
| Asset Management & Custody Banks - 3.8% | | | |
| Bank of New York Mellon Corp. | | 212,300 | 8,950,568 |
| Northern Trust Corp. | | 29,200 | 2,777,796 |
| State Street Corp. | | 116,700 | 8,492,259 |
| | | | 20,220,623 |
| Consumer Finance - 4.4% | | | |
| Consumer Finance - 4.4% | | | |
| Capital One Financial Corp. | | 117,200 | 14,086,268 |
| Navient Corp. | | 256,400 | 3,174,232 |
| OneMain Holdings, Inc. | | 113,400 | 5,319,594 |
| SLM Corp. | | 52,700 | 832,133 |
| | | | 23,412,227 |
| IT Services - 0.3% | | | |
| Data Processing & Outsourced Services - 0.3% | | | |
| Computer Services, Inc. | | 30,000 | 1,800,000 |
| Thrifts & Mortgage Finance - 7.2% | | | |
| Thrifts & Mortgage Finance - 7.2% | | | |
| Essent Group Ltd. | | 301,029 | 12,411,426 |
| MGIC Investment Corp. | | 1,001,100 | 12,193,398 |
| NMI Holdings, Inc. (a) | | 302,002 | 6,903,766 |
| Radian Group, Inc. | | 345,836 | 7,055,054 |
| | | | 38,563,644 |
| TOTAL COMMON STOCKS | | | |
| (Cost $418,356,274) | | | 533,815,060 |
|
| Money Market Funds - 1.1% | | | |
| Fidelity Cash Central Fund 0.07% (b) | | | |
| (Cost $6,125,655) | | 6,124,430 | 6,125,655 |
| TOTAL INVESTMENT IN SECURITIES - 100.4% | | | |
| (Cost $424,481,929) | | | 539,940,715 |
| NET OTHER ASSETS (LIABILITIES) - (0.4)% | | | (2,080,993) |
| NET ASSETS - 100% | | | $537,859,722 |
Legend
(a) Non-income producing
(b) Affiliated fund that is generally available only to investment companies and other accounts managed by Fidelity Investments. The rate quoted is the annualized seven-day yield of the fund at period end. A complete unaudited listing of the fund's holdings as of its most recent quarter end is available upon request. In addition, each Fidelity Central Fund's financial statements, which are not covered by the Fund's Report of Independent Registered Public Accounting Firm, are available on the SEC's website or upon request.
Affiliated Central Funds
Information regarding fiscal year to date income earned by the Fund from investments in Fidelity Central Funds is as follows:
| Fund | Income earned |
| Fidelity Cash Central Fund | $3,106 |
| Fidelity Securities Lending Cash Central Fund | 3,386 |
| Total | $6,492 |
Amounts in the income column in the above table include any capital gain distributions from underlying funds, which are presented in the corresponding line-item in the Statement of Operations, if applicable. Amount for Fidelity Securities Lending Cash Central Fund represents the income earned on investing cash collateral, less rebates paid to borrowers and any lending agent fees associated with the loan, plus any premium payments received for lending certain types of securities.
Investment Valuation
The following is a summary of the inputs used, as of February 28, 2021, involving the Fund's assets and liabilities carried at fair value. The inputs or methodology used for valuing securities may not be an indication of the risk associated with investing in those securities. For more information on valuation inputs, and their aggregation into the levels used below, please refer to the Investment Valuation section in the accompanying Notes to Financial Statements.
| | Valuation Inputs at Reporting Date: |
| Description | Total | Level 1 | Level 2 | Level 3 |
| Investments in Securities: | | | | |
| Common Stocks | $533,815,060 | $533,815,060 | $-- | $-- |
| Money Market Funds | 6,125,655 | 6,125,655 | -- | -- |
| Total Investments in Securities: | $539,940,715 | $539,940,715 | $-- | $-- |
See accompanying notes which are an integral part of the financial statements.
Banking Portfolio
Financial Statements
Statement of Assets and Liabilities
| | | February 28, 2021 |
| Assets | | |
Investment in securities, at value — See accompanying schedule:
Unaffiliated issuers (cost $418,356,274) | $533,815,060 | |
| Fidelity Central Funds (cost $6,125,655) | 6,125,655 | |
| Total Investment in Securities (cost $424,481,929) | | $539,940,715 |
| Cash | | 66,812 |
| Receivable for fund shares sold | | 4,801,129 |
| Dividends receivable | | 545,702 |
| Distributions receivable from Fidelity Central Funds | | 75 |
| Prepaid expenses | | 4,412 |
| Total assets | | 545,358,845 |
| Liabilities | | |
| Payable for investments purchased | $6,370,571 | |
| Payable for fund shares redeemed | 791,941 | |
| Accrued management fee | 221,960 | |
| Other affiliated payables | 80,566 | |
| Other payables and accrued expenses | 34,085 | |
| Total liabilities | | 7,499,123 |
| Net Assets | | $537,859,722 |
| Net Assets consist of: | | |
| Paid in capital | | $427,185,819 |
| Total accumulated earnings (loss) | | 110,673,903 |
| Net Assets | | $537,859,722 |
| Net Asset Value, offering price and redemption price per share ($537,859,722 ÷ 20,445,701 shares) | | $26.31 |
See accompanying notes which are an integral part of the financial statements.
Statement of Operations
| | | Year ended February 28, 2021 |
| Investment Income | | |
| Dividends | | $12,152,019 |
| Income from Fidelity Central Funds (including $3,386 from security lending) | | 6,492 |
| Total income | | 12,158,511 |
| Expenses | | |
| Management fee | $1,785,917 | |
| Transfer agent fees | 636,269 | |
| Accounting fees | 131,128 | |
| Custodian fees and expenses | 6,371 | |
| Independent trustees' fees and expenses | 1,852 | |
| Registration fees | 47,449 | |
| Audit | 38,270 | |
| Legal | 1,020 | |
| Miscellaneous | 9,546 | |
| Total expenses before reductions | 2,657,822 | |
| Expense reductions | (18,645) | |
| Total expenses after reductions | | 2,639,177 |
| Net investment income (loss) | | 9,519,334 |
| Realized and Unrealized Gain (Loss) | | |
| Net realized gain (loss) on: | | |
| Investment securities: | | |
| Unaffiliated issuers | (3,834,835) | |
| Fidelity Central Funds | (458) | |
| Foreign currency transactions | (21) | |
| Total net realized gain (loss) | | (3,835,314) |
| Change in net unrealized appreciation (depreciation) on investment securities | | 100,101,655 |
| Net gain (loss) | | 96,266,341 |
| Net increase (decrease) in net assets resulting from operations | | $105,785,675 |
See accompanying notes which are an integral part of the financial statements.
Statement of Changes in Net Assets
| | Year ended February 28, 2021 | Year ended February 29, 2020 |
| Increase (Decrease) in Net Assets | | |
| Operations | | |
| Net investment income (loss) | $9,519,334 | $10,191,695 |
| Net realized gain (loss) | (3,835,314) | 39,645,121 |
| Change in net unrealized appreciation (depreciation) | 100,101,655 | (72,578,685) |
| Net increase (decrease) in net assets resulting from operations | 105,785,675 | (22,741,869) |
| Distributions to shareholders | (30,620,603) | (30,093,044) |
| Share transactions | | |
| Proceeds from sales of shares | 280,772,770 | 121,977,862 |
| Reinvestment of distributions | 29,138,501 | 28,635,030 |
| Cost of shares redeemed | (208,912,791) | (250,731,343) |
| Net increase (decrease) in net assets resulting from share transactions | 100,998,480 | (100,118,451) |
| Total increase (decrease) in net assets | 176,163,552 | (152,953,364) |
| Net Assets | | |
| Beginning of period | 361,696,170 | 514,649,534 |
| End of period | $537,859,722 | $361,696,170 |
| Other Information | | |
| Shares | | |
| Sold | 14,272,458 | 4,485,997 |
| Issued in reinvestment of distributions | 1,749,438 | 1,050,495 |
| Redeemed | (11,050,997) | (9,539,655) |
| Net increase (decrease) | 4,970,899 | (4,003,163) |
See accompanying notes which are an integral part of the financial statements.
Financial Highlights
Banking Portfolio
| | | | | | |
| Years ended February 28, | 2021 | 2020 A | 2019 | 2018 | 2017 |
| Selected Per–Share Data | | | | | |
| Net asset value, beginning of period | $23.37 | $26.42 | $36.82 | $33.63 | $21.70 |
| Income from Investment Operations | | | | | |
| Net investment income (loss)B | .54 | .58 | .49 | .42 | .33 |
| Net realized and unrealized gain (loss) | 4.32 | (1.96) | (3.62) | 3.68 | 11.85 |
| Total from investment operations | 4.86 | (1.38) | (3.13) | 4.10 | 12.18 |
| Distributions from net investment income | (.55) | (.53) | (.54) | (.33) | (.25) |
| Distributions from net realized gain | (1.37) | (1.14) | (6.73) | (.58) | – |
| Total distributions | (1.92) | (1.67) | (7.27) | (.91) | (.25) |
| Redemption fees added to paid in capitalB | – | – | – | –C | –C |
| Net asset value, end of period | $26.31 | $23.37 | $26.42 | $36.82 | $33.63 |
| Total ReturnD | 25.90% | (6.05)% | (6.57)% | 12.31% | 56.16% |
| Ratios to Average Net AssetsE,F | | | | | |
| Expenses before reductions | .79% | .77% | .77% | .77% | .79% |
| Expenses net of fee waivers, if any | .79% | .77% | .77% | .77% | .79% |
| Expenses net of all reductions | .79% | .77% | .76% | .77% | .79% |
| Net investment income (loss) | 2.84% | 2.21% | 1.54% | 1.26% | 1.20% |
| Supplemental Data | | | | | |
| Net assets, end of period (000 omitted) | $537,860 | $361,696 | $514,650 | $830,245 | $1,261,859 |
| Portfolio turnover rateG | 32% | 31% | 44% | 35% | 34% |
A For the year ended February 29.
B Calculated based on average shares outstanding during the period.
C Amount represents less than $.005 per share.
D Total returns would have been lower if certain expenses had not been reduced during the applicable periods shown.
E Fees and expenses of any underlying mutual funds or exchange-traded funds (ETFs) are not included in the Fund's expense ratio. The Fund indirectly bears its proportionate share of these expenses. For additional expense information related to investments in Fidelity Central Funds, please refer to the "Investments in Fidelity Central Funds" note found in the Notes to Financial Statements section of the most recent Annual or Semi-Annual report.
F Expense ratios reflect operating expenses of the class. Expenses before reductions do not reflect amounts reimbursed, waived, or reduced through arrangements with the investment advisor, brokerage services, or other offset arrangements, if applicable, and do not represent the amount paid by the class during periods when reimbursements, waivers or reductions occur.
G Amount does not include the portfolio activity of any underlying mutual funds or exchange-traded funds (ETFs).
See accompanying notes which are an integral part of the financial statements.
Brokerage and Investment Management Portfolio
Performance: The Bottom Line
Average annual total return reflects the change in the value of an investment, assuming reinvestment of distributions from dividend income and capital gains (the profits earned upon the sale of securities that have grown in value, if any) and assuming a constant rate of performance each year. The hypothetical investment and the average annual total returns do not reflect the deduction of taxes that a shareholder would pay on fund distributions or the redemption of fund shares. During periods of reimbursement by Fidelity, a fund’s total return will be greater than it would be had the reimbursement not occurred. How a fund did yesterday is no guarantee of how it will do tomorrow.
Average Annual Total Returns
| For the periods ended February 28, 2021 | Past 1 year | Past 5 years | Past 10 years |
| Brokerage and Investment Management Portfolio | 39.69% | 18.72% | 10.56% |
$10,000 Over 10 Years
Let's say hypothetically that $10,000 was invested in Brokerage and Investment Management Portfolio on February 28, 2011.
The chart shows how the value of your investment would have changed, and also shows how the S&P 500® Index performed over the same period.
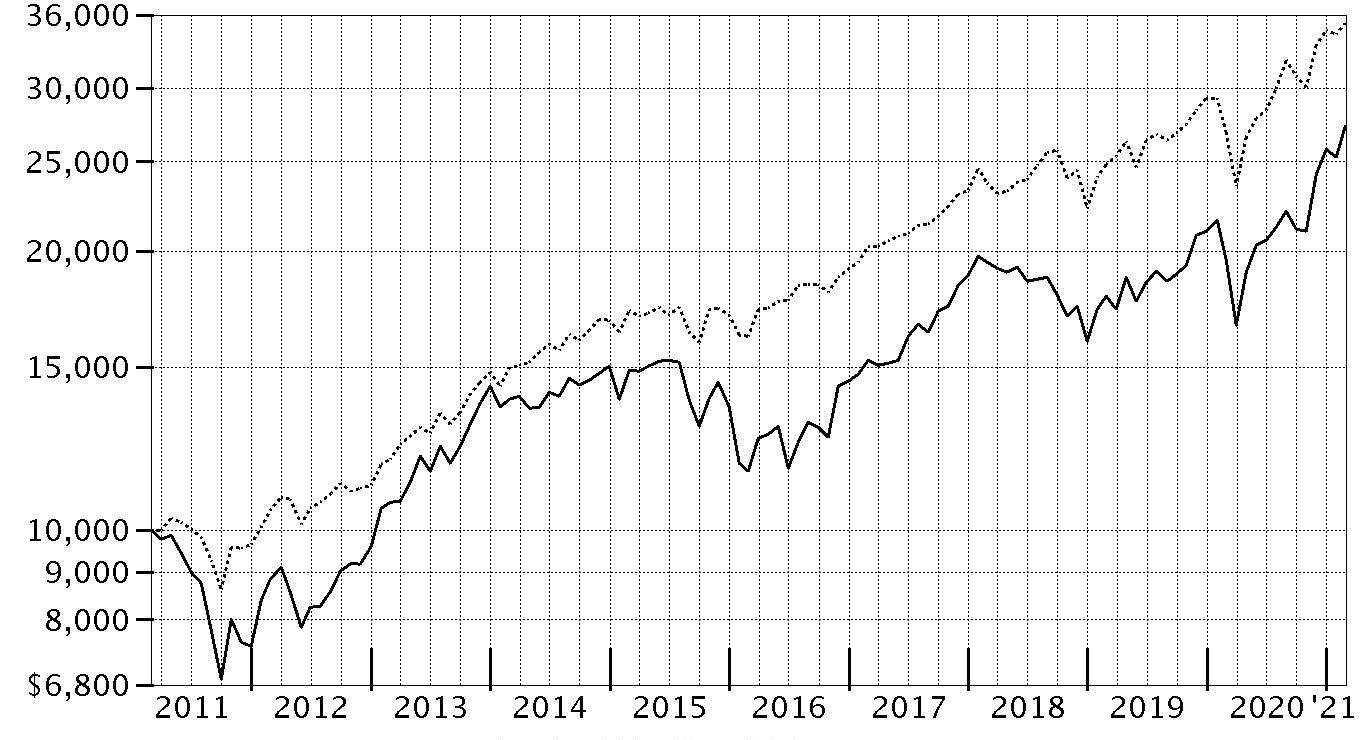
| Period Ending Values |
| $27,298 | Brokerage and Investment Management Portfolio |
| $35,259 | S&P 500® Index |
Brokerage and Investment Management Portfolio
Management's Discussion of Fund Performance
Market Recap: The S&P 500
® index gained 31.29% for the 12 months ending February 28, 2021, a volatile but productive period for U.S. risk assets. The early-2020 outbreak and spread of COVID-19 resulted in stocks suffering one of the quickest declines on record, through March 23, followed by a historic rebound that included the index closing 2020 at an all-time high and gaining modest ground in the first two months of the new year. The crisis and containment efforts caused broad contraction in economic activity, along with extreme uncertainty and dislocation in financial markets. A rapid and expansive U.S. monetary/fiscal-policy response partially offset the economic disruption and fueled the market surge, as did resilient corporate earnings. The rally slowed in September, when stocks began a two-month retreat amid Congress’s inability to reach a deal on additional fiscal stimulus, as well as concerns about election uncertainty, indications the U.S. economic recovery could be slowing and a new wave of COVID-19 cases. A shift in momentum began in October and accelerated following the U.S. elections, with the approval of three breakthrough COVID-19 vaccines and prospects for additional government stimulus fueling the “reflation trade” through February 28. By sector for the full 12 months, information technology (+50%) and consumer discretionary (+43%) led all gainers. Materials (+42%) and communication services (+37%) also stood out. In contrast, the defensive utilities (-3%) and real estate sectors (+5%) notably lagged.
Comments from Portfolio Manager Charles Ackerman: For the fiscal year ending February 28, 2021, the fund gained 39.69%, trailing the 40.27% advance of the MSCI US IMI Capital Markets 5% Capped Linked Index, but outperforming the broad-based S&P 500
® index. The largest detractor from performance versus the industry index was stock picks in financial exchanges & data. The fund's biggest individual relative detractor was our lighter-than-index stake in Goldman Sachs Group, which gained 62% the past year. Also holding back performance was our outsized stake in Intercontinental Exchange, which gained 25%. Intercontinental Exchange was one of our largest holdings. Also hampering performance was our overweighting in Apollo Global Management, which gained 24%. In contrast, the biggest contributor to performance versus the industry index was an overweighting and security selection in investment banking & brokerage. Also boosting the fund's relative result was an underweighting and stock selection in asset management & custody banks. The fund's biggest individual relative contributor was an outsized stake in LPL Financial Holdings, which gained approximately 68% the past 12 months. The company was among our biggest holdings. Also lifting performance was our overweighting in Morgan Stanley, which gained roughly 76%. Morgan Stanley was the fund's top holding at period end. Another notable relative contributor was an outsized stake in BlackRock (+54%), which was one of the fund's biggest holdings. Notable changes in positioning include a higher allocation to asset management & custody banks and reduced exposure to financial exchanges & data.
The views expressed above reflect those of the portfolio manager(s) only through the end of the period as stated on the cover of this report and do not necessarily represent the views of Fidelity or any other person in the Fidelity organization. Any such views are subject to change at any time based upon market or other conditions and Fidelity disclaims any responsibility to update such views. These views may not be relied on as investment advice and, because investment decisions for a Fidelity fund are based on numerous factors, may not be relied on as an indication of trading intent on behalf of any Fidelity fund.
Brokerage and Investment Management Portfolio
Investment Summary (Unaudited)
Top Ten Stocks as of February 28, 2021
| | % of fund's net assets |
| Morgan Stanley | 8.5 |
| Charles Schwab Corp. | 8.1 |
| BlackRock, Inc. Class A | 8.1 |
| Intercontinental Exchange, Inc. | 6.2 |
| LPL Financial | 5.9 |
| S&P Global, Inc. | 5.4 |
| Ameriprise Financial, Inc. | 5.0 |
| MSCI, Inc. | 4.3 |
| T. Rowe Price Group, Inc. | 4.2 |
| Bank of New York Mellon Corp. | 4.2 |
| | 59.9 |
Top Industries (% of fund's net assets)
| As of February 28, 2021 |
| | Capital Markets | 97.4% |
| | All Others* | 2.6% |

* Includes short-term investments and net other assets (liabilities).
Brokerage and Investment Management Portfolio
Schedule of Investments February 28, 2021
Showing Percentage of Net Assets
| Common Stocks - 97.4% | | | |
| | | Shares | Value |
| Capital Markets - 97.4% | | | |
| Asset Management & Custody Banks - 35.2% | | | |
| Affiliated Managers Group, Inc. | | 12,300 | $1,721,631 |
| AllianceBernstein Holding LP | | 27,000 | 987,120 |
| Ameriprise Financial, Inc. | | 96,200 | 21,283,288 |
| Apollo Global Management LLC Class A | | 315,200 | 15,589,792 |
| Ares Management Corp. | | 37,900 | 1,970,042 |
| Artisan Partners Asset Management, Inc. | | 17,100 | 812,250 |
| Bank of New York Mellon Corp. | | 425,300 | 17,930,648 |
| BlackRock, Inc. Class A | | 49,800 | 34,586,100 |
| Carlyle Group LP | | 33,000 | 1,130,250 |
| Eaton Vance Corp. (non-vtg.) | | 25,400 | 1,855,978 |
| Franklin Resources, Inc. | | 45,000 | 1,177,650 |
| KKR & Co. LP | | 203,600 | 9,276,016 |
| Northern Trust Corp. | | 70,000 | 6,659,100 |
| Patria Investments Ltd. | | 11,500 | 222,525 |
| State Street Corp. | | 130,600 | 9,503,762 |
| T. Rowe Price Group, Inc. | | 111,900 | 18,143,466 |
| The Blackstone Group LP | | 121,200 | 8,390,676 |
| | | | 151,240,294 |
| Financial Exchanges & Data - 30.9% | | | |
| Cboe Global Markets, Inc. | | 66,638 | 6,594,496 |
| CME Group, Inc. | | 86,100 | 17,194,170 |
| Intercontinental Exchange, Inc. | | 241,200 | 26,606,772 |
| MarketAxess Holdings, Inc. | | 16,300 | 9,061,822 |
| Moody's Corp. | | 47,500 | 13,057,275 |
| MSCI, Inc. | | 44,700 | 18,529,044 |
| NASDAQ, Inc. | | 127,900 | 17,687,291 |
| Open Lending Corp. (a) | | 22,300 | 852,752 |
| S&P Global, Inc. | | 70,200 | 23,121,072 |
| | | | 132,704,694 |
| Investment Banking & Brokerage - 31.3% | | | |
| BGC Partners, Inc. Class A | | 400,800 | 1,795,584 |
| Charles Schwab Corp. | | 565,561 | 34,906,425 |
| Goldman Sachs Group, Inc. | | 44,200 | 14,121,016 |
| LPL Financial | | 192,600 | 25,334,604 |
| Moelis & Co. Class A | | 54,600 | 2,819,544 |
| Morgan Stanley | | 471,901 | 36,275,030 |
| PJT Partners, Inc. | | 82,912 | 5,780,625 |
| Raymond James Financial, Inc. | | 74,100 | 8,650,434 |
| Virtu Financial, Inc. Class A | | 163,600 | 4,461,372 |
| | | | 134,144,634 |
| TOTAL COMMON STOCK | | | |
| (Cost $239,347,972) | | | 418,089,622 |
|
| Money Market Funds - 2.5% | | | |
| Fidelity Cash Central Fund 0.07% (b) | | | |
| (Cost $10,744,136) | | 10,741,988 | 10,744,136 |
| TOTAL INVESTMENT IN SECURITIES - 99.9% | | | |
| (Cost $250,092,108) | | | 428,833,758 |
| NET OTHER ASSETS (LIABILITIES) - 0.1% | | | 486,406 |
| NET ASSETS - 100% | | | $429,320,164 |
Legend
(a) Non-income producing
(b) Affiliated fund that is generally available only to investment companies and other accounts managed by Fidelity Investments. The rate quoted is the annualized seven-day yield of the fund at period end. A complete unaudited listing of the fund's holdings as of its most recent quarter end is available upon request. In addition, each Fidelity Central Fund's financial statements, which are not covered by the Fund's Report of Independent Registered Public Accounting Firm, are available on the SEC's website or upon request.
Affiliated Central Funds
Information regarding fiscal year to date income earned by the Fund from investments in Fidelity Central Funds is as follows:
| Fund | Income earned |
| Fidelity Cash Central Fund | $3,325 |
| Fidelity Securities Lending Cash Central Fund | 1,678 |
| Total | $5,003 |
Amounts in the income column in the above table include any capital gain distributions from underlying funds, which are presented in the corresponding line-item in the Statement of Operations, if applicable. Amount for Fidelity Securities Lending Cash Central Fund represents the income earned on investing cash collateral, less rebates paid to borrowers and any lending agent fees associated with the loan, plus any premium payments received for lending certain types of securities.
Investment Valuation
The following is a summary of the inputs used, as of February 28, 2021, involving the Fund's assets and liabilities carried at fair value. The inputs or methodology used for valuing securities may not be an indication of the risk associated with investing in those securities. For more information on valuation inputs, and their aggregation into the levels used below, please refer to the Investment Valuation section in the accompanying Notes to Financial Statements.
| | Valuation Inputs at Reporting Date: |
| Description | Total | Level 1 | Level 2 | Level 3 |
| Investments in Securities: | | | | |
| Common Stocks | $418,089,622 | $418,089,622 | $-- | $-- |
| Money Market Funds | 10,744,136 | 10,744,136 | -- | -- |
| Total Investments in Securities: | $428,833,758 | $428,833,758 | $-- | $-- |
See accompanying notes which are an integral part of the financial statements.
Brokerage and Investment Management Portfolio
Financial Statements
Statement of Assets and Liabilities
| | | February 28, 2021 |
| Assets | | |
Investment in securities, at value — See accompanying schedule:
Unaffiliated issuers (cost $239,347,972) | $418,089,622 | |
| Fidelity Central Funds (cost $10,744,136) | 10,744,136 | |
| Total Investment in Securities (cost $250,092,108) | | $428,833,758 |
| Cash | | 2,457 |
| Receivable for fund shares sold | | 802,200 |
| Dividends receivable | | 261,049 |
| Distributions receivable from Fidelity Central Funds | | 581 |
| Prepaid expenses | | 2,585 |
| Other receivables | | 52,788 |
| Total assets | | 429,955,418 |
| Liabilities | | |
| Payable for fund shares redeemed | $298,101 | |
| Accrued management fee | 186,126 | |
| Transfer agent fee payable | 52,998 | |
| Trustees fee payable | 52,787 | |
| Other affiliated payables | 13,741 | |
| Other payables and accrued expenses | 31,501 | |
| Total liabilities | | 635,254 |
| Net Assets | | $429,320,164 |
| Net Assets consist of: | | |
| Paid in capital | | $246,934,307 |
| Total accumulated earnings (loss) | | 182,385,857 |
| Net Assets | | $429,320,164 |
| Net Asset Value, offering price and redemption price per share ($429,320,164 ÷ 4,251,214 shares) | | $100.99 |
See accompanying notes which are an integral part of the financial statements.
Statement of Operations
| | | Year ended February 28, 2021 |
| Investment Income | | |
| Dividends | | $6,359,153 |
| Income from Fidelity Central Funds (including $1,678 from security lending) | | 5,003 |
| Total income | | 6,364,156 |
| Expenses | | |
| Management fee | $1,782,798 | |
| Transfer agent fees | 557,772 | |
| Accounting fees | 130,916 | |
| Custodian fees and expenses | 3,467 | |
| Independent trustees' fees and expenses | 1,810 | |
| Registration fees | 24,980 | |
| Audit | 38,477 | |
| Legal | 370 | |
| Miscellaneous | 6,725 | |
| Total expenses before reductions | 2,547,315 | |
| Expense reductions | (2,454) | |
| Total expenses after reductions | | 2,544,861 |
| Net investment income (loss) | | 3,819,295 |
| Realized and Unrealized Gain (Loss) | | |
| Net realized gain (loss) on: | | |
| Investment securities: | | |
| Unaffiliated issuers | 7,729,033 | |
| Fidelity Central Funds | (258) | |
| Total net realized gain (loss) | | 7,728,775 |
| Change in net unrealized appreciation (depreciation) on: | | |
| Investment securities: | | |
| Unaffiliated issuers | 105,204,642 | |
| Assets and liabilities in foreign currencies | 2,477 | |
| Total change in net unrealized appreciation (depreciation) | | 105,207,119 |
| Net gain (loss) | | 112,935,894 |
| Net increase (decrease) in net assets resulting from operations | | $116,755,189 |
See accompanying notes which are an integral part of the financial statements.
Statement of Changes in Net Assets
| | Year ended February 28, 2021 | Year ended February 29, 2020 |
| Increase (Decrease) in Net Assets | | |
| Operations | | |
| Net investment income (loss) | $3,819,295 | $4,319,475 |
| Net realized gain (loss) | 7,728,775 | 11,001,402 |
| Change in net unrealized appreciation (depreciation) | 105,207,119 | 13,075,301 |
| Net increase (decrease) in net assets resulting from operations | 116,755,189 | 28,396,178 |
| Distributions to shareholders | (11,912,054) | (14,519,767) |
| Share transactions | | |
| Proceeds from sales of shares | 84,488,611 | 27,899,331 |
| Reinvestment of distributions | 11,152,814 | 13,537,015 |
| Cost of shares redeemed | (80,252,501) | (73,352,343) |
| Net increase (decrease) in net assets resulting from share transactions | 15,388,924 | (31,915,997) |
| Total increase (decrease) in net assets | 120,232,059 | (18,039,586) |
| Net Assets | | |
| Beginning of period | 309,088,105 | 327,127,691 |
| End of period | $429,320,164 | $309,088,105 |
| Other Information | | |
| Shares | | |
| Sold | 981,489 | 356,153 |
| Issued in reinvestment of distributions | 139,657 | 175,977 |
| Redeemed | (991,927) | (972,124) |
| Net increase (decrease) | 129,219 | (439,994) |
See accompanying notes which are an integral part of the financial statements.
Financial Highlights
Brokerage and Investment Management Portfolio
| | | | | | |
| Years ended February 28, | 2021 | 2020 A | 2019 | 2018 | 2017 |
| Selected Per–Share Data | | | | | |
| Net asset value, beginning of period | $74.99 | $71.71 | $84.47 | $71.13 | $54.65 |
| Income from Investment Operations | | | | | |
| Net investment income (loss)B | .93 | 1.01 | .77 | 1.15 | .89 |
| Net realized and unrealized gain (loss) | 28.01 | 5.70 | (7.60) | 17.88 | 16.44 |
| Total from investment operations | 28.94 | 6.71 | (6.83) | 19.03 | 17.33 |
| Distributions from net investment income | (1.06) | (.98) | (.96) | (.82) | (.83) |
| Distributions from net realized gain | (1.88) | (2.45) | (4.96) | (4.87) | (.01) |
| Total distributions | (2.94) | (3.43) | (5.93)C | (5.69) | (.85)C |
| Redemption fees added to paid in capitalB | – | – | – | –D | –D |
| Net asset value, end of period | $100.99 | $74.99 | $71.71 | $84.47 | $71.13 |
| Total ReturnE | 39.69% | 9.28% | (8.04)% | 27.51% | 31.76% |
| Ratios to Average Net AssetsF,G | | | | | |
| Expenses before reductions | .76% | .77% | .78% | .79% | .82% |
| Expenses net of fee waivers, if any | .76% | .77% | .77% | .79% | .82% |
| Expenses net of all reductions | .76% | .77% | .77% | .78% | .80% |
| Net investment income (loss) | 1.14% | 1.33% | 1.01% | 1.49% | 1.43% |
| Supplemental Data | | | | | |
| Net assets, end of period (000 omitted) | $429,320 | $309,088 | $327,128 | $461,981 | $405,283 |
| Portfolio turnover rateH | 11% | 9% | 30% | 75% | 146% |
A For the year ended February 29.
B Calculated based on average shares outstanding during the period.
C Total distributions per share do not sum due to rounding.
D Amount represents less than $.005 per share.
E Total returns would have been lower if certain expenses had not been reduced during the applicable periods shown.
F Fees and expenses of any underlying mutual funds or exchange-traded funds (ETFs) are not included in the Fund's expense ratio. The Fund indirectly bears its proportionate share of these expenses. For additional expense information related to investments in Fidelity Central Funds, please refer to the "Investments in Fidelity Central Funds" note found in the Notes to Financial Statements section of the most recent Annual or Semi-Annual report.
G Expense ratios reflect operating expenses of the class. Expenses before reductions do not reflect amounts reimbursed, waived, or reduced through arrangements with the investment advisor, brokerage services, or other offset arrangements, if applicable, and do not represent the amount paid by the class during periods when reimbursements, waivers or reductions occur.
H Amount does not include the portfolio activity of any underlying mutual funds or exchange-traded funds (ETFs).
See accompanying notes which are an integral part of the financial statements.
Consumer Finance Portfolio
Performance: The Bottom Line
Average annual total return reflects the change in the value of an investment, assuming reinvestment of distributions from dividend income and capital gains (the profits earned upon the sale of securities that have grown in value, if any) and assuming a constant rate of performance each year. The hypothetical investment and the average annual total returns do not reflect the deduction of taxes that a shareholder would pay on fund distributions or the redemption of fund shares. During periods of reimbursement by Fidelity, a fund’s total return will be greater than it would be had the reimbursement not occurred. How a fund did yesterday is no guarantee of how it will do tomorrow.
Average Annual Total Returns
| For the periods ended February 28, 2021 | Past 1 year | Past 5 years | Past 10 years |
| Consumer Finance Portfolio | 21.94% | 16.08% | 12.44% |
Prior to December 1, 2010, the fund was named Home Finance Portfolio, and the fund operated under certain different investment policies and compared its performance to a different additional index. The fund's historical performance may not represent its current investment policies.
$10,000 Over 10 Years
Let's say hypothetically that $10,000 was invested in Consumer Finance Portfolio on February 28, 2011.
The chart shows how the value of your investment would have changed, and also shows how the S&P 500® Index performed over the same period.
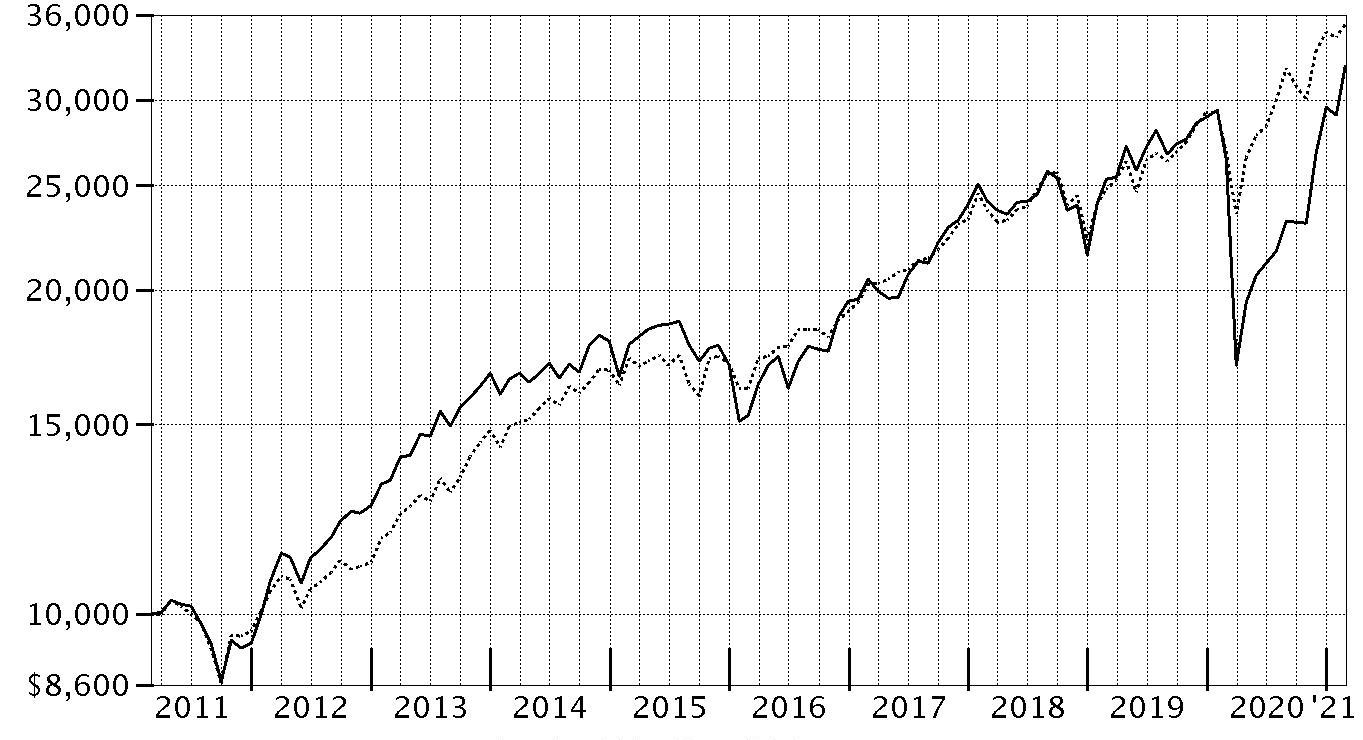
| Period Ending Values |
| $32,287 | Consumer Finance Portfolio |
| $35,259 | S&P 500® Index |
Consumer Finance Portfolio
Management's Discussion of Fund Performance
Market Recap: The S&P 500
® index gained 31.29% for the 12 months ending February 28, 2021, a volatile but productive period for U.S. risk assets. The early-2020 outbreak and spread of COVID-19 resulted in stocks suffering one of the quickest declines on record, through March 23, followed by a historic rebound that included the index closing 2020 at an all-time high and gaining modest ground in the first two months of the new year. The crisis and containment efforts caused broad contraction in economic activity, along with extreme uncertainty and dislocation in financial markets. A rapid and expansive U.S. monetary/fiscal-policy response partially offset the economic disruption and fueled the market surge, as did resilient corporate earnings. The rally slowed in September, when stocks began a two-month retreat amid Congress’s inability to reach a deal on additional fiscal stimulus, as well as concerns about election uncertainty, indications the U.S. economic recovery could be slowing and a new wave of COVID-19 cases. A shift in momentum began in October and accelerated following the U.S. elections, with the approval of three breakthrough COVID-19 vaccines and prospects for additional government stimulus fueling the “reflation trade” through February 28. By sector for the full 12 months, information technology (+50%) and consumer discretionary (+43%) led all gainers. Materials (+42%) and communication services (+37%) also stood out. In contrast, the defensive utilities (-3%) and real estate sectors (+5%) notably lagged.
Comments from Portfolio Manager Chuck Culp: For the fiscal year ending February 28, 2021, the fund gained 21.94%, outperforming the 19.08% advance of the S&P Consumer Finance Index (Gross), but underperforming the broad-based S&P 500
® index. Security selection in the consumer finance and regional banks groups gave the biggest boost to performance versus the industry index An overweighting in data processing & outsourced services also aided the fund's relative result. A non-index stake in Signature Bank (+79%) was the fund's biggest individual relative contributor. Avoiding Chimera Investment, an index component that returned about -33%, also helped, as did our out-of-index position in PayPal Holdings (+141%); we decreased exposure to PayPal the past 12 months. Conversely, stock selection in mortgage REITs (real estate investment trusts) hurt performance versus the industry index. Underexposure to Mr. Cooper Group, a new addition this period, was the fund's largest individual relative detractor. Within the industry index, the stock rose 145% this period. Our underweighting in Axos Financial, which gained 86% within the industry index, also hurt; Axos Financial was not in the fund at period end. Further hindering performance was our overweighting in MFA Financial (-41%). Notable changes in positioning include increased exposure to thrifts & mortgage finance and consumer finance and lower allocations to data processing & outsourced services and mortgage REITs.
The views expressed above reflect those of the portfolio manager(s) only through the end of the period as stated on the cover of this report and do not necessarily represent the views of Fidelity or any other person in the Fidelity organization. Any such views are subject to change at any time based upon market or other conditions and Fidelity disclaims any responsibility to update such views. These views may not be relied on as investment advice and, because investment decisions for a Fidelity fund are based on numerous factors, may not be relied on as an indication of trading intent on behalf of any Fidelity fund.
Consumer Finance Portfolio
Investment Summary (Unaudited)
Top Ten Stocks as of February 28, 2021
| | % of fund's net assets |
| Capital One Financial Corp. | 8.0 |
| Ally Financial, Inc. | 7.2 |
| AGNC Investment Corp. | 6.7 |
| Synchrony Financial | 6.4 |
| American Express Co. | 6.0 |
| MasterCard, Inc. Class A | 5.2 |
| Visa, Inc. Class A | 4.8 |
| OneMain Holdings, Inc. | 4.8 |
| Discover Financial Services | 4.8 |
| MGIC Investment Corp. | 4.0 |
| | 57.9 |
Top Industries (% of fund's net assets)
| As of February 28, 2021 |
| | Consumer Finance | 49.8% |
| | Thrifts & Mortgage Finance | 15.3% |
| | IT Services | 14.4% |
| | Mortgage Real Estate Investment Trusts | 13.9% |
| | Banks | 4.8% |
| | All Others* | 1.8% |

* Includes short-term investments and net other assets (liabilities).
Consumer Finance Portfolio
Schedule of Investments February 28, 2021
Showing Percentage of Net Assets
| Common Stocks - 99.6% | | | |
| | | Shares | Value |
| Banks - 4.8% | | | |
| Diversified Banks - 0.6% | | | |
| Wells Fargo & Co. | | 25,100 | $907,867 |
| Regional Banks - 4.2% | | | |
| Huntington Bancshares, Inc. | | 89,300 | 1,369,862 |
| Signature Bank | | 21,600 | 4,716,144 |
| | | | 6,086,006 |
|
| TOTAL BANKS | | | 6,993,873 |
|
| Consumer Finance - 49.8% | | | |
| Consumer Finance - 49.8% | | | |
| Ally Financial, Inc. | | 252,000 | 10,458,000 |
| American Express Co. | | 64,400 | 8,710,744 |
| Capital One Financial Corp. | | 96,200 | 11,562,277 |
| Credit Acceptance Corp. (a)(b) | | 8,175 | 2,967,689 |
| Discover Financial Services | | 73,600 | 6,923,552 |
| First Cash Financial Services, Inc. | | 39,011 | 2,470,177 |
| Navient Corp. | | 258,400 | 3,198,992 |
| OneMain Holdings, Inc. | | 149,219 | 6,999,863 |
| Santander Consumer U.S.A. Holdings, Inc. | | 182,700 | 4,567,500 |
| SLM Corp. | | 317,500 | 5,013,325 |
| Synchrony Financial | | 240,410 | 9,299,059 |
| | | | 72,171,178 |
| Entertainment - 0.2% | | | |
| Interactive Home Entertainment - 0.2% | | | |
| Sea Ltd. ADR (a) | | 1,300 | 306,397 |
| Insurance - 0.5% | | | |
| Multi-Line Insurance - 0.5% | | | |
| Assurant, Inc. | | 5,300 | 653,066 |
| Internet & Direct Marketing Retail - 0.2% | | | |
| Internet & Direct Marketing Retail - 0.2% | | | |
| MercadoLibre, Inc. (a) | | 200 | 327,622 |
| IT Services - 14.4% | | | |
| Data Processing & Outsourced Services - 14.4% | | | |
| Black Knight, Inc. (a) | | 12,600 | 966,294 |
| Fidelity National Information Services, Inc. | | 9,110 | 1,257,180 |
| Global Payments, Inc. | | 9,369 | 1,854,968 |
| Jack Henry & Associates, Inc. | | 4,400 | 653,136 |
| MasterCard, Inc. Class A | | 21,350 | 7,554,698 |
| Nuvei Corp. (a)(c) | | 1,600 | 83,280 |
| PayPal Holdings, Inc. (a) | | 3,800 | 987,430 |
| Repay Holdings Corp. (a) | | 18,400 | 401,120 |
| Visa, Inc. Class A | | 33,036 | 7,016,516 |
| | | | 20,774,622 |
| Mortgage Real Estate Investment Trusts - 13.9% | | | |
| Mortgage REITs - 13.9% | | | |
| AGNC Investment Corp. | | 609,400 | 9,768,682 |
| Annaly Capital Management, Inc. | | 229,015 | 1,903,115 |
| MFA Financial, Inc. | | 422,200 | 1,697,244 |
| New Residential Investment Corp. | | 389,150 | 4,000,462 |
| Redwood Trust, Inc. | | 274,000 | 2,696,160 |
| | | | 20,065,663 |
| Professional Services - 0.3% | | | |
| Research & Consulting Services - 0.3% | | | |
| Equifax, Inc. | | 2,600 | 420,888 |
| Software - 0.2% | | | |
| Application Software - 0.2% | | | |
| BTRS Holdings, Inc. (d) | | 20,000 | 338,000 |
| Thrifts & Mortgage Finance - 15.3% | | | |
| Thrifts & Mortgage Finance - 15.3% | | | |
| Essent Group Ltd. | | 19,200 | 791,616 |
| Meta Financial Group, Inc. | | 33,100 | 1,465,999 |
| MGIC Investment Corp. | | 471,828 | 5,746,865 |
| Mr. Cooper Group, Inc. (a)(b) | | 63,000 | 1,981,350 |
| New York Community Bancorp, Inc. | | 17,500 | 213,675 |
| NMI Holdings, Inc. (a) | | 12,500 | 285,750 |
| Pennymac Financial Services, Inc. | | 64,900 | 3,842,729 |
| TFS Financial Corp. | | 74,300 | 1,451,079 |
| Washington Federal, Inc. | | 104,700 | 3,164,034 |
| WSFS Financial Corp. | | 61,300 | 3,257,482 |
| | | | 22,200,579 |
| TOTAL COMMON STOCKS | | | |
| (Cost $98,329,321) | | | 144,251,888 |
|
| Money Market Funds - 2.5% | | | |
| Fidelity Cash Central Fund 0.07% (e) | | 355,334 | 355,405 |
| Fidelity Securities Lending Cash Central Fund 0.08% (e)(f) | | 3,320,036 | 3,320,368 |
| TOTAL MONEY MARKET FUNDS | | | |
| (Cost $3,675,773) | | | 3,675,773 |
| TOTAL INVESTMENT IN SECURITIES - 102.1% | | | |
| (Cost $102,005,094) | | | 147,927,661 |
| NET OTHER ASSETS (LIABILITIES) - (2.1)% | | | (3,047,546) |
| NET ASSETS - 100% | | | $144,880,115 |
Legend
(a) Non-income producing
(b) Security or a portion of the security is on loan at period end.
(c) Security exempt from registration under Rule 144A of the Securities Act of 1933. These securities may be resold in transactions exempt from registration, normally to qualified institutional buyers. At the end of the period, the value of these securities amounted to $83,280 or 0.1% of net assets.
(d) Restricted securities (including private placements) - Investment in securities not registered under the Securities Act of 1933 (excluding 144A issues). At the end of the period, the value of restricted securities (excluding 144A issues) amounted to $338,000 or 0.2% of net assets.
(e) Affiliated fund that is generally available only to investment companies and other accounts managed by Fidelity Investments. The rate quoted is the annualized seven-day yield of the fund at period end. A complete unaudited listing of the fund's holdings as of its most recent quarter end is available upon request. In addition, each Fidelity Central Fund's financial statements, which are not covered by the Fund's Report of Independent Registered Public Accounting Firm, are available on the SEC's website or upon request.
(f) Investment made with cash collateral received from securities on loan.
Additional information on each restricted holding is as follows:
| Security | Acquisition Date | Acquisition Cost |
| BTRS Holdings, Inc. | 1/12/21 | $200,000 |
Affiliated Central Funds
Information regarding fiscal year to date income earned by the Fund from investments in Fidelity Central Funds is as follows:
| Fund | Income earned |
| Fidelity Cash Central Fund | $1,838 |
| Fidelity Securities Lending Cash Central Fund | 10,636 |
| Total | $12,474 |
Amounts in the income column in the above table include any capital gain distributions from underlying funds, which are presented in the corresponding line-item in the Statement of Operations, if applicable. Amount for Fidelity Securities Lending Cash Central Fund represents the income earned on investing cash collateral, less rebates paid to borrowers and any lending agent fees associated with the loan, plus any premium payments received for lending certain types of securities.
Investment Valuation
The following is a summary of the inputs used, as of February 28, 2021, involving the Fund's assets and liabilities carried at fair value. The inputs or methodology used for valuing securities may not be an indication of the risk associated with investing in those securities. For more information on valuation inputs, and their aggregation into the levels used below, please refer to the Investment Valuation section in the accompanying Notes to Financial Statements.
| | Valuation Inputs at Reporting Date: |
| Description | Total | Level 1 | Level 2 | Level 3 |
| Investments in Securities: | | | | |
| Common Stocks | $144,251,888 | $144,251,888 | $-- | $-- |
| Money Market Funds | 3,675,773 | 3,675,773 | -- | -- |
| Total Investments in Securities: | $147,927,661 | $147,927,661 | $-- | $-- |
See accompanying notes which are an integral part of the financial statements.
Consumer Finance Portfolio
Financial Statements
Statement of Assets and Liabilities
| | | February 28, 2021 |
| Assets | | |
Investment in securities, at value (including securities loaned of $3,298,009) — See accompanying schedule:
Unaffiliated issuers (cost $98,329,321) | $144,251,888 | |
| Fidelity Central Funds (cost $3,675,773) | 3,675,773 | |
| Total Investment in Securities (cost $102,005,094) | | $147,927,661 |
| Cash | | 6,086 |
| Receivable for investments sold | | 72,966 |
| Receivable for fund shares sold | | 721,915 |
| Dividends receivable | | 188,115 |
| Distributions receivable from Fidelity Central Funds | | 589 |
| Prepaid expenses | | 619 |
| Other receivables | | 718 |
| Total assets | | 148,918,669 |
| Liabilities | | |
| Payable for investments purchased | $435,831 | |
| Payable for fund shares redeemed | 159,019 | |
| Accrued management fee | 62,532 | |
| Other affiliated payables | 29,368 | |
| Other payables and accrued expenses | 32,279 | |
| Collateral on securities loaned | 3,319,525 | |
| Total liabilities | | 4,038,554 |
| Net Assets | | $144,880,115 |
| Net Assets consist of: | | |
| Paid in capital | | $100,968,166 |
| Total accumulated earnings (loss) | | 43,911,949 |
| Net Assets | | $144,880,115 |
| Net Asset Value, offering price and redemption price per share ($144,880,115 ÷ 7,481,484 shares) | | $19.37 |
See accompanying notes which are an integral part of the financial statements.
Statement of Operations
| | | Year ended February 28, 2021 |
| Investment Income | | |
| Dividends | | $3,165,895 |
| Special dividends | | 517,017 |
| Income from Fidelity Central Funds (including $10,636 from security lending) | | 12,474 |
| Total income | | 3,695,386 |
| Expenses | | |
| Management fee | $606,588 | |
| Transfer agent fees | 287,289 | |
| Accounting fees | 44,534 | |
| Custodian fees and expenses | 5,357 | |
| Independent trustees' fees and expenses | 666 | |
| Registration fees | 32,080 | |
| Audit | 38,273 | |
| Legal | 2,602 | |
| Miscellaneous | 4,724 | |
| Total expenses before reductions | 1,022,113 | |
| Expense reductions | (7,127) | |
| Total expenses after reductions | | 1,014,986 |
| Net investment income (loss) | | 2,680,400 |
| Realized and Unrealized Gain (Loss) | | |
| Net realized gain (loss) on: | | |
| Investment securities: | | |
| Unaffiliated issuers | (1,771,187) | |
| Fidelity Central Funds | 755 | |
| Foreign currency transactions | (51) | |
| Total net realized gain (loss) | | (1,770,483) |
| Change in net unrealized appreciation (depreciation) on investment securities | | 19,426,786 |
| Net gain (loss) | | 17,656,303 |
| Net increase (decrease) in net assets resulting from operations | | $20,336,703 |
See accompanying notes which are an integral part of the financial statements.
Statement of Changes in Net Assets
| | Year ended February 28, 2021 | Year ended February 29, 2020 |
| Increase (Decrease) in Net Assets | | |
| Operations | | |
| Net investment income (loss) | $2,680,400 | $3,451,870 |
| Net realized gain (loss) | (1,770,483) | (62,773) |
| Change in net unrealized appreciation (depreciation) | 19,426,786 | 782,674 |
| Net increase (decrease) in net assets resulting from operations | 20,336,703 | 4,171,771 |
| Distributions to shareholders | (2,613,470) | (2,870,396) |
| Share transactions | | |
| Proceeds from sales of shares | 60,803,718 | 141,915,304 |
| Reinvestment of distributions | 2,390,791 | 2,749,682 |
| Cost of shares redeemed | (84,284,960) | (100,053,055) |
| Net increase (decrease) in net assets resulting from share transactions | (21,090,451) | 44,611,931 |
| Total increase (decrease) in net assets | (3,367,218) | 45,913,306 |
| Net Assets | | |
| Beginning of period | 148,247,333 | 102,334,027 |
| End of period | $144,880,115 | $148,247,333 |
| Other Information | | |
| Shares | | |
| Sold | 4,293,129 | 8,358,702 |
| Issued in reinvestment of distributions | 153,801 | 154,483 |
| Redeemed | (6,098,211) | (5,856,956) |
| Net increase (decrease) | (1,651,281) | 2,656,229 |
See accompanying notes which are an integral part of the financial statements.
Financial Highlights
Consumer Finance Portfolio
| | | | | | |
| Years ended February 28, | 2021 | 2020 A | 2019 | 2018 | 2017 |
| Selected Per–Share Data | | | | | |
| Net asset value, beginning of period | $16.23 | $15.80 | $16.29 | $14.02 | $10.94 |
| Income from Investment Operations | | | | | |
| Net investment income (loss)B | .34C | .39 | .24 | .20 | .21 |
| Net realized and unrealized gain (loss) | 3.14 | .35 | .43 | 2.33D | 3.38 |
| Total from investment operations | 3.48 | .74 | .67 | 2.53 | 3.59 |
| Distributions from net investment income | (.34) | (.31) | (.20) | (.26) | (.23) |
| Distributions from net realized gain | – | (.01) | (.95) | – | (.28) |
| Total distributions | (.34) | (.31)E | (1.16)E | (.26) | (.51) |
| Redemption fees added to paid in capitalB | – | – | – | –F | –F |
| Net asset value, end of period | $19.37 | $16.23 | $15.80 | $16.29 | $14.02 |
| Total ReturnG | 21.94% | 4.54% | 4.83% | 18.07%D | 33.57% |
| Ratios to Average Net AssetsH,I | | | | | |
| Expenses before reductions | .89% | .86% | .87% | .90% | .94% |
| Expenses net of fee waivers, if any | .89% | .86% | .87% | .89% | .94% |
| Expenses net of all reductions | .89% | .85% | .86% | .89% | .93% |
| Net investment income (loss) | 2.35%C | 2.29% | 1.57% | 1.38% | 1.72% |
| Supplemental Data | | | | | |
| Net assets, end of period (000 omitted) | $144,880 | $148,247 | $102,334 | $104,105 | $101,823 |
| Portfolio turnover rateJ | 25% | 20% | 32% | 81% | 44% |
A For the year ended February 29.
B Calculated based on average shares outstanding during the period.
C Net investment income per share reflects one or more large, non-recurring dividend(s) which amounted to $.07 per share. Excluding such non-recurring dividend(s), the ratio of net investment income (loss) to average net assets would have been 1.89%.
D Net realized and unrealized gain (loss) per share reflects proceeds received from litigation which amounted to $.28 per share. Excluding these litigation proceeds, the total return would have been 16.18%.
E Total distributions per share do not sum due to rounding.
F Amount represents less than $.005 per share.
G Total returns would have been lower if certain expenses had not been reduced during the applicable periods shown.
H Fees and expenses of any underlying mutual funds or exchange-traded funds (ETFs) are not included in the Fund's expense ratio. The Fund indirectly bears its proportionate share of these expenses. For additional expense information related to investments in Fidelity Central Funds, please refer to the "Investments in Fidelity Central Funds" note found in the Notes to Financial Statements section of the most recent Annual or Semi-Annual report.
I Expense ratios reflect operating expenses of the class. Expenses before reductions do not reflect amounts reimbursed, waived, or reduced through arrangements with the investment advisor, brokerage services, or other offset arrangements, if applicable, and do not represent the amount paid by the class during periods when reimbursements, waivers or reductions occur.
J Amount does not include the portfolio activity of any underlying mutual funds or exchange-traded funds (ETFs).
See accompanying notes which are an integral part of the financial statements.
Financial Services Portfolio
Performance: The Bottom Line
Average annual total return reflects the change in the value of an investment, assuming reinvestment of distributions from dividend income and capital gains (the profits earned upon the sale of securities that have grown in value, if any) and assuming a constant rate of performance each year. The hypothetical investment and the average annual total returns do not reflect the deduction of taxes that a shareholder would pay on fund distributions or the redemption of fund shares. During periods of reimbursement by Fidelity, a fund’s total return will be greater than it would be had the reimbursement not occurred. How a fund did yesterday is no guarantee of how it will do tomorrow.
Average Annual Total Returns
| For the periods ended February 28, 2021 | Past 1 year | Past 5 years | Past 10 years |
| Financial Services Portfolio | 27.89% | 15.21% | 9.91% |
$10,000 Over 10 Years
Let's say hypothetically that $10,000 was invested in Financial Services Portfolio on February 28, 2011.
The chart shows how the value of your investment would have changed, and also shows how the S&P 500® Index performed over the same period.
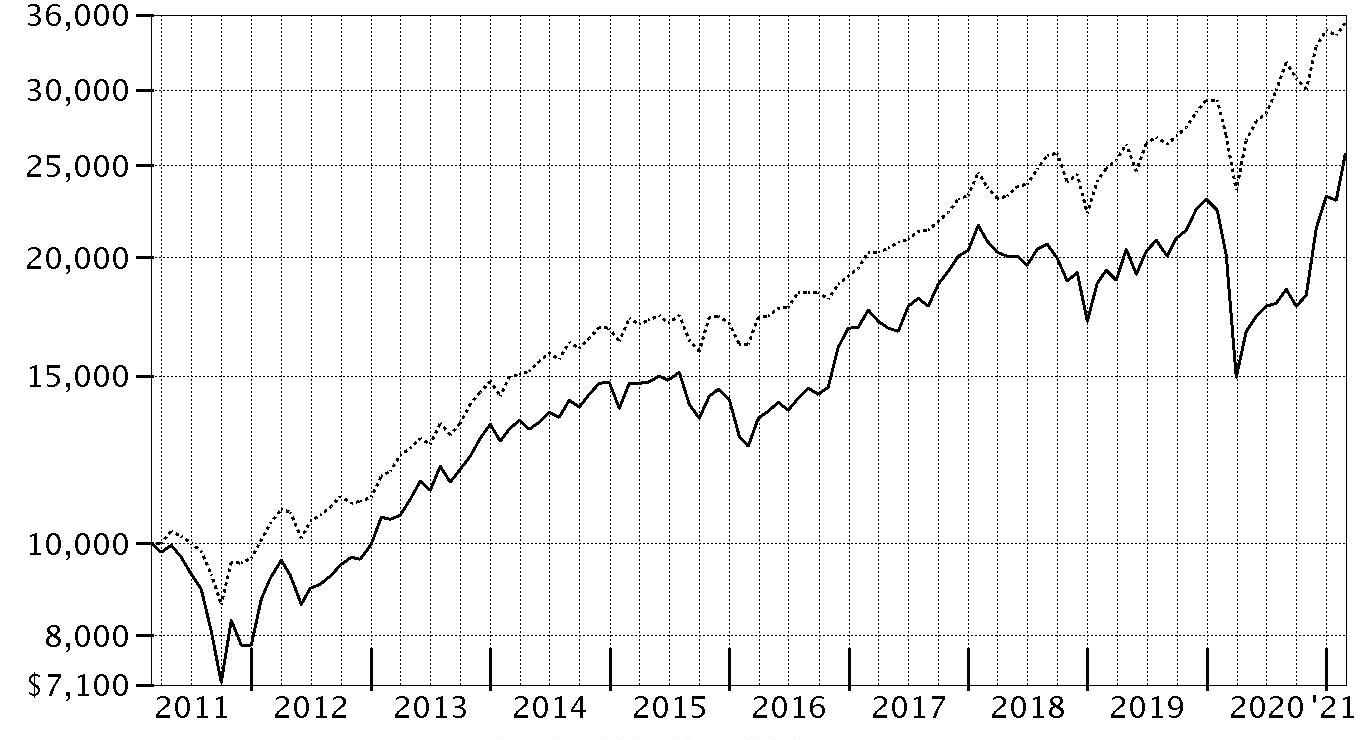
| Period Ending Values |
| $25,720 | Financial Services Portfolio |
| $35,259 | S&P 500® Index |
Financial Services Portfolio
Management's Discussion of Fund Performance
Market Recap: The S&P 500
® index gained 31.29% for the 12 months ending February 28, 2021, a volatile but productive period for U.S. risk assets. The early-2020 outbreak and spread of COVID-19 resulted in stocks suffering one of the quickest declines on record, through March 23, followed by a historic rebound that included the index closing 2020 at an all-time high and gaining modest ground in the first two months of the new year. The crisis and containment efforts caused broad contraction in economic activity, along with extreme uncertainty and dislocation in financial markets. A rapid and expansive U.S. monetary/fiscal-policy response partially offset the economic disruption and fueled the market surge, as did resilient corporate earnings. The rally slowed in September, when stocks began a two-month retreat amid Congress’s inability to reach a deal on additional fiscal stimulus, as well as concerns about election uncertainty, indications the U.S. economic recovery could be slowing and a new wave of COVID-19 cases. A shift in momentum began in October and accelerated following the U.S. elections, with the approval of three breakthrough COVID-19 vaccines and prospects for additional government stimulus fueling the “reflation trade” through February 28. By sector for the full 12 months, information technology (+50%) and consumer discretionary (+43%) led all gainers. Materials (+42%) and communication services (+37%) also stood out. In contrast, the defensive utilities (-3%) and real estate sectors (+5%) notably lagged.
Comments from Portfolio Manager Matthew Reed: For the fiscal year ending February 28, 2021, the fund gained 27.89%, outperforming the 24.94% increase in the MSCI US IMI Financials 5% Capped Linked Index, but underperforming the broad-based S&P 500
® index. The primary contributor to performance versus the sector index was security selection and an overweighting in consumer finance. Also bolstering the fund's relative result was an underweighting in multi-sector holdings and mortgage REITs. The fund's largest individual relative contributor was our lighter-than-index stake in Berkshire Hathaway, which gained roughly 17% the past 12 months and was no longer held at period end. Also lifting performance was our outsized stake in Morgan Stanley, which gained about 76% and was among the portfolio’s largest holdings. Another notable relative contributor was an overweight position in Discover Financial Services (+136%), which was sold prior to February 28. Conversely, the primary detractor from performance versus the sector index was our stock picking among diversified banks. The biggest individual relative detractor was an overweight position in CBOE Global Markets (-12%), one of the fund's biggest holdings this period. Also pressuring the fund’s relative return was an overweighting in Wells Fargo (-8%), which was another of the fund's largest holdings. Further detracting was our out-of-index stake in Equifax (+13%), a position we established this period. Notable changes in positioning include increased exposure to consumer finance stocks and a lower allocation to investment banking & brokerage firms.
The views expressed above reflect those of the portfolio manager(s) only through the end of the period as stated on the cover of this report and do not necessarily represent the views of Fidelity or any other person in the Fidelity organization. Any such views are subject to change at any time based upon market or other conditions and Fidelity disclaims any responsibility to update such views. These views may not be relied on as investment advice and, because investment decisions for a Fidelity fund are based on numerous factors, may not be relied on as an indication of trading intent on behalf of any Fidelity fund.
Financial Services Portfolio
Investment Summary (Unaudited)
Top Ten Stocks as of February 28, 2021
| | % of fund's net assets |
| Citigroup, Inc. | 5.6 |
| Wells Fargo & Co. | 5.5 |
| Bank of America Corp. | 5.2 |
| Morgan Stanley | 4.8 |
| American Express Co. | 4.4 |
| Capital One Financial Corp. | 4.1 |
| The Travelers Companies, Inc. | 4.1 |
| PNC Financial Services Group, Inc. | 2.8 |
| U.S. Bancorp | 2.6 |
| Bank of New York Mellon Corp. | 2.3 |
| | 41.4 |
Top Industries (% of fund's net assets)
| As of February 28, 2021 |
| | Banks | 36.9% |
| | Insurance | 24.5% |
| | Capital Markets | 19.0% |
| | Consumer Finance | 10.6% |
| | Thrifts & Mortgage Finance | 4.0% |
| | All Others* | 5.0% |
* Includes short-term investments and net other assets (liabilities).
Financial Services Portfolio
Schedule of Investments February 28, 2021
Showing Percentage of Net Assets
| Common Stocks - 99.5% | | | |
| | | Shares | Value |
| Banks - 36.9% | | | |
| Diversified Banks - 18.9% | | | |
| Bank of America Corp. | | 909,100 | $31,554,861 |
| Citigroup, Inc. | | 509,500 | 33,565,860 |
| U.S. Bancorp | | 316,600 | 15,830,000 |
| Wells Fargo & Co. | | 917,490 | 33,185,613 |
| | | | 114,136,334 |
| Regional Banks - 18.0% | | | |
| Ameris Bancorp | | 74,300 | 3,539,652 |
| Associated Banc-Corp. | | 92,900 | 1,871,935 |
| Bank OZK | | 158,100 | 6,516,882 |
| BOK Financial Corp. | | 45,600 | 3,924,336 |
| Cadence Bancorp Class A | | 254,400 | 5,220,288 |
| East West Bancorp, Inc. | | 60,900 | 4,394,544 |
| First Horizon National Corp. | | 493,000 | 7,986,600 |
| First Interstate Bancsystem, Inc. | | 75,400 | 3,424,668 |
| Great Western Bancorp, Inc. | | 81,700 | 2,192,011 |
| Huntington Bancshares, Inc. | | 737,200 | 11,308,648 |
| KeyCorp | | 276,100 | 5,560,654 |
| M&T Bank Corp. | | 60,900 | 9,192,246 |
| PacWest Bancorp | | 40,200 | 1,456,848 |
| Peoples United Financial, Inc. | | 202,200 | 3,627,468 |
| PNC Financial Services Group, Inc. | | 101,400 | 17,071,704 |
| Signature Bank | | 48,200 | 10,523,988 |
| WesBanco, Inc. | | 111,300 | 3,592,764 |
| Wintrust Financial Corp. | | 106,900 | 7,874,254 |
| | | | 109,279,490 |
|
| TOTAL BANKS | | | 223,415,824 |
|
| Capital Markets - 19.0% | | | |
| Asset Management & Custody Banks - 9.7% | | | |
| Affiliated Managers Group, Inc. | | 51,400 | 7,194,458 |
| AllianceBernstein Holding LP | | 203,773 | 7,449,941 |
| Bank of New York Mellon Corp. | | 337,600 | 14,233,216 |
| Brookfield Asset Management, Inc. Class A | | 209,500 | 8,453,325 |
| Carlyle Group LP | | 209,900 | 7,189,075 |
| Northern Trust Corp. | | 37,300 | 3,548,349 |
| State Street Corp. | | 148,700 | 10,820,899 |
| | | | 58,889,263 |
| Financial Exchanges & Data - 1.8% | | | |
| Cboe Global Markets, Inc. | | 107,600 | 10,648,096 |
| Investment Banking & Brokerage - 7.5% | | | |
| Lazard Ltd. Class A | | 109,900 | 4,252,031 |
| Morgan Stanley | | 384,000 | 29,518,080 |
| Raymond James Financial, Inc. | | 67,100 | 7,833,254 |
| Virtu Financial, Inc. Class A | | 150,200 | 4,095,954 |
| | | | 45,699,319 |
|
| TOTAL CAPITAL MARKETS | | | 115,236,678 |
|
| Consumer Finance - 10.6% | | | |
| Consumer Finance - 10.6% | | | |
| American Express Co. | | 195,300 | 26,416,278 |
| Capital One Financial Corp. | | 209,000 | 25,119,710 |
| Navient Corp. | | 355,000 | 4,394,900 |
| OneMain Holdings, Inc. | | 155,300 | 7,285,123 |
| SLM Corp. | | 73,100 | 1,154,249 |
| | | | 64,370,260 |
| Diversified Financial Services - 1.0% | | | |
| Multi-Sector Holdings - 1.0% | | | |
| Cannae Holdings, Inc. (a) | | 158,190 | 5,908,397 |
| Insurance - 24.5% | | | |
| Insurance Brokers - 3.6% | | | |
| Arthur J. Gallagher & Co. | | 98,800 | 11,836,240 |
| Willis Towers Watson PLC | | 45,869 | 10,120,536 |
| | | | 21,956,776 |
| Life & Health Insurance - 3.2% | | | |
| CNO Financial Group, Inc. | | 225,000 | 5,413,500 |
| MetLife, Inc. | | 172,900 | 9,959,040 |
| Primerica, Inc. | | 27,300 | 3,855,579 |
| | | | 19,228,119 |
| Multi-Line Insurance - 5.6% | | | |
| American Financial Group, Inc. | | 87,600 | 9,346,920 |
| American International Group, Inc. | | 251,100 | 11,035,845 |
| Assurant, Inc. | | 55,100 | 6,789,422 |
| Hartford Financial Services Group, Inc. | | 130,400 | 6,609,976 |
| | | | 33,782,163 |
| Property & Casualty Insurance - 9.5% | | | |
| Chubb Ltd. | | 59,600 | 9,689,768 |
| First American Financial Corp. | | 141,700 | 7,444,918 |
| Hiscox Ltd. (a) | | 432,200 | 5,684,211 |
| Kemper Corp. | | 59,600 | 4,506,952 |
| Old Republic International Corp. | | 269,000 | 5,199,770 |
| The Travelers Companies, Inc. | | 170,200 | 24,764,100 |
| | | | 57,289,719 |
| Reinsurance - 2.6% | | | |
| Reinsurance Group of America, Inc. | | 89,100 | 10,890,693 |
| RenaissanceRe Holdings Ltd. | | 30,700 | 5,126,286 |
| | | | 16,016,979 |
|
| TOTAL INSURANCE | | | 148,273,756 |
|
| IT Services - 2.2% | | | |
| Data Processing & Outsourced Services - 2.2% | | | |
| Computer Services, Inc. | | 32,281 | 1,936,860 |
| Fidelity National Information Services, Inc. | | 38,900 | 5,368,200 |
| Visa, Inc. Class A | | 28,900 | 6,138,071 |
| | | | 13,443,131 |
| Professional Services - 1.3% | | | |
| Research & Consulting Services - 1.3% | | | |
| Dun & Bradstreet Holdings, Inc. (a) | | 82,100 | 1,794,706 |
| Equifax, Inc. | | 39,300 | 6,361,884 |
| | | | 8,156,590 |
| Thrifts & Mortgage Finance - 4.0% | | | |
| Thrifts & Mortgage Finance - 4.0% | | | |
| Essent Group Ltd. | | 173,300 | 7,145,159 |
| MGIC Investment Corp. | | 823,000 | 10,024,140 |
| NMI Holdings, Inc. (a) | | 261,300 | 5,973,318 |
| Radian Group, Inc. | | 59,700 | 1,217,880 |
| | | | 24,360,497 |
| TOTAL COMMON STOCKS | | | |
| (Cost $464,634,876) | | | 603,165,133 |
|
| Money Market Funds - 0.6% | | | |
| Fidelity Cash Central Fund 0.07% (b) | | | |
| (Cost $3,527,615) | | 3,526,910 | 3,527,615 |
| TOTAL INVESTMENT IN SECURITIES - 100.1% | | | |
| (Cost $468,162,491) | | | 606,692,748 |
| NET OTHER ASSETS (LIABILITIES) - (0.1)% | | | (645,046) |
| NET ASSETS - 100% | | | $606,047,702 |
Legend
(a) Non-income producing
(b) Affiliated fund that is generally available only to investment companies and other accounts managed by Fidelity Investments. The rate quoted is the annualized seven-day yield of the fund at period end. A complete unaudited listing of the fund's holdings as of its most recent quarter end is available upon request. In addition, each Fidelity Central Fund's financial statements, which are not covered by the Fund's Report of Independent Registered Public Accounting Firm, are available on the SEC's website or upon request.
Affiliated Central Funds
Information regarding fiscal year to date income earned by the Fund from investments in Fidelity Central Funds is as follows:
| Fund | Income earned |
| Fidelity Cash Central Fund | $3,054 |
| Fidelity Securities Lending Cash Central Fund | 1,887 |
| Total | $4,941 |
Amounts in the income column in the above table include any capital gain distributions from underlying funds, which are presented in the corresponding line-item in the Statement of Operations, if applicable. Amount for Fidelity Securities Lending Cash Central Fund represents the income earned on investing cash collateral, less rebates paid to borrowers and any lending agent fees associated with the loan, plus any premium payments received for lending certain types of securities.
Investment Valuation
The following is a summary of the inputs used, as of February 28, 2021, involving the Fund's assets and liabilities carried at fair value. The inputs or methodology used for valuing securities may not be an indication of the risk associated with investing in those securities. For more information on valuation inputs, and their aggregation into the levels used below, please refer to the Investment Valuation section in the accompanying Notes to Financial Statements.
| | Valuation Inputs at Reporting Date: |
| Description | Total | Level 1 | Level 2 | Level 3 |
| Investments in Securities: | | | | |
| Common Stocks | $603,165,133 | $603,165,133 | $-- | $-- |
| Money Market Funds | 3,527,615 | 3,527,615 | -- | -- |
| Total Investments in Securities: | $606,692,748 | $606,692,748 | $-- | $-- |
See accompanying notes which are an integral part of the financial statements.
Financial Services Portfolio
Financial Statements
Statement of Assets and Liabilities
| | | February 28, 2021 |
| Assets | | |
Investment in securities, at value — See accompanying schedule:
Unaffiliated issuers (cost $464,634,876) | $603,165,133 | |
| Fidelity Central Funds (cost $3,527,615) | 3,527,615 | |
| Total Investment in Securities (cost $468,162,491) | | $606,692,748 |
| Receivable for fund shares sold | | 2,739,948 |
| Dividends receivable | | 942,227 |
| Distributions receivable from Fidelity Central Funds | | 105 |
| Prepaid expenses | | 6,881 |
| Other receivables | | 5,949 |
| Total assets | | 610,387,858 |
| Liabilities | | |
| Payable for investments purchased | $3,641,115 | |
| Payable for fund shares redeemed | 316,246 | |
| Accrued management fee | 257,473 | |
| Other affiliated payables | 91,068 | |
| Other payables and accrued expenses | 34,254 | |
| Total liabilities | | 4,340,156 |
| Net Assets | | $606,047,702 |
| Net Assets consist of: | | |
| Paid in capital | | $470,265,325 |
| Total accumulated earnings (loss) | | 135,782,377 |
| Net Assets | | $606,047,702 |
| Net Asset Value, offering price and redemption price per share ($606,047,702 ÷ 53,827,854 shares) | | $11.26 |
See accompanying notes which are an integral part of the financial statements.
Statement of Operations
| | | Year ended February 28, 2021 |
| Investment Income | | |
| Dividends | | $13,628,767 |
| Income from Fidelity Central Funds (including $1,887 from security lending) | | 4,941 |
| Total income | | 13,633,708 |
| Expenses | | |
| Management fee | $2,320,117 | |
| Transfer agent fees | 782,802 | |
| Accounting fees | 169,042 | |
| Custodian fees and expenses | 9,344 | |
| Independent trustees' fees and expenses | 2,437 | |
| Registration fees | 38,820 | |
| Audit | 41,556 | |
| Legal | 1,788 | |
| Interest | 64 | |
| Miscellaneous | 11,542 | |
| Total expenses before reductions | 3,377,512 | |
| Expense reductions | (34,609) | |
| Total expenses after reductions | | 3,342,903 |
| Net investment income (loss) | | 10,290,805 |
| Realized and Unrealized Gain (Loss) | | |
| Net realized gain (loss) on: | | |
| Investment securities: | | |
| Unaffiliated issuers | (3,226,139) | |
| Fidelity Central Funds | (627) | |
| Foreign currency transactions | (13,990) | |
| Total net realized gain (loss) | | (3,240,756) |
| Change in net unrealized appreciation (depreciation) on: | | |
| Investment securities: | | |
| Unaffiliated issuers | 109,247,930 | |
| Assets and liabilities in foreign currencies | (30) | |
| Total change in net unrealized appreciation (depreciation) | | 109,247,900 |
| Net gain (loss) | | 106,007,144 |
| Net increase (decrease) in net assets resulting from operations | | $116,297,949 |
See accompanying notes which are an integral part of the financial statements.
Statement of Changes in Net Assets
| | Year ended February 28, 2021 | Year ended February 29, 2020 |
| Increase (Decrease) in Net Assets | | |
| Operations | | |
| Net investment income (loss) | $10,290,805 | $9,837,410 |
| Net realized gain (loss) | (3,240,756) | 50,080,923 |
| Change in net unrealized appreciation (depreciation) | 109,247,900 | (38,602,945) |
| Net increase (decrease) in net assets resulting from operations | 116,297,949 | 21,315,388 |
| Distributions to shareholders | (29,274,755) | (30,387,187) |
| Share transactions | | |
| Proceeds from sales of shares | 213,063,603 | 94,490,608 |
| Reinvestment of distributions | 27,752,133 | 28,305,777 |
| Cost of shares redeemed | (205,127,889) | (188,816,638) |
| Net increase (decrease) in net assets resulting from share transactions | 35,687,847 | (66,020,253) |
| Total increase (decrease) in net assets | 122,711,041 | (75,092,052) |
| Net Assets | | |
| Beginning of period | 483,336,661 | 558,428,713 |
| End of period | $606,047,702 | $483,336,661 |
| Other Information | | |
| Shares | | |
| Sold | 23,964,944 | 8,971,280 |
| Issued in reinvestment of distributions | 3,577,346 | 2,601,634 |
| Redeemed | (24,643,342) | (18,497,880) |
| Net increase (decrease) | 2,898,948 | (6,924,966) |
See accompanying notes which are an integral part of the financial statements.
Financial Highlights
Financial Services Portfolio
| | | | | | |
| Years ended February 28, | 2021 | 2020 A | 2019 B | 2018 B | 2017 B |
| Selected Per–Share Data | | | | | |
| Net asset value, beginning of period | $9.49 | $9.65 | $11.67 | $10.31 | $7.50 |
| Income from Investment Operations | | | | | |
| Net investment income (loss)C | .20 | .19 | .14 | .09 | .10 |
| Net realized and unrealized gain (loss) | 2.17 | .26 | (1.04) | 1.76 | 2.81 |
| Total from investment operations | 2.37 | .45 | (.90) | 1.85 | 2.91 |
| Distributions from net investment income | (.21) | (.16) | (.14) | (.07) | (.10) |
| Distributions from net realized gain | (.39) | (.45) | (.98) | (.42) | – |
| Total distributions | (.60) | (.61) | (1.12) | (.49) | (.10) |
| Redemption fees added to paid in capitalC | – | – | – | – | –D |
| Net asset value, end of period | $11.26 | $9.49 | $9.65 | $11.67 | $10.31 |
| Total ReturnE | 27.89% | 3.81% | (6.91)% | 18.33% | 38.78% |
| Ratios to Average Net AssetsF,G | | | | | |
| Expenses before reductions | .77% | .77% | .76% | .77% | .77% |
| Expenses net of fee waivers, if any | .77% | .77% | .76% | .77% | .77% |
| Expenses net of all reductions | .77% | .76% | .75% | .76% | .76% |
| Net investment income (loss) | 2.36% | 1.81% | 1.28% | .87% | 1.10% |
| Supplemental Data | | | | | |
| Net assets, end of period (000 omitted) | $606,048 | $483,337 | $558,429 | $1,308,254 | $1,019,656 |
| Portfolio turnover rateH | 63% | 61%I | 49%I | 54% | 84%I |
A For the year ended February 29.
B Per share amounts have been adjusted to reflect the impact of the 10 for 1 share split that occurred on August 10, 2018.
C Calculated based on average shares outstanding during the period.
D Amount represents less than $.005 per share.
E Total returns would have been lower if certain expenses had not been reduced during the applicable periods shown.
F Fees and expenses of any underlying mutual funds or exchange-traded funds (ETFs) are not included in the Fund's expense ratio. The Fund indirectly bears its proportionate share of these expenses. For additional expense information related to investments in Fidelity Central Funds, please refer to the "Investments in Fidelity Central Funds" note found in the Notes to Financial Statements section of the most recent Annual or Semi-Annual report.
G Expense ratios reflect operating expenses of the class. Expenses before reductions do not reflect amounts reimbursed, waived, or reduced through arrangements with the investment advisor, brokerage services, or other offset arrangements, if applicable, and do not represent the amount paid by the class during periods when reimbursements, waivers or reductions occur.
H Amount does not include the portfolio activity of any underlying mutual funds or exchange-traded funds (ETFs).
I Portfolio turnover rate excludes securities received or delivered in-kind.
See accompanying notes which are an integral part of the financial statements.
Insurance Portfolio
Performance: The Bottom Line
Average annual total return reflects the change in the value of an investment, assuming reinvestment of distributions from dividend income and capital gains (the profits earned upon the sale of securities that have grown in value, if any) and assuming a constant rate of performance each year. The hypothetical investment and the average annual total returns do not reflect the deduction of taxes that a shareholder would pay on fund distributions or the redemption of fund shares. During periods of reimbursement by Fidelity, a fund’s total return will be greater than it would be had the reimbursement not occurred. How a fund did yesterday is no guarantee of how it will do tomorrow.
Average Annual Total Returns
| For the periods ended February 28, 2021 | Past 1 year | Past 5 years | Past 10 years |
| Insurance Portfolio | 15.54% | 11.98% | 11.14% |
$10,000 Over 10 Years
Let's say hypothetically that $10,000 was invested in Insurance Portfolio on February 28, 2011.
The chart shows how the value of your investment would have changed, and also shows how the S&P 500® Index performed over the same period.
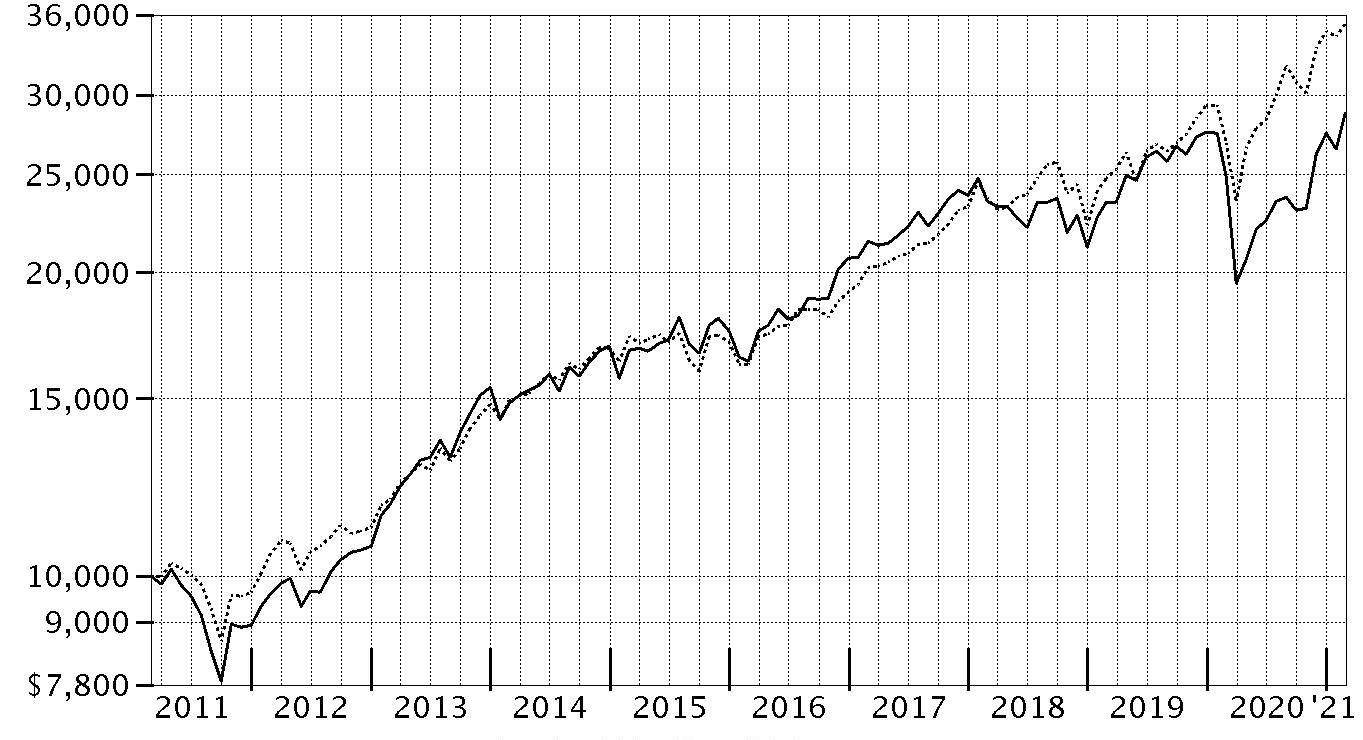
| Period Ending Values |
| $28,750 | Insurance Portfolio |
| $35,259 | S&P 500® Index |
Insurance Portfolio
Management's Discussion of Fund Performance
Market Recap: The S&P 500
® index gained 31.29% for the 12 months ending February 28, 2021, a volatile but productive period for U.S. risk assets. The early-2020 outbreak and spread of COVID-19 resulted in stocks suffering one of the quickest declines on record, through March 23, followed by a historic rebound that included the index closing 2020 at an all-time high and gaining modest ground in the first two months of the new year. The crisis and containment efforts caused broad contraction in economic activity, along with extreme uncertainty and dislocation in financial markets. A rapid and expansive U.S. monetary/fiscal-policy response partially offset the economic disruption and fueled the market surge, as did resilient corporate earnings. The rally slowed in September, when stocks began a two-month retreat amid Congress’s inability to reach a deal on additional fiscal stimulus, as well as concerns about election uncertainty, indications the U.S. economic recovery could be slowing and a new wave of COVID-19 cases. A shift in momentum began in October and accelerated following the U.S. elections, with the approval of three breakthrough COVID-19 vaccines and prospects for additional government stimulus fueling the “reflation trade” through February 28. By sector for the full 12 months, information technology (+50%) and consumer discretionary (+43%) led all gainers. Materials (+42%) and communication services (+37%) also stood out. In contrast, the defensive utilities (-3%) and real estate sectors (+5%) notably lagged.
Comments from Portfolio Manager Peter Deutsch: For the fiscal year ending February 28, 2021, the fund gained 15.54%, outperforming the 13.76% advance of the MSCI US IMI Insurance 25/50 Index, but underperforming the broad-based S&P 500
® index. Versus the industry index, security selection was the primary contributor, especially within the asset management & custody banks category. An underweighting and security selection among reinsurance stocks, along with investment choices within life & health insurance, lifted the fund's relative result as well. Our non-index stake in Ares Management was the fund's biggest individual relative contributor, driven by a roughly 52% increase. We decreased our stake in the company in the past 12 months. Also lifting performance was an underweighting in Aon, which returned about -21% and was among our largest holdings. Another notable relative contributor was an overweighting in Travelers Companies (+24%), also one of our biggest holdings. In contrast, the largest detractor from performance versus the industry index was an underweighting in life & health insurance. Weak stock picks among multi-line insurance companies also hindered the portfolio’s relative performance. The fund's largest individual relative detractor was our lighter-than-index stake in Lincoln National, which gained 31% the past 12 months. Lincoln National was not held at period end. Also hindering performance was our underweighting in Progressive, which gained roughly 24% and was among the fund’s biggest holdings on February 28. Avoiding Erie Indemnity, an index component that gained 74%, also weighed on relative performance this period. Notable changes in positioning include reduced exposure to life & health insurance firms.
The views expressed above reflect those of the portfolio manager(s) only through the end of the period as stated on the cover of this report and do not necessarily represent the views of Fidelity or any other person in the Fidelity organization. Any such views are subject to change at any time based upon market or other conditions and Fidelity disclaims any responsibility to update such views. These views may not be relied on as investment advice and, because investment decisions for a Fidelity fund are based on numerous factors, may not be relied on as an indication of trading intent on behalf of any Fidelity fund.
Insurance Portfolio
Investment Summary (Unaudited)
Top Ten Stocks as of February 28, 2021
| | % of fund's net assets |
| Chubb Ltd. | 10.0 |
| The Travelers Companies, Inc. | 10.0 |
| Marsh & McLennan Companies, Inc. | 8.0 |
| American International Group, Inc. | 6.3 |
| Willis Towers Watson PLC | 5.0 |
| Allstate Corp. | 4.7 |
| MetLife, Inc. | 4.6 |
| Progressive Corp. | 4.2 |
| Arthur J. Gallagher & Co. | 4.1 |
| Aon PLC | 3.4 |
| | 60.3 |
Top Industries (% of fund's net assets)
| As of February 28, 2021 |
| | Insurance | 90.0% |
| | Diversified Financial Services | 4.7% |
| | Capital Markets | 3.1% |
| | Consumer Finance | 0.6% |
| | All Others* | 1.6% |

* Includes short-term investments and net other assets (liabilities).
Insurance Portfolio
Schedule of Investments February 28, 2021
Showing Percentage of Net Assets
| Common Stocks - 98.3% | | | |
| | | Shares | Value |
| Capital Markets - 3.1% | | | |
| Asset Management & Custody Banks - 3.1% | | | |
| Apollo Global Management LLC Class A | | 46,344 | $2,292,174 |
| Ares Management Corp. | | 49,314 | 2,563,342 |
| BlackRock, Inc. Class A | | 1,300 | 902,850 |
| | | | 5,758,366 |
| Consumer Finance - 0.6% | | | |
| Consumer Finance - 0.6% | | | |
| OneMain Holdings, Inc. | | 21,800 | 1,022,638 |
| Diversified Financial Services - 4.7% | | | |
| Multi-Sector Holdings - 2.9% | | | |
| Berkshire Hathaway, Inc. Class B (a) | | 22,200 | 5,339,322 |
| Other Diversified Financial Services - 1.8% | | | |
| Voya Financial, Inc. | | 54,900 | 3,309,372 |
|
| TOTAL DIVERSIFIED FINANCIAL SERVICES | | | 8,648,694 |
|
| Insurance - 89.9% | | | |
| Insurance Brokers - 22.8% | | | |
| Aon PLC | | 27,300 | 6,216,483 |
| Arthur J. Gallagher & Co. | | 62,900 | 7,535,420 |
| Brown & Brown, Inc. | | 92,900 | 4,264,110 |
| Marsh & McLennan Companies, Inc. | | 127,800 | 14,725,116 |
| Willis Towers Watson PLC | | 42,228 | 9,317,186 |
| | | | 42,058,315 |
| Life & Health Insurance - 15.6% | | | |
| AFLAC, Inc. | | 51,600 | 2,471,124 |
| Athene Holding Ltd. (a) | | 36,400 | 1,659,476 |
| CNO Financial Group, Inc. | | 103,800 | 2,497,428 |
| Globe Life, Inc. | | 25,700 | 2,400,380 |
| MetLife, Inc. | | 147,475 | 8,494,560 |
| Primerica, Inc. | | 21,600 | 3,050,568 |
| Principal Financial Group, Inc. | | 60,700 | 3,434,406 |
| Prudential Financial, Inc. | | 48,289 | 4,187,622 |
| Prudential PLC | | 35,800 | 713,146 |
| | | | 28,908,710 |
| Multi-Line Insurance - 10.7% | | | |
| American Financial Group, Inc. | | 200 | 21,340 |
| American International Group, Inc. | | 263,950 | 11,600,603 |
| Assurant, Inc. | | 16,300 | 2,008,486 |
| China Pacific Insurance (Group) Co. Ltd. (H Shares) | | 161,800 | 743,661 |
| Hartford Financial Services Group, Inc. | | 88,300 | 4,475,927 |
| Zurich Insurance Group Ltd. | | 2,116 | 863,774 |
| | | | 19,713,791 |
| Property & Casualty Insurance - 37.2% | | | |
| Allstate Corp. | | 81,800 | 8,719,880 |
| Arch Capital Group Ltd. (a) | | 100,800 | 3,610,656 |
| Assured Guaranty Ltd. | | 62,400 | 2,759,328 |
| Chubb Ltd. | | 113,905 | 18,518,674 |
| Cincinnati Financial Corp. | | 11,200 | 1,096,144 |
| First American Financial Corp. | | 36,500 | 1,917,710 |
| FNF Group | | 36,200 | 1,385,736 |
| Loews Corp. | | 53,700 | 2,567,397 |
| Markel Corp. (a) | | 1,820 | 1,981,616 |
| Mercury General Corp. | | 200 | 11,680 |
| Progressive Corp. | | 89,500 | 7,692,525 |
| The Travelers Companies, Inc. | | 126,900 | 18,463,950 |
| | | | 68,725,296 |
| Reinsurance - 3.6% | | | |
| Everest Re Group Ltd. | | 3,300 | 797,973 |
| Maiden Holdings Ltd. (a) | | 400 | 1,080 |
| Reinsurance Group of America, Inc. | | 48,200 | 5,891,486 |
| | | | 6,690,539 |
|
| TOTAL INSURANCE | | | 166,096,651 |
|
| TOTAL COMMON STOCKS | | | |
| (Cost $94,339,255) | | | 181,526,349 |
|
| Nonconvertible Preferred Stocks - 0.1% | | | |
| Insurance - 0.1% | | | |
| Life & Health Insurance - 0.1% | | | |
| Globe Life, Inc. 6.125% | | | |
| (Cost $73,591) | | 2,959 | 75,159 |
|
| Money Market Funds - 1.5% | | | |
| Fidelity Cash Central Fund 0.07% (b) | | | |
| (Cost $2,833,851) | | 2,833,284 | 2,833,851 |
| TOTAL INVESTMENT IN SECURITIES - 99.9% | | | |
| (Cost $97,246,697) | | | 184,435,359 |
| NET OTHER ASSETS (LIABILITIES) - 0.1% | | | 265,782 |
| NET ASSETS - 100% | | | $184,701,141 |
Legend
(a) Non-income producing
(b) Affiliated fund that is generally available only to investment companies and other accounts managed by Fidelity Investments. The rate quoted is the annualized seven-day yield of the fund at period end. A complete unaudited listing of the fund's holdings as of its most recent quarter end is available upon request. In addition, each Fidelity Central Fund's financial statements, which are not covered by the Fund's Report of Independent Registered Public Accounting Firm, are available on the SEC's website or upon request.
Affiliated Central Funds
Information regarding fiscal year to date income earned by the Fund from investments in Fidelity Central Funds is as follows:
| Fund | Income earned |
| Fidelity Cash Central Fund | $1,152 |
| Fidelity Securities Lending Cash Central Fund | 448 |
| Total | $1,600 |
Amounts in the income column in the above table include any capital gain distributions from underlying funds, which are presented in the corresponding line-item in the Statement of Operations, if applicable. Amount for Fidelity Securities Lending Cash Central Fund represents the income earned on investing cash collateral, less rebates paid to borrowers and any lending agent fees associated with the loan, plus any premium payments received for lending certain types of securities.
Investment Valuation
The following is a summary of the inputs used, as of February 28, 2021, involving the Fund's assets and liabilities carried at fair value. The inputs or methodology used for valuing securities may not be an indication of the risk associated with investing in those securities. For more information on valuation inputs, and their aggregation into the levels used below, please refer to the Investment Valuation section in the accompanying Notes to Financial Statements.
| | Valuation Inputs at Reporting Date: |
| Description | Total | Level 1 | Level 2 | Level 3 |
| Investments in Securities: | | | | |
| Common Stocks | $181,526,349 | $179,949,429 | $1,576,920 | $-- |
| Nonconvertible Preferred Stocks | 75,159 | 75,159 | -- | -- |
| Money Market Funds | 2,833,851 | 2,833,851 | -- | -- |
| Total Investments in Securities: | $184,435,359 | $182,858,439 | $1,576,920 | $-- |
Other Information
Distribution of investments by country or territory of incorporation, as a percentage of Total Net Assets, is as follows (Unaudited):
| United States of America | 75.5% |
| Switzerland | 10.5% |
| United Kingdom | 5.4% |
| Bermuda | 4.8% |
| Ireland | 3.4% |
| Others (Individually Less Than 1%) | 0.4% |
| | 100.0% |
See accompanying notes which are an integral part of the financial statements.
Insurance Portfolio
Financial Statements
Statement of Assets and Liabilities
| | | February 28, 2021 |
| Assets | | |
Investment in securities, at value — See accompanying schedule:
Unaffiliated issuers (cost $94,412,846) | $181,601,508 | |
| Fidelity Central Funds (cost $2,833,851) | 2,833,851 | |
| Total Investment in Securities (cost $97,246,697) | | $184,435,359 |
| Receivable for fund shares sold | | 330,961 |
| Dividends receivable | | 326,320 |
| Distributions receivable from Fidelity Central Funds | | 123 |
| Prepaid expenses | | 1,861 |
| Other receivables | | 578 |
| Total assets | | 185,095,202 |
| Liabilities | | |
| Payable for fund shares redeemed | $245,644 | |
| Accrued management fee | 80,717 | |
| Transfer agent fee payable | 30,345 | |
| Other affiliated payables | 5,959 | |
| Other payables and accrued expenses | 31,396 | |
| Total liabilities | | 394,061 |
| Net Assets | | $184,701,141 |
| Net Assets consist of: | | |
| Paid in capital | | $88,587,176 |
| Total accumulated earnings (loss) | | 96,113,965 |
| Net Assets | | $184,701,141 |
| Net Asset Value, offering price and redemption price per share ($184,701,141 ÷ 3,019,400 shares) | | $61.17 |
See accompanying notes which are an integral part of the financial statements.
Statement of Operations
| | | Year ended February 28, 2021 |
| Investment Income | | |
| Dividends | | $4,376,749 |
| Income from Fidelity Central Funds (including $448 from security lending) | | 1,600 |
| Total income | | 4,378,349 |
| Expenses | | |
| Management fee | $926,443 | |
| Transfer agent fees | 382,641 | |
| Accounting fees | 67,996 | |
| Custodian fees and expenses | 3,774 | |
| Independent trustees' fees and expenses | 1,039 | |
| Registration fees | 22,362 | |
| Audit | 38,277 | |
| Legal | 236 | |
| Miscellaneous | 6,054 | |
| Total expenses before reductions | 1,448,822 | |
| Expense reductions | (3,390) | |
| Total expenses after reductions | | 1,445,432 |
| Net investment income (loss) | | 2,932,917 |
| Realized and Unrealized Gain (Loss) | | |
| Net realized gain (loss) on: | | |
| Investment securities: | | |
| Unaffiliated issuers | 15,505,547 | |
| Fidelity Central Funds | (221) | |
| Foreign currency transactions | 906 | |
| Total net realized gain (loss) | | 15,506,232 |
| Change in net unrealized appreciation (depreciation) on: | | |
| Investment securities: | | |
| Unaffiliated issuers | 2,198,339 | |
| Assets and liabilities in foreign currencies | 2,879 | |
| Total change in net unrealized appreciation (depreciation) | | 2,201,218 |
| Net gain (loss) | | 17,707,450 |
| Net increase (decrease) in net assets resulting from operations | | $20,640,367 |
See accompanying notes which are an integral part of the financial statements.
Statement of Changes in Net Assets
| | Year ended February 28, 2021 | Year ended February 29, 2020 |
| Increase (Decrease) in Net Assets | | |
| Operations | | |
| Net investment income (loss) | $2,932,917 | $3,416,133 |
| Net realized gain (loss) | 15,506,232 | 16,442,918 |
| Change in net unrealized appreciation (depreciation) | 2,201,218 | (7,312,578) |
| Net increase (decrease) in net assets resulting from operations | 20,640,367 | 12,546,473 |
| Distributions to shareholders | (16,870,459) | (16,441,347) |
| Share transactions | | |
| Proceeds from sales of shares | 34,006,375 | 122,036,657 |
| Reinvestment of distributions | 15,964,972 | 15,592,643 |
| Cost of shares redeemed | (88,579,235) | (137,276,331) |
| Net increase (decrease) in net assets resulting from share transactions | (38,607,888) | 352,969 |
| Total increase (decrease) in net assets | (34,837,980) | (3,541,905) |
| Net Assets | | |
| Beginning of period | 219,539,121 | 223,081,026 |
| End of period | $184,701,141 | $219,539,121 |
| Other Information | | |
| Shares | | |
| Sold | 655,154 | 1,926,289 |
| Issued in reinvestment of distributions | 317,057 | 255,136 |
| Redeemed | (1,709,560) | (2,188,784) |
| Net increase (decrease) | (737,349) | (7,359) |
See accompanying notes which are an integral part of the financial statements.
Financial Highlights
Insurance Portfolio
| | | | | | |
| Years ended February 28, | 2021 | 2020 A | 2019 | 2018 | 2017 |
| Selected Per–Share Data | | | | | |
| Net asset value, beginning of period | $58.44 | $59.27 | $78.49 | $80.60 | $63.15 |
| Income from Investment Operations | | | | | |
| Net investment income (loss)B | .88 | .87 | .98 | 1.08 | .99 |
| Net realized and unrealized gain (loss) | 6.99 | 2.77 | (2.40) | 6.76 | 18.64 |
| Total from investment operations | 7.87 | 3.64 | (1.42) | 7.84 | 19.63 |
| Distributions from net investment income | (.94) | (.91) | (1.16) | (.96) | (.89) |
| Distributions from net realized gain | (4.20) | (3.56) | (16.63) | (8.99) | (1.29) |
| Total distributions | (5.14) | (4.47) | (17.80)C | (9.95) | (2.18) |
| Redemption fees added to paid in capitalB | – | – | – | –D | –D |
| Net asset value, end of period | $61.17 | $58.44 | $59.27 | $78.49 | $80.60 |
| Total ReturnE | 15.54% | 5.95% | (.29)% | 9.62% | 31.60% |
| Ratios to Average Net AssetsF,G | | | | | |
| Expenses before reductions | .83% | .81% | .82% | .79% | .80% |
| Expenses net of fee waivers, if any | .83% | .81% | .81% | .79% | .79% |
| Expenses net of all reductions | .83% | .80% | .81% | .79% | .79% |
| Net investment income (loss) | 1.68% | 1.37% | 1.48% | 1.30% | 1.37% |
| Supplemental Data | | | | | |
| Net assets, end of period (000 omitted) | $184,701 | $219,539 | $223,081 | $341,743 | $647,787 |
| Portfolio turnover rateH | 18% | 28% | 9% | 21% | 16% |
A For the year ended February 29.
B Calculated based on average shares outstanding during the period.
C Total distributions per share do not sum due to rounding.
D Amount represents less than $.005 per share.
E Total returns would have been lower if certain expenses had not been reduced during the applicable periods shown.
F Fees and expenses of any underlying mutual funds or exchange-traded funds (ETFs) are not included in the Fund's expense ratio. The Fund indirectly bears its proportionate share of these expenses. For additional expense information related to investments in Fidelity Central Funds, please refer to the "Investments in Fidelity Central Funds" note found in the Notes to Financial Statements section of the most recent Annual or Semi-Annual report.
G Expense ratios reflect operating expenses of the class. Expenses before reductions do not reflect amounts reimbursed, waived, or reduced through arrangements with the investment advisor, brokerage services, or other offset arrangements, if applicable, and do not represent the amount paid by the class during periods when reimbursements, waivers or reductions occur.
H Amount does not include the portfolio activity of any underlying mutual funds or exchange-traded funds (ETFs).
See accompanying notes which are an integral part of the financial statements.
Notes to Financial Statements
For the period ended February 28, 2021
1. Organization.
Banking Portfolio, Brokerage and Investment Management Portfolio, Consumer Finance Portfolio, Financial Services Portfolio, and Insurance Portfolio (the Funds) are non-diversified funds of Fidelity Select Portfolios (the Trust). The Trust is registered under the Investment Company Act of 1940, as amended (the 1940 Act), as an open-end management investment company organized as a Massachusetts business trust. The Funds invest primarily in securities of companies whose principal business activities fall within specific industries. Each Fund is authorized to issue an unlimited number of shares. Share transactions on the Statement of Changes in Net Assets may contain exchanges between affiliated funds.
2. Investments in Fidelity Central Funds.
The Funds invests in Fidelity Central Funds, which are open-end investment companies generally available only to other investment companies and accounts managed by the investment adviser and its affiliates. The Funds' Schedules of Investments list each of the Fidelity Central Funds held as of period end, if any, as an investment of each Fund, but do not include the underlying holdings of each Fidelity Central Fund. As an Investing Fund, each Fund indirectly bears its proportionate share of the expenses of the underlying Fidelity Central Funds.
The Money Market Central Funds seek preservation of capital and current income and are managed by the investment adviser. Annualized expenses of the Money Market Central Funds as of their most recent shareholder report date ranged from less than .005% to .01%.
A complete unaudited list of holdings for each Fidelity Central Fund is available upon request or at the Securities and Exchange Commission (the SEC) website at www.sec.gov. In addition, the financial statements of the Fidelity Central Funds, which are not covered by the Funds' Report of Independent Registered Public Accounting Firm, are available on the SEC website or upon request.
3. Significant Accounting Policies.
Each Fund is an investment company and applies the accounting and reporting guidance of the Financial Accounting Standards Board (FASB) Accounting Standards Codification Topic 946 Financial Services - Investment Companies. The financial statements have been prepared in conformity with accounting principles generally accepted in the United States of America (GAAP), which require management to make certain estimates and assumptions at the date of the financial statements. Actual results could differ from those estimates. Subsequent events, if any, through the date that the financial statements were issued have been evaluated in the preparation of the financial statements. The following summarizes the significant accounting policies of the Funds:
Investment Valuation. Investments are valued as of 4:00 p.m. Eastern time on the last calendar day of the period. The Board of Trustees (the Board) has delegated the day to day responsibility for the valuation of each Fund's investments to the Fair Value Committee (the Committee) established by each Fund's investment adviser. In accordance with valuation policies and procedures approved by the Board, each Fund attempts to obtain prices from one or more third party pricing vendors or brokers to value its investments. When current market prices, quotations or currency exchange rates are not readily available or reliable, investments will be fair valued in good faith by the Committee, in accordance with procedures adopted by the Board. Factors used in determining fair value vary by investment type and may include market or investment specific events. The frequency with which these procedures are used cannot be predicted and they may be utilized to a significant extent. The Committee oversees each Fund's valuation policies and procedures and reports to the Board on the Committee's activities and fair value determinations. The Board monitors the appropriateness of the procedures used in valuing each Fund's investments and ratifies the fair value determinations of the Committee.
Each Fund categorizes the inputs to valuation techniques used to value its investments into a disclosure hierarchy consisting of three levels as shown below:
- Level 1 – quoted prices in active markets for identical investments
- Level 2 – other significant observable inputs (including quoted prices for similar investments, interest rates, prepayment speeds, etc.)
- Level 3 – unobservable inputs (including the Fund's own assumptions based on the best information available)
Valuation techniques used to value each Fund's investments by major category are as follows:
Equity securities, including restricted securities, for which market quotations are readily available, are valued at the last reported sale price or official closing price as reported by a third party pricing vendor on the primary market or exchange on which they are traded and are categorized as Level 1 in the hierarchy. In the event there were no sales during the day or closing prices are not available, securities are valued at the last quoted bid price or may be valued using the last available price and are generally categorized as Level 2 in the hierarchy. For foreign equity securities, when market or security specific events arise, comparisons to the valuation of American Depositary Receipts (ADRs), futures contracts, Exchange-Traded Funds (ETFs) and certain indexes as well as quoted prices for similar securities may be used and would be categorized as Level 2 in the hierarchy. For equity securities, including restricted securities, where observable inputs are limited, assumptions about market activity and risk are used and these securities may be categorized as Level 3 in the hierarchy.
Investments in open-end mutual funds, including the Fidelity Central Funds, are valued at their closing net asset value (NAV) each business day and are categorized as Level 1 in the hierarchy.
Changes in valuation techniques may result in transfers in or out of an assigned level within the disclosure hierarchy. The aggregate value of investments by input level as of February 28, 2021 is included at the end of each Fund's Schedule of Investments.
Foreign Currency. Certain Funds may use foreign currency contracts to facilitate transactions in foreign-denominated securities. Gains and losses from these transactions may arise from changes in the value of the foreign currency or if the counterparties do not perform under the contracts' terms.
Foreign-denominated assets, including investment securities, and liabilities are translated into U.S. dollars at the exchange rates at period end. Purchases and sales of investment securities, income and dividends received, and expenses denominated in foreign currencies are translated into U.S. dollars at the exchange rate in effect on the transaction date.
The effects of exchange rate fluctuations on investments are included with the net realized and unrealized gain (loss) on investment securities. Other foreign currency transactions resulting in realized and unrealized gain (loss) are disclosed separately.
Investment Transactions and Income. For financial reporting purposes, the Funds' investment holdings and NAV include trades executed through the end of the last business day of the period. The NAV per share for processing shareholder transactions is calculated as of the close of business of the New York Stock Exchange (NYSE), normally 4:00 p.m. Eastern time and includes trades executed through the end of the prior business day. Gains and losses on securities sold are determined on the basis of identified cost and for certain Funds include proceeds received from litigation. Dividend income is recorded on the ex-dividend date, except for certain dividends from foreign securities where the ex-dividend date may have passed, which are recorded as soon as the Funds are informed of the ex-dividend date. Non-cash dividends included in dividend income, if any, are recorded at the fair market value of the securities received. Income and capital gain distributions from Fidelity Central Funds, if any, are recorded on the ex-dividend date. Certain distributions received by the Funds represent a return of capital or capital gain. The Funds determine the components of these distributions subsequent to the ex-dividend date, based upon receipt of tax filings or other correspondence relating to the underlying investment. These distributions are recorded as a reduction of cost of investments and/or as a realized gain. Large, non-recurring dividends recognized by the Funds are presented separately on the Statement of Operations as "Special Dividends" and the impact of these dividends is presented in the Financial Highlights. Investment income is recorded net of foreign taxes withheld where recovery of such taxes is uncertain.
Expenses. Expenses directly attributable to a fund are charged to that fund. Expenses attributable to more than one fund are allocated among the respective funds on the basis of relative net assets or other appropriate methods. Expense estimates are accrued in the period to which they relate and adjustments are made when actual amounts are known.
Deferred Trustee Compensation. Under a Deferred Compensation Plan (the Plan) for certain Funds, certain independent Trustees have elected to defer receipt of a portion of their annual compensation. Deferred amounts are invested in affiliated mutual funds, are marked-to-market and remain in a fund until distributed in accordance with the Plan. The investment of deferred amounts and the offsetting payable to the Trustees presented below are included in the accompanying Statement of Assets and Liabilities in other receivables and other payables and accrued expenses, as applicable.
| Brokerage and Investment Management Portfolio | $52,787 |
Income Tax Information and Distributions to Shareholders. Each year, each Fund intends to qualify as a regulated investment company under Subchapter M of the Internal Revenue Code, including distributing substantially all of its taxable income and realized gains. As a result, no provision for U.S. Federal income taxes is required. As of February 28, 2021, each Fund did not have any unrecognized tax benefits in the financial statements; nor is each Fund aware of any tax positions for which it is reasonably possible that the total amounts of unrecognized tax benefits will significantly change in the next twelve months. Each Fund files a U.S. federal tax return, in addition to state and local tax returns as required. Each Fund's federal income tax returns are subject to examination by the Internal Revenue Service (IRS) for a period of three fiscal years after they are filed. State and local tax returns may be subject to examination for an additional fiscal year depending on the jurisdiction. Foreign taxes are provided for based on each Fund's understanding of the tax rules and rates that exist in the foreign markets in which it invests.
Distributions are declared and recorded on the ex-dividend date. Income and capital gain distributions are determined in accordance with income tax regulations, which may differ from GAAP. In addition, the Funds claimed a portion of the payment made to redeeming shareholders as a distribution for income tax purposes.
Capital accounts within the financial statements are adjusted for permanent book-tax differences. These adjustments have no impact on net assets or the results of operations. Capital accounts are not adjusted for temporary book-tax differences which will reverse in a subsequent period.
Book-tax differences are primarily due to foreign currency transactions, equity-debt classifications, partnerships, deferred Trustees compensation, capital loss carryforwards, and losses deferred due to wash sales and excise tax regulations.
As of period end, the cost and unrealized appreciation (depreciation) in securities, and derivatives if applicable, for federal income tax purposes were as follows for each Fund:
| | Tax cost | Gross unrealized appreciation | Gross unrealized depreciation | Net unrealized appreciation (depreciation) |
| Banking Portfolio | $425,943,064 | $124,719,496 | $(10,721,845) | $113,997,651 |
| Brokerage and Investment Management Portfolio | 250,702,729 | 181,763,363 | (3,632,334) | 178,131,029 |
| Consumer Finance Portfolio | 103,067,403 | 51,367,298 | (6,507,040) | 44,860,258 |
| Financial Services Portfolio | 469,732,164 | 146,564,751 | (9,604,167) | 136,960,584 |
| Insurance Portfolio | 97,534,289 | 87,071,484 | (170,414) | 86,901,070 |
The tax-based components of distributable earnings as of period end were as follows for each Fund:
| | Undistributed ordinary income | Undistributed long-term capital gain | Capital loss carryforward | Net unrealized appreciation (depreciation) on securities and other investments |
| Banking Portfolio | $274,885 | $– | $(3,598,632) | $113,997,651 |
| Brokerage and Investment Management Portfolio | – | 4,546,633 | – | 178,133,027 |
| Consumer Finance Portfolio | 116,292 | – | (1,064,601) | 44,860,258 |
| Financial Services Portfolio | 548,934 | – | (1,726,128) | 136,959,570 |
| Insurance Portfolio | 450,516 | 8,760,017 | – | 86,903,455 |
Capital loss carryforwards are only available to offset future capital gains of the Funds to the extent provided by regulations and may be limited. The capital loss carryforward information presented below, including any applicable limitation, is estimated as of fiscal period end and is subject to adjustment.
| | No expiration | | |
| | Short-term | Long-term | Total capital loss carryfoward |
| Banking Portfolio | $(3,598,632) | $– | $(3,598,632) |
| Consumer Finance Portfolio | (1,064,601) | – | (1,064,601) |
| Financial Services Portfolio | (1,726,128) | – | (1,726,128) |
Certain of the Funds intend to elect to defer to the next fiscal year ordinary losses recognized during the period January 1, 2021 to February 28, 2021. Loss deferrals were as follows:
| | Ordinary losses |
| Brokerage and Investment Management Portfolio | $241,015 |
The tax character of distributions paid was as follows:
| February 28, 2021 | | | |
| | Ordinary Income | Long-term Capital Gains | Total |
| Banking Portfolio | $9,662,838 | $20,957,765 | $30,620,603 |
| Brokerage and Investment Management Portfolio | 4,534,924 | 7,377,130 | 11,912,054 |
| Consumer Finance Portfolio | 2,613,470 | – | 2,613,470 |
| Financial Services Portfolio | 10,218,684 | 19,056,071 | 29,274,755 |
| Insurance Portfolio | 2,935,872 | 13,934,587 | 16,870,459 |
| February 29, 2020 | | | |
| | Ordinary Income | Long-term Capital Gains | Total |
| Banking Portfolio | $9,410,001 | $20,683,043 | $30,093,044 |
| Brokerage and Investment Management Portfolio | 5,182,693 | 9,337,074 | 14,519,767 |
| Consumer Finance Portfolio | 2,813,328 | 57,068 | 2,870,396 |
| Financial Services Portfolio | 9,191,497 | 21,195,690 | 30,387,187 |
| Insurance Portfolio | 3,421,425 | 13,019,922 | 16,441,347 |
Restricted Securities (including Private Placements). The Funds may invest in securities that are subject to legal or contractual restrictions on resale. These securities generally may be resold in transactions exempt from registration or to the public if the securities are registered. Disposal of these securities may involve time-consuming negotiations and expense, and prompt sale at an acceptable price may be difficult. Information regarding restricted securities is included at the end of each applicable Fund's Schedule of Investments.
4. Purchases and Sales of Investments.
Purchases and sales of securities, other than short-term securities, are noted in the table below.
| | Purchases ($) | Sales ($) |
| Banking Portfolio | 187,772,666 | 110,698,082 |
| Brokerage and Investment Management Portfolio | 35,652,629 | 38,586,246 |
| Consumer Finance Portfolio | 29,173,324 | 49,279,101 |
| Financial Services Portfolio | 293,582,789 | 278,140,771 |
| Insurance Portfolio | 30,986,184 | 83,084,075 |
5. Fees and Other Transactions with Affiliates.
Management Fee. Fidelity Management & Research Company LLC (the investment adviser) and its affiliates provide the Funds with investment management related services for which the Funds pay a monthly management fee. The management fee is the sum of an individual fund fee rate and an annualized group fee rate. The individual fund fee rate is applied to each Fund's average net assets. The group fee rate is based upon the monthly average net assets of a group of registered investment companies with which the investment adviser has management contracts. The group fee rate decreases as assets under management increase and increases as assets under management decrease. For the reporting period, each Fund's annual management fee rate expressed as a percentage of each Fund's average net assets was as follows:
| | Individual Rate | Group Rate | Total |
| Banking Portfolio | .30% | .23% | .53% |
| Brokerage and Investment Management Portfolio | .30% | .23% | .53% |
| Consumer Finance Portfolio | .30% | .23% | .53% |
| Financial Services Portfolio | .30% | .23% | .53% |
| Insurance Portfolio | .30% | .23% | .53% |
Transfer Agent Fees. Fidelity Investments Institutional Operations Company LLC (FIIOC), an affiliate of the investment adviser, is the Funds' transfer, dividend disbursing and shareholder servicing agent. FIIOC receives account fees and asset-based fees that vary according to account size and type of account. FIIOC pays for typesetting, printing and mailing of shareholder reports, except proxy statements. For the period, transfer agent fees were equivalent to the following annual rates expressed as a percentage of average net assets:
| Banking Portfolio | .19% |
| Brokerage and Investment Management Portfolio | .17% |
| Consumer Finance Portfolio | .25% |
| Financial Services Portfolio | .18% |
| Insurance Portfolio | .22% |
Accounting Fees. Fidelity Service Company, Inc. (FSC), an affiliate of the investment adviser, maintains each Fund's accounting records. The accounting fee is based on the level of average net assets for each month. For the period, the fees were equivalent to the following annual rates:
| | % of Average Net Assets |
| Banking Portfolio | .04 |
| Brokerage and Investment Management Portfolio | .04 |
| Consumer Finance Portfolio | .04 |
| Financial Services Portfolio | .04 |
| Insurance Portfolio | .04 |
Brokerage Commissions. A portion of portfolio transactions were placed with brokerage firms which are affiliates of the investment adviser. Brokerage commissions are included in net realized gain (loss) and change in net unrealized appreciation (depreciation) in the Statement of Operations. The commissions paid to these affiliated firms were as follows:
| | Amount |
| Banking Portfolio | $4,679 |
| Brokerage and Investment Management Portfolio | 502 |
| Consumer Finance Portfolio | 1,460 |
| Financial Services Portfolio | 7,369 |
| Insurance Portfolio | 604 |
Interfund Lending Program. Pursuant to an Exemptive Order issued by the SEC, each Fund, along with other registered investment companies having management contracts with Fidelity Management & Research Company LLC (FMR), or other affiliated entities of FMR, may participate in an interfund lending program. This program provides an alternative credit facility allowing each Fund to borrow from, or lend money to, other participating affiliated funds. At period end, there were no interfund loans outstanding. Activity in this program during the period for which loans were outstanding was as follows:
| | Borrower or Lender | Average Loan Balance | Weighted Average Interest Rate | Interest Expense |
| Financial Services Portfolio | Borrower | $6,811,000 | .34% | $64 |
Interfund Trades. Funds may purchase from or sell securities to other Fidelity Funds under procedures adopted by the Board. The procedures have been designed to ensure these interfund trades are executed in accordance with Rule 17a-7 of the 1940 Act. Any interfund trades are included within the respective purchases and sales amounts shown in the Purchases and Sales of Investments note and are noted in the table below.
| | Purchases ($) | Sales ($) |
| Banking Portfolio | 10,721,101 | 3,969,936 |
| Brokerage and Investment Management Portfolio | 3,299,469 | 1,808,168 |
| Consumer Finance Portfolio | 832,489 | 1,998,856 |
| Financial Services Portfolio | 14,774,058 | 21,440,301 |
| Insurance Portfolio | 525,390 | 5,452,371 |
Prior Fiscal Year Affiliated Redemptions In-Kind. During the prior period, 2,278,421 shares of the Financial Services Portfolio were redeemed in-kind for investments and cash with a value of $22,465,229. The Fund had a net realized gain of $4,465,779 on investments delivered through in-kind redemptions. The amount of the in-kind redemptions is included in share transactions in the accompanying Statement of Changes in Net Assets. Financial Services Portfolio recognized no gain or loss for federal income tax purposes.
Other. During the period, the investment adviser reimbursed the Funds for certain losses as follows:
| | Amount |
| Financial Services Portfolio | $8,764 |
6. Committed Line of Credit.
Certain Funds participate with other funds managed by the investment adviser or an affiliate in a $4.25 billion credit facility (the "line of credit") to be utilized for temporary or emergency purposes to fund shareholder redemptions or for other short-term liquidity purposes. The participating funds have agreed to pay commitment fees on their pro-rata portion of the line of credit, which are reflected in Miscellaneous expenses on the Statement of Operations, and are listed below.
| | Amount |
| Banking Portfolio | $763 |
| Brokerage and Investment Management Portfolio | 737 |
| Consumer Finance Portfolio | 277 |
| Financial Services Portfolio | 1,001 |
| Insurance Portfolio | 430 |
During the period, there were no borrowings on this line of credit.
7. Security Lending.
Funds lend portfolio securities from time to time in order to earn additional income. Lending agents are used, including National Financial Services (NFS), an affiliate of the investment adviser. Pursuant to a securities lending agreement, NFS will receive a fee, which is capped at 9.9% of a fund's daily lending revenue, for its services as lending agent. A fund may lend securities to certain qualified borrowers, including NFS. On the settlement date of the loan, a fund receives collateral (in the form of U.S. Treasury obligations, letters of credit and/or cash) against the loaned securities and maintains collateral in an amount not less than 100% of the market value of the loaned securities during the period of the loan. The market value of the loaned securities is determined at the close of business of a fund and any additional required collateral is delivered to a fund on the next business day. A fund or borrower may terminate the loan at any time, and if the borrower defaults on its obligation to return the securities loaned because of insolvency or other reasons, a fund may apply collateral received from the borrower against the obligation. A fund may experience delays and costs in recovering the securities loaned. Any cash collateral received is invested in the Fidelity Securities Lending Cash Central Fund. Any loaned securities are identified as such in the Schedule of Investments, and the value of loaned securities and cash collateral at period end, as applicable, are presented in the Statement of Assets and Liabilities. Security lending income represents the income earned on investing cash collateral, less rebates paid to borrowers and any lending agent fees associated with the loan, plus any premium payments received for lending certain types of securities. Security lending income is presented in the Statement of Operations as a component of income from Fidelity Central Funds. Affiliated security lending activity, if any, was as follows:
| | Total Security Lending Income Fees Paid to NFS | Security Lending Income From Securities Loaned to NFS | Value of Securities Loaned to NFS at Period End |
| Banking Portfolio | $345 | $– | $– |
| Brokerage and Investment Management Portfolio | 173 | – | – |
| Consumer Finance Portfolio | 1,119 | – | – |
| Financial Services Portfolio | 186 | 1 | – |
| Insurance Portfolio | 46 | – | – |
8. Expense Reductions.
Commissions paid to certain brokers with whom the investment adviser, or its affiliates, places trades on behalf of certain Funds include an amount in addition to trade execution, which may be rebated back to the Funds to offset expenses. In addition, through arrangements with each applicable Fund's custodian and transfer agent, credits realized as a result of certain uninvested cash balances were used to reduce each applicable Fund's expenses. All of the applicable expense reductions are noted in the table below.
| | Brokerage service rebates |
| Banking Portfolio | $17,014 |
| Brokerage and Investment Management Portfolio | 1,189 |
| Consumer Finance Portfolio | 6,604 |
| Financial Services Portfolio | 32,731 |
| Insurance Portfolio | 2,614 |
In addition, during the period the investment adviser or an affiliate reimbursed and/or waived a portion of operating expenses as follows:
| | Amount |
| Banking Portfolio | $1,631 |
| Brokerage and Investment Management Portfolio | 1,265 |
| Consumer Finance Portfolio | 523 |
| Financial Services Portfolio | 1,878 |
| Insurance Portfolio | 776 |
9. Other.
The Funds' organizational documents provide former and current trustees and officers with a limited indemnification against liabilities arising in connection with the performance of their duties to the Funds. In the normal course of business, the Funds may also enter into contracts that provide general indemnifications. The Funds' maximum exposure under these arrangements is unknown as this would be dependent on future claims that may be made against the Funds. The risk of material loss from such claims is considered remote.
10. Coronavirus (COVID-19) Pandemic.
An outbreak of COVID-19 first detected in China during December 2019 has since spread globally and was declared a pandemic by the World Health Organization during March 2020. Developments that disrupt global economies and financial markets, such as the COVID-19 pandemic, may magnify factors that affect the Funds' performance.
Report of Independent Registered Public Accounting Firm
To the Board of Trustees of Fidelity Select Portfolios and the Shareholders of Banking Portfolio, Brokerage and Investment Management Portfolio, Consumer Finance Portfolio, Financial Services Portfolio and Insurance Portfolio
Opinions on the Financial Statements
We have audited the accompanying statements of assets and liabilities, including the schedules of investments, of Banking Portfolio, Brokerage and Investment Management Portfolio, Consumer Finance Portfolio, Financial Services Portfolio, and Insurance Portfolio (five of the funds constituting Fidelity Select Portfolios, hereafter collectively referred to as the “Funds”) as of February 28, 2021, the related statements of operations for the year ended February 28, 2021, the statements of changes in net assets for each of the two years in the period ended February 28, 2021, including the related notes, and the financial highlights for each of the five years in the period ended February 28, 2021 (collectively referred to as the “financial statements”). In our opinion, the financial statements present fairly, in all material respects, the financial position of each of the Funds as of February 28, 2021, the results of each of their operations for the year then ended, the changes in each of their net assets for each of the two years in the period ended February 28, 2021 and each of the financial highlights for each of the five years in the period ended February 28, 2021 in conformity with accounting principles generally accepted in the United States of America.
Basis for Opinions
These financial statements are the responsibility of the Funds’ management. Our responsibility is to express an opinion on the Funds’ financial statements based on our audits. We are a public accounting firm registered with the Public Company Accounting Oversight Board (United States) (PCAOB) and are required to be independent with respect to the Funds in accordance with the U.S. federal securities laws and the applicable rules and regulations of the Securities and Exchange Commission and the PCAOB.
We conducted our audits of these financial statements in accordance with the standards of the PCAOB. Those standards require that we plan and perform the audit to obtain reasonable assurance about whether the financial statements are free of material misstatement, whether due to error or fraud.
Our audits included performing procedures to assess the risks of material misstatement of the financial statements, whether due to error or fraud, and performing procedures that respond to those risks. Such procedures included examining, on a test basis, evidence regarding the amounts and disclosures in the financial statements. Our audits also included evaluating the accounting principles used and significant estimates made by management, as well as evaluating the overall presentation of the financial statements. Our procedures included confirmation of securities owned as of February 28, 2021 by correspondence with the custodian and brokers; when replies were not received from brokers, we performed other auditing procedures. We believe that our audits provide a reasonable basis for our opinions.
/s/ PricewaterhouseCoopers LLP
Boston, Massachusetts
April 12, 2021
We have served as the auditor of one or more investment companies in the Fidelity group of funds since 1932.
Trustees and Officers
The Trustees, Members of the Advisory Board (if any), and officers of the trust and funds, as applicable, are listed below. The Board of Trustees governs each fund and is responsible for protecting the interests of shareholders. The Trustees are experienced executives who meet periodically throughout the year to oversee each fund's activities, review contractual arrangements with companies that provide services to each fund, oversee management of the risks associated with such activities and contractual arrangements, and review each fund's performance. Each of the Trustees oversees 309 funds.
The Trustees hold office without limit in time except that (a) any Trustee may resign; (b) any Trustee may be removed by written instrument, signed by at least two-thirds of the number of Trustees prior to such removal; (c) any Trustee who requests to be retired or who has become incapacitated by illness or injury may be retired by written instrument signed by a majority of the other Trustees; and (d) any Trustee may be removed at any special meeting of shareholders by a two-thirds vote of the outstanding voting securities of the trust. Each Trustee who is not an interested person (as defined in the 1940 Act) of the trust and the funds is referred to herein as an Independent Trustee. Each Independent Trustee shall retire not later than the last day of the calendar year in which his or her 75th birthday occurs. The Independent Trustees may waive this mandatory retirement age policy with respect to individual Trustees. Officers and Advisory Board Members hold office without limit in time, except that any officer or Advisory Board Member may resign or may be removed by a vote of a majority of the Trustees at any regular meeting or any special meeting of the Trustees. Except as indicated, each individual has held the office shown or other offices in the same company for the past five years.
Each fund’s Statement of Additional Information (SAI) includes more information about the Trustees. To request a free copy, call Fidelity at 1-800-544-8544.
Experience, Skills, Attributes, and Qualifications of the Trustees. The Governance and Nominating Committee has adopted a statement of policy that describes the experience, qualifications, attributes, and skills that are necessary and desirable for potential Independent Trustee candidates (Statement of Policy). The Board believes that each Trustee satisfied at the time he or she was initially elected or appointed a Trustee, and continues to satisfy, the standards contemplated by the Statement of Policy. The Governance and Nominating Committee also engages professional search firms to help identify potential Independent Trustee candidates who have the experience, qualifications, attributes, and skills consistent with the Statement of Policy. From time to time, additional criteria based on the composition and skills of the current Independent Trustees, as well as experience or skills that may be appropriate in light of future changes to board composition, business conditions, and regulatory or other developments, have also been considered by the professional search firms and the Governance and Nominating Committee. In addition, the Board takes into account the Trustees' commitment and participation in Board and committee meetings, as well as their leadership of standing and ad hoc committees throughout their tenure.
In determining that a particular Trustee was and continues to be qualified to serve as a Trustee, the Board has considered a variety of criteria, none of which, in isolation, was controlling. The Board believes that, collectively, the Trustees have balanced and diverse experience, qualifications, attributes, and skills, which allow the Board to operate effectively in governing each fund and protecting the interests of shareholders. Information about the specific experience, skills, attributes, and qualifications of each Trustee, which in each case led to the Board's conclusion that the Trustee should serve (or continue to serve) as a trustee of the funds, is provided below.
Board Structure and Oversight Function. Robert A. Lawrence is an interested person and currently serves as Acting Chairman. The Trustees have determined that an interested Chairman is appropriate and benefits shareholders because an interested Chairman has a personal and professional stake in the quality and continuity of services provided to the funds. Independent Trustees exercise their informed business judgment to appoint an individual of their choosing to serve as Chairman, regardless of whether the Trustee happens to be independent or a member of management. The Independent Trustees have determined that they can act independently and effectively without having an Independent Trustee serve as Chairman and that a key structural component for assuring that they are in a position to do so is for the Independent Trustees to constitute a substantial majority for the Board. The Independent Trustees also regularly meet in executive session. David M. Thomas serves as Lead Independent Trustee and as such (i) acts as a liaison between the Independent Trustees and management with respect to matters important to the Independent Trustees and (ii) with management prepares agendas for Board meetings.
Fidelity® funds are overseen by different Boards of Trustees. The funds' Board oversees Fidelity's high income and certain equity funds, and other Boards oversee Fidelity's investment-grade bond, money market, asset allocation, and other equity funds. The asset allocation funds may invest in Fidelity® funds overseen by the funds' Board. The use of separate Boards, each with its own committee structure, allows the Trustees of each group of Fidelity® funds to focus on the unique issues of the funds they oversee, including common research, investment, and operational issues. On occasion, the separate Boards establish joint committees to address issues of overlapping consequences for the Fidelity® funds overseen by each Board.
The Trustees operate using a system of committees to facilitate the timely and efficient consideration of all matters of importance to the Trustees, each fund, and fund shareholders and to facilitate compliance with legal and regulatory requirements and oversight of the funds' activities and associated risks. The Board, acting through its committees, has charged FMR and its affiliates with (i) identifying events or circumstances the occurrence of which could have demonstrably adverse effects on the funds' business and/or reputation; (ii) implementing processes and controls to lessen the possibility that such events or circumstances occur or to mitigate the effects of such events or circumstances if they do occur; and (iii) creating and maintaining a system designed to evaluate continuously business and market conditions in order to facilitate the identification and implementation processes described in (i) and (ii) above. Because the day-to-day operations and activities of the funds are carried out by or through FMR, its affiliates, and other service providers, the funds' exposure to risks is mitigated but not eliminated by the processes overseen by the Trustees. While each of the Board's committees has responsibility for overseeing different aspects of the funds' activities, oversight is exercised primarily through the Operations, Audit, and Compliance Committees. Appropriate personnel, including but not limited to the funds' Chief Compliance Officer (CCO), FMR's internal auditor, the independent accountants, the funds' Treasurer and portfolio management personnel, make periodic reports to the Board's committees, as appropriate, including an annual review of Fidelity's risk management program for the Fidelity® funds. The responsibilities of each standing committee, including their oversight responsibilities, are described further under "Standing Committees of the Trustees."
Interested Trustees*:
Correspondence intended for a Trustee who is an interested person may be sent to Fidelity Investments, 245 Summer Street, Boston, Massachusetts 02210.
Name, Year of Birth; Principal Occupations and Other Relevant Experience+
Bettina Doulton (1964)
Year of Election or Appointment: 2020
Trustee
Ms. Doulton also serves as Trustee of other Fidelity® funds. Prior to her retirement, Ms. Doulton served in a variety of positions at Fidelity Investments, including as a managing director of research (2006-2007), portfolio manager to certain Fidelity® funds (1993-2005), equity analyst and portfolio assistant (1990-1993), and research assistant (1987-1990). Ms. Doulton currently owns and operates Phi Builders + Architects and Cellardoor Winery. Previously, Ms. Doulton served as a member of the Board of Brown Capital Management, LLC (2013-2018).
Robert A. Lawrence (1952)
Year of Election or Appointment: 2020
Trustee
Acting Chairman of the Board of Trustees
Mr. Lawrence also serves as Trustee of other funds. Previously, Mr. Lawrence served as a Member of the Advisory Board of certain funds. Prior to his retirement in 2008, Mr. Lawrence served as Vice President of certain Fidelity® funds (2006-2008), Senior Vice President, Head of High Income Division of Fidelity Management & Research Company (investment adviser firm, 2006-2008), and President of Fidelity Strategic Investments (investment adviser firm, 2002-2005).
* Determined to be an “Interested Trustee” by virtue of, among other things, his or her affiliation with the trust or various entities under common control with FMR.
+ The information includes the Trustee's principal occupation during the last five years and other information relating to the experience, attributes, and skills relevant to the Trustee's qualifications to serve as a Trustee, which led to the conclusion that the Trustee should serve as a Trustee for each fund.
Independent Trustees:
Correspondence intended for an Independent Trustee may be sent to Fidelity Investments, P.O. Box 55235, Boston, Massachusetts 02205-5235.
Name, Year of Birth; Principal Occupations and Other Relevant Experience+
Dennis J. Dirks (1948)
Year of Election or Appointment: 2018
Trustee
Mr. Dirks also serves as Trustee of other Fidelity® funds. Prior to his retirement in May 2003, Mr. Dirks served as Chief Operating Officer and as a member of the Board of The Depository Trust & Clearing Corporation (financial markets infrastructure), President, Chief Operating Officer and a member of the Board of The Depository Trust Company (DTC), President and a member of the Board of the National Securities Clearing Corporation (NSCC), Chief Executive Officer and a member of the Board of the Government Securities Clearing Corporation and Chief Executive Officer and a member of the Board of the Mortgage-Backed Securities Clearing Corporation. Mr. Dirks currently serves as a member of the Finance Committee (2016-present) and Board (2017-present) and is Treasurer (2018-present) of the Asolo Repertory Theatre.
Donald F. Donahue (1950)
Year of Election or Appointment: 2018
Trustee
Mr. Donahue also serves as Trustee of other Fidelity® funds. Mr. Donahue serves as President and Chief Executive Officer of Miranda Partners, LLC (risk consulting for the financial services industry, 2012-present). Previously, Mr. Donahue served as Chief Executive Officer (2006-2012), Chief Operating Officer (2003-2006) and Managing Director, Customer Marketing and Development (1999-2003) of The Depository Trust & Clearing Corporation (financial markets infrastructure). Mr. Donahue currently serves as a member (2007-present) and Co-Chairman (2016-present) of the Board of United Way of New York, a member of the Board of NYC Leadership Academy (2012-present) and a member of the Board of Advisors of Ripple Labs, Inc. (financial services, 2015-present). Mr. Donahue previously served as a member of the Advisory Board of certain Fidelity® funds (2015-2018).
Vicki L. Fuller (1957)
Year of Election or Appointment: 2020
Trustee
Ms. Fuller also serves as Trustee of other Fidelity® funds. Previously, Ms. Fuller served as a member of the Advisory Board of certain Fidelity® funds (2018-2020), Chief Investment Officer of the New York State Common Retirement Fund (2012-2018) and held a variety of positions at AllianceBernstein L.P. (global asset management, 1985-2012), including Managing Director (2006-2012) and Senior Vice President and Senior Portfolio Manager (2001-2006). Ms. Fuller currently serves as a member of the Board, Audit Committee and Nominating and Governance Committee of The Williams Companies, Inc. (natural gas infrastructure, 2018-present), as a member of the Board, Audit Committee and Nominating and Governance Committee of two Blackstone business development companies (2020-present) and as a member of the Board of Treliant, LLC (consulting, 2019-present).
Patricia L. Kampling (1959)
Year of Election or Appointment: 2020
Trustee
Ms. Kampling also serves as Trustee of other Fidelity® funds. Prior to her retirement, Ms. Kampling served as Chairman of the Board and Chief Executive Officer (2012-2019), President and Chief Operating Officer (2011-2012) and Executive Vice President and Chief Financial Officer (2010-2011) of Alliant Energy Corporation. Ms. Kampling currently serves as a member of the Board, Compensation Committee and Executive Committee and as Chair of the Audit Committee of Briggs & Stratton Corporation (manufacturing, 2011-present) and as a member of the Board, Audit, Finance and Risk Committee and Safety, Environmental, Technology and Operations Committee of American Water Works Company, Inc. (utilities company, 2019-present). In addition, Ms. Kampling currently serves as a member of the Board of the Nature Conservancy, Wisconsin Chapter (2019-present). Previously, Ms. Kampling served as a Member of the Advisory Board of certain Fidelity® funds (2020), a member of the Board of Interstate Power and Light Company (2012-2019) and Wisconsin Power and Light Company (2012-2019) (each a subsidiary of Alliant Energy Corporation) and as a member of the Board and Workforce Development Committee of the Business Roundtable (2018-2019).
Thomas A. Kennedy (1955)
Year of Election or Appointment: 2021
Trustee
Mr. Kennedy also serves as Trustee of other Fidelity® funds. Previously, Mr. Kennedy served as a Member of the Advisory Board of certain Fidelity® funds (2020) and held a variety of positions at Raytheon Company (aerospace and defense, 1983-2020), including Chairman and Chief Executive Officer (2014-2020) and Executive Vice President and Chief Operating Officer (2013-2014). Mr. Kennedy currently serves as Executive Chairman of the Board of Directors of Raytheon Technologies Corporation (aerospace and defense, 2020-present). He is also a member of the Rutgers School of Engineering Industry Advisory Board (2011-present) and a member of the UCLA Engineering Dean’s Executive Board (2016-present).
Garnett A. Smith (1947)
Year of Election or Appointment: 2013
Trustee
Mr. Smith also serves as Trustee of other Fidelity® funds. Prior to his retirement, Mr. Smith served as Chairman and Chief Executive Officer (1990-1997) and President (1986-1990) of Inbrand Corp. (manufacturer of personal absorbent products). Prior to his employment with Inbrand Corp., he was employed by a retail fabric chain and North Carolina National Bank (now Bank of America). Mr. Smith previously served as a member of the Advisory Board of certain Fidelity® funds (2012-2013).
David M. Thomas (1949)
Year of Election or Appointment: 2018
Trustee
Lead Independent Trustee
Mr. Thomas also serves as Trustee of other Fidelity® funds. Previously, Mr. Thomas served as Executive Chairman (2005-2006) and Chairman and Chief Executive Officer (2000-2005) of IMS Health, Inc. (pharmaceutical and healthcare information solutions). Mr. Thomas currently serves as Non-Executive Chairman of the Board of Fortune Brands Home and Security (home and security products, 2011-present), and a member of the Board (2004-present) and Presiding Director (2013-present) of Interpublic Group of Companies, Inc. (marketing communication).
Susan Tomasky (1953)
Year of Election or Appointment: 2020
Trustee
Ms. Tomasky also serves as Trustee of other Fidelity® funds. Prior to her retirement, Ms. Tomasky served in various executive officer positions at American Electric Power Company, Inc. (1998-2011), including most recently as President of AEP Transmission (2007-2011). Ms. Tomasky currently serves as a member of the Board and Sustainability Committee and as Chair of the Audit Committee of Marathon Petroleum Corporation (2018-present) and as a member of the Board, Corporate Governance Committee and Organization and Compensation Committee and as Chair of the Audit Committee of Public Service Enterprise Group, Inc. (utilities company, 2012-present). In addition, Ms. Tomasky currently serves as a member of the Board of the Columbus Regional Airport Authority (2007-present), as a member of the Board of the Royal Shakespeare Company – America (2009-present), as a member of the Board of the Columbus Association for the Performing Arts (2011-present) and as a member of the Board of Kenyon College (2016-present). Previously, Ms. Tomasky served as a Member of the Advisory Board of certain Fidelity® funds (2020), a member of the Board (2011-2019) and as Lead Independent Director (2015-2018) of Andeavor Corporation (previously Tesoro Corporation) (independent oil refiner and marketer) and as a member of the Board of Summit Midstream Partners LP (energy, 2012-2018).
Michael E. Wiley (1950)
Year of Election or Appointment: 2008
Trustee
Mr. Wiley also serves as Trustee of other Fidelity® funds. Previously, Mr. Wiley served as a member of the Advisory Board of certain Fidelity® funds (2018-2020), Chairman, President and CEO of Baker Hughes, Inc. (oilfield services, 2000-2004). Mr. Wiley also previously served as a member of the Board of Andeavor Corporation (independent oil refiner and marketer, 2005-2018), a member of the Board of Andeavor Logistics LP (natural resources logistics, 2015-2018) and a member of the Board of High Point Resources (exploration and production, 2005-2020).
+ The information includes the Trustee's principal occupation during the last five years and other information relating to the experience, attributes, and skills relevant to the Trustee's qualifications to serve as a Trustee, which led to the conclusion that the Trustee should serve as a Trustee for each fund.
Advisory Board Members and Officers:
Correspondence intended for a Member of the Advisory Board (if any) may be sent to Fidelity Investments, P.O. Box 55235, Boston, Massachusetts 02205-5235. Correspondence intended for an officer or Peter S. Lynch may be sent to Fidelity Investments, 245 Summer Street, Boston, Massachusetts 02210. Officers appear below in alphabetical order.
Name, Year of Birth; Principal Occupation
Ned C. Lautenbach (1944)
Year of Election or Appointment: 2021
Member of the Advisory Board
Mr. Lautenbach also serves as a Member of the Advisory Board of other Fidelity® funds. Mr. Lautenbach currently serves as Chair of the Board of Governors, State University System of Florida (2013-present) and is a member of the Council on Foreign Relations (1994-present). He is also a member and has in the past served as Chairman of the Board of Directors of Artis-Naples (2012-present). Previously, Mr. Lautenbach served as a Trustee of certain Fidelity® funds (2000-2020) and a member and then Lead Director of the Board of Directors of Eaton Corporation (diversified industrial, 1997-2016). He was also a Partner at Clayton, Dubilier & Rice, LLC (private equity investment, 1998-2010); as well as Director of Sony Corporation (2006-2007). In addition, Mr. Lautenbach had a 30-year career with IBM (technology company), during which time he served as Senior Vice President and as a member of the Corporate Executive Committee (1968-1998).
Peter S. Lynch (1944)
Year of Election or Appointment: 2018
Member of the Advisory Board
Mr. Lynch also serves as a Member of the Advisory Board of other Fidelity® funds. Mr. Lynch is Vice Chairman and a Director of Fidelity Management & Research Company LLC (investment adviser firm). In addition, Mr. Lynch serves as a Trustee of Boston College and as the Chairman of the Inner-City Scholarship Fund. Previously, Mr. Lynch served as Vice Chairman and a Director of FMR Co., Inc. (investment adviser firm) and on the Special Olympics International Board of Directors (1997-2006).
Craig S. Brown (1977)
Year of Election or Appointment: 2019
Assistant Treasurer
Mr. Brown also serves as Assistant Treasurer of other funds. Mr. Brown is an employee of Fidelity Investments (2013-present).
John J. Burke III (1964)
Year of Election or Appointment: 2018
Chief Financial Officer
Mr. Burke also serves as Chief Financial Officer of other funds. Mr. Burke serves as Head of Investment Operations for Fidelity Fund and Investment Operations (2018-present) and is an employee of Fidelity Investments (1998-present). Previously Mr. Burke served as head of Asset Management Investment Operations (2012-2018).
William C. Coffey (1969)
Year of Election or Appointment: 2019
Assistant Secretary
Mr. Coffey also serves as Assistant Secretary of other funds. He is Senior Vice President and Deputy General Counsel of FMR LLC (diversified financial services company, 2010-present), and is an employee of Fidelity Investments. Previously, Mr. Coffey served as Secretary and CLO of certain funds (2018-2019); CLO, Secretary, and Senior Vice President of Fidelity Management & Research Company and FMR Co., Inc. (investment adviser firms, 2018-2019); Secretary of Fidelity SelectCo, LLC and Fidelity Investments Money Management, Inc. (investment adviser firms, 2018-2019); CLO of Fidelity Management & Research (Hong Kong) Limited, FMR Investment Management (UK) Limited, and Fidelity Management & Research (Japan) Limited (investment adviser firms, 2018-2019); and Assistant Secretary of certain funds (2009-2018).
Timothy M. Cohen (1969)
Year of Election or Appointment: 2018
Vice President
Mr. Cohen also serves as Vice President of other funds. Mr. Cohen serves as Co-Head of Equity (2018-present), a Director of Fidelity Management & Research (Japan) Limited (investment adviser firm, 2016-present), and is an employee of Fidelity Investments. Previously, Mr. Cohen served as Executive Vice President of Fidelity SelectCo, LLC (2019), Head of Global Equity Research (2016-2018), Chief Investment Officer - Equity and a Director of Fidelity Management & Research (U.K.) Inc. (investment adviser firm, 2013-2015) and as a Director of Fidelity Management & Research (Hong Kong) Limited (investment adviser firm, 2017).
Jonathan Davis (1968)
Year of Election or Appointment: 2010
Assistant Treasurer
Mr. Davis also serves as Assistant Treasurer of other funds. Mr. Davis serves as Assistant Treasurer of FMR Capital, Inc. (2017-present) and is an employee of Fidelity Investments. Previously, Mr. Davis served as Vice President and Associate General Counsel of FMR LLC (diversified financial services company, 2003-2010).
Laura M. Del Prato (1964)
Year of Election or Appointment: 2018
Assistant Treasurer
Ms. Del Prato also serves as an officer of other funds. Ms. Del Prato is an employee of Fidelity Investments (2017-present). Previously, Ms. Del Prato served as President and Treasurer of The North Carolina Capital Management Trust: Cash Portfolio and Term Portfolio (2018-2020). Prior to joining Fidelity Investments, Ms. Del Prato served as a Managing Director and Treasurer of the JPMorgan Mutual Funds (2014-2017). Prior to JPMorgan, Ms. Del Prato served as a partner at Cohen Fund Audit Services (accounting firm, 2012-2013) and KPMG LLP (accounting firm, 2004-2012).
Colm A. Hogan (1973)
Year of Election or Appointment: 2020
Assistant Treasurer
Mr. Hogan also serves as an officer of other funds. Mr. Hogan serves as Assistant Treasurer of FMR Capital, Inc. (2017-present) and is an employee of Fidelity Investments (2005-present). Previously, Mr. Hogan served as Deputy Treasurer of certain Fidelity® funds (2016-2020) and Assistant Treasurer of certain Fidelity® funds (2016-2018).
Pamela R. Holding (1964)
Year of Election or Appointment: 2018
Vice President
Ms. Holding also serves as Vice President of other funds. Ms. Holding serves as Co-Head of Equity (2018-present) and is an employee of Fidelity Investments (2013-present). Previously, Ms. Holding served as Executive Vice President of Fidelity SelectCo, LLC (2019) and as Chief Investment Officer of Fidelity Institutional Asset Management (2013-2018).
Cynthia Lo Bessette (1969)
Year of Election or Appointment: 2019
Secretary and Chief Legal Officer (CLO)
Ms. Lo Bessette also serves as an officer of other funds. Ms. Lo Bessette serves as CLO, Secretary, and Senior Vice President of Fidelity Management & Research Company LLC (investment adviser firm, 2019-present); and CLO of Fidelity Management & Research (Hong Kong) Limited, FMR Investment Management (UK) Limited, and Fidelity Management & Research (Japan) Limited (investment adviser firms, 2019-present). She is a Senior Vice President and Deputy General Counsel of FMR LLC (diversified financial services company, 2019-present), and is an employee of Fidelity Investments. Previously, Ms. Lo Bessette served as CLO, Secretary, and Senior Vice President of FMR Co., Inc. (investment adviser firm, 2019); Secretary of Fidelity SelectCo, LLC and Fidelity Investments Money Management, Inc. (investment adviser firms, 2019). Prior to joining Fidelity Investments, Ms. Lo Bessette was Executive Vice President, General Counsel (2016-2019) and Senior Vice President, Deputy General Counsel (2015-2016) of OppenheimerFunds (investment management company) and Deputy Chief Legal Officer (2013-2015) of Jennison Associates LLC (investment adviser firm).
Chris Maher (1972)
Year of Election or Appointment: 2020
Deputy Treasurer
Mr. Maher also serves as an officer of other funds. Mr. Maher serves as Assistant Treasurer of FMR Capital, Inc. (2017-present), and is an employee of Fidelity Investments (2008-present). Previously, Mr. Maher served as Assistant Treasurer of certain funds (2013-2020); Vice President of Asset Management Compliance (2013), Vice President of the Program Management Group of FMR (investment adviser firm, 2010-2013), and Vice President of Valuation Oversight (2008-2010).
Jason P. Pogorelec (1975)
Year of Election or Appointment: 2020
Chief Compliance Officer
Mr. Pogorelec also serves as Chief Compliance Officer of other funds. Mr. Pogorelec is a senior Vice President of Asset Management Compliance for Fidelity Investments and is an employee of Fidelity Investments (2006-present). Previously, Mr. Pogorelec served as Vice President, Associate General Counsel for Fidelity Investments (2010-2020) and Assistant Secretary of certain Fidelity funds (2015-2020).
Brett Segaloff (1972)
Year of Election or Appointment: 2021
Anti-Money Laundering (AML) Officer
Mr. Segaloff also serves as an AML Officer of other funds and other related entities. He is Director, Anti-Money Laundering (2007-present) of FMR LLC (diversified financial services company) and is an employee of Fidelity Investments (1996-present).
Stacie M. Smith (1974)
Year of Election or Appointment: 2018
President and Treasurer
Ms. Smith also serves as an officer of other funds. Ms. Smith serves as Assistant Treasurer of FMR Capital, Inc. (2017-present), is an employee of Fidelity Investments (2009-present), and has served in other fund officer roles. Prior to joining Fidelity Investments, Ms. Smith served as Senior Audit Manager of Ernst & Young LLP (accounting firm, 1996-2009). Previously, Ms. Smith served as Assistant Treasurer (2013-2019) and Deputy Treasurer (2013-2016) of certain Fidelity® funds.
Marc L. Spector (1972)
Year of Election or Appointment: 2017
Assistant Treasurer
Mr. Spector also serves as an officer of other funds. Mr. Spector serves as Assistant Treasurer of FMR Capital, Inc. (2017-present) and is an employee of Fidelity Investments (2016-present). Prior to joining Fidelity Investments, Mr. Spector served as Director at the Siegfried Group (accounting firm, 2013-2016), and prior to Siegfried Group as audit senior manager at Deloitte & Touche LLP (accounting firm, 2005-2013).
Jim Wegmann (1979)
Year of Election or Appointment: 2019
Assistant Treasurer
Mr. Wegmann also serves as Assistant Treasurer of other funds. Mr. Wegmann is an employee of Fidelity Investments (2011-present).
Shareholder Expense Example
As a shareholder, you incur two types of costs: (1) transaction costs, which may include sales charges (loads) on purchase payments or redemption proceeds, as applicable and (2) ongoing costs, which generally include management fees, distribution and/or service (12b-1) fees and other Fund expenses. This Example is intended to help you understand your ongoing costs (in dollars) of investing in a fund and to compare these costs with the ongoing costs of investing in other mutual funds.
The Example is based on an investment of $1,000 invested at the beginning of the period and held for the entire period (September 1, 2020 to February 28, 2021).
Actual Expenses
The first line of the accompanying table provides information about actual account values and actual expenses. You may use the information in this line, together with the amount you invested, to estimate the expenses that you paid over the period. Simply divide your account value by $1,000.00 (for example, an $8,600 account value divided by $1,000.00 = 8.6), then multiply the result by the number in the first line for a class/Fund under the heading entitled "Expenses Paid During Period" to estimate the expenses you paid on your account during this period. If any fund is a shareholder of any underlying mutual funds or exchange-traded funds (ETFs) (the Underlying Funds), such fund indirectly bears its proportional share of the expenses of the Underlying Funds in addition to the direct expenses incurred presented in the table. These fees and expenses are not included in the annualized expense ratio used to calculate the expense estimate in the table below.
Hypothetical Example for Comparison Purposes
The second line of the accompanying table provides information about hypothetical account values and hypothetical expenses based on the actual expense ratio and an assumed rate of return of 5% per year before expenses, which is not the actual return. The hypothetical account values and expenses may not be used to estimate the actual ending account balance or expenses you paid for the period. You may use this information to compare the ongoing costs of investing in the Fund and other funds. To do so, compare this 5% hypothetical example with the 5% hypothetical examples that appear in the shareholder reports of the other funds. If any fund is a shareholder of any Underlying Funds, such fund indirectly bears its proportional share of the expenses of the Underlying Funds in addition to the direct expenses as presented in the table. These fees and expenses are not included in the annualized expense ratio used to calculate the expense estimate in the table below.
Please note that the expenses shown in the table are meant to highlight your ongoing costs only and do not reflect any transaction costs. Therefore, the second line of the table is useful in comparing ongoing costs only, and will not help you determine the relative total costs of owning different funds. In addition, if these transactional costs were included, your costs would have been higher.
| | Annualized Expense Ratio-A | Beginning
Account Value
September 1, 2020 | Ending
Account Value
February 28, 2021 | Expenses Paid
During Period-B
September 1, 2020
to February 28, 2021 |
| Banking Portfolio | .77% | | | |
| Actual | | $1,000.00 | $1,561.00 | $4.89 |
| Hypothetical-C | | $1,000.00 | $1,020.98 | $3.86 |
| Brokerage and Investment Management Portfolio | .75% | | | |
| Actual | | $1,000.00 | $1,236.00 | $4.16 |
| Hypothetical-C | | $1,000.00 | $1,021.08 | $3.76 |
| Consumer Finance Portfolio | .86% | | | |
| Actual | | $1,000.00 | $1,393.10 | $5.10 |
| Hypothetical-C | | $1,000.00 | $1,020.53 | $4.31 |
| Financial Services Portfolio | .75% | | | |
| Actual | | $1,000.00 | $1,390.00 | $4.44 |
| Hypothetical-C | | $1,000.00 | $1,021.08 | $3.76 |
| Insurance Portfolio | .81% | | | |
| Actual | | $1,000.00 | $1,210.30 | $4.44 |
| Hypothetical-C | | $1,000.00 | $1,020.78 | $4.06 |
A Annualized expense ratio reflects expenses net of applicable fee waivers.
B Expenses are equal to the annualized expense ratio, multiplied by the average account value over the period, multiplied by 181/ 365 (to reflect the one-half year period). The fees and expenses of any Underlying Funds are not included in each annualized expense ratio.
C 5% return per year before expenses
Distributions (Unaudited)
The Board of Trustees of each fund voted to pay to shareholders of record at the opening of business on record date, the following distributions per share derived from capital gains realized from sales of portfolio securities, and dividends derived from net investment income:
| | Pay Date | Record Date | Dividends | Capital Gains |
| Banking Portfolio | 04/12/21 | 04/09/21 | $0.013 | $0.000 |
| Brokerage and Investment Management Portfolio | 04/12/21 | 04/09/21 | $0.000 | $1.006 |
| Consumer Finance Portfolio | 04/12/21 | 04/09/21 | $0.015 | $0.000 |
| Financial Services Portfolio | 04/12/21 | 04/09/21 | $0.011 | $0.000 |
| Insurance Portfolio | 04/12/21 | 04/09/21 | $0.151 | $2.918 |
|
The funds hereby designate as capital gain dividend the amounts noted below for the taxable year ended February 28, 2021, or, if subsequently determined to be different, the net capital gain of such year.
| Brokerage and Investment Management Portfolio | $7,818,976 |
| Insurance Portfolio | $15,274,596 |
|
A percentage of the dividends distributed during the fiscal year for the following funds qualify for the dividends–received deduction for corporate shareholders:
| Banking Portfolio | |
| April 2020 | 100% |
| December 2020 | 100% |
| Brokerage and Investment Management Portfolio | |
| April 2020 | 100% |
| December 2020 | 100% |
| Consumer Finance Portfolio | |
| April 2020 | 100% |
| December 2020 | 86% |
| Financial Services Portfolio | |
| April 2020 | 100% |
| December 2020 | 100% |
| Insurance Portfolio | |
| April 2020 | 100% |
| December 2020 | 100% |
|
A percentage of the dividends distributed during the fiscal year for the following funds may be taken into account as a dividend for purposes of the maximum rate under section 1(h)(11) of the Internal Revenue Code.
| Banking Portfolio | |
| April 2020 | 100% |
| December 2020 | 100% |
| Brokerage and Investment Management Portfolio | |
| April 2020 | 100% |
| December 2020 | 100% |
| Consumer Finance Portfolio | |
| April 2020 | 100% |
| December 2020 | 88% |
| Financial Services Portfolio | |
| April 2020 | 100% |
| December 2020 | 100% |
| Insurance Portfolio | |
| April 2020 | 100% |
| December 2020 | 100% |
|
A percentage of the dividends distributed during the fiscal year for the following funds qualify as a section 199A dividend:
| Consumer Finance Portfolio | |
| April 2020 | 1% |
| December 2020 | 13% |
|
The funds hereby designate the percentages noted below of the short-term capital gain dividends distributed during the fiscal year as qualifying to be taxed as short-term capital gain dividends for nonresident alien shareholders:
| | April 2020 |
| Brokerage and Investment Management Portfolio | 100% |
|
The funds will notify shareholders in January 2022 of amounts for use in preparing 2021 income tax returns.
Board Approval of Investment Advisory Contracts
Banking Portfolio
Brokerage and Investment Management Portfolio
Consumer Finance Portfolio
Financial Services Portfolio
Insurance Portfolio
At its January 2021 meeting, the Board of Trustees, including the Independent Trustees (together, the Board), voted to continue the management contract with Fidelity Management & Research Company LLC (FMR), and the sub-advisory agreements and sub-subadvisory agreements, in each case, where applicable (together, the Advisory Contracts) for each fund for four months from February 1, 2021 through May 31, 2021, in connection with changes to the Board's meeting calendar.
The Board considered that the approval of each fund's Advisory Contracts will not result in any changes in (i) the investment process or strategies employed in the management of each fund's assets; (ii) the fees and expenses paid by shareholders; (iii) the nature, extent or quality of services provided under each fund's Advisory Contracts; or (iv) the day-to-day management of each fund or the persons primarily responsible for such management. The Board also considered that since its last approval of each fund's Advisory Contracts, FMR had provided additional information on each fund in support of the annual contract renewal process, including competitive analyses on total expenses and management fees and in-depth reviews of fund performance and fund profitability information. The Board also considered the findings of certain ad hoc committees that had been previously formed to discuss matters relevant to all of the Fidelity funds, including economies of scale, fall-out benefits and retail vs. institutional funds. The Board concluded that each fund's Advisory Contracts are fair and reasonable, and that each fund's Advisory Contracts should be renewed, without modification, through May 31, 2021, with the understanding that the Board will consider the annual renewal for a full one year period in May 2021.
In connection with its consideration of future renewals of each fund's Advisory Contracts, the Board will consider: (i) the nature, extent and quality of services provided to the funds, including shareholder and administrative services and investment performance; (ii) the competitiveness of the management fee and total expenses for each fund; (iii) the costs of the services and profitability, including the revenues earned and the expenses incurred in conducting the business of developing, marketing, distributing, managing, administering, and servicing each fund and its shareholders, to the extent applicable; and (iv) whether there have been economies of scale in respect of the Fidelity funds, whether the Fidelity funds (including the funds) have appropriately benefited from any such economies of scale, and whether there is the potential for realization of any further economies.
Based on its evaluation of all of the conclusions noted above, and after considering all factors it believed relevant, the Board ultimately concluded that each fund's management fee structures are fair and reasonable, and that the continuation of the funds' Advisory Contracts should be approved for four months from February 1, 2021 through May 31, 2021.
Liquidity Risk Management Program
The Securities and Exchange Commission adopted Rule 22e-4 under the Investment Company Act of 1940 (the Liquidity Rule) to promote effective liquidity risk management throughout the open-end investment company industry, thereby reducing the risk that funds will be unable to meet their redemption obligations and mitigating dilution of the interests of fund shareholders.
The Funds have adopted and implemented a liquidity risk management program pursuant to the Liquidity Rule (the Program) effective December 1, 2018. The Program is reasonably designed to assess and manage each Fund’s liquidity risk and to comply with the requirements of the Liquidity Rule. Each Fund’s Board of Trustees (the Board) has designated each Fund’s investment adviser as administrator of the Program. The Fidelity advisers have established a Liquidity Risk Management Committee (the LRM Committee) to manage the Program for each of the Fidelity Funds. The LRM Committee monitors the adequacy and effectiveness of implementation of the Program and on a periodic basis assesses each Fund’s liquidity risk based on a variety of factors including (1) the Fund’s investment strategy, (2) portfolio liquidity and cash flow projections during normal and reasonably foreseeable stressed conditions, (3) shareholder redemptions, (4) borrowings and other funding sources and (5) in the case of exchange-traded funds, certain additional factors including the effect of the Fund’s prices and spreads, market participants, and basket compositions on the overall liquidity of the Fund’s portfolio, as applicable.
In accordance with the Program, each of the Fund’s portfolio investments is classified into one of four liquidity categories described below based on a determination of a reasonable expectation for how long it would take to convert the investment to cash (or sell or dispose of the investment) without significantly changing its market value.
- Highly liquid investments – cash or convertible to cash within three business days or less
- Moderately liquid investments – convertible to cash in three to seven calendar days
- Less liquid investments – can be sold or disposed of, but not settled, within seven calendar days
- Illiquid investments – cannot be sold or disposed of within seven calendar days
Liquidity classification determinations take into account a variety of factors including various market, trading and investment-specific considerations, as well as market depth, and generally utilize analysis from a third-party liquidity metrics service.
The Liquidity Rule places a 15% limit on a fund’s illiquid investments and requires funds that do not primarily hold assets that are highly liquid investments to determine and maintain a minimum percentage of the fund’s net assets to be invested in highly liquid investments (highly liquid investment minimum or HLIM). The Program includes provisions reasonably designed to comply with the 15% limit on illiquid investments and for determining, periodically reviewing and complying with the HLIM requirement as applicable.
At a recent meeting of the Fund’s Board of Trustees, the LRM Committee provided a written report to the Board pertaining to the operation, adequacy, and effectiveness of implementation of the Program for the annual period from December 1, 2019 through November 30, 2020. The report concluded that the Program has been implemented and is operating effectively and is reasonably designed to assess and manage the Fund’s liquidity risk.
Proxy Voting Results
A special meeting of shareholders was held on June 9, 2020. The results of votes taken among shareholders on the proposal before them are reported below. Each vote reported represents one dollar of net asset value held on the record date for the meeting.
PROPOSAL 1
To elect a Board of Trustees.
| | # of
Votes | % of
Votes |
| Dennis J. Dirks |
| Affirmative | 32,463,705,305.665 | 92.437 |
| Withheld | 2,655,951,104.308 | 7.563 |
| TOTAL | 35,119,656,409.973 | 100.000 |
| Donald F. Donahue |
| Affirmative | 32,446,843,861.354 | 92.389 |
| Withheld | 2,672,812,548.619 | 7.611 |
| TOTAL | 35,119,656,409.973 | 100.000 |
| Bettina Doulton |
| Affirmative | 32,610,463,757.584 | 92.855 |
| Withheld | 2,509,192,652.389 | 7.145 |
| TOTAL | 35,119,656,409.973 | 100.000 |
| Vicki L. Fuller |
| Affirmative | 32,688,213,522.720 | 93.077 |
| Withheld | 2,431,442,887.253 | 6.923 |
| TOTAL | 35,119,656,409.973 | 100.000 |
| Patricia L. Kampling |
| Affirmative | 32,313,755,598.535 | 92.010 |
| Withheld | 2,805,900,811.438 | 7.990 |
| TOTAL | 35,119,656,409.973 | 100.000 |
| Alan J. Lacy |
| Affirmative | 31,990,158,754.948 | 91.089 |
| Withheld | 3,129,497,655.026 | 8.911 |
| TOTAL | 35,119,656,409.973 | 100.000 |
| Ned C. Lautenbach |
| Affirmative | 32,043,019,991.143 | 91.240 |
| Withheld | 3,076,636,418.830 | 8.760 |
| TOTAL | 35,119,656,409.973 | 100.000 |
| Robert A. Lawrence |
| Affirmative | 32,150,842,398.009 | 91.547 |
| Withheld | 2,968,814,011.965 | 8.453 |
| TOTAL | 35,119,656,409.973 | 100.000 |
| Joseph Mauriello |
| Affirmative | 32,082,201,213.166 | 91.351 |
| Withheld | 3,037,455,196.807 | 8.649 |
| TOTAL | 35,119,656,409.973 | 100.000 |
| Cornelia M. Small |
| Affirmative | 32,207,976,835.934 | 91.709 |
| Withheld | 2,911,679,574.039 | 8.291 |
| TOTAL | 35,119,656,409.973 | 100.000 |
| Garnett A. Smith |
| Affirmative | 32,102,654,343.096 | 91.409 |
| Withheld | 3,017,002,066.877 | 8.591 |
| TOTAL | 35,119,656,409.973 | 100.000 |
| David M. Thomas |
| Affirmative | 32,150,749,424.556 | 91.546 |
| Withheld | 2,968,906,985.418 | 8.454 |
| TOTAL | 35,119,656,409.973 | 100.000 |
| Susan Tomasky |
| Affirmative | 32,381,933,484.515 | 92.205 |
| Withheld | 2,737,722,925.459 | 7.795 |
| TOTAL | 35,119,656,409.973 | 100.000 |
| Michael E. Wiley |
| Affirmative | 32,135,064,741.973 | 91.502 |
| Withheld | 2,984,591,668.000 | 8.498 |
| TOTAL | 35,119,656,409.973 | 100.000 |
|
| Proposal 1 reflects trust wide proposal and voting results. |
SELFIN-ANN-0421
1.813663.116
Fidelity® Select Portfolios®
Health Care Sector
Biotechnology Portfolio
Health Care Portfolio
Health Care Services Portfolio
Medical Technology and Devices Portfolio
Pharmaceuticals Portfolio
Annual Report
February 28, 2021
Contents
To view a fund's proxy voting guidelines and proxy voting record for the 12-month period ended June 30, visit http://www.fidelity.com/proxyvotingresults or visit the Securities and Exchange Commission's (SEC) web site at http://www.sec.gov.
You may also call 1-800-544-8544 to request a free copy of the proxy voting guidelines.
Standard & Poor's, S&P and S&P 500 are registered service marks of The McGraw-Hill Companies, Inc. and have been licensed for use by Fidelity Distributors Corporation.
Other third-party marks appearing herein are the property of their respective owners.
All other marks appearing herein are registered or unregistered trademarks or service marks of FMR LLC or an affiliated company. © 2021 FMR LLC. All rights reserved.
This report and the financial statements contained herein are submitted for the general information of the shareholders of the Funds. This report is not authorized for distribution to prospective investors in the Funds unless preceded or accompanied by an effective prospectus.
A fund files its complete schedule of portfolio holdings with the SEC for the first and third quarters of each fiscal year on Form N-PORT. Forms N-PORT are available on the SEC’s web site at http://www.sec.gov. A fund's Forms N-PORT may be reviewed and copied at the SEC’s Public Reference Room in Washington, DC. Information regarding the operation of the SEC's Public Reference Room may be obtained by calling 1-800-SEC-0330.
For a complete list of a fund's portfolio holdings, view the most recent holdings listing, semiannual report, or annual report on Fidelity's web site at http://www.fidelity.com, http://www.institutional.fidelity.com, or http://www.401k.com, as applicable.
NOT FDIC INSURED •MAY LOSE VALUE •NO BANK GUARANTEE
Neither the Funds nor Fidelity Distributors Corporation is a bank.
Note to Shareholders:
Early in 2020, the outbreak and spread of a new coronavirus emerged as a public health emergency that had a major influence on financial markets, primarily based on its impact on the global economy and the outlook for corporate earnings. The virus causes a respiratory disease known as COVID-19. On March 11, 2020 the World Health Organization declared the COVID-19 outbreak a pandemic, citing sustained risk of further global spread.
In the weeks following, as the crisis worsened, we witnessed an escalating human tragedy with wide-scale social and economic consequences from coronavirus-containment measures. The outbreak of COVID-19 prompted a number of measures to limit the spread, including travel and border restrictions, quarantines, and restrictions on large gatherings. In turn, these resulted in lower consumer activity, diminished demand for a wide range of products and services, disruption in manufacturing and supply chains, and – given the wide variability in outcomes regarding the outbreak – significant market uncertainty and volatility. Amid the turmoil, global governments and central banks took unprecedented action to help support consumers, businesses, and the broader economies, and to limit disruption to financial systems.
The situation continues to unfold, and the extent and duration of its impact on financial markets and the economy remain highly uncertain. Extreme events such as the coronavirus crisis are “exogenous shocks” that can have significant adverse effects on mutual funds and their investments. Although multiple asset classes may be affected by market disruption, the duration and impact may not be the same for all types of assets.
Fidelity is committed to helping you stay informed amid news about COVID-19 and during increased market volatility, and we’re taking extra steps to be responsive to customer needs. We encourage you to visit our websites, where we offer ongoing updates, commentary, and analysis on the markets and our funds.
Biotechnology Portfolio
Performance: The Bottom Line
Average annual total return reflects the change in the value of an investment, assuming reinvestment of distributions from dividend income and capital gains (the profits earned upon the sale of securities that have grown in value, if any) and assuming a constant rate of performance each year. The hypothetical investment and the average annual total returns do not reflect the deduction of taxes that a shareholder would pay on fund distributions or the redemption of fund shares. During periods of reimbursement by Fidelity, a fund’s total return will be greater than it would be had the reimbursement not occurred. How a fund did yesterday is no guarantee of how it will do tomorrow.
Average Annual Total Returns
| For the periods ended February 28, 2021 | Past 1 year | Past 5 years | Past 10 years |
| Biotechnology Portfolio | 47.35% | 19.30% | 20.98% |
$10,000 Over 10 Years
Let's say hypothetically that $10,000 was invested in Biotechnology Portfolio on February 28, 2011.
The chart shows how the value of your investment would have changed, and also shows how the S&P 500® Index performed over the same period.

| Period Ending Values |
| $67,175 | Biotechnology Portfolio |
| $35,259 | S&P 500® Index |
Biotechnology Portfolio
Management's Discussion of Fund Performance
Market Recap: The S&P 500
® index gained 31.29% for the 12 months ending February 28, 2021, a volatile but productive period for U.S. risk assets. The early-2020 outbreak and spread of COVID-19 resulted in stocks suffering one of the quickest declines on record, through March 23, followed by a historic rebound that included the index closing 2020 at an all-time high and gaining modest ground in the first two months of the new year. The crisis and containment efforts caused broad contraction in economic activity, along with extreme uncertainty and dislocation in financial markets. A rapid and expansive U.S. monetary/fiscal-policy response partially offset the economic disruption and fueled the market surge, as did resilient corporate earnings. The rally slowed in September, when stocks began a two-month retreat amid Congress’s inability to reach a deal on additional fiscal stimulus, as well as concerns about election uncertainty, indications the U.S. economic recovery could be slowing and a new wave of COVID-19 cases. A shift in momentum began in October and accelerated following the U.S. elections, with the approval of three breakthrough COVID-19 vaccines and prospects for additional government stimulus fueling the “reflation trade” through February 28. By sector for the full 12 months, information technology (+50%) and consumer discretionary (+43%) led all gainers. Materials (+42%) and communication services (+37%) also stood out. In contrast, the defensive utilities (-3%) and real estate sectors (+5%) notably lagged.
Comments from Portfolio Manager Rajiv Kaul: For the fiscal year ending February 28, 2021, the fund gained 47.35%, outperforming the 31.95% advance of the MSCI US IMI Biotechnology 25/50 Index, as well as the broad-based S&P 500
® index. Versus the industry index, security selection was the primary contributor, especially within the biotechnology group. Non-index exposure to pharmaceuticals and health care equipment also helped. The fund's largest individual relative contributor was our outsized stake in Immunomedics, which gained about 440%. This is a position that was sold the past 12 months. Also boosting value was our lighter-than-index stake in Gilead Sciences, which returned -8%. This was a position we established the past year. Another top relative contributor was an out-of-index stake in MyoKardia (+249%). This was a position that was sold the past 12 months. Conversely, out-of-index exposure to other diversified financial services modestly detracted from our relative result. The fund's modest position in cash also hurt relative performance amid a strong market the past 12 months. Our non-index stake in Galapagos Genomics was the fund's biggest individual relative detractor, due to its -61% result. Also hampering performance was an underweighting in Alexion Pharmaceuticals, which gained roughly 62%. Alexion Pharmaceuticals was not held at period end. Also hurting performance was an underweighting in AbbVie, which gained about 32%. The company was the fund's top holding.
The views expressed above reflect those of the portfolio manager(s) only through the end of the period as stated on the cover of this report and do not necessarily represent the views of Fidelity or any other person in the Fidelity organization. Any such views are subject to change at any time based upon market or other conditions and Fidelity disclaims any responsibility to update such views. These views may not be relied on as investment advice and, because investment decisions for a Fidelity fund are based on numerous factors, may not be relied on as an indication of trading intent on behalf of any Fidelity fund.
Biotechnology Portfolio
Investment Summary (Unaudited)
Top Ten Stocks as of February 28, 2021
| | % of fund's net assets |
| AbbVie, Inc. | 12.0 |
| Vertex Pharmaceuticals, Inc. | 4.5 |
| Biogen, Inc. | 3.7 |
| Alnylam Pharmaceuticals, Inc. | 2.4 |
| Acceleron Pharma, Inc. | 1.8 |
| Amgen, Inc. | 1.8 |
| Argenx SE ADR | 1.8 |
| TG Therapeutics, Inc. | 1.7 |
| ChemoCentryx, Inc. | 1.6 |
| Moderna, Inc. | 1.5 |
| | 32.8 |
Top Industries (% of fund's net assets)
| As of February 28, 2021 |
| | Biotechnology | 91.5% |
| | Pharmaceuticals | 6.3% |
| | Life Sciences Tools & Services | 0.9% |
| | Diversified Financial Services | 0.3% |
| | Health Care Equipment & Supplies | 0.2% |
| | All Others* | 0.8% |

* Includes short-term investments and net other assets (liabilities).
Biotechnology Portfolio
Schedule of Investments February 28, 2021
Showing Percentage of Net Assets
| Common Stocks - 97.8% | | | |
| | | Shares | Value |
| Biotechnology - 90.2% | | | |
| Biotechnology - 90.2% | | | |
| 4D Molecular Therapeutics, Inc. | | 148,168 | $6,220,093 |
| AbbVie, Inc. | | 9,897,084 | 1,066,311,827 |
| AC Immune SA (a)(b) | | 14,032 | 106,503 |
| ACADIA Pharmaceuticals, Inc. (a)(b) | | 945,994 | 46,325,326 |
| Acceleron Pharma, Inc. (a) | | 1,168,353 | 159,082,944 |
| ADC Therapeutics SA (a) | | 764,038 | 20,315,770 |
| Adverum Biotechnologies, Inc. (a) | | 774,442 | 9,936,091 |
| Agios Pharmaceuticals, Inc. (a) | | 1,500,869 | 71,201,225 |
| Akouos, Inc. (a) | | 94,426 | 1,923,458 |
| Albireo Pharma, Inc. (a) | | 320,350 | 11,167,401 |
| Aldeyra Therapeutics, Inc. (a)(b) | | 759,611 | 9,312,831 |
| Alector, Inc. (a)(b) | | 744,582 | 13,536,501 |
| Allakos, Inc. (a)(b) | | 274,331 | 33,243,431 |
| Allena Pharmaceuticals, Inc. (a) | | 848,640 | 1,425,715 |
| Allena Pharmaceuticals, Inc. (a)(c) | | 1,447,443 | 2,431,704 |
| Allogene Therapeutics, Inc. (a)(b) | | 565,370 | 19,623,993 |
| Allovir, Inc. (a) | | 111,300 | 4,069,128 |
| Alnylam Pharmaceuticals, Inc. (a) | | 1,432,939 | 212,218,266 |
| ALX Oncology Holdings, Inc. (a)(b) | | 625,290 | 50,204,534 |
| Amgen, Inc. | | 703,132 | 158,148,449 |
| Amicus Therapeutics, Inc. (a) | | 50,181 | 616,223 |
| AnaptysBio, Inc. (a) | | 213,167 | 6,117,893 |
| Angion Biomedica Corp. (b) | | 312,500 | 5,418,750 |
| Annexon, Inc. (a) | | 691,636 | 20,133,524 |
| Apellis Pharmaceuticals, Inc. (a) | | 1,620,434 | 78,056,306 |
| Applied Genetic Technologies Corp. (a) | | 129,100 | 655,828 |
| Applied Therapeutics, Inc. (a) | | 700,940 | 15,224,417 |
| Aravive, Inc. (a)(b) | | 456,443 | 3,108,377 |
| Arcturus Therapeutics Holdings, Inc. (a)(b) | | 730,290 | 38,464,374 |
| Arcus Biosciences, Inc. (a)(b) | | 2,233,660 | 78,758,852 |
| Arcutis Biotherapeutics, Inc. (a) | | 879,674 | 30,058,461 |
| Ardelyx, Inc. (a) | | 97,094 | 626,256 |
| Arena Pharmaceuticals, Inc. (a) | | 437,973 | 35,191,131 |
| Argenx SE ADR (a) | | 469,786 | 155,348,834 |
| Arrowhead Pharmaceuticals, Inc. (a) | | 1,075,526 | 85,676,401 |
| Ascendis Pharma A/S sponsored ADR (a) | | 659,409 | 102,188,613 |
| Atara Biotherapeutics, Inc. (a) | | 863,195 | 14,484,412 |
| Athenex, Inc. (a)(b) | | 149,900 | 1,813,790 |
| Atreca, Inc. (a)(b) | | 109,588 | 1,901,352 |
| aTyr Pharma, Inc. (a)(b) | | 481,990 | 2,096,657 |
| Aurinia Pharmaceuticals, Inc. (a)(b) | | 1,495,486 | 20,936,804 |
| Autolus Therapeutics Ltd. ADR (a)(b) | | 1,074,488 | 6,919,703 |
| Avidity Biosciences, Inc. (b) | | 235,484 | 5,682,229 |
| AVROBIO, Inc. (a) | | 275,054 | 3,025,594 |
| Axcella Health, Inc. (a) | | 397,149 | 2,263,749 |
| BeiGene Ltd. ADR (a) | | 9,800 | 3,136,000 |
| Bicycle Therapeutics PLC ADR (a)(b) | | 211,444 | 5,343,190 |
| BioAtla, Inc. | | 19,140 | 1,016,334 |
| BioCryst Pharmaceuticals, Inc. (a)(b) | | 806,284 | 8,691,742 |
| Biogen, Inc. (a) | | 1,197,605 | 326,802,452 |
| Biohaven Pharmaceutical Holding Co. Ltd. (a) | | 961,652 | 81,721,187 |
| BioMarin Pharmaceutical, Inc. (a) | | 8,344 | 646,076 |
| BioNTech SE ADR (a)(b) | | 117,228 | 12,781,369 |
| BioXcel Therapeutics, Inc. (a)(b) | | 221,727 | 11,886,784 |
| Black Diamond Therapeutics, Inc. (a)(b) | | 422,442 | 11,828,376 |
| bluebird bio, Inc. (a) | | 12,384 | 385,142 |
| Blueprint Medicines Corp. (a)(b) | | 1,178,239 | 115,726,635 |
| Bolt Biotherapeutics, Inc. | | 552,600 | 14,754,420 |
| BridgeBio Pharma, Inc. (a)(b) | | 968,461 | 68,450,823 |
| C4 Therapeutics, Inc. (b) | | 338,387 | 14,523,570 |
| Cabaletta Bio, Inc. (a) | | 35,650 | 387,516 |
| Cardiff Oncology, Inc. (a)(b) | | 149,780 | 1,548,725 |
| CareDx, Inc. (a) | | 192,100 | 15,191,268 |
| Celldex Therapeutics, Inc. (a) | | 32,200 | 871,976 |
| Cellectis SA sponsored ADR (a)(b) | | 405,065 | 8,708,898 |
| Cerevel Therapeutics Holdings (d) | | 201,800 | 3,059,288 |
| ChemoCentryx, Inc. (a) | | 2,062,222 | 139,901,140 |
| Chinook Therapeutics, Inc. (a) | | 865,822 | 14,320,696 |
| Chinook Therapeutics, Inc. rights (a)(e) | | 115,821 | 5,791 |
| Clovis Oncology, Inc. (a)(b) | | 101,570 | 608,404 |
| Codiak Biosciences, Inc. | | 499,925 | 7,693,846 |
| Codiak Biosciences, Inc. | | 66,300 | 1,074,060 |
| Coherus BioSciences, Inc. (a) | | 58,387 | 948,205 |
| Constellation Pharmaceuticals, Inc. (a)(b) | | 90,259 | 2,274,527 |
| ContraFect Corp. (a) | | 256,309 | 1,345,622 |
| Cortexyme, Inc. (a)(b) | | 1,947 | 66,334 |
| Crinetics Pharmaceuticals, Inc. (a)(f) | | 2,123,187 | 32,463,529 |
| CRISPR Therapeutics AG (a)(b) | | 276,322 | 34,730,912 |
| Cullinan Oncology, Inc. | | 203,040 | 8,206,877 |
| Cyclerion Therapeutics, Inc. (a)(b) | | 837,285 | 3,215,174 |
| Cyclerion Therapeutics, Inc. (a)(d) | | 94,809 | 364,067 |
| Cytokinetics, Inc. (a)(b) | | 1,037,571 | 19,433,705 |
| CytomX Therapeutics, Inc. (a)(b) | | 221,700 | 1,740,345 |
| CytomX Therapeutics, Inc. (a)(c) | | 287,485 | 2,256,757 |
| Decibel Therapeutics, Inc. (b) | | 500,000 | 9,390,000 |
| Deciphera Pharmaceuticals, Inc. (a) | | 397,200 | 17,389,416 |
| Denali Therapeutics, Inc. (a)(b) | | 697,951 | 50,112,882 |
| Dicerna Pharmaceuticals, Inc. (a) | | 618,712 | 16,692,850 |
| Dynavax Technologies Corp.(a)(b) | | 33,998 | 297,483 |
| Dyne Therapeutics, Inc. (b) | | 266,683 | 4,925,635 |
| Editas Medicine, Inc. (a)(b) | | 49,889 | 2,188,132 |
| Eledon Pharmaceuticals, Inc. (a)(f) | | 1,004,111 | 16,136,064 |
| Emergent BioSolutions, Inc. (a) | | 145,901 | 14,006,496 |
| Epizyme, Inc. (a)(b) | | 1,405,435 | 13,478,122 |
| Equillium, Inc. (a)(b) | | 209,800 | 1,479,090 |
| Esperion Therapeutics, Inc. (a)(b) | | 127,197 | 3,483,926 |
| Essa Pharma, Inc. (a)(b) | | 797,203 | 21,596,229 |
| Evelo Biosciences, Inc. (a)(b) | | 834,199 | 10,152,202 |
| Exact Sciences Corp. (a) | | 566,212 | 77,072,777 |
| Exelixis, Inc. (a) | | 4,166,444 | 90,245,177 |
| Fate Therapeutics, Inc. (a) | | 1,012,587 | 90,849,306 |
| FibroGen, Inc. (a) | | 1,190,431 | 59,557,263 |
| Five Prime Therapeutics, Inc. (a)(b) | | 603,035 | 13,405,468 |
| Foghorn Therapeutics, Inc. | | 443,055 | 7,292,685 |
| Foghorn Therapeutics, Inc. | | 144,144 | 2,253,980 |
| Forma Therapeutics Holdings, Inc. | | 913,462 | 35,268,768 |
| Frequency Therapeutics, Inc. (a)(b) | | 18,356 | 903,299 |
| Fusion Pharmaceuticals, Inc. (a)(b) | | 871,443 | 10,178,454 |
| G1 Therapeutics, Inc. (a)(b) | | 737,500 | 16,298,750 |
| Galapagos Genomics NV sponsored ADR (a)(b) | | 564,459 | 46,624,313 |
| Galecto, Inc. (b) | | 133,333 | 1,385,330 |
| Gamida Cell Ltd. (a) | | 917,467 | 8,587,491 |
| Generation Bio Co. | | 137,100 | 4,787,532 |
| Genmab A/S ADR (a) | | 43,390 | 1,469,619 |
| Geron Corp. (a)(b) | | 4,109,206 | 7,355,479 |
| Geron Corp. warrants 12/31/25 (a) | | 2,100,000 | 981,490 |
| Gilead Sciences, Inc. | | 78,732 | 4,834,145 |
| Global Blood Therapeutics, Inc. (a)(b) | | 736,416 | 31,371,322 |
| Gossamer Bio, Inc. (a) | | 24,014 | 225,732 |
| Gracell Biotechnologies, Inc. ADR | | 147,966 | 3,363,267 |
| Gritstone Oncology, Inc. (a) | | 780,780 | 10,595,185 |
| Halozyme Therapeutics, Inc. (a) | | 885,208 | 40,055,662 |
| Heron Therapeutics, Inc. (a)(b) | | 804,225 | 14,540,388 |
| Homology Medicines, Inc. (a) | | 308,176 | 3,309,810 |
| Hookipa Pharma, Inc. (a)(b)(f) | | 1,669,000 | 19,760,960 |
| Idorsia Ltd. (a) | | 1,218,941 | 33,339,474 |
| IGM Biosciences, Inc. (a)(b) | | 142,968 | 12,499,692 |
| Immunic, Inc. (a) | | 602,072 | 9,603,048 |
| Immunocore Holdings PLC | | 400,875 | 17,447,684 |
| Immunocore Holdings PLC ADR | | 99,268 | 4,800,600 |
| ImmunoGen, Inc. (a)(b) | | 1,963,743 | 17,182,751 |
| Immunome, Inc. (b) | | 226,456 | 8,963,128 |
| Incyte Corp. (a) | | 727,067 | 57,191,090 |
| Inhibikase Therapeutics, Inc. (b) | | 100,000 | 670,000 |
| Inhibrx, Inc. (a) | | 77,900 | 1,980,218 |
| Inovio Pharmaceuticals, Inc. (a)(b) | | 130,844 | 1,452,368 |
| Inozyme Pharma, Inc. (a)(b) | | 609,380 | 12,187,600 |
| Insmed, Inc. (a)(b) | | 1,298,520 | 46,448,060 |
| Intellia Therapeutics, Inc. (a)(b) | | 1,150,501 | 69,559,290 |
| Intercept Pharmaceuticals, Inc. (a) | | 408,294 | 8,843,648 |
| Invitae Corp. (a)(b) | | 714,517 | 28,673,567 |
| Ionis Pharmaceuticals, Inc. (a) | | 1,722,677 | 90,268,275 |
| Iovance Biotherapeutics, Inc. (a) | | 651,079 | 24,285,247 |
| iTeos Therapeutics, Inc. (a) | | 303,681 | 12,627,056 |
| Jounce Therapeutics, Inc. (a) | | 318,234 | 3,494,209 |
| Kalvista Pharmaceuticals, Inc. (a) | | 568,760 | 18,695,141 |
| Karuna Therapeutics, Inc. (a) | | 229,311 | 28,654,703 |
| Karyopharm Therapeutics, Inc. (a)(b) | | 160,610 | 2,219,630 |
| Keros Therapeutics, Inc. | | 405,386 | 26,540,621 |
| Kezar Life Sciences, Inc. (a) | | 1,013,094 | 5,551,755 |
| Kiniksa Pharmaceuticals Ltd. (a)(b) | | 507,140 | 10,431,870 |
| Kinnate Biopharma, Inc. | | 639,303 | 19,234,709 |
| Kinnate Biopharma, Inc. | | 14,000 | 468,020 |
| Kodiak Sciences, Inc. (a)(b) | | 325,468 | 41,988,627 |
| Kronos Bio, Inc. (b) | | 52,276 | 1,519,663 |
| Kronos Bio, Inc. | | 495,356 | 13,679,999 |
| Krystal Biotech, Inc. (a)(f) | | 1,341,897 | 105,862,254 |
| Kura Oncology, Inc. (a) | | 1,933,557 | 54,139,596 |
| Kymera Therapeutics, Inc. (a) | | 241,671 | 11,595,375 |
| Legend Biotech Corp. ADR | | 5,794 | 157,481 |
| Lexicon Pharmaceuticals, Inc. (a) | | 1,045,768 | 7,519,072 |
| Ligand Pharmaceuticals, Inc. Class B (a)(b) | | 698 | 103,458 |
| LogicBio Therapeutics, Inc. (a) | | 500,000 | 4,145,000 |
| Macrogenics, Inc. (a) | | 1,205,850 | 30,158,309 |
| Madrigal Pharmaceuticals, Inc. (a)(b) | | 171,140 | 20,740,457 |
| MannKind Corp. (a)(b) | | 3,281,362 | 18,736,577 |
| Mersana Therapeutics, Inc. (a) | | 614,906 | 11,178,991 |
| Merus BV (a)(b) | | 500,000 | 11,250,000 |
| Metacrine, Inc. | | 312,500 | 2,656,250 |
| Minerva Neurosciences, Inc. (a) | | 394,479 | 1,222,885 |
| Mirati Therapeutics, Inc. (a) | | 630,540 | 126,688,097 |
| Mirum Pharmaceuticals, Inc. (a)(b) | | 159,228 | 2,923,426 |
| Moderna, Inc. (a) | | 850,405 | 131,651,198 |
| Molecular Templates, Inc. (a)(b) | | 624,214 | 6,803,933 |
| Morphic Holding, Inc. (a) | | 771,037 | 27,880,698 |
| Myovant Sciences Ltd. (a)(b) | | 191,666 | 4,304,818 |
| Natera, Inc. (a) | | 632,233 | 73,395,929 |
| Neurocrine Biosciences, Inc. (a) | | 802,798 | 87,914,409 |
| Neximmune, Inc. | | 525,000 | 13,602,750 |
| NextCure, Inc. (a) | | 15,490 | 175,966 |
| Nkarta, Inc. (a)(b) | | 60,200 | 2,935,352 |
| Novavax, Inc. (a) | | 289,026 | 66,831,482 |
| Nurix Therapeutics, Inc. (a)(b) | | 335,685 | 11,953,743 |
| Nuvation Bio Pvt, Inc. | | 408,991 | 3,691,962 |
| Olema Pharmaceuticals, Inc. (b) | | 61,997 | 2,474,920 |
| Oragenics, Inc. (a) | | 155,806 | 158,922 |
| ORIC Pharmaceuticals, Inc. (a)(b) | | 724,374 | 23,469,718 |
| Passage Bio, Inc. | | 643,962 | 11,604,195 |
| PMV Pharmaceuticals, Inc. | | 172,300 | 6,483,649 |
| Poseida Therapeutics, Inc. (a) | | 101,700 | 1,122,768 |
| Poseida Therapeutics, Inc. (c) | | 513,583 | 5,669,956 |
| Praxis Precision Medicines, Inc. (b) | | 301,561 | 13,117,904 |
| Prelude Therapeutics, Inc. | | 10,079 | 628,224 |
| Prelude Therapeutics, Inc. | | 550,977 | 32,625,277 |
| ProQR Therapeutics BV (a)(b) | | 100,416 | 458,901 |
| Protagonist Therapeutics, Inc. (a) | | 335,563 | 7,909,220 |
| Prothena Corp. PLC (a) | | 1,024,989 | 22,877,754 |
| PTC Therapeutics, Inc. (a) | | 2,268,744 | 129,545,282 |
| Radius Health, Inc. (a) | | 40,249 | 749,034 |
| Regeneron Pharmaceuticals, Inc. (a) | | 216,721 | 97,647,981 |
| REGENXBIO, Inc. (a) | | 15,108 | 618,068 |
| Relay Therapeutics, Inc. (a)(b) | | 1,293,843 | 53,396,901 |
| Repare Therapeutics, Inc. | | 540,250 | 17,774,225 |
| Replimune Group, Inc. (a) | | 1,054,117 | 36,504,072 |
| Revolution Medicines, Inc. | | 834,592 | 38,124,163 |
| Rhythm Pharmaceuticals, Inc. (a) | | 47,178 | 1,222,854 |
| Rigel Pharmaceuticals, Inc. (a) | | 1,097,800 | 4,555,870 |
| Rocket Pharmaceuticals, Inc. (a)(b) | | 743,436 | 41,320,173 |
| Rubius Therapeutics, Inc. (a) | | 594,943 | 6,175,508 |
| Sage Therapeutics, Inc. (a) | | 1,102,835 | 93,740,975 |
| Sana Biotechnology, Inc. | | 181,690 | 5,585,151 |
| Sangamo Therapeutics, Inc. (a)(b) | | 503,127 | 5,780,929 |
| Sarepta Therapeutics, Inc. (a) | | 816,304 | 71,067,426 |
| Scholar Rock Holding Corp. (a) | | 1,543,247 | 83,489,663 |
| Seagen, Inc. (a) | | 114,037 | 17,232,131 |
| Seer, Inc. | | 40,900 | 1,972,607 |
| Selecta Biosciences, Inc. (a) | | 1,032,715 | 4,358,057 |
| Sensorion SA (a) | | 3,270,000 | 8,364,287 |
| Seres Therapeutics, Inc. (a)(b) | | 687,847 | 13,096,607 |
| Shattuck Labs, Inc. | | 110,936 | 4,581,657 |
| Sigilon Therapeutics, Inc. (b) | | 82,144 | 2,185,030 |
| Silverback Therapeutics, Inc. | | 88,578 | 4,257,059 |
| Silverback Therapeutics, Inc. | | 296,788 | 12,837,268 |
| Spero Therapeutics, Inc. (a)(b) | | 8,552 | 155,390 |
| Springworks Therapeutics, Inc. (a)(b) | | 259,620 | 22,340,301 |
| Spruce Biosciences, Inc. (b) | | 698,273 | 14,593,906 |
| Stoke Therapeutics, Inc. (a)(b) | | 449,236 | 26,904,744 |
| Surface Oncology, Inc. (a)(b) | | 885,265 | 7,507,047 |
| Sutro Biopharma, Inc. (a) | | 737,300 | 16,368,060 |
| Syros Pharmaceuticals, Inc. (a) | | 2,002,674 | 16,822,462 |
| Syros Pharmaceuticals, Inc. (a)(c) | | 303,621 | 2,550,416 |
| Syros Pharmaceuticals, Inc. warrants 10/10/22 (a) | | 21,625 | 43,772 |
| Taysha Gene Therapies, Inc. | | 152,232 | 3,895,617 |
| Taysha Gene Therapies, Inc. | | 800,115 | 19,451,196 |
| TCR2 Therapeutics, Inc. (a) | | 458,700 | 12,137,202 |
| TG Therapeutics, Inc. (a)(b) | | 3,398,912 | 148,770,378 |
| Translate Bio, Inc. (a) | | 1,038,823 | 24,246,129 |
| Travere Therapeutics, Inc. (a) | | 633,999 | 19,539,849 |
| Trillium Therapeutics, Inc. (a)(b) | | 173,460 | 1,968,771 |
| Turning Point Therapeutics, Inc. (a) | | 873,052 | 102,941,561 |
| Twist Bioscience Corp. (a) | | 287,151 | 39,523,464 |
| Ultragenyx Pharmaceutical, Inc. (a) | | 654,537 | 92,643,167 |
| uniQure B.V. (a) | | 737,908 | 27,081,224 |
| United Therapeutics Corp. (a) | | 239,716 | 40,075,721 |
| UroGen Pharma Ltd. (a)(b) | | 47,603 | 906,837 |
| Vaxart, Inc. (a)(b) | | 138,865 | 992,885 |
| Vaxcyte, Inc. | | 559,915 | 13,191,597 |
| Veracyte, Inc. (a) | | 193,600 | 11,240,416 |
| Vertex Pharmaceuticals, Inc. (a) | | 1,886,555 | 400,987,265 |
| Vor Biopharma, Inc. (a) | | 5,800 | 260,768 |
| Vor Biopharma, Inc. | | 424,208 | 17,165,153 |
| X4 Pharmaceuticals, Inc. (a) | | 212,620 | 2,034,773 |
| X4 Pharmaceuticals, Inc. warrants 4/12/24 (a) | | 450,000 | 1,056,011 |
| Xencor, Inc. (a) | | 972,143 | 47,897,486 |
| Xenon Pharmaceuticals, Inc. (a) | | 341,771 | 6,384,282 |
| Y-mAbs Therapeutics, Inc. (a) | | 1,354,184 | 47,626,651 |
| Yumanity Therapeutics, Inc. (d) | | 173,913 | 3,090,434 |
| Yumanity Therapeutics, Inc. | | 132,069 | 2,112,180 |
| Zai Lab Ltd. ADR (a) | | 48,800 | 7,198,976 |
| Zealand Pharma A/S (a) | | 521,805 | 16,526,534 |
| Zentalis Pharmaceuticals, Inc. | | 621,333 | 26,120,839 |
| Zymeworks, Inc. (a) | | 709,195 | 25,750,870 |
| | | | 7,999,197,592 |
| Capital Markets - 0.0% | | | |
| Asset Management & Custody Banks - 0.0% | | | |
| Arix Bioscience PLC (a)(c) | | 1,411,100 | 3,715,635 |
| Diversified Financial Services - 0.3% | | | |
| Other Diversified Financial Services - 0.3% | | | |
| ARYA Sciences Acquisition Corp. III | | 328,140 | 5,151,798 |
| Gemini Therapeutics, Inc. (d) | | 1,000,000 | 14,440,000 |
| Nuvation Bio, Inc. (d) | | 1,000,000 | 9,027,000 |
| | | | 28,618,798 |
| Health Care Equipment & Supplies - 0.2% | | | |
| Health Care Equipment - 0.2% | | | |
| Novocure Ltd. (a)(c) | | 106,313 | 15,851,268 |
| Health Care Supplies - 0.0% | | | |
| Pulmonx Corp. | | 8,300 | 471,689 |
|
| TOTAL HEALTH CARE EQUIPMENT & SUPPLIES | | | 16,322,957 |
|
| Health Care Providers & Services - 0.0% | | | |
| Health Care Services - 0.0% | | | |
| Precipio, Inc. (a)(d) | | 525 | 1,281 |
| Health Care Technology - 0.0% | | | |
| Health Care Technology - 0.0% | | | |
| Schrodinger, Inc. | | 29,600 | 3,033,408 |
| Life Sciences Tools & Services - 0.9% | | | |
| Life Sciences Tools & Services - 0.9% | | | |
| 10X Genomics, Inc. (a) | | 96,819 | 17,232,814 |
| AbCellera Biologics, Inc. (b) | | 48,400 | 1,825,164 |
| Adaptive Biotechnologies Corp. (a) | | 45,980 | 2,601,089 |
| Berkeley Lights, Inc. (a) | | 10,200 | 632,094 |
| Bruker Corp. | | 175,400 | 10,695,892 |
| Compugen Ltd. (a)(b) | | 808,113 | 7,539,694 |
| Evotec OAI AG (a) | | 469,500 | 18,166,860 |
| Maravai LifeSciences Holdings, Inc. | | 146,700 | 4,770,684 |
| Seer, Inc. Class A (d) | | 263,158 | 12,692,110 |
| | | | 76,156,401 |
| Personal Products - 0.0% | | | |
| Personal Products - 0.0% | | | |
| MedAvail Holdings, Inc. (a) | | 2,777 | 38,573 |
| Pharmaceuticals - 6.2% | | | |
| Pharmaceuticals - 6.2% | | | |
| Aclaris Therapeutics, Inc. (a) | | 790,699 | 17,616,774 |
| Adimab LLC (a)(d)(e)(g) | | 1,954,526 | 99,265,489 |
| Aerie Pharmaceuticals, Inc. (a)(b) | | 121,922 | 2,242,146 |
| Afferent Pharmaceuticals, Inc. rights 12/31/24 (a)(e) | | 8,274,568 | 13,487,546 |
| Antengene Corp. | | 2,066,800 | 4,288,175 |
| Aradigm Corp. (e) | | 11,945 | 549 |
| Aradigm Corp. (a)(e) | | 148,009 | 6,808 |
| Arvinas Holding Co. LLC (a) | | 1,285,223 | 100,632,961 |
| Atea Pharmaceuticals, Inc. | | 119,100 | 8,975,376 |
| Axsome Therapeutics, Inc. (a)(b) | | 187,409 | 12,623,870 |
| Chiasma, Inc. (a) | | 718,999 | 2,796,906 |
| Chiasma, Inc. warrants 12/16/24 (a) | | 382,683 | 177,136 |
| Corcept Therapeutics, Inc. (a)(b) | | 52,359 | 1,316,829 |
| Fulcrum Therapeutics, Inc. (a)(b) | | 210,767 | 2,657,772 |
| Graybug Vision, Inc. | | 678,136 | 13,616,971 |
| Harmony Biosciences Holdings, Inc. (a) | | 30,600 | 1,085,382 |
| Horizon Therapeutics PLC (a) | | 185,819 | 16,892,805 |
| IMARA, Inc. | | 575,991 | 7,251,727 |
| Intra-Cellular Therapies, Inc. (a) | | 1,255,076 | 44,467,343 |
| Kala Pharmaceuticals, Inc. (a)(b) | | 190,200 | 1,409,382 |
| Kaleido Biosciences, Inc. (a) | | 249,460 | 2,227,678 |
| Marinus Pharmaceuticals, Inc. (a)(b) | | 474,765 | 7,173,699 |
| Nektar Therapeutics (a) | | 776,551 | 17,619,942 |
| Ocular Therapeutix, Inc. (a)(b) | | 184,853 | 3,390,204 |
| OptiNose, Inc. (a) | | 229,115 | 888,966 |
| Pharvaris BV (b) | | 496,353 | 18,856,450 |
| Pliant Therapeutics, Inc. | | 971,031 | 32,131,416 |
| Reata Pharmaceuticals, Inc. (a)(b) | | 63,232 | 7,730,744 |
| Revance Therapeutics, Inc. (a) | | 169,800 | 4,458,948 |
| Royalty Pharma PLC (a)(d)(e) | | 3,976 | 0 |
| Royalty Pharma PLC (c) | | 509,820 | 23,742,317 |
| Stemcentrx, Inc. rights 12/31/21 (a)(e) | | 876,163 | 9 |
| Terns Pharmaceuticals, Inc. | | 862,409 | 19,533,564 |
| Theravance Biopharma, Inc. (a) | | 371,300 | 6,152,441 |
| Trevi Therapeutics, Inc. (a)(b) | | 576,500 | 1,625,730 |
| UCB SA | | 489,127 | 48,652,475 |
| Verrica Pharmaceuticals, Inc. (a)(b) | | 136,949 | 1,877,571 |
| WAVE Life Sciences (a)(b) | | 137,100 | 1,290,111 |
| | | | 548,164,212 |
| TOTAL COMMON STOCKS | | | |
| (Cost $5,490,531,779) | | | 8,675,248,857 |
|
| Convertible Preferred Stocks - 1.6% | | | |
| Biotechnology - 1.3% | | | |
| Biotechnology - 1.3% | | | |
| 23andMe, Inc.: | | | |
| Series E (a)(d) | | 1,340,332 | 30,811,217 |
| Series F1 (d) | | 57,637 | 1,324,945 |
| Adagio Theraputics, Inc. Series B (d)(e) | | 19,100 | 1,323,057 |
| Ambrx, Inc.: | | | |
| Series A (d)(e) | | 4,797,917 | 9,883,709 |
| Series B (d)(e) | | 4,318,126 | 8,895,340 |
| Century Therapeutics, Inc. Series C (d)(e) | | 1,931,406 | 12,499,996 |
| EQRx, Inc. Series B (d)(e) | | 1,823,553 | 6,054,196 |
| Instil Bio Series C (d) | | 1,192,729 | 21,469,122 |
| National Resilience, Inc. Series B (d)(e) | | 732,064 | 9,999,994 |
| Tenaya Therapeutics, Inc. Series C (d)(e) | | 7,239,382 | 15,000,000 |
| | | | 117,261,576 |
| Health Care Providers & Services - 0.2% | | | |
| Health Care Services - 0.2% | | | |
| Ikena Oncology, Inc. Series B (d)(e) | | 6,283,700 | 8,787,754 |
| Scorpion Therapeutics, Inc. Series B (d)(e) | | 3,099,905 | 7,500,000 |
| | | | 16,287,754 |
| Pharmaceuticals - 0.1% | | | |
| Pharmaceuticals - 0.1% | | | |
| Afferent Pharmaceuticals, Inc. Series C (a)(d)(e) | | 8,274,568 | 83 |
| Aristea Therapeutics, Inc. Series B (d)(e) | | 836,400 | 6,030,444 |
| Vera Therapeutics, Inc. Series C (d)(e) | | 8,448,800 | 6,505,576 |
| | | | 12,536,103 |
| TOTAL CONVERTIBLE PREFERRED STOCKS | | | |
| (Cost $114,994,893) | | | 146,085,433 |
|
| Money Market Funds - 6.3% | | | |
| Fidelity Cash Central Fund 0.07% (h) | | 49,630,332 | 49,640,258 |
| Fidelity Securities Lending Cash Central Fund 0.08% (h)(i) | | 509,240,052 | 509,290,976 |
| TOTAL MONEY MARKET FUNDS | | | |
| (Cost $558,893,876) | | | 558,931,234 |
| TOTAL INVESTMENT IN SECURITIES - 105.7% | | | |
| (Cost $6,164,420,548) | | | 9,380,265,524 |
| NET OTHER ASSETS (LIABILITIES) - (5.7)% | | | (506,641,428) |
| NET ASSETS - 100% | | | $8,873,624,096 |
Legend
(a) Non-income producing
(b) Security or a portion of the security is on loan at period end.
(c) Security exempt from registration under Rule 144A of the Securities Act of 1933. These securities may be resold in transactions exempt from registration, normally to qualified institutional buyers. At the end of the period, the value of these securities amounted to $56,218,053 or 0.6% of net assets.
(d) Restricted securities (including private placements) - Investment in securities not registered under the Securities Act of 1933 (excluding 144A issues). At the end of the period, the value of restricted securities (excluding 144A issues) amounted to $288,025,102 or 3.2% of net assets.
(e) Level 3 security
(f) Affiliated company
(g) Investment is owned by a wholly-owned subsidiary (Subsidiary) that is treated as a corporation for U.S. tax purposes.
(h) Affiliated fund that is generally available only to investment companies and other accounts managed by Fidelity Investments. The rate quoted is the annualized seven-day yield of the fund at period end. A complete unaudited listing of the fund's holdings as of its most recent quarter end is available upon request. In addition, each Fidelity Central Fund's financial statements, which are not covered by the Fund's Report of Independent Registered Public Accounting Firm, are available on the SEC's website or upon request.
(i) Investment made with cash collateral received from securities on loan.
Additional information on each restricted holding is as follows:
| Security | Acquisition Date | Acquisition Cost |
| 23andMe, Inc. Series E | 6/18/15 | $14,512,138 |
| 23andMe, Inc. Series F1 | 12/9/20 | $1,000,002 |
| Adagio Theraputics, Inc. Series B | 11/4/20 | $1,083,352 |
| Adimab LLC | 9/17/14 - 6/5/15 | $31,094,459 |
| Afferent Pharmaceuticals, Inc. Series C | 7/1/15 | $0 |
| Ambrx, Inc. Series A | 11/6/20 | $7,499,998 |
| Ambrx, Inc. Series B | 11/6/20 | $7,500,002 |
| Aristea Therapeutics, Inc. Series B | 10/6/20 | $4,611,659 |
| Century Therapeutics, Inc. Series C | 2/25/21 | $12,499,996 |
| Cerevel Therapeutics Holdings | 10/27/20 | $2,018,000 |
| Cyclerion Therapeutics, Inc. | 4/2/19 | $1,404,026 |
| EQRx, Inc. Series B | 11/19/20 | $5,000,000 |
| Gemini Therapeutics, Inc. | 2/5/21 | $10,000,000 |
| Ikena Oncology, Inc. Series B | 12/21/20 | $8,787,754 |
| Instil Bio Series C | 2/5/21 | $14,999,998 |
| National Resilience, Inc. Series B | 12/1/20 | $9,999,994 |
| Nuvation Bio, Inc. | 2/10/21 | $10,000,000 |
| Precipio, Inc. | 2/3/12 | $2,828,200 |
| Royalty Pharma PLC | 5/21/15 | $468,770 |
| Scorpion Therapeutics, Inc. Series B | 1/8/21 | $7,500,000 |
| Seer, Inc. Class A | 12/8/20 | $5,000,002 |
| Tenaya Therapeutics, Inc. Series C | 1/12/21 | $15,000,000 |
| Vera Therapeutics, Inc. Series C | 10/29/20 | $5,000,000 |
| Yumanity Therapeutics, Inc. | 12/22/20 | $3,999,999 |
Affiliated Central Funds
Information regarding fiscal year to date income earned by the Fund from investments in Fidelity Central Funds is as follows:
| Fund | Income earned |
| Fidelity Cash Central Fund | $120,191 |
| Fidelity Securities Lending Cash Central Fund | 4,387,871 |
| Total | $4,508,062 |
Amounts in the income column in the above table include any capital gain distributions from underlying funds, which are presented in the corresponding line-item in the Statement of Operations, if applicable. Amount for Fidelity Securities Lending Cash Central Fund represents the income earned on investing cash collateral, less rebates paid to borrowers and any lending agent fees associated with the loan, plus any premium payments received for lending certain types of securities.
The value, beginning of period, for the Fidelity Securities Lending Cash Central Fund was $618,432,642. Net realized gain (loss) and change in net unrealized appreciation (depreciation) on Fidelity Securities Lending Cash Central Fund is presented in the Statement of Operations, if applicable. Purchases and sales of the Fidelity Securities Lending Cash Central Fund were $2,696,837,410 and $2,805,992,758, respectively, during the period.
Other Affiliated Issuers
An affiliated company is a company in which the Fund has ownership of at least 5% of the voting securities. Fiscal year to date transactions with companies which are or were affiliates are as follows:
| Affiliate | Value, beginning of period | Purchases | Sales Proceeds | Dividend Income | Realized Gain (loss) | Change in Unrealized appreciation (depreciation) | Value, end of period |
| Acorda Therapeutics, Inc. | $3,751,237 | $-- | $2,055,586 | $-- | $(21,408,329) | $19,712,678 | $-- |
| Allena Pharmaceuticals, Inc. | 56,027 | 1,201,499 | 180,622 | -- | (355,806) | 704,617 | -- |
| Allena Pharmaceuticals, Inc. | 2,851,463 | -- | -- | -- | -- | (419,759) | -- |
| aTyr Pharma, Inc. | 1,510,141 | 255,158 | -- | -- | -- | 331,358 | -- |
| Crinetics Pharmaceuticals, Inc. | 20,388,606 | 15,729,716 | -- | -- | -- | (3,654,793) | 32,463,529 |
| Eledon Pharmaceuticals, Inc. | -- | 8,999,587 | -- | -- | -- | 7,136,477 | 16,136,064 |
| Geron Corp. | 15,417,418 | 2,730,000 | 20,256,110 | -- | 4,371,691 | 5,092,480 | -- |
| Hookipa Pharma, Inc. | 2,327,262 | 16,977,957 | 1,093,578 | -- | (663,464) | 2,212,783 | 19,760,960 |
| Krystal Biotech, Inc. | 61,375,887 | 19,002,999 | 7,717,011 | -- | 754,616 | 32,445,763 | 105,862,254 |
| Scholar Rock Holding Corp. | 21,573,442 | 557,701 | -- | -- | -- | 61,358,520 | -- |
| Viridian Therapeutics, Inc. | 2,887,327 | -- | 2,092,204 | -- | (16,920,269) | 16,125,146 | -- |
| X4 Pharmaceuticals, Inc. | 8,808,864 | -- | 4,789,484 | -- | (1,944,496) | (40,111) | -- |
| Total | $140,947,674 | $65,454,617 | $38,184,595 | $-- | $(36,166,057) | $141,005,159 | $174,222,807 |
Investment Valuation
The following is a summary of the inputs used, as of February 28, 2021, involving the Fund's assets and liabilities carried at fair value. The inputs or methodology used for valuing securities may not be an indication of the risk associated with investing in those securities. For more information on valuation inputs, and their aggregation into the levels used below, please refer to the Investment Valuation section in the accompanying Notes to Financial Statements.
| | Valuation Inputs at Reporting Date: |
| Description | Total | Level 1 | Level 2 | Level 3 |
| Investments in Securities: | | | | |
| Common Stocks | $8,675,248,857 | $8,384,275,827 | $178,206,838 | $112,766,192 |
| Convertible Preferred Stocks | 146,085,433 | -- | 53,605,284 | 92,480,149 |
| Money Market Funds | 558,931,234 | 558,931,234 | -- | -- |
| Total Investments in Securities: | $9,380,265,524 | $8,943,207,061 | $231,812,122 | $205,246,341 |
The following is a reconciliation of Investments in Securities for which Level 3 inputs were used in determining value:
| Investments in Securities: | |
| Common Stocks | |
| Beginning Balance | $114,638,031 |
| Total Realized Gain (Loss) | 14,178,094 |
| Total Unrealized Gain (Loss) | 4,787,540 |
| Cost of Purchases | -- |
| Proceeds of Sales | (20,853,644) |
| Amortization/Accretion | -- |
| Transfers in to Level 3 | 16,171 |
| Transfers out of Level 3 | -- |
| Ending Balance | $112,766,192 |
| The change in unrealized gain (loss) for the period attributable to Level 3 securities held at February 28, 2021 | $4,787,540 |
| Convertible Preferred Stocks | |
| Beginning Balance | $52,087,895 |
| Total Realized Gain (Loss) | -- |
| Total Unrealized Gain (Loss) | 7,997,310 |
| Cost of Purchases | 84,482,755 |
| Proceeds of Sales | -- |
| Amortization/Accretion | -- |
| Transfers in to Level 3 | -- |
| Transfers out of Level 3 | (52,087,811) |
| Ending Balance | $92,480,149 |
| The change in unrealized gain (loss) for the period attributable to Level 3 securities held at February 28, 2021 | $7,997,310 |
The information used in the above reconciliations represents fiscal year to date activity for any Investments in Securities identified as using Level 3 inputs at either the beginning or the end of the current fiscal period. Cost of purchases and proceeds of sales may include securities received and/or delivered through in-kind transactions. Transfers in or out of Level 3 represent the beginning value of any Security or Instrument where a change in the pricing level occurred from the beginning to the end of the period. The cost of purchases and the proceeds of sales may include securities received or delivered through corporate actions or exchanges. Realized and unrealized gains (losses) disclosed in the reconciliations are included in Net Gain (Loss) on the Fund's Statement of Operations.
See accompanying notes which are an integral part of the financial statements.
Biotechnology Portfolio
Financial Statements
Statement of Assets and Liabilities
| | | February 28, 2021 |
| Assets | | |
Investment in securities, at value (including securities loaned of $504,705,489) — See accompanying schedule:
Unaffiliated issuers (cost $5,502,050,605) | $8,647,111,483 | |
| Fidelity Central Funds (cost $558,893,876) | 558,931,234 | |
| Other affiliated issuers (cost $103,476,067) | 174,222,807 | |
| Total Investment in Securities (cost $6,164,420,548) | | $9,380,265,524 |
| Cash | | 329,193 |
| Receivable for investments sold | | 27,581,531 |
| Receivable for fund shares sold | | 15,775,766 |
| Dividends receivable | | 1,439,248 |
| Distributions receivable from Fidelity Central Funds | | 194,036 |
| Prepaid expenses | | 51,198 |
| Other receivables | | 1,183,337 |
| Total assets | | 9,426,819,833 |
| Liabilities | | |
| Payable for investments purchased | $30,573,179 | |
| Payable for fund shares redeemed | 7,071,698 | |
| Accrued management fee | 4,055,228 | |
| Other affiliated payables | 1,121,285 | |
| Other payables and accrued expenses | 1,244,439 | |
| Collateral on securities loaned | 509,129,908 | |
| Total liabilities | | 553,195,737 |
| Net Assets | | $8,873,624,096 |
| Net Assets consist of: | | |
| Paid in capital | | $5,111,725,171 |
| Total accumulated earnings (loss) | | 3,761,898,925 |
| Net Assets | | $8,873,624,096 |
| Net Asset Value, offering price and redemption price per share ($8,873,624,096 ÷ 347,691,337 shares) | | $25.52 |
See accompanying notes which are an integral part of the financial statements.
Statement of Operations
| | | Year ended February 28, 2021 |
| Investment Income | | |
| Dividends | | $46,624,818 |
| Income from Fidelity Central Funds (including $4,387,871 from security lending) | | 4,508,062 |
| Total income | | 51,132,880 |
| Expenses | | |
| Management fee | $40,666,479 | |
| Transfer agent fees | 11,286,651 | |
| Accounting fees | 1,190,724 | |
| Custodian fees and expenses | 116,117 | |
| Independent trustees' fees and expenses | 40,918 | |
| Registration fees | 115,936 | |
| Audit | 74,808 | |
| Legal | 10,322 | |
| Miscellaneous | 134,128 | |
| Total expenses before reductions | 53,636,083 | |
| Expense reductions | (533,422) | |
| Total expenses after reductions | | 53,102,661 |
| Net investment income (loss) | | (1,969,781) |
| Realized and Unrealized Gain (Loss) | | |
| Net realized gain (loss) on: | | |
| Investment securities: | | |
| Unaffiliated issuers | 1,912,376,973 | |
| Fidelity Central Funds | 17,111 | |
| Other affiliated issuers | (36,166,057) | |
| Foreign currency transactions | 120,624 | |
| Total net realized gain (loss) | | 1,876,348,651 |
| Change in net unrealized appreciation (depreciation) on: | | |
| Investment securities: | | |
| Unaffiliated issuers | 905,765,498 | |
| Fidelity Central Funds | (419) | |
| Other affiliated issuers | 141,005,159 | |
| Assets and liabilities in foreign currencies | 1,807 | |
| Total change in net unrealized appreciation (depreciation) | | 1,046,772,045 |
| Net gain (loss) | | 2,923,120,696 |
| Net increase (decrease) in net assets resulting from operations | | $2,921,150,915 |
See accompanying notes which are an integral part of the financial statements.
Statement of Changes in Net Assets
| | Year ended February 28, 2021 | Year ended February 29, 2020 |
| Increase (Decrease) in Net Assets | | |
| Operations | | |
| Net investment income (loss) | $(1,969,781) | $15,224,099 |
| Net realized gain (loss) | 1,876,348,651 | 756,206,173 |
| Change in net unrealized appreciation (depreciation) | 1,046,772,045 | (244,332,914) |
| Net increase (decrease) in net assets resulting from operations | 2,921,150,915 | 527,097,358 |
| Distributions to shareholders | (1,503,254,696) | (648,542,988) |
| Share transactions | | |
| Proceeds from sales of shares | 1,129,372,944 | 456,496,894 |
| Reinvestment of distributions | 1,417,160,740 | 610,226,532 |
| Cost of shares redeemed | (1,715,557,877) | (1,904,247,877) |
| Net increase (decrease) in net assets resulting from share transactions | 830,975,807 | (837,524,451) |
| Total increase (decrease) in net assets | 2,248,872,026 | (958,970,081) |
| Net Assets | | |
| Beginning of period | 6,624,752,070 | 7,583,722,151 |
| End of period | $8,873,624,096 | $6,624,752,070 |
| Other Information | | |
| Shares | | |
| Sold | 47,593,369 | 21,609,310 |
| Issued in reinvestment of distributions | 59,356,167 | 27,974,462 |
| Redeemed | (74,376,813) | (93,189,218) |
| Net increase (decrease) | 32,572,723 | (43,605,446) |
See accompanying notes which are an integral part of the financial statements.
Financial Highlights
Biotechnology Portfolio
| | | | | | |
| Years ended February 28, | 2021 | 2020 A | 2019 B | 2018 B | 2017 B |
| Selected Per–Share Data | | | | | |
| Net asset value, beginning of period | $21.02 | $21.14 | $23.45 | $20.32 | $16.20 |
| Income from Investment Operations | | | | | |
| Net investment income (loss)C | (.01) | .05 | (.04) | (.05) | (.08) |
| Net realized and unrealized gain (loss) | 9.41 | 1.79 | (.29)D | 3.49 | 4.80 |
| Total from investment operations | 9.40 | 1.84 | (.33) | 3.44 | 4.72 |
| Distributions from net investment income | (.07) | (.03) | – | – | – |
| Distributions from net realized gain | (4.84) | (1.93) | (1.98) | (.31) | (.60) |
| Total distributions | (4.90)E | (1.96) | (1.98) | (.31) | (.60) |
| Redemption fees added to paid in capitalC | – | – | – | – | –F |
| Net asset value, end of period | $25.52 | $21.02 | $21.14 | $23.45 | $20.32 |
| Total ReturnG | 47.35% | 8.57% | (.46)%D | 17.04% | 29.67% |
| Ratios to Average Net AssetsH,I | | | | | |
| Expenses before reductions | .70% | .72% | .72% | .74% | .75% |
| Expenses net of fee waivers, if any | .70% | .72% | .72% | .74% | .75% |
| Expenses net of all reductions | .69% | .72% | .72% | .73% | .74% |
| Net investment income (loss) | (.03)% | .22% | (.20)% | (.25)% | (.43)% |
| Supplemental Data | | | | | |
| Net assets, end of period (000 omitted) | $8,873,624 | $6,624,752 | $7,583,722 | $8,940,767 | $9,573,681 |
| Portfolio turnover rateJ | 78% | 50% | 37% | 26% | 28% |
A For the year ended February 29.
B Per share amounts have been adjusted to reflect the impact of the 10 for 1 share split that occurred on August 10, 2018.
C Calculated based on average shares outstanding during the period.
D Net realized and unrealized gain (loss) per share reflects proceeds received from litigation which amounted to $.01 per share. Excluding these litigation proceeds, the total return would have been (.53)%.
E Total distributions per share do not sum due to rounding.
F Amount represents less than .005%.
G Total returns would have been lower if certain expenses had not been reduced during the applicable periods shown.
H Fees and expenses of any underlying mutual funds or exchange-traded funds (ETFs) are not included in the Fund's expense ratio. The Fund indirectly bears its proportionate share of these expenses. For additional expense information related to investments in Fidelity Central Funds, please refer to the "Investments in Fidelity Central Funds" note found in the Notes to Financial Statements section of the most recent Annual or Semi-Annual report.
I Expense ratios reflect operating expenses of the class. Expenses before reductions do not reflect amounts reimbursed, waived, or reduced through arrangements with the investment advisor, brokerage services, or other offset arrangements, if applicable, and do not represent the amount paid by the class during periods when reimbursements, waivers or reductions occur.
J Amount does not include the portfolio activity of any underlying mutual funds or exchange-traded funds (ETFs).
See accompanying notes which are an integral part of the financial statements.
Health Care Portfolio
Performance: The Bottom Line
Average annual total return reflects the change in the value of an investment, assuming reinvestment of distributions from dividend income and capital gains (the profits earned upon the sale of securities that have grown in value, if any) and assuming a constant rate of performance each year. The hypothetical investment and the average annual total returns do not reflect the deduction of taxes that a shareholder would pay on fund distributions or the redemption of fund shares. During periods of reimbursement by Fidelity, a fund’s total return will be greater than it would be had the reimbursement not occurred. How a fund did yesterday is no guarantee of how it will do tomorrow.
Average Annual Total Returns
| For the periods ended February 28, 2021 | Past 1 year | Past 5 years | Past 10 years |
| Health Care Portfolio | 36.00% | 17.88% | 18.19% |
$10,000 Over 10 Years
Let's say hypothetically that $10,000 was invested in Health Care Portfolio on February 28, 2011.
The chart shows how the value of your investment would have changed, and also shows how the S&P 500® Index performed over the same period.
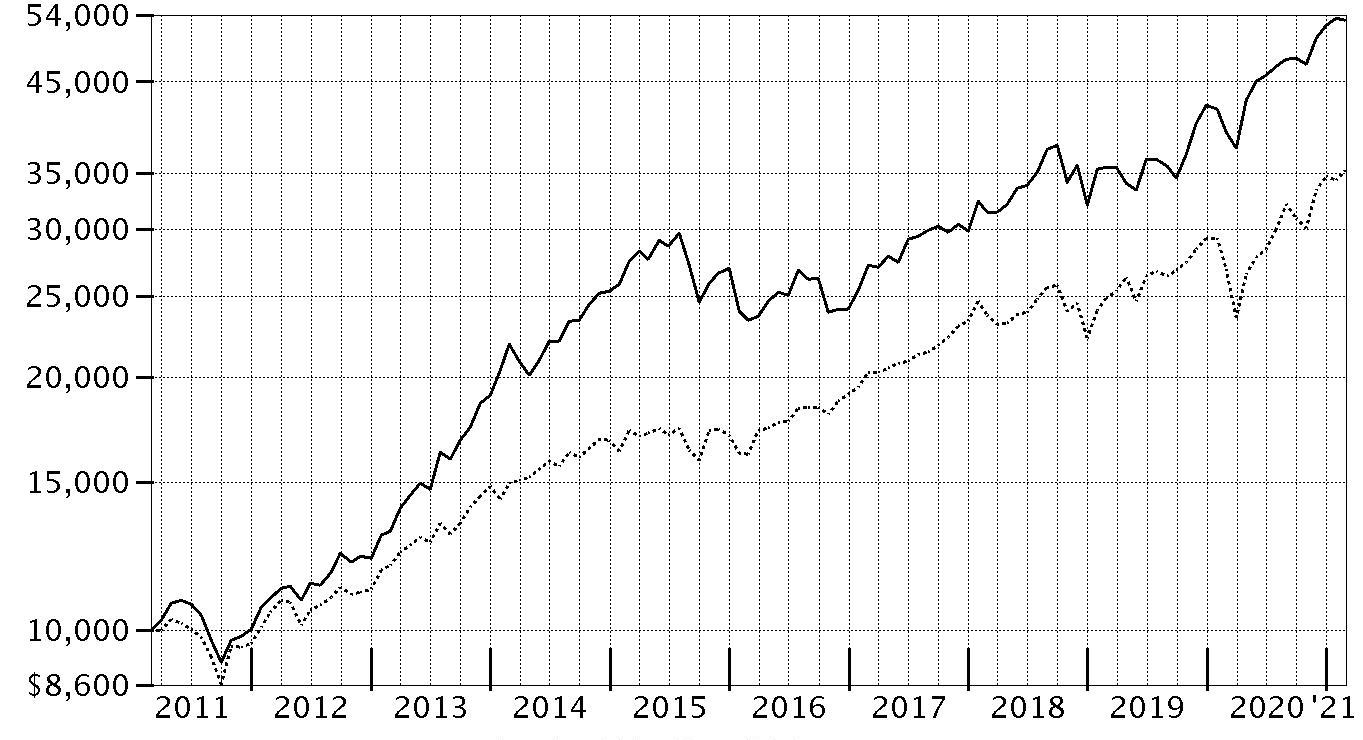
| Period Ending Values |
| $53,192 | Health Care Portfolio |
| $35,259 | S&P 500® Index |
Health Care Portfolio
Management's Discussion of Fund Performance
Market Recap: The S&P 500
® index gained 31.29% for the 12 months ending February 28, 2021, a volatile but productive period for U.S. risk assets. The early-2020 outbreak and spread of COVID-19 resulted in stocks suffering one of the quickest declines on record, through March 23, followed by a historic rebound that included the index closing 2020 at an all-time high and gaining modest ground in the first two months of the new year. The crisis and containment efforts caused broad contraction in economic activity, along with extreme uncertainty and dislocation in financial markets. A rapid and expansive U.S. monetary/fiscal-policy response partially offset the economic disruption and fueled the market surge, as did resilient corporate earnings. The rally slowed in September, when stocks began a two-month retreat amid Congress’s inability to reach a deal on additional fiscal stimulus, as well as concerns about election uncertainty, indications the U.S. economic recovery could be slowing and a new wave of COVID-19 cases. A shift in momentum began in October and accelerated following the U.S. elections, with the approval of three breakthrough COVID-19 vaccines and prospects for additional government stimulus fueling the “reflation trade” through February 28. By sector for the full 12 months, information technology (+50%) and consumer discretionary (+43%) led all gainers. Materials (+42%) and communication services (+37%) also stood out. In contrast, the defensive utilities (-3%) and real estate sectors (+5%) notably lagged.
Comments from Portfolio Manager Eddie Yoon: For the fiscal year ending February 28, 2021, the fund gained 36.00%, outperforming the 30.05% advance of the MSCI US IMI Health Care 25/50 Index, as well as the broad-based S&P 500
® index. Versus the sector index, security selection was the primary contributor, especially within the pharmaceuticals category. Security selection in health care services and biotechnology also bolstered the fund's relative result. Not owning Merck, an index component that returned -2%, was the biggest individual relative contributor. Also bolstering performance was our overweighting in 10x Genomics, which gained about 125%. Another notable relative contributor was our overweighting in MyoKardia (+253%), a position not held at period end. Conversely, the largest detractor from performance versus the sector index was an underweighting in life sciences tools & services. Also hampering the fund's relative performance was an underweighting in health care supplies and health care facilities. The biggest individual relative detractor was an overweight position in Regeneron Pharmaceuticals (+3%). Regeneron Pharmaceuticals was among the fund's largest holdings. The fund's non-index stake in Roche Holdings, one of the fund's biggest positions, gained approximately 4%. Also holding back performance was an underweighting in Thermo Fisher Scientific, which gained 55%. This was a position we established the past 12 months. The fund's foreign holdings detracted overall, despite the tailwind of broad U.S.-dollar weakness. Notable changes in positioning include a higher allocation to the health care services and life sciences tools & services industries.
The views expressed above reflect those of the portfolio manager(s) only through the end of the period as stated on the cover of this report and do not necessarily represent the views of Fidelity or any other person in the Fidelity organization. Any such views are subject to change at any time based upon market or other conditions and Fidelity disclaims any responsibility to update such views. These views may not be relied on as investment advice and, because investment decisions for a Fidelity fund are based on numerous factors, may not be relied on as an indication of trading intent on behalf of any Fidelity fund.
Health Care Portfolio
Investment Summary (Unaudited)
Top Ten Stocks as of February 28, 2021
| | % of fund's net assets |
| UnitedHealth Group, Inc. | 7.6 |
| Humana, Inc. | 5.5 |
| Cigna Corp. | 5.1 |
| Eli Lilly & Co. | 4.7 |
| Danaher Corp. | 4.7 |
| Boston Scientific Corp. | 4.6 |
| Regeneron Pharmaceuticals, Inc. | 3.4 |
| Roche Holding AG (participation certificate) | 3.2 |
| Penumbra, Inc. | 3.1 |
| Centene Corp. | 2.8 |
| | 44.7 |
Top Industries (% of fund's net assets)
| As of February 28, 2021 |
| | Health Care Providers & Services | 27.0% |
| | Biotechnology | 24.7% |
| | Health Care Equipment & Supplies | 21.7% |
| | Pharmaceuticals | 16.0% |
| | Life Sciences Tools & Services | 7.3% |
| | All Others* | 3.3% |

* Includes short-term investments and net other assets (liabilities).
Health Care Portfolio
Schedule of Investments February 28, 2021
Showing Percentage of Net Assets
| Common Stocks - 99.3% | | | |
| | | Shares | Value |
| Biotechnology - 24.7% | | | |
| Biotechnology - 24.7% | | | |
| Acceleron Pharma, Inc. (a) | | 480,000 | $65,356,800 |
| ADC Therapeutics SA (a)(b) | | 975,275 | 25,932,562 |
| Agios Pharmaceuticals, Inc. (a) | | 600,000 | 28,464,000 |
| Alnylam Pharmaceuticals, Inc. (a) | | 924,000 | 136,844,400 |
| Arcutis Biotherapeutics, Inc. (a) | | 634,500 | 21,680,865 |
| Argenx SE ADR (a) | | 690,000 | 228,169,200 |
| Ascendis Pharma A/S sponsored ADR (a) | | 916,602 | 142,045,812 |
| Avid Bioservices, Inc. (a) | | 1,200,000 | 24,696,000 |
| BeiGene Ltd. ADR (a) | | 150,000 | 48,000,000 |
| BioAtla, Inc. | | 201,306 | 10,689,349 |
| Black Diamond Therapeutics, Inc. (a) | | 300,000 | 8,400,000 |
| Blueprint Medicines Corp. (a) | | 400,000 | 39,288,000 |
| Denali Therapeutics, Inc. (a) | | 500,000 | 35,900,000 |
| Exelixis, Inc. (a) | | 1,800,000 | 38,988,000 |
| Fate Therapeutics, Inc. (a) | | 800,000 | 71,776,000 |
| Forma Therapeutics Holdings, Inc. | | 700,000 | 27,027,000 |
| Fusion Pharmaceuticals, Inc. (a) | | 170,800 | 1,994,944 |
| Generation Bio Co. | | 365,359 | 12,758,336 |
| Innovent Biologics, Inc. (a)(c) | | 6,600,000 | 67,987,288 |
| Insmed, Inc. (a) | | 1,143,725 | 40,911,043 |
| Keros Therapeutics, Inc. | | 280,000 | 18,331,600 |
| Kinnate Biopharma, Inc. | | 228,000 | 7,622,040 |
| Kura Oncology, Inc. (a) | | 1,400,000 | 39,200,000 |
| Kymera Therapeutics, Inc. (a) | | 420,000 | 20,151,600 |
| Mirati Therapeutics, Inc. (a) | | 380,000 | 76,349,600 |
| Morphic Holding, Inc. (a) | | 260,225 | 9,409,736 |
| Neurocrine Biosciences, Inc. (a) | | 800,000 | 87,608,000 |
| Novavax, Inc. (a) | | 375,000 | 86,711,250 |
| ORIC Pharmaceuticals, Inc. (a) | | 710,235 | 23,011,614 |
| Passage Bio, Inc. | | 609,600 | 10,984,992 |
| Poseida Therapeutics, Inc. (c) | | 1,415,125 | 15,622,980 |
| Poseida Therapeutics, Inc. (a) | | 219,578 | 2,424,141 |
| Prelude Therapeutics, Inc. | | 600,000 | 37,398,000 |
| PTC Therapeutics, Inc. (a) | | 553,020 | 31,577,442 |
| Regeneron Pharmaceuticals, Inc. (a) | | 785,000 | 353,697,450 |
| Relay Therapeutics, Inc. (a) | | 460,000 | 18,984,200 |
| Repare Therapeutics, Inc. | | 500,000 | 16,450,000 |
| Revolution Medicines, Inc. | | 1,280,000 | 58,470,400 |
| Sage Therapeutics, Inc. (a) | | 175,979 | 14,958,215 |
| Sarepta Therapeutics, Inc. (a) | | 700,000 | 60,942,000 |
| Scholar Rock Holding Corp.(a) | | 134,347 | 7,268,173 |
| Seer, Inc. | | 6,918 | 333,655 |
| Shattuck Labs, Inc. | | 150,200 | 6,203,260 |
| Shattuck Labs, Inc. | | 980,433 | 38,467,289 |
| Stoke Therapeutics, Inc. (a) | | 600,000 | 35,934,000 |
| Taysha Gene Therapies, Inc. | | 271,778 | 6,954,799 |
| TG Therapeutics, Inc. (a) | | 2,240,000 | 98,044,800 |
| Turning Point Therapeutics, Inc. (a) | | 540,000 | 63,671,400 |
| uniQure B.V. (a) | | 506,342 | 18,582,751 |
| Vaxcyte, Inc. | | 632,790 | 14,908,532 |
| Vertex Pharmaceuticals, Inc. (a) | | 260,000 | 55,263,000 |
| Xencor, Inc. (a) | | 1,280,000 | 63,065,600 |
| Zentalis Pharmaceuticals, Inc. (b) | | 1,128,000 | 47,421,120 |
| Zymeworks, Inc. (a) | | 867,545 | 31,500,559 |
| | | | 2,554,433,797 |
| Capital Markets - 0.0% | | | |
| Investment Banking & Brokerage - 0.0% | | | |
| Vesper Healthcare Acquisition Corp. Class A (a) | | 600,000 | 6,624,000 |
| Diversified Financial Services - 0.1% | | | |
| Other Diversified Financial Services - 0.1% | | | |
| Jaws Acquisition Corp. (a) | | 600,000 | 8,592,000 |
| Health Care Equipment & Supplies - 21.7% | | | |
| Health Care Equipment - 21.7% | | | |
| Becton, Dickinson & Co. | | 200,000 | 48,230,000 |
| Boston Scientific Corp. (a) | | 12,180,000 | 472,340,400 |
| Danaher Corp. | | 2,200,000 | 483,274,000 |
| DexCom, Inc. (a) | | 100,000 | 39,778,000 |
| Envista Holdings Corp. (a) | | 1,500,000 | 57,810,000 |
| Genmark Diagnostics, Inc. (a) | | 2,000,000 | 39,100,000 |
| Hologic, Inc. (a) | | 2,800,000 | 201,852,000 |
| Insulet Corp. (a) | | 1,000,000 | 259,100,000 |
| Intuitive Surgical, Inc. (a) | | 100,000 | 73,680,000 |
| Masimo Corp. (a) | | 400,000 | 100,292,000 |
| Outset Medical, Inc. | | 21,700 | 1,080,443 |
| Outset Medical, Inc. | | 1,451,090 | 68,637,283 |
| Penumbra, Inc. (a)(b) | | 1,148,419 | 326,644,816 |
| Tandem Diabetes Care, Inc. (a) | | 750,000 | 71,992,500 |
| | | | 2,243,811,442 |
| Health Care Providers & Services - 26.9% | | | |
| Health Care Facilities - 1.9% | | | |
| HCA Holdings, Inc. | | 700,000 | 120,421,000 |
| Rede D'Oregon Sao Luiz SA (c) | | 5,000,000 | 61,650,191 |
| Surgery Partners, Inc. (a) | | 400,000 | 15,788,000 |
| | | | 197,859,191 |
| Health Care Services - 8.7% | | | |
| 1Life Healthcare, Inc. (a) | | 1,400,000 | 66,514,000 |
| Alignment Healthcare Partners unit (d)(e) | | 2,145,460 | 40,167,302 |
| Cigna Corp. | | 2,500,000 | 524,750,000 |
| Guardant Health, Inc. (a) | | 600,000 | 88,308,000 |
| Oak Street Health, Inc. (a) | | 2,750,000 | 145,832,500 |
| Option Care Health, Inc. (a) | | 1,600,000 | 30,704,000 |
| | | | 896,275,802 |
| Managed Health Care - 16.3% | | | |
| Anthem, Inc. | | 120,000 | 36,382,800 |
| Centene Corp. (a) | | 5,000,000 | 292,700,000 |
| Humana, Inc. | | 1,500,000 | 569,475,000 |
| UnitedHealth Group, Inc. | | 2,375,000 | 789,022,501 |
| | | | 1,687,580,301 |
|
| TOTAL HEALTH CARE PROVIDERS & SERVICES | | | 2,781,715,294 |
|
| Health Care Technology - 1.9% | | | |
| Health Care Technology - 1.9% | | | |
| Castlight Health, Inc. (a) | | 1,845,550 | 3,137,435 |
| Castlight Health, Inc. Class B (a) | | 4,000,000 | 6,800,000 |
| Inspire Medical Systems, Inc. (a) | | 520,000 | 121,050,800 |
| Phreesia, Inc. (a) | | 700,000 | 42,875,000 |
| Veeva Systems, Inc. Class A (a) | | 70,000 | 19,607,700 |
| | | | 193,470,935 |
| Life Sciences Tools & Services - 7.3% | | | |
| Life Sciences Tools & Services - 7.3% | | | |
| 10X Genomics, Inc. (a) | | 20,000 | 3,559,800 |
| 10X Genomics, Inc. Class B (c) | | 1,180,000 | 210,028,200 |
| Bio-Rad Laboratories, Inc. Class A (a) | | 150,000 | 87,675,000 |
| Bruker Corp. | | 2,540,000 | 154,889,200 |
| Lonza Group AG | | 190,000 | 119,841,719 |
| Maravai LifeSciences Holdings, Inc. | | 1,000,000 | 32,520,000 |
| Seer, Inc. Class A (e) | | 443,082 | 21,369,845 |
| Thermo Fisher Scientific, Inc. | | 290,000 | 130,523,200 |
| | | | 760,406,964 |
| Pharmaceuticals - 15.9% | | | |
| Pharmaceuticals - 15.9% | | | |
| Arvinas Holding Co. LLC (a) | | 500,000 | 39,150,000 |
| AstraZeneca PLC (United Kingdom) | | 3,000,000 | 290,273,218 |
| Atea Pharmaceuticals, Inc. | | 260,000 | 19,593,600 |
| Bristol-Myers Squibb Co. | | 1,800,000 | 110,394,000 |
| Eli Lilly & Co. | | 2,400,000 | 491,736,000 |
| Harmony Biosciences Holdings, Inc. (c) | | 37,257 | 1,321,506 |
| Harmony Biosciences Holdings, Inc. (a) | | 1,665,738 | 59,083,727 |
| Nektar Therapeutics (a)(b) | | 2,000,000 | 45,380,000 |
| Pharvaris BV | | 99,723 | 3,788,477 |
| Pliant Therapeutics, Inc. | | 914,421 | 30,258,191 |
| Revance Therapeutics, Inc. (a) | | 700,000 | 18,382,000 |
| Roche Holding AG (participation certificate) | | 1,000,000 | 328,059,016 |
| Royalty Pharma PLC (c) | | 1,853,000 | 86,294,210 |
| Royalty Pharma PLC (a)(d)(e) | | 14,453 | 0 |
| Royalty Pharma PLC | | 800,000 | 37,256,000 |
| Theravance Biopharma, Inc. (a) | | 1,309,635 | 21,700,652 |
| UCB SA | | 650,000 | 64,654,188 |
| | | | 1,647,324,785 |
| Professional Services - 0.2% | | | |
| Research & Consulting Services - 0.2% | | | |
| Clarivate Analytics PLC (a) | | 900,000 | 20,475,000 |
| Software - 0.6% | | | |
| Application Software - 0.6% | | | |
| Nuance Communications, Inc. (a) | | 1,500,000 | 66,900,000 |
| TOTAL COMMON STOCKS | | | |
| (Cost $6,528,461,580) | | | 10,283,754,217 |
|
| Convertible Preferred Stocks - 0.2% | | | |
| Health Care Providers & Services - 0.1% | | | |
| Health Care Services - 0.1% | | | |
| dMed Biopharmaceutical Co. Ltd. (Class C) (d)(e) | | 380,451 | 7,087,802 |
| Pharmaceuticals - 0.1% | | | |
| Pharmaceuticals - 0.1% | | | |
| Aristea Therapeutics, Inc. Series B (d)(e) | | 1,037,400 | 7,479,654 |
| TOTAL CONVERTIBLE PREFERRED STOCKS | | | |
| (Cost $11,123,514) | | | 14,567,456 |
|
| Money Market Funds - 0.5% | | | |
| Fidelity Cash Central Fund 0.07% (f) | | 22,291,702 | 22,296,160 |
| Fidelity Securities Lending Cash Central Fund 0.08% (f)(g) | | 28,137,586 | 28,140,400 |
| TOTAL MONEY MARKET FUNDS | | | |
| (Cost $50,434,810) | | | 50,436,560 |
| TOTAL INVESTMENT IN SECURITIES - 100.0% | | | |
| (Cost $6,590,019,904) | | | 10,348,758,233 |
| NET OTHER ASSETS (LIABILITIES) - 0.0% | | | 4,318,384 |
| NET ASSETS - 100% | | | $10,353,076,617 |
Legend
(a) Non-income producing
(b) Security or a portion of the security is on loan at period end.
(c) Security exempt from registration under Rule 144A of the Securities Act of 1933. These securities may be resold in transactions exempt from registration, normally to qualified institutional buyers. At the end of the period, the value of these securities amounted to $442,904,375 or 4.3% of net assets.
(d) Level 3 security
(e) Restricted securities (including private placements) - Investment in securities not registered under the Securities Act of 1933 (excluding 144A issues). At the end of the period, the value of restricted securities (excluding 144A issues) amounted to $76,104,603 or 0.7% of net assets.
(f) Affiliated fund that is generally available only to investment companies and other accounts managed by Fidelity Investments. The rate quoted is the annualized seven-day yield of the fund at period end. A complete unaudited listing of the fund's holdings as of its most recent quarter end is available upon request. In addition, each Fidelity Central Fund's financial statements, which are not covered by the Fund's Report of Independent Registered Public Accounting Firm, are available on the SEC's website or upon request.
(g) Investment made with cash collateral received from securities on loan.
Additional information on each restricted holding is as follows:
| Security | Acquisition Date | Acquisition Cost |
| Alignment Healthcare Partners unit | 2/28/20 | $26,000,002 |
| Aristea Therapeutics, Inc. Series B | 10/6/20 | $5,719,912 |
| dMed Biopharmaceutical Co. Ltd. (Class C) | 12/1/20 | $5,403,602 |
| Royalty Pharma PLC | 5/21/15 | $1,704,009 |
| Seer, Inc. Class A | 12/8/20 | $8,418,558 |
Affiliated Central Funds
Information regarding fiscal year to date income earned by the Fund from investments in Fidelity Central Funds is as follows:
| Fund | Income earned |
| Fidelity Cash Central Fund | $136,736 |
| Fidelity Securities Lending Cash Central Fund | 613,154 |
| Total | $749,890 |
Amounts in the income column in the above table include any capital gain distributions from underlying funds, which are presented in the corresponding line-item in the Statement of Operations, if applicable. Amount for Fidelity Securities Lending Cash Central Fund represents the income earned on investing cash collateral, less rebates paid to borrowers and any lending agent fees associated with the loan, plus any premium payments received for lending certain types of securities.
Investment Valuation
The following is a summary of the inputs used, as of February 28, 2021, involving the Fund's assets and liabilities carried at fair value. The inputs or methodology used for valuing securities may not be an indication of the risk associated with investing in those securities. For more information on valuation inputs, and their aggregation into the levels used below, please refer to the Investment Valuation section in the accompanying Notes to Financial Statements.
| | Valuation Inputs at Reporting Date: |
| Description | Total | Level 1 | Level 2 | Level 3 |
| Investments in Securities: | | | | |
| Common Stocks | $10,283,754,217 | $9,688,581,608 | $555,005,307 | $40,167,302 |
| Convertible Preferred Stocks | 14,567,456 | -- | -- | 14,567,456 |
| Money Market Funds | 50,436,560 | 50,436,560 | -- | -- |
| Total Investments in Securities: | $10,348,758,233 | $9,739,018,168 | $555,005,307 | $54,734,758 |
| Net unrealized appreciation on unfunded commitments | $11,504,090 | $-- | $11,504,090 | $-- |
The following is a reconciliation of Investments in Securities for which Level 3 inputs were used in determining value:
| Investments in Securities: | |
| Beginning Balance | $147,746,771 |
| Total Realized Gain (Loss) | 48,578,778 |
| Total Unrealized Gain (Loss) | 1,461,899 |
| Cost of Purchases | 11,123,514 |
| Proceeds of Sales | (73,378,800) |
| Amortization/Accretion | -- |
| Transfers in to Level 3 | -- |
| Transfers out of Level 3 | (80,797,404) |
| Ending Balance | $54,734,758 |
| The change in unrealized gain (loss) for the period attributable to Level 3 securities held at February 28, 2021 | $1,461,899 |
The information used in the above reconciliation represents fiscal year to date activity for any Investments in Securities identified as using Level 3 inputs at either the beginning or the end of the current fiscal period. Cost of purchases and proceeds of sales may include securities received and/or delivered through in-kind transactions. Transfers in or out of Level 3 represent the beginning value of any Security or Instrument where a change in the pricing level occurred from the beginning to the end of the period. The cost of purchases and the proceeds of sales may include securities received or delivered through corporate actions or exchanges. Realized and unrealized gains (losses) disclosed in the reconciliation are included in Net Gain (Loss) on the Fund's Statement of Operations.
Other Information
Distribution of investments by country or territory of incorporation, as a percentage of Total Net Assets, is as follows (Unaudited):
| United States of America | 84.8% |
| Switzerland | 4.6% |
| United Kingdom | 3.6% |
| Netherlands | 2.4% |
| Denmark | 1.4% |
| Cayman Islands | 1.4% |
| Others (Individually Less Than 1%) | 1.8% |
| | 100.0% |
See accompanying notes which are an integral part of the financial statements.
Health Care Portfolio
Financial Statements
Statement of Assets and Liabilities
| | | February 28, 2021 |
| Assets | | |
Investment in securities, at value (including securities loaned of $27,100,556) — See accompanying schedule:
Unaffiliated issuers (cost $6,539,585,094) | $10,298,321,673 | |
| Fidelity Central Funds (cost $50,434,810) | 50,436,560 | |
| Total Investment in Securities (cost $6,590,019,904) | | $10,348,758,233 |
| Foreign currency held at value (cost $140) | | 140 |
| Receivable for investments sold | | 22,381,857 |
| Net unrealized appreciation on unfunded commitments | | 11,619,290 |
| Receivable for fund shares sold | | 5,048,056 |
| Dividends receivable | | 14,607,665 |
| Distributions receivable from Fidelity Central Funds | | 3,716 |
| Prepaid expenses | | 42,237 |
| Other receivables | | 751,404 |
| Total assets | | 10,403,212,598 |
| Liabilities | | |
| Payable for investments purchased | $8,964,131 | |
| Net unrealized depreciation on unfunded commitments | 115,200 | |
| Payable for fund shares redeemed | 6,079,142 | |
| Accrued management fee | 4,693,897 | |
| Other affiliated payables | 1,290,606 | |
| Other payables and accrued expenses | 874,430 | |
| Collateral on securities loaned | 28,118,575 | |
| Total liabilities | | 50,135,981 |
| Net Assets | | $10,353,076,617 |
| Net Assets consist of: | | |
| Paid in capital | | $6,287,735,681 |
| Total accumulated earnings (loss) | | 4,065,340,936 |
| Net Assets | | $10,353,076,617 |
| Net Asset Value, offering price and redemption price per share ($10,353,076,617 ÷ 321,735,063 shares) | | $32.18 |
See accompanying notes which are an integral part of the financial statements.
Statement of Operations
| | | Year ended February 28, 2021 |
| Investment Income | | |
| Dividends | | $60,763,425 |
| Income from Fidelity Central Funds (including $613,154 from security lending) | | 749,890 |
| Total income | | 61,513,315 |
| Expenses | | |
| Management fee | $48,402,050 | |
| Transfer agent fees | 12,923,384 | |
| Accounting fees | 1,250,592 | |
| Custodian fees and expenses | 186,487 | |
| Independent trustees' fees and expenses | 48,271 | |
| Registration fees | 267,148 | |
| Audit | 54,839 | |
| Legal | 15,941 | |
| Interest | 2,303 | |
| Miscellaneous | 132,070 | |
| Total expenses before reductions | 63,283,085 | |
| Expense reductions | (466,808) | |
| Total expenses after reductions | | 62,816,277 |
| Net investment income (loss) | | (1,302,962) |
| Realized and Unrealized Gain (Loss) | | |
| Net realized gain (loss) on: | | |
| Investment securities: | | |
| Unaffiliated issuers | 1,255,615,256 | |
| Fidelity Central Funds | 3,565 | |
| Foreign currency transactions | (1,225,107) | |
| Total net realized gain (loss) | | 1,254,393,714 |
| Change in net unrealized appreciation (depreciation) on: | | |
| Investment securities: | | |
| Unaffiliated issuers | 1,421,421,650 | |
| Fidelity Central Funds | (633) | |
| Unfunded commitments | 11,504,090 | |
| Assets and liabilities in foreign currencies | 406,331 | |
| Total change in net unrealized appreciation (depreciation) | | 1,433,331,438 |
| Net gain (loss) | | 2,687,725,152 |
| Net increase (decrease) in net assets resulting from operations | | $2,686,422,190 |
See accompanying notes which are an integral part of the financial statements.
Statement of Changes in Net Assets
| | Year ended February 28, 2021 | Year ended February 29, 2020 |
| Increase (Decrease) in Net Assets | | |
| Operations | | |
| Net investment income (loss) | $(1,302,962) | $11,611,040 |
| Net realized gain (loss) | 1,254,393,714 | 416,068,140 |
| Change in net unrealized appreciation (depreciation) | 1,433,331,438 | 215,998,550 |
| Net increase (decrease) in net assets resulting from operations | 2,686,422,190 | 643,677,730 |
| Distributions to shareholders | (1,043,319,929) | (104,508,735) |
| Share transactions | | |
| Proceeds from sales of shares | 2,530,824,884 | 845,022,583 |
| Reinvestment of distributions | 966,756,493 | 96,915,411 |
| Cost of shares redeemed | (2,007,793,854) | (1,711,627,255) |
| Net increase (decrease) in net assets resulting from share transactions | 1,489,787,523 | (769,689,261) |
| Total increase (decrease) in net assets | 3,132,889,784 | (230,520,266) |
| Net Assets | | |
| Beginning of period | 7,220,186,833 | 7,450,707,099 |
| End of period | $10,353,076,617 | $7,220,186,833 |
| Other Information | | |
| Shares | | |
| Sold | 84,148,004 | 32,388,556 |
| Issued in reinvestment of distributions | 31,895,088 | 3,395,775 |
| Redeemed | (66,461,246) | (67,969,335) |
| Net increase (decrease) | 49,581,846 | (32,185,004) |
See accompanying notes which are an integral part of the financial statements.
Financial Highlights
Health Care Portfolio
| | | | | | |
| Years ended February 28, | 2021 | 2020 A | 2019 B | 2018 B | 2017 B |
| Selected Per–Share Data | | | | | |
| Net asset value, beginning of period | $26.53 | $24.48 | $23.56 | $20.89 | $18.05 |
| Income from Investment Operations | | | | | |
| Net investment income (loss)C | –D | .04 | .02 | .05 | .02 |
| Net realized and unrealized gain (loss) | 9.23 | 2.40 | 2.90 | 3.17 | 2.93 |
| Total from investment operations | 9.23 | 2.44 | 2.92 | 3.22 | 2.95 |
| Distributions from net investment income | (.18) | (.03) | (.03) | (.04) | (.02) |
| Distributions from net realized gain | (3.40) | (.36) | (1.97) | (.51) | (.09) |
| Total distributions | (3.58) | (.39) | (2.00) | (.55) | (.11) |
| Redemption fees added to paid in capitalC | – | – | – | – | –D |
| Net asset value, end of period | $32.18 | $26.53 | $24.48 | $23.56 | $20.89 |
| Total ReturnE | 36.00% | 9.84% | 13.30% | 15.49% | 16.43% |
| Ratios to Average Net AssetsF,G | | | | | |
| Expenses before reductions | .69% | .70% | .71% | .73% | .74% |
| Expenses net of fee waivers, if any | .69% | .70% | .71% | .73% | .73% |
| Expenses net of all reductions | .69% | .70% | .71% | .72% | .73% |
| Net investment income (loss) | (.01)% | .16% | .10% | .23% | .12% |
| Supplemental Data | | | | | |
| Net assets, end of period (000 omitted) | $10,353,077 | $7,220,187 | $7,450,707 | $6,923,404 | $6,628,882 |
| Portfolio turnover rateH | 52% | 36%I | 60%I | 75% | 49%I |
A For the year ended February 29.
B Per share amounts have been adjusted to reflect the impact of the 10 for 1 share split that occurred on August 10, 2018.
C Calculated based on average shares outstanding during the period.
D Amount represents less than $.005 per share.
E Total returns would have been lower if certain expenses had not been reduced during the applicable periods shown.
F Fees and expenses of any underlying mutual funds or exchange-traded funds (ETFs) are not included in the Fund's expense ratio. The Fund indirectly bears its proportionate share of these expenses. For additional expense information related to investments in Fidelity Central Funds, please refer to the "Investments in Fidelity Central Funds" note found in the Notes to Financial Statements section of the most recent Annual or Semi-Annual report.
G Expense ratios reflect operating expenses of the class. Expenses before reductions do not reflect amounts reimbursed, waived, or reduced through arrangements with the investment advisor, brokerage services, or other offset arrangements, if applicable, and do not represent the amount paid by the class during periods when reimbursements, waivers or reductions occur.
H Amount does not include the portfolio activity of any underlying mutual funds or exchange-traded funds (ETFs).
I Portfolio turnover rate excludes securities received or delivered in-kind.
See accompanying notes which are an integral part of the financial statements.
Health Care Services Portfolio
Performance: The Bottom Line
Average annual total return reflects the change in the value of an investment, assuming reinvestment of distributions from dividend income and capital gains (the profits earned upon the sale of securities that have grown in value, if any) and assuming a constant rate of performance each year. The hypothetical investment and the average annual total returns do not reflect the deduction of taxes that a shareholder would pay on fund distributions or the redemption of fund shares. During periods of reimbursement by Fidelity, a fund’s total return will be greater than it would be had the reimbursement not occurred. How a fund did yesterday is no guarantee of how it will do tomorrow.
Average Annual Total Returns
| For the periods ended February 28, 2021 | Past 1 year | Past 5 years | Past 10 years |
| Health Care Services Portfolio | 29.43% | 16.16% | 14.45% |
$10,000 Over 10 Years
Let's say hypothetically that $10,000 was invested in Health Care Services Portfolio on February 28, 2011.
The chart shows how the value of your investment would have changed, and also shows how the S&P 500® Index performed over the same period.
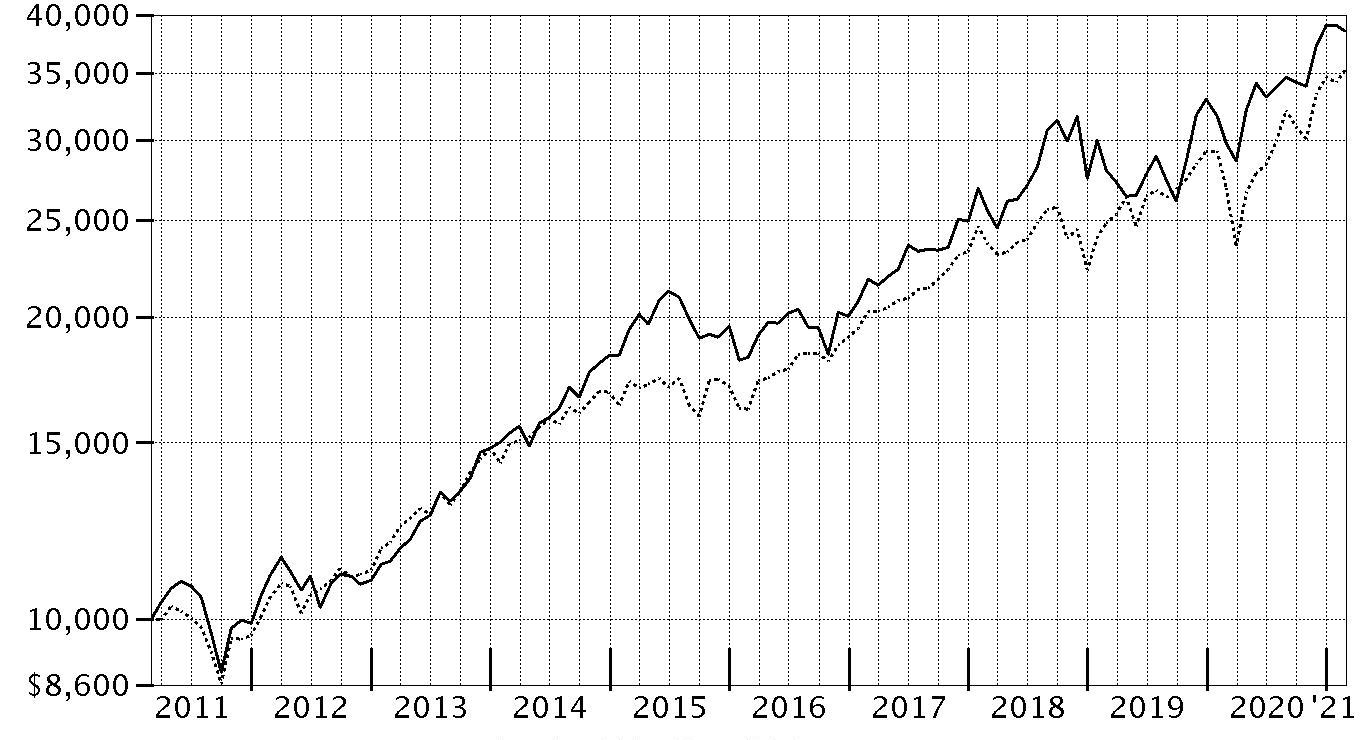
| Period Ending Values |
| $38,546 | Health Care Services Portfolio |
| $35,259 | S&P 500® Index |
Health Care Services Portfolio
Management's Discussion of Fund Performance
Market Recap: The S&P 500
® index gained 31.29% for the 12 months ending February 28, 2021, a volatile but productive period for U.S. risk assets. The early-2020 outbreak and spread of COVID-19 resulted in stocks suffering one of the quickest declines on record, through March 23, followed by a historic rebound that included the index closing 2020 at an all-time high and gaining modest ground in the first two months of the new year. The crisis and containment efforts caused broad contraction in economic activity, along with extreme uncertainty and dislocation in financial markets. A rapid and expansive U.S. monetary/fiscal-policy response partially offset the economic disruption and fueled the market surge, as did resilient corporate earnings. The rally slowed in September, when stocks began a two-month retreat amid Congress’s inability to reach a deal on additional fiscal stimulus, as well as concerns about election uncertainty, indications the U.S. economic recovery could be slowing and a new wave of COVID-19 cases. A shift in momentum began in October and accelerated following the U.S. elections, with the approval of three breakthrough COVID-19 vaccines and prospects for additional government stimulus fueling the “reflation trade” through February 28. By sector for the full 12 months, information technology (+50%) and consumer discretionary (+43%) led all gainers. Materials (+42%) and communication services (+37%) also stood out. In contrast, the defensive utilities (-3%) and real estate sectors (+5%) notably lagged.
Comments from Portfolio Manager Justin Segalini: For the fiscal year ending February 28, 2021, the fund gained 29.43%, underperforming the 30.44% gain of the MSCI US IMI Health Care Providers & Services 25/50 Index, as well as the broad-based S&P 500
® index. Versus the industry index, positioning among various industries was the primary detractor, especially an underweighting in the health care facilities group. We also had weak security selection in insurance brokers and managed health care. Our biggest individual detractor versus the industry index was an out-of-index stake in eHealth (-50%). We reduced the position this period. Also hurting performance was an underweighting in Covetrus, which gained approximately 234%. This was a position we established the past 12 months. Also hampering performance was our lighter-than-index stake in HealthEquity, which gained 16%. HealthEquity was not held at period end. Conversely, the biggest contributor to performance versus the industry index was our stock picks in health care facilities. Security selection in health care technology and health care services also helped the fund's relative result. The biggest individual relative contributor was an overweight position in 1Life Healthcare (+154%). Also bolstering performance was our overweighting in Surgery Partners, which gained 141%. The fund's non-index stake in Change Healthcare, a position not held at period end, gained 111%. Notable changes in positioning include increased exposure to the health care services subindustry.
The views expressed above reflect those of the portfolio manager(s) only through the end of the period as stated on the cover of this report and do not necessarily represent the views of Fidelity or any other person in the Fidelity organization. Any such views are subject to change at any time based upon market or other conditions and Fidelity disclaims any responsibility to update such views. These views may not be relied on as investment advice and, because investment decisions for a Fidelity fund are based on numerous factors, may not be relied on as an indication of trading intent on behalf of any Fidelity fund.
Health Care Services Portfolio
Investment Summary (Unaudited)
Top Ten Stocks as of February 28, 2021
| | % of fund's net assets |
| UnitedHealth Group, Inc. | 22.9 |
| Cigna Corp. | 11.2 |
| Humana, Inc. | 7.9 |
| Centene Corp. | 7.2 |
| AmerisourceBergen Corp. | 4.7 |
| HCA Holdings, Inc. | 3.8 |
| Molina Healthcare, Inc. | 3.7 |
| Amedisys, Inc. | 3.4 |
| LHC Group, Inc. | 3.1 |
| Anthem, Inc. | 3.1 |
| | 71.0 |
Top Industries (% of fund's net assets)
| As of February 28, 2021 |
| | Health Care Providers & Services | 93.2% |
| | Insurance | 3.5% |
| | Diversified Consumer Services | 1.1% |
| | Diversified Financial Services | 1.0% |
| | Health Care Technology | 0.5% |
| | All Others* | 0.7% |

* Includes short-term investments and net other assets (liabilities).
Health Care Services Portfolio
Schedule of Investments February 28, 2021
Showing Percentage of Net Assets
| Common Stocks - 99.3% | | | |
| | | Shares | Value |
| Diversified Consumer Services - 1.1% | | | |
| Specialized Consumer Services - 1.1% | | | |
| Service Corp. International | | 258,000 | $12,322,080 |
| Diversified Financial Services - 1.0% | | | |
| Other Diversified Financial Services - 1.0% | | | |
| Deerfield Healthcare Technology Acquisitions Corp. Class A (a) | | 102,280 | 1,297,933 |
| Jaws Acquisition Corp. (a)(b) | | 647,800 | 9,276,496 |
| | | | 10,574,429 |
| Health Care Providers & Services - 93.2% | | | |
| Health Care Distributors & Services - 5.7% | | | |
| AmerisourceBergen Corp. | | 515,600 | 52,189,032 |
| Covetrus, Inc. (a) | | 183,500 | 6,818,860 |
| McKesson Corp. | | 22,953 | 3,890,993 |
| | | | 62,898,885 |
| Health Care Facilities - 10.3% | | | |
| Brookdale Senior Living, Inc. (a) | | 2,379,900 | 13,851,018 |
| HCA Holdings, Inc. | | 244,700 | 42,095,741 |
| Rede D'Oregon Sao Luiz SA (c) | | 470,900 | 5,806,215 |
| Surgery Partners, Inc. (a) | | 723,400 | 28,552,598 |
| U.S. Physical Therapy, Inc. | | 200,600 | 23,518,344 |
| | | | 113,823,916 |
| Health Care Services - 32.4% | | | |
| 1Life Healthcare, Inc. (a) | | 535,136 | 25,424,311 |
| Alignment Healthcare Partners unit (d)(e) | | 181,539 | 3,398,773 |
| Amedisys, Inc. (a) | | 147,800 | 37,487,992 |
| Andlauer Healthcare Group, Inc. | | 184,939 | 5,885,612 |
| Chemed Corp. | | 72,900 | 32,455,809 |
| Cigna Corp. | | 589,572 | 123,751,163 |
| CVS Health Corp. | | 368,000 | 25,071,840 |
| Guardant Health, Inc. (a) | | 40,600 | 5,975,508 |
| LHC Group, Inc. (a) | | 188,196 | 34,197,095 |
| Oak Street Health, Inc. (a) | | 282,027 | 14,955,892 |
| Option Care Health, Inc. (a) | | 925,632 | 17,762,878 |
| Quest Diagnostics, Inc. | | 263,400 | 30,446,406 |
| Signify Health, Inc. | | 2,700 | 89,154 |
| | | | 356,902,433 |
| Managed Health Care - 44.8% | | | |
| Anthem, Inc. | | 111,802 | 33,897,248 |
| Centene Corp. (a) | | 1,348,250 | 78,926,555 |
| Humana, Inc. | | 228,900 | 86,901,885 |
| Molina Healthcare, Inc. (a) | | 187,700 | 40,685,852 |
| UnitedHealth Group, Inc. | | 759,150 | 252,204,811 |
| | | | 492,616,351 |
|
| TOTAL HEALTH CARE PROVIDERS & SERVICES | | | 1,026,241,585 |
|
| Health Care Technology - 0.5% | | | |
| Health Care Technology - 0.5% | | | |
| Phreesia, Inc. (a) | | 98,735 | 6,047,519 |
| Teladoc Health, Inc. (a) | | 129 | 28,521 |
| | | | 6,076,040 |
| Insurance - 3.5% | | | |
| Insurance Brokers - 3.5% | | | |
| eHealth, Inc. (a) | | 300 | 17,826 |
| GoHealth, Inc. (a)(b) | | 1,557,182 | 21,130,960 |
| Selectquote, Inc. (b) | | 571,500 | 17,430,750 |
| | | | 38,579,536 |
| TOTAL COMMON STOCKS | | | |
| (Cost $531,399,218) | | | 1,093,793,670 |
|
| Money Market Funds - 4.4% | | | |
| Fidelity Cash Central Fund 0.07% (f) | | 2,537,839 | 2,538,347 |
| Fidelity Securities Lending Cash Central Fund 0.08% (f)(g) | | 45,660,063 | 45,664,629 |
| TOTAL MONEY MARKET FUNDS | | | |
| (Cost $48,202,976) | | | 48,202,976 |
| TOTAL INVESTMENT IN SECURITIES - 103.7% | | | |
| (Cost $579,602,194) | | | 1,141,996,646 |
| NET OTHER ASSETS (LIABILITIES) - (3.7)% | | | (41,083,208) |
| NET ASSETS - 100% | | | $1,100,913,438 |
Legend
(a) Non-income producing
(b) Security or a portion of the security is on loan at period end.
(c) Security exempt from registration under Rule 144A of the Securities Act of 1933. These securities may be resold in transactions exempt from registration, normally to qualified institutional buyers. At the end of the period, the value of these securities amounted to $5,806,215 or 0.5% of net assets.
(d) Level 3 security
(e) Restricted securities (including private placements) - Investment in securities not registered under the Securities Act of 1933 (excluding 144A issues). At the end of the period, the value of restricted securities (excluding 144A issues) amounted to $3,398,773 or 0.3% of net assets.
(f) Affiliated fund that is generally available only to investment companies and other accounts managed by Fidelity Investments. The rate quoted is the annualized seven-day yield of the fund at period end. A complete unaudited listing of the fund's holdings as of its most recent quarter end is available upon request. In addition, each Fidelity Central Fund's financial statements, which are not covered by the Fund's Report of Independent Registered Public Accounting Firm, are available on the SEC's website or upon request.
(g) Investment made with cash collateral received from securities on loan.
Additional information on each restricted holding is as follows:
| Security | Acquisition Date | Acquisition Cost |
| Alignment Healthcare Partners unit | 2/28/20 | $2,200,001 |
Affiliated Central Funds
Information regarding fiscal year to date income earned by the Fund from investments in Fidelity Central Funds is as follows:
| Fund | Income earned |
| Fidelity Cash Central Fund | $16,552 |
| Fidelity Securities Lending Cash Central Fund | 104,687 |
| Total | $121,239 |
Amounts in the income column in the above table include any capital gain distributions from underlying funds, which are presented in the corresponding line-item in the Statement of Operations, if applicable. Amount for Fidelity Securities Lending Cash Central Fund represents the income earned on investing cash collateral, less rebates paid to borrowers and any lending agent fees associated with the loan, plus any premium payments received for lending certain types of securities.
Investment Valuation
The following is a summary of the inputs used, as of February 28, 2021, involving the Fund's assets and liabilities carried at fair value. The inputs or methodology used for valuing securities may not be an indication of the risk associated with investing in those securities. For more information on valuation inputs, and their aggregation into the levels used below, please refer to the Investment Valuation section in the accompanying Notes to Financial Statements.
| | Valuation Inputs at Reporting Date: |
| Description | Total | Level 1 | Level 2 | Level 3 |
| Investments in Securities: | | | | |
| Common Stocks | $1,093,793,670 | $1,090,394,897 | $-- | $3,398,773 |
| Money Market Funds | 48,202,976 | 48,202,976 | -- | -- |
| Total Investments in Securities: | $1,141,996,646 | $1,138,597,873 | $-- | $3,398,773 |
| Net unrealized appreciation on unfunded commitments | $2,759,299 | $-- | $2,759,299 | $-- |
See accompanying notes which are an integral part of the financial statements.
Health Care Services Portfolio
Financial Statements
Statement of Assets and Liabilities
| | | February 28, 2021 |
| Assets | | |
Investment in securities, at value (including securities loaned of $44,048,484) — See accompanying schedule:
Unaffiliated issuers (cost $531,399,218) | $1,093,793,670 | |
| Fidelity Central Funds (cost $48,202,976) | 48,202,976 | |
| Total Investment in Securities (cost $579,602,194) | | $1,141,996,646 |
| Receivable for investments sold | | 4,468,380 |
| Net unrealized appreciation on unfunded commitments | | 2,759,299 |
| Receivable for fund shares sold | | 1,463,729 |
| Dividends receivable | | 267,562 |
| Distributions receivable from Fidelity Central Funds | | 5,216 |
| Prepaid expenses | | 5,084 |
| Other receivables | | 87,301 |
| Total assets | | 1,151,053,217 |
| Liabilities | | |
| Payable for investments purchased | $3,356,524 | |
| Payable for fund shares redeemed | 335,522 | |
| Accrued management fee | 495,744 | |
| Other affiliated payables | 173,945 | |
| Other payables and accrued expenses | 116,844 | |
| Collateral on securities loaned | 45,661,200 | |
| Total liabilities | | 50,139,779 |
| Net Assets | | $1,100,913,438 |
| Net Assets consist of: | | |
| Paid in capital | | $521,858,639 |
| Total accumulated earnings (loss) | | 579,054,799 |
| Net Assets | | $1,100,913,438 |
| Net Asset Value, offering price and redemption price per share ($1,100,913,438 ÷ 9,065,483 shares) | | $121.44 |
See accompanying notes which are an integral part of the financial statements.
Statement of Operations
| | | Year ended February 28, 2021 |
| Investment Income | | |
| Dividends | | $8,233,267 |
| Income from Fidelity Central Funds (including $104,687 from security lending) | | 121,239 |
| Total income | | 8,354,506 |
| Expenses | | |
| Management fee | $5,649,968 | |
| Transfer agent fees | 1,704,051 | |
| Accounting fees | 350,197 | |
| Custodian fees and expenses | 8,051 | |
| Independent trustees' fees and expenses | 5,948 | |
| Registration fees | 35,064 | |
| Audit | 38,684 | |
| Legal | 6,230 | |
| Interest | 407 | |
| Miscellaneous | 21,642 | |
| Total expenses before reductions | 7,820,242 | |
| Expense reductions | (22,435) | |
| Total expenses after reductions | | 7,797,807 |
| Net investment income (loss) | | 556,699 |
| Realized and Unrealized Gain (Loss) | | |
| Net realized gain (loss) on: | | |
| Investment securities: | | |
| Unaffiliated issuers | 86,855,054 | |
| Fidelity Central Funds | (1,622) | |
| Foreign currency transactions | (62,851) | |
| Total net realized gain (loss) | | 86,790,581 |
| Change in net unrealized appreciation (depreciation) on: | | |
| Investment securities: | | |
| Unaffiliated issuers | 178,417,849 | |
| Unfunded commitments | 2,759,299 | |
| Assets and liabilities in foreign currencies | (320) | |
| Total change in net unrealized appreciation (depreciation) | | 181,176,828 |
| Net gain (loss) | | 267,967,409 |
| Net increase (decrease) in net assets resulting from operations | | $268,524,108 |
See accompanying notes which are an integral part of the financial statements.
Statement of Changes in Net Assets
| | Year ended February 28, 2021 | Year ended February 29, 2020 |
| Increase (Decrease) in Net Assets | | |
| Operations | | |
| Net investment income (loss) | $556,699 | $2,706,224 |
| Net realized gain (loss) | 86,790,581 | (27,521,941) |
| Change in net unrealized appreciation (depreciation) | 181,176,828 | 75,937,774 |
| Net increase (decrease) in net assets resulting from operations | 268,524,108 | 51,122,057 |
| Distributions to shareholders | (9,375,003) | (3,201,281) |
| Share transactions | | |
| Proceeds from sales of shares | 168,402,095 | 234,226,310 |
| Reinvestment of distributions | 8,736,753 | 3,008,611 |
| Cost of shares redeemed | (338,580,546) | (625,019,620) |
| Net increase (decrease) in net assets resulting from share transactions | (161,441,698) | (387,784,699) |
| Total increase (decrease) in net assets | 97,707,407 | (339,863,923) |
| Net Assets | | |
| Beginning of period | 1,003,206,031 | 1,343,069,954 |
| End of period | $1,100,913,438 | $1,003,206,031 |
| Other Information | | |
| Shares | | |
| Sold | 1,602,271 | 2,483,026 |
| Issued in reinvestment of distributions | 89,436 | 28,799 |
| Redeemed | (3,218,003) | (6,963,847) |
| Net increase (decrease) | (1,526,296) | (4,452,022) |
See accompanying notes which are an integral part of the financial statements.
Financial Highlights
Health Care Services Portfolio
| | | | | | |
| Years ended February 28, | 2021 | 2020 A | 2019 | 2018 | 2017 |
| Selected Per–Share Data | | | | | |
| Net asset value, beginning of period | $94.72 | $89.28 | $92.21 | $89.93 | $78.59 |
| Income from Investment Operations | | | | | |
| Net investment income (loss)B | .06 | .23 | .13 | .11 | .12 |
| Net realized and unrealized gain (loss) | 27.59 | 5.50 | 8.27 | 14.23 | 15.03 |
| Total from investment operations | 27.65 | 5.73 | 8.40 | 14.34 | 15.15 |
| Distributions from net investment income | (.93) | (.29) | (.10) | (.10) | (.13) |
| Distributions from net realized gain | – | – | (11.23) | (11.96) | (3.68) |
| Total distributions | (.93) | (.29) | (11.33) | (12.06) | (3.81) |
| Redemption fees added to paid in capitalB | – | – | – | –C | –C |
| Net asset value, end of period | $121.44 | $94.72 | $89.28 | $92.21 | $89.93 |
| Total ReturnD | 29.43% | 6.39% | 9.61% | 17.03% | 19.71% |
| Ratios to Average Net AssetsE,F | | | | | |
| Expenses before reductions | .73% | .75% | .76% | .77% | .78% |
| Expenses net of fee waivers, if any | .73% | .75% | .76% | .77% | .78% |
| Expenses net of all reductions | .73% | .75% | .76% | .76% | .78% |
| Net investment income (loss) | .05% | .25% | .14% | .12% | .15% |
| Supplemental Data | | | | | |
| Net assets, end of period (000 omitted) | $1,100,913 | $1,003,206 | $1,343,070 | $829,692 | $760,108 |
| Portfolio turnover rateG | 34% | 37% | 60% | 65% | 26% |
A For the year ended February 29.
B Calculated based on average shares outstanding during the period.
C Amount represents less than $.005 per share.
D Total returns would have been lower if certain expenses had not been reduced during the applicable periods shown.
E Fees and expenses of any underlying mutual funds or exchange-traded funds (ETFs) are not included in the Fund's expense ratio. The Fund indirectly bears its proportionate share of these expenses. For additional expense information related to investments in Fidelity Central Funds, please refer to the "Investments in Fidelity Central Funds" note found in the Notes to Financial Statements section of the most recent Annual or Semi-Annual report.
F Expense ratios reflect operating expenses of the class. Expenses before reductions do not reflect amounts reimbursed, waived, or reduced through arrangements with the investment advisor, brokerage services, or other offset arrangements, if applicable, and do not represent the amount paid by the class during periods when reimbursements, waivers or reductions occur.
G Amount does not include the portfolio activity of any underlying mutual funds or exchange-traded funds (ETFs).
See accompanying notes which are an integral part of the financial statements.
Medical Technology and Devices Portfolio
Performance: The Bottom Line
Average annual total return reflects the change in the value of an investment, assuming reinvestment of distributions from dividend income and capital gains (the profits earned upon the sale of securities that have grown in value, if any) and assuming a constant rate of performance each year. The hypothetical investment and the average annual total returns do not reflect the deduction of taxes that a shareholder would pay on fund distributions or the redemption of fund shares. During periods of reimbursement by Fidelity, a fund’s total return will be greater than it would be had the reimbursement not occurred. How a fund did yesterday is no guarantee of how it will do tomorrow.
Average Annual Total Returns
| For the periods ended February 28, 2021 | Past 1 year | Past 5 years | Past 10 years |
| Medical Technology and Devices Portfolio | 44.20% | 24.13% | 18.68% |
Prior to January 1, 2018, the fund was named Medical Equipment and Systems Portfolio, and the fund operated under certain different investment policies and compared its performance to a different index. The fund's historical performance may not represent its current investment policies.
$10,000 Over 10 Years
Let's say hypothetically that $10,000 was invested in Medical Technology and Devices Portfolio on February 28, 2011.
The chart shows how the value of your investment would have changed, and also shows how the S&P 500® Index performed over the same period.
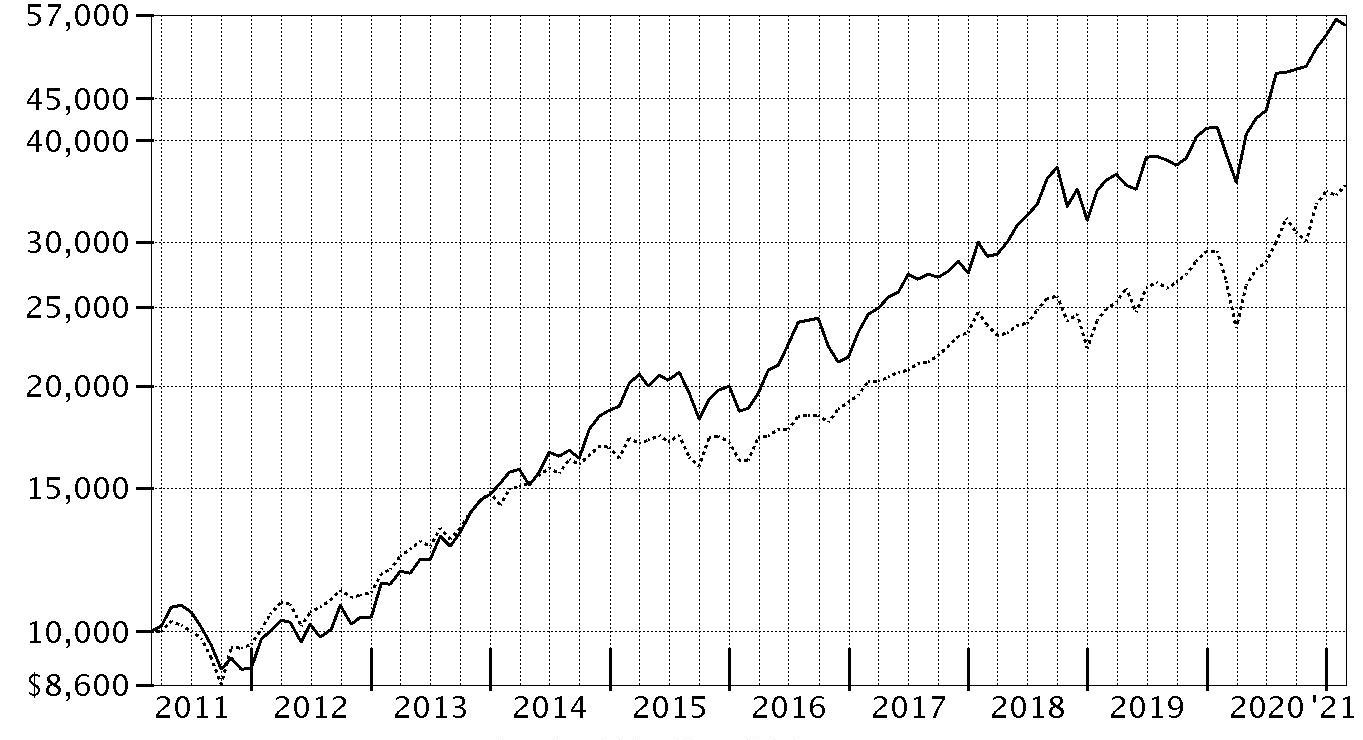
| Period Ending Values |
| $55,421 | Medical Technology and Devices Portfolio |
| $35,259 | S&P 500® Index |
Medical Technology and Devices Portfolio
Management's Discussion of Fund Performance
Market Recap: The S&P 500
® index gained 31.29% for the 12 months ending February 28, 2021, a volatile but productive period for U.S. risk assets. The early-2020 outbreak and spread of COVID-19 resulted in stocks suffering one of the quickest declines on record, through March 23, followed by a historic rebound that included the index closing 2020 at an all-time high and gaining modest ground in the first two months of the new year. The crisis and containment efforts caused broad contraction in economic activity, along with extreme uncertainty and dislocation in financial markets. A rapid and expansive U.S. monetary/fiscal-policy response partially offset the economic disruption and fueled the market surge, as did resilient corporate earnings. The rally slowed in September, when stocks began a two-month retreat amid Congress’s inability to reach a deal on additional fiscal stimulus, as well as concerns about election uncertainty, indications the U.S. economic recovery could be slowing and a new wave of COVID-19 cases. A shift in momentum began in October and accelerated following the U.S. elections, with the approval of three breakthrough COVID-19 vaccines and prospects for additional government stimulus fueling the “reflation trade” through February 28. By sector for the full 12 months, information technology (+50%) and consumer discretionary (+43%) led all gainers. Materials (+42%) and communication services (+37%) also stood out. In contrast, the defensive utilities (-3%) and real estate sectors (+5%) notably lagged.
Comments from Portfolio Manager Eddie Yoon: For the fiscal year ending February 28, 2021, the fund gained 44.20%, outperforming the 42.63% gain of the MSCI U.S. IMI Custom Health Care Technology and Equipment 25/50 Linked Index, as well as the broad-based S&P 500
® index. Versus the industry index, security selection was the primary contributor, especially within the biotechnology category. Security selection and an underweighting in health care equipment and stock picks in health care technology also bolstered the fund's relative result. The fund's top individual relative contributor was our lighter-than-index stake in Medtronic, which gained 19% the past 12 months. Medtronic was not held at period end. Also bolstering performance was our outsized stake in Inspire Medical Systems, which gained 181%. This was a stake we established the past year. Avoiding Baxter International, an index component that returned -6%, also aided relative performance. Conversely, the primary detractor from performance versus the industry index was our security selection in managed health care. An underweighting in life sciences tools & services and a non-index position in insurance brokers also hurt the fund's relative performance. The fund's biggest individual relative detractor was an outsized stake in Becton Dickinson, which gained 4% the past 12 months. We reduced our position in this company. Another notable relative detractor was an overweighting in Boston Scientific (+3%), which was among the fund's largest holdings. Another notable relative detractor was our lighter-than-index stake in Abbott Laboratories (+58%). The company was among the biggest holdings as of February 28. Notable changes in positioning include increased exposure to the life sciences tools & services subindustry and a lower allocation to health care equipment.
The views expressed above reflect those of the portfolio manager(s) only through the end of the period as stated on the cover of this report and do not necessarily represent the views of Fidelity or any other person in the Fidelity organization. Any such views are subject to change at any time based upon market or other conditions and Fidelity disclaims any responsibility to update such views. These views may not be relied on as investment advice and, because investment decisions for a Fidelity fund are based on numerous factors, may not be relied on as an indication of trading intent on behalf of any Fidelity fund.
Medical Technology and Devices Portfolio
Investment Summary (Unaudited)
Top Ten Stocks as of February 28, 2021
| | % of fund's net assets |
| Thermo Fisher Scientific, Inc. | 10.4 |
| Danaher Corp. | 10.1 |
| Boston Scientific Corp. | 7.1 |
| Penumbra, Inc. | 4.2 |
| Hologic, Inc. | 4.2 |
| Abbott Laboratories | 4.1 |
| Insulet Corp. | 3.7 |
| Humana, Inc. | 3.3 |
| DexCom, Inc. | 3.1 |
| Intuitive Surgical, Inc. | 2.9 |
| | 53.1 |
Top Industries (% of fund's net assets)
| As of February 28, 2021 |
| | Health Care Equipment & Supplies | 59.3% |
| | Life Sciences Tools & Services | 25.4% |
| | Health Care Providers & Services | 6.7% |
| | Health Care Technology | 4.0% |
| | Biotechnology | 2.7% |
| | All Others* | 1.9% |

* Includes short-term investments and net other assets (liabilities).
Medical Technology and Devices Portfolio
Schedule of Investments February 28, 2021
Showing Percentage of Net Assets
| Preferred Securities - 0.2% | | | |
| | | Shares | Value |
| Kardium, Inc. 0% (a)(b)(c) | | | |
| (Cost $19,551,861) | | 19,551,861 | 19,551,861 |
|
| Common Stocks - 98.4% | | | |
| Biotechnology - 2.2% | | | |
| Biotechnology - 2.2% | | | |
| Abcam PLC | | 2,280,000 | 53,873,372 |
| Avid Bioservices, Inc. (d) | | 1,690,000 | 34,780,200 |
| Burning Rock Biotech Ltd. ADR | | 600,000 | 21,594,000 |
| Natera, Inc. (d) | | 515,000 | 59,786,350 |
| Twist Bioscience Corp. (d) | | 140,000 | 19,269,600 |
| | | | 189,303,522 |
| Capital Markets - 0.1% | | | |
| Investment Banking & Brokerage - 0.1% | | | |
| Vesper Healthcare Acquisition Corp. Class A (d) | | 600,000 | 6,624,000 |
| Health Care Equipment & Supplies - 58.9% | | | |
| Health Care Equipment - 56.0% | | | |
| Abbott Laboratories | | 3,000,000 | 359,340,000 |
| Ambu A/S Series B | | 500,000 | 23,153,557 |
| Angiodynamics, Inc. (d) | | 775,800 | 16,253,010 |
| Atricure, Inc. (d) | | 600,000 | 39,162,000 |
| Axonics Modulation Technologies, Inc. (d)(e) | | 700,000 | 35,217,000 |
| Becton, Dickinson & Co. | | 630,000 | 151,924,500 |
| Boston Scientific Corp. (d) | | 15,850,000 | 614,663,000 |
| Danaher Corp. | | 4,000,000 | 878,680,000 |
| DexCom, Inc. (d) | | 684,000 | 272,081,520 |
| Envista Holdings Corp. (d) | | 2,600,000 | 100,204,000 |
| Fisher & Paykel Healthcare Corp. | | 1,850,000 | 39,098,987 |
| Genmark Diagnostics, Inc. (d) | | 3,054,201 | 59,709,630 |
| Hologic, Inc. (d) | | 5,000,000 | 360,450,000 |
| IDEXX Laboratories, Inc. (d) | | 50,000 | 26,008,500 |
| Insulet Corp. (d) | | 1,251,119 | 324,164,933 |
| Intersect ENT, Inc. (d)(f) | | 2,500,000 | 57,025,000 |
| Intuitive Surgical, Inc. (d) | | 340,000 | 250,512,000 |
| iRhythm Technologies, Inc. (d) | | 40,000 | 6,436,000 |
| Masimo Corp. (d) | | 640,000 | 160,467,200 |
| Nevro Corp. (d) | | 625,000 | 103,237,500 |
| Outset Medical, Inc. | | 17,194 | 856,089 |
| Outset Medical, Inc. | | 1,006,234 | 47,595,371 |
| Penumbra, Inc. (d)(e) | | 1,290,000 | 366,914,700 |
| ResMed, Inc. | | 1,000,000 | 192,780,000 |
| Shockwave Medical, Inc. (d)(e) | | 300,000 | 35,028,000 |
| Stryker Corp. | | 600,000 | 145,614,000 |
| Tandem Diabetes Care, Inc. (d) | | 1,500,000 | 143,985,000 |
| Venus MedTech Hangzhou, Inc. (H Shares) (d)(g) | | 900,000 | 7,971,430 |
| ViewRay, Inc. (d)(e)(f) | | 8,800,000 | 38,368,000 |
| | | | 4,856,900,927 |
| Health Care Supplies - 2.9% | | | |
| Align Technology, Inc. (d) | | 135,000 | 76,559,850 |
| Nanosonics Ltd. (d)(f) | | 21,800,000 | 101,147,280 |
| Pulmonx Corp. | | 180,000 | 10,229,400 |
| West Pharmaceutical Services, Inc. | | 228,000 | 63,988,200 |
| | | | 251,924,730 |
|
| TOTAL HEALTH CARE EQUIPMENT & SUPPLIES | | | 5,108,825,657 |
|
| Health Care Providers & Services - 6.5% | | | |
| Health Care Services - 3.2% | | | |
| Cigna Corp. | | 828,000 | 173,797,200 |
| Guardant Health, Inc. (d) | | 700,000 | 103,026,000 |
| | | | 276,823,200 |
| Managed Health Care - 3.3% | | | |
| Humana, Inc. | | 750,000 | 284,737,500 |
|
| TOTAL HEALTH CARE PROVIDERS & SERVICES | | | 561,560,700 |
|
| Health Care Technology - 3.9% | | | |
| Health Care Technology - 3.9% | | | |
| Castlight Health, Inc. (d) | | 983,300 | 1,671,610 |
| Castlight Health, Inc. Class B (d) | | 5,300,000 | 9,010,000 |
| Health Catalyst, Inc. (d) | | 1,000,600 | 48,519,094 |
| Inspire Medical Systems, Inc. (d) | | 640,000 | 148,985,600 |
| Phreesia, Inc. (d) | | 800,000 | 49,000,000 |
| Veeva Systems, Inc. Class A (d) | | 280,000 | 78,430,800 |
| | | | 335,617,104 |
| Life Sciences Tools & Services - 25.4% | | | |
| Life Sciences Tools & Services - 25.4% | | | |
| 10X Genomics, Inc. (d) | | 280,000 | 49,837,200 |
| 10X Genomics, Inc. Class B (g) | | 392,772 | 69,909,488 |
| Avantor, Inc. (d) | | 3,400,000 | 94,758,000 |
| Bio-Rad Laboratories, Inc. Class A (d) | | 220,000 | 128,590,000 |
| Bio-Techne Corp. | | 228,000 | 82,465,320 |
| Bruker Corp. | | 4,000,000 | 243,920,000 |
| Charles River Laboratories International, Inc. (d) | | 574,000 | 164,244,360 |
| Lonza Group AG | | 300,000 | 189,223,767 |
| Maravai LifeSciences Holdings, Inc. | | 1,400,000 | 45,528,000 |
| Nanostring Technologies, Inc. (d) | | 340,000 | 23,728,600 |
| Sartorius Stedim Biotech | | 280,000 | 122,295,907 |
| Seer, Inc. | | 1,557,632 | 67,612,132 |
| Sotera Health Co. | | 1,000,000 | 26,150,000 |
| Thermo Fisher Scientific, Inc. | | 2,000,000 | 900,159,999 |
| | | | 2,208,422,773 |
| Professional Services - 0.2% | | | |
| Research & Consulting Services - 0.2% | | | |
| Clarivate Analytics PLC (d) | | 900,000 | 20,475,000 |
| Software - 0.8% | | | |
| Application Software - 0.8% | | | |
| Nuance Communications, Inc. (d) | | 1,600,000 | 71,360,000 |
| Textiles, Apparel & Luxury Goods - 0.4% | | | |
| Apparel, Accessories & Luxury Goods - 0.4% | | | |
| Essilor International SA | | 200,000 | 32,626,650 |
| TOTAL COMMON STOCKS | | | |
| (Cost $4,944,144,870) | | | 8,534,815,406 |
|
| Convertible Preferred Stocks - 1.2% | | | |
| Biotechnology - 0.5% | | | |
| Biotechnology - 0.5% | | | |
| Element Biosciences, Inc. Series B (a)(c)(d) | | 2,385,223 | 17,936,877 |
| Inscripta, Inc. Series D (a)(c) | | 3,938,731 | 20,993,436 |
| | | | 38,930,313 |
| Health Care Equipment & Supplies - 0.2% | | | |
| Health Care Supplies - 0.2% | | | |
| Kardium, Inc. Series D6 (a)(c) | | 13,783,189 | 14,001,515 |
| Health Care Providers & Services - 0.2% | | | |
| Health Care Services - 0.2% | | | |
| Conformal Medical, Inc. Series C (a)(c) | | 2,605,625 | 11,386,581 |
| dMed Biopharmaceutical Co. Ltd. (Class C) (a)(c) | | 309,255 | 5,761,421 |
| | | | 17,148,002 |
| Health Care Technology - 0.1% | | | |
| Health Care Technology - 0.1% | | | |
| PrognomIQ, Inc.: | | | |
| Series A5 (a)(c) | | 833,333 | 2,783,332 |
| Series B (a)(c) | | 2,735,093 | 9,135,211 |
| | | | 11,918,543 |
| Textiles, Apparel & Luxury Goods - 0.2% | | | |
| Textiles - 0.2% | | | |
| Freenome, Inc. Series C (a)(c) | | 2,268,156 | 17,805,025 |
| TOTAL CONVERTIBLE PREFERRED STOCKS | | | |
| (Cost $80,202,235) | | | 99,803,398 |
|
| Money Market Funds - 4.1% | | | |
| Fidelity Cash Central Fund 0.07% (h) | | 29,302,286 | 29,308,147 |
| Fidelity Securities Lending Cash Central Fund 0.08% (h)(i) | | 325,585,624 | 325,618,183 |
| TOTAL MONEY MARKET FUNDS | | | |
| (Cost $354,926,330) | | | 354,926,330 |
| TOTAL INVESTMENT IN SECURITIES - 103.9% | | | |
| (Cost $5,398,825,296) | | | 9,009,096,995 |
| NET OTHER ASSETS (LIABILITIES) - (3.9)% | | | (335,797,686) |
| NET ASSETS - 100% | | | $8,673,299,309 |
Legend
(a) Level 3 security
(b) Security is perpetual in nature with no stated maturity date.
(c) Restricted securities (including private placements) - Investment in securities not registered under the Securities Act of 1933 (excluding 144A issues). At the end of the period, the value of restricted securities (excluding 144A issues) amounted to $119,355,259 or 1.4% of net assets.
(d) Non-income producing
(e) Security or a portion of the security is on loan at period end.
(f) Affiliated company
(g) Security exempt from registration under Rule 144A of the Securities Act of 1933. These securities may be resold in transactions exempt from registration, normally to qualified institutional buyers. At the end of the period, the value of these securities amounted to $77,880,918 or 0.9% of net assets.
(h) Affiliated fund that is generally available only to investment companies and other accounts managed by Fidelity Investments. The rate quoted is the annualized seven-day yield of the fund at period end. A complete unaudited listing of the fund's holdings as of its most recent quarter end is available upon request. In addition, each Fidelity Central Fund's financial statements, which are not covered by the Fund's Report of Independent Registered Public Accounting Firm, are available on the SEC's website or upon request.
(i) Investment made with cash collateral received from securities on loan.
Additional information on each restricted holding is as follows:
| Security | Acquisition Date | Acquisition Cost |
| Conformal Medical, Inc. Series C | 7/24/20 | $9,554,996 |
| dMed Biopharmaceutical Co. Ltd. (Class C) | 12/1/20 | $4,392,395 |
| Element Biosciences, Inc. Series B | 12/13/19 | $12,500,000 |
| Freenome, Inc. Series C | 8/14/20 | $14,999,996 |
| Inscripta, Inc. Series D | 11/13/20 | $18,000,001 |
| Kardium, Inc. Series D6 | 12/30/20 | $14,001,515 |
| Kardium, Inc. 0% | 12/30/20 | $19,551,861 |
| PrognomIQ, Inc. Series A5 | 8/20/20 | $503,333 |
| PrognomIQ, Inc. Series B | 9/11/20 | $6,249,999 |
Affiliated Central Funds
Information regarding fiscal year to date income earned by the Fund from investments in Fidelity Central Funds is as follows:
| Fund | Income earned |
| Fidelity Cash Central Fund | $136,948 |
| Fidelity Securities Lending Cash Central Fund | 204,003 |
| Total | $340,951 |
Amounts in the income column in the above table include any capital gain distributions from underlying funds, which are presented in the corresponding line-item in the Statement of Operations, if applicable. Amount for Fidelity Securities Lending Cash Central Fund represents the income earned on investing cash collateral, less rebates paid to borrowers and any lending agent fees associated with the loan, plus any premium payments received for lending certain types of securities.
Other Affiliated Issuers
An affiliated company is a company in which the Fund has ownership of at least 5% of the voting securities. Fiscal year to date transactions with companies which are or were affiliates are as follows:
| Affiliate | Value, beginning of period | Purchases | Sales Proceeds | Dividend Income | Realized Gain (loss) | Change in Unrealized appreciation (depreciation) | Value, end of period |
| Intersect ENT, Inc. | $14,316,000 | $31,980,414 | $5,065,157 | $-- | $4,538 | $15,789,205 | $57,025,000 |
| Nanosonics Ltd. | 92,968,430 | 6,353,555 | 5,398,930 | -- | 887,643 | 6,336,582 | 101,147,280 |
| ViewRay, Inc. | 16,646,000 | 8,487,095 | -- | -- | -- | 13,234,905 | 38,368,000 |
| Total | $123,930,430 | $46,821,064 | $10,464,087 | $-- | $892,181 | $35,360,692 | $196,540,280 |
Investment Valuation
The following is a summary of the inputs used, as of February 28, 2021, involving the Fund's assets and liabilities carried at fair value. The inputs or methodology used for valuing securities may not be an indication of the risk associated with investing in those securities. For more information on valuation inputs, and their aggregation into the levels used below, please refer to the Investment Valuation section in the accompanying Notes to Financial Statements.
| | Valuation Inputs at Reporting Date: |
| Description | Total | Level 1 | Level 2 | Level 3 |
| Investments in Securities: | | | | |
| Common Stocks | $8,534,815,406 | $8,197,757,486 | $337,057,920 | $-- |
| Convertible Preferred Stocks | 99,803,398 | -- | -- | 99,803,398 |
| Money Market Funds | 354,926,330 | 354,926,330 | -- | -- |
| Preferred Securities | 19,551,861 | -- | -- | 19,551,861 |
| Total Investments in Securities: | $9,009,096,995 | $8,552,683,816 | $337,057,920 | $119,355,259 |
| Net unrealized depreciation on unfunded commitments | $(192,000) | $-- | $(192,000) | $-- |
The following is a reconciliation of Investments in Securities for which Level 3 inputs were used in determining value:
| Investments in Securities: | |
| Convertible Preferred Stocks | |
| Beginning Balance | $26,711,731 |
| Total Realized Gain (Loss) | -- |
| Total Unrealized Gain (Loss) | 19,601,163 |
| Cost of Purchases | 67,702,235 |
| Proceeds of Sales | -- |
| Amortization/Accretion | -- |
| Transfers in to Level 3 | -- |
| Transfers out of Level 3 | (14,211,731) |
| Ending Balance | $99,803,398 |
| The change in unrealized gain (loss) for the period attributable to Level 3 securities held at February 28, 2021 | $19,601,163 |
| Other Investments in Securities | |
| Beginning Balance | $3,270,007 |
| Total Realized Gain (Loss) | -- |
| Total Unrealized Gain (Loss) | -- |
| Cost of Purchases | 19,551,861 |
| Proceeds of Sales | -- |
| Amortization/Accretion | -- |
| Transfers in to Level 3 | -- |
| Transfers out of Level 3 | (3,270,007) |
| Ending Balance | $19,551,861 |
| The change in unrealized gain (loss) for the period attributable to Level 3 securities held at February 28, 2021 | $-- |
The information used in the above reconciliations represents fiscal year to date activity for any Investments in Securities identified as using Level 3 inputs at either the beginning or the end of the current fiscal period. Cost of purchases and proceeds of sales may include securities received and/or delivered through in-kind transactions. Transfers in or out of Level 3 represent the beginning value of any Security or Instrument where a change in the pricing level occurred from the beginning to the end of the period. The cost of purchases and the proceeds of sales may include securities received or delivered through corporate actions or exchanges. Realized and unrealized gains (losses) disclosed in the reconciliations are included in Net Gain (Loss) on the Fund's Statement of Operations.
See accompanying notes which are an integral part of the financial statements.
Medical Technology and Devices Portfolio
Financial Statements
Statement of Assets and Liabilities
| | | February 28, 2021 |
| Assets | | |
Investment in securities, at value (including securities loaned of $318,289,719) — See accompanying schedule:
Unaffiliated issuers (cost $4,921,282,184) | $8,457,630,385 | |
| Fidelity Central Funds (cost $354,926,330) | 354,926,330 | |
| Other affiliated issuers (cost $122,616,782) | 196,540,280 | |
| Total Investment in Securities (cost $5,398,825,296) | | $9,009,096,995 |
| Receivable for investments sold | | 19,605,174 |
| Receivable for fund shares sold | | 9,953,763 |
| Dividends receivable | | 500,069 |
| Distributions receivable from Fidelity Central Funds | | 20,957 |
| Prepaid expenses | | 25,921 |
| Other receivables | | 262,679 |
| Total assets | | 9,039,465,558 |
| Liabilities | | |
| Payable for investments purchased | $27,299,035 | |
| Net unrealized depreciation on unfunded commitments | 192,000 | |
| Payable for fund shares redeemed | 7,707,010 | |
| Accrued management fee | 3,933,818 | |
| Other affiliated payables | 1,105,843 | |
| Other payables and accrued expenses | 318,925 | |
| Collateral on securities loaned | 325,609,618 | |
| Total liabilities | | 366,166,249 |
| Net Assets | | $8,673,299,309 |
| Net Assets consist of: | | |
| Paid in capital | | $4,652,415,194 |
| Total accumulated earnings (loss) | | 4,020,884,115 |
| Net Assets | | $8,673,299,309 |
| Net Asset Value, offering price and redemption price per share ($8,673,299,309 ÷ 115,663,163 shares) | | $74.99 |
See accompanying notes which are an integral part of the financial statements.
Statement of Operations
| | | Year ended February 28, 2021 |
| Investment Income | | |
| Dividends | | $23,632,748 |
| Income from Fidelity Central Funds (including $204,003 from security lending) | | 340,951 |
| Total income | | 23,973,699 |
| Expenses | | |
| Management fee | $38,159,179 | |
| Transfer agent fees | 10,599,725 | |
| Accounting fees | 1,171,349 | |
| Custodian fees and expenses | 88,778 | |
| Independent trustees' fees and expenses | 38,172 | |
| Registration fees | 153,885 | |
| Audit | 40,444 | |
| Legal | 11,696 | |
| Interest | 693 | |
| Miscellaneous | 113,497 | |
| Total expenses before reductions | 50,377,418 | |
| Expense reductions | (279,688) | |
| Total expenses after reductions | | 50,097,730 |
| Net investment income (loss) | | (26,124,031) |
| Realized and Unrealized Gain (Loss) | | |
| Net realized gain (loss) on: | | |
| Investment securities: | | |
| Unaffiliated issuers | 875,969,136 | |
| Fidelity Central Funds | (12,038) | |
| Other affiliated issuers | 892,181 | |
| Foreign currency transactions | (171,740) | |
| Total net realized gain (loss) | | 876,677,539 |
| Change in net unrealized appreciation (depreciation) on: | | |
| Investment securities: | | |
| Unaffiliated issuers | 1,625,859,248 | |
| Affiliated issuers | 35,360,692 | |
| Unfunded commitments | ( 192,000) | |
| Assets and liabilities in foreign currencies | 7,532 | |
| Total change in net unrealized appreciation (depreciation) | | 1,661,035,472 |
| Net gain (loss) | | 2,537,713,011 |
| Net increase (decrease) in net assets resulting from operations | | $2,511,588,980 |
See accompanying notes which are an integral part of the financial statements.
Statement of Changes in Net Assets
| | Year ended February 28, 2021 | Year ended February 29, 2020 |
| Increase (Decrease) in Net Assets | | |
| Operations | | |
| Net investment income (loss) | $(26,124,031) | $(9,728,901) |
| Net realized gain (loss) | 876,677,539 | 276,923,920 |
| Change in net unrealized appreciation (depreciation) | 1,661,035,472 | 196,604,918 |
| Net increase (decrease) in net assets resulting from operations | 2,511,588,980 | 463,799,937 |
| Distributions to shareholders | (514,309,620) | (118,431,567) |
| Share transactions | | |
| Proceeds from sales of shares | 1,910,160,299 | 705,581,911 |
| Reinvestment of distributions | 484,677,137 | 111,785,832 |
| Cost of shares redeemed | (1,777,583,064) | (1,891,615,421) |
| Net increase (decrease) in net assets resulting from share transactions | 617,254,372 | (1,074,247,678) |
| Total increase (decrease) in net assets | 2,614,533,732 | (728,879,308) |
| Net Assets | | |
| Beginning of period | 6,058,765,577 | 6,787,644,885 |
| End of period | $8,673,299,309 | $6,058,765,577 |
| Other Information | | |
| Shares | | |
| Sold | 27,985,720 | 12,747,720 |
| Issued in reinvestment of distributions | 7,325,256 | 1,859,380 |
| Redeemed | (28,081,786) | (34,440,758) |
| Net increase (decrease) | 7,229,190 | (19,833,658) |
See accompanying notes which are an integral part of the financial statements.
Financial Highlights
Medical Technology and Devices Portfolio
| | | | | | |
| Years ended February 28, | 2021 | 2020 A | 2019 | 2018 | 2017 |
| Selected Per–Share Data | | | | | |
| Net asset value, beginning of period | $55.88 | $52.92 | $46.09 | $41.48 | $33.75 |
| Income from Investment Operations | | | | | |
| Net investment income (loss)B | (.24) | (.08) | (.04) | .05 | .01 |
| Net realized and unrealized gain (loss) | 24.19 | 4.10 | 10.40 | 7.31 | 9.87 |
| Total from investment operations | 23.95 | 4.02 | 10.36 | 7.36 | 9.88 |
| Distributions from net investment income | – | – | – | (.08) | – |
| Distributions from net realized gain | (4.84) | (1.06) | (3.53) | (2.67) | (2.15) |
| Total distributions | (4.84) | (1.06) | (3.53) | (2.75) | (2.15) |
| Redemption fees added to paid in capitalB | – | – | – | – | –C |
| Net asset value, end of period | $74.99 | $55.88 | $52.92 | $46.09 | $41.48 |
| Total ReturnD | 44.20% | 7.46% | 23.85% | 18.01% | 30.13% |
| Ratios to Average Net AssetsE,F | | | | | |
| Expenses before reductions | .70% | .71% | .73% | .76% | .76% |
| Expenses net of fee waivers, if any | .70% | .71% | .73% | .76% | .76% |
| Expenses net of all reductions | .70% | .71% | .73% | .75% | .76% |
| Net investment income (loss) | (.36)% | (.15)% | (.07)% | .11% | .01% |
| Supplemental Data | | | | | |
| Net assets, end of period (000 omitted) | $8,673,299 | $6,058,766 | $6,787,645 | $4,063,926 | $3,134,376 |
| Portfolio turnover rateG | 58% | 35% | 43% | 77% | 55% |
A For the year ended February 29.
B Calculated based on average shares outstanding during the period.
C Amount represents less than $.005 per share.
D Total returns would have been lower if certain expenses had not been reduced during the applicable periods shown.
E Fees and expenses of any underlying mutual funds or exchange-traded funds (ETFs) are not included in the Fund's expense ratio. The Fund indirectly bears its proportionate share of these expenses. For additional expense information related to investments in Fidelity Central Funds, please refer to the "Investments in Fidelity Central Funds" note found in the Notes to Financial Statements section of the most recent Annual or Semi-Annual report.
F Expense ratios reflect operating expenses of the class. Expenses before reductions do not reflect amounts reimbursed, waived, or reduced through arrangements with the investment advisor, brokerage services, or other offset arrangements, if applicable, and do not represent the amount paid by the class during periods when reimbursements, waivers or reductions occur.
G Amount does not include the portfolio activity of any underlying mutual funds or exchange-traded funds (ETFs).
See accompanying notes which are an integral part of the financial statements.
Pharmaceuticals Portfolio
Performance: The Bottom Line
Average annual total return reflects the change in the value of an investment, assuming reinvestment of distributions from dividend income and capital gains (the profits earned upon the sale of securities that have grown in value, if any) and assuming a constant rate of performance each year. The hypothetical investment and the average annual total returns do not reflect the deduction of taxes that a shareholder would pay on fund distributions or the redemption of fund shares. During periods of reimbursement by Fidelity, a fund’s total return will be greater than it would be had the reimbursement not occurred. How a fund did yesterday is no guarantee of how it will do tomorrow.
Average Annual Total Returns
| For the periods ended February 28, 2021 | Past 1 year | Past 5 years | Past 10 years |
| Pharmaceuticals Portfolio | 20.46% | 10.36% | 13.18% |
$10,000 Over 10 Years
Let's say hypothetically that $10,000 was invested in Pharmaceuticals Portfolio on February 28, 2011.
The chart shows how the value of your investment would have changed, and also shows how the S&P 500® Index performed over the same period.

| Period Ending Values |
| $34,479 | Pharmaceuticals Portfolio |
| $35,259 | S&P 500® Index |
Pharmaceuticals Portfolio
Management's Discussion of Fund Performance
Market Recap: The S&P 500
® index gained 31.29% for the 12 months ending February 28, 2021, a volatile but productive period for U.S. risk assets. The early-2020 outbreak and spread of COVID-19 resulted in stocks suffering one of the quickest declines on record, through March 23, followed by a historic rebound that included the index closing 2020 at an all-time high and gaining modest ground in the first two months of the new year. The crisis and containment efforts caused broad contraction in economic activity, along with extreme uncertainty and dislocation in financial markets. A rapid and expansive U.S. monetary/fiscal-policy response partially offset the economic disruption and fueled the market surge, as did resilient corporate earnings. The rally slowed in September, when stocks began a two-month retreat amid Congress’s inability to reach a deal on additional fiscal stimulus, as well as concerns about election uncertainty, indications the U.S. economic recovery could be slowing and a new wave of COVID-19 cases. A shift in momentum began in October and accelerated following the U.S. elections, with the approval of three breakthrough COVID-19 vaccines and prospects for additional government stimulus fueling the “reflation trade” through February 28. By sector for the full 12 months, information technology (+50%) and consumer discretionary (+43%) led all gainers. Materials (+42%) and communication services (+37%) also stood out. In contrast, the defensive utilities (-3%) and real estate sectors (+5%) notably lagged.
Comments from Portfolio Manager Karim Suwwan de Felipe: For the fiscal year ending February 28, 2021, the fund gained 20.46%, outperforming the 19.37% gain of the MSCI North America IMI + ADR Custom Pharmaceuticals 25/50 Linked Index, but underperforming the broad-based S&P 500
® index. Versus the industry index, security selection was the primary contributor, especially within the biotechnology category. The biggest individual relative contributor was an overweight position in Eli Lilly (+65%). Eli Lilly was the fund's biggest holding at period end. The fund's non-index stake in Immunomedics, a position not held at period end, gained roughly 229%. Another notable relative contributor was our lighter-than-index stake in Merck (-2%). The company was among our largest holdings. In contrast, the largest detractor from performance versus the industry index was our stock picks in pharmaceuticals. The fund's biggest individual relative detractor was our lighter-than-index stake in MyoKardia, which gained 255% the past 12 months. MyoKardia was not held at period end. Another notable relative detractor was an out-of-index stake in Roche Holdings (+5%). This was among the fund's largest holdings. Another notable relative detractor was an overweighting in Sanofi (+2%), which was among our biggest holdings. The fund's foreign holdings detracted overall, despite the tailwind of broad U.S.-dollar weakness.
The views expressed above reflect those of the portfolio manager(s) only through the end of the period as stated on the cover of this report and do not necessarily represent the views of Fidelity or any other person in the Fidelity organization. Any such views are subject to change at any time based upon market or other conditions and Fidelity disclaims any responsibility to update such views. These views may not be relied on as investment advice and, because investment decisions for a Fidelity fund are based on numerous factors, may not be relied on as an indication of trading intent on behalf of any Fidelity fund.
Pharmaceuticals Portfolio
Investment Summary (Unaudited)
Top Ten Stocks as of February 28, 2021
| | % of fund's net assets |
| Eli Lilly & Co. | 10.3 |
| AstraZeneca PLC sponsored ADR | 9.8 |
| Bristol-Myers Squibb Co. | 9.1 |
| Sanofi SA sponsored ADR | 8.4 |
| Roche Holding AG (participation certificate) | 7.0 |
| Johnson & Johnson | 5.0 |
| Merck & Co., Inc. | 4.5 |
| Zoetis, Inc. Class A | 4.2 |
| Novartis AG sponsored ADR | 4.2 |
| Amgen, Inc. | 3.6 |
| | 66.1 |
Top Industries (% of fund's net assets)
| As of February 28, 2021 |
| | Pharmaceuticals | 79.1% |
| | Biotechnology | 16.1% |
| | Health Care Equipment & Supplies | 2.0% |
| | Life Sciences Tools & Services | 1.4% |
| | Diversified Financial Services | 0.2% |
| | All Others* | 1.2% |

* Includes short-term investments and net other assets (liabilities).
Pharmaceuticals Portfolio
Schedule of Investments February 28, 2021
Showing Percentage of Net Assets
| Common Stocks - 98.1% | | | |
| | | Shares | Value |
| Biotechnology - 15.6% | | | |
| Biotechnology - 15.6% | | | |
| Acceleron Pharma, Inc. (a) | | 68,800 | $9,367,808 |
| Amgen, Inc. | | 134,000 | 30,139,280 |
| Argenx SE (a) | | 17,400 | 5,787,448 |
| Argenx SE ADR (a) | | 11,000 | 3,637,480 |
| Ascendis Pharma A/S sponsored ADR (a) | | 51,300 | 7,949,961 |
| Athenex, Inc. (a) | | 166,800 | 2,018,280 |
| BioNTech SE ADR (a)(b) | | 50,148 | 5,467,636 |
| Blueprint Medicines Corp. (a) | | 80,300 | 7,887,066 |
| ChemoCentryx, Inc. (a) | | 7,000 | 474,880 |
| Galapagos Genomics NV sponsored ADR (a) | | 36,900 | 3,047,940 |
| Generation Bio Co. | | 30,411 | 1,061,952 |
| Innovent Biologics, Inc. (a)(c) | | 279,500 | 2,879,159 |
| Kalvista Pharmaceuticals, Inc. (a) | | 99,000 | 3,254,130 |
| Leap Therapeutics, Inc. warrants 1/31/26 (a) | | 606,000 | 684,756 |
| Mersana Therapeutics, Inc. (a) | | 142,000 | 2,581,560 |
| PTC Therapeutics, Inc. (a) | | 136,600 | 7,799,860 |
| Springworks Therapeutics, Inc. (a) | | 44,300 | 3,812,015 |
| TG Therapeutics, Inc. (a) | | 41,900 | 1,833,963 |
| Translate Bio, Inc. (a) | | 219,500 | 5,123,130 |
| uniQure B.V. (a) | | 132,113 | 4,848,547 |
| Vertex Pharmaceuticals, Inc. (a) | | 83,400 | 17,726,670 |
| Xencor, Inc. (a) | | 49,568 | 2,442,215 |
| | | | 129,825,736 |
| Health Care Equipment & Supplies - 2.0% | | | |
| Health Care Equipment - 2.0% | | | |
| Becton, Dickinson & Co. | | 46,700 | 11,261,705 |
| Boston Scientific Corp. (a) | | 149,600 | 5,801,488 |
| | | | 17,063,193 |
| Life Sciences Tools & Services - 1.4% | | | |
| Life Sciences Tools & Services - 1.4% | | | |
| Bruker Corp. | | 116,900 | 7,128,562 |
| Sartorius Stedim Biotech | | 9,400 | 4,105,648 |
| | | | 11,234,210 |
| Personal Products - 0.0% | | | |
| Personal Products - 0.0% | | | |
| MedAvail Holdings, Inc. (a) | | 3,333 | 46,295 |
| Pharmaceuticals - 79.1% | | | |
| Pharmaceuticals - 79.1% | | | |
| AstraZeneca PLC sponsored ADR (b) | | 1,691,100 | 81,815,418 |
| Atea Pharmaceuticals, Inc. | | 15,200 | 1,145,472 |
| Axsome Therapeutics, Inc. (a)(b) | | 43,400 | 2,923,424 |
| Bausch Health Cos., Inc. (Canada) (a) | | 501,700 | 15,789,003 |
| Bristol-Myers Squibb Co. | | 1,239,580 | 76,023,441 |
| Catalent, Inc. (a) | | 75,400 | 8,573,734 |
| Elanco Animal Health, Inc. (a) | | 172,400 | 5,665,064 |
| Eli Lilly & Co. | | 416,961 | 85,431,140 |
| GlaxoSmithKline PLC sponsored ADR | | 126,200 | 4,241,582 |
| Harmony Biosciences Holdings, Inc. (a) | | 128,014 | 4,540,657 |
| Harmony Biosciences Holdings, Inc. (c) | | 4,463 | 158,303 |
| Horizon Therapeutics PLC (a) | | 316,100 | 28,736,651 |
| Intra-Cellular Therapies, Inc. (a) | | 107,000 | 3,791,010 |
| Johnson & Johnson | | 264,050 | 41,841,363 |
| Merck & Co., Inc. | | 515,936 | 37,467,272 |
| Nektar Therapeutics (a)(b) | | 368,233 | 8,355,207 |
| Novartis AG sponsored ADR (b) | | 405,396 | 34,827,570 |
| Perrigo Co. PLC | | 118,100 | 4,766,516 |
| Reata Pharmaceuticals, Inc. (a)(b) | | 55,300 | 6,760,978 |
| Richter Gedeon PLC | | 157,700 | 4,498,128 |
| Roche Holding AG (participation certificate) | | 178,516 | 58,563,783 |
| Royalty Pharma PLC | | 283,500 | 13,202,595 |
| Sanofi SA sponsored ADR | | 1,524,322 | 69,951,137 |
| UCB SA | | 253,200 | 25,185,293 |
| Zoetis, Inc. Class A | | 225,200 | 34,960,048 |
| Zogenix, Inc. (a) | | 800 | 16,968 |
| | | | 659,231,757 |
| TOTAL COMMON STOCKS | | | |
| (Cost $568,905,175) | | | 817,401,191 |
|
| Convertible Preferred Stocks - 0.7% | | | |
| Biotechnology - 0.5% | | | |
| Biotechnology - 0.5% | | | |
| 23andMe, Inc. Series F1 (d) | | 172,911 | 3,974,835 |
| Diversified Financial Services - 0.2% | | | |
| Other Diversified Financial Services - 0.2% | | | |
| Paragon Biosciences Emalex Capital, Inc. Series C (d)(e) | | 158,879 | 1,700,005 |
| Pharmaceuticals - 0.0% | | | |
| Pharmaceuticals - 0.0% | | | |
| Castle Creek Pharmaceutical Holdings, Inc. Series C (a)(d)(e) | | 200 | 131,038 |
| TOTAL CONVERTIBLE PREFERRED STOCKS | | | |
| (Cost $4,782,381) | | | 5,805,878 |
|
| Money Market Funds - 13.4% | | | |
| Fidelity Cash Central Fund 0.07% (f) | | 2,504,691 | 2,505,192 |
| Fidelity Securities Lending Cash Central Fund 0.08% (f)(g) | | 109,391,594 | 109,402,533 |
| TOTAL MONEY MARKET FUNDS | | | |
| (Cost $111,907,725) | | | 111,907,725 |
| TOTAL INVESTMENT IN SECURITIES - 112.2% | | | |
| (Cost $685,595,281) | | | 935,114,794 |
| NET OTHER ASSETS (LIABILITIES) - (12.2)% | | | (101,735,110) |
| NET ASSETS - 100% | | | $833,379,684 |
Legend
(a) Non-income producing
(b) Security or a portion of the security is on loan at period end.
(c) Security exempt from registration under Rule 144A of the Securities Act of 1933. These securities may be resold in transactions exempt from registration, normally to qualified institutional buyers. At the end of the period, the value of these securities amounted to $3,037,462 or 0.4% of net assets.
(d) Restricted securities (including private placements) - Investment in securities not registered under the Securities Act of 1933 (excluding 144A issues). At the end of the period, the value of restricted securities (excluding 144A issues) amounted to $5,805,878 or 0.7% of net assets.
(e) Level 3 security
(f) Affiliated fund that is generally available only to investment companies and other accounts managed by Fidelity Investments. The rate quoted is the annualized seven-day yield of the fund at period end. A complete unaudited listing of the fund's holdings as of its most recent quarter end is available upon request. In addition, each Fidelity Central Fund's financial statements, which are not covered by the Fund's Report of Independent Registered Public Accounting Firm, are available on the SEC's website or upon request.
(g) Investment made with cash collateral received from securities on loan.
Additional information on each restricted holding is as follows:
| Security | Acquisition Date | Acquisition Cost |
| 23andMe, Inc. Series F1 | 12/9/20 | $3,000,006 |
| Castle Creek Pharmaceutical Holdings, Inc. Series C | 12/9/19 | $82,370 |
| Paragon Biosciences Emalex Capital, Inc. Series C | 2/26/21 | $1,700,005 |
Affiliated Central Funds
Information regarding fiscal year to date income earned by the Fund from investments in Fidelity Central Funds is as follows:
| Fund | Income earned |
| Fidelity Cash Central Fund | $20,992 |
| Fidelity Securities Lending Cash Central Fund | 108,070 |
| Total | $129,062 |
Amounts in the income column in the above table include any capital gain distributions from underlying funds, which are presented in the corresponding line-item in the Statement of Operations, if applicable. Amount for Fidelity Securities Lending Cash Central Fund represents the income earned on investing cash collateral, less rebates paid to borrowers and any lending agent fees associated with the loan, plus any premium payments received for lending certain types of securities.
The value, beginning of period, for the Fidelity Securities Lending Cash Central Fund was $32,218,667. Net realized gain (loss) and change in net unrealized appreciation (depreciation) on Fidelity Securities Lending Cash Central Fund is presented in the Statement of Operations, if applicable. Purchases and sales of the Fidelity Securities Lending Cash Central Fund were $441,629,242 and $364,445,888, respectively, during the period.
Investment Valuation
The following is a summary of the inputs used, as of February 28, 2021, involving the Fund's assets and liabilities carried at fair value. The inputs or methodology used for valuing securities may not be an indication of the risk associated with investing in those securities. For more information on valuation inputs, and their aggregation into the levels used below, please refer to the Investment Valuation section in the accompanying Notes to Financial Statements.
| | Valuation Inputs at Reporting Date: |
| Description | Total | Level 1 | Level 2 | Level 3 |
| Investments in Securities: | | | | |
| Common Stocks | $817,401,191 | $752,365,204 | $65,035,987 | $-- |
| Convertible Preferred Stocks | 5,805,878 | -- | 3,974,835 | 1,831,043 |
| Money Market Funds | 111,907,725 | 111,907,725 | -- | -- |
| Total Investments in Securities: | $935,114,794 | $864,272,929 | $69,010,822 | $1,831,043 |
Other Information
Distribution of investments by country or territory of incorporation, as a percentage of Total Net Assets, is as follows (Unaudited):
| United States of America | 65.8% |
| Switzerland | 11.2% |
| France | 8.9% |
| Ireland | 4.1% |
| Belgium | 3.4% |
| Canada | 1.9% |
| Netherlands | 1.7% |
| Denmark | 1.0% |
| Others (Individually Less Than 1%) | 2.0% |
| | 100.0% |
See accompanying notes which are an integral part of the financial statements.
Pharmaceuticals Portfolio
Financial Statements
Statement of Assets and Liabilities
| | | February 28, 2021 |
| Assets | | |
Investment in securities, at value (including securities loaned of $105,887,144) — See accompanying schedule:
Unaffiliated issuers (cost $573,687,556) | $823,207,069 | |
| Fidelity Central Funds (cost $111,907,725) | 111,907,725 | |
| Total Investment in Securities (cost $685,595,281) | | $935,114,794 |
| Foreign currency held at value (cost $1,834,699) | | 1,834,699 |
| Receivable for investments sold | | 4,757,259 |
| Receivable for fund shares sold | | 272,580 |
| Dividends receivable | | 4,059,830 |
| Distributions receivable from Fidelity Central Funds | | 14,218 |
| Prepaid expenses | | 4,500 |
| Other receivables | | 155,387 |
| Total assets | | 946,213,267 |
| Liabilities | | |
| Payable for investments purchased | $1,834,808 | |
| Payable for fund shares redeemed | 833,243 | |
| Accrued management fee | 375,876 | |
| Other affiliated payables | 149,603 | |
| Other payables and accrued expenses | 238,228 | |
| Collateral on securities loaned | 109,401,825 | |
| Total liabilities | | 112,833,583 |
| Net Assets | | $833,379,684 |
| Net Assets consist of: | | |
| Paid in capital | | $560,150,069 |
| Total accumulated earnings (loss) | | 273,229,615 |
| Net Assets | | $833,379,684 |
| Net Asset Value, offering price and redemption price per share ($833,379,684 ÷ 34,835,718 shares) | | $23.92 |
See accompanying notes which are an integral part of the financial statements.
Statement of Operations
| | | Year ended February 28, 2021 |
| Investment Income | | |
| Dividends | | $15,984,832 |
| Income from Fidelity Central Funds (including $108,070 from security lending) | | 129,062 |
| Total income | | 16,113,894 |
| Expenses | | |
| Management fee | $4,513,939 | |
| Transfer agent fees | 1,555,500 | |
| Accounting fees | 291,221 | |
| Custodian fees and expenses | 70,333 | |
| Independent trustees' fees and expenses | 4,719 | |
| Registration fees | 51,677 | |
| Audit | 37,740 | |
| Legal | 3,098 | |
| Interest | 792 | |
| Miscellaneous | 18,663 | |
| Total expenses before reductions | 6,547,682 | |
| Expense reductions | (35,279) | |
| Total expenses after reductions | | 6,512,403 |
| Net investment income (loss) | | 9,601,491 |
| Realized and Unrealized Gain (Loss) | | |
| Net realized gain (loss) on: | | |
| Investment securities: | | |
| Unaffiliated issuers | 75,659,144 | |
| Fidelity Central Funds | (136) | |
| Foreign currency transactions | (4,839) | |
| Total net realized gain (loss) | | 75,654,169 |
| Change in net unrealized appreciation (depreciation) on: | | |
| Investment securities: | | |
| Unaffiliated issuers | 69,230,862 | |
| Assets and liabilities in foreign currencies | 69,671 | |
| Total change in net unrealized appreciation (depreciation) | | 69,300,533 |
| Net gain (loss) | | 144,954,702 |
| Net increase (decrease) in net assets resulting from operations | | $154,556,193 |
See accompanying notes which are an integral part of the financial statements.
Statement of Changes in Net Assets
| | Year ended February 28, 2021 | Year ended February 29, 2020 |
| Increase (Decrease) in Net Assets | | |
| Operations | | |
| Net investment income (loss) | $9,601,491 | $10,028,605 |
| Net realized gain (loss) | 75,654,169 | 65,450,148 |
| Change in net unrealized appreciation (depreciation) | 69,300,533 | 5,301,157 |
| Net increase (decrease) in net assets resulting from operations | 154,556,193 | 80,779,910 |
| Distributions to shareholders | (72,330,079) | (66,086,434) |
| Share transactions | | |
| Proceeds from sales of shares | 263,105,559 | 129,274,481 |
| Reinvestment of distributions | 68,862,070 | 62,770,076 |
| Cost of shares redeemed | (345,098,612) | (190,057,404) |
| Net increase (decrease) in net assets resulting from share transactions | (13,130,983) | 1,987,153 |
| Total increase (decrease) in net assets | 69,095,131 | 16,680,629 |
| Net Assets | | |
| Beginning of period | 764,284,553 | 747,603,924 |
| End of period | $833,379,684 | $764,284,553 |
| Other Information | | |
| Shares | | |
| Sold | 11,435,481 | 5,749,544 |
| Issued in reinvestment of distributions | 3,007,054 | 2,784,673 |
| Redeemed | (14,811,031) | (8,808,887) |
| Net increase (decrease) | (368,496) | (274,670) |
See accompanying notes which are an integral part of the financial statements.
Financial Highlights
Pharmaceuticals Portfolio
| | | | | | |
| Years ended February 28, | 2021 | 2020 A | 2019 | 2018 | 2017 |
| Selected Per–Share Data | | | | | |
| Net asset value, beginning of period | $21.71 | $21.07 | $18.82 | $18.11 | $18.20 |
| Income from Investment Operations | | | | | |
| Net investment income (loss)B | .27 | .29 | .29 | .27 | .22 |
| Net realized and unrealized gain (loss) | 4.04 | 2.29 | 2.34 | .74 | (.13) |
| Total from investment operations | 4.31 | 2.58 | 2.63 | 1.01 | .09 |
| Distributions from net investment income | (.31) | (.31) | (.28) | (.25) | (.18) |
| Distributions from net realized gain | (1.79) | (1.64) | (.10) | (.05) | – |
| Total distributions | (2.10) | (1.94)C | (.38) | (.30) | (.18) |
| Redemption fees added to paid in capitalB | – | – | – | – | –D |
| Net asset value, end of period | $23.92 | $21.71 | $21.07 | $18.82 | $18.11 |
| Total ReturnE | 20.46% | 12.06% | 14.15% | 5.61% | .57% |
| Ratios to Average Net AssetsF,G | | | | | |
| Expenses before reductions | .77% | .78% | .80% | .81% | .80% |
| Expenses net of fee waivers, if any | .77% | .78% | .79% | .81% | .80% |
| Expenses net of all reductions | .76% | .77% | .79% | .80% | .79% |
| Net investment income (loss) | 1.13% | 1.36% | 1.48% | 1.44% | 1.16% |
| Supplemental Data | | | | | |
| Net assets, end of period (000 omitted) | $833,380 | $764,285 | $747,604 | $744,563 | $1,000,937 |
| Portfolio turnover rateH | 32% | 52% | 55% | 89% | 77% |
A For the year ended February 29.
B Calculated based on average shares outstanding during the period.
C Total distributions per share do not sum due to rounding.
D Amount represents less than $.005 per share.
E Total returns would have been lower if certain expenses had not been reduced during the applicable periods shown.
F Fees and expenses of any underlying mutual funds or exchange-traded funds (ETFs) are not included in the Fund's expense ratio. The Fund indirectly bears its proportionate share of these expenses. For additional expense information related to investments in Fidelity Central Funds, please refer to the "Investments in Fidelity Central Funds" note found in the Notes to Financial Statements section of the most recent Annual or Semi-Annual report.
G Expense ratios reflect operating expenses of the class. Expenses before reductions do not reflect amounts reimbursed, waived, or reduced through arrangements with the investment advisor, brokerage services, or other offset arrangements, if applicable, and do not represent the amount paid by the class during periods when reimbursements, waivers or reductions occur.
H Amount does not include the portfolio activity of any underlying mutual funds or exchange-traded funds (ETFs).
See accompanying notes which are an integral part of the financial statements.
Notes to Financial Statements
For the period ended February 28, 2021
1. Organization.
Biotechnology Portfolio, Health Care Portfolio, Health Care Services Portfolio, Medical Technology and Devices Portfolio, and Pharmaceuticals Portfolio (the Funds) are non-diversified funds of Fidelity Select Portfolios (the Trust). The Trust is registered under the Investment Company Act of 1940, as amended (the 1940 Act), as an open-end management investment company organized as a Massachusetts business trust. The Funds invest primarily in securities of companies whose principal business activities fall within specific industries. Each Fund is authorized to issue an unlimited number of shares. Share transactions on the Statement of Changes in Net Assets may contain exchanges between affiliated funds.
2. Investments in Fidelity Central Funds.
The Funds invest in Fidelity Central Funds, which are open-end investment companies generally available only to other investment companies and accounts managed by the investment adviser and its affiliates. The Funds' Schedules of Investments list each of the Fidelity Central Funds held as of period end, if any, as an investment of each Fund, but do not include the underlying holdings of each Fidelity Central Fund. As an Investing Fund, each Fund indirectly bears its proportionate share of the expenses of the underlying Fidelity Central Funds.
The Money Market Central Funds seek preservation of capital and current income and are managed by the investment adviser. Annualized expenses of the Money Market Central Funds as of their most recent shareholder report date ranged from less than .005% to .01%.
A complete unaudited list of holdings for each Fidelity Central Fund is available upon request or at the Securities and Exchange Commission (the SEC) website at www.sec.gov. In addition, the financial statements of the Fidelity Central Funds, which are not covered by the Funds' Report of Independent Registered Public Accounting Firm, are available on the SEC website or upon request.
3. Significant Accounting Policies.
Each Fund is an investment company and applies the accounting and reporting guidance of the Financial Accounting Standards Board (FASB) Accounting Standards Codification Topic 946 Financial Services - Investment Companies. The financial statements have been prepared in conformity with accounting principles generally accepted in the United States of America (GAAP), which require management to make certain estimates and assumptions at the date of the financial statements. Actual results could differ from those estimates. Subsequent events, if any, through the date that the financial statements were issued have been evaluated in the preparation of the financial statements. The following summarizes the significant accounting policies of the Funds:
Investment Valuation. Investments are valued as of 4:00 p.m. Eastern time on the last calendar day of the period. The Board of Trustees (the Board) has delegated the day to day responsibility for the valuation of each Fund's investments to the Fair Value Committee (the Committee) established by each Fund's investment adviser. In accordance with valuation policies and procedures approved by the Board, each Fund attempts to obtain prices from one or more third party pricing vendors or brokers to value its investments. When current market prices, quotations or currency exchange rates are not readily available or reliable, investments will be fair valued in good faith by the Committee, in accordance with procedures adopted by the Board. Factors used in determining fair value vary by investment type and may include market or investment specific events, changes in interest rates and credit quality. The frequency with which these procedures are used cannot be predicted and they may be utilized to a significant extent. The Committee oversees each Fund's valuation policies and procedures and reports to the Board on the Committee's activities and fair value determinations. The Board monitors the appropriateness of the procedures used in valuing each Fund's investments and ratifies the fair value determinations of the Committee.
Each Fund categorizes the inputs to valuation techniques used to value its investments into a disclosure hierarchy consisting of three levels as shown below:
- Level 1 – quoted prices in active markets for identical investments
- Level 2 – other significant observable inputs (including quoted prices for similar investments, interest rates, prepayment speeds, etc.)
- Level 3 – unobservable inputs (including the Fund's own assumptions based on the best information available)
Valuation techniques used to value each Fund's investments by major category are as follows:
Equity securities, including restricted securities, for which market quotations are readily available, are valued at the last reported sale price or official closing price as reported by a third party pricing vendor on the primary market or exchange on which they are traded and are categorized as Level 1 in the hierarchy. In the event there were no sales during the day or closing prices are not available, securities are valued at the last quoted bid price or may be valued using the last available price and are generally categorized as Level 2 in the hierarchy. For foreign equity securities, when market or security specific events arise, comparisons to the valuation of American Depositary Receipts (ADRs), futures contracts, Exchange-Traded Funds (ETFs) and certain indexes as well as quoted prices for similar securities may be used and would be categorized as Level 2 in the hierarchy. For equity securities, including restricted securities, where observable inputs are limited, assumptions about market activity and risk are used and these securities may be categorized as Level 3 in the hierarchy. Securities, including private placements or other restricted securities, for which observable inputs are not available are valued using alternate valuation approaches, including the market approach, the income approach and cost approach, and are categorized as Level 3 in the hierarchy. The market approach considers factors including the price of recent investments in the same or a similar security or financial metrics of comparable securities. The income approach considers factors including expected future cash flows, security specific risks and corresponding discount rates. The cost approach considers factors including the value of the security's underlying assets and liabilities.
Debt securities, including restricted securities, are valued based on evaluated prices received from third party pricing vendors or from brokers who make markets in such securities. Preferred securities are valued by pricing vendors who utilize matrix pricing which considers yield or price of bonds of comparable quality, coupon, maturity and type or by broker-supplied prices. When independent prices are unavailable or unreliable, debt securities may be valued utilizing pricing methodologies which consider similar factors that would be used by third party pricing vendors. Debt securities are generally categorized as Level 2 in the hierarchy but may be Level 3 depending on the circumstances.
Investments in open-end mutual funds, including the Fidelity Central Funds, are valued at their closing net asset value (NAV) each business day and are categorized as Level 1 in the hierarchy.
The following provides information on Level 3 securities held by the Fund that were valued at period end based on unobservable inputs. These amounts exclude valuations provided by a broker.
Biotechnology Portfolio:
| Asset Type | Fair Value | Valuation Technique(s) | Unobservable Input | Amount or Range/Weighted Average | Impact to Valuation from an Increase in Input(a) |
| Equities | $ 205,246,341 | Recovery value | Recovery value | 0.0% | Increase |
| | | Market approach | Transaction price | $0.59 - $56.72 / $28.58 | Increase |
| | | | Premium rate | 21.2% - 30.9% / 26.2% | Increase |
| | | | Parity price | $0.05 | Increase |
| | | Discounted cash flow | Discount rate | 8.0% | Decrease |
| | | | Discount for lack of marketability | 10.0% | Decrease |
(a) Represents the directional change in the fair value of the Level 3 investments that could have resulted from an increase in the corresponding input as of period end. A decrease to the unobservable input would have had the opposite effect. Significant changes in these inputs may have resulted in a significantly higher or lower fair value measurement at period end.
Medical Technology and Devices Portfolio:
| Asset Type | Fair Value | Valuation Technique(s) | Unobservable Input | Amount or Range/Weighted Average | Impact to Valuation from an Increase in Input(a) |
| Equities | $ 99,803,398 | Market approach | Transaction price | $1.02 - $14.20 / $4.74 | Increase |
| | | | Premium rate | 16.6% - 45.9% / 28.1% | Increase |
| Preferred Securities | $ 19,551,861 | Market approach | Transaction price | $100.00 | Increase |
(a) Represents the directional change in the fair value of the Level 3 investments that could have resulted from an increase in the corresponding input as of period end. A decrease to the unobservable input would have had the opposite effect. Significant changes in these inputs may have resulted in a significantly higher or lower fair value measurement at period end.
Changes in valuation techniques may result in transfers in or out of an assigned level within the disclosure hierarchy. The aggregate value of investments by input level as of February 28, 2021, as well as a roll forward of Level 3 investments, is included at the end of each applicable Fund's Schedule of Investments.
Foreign Currency. Certain Funds may use foreign currency contracts to facilitate transactions in foreign-denominated securities. Gains and losses from these transactions may arise from changes in the value of the foreign currency or if the counterparties do not perform under the contracts' terms.
Foreign-denominated assets, including investment securities, and liabilities are translated into U.S. dollars at the exchange rates at period end. Purchases and sales of investment securities, income and dividends received, and expenses denominated in foreign currencies are translated into U.S. dollars at the exchange rate in effect on the transaction date.
The effects of exchange rate fluctuations on investments are included with the net realized and unrealized gain (loss) on investment securities. Other foreign currency transactions resulting in realized and unrealized gain (loss) are disclosed separately.
Investment Transactions and Income. For financial reporting purposes, the Funds' investment holdings and NAV include trades executed through the end of the last business day of the period. The NAV per share for processing shareholder transactions is calculated as of the close of business of the New York Stock Exchange (NYSE), normally 4:00 p.m. Eastern time and includes trades executed through the end of the prior business day. Gains and losses on securities sold are determined on the basis of identified cost and for certain Funds include proceeds received from litigation. Dividend income is recorded on the ex-dividend date, except for certain dividends from foreign securities where the ex-dividend date may have passed, which are recorded as soon as the Funds are informed of the ex-dividend date. Non-cash dividends included in dividend income, if any, are recorded at the fair market value of the securities received. Income and capital gain distributions from Fidelity Central Funds, if any, are recorded on the ex-dividend date. Certain distributions received by the Funds represent a return of capital or capital gain. The Funds determine the components of these distributions subsequent to the ex-dividend date, based upon receipt of tax filings or other correspondence relating to the underlying investment. These distributions are recorded as a reduction of cost of investments and/or as a realized gain. Investment income is recorded net of foreign taxes withheld where recovery of such taxes is uncertain.
Expenses. Expenses directly attributable to a fund are charged to that fund. Expenses attributable to more than one fund are allocated among the respective funds on the basis of relative net assets or other appropriate methods. Expense estimates are accrued in the period to which they relate and adjustments are made when actual amounts are known.
Deferred Trustee Compensation. Under a Deferred Compensation Plan (the Plan) for certain Funds, certain independent Trustees have elected to defer receipt of a portion of their annual compensation. Deferred amounts are invested in affiliated mutual funds, are marked-to-market and remain in a fund until distributed in accordance with the Plan. The investment of deferred amounts and the offsetting payable to the Trustees presented below are included in the accompanying Statement of Assets and Liabilities in other receivables and other payables and accrued expenses, as applicable.
| Biotechnology Portfolio | $1,119,921 |
| Health Care Portfolio | 745,937 |
| Health Care Services Portfolio | 83,321 |
| Medical Technology and Devices Portfolio | 246,482 |
| Pharmaceuticals Portfolio | 150,873 |
Income Tax Information and Distributions to Shareholders. Each year, each Fund intends to qualify as a regulated investment company under Subchapter M of the Internal Revenue Code, including distributing substantially all of its taxable income and realized gains. As a result, no provision for U.S. Federal income taxes is required. As of February 28, 2021, each Fund did not have any unrecognized tax benefits in the financial statements; nor is each Fund aware of any tax positions for which it is reasonably possible that the total amounts of unrecognized tax benefits will significantly change in the next twelve months. Each Fund files a U.S. federal tax return, in addition to state and local tax returns as required. Each Fund's federal income tax returns are subject to examination by the Internal Revenue Service (IRS) for a period of three fiscal years after they are filed. State and local tax returns may be subject to examination for an additional fiscal year depending on the jurisdiction. Foreign taxes are provided for based on each Fund's understanding of the tax rules and rates that exist in the foreign markets in which it invests.
Distributions are declared and recorded on the ex-dividend date. Income and capital gain distributions are determined in accordance with income tax regulations, which may differ from GAAP. In addition, certain Funds claimed a portion of the payment made to redeeming shareholders as a distribution for income tax purposes.
Capital accounts within the financial statements are adjusted for permanent book-tax differences. These adjustments have no impact on net assets or the results of operations. Capital accounts are not adjusted for temporary book-tax differences which will reverse in a subsequent period.
Book-tax differences are primarily due to foreign currency transactions, passive foreign investment companies (PFIC), partnerships, deferred Trustees compensation, net operating losses, capital loss carryforwards and losses deferred due to wash sales and excise tax regulations.
As of period end, the cost and unrealized appreciation (depreciation) in securities, and derivatives if applicable, for federal income tax purposes were as follows for each Fund:
| | Tax cost | Gross unrealized appreciation | Gross unrealized depreciation | Net unrealized appreciation (depreciation) |
| Biotechnology Portfolio | $6,202,465,917 | $3,565,306,330 | $(387,506,723) | $3,177,799,607 |
| Health Care Portfolio | 6,639,307,722 | 3,928,501,432 | (207,546,831) | 3,720,954,601 |
| Health Care Services Portfolio | 596,796,626 | 559,287,885 | (11,328,566) | 547,959,319 |
| Medical Technology and Devices Portfolio | 5,407,516,774 | 3,649,776,645 | (48,388,424) | 3,601,388,221 |
| Pharmaceuticals Portfolio | 688,261,389 | 267,570,779 | (20,717,374) | 246,853,405 |
The tax-based components of distributable earnings as of period end were as follows for each Fund:
| | Undistributed ordinary income | Undistributed long-term capital gain | Net unrealized appreciation (depreciation) on securities and other investments |
| Biotechnology Portfolio | $44,472,065 | $540,745,367 | $3,177,801,414 |
| Health Care Portfolio | 31,831,453 | 312,819,335 | 3,721,436,083 |
| Health Care Services Portfolio | 857,464 | 30,323,368 | 547,957,290 |
| Medical Technology and Devices Portfolio | 80,028,279 | 339,709,005 | 3,601,393,312 |
| Pharmaceuticals Portfolio | 6,928,532 | 19,516,513 | 246,935,441 |
The tax character of distributions paid was as follows:
| February 28, 2021 | | | |
| | Ordinary Income | Long-term Capital Gains | Total |
| Biotechnology Portfolio | $153,648,169 | $1,349,606,527 | $1,503,254,696 |
| Health Care Portfolio | 180,426,644 | 862,893,285 | 1,043,319,929 |
| Health Care Services Portfolio | 9,375,003 | – | 9,375,003 |
| Medical Technology and Devices Portfolio | 5,369,657 | 508,939,963 | 514,309,620 |
| Pharmaceuticals Portfolio | 23,917,701 | 48,412,378 | 72,330,079 |
| February 29, 2020 | | | |
| | Ordinary Income | Long-term Capital Gains | Total |
| Biotechnology Portfolio | $10,687,837 | $637,855,151 | $648,542,988 |
| Health Care Portfolio | 8,393,187 | 96,115,548 | 104,508,735 |
| Health Care Services Portfolio | 3,201,281 | – | 3,201,281 |
| Medical Technology and Devices Portfolio | – | 118,431,567 | 118,431,567 |
| Pharmaceuticals Portfolio | 17,857,599 | 48,228,835 | 66,086,434 |
Restricted Securities (including Private Placements). The Funds may invest in securities that are subject to legal or contractual restrictions on resale. These securities generally may be resold in transactions exempt from registration or to the public if the securities are registered. Disposal of these securities may involve time-consuming negotiations and expense, and prompt sale at an acceptable price may be difficult. Information regarding restricted securities is included at the end of each applicable Fund's Schedule of Investments.
Consolidated Subsidiary. The Funds included in the table below hold certain investments through a wholly-owned subsidiary ("Subsidiary"), which may be subject to federal and state taxes upon disposition.
As of period end, investments in Subsidiaries were as follows:
| | $ Amount | % of Net Assets |
| Biotechnology Portfolio | 99,265,489 | 1.12 |
The financial statements have been consolidated to include the Subsidiary accounts where applicable. Accordingly, all inter-company transactions and balances have been eliminated.
At period end, any estimated tax liability for these investments is presented as "Deferred taxes" in the Statement of Assets and Liabilities and included in "Change in net unrealized appreciation (depreciation) on investment securities" in the Statement of Operations. The tax liability incurred may differ materially depending on conditions when these investments are disposed. Any cash held by a Subsidiary is restricted as to its use and is presented as "Restricted cash" in the Statement of Assets and Liabilities, if applicable.
Special Purpose Acquisition Companies. Funds may invest in stock, warrants, and other securities of special purpose acquisition companies (SPACs) or similar special purpose entities. A SPAC is a publicly traded company that raises investment capital via an initial public offering (IPO) for the purpose of acquiring the equity securities of one or more existing companies via merger, business combination, acquisition or other similar transactions within a designated time frame.
Private Investment in Public Equity. Funds may acquire equity securities of an issuer through a private investment in a public equity (PIPE) transaction, including through commitments to purchase securities on a when-issued basis. A PIPE typically involves the purchase of securities directly from a publicly traded company in a private placement transaction. Securities purchased through PIPE transactions will be restricted from trading and considered illiquid until a resale registration statement for the shares is filed and declared effective.
At period end, Health Care Portfolio, Health Care Services Portfolio and Medical Technology and Devices Portfolio had commitments to purchase when-issued securities through PIPE transactions with SPACs. The commitments are contingent upon the SPACs acquiring the securities of target companies. Unrealized appreciation (depreciation) on these commitments is separately presented in the Statements of Assets and Liabilities as Unrealized appreciation (depreciation) on unfunded commitments, and in the Statement of Operations as Change in unrealized appreciation (depreciation) on unfunded commitments.
4. Purchases and Sales of Investments.
Purchases and sales of securities, other than short-term securities are noted in the table below.
| | Purchases ($) | Sales ($) |
| Biotechnology Portfolio | 5,832,883,692 | 6,486,993,160 |
| Health Care Portfolio | 5,087,518,799 | 4,650,079,899 |
| Health Care Services Portfolio | 357,167,051 | 528,821,728 |
| Medical Technology and Devices Portfolio | 4,195,793,844 | 4,122,302,752 |
| Pharmaceuticals Portfolio | 264,687,424 | 340,020,055 |
5. Fees and Other Transactions with Affiliates.
Management Fee. Fidelity Management & Research Company LLC (the investment adviser) and its affiliates provide the Funds with investment management related services for which the Funds pay a monthly management fee. The management fee is the sum of an individual fund fee rate and an annualized group fee rate. The individual fund fee rate is applied to each Fund's average net assets. The group fee rate is based upon the monthly average net assets of a group of registered investment companies with which the investment adviser has management contracts. The group fee rate decreases as assets under management increase and increases as assets under management decrease. For the reporting period, each Fund's annual management fee rate expressed as a percentage of each Fund's average net assets was as follows:
| | Individual Rate | Group Rate | Total |
| Biotechnology Portfolio | .30% | .23% | .53% |
| Health Care Portfolio | .30% | .23% | .53% |
| Health Care Services Portfolio | .30% | .23% | .53% |
| Medical Technology and Devices Portfolio | .30% | .23% | .53% |
| Pharmaceuticals Portfolio | .30% | .23% | .53% |
Transfer Agent Fees. Fidelity Investments Institutional Operations Company LLC (FIIOC), an affiliate of the investment adviser, is the Funds' transfer, dividend disbursing and shareholder servicing agent. FIIOC receives account fees and asset-based fees that vary according to account size and type of account. FIIOC pays for typesetting, printing and mailing of shareholder reports, except proxy statements. For the period, transfer agent fees were equivalent to the following annual rates expressed as a percentage of average net assets:
| Biotechnology Portfolio | .15% |
| Health Care Portfolio | .14% |
| Health Care Services Portfolio | .16% |
| Medical Technology and Devices Portfolio | .15% |
| Pharmaceuticals Portfolio | .18% |
Accounting Fees. Fidelity Service Company, Inc. (FSC), an affiliate of the investment adviser, maintains each Fund's accounting records. The accounting fee is based on the level of average net assets for each month. For the period, the fees were equivalent to the following annual rates:
| | % of Average Net Assets |
| Biotechnology Portfolio | .02 |
| Health Care Portfolio | .01 |
| Health Care Services Portfolio | .03 |
| Medical Technology and Devices Portfolio | .02 |
| Pharmaceuticals Portfolio | .03 |
Brokerage Commissions. A portion of portfolio transactions were placed with brokerage firms which are affiliates of the investment adviser. Brokerage commissions are included in net realized gain (loss) and change in net unrealized appreciation (depreciation) in the Statement of Operations. The commissions paid to these affiliated firms were as follows:
| | Amount |
| Biotechnology Portfolio | $282,704 |
| Health Care Portfolio | 94,080 |
| Health Care Services Portfolio | 13,984 |
| Medical Technology and Devices Portfolio | 88,981 |
| Pharmaceuticals Portfolio | 8,032 |
Interfund Lending Program. Pursuant to an Exemptive Order issued by the SEC, each Fund, along with other registered investment companies having management contracts with Fidelity Management & Research Company LLC (FMR), or other affiliated entities of FMR, may participate in an interfund lending program. This program provides an alternative credit facility allowing each Fund to borrow from, or lend money to, other participating affiliated funds. At period end, there were no interfund loans outstanding. Activity in this program during the period for which loans were outstanding was as follows:
| | Borrower or Lender | Average Loan Balance | Weighted Average Interest Rate | Interest Expense |
| Health Care Portfolio | Borrower | $19,022,077 | .34% | $2,303 |
| Health Care Services Portfolio | Borrower | $5,452,000 | 1.34% | $407 |
| Medical Technology and Devices Portfolio | Borrower | $10,542,429 | .34% | $693 |
| Pharmaceuticals Portfolio | Borrower | $8,128,200 | .70% | $792 |
Interfund Trades. Funds may purchase from or sell securities to other Fidelity Funds under procedures adopted by the Board. The procedures have been designed to ensure these interfund trades are executed in accordance with Rule 17a-7 of the 1940 Act. Any interfund trades are included within the respective purchases and sales amounts shown in the Purchases and Sales of Investments note and are noted in the table below.
| | Purchases ($) | Sales ($) |
| Biotechnology Portfolio | 390,453,953 | 355,369,222 |
| Health Care Portfolio | 593,189,690 | 460,378,494 |
| Health Care Services Portfolio | 51,426,571 | 32,993,199 |
| Medical Technology and Devices Portfolio | 433,943,857 | 263,191,265 |
| Pharmaceuticals Portfolio | 50,362,194 | 29,720,921 |
Prior Fiscal Year Affiliated Redemptions In-Kind. During the prior period, 4,971,286 shares of the Health Care Portfolio were redeemed in-kind for investments and cash with a value of $122,939,907. The Fund had a net realized gain of $52,017,323 on investments delivered through in-kind redemptions. The amount of the in-kind redemptions is included in share transactions in the accompanying Statement of Changes in Net Assets. The Health Care Portfolio recognized no gain or loss for federal income tax purposes.
Other. During the period, the investment adviser reimbursed the Funds for certain losses as follows:
| | Amount |
| Biotechnology Portfolio | $12,300 |
| Medical Technology and Devices Portfolio | 16,906 |
| Pharmaceuticals Portfolio | 2,666 |
6. Committed Line of Credit.
Certain Funds participate with other funds managed by the investment adviser or an affiliate in a $4.25 billion credit facility (the "line of credit") to be utilized for temporary or emergency purposes to fund shareholder redemptions or for other short-term liquidity purposes. The participating funds have agreed to pay commitment fees on their pro-rata portion of the line of credit, which are reflected in Miscellaneous expenses on the Statement of Operations, and are listed below.
| | Amount |
| Biotechnology Portfolio | $16,535 |
| Health Care Portfolio | 19,503 |
| Health Care Services Portfolio | 2,421 |
| Medical Technology and Devices Portfolio | 15,479 |
| Pharmaceuticals Portfolio | 1,918 |
During the period, there were no borrowings on this line of credit.
7. Security Lending.
Funds lend portfolio securities from time to time in order to earn additional income. Lending agents are used, including National Financial Services (NFS), an affiliate of the investment adviser. Pursuant to a securities lending agreement, NFS will receive a fee, which is capped at 9.9% of a fund's daily lending revenue, for its services as lending agent. A fund may lend securities to certain qualified borrowers, including NFS. On the settlement date of the loan, a fund receives collateral (in the form of U.S. Treasury obligations, letters of credit and/or cash) against the loaned securities and maintains collateral in an amount not less than 100% of the market value of the loaned securities during the period of the loan. The market value of the loaned securities is determined at the close of business of a fund and any additional required collateral is delivered to a fund on the next business day. A fund or borrower may terminate the loan at any time, and if the borrower defaults on its obligation to return the securities loaned because of insolvency or other reasons, a fund may apply collateral received from the borrower against the obligation. A fund may experience delays and costs in recovering the securities loaned. Any cash collateral received is invested in the Fidelity Securities Lending Cash Central Fund. Any loaned securities are identified as such in the Schedule of Investments, and the value of loaned securities and cash collateral at period end, as applicable, are presented in the Statement of Assets and Liabilities. Security lending income represents the income earned on investing cash collateral, less rebates paid to borrowers and any lending agent fees associated with the loan, plus any premium payments received for lending certain types of securities. Security lending income is presented in the Statement of Operations as a component of income from Fidelity Central Funds. Affiliated security lending activity, if any, was as follows:
| | Total Security Lending Income Fees Paid to NFS | Security Lending Income From Securities Loaned to NFS | Value of Securities Loaned to NFS at Period End |
| Biotechnology Portfolio | $435,356 | $692,686 | $4,329,203 |
| Health Care Portfolio | $55,344 | $153,197 | $– |
| Health Care Services Portfolio | $8,789 | $1,960 | $– |
| Medical Technology and Devices Portfolio | $20,658 | $133 | $– |
| Pharmaceuticals Portfolio | $10,070 | $35,507 | $– |
8. Expense Reductions.
Commissions paid to certain brokers with whom the investment adviser, or its affiliates, places trades on behalf of certain Funds include an amount in addition to trade execution, which may be rebated back to the Funds to offset expenses. In addition, through arrangements with each applicable Fund's custodian and transfer agent, credits realized as a result of certain uninvested cash balances were used to reduce each applicable Fund's expenses. All of the applicable expense reductions are noted in the table below.
| | Brokerage service rebates | Custodian credits |
| Biotechnology Portfolio | $504,097 | $1,689 |
| Health Care Portfolio | 435,995 | 418 |
| Health Care Services Portfolio | 18,463 | – |
| Medical Technology and Devices Portfolio | 254,161 | – |
| Pharmaceuticals Portfolio | 32,281 | 121 |
In addition, during the period the investment adviser or an affiliate reimbursed and/or waived a portion of operating expenses as follows:
| | Amount |
| Biotechnology Portfolio | $27,636 |
| Health Care Portfolio | 30,395 |
| Health Care Services Portfolio | 3,972 |
| Medical Technology and Devices Portfolio | 25,527 |
| Pharmaceuticals Portfolio | 2,877 |
9. Other.
The Funds' organizational documents provide former and current trustees and officers with a limited indemnification against liabilities arising in connection with the performance of their duties to the Funds. In the normal course of business, the Funds may also enter into contracts that provide general indemnifications. The Funds' maximum exposure under these arrangements is unknown as this would be dependent on future claims that may be made against the Funds. The risk of material loss from such claims is considered remote.
10. Coronavirus (COVID-19) Pandemic.
An outbreak of COVID-19 first detected in China during December 2019 has since spread globally and was declared a pandemic by the World Health Organization during March 2020. Developments that disrupt global economies and financial markets, such as the COVID-19 pandemic, may magnify factors that affect the Funds' performance.
Report of Independent Registered Public Accounting Firm
To the Board of Trustees of Fidelity Select Portfolios and the Shareholders of Biotechnology Portfolio, Health Care Portfolio, Health Care Services Portfolio, Medical Technology and Devices Portfolio and Pharmaceuticals Portfolio
Opinions on the Financial Statements
We have audited the accompanying statements of assets and liabilities, including the schedules of investments, of Biotechnology Portfolio, Health Care Portfolio, Health Care Services Portfolio, Medical Technology and Devices Portfolio, and Pharmaceuticals Portfolio (five of the funds constituting Fidelity Select Portfolios, hereafter collectively referred to as the “Funds”) as of February 28, 2021, the related statements of operations for the year ended February 28, 2021, the statements of changes in net assets for each of the two years in the period ended February 28, 2021, including the related notes, and the financial highlights for each of the five years in the period ended February 28, 2021 (collectively referred to as the “financial statements”). In our opinion, the financial statements present fairly, in all material respects, the financial position of each of the Funds as of February 28, 2021, the results of each of their operations for the year then ended, the changes in each of their net assets for each of the two years in the period ended February 28, 2021 and each of the financial highlights for each of the five years in the period ended February 28, 2021 in conformity with accounting principles generally accepted in the United States of America.
Basis for Opinions
These financial statements are the responsibility of the Funds’ management. Our responsibility is to express an opinion on the Funds’ financial statements based on our audits. We are a public accounting firm registered with the Public Company Accounting Oversight Board (United States) (PCAOB) and are required to be independent with respect to the Funds in accordance with the U.S. federal securities laws and the applicable rules and regulations of the Securities and Exchange Commission and the PCAOB.
We conducted our audits of these financial statements in accordance with the standards of the PCAOB. Those standards require that we plan and perform the audit to obtain reasonable assurance about whether the financial statements are free of material misstatement, whether due to error or fraud.
Our audits included performing procedures to assess the risks of material misstatement of the financial statements, whether due to error or fraud, and performing procedures that respond to those risks. Such procedures included examining, on a test basis, evidence regarding the amounts and disclosures in the financial statements. Our audits also included evaluating the accounting principles used and significant estimates made by management, as well as evaluating the overall presentation of the financial statements. Our procedures included confirmation of securities owned as of February 28, 2021 by correspondence with the custodians, issuers of privately offered securities and brokers; when replies were not received from brokers, we performed other auditing procedures. We believe that our audits provide a reasonable basis for our opinions.
/s/ PricewaterhouseCoopers LLP
Boston, Massachusetts
April 16, 2021
We have served as the auditor of one or more investment companies in the Fidelity group of funds since 1932.
Trustees and Officers
The Trustees, Members of the Advisory Board (if any), and officers of the trust and funds, as applicable, are listed below. The Board of Trustees governs each fund and is responsible for protecting the interests of shareholders. The Trustees are experienced executives who meet periodically throughout the year to oversee each fund's activities, review contractual arrangements with companies that provide services to each fund, oversee management of the risks associated with such activities and contractual arrangements, and review each fund's performance. Each of the Trustees oversees 309 funds.
The Trustees hold office without limit in time except that (a) any Trustee may resign; (b) any Trustee may be removed by written instrument, signed by at least two-thirds of the number of Trustees prior to such removal; (c) any Trustee who requests to be retired or who has become incapacitated by illness or injury may be retired by written instrument signed by a majority of the other Trustees; and (d) any Trustee may be removed at any special meeting of shareholders by a two-thirds vote of the outstanding voting securities of the trust. Each Trustee who is not an interested person (as defined in the 1940 Act) of the trust and the funds is referred to herein as an Independent Trustee. Each Independent Trustee shall retire not later than the last day of the calendar year in which his or her 75th birthday occurs. The Independent Trustees may waive this mandatory retirement age policy with respect to individual Trustees. Officers and Advisory Board Members hold office without limit in time, except that any officer or Advisory Board Member may resign or may be removed by a vote of a majority of the Trustees at any regular meeting or any special meeting of the Trustees. Except as indicated, each individual has held the office shown or other offices in the same company for the past five years.
Each fund’s Statement of Additional Information (SAI) includes more information about the Trustees. To request a free copy, call Fidelity at 1-800-544-8544.
Experience, Skills, Attributes, and Qualifications of the Trustees. The Governance and Nominating Committee has adopted a statement of policy that describes the experience, qualifications, attributes, and skills that are necessary and desirable for potential Independent Trustee candidates (Statement of Policy). The Board believes that each Trustee satisfied at the time he or she was initially elected or appointed a Trustee, and continues to satisfy, the standards contemplated by the Statement of Policy. The Governance and Nominating Committee also engages professional search firms to help identify potential Independent Trustee candidates who have the experience, qualifications, attributes, and skills consistent with the Statement of Policy. From time to time, additional criteria based on the composition and skills of the current Independent Trustees, as well as experience or skills that may be appropriate in light of future changes to board composition, business conditions, and regulatory or other developments, have also been considered by the professional search firms and the Governance and Nominating Committee. In addition, the Board takes into account the Trustees' commitment and participation in Board and committee meetings, as well as their leadership of standing and ad hoc committees throughout their tenure.
In determining that a particular Trustee was and continues to be qualified to serve as a Trustee, the Board has considered a variety of criteria, none of which, in isolation, was controlling. The Board believes that, collectively, the Trustees have balanced and diverse experience, qualifications, attributes, and skills, which allow the Board to operate effectively in governing each fund and protecting the interests of shareholders. Information about the specific experience, skills, attributes, and qualifications of each Trustee, which in each case led to the Board's conclusion that the Trustee should serve (or continue to serve) as a trustee of the funds, is provided below.
Board Structure and Oversight Function. Robert A. Lawrence is an interested person and currently serves as Acting Chairman. The Trustees have determined that an interested Chairman is appropriate and benefits shareholders because an interested Chairman has a personal and professional stake in the quality and continuity of services provided to the funds. Independent Trustees exercise their informed business judgment to appoint an individual of their choosing to serve as Chairman, regardless of whether the Trustee happens to be independent or a member of management. The Independent Trustees have determined that they can act independently and effectively without having an Independent Trustee serve as Chairman and that a key structural component for assuring that they are in a position to do so is for the Independent Trustees to constitute a substantial majority for the Board. The Independent Trustees also regularly meet in executive session. David M. Thomas serves as Lead Independent Trustee and as such (i) acts as a liaison between the Independent Trustees and management with respect to matters important to the Independent Trustees and (ii) with management prepares agendas for Board meetings.
Fidelity® funds are overseen by different Boards of Trustees. The funds' Board oversees Fidelity's high income and certain equity funds, and other Boards oversee Fidelity's investment-grade bond, money market, asset allocation, and other equity funds. The asset allocation funds may invest in Fidelity® funds overseen by the funds' Board. The use of separate Boards, each with its own committee structure, allows the Trustees of each group of Fidelity® funds to focus on the unique issues of the funds they oversee, including common research, investment, and operational issues. On occasion, the separate Boards establish joint committees to address issues of overlapping consequences for the Fidelity® funds overseen by each Board.
The Trustees operate using a system of committees to facilitate the timely and efficient consideration of all matters of importance to the Trustees, each fund, and fund shareholders and to facilitate compliance with legal and regulatory requirements and oversight of the funds' activities and associated risks. The Board, acting through its committees, has charged FMR and its affiliates with (i) identifying events or circumstances the occurrence of which could have demonstrably adverse effects on the funds' business and/or reputation; (ii) implementing processes and controls to lessen the possibility that such events or circumstances occur or to mitigate the effects of such events or circumstances if they do occur; and (iii) creating and maintaining a system designed to evaluate continuously business and market conditions in order to facilitate the identification and implementation processes described in (i) and (ii) above. Because the day-to-day operations and activities of the funds are carried out by or through FMR, its affiliates, and other service providers, the funds' exposure to risks is mitigated but not eliminated by the processes overseen by the Trustees. While each of the Board's committees has responsibility for overseeing different aspects of the funds' activities, oversight is exercised primarily through the Operations, Audit, and Compliance Committees. Appropriate personnel, including but not limited to the funds' Chief Compliance Officer (CCO), FMR's internal auditor, the independent accountants, the funds' Treasurer and portfolio management personnel, make periodic reports to the Board's committees, as appropriate, including an annual review of Fidelity's risk management program for the Fidelity® funds. The responsibilities of each standing committee, including their oversight responsibilities, are described further under "Standing Committees of the Trustees."
Interested Trustees*:
Correspondence intended for a Trustee who is an interested person may be sent to Fidelity Investments, 245 Summer Street, Boston, Massachusetts 02210.
Name, Year of Birth; Principal Occupations and Other Relevant Experience+
Bettina Doulton (1964)
Year of Election or Appointment: 2020
Trustee
Ms. Doulton also serves as Trustee of other Fidelity® funds. Prior to her retirement, Ms. Doulton served in a variety of positions at Fidelity Investments, including as a managing director of research (2006-2007), portfolio manager to certain Fidelity® funds (1993-2005), equity analyst and portfolio assistant (1990-1993), and research assistant (1987-1990). Ms. Doulton currently owns and operates Phi Builders + Architects and Cellardoor Winery. Previously, Ms. Doulton served as a member of the Board of Brown Capital Management, LLC (2013-2018).
Robert A. Lawrence (1952)
Year of Election or Appointment: 2020
Trustee
Acting Chairman of the Board of Trustees
Mr. Lawrence also serves as Trustee of other funds. Previously, Mr. Lawrence served as a Member of the Advisory Board of certain funds. Prior to his retirement in 2008, Mr. Lawrence served as Vice President of certain Fidelity® funds (2006-2008), Senior Vice President, Head of High Income Division of Fidelity Management & Research Company (investment adviser firm, 2006-2008), and President of Fidelity Strategic Investments (investment adviser firm, 2002-2005).
* Determined to be an “Interested Trustee” by virtue of, among other things, his or her affiliation with the trust or various entities under common control with FMR.
+ The information includes the Trustee's principal occupation during the last five years and other information relating to the experience, attributes, and skills relevant to the Trustee's qualifications to serve as a Trustee, which led to the conclusion that the Trustee should serve as a Trustee for each fund.
Independent Trustees:
Correspondence intended for an Independent Trustee may be sent to Fidelity Investments, P.O. Box 55235, Boston, Massachusetts 02205-5235.
Name, Year of Birth; Principal Occupations and Other Relevant Experience+
Dennis J. Dirks (1948)
Year of Election or Appointment: 2018
Trustee
Mr. Dirks also serves as Trustee of other Fidelity® funds. Prior to his retirement in May 2003, Mr. Dirks served as Chief Operating Officer and as a member of the Board of The Depository Trust & Clearing Corporation (financial markets infrastructure), President, Chief Operating Officer and a member of the Board of The Depository Trust Company (DTC), President and a member of the Board of the National Securities Clearing Corporation (NSCC), Chief Executive Officer and a member of the Board of the Government Securities Clearing Corporation and Chief Executive Officer and a member of the Board of the Mortgage-Backed Securities Clearing Corporation. Mr. Dirks currently serves as a member of the Finance Committee (2016-present) and Board (2017-present) and is Treasurer (2018-present) of the Asolo Repertory Theatre.
Donald F. Donahue (1950)
Year of Election or Appointment: 2018
Trustee
Mr. Donahue also serves as Trustee of other Fidelity® funds. Mr. Donahue serves as President and Chief Executive Officer of Miranda Partners, LLC (risk consulting for the financial services industry, 2012-present). Previously, Mr. Donahue served as Chief Executive Officer (2006-2012), Chief Operating Officer (2003-2006) and Managing Director, Customer Marketing and Development (1999-2003) of The Depository Trust & Clearing Corporation (financial markets infrastructure). Mr. Donahue currently serves as a member (2007-present) and Co-Chairman (2016-present) of the Board of United Way of New York, a member of the Board of NYC Leadership Academy (2012-present) and a member of the Board of Advisors of Ripple Labs, Inc. (financial services, 2015-present). Mr. Donahue previously served as a member of the Advisory Board of certain Fidelity® funds (2015-2018).
Vicki L. Fuller (1957)
Year of Election or Appointment: 2020
Trustee
Ms. Fuller also serves as Trustee of other Fidelity® funds. Previously, Ms. Fuller served as a member of the Advisory Board of certain Fidelity® funds (2018-2020), Chief Investment Officer of the New York State Common Retirement Fund (2012-2018) and held a variety of positions at AllianceBernstein L.P. (global asset management, 1985-2012), including Managing Director (2006-2012) and Senior Vice President and Senior Portfolio Manager (2001-2006). Ms. Fuller currently serves as a member of the Board, Audit Committee and Nominating and Governance Committee of The Williams Companies, Inc. (natural gas infrastructure, 2018-present), as a member of the Board, Audit Committee and Nominating and Governance Committee of two Blackstone business development companies (2020-present) and as a member of the Board of Treliant, LLC (consulting, 2019-present).
Patricia L. Kampling (1959)
Year of Election or Appointment: 2020
Trustee
Ms. Kampling also serves as Trustee of other Fidelity® funds. Prior to her retirement, Ms. Kampling served as Chairman of the Board and Chief Executive Officer (2012-2019), President and Chief Operating Officer (2011-2012) and Executive Vice President and Chief Financial Officer (2010-2011) of Alliant Energy Corporation. Ms. Kampling currently serves as a member of the Board, Compensation Committee and Executive Committee and as Chair of the Audit Committee of Briggs & Stratton Corporation (manufacturing, 2011-present) and as a member of the Board, Audit, Finance and Risk Committee and Safety, Environmental, Technology and Operations Committee of American Water Works Company, Inc. (utilities company, 2019-present). In addition, Ms. Kampling currently serves as a member of the Board of the Nature Conservancy, Wisconsin Chapter (2019-present). Previously, Ms. Kampling served as a Member of the Advisory Board of certain Fidelity® funds (2020), a member of the Board of Interstate Power and Light Company (2012-2019) and Wisconsin Power and Light Company (2012-2019) (each a subsidiary of Alliant Energy Corporation) and as a member of the Board and Workforce Development Committee of the Business Roundtable (2018-2019).
Thomas A. Kennedy (1955)
Year of Election or Appointment: 2021
Trustee
Mr. Kennedy also serves as Trustee of other Fidelity® funds. Previously, Mr. Kennedy served as a Member of the Advisory Board of certain Fidelity® funds (2020) and held a variety of positions at Raytheon Company (aerospace and defense, 1983-2020), including Chairman and Chief Executive Officer (2014-2020) and Executive Vice President and Chief Operating Officer (2013-2014). Mr. Kennedy currently serves as Executive Chairman of the Board of Directors of Raytheon Technologies Corporation (aerospace and defense, 2020-present). He is also a member of the Rutgers School of Engineering Industry Advisory Board (2011-present) and a member of the UCLA Engineering Dean’s Executive Board (2016-present).
Garnett A. Smith (1947)
Year of Election or Appointment: 2013
Trustee
Mr. Smith also serves as Trustee of other Fidelity® funds. Prior to his retirement, Mr. Smith served as Chairman and Chief Executive Officer (1990-1997) and President (1986-1990) of Inbrand Corp. (manufacturer of personal absorbent products). Prior to his employment with Inbrand Corp., he was employed by a retail fabric chain and North Carolina National Bank (now Bank of America). Mr. Smith previously served as a member of the Advisory Board of certain Fidelity® funds (2012-2013).
David M. Thomas (1949)
Year of Election or Appointment: 2018
Trustee
Lead Independent Trustee
Mr. Thomas also serves as Trustee of other Fidelity® funds. Previously, Mr. Thomas served as Executive Chairman (2005-2006) and Chairman and Chief Executive Officer (2000-2005) of IMS Health, Inc. (pharmaceutical and healthcare information solutions). Mr. Thomas currently serves as Non-Executive Chairman of the Board of Fortune Brands Home and Security (home and security products, 2011-present), and a member of the Board (2004-present) and Presiding Director (2013-present) of Interpublic Group of Companies, Inc. (marketing communication).
Susan Tomasky (1953)
Year of Election or Appointment: 2020
Trustee
Ms. Tomasky also serves as Trustee of other Fidelity® funds. Prior to her retirement, Ms. Tomasky served in various executive officer positions at American Electric Power Company, Inc. (1998-2011), including most recently as President of AEP Transmission (2007-2011). Ms. Tomasky currently serves as a member of the Board and Sustainability Committee and as Chair of the Audit Committee of Marathon Petroleum Corporation (2018-present) and as a member of the Board, Corporate Governance Committee and Organization and Compensation Committee and as Chair of the Audit Committee of Public Service Enterprise Group, Inc. (utilities company, 2012-present). In addition, Ms. Tomasky currently serves as a member of the Board of the Columbus Regional Airport Authority (2007-present), as a member of the Board of the Royal Shakespeare Company – America (2009-present), as a member of the Board of the Columbus Association for the Performing Arts (2011-present) and as a member of the Board of Kenyon College (2016-present). Previously, Ms. Tomasky served as a Member of the Advisory Board of certain Fidelity® funds (2020), a member of the Board (2011-2019) and as Lead Independent Director (2015-2018) of Andeavor Corporation (previously Tesoro Corporation) (independent oil refiner and marketer) and as a member of the Board of Summit Midstream Partners LP (energy, 2012-2018).
Michael E. Wiley (1950)
Year of Election or Appointment: 2008
Trustee
Mr. Wiley also serves as Trustee of other Fidelity® funds. Previously, Mr. Wiley served as a member of the Advisory Board of certain Fidelity® funds (2018-2020), Chairman, President and CEO of Baker Hughes, Inc. (oilfield services, 2000-2004). Mr. Wiley also previously served as a member of the Board of Andeavor Corporation (independent oil refiner and marketer, 2005-2018), a member of the Board of Andeavor Logistics LP (natural resources logistics, 2015-2018) and a member of the Board of High Point Resources (exploration and production, 2005-2020).
+ The information includes the Trustee's principal occupation during the last five years and other information relating to the experience, attributes, and skills relevant to the Trustee's qualifications to serve as a Trustee, which led to the conclusion that the Trustee should serve as a Trustee for each fund.
Advisory Board Members and Officers:
Correspondence intended for a Member of the Advisory Board (if any) may be sent to Fidelity Investments, P.O. Box 55235, Boston, Massachusetts 02205-5235. Correspondence intended for an officer or Peter S. Lynch may be sent to Fidelity Investments, 245 Summer Street, Boston, Massachusetts 02210. Officers appear below in alphabetical order.
Name, Year of Birth; Principal Occupation
Ned C. Lautenbach (1944)
Year of Election or Appointment: 2021
Member of the Advisory Board
Mr. Lautenbach also serves as a Member of the Advisory Board of other Fidelity® funds. Mr. Lautenbach currently serves as Chair of the Board of Governors, State University System of Florida (2013-present) and is a member of the Council on Foreign Relations (1994-present). He is also a member and has in the past served as Chairman of the Board of Directors of Artis-Naples (2012-present). Previously, Mr. Lautenbach served as a Trustee of certain Fidelity® funds (2000-2020) and a member and then Lead Director of the Board of Directors of Eaton Corporation (diversified industrial, 1997-2016). He was also a Partner at Clayton, Dubilier & Rice, LLC (private equity investment, 1998-2010); as well as Director of Sony Corporation (2006-2007). In addition, Mr. Lautenbach had a 30-year career with IBM (technology company), during which time he served as Senior Vice President and as a member of the Corporate Executive Committee (1968-1998).
Peter S. Lynch (1944)
Year of Election or Appointment: 2018
Member of the Advisory Board
Mr. Lynch also serves as a Member of the Advisory Board of other Fidelity® funds. Mr. Lynch is Vice Chairman and a Director of Fidelity Management & Research Company LLC (investment adviser firm). In addition, Mr. Lynch serves as a Trustee of Boston College and as the Chairman of the Inner-City Scholarship Fund. Previously, Mr. Lynch served as Vice Chairman and a Director of FMR Co., Inc. (investment adviser firm) and on the Special Olympics International Board of Directors (1997-2006).
Craig S. Brown (1977)
Year of Election or Appointment: 2019
Assistant Treasurer
Mr. Brown also serves as Assistant Treasurer of other funds. Mr. Brown is an employee of Fidelity Investments (2013-present).
John J. Burke III (1964)
Year of Election or Appointment: 2018
Chief Financial Officer
Mr. Burke also serves as Chief Financial Officer of other funds. Mr. Burke serves as Head of Investment Operations for Fidelity Fund and Investment Operations (2018-present) and is an employee of Fidelity Investments (1998-present). Previously Mr. Burke served as head of Asset Management Investment Operations (2012-2018).
William C. Coffey (1969)
Year of Election or Appointment: 2019
Assistant Secretary
Mr. Coffey also serves as Assistant Secretary of other funds. He is Senior Vice President and Deputy General Counsel of FMR LLC (diversified financial services company, 2010-present), and is an employee of Fidelity Investments. Previously, Mr. Coffey served as Secretary and CLO of certain funds (2018-2019); CLO, Secretary, and Senior Vice President of Fidelity Management & Research Company and FMR Co., Inc. (investment adviser firms, 2018-2019); Secretary of Fidelity SelectCo, LLC and Fidelity Investments Money Management, Inc. (investment adviser firms, 2018-2019); CLO of Fidelity Management & Research (Hong Kong) Limited, FMR Investment Management (UK) Limited, and Fidelity Management & Research (Japan) Limited (investment adviser firms, 2018-2019); and Assistant Secretary of certain funds (2009-2018).
Timothy M. Cohen (1969)
Year of Election or Appointment: 2018
Vice President
Mr. Cohen also serves as Vice President of other funds. Mr. Cohen serves as Co-Head of Equity (2018-present), a Director of Fidelity Management & Research (Japan) Limited (investment adviser firm, 2016-present), and is an employee of Fidelity Investments. Previously, Mr. Cohen served as Executive Vice President of Fidelity SelectCo, LLC (2019), Head of Global Equity Research (2016-2018), Chief Investment Officer - Equity and a Director of Fidelity Management & Research (U.K.) Inc. (investment adviser firm, 2013-2015) and as a Director of Fidelity Management & Research (Hong Kong) Limited (investment adviser firm, 2017).
Jonathan Davis (1968)
Year of Election or Appointment: 2010
Assistant Treasurer
Mr. Davis also serves as Assistant Treasurer of other funds. Mr. Davis serves as Assistant Treasurer of FMR Capital, Inc. (2017-present) and is an employee of Fidelity Investments. Previously, Mr. Davis served as Vice President and Associate General Counsel of FMR LLC (diversified financial services company, 2003-2010).
Laura M. Del Prato (1964)
Year of Election or Appointment: 2018
Assistant Treasurer
Ms. Del Prato also serves as an officer of other funds. Ms. Del Prato is an employee of Fidelity Investments (2017-present). Previously, Ms. Del Prato served as President and Treasurer of The North Carolina Capital Management Trust: Cash Portfolio and Term Portfolio (2018-2020). Prior to joining Fidelity Investments, Ms. Del Prato served as a Managing Director and Treasurer of the JPMorgan Mutual Funds (2014-2017). Prior to JPMorgan, Ms. Del Prato served as a partner at Cohen Fund Audit Services (accounting firm, 2012-2013) and KPMG LLP (accounting firm, 2004-2012).
Colm A. Hogan (1973)
Year of Election or Appointment: 2020
Assistant Treasurer
Mr. Hogan also serves as an officer of other funds. Mr. Hogan serves as Assistant Treasurer of FMR Capital, Inc. (2017-present) and is an employee of Fidelity Investments (2005-present). Previously, Mr. Hogan served as Deputy Treasurer of certain Fidelity® funds (2016-2020) and Assistant Treasurer of certain Fidelity® funds (2016-2018).
Pamela R. Holding (1964)
Year of Election or Appointment: 2018
Vice President
Ms. Holding also serves as Vice President of other funds. Ms. Holding serves as Co-Head of Equity (2018-present) and is an employee of Fidelity Investments (2013-present). Previously, Ms. Holding served as Executive Vice President of Fidelity SelectCo, LLC (2019) and as Chief Investment Officer of Fidelity Institutional Asset Management (2013-2018).
Cynthia Lo Bessette (1969)
Year of Election or Appointment: 2019
Secretary and Chief Legal Officer (CLO)
Ms. Lo Bessette also serves as an officer of other funds. Ms. Lo Bessette serves as CLO, Secretary, and Senior Vice President of Fidelity Management & Research Company LLC (investment adviser firm, 2019-present); and CLO of Fidelity Management & Research (Hong Kong) Limited, FMR Investment Management (UK) Limited, and Fidelity Management & Research (Japan) Limited (investment adviser firms, 2019-present). She is a Senior Vice President and Deputy General Counsel of FMR LLC (diversified financial services company, 2019-present), and is an employee of Fidelity Investments. Previously, Ms. Lo Bessette served as CLO, Secretary, and Senior Vice President of FMR Co., Inc. (investment adviser firm, 2019); Secretary of Fidelity SelectCo, LLC and Fidelity Investments Money Management, Inc. (investment adviser firms, 2019). Prior to joining Fidelity Investments, Ms. Lo Bessette was Executive Vice President, General Counsel (2016-2019) and Senior Vice President, Deputy General Counsel (2015-2016) of OppenheimerFunds (investment management company) and Deputy Chief Legal Officer (2013-2015) of Jennison Associates LLC (investment adviser firm).
Chris Maher (1972)
Year of Election or Appointment: 2020
Deputy Treasurer
Mr. Maher also serves as an officer of other funds. Mr. Maher serves as Assistant Treasurer of FMR Capital, Inc. (2017-present), and is an employee of Fidelity Investments (2008-present). Previously, Mr. Maher served as Assistant Treasurer of certain funds (2013-2020); Vice President of Asset Management Compliance (2013), Vice President of the Program Management Group of FMR (investment adviser firm, 2010-2013), and Vice President of Valuation Oversight (2008-2010).
Jason P. Pogorelec (1975)
Year of Election or Appointment: 2020
Chief Compliance Officer
Mr. Pogorelec also serves as Chief Compliance Officer of other funds. Mr. Pogorelec is a senior Vice President of Asset Management Compliance for Fidelity Investments and is an employee of Fidelity Investments (2006-present). Previously, Mr. Pogorelec served as Vice President, Associate General Counsel for Fidelity Investments (2010-2020) and Assistant Secretary of certain Fidelity funds (2015-2020).
Brett Segaloff (1972)
Year of Election or Appointment: 2021
Anti-Money Laundering (AML) Officer
Mr. Segaloff also serves as an AML Officer of other funds and other related entities. He is Director, Anti-Money Laundering (2007-present) of FMR LLC (diversified financial services company) and is an employee of Fidelity Investments (1996-present).
Stacie M. Smith (1974)
Year of Election or Appointment: 2018
President and Treasurer
Ms. Smith also serves as an officer of other funds. Ms. Smith serves as Assistant Treasurer of FMR Capital, Inc. (2017-present), is an employee of Fidelity Investments (2009-present), and has served in other fund officer roles. Prior to joining Fidelity Investments, Ms. Smith served as Senior Audit Manager of Ernst & Young LLP (accounting firm, 1996-2009). Previously, Ms. Smith served as Assistant Treasurer (2013-2019) and Deputy Treasurer (2013-2016) of certain Fidelity® funds.
Marc L. Spector (1972)
Year of Election or Appointment: 2017
Assistant Treasurer
Mr. Spector also serves as an officer of other funds. Mr. Spector serves as Assistant Treasurer of FMR Capital, Inc. (2017-present) and is an employee of Fidelity Investments (2016-present). Prior to joining Fidelity Investments, Mr. Spector served as Director at the Siegfried Group (accounting firm, 2013-2016), and prior to Siegfried Group as audit senior manager at Deloitte & Touche LLP (accounting firm, 2005-2013).
Jim Wegmann (1979)
Year of Election or Appointment: 2019
Assistant Treasurer
Mr. Wegmann also serves as Assistant Treasurer of other funds. Mr. Wegmann is an employee of Fidelity Investments (2011-present).
Shareholder Expense Example
As a shareholder, you incur two types of costs: (1) transaction costs, which may include sales charges (loads) on purchase payments or redemption proceeds, as applicable and (2) ongoing costs, which generally include management fees, distribution and/or service (12b-1) fees and other Fund expenses. This Example is intended to help you understand your ongoing costs (in dollars) of investing in a fund and to compare these costs with the ongoing costs of investing in other mutual funds.
The Example is based on an investment of $1,000 invested at the beginning of the period and held for the entire period (September 1, 2020 to February 28, 2021).
Actual Expenses
The first line of the accompanying table provides information about actual account values and actual expenses. You may use the information in this line, together with the amount you invested, to estimate the expenses that you paid over the period. Simply divide your account value by $1,000.00 (for example, an $8,600 account value divided by $1,000.00 = 8.6), then multiply the result by the number in the first line for a class/Fund under the heading entitled "Expenses Paid During Period" to estimate the expenses you paid on your account during this period. If any fund is a shareholder of any underlying mutual funds or exchange-traded funds (ETFs) (the Underlying Funds), such fund indirectly bears its proportional share of the expenses of the Underlying Funds in addition to the direct expenses incurred presented in the table. These fees and expenses are not included in the annualized expense ratio used to calculate the expense estimate in the table below.
Hypothetical Example for Comparison Purposes
The second line of the accompanying table provides information about hypothetical account values and hypothetical expenses based on the actual expense ratio and an assumed rate of return of 5% per year before expenses, which is not the actual return. The hypothetical account values and expenses may not be used to estimate the actual ending account balance or expenses you paid for the period. You may use this information to compare the ongoing costs of investing in the Fund and other funds. To do so, compare this 5% hypothetical example with the 5% hypothetical examples that appear in the shareholder reports of the other funds. If any fund is a shareholder of any Underlying Funds, such fund indirectly bears its proportional share of the expenses of the Underlying Funds in addition to the direct expenses as presented in the table. These fees and expenses are not included in the annualized expense ratio used to calculate the expense estimate in the table below.
Please note that the expenses shown in the table are meant to highlight your ongoing costs only and do not reflect any transaction costs. Therefore, the second line of the table is useful in comparing ongoing costs only, and will not help you determine the relative total costs of owning different funds. In addition, if these transactional costs were included, your costs would have been higher.
| | Annualized Expense Ratio-A | Beginning
Account Value
September 1, 2020 | Ending
Account Value
February 28, 2021 | Expenses Paid
During Period-B
September 1, 2020
to February 28, 2021 |
| Biotechnology Portfolio | .69% | | | |
| Actual | | $1,000.00 | $1,240.00 | $3.83 |
| Hypothetical-C | | $1,000.00 | $1,021.37 | $3.46 |
| Health Care Portfolio | .69% | | | |
| Actual | | $1,000.00 | $1,111.00 | $3.61 |
| Hypothetical-C | | $1,000.00 | $1,021.37 | $3.46 |
| Health Care Services Portfolio | .72% | | | |
| Actual | | $1,000.00 | $1,112.20 | $3.77 |
| Hypothetical-C | | $1,000.00 | $1,021.22 | $3.61 |
| Medical Technology and Devices Portfolio | .69% | | | |
| Actual | | $1,000.00 | $1,142.20 | $3.66 |
| Hypothetical-C | | $1,000.00 | $1,021.37 | $3.46 |
| Pharmaceuticals Portfolio | .76% | | | |
| Actual | | $1,000.00 | $1,036.70 | $3.84 |
| Hypothetical-C | | $1,000.00 | $1,021.03 | $3.81 |
A Annualized expense ratio reflects expenses net of applicable fee waivers.
B Expenses are equal to the annualized expense ratio, multiplied by the average account value over the period, multiplied by 181/ 365 (to reflect the one-half year period). The fees and expenses of any Underlying Funds are not included in each annualized expense ratio.
C 5% return per year before expenses
Distributions (Unaudited)
The Board of Trustees of each fund voted to pay to shareholders of record at the opening of business on record date, the following distributions per share derived from capital gains realized from sales of portfolio securities, and dividends derived from net investment income:
| | Pay Date | Record Date | Dividends | Capital Gains |
| Biotechnology Portfolio | 04/12/2021 | 04/09/2021 | $0.032 | $1.671 |
| Health Care Portfolio | 04/12/2021 | 04/09/2021 | $0.041 | $1.039 |
| Health Care Services Portfolio | 04/12/2021 | 04/09/2021 | $0.095 | $3.347 |
| Medical Technology and Devices Portfolio | 04/12/2021 | 04/09/2021 | $0.000 | $3.633 |
| Pharmaceuticals Portfolio | 04/12/2021 | 04/09/2021 | $0.054 | $0.721 |
|
The funds hereby designate as capital gain dividend the amounts noted below for the taxable year ended February 28, 2021, or, if subsequently determined to be different, the net capital gain of such year.
| Biotechnology Portfolio | $1,584,228,672 |
| Health Care Portfolio | $1,030,726,607 |
| Health Care Services Portfolio | $30,627,276 |
| Medical Technology and Devices Portfolio | $714,819,240 |
| Pharmaceuticals Portfolio | $50,837,213 |
|
A percentage of the dividends distributed during the fiscal year for the following funds qualify for the dividends–received deduction for corporate shareholders:
| Biotechnology Portfolio | |
| April 2020 | 99% |
| December 2020 | 25% |
| Health Care Portfolio | |
| April 2020 | 48% |
| December 2020 | 20% |
| Health Care Services Portfolio | |
| April 2020 | 100% |
| December 2020 | 100% |
| Medical Technology and Devices Portfolio | |
| April 2020 | –% |
| December 2020 | 100% |
| Pharmaceuticals Portfolio | |
| April 2020 | 81% |
| December 2020 | 38% |
|
A percentage of the dividends distributed during the fiscal year for the following funds may be taken into account as a dividend for purposes of the maximum rate under section 1(h)(11) of the Internal Revenue Code.
| Biotechnology Portfolio | |
| April 2020 | 100% |
| December 2020 | 26% |
| Health Care Portfolio | |
| April 2020 | 82% |
| December 2020 | 34% |
| Health Care Services Portfolio | |
| April 2020 | 100% |
| December 2020 | 100% |
| Medical Technology and Devices Portfolio | |
| April 2020 | –% |
| December 2020 | 100% |
| Pharmaceuticals Portfolio | |
| April 2020 | 70% |
| December 2020 | 71% |
|
The funds hereby designate the percentages noted below of the short-term capital gain dividends distributed during the fiscal year as qualifying to be taxed as short-term capital gain dividends for nonresident alien shareholders:
| | April, 2020 | December, 2020 |
| Biotechnology Portfolio | –% | 100% |
| Health Care Portfolio | 100% | 100% |
| Health Care Services Portfolio | –% | –% |
| Medical Technology and Devices Portfolio | –% | 100% |
| Pharmaceuticals Portfolio | 100% | 100% |
|
The funds will notify shareholders in January 2022 of amounts for use in preparing 2021 income tax returns.
Board Approval of Investment Advisory Contracts
Biotechnology PortfolioHealth Care PortfolioHealth Care Services PortfolioMedical Technology and Devices PortfolioPharmaceuticals PortfolioAt its January 2021 meeting, the Board of Trustees, including the Independent Trustees (together, the Board), voted to continue the management contract with Fidelity Management & Research Company LLC (FMR), and the sub-advisory agreements and sub-subadvisory agreements, in each case, where applicable (together, the Advisory Contracts) for each fund for four months from February 1, 2021 through May 31, 2021, in connection with changes to the Board's meeting calendar.
The Board considered that the approval of each fund's Advisory Contracts will not result in any changes in (i) the investment process or strategies employed in the management of each fund's assets; (ii) the fees and expenses paid by shareholders; (iii) the nature, extent or quality of services provided under each fund's Advisory Contracts; or (iv) the day-to-day management of each fund or the persons primarily responsible for such management. The Board also considered that since its last approval of each fund's Advisory Contracts, FMR had provided additional information on each fund in support of the annual contract renewal process, including competitive analyses on total expenses and management fees and in-depth reviews of fund performance and fund profitability information. The Board also considered the findings of certain ad hoc committees that had been previously formed to discuss matters relevant to all of the Fidelity funds, including economies of scale, fall-out benefits and retail vs. institutional funds. The Board concluded that each fund's Advisory Contracts are fair and reasonable, and that each fund's Advisory Contracts should be renewed, without modification, through May 31, 2021, with the understanding that the Board will consider the annual renewal for a full one year period in May 2021.
In connection with its consideration of future renewals of each fund's Advisory Contracts, the Board will consider: (i) the nature, extent and quality of services provided to the funds, including shareholder and administrative services and investment performance; (ii) the competitiveness of the management fee and total expenses for each fund; (iii) the costs of the services and profitability, including the revenues earned and the expenses incurred in conducting the business of developing, marketing, distributing, managing, administering, and servicing each fund and its shareholders, to the extent applicable; and (iv) whether there have been economies of scale in respect of the Fidelity funds, whether the Fidelity funds (including the funds) have appropriately benefited from any such economies of scale, and whether there is the potential for realization of any further economies.
Based on its evaluation of all of the conclusions noted above, and after considering all factors it believed relevant, the Board ultimately concluded that each fund's management fee structures are fair and reasonable, and that the continuation of the funds' Advisory Contracts should be approved for four months from February 1, 2021 through May 31, 2021.
Liquidity Risk Management Program
The Securities and Exchange Commission adopted Rule 22e-4 under the Investment Company Act of 1940 (the Liquidity Rule) to promote effective liquidity risk management throughout the open-end investment company industry, thereby reducing the risk that funds will be unable to meet their redemption obligations and mitigating dilution of the interests of fund shareholders.
The Funds have adopted and implemented a liquidity risk management program pursuant to the Liquidity Rule (the Program) effective December 1, 2018. The Program is reasonably designed to assess and manage each Fund’s liquidity risk and to comply with the requirements of the Liquidity Rule. Each Fund’s Board of Trustees (the Board) has designated each Fund’s investment adviser as administrator of the Program. The Fidelity advisers have established a Liquidity Risk Management Committee (the LRM Committee) to manage the Program for each of the Fidelity Funds. The LRM Committee monitors the adequacy and effectiveness of implementation of the Program and on a periodic basis assesses each Fund’s liquidity risk based on a variety of factors including (1) the Fund’s investment strategy, (2) portfolio liquidity and cash flow projections during normal and reasonably foreseeable stressed conditions, (3) shareholder redemptions, (4) borrowings and other funding sources and (5) in the case of exchange-traded funds, certain additional factors including the effect of the Fund’s prices and spreads, market participants, and basket compositions on the overall liquidity of the Fund’s portfolio, as applicable.
In accordance with the Program, each of the Fund’s portfolio investments is classified into one of four liquidity categories described below based on a determination of a reasonable expectation for how long it would take to convert the investment to cash (or sell or dispose of the investment) without significantly changing its market value.
- Highly liquid investments – cash or convertible to cash within three business days or less
- Moderately liquid investments – convertible to cash in three to seven calendar days
- Less liquid investments – can be sold or disposed of, but not settled, within seven calendar days
- Illiquid investments – cannot be sold or disposed of within seven calendar days
Liquidity classification determinations take into account a variety of factors including various market, trading and investment-specific considerations, as well as market depth, and generally utilize analysis from a third-party liquidity metrics service.
The Liquidity Rule places a 15% limit on a fund’s illiquid investments and requires funds that do not primarily hold assets that are highly liquid investments to determine and maintain a minimum percentage of the fund’s net assets to be invested in highly liquid investments (highly liquid investment minimum or HLIM). The Program includes provisions reasonably designed to comply with the 15% limit on illiquid investments and for determining, periodically reviewing and complying with the HLIM requirement as applicable.
At a recent meeting of the Fund’s Board of Trustees, the LRM Committee provided a written report to the Board pertaining to the operation, adequacy, and effectiveness of implementation of the Program for the annual period from December 1, 2019 through November 30, 2020. The report concluded that the Program has been implemented and is operating effectively and is reasonably designed to assess and manage the Fund’s liquidity risk.
Proxy Voting Results
A special meeting of shareholders was held on June 9, 2020. The results of votes taken among shareholders on the proposal before them are reported below. Each vote reported represents one dollar of net asset value held on the record date for the meeting.
PROPOSAL 1
To elect a Board of Trustees.
| | # of
Votes | % of
Votes |
| Dennis J. Dirks |
| Affirmative | 32,463,705,305.665 | 92.437 |
| Withheld | 2,655,951,104.308 | 7.563 |
| TOTAL | 35,119,656,409.973 | 100.000 |
| Donald F. Donahue |
| Affirmative | 32,446,843,861.354 | 92.389 |
| Withheld | 2,672,812,548.619 | 7.611 |
| TOTAL | 35,119,656,409.973 | 100.000 |
| Bettina Doulton |
| Affirmative | 32,610,463,757.584 | 92.855 |
| Withheld | 2,509,192,652.389 | 7.145 |
| TOTAL | 35,119,656,409.973 | 100.000 |
| Vicki L. Fuller |
| Affirmative | 32,688,213,522.720 | 93.077 |
| Withheld | 2,431,442,887.253 | 6.923 |
| TOTAL | 35,119,656,409.973 | 100.000 |
| Patricia L. Kampling |
| Affirmative | 32,313,755,598.535 | 92.010 |
| Withheld | 2,805,900,811.438 | 7.990 |
| TOTAL | 35,119,656,409.973 | 100.000 |
| Alan J. Lacy |
| Affirmative | 31,990,158,754.948 | 91.089 |
| Withheld | 3,129,497,655.026 | 8.911 |
| TOTAL | 35,119,656,409.973 | 100.000 |
| Ned C. Lautenbach |
| Affirmative | 32,043,019,991.143 | 91.240 |
| Withheld | 3,076,636,418.830 | 8.760 |
| TOTAL | 35,119,656,409.973 | 100.000 |
| Robert A. Lawrence |
| Affirmative | 32,150,842,398.009 | 91.547 |
| Withheld | 2,968,814,011.965 | 8.453 |
| TOTAL | 35,119,656,409.973 | 100.000 |
| Joseph Mauriello |
| Affirmative | 32,082,201,213.166 | 91.351 |
| Withheld | 3,037,455,196.807 | 8.649 |
| TOTAL | 35,119,656,409.973 | 100.000 |
| Cornelia M. Small |
| Affirmative | 32,207,976,835.934 | 91.709 |
| Withheld | 2,911,679,574.039 | 8.291 |
| TOTAL | 35,119,656,409.973 | 100.000 |
| Garnett A. Smith |
| Affirmative | 32,102,654,343.096 | 91.409 |
| Withheld | 3,017,002,066.877 | 8.591 |
| TOTAL | 35,119,656,409.973 | 100.000 |
| David M. Thomas |
| Affirmative | 32,150,749,424.556 | 91.546 |
| Withheld | 2,968,906,985.418 | 8.454 |
| TOTAL | 35,119,656,409.973 | 100.000 |
| Susan Tomasky |
| Affirmative | 32,381,933,484.515 | 92.205 |
| Withheld | 2,737,722,925.459 | 7.795 |
| TOTAL | 35,119,656,409.973 | 100.000 |
| Michael E. Wiley |
| Affirmative | 32,135,064,741.973 | 91.502 |
| Withheld | 2,984,591,668.000 | 8.498 |
| TOTAL | 35,119,656,409.973 | 100.000 |
|
| Proposal 1 reflects trust wide proposal and voting results. |
SELHC-ANN-0421
1.813640.116
Fidelity® Select Portfolios®
Industrials Sector
Air Transportation Portfolio
Defense and Aerospace Portfolio
Environment and Alternative Energy Portfolio (to be renamed Fidelity Environment and Alternative Energy Fund effective May 1, 2021)
Industrials Portfolio
Transportation Portfolio
Annual Report
February 28, 2021
Contents
To view a fund's proxy voting guidelines and proxy voting record for the 12-month period ended June 30, visit http://www.fidelity.com/proxyvotingresults or visit the Securities and Exchange Commission's (SEC) web site at http://www.sec.gov.
You may also call 1-800-544-8544 to request a free copy of the proxy voting guidelines.
Standard & Poor's, S&P and S&P 500 are registered service marks of The McGraw-Hill Companies, Inc. and have been licensed for use by Fidelity Distributors Corporation.
Other third-party marks appearing herein are the property of their respective owners.
All other marks appearing herein are registered or unregistered trademarks or service marks of FMR LLC or an affiliated company. © 2021 FMR LLC. All rights reserved.
This report and the financial statements contained herein are submitted for the general information of the shareholders of the Funds. This report is not authorized for distribution to prospective investors in the Funds unless preceded or accompanied by an effective prospectus.
A fund files its complete schedule of portfolio holdings with the SEC for the first and third quarters of each fiscal year on Form N-PORT. Forms N-PORT are available on the SEC’s web site at http://www.sec.gov. A fund's Forms N-PORT may be reviewed and copied at the SEC’s Public Reference Room in Washington, DC. Information regarding the operation of the SEC's Public Reference Room may be obtained by calling 1-800-SEC-0330.
For a complete list of a fund's portfolio holdings, view the most recent holdings listing, semiannual report, or annual report on Fidelity's web site at http://www.fidelity.com, http://www.institutional.fidelity.com, or http://www.401k.com, as applicable.
NOT FDIC INSURED •MAY LOSE VALUE •NO BANK GUARANTEE
Neither the Funds nor Fidelity Distributors Corporation is a bank.
Note to Shareholders:
Early in 2020, the outbreak and spread of a new coronavirus emerged as a public health emergency that had a major influence on financial markets, primarily based on its impact on the global economy and the outlook for corporate earnings. The virus causes a respiratory disease known as COVID-19. On March 11, 2020 the World Health Organization declared the COVID-19 outbreak a pandemic, citing sustained risk of further global spread.
In the weeks following, as the crisis worsened, we witnessed an escalating human tragedy with wide-scale social and economic consequences from coronavirus-containment measures. The outbreak of COVID-19 prompted a number of measures to limit the spread, including travel and border restrictions, quarantines, and restrictions on large gatherings. In turn, these resulted in lower consumer activity, diminished demand for a wide range of products and services, disruption in manufacturing and supply chains, and – given the wide variability in outcomes regarding the outbreak – significant market uncertainty and volatility. Amid the turmoil, global governments and central banks took unprecedented action to help support consumers, businesses, and the broader economies, and to limit disruption to financial systems.
The situation continues to unfold, and the extent and duration of its impact on financial markets and the economy remain highly uncertain. Extreme events such as the coronavirus crisis are “exogenous shocks” that can have significant adverse effects on mutual funds and their investments. Although multiple asset classes may be affected by market disruption, the duration and impact may not be the same for all types of assets.
Fidelity is committed to helping you stay informed amid news about COVID-19 and during increased market volatility, and we’re taking extra steps to be responsive to customer needs. We encourage you to visit our websites, where we offer ongoing updates, commentary, and analysis on the markets and our funds.
Air Transportation Portfolio
Performance: The Bottom Line
Average annual total return reflects the change in the value of an investment, assuming reinvestment of distributions from dividend income and capital gains (the profits earned upon the sale of securities that have grown in value, if any) and assuming a constant rate of performance each year. The hypothetical investment and the average annual total returns do not reflect the deduction of taxes that a shareholder would pay on fund distributions or the redemption of fund shares. During periods of reimbursement by Fidelity, a fund’s total return will be greater than it would be had the reimbursement not occurred. How a fund did yesterday is no guarantee of how it will do tomorrow.
Average Annual Total Returns
| For the periods ended February 28, 2021 | Past 1 year | Past 5 years | Past 10 years |
| Air Transportation Portfolio | 12.76% | 8.77% | 11.14% |
$10,000 Over 10 Years
Let's say hypothetically that $10,000 was invested in Air Transportation Portfolio on February 28, 2011.
The chart shows how the value of your investment would have changed, and also shows how the S&P 500® Index performed over the same period.
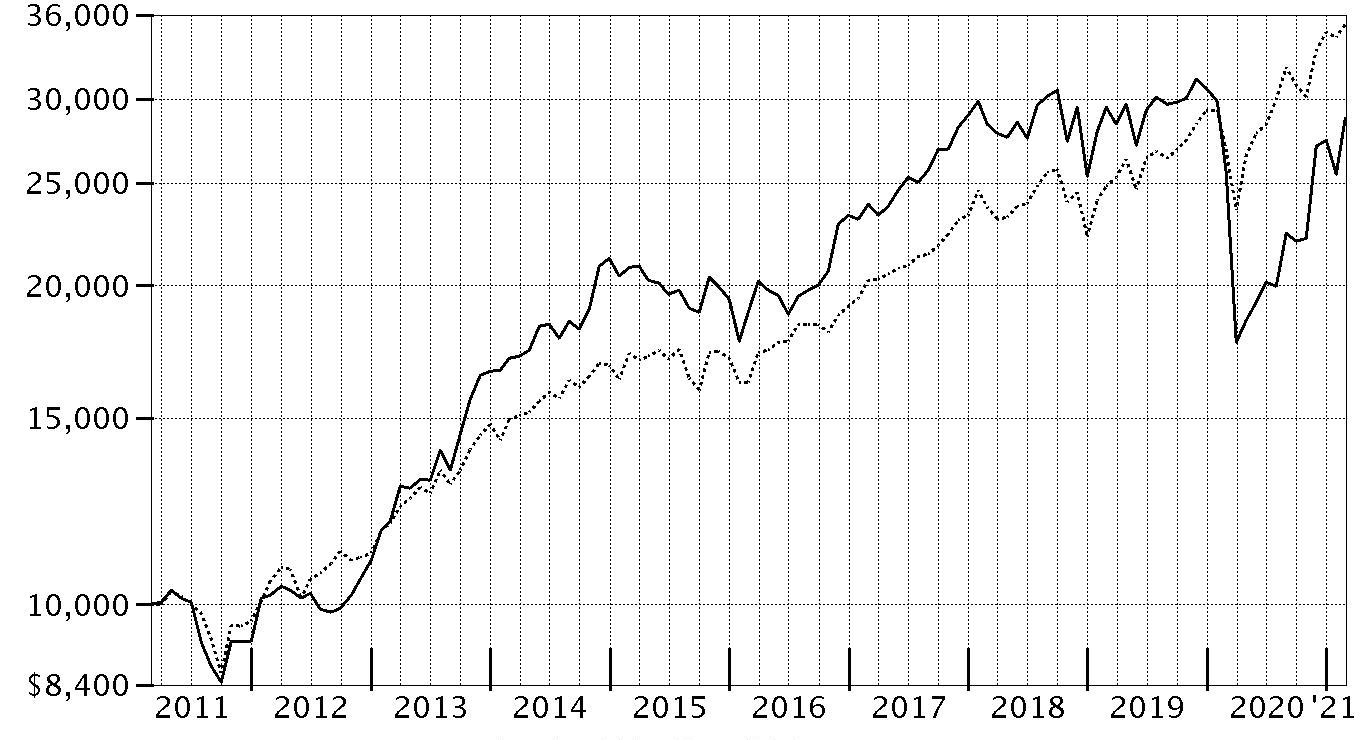
| Period Ending Values |
| $28,766 | Air Transportation Portfolio |
| $35,259 | S&P 500® Index |
Air Transportation Portfolio
Management's Discussion of Fund Performance
Market Recap: The S&P 500
® index gained 31.29% for the 12 months ending February 28, 2021, a volatile but productive period for U.S. risk assets. The early-2020 outbreak and spread of COVID-19 resulted in stocks suffering one of the quickest declines on record, through March 23, followed by a historic rebound that included the index closing 2020 at an all-time high and gaining modest ground in the first two months of the new year. The crisis and containment efforts caused broad contraction in economic activity, along with extreme uncertainty and dislocation in financial markets. A rapid and expansive U.S. monetary/fiscal-policy response partially offset the economic disruption and fueled the market surge, as did resilient corporate earnings. The rally slowed in September, when stocks began a two-month retreat amid Congress’s inability to reach a deal on additional fiscal stimulus, as well as concerns about election uncertainty, indications the U.S. economic recovery could be slowing and a new wave of COVID-19 cases. A shift in momentum began in October and accelerated following the U.S. elections, with the approval of three breakthrough COVID-19 vaccines and prospects for additional government stimulus fueling the “reflation trade” through February 28. By sector for the full 12 months, information technology (+50%) and consumer discretionary (+43%) led all gainers. Materials (+42%) and communication services (+37%) also stood out. In contrast, the defensive utilities (-3%) and real estate sectors (+5%) notably lagged.
Comments from Portfolio Manager Matthew Moulis: For the fiscal year ending February 28, 2021, the fund gained 12.76%, trailing the 16.94% advance of the Nasdaq North America Air Transportation Total Return Linked Index, as well as the broad-based S&P 500
® index. The largest detractor from performance versus the industry index was an overweighting and security selection in air freight & logistics. An underweighting coupled with subpar picks among airlines stocks hurt as well. Modest out-of-index exposure to the building products category further pressured performance. The fund's largest individual relative detractor was an underweighting in FedEx, which gained approximately 83% the past 12 months. The company was among our biggest holdings on February 28. Also holding back performance was our overweighting in Air Transport Services, which gained roughly 50% and was one of the portfolio's largest holdings. Further hampering the fund’s relative result was our lighter-than-index stake in United Parcel Service, which gained about 80% and was another of the fund's biggest holdings. Conversely, the largest contributor to performance versus the industry index was an underweighting and stock picking within the aerospace & defense group. Non-index allocations to trucking and application software firms also bolstered the fund's relative return. Our largest individual relative contributor was an underweighting in Boeing, which returned -23% the past 12 months. We increased our exposure to the stock this period. Also bolstering performance was our lighter-than-index stake in the shares of Raytheon Technologies, which returned roughly -4% and was one of our largest holdings as of period end. Another key relative contributor was an underweighting in Spirit Aerosystem (-19%). Notable changes in positioning include increased exposure to the air freight & logistics segment and a lower allocation to aerospace & defense companies.
The views expressed above reflect those of the portfolio manager(s) only through the end of the period as stated on the cover of this report and do not necessarily represent the views of Fidelity or any other person in the Fidelity organization. Any such views are subject to change at any time based upon market or other conditions and Fidelity disclaims any responsibility to update such views. These views may not be relied on as investment advice and, because investment decisions for a Fidelity fund are based on numerous factors, may not be relied on as an indication of trading intent on behalf of any Fidelity fund.
Air Transportation Portfolio
Investment Summary (Unaudited)
Top Ten Stocks as of February 28, 2021
| | % of fund's net assets |
| Air Transport Services Group, Inc. | 7.8 |
| Delta Air Lines, Inc. | 7.2 |
| United Parcel Service, Inc. Class B | 6.6 |
| Raytheon Technologies Corp. | 6.0 |
| Southwest Airlines Co. | 5.8 |
| Alaska Air Group, Inc. | 4.7 |
| FedEx Corp. | 4.5 |
| Teledyne Technologies, Inc. | 4.3 |
| United Airlines Holdings, Inc. | 4.0 |
| SkyWest, Inc. | 3.6 |
| | 54.5 |
Top Industries (% of fund's net assets)
| As of February 28, 2021 |
| | Airlines | 31.5% |
| | Aerospace & Defense | 29.9% |
| | Air Freight & Logistics | 26.6% |
| | Machinery | 4.5% |
| | Road & Rail | 2.1% |
| | All Others* | 5.4% |
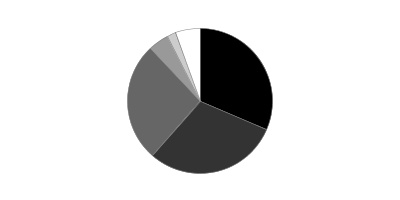
* Includes short-term investments and net other assets (liabilities).
Air Transportation Portfolio
Schedule of Investments February 28, 2021
Showing Percentage of Net Assets
| Common Stocks - 97.0% | | | |
| | | Shares | Value |
| Aerospace & Defense - 29.9% | | | |
| Aerospace & Defense - 29.9% | | | |
| CAE, Inc. | | 315,500 | $8,349,866 |
| Elbit Systems Ltd. (Israel) | | 15,500 | 2,016,843 |
| HEICO Corp. Class A | | 24,400 | 2,824,544 |
| Heroux-Devtek, Inc. (a) | | 167,200 | 2,018,067 |
| Howmet Aerospace, Inc. | | 275,300 | 7,738,683 |
| Huntington Ingalls Industries, Inc. | | 4,900 | 861,959 |
| Moog, Inc. Class A | | 65,200 | 5,063,432 |
| Northrop Grumman Corp. | | 11,200 | 3,266,592 |
| Raytheon Technologies Corp. | | 300,400 | 21,625,796 |
| Spirit AeroSystems Holdings, Inc. Class A | | 45,100 | 1,931,633 |
| Teledyne Technologies, Inc. (a) | | 42,000 | 15,582,000 |
| Textron, Inc. | | 183,300 | 9,227,322 |
| The Boeing Co. | | 58,410 | 12,383,504 |
| TransDigm Group, Inc. (a) | | 19,700 | 11,360,399 |
| Virgin Galactic Holdings, Inc. (a)(b) | | 104,200 | 3,879,366 |
| | | | 108,130,006 |
| Air Freight & Logistics - 26.6% | | | |
| Air Freight & Logistics - 26.6% | | | |
| Air Transport Services Group, Inc. (a) | | 1,063,550 | 28,226,617 |
| Atlas Air Worldwide Holdings, Inc. (a)(b) | | 231,400 | 12,757,082 |
| C.H. Robinson Worldwide, Inc. | | 6,300 | 572,355 |
| Cargojet, Inc. | | 68,900 | 10,344,745 |
| Echo Global Logistics, Inc. (a) | | 29,700 | 827,442 |
| Expeditors International of Washington, Inc. | | 21,100 | 1,937,824 |
| FedEx Corp. | | 63,700 | 16,211,650 |
| Hub Group, Inc. Class A (a) | | 28,800 | 1,658,304 |
| United Parcel Service, Inc. Class B | | 150,550 | 23,761,307 |
| | | | 96,297,326 |
| Airlines - 31.5% | | | |
| Airlines - 31.5% | | | |
| Air Canada (a) | | 464,300 | 9,157,575 |
| Alaska Air Group, Inc. | | 263,100 | 17,106,762 |
| Allegiant Travel Co. (b) | | 27,400 | 6,910,006 |
| Copa Holdings SA Class A | | 43,300 | 3,969,311 |
| Delta Air Lines, Inc. | | 546,102 | 26,180,130 |
| Global Crossing Airlines Group (a) | | 5,000 | 8,958 |
| Hawaiian Holdings, Inc. | | 300 | 8,046 |
| Jet2 PLC | | 43,900 | 889,288 |
| Mesa Air Group, Inc. (a)(b) | | 118,700 | 1,448,140 |
| SkyWest, Inc. | | 228,200 | 12,863,634 |
| Southwest Airlines Co. | | 359,400 | 20,891,922 |
| United Airlines Holdings, Inc. (a) | | 274,900 | 14,481,732 |
| | | | 113,915,504 |
| Building Products - 0.1% | | | |
| Building Products - 0.1% | | | |
| Carrier Global Corp. | | 8,270 | 302,103 |
| Internet & Direct Marketing Retail - 1.0% | | | |
| Internet & Direct Marketing Retail - 1.0% | | | |
| Points International Ltd. (a) | | 221,500 | 3,488,625 |
| IT Services - 0.8% | | | |
| IT Consulting & Other Services - 0.8% | | | |
| CACI International, Inc. Class A (a) | | 13,000 | 2,877,420 |
| Machinery - 4.5% | | | |
| Industrial Machinery - 4.5% | | | |
| Otis Worldwide Corp. | | 3,685 | 234,771 |
| Park-Ohio Holdings Corp. | | 49,490 | 1,600,012 |
| RBC Bearings, Inc. (a)(b) | | 47,800 | 9,515,068 |
| Woodward, Inc. | | 41,400 | 4,728,708 |
| | | | 16,078,559 |
| Road & Rail - 2.1% | | | |
| Trucking - 2.1% | | | |
| J.B. Hunt Transport Services, Inc. | | 1,600 | 234,992 |
| Knight-Swift Transportation Holdings, Inc. Class A | | 27,700 | 1,196,640 |
| Landstar System, Inc. | | 1,900 | 304,266 |
| Ryder System, Inc. | | 7,200 | 487,944 |
| Schneider National, Inc. Class B | | 20,600 | 476,478 |
| TFI International, Inc. | | 59,100 | 4,126,362 |
| U.S. Xpress Enterprises, Inc. (a) | | 21,900 | 202,575 |
| U.S.A. Truck, Inc. (a) | | 10,400 | 144,560 |
| Universal Logistics Holdings, Inc. | | 15,300 | 358,173 |
| | | | 7,531,990 |
| Trading Companies & Distributors - 0.5% | | | |
| Trading Companies & Distributors - 0.5% | | | |
| Air Lease Corp. Class A | | 38,600 | 1,770,196 |
| Willis Lease Finance Corp. (a) | | 6,000 | 193,800 |
| | | | 1,963,996 |
| TOTAL COMMON STOCKS | | | |
| (Cost $239,005,705) | | | 350,585,529 |
|
| Money Market Funds - 4.4% | | | |
| Fidelity Cash Central Fund 0.07% (c) | | 10,443,463 | 10,445,552 |
| Fidelity Securities Lending Cash Central Fund 0.08% (c)(d) | | 5,700,785 | 5,701,355 |
| TOTAL MONEY MARKET FUNDS | | | |
| (Cost $16,146,907) | | | 16,146,907 |
| TOTAL INVESTMENT IN SECURITIES - 101.4% | | | |
| (Cost $255,152,612) | | | 366,732,436 |
| NET OTHER ASSETS (LIABILITIES) - (1.4)% | | | (5,181,546) |
| NET ASSETS - 100% | | | $361,550,890 |
Legend
(a) Non-income producing
(b) Security or a portion of the security is on loan at period end.
(c) Affiliated fund that is generally available only to investment companies and other accounts managed by Fidelity Investments. The rate quoted is the annualized seven-day yield of the fund at period end. A complete unaudited listing of the fund's holdings as of its most recent quarter end is available upon request. In addition, each Fidelity Central Fund's financial statements, which are not covered by the Fund's Report of Independent Registered Public Accounting Firm, are available on the SEC's website or upon request.
(d) Investment made with cash collateral received from securities on loan.
Affiliated Central Funds
Information regarding fiscal year to date income earned by the Fund from investments in Fidelity Central Funds is as follows:
| Fund | Income earned |
| Fidelity Cash Central Fund | $12,118 |
| Fidelity Securities Lending Cash Central Fund | 164,843 |
| Total | $176,961 |
Amounts in the income column in the above table include any capital gain distributions from underlying funds, which are presented in the corresponding line-item in the Statement of Operations, if applicable. Amount for Fidelity Securities Lending Cash Central Fund represents the income earned on investing cash collateral, less rebates paid to borrowers and any lending agent fees associated with the loan, plus any premium payments received for lending certain types of securities.
Investment Valuation
The following is a summary of the inputs used, as of February 28, 2021, involving the Fund's assets and liabilities carried at fair value. The inputs or methodology used for valuing securities may not be an indication of the risk associated with investing in those securities. For more information on valuation inputs, and their aggregation into the levels used below, please refer to the Investment Valuation section in the accompanying Notes to Financial Statements.
| | Valuation Inputs at Reporting Date: |
| Description | Total | Level 1 | Level 2 | Level 3 |
| Investments in Securities: | | | | |
| Common Stocks | $350,585,529 | $350,585,529 | $-- | $-- |
| Money Market Funds | 16,146,907 | 16,146,907 | -- | -- |
| Total Investments in Securities: | $366,732,436 | $366,732,436 | $-- | $-- |
Other Information
Distribution of investments by country or territory of incorporation, as a percentage of Total Net Assets, is as follows (Unaudited):
| United States of America | 87.5% |
| Canada | 10.5% |
| Panama | 1.1% |
| Others (Individually Less Than 1%) | 0.9% |
| | 100.0% |
See accompanying notes which are an integral part of the financial statements.
Air Transportation Portfolio
Financial Statements
Statement of Assets and Liabilities
| | | February 28, 2021 |
| Assets | | |
Investment in securities, at value (including securities loaned of $5,041,883) — See accompanying schedule:
Unaffiliated issuers (cost $239,005,705) | $350,585,529 | |
| Fidelity Central Funds (cost $16,146,907) | 16,146,907 | |
| Total Investment in Securities (cost $255,152,612) | | $366,732,436 |
| Receivable for investments sold | | 371,267 |
| Receivable for fund shares sold | | 1,319,487 |
| Dividends receivable | | 349,559 |
| Distributions receivable from Fidelity Central Funds | | 2,255 |
| Prepaid expenses | | 2,133 |
| Other receivables | | 2,686 |
| Total assets | | 368,779,823 |
| Liabilities | | |
| Payable for investments purchased | $362,191 | |
| Payable for fund shares redeemed | 907,396 | |
| Accrued management fee | 153,834 | |
| Other affiliated payables | 68,246 | |
| Other payables and accrued expenses | 36,616 | |
| Collateral on securities loaned | 5,700,650 | |
| Total liabilities | | 7,228,933 |
| Net Assets | | $361,550,890 |
| Net Assets consist of: | | |
| Paid in capital | | $274,265,900 |
| Total accumulated earnings (loss) | | 87,284,990 |
| Net Assets | | $361,550,890 |
| Net Asset Value, offering price and redemption price per share ($361,550,890 ÷ 5,446,563 shares) | | $66.38 |
See accompanying notes which are an integral part of the financial statements.
Statement of Operations
| | | Year ended February 28, 2021 |
| Investment Income | | |
| Dividends | | $1,566,204 |
| Income from Fidelity Central Funds (including $164,843 from security lending) | | 176,961 |
| Total income | | 1,743,165 |
| Expenses | | |
| Management fee | $1,428,151 | |
| Transfer agent fees | 615,236 | |
| Accounting fees | 104,917 | |
| Custodian fees and expenses | 16,193 | |
| Independent trustees' fees and expenses | 1,412 | |
| Registration fees | 57,893 | |
| Audit | 38,280 | |
| Legal | 830 | |
| Miscellaneous | 8,335 | |
| Total expenses before reductions | 2,271,247 | |
| Expense reductions | (32,640) | |
| Total expenses after reductions | | 2,238,607 |
| Net investment income (loss) | | (495,442) |
| Realized and Unrealized Gain (Loss) | | |
| Net realized gain (loss) on: | | |
| Investment securities: | | |
| Unaffiliated issuers | (21,495,851) | |
| Fidelity Central Funds | 718 | |
| Foreign currency transactions | 6,282 | |
| Total net realized gain (loss) | | (21,488,851) |
| Change in net unrealized appreciation (depreciation) on: | | |
| Investment securities: | | |
| Unaffiliated issuers | 84,474,328 | |
| Fidelity Central Funds | (84) | |
| Total change in net unrealized appreciation (depreciation) | | 84,474,244 |
| Net gain (loss) | | 62,985,393 |
| Net increase (decrease) in net assets resulting from operations | | $62,489,951 |
See accompanying notes which are an integral part of the financial statements.
Statement of Changes in Net Assets
| | Year ended February 28, 2021 | Year ended February 29, 2020 |
| Increase (Decrease) in Net Assets | | |
| Operations | | |
| Net investment income (loss) | $(495,442) | $3,469,072 |
| Net realized gain (loss) | (21,488,851) | 25,989,344 |
| Change in net unrealized appreciation (depreciation) | 84,474,244 | (62,958,416) |
| Net increase (decrease) in net assets resulting from operations | 62,489,951 | (33,500,000) |
| Distributions to shareholders | (5,293,284) | (26,369,146) |
| Share transactions | | |
| Proceeds from sales of shares | 328,745,456 | 68,675,973 |
| Reinvestment of distributions | 5,072,639 | 25,095,120 |
| Cost of shares redeemed | (245,559,011) | (124,669,961) |
| Net increase (decrease) in net assets resulting from share transactions | 88,259,084 | (30,898,868) |
| Total increase (decrease) in net assets | 145,455,751 | (90,768,014) |
| Net Assets | | |
| Beginning of period | 216,095,139 | 306,863,153 |
| End of period | $361,550,890 | $216,095,139 |
| Other Information | | |
| Shares | | |
| Sold | 6,518,277 | 889,941 |
| Issued in reinvestment of distributions | 121,734 | 339,914 |
| Redeemed | (4,752,310) | (1,681,395) |
| Net increase (decrease) | 1,887,701 | (451,540) |
See accompanying notes which are an integral part of the financial statements.
Financial Highlights
Air Transportation Portfolio
| | | | | | |
| Years ended February 28, | 2021 | 2020 A | 2019 | 2018 | 2017 |
| Selected Per–Share Data | | | | | |
| Net asset value, beginning of period | $60.72 | $76.52 | $82.64 | $76.04 | $60.60 |
| Income from Investment Operations | | | | | |
| Net investment income (loss)B | (.10) | .90C | .54 | .48D | .32 |
| Net realized and unrealized gain (loss) | 7.07 | (10.09) | 1.73 | 13.85 | 15.61 |
| Total from investment operations | 6.97 | (9.19) | 2.27 | 14.33 | 15.93 |
| Distributions from net investment income | (.32) | (.70) | (.48) | (.38) | (.25) |
| Distributions from net realized gain | (1.00) | (5.92) | (7.91) | (7.36) | (.24) |
| Total distributions | (1.31)E | (6.61)E | (8.39) | (7.73)E | (.49) |
| Redemption fees added to paid in capitalB | – | – | – | –F | –F |
| Net asset value, end of period | $66.38 | $60.72 | $76.52 | $82.64 | $76.04 |
| Total ReturnG | 12.76% | (13.48)% | 3.79% | 19.07% | 26.30% |
| Ratios to Average Net AssetsH,I | | | | | |
| Expenses before reductions | .85% | .81% | .81% | .82% | .85% |
| Expenses net of fee waivers, if any | .84% | .81% | .81% | .82% | .85% |
| Expenses net of all reductions | .83% | .81% | .81% | .82% | .84% |
| Net investment income (loss) | (.18)% | 1.19%C | .70% | .59%D | .48% |
| Supplemental Data | | | | | |
| Net assets, end of period (000 omitted) | $361,551 | $216,095 | $306,863 | $382,530 | $394,143 |
| Portfolio turnover rateJ | 93% | 95% | 32% | 86% | 106% |
A For the year ended February 29.
B Calculated based on average shares outstanding during the period.
C Net investment income per share reflects one or more large, non-recurring dividend(s) which amounted to $.54 per share. Excluding such non-recurring dividend(s), the ratio of net investment income (loss) to average net assets would have been .48%.
D Net investment income per share reflects one or more large, non-recurring dividend(s) which amounted to $.22 per share. Excluding such non-recurring dividend(s), the ratio of net investment income (loss) to average net assets would have been .31%.
E Total distributions per share do not sum due to rounding.
F Amount represents less than $.005 per share.
G Total returns would have been lower if certain expenses had not been reduced during the applicable periods shown.
H Fees and expenses of any underlying mutual funds or exchange-traded funds (ETFs) are not included in the Fund's expense ratio. The Fund indirectly bears its proportionate share of these expenses. For additional expense information related to investments in Fidelity Central Funds, please refer to the "Investments in Fidelity Central Funds" note found in the Notes to Financial Statements section of the most recent Annual or Semi-Annual report.
I Expense ratios reflect operating expenses of the class. Expenses before reductions do not reflect amounts reimbursed, waived, or reduced through arrangements with the investment advisor, brokerage services, or other offset arrangements, if applicable, and do not represent the amount paid by the class during periods when reimbursements, waivers or reductions occur.
J Amount does not include the portfolio activity of any underlying mutual funds or exchange-traded funds (ETFs).
See accompanying notes which are an integral part of the financial statements.
Defense and Aerospace Portfolio
Performance: The Bottom Line
Average annual total return reflects the change in the value of an investment, assuming reinvestment of distributions from dividend income and capital gains (the profits earned upon the sale of securities that have grown in value, if any) and assuming a constant rate of performance each year. The hypothetical investment and the average annual total returns do not reflect the deduction of taxes that a shareholder would pay on fund distributions or the redemption of fund shares. During periods of reimbursement by Fidelity, a fund’s total return will be greater than it would be had the reimbursement not occurred. How a fund did yesterday is no guarantee of how it will do tomorrow.
Average Annual Total Returns
| For the periods ended February 28, 2021 | Past 1 year | Past 5 years | Past 10 years |
| Defense and Aerospace Portfolio | 0.69% | 13.87% | 12.48% |
$10,000 Over 10 Years
Let's say hypothetically that $10,000 was invested in Defense and Aerospace Portfolio on February 28, 2011.
The chart shows how the value of your investment would have changed, and also shows how the S&P 500® Index performed over the same period.
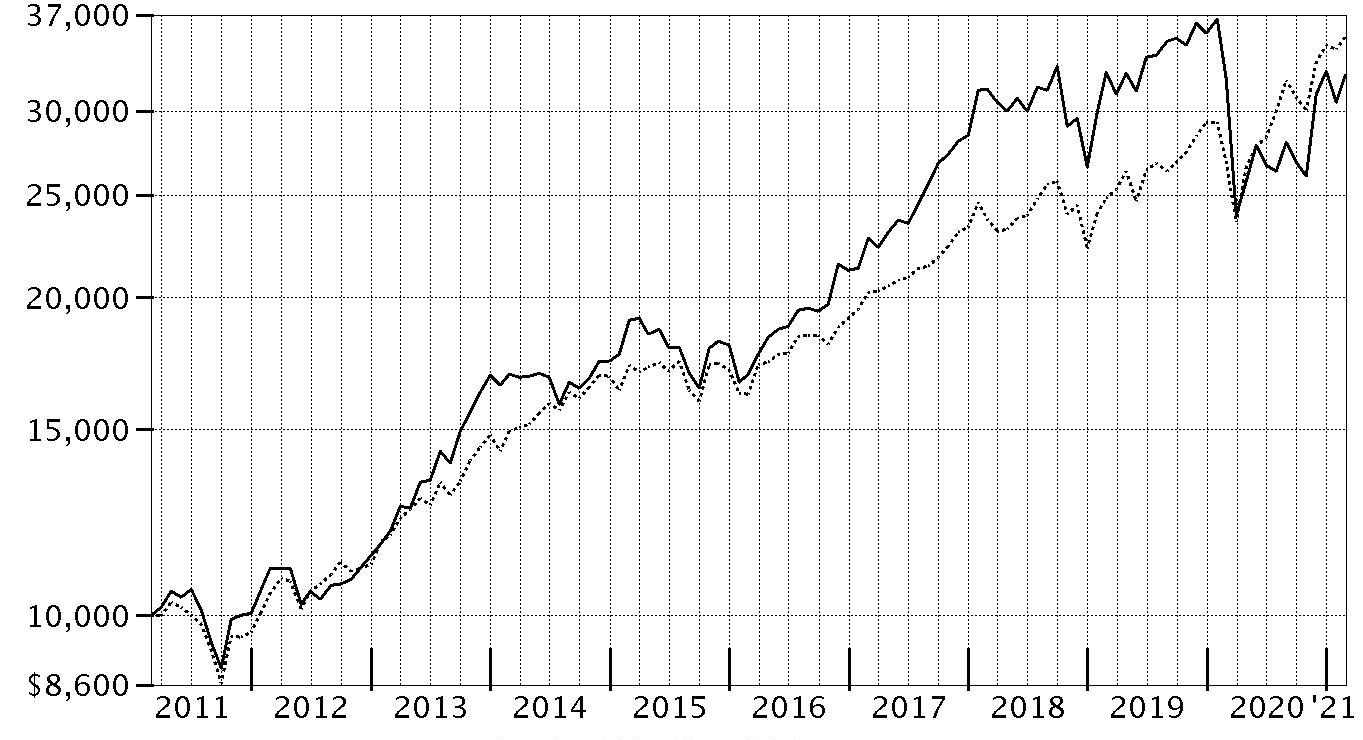
| Period Ending Values |
| $32,419 | Defense and Aerospace Portfolio |
| $35,259 | S&P 500® Index |
Defense and Aerospace Portfolio
Management's Discussion of Fund Performance
Market Recap: The S&P 500
® index gained 31.29% for the 12 months ending February 28, 2021, a volatile but productive period for U.S. risk assets. The early-2020 outbreak and spread of COVID-19 resulted in stocks suffering one of the quickest declines on record, through March 23, followed by a historic rebound that included the index closing 2020 at an all-time high and gaining modest ground in the first two months of the new year. The crisis and containment efforts caused broad contraction in economic activity, along with extreme uncertainty and dislocation in financial markets. A rapid and expansive U.S. monetary/fiscal-policy response partially offset the economic disruption and fueled the market surge, as did resilient corporate earnings. The rally slowed in September, when stocks began a two-month retreat amid Congress’s inability to reach a deal on additional fiscal stimulus, as well as concerns about election uncertainty, indications the U.S. economic recovery could be slowing and a new wave of COVID-19 cases. A shift in momentum began in October and accelerated following the U.S. elections, with the approval of three breakthrough COVID-19 vaccines and prospects for additional government stimulus fueling the “reflation trade” through February 28. By sector for the full 12 months, information technology (+50%) and consumer discretionary (+43%) led all gainers. Materials (+42%) and communication services (+37%) also stood out. In contrast, the defensive utilities (-3%) and real estate sectors (+5%) notably lagged.
Comments from Portfolio Manager Jonathan Siegmann: For the fiscal year ending February 28, 2021, the fund gained 0.69%, trailing the 1.47% advance of the MSCI US IMI Aerospace & Defense 25/50 Linked Index, as well as the broad-based S&P 500
® index. The largest detractor from performance versus the industry index was security selection in aerospace & defense. Also hindering performance were out-of-index allocations to the industrial conglomerates and IT consulting & other services groups. An underweighting in Maxar Technologies, a position we established this period, was the fund's biggest individual relative detractor and gained approximately 215% the past 12 months. Further pressuring performance was our smaller-than-index exposure to Axon Enterprise, which gained 114% and was another holding we established during the reporting period. Also hindering performance was our sizable overweighting in Northrop Grumman, which returned -9% and was one of the portfolio’s largest positions. Conversely, the biggest contributor to performance versus the industry index was non-index exposure to the industrial machinery segment. A modest out-of-index weighting in trading companies & distributors also bolstered the fund's relative result. The leading individual relative contributor was our lighter-than-index stake in Lockheed Martin, which returned -8% this period. We meaningfully decreased our position in the company during the past year. Also adding value was our outsized holding in the shares of Kratos Defense & Security Solutions, which gained 69% and was one of the fund’s biggest positions at period end. Another notable relative contributor was an overweighting in HEICO (+32%), also a sizable holding within the portfolio on February 28.
The views expressed above reflect those of the portfolio manager(s) only through the end of the period as stated on the cover of this report and do not necessarily represent the views of Fidelity or any other person in the Fidelity organization. Any such views are subject to change at any time based upon market or other conditions and Fidelity disclaims any responsibility to update such views. These views may not be relied on as investment advice and, because investment decisions for a Fidelity fund are based on numerous factors, may not be relied on as an indication of trading intent on behalf of any Fidelity fund.
Defense and Aerospace Portfolio
Investment Summary (Unaudited)
Top Ten Stocks as of February 28, 2021
| | % of fund's net assets |
| The Boeing Co. | 17.1 |
| Northrop Grumman Corp. | 12.5 |
| TransDigm Group, Inc. | 10.4 |
| Teledyne Technologies, Inc. | 7.9 |
| BWX Technologies, Inc. | 5.0 |
| HEICO Corp. Class A | 4.8 |
| Huntington Ingalls Industries, Inc. | 4.8 |
| Kratos Defense & Security Solutions, Inc. | 4.2 |
| Moog, Inc. Class A | 4.2 |
| Woodward, Inc. | 3.8 |
| | 74.7 |
Top Industries (% of fund's net assets)
| As of February 28, 2021 |
| | Aerospace & Defense | 88.7% |
| | Machinery | 5.6% |
| | IT Services | 2.5% |
| | Trading Companies & Distributors | 2.5% |
| | Air Freight & Logistics | 0.2% |
| | All Others* | 0.5% |

* Includes short-term investments and net other assets (liabilities).
Defense and Aerospace Portfolio
Schedule of Investments February 28, 2021
Showing Percentage of Net Assets
| Common Stocks - 99.5% | | | |
| | | Shares | Value |
| Aerospace & Defense - 88.7% | | | |
| Aerospace & Defense - 88.7% | | | |
| AerSale Corp. (a)(b) | | 300,000 | $2,955,000 |
| Airbus Group NV | | 500,000 | 58,087,327 |
| Axon Enterprise, Inc. (a) | | 77,803 | 12,875,618 |
| BWX Technologies, Inc. | | 1,400,000 | 81,214,000 |
| Curtiss-Wright Corp. | | 10,000 | 1,104,900 |
| Elbit Systems Ltd. (b) | | 325,000 | 41,294,500 |
| General Dynamics Corp. | | 65,000 | 10,625,550 |
| HEICO Corp. Class A | | 685,000 | 79,295,600 |
| Huntington Ingalls Industries, Inc. | | 450,000 | 79,159,500 |
| Kratos Defense & Security Solutions, Inc. (a) | | 2,500,000 | 68,750,000 |
| Lockheed Martin Corp. | | 15,000 | 4,953,750 |
| Maxar Technologies, Inc. | | 350,000 | 16,747,500 |
| Moog, Inc. Class A | | 875,000 | 67,952,500 |
| Northrop Grumman Corp. | | 700,000 | 204,162,000 |
| Parsons Corp. (a)(b) | | 1,250,000 | 44,675,000 |
| Raytheon Technologies Corp. | | 825,000 | 59,391,750 |
| Teledyne Technologies, Inc. (a) | | 350,000 | 129,850,000 |
| The Boeing Co. | | 1,325,000 | 280,913,251 |
| TransDigm Group, Inc. (a) | | 295,000 | 170,117,650 |
| Triumph Group, Inc. | | 900,000 | 13,113,000 |
| Vectrus, Inc. (a) | | 484,639 | 26,461,289 |
| | | | 1,453,699,685 |
| Air Freight & Logistics - 0.2% | | | |
| Air Freight & Logistics - 0.2% | | | |
| Air Transport Services Group, Inc. (a) | | 100,000 | 2,654,000 |
| IT Services - 2.5% | | | |
| IT Consulting & Other Services - 2.5% | | | |
| Booz Allen Hamilton Holding Corp. Class A | | 30,000 | 2,314,200 |
| CACI International, Inc. Class A (a) | | 170,000 | 37,627,800 |
| | | | 39,942,000 |
| Machinery - 5.6% | | | |
| Industrial Machinery - 5.6% | | | |
| Barnes Group, Inc. | | 50,000 | 2,617,500 |
| ESCO Technologies, Inc. | | 75,000 | 7,925,250 |
| RBC Bearings, Inc. (a) | | 90,000 | 17,915,400 |
| Woodward, Inc. | | 550,000 | 62,821,000 |
| | | | 91,279,150 |
| Trading Companies & Distributors - 2.5% | | | |
| Trading Companies & Distributors - 2.5% | | | |
| AerCap Holdings NV (a) | | 550,000 | 26,499,000 |
| Air Lease Corp. Class A | | 325,000 | 14,904,500 |
| | | | 41,403,500 |
| TOTAL COMMON STOCKS | | | |
| (Cost $995,162,216) | | | 1,628,978,335 |
|
| Money Market Funds - 1.1% | | | |
| Fidelity Cash Central Fund 0.07% (c) | | 6,175,555 | 6,176,790 |
| Fidelity Securities Lending Cash Central Fund 0.08% (c)(d) | | 12,100,096 | 12,101,306 |
| TOTAL MONEY MARKET FUNDS | | | |
| (Cost $18,278,096) | | | 18,278,096 |
| TOTAL INVESTMENT IN SECURITIES - 100.6% | | | |
| (Cost $1,013,440,312) | | | 1,647,256,431 |
| NET OTHER ASSETS (LIABILITIES) - (0.6)% | | | (9,062,834) |
| NET ASSETS - 100% | | | $1,638,193,597 |
Legend
(a) Non-income producing
(b) Security or a portion of the security is on loan at period end.
(c) Affiliated fund that is generally available only to investment companies and other accounts managed by Fidelity Investments. The rate quoted is the annualized seven-day yield of the fund at period end. A complete unaudited listing of the fund's holdings as of its most recent quarter end is available upon request. In addition, each Fidelity Central Fund's financial statements, which are not covered by the Fund's Report of Independent Registered Public Accounting Firm, are available on the SEC's website or upon request.
(d) Investment made with cash collateral received from securities on loan.
Affiliated Central Funds
Information regarding fiscal year to date income earned by the Fund from investments in Fidelity Central Funds is as follows:
| Fund | Income earned |
| Fidelity Cash Central Fund | $2,885 |
| Fidelity Securities Lending Cash Central Fund | 406,018 |
| Total | $408,903 |
Amounts in the income column in the above table include any capital gain distributions from underlying funds, which are presented in the corresponding line-item in the Statement of Operations, if applicable. Amount for Fidelity Securities Lending Cash Central Fund represents the income earned on investing cash collateral, less rebates paid to borrowers and any lending agent fees associated with the loan, plus any premium payments received for lending certain types of securities.
Investment Valuation
The following is a summary of the inputs used, as of February 28, 2021, involving the Fund's assets and liabilities carried at fair value. The inputs or methodology used for valuing securities may not be an indication of the risk associated with investing in those securities. For more information on valuation inputs, and their aggregation into the levels used below, please refer to the Investment Valuation section in the accompanying Notes to Financial Statements.
| | Valuation Inputs at Reporting Date: |
| Description | Total | Level 1 | Level 2 | Level 3 |
| Investments in Securities: | | | | |
| Common Stocks | $1,628,978,335 | $1,570,891,008 | $58,087,327 | $-- |
| Money Market Funds | 18,278,096 | 18,278,096 | -- | -- |
| Total Investments in Securities: | $1,647,256,431 | $1,589,169,104 | $58,087,327 | $-- |
See accompanying notes which are an integral part of the financial statements.
Defense and Aerospace Portfolio
Financial Statements
Statement of Assets and Liabilities
| | | February 28, 2021 |
| Assets | | |
Investment in securities, at value (including securities loaned of $11,691,510) — See accompanying schedule:
Unaffiliated issuers (cost $995,162,216) | $1,628,978,335 | |
| Fidelity Central Funds (cost $18,278,096) | 18,278,096 | |
| Total Investment in Securities (cost $1,013,440,312) | | $1,647,256,431 |
| Receivable for investments sold | | 13,349,245 |
| Receivable for fund shares sold | | 759,352 |
| Dividends receivable | | 2,292,350 |
| Distributions receivable from Fidelity Central Funds | | 37,571 |
| Prepaid expenses | | 17,079 |
| Other receivables | | 126,973 |
| Total assets | | 1,663,839,001 |
| Liabilities | | |
| Payable for investments purchased | $10,754,634 | |
| Payable for fund shares redeemed | 1,580,904 | |
| Accrued management fee | 744,534 | |
| Other affiliated payables | 306,947 | |
| Other payables and accrued expenses | 156,937 | |
| Collateral on securities loaned | 12,101,448 | |
| Total liabilities | | 25,645,404 |
| Net Assets | | $1,638,193,597 |
| Net Assets consist of: | | |
| Paid in capital | | $1,114,500,943 |
| Total accumulated earnings (loss) | | 523,692,654 |
| Net Assets | | $1,638,193,597 |
| Net Asset Value, offering price and redemption price per share ($1,638,193,597 ÷ 100,608,360 shares) | | $16.28 |
See accompanying notes which are an integral part of the financial statements.
Statement of Operations
| | | Year ended February 28, 2021 |
| Investment Income | | |
| Dividends | | $8,275,620 |
| Income from Fidelity Central Funds (including $406,018 from security lending) | | 408,903 |
| Total income | | 8,684,523 |
| Expenses | | |
| Management fee | $9,772,261 | |
| Transfer agent fees | 3,649,956 | |
| Accounting fees | 563,865 | |
| Custodian fees and expenses | 16,529 | |
| Independent trustees' fees and expenses | 11,653 | |
| Registration fees | 55,168 | |
| Audit | 39,079 | |
| Legal | 3,385 | |
| Interest | 10,832 | |
| Miscellaneous | 65,698 | |
| Total expenses before reductions | 14,188,426 | |
| Expense reductions | (69,004) | |
| Total expenses after reductions | | 14,119,422 |
| Net investment income (loss) | | (5,434,899) |
| Realized and Unrealized Gain (Loss) | | |
| Net realized gain (loss) on: | | |
| Investment securities: | | |
| Unaffiliated issuers | (89,430,502) | |
| Fidelity Central Funds | (610) | |
| Foreign currency transactions | 20,818 | |
| Total net realized gain (loss) | | (89,410,294) |
| Change in net unrealized appreciation (depreciation) on: | | |
| Investment securities: | | |
| Unaffiliated issuers | (50,481,888) | |
| Assets and liabilities in foreign currencies | (10,224) | |
| Total change in net unrealized appreciation (depreciation) | | (50,492,112) |
| Net gain (loss) | | (139,902,406) |
| Net increase (decrease) in net assets resulting from operations | | $(145,337,305) |
See accompanying notes which are an integral part of the financial statements.
Statement of Changes in Net Assets
| | Year ended February 28, 2021 | Year ended February 29, 2020 |
| Increase (Decrease) in Net Assets | | |
| Operations | | |
| Net investment income (loss) | $(5,434,899) | $43,682,052 |
| Net realized gain (loss) | (89,410,294) | 96,143,855 |
| Change in net unrealized appreciation (depreciation) | (50,492,112) | (188,436,207) |
| Net increase (decrease) in net assets resulting from operations | (145,337,305) | (48,610,300) |
| Distributions to shareholders | (52,505,082) | (79,290,455) |
| Share transactions | | |
| Proceeds from sales of shares | 299,665,979 | 1,019,400,280 |
| Reinvestment of distributions | 49,624,011 | 75,052,031 |
| Cost of shares redeemed | (1,242,213,028) | (1,032,851,200) |
| Net increase (decrease) in net assets resulting from share transactions | (892,923,038) | 61,601,111 |
| Total increase (decrease) in net assets | (1,090,765,425) | (66,299,644) |
| Net Assets | | |
| Beginning of period | 2,728,959,022 | 2,795,258,666 |
| End of period | $1,638,193,597 | $2,728,959,022 |
| Other Information | | |
| Shares(a) | | |
| Sold | 21,539,155 | 56,160,058 |
| Issued in reinvestment of distributions | 3,901,259 | 4,058,280 |
| Redeemed | (89,147,504) | (57,771,315) |
| Net increase (decrease) | (63,707,090) | 2,447,023 |
(a) Share activity prior to August 10, 2018 has been adjusted to reflect the impact of the 10 for 1 share split that occurred on that date.
See accompanying notes which are an integral part of the financial statements.
Financial Highlights
Defense and Aerospace Portfolio
| | | | | | |
| Years ended February 28, | 2021 | 2020 A | 2019 B | 2018 B | 2017 B |
| Selected Per–Share Data | | | | | |
| Net asset value, beginning of period | $16.61 | $17.27 | $18.45 | $13.83 | $10.81 |
| Income from Investment Operations | | | | | |
| Net investment income (loss)C | (.04) | .27D | .11 | .09E | .13F |
| Net realized and unrealized gain (loss) | .06G | (.45) | .33 | 5.14 | 3.52 |
| Total from investment operations | .02 | (.18) | .44 | 5.23 | 3.65 |
| Distributions from net investment income | (.05) | (.22) | (.10) | (.07) | (.12) |
| Distributions from net realized gain | (.30) | (.26) | (1.52) | (.54) | (.51) |
| Total distributions | (.35) | (.48) | (1.62) | (.61) | (.63) |
| Redemption fees added to paid in capitalC | – | – | – | – | –H |
| Net asset value, end of period | $16.28 | $16.61 | $17.27 | $18.45 | $13.83 |
| Total ReturnI | .69% | (1.32)% | 3.57% | 38.46% | 34.36% |
| Ratios to Average Net AssetsJ,K | | | | | |
| Expenses before reductions | .77% | .75% | .75% | .76% | .79% |
| Expenses net of fee waivers, if any | .77% | .74% | .75% | .76% | .79% |
| Expenses net of all reductions | .76% | .74% | .75% | .76% | .79% |
| Net investment income (loss) | (.29)% | 1.49%D | .66% | .58%E | 1.03%F |
| Supplemental Data | | | | | |
| Net assets, end of period (000 omitted) | $1,638,194 | $2,728,959 | $2,795,259 | $3,073,789 | $1,601,468 |
| Portfolio turnover rateL | 30% | 40% | 44% | 32% | 24% |
A For the year ended February 29.
B Per share amounts have been adjusted to reflect the impact of the 10 for 1 share split that occurred on August 10, 2018.
C Calculated based on average shares outstanding during the period.
D Net investment income per share reflects one or more large, non-recurring dividend(s) which amounted to $.18 per share. Excluding such non-recurring dividend(s), the ratio of net investment income (loss) to average net assets would have been .48%.
E Net investment income per share reflects one or more large, non-recurring dividend(s) which amounted to $.07 per share. Excluding such non-recurring dividend(s), the ratio of net investment income (loss) to average net assets would have been .14%.
F Net investment income per share reflects one or more large, non-recurring dividend(s) which amounted to $.05 per share. Excluding such non-recurring dividend(s), the ratio of net investment income (loss) to average net assets would have been .64%.
G The amount shown for a share outstanding does not correspond with the aggregate net gain (loss) on investments for the period due to the timing of sales and repurchases of shares in relation to fluctuating market values of the investments of the Fund.
H Amount represents less than $.005 per share.
I Total returns would have been lower if certain expenses had not been reduced during the applicable periods shown.
J Fees and expenses of any underlying mutual funds or exchange-traded funds (ETFs) are not included in the Fund's expense ratio. The Fund indirectly bears its proportionate share of these expenses. For additional expense information related to investments in Fidelity Central Funds, please refer to the "Investments in Fidelity Central Funds" note found in the Notes to Financial Statements section of the most recent Annual or Semi-Annual report.
K Expense ratios reflect operating expenses of the class. Expenses before reductions do not reflect amounts reimbursed, waived, or reduced through arrangements with the investment advisor, brokerage services, or other offset arrangements, if applicable, and do not represent the amount paid by the class during periods when reimbursements, waivers or reductions occur.
L Amount does not include the portfolio activity of any underlying mutual funds or exchange-traded funds (ETFs).
See accompanying notes which are an integral part of the financial statements.
Environment and Alternative Energy Portfolio
Performance: The Bottom Line
Average annual total return reflects the change in the value of an investment, assuming reinvestment of distributions from dividend income and capital gains (the profits earned upon the sale of securities that have grown in value, if any) and assuming a constant rate of performance each year. The hypothetical investment and the average annual total returns do not reflect the deduction of taxes that a shareholder would pay on fund distributions or the redemption of fund shares. During periods of reimbursement by Fidelity, a fund’s total return will be greater than it would be had the reimbursement not occurred. How a fund did yesterday is no guarantee of how it will do tomorrow.
Average Annual Total Returns
| For the periods ended February 28, 2021 | Past 1 year | Past 5 years | Past 10 years |
| Environment and Alternative Energy Portfolio | 38.97% | 16.36% | 9.34% |
If disclosing performance data prior to 7/1/10: Prior to July 1, 2010, the fund was named Environmental Portfolio, and the fund operated under certain different investment policies and compared its performance to a different additional index. The fund's historical performance may not represent its current investment policies.
$10,000 Over 10 Years
Let's say hypothetically that $10,000 was invested in Environment and Alternative Energy Portfolio on February 28, 2011.
The chart shows how the value of your investment would have changed, and also shows how the S&P 500® Index performed over the same period.
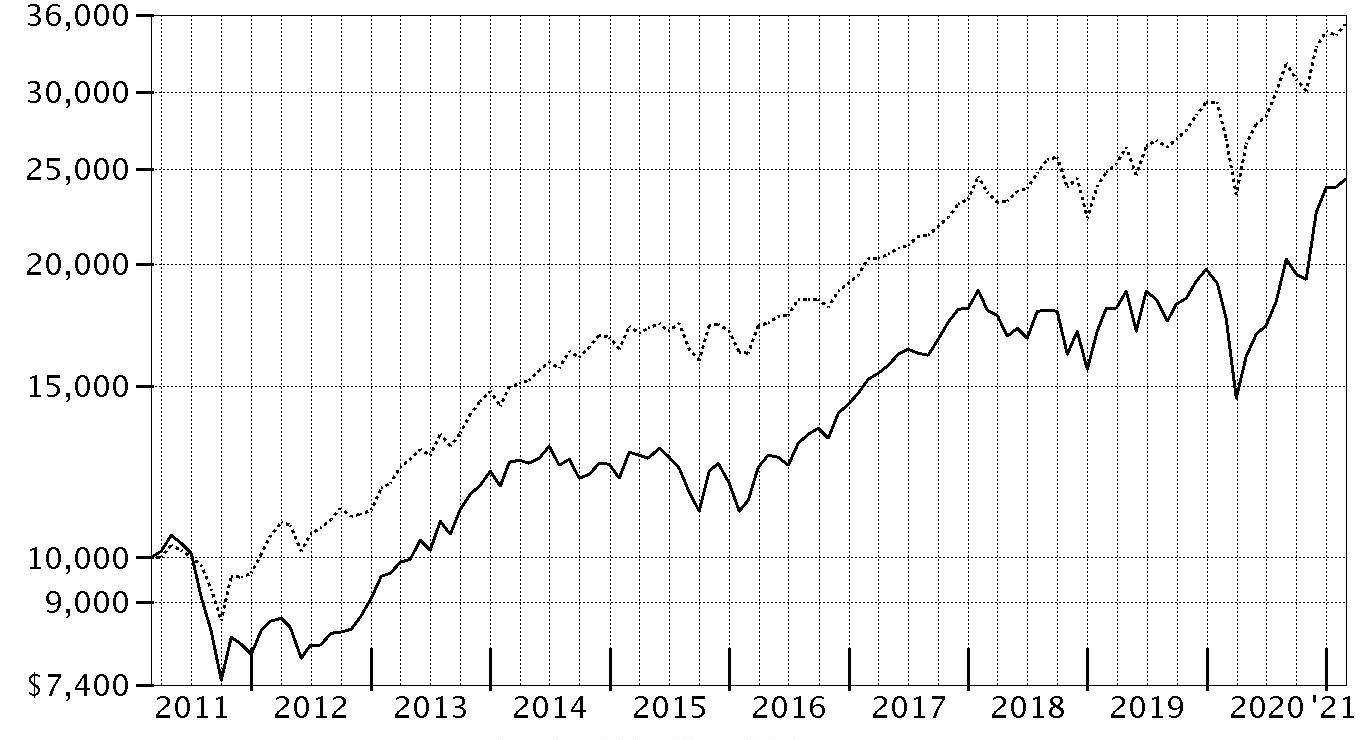
| Period Ending Values |
| $24,418 | Environment and Alternative Energy Portfolio |
| $35,259 | S&P 500® Index |
Environment and Alternative Energy Portfolio
Management's Discussion of Fund Performance
Market Recap: The S&P 500
® index gained 31.29% for the 12 months ending February 28, 2021, a volatile but productive period for U.S. risk assets. The early-2020 outbreak and spread of COVID-19 resulted in stocks suffering one of the quickest declines on record, through March 23, followed by a historic rebound that included the index closing 2020 at an all-time high and gaining modest ground in the first two months of the new year. The crisis and containment efforts caused broad contraction in economic activity, along with extreme uncertainty and dislocation in financial markets. A rapid and expansive U.S. monetary/fiscal-policy response partially offset the economic disruption and fueled the market surge, as did resilient corporate earnings. The rally slowed in September, when stocks began a two-month retreat amid Congress’s inability to reach a deal on additional fiscal stimulus, as well as concerns about election uncertainty, indications the U.S. economic recovery could be slowing and a new wave of COVID-19 cases. A shift in momentum began in October and accelerated following the U.S. elections, with the approval of three breakthrough COVID-19 vaccines and prospects for additional government stimulus fueling the “reflation trade” through February 28. By sector for the full 12 months, information technology (+50%) and consumer discretionary (+43%) led all gainers. Materials (+42%) and communication services (+37%) also stood out. In contrast, the defensive utilities (-3%) and real estate sectors (+5%) notably lagged.
Comments from Portfolio Manager Kevin Walenta: For the fiscal year ending February 28, 2021, the fund gained 38.97%, trailing the 56.95% advance of the FTSE Environmental Opportunities & Alternative Energy Index, but outperforming the broad-based S&P 500
® index. The largest detractor from performance versus the industry index was security selection in the energy-efficiency group. Stock picks in the renewable & alternative energy segment also hurt. The fund's biggest individual relative detractor was an underweighting in Tesla, a large index component that gained about 406% the past 12 months. Tesla was the fund’s largest holding at period end. Also hampering performance was an underweighting in Danaher, which advanced roughly 53%. This was a stake we established the past year. Our overweighting in Cosan SA Industria E Comerico, which returned approximately -9%, further detracted. In contrast, the largest contributor to performance versus the industry index was security selection and an underweighting in the waste management & technologies category. Also boosting the fund's relative result was an underweighting in environmental support services. Not owning Waste Management, an index component that gained 2%, was the largest individual relative contributor. Avoiding Engie, an index component that returned about -11%, also helped. Our lighter-than-index stake in Zoetis (+17%), a position we established the past 12 months, further aided relative performance. Notable changes in positioning this period included a higher allocation to the energy efficiency group and a reduction to the fund’s weighting in environmental support services.
The views expressed above reflect those of the portfolio manager(s) only through the end of the period as stated on the cover of this report and do not necessarily represent the views of Fidelity or any other person in the Fidelity organization. Any such views are subject to change at any time based upon market or other conditions and Fidelity disclaims any responsibility to update such views. These views may not be relied on as investment advice and, because investment decisions for a Fidelity fund are based on numerous factors, may not be relied on as an indication of trading intent on behalf of any Fidelity fund.
Environment and Alternative Energy Portfolio
Investment Summary (Unaudited)
Top Ten Stocks as of February 28, 2021
| | % of fund's net assets |
| Tesla, Inc. | 14.2 |
| Honeywell International, Inc. | 7.4 |
| Danaher Corp. | 4.8 |
| Eaton Corp. PLC | 4.3 |
| 3M Co. | 4.1 |
| TE Connectivity Ltd. | 4.0 |
| Cummins, Inc. | 3.7 |
| Trane Technologies PLC | 3.7 |
| EMCOR Group, Inc. | 2.9 |
| Hubbell, Inc. Class B | 2.8 |
| | 51.9 |
Top Industries (% of fund's net assets)
| As of February 28, 2021 |
| | Energy Efficiency | 55.5% |
| | Renewable & Alternative Energy | 11.0% |
| | Other | 9.6% |
| | Water Infrastructure & Technologies | 8.8% |
| | Environmental Support Services | 7.0% |
| | All Others* | 8.1% |

* Includes short-term investments and net other assets (liabilities).
Environment and Alternative Energy Portfolio
Schedule of Investments February 28, 2021
Showing Percentage of Net Assets
| Common Stocks - 97.7% | | | |
| | | Shares | Value |
| Energy Efficiency - 55.5% | | | |
| Buildings Energy Efficiency - 12.8% | | | |
| A.O. Smith Corp. | | 121,940 | $7,239,578 |
| Acuity Brands, Inc. | | 40,380 | 4,978,854 |
| Carlisle Companies, Inc. | | 47,680 | 6,925,520 |
| Comfort Systems U.S.A., Inc. | | 141,110 | 8,740,353 |
| Owens Corning | | 78,930 | 6,394,909 |
| Trane Technologies PLC | | 88,880 | 13,619,971 |
| | | | 47,899,185 |
| Diversified Energy Efficiency - 7.4% | | | |
| Honeywell International, Inc. | | 137,037 | 27,729,437 |
| Industrial Energy Efficiency - 9.3% | | | |
| EMCOR Group, Inc. | | 110,378 | 10,747,506 |
| Linde PLC | | 39,270 | 9,592,483 |
| Minerals Technologies, Inc. | | 63,570 | 4,528,091 |
| Regal Beloit Corp. | | 71,634 | 9,790,219 |
| | | | 34,658,299 |
| Power Network Efficiency - 7.1% | | | |
| Eaton Corp. PLC | | 125,110 | 16,288,071 |
| Hubbell, Inc. Class B | | 58,200 | 10,331,082 |
| | | | 26,619,153 |
| Transport Energy Efficiency - 18.9% | | | |
| BorgWarner, Inc. | | 196,910 | 8,860,950 |
| Innospec, Inc. | | 86,417 | 8,680,588 |
| Tesla, Inc. (a) | | 78,490 | 53,019,990 |
| | | | 70,561,528 |
|
| TOTAL ENERGY EFFICIENCY | | | 207,467,602 |
|
| Environmental Support Services - 7.0% | | | |
| Carbon and Other Environmental - 0.1% | | | |
| Hannon Armstrong Sustainable Infrastructure Capital, Inc. | | 4,660 | 262,032 |
| Diversified Environmental - 6.9% | | | |
| 3M Co. | | 87,812 | 15,372,369 |
| Air Products & Chemicals, Inc. | | 3,090 | 789,866 |
| Dover Corp. | | 79,630 | 9,815,194 |
| | | | 25,977,429 |
|
| TOTAL ENVIRONMENTAL SUPPORT SERVICES | | | 26,239,461 |
|
| Food Agriculture & Forestry - 1.3% | | | |
| Logistics, Food Safety and Packaging - 0.9% | | | |
| Corbion NV | | 2,840 | 161,393 |
| Zoetis, Inc. Class A | | 19,950 | 3,097,038 |
| | | | 3,258,431 |
| Sustainable and Efficient Agriculture - 0.4% | | | |
| Deere & Co. | | 4,780 | 1,668,794 |
|
| TOTAL FOOD AGRICULTURE& FORESTRY | | | 4,927,225 |
|
| Miscellaneous Environmental - 7.3% | | | |
| Other Environmental - 7.3% | | | |
| Accenture PLC Class A | | 10,170 | 2,551,653 |
| American Express Co. | | 9,930 | 1,343,132 |
| Amgen, Inc. | | 5,920 | 1,331,526 |
| Bank of New York Mellon Corp. | | 29,210 | 1,231,494 |
| BlackRock, Inc. Class A | | 4,320 | 3,000,240 |
| HCA Holdings, Inc. | | 16,310 | 2,805,809 |
| Microsoft Corp. | | 7,350 | 1,707,993 |
| Oracle Corp. | | 18,530 | 1,195,370 |
| Procter & Gamble Co. | | 10,920 | 1,348,948 |
| Reliance Steel & Aluminum Co. | | 26,720 | 3,532,384 |
| Robert Half International, Inc. | | 44,840 | 3,488,104 |
| Steelcase, Inc. Class A | | 176,230 | 2,456,646 |
| Visa, Inc. Class A | | 6,650 | 1,412,394 |
| | | | 27,405,693 |
| Pollution Control - 3.7% | | | |
| Pollution Control Solutions - 3.7% | | | |
| Cummins, Inc. | | 55,162 | 13,967,018 |
| Renewable & Alternative Energy - 11.0% | | | |
| Biofuels - 1.7% | | | |
| Cosan SA Industria e Comercio | | 423,470 | 6,150,826 |
| Renewable Energy Developers and Independent Power Producers - 8.1% | | | |
| Colbun SA | | 19,520,060 | 3,645,736 |
| Enel SpA | | 255,730 | 2,411,253 |
| Hollysys Automation Technologies Ltd. | | 89,061 | 1,341,259 |
| Iberdrola SA | | 241,310 | 3,035,266 |
| Johnson Controls International PLC | | 14,130 | 788,313 |
| ORSTED A/S (b) | | 16,770 | 2,715,547 |
| TE Connectivity Ltd. | | 113,600 | 14,771,408 |
| The AES Corp. | | 56,700 | 1,505,952 |
| | | | 30,214,734 |
| Solar Energy Generation Equipment - 0.2% | | | |
| First Solar, Inc. (a) | | 6,930 | 561,469 |
| Sunrun, Inc. (a) | | 5,500 | 344,190 |
| | | | 905,659 |
| Wind Power Generation Equipment - 1.0% | | | |
| SolarEdge Technologies, Inc. (a) | | 3,210 | 957,575 |
| Vestas Wind Systems A/S | | 14,930 | 2,799,750 |
| | | | 3,757,325 |
|
| TOTAL RENEWABLE & ALTERNATIVE ENERGY | | | 41,028,544 |
|
| Waste Management & Technologies - 3.1% | | | |
| Recycling and Value Added Waste Processing - 3.1% | | | |
| Schnitzer Steel Industries, Inc. Class A | | 143,050 | 4,940,947 |
| Steel Dynamics, Inc. | | 155,650 | 6,471,927 |
| | | | 11,412,874 |
| Water Infrastructure & Technologies - 8.8% | | | |
| Diversified Water Infrastructure and Technology - 4.8% | | | |
| Danaher Corp. | | 82,550 | 18,133,759 |
| Water Infrastructure - 4.0% | | | |
| Crane Co. | | 50,317 | 4,219,584 |
| IDEX Corp. | | 48,280 | 9,422,808 |
| Roper Technologies, Inc. | | 3,240 | 1,223,489 |
| | | | 14,865,881 |
|
| TOTAL WATER INFRASTRUCTURE & TECHNOLOGIES | | | 32,999,640 |
|
| TOTAL COMMON STOCKS | | | |
| (Cost $293,965,329) | | | 365,448,057 |
|
| Money Market Funds - 2.2% | | | |
| Fidelity Cash Central Fund 0.07% (c) | | | |
| (Cost $8,161,296) | | 8,159,664 | 8,161,296 |
| TOTAL INVESTMENT IN SECURITIES - 99.9% | | | |
| (Cost $302,126,625) | | | 373,609,353 |
| NET OTHER ASSETS (LIABILITIES) - 0.1% | | | 372,151 |
| NET ASSETS - 100% | | | $373,981,504 |
Legend
(a) Non-income producing
(b) Security exempt from registration under Rule 144A of the Securities Act of 1933. These securities may be resold in transactions exempt from registration, normally to qualified institutional buyers. At the end of the period, the value of these securities amounted to $2,715,547 or 0.7% of net assets.
(c) Affiliated fund that is generally available only to investment companies and other accounts managed by Fidelity Investments. The rate quoted is the annualized seven-day yield of the fund at period end. A complete unaudited listing of the fund's holdings as of its most recent quarter end is available upon request. In addition, each Fidelity Central Fund's financial statements, which are not covered by the Fund's Report of Independent Registered Public Accounting Firm, are available on the SEC's website or upon request.
Affiliated Central Funds
Information regarding fiscal year to date income earned by the Fund from investments in Fidelity Central Funds is as follows:
| Fund | Income earned |
| Fidelity Cash Central Fund | $6,363 |
| Fidelity Securities Lending Cash Central Fund | 2,309 |
| Total | $8,672 |
Amounts in the income column in the above table include any capital gain distributions from underlying funds, which are presented in the corresponding line-item in the Statement of Operations, if applicable. Amount for Fidelity Securities Lending Cash Central Fund represents the income earned on investing cash collateral, less rebates paid to borrowers and any lending agent fees associated with the loan, plus any premium payments received for lending certain types of securities.
Investment Valuation
The following is a summary of the inputs used, as of February 28, 2021, involving the Fund's assets and liabilities carried at fair value. The inputs or methodology used for valuing securities may not be an indication of the risk associated with investing in those securities. For more information on valuation inputs, and their aggregation into the levels used below, please refer to the Investment Valuation section in the accompanying Notes to Financial Statements.
| | Valuation Inputs at Reporting Date: |
| Description | Total | Level 1 | Level 2 | Level 3 |
| Investments in Securities: | | | | |
| Common Stocks | $365,448,057 | $360,237,054 | $5,211,003 | $-- |
| Money Market Funds | 8,161,296 | 8,161,296 | -- | -- |
| Total Investments in Securities: | $373,609,353 | $368,398,350 | $5,211,003 | $-- |
Other Information
Distribution of investments by country or territory of incorporation, as a percentage of Total Net Assets, is as follows (Unaudited):
| United States of America | 78.5% |
| Ireland | 11.5% |
| Switzerland | 4.0% |
| Brazil | 1.7% |
| Denmark | 1.4% |
| Chile | 1.0% |
| Others (Individually Less Than 1%) | 1.9% |
| | 100.0% |
See accompanying notes which are an integral part of the financial statements.
Environment and Alternative Energy Portfolio
Financial Statements
Statement of Assets and Liabilities
| | | February 28, 2021 |
| Assets | | |
Investment in securities, at value — See accompanying schedule:
Unaffiliated issuers (cost $293,965,329) | $365,448,057 | |
| Fidelity Central Funds (cost $8,161,296) | 8,161,296 | |
| Total Investment in Securities (cost $302,126,625) | | $373,609,353 |
| Receivable for fund shares sold | | 1,024,996 |
| Dividends receivable | | 668,074 |
| Distributions receivable from Fidelity Central Funds | | 386 |
| Prepaid expenses | | 1,082 |
| Other receivables | | 1,162 |
| Total assets | | 375,305,053 |
| Liabilities | | |
| Payable for fund shares redeemed | $1,052,839 | |
| Accrued management fee | 162,799 | |
| Other affiliated payables | 70,820 | |
| Other payables and accrued expenses | 37,091 | |
| Total liabilities | | 1,323,549 |
| Net Assets | | $373,981,504 |
| Net Assets consist of: | | |
| Paid in capital | | $305,633,976 |
| Total accumulated earnings (loss) | | 68,347,528 |
| Net Assets | | $373,981,504 |
| Net Asset Value, offering price and redemption price per share ($373,981,504 ÷ 12,401,805 shares) | | $30.16 |
See accompanying notes which are an integral part of the financial statements.
Statement of Operations
| | | Year ended February 28, 2021 |
| Investment Income | | |
| Dividends | | $3,759,357 |
| Income from Fidelity Central Funds (including $2,309 from security lending) | | 8,672 |
| Total income | | 3,768,029 |
| Expenses | | |
| Management fee | $1,122,205 | |
| Transfer agent fees | 488,409 | |
| Accounting fees | 82,463 | |
| Custodian fees and expenses | 10,812 | |
| Independent trustees' fees and expenses | 1,047 | |
| Registration fees | 34,875 | |
| Audit | 45,506 | |
| Legal | 759 | |
| Miscellaneous | 6,087 | |
| Total expenses before reductions | 1,792,163 | |
| Expense reductions | (9,506) | |
| Total expenses after reductions | | 1,782,657 |
| Net investment income (loss) | | 1,985,372 |
| Realized and Unrealized Gain (Loss) | | |
| Net realized gain (loss) on: | | |
| Investment securities: | | |
| Unaffiliated issuers | (3,213,245) | |
| Fidelity Central Funds | 413 | |
| Foreign currency transactions | (689) | |
| Total net realized gain (loss) | | (3,213,521) |
| Change in net unrealized appreciation (depreciation) on: | | |
| Investment securities: | | |
| Unaffiliated issuers | 68,277,951 | |
| Assets and liabilities in foreign currencies | 6,535 | |
| Total change in net unrealized appreciation (depreciation) | | 68,284,486 |
| Net gain (loss) | | 65,070,965 |
| Net increase (decrease) in net assets resulting from operations | | $67,056,337 |
See accompanying notes which are an integral part of the financial statements.
Statement of Changes in Net Assets
| | Year ended February 28, 2021 | Year ended February 29, 2020 |
| Increase (Decrease) in Net Assets | | |
| Operations | | |
| Net investment income (loss) | $1,985,372 | $1,937,125 |
| Net realized gain (loss) | (3,213,521) | 11,966,522 |
| Change in net unrealized appreciation (depreciation) | 68,284,486 | (20,698,037) |
| Net increase (decrease) in net assets resulting from operations | 67,056,337 | (6,794,390) |
| Distributions to shareholders | (13,727,960) | (4,290,450) |
| Share transactions | | |
| Proceeds from sales of shares | 204,311,751 | 109,059,408 |
| Reinvestment of distributions | 13,015,832 | 4,066,285 |
| Cost of shares redeemed | (78,130,888) | (81,544,645) |
| Net increase (decrease) in net assets resulting from share transactions | 139,196,695 | 31,581,048 |
| Total increase (decrease) in net assets | 192,525,072 | 20,496,208 |
| Net Assets | | |
| Beginning of period | 181,456,432 | 160,960,224 |
| End of period | $373,981,504 | $181,456,432 |
| Other Information | | |
| Shares | | |
| Sold | 7,351,508 | 4,278,847 |
| Issued in reinvestment of distributions | 653,424 | 156,342 |
| Redeemed | (3,226,046) | (3,270,425) |
| Net increase (decrease) | 4,778,886 | 1,164,764 |
See accompanying notes which are an integral part of the financial statements.
Financial Highlights
Environment and Alternative Energy Portfolio
| | | | | | |
| Years ended February 28, | 2021 | 2020 A | 2019 | 2018 | 2017 |
| Selected Per–Share Data | | | | | |
| Net asset value, beginning of period | $23.80 | $24.92 | $26.31 | $23.89 | $18.20 |
| Income from Investment Operations | | | | | |
| Net investment income (loss)B | .24 | .27 | .24 | .27 | .20 |
| Net realized and unrealized gain (loss) | 8.02 | (.81) | (.25) | 3.83 | 5.78 |
| Total from investment operations | 8.26 | (.54) | (.01) | 4.10 | 5.98 |
| Distributions from net investment income | (.26) | (.23) | (.22) | (.22) | (.16) |
| Distributions from net realized gain | (1.64) | (.35) | (1.16) | (1.46) | (.13) |
| Total distributions | (1.90) | (.58) | (1.38) | (1.68) | (.29) |
| Redemption fees added to paid in capitalB | – | – | – | –C | –C |
| Net asset value, end of period | $30.16 | $23.80 | $24.92 | $26.31 | $23.89 |
| Total ReturnD | 38.97% | (2.35)% | .39% | 17.73% | 33.02% |
| Ratios to Average Net AssetsE,F | | | | | |
| Expenses before reductions | .85% | .85% | .87% | .87% | .94% |
| Expenses net of fee waivers, if any | .85% | .85% | .87% | .87% | .94% |
| Expenses net of all reductions | .85% | .85% | .87% | .86% | .94% |
| Net investment income (loss) | .95% | 1.08% | .96% | 1.07% | .94% |
| Supplemental Data | | | | | |
| Net assets, end of period (000 omitted) | $373,982 | $181,456 | $160,960 | $188,383 | $137,674 |
| Portfolio turnover rateG | 28% | 49% | 62% | 47% | 82% |
A For the year ended February 29.
B Calculated based on average shares outstanding during the period.
C Amount represents less than $.005 per share.
D Total returns would have been lower if certain expenses had not been reduced during the applicable periods shown.
E Fees and expenses of any underlying mutual funds or exchange-traded funds (ETFs) are not included in the Fund's expense ratio. The Fund indirectly bears its proportionate share of these expenses. For additional expense information related to investments in Fidelity Central Funds, please refer to the "Investments in Fidelity Central Funds" note found in the Notes to Financial Statements section of the most recent Annual or Semi-Annual report.
F Expense ratios reflect operating expenses of the class. Expenses before reductions do not reflect amounts reimbursed, waived, or reduced through arrangements with the investment advisor, brokerage services, or other offset arrangements, if applicable, and do not represent the amount paid by the class during periods when reimbursements, waivers or reductions occur.
G Amount does not include the portfolio activity of any underlying mutual funds or exchange-traded funds (ETFs).
See accompanying notes which are an integral part of the financial statements.
Industrials Portfolio
Performance: The Bottom Line
Average annual total return reflects the change in the value of an investment, assuming reinvestment of distributions from dividend income and capital gains (the profits earned upon the sale of securities that have grown in value, if any) and assuming a constant rate of performance each year. The hypothetical investment and the average annual total returns do not reflect the deduction of taxes that a shareholder would pay on fund distributions or the redemption of fund shares. During periods of reimbursement by Fidelity, a fund’s total return will be greater than it would be had the reimbursement not occurred. How a fund did yesterday is no guarantee of how it will do tomorrow.
Average Annual Total Returns
| For the periods ended February 28, 2021 | Past 1 year | Past 5 years | Past 10 years |
| Industrials Portfolio | 21.41% | 11.45% | 9.85% |
$10,000 Over 10 Years
Let's say hypothetically that $10,000 was invested in Industrials Portfolio on February 28, 2011.
The chart shows how the value of your investment would have changed, and also shows how the S&P 500® Index performed over the same period.
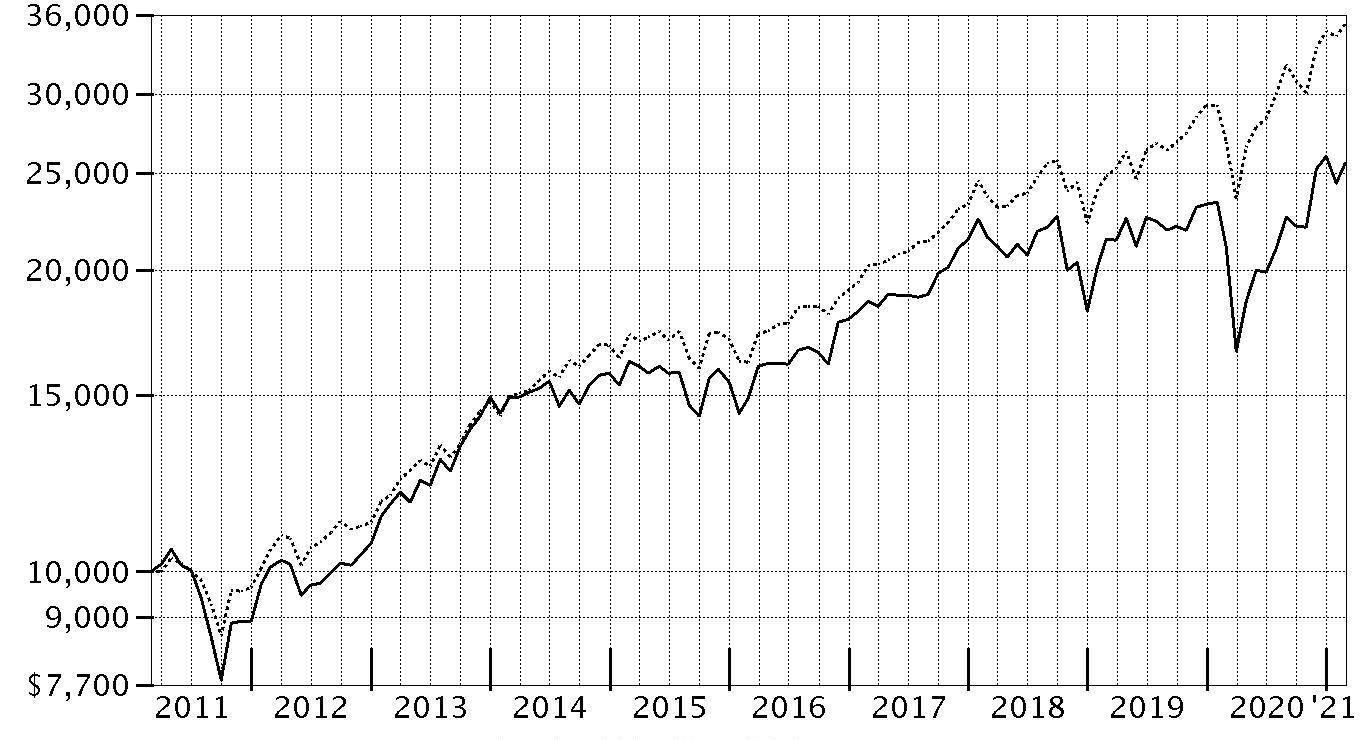
| Period Ending Values |
| $25,592 | Industrials Portfolio |
| $35,259 | S&P 500® Index |
Industrials Portfolio
Management's Discussion of Fund Performance
Market Recap: The S&P 500
® index gained 31.29% for the 12 months ending February 28, 2021, a volatile but productive period for U.S. risk assets. The early-2020 outbreak and spread of COVID-19 resulted in stocks suffering one of the quickest declines on record, through March 23, followed by a historic rebound that included the index closing 2020 at an all-time high and gaining modest ground in the first two months of the new year. The crisis and containment efforts caused broad contraction in economic activity, along with extreme uncertainty and dislocation in financial markets. A rapid and expansive U.S. monetary/fiscal-policy response partially offset the economic disruption and fueled the market surge, as did resilient corporate earnings. The rally slowed in September, when stocks began a two-month retreat amid Congress’s inability to reach a deal on additional fiscal stimulus, as well as concerns about election uncertainty, indications the U.S. economic recovery could be slowing and a new wave of COVID-19 cases. A shift in momentum began in October and accelerated following the U.S. elections, with the approval of three breakthrough COVID-19 vaccines and prospects for additional government stimulus fueling the “reflation trade” through February 28. By sector for the full 12 months, information technology (+50%) and consumer discretionary (+43%) led all gainers. Materials (+42%) and communication services (+37%) also stood out. In contrast, the defensive utilities (-3%) and real estate sectors (+5%) notably lagged.
Comments from Portfolio Manager Janet Glazer: For the fiscal year ending February 28, 2021, the fund gained 21.41%, underperforming the 29.25% gain of the MSCI US IMI Industrials 25/50 Linked Index, as well as the broad-based S&P 500
® index. The primary factors detracting from performance versus the sector index were stock picks and an overweighting in industrial conglomerates. Stock selection and an underweighting in construction machinery & heavy trucks and an underweighting in agricultural & farm machinery also hurt. The biggest individual relative detractor was an overweight position in Roper Technologies (+8%), the fund's largest holding. Another notable relative detractor was an outsized stake in TransDigm Group (-5%), which was among the fund's biggest holdings. Also hurting performance was an underweighting in United Parcel Service (UPS), which gained about 80%. UPS was not held at period end. In contrast, the biggest contributor to performance versus the sector index was an underweighting in aerospace & defense. Also bolstering the fund's relative performance was an overweighting in electrical components & equipment and in human resource & employment services. The fund's top individual relative contributor was our lighter-than-index stake in Lockheed Martin, which returned -8% the past 12 months. Lockheed Martin was not held at period end. Also lifting performance was our lighter-than-index stake in Boeing, which returned -23%. We increased our position here the past year. Another notable relative contributor was an overweighting in XPO Logistics (+49%), which was one of the fund's largest holdings this period. Notable changes in positioning include a lower allocation to the railroads and aerospace & defense subindustries.
The views expressed above reflect those of the portfolio manager(s) only through the end of the period as stated on the cover of this report and do not necessarily represent the views of Fidelity or any other person in the Fidelity organization. Any such views are subject to change at any time based upon market or other conditions and Fidelity disclaims any responsibility to update such views. These views may not be relied on as investment advice and, because investment decisions for a Fidelity fund are based on numerous factors, may not be relied on as an indication of trading intent on behalf of any Fidelity fund.
Industrials Portfolio
Investment Summary (Unaudited)
Top Ten Stocks as of February 28, 2021
| | % of fund's net assets |
| Roper Technologies, Inc. | 9.9 |
| General Electric Co. | 6.6 |
| Honeywell International, Inc. | 5.7 |
| AMETEK, Inc. | 5.1 |
| TriNet Group, Inc. | 4.5 |
| The Boeing Co. | 4.5 |
| United Rentals, Inc. | 4.4 |
| Colfax Corp. | 4.3 |
| ITT, Inc. | 3.2 |
| Parker Hannifin Corp. | 2.9 |
| | 51.1 |
Top Industries (% of fund's net assets)
| As of February 28, 2021 |
| | Machinery | 23.4% |
| | Industrial Conglomerates | 22.2% |
| | Aerospace & Defense | 12.8% |
| | Electrical Equipment | 10.1% |
| | Road & Rail | 7.4% |
| | All Others* | 24.1% |

* Includes short-term investments and net other assets (liabilities).
Industrials Portfolio
Schedule of Investments February 28, 2021
Showing Percentage of Net Assets
| Common Stocks - 100.3% | | | |
| | | Shares | Value |
| Aerospace & Defense - 12.8% | | | |
| Aerospace & Defense - 12.8% | | | |
| Axon Enterprise, Inc. (a) | | 11,500 | $1,903,135 |
| HEICO Corp. Class A | | 58,798 | 6,806,456 |
| Raytheon Technologies Corp. | | 130,000 | 9,358,700 |
| Teledyne Technologies, Inc. (a) | | 20,900 | 7,753,900 |
| The Boeing Co. | | 120,060 | 25,453,921 |
| TransDigm Group, Inc. (a) | | 26,837 | 15,476,093 |
| Triumph Group, Inc. | | 369,700 | 5,386,529 |
| | | | 72,138,734 |
| Air Freight & Logistics - 2.4% | | | |
| Air Freight & Logistics - 2.4% | | | |
| XPO Logistics, Inc. (a) | | 117,840 | 13,740,144 |
| Airlines - 3.3% | | | |
| Airlines - 3.3% | | | |
| Alaska Air Group, Inc. | | 78,100 | 5,078,062 |
| JetBlue Airways Corp. (a) | | 179,700 | 3,311,871 |
| Southwest Airlines Co. | | 180,100 | 10,469,213 |
| | | | 18,859,146 |
| Building Products - 6.0% | | | |
| Building Products - 6.0% | | | |
| Advanced Drain Systems, Inc. | | 65,100 | 7,162,302 |
| Johnson Controls International PLC | | 284,900 | 15,894,571 |
| The AZEK Co., Inc. | | 25,800 | 1,138,038 |
| Trane Technologies PLC | | 53,265 | 8,162,329 |
| Trex Co., Inc. (a)(b) | | 14,200 | 1,301,288 |
| | | | 33,658,528 |
| Commercial Services & Supplies - 2.8% | | | |
| Environmental & Facility Services - 2.8% | | | |
| Tetra Tech, Inc. | | 112,800 | 15,608,136 |
| Construction & Engineering - 0.5% | | | |
| Construction & Engineering - 0.5% | | | |
| AECOM (a) | | 23,700 | 1,371,993 |
| Quanta Services, Inc. | | 14,400 | 1,207,440 |
| | | | 2,579,433 |
| Electrical Equipment - 10.1% | | | |
| Electrical Components & Equipment - 10.0% | | | |
| AMETEK, Inc. | | 243,520 | 28,728,054 |
| Generac Holdings, Inc. (a) | | 18,700 | 6,162,772 |
| Plug Power, Inc. (a)(b) | | 79,300 | 3,836,534 |
| Regal Beloit Corp. | | 61,813 | 8,447,983 |
| Vertiv Holdings Co. | | 455,400 | 9,531,522 |
| | | | 56,706,865 |
| Heavy Electrical Equipment - 0.1% | | | |
| Bloom Energy Corp. Class A (a) | | 14,700 | 419,391 |
|
| TOTAL ELECTRICAL EQUIPMENT | | | 57,126,256 |
|
| Industrial Conglomerates - 22.2% | | | |
| Industrial Conglomerates - 22.2% | | | |
| General Electric Co. | | 2,985,800 | 37,441,932 |
| Honeywell International, Inc. | | 158,498 | 32,072,070 |
| Roper Technologies, Inc. | | 148,004 | 55,889,269 |
| | | | 125,403,271 |
| Machinery - 23.4% | | | |
| Agricultural & Farm Machinery - 3.6% | | | |
| AGCO Corp. | | 10,800 | 1,398,384 |
| Deere & Co. | | 46,300 | 16,164,256 |
| Lindsay Corp. | | 16,000 | 2,564,000 |
| | | | 20,126,640 |
| Construction Machinery & Heavy Trucks - 1.6% | | | |
| Oshkosh Corp. | | 82,840 | 8,781,040 |
| Industrial Machinery - 18.2% | | | |
| Chart Industries, Inc. (a) | | 36,500 | 5,222,785 |
| Colfax Corp. (a) | | 549,223 | 24,358,040 |
| Fortive Corp. | | 128,400 | 8,451,288 |
| Ingersoll Rand, Inc. (a) | | 212,500 | 9,847,250 |
| ITT, Inc. | | 219,710 | 18,231,536 |
| Kadant, Inc. | | 27,900 | 4,854,600 |
| Parker Hannifin Corp. | | 56,700 | 16,270,632 |
| Woodward, Inc. | | 136,669 | 15,610,333 |
| | | | 102,846,464 |
|
| TOTAL MACHINERY | | | 131,754,144 |
|
| Marine - 0.1% | | | |
| Marine - 0.1% | | | |
| Matson, Inc. | | 5,039 | 349,052 |
| Professional Services - 4.9% | | | |
| Human Resource & Employment Services - 4.5% | | | |
| TriNet Group, Inc. (a) | | 317,881 | 25,516,308 |
| Research & Consulting Services - 0.4% | | | |
| Clarivate Analytics PLC (a) | | 94,256 | 2,144,324 |
|
| TOTAL PROFESSIONAL SERVICES | | | 27,660,632 |
|
| Road & Rail - 7.4% | | | |
| Railroads - 3.4% | | | |
| Kansas City Southern | | 14,566 | 3,092,944 |
| Norfolk Southern Corp. | | 55,009 | 13,865,569 |
| Union Pacific Corp. | | 10,821 | 2,228,693 |
| | | | 19,187,206 |
| Trucking - 4.0% | | | |
| ArcBest Corp. | | 110,229 | 6,502,409 |
| Old Dominion Freight Lines, Inc. | | 15,123 | 3,247,967 |
| Saia, Inc. (a) | | 41,000 | 8,221,730 |
| Uber Technologies, Inc. (a) | | 93,000 | 4,812,750 |
| | | | 22,784,856 |
|
| TOTAL ROAD & RAIL | | | 41,972,062 |
|
| Trading Companies & Distributors - 4.4% | | | |
| Trading Companies & Distributors - 4.4% | | | |
| United Rentals, Inc. (a) | | 84,000 | 24,979,920 |
| TOTAL COMMON STOCKS | | | |
| (Cost $467,239,664) | | | 565,829,458 |
|
| Money Market Funds - 0.8% | | | |
| Fidelity Cash Central Fund 0.07% (c) | | 914 | 915 |
| Fidelity Securities Lending Cash Central Fund 0.08% (c)(d) | | 4,412,205 | 4,412,646 |
| TOTAL MONEY MARKET FUNDS | | | |
| (Cost $4,413,561) | | | 4,413,561 |
| TOTAL INVESTMENT IN SECURITIES - 101.1% | | | |
| (Cost $471,653,225) | | | 570,243,019 |
| NET OTHER ASSETS (LIABILITIES) - (1.1)% | | | (6,034,155) |
| NET ASSETS - 100% | | | $564,208,864 |
Legend
(a) Non-income producing
(b) Security or a portion of the security is on loan at period end.
(c) Affiliated fund that is generally available only to investment companies and other accounts managed by Fidelity Investments. The rate quoted is the annualized seven-day yield of the fund at period end. A complete unaudited listing of the fund's holdings as of its most recent quarter end is available upon request. In addition, each Fidelity Central Fund's financial statements, which are not covered by the Fund's Report of Independent Registered Public Accounting Firm, are available on the SEC's website or upon request.
(d) Investment made with cash collateral received from securities on loan.
Affiliated Central Funds
Information regarding fiscal year to date income earned by the Fund from investments in Fidelity Central Funds is as follows:
| Fund | Income earned |
| Fidelity Cash Central Fund | $2,482 |
| Fidelity Securities Lending Cash Central Fund | 12,211 |
| Total | $14,693 |
Amounts in the income column in the above table include any capital gain distributions from underlying funds, which are presented in the corresponding line-item in the Statement of Operations, if applicable. Amount for Fidelity Securities Lending Cash Central Fund represents the income earned on investing cash collateral, less rebates paid to borrowers and any lending agent fees associated with the loan, plus any premium payments received for lending certain types of securities.
Investment Valuation
The following is a summary of the inputs used, as of February 28, 2021, involving the Fund's assets and liabilities carried at fair value. The inputs or methodology used for valuing securities may not be an indication of the risk associated with investing in those securities. For more information on valuation inputs, and their aggregation into the levels used below, please refer to the Investment Valuation section in the accompanying Notes to Financial Statements.
| | Valuation Inputs at Reporting Date: |
| Description | Total | Level 1 | Level 2 | Level 3 |
| Investments in Securities: | | | | |
| Common Stocks | $565,829,458 | $565,829,458 | $-- | $-- |
| Money Market Funds | 4,413,561 | 4,413,561 | -- | -- |
| Total Investments in Securities: | $570,243,019 | $570,243,019 | $-- | $-- |
See accompanying notes which are an integral part of the financial statements.
Industrials Portfolio
Financial Statements
Statement of Assets and Liabilities
| | | February 28, 2021 |
| Assets | | |
Investment in securities, at value (including securities loaned of $4,741,131) — See accompanying schedule:
Unaffiliated issuers (cost $467,239,664) | $565,829,458 | |
| Fidelity Central Funds (cost $4,413,561) | 4,413,561 | |
| Total Investment in Securities (cost $471,653,225) | | $570,243,019 |
| Receivable for investments sold | | 75,430,499 |
| Receivable for fund shares sold | | 264,537 |
| Dividends receivable | | 324,495 |
| Distributions receivable from Fidelity Central Funds | | 622 |
| Prepaid expenses | | 5,771 |
| Other receivables | | 111,640 |
| Total assets | | 646,380,583 |
| Liabilities | | |
| Payable for investments purchased | $67,870,659 | |
| Payable for fund shares redeemed | 606,326 | |
| Accrued management fee | 252,180 | |
| Notes payable to affiliates | 8,786,000 | |
| Other affiliated payables | 91,578 | |
| Other payables and accrued expenses | 152,330 | |
| Collateral on securities loaned | 4,412,646 | |
| Total liabilities | | 82,171,719 |
| Net Assets | | $564,208,864 |
| Net Assets consist of: | | |
| Paid in capital | | $415,865,830 |
| Total accumulated earnings (loss) | | 148,343,034 |
| Net Assets | | $564,208,864 |
| Net Asset Value, offering price and redemption price per share ($564,208,864 ÷ 15,179,868 shares) | | $37.17 |
See accompanying notes which are an integral part of the financial statements.
Statement of Operations
| | | Year ended February 28, 2021 |
| Investment Income | | |
| Dividends | | $3,446,572 |
| Income from Fidelity Central Funds (including $12,211 from security lending) | | 14,693 |
| Total income | | 3,461,265 |
| Expenses | | |
| Management fee | $2,640,068 | |
| Transfer agent fees | 831,058 | |
| Accounting fees | 191,183 | |
| Custodian fees and expenses | 16,956 | |
| Independent trustees' fees and expenses | 2,790 | |
| Registration fees | 35,710 | |
| Audit | 40,230 | |
| Legal | 5,758 | |
| Interest | 613 | |
| Miscellaneous | 12,039 | |
| Total expenses before reductions | 3,776,405 | |
| Expense reductions | (80,666) | |
| Total expenses after reductions | | 3,695,739 |
| Net investment income (loss) | | (234,474) |
| Realized and Unrealized Gain (Loss) | | |
| Net realized gain (loss) on: | | |
| Investment securities: | | |
| Unaffiliated issuers | 58,524,364 | |
| Fidelity Central Funds | (1,360) | |
| Foreign currency transactions | 7,814 | |
| Total net realized gain (loss) | | 58,530,818 |
| Change in net unrealized appreciation (depreciation) on: | | |
| Investment securities: | | |
| Unaffiliated issuers | 32,495,504 | |
| Assets and liabilities in foreign currencies | (4) | |
| Total change in net unrealized appreciation (depreciation) | | 32,495,500 |
| Net gain (loss) | | 91,026,318 |
| Net increase (decrease) in net assets resulting from operations | | $90,791,844 |
See accompanying notes which are an integral part of the financial statements.
Statement of Changes in Net Assets
| | Year ended February 28, 2021 | Year ended February 29, 2020 |
| Increase (Decrease) in Net Assets | | |
| Operations | | |
| Net investment income (loss) | $(234,474) | $4,960,230 |
| Net realized gain (loss) | 58,530,818 | 43,925,894 |
| Change in net unrealized appreciation (depreciation) | 32,495,500 | (55,478,292) |
| Net increase (decrease) in net assets resulting from operations | 90,791,844 | (6,592,168) |
| Distributions to shareholders | (17,106,826) | (24,419,475) |
| Share transactions | | |
| Proceeds from sales of shares | 130,225,348 | 75,905,271 |
| Reinvestment of distributions | 16,136,117 | 22,923,326 |
| Cost of shares redeemed | (184,860,626) | (171,263,736) |
| Net increase (decrease) in net assets resulting from share transactions | (38,499,161) | (72,435,139) |
| Total increase (decrease) in net assets | 35,185,857 | (103,446,782) |
| Net Assets | | |
| Beginning of period | 529,023,007 | 632,469,789 |
| End of period | $564,208,864 | $529,023,007 |
| Other Information | | |
| Shares | | |
| Sold | 3,871,976 | 2,169,004 |
| Issued in reinvestment of distributions | 620,923 | 650,311 |
| Redeemed | (5,894,475) | (4,925,986) |
| Net increase (decrease) | (1,401,576) | (2,106,671) |
See accompanying notes which are an integral part of the financial statements.
Financial Highlights
Industrials Portfolio
| | | | | | |
| Years ended February 28, | 2021 | 2020 A | 2019 | 2018 | 2017 |
| Selected Per–Share Data | | | | | |
| Net asset value, beginning of period | $31.90 | $33.84 | $36.96 | $33.72 | $28.10 |
| Income from Investment Operations | | | | | |
| Net investment income (loss)B | (.02) | .28C | .32 | .21 | .26 |
| Net realized and unrealized gain (loss) | 6.38 | (.76) | (.70) | 4.95 | 6.76 |
| Total from investment operations | 6.36 | (.48) | (.38) | 5.16 | 7.02 |
| Distributions from net investment income | (.07)D | (.24) | (.25) | (.22) | (.19) |
| Distributions from net realized gain | (1.02)D | (1.23) | (2.49) | (1.71) | (1.21) |
| Total distributions | (1.09) | (1.46)E | (2.74) | (1.92)E | (1.40) |
| Redemption fees added to paid in capitalB | – | – | – | – | –F |
| Net asset value, end of period | $37.17 | $31.90 | $33.84 | $36.96 | $33.72 |
| Total ReturnG | 21.41% | (1.82)% | (.45)% | 15.73% | 25.18% |
| Ratios to Average Net AssetsH,I | | | | | |
| Expenses before reductions | .76% | .76% | .76% | .77% | .77% |
| Expenses net of fee waivers, if any | .76% | .76% | .76% | .77% | .77% |
| Expenses net of all reductions | .74% | .75% | .75% | .77% | .77% |
| Net investment income (loss) | (.05)% | .81%C | .92% | .60% | .83% |
| Supplemental Data | | | | | |
| Net assets, end of period (000 omitted) | $564,209 | $529,023 | $632,470 | $1,076,950 | $1,006,420 |
| Portfolio turnover rateJ | 272% | 143%K | 88%K | 64%L | 62%K |
A For the year ended February 29.
B Calculated based on average shares outstanding during the period.
C Net investment income per share reflects one or more large, non-recurring dividend(s) which amounted to $.06 per share. Excluding such non-recurring dividend(s), the ratio of net investment income (loss) to average net assets would have been .64%.
D The amounts shown reflect certain reclassifications related to book to tax differences that were made in the year shown.
E Total distributions per share do not sum due to rounding.
F Amount represents less than $.005 per share.
G Total returns would have been lower if certain expenses had not been reduced during the applicable periods shown.
H Fees and expenses of any underlying mutual funds or exchange-traded funds (ETFs) are not included in the Fund's expense ratio. The Fund indirectly bears its proportionate share of these expenses. For additional expense information related to investments in Fidelity Central Funds, please refer to the "Investments in Fidelity Central Funds" note found in the Notes to Financial Statements section of the most recent Annual or Semi-Annual report.
I Expense ratios reflect operating expenses of the class. Expenses before reductions do not reflect amounts reimbursed, waived, or reduced through arrangements with the investment advisor, brokerage services, or other offset arrangements, if applicable, and do not represent the amount paid by the class during periods when reimbursements, waivers or reductions occur.
J Amount does not include the portfolio activity of any underlying mutual funds or exchange-traded funds (ETFs).
K Portfolio turnover rate excludes securities received or delivered in-kind.
L The portfolio turnover rate does not include the assets acquired in the merger.
See accompanying notes which are an integral part of the financial statements.
Transportation Portfolio
Performance: The Bottom Line
Average annual total return reflects the change in the value of an investment, assuming reinvestment of distributions from dividend income and capital gains (the profits earned upon the sale of securities that have grown in value, if any) and assuming a constant rate of performance each year. The hypothetical investment and the average annual total returns do not reflect the deduction of taxes that a shareholder would pay on fund distributions or the redemption of fund shares. During periods of reimbursement by Fidelity, a fund’s total return will be greater than it would be had the reimbursement not occurred. How a fund did yesterday is no guarantee of how it will do tomorrow.
Average Annual Total Returns
| For the periods ended February 28, 2021 | Past 1 year | Past 5 years | Past 10 years |
| Transportation Portfolio | 34.62% | 13.39% | 12.19% |
$10,000 Over 10 Years
Let's say hypothetically that $10,000 was invested in Transportation Portfolio on February 28, 2011.
The chart shows how the value of your investment would have changed, and also shows how the S&P 500® Index performed over the same period.

| Period Ending Values |
| $31,601 | Transportation Portfolio |
| $35,259 | S&P 500® Index |
Transportation Portfolio
Management's Discussion of Fund Performance
Market Recap: The S&P 500
® index gained 31.29% for the 12 months ending February 28, 2021, a volatile but productive period for U.S. risk assets. The early-2020 outbreak and spread of COVID-19 resulted in stocks suffering one of the quickest declines on record, through March 23, followed by a historic rebound that included the index closing 2020 at an all-time high and gaining modest ground in the first two months of the new year. The crisis and containment efforts caused broad contraction in economic activity, along with extreme uncertainty and dislocation in financial markets. A rapid and expansive U.S. monetary/fiscal-policy response partially offset the economic disruption and fueled the market surge, as did resilient corporate earnings. The rally slowed in September, when stocks began a two-month retreat amid Congress’s inability to reach a deal on additional fiscal stimulus, as well as concerns about election uncertainty, indications the U.S. economic recovery could be slowing and a new wave of COVID-19 cases. A shift in momentum began in October and accelerated following the U.S. elections, with the approval of three breakthrough COVID-19 vaccines and prospects for additional government stimulus fueling the “reflation trade” through February 28. By sector for the full 12 months, information technology (+50%) and consumer discretionary (+43%) led all gainers. Materials (+42%) and communication services (+37%) also stood out. In contrast, the defensive utilities (-3%) and real estate sectors (+5%) notably lagged.
Comments from Portfolio Manager Matthew Moulis: For the fiscal year ending February 28, 2021, the fund gained 34.62%, underperforming the 44.40% advance of the MSCI US IMI Transportation 25/50 Linked Index, but outperforming the broad-based S&P 500
® index. The primary detractor from performance versus the industry index was security selection and an overweighting in the air freight & logistics category. Subpar picks, along with an underweighting among airlines stocks, also hurt. Modest out-of-index exposure to aerospace & defense further hindered the fund's relative result the past 12 months. The largest individual relative detractor was untimely ownership of Air Transport Services, which gained about 48% the past year and was among the portfolio's biggest holdings on February 28. Also hampering performance versus the index was an outsized stake in SkyWest (+29%), although we decreased our exposure to the company this period. Another notable relative detractor was untimely ownership of United Airlines Holdings (-14%). Here, we also we reduced our stake the past 12 months. In contrast, the biggest contributor to performance versus the industry index was security selection and an underweighting in the marine group. Non-index exposure to internet & direct marketing retail firms, as well as an underweighting in railroads, further boosted the fund's relative performance. The portfolio’s top individual relative contributor was an out-of-index stake in TFI International (+129%), which was among the largest holdings as of February 28. Also lifting performance was our lighter-than-index stake in Delta Air Lines, which gained 4%. Another notable relative contributor was our underweighting in Hertz Global Holdings (-96%), a position not held at period end. Notable changes in positioning include increased exposure to trucking companies and a lower allocation to airlines.
The views expressed above reflect those of the portfolio manager(s) only through the end of the period as stated on the cover of this report and do not necessarily represent the views of Fidelity or any other person in the Fidelity organization. Any such views are subject to change at any time based upon market or other conditions and Fidelity disclaims any responsibility to update such views. These views may not be relied on as investment advice and, because investment decisions for a Fidelity fund are based on numerous factors, may not be relied on as an indication of trading intent on behalf of any Fidelity fund.
Transportation Portfolio
Investment Summary (Unaudited)
Top Ten Stocks as of February 28, 2021
| | % of fund's net assets |
| Union Pacific Corp. | 17.0 |
| United Parcel Service, Inc. Class B | 13.3 |
| CSX Corp. | 7.9 |
| Air Transport Services Group, Inc. | 6.1 |
| FedEx Corp. | 4.3 |
| Expeditors International of Washington, Inc. | 3.0 |
| Norfolk Southern Corp. | 3.0 |
| C.H. Robinson Worldwide, Inc. | 2.6 |
| Landstar System, Inc. | 2.5 |
| Knight-Swift Transportation Holdings, Inc. Class A | 2.5 |
| | 62.2 |
Top Industries (% of fund's net assets)
| As of February 28, 2021 |
| | Road & Rail | 50.8% |
| | Air Freight & Logistics | 35.5% |
| | Airlines | 5.6% |
| | Marine | 2.7% |
| | Internet & Direct Marketing Retail | 1.1% |
| | All Others* | 4.3% |

* Includes short-term investments and net other assets (liabilities).
Transportation Portfolio
Schedule of Investments February 28, 2021
Showing Percentage of Net Assets
| Common Stocks - 97.7% | | | |
| | | Shares | Value |
| Aerospace & Defense - 0.5% | | | |
| Aerospace & Defense - 0.5% | | | |
| Northrop Grumman Corp. | | 5,400 | $1,574,964 |
| Air Freight & Logistics - 35.5% | | | |
| Air Freight & Logistics - 35.5% | | | |
| Air Transport Services Group, Inc. (a) | | 771,400 | 20,472,956 |
| Atlas Air Worldwide Holdings, Inc. (a) | | 71,700 | 3,952,821 |
| C.H. Robinson Worldwide, Inc. | | 94,396 | 8,575,877 |
| Echo Global Logistics, Inc. (a) | | 107,000 | 2,981,020 |
| Expeditors International of Washington, Inc. | | 111,100 | 10,203,424 |
| FedEx Corp. | | 56,950 | 14,493,775 |
| Forward Air Corp. | | 20,700 | 1,775,439 |
| Hub Group, Inc. Class A (a) | | 123,100 | 7,088,098 |
| United Parcel Service, Inc. Class B | | 282,674 | 44,614,437 |
| XPO Logistics, Inc. (a) | | 43,100 | 5,025,460 |
| | | | 119,183,307 |
| Airlines - 5.6% | | | |
| Airlines - 5.6% | | | |
| Alaska Air Group, Inc. | | 31,000 | 2,015,620 |
| Copa Holdings SA Class A | | 24,600 | 2,255,082 |
| Delta Air Lines, Inc. | | 49,502 | 2,373,126 |
| Global Crossing Airlines Group (a) | | 5,000 | 8,958 |
| SkyWest, Inc. | | 129,600 | 7,305,552 |
| Southwest Airlines Co. | | 64,000 | 3,720,320 |
| United Airlines Holdings, Inc. (a) | | 19,500 | 1,027,260 |
| | | | 18,705,918 |
| Internet & Direct Marketing Retail - 1.1% | | | |
| Internet & Direct Marketing Retail - 1.1% | | | |
| Points International Ltd. (a)(b) | | 230,800 | 3,635,100 |
| IT Services - 0.5% | | | |
| IT Consulting & Other Services - 0.5% | | | |
| CACI International, Inc. Class A (a) | | 8,200 | 1,814,988 |
| Marine - 2.7% | | | |
| Marine - 2.7% | | | |
| A.P. Moller - Maersk A/S Series A | | 900 | 1,806,367 |
| Diana Shipping, Inc. (a) | | 100,800 | 306,432 |
| Genco Shipping & Trading Ltd. | | 98,836 | 1,037,778 |
| Kirby Corp. (a) | | 24,400 | 1,526,464 |
| Matson, Inc. | | 51,095 | 3,539,351 |
| Safe Bulkers, Inc. (a) | | 91,600 | 251,900 |
| Star Bulk Carriers Corp. | | 30,900 | 435,072 |
| | | | 8,903,364 |
| Road & Rail - 50.8% | | | |
| Railroads - 29.9% | | | |
| CSX Corp. | | 289,546 | 26,507,936 |
| Kansas City Southern | | 30,900 | 6,561,306 |
| Norfolk Southern Corp. | | 40,450 | 10,195,827 |
| Union Pacific Corp. | | 276,895 | 57,029,294 |
| | | | 100,294,363 |
| Trucking - 20.9% | | | |
| AMERCO | | 12,600 | 7,241,472 |
| ArcBest Corp. | | 21,000 | 1,238,790 |
| Covenant Transport Group, Inc. Class A (a) | | 63,374 | 1,152,139 |
| J.B. Hunt Transport Services, Inc. | | 55,700 | 8,180,659 |
| Knight-Swift Transportation Holdings, Inc. Class A | | 192,300 | 8,307,360 |
| Landstar System, Inc. | | 52,400 | 8,391,336 |
| Marten Transport Ltd. | | 40,176 | 650,048 |
| Old Dominion Freight Lines, Inc. | | 3,600 | 773,172 |
| Ryder System, Inc. | | 87,025 | 5,897,684 |
| Schneider National, Inc. Class B | | 176,200 | 4,075,506 |
| TFI International, Inc. | | 112,800 | 7,875,696 |
| TFI International, Inc. (Canada) | | 66,800 | 4,665,922 |
| U.S. Xpress Enterprises, Inc. (a)(b) | | 177,100 | 1,638,175 |
| U.S.A. Truck, Inc. (a) | | 48,500 | 674,150 |
| Uber Technologies, Inc. (a) | | 90,500 | 4,683,375 |
| Universal Logistics Holdings, Inc. | | 54,600 | 1,278,186 |
| Werner Enterprises, Inc. | | 84,283 | 3,617,426 |
| | | | 70,341,096 |
|
| TOTAL ROAD & RAIL | | | 170,635,459 |
|
| Software - 0.0% | | | |
| Application Software - 0.0% | | | |
| Descartes Systems Group, Inc. (Canada) (a) | | 2,800 | 163,938 |
| Trading Companies & Distributors - 0.0% | | | |
| Trading Companies & Distributors - 0.0% | | | |
| Willis Lease Finance Corp. (a) | | 3,249 | 104,943 |
| Transportation Infrastructure - 1.0% | | | |
| Airport Services - 1.0% | | | |
| Macquarie Infrastructure Co. LLC | | 109,800 | 3,441,132 |
| TOTAL COMMON STOCKS | | | |
| (Cost $167,670,564) | | | 328,163,113 |
|
| Money Market Funds - 2.5% | | | |
| Fidelity Cash Central Fund 0.07% (c) | | 7,056,573 | 7,057,985 |
| Fidelity Securities Lending Cash Central Fund 0.08% (c)(d) | | 1,190,006 | 1,190,125 |
| TOTAL MONEY MARKET FUNDS | | | |
| (Cost $8,248,110) | | | 8,248,110 |
| TOTAL INVESTMENT IN SECURITIES - 100.2% | | | |
| (Cost $175,918,674) | | | 336,411,223 |
| NET OTHER ASSETS (LIABILITIES) - (0.2)% | | | (631,628) |
| NET ASSETS - 100% | | | $335,779,595 |
Legend
(a) Non-income producing
(b) Security or a portion of the security is on loan at period end.
(c) Affiliated fund that is generally available only to investment companies and other accounts managed by Fidelity Investments. The rate quoted is the annualized seven-day yield of the fund at period end. A complete unaudited listing of the fund's holdings as of its most recent quarter end is available upon request. In addition, each Fidelity Central Fund's financial statements, which are not covered by the Fund's Report of Independent Registered Public Accounting Firm, are available on the SEC's website or upon request.
(d) Investment made with cash collateral received from securities on loan.
Affiliated Central Funds
Information regarding fiscal year to date income earned by the Fund from investments in Fidelity Central Funds is as follows:
| Fund | Income earned |
| Fidelity Cash Central Fund | $11,573 |
| Fidelity Securities Lending Cash Central Fund | 7,008 |
| Total | $18,581 |
Amounts in the income column in the above table include any capital gain distributions from underlying funds, which are presented in the corresponding line-item in the Statement of Operations, if applicable. Amount for Fidelity Securities Lending Cash Central Fund represents the income earned on investing cash collateral, less rebates paid to borrowers and any lending agent fees associated with the loan, plus any premium payments received for lending certain types of securities.
Investment Valuation
The following is a summary of the inputs used, as of February 28, 2021, involving the Fund's assets and liabilities carried at fair value. The inputs or methodology used for valuing securities may not be an indication of the risk associated with investing in those securities. For more information on valuation inputs, and their aggregation into the levels used below, please refer to the Investment Valuation section in the accompanying Notes to Financial Statements.
| | Valuation Inputs at Reporting Date: |
| Description | Total | Level 1 | Level 2 | Level 3 |
| Investments in Securities: | | | | |
| Common Stocks | $328,163,113 | $328,163,113 | $-- | $-- |
| Money Market Funds | 8,248,110 | 8,248,110 | -- | -- |
| Total Investments in Securities: | $336,411,223 | $336,411,223 | $-- | $-- |
See accompanying notes which are an integral part of the financial statements.
Transportation Portfolio
Financial Statements
Statement of Assets and Liabilities
| | | February 28, 2021 |
| Assets | | |
Investment in securities, at value (including securities loaned of $1,129,150) — See accompanying schedule:
Unaffiliated issuers (cost $167,670,564) | $328,163,113 | |
| Fidelity Central Funds (cost $8,248,110) | 8,248,110 | |
| Total Investment in Securities (cost $175,918,674) | | $336,411,223 |
| Receivable for investments sold | | 1,117,134 |
| Receivable for fund shares sold | | 65,475 |
| Dividends receivable | | 770,092 |
| Distributions receivable from Fidelity Central Funds | | 386 |
| Prepaid expenses | | 2,798 |
| Other receivables | | 2,228 |
| Total assets | | 338,369,336 |
| Liabilities | | |
| Payable to custodian bank | $1,182 | |
| Payable for investments purchased | $1,019,374 | |
| Payable for fund shares redeemed | 137,408 | |
| Accrued management fee | 147,155 | |
| Other affiliated payables | 61,675 | |
| Other payables and accrued expenses | 32,822 | |
| Collateral on securities loaned | 1,190,125 | |
| Total liabilities | | 2,589,741 |
| Net Assets | | $335,779,595 |
| Net Assets consist of: | | |
| Paid in capital | | $164,953,174 |
| Total accumulated earnings (loss) | | 170,826,421 |
| Net Assets | | $335,779,595 |
| Net Asset Value, offering price and redemption price per share ($335,779,595 ÷ 3,392,910 shares) | | $98.97 |
See accompanying notes which are an integral part of the financial statements.
Statement of Operations
| | | Year ended February 28, 2021 |
| Investment Income | | |
| Dividends | | $5,017,567 |
| Special dividends | | 1,235,300 |
| Income from Fidelity Central Funds (including $7,008 from security lending) | | 18,581 |
| Total income | | 6,271,448 |
| Expenses | | |
| Management fee | $1,591,633 | |
| Transfer agent fees | 603,042 | |
| Accounting fees | 116,863 | |
| Custodian fees and expenses | 8,095 | |
| Independent trustees' fees and expenses | 1,694 | |
| Registration fees | 27,396 | |
| Audit | 46,184 | |
| Legal | 3,863 | |
| Miscellaneous | 8,837 | |
| Total expenses before reductions | 2,407,607 | |
| Expense reductions | (19,586) | |
| Total expenses after reductions | | 2,388,021 |
| Net investment income (loss) | | 3,883,427 |
| Realized and Unrealized Gain (Loss) | | |
| Net realized gain (loss) on: | | |
| Investment securities: | | |
| Unaffiliated issuers | 10,993,836 | |
| Fidelity Central Funds | (1,236) | |
| Foreign currency transactions | 585 | |
| Total net realized gain (loss) | | 10,993,185 |
| Change in net unrealized appreciation (depreciation) on: | | |
| Investment securities: | | |
| Unaffiliated issuers | 72,710,385 | |
| Assets and liabilities in foreign currencies | 255 | |
| Total change in net unrealized appreciation (depreciation) | | 72,710,640 |
| Net gain (loss) | | 83,703,825 |
| Net increase (decrease) in net assets resulting from operations | | $87,587,252 |
See accompanying notes which are an integral part of the financial statements.
Statement of Changes in Net Assets
| | Year ended February 28, 2021 | Year ended February 29, 2020 |
| Increase (Decrease) in Net Assets | | |
| Operations | | |
| Net investment income (loss) | $3,883,427 | $4,099,350 |
| Net realized gain (loss) | 10,993,185 | 27,932,322 |
| Change in net unrealized appreciation (depreciation) | 72,710,640 | (68,395,892) |
| Net increase (decrease) in net assets resulting from operations | 87,587,252 | (36,364,220) |
| Distributions to shareholders | (27,097,439) | (16,996,996) |
| Share transactions | | |
| Proceeds from sales of shares | 67,825,627 | 36,956,264 |
| Reinvestment of distributions | 25,610,516 | 16,103,156 |
| Cost of shares redeemed | (128,587,302) | (140,448,927) |
| Net increase (decrease) in net assets resulting from share transactions | (35,151,159) | (87,389,507) |
| Total increase (decrease) in net assets | 25,338,654 | (140,750,723) |
| Net Assets | | |
| Beginning of period | 310,440,941 | 451,191,664 |
| End of period | $335,779,595 | $310,440,941 |
| Other Information | | |
| Shares | | |
| Sold | 836,595 | 396,518 |
| Issued in reinvestment of distributions | 390,206 | 168,242 |
| Redeemed | (1,614,325) | (1,513,069) |
| Net increase (decrease) | (387,524) | (948,309) |
See accompanying notes which are an integral part of the financial statements.
Financial Highlights
Transportation Portfolio
| | | | | | |
| Years ended February 28, | 2021 | 2020 A | 2019 | 2018 | 2017 |
| Selected Per–Share Data | | | | | |
| Net asset value, beginning of period | $82.12 | $95.41 | $99.07 | $92.98 | $73.25 |
| Income from Investment Operations | | | | | |
| Net investment income (loss)B | 1.06C | .93 | .85 | .78 | .63 |
| Net realized and unrealized gain (loss) | 23.43 | (10.43) | 5.05 | 10.83 | 20.86 |
| Total from investment operations | 24.49 | (9.50) | 5.90 | 11.61 | 21.49 |
| Distributions from net investment income | (.76) | (1.10) | (.78) | (.67) | (.38) |
| Distributions from net realized gain | (6.88) | (2.70) | (8.78) | (4.85) | (1.39) |
| Total distributions | (7.64) | (3.79)D | (9.56) | (5.52) | (1.77) |
| Redemption fees added to paid in capitalB | – | – | – | –E | .01 |
| Net asset value, end of period | $98.97 | $82.12 | $95.41 | $99.07 | $92.98 |
| Total ReturnF | 34.62% | (10.49)% | 6.85% | 12.48% | 29.40% |
| Ratios to Average Net AssetsG,H | | | | | |
| Expenses before reductions | .80% | .79% | .79% | .80% | .83% |
| Expenses net of fee waivers, if any | .80% | .79% | .79% | .80% | .83% |
| Expenses net of all reductions | .80% | .79% | .78% | .80% | .82% |
| Net investment income (loss) | 1.29%C | 1.00% | .87% | .80% | .76% |
| Supplemental Data | | | | | |
| Net assets, end of period (000 omitted) | $335,780 | $310,441 | $451,192 | $512,155 | $643,067 |
| Portfolio turnover rateI | 52% | 78% | 58% | 47% | 104% |
A For the year ended February 29.
B Calculated based on average shares outstanding during the period.
C Net investment income per share reflects one or more large, non-recurring dividend(s) which amounted to $.34 per share. Excluding such non-recurring dividend(s), the ratio of net investment income (loss) to average net assets would have been .88%.
D Total distributions per share do not sum due to rounding.
E Amount represents less than $.005 per share.
F Total returns would have been lower if certain expenses had not been reduced during the applicable periods shown.
G Fees and expenses of any underlying mutual funds or exchange-traded funds (ETFs) are not included in the Fund's expense ratio. The Fund indirectly bears its proportionate share of these expenses. For additional expense information related to investments in Fidelity Central Funds, please refer to the "Investments in Fidelity Central Funds" note found in the Notes to Financial Statements section of the most recent Annual or Semi-Annual report.
H Expense ratios reflect operating expenses of the class. Expenses before reductions do not reflect amounts reimbursed, waived, or reduced through arrangements with the investment advisor, brokerage services, or other offset arrangements, if applicable, and do not represent the amount paid by the class during periods when reimbursements, waivers or reductions occur.
I Amount does not include the portfolio activity of any underlying mutual funds or exchange-traded funds (ETFs).
See accompanying notes which are an integral part of the financial statements.
Notes to Financial Statements
For the period ended February 28, 2021
1. Organization.
Air Transportation Portfolio, Defense and Aerospace Portfolio, Environment and Alternative Energy Portfolio, Industrials Portfolio, and Transportation Portfolio (the Funds) are non-diversified funds of Fidelity Select Portfolios (the Trust). The Trust is registered under the Investment Company Act of 1940, as amended (the 1940 Act), as an open-end management investment company organized as a Massachusetts business trust. The Funds invest primarily in securities of companies whose principal business activities fall within specific industries. Each Fund is authorized to issue an unlimited number of shares. Share transactions on the Statement of Changes in Net Assets may contain exchanges between affiliated funds.
In April 2021, the Board of Trustees approved a change in the name of Environment and Alternative Energy Portfolio to Fidelity Environment and Alternative Energy Fund effective May 1, 2021.
2. Investments in Fidelity Central Funds.
The Funds invest in Fidelity Central Funds, which are open-end investment companies generally available only to other investment companies and accounts managed by the investment adviser and its affiliates. The Funds' Schedules of Investments list each of the Fidelity Central Funds held as of period end, if any, as an investment of each Fund, but do not include the underlying holdings of each Fidelity Central Fund. As an Investing Fund, each Fund indirectly bears its proportionate share of the expenses of the underlying Fidelity Central Funds.
The Money Market Central Funds seek preservation of capital and current income and are managed by the investment adviser. Annualized expenses of the Money Market Central Funds as of their most recent shareholder report date ranged from less than .005% to .01%.
A complete unaudited list of holdings for each Fidelity Central Fund is available upon request or at the Securities and Exchange Commission (the SEC) website at www.sec.gov. In addition, the financial statements of the Fidelity Central Funds, which are not covered by the Funds' Report of Independent Registered Public Accounting Firm, are available on the SEC website or upon request.
3. Significant Accounting Policies.
Each Fund is an investment company and applies the accounting and reporting guidance of the Financial Accounting Standards Board (FASB) Accounting Standards Codification Topic 946 Financial Services - Investment Companies. The financial statements have been prepared in conformity with accounting principles generally accepted in the United States of America (GAAP), which require management to make certain estimates and assumptions at the date of the financial statements. Actual results could differ from those estimates. Subsequent events, if any, through the date that the financial statements were issued have been evaluated in the preparation of the financial statements. The following summarizes the significant accounting policies of the Funds:
Investment Valuation. Investments are valued as of 4:00 p.m. Eastern time on the last calendar day of the period. The Board of Trustees (the Board) has delegated the day to day responsibility for the valuation of each Fund's investments to the Fair Value Committee (the Committee) established by each Fund's investment adviser. In accordance with valuation policies and procedures approved by the Board, each Fund attempts to obtain prices from one or more third party pricing vendors or brokers to value its investments. When current market prices, quotations or currency exchange rates are not readily available or reliable, investments will be fair valued in good faith by the Committee, in accordance with procedures adopted by the Board. Factors used in determining fair value vary by investment type and may include market or investment specific events. The frequency with which these procedures are used cannot be predicted and they may be utilized to a significant extent. The Committee oversees each Fund's valuation policies and procedures and reports to the Board on the Committee's activities and fair value determinations. The Board monitors the appropriateness of the procedures used in valuing each Fund's investments and ratifies the fair value determinations of the Committee.
Each Fund categorizes the inputs to valuation techniques used to value its investments into a disclosure hierarchy consisting of three levels as shown below:
- Level 1 – quoted prices in active markets for identical investments
- Level 2 – other significant observable inputs (including quoted prices for similar investments, interest rates, prepayment speeds, etc.)
- Level 3 – unobservable inputs (including the Fund's own assumptions based on the best information available)
Valuation techniques used to value each Fund's investments by major category are as follows:
Equity securities, including restricted securities, for which market quotations are readily available, are valued at the last reported sale price or official closing price as reported by a third party pricing vendor on the primary market or exchange on which they are traded and are categorized as Level 1 in the hierarchy. In the event there were no sales during the day or closing prices are not available, securities are valued at the last quoted bid price or may be valued using the last available price and are generally categorized as Level 2 in the hierarchy. For foreign equity securities, when market or security specific events arise, comparisons to the valuation of American Depositary Receipts (ADRs), futures contracts, Exchange-Traded Funds (ETFs) and certain indexes as well as quoted prices for similar securities may be used and would be categorized as Level 2 in the hierarchy. For equity securities, including restricted securities, where observable inputs are limited, assumptions about market activity and risk are used and these securities may be categorized as Level 3 in the hierarchy.
Investments in open-end mutual funds, including the Fidelity Central Funds, are valued at their closing net asset value (NAV) each business day and are categorized as Level 1 in the hierarchy.
Changes in valuation techniques may result in transfers in or out of an assigned level within the disclosure hierarchy. The aggregate value of investments by input level as of February 28, 2021 is included at the end of each Fund's Schedule of Investments.
Foreign Currency. Certain Funds may use foreign currency contracts to facilitate transactions in foreign-denominated securities. Gains and losses from these transactions may arise from changes in the value of the foreign currency or if the counterparties do not perform under the contracts' terms.
Foreign-denominated assets, including investment securities, and liabilities are translated into U.S. dollars at the exchange rates at period end. Purchases and sales of investment securities, income and dividends received, and expenses denominated in foreign currencies are translated into U.S. dollars at the exchange rate in effect on the transaction date.
The effects of exchange rate fluctuations on investments are included with the net realized and unrealized gain (loss) on investment securities. Other foreign currency transactions resulting in realized and unrealized gain (loss) are disclosed separately.
Investment Transactions and Income. For financial reporting purposes, the Funds' investment holdings and NAV include trades executed through the end of the last business day of the period. The NAV per share for processing shareholder transactions is calculated as of the close of business of the New York Stock Exchange (NYSE), normally 4:00 p.m. Eastern time and includes trades executed through the end of the prior business day. Gains and losses on securities sold are determined on the basis of identified cost and for certain Funds include proceeds received from litigation. Dividend income is recorded on the ex-dividend date, except for certain dividends from foreign securities where the ex-dividend date may have passed, which are recorded as soon as the Funds are informed of the ex-dividend date. Non-cash dividends included in dividend income, if any, are recorded at the fair market value of the securities received. Income and capital gain distributions from Fidelity Central Funds, if any, are recorded on the ex-dividend date. Certain distributions received by the Funds represent a return of capital or capital gain. The Funds determine the components of these distributions subsequent to the ex-dividend date, based upon receipt of tax filings or other correspondence relating to the underlying investment. These distributions are recorded as a reduction of cost of investments and/or as a realized gain. During the period, dividend income has been reduced $422,879 for Air Transportation Portfolio, $9,362,244 for Defense and Aerospace Portfolio, and $530,746 for Industrials Portfolio with a corresponding increase to net unrealized appreciation (depreciation) as a result of a change in the prior period estimate, which had no impact on the total net assets or total return of the Funds.
Large, non-recurring dividends recognized by the Funds are presented separately on the Statement of Operations as "Special Dividends" and the impact of these dividends is presented in the Financial Highlights. Investment income is recorded net of foreign taxes withheld where recovery of such taxes is uncertain.
Expenses. Expenses directly attributable to a fund are charged to that fund. Expenses attributable to more than one fund are allocated among the respective funds on the basis of relative net assets or other appropriate methods. Expense estimates are accrued in the period to which they relate and adjustments are made when actual amounts are known.
Deferred Trustee Compensation. Under a Deferred Compensation Plan (the Plan) for certain Funds, certain independent Trustees have elected to defer receipt of a portion of their annual compensation. Deferred amounts are invested in affiliated mutual funds, are marked-to-market and remain in a fund until distributed in accordance with the Plan. The investment of deferred amounts and the offsetting payable to the Trustees presented below are included in the accompanying Statement of Assets and Liabilities in other receivables and other payables and accrued expenses, as applicable.
| Defense and Aerospace Portfolio | 120,503 |
| Industrials Portfolio | 111,419 |
Income Tax Information and Distributions to Shareholders. Each year, each Fund intends to qualify as a regulated investment company under Subchapter M of the Internal Revenue Code, including distributing substantially all of its taxable income and realized gains. As a result, no provision for U.S. Federal income taxes is required. As of February 28, 2021, each Fund did not have any unrecognized tax benefits in the financial statements; nor is each Fund aware of any tax positions for which it is reasonably possible that the total amounts of unrecognized tax benefits will significantly change in the next twelve months. Each Fund files a U.S. federal tax return, in addition to state and local tax returns as required. Each Fund's federal income tax returns are subject to examination by the Internal Revenue Service (IRS) for a period of three fiscal years after they are filed. State and local tax returns may be subject to examination for an additional fiscal year depending on the jurisdiction. Foreign taxes are provided for based on each Fund's understanding of the tax rules and rates that exist in the foreign markets in which it invests.
Distributions are declared and recorded on the ex-dividend date. Income and capital gain distributions are determined in accordance with income tax regulations, which may differ from GAAP. These differences resulted in distribution reclassifications. In addition, certain Funds claimed a portion of the payment made to redeeming shareholders as a distribution for income tax purposes.
Capital accounts within the financial statements are adjusted for permanent book-tax differences. These adjustments have no impact on net assets or the results of operations. Capital accounts are not adjusted for temporary book-tax differences which will reverse in a subsequent period.
Book-tax differences are primarily due to foreign currency transactions, deferred Trustees compensation, net operating losses, capital loss carryforwards, losses deferred due to wash sales and excise tax regulations.
As of period end, the cost and unrealized appreciation (depreciation) in securities, and derivatives if applicable, for federal income tax purposes were as follows for each Fund:
| | Tax cost | Gross unrealized appreciation | Gross unrealized depreciation | Net unrealized appreciation (depreciation) |
| Air Transportation Portfolio | $261,341,348 | $114,714,123 | $(9,323,035) | $105,391,088 |
| Defense and Aerospace Portfolio | 1,014,115,338 | 649,956,573 | (16,815,480) | 633,141,093 |
| Environment and Alternative Energy Portfolio | 302,283,235 | 79,082,795 | (7,756,677) | 71,326,118 |
| Industrials Portfolio | 477,615,378 | 102,638,233 | (10,010,592) | 92,627,641 |
| Transportation Portfolio | 176,649,673 | 161,759,458 | (1,997,908) | 159,761,550 |
The tax-based components of distributable earnings as of period end were as follows for each Fund:
| | Undistributed ordinary income | Undistributed long-term capital gain | Capital loss carryforward | Net unrealized appreciation (depreciation) on securities and other investments |
| Air Transportation Portfolio | $– | $– | $(17,628,105) | $105,391,088 |
| Defense and Aerospace Portfolio | – | – | (103,341,322) | 633,143,634 |
| Environment and Alternative Energy Portfolio | 231,917 | – | (3,214,228) | 71,329,840 |
| Industrials Portfolio | 11,392,033 | 44,434,816 | – | 92,627,605 |
| Transportation Portfolio | 1,776,509 | 9,288,105 | – | 159,761,805 |
Capital loss carryforwards are only available to offset future capital gains of the Funds to the extent provided by regulations and may be limited. The capital loss carryforward information presented below, including any applicable limitation, is estimated as of fiscal period end and is subject to adjustment.
| | No expiration | | |
| | Short-term | Long-term | Total capital loss carryfoward |
| Air Transportation Portfolio | $(6,467,342) | $(11,160,763) | $(17,628,105) |
| Defense and Aerospace Portfolio | (101,572,404) | (1,768,918) | (103,341,322) |
| Environment and Alternative Energy Portfolio | (3,214,228) | -– | (3,214,228) |
Certain of the Funds intend to elect to defer to the next fiscal year ordinary losses recognized during the period January 1, 2021 to February 28, 2021. Loss deferrals were as follows:
| | Ordinary losses |
| Air Transportation Portfolio | $477,992 |
The tax character of distributions paid was as follows:
| February 28, 2021 | | | |
| | Ordinary Income | Long-term Capital Gains | Total |
| Air Transportation Portfolio | $1,275,879 | $4,017,405 | $5,293,284 |
| Defense and Aerospace Portfolio | 7,565,576 | 44,939,506 | 52,505,082 |
| Environment and Alternative Energy Portfolio | 5,071,517 | 8,656,443 | 13,727,960 |
| Industrials Portfolio | 1,388,402 | 15,718,424 | 17,106,826 |
| Transportation Portfolio | 2,696,447 | 24,400,992 | 27,097,439 |
| February 29, 2020 | | | |
| | Ordinary Income | Long-term Capital Gains | Total |
| Air Transportation Portfolio | $6,970,913 | $19,398,233 | $26,369,146 |
| Defense and Aerospace Portfolio | 36,154,792 | 43,135,663 | 79,290,455 |
| Environment and Alternative Energy Portfolio | 1,647,024 | 2,643,426 | 4,290,450 |
| Industrials Portfolio | 3,927,627 | 20,491,848 | 24,419,475 |
| Transportation Portfolio | 4,619,486 | 12,377,510 | 16,996,996 |
Restricted Securities (including Private Placements). The Funds may invest in securities that are subject to legal or contractual restrictions on resale. These securities generally may be resold in transactions exempt from registration or to the public if the securities are registered. Disposal of these securities may involve time-consuming negotiations and expense, and prompt sale at an acceptable price may be difficult. Information regarding restricted securities is included at the end of each applicable Fund's Schedule of Investments.
4. Purchases and Sales of Investments.
Purchases and sales of securities, other than short-term securities, are noted in the table below.
| | Purchases ($) | Sales ($) |
| Air Transportation Portfolio | 323,359,867 | 245,817,796 |
| Defense and Aerospace Portfolio | 554,856,713 | 1,504,438,882 |
| Environment and Alternative Energy Portfolio | 180,055,822 | 58,341,008 |
| Industrials Portfolio | 1,349,716,305 | 1,401,844,616 |
| Transportation Portfolio | 154,090,326 | 215,949,897 |
5. Fees and Other Transactions with Affiliates.
Management Fee. Fidelity Management & Research Company LLC (the investment adviser) and its affiliates provide the Funds with investment management related services for which the Funds pay a monthly management fee. The management fee is the sum of an individual fund fee rate and an annualized group fee rate. The individual fund fee rate is applied to each Fund's average net assets. The group fee rate is based upon the monthly average net assets of a group of registered investment companies with which the investment adviser has management contracts. The group fee rate decreases as assets under management increase and increases as assets under management decrease. For the reporting period, each Fund's annual management fee rate expressed as a percentage of each Fund's average net assets was as follows:
| | Individual Rate | Group Rate | Total |
| Air Transportation Portfolio | .30% | .23% | .53% |
| Defense and Aerospace Portfolio | .30% | .23% | .53% |
| Environment and Alternative Energy Portfolio | .30% | .23% | .54% |
| Industrials Portfolio | .30% | .23% | .53% |
| Transportation Portfolio | .30% | .23% | .53% |
Transfer Agent Fees. Fidelity Investments Institutional Operations Company LLC (FIIOC), an affiliate of the investment adviser, is the Funds' transfer, dividend disbursing and shareholder servicing agent. FIIOC receives account fees and asset-based fees that vary according to account size and type of account. FIIOC pays for typesetting, printing and mailing of shareholder reports, except proxy statements. For the period, transfer agent fees were equivalent to the following annual rates expressed as a percentage of average net assets:
| Air Transportation Portfolio | .23% |
| Defense and Aerospace Portfolio | .20% |
| Environment and Alternative Energy Portfolio | .23% |
| Industrials Portfolio | .17% |
| Transportation Portfolio | .20% |
Accounting Fees. Fidelity Service Company, Inc. (FSC), an affiliate of the investment adviser, maintains each Fund's accounting records. The accounting fee is based on the level of average net assets for each month. For the period, the fees were equivalent to the following annual rates:
| | % of Average Net Assets |
| Air Transportation Portfolio | .04 |
| Defense and Aerospace Portfolio | .03 |
| Environment and Alternative Energy Portfolio | .04 |
| Industrials Portfolio | .04 |
| Transportation Portfolio | .04 |
Brokerage Commissions. A portion of portfolio transactions were placed with brokerage firms which are affiliates of the investment adviser. Brokerage commissions are included in net realized gain (loss) and change in net unrealized appreciation (depreciation) in the Statement of Operations. The commissions paid to these affiliated firms were as follows:
| | Amount |
| Air Transportation Portfolio | $6,277 |
| Defense and Aerospace Portfolio | 16,920 |
| Environment and Alternative Energy Portfolio | 809 |
| Industrials Portfolio | 31,583 |
| Transportation Portfolio | 4,636 |
Interfund Lending Program. Pursuant to an Exemptive Order issued by the SEC, each Fund, along with other registered investment companies having management contracts with Fidelity Management & Research Company LLC (FMR), or other affiliated entities of FMR, may participate in an interfund lending program. This program provides an alternative credit facility allowing each Fund to borrow from, or lend money to, other participating affiliated funds. At period end, Air Transportation Portfolio, Defense and Aerospace Portfolio, Transportation Portfolio and Environment and Alternative Energy Portfolio had no interfund loans outstanding. Any open loans, including accrued interest, at period end are presented under the caption "Notes payable to affiliates" in the their Statements of Assets and Liabilities. Activity in this program during the period for which loans were outstanding was as follows:
| | Borrower or Lender | Average Loan Balance | Weighted Average Interest Rate | Interest Expense |
| Defense and Aerospace Portfolio | Borrower | $5,814,924 | .75% | $10,114 |
| Industrials Portfolio | Borrower | $5,919,917 | .31% | $613 |
Interfund Trades. Funds may purchase from or sell securities to other Fidelity Funds under procedures adopted by the Board. The procedures have been designed to ensure these interfund trades are executed in accordance with Rule 17a-7 of the 1940 Act. Any interfund trades are included within the respective purchases and sales amounts shown in the Purchases and Sales of Investments note and are noted in the table below.
| | Purchases ($) | Sales ($) |
| Air Transportation Portfolio | 11,890,329 | 6,387,412 |
| Defense and Aerospace Portfolio | 18,081,301 | 176,834,975 |
| Environment and Alternative Energy Portfolio | 9,474,961 | 2,375,792 |
| Industrials Portfolio | 77,425,386 | 130,175,512 |
| Transportation Portfolio | 12,423,581 | 6,782,339 |
Prior Fiscal Year Affiliated Redemptions In-Kind. During the prior period, 386,628 shares of the Industrials Portfolio were redeemed in-kind for investments and cash with a value of $13,207,212. The Fund had a net realized gain of $4,051,467 on investments delivered through in-kind redemptions. The amount of the in-kind redemptions is included in share transactions in the accompanying Statement of Changes in Net Assets. Industrials Portfolio recognized no ain or loss for federal income tax purposes.
6. Committed Line of Credit.
Certain Funds participate with other funds managed by the investment adviser or an affiliate in a $4.25 billion credit facility (the "line of credit") to be utilized for temporary or emergency purposes to fund shareholder redemptions or for other short-term liquidity purposes. The participating funds have agreed to pay commitment fees on their pro-rata portion of the line of credit, which are reflected in Miscellaneous expenses on the Statement of Operations, and are listed below.
| | Amount |
| Air Transportation Portfolio | $580 |
| Defense and Aerospace Portfolio | 4,900 |
| Environment and Alternative Energy Portfolio | 420 |
| Industrials Portfolio | 1,148 |
| Transportation Portfolio | 699 |
During the period, there were no borrowings on this line of credit.
7. Security Lending.
Funds lend portfolio securities from time to time in order to earn additional income. Lending agents are used, including National Financial Services (NFS), an affiliate of the investment adviser. Pursuant to a securities lending agreement, NFS will receive a fee, which is capped at 9.9% of a fund's daily lending revenue, for its services as lending agent. A fund may lend securities to certain qualified borrowers, including NFS. On the settlement date of the loan, a fund receives collateral (in the form of U.S. Treasury obligations, letters of credit and/or cash) against the loaned securities and maintains collateral in an amount not less than 100% of the market value of the loaned securities during the period of the loan. The market value of the loaned securities is determined at the close of business of a fund and any additional required collateral is delivered to a fund on the next business day. A fund or borrower may terminate the loan at any time, and if the borrower defaults on its obligation to return the securities loaned because of insolvency or other reasons, a fund may apply collateral received from the borrower against the obligation. A fund may experience delays and costs in recovering the securities loaned. Any cash collateral received is invested in the Fidelity Securities Lending Cash Central Fund. Any loaned securities are identified as such in the Schedule of Investments, and the value of loaned securities and cash collateral at period end, as applicable, are presented in the Statement of Assets and Liabilities. Security lending income represents the income earned on investing cash collateral, less rebates paid to borrowers and any lending agent fees associated with the loan, plus any premium payments received for lending certain types of securities. Security lending income is presented in the Statement of Operations as a component of income from Fidelity Central Funds. Affiliated security lending activity, if any, was as follows:
| | Total Security Lending Income Fees Paid to NFS | Security Lending Income From Securities Loaned to NFS | Value of Securities Loaned to NFS at Period End |
| Air Transportation Portfolio | $16,803 | $111 | $– |
| Defense and Aerospace Portfolio | $42,398 | $32,879 | $1,360,285 |
| Environment and Alternative Energy Portfolio | $245 | $– | $– |
| Industrials Portfolio | $1,244 | $– | $– |
| Transportation Portfolio | $713 | $– | $– |
8. Bank Borrowings.
Each Fund is permitted to have bank borrowings for temporary or emergency purposes to fund shareholder redemptions or for other short-term liquidity requirements. Each Fund has established borrowing arrangements with certain banks. The interest rate on the borrowings is the bank's base rate, as revised from time to time. Any open loans, including accrued interest, at period end are presented under the caption "Notes payable" in the Statement of Assets and Liabilities, if applicable. Activity in this program during the period for which loans were outstanding was as follows:
| | Average Loan Balance | Weighted Average Interest Rate | Interest Expense |
| Defense and Aerospace Portfolio | $1,183,806 | .61% | $718 |
9. Expense Reductions.
Commissions paid to certain brokers with whom the investment adviser, or its affiliates, places trades on behalf of certain Funds include an amount in addition to trade execution, which may be rebated back to the Funds to offset expenses. In addition, through arrangements with each applicable Fund's custodian and transfer agent, credits realized as a result of certain uninvested cash balances were used to reduce each applicable Fund's expenses. All of the applicable expense reductions are noted in the table below.
| | Brokerage service rebates | Custodian credits | Transfer Agent credits |
| Air Transportation Portfolio | $31,348 | $109 | $– |
| Defense and Aerospace Portfolio | 60,013 | – | – |
| Environment and Alternative Energy Portfolio | 8,725 | – | – |
| Industrials Portfolio | 78,591 | – | – |
| Transportation Portfolio | 17,715 | 576 | – |
In addition, during the period the investment adviser or an affiliate reimbursed and/or waived a portion of operating expenses as follows:
| | Amount |
| Air Transportation Portfolio | $1,183 |
| Defense and Aerospace Portfolio | 8,991 |
| Environment and Alternative Energy Portfolio | 781 |
| Industrials Portfolio | 2,075 |
| Transportation Portfolio | 1,295 |
10. Other.
The Funds' organizational documents provide former and current trustees and officers with a limited indemnification against liabilities arising in connection with the performance of their duties to the Funds. In the normal course of business, the Funds may also enter into contracts that provide general indemnifications. The Funds' maximum exposure under these arrangements is unknown as this would be dependent on future claims that may be made against the Funds. The risk of material loss from such claims is considered remote.
11. Coronavirus (COVID-19) Pandemic.
An outbreak of COVID-19 first detected in China during December 2019 has since spread globally and was declared a pandemic by the World Health Organization during March 2020. Developments that disrupt global economies and financial markets, such as the COVID-19 pandemic, may magnify factors that affect the Funds' performance.
Report of Independent Registered Public Accounting Firm
To the Board of Trustees of Fidelity Select Portfolios and the Shareholders of Air Transportation Portfolio, Defense and Aerospace Portfolio, Environment and Alternative Energy Portfolio, Industrials Portfolio and Transportation Portfolio
Opinions on the Financial Statements
We have audited the accompanying statements of assets and liabilities, including the schedules of investments, of Air Transportation Portfolio, Defense and Aerospace Portfolio, Environment and Alternative Energy Portfolio, Industrials Portfolio and Transportation Portfolio (five of the funds constituting Fidelity Select Portfolios, hereafter collectively referred to as the “Funds”) as of February 28, 2021, the related statements of operations for the year ended February 28, 2021, the statements of changes in net assets for each of the two years in the period ended February 28, 2021, including the related notes, and the financial highlights for each of the five years in the period ended February 28, 2021 (collectively referred to as the “financial statements”). In our opinion, the financial statements present fairly, in all material respects, the financial position of each of the Funds as of February 28, 2021, the results of each of their operations for the year then ended, the changes in each of their net assets for each of the two years in the period ended February 28, 2021 and each of the financial highlights for each of the five years in the period ended February 28, 2021 in conformity with accounting principles generally accepted in the United States of America.
Basis for Opinions
These financial statements are the responsibility of the Funds’ management. Our responsibility is to express an opinion on the Funds’ financial statements based on our audits. We are a public accounting firm registered with the Public Company Accounting Oversight Board (United States) (PCAOB) and are required to be independent with respect to the Funds in accordance with the U.S. federal securities laws and the applicable rules and regulations of the Securities and Exchange Commission and the PCAOB.
We conducted our audits of these financial statements in accordance with the standards of the PCAOB. Those standards require that we plan and perform the audit to obtain reasonable assurance about whether the financial statements are free of material misstatement, whether due to error or fraud.
Our audits included performing procedures to assess the risks of material misstatement of the financial statements, whether due to error or fraud, and performing procedures that respond to those risks. Such procedures included examining, on a test basis, evidence regarding the amounts and disclosures in the financial statements. Our audits also included evaluating the accounting principles used and significant estimates made by management, as well as evaluating the overall presentation of the financial statements. Our procedures included confirmation of securities owned as of February 28, 2021 by correspondence with the custodian and brokers; when replies were not received from brokers, we performed other auditing procedures. We believe that our audits provide a reasonable basis for our opinions.
/s/ PricewaterhouseCoopers LLP
Boston, Massachusetts
April 15, 2021
We have served as the auditor of one or more investment companies in the Fidelity group of funds since 1932.
Trustees and Officers
The Trustees, Members of the Advisory Board (if any), and officers of the trust and funds, as applicable, are listed below. The Board of Trustees governs each fund and is responsible for protecting the interests of shareholders. The Trustees are experienced executives who meet periodically throughout the year to oversee each fund's activities, review contractual arrangements with companies that provide services to each fund, oversee management of the risks associated with such activities and contractual arrangements, and review each fund's performance. Each of the Trustees oversees 309 funds.
The Trustees hold office without limit in time except that (a) any Trustee may resign; (b) any Trustee may be removed by written instrument, signed by at least two-thirds of the number of Trustees prior to such removal; (c) any Trustee who requests to be retired or who has become incapacitated by illness or injury may be retired by written instrument signed by a majority of the other Trustees; and (d) any Trustee may be removed at any special meeting of shareholders by a two-thirds vote of the outstanding voting securities of the trust. Each Trustee who is not an interested person (as defined in the 1940 Act) of the trust and the funds is referred to herein as an Independent Trustee. Each Independent Trustee shall retire not later than the last day of the calendar year in which his or her 75th birthday occurs. The Independent Trustees may waive this mandatory retirement age policy with respect to individual Trustees. Officers and Advisory Board Members hold office without limit in time, except that any officer or Advisory Board Member may resign or may be removed by a vote of a majority of the Trustees at any regular meeting or any special meeting of the Trustees. Except as indicated, each individual has held the office shown or other offices in the same company for the past five years.
Each fund’s Statement of Additional Information (SAI) includes more information about the Trustees. To request a free copy, call Fidelity at 1-800-544-8544.
Experience, Skills, Attributes, and Qualifications of the Trustees. The Governance and Nominating Committee has adopted a statement of policy that describes the experience, qualifications, attributes, and skills that are necessary and desirable for potential Independent Trustee candidates (Statement of Policy). The Board believes that each Trustee satisfied at the time he or she was initially elected or appointed a Trustee, and continues to satisfy, the standards contemplated by the Statement of Policy. The Governance and Nominating Committee also engages professional search firms to help identify potential Independent Trustee candidates who have the experience, qualifications, attributes, and skills consistent with the Statement of Policy. From time to time, additional criteria based on the composition and skills of the current Independent Trustees, as well as experience or skills that may be appropriate in light of future changes to board composition, business conditions, and regulatory or other developments, have also been considered by the professional search firms and the Governance and Nominating Committee. In addition, the Board takes into account the Trustees' commitment and participation in Board and committee meetings, as well as their leadership of standing and ad hoc committees throughout their tenure.
In determining that a particular Trustee was and continues to be qualified to serve as a Trustee, the Board has considered a variety of criteria, none of which, in isolation, was controlling. The Board believes that, collectively, the Trustees have balanced and diverse experience, qualifications, attributes, and skills, which allow the Board to operate effectively in governing each fund and protecting the interests of shareholders. Information about the specific experience, skills, attributes, and qualifications of each Trustee, which in each case led to the Board's conclusion that the Trustee should serve (or continue to serve) as a trustee of the funds, is provided below.
Board Structure and Oversight Function. Robert A. Lawrence is an interested person and currently serves as Acting Chairman. The Trustees have determined that an interested Chairman is appropriate and benefits shareholders because an interested Chairman has a personal and professional stake in the quality and continuity of services provided to the funds. Independent Trustees exercise their informed business judgment to appoint an individual of their choosing to serve as Chairman, regardless of whether the Trustee happens to be independent or a member of management. The Independent Trustees have determined that they can act independently and effectively without having an Independent Trustee serve as Chairman and that a key structural component for assuring that they are in a position to do so is for the Independent Trustees to constitute a substantial majority for the Board. The Independent Trustees also regularly meet in executive session. David M. Thomas serves as Lead Independent Trustee and as such (i) acts as a liaison between the Independent Trustees and management with respect to matters important to the Independent Trustees and (ii) with management prepares agendas for Board meetings.
Fidelity® funds are overseen by different Boards of Trustees. The funds' Board oversees Fidelity's high income and certain equity funds, and other Boards oversee Fidelity's investment-grade bond, money market, asset allocation, and other equity funds. The asset allocation funds may invest in Fidelity® funds overseen by the funds' Board. The use of separate Boards, each with its own committee structure, allows the Trustees of each group of Fidelity® funds to focus on the unique issues of the funds they oversee, including common research, investment, and operational issues. On occasion, the separate Boards establish joint committees to address issues of overlapping consequences for the Fidelity® funds overseen by each Board.
The Trustees operate using a system of committees to facilitate the timely and efficient consideration of all matters of importance to the Trustees, each fund, and fund shareholders and to facilitate compliance with legal and regulatory requirements and oversight of the funds' activities and associated risks. The Board, acting through its committees, has charged FMR and its affiliates with (i) identifying events or circumstances the occurrence of which could have demonstrably adverse effects on the funds' business and/or reputation; (ii) implementing processes and controls to lessen the possibility that such events or circumstances occur or to mitigate the effects of such events or circumstances if they do occur; and (iii) creating and maintaining a system designed to evaluate continuously business and market conditions in order to facilitate the identification and implementation processes described in (i) and (ii) above. Because the day-to-day operations and activities of the funds are carried out by or through FMR, its affiliates, and other service providers, the funds' exposure to risks is mitigated but not eliminated by the processes overseen by the Trustees. While each of the Board's committees has responsibility for overseeing different aspects of the funds' activities, oversight is exercised primarily through the Operations, Audit, and Compliance Committees. Appropriate personnel, including but not limited to the funds' Chief Compliance Officer (CCO), FMR's internal auditor, the independent accountants, the funds' Treasurer and portfolio management personnel, make periodic reports to the Board's committees, as appropriate, including an annual review of Fidelity's risk management program for the Fidelity® funds. The responsibilities of each standing committee, including their oversight responsibilities, are described further under "Standing Committees of the Trustees."
Interested Trustees*:
Correspondence intended for a Trustee who is an interested person may be sent to Fidelity Investments, 245 Summer Street, Boston, Massachusetts 02210.
Name, Year of Birth; Principal Occupations and Other Relevant Experience+
Bettina Doulton (1964)
Year of Election or Appointment: 2020
Trustee
Ms. Doulton also serves as Trustee of other Fidelity® funds. Prior to her retirement, Ms. Doulton served in a variety of positions at Fidelity Investments, including as a managing director of research (2006-2007), portfolio manager to certain Fidelity® funds (1993-2005), equity analyst and portfolio assistant (1990-1993), and research assistant (1987-1990). Ms. Doulton currently owns and operates Phi Builders + Architects and Cellardoor Winery. Previously, Ms. Doulton served as a member of the Board of Brown Capital Management, LLC (2013-2018).
Robert A. Lawrence (1952)
Year of Election or Appointment: 2020
Trustee
Acting Chairman of the Board of Trustees
Mr. Lawrence also serves as Trustee of other funds. Previously, Mr. Lawrence served as a Member of the Advisory Board of certain funds. Prior to his retirement in 2008, Mr. Lawrence served as Vice President of certain Fidelity® funds (2006-2008), Senior Vice President, Head of High Income Division of Fidelity Management & Research Company (investment adviser firm, 2006-2008), and President of Fidelity Strategic Investments (investment adviser firm, 2002-2005).
* Determined to be an “Interested Trustee” by virtue of, among other things, his or her affiliation with the trust or various entities under common control with FMR.
+ The information includes the Trustee's principal occupation during the last five years and other information relating to the experience, attributes, and skills relevant to the Trustee's qualifications to serve as a Trustee, which led to the conclusion that the Trustee should serve as a Trustee for each fund.
Independent Trustees:
Correspondence intended for an Independent Trustee may be sent to Fidelity Investments, P.O. Box 55235, Boston, Massachusetts 02205-5235.
Name, Year of Birth; Principal Occupations and Other Relevant Experience+
Dennis J. Dirks (1948)
Year of Election or Appointment: 2018
Trustee
Mr. Dirks also serves as Trustee of other Fidelity® funds. Prior to his retirement in May 2003, Mr. Dirks served as Chief Operating Officer and as a member of the Board of The Depository Trust & Clearing Corporation (financial markets infrastructure), President, Chief Operating Officer and a member of the Board of The Depository Trust Company (DTC), President and a member of the Board of the National Securities Clearing Corporation (NSCC), Chief Executive Officer and a member of the Board of the Government Securities Clearing Corporation and Chief Executive Officer and a member of the Board of the Mortgage-Backed Securities Clearing Corporation. Mr. Dirks currently serves as a member of the Finance Committee (2016-present) and Board (2017-present) and is Treasurer (2018-present) of the Asolo Repertory Theatre.
Donald F. Donahue (1950)
Year of Election or Appointment: 2018
Trustee
Mr. Donahue also serves as Trustee of other Fidelity® funds. Mr. Donahue serves as President and Chief Executive Officer of Miranda Partners, LLC (risk consulting for the financial services industry, 2012-present). Previously, Mr. Donahue served as Chief Executive Officer (2006-2012), Chief Operating Officer (2003-2006) and Managing Director, Customer Marketing and Development (1999-2003) of The Depository Trust & Clearing Corporation (financial markets infrastructure). Mr. Donahue currently serves as a member (2007-present) and Co-Chairman (2016-present) of the Board of United Way of New York, a member of the Board of NYC Leadership Academy (2012-present) and a member of the Board of Advisors of Ripple Labs, Inc. (financial services, 2015-present). Mr. Donahue previously served as a member of the Advisory Board of certain Fidelity® funds (2015-2018).
Vicki L. Fuller (1957)
Year of Election or Appointment: 2020
Trustee
Ms. Fuller also serves as Trustee of other Fidelity® funds. Previously, Ms. Fuller served as a member of the Advisory Board of certain Fidelity® funds (2018-2020), Chief Investment Officer of the New York State Common Retirement Fund (2012-2018) and held a variety of positions at AllianceBernstein L.P. (global asset management, 1985-2012), including Managing Director (2006-2012) and Senior Vice President and Senior Portfolio Manager (2001-2006). Ms. Fuller currently serves as a member of the Board, Audit Committee and Nominating and Governance Committee of The Williams Companies, Inc. (natural gas infrastructure, 2018-present), as a member of the Board, Audit Committee and Nominating and Governance Committee of two Blackstone business development companies (2020-present) and as a member of the Board of Treliant, LLC (consulting, 2019-present).
Patricia L. Kampling (1959)
Year of Election or Appointment: 2020
Trustee
Ms. Kampling also serves as Trustee of other Fidelity® funds. Prior to her retirement, Ms. Kampling served as Chairman of the Board and Chief Executive Officer (2012-2019), President and Chief Operating Officer (2011-2012) and Executive Vice President and Chief Financial Officer (2010-2011) of Alliant Energy Corporation. Ms. Kampling currently serves as a member of the Board, Compensation Committee and Executive Committee and as Chair of the Audit Committee of Briggs & Stratton Corporation (manufacturing, 2011-present) and as a member of the Board, Audit, Finance and Risk Committee and Safety, Environmental, Technology and Operations Committee of American Water Works Company, Inc. (utilities company, 2019-present). In addition, Ms. Kampling currently serves as a member of the Board of the Nature Conservancy, Wisconsin Chapter (2019-present). Previously, Ms. Kampling served as a Member of the Advisory Board of certain Fidelity® funds (2020), a member of the Board of Interstate Power and Light Company (2012-2019) and Wisconsin Power and Light Company (2012-2019) (each a subsidiary of Alliant Energy Corporation) and as a member of the Board and Workforce Development Committee of the Business Roundtable (2018-2019).
Thomas A. Kennedy (1955)
Year of Election or Appointment: 2021
Trustee
Mr. Kennedy also serves as Trustee of other Fidelity® funds. Previously, Mr. Kennedy served as a Member of the Advisory Board of certain Fidelity® funds (2020) and held a variety of positions at Raytheon Company (aerospace and defense, 1983-2020), including Chairman and Chief Executive Officer (2014-2020) and Executive Vice President and Chief Operating Officer (2013-2014). Mr. Kennedy currently serves as Executive Chairman of the Board of Directors of Raytheon Technologies Corporation (aerospace and defense, 2020-present). He is also a member of the Rutgers School of Engineering Industry Advisory Board (2011-present) and a member of the UCLA Engineering Dean’s Executive Board (2016-present).
Garnett A. Smith (1947)
Year of Election or Appointment: 2013
Trustee
Mr. Smith also serves as Trustee of other Fidelity® funds. Prior to his retirement, Mr. Smith served as Chairman and Chief Executive Officer (1990-1997) and President (1986-1990) of Inbrand Corp. (manufacturer of personal absorbent products). Prior to his employment with Inbrand Corp., he was employed by a retail fabric chain and North Carolina National Bank (now Bank of America). Mr. Smith previously served as a member of the Advisory Board of certain Fidelity® funds (2012-2013).
David M. Thomas (1949)
Year of Election or Appointment: 2018
Trustee
Lead Independent Trustee
Mr. Thomas also serves as Trustee of other Fidelity® funds. Previously, Mr. Thomas served as Executive Chairman (2005-2006) and Chairman and Chief Executive Officer (2000-2005) of IMS Health, Inc. (pharmaceutical and healthcare information solutions). Mr. Thomas currently serves as Non-Executive Chairman of the Board of Fortune Brands Home and Security (home and security products, 2011-present), and a member of the Board (2004-present) and Presiding Director (2013-present) of Interpublic Group of Companies, Inc. (marketing communication).
Susan Tomasky (1953)
Year of Election or Appointment: 2020
Trustee
Ms. Tomasky also serves as Trustee of other Fidelity® funds. Prior to her retirement, Ms. Tomasky served in various executive officer positions at American Electric Power Company, Inc. (1998-2011), including most recently as President of AEP Transmission (2007-2011). Ms. Tomasky currently serves as a member of the Board and Sustainability Committee and as Chair of the Audit Committee of Marathon Petroleum Corporation (2018-present) and as a member of the Board, Corporate Governance Committee and Organization and Compensation Committee and as Chair of the Audit Committee of Public Service Enterprise Group, Inc. (utilities company, 2012-present). In addition, Ms. Tomasky currently serves as a member of the Board of the Columbus Regional Airport Authority (2007-present), as a member of the Board of the Royal Shakespeare Company – America (2009-present), as a member of the Board of the Columbus Association for the Performing Arts (2011-present) and as a member of the Board of Kenyon College (2016-present). Previously, Ms. Tomasky served as a Member of the Advisory Board of certain Fidelity® funds (2020), a member of the Board (2011-2019) and as Lead Independent Director (2015-2018) of Andeavor Corporation (previously Tesoro Corporation) (independent oil refiner and marketer) and as a member of the Board of Summit Midstream Partners LP (energy, 2012-2018).
Michael E. Wiley (1950)
Year of Election or Appointment: 2008
Trustee
Mr. Wiley also serves as Trustee of other Fidelity® funds. Previously, Mr. Wiley served as a member of the Advisory Board of certain Fidelity® funds (2018-2020), Chairman, President and CEO of Baker Hughes, Inc. (oilfield services, 2000-2004). Mr. Wiley also previously served as a member of the Board of Andeavor Corporation (independent oil refiner and marketer, 2005-2018), a member of the Board of Andeavor Logistics LP (natural resources logistics, 2015-2018) and a member of the Board of High Point Resources (exploration and production, 2005-2020).
+ The information includes the Trustee's principal occupation during the last five years and other information relating to the experience, attributes, and skills relevant to the Trustee's qualifications to serve as a Trustee, which led to the conclusion that the Trustee should serve as a Trustee for each fund.
Advisory Board Members and Officers:
Correspondence intended for a Member of the Advisory Board (if any) may be sent to Fidelity Investments, P.O. Box 55235, Boston, Massachusetts 02205-5235. Correspondence intended for an officer or Peter S. Lynch may be sent to Fidelity Investments, 245 Summer Street, Boston, Massachusetts 02210. Officers appear below in alphabetical order.
Name, Year of Birth; Principal Occupation
Ned C. Lautenbach (1944)
Year of Election or Appointment: 2021
Member of the Advisory Board
Mr. Lautenbach also serves as a Member of the Advisory Board of other Fidelity® funds. Mr. Lautenbach currently serves as Chair of the Board of Governors, State University System of Florida (2013-present) and is a member of the Council on Foreign Relations (1994-present). He is also a member and has in the past served as Chairman of the Board of Directors of Artis-Naples (2012-present). Previously, Mr. Lautenbach served as a Trustee of certain Fidelity® funds (2000-2020) and a member and then Lead Director of the Board of Directors of Eaton Corporation (diversified industrial, 1997-2016). He was also a Partner at Clayton, Dubilier & Rice, LLC (private equity investment, 1998-2010); as well as Director of Sony Corporation (2006-2007). In addition, Mr. Lautenbach had a 30-year career with IBM (technology company), during which time he served as Senior Vice President and as a member of the Corporate Executive Committee (1968-1998).
Peter S. Lynch (1944)
Year of Election or Appointment: 2018
Member of the Advisory Board
Mr. Lynch also serves as a Member of the Advisory Board of other Fidelity® funds. Mr. Lynch is Vice Chairman and a Director of Fidelity Management & Research Company LLC (investment adviser firm). In addition, Mr. Lynch serves as a Trustee of Boston College and as the Chairman of the Inner-City Scholarship Fund. Previously, Mr. Lynch served as Vice Chairman and a Director of FMR Co., Inc. (investment adviser firm) and on the Special Olympics International Board of Directors (1997-2006).
Craig S. Brown (1977)
Year of Election or Appointment: 2019
Assistant Treasurer
Mr. Brown also serves as Assistant Treasurer of other funds. Mr. Brown is an employee of Fidelity Investments (2013-present).
John J. Burke III (1964)
Year of Election or Appointment: 2018
Chief Financial Officer
Mr. Burke also serves as Chief Financial Officer of other funds. Mr. Burke serves as Head of Investment Operations for Fidelity Fund and Investment Operations (2018-present) and is an employee of Fidelity Investments (1998-present). Previously Mr. Burke served as head of Asset Management Investment Operations (2012-2018).
William C. Coffey (1969)
Year of Election or Appointment: 2019
Assistant Secretary
Mr. Coffey also serves as Assistant Secretary of other funds. He is Senior Vice President and Deputy General Counsel of FMR LLC (diversified financial services company, 2010-present), and is an employee of Fidelity Investments. Previously, Mr. Coffey served as Secretary and CLO of certain funds (2018-2019); CLO, Secretary, and Senior Vice President of Fidelity Management & Research Company and FMR Co., Inc. (investment adviser firms, 2018-2019); Secretary of Fidelity SelectCo, LLC and Fidelity Investments Money Management, Inc. (investment adviser firms, 2018-2019); CLO of Fidelity Management & Research (Hong Kong) Limited, FMR Investment Management (UK) Limited, and Fidelity Management & Research (Japan) Limited (investment adviser firms, 2018-2019); and Assistant Secretary of certain funds (2009-2018).
Timothy M. Cohen (1969)
Year of Election or Appointment: 2018
Vice President
Mr. Cohen also serves as Vice President of other funds. Mr. Cohen serves as Co-Head of Equity (2018-present), a Director of Fidelity Management & Research (Japan) Limited (investment adviser firm, 2016-present), and is an employee of Fidelity Investments. Previously, Mr. Cohen served as Executive Vice President of Fidelity SelectCo, LLC (2019), Head of Global Equity Research (2016-2018), Chief Investment Officer - Equity and a Director of Fidelity Management & Research (U.K.) Inc. (investment adviser firm, 2013-2015) and as a Director of Fidelity Management & Research (Hong Kong) Limited (investment adviser firm, 2017).
Jonathan Davis (1968)
Year of Election or Appointment: 2010
Assistant Treasurer
Mr. Davis also serves as Assistant Treasurer of other funds. Mr. Davis serves as Assistant Treasurer of FMR Capital, Inc. (2017-present) and is an employee of Fidelity Investments. Previously, Mr. Davis served as Vice President and Associate General Counsel of FMR LLC (diversified financial services company, 2003-2010).
Laura M. Del Prato (1964)
Year of Election or Appointment: 2018
Assistant Treasurer
Ms. Del Prato also serves as an officer of other funds. Ms. Del Prato is an employee of Fidelity Investments (2017-present). Previously, Ms. Del Prato served as President and Treasurer of The North Carolina Capital Management Trust: Cash Portfolio and Term Portfolio (2018-2020). Prior to joining Fidelity Investments, Ms. Del Prato served as a Managing Director and Treasurer of the JPMorgan Mutual Funds (2014-2017). Prior to JPMorgan, Ms. Del Prato served as a partner at Cohen Fund Audit Services (accounting firm, 2012-2013) and KPMG LLP (accounting firm, 2004-2012).
Colm A. Hogan (1973)
Year of Election or Appointment: 2020
Assistant Treasurer
Mr. Hogan also serves as an officer of other funds. Mr. Hogan serves as Assistant Treasurer of FMR Capital, Inc. (2017-present) and is an employee of Fidelity Investments (2005-present). Previously, Mr. Hogan served as Deputy Treasurer of certain Fidelity® funds (2016-2020) and Assistant Treasurer of certain Fidelity® funds (2016-2018).
Pamela R. Holding (1964)
Year of Election or Appointment: 2018
Vice President
Ms. Holding also serves as Vice President of other funds. Ms. Holding serves as Co-Head of Equity (2018-present) and is an employee of Fidelity Investments (2013-present). Previously, Ms. Holding served as Executive Vice President of Fidelity SelectCo, LLC (2019) and as Chief Investment Officer of Fidelity Institutional Asset Management (2013-2018).
Cynthia Lo Bessette (1969)
Year of Election or Appointment: 2019
Secretary and Chief Legal Officer (CLO)
Ms. Lo Bessette also serves as an officer of other funds. Ms. Lo Bessette serves as CLO, Secretary, and Senior Vice President of Fidelity Management & Research Company LLC (investment adviser firm, 2019-present); and CLO of Fidelity Management & Research (Hong Kong) Limited, FMR Investment Management (UK) Limited, and Fidelity Management & Research (Japan) Limited (investment adviser firms, 2019-present). She is a Senior Vice President and Deputy General Counsel of FMR LLC (diversified financial services company, 2019-present), and is an employee of Fidelity Investments. Previously, Ms. Lo Bessette served as CLO, Secretary, and Senior Vice President of FMR Co., Inc. (investment adviser firm, 2019); Secretary of Fidelity SelectCo, LLC and Fidelity Investments Money Management, Inc. (investment adviser firms, 2019). Prior to joining Fidelity Investments, Ms. Lo Bessette was Executive Vice President, General Counsel (2016-2019) and Senior Vice President, Deputy General Counsel (2015-2016) of OppenheimerFunds (investment management company) and Deputy Chief Legal Officer (2013-2015) of Jennison Associates LLC (investment adviser firm).
Chris Maher (1972)
Year of Election or Appointment: 2020
Deputy Treasurer
Mr. Maher also serves as an officer of other funds. Mr. Maher serves as Assistant Treasurer of FMR Capital, Inc. (2017-present), and is an employee of Fidelity Investments (2008-present). Previously, Mr. Maher served as Assistant Treasurer of certain funds (2013-2020); Vice President of Asset Management Compliance (2013), Vice President of the Program Management Group of FMR (investment adviser firm, 2010-2013), and Vice President of Valuation Oversight (2008-2010).
Jason P. Pogorelec (1975)
Year of Election or Appointment: 2020
Chief Compliance Officer
Mr. Pogorelec also serves as Chief Compliance Officer of other funds. Mr. Pogorelec is a senior Vice President of Asset Management Compliance for Fidelity Investments and is an employee of Fidelity Investments (2006-present). Previously, Mr. Pogorelec served as Vice President, Associate General Counsel for Fidelity Investments (2010-2020) and Assistant Secretary of certain Fidelity funds (2015-2020).
Brett Segaloff (1972)
Year of Election or Appointment: 2021
Anti-Money Laundering (AML) Officer
Mr. Segaloff also serves as an AML Officer of other funds and other related entities. He is Director, Anti-Money Laundering (2007-present) of FMR LLC (diversified financial services company) and is an employee of Fidelity Investments (1996-present).
Stacie M. Smith (1974)
Year of Election or Appointment: 2018
President and Treasurer
Ms. Smith also serves as an officer of other funds. Ms. Smith serves as Assistant Treasurer of FMR Capital, Inc. (2017-present), is an employee of Fidelity Investments (2009-present), and has served in other fund officer roles. Prior to joining Fidelity Investments, Ms. Smith served as Senior Audit Manager of Ernst & Young LLP (accounting firm, 1996-2009). Previously, Ms. Smith served as Assistant Treasurer (2013-2019) and Deputy Treasurer (2013-2016) of certain Fidelity® funds.
Marc L. Spector (1972)
Year of Election or Appointment: 2017
Assistant Treasurer
Mr. Spector also serves as an officer of other funds. Mr. Spector serves as Assistant Treasurer of FMR Capital, Inc. (2017-present) and is an employee of Fidelity Investments (2016-present). Prior to joining Fidelity Investments, Mr. Spector served as Director at the Siegfried Group (accounting firm, 2013-2016), and prior to Siegfried Group as audit senior manager at Deloitte & Touche LLP (accounting firm, 2005-2013).
Jim Wegmann (1979)
Year of Election or Appointment: 2019
Assistant Treasurer
Mr. Wegmann also serves as Assistant Treasurer of other funds. Mr. Wegmann is an employee of Fidelity Investments (2011-present).
Shareholder Expense Example
As a shareholder, you incur two types of costs: (1) transaction costs, which may include sales charges (loads) on purchase payments or redemption proceeds, as applicable and (2) ongoing costs, which generally include management fees, distribution and/or service (12b-1) fees and other Fund expenses. This Example is intended to help you understand your ongoing costs (in dollars) of investing in a fund and to compare these costs with the ongoing costs of investing in other mutual funds.
The Example is based on an investment of $1,000 invested at the beginning of the period and held for the entire period (September 1, 2020 to February 28, 2021).
Actual Expenses
The first line of the accompanying table provides information about actual account values and actual expenses. You may use the information in this line, together with the amount you invested, to estimate the expenses that you paid over the period. Simply divide your account value by $1,000.00 (for example, an $8,600 account value divided by $1,000.00 = 8.6), then multiply the result by the number in the first line for a class/Fund under the heading entitled "Expenses Paid During Period" to estimate the expenses you paid on your account during this period. If any fund is a shareholder of any underlying mutual funds or exchange-traded funds (ETFs) (the Underlying Funds), such fund indirectly bears its proportional share of the expenses of the Underlying Funds in addition to the direct expenses incurred presented in the table. These fees and expenses are not included in the annualized expense ratio used to calculate the expense estimate in the table below.
Hypothetical Example for Comparison Purposes
The second line of the accompanying table provides information about hypothetical account values and hypothetical expenses based on the actual expense ratio and an assumed rate of return of 5% per year before expenses, which is not the actual return. The hypothetical account values and expenses may not be used to estimate the actual ending account balance or expenses you paid for the period. You may use this information to compare the ongoing costs of investing in the Fund and other funds. To do so, compare this 5% hypothetical example with the 5% hypothetical examples that appear in the shareholder reports of the other funds. If any fund is a shareholder of any Underlying Funds, such fund indirectly bears its proportional share of the expenses of the Underlying Funds in addition to the direct expenses as presented in the table. These fees and expenses are not included in the annualized expense ratio used to calculate the expense estimate in the table below.
Please note that the expenses shown in the table are meant to highlight your ongoing costs only and do not reflect any transaction costs. Therefore, the second line of the table is useful in comparing ongoing costs only, and will not help you determine the relative total costs of owning different funds. In addition, if these transactional costs were included, your costs would have been higher.
| | Annualized Expense Ratio-A | Beginning
Account Value
September 1, 2020 | Ending
Account Value
February 28, 2021 | Expenses Paid
During Period-B
September 1, 2020
to February 28, 2021 |
| Air Transportation Portfolio | .81% | | | |
| Actual | | $1,000.00 | $1,282.70 | $4.58 |
| Hypothetical-C | | $1,000.00 | $1,020.78 | $4.06 |
| Defense and Aerospace Portfolio | .75% | | | |
| Actual | | $1,000.00 | $1,155.40 | $4.01 |
| Hypothetical-C | | $1,000.00 | $1,021.08 | $3.76 |
| Environment and Alternative Energy Portfolio | .83% | | | |
| Actual | | $1,000.00 | $1,207.40 | $4.54 |
| Hypothetical-C | | $1,000.00 | $1,020.68 | $4.16 |
| Industrials Portfolio | .75% | | | |
| Actual | | $1,000.00 | $1,133.60 | $3.97 |
| Hypothetical-C | | $1,000.00 | $1,021.08 | $3.76 |
| Transportation Portfolio | .78% | | | |
| Actual | | $1,000.00 | $1,149.60 | $4.16 |
| Hypothetical-C | | $1,000.00 | $1,020.93 | $3.91 |
A Annualized expense ratio reflects expenses net of applicable fee waivers.
B Expenses are equal to the annualized expense ratio, multiplied by the average account value over the period, multiplied by 181/ 365 (to reflect the one-half year period). The fees and expenses of any Underlying Funds are not included in each annualized expense ratio.
C 5% return per year before expenses
Distributions (Unaudited)
The Board of Trustees of each fund voted to pay to shareholders of record at the opening of business on record date, the following distributions per share derived from capital gains realized from sales of portfolio securities, and dividends derived from net investment income:
| | Pay Date | Record Date | Dividends | Capital Gains |
| Air Transportation Portfolio | 04/12/21 | 04/09/21 | $0.000 | $0.000 |
| Defense and Aerospace Portfolio | 04/12/21 | 04/09/21 | $0.000 | $0.000 |
| Environment and Alternative Energy Portfolio | 04/12/21 | 04/09/21 | $0.019 | $0.000 |
| Industrials Portfolio | 04/12/21 | 04/09/21 | $0.000 | $3.597 |
| Transportation Portfolio | 04/12/21 | 04/09/21 | $0.500 | $2.613 |
The funds hereby designate as capital gain dividend the amounts noted below for the taxable year ended February 28, 2021, or, if subsequently determined to be different, the net capital gain of such year.
| Industrials Portfolio | $44,459,909 |
| Transportation Portfolio | $9,852,307 |
|
A percentage of the dividends distributed during the fiscal year for the following funds qualify for the dividends–received deduction for corporate shareholders:
| | April 2020 | December 2020 |
| Air Transportation Portfolio | 100% | –% |
| Defense and Aerospace Portfolio | 100% | –% |
| Environment and Alternative Energy Portfolio | 27% | 100% |
| Industrials Portfolio | 100% | 100% |
| Transportation Portfolio | 100% | 100% |
|
A percentage of the dividends distributed during the fiscal year for the following funds may be taken into account as a dividend for purposes of the maximum rate under section 1(h)(11) of the Internal Revenue Code.
| | April 2020 | December 2020 |
| Air Transportation Portfolio | 100% | –% |
| Defense and Aerospace Portfolio | 100% | –% |
| Environment and Alternative Energy Portfolio | 46% | 100% |
| Industrials Portfolio | 100% | 100% |
| Transportation Portfolio | 100% | 100% |
The funds hereby designate the percentages noted below of the short-term capital gain dividends distributed during the fiscal year as qualifying to be taxed as short-term capital gain dividends for nonresident alien shareholders:
| | April, 2020 |
| Environment and Alternative Energy Portfolio | 100% |
The funds will notify shareholders in January 2022 of amounts for use in preparing 2021 income tax returns.
Board Approval of Investment Advisory Contracts
Air Transportation Portfolio
Defense and Aerospace PortfolioEnvironment and Alternative Energy PortfolioIndustrials PortfolioTransportation PortfolioAt its January 2021 meeting, the Board of Trustees, including the Independent Trustees (together, the Board), voted to continue the management contract with Fidelity Management & Research Company LLC (FMR), and the sub-advisory agreements and sub-subadvisory agreements, in each case, where applicable (together, the Advisory Contracts) for each fund for four months from February 1, 2021 through May 31, 2021, in connection with changes to the Board's meeting calendar.
The Board considered that the approval of each fund's Advisory Contracts will not result in any changes in (i) the investment process or strategies employed in the management of each fund's assets; (ii) the fees and expenses paid by shareholders; (iii) the nature, extent or quality of services provided under each fund's Advisory Contracts; or (iv) the day-to-day management of each fund or the persons primarily responsible for such management. The Board also considered that since its last approval of each fund's Advisory Contracts, FMR had provided additional information on each fund in support of the annual contract renewal process, including competitive analyses on total expenses and management fees and in-depth reviews of fund performance and fund profitability information. The Board also considered the findings of certain ad hoc committees that had been previously formed to discuss matters relevant to all of the Fidelity funds, including economies of scale, fall-out benefits and retail vs. institutional funds. The Board concluded that each fund's Advisory Contracts are fair and reasonable, and that each fund's Advisory Contracts should be renewed, without modification, through May 31, 2021, with the understanding that the Board will consider the annual renewal for a full one year period in May 2021.
In connection with its consideration of future renewals of each fund's Advisory Contracts, the Board will consider: (i) the nature, extent and quality of services provided to the funds, including shareholder and administrative services and investment performance; (ii) the competitiveness of the management fee and total expenses for each fund; (iii) the costs of the services and profitability, including the revenues earned and the expenses incurred in conducting the business of developing, marketing, distributing, managing, administering, and servicing each fund and its shareholders, to the extent applicable; and (iv) whether there have been economies of scale in respect of the Fidelity funds, whether the Fidelity funds (including the funds) have appropriately benefited from any such economies of scale, and whether there is the potential for realization of any further economies.
Based on its evaluation of all of the conclusions noted above, and after considering all factors it believed relevant, the Board ultimately concluded that each fund's management fee structures are fair and reasonable, and that the continuation of the funds' Advisory Contracts should be approved for four months from February 1, 2021 through May 31, 2021.
Liquidity Risk Management Program
The Securities and Exchange Commission adopted Rule 22e-4 under the Investment Company Act of 1940 (the Liquidity Rule) to promote effective liquidity risk management throughout the open-end investment company industry, thereby reducing the risk that funds will be unable to meet their redemption obligations and mitigating dilution of the interests of fund shareholders.
The Funds have adopted and implemented a liquidity risk management program pursuant to the Liquidity Rule (the Program) effective December 1, 2018. The Program is reasonably designed to assess and manage each Fund’s liquidity risk and to comply with the requirements of the Liquidity Rule. Each Fund’s Board of Trustees (the Board) has designated each Fund’s investment adviser as administrator of the Program. The Fidelity advisers have established a Liquidity Risk Management Committee (the LRM Committee) to manage the Program for each of the Fidelity Funds. The LRM Committee monitors the adequacy and effectiveness of implementation of the Program and on a periodic basis assesses each Fund’s liquidity risk based on a variety of factors including (1) the Fund’s investment strategy, (2) portfolio liquidity and cash flow projections during normal and reasonably foreseeable stressed conditions, (3) shareholder redemptions, (4) borrowings and other funding sources and (5) in the case of exchange-traded funds, certain additional factors including the effect of the Fund’s prices and spreads, market participants, and basket compositions on the overall liquidity of the Fund’s portfolio, as applicable
In accordance with the Program, each of the Fund’s portfolio investments is classified into one of four liquidity categories described below based on a determination of a reasonable expectation for how long it would take to convert the investment to cash (or sell or dispose of the investment) without significantly changing its market value.
- Highly liquid investments – cash or convertible to cash within three business days or less
- Moderately liquid investments – convertible to cash in three to seven calendar days
- Less liquid investments – can be sold or disposed of, but not settled, within seven calendar days
- Illiquid investments – cannot be sold or disposed of within seven calendar days
Liquidity classification determinations take into account a variety of factors including various market, trading and investment-specific considerations, as well as market depth, and generally utilize analysis from a third-party liquidity metrics service.
The Liquidity Rule places a 15% limit on a fund’s illiquid investments and requires funds that do not primarily hold assets that are highly liquid investments to determine and maintain a minimum percentage of the fund’s net assets to be invested in highly liquid investments (highly liquid investment minimum or HLIM). The Program includes provisions reasonably designed to comply with the 15% limit on illiquid investments and for determining, periodically reviewing and complying with the HLIM requirement as applicable.
At a recent meeting of the Fund’s Board of Trustees, the LRM Committee provided a written report to the Board pertaining to the operation, adequacy, and effectiveness of implementation of the Program for the annual period from December 1, 2019 through November 30, 2020. The report concluded that the Program has been implemented and is operating effectively and is reasonably designed to assess and manage the Fund’s liquidity risk.
Proxy Voting Results
A special meeting of shareholders was held on June 9, 2020. The results of votes taken among shareholders on the proposal before them are reported below. Each vote reported represents one dollar of net asset value held on the record date for the meeting.
PROPOSAL 1
To elect a Board of Trustees.
| | # of
Votes | % of
Votes |
| Dennis J. Dirks |
| Affirmative | 32,463,705,305.665 | 92.437 |
| Withheld | 2,655,951,104.308 | 7.563 |
| TOTAL | 35,119,656,409.973 | 100.000 |
| Donald F. Donahue |
| Affirmative | 32,446,843,861.354 | 92.389 |
| Withheld | 2,672,812,548.619 | 7.611 |
| TOTAL | 35,119,656,409.973 | 100.000 |
| Bettina Doulton |
| Affirmative | 32,610,463,757.584 | 92.855 |
| Withheld | 2,509,192,652.389 | 7.145 |
| TOTAL | 35,119,656,409.973 | 100.000 |
| Vicki L. Fuller |
| Affirmative | 32,688,213,522.720 | 93.077 |
| Withheld | 2,431,442,887.253 | 6.923 |
| TOTAL | 35,119,656,409.973 | 100.000 |
| Patricia L. Kampling |
| Affirmative | 32,313,755,598.535 | 92.010 |
| Withheld | 2,805,900,811.438 | 7.990 |
| TOTAL | 35,119,656,409.973 | 100.000 |
| Alan J. Lacy |
| Affirmative | 31,990,158,754.948 | 91.089 |
| Withheld | 3,129,497,655.026 | 8.911 |
| TOTAL | 35,119,656,409.973 | 100.000 |
| Ned C. Lautenbach |
| Affirmative | 32,043,019,991.143 | 91.240 |
| Withheld | 3,076,636,418.830 | 8.760 |
| TOTAL | 35,119,656,409.973 | 100.000 |
| Robert A. Lawrence |
| Affirmative | 32,150,842,398.009 | 91.547 |
| Withheld | 2,968,814,011.965 | 8.453 |
| TOTAL | 35,119,656,409.973 | 100.000 |
| Joseph Mauriello |
| Affirmative | 32,082,201,213.166 | 91.351 |
| Withheld | 3,037,455,196.807 | 8.649 |
| TOTAL | 35,119,656,409.973 | 100.000 |
| Cornelia M. Small |
| Affirmative | 32,207,976,835.934 | 91.709 |
| Withheld | 2,911,679,574.039 | 8.291 |
| TOTAL | 35,119,656,409.973 | 100.000 |
| Garnett A. Smith |
| Affirmative | 32,102,654,343.096 | 91.409 |
| Withheld | 3,017,002,066.877 | 8.591 |
| TOTAL | 35,119,656,409.973 | 100.000 |
| David M. Thomas |
| Affirmative | 32,150,749,424.556 | 91.546 |
| Withheld | 2,968,906,985.418 | 8.454 |
| TOTAL | 35,119,656,409.973 | 100.000 |
| Susan Tomasky |
| Affirmative | 32,381,933,484.515 | 92.205 |
| Withheld | 2,737,722,925.459 | 7.795 |
| TOTAL | 35,119,656,409.973 | 100.000 |
| Michael E. Wiley |
| Affirmative | 32,135,064,741.973 | 91.502 |
| Withheld | 2,984,591,668.000 | 8.498 |
| TOTAL | 35,119,656,409.973 | 100.000 |
|
| Proposal 1 reflects trust wide proposal and voting results. |
SELCI-ANN-0421
1.813657.116
Fidelity® Select Portfolios®
Information Technology Sector
Communications Equipment Portfolio
Computers Portfolio
IT Services Portfolio
Semiconductors Portfolio
Software and IT Services Portfolio
Technology Portfolio
Annual Report
February 28, 2021
Contents
To view a fund's proxy voting guidelines and proxy voting record for the 12-month period ended June 30, visit http://www.fidelity.com/proxyvotingresults or visit the Securities and Exchange Commission's (SEC) web site at http://www.sec.gov.
You may also call 1-800-544-8544 to request a free copy of the proxy voting guidelines.
Standard & Poor's, S&P and S&P 500 are registered service marks of The McGraw-Hill Companies, Inc. and have been licensed for use by Fidelity Distributors Corporation.
Other third-party marks appearing herein are the property of their respective owners.
All other marks appearing herein are registered or unregistered trademarks or service marks of FMR LLC or an affiliated company. © 2021 FMR LLC. All rights reserved.
This report and the financial statements contained herein are submitted for the general information of the shareholders of the Funds. This report is not authorized for distribution to prospective investors in the Funds unless preceded or accompanied by an effective prospectus.
A fund files its complete schedule of portfolio holdings with the SEC for the first and third quarters of each fiscal year on Form N-PORT. Forms N-PORT are available on the SEC’s web site at http://www.sec.gov. A fund's Forms N-PORT may be reviewed and copied at the SEC’s Public Reference Room in Washington, DC. Information regarding the operation of the SEC's Public Reference Room may be obtained by calling 1-800-SEC-0330.
For a complete list of a fund's portfolio holdings, view the most recent holdings listing, semiannual report, or annual report on Fidelity's web site at http://www.fidelity.com, http://www.institutional.fidelity.com, or http://www.401k.com, as applicable.
NOT FDIC INSURED •MAY LOSE VALUE •NO BANK GUARANTEE
Neither the Funds nor Fidelity Distributors Corporation is a bank.
Note to Shareholders:
Early in 2020, the outbreak and spread of a new coronavirus emerged as a public health emergency that had a major influence on financial markets, primarily based on its impact on the global economy and the outlook for corporate earnings. The virus causes a respiratory disease known as COVID-19. On March 11, 2020 the World Health Organization declared the COVID-19 outbreak a pandemic, citing sustained risk of further global spread.
In the weeks following, as the crisis worsened, we witnessed an escalating human tragedy with wide-scale social and economic consequences from coronavirus-containment measures. The outbreak of COVID-19 prompted a number of measures to limit the spread, including travel and border restrictions, quarantines, and restrictions on large gatherings. In turn, these resulted in lower consumer activity, diminished demand for a wide range of products and services, disruption in manufacturing and supply chains, and – given the wide variability in outcomes regarding the outbreak – significant market uncertainty and volatility. Amid the turmoil, global governments and central banks took unprecedented action to help support consumers, businesses, and the broader economies, and to limit disruption to financial systems.
The situation continues to unfold, and the extent and duration of its impact on financial markets and the economy remain highly uncertain. Extreme events such as the coronavirus crisis are “exogenous shocks” that can have significant adverse effects on mutual funds and their investments. Although multiple asset classes may be affected by market disruption, the duration and impact may not be the same for all types of assets.
Fidelity is committed to helping you stay informed amid news about COVID-19 and during increased market volatility, and we’re taking extra steps to be responsive to customer needs. We encourage you to visit our websites, where we offer ongoing updates, commentary, and analysis on the markets and our funds.
Communications Equipment Portfolio
Performance: The Bottom Line
Average annual total return reflects the change in the value of an investment, assuming reinvestment of distributions from dividend income and capital gains (the profits earned upon the sale of securities that have grown in value, if any) and assuming a constant rate of performance each year. The hypothetical investment and the average annual total returns do not reflect the deduction of taxes that a shareholder would pay on fund distributions or the redemption of fund shares. During periods of reimbursement by Fidelity, a fund’s total return will be greater than it would be had the reimbursement not occurred. How a fund did yesterday is no guarantee of how it will do tomorrow.
Average Annual Total Returns
| For the periods ended February 28, 2021 | Past 1 year | Past 5 years | Past 10 years |
| Communications Equipment Portfolio | 30.81% | 12.22% | 6.03% |
$10,000 Over 10 Years
Let's say hypothetically that $10,000 was invested in Communications Equipment Portfolio on February 28, 2011.
The chart shows how the value of your investment would have changed, and also shows how the S&P 500® Index performed over the same period.
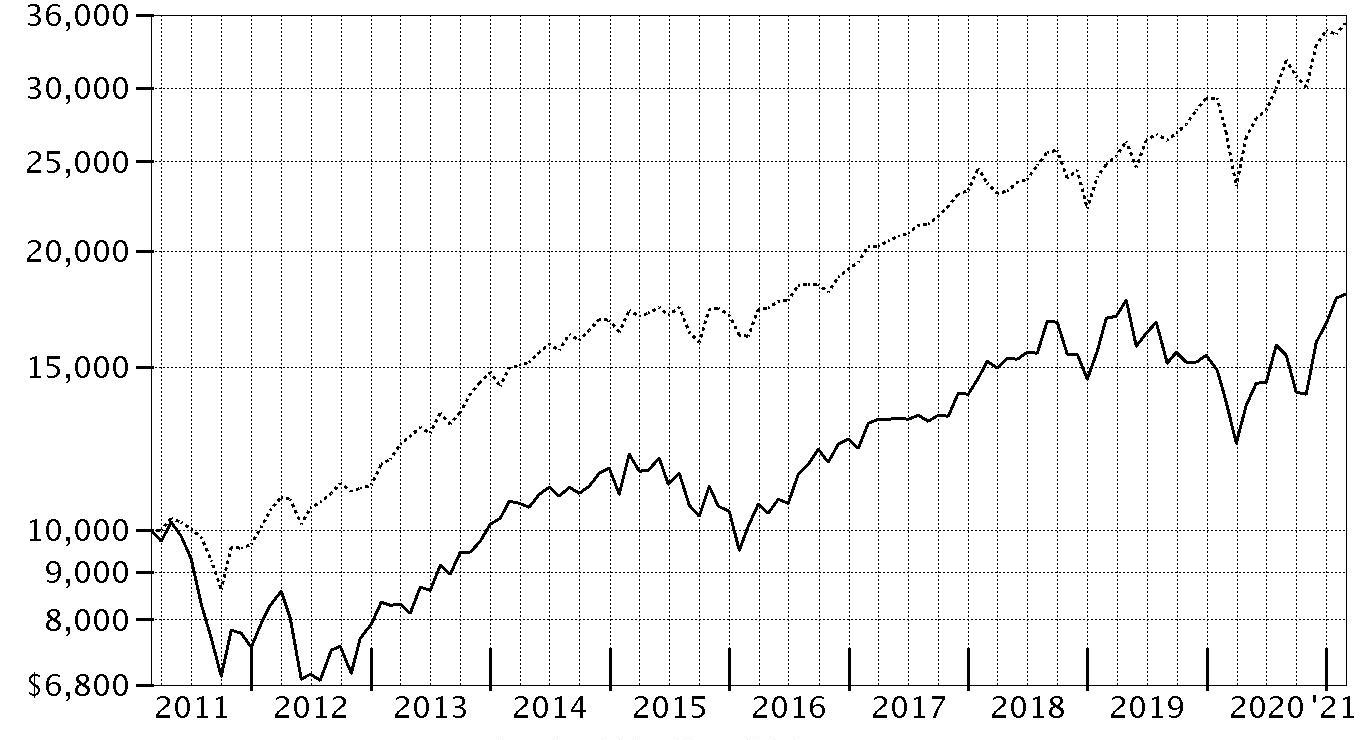
| Period Ending Values |
| $17,962 | Communications Equipment Portfolio |
| $35,259 | S&P 500® Index |
Communications Equipment Portfolio
Management's Discussion of Fund Performance
Market Recap: The S&P 500
® index gained 31.29% for the 12 months ending February 28, 2021, a volatile but productive period for U.S. risk assets. The early-2020 outbreak and spread of COVID-19 resulted in stocks suffering one of the quickest declines on record, through March 23, followed by a historic rebound that included the index closing 2020 at an all-time high and gaining modest ground in the first two months of the new year. The crisis and containment efforts caused broad contraction in economic activity, along with extreme uncertainty and dislocation in financial markets. A rapid and expansive U.S. monetary/fiscal-policy response partially offset the economic disruption and fueled the market surge, as did resilient corporate earnings. The rally slowed in September, when stocks began a two-month retreat amid Congress’s inability to reach a deal on additional fiscal stimulus, as well as concerns about election uncertainty, indications the U.S. economic recovery could be slowing and a new wave of COVID-19 cases. A shift in momentum began in October and accelerated following the U.S. elections, with the approval of three breakthrough COVID-19 vaccines and prospects for additional government stimulus fueling the “reflation trade” through February 28. By sector for the full 12 months, information technology (+50%) and consumer discretionary (+43%) led all gainers. Materials (+42%) and communication services (+37%) also stood out. In contrast, the defensive utilities (-3%) and real estate sectors (+5%) notably lagged.
Comments from Portfolio Manager Caroline Tall: For the fiscal year ending February 28, 2021, the fund gained 30.81%, outperforming the 30.47% advance of the MSCI North America IMI + ADR Custom Communications Equipment 25/50 Linked Index, but underperforming the broad-based S&P 500
® index. Versus the industry index, out-of-benchmark exposure to the systems software group was the top contributor. Non-index exposure to internet services & infrastructure and stock picking in application software also lifted the fund's relative result. Our non-index stake in Cloudflare, a position we established this period, was the fund's largest individual relative contributor, driven by a roughly 261% advance. Also lifting performance was our outsized stake in Calix Networks, which gained 183%. Calix Networks was among the biggest holdings at period end. The fund's non-index stake in Fastly, a position not held at period end, gained 232%. Conversely, the biggest detractor from performance versus the industry index was security selection in communications equipment. The fund's largest individual relative detractor was our lighter-than-index stake in Ericsson, which gained roughly 59% the past year. The company was among our biggest holdings. Also holding back performance was an underweighting in Plantronics, which gained 195%. Plantronics was not held at period end. Further hurting performance was our overweighting in Echostar, which returned -35%.
The views expressed above reflect those of the portfolio manager(s) only through the end of the period as stated on the cover of this report and do not necessarily represent the views of Fidelity or any other person in the Fidelity organization. Any such views are subject to change at any time based upon market or other conditions and Fidelity disclaims any responsibility to update such views. These views may not be relied on as investment advice and, because investment decisions for a Fidelity fund are based on numerous factors, may not be relied on as an indication of trading intent on behalf of any Fidelity fund.
Communications Equipment Portfolio
Investment Summary (Unaudited)
Top Ten Stocks as of February 28, 2021
| | % of fund's net assets |
| Cisco Systems, Inc. | 18.3 |
| Ericsson (B Shares) sponsored ADR | 11.4 |
| Motorola Solutions, Inc. | 10.8 |
| F5 Networks, Inc. | 5.6 |
| Calix Networks, Inc. | 5.0 |
| Ciena Corp. | 4.7 |
| Acacia Communications, Inc. | 4.7 |
| Juniper Networks, Inc. | 4.6 |
| Lumentum Holdings, Inc. | 4.1 |
| CommScope Holding Co., Inc. | 3.5 |
| | 72.7 |
Top Industries (% of fund's net assets)
| As of February 28, 2021 |
| | Communications Equipment | 93.6% |
| | Software | 5.1% |
| | IT Services | 0.7% |
| | Entertainment | 0.3% |
| | All Others* | 0.3% |

* Includes short-term investments and net other assets (liabilities).
Communications Equipment Portfolio
Schedule of Investments February 28, 2021
Showing Percentage of Net Assets
| Common Stocks - 99.7% | | | |
| | | Shares | Value |
| Communications Equipment - 93.6% | | | |
| Communications Equipment - 93.6% | | | |
| Acacia Communications, Inc. (a) | | 70,146 | $8,066,089 |
| ADTRAN, Inc. | | 133,925 | 2,255,297 |
| Arista Networks, Inc. (a) | | 14,871 | 4,161,501 |
| Calix Networks, Inc. (a) | | 215,119 | 8,499,352 |
| Cambium Networks Corp. (a) | | 48,600 | 2,055,294 |
| Casa Systems, Inc. (a) | | 72,103 | 591,966 |
| Ciena Corp. (a) | | 155,119 | 8,092,558 |
| Cisco Systems, Inc. | | 694,614 | 31,167,327 |
| CommScope Holding Co., Inc. (a) | | 411,614 | 6,005,448 |
| EchoStar Holding Corp. Class A (a) | | 136,878 | 3,107,131 |
| Ericsson (B Shares) sponsored ADR | | 1,551,856 | 19,444,756 |
| Evertz Technologies Ltd. | | 45,496 | 504,796 |
| Extreme Networks, Inc. (a) | | 265,678 | 2,436,267 |
| F5 Networks, Inc. (a) | | 50,662 | 9,624,767 |
| Harmonic, Inc. (a) | | 156,568 | 1,212,619 |
| Inseego Corp. (a)(b) | | 73,031 | 1,065,522 |
| Juniper Networks, Inc. | | 335,329 | 7,806,459 |
| Lumentum Holdings, Inc. (a) | | 78,138 | 7,032,420 |
| Motorola Solutions, Inc. | | 105,056 | 18,435,227 |
| NetScout Systems, Inc. (a) | | 121,359 | 3,424,751 |
| Nokia Corp. sponsored ADR (a)(b) | | 1,139,690 | 4,467,585 |
| Radware Ltd. (a) | | 8 | 208 |
| Ribbon Communications, Inc. (a) | | 102,327 | 884,105 |
| Sierra Wireless, Inc. (a) | | 63,111 | 1,061,273 |
| ViaSat, Inc. (a)(b) | | 64,968 | 3,322,464 |
| Viavi Solutions, Inc. (a) | | 324,369 | 5,249,912 |
| | | | 159,975,094 |
| Entertainment - 0.3% | | | |
| Movies & Entertainment - 0.3% | | | |
| The Walt Disney Co. (a) | | 2,500 | 472,600 |
| IT Services - 0.7% | | | |
| Internet Services & Infrastructure - 0.7% | | | |
| Rackspace Technology, Inc. (a)(b) | | 59,600 | 1,252,792 |
| Software - 5.1% | | | |
| Application Software - 0.0% | | | |
| Citrix Systems, Inc. | | 13 | 1,737 |
| Systems Software - 5.1% | | | |
| Cloudflare, Inc. (a) | | 19,413 | 1,435,980 |
| CommVault Systems, Inc. (a) | | 21,130 | 1,346,615 |
| Fortinet, Inc. (a) | | 4,000 | 675,400 |
| Palo Alto Networks, Inc. (a) | | 4,700 | 1,684,057 |
| Ping Identity Holding Corp. (a) | | 93,400 | 2,188,362 |
| Rapid7, Inc. (a) | | 18,298 | 1,395,040 |
| | | | 8,725,454 |
|
| TOTAL SOFTWARE | | | 8,727,191 |
|
| TOTAL COMMON STOCKS | | | |
| (Cost $113,479,661) | | | 170,427,677 |
|
| Money Market Funds - 6.2% | | | |
| Fidelity Cash Central Fund 0.07% (c) | | 1,166,924 | 1,167,158 |
| Fidelity Securities Lending Cash Central Fund 0.08% (c)(d) | | 9,409,373 | 9,410,314 |
| TOTAL MONEY MARKET FUNDS | | | |
| (Cost $10,577,472) | | | 10,577,472 |
| TOTAL INVESTMENT IN SECURITIES - 105.9% | | | |
| (Cost $124,057,133) | | | 181,005,149 |
| NET OTHER ASSETS (LIABILITIES) - (5.9)% | | | (10,130,887) |
| NET ASSETS - 100% | | | $170,874,262 |
Legend
(a) Non-income producing
(b) Security or a portion of the security is on loan at period end.
(c) Affiliated fund that is generally available only to investment companies and other accounts managed by Fidelity Investments. The rate quoted is the annualized seven-day yield of the fund at period end. A complete unaudited listing of the fund's holdings as of its most recent quarter end is available upon request. In addition, each Fidelity Central Fund's financial statements, which are not covered by the Fund's Report of Independent Registered Public Accounting Firm, are available on the SEC's website or upon request.
(d) Investment made with cash collateral received from securities on loan.
Affiliated Central Funds
Information regarding fiscal year to date income earned by the Fund from investments in Fidelity Central Funds is as follows:
| Fund | Income earned |
| Fidelity Cash Central Fund | $4,214 |
| Fidelity Securities Lending Cash Central Fund | 109,793 |
| Total | $114,007 |
Amounts in the income column in the above table include any capital gain distributions from underlying funds, which are presented in the corresponding line-item in the Statement of Operations, if applicable. Amount for Fidelity Securities Lending Cash Central Fund represents the income earned on investing cash collateral, less rebates paid to borrowers and any lending agent fees associated with the loan, plus any premium payments received for lending certain types of securities.
The value, beginning of period, for the Fidelity Securities Lending Cash Central Fund was $4,504,391. Net realized gain (loss) and change in net unrealized appreciation (depreciation) on Fidelity Securities Lending Cash Central Fund is presented in the Statement of Operations, if applicable. Purchases and sales of the Fidelity Securities Lending Cash Central Fund were $135,591,093 and $130,685,378, respectively, during the period.
Investment Valuation
The following is a summary of the inputs used, as of February 28, 2021, involving the Fund's assets and liabilities carried at fair value. The inputs or methodology used for valuing securities may not be an indication of the risk associated with investing in those securities. For more information on valuation inputs, and their aggregation into the levels used below, please refer to the Investment Valuation section in the accompanying Notes to Financial Statements.
| | Valuation Inputs at Reporting Date: |
| Description | Total | Level 1 | Level 2 | Level 3 |
| Investments in Securities: | | | | |
| Common Stocks | $170,427,677 | $170,427,677 | $-- | $-- |
| Money Market Funds | 10,577,472 | 10,577,472 | -- | -- |
| Total Investments in Securities: | $181,005,149 | $181,005,149 | $-- | $-- |
Other Information
Distribution of investments by country or territory of incorporation, as a percentage of Total Net Assets, is as follows (Unaudited):
| United States of America | 83.9% |
| Sweden | 11.4% |
| Finland | 2.6% |
| Cayman Islands | 1.2% |
| Others (Individually Less Than 1%) | 0.9% |
| | 100.0% |
See accompanying notes which are an integral part of the financial statements.
Communications Equipment Portfolio
Financial Statements
Statement of Assets and Liabilities
| | | February 28, 2021 |
| Assets | | |
Investment in securities, at value (including securities loaned of $8,867,191) — See accompanying schedule:
Unaffiliated issuers (cost $113,479,661) | $170,427,677 | |
| Fidelity Central Funds (cost $10,577,472) | 10,577,472 | |
| Total Investment in Securities (cost $124,057,133) | | $181,005,149 |
| Cash | | 19,689 |
| Receivable for fund shares sold | | 70,538 |
| Dividends receivable | | 74,088 |
| Distributions receivable from Fidelity Central Funds | | 2,752 |
| Prepaid expenses | | 1,169 |
| Other receivables | | 1,281 |
| Total assets | | 181,174,666 |
| Liabilities | | |
| Payable for investments purchased | $626,675 | |
| Payable for fund shares redeemed | 71,266 | |
| Accrued management fee | 77,707 | |
| Other affiliated payables | 32,888 | |
| Other payables and accrued expenses | 81,818 | |
| Collateral on securities loaned | 9,410,050 | |
| Total liabilities | | 10,300,404 |
| Net Assets | | $170,874,262 |
| Net Assets consist of: | | |
| Paid in capital | | $113,874,338 |
| Total accumulated earnings (loss) | | 56,999,924 |
| Net Assets | | $170,874,262 |
| Net Asset Value, offering price and redemption price per share ($170,874,262 ÷ 4,209,903 shares) | | $40.59 |
See accompanying notes which are an integral part of the financial statements.
Statement of Operations
| | | Year ended February 28, 2021 |
| Investment Income | | |
| Dividends | | $1,760,462 |
| Income from Fidelity Central Funds (including $109,793 from security lending) | | 114,007 |
| Total income | | 1,874,469 |
| Expenses | | |
| Management fee | $784,278 | |
| Transfer agent fees | 321,732 | |
| Accounting fees | 57,575 | |
| Custodian fees and expenses | 58,035 | |
| Independent trustees' fees and expenses | 824 | |
| Registration fees | 16,301 | |
| Audit | 38,277 | |
| Legal | 176 | |
| Miscellaneous | 4,700 | |
| Total expenses before reductions | 1,281,898 | |
| Expense reductions | (37,061) | |
| Total expenses after reductions | | 1,244,837 |
| Net investment income (loss) | | 629,632 |
| Realized and Unrealized Gain (Loss) | | |
| Net realized gain (loss) on: | | |
| Investment securities: | | |
| Unaffiliated issuers | 3,204,145 | |
| Fidelity Central Funds | 247 | |
| Foreign currency transactions | (473) | |
| Total net realized gain (loss) | | 3,203,919 |
| Change in net unrealized appreciation (depreciation) on: | | |
| Investment securities: | | |
| Unaffiliated issuers | 36,373,244 | |
| Assets and liabilities in foreign currencies | 1 | |
| Total change in net unrealized appreciation (depreciation) | | 36,373,245 |
| Net gain (loss) | | 39,577,164 |
| Net increase (decrease) in net assets resulting from operations | | $40,206,796 |
See accompanying notes which are an integral part of the financial statements.
Statement of Changes in Net Assets
| | Year ended February 28, 2021 | Year ended February 29, 2020 |
| Increase (Decrease) in Net Assets | | |
| Operations | | |
| Net investment income (loss) | $629,632 | $969,116 |
| Net realized gain (loss) | 3,203,919 | 4,124,762 |
| Change in net unrealized appreciation (depreciation) | 36,373,245 | (42,282,905) |
| Net increase (decrease) in net assets resulting from operations | 40,206,796 | (37,189,027) |
| Distributions to shareholders | (643,329) | (9,589,306) |
| Share transactions | | |
| Proceeds from sales of shares | 16,670,458 | 43,801,317 |
| Reinvestment of distributions | 600,577 | 9,043,238 |
| Cost of shares redeemed | (31,097,669) | (79,873,603) |
| Net increase (decrease) in net assets resulting from share transactions | (13,826,634) | (27,029,048) |
| Total increase (decrease) in net assets | 25,736,833 | (73,807,381) |
| Net Assets | | |
| Beginning of period | 145,137,429 | 218,944,810 |
| End of period | $170,874,262 | $145,137,429 |
| Other Information | | |
| Shares | | |
| Sold | 454,656 | 1,090,635 |
| Issued in reinvestment of distributions | 16,299 | 241,125 |
| Redeemed | (918,846) | (2,098,473) |
| Net increase (decrease) | (447,891) | (766,713) |
See accompanying notes which are an integral part of the financial statements.
Financial Highlights
Communications Equipment Portfolio
| | | | | | |
| Years ended February 28, | 2021 | 2020 A | 2019 | 2018 | 2017 |
| Selected Per–Share Data | | | | | |
| Net asset value, beginning of period | $31.16 | $40.36 | $39.13 | $34.12 | $26.71 |
| Income from Investment Operations | | | | | |
| Net investment income (loss)B | .15 | .19 | .25 | .17 | .38 |
| Net realized and unrealized gain (loss) | 9.44 | (7.51) | 3.76 | 5.45C | 7.39 |
| Total from investment operations | 9.59 | (7.32) | 4.01 | 5.62 | 7.77 |
| Distributions from net investment income | (.16) | (.20) | (.17)D | (.33) | (.36) |
| Distributions from net realized gain | – | (1.69) | (2.61)D | (.28) | – |
| Total distributions | (.16) | (1.88)E | (2.78) | (.61) | (.36) |
| Redemption fees added to paid in capitalB | – | – | – | –F | –F |
| Net asset value, end of period | $40.59 | $31.16 | $40.36 | $39.13 | $34.12 |
| Total ReturnG | 30.81% | (18.84)% | 11.11% | 16.71%C | 29.24% |
| Ratios to Average Net AssetsH,I | | | | | |
| Expenses before reductions | .87% | .83% | .84% | .85% | .88% |
| Expenses net of fee waivers, if any | .87% | .83% | .84% | .85% | .88% |
| Expenses net of all reductions | .84% | .82% | .83% | .85% | .88% |
| Net investment income (loss) | .43% | .50% | .66% | .48% | 1.27% |
| Supplemental Data | | | | | |
| Net assets, end of period (000 omitted) | $170,874 | $145,137 | $218,945 | $209,178 | $204,651 |
| Portfolio turnover rateJ | 110% | 108% | 71% | 56% | 38% |
A For the year ended February 29.
B Calculated based on average shares outstanding during the period.
C Net realized and unrealized gain (loss) per share reflects proceeds received from litigation which amounted to $.01 per share. Excluding these litigation proceeds, the total return would have been 16.67%.
D The amounts shown reflect certain reclassifications related to book to tax differences that were made in the year shown.
E Total distributions per share do not sum due to rounding.
F Amount represents less than $.005 per share.
G Total returns would have been lower if certain expenses had not been reduced during the applicable periods shown.
H Fees and expenses of any underlying mutual funds or exchange-traded funds (ETFs) are not included in the Fund's expense ratio. The Fund indirectly bears its proportionate share of these expenses. For additional expense information related to investments in Fidelity Central Funds, please refer to the "Investments in Fidelity Central Funds" note found in the Notes to Financial Statements section of the most recent Annual or Semi-Annual report.
I Expense ratios reflect operating expenses of the class. Expenses before reductions do not reflect amounts reimbursed, waived, or reduced through arrangements with the investment advisor, brokerage services, or other offset arrangements, if applicable, and do not represent the amount paid by the class during periods when reimbursements, waivers or reductions occur.
J Amount does not include the portfolio activity of any underlying mutual funds or exchange-traded funds (ETFs).
See accompanying notes which are an integral part of the financial statements.
Computers Portfolio
Performance: The Bottom Line
Average annual total return reflects the change in the value of an investment, assuming reinvestment of distributions from dividend income and capital gains (the profits earned upon the sale of securities that have grown in value, if any) and assuming a constant rate of performance each year. The hypothetical investment and the average annual total returns do not reflect the deduction of taxes that a shareholder would pay on fund distributions or the redemption of fund shares. During periods of reimbursement by Fidelity, a fund’s total return will be greater than it would be had the reimbursement not occurred. How a fund did yesterday is no guarantee of how it will do tomorrow.
Average Annual Total Returns
| For the periods ended February 28, 2021 | Past 1 year | Past 5 years | Past 10 years |
| Computers Portfolio | 62.60% | 27.75% | 15.32% |
$10,000 Over 10 Years
Let's say hypothetically that $10,000 was invested in Computers Portfolio on February 28, 2011.
The chart shows how the value of your investment would have changed, and also shows how the S&P 500® Index performed over the same period.
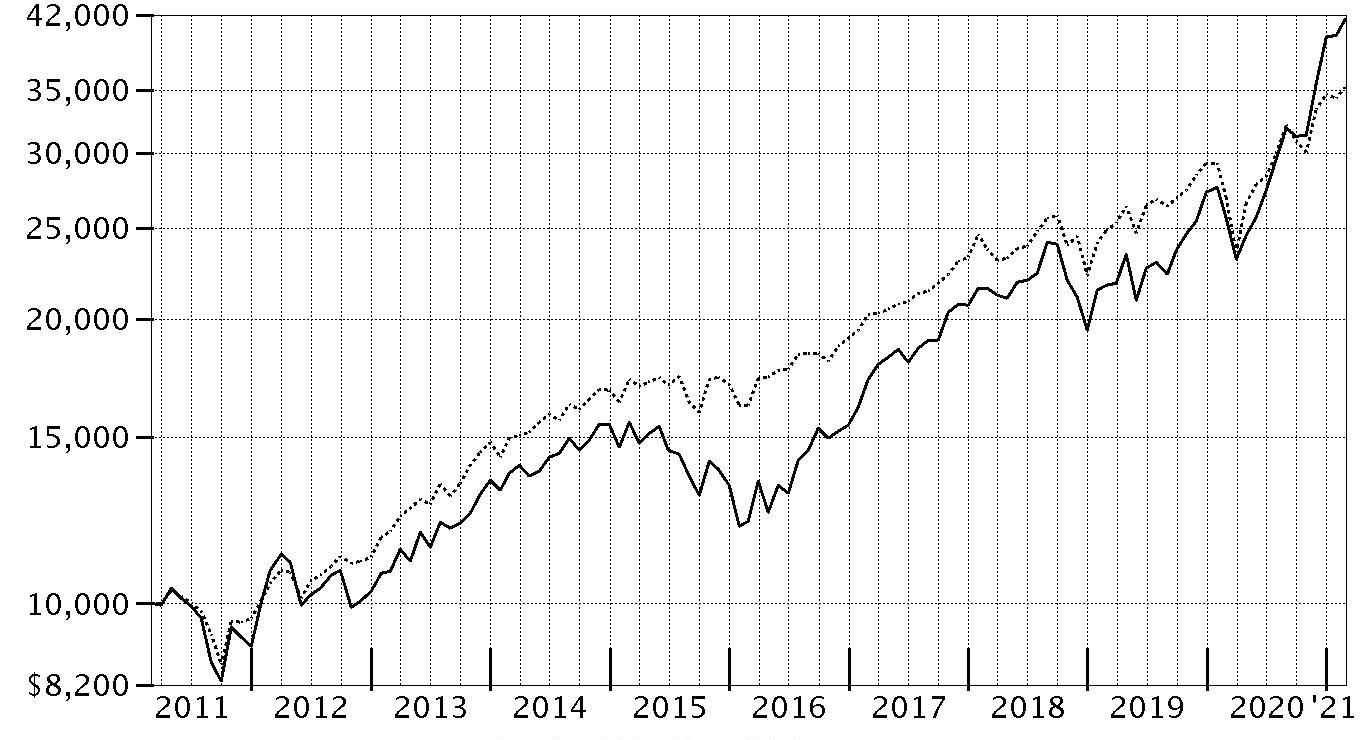
| Period Ending Values |
| $41,583 | Computers Portfolio |
| $35,259 | S&P 500® Index |
Computers Portfolio
Management's Discussion of Fund Performance
Market Recap: The S&P 500
® index gained 31.29% for the 12 months ending February 28, 2021, a volatile but productive period for U.S. risk assets. The early-2020 outbreak and spread of COVID-19 resulted in stocks suffering one of the quickest declines on record, through March 23, followed by a historic rebound that included the index closing 2020 at an all-time high and gaining modest ground in the first two months of the new year. The crisis and containment efforts caused broad contraction in economic activity, along with extreme uncertainty and dislocation in financial markets. A rapid and expansive U.S. monetary/fiscal-policy response partially offset the economic disruption and fueled the market surge, as did resilient corporate earnings. The rally slowed in September, when stocks began a two-month retreat amid Congress’s inability to reach a deal on additional fiscal stimulus, as well as concerns about election uncertainty, indications the U.S. economic recovery could be slowing and a new wave of COVID-19 cases. A shift in momentum began in October and accelerated following the U.S. elections, with the approval of three breakthrough COVID-19 vaccines and prospects for additional government stimulus fueling the “reflation trade” through February 28. By sector for the full 12 months, information technology (+50%) and consumer discretionary (+43%) led all gainers. Materials (+42%) and communication services (+37%) also stood out. In contrast, the defensive utilities (-3%) and real estate sectors (+5%) notably lagged.
Comments from Portfolio Manager Caroline Tall: For the fiscal year ending February 28, 2021, the fund gained 62.60%, outperforming the 61.01% advance of the FactSet Computers and Peripherals Linked Index, as well as the broad-based S&P 500
® index. The top contributor to performance versus the industry index was stock picking in the technology hardware, storage & peripherals group. Non-index allocations to industrial machinery and internet & direct marketing retail also helped. The fund's largest individual relative contributor was our lighter-than-index stake in Canon, which returned approximately -13% the past year. Also lifting performance was an underweighting in Hewlett Packard Enterprise, which gained 19%. The company was among the biggest holdings as of February 28. Another top relative contributor was an out-of-index stake in Kornit Digital (+182%). We decreased our stake in the company the past 12 months. The fund's foreign holdings contributed overall, aided in part by broad U.S.-dollar weakness. Conversely, the primary detractor from performance versus the industry index was a combination of stock selection and an underweighting in consumer electronics. Out-of-index exposure to specialized REITs and wireless telecommunication services also hampered the fund's relative performance. The biggest individual relative detractor was an underweight position in LG Electronics (+162%), which was among the largest holdings at period end. Also holding back performance was our lighter-than-index stake in Xiaomi, which gained roughly 102%. The company was among the fund's biggest holdings this period. Also hampering performance was our overweighting in Xerox Holdings, which returned about -16%. Notable changes in positioning include increased exposure to the consumer electronics subindustry.
The views expressed above reflect those of the portfolio manager(s) only through the end of the period as stated on the cover of this report and do not necessarily represent the views of Fidelity or any other person in the Fidelity organization. Any such views are subject to change at any time based upon market or other conditions and Fidelity disclaims any responsibility to update such views. These views may not be relied on as investment advice and, because investment decisions for a Fidelity fund are based on numerous factors, may not be relied on as an indication of trading intent on behalf of any Fidelity fund.
Computers Portfolio
Investment Summary (Unaudited)
Top Ten Stocks as of February 28, 2021
| | % of fund's net assets |
| Samsung Electronics Co. Ltd. | 16.4 |
| Sony Corp. | 15.3 |
| Apple, Inc. | 9.0 |
| Dell Technologies, Inc. | 5.5 |
| Western Digital Corp. | 5.0 |
| Hewlett Packard Enterprise Co. | 4.8 |
| Logitech International SA (Reg.) | 4.5 |
| HP, Inc. | 4.2 |
| Fujifilm Holdings Corp. | 3.3 |
| LG Electronics, Inc. | 3.3 |
| | 71.3 |
Top Industries (% of fund's net assets)
| As of February 28, 2021 |
| | Technology Hardware, Storage & Peripherals | 67.9% |
| | Household Durables | 18.6% |
| | Software | 3.4% |
| | Interactive Media & Services | 2.7% |
| | Electronic Equipment & Components | 1.7% |
| | All Others* | 5.7% |

* Includes short-term investments and net other assets (liabilities).
Computers Portfolio
Schedule of Investments February 28, 2021
Showing Percentage of Net Assets
| Common Stocks - 98.2% | | | |
| | | Shares | Value |
| Electronic Equipment & Components - 1.7% | | | |
| Electronic Components - 1.7% | | | |
| Kyocera Corp. | | 206,169 | $13,344,786 |
| Health Care Equipment & Supplies - 0.9% | | | |
| Health Care Supplies - 0.9% | | | |
| Hoya Corp. | | 58,651 | 6,657,696 |
| Household Durables - 18.6% | | | |
| Consumer Electronics - 18.6% | | | |
| LG Electronics, Inc. | | 195,621 | 25,417,154 |
| Sony Corp. | | 1,114,782 | 117,722,297 |
| | | | 143,139,451 |
| Interactive Media & Services - 2.7% | | | |
| Interactive Media & Services - 2.7% | | | |
| Alphabet, Inc. Class A (a) | | 10,302 | 20,829,717 |
| Internet & Direct Marketing Retail - 0.1% | | | |
| Internet & Direct Marketing Retail - 0.1% | | | |
| Doordash, Inc. (b) | | 1,800 | 305,082 |
| Machinery - 1.2% | | | |
| Industrial Machinery - 1.2% | | | |
| Kornit Digital Ltd. (a) | | 83,574 | 9,454,727 |
| Semiconductors & Semiconductor Equipment - 1.7% | | | |
| Semiconductor Equipment - 0.2% | | | |
| Tokyo Electron Ltd. | | 4,469 | 1,863,649 |
| Semiconductors - 1.5% | | | |
| NVIDIA Corp. | | 10,893 | 5,975,682 |
| Taiwan Semiconductor Manufacturing Co. Ltd. sponsored ADR | | 42,584 | 5,363,029 |
| | | | 11,338,711 |
|
| TOTAL SEMICONDUCTORS & SEMICONDUCTOR EQUIPMENT | | | 13,202,360 |
|
| Software - 3.4% | | | |
| Application Software - 0.0% | | | |
| Jamf Holding Corp. (a) | | 700 | 26,180 |
| Systems Software - 3.4% | | | |
| CyberArk Software Ltd. (a) | | 25,559 | 3,752,828 |
| Microsoft Corp. | | 64,478 | 14,983,398 |
| NortonLifeLock, Inc. | | 164,376 | 3,206,976 |
| Telos Corp. | | 68,636 | 2,286,952 |
| Zscaler, Inc. (a) | | 9,822 | 2,013,805 |
| | | | 26,243,959 |
|
| TOTAL SOFTWARE | | | 26,270,139 |
|
| Technology Hardware, Storage & Peripherals - 67.9% | | | |
| Technology Hardware, Storage & Peripherals - 67.9% | | | |
| Apple, Inc. | | 574,894 | 69,711,646 |
| Canon, Inc. | | 1,018,800 | 22,095,884 |
| Dell Technologies, Inc. (a) | | 527,228 | 42,742,374 |
| Diebold Nixdorf, Inc. (a) | | 253,579 | 3,681,967 |
| Fujifilm Holdings Corp. | | 446,223 | 25,515,160 |
| Hewlett Packard Enterprise Co. | | 2,535,970 | 36,923,723 |
| HP, Inc. | | 1,118,288 | 32,396,803 |
| Lenovo Group Ltd. | | 11,179,556 | 14,139,386 |
| Logitech International SA (Reg.) | | 323,232 | 34,474,764 |
| NetApp, Inc. | | 197,516 | 12,364,502 |
| Pure Storage, Inc. Class A (a) | | 453,656 | 10,606,477 |
| Samsung Electronics Co. Ltd. | | 1,722,881 | 126,061,667 |
| Seagate Technology LLC | | 340,807 | 24,957,297 |
| Western Digital Corp. | | 562,742 | 38,564,709 |
| Xerox Holdings Corp. | | 349,247 | 8,898,814 |
| Xiaomi Corp. Class B (a)(c) | | 6,152,241 | 20,453,455 |
| | | | 523,588,628 |
| TOTAL COMMON STOCKS | | | |
| (Cost $424,065,926) | | | 756,792,586 |
|
| Money Market Funds - 1.4% | | | |
| Fidelity Cash Central Fund 0.07% (d) | | 10,713,333 | 10,715,475 |
| Fidelity Securities Lending Cash Central Fund 0.08% (d)(e) | | 289,396 | 289,425 |
| TOTAL MONEY MARKET FUNDS | | | |
| (Cost $11,004,900) | | | 11,004,900 |
| TOTAL INVESTMENT IN SECURITIES - 99.6% | | | |
| (Cost $435,070,826) | | | 767,797,486 |
| NET OTHER ASSETS (LIABILITIES) - 0.4% | | | 2,978,561 |
| NET ASSETS - 100% | | | $770,776,047 |
Legend
(a) Non-income producing
(b) Security or a portion of the security is on loan at period end.
(c) Security exempt from registration under Rule 144A of the Securities Act of 1933. These securities may be resold in transactions exempt from registration, normally to qualified institutional buyers. At the end of the period, the value of these securities amounted to $20,453,455 or 2.7% of net assets.
(d) Affiliated fund that is generally available only to investment companies and other accounts managed by Fidelity Investments. The rate quoted is the annualized seven-day yield of the fund at period end. A complete unaudited listing of the fund's holdings as of its most recent quarter end is available upon request. In addition, each Fidelity Central Fund's financial statements, which are not covered by the Fund's Report of Independent Registered Public Accounting Firm, are available on the SEC's website or upon request.
(e) Investment made with cash collateral received from securities on loan.
Affiliated Central Funds
Information regarding fiscal year to date income earned by the Fund from investments in Fidelity Central Funds is as follows:
| Fund | Income earned |
| Fidelity Cash Central Fund | $27,152 |
| Fidelity Securities Lending Cash Central Fund | 64,740 |
| Total | $91,892 |
Amounts in the income column in the above table include any capital gain distributions from underlying funds, which are presented in the corresponding line-item in the Statement of Operations, if applicable. Amount for Fidelity Securities Lending Cash Central Fund represents the income earned on investing cash collateral, less rebates paid to borrowers and any lending agent fees associated with the loan, plus any premium payments received for lending certain types of securities.
Investment Valuation
The following is a summary of the inputs used, as of February 28, 2021, involving the Fund's assets and liabilities carried at fair value. The inputs or methodology used for valuing securities may not be an indication of the risk associated with investing in those securities. For more information on valuation inputs, and their aggregation into the levels used below, please refer to the Investment Valuation section in the accompanying Notes to Financial Statements.
| | Valuation Inputs at Reporting Date: |
| Description | Total | Level 1 | Level 2 | Level 3 |
| Investments in Securities: | | | | |
| Common Stocks | $756,792,586 | $555,797,355 | $200,995,231 | $-- |
| Money Market Funds | 11,004,900 | 11,004,900 | -- | -- |
| Total Investments in Securities: | $767,797,486 | $566,802,255 | $200,995,231 | $-- |
Other Information
Distribution of investments by country or territory of incorporation, as a percentage of Total Net Assets, is as follows (Unaudited):
| United States of America | 41.5% |
| Japan | 24.3% |
| Korea (South) | 19.7% |
| Switzerland | 4.5% |
| Ireland | 3.2% |
| Cayman Islands | 2.6% |
| Hong Kong | 1.8% |
| Israel | 1.7% |
| Others (Individually Less Than 1%) | 0.7% |
| | 100.0% |
See accompanying notes which are an integral part of the financial statements.
Computers Portfolio
Financial Statements
Statement of Assets and Liabilities
| | | February 28, 2021 |
| Assets | | |
Investment in securities, at value (including securities loaned of $288,133) — See accompanying schedule:
Unaffiliated issuers (cost $424,065,926) | $756,792,586 | |
| Fidelity Central Funds (cost $11,004,900) | 11,004,900 | |
| Total Investment in Securities (cost $435,070,826) | | $767,797,486 |
| Cash | | 5,077 |
| Receivable for fund shares sold | | 1,491,530 |
| Dividends receivable | | 3,071,509 |
| Distributions receivable from Fidelity Central Funds | | 1,252 |
| Prepaid expenses | | 3,135 |
| Other receivables | | 180,534 |
| Total assets | | 772,550,523 |
| Liabilities | | |
| Payable for fund shares redeemed | $920,642 | |
| Accrued management fee | 346,167 | |
| Other affiliated payables | 107,201 | |
| Other payables and accrued expenses | 111,041 | |
| Collateral on securities loaned | 289,425 | |
| Total liabilities | | 1,774,476 |
| Net Assets | | $770,776,047 |
| Net Assets consist of: | | |
| Paid in capital | | $377,319,984 |
| Total accumulated earnings (loss) | | 393,456,063 |
| Net Assets | | $770,776,047 |
| Net Asset Value, offering price and redemption price per share ($770,776,047 ÷ 6,717,759 shares) | | $114.74 |
See accompanying notes which are an integral part of the financial statements.
Statement of Operations
| | | Year ended February 28, 2021 |
| Investment Income | | |
| Dividends | | $7,426,502 |
| Special dividends | | 2,849,738 |
| Income from Fidelity Central Funds (including $64,740 from security lending) | | 91,892 |
| Total income | | 10,368,132 |
| Expenses | | |
| Management fee | $3,130,730 | |
| Transfer agent fees | 880,641 | |
| Accounting fees | 218,885 | |
| Custodian fees and expenses | 34,360 | |
| Independent trustees' fees and expenses | 3,130 | |
| Registration fees | 29,735 | |
| Audit | 42,037 | |
| Legal | 1,276 | |
| Interest | 570 | |
| Miscellaneous | 10,238 | |
| Total expenses before reductions | 4,351,602 | |
| Expense reductions | (87,273) | |
| Total expenses after reductions | | 4,264,329 |
| Net investment income (loss) | | 6,103,803 |
| Realized and Unrealized Gain (Loss) | | |
| Net realized gain (loss) on: | | |
| Investment securities: | | |
| Unaffiliated issuers (net of foreign taxes of $160,206) | 95,018,578 | |
| Fidelity Central Funds | (1,534) | |
| Foreign currency transactions | (282,238) | |
| Total net realized gain (loss) | | 94,734,806 |
| Change in net unrealized appreciation (depreciation) on: | | |
| Investment securities: | | |
| Unaffiliated issuers | 193,220,085 | |
| Assets and liabilities in foreign currencies | (35,413) | |
| Total change in net unrealized appreciation (depreciation) | | 193,184,672 |
| Net gain (loss) | | 287,919,478 |
| Net increase (decrease) in net assets resulting from operations | | $294,023,281 |
See accompanying notes which are an integral part of the financial statements.
Statement of Changes in Net Assets
| | Year ended February 28, 2021 | Year ended February 29, 2020 |
| Increase (Decrease) in Net Assets | | |
| Operations | | |
| Net investment income (loss) | $6,103,803 | $10,071,727 |
| Net realized gain (loss) | 94,734,806 | 41,250,368 |
| Change in net unrealized appreciation (depreciation) | 193,184,672 | 28,116,018 |
| Net increase (decrease) in net assets resulting from operations | 294,023,281 | 79,438,113 |
| Distributions to shareholders | (61,816,773) | (66,135,088) |
| Share transactions | | |
| Proceeds from sales of shares | 88,420,400 | 97,658,347 |
| Reinvestment of distributions | 59,014,619 | 63,117,629 |
| Cost of shares redeemed | (142,658,039) | (132,066,756) |
| Net increase (decrease) in net assets resulting from share transactions | 4,776,980 | 28,709,220 |
| Total increase (decrease) in net assets | 236,983,488 | 42,012,245 |
| Net Assets | | |
| Beginning of period | 533,792,559 | 491,780,314 |
| End of period | $770,776,047 | $533,792,559 |
| Other Information | | |
| Shares | | |
| Sold | 905,980 | 1,202,453 |
| Issued in reinvestment of distributions | 681,911 | 818,801 |
| Redeemed | (1,658,159) | (1,718,015) |
| Net increase (decrease) | (70,268) | 303,239 |
See accompanying notes which are an integral part of the financial statements.
Financial Highlights
Computers Portfolio
| | | | | | |
| Years ended February 28, | 2021 | 2020 A | 2019 | 2018 | 2017 |
| Selected Per–Share Data | | | | | |
| Net asset value, beginning of period | $78.64 | $75.84 | $92.81 | $83.01 | $62.46 |
| Income from Investment Operations | | | | | |
| Net investment income (loss)B | .93C | 1.51D | .81 | .67 | .73 |
| Net realized and unrealized gain (loss) | 44.83 | 11.48 | (1.67) | 19.24 | 24.69 |
| Total from investment operations | 45.76 | 12.99 | (.86) | 19.91 | 25.42 |
| Distributions from net investment income | (1.61) | (.77) | (.88)E | (.73)E | (.88) |
| Distributions from net realized gain | (8.05) | (9.42) | (15.23)E | (9.38)E | (4.00) |
| Total distributions | (9.66) | (10.19) | (16.11) | (10.11) | (4.87)F |
| Redemption fees added to paid in capitalB | – | – | – | –G | –G |
| Net asset value, end of period | $114.74 | $78.64 | $75.84 | $92.81 | $83.01 |
| Total ReturnH | 62.60% | 17.80% | .54% | 24.82% | 41.57% |
| Ratios to Average Net AssetsI,J | | | | | |
| Expenses before reductions | .74% | .76% | .77% | .79% | .81% |
| Expenses net of fee waivers, if any | .74% | .76% | .77% | .79% | .81% |
| Expenses net of all reductions | .73% | .75% | .77% | .78% | .81% |
| Net investment income (loss) | 1.04%C | 1.95%D | .90% | .75% | 1.01% |
| Supplemental Data | | | | | |
| Net assets, end of period (000 omitted) | $770,776 | $533,793 | $491,780 | $538,332 | $472,745 |
| Portfolio turnover rateK | 78% | 116% | 81% | 57% | 49% |
A For the year ended February 29.
B Calculated based on average shares outstanding during the period.
C Net investment income per share reflects one or more large, non-recurring dividend which amounted to $.44 per share. Excluding such non-recurring dividend, the ratio of net investment income (loss) to average net assets would have been .55%.
D Net investment income per share reflects one or more large, non-recurring dividend which amounted to $.78 per share. Excluding such non-recurring dividend, the ratio of net investment income (loss) to average net assets would have been .94%.
E The amounts shown reflect certain reclassifications related to book to tax differences that were made in the year shown.
F Total distributions per share do not sum due to rounding.
G Amount represents less than $.005 per share.
H Total returns would have been lower if certain expenses had not been reduced during the applicable periods shown.
I Fees and expenses of any underlying mutual funds or exchange-traded funds (ETFs) are not included in the Fund's expense ratio. The Fund indirectly bears its proportionate share of these expenses. For additional expense information related to investments in Fidelity Central Funds, please refer to the "Investments in Fidelity Central Funds" note found in the Notes to Financial Statements section of the most recent Annual or Semi-Annual report.
J Expense ratios reflect operating expenses of the class. Expenses before reductions do not reflect amounts reimbursed, waived, or reduced through arrangements with the investment advisor, brokerage services, or other offset arrangements, if applicable, and do not represent the amount paid by the class during periods when reimbursements, waivers or reductions occur.
K Amount does not include the portfolio activity of any underlying mutual funds or exchange-traded funds (ETFs).
See accompanying notes which are an integral part of the financial statements.
IT Services Portfolio
Performance: The Bottom Line
Average annual total return reflects the change in the value of an investment, assuming reinvestment of distributions from dividend income and capital gains (the profits earned upon the sale of securities that have grown in value, if any) and assuming a constant rate of performance each year. The hypothetical investment and the average annual total returns do not reflect the deduction of taxes that a shareholder would pay on fund distributions or the redemption of fund shares. During periods of reimbursement by Fidelity, a fund’s total return will be greater than it would be had the reimbursement not occurred. How a fund did yesterday is no guarantee of how it will do tomorrow.
Average Annual Total Returns
| For the periods ended February 28, 2021 | Past 1 year | Past 5 years | Past 10 years |
| IT Services Portfolio | 34.67% | 24.29% | 19.40% |
$10,000 Over 10 Years
Let's say hypothetically that $10,000 was invested in IT Services Portfolio on February 28, 2011.
The chart shows how the value of your investment would have changed, and also shows how the S&P 500® Index performed over the same period.
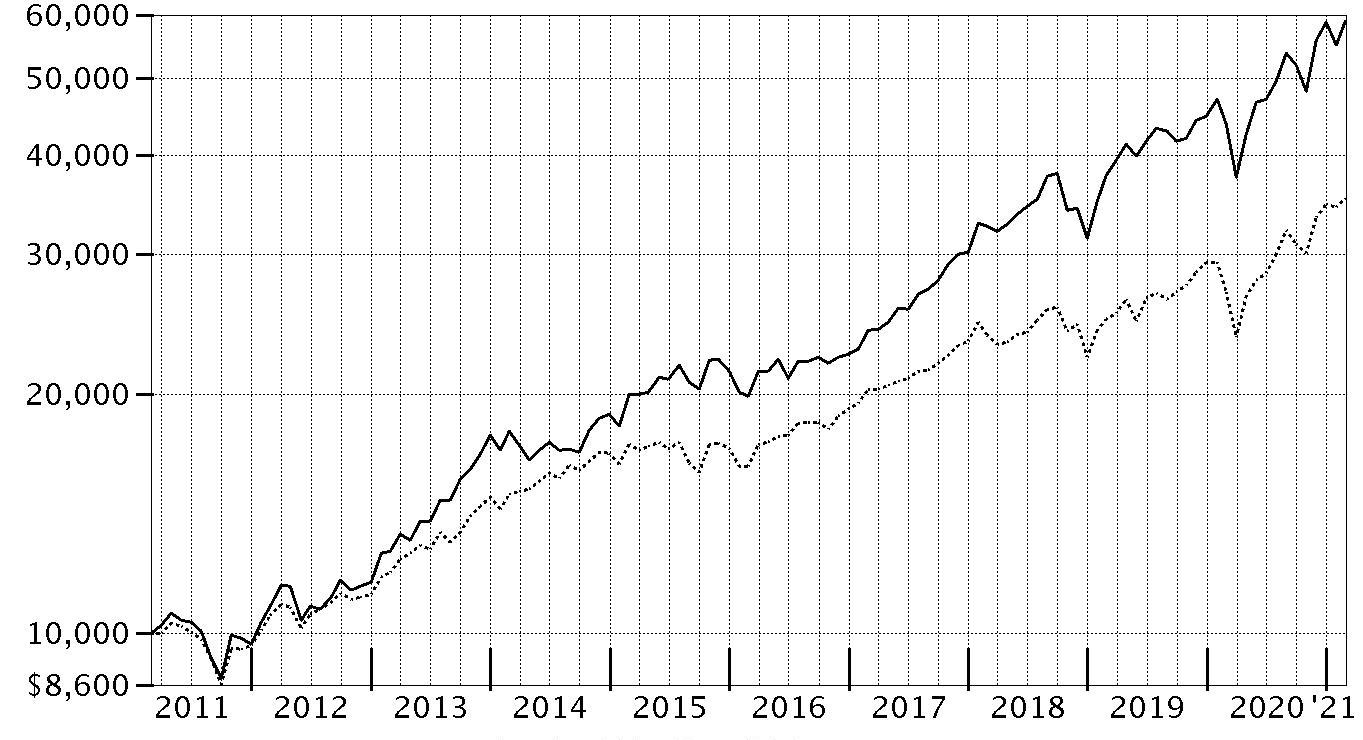
| Period Ending Values |
| $58,875 | IT Services Portfolio |
| $35,259 | S&P 500® Index |
IT Services Portfolio
Management's Discussion of Fund Performance
Market Recap: The S&P 500
® index gained 31.29% for the 12 months ending February 28, 2021, a volatile but productive period for U.S. risk assets. The early-2020 outbreak and spread of COVID-19 resulted in stocks suffering one of the quickest declines on record, through March 23, followed by a historic rebound that included the index closing 2020 at an all-time high and gaining modest ground in the first two months of the new year. The crisis and containment efforts caused broad contraction in economic activity, along with extreme uncertainty and dislocation in financial markets. A rapid and expansive U.S. monetary/fiscal-policy response partially offset the economic disruption and fueled the market surge, as did resilient corporate earnings. The rally slowed in September, when stocks began a two-month retreat amid Congress’s inability to reach a deal on additional fiscal stimulus, as well as concerns about election uncertainty, indications the U.S. economic recovery could be slowing and a new wave of COVID-19 cases. A shift in momentum began in October and accelerated following the U.S. elections, with the approval of three breakthrough COVID-19 vaccines and prospects for additional government stimulus fueling the “reflation trade” through February 28. By sector for the full 12 months, information technology (+50%) and consumer discretionary (+43%) led all gainers. Materials (+42%) and communication services (+37%) also stood out. In contrast, the defensive utilities (-3%) and real estate sectors (+5%) notably lagged.
Comments from Portfolio Manager Rebecca Baker: For the fiscal year ending February 28, 2021, the fund gained 34.67%, outperforming the 30.91% gain of the MSCI US IMI IT Services 25/50 Index, as well as the broad-based S&P 500
® index. Versus the industry index, security selection was the primary contributor, especially within the internet services & infrastructure category. Stock picks and an underweighting in IT consulting & other services and non-index exposure to advertising also helped, as did the fund's position in cash. The biggest individual relative contributor was an overweight position in Twilio (+248%). Twilio was among the fund's largest holdings. Also bolstering performance was an underweighting in IBM, which returned roughly -4%. We reduced our position this period. Another top relative contributor was an out-of-index stake in S4 Capital (+171%). In contrast, the primary detractor from performance versus the industry index was stock selection in data processing & outsourced services. An underweighting in internet services & infrastructure and stock picks in research & consulting services also hurt the fund's relative result. The biggest individual relative detractor was an underweight position in Square (+176%), which was among our biggest holdings as of February 28. Our second-largest relative detractor this period was avoiding Okta, an index component that gained 104%. Lastly, Fidelity National Information Services, one of the fund's largest holdings, returned approximately 0% the past year and hampered relative performance. We considerably reduced this position. Notable changes in positioning include increased exposure to the internet services & infrastructure subindustry and a lower allocation to IT consulting & other services.
The views expressed above reflect those of the portfolio manager(s) only through the end of the period as stated on the cover of this report and do not necessarily represent the views of Fidelity or any other person in the Fidelity organization. Any such views are subject to change at any time based upon market or other conditions and Fidelity disclaims any responsibility to update such views. These views may not be relied on as investment advice and, because investment decisions for a Fidelity fund are based on numerous factors, may not be relied on as an indication of trading intent on behalf of any Fidelity fund.
Note to shareholders: On July 20, 2020, Rebecca Baker assumed co-management responsibilities for the fund, joining Zach Turner until January 1, 2021, when Zach came off the fund, leaving Rebecca as sole portfolio manager.
IT Services Portfolio
Investment Summary (Unaudited)
Top Ten Stocks as of February 28, 2021
| | % of fund's net assets |
| MasterCard, Inc. Class A | 18.5 |
| Visa, Inc. Class A | 14.2 |
| PayPal Holdings, Inc. | 14.0 |
| Fiserv, Inc. | 4.9 |
| Square, Inc. | 4.6 |
| Twilio, Inc. Class A | 3.6 |
| Intuit, Inc. | 2.8 |
| Fidelity National Information Services, Inc. | 2.6 |
| Global Payments, Inc. | 2.5 |
| EPAM Systems, Inc. | 2.1 |
| | 69.8 |
Top Industries (% of fund's net assets)
| As of February 28, 2021 |
| | IT Services | 86.8% |
| | Software | 7.4% |
| | Interactive Media & Services | 1.8% |
| | Media | 1.2% |
| | Aerospace & Defense | 0.9% |
| | All Others* | 1.9% |

* Includes short-term investments and net other assets (liabilities).
IT Services Portfolio
Schedule of Investments February 28, 2021
Showing Percentage of Net Assets
| Common Stocks - 99.7% | | | |
| | | Shares | Value |
| Aerospace & Defense - 0.9% | | | |
| Aerospace & Defense - 0.9% | | | |
| Axon Enterprise, Inc. (a) | | 230,900 | $38,211,641 |
| Interactive Media & Services - 1.8% | | | |
| Interactive Media & Services - 1.8% | | | |
| Facebook, Inc. Class A (a) | | 121,300 | 31,249,306 |
| Match Group, Inc. (a) | | 292,430 | 44,697,926 |
| | | | 75,947,232 |
| Internet & Direct Marketing Retail - 0.9% | | | |
| Internet & Direct Marketing Retail - 0.9% | | | |
| Alibaba Group Holding Ltd. sponsored ADR (a) | | 52,200 | 12,411,072 |
| Expedia, Inc. | | 33,900 | 5,457,900 |
| MercadoLibre, Inc. (a) | | 10,500 | 17,200,155 |
| | | | 35,069,127 |
| IT Services - 86.8% | | | |
| Data Processing & Outsourced Services - 69.3% | | | |
| Adyen BV (a)(b) | | 3,400 | 7,933,507 |
| Automatic Data Processing, Inc. | | 333,675 | 58,066,124 |
| Black Knight, Inc. (a) | | 754,800 | 57,885,612 |
| ExlService Holdings, Inc. (a) | | 75,493 | 6,388,218 |
| Fidelity National Information Services, Inc. | | 781,197 | 107,805,186 |
| Fiserv, Inc. (a) | | 1,753,817 | 202,337,867 |
| FleetCor Technologies, Inc. (a) | | 95,000 | 26,344,450 |
| Genpact Ltd. | | 1,281,080 | 51,806,875 |
| Global Payments, Inc. | | 517,603 | 102,480,218 |
| MasterCard, Inc. Class A | | 2,159,400 | 764,103,689 |
| PayPal Holdings, Inc. (a) | | 2,234,640 | 580,671,204 |
| Square, Inc. (a) | | 825,000 | 189,774,750 |
| StoneCo Ltd. Class A (a) | | 430,200 | 36,915,462 |
| The Western Union Co. | | 4,800 | 111,456 |
| Ttec Holdings, Inc. | | 2,000 | 168,280 |
| Visa, Inc. Class A (c) | | 2,766,548 | 587,587,130 |
| WEX, Inc. (a) | | 700 | 145,845 |
| WNS Holdings Ltd. sponsored ADR (a) | | 1,154,792 | 86,274,510 |
| | | | 2,866,800,383 |
| Internet Services & Infrastructure - 7.3% | | | |
| GoDaddy, Inc. (a) | | 967,527 | 78,485,790 |
| MongoDB, Inc. Class A (a) | | 141,900 | 54,763,467 |
| Snowflake Computing, Inc. (c) | | 24,500 | 6,358,730 |
| Twilio, Inc. Class A (a) | | 375,500 | 147,526,440 |
| VeriSign, Inc. (a) | | 70,000 | 13,582,100 |
| | | | 300,716,527 |
| IT Consulting & Other Services - 10.2% | | | |
| Accenture PLC Class A | | 25,480 | 6,392,932 |
| Cognizant Technology Solutions Corp. Class A | | 1,012,832 | 74,422,895 |
| DXC Technology Co. | | 2,111,100 | 53,241,942 |
| Endava PLC ADR (a) | | 430,061 | 38,038,895 |
| EPAM Systems, Inc. (a) | | 235,800 | 88,097,238 |
| Gartner, Inc. (a) | | 281,400 | 50,381,856 |
| IBM Corp. | | 253,150 | 30,107,130 |
| Leidos Holdings, Inc. | | 699,130 | 61,838,049 |
| Liveramp Holdings, Inc. (a) | | 247,200 | 15,613,152 |
| Science Applications International Corp. | | 800 | 68,904 |
| Unisys Corp. (a) | | 167,753 | 4,118,336 |
| | | | 422,321,329 |
|
| TOTAL IT SERVICES | | | 3,589,838,239 |
|
| Media - 1.2% | | | |
| Advertising - 1.2% | | | |
| S4 Capital PLC (a) | | 7,968,188 | 49,289,681 |
| Professional Services - 0.7% | | | |
| Research & Consulting Services - 0.7% | | | |
| ICF International, Inc. | | 161,411 | 13,469,748 |
| Verisk Analytics, Inc. | | 81,300 | 13,321,005 |
| | | | 26,790,753 |
| Software - 7.4% | | | |
| Application Software - 7.4% | | | |
| Adobe, Inc. (a) | | 66,469 | 30,553,805 |
| Ceridian HCM Holding, Inc. (a) | | 540,373 | 48,449,843 |
| Intuit, Inc. | | 300,656 | 117,297,932 |
| Paycom Software, Inc. (a) | | 113,900 | 42,625,936 |
| SS&C Technologies Holdings, Inc. | | 494,350 | 32,765,518 |
| Workday, Inc. Class A (a) | | 69,300 | 16,990,974 |
| Xero Ltd. (a) | | 190,005 | 17,314,389 |
| | | | 305,998,397 |
| TOTAL COMMON STOCKS | | | |
| (Cost $1,698,345,800) | | | 4,121,145,070 |
|
| Money Market Funds - 3.3% | | | |
| Fidelity Securities Lending Cash Central Fund 0.08% (d)(e) | | | |
| (Cost $136,234,240) | | 136,220,618 | 136,234,240 |
| TOTAL INVESTMENT IN SECURITIES - 103.0% | | | |
| (Cost $1,834,580,040) | | | 4,257,379,310 |
| NET OTHER ASSETS (LIABILITIES) - (3.0)% | | | (122,068,320) |
| NET ASSETS - 100% | | | $4,135,310,990 |
Legend
(a) Non-income producing
(b) Security exempt from registration under Rule 144A of the Securities Act of 1933. These securities may be resold in transactions exempt from registration, normally to qualified institutional buyers. At the end of the period, the value of these securities amounted to $7,933,507 or 0.2% of net assets.
(c) Security or a portion of the security is on loan at period end.
(d) Investment made with cash collateral received from securities on loan.
(e) Affiliated fund that is generally available only to investment companies and other accounts managed by Fidelity Investments. The rate quoted is the annualized seven-day yield of the fund at period end. A complete unaudited listing of the fund's holdings as of its most recent quarter end is available upon request. In addition, each Fidelity Central Fund's financial statements, which are not covered by the Fund's Report of Independent Registered Public Accounting Firm, are available on the SEC's website or upon request.
Affiliated Central Funds
Information regarding fiscal year to date income earned by the Fund from investments in Fidelity Central Funds is as follows:
| Fund | Income earned |
| Fidelity Cash Central Fund | $99,709 |
| Fidelity Securities Lending Cash Central Fund | 1,346,410 |
| Total | $1,446,119 |
Amounts in the income column in the above table include any capital gain distributions from underlying funds, which are presented in the corresponding line-item in the Statement of Operations, if applicable. Amount for Fidelity Securities Lending Cash Central Fund represents the income earned on investing cash collateral, less rebates paid to borrowers and any lending agent fees associated with the loan, plus any premium payments received for lending certain types of securities.
Investment Valuation
The following is a summary of the inputs used, as of February 28, 2021, involving the Fund's assets and liabilities carried at fair value. The inputs or methodology used for valuing securities may not be an indication of the risk associated with investing in those securities. For more information on valuation inputs, and their aggregation into the levels used below, please refer to the Investment Valuation section in the accompanying Notes to Financial Statements.
| | Valuation Inputs at Reporting Date: |
| Description | Total | Level 1 | Level 2 | Level 3 |
| Investments in Securities: | | | | |
| Common Stocks | $4,121,145,070 | $4,113,211,563 | $7,933,507 | $-- |
| Money Market Funds | 136,234,240 | 136,234,240 | -- | -- |
| Total Investments in Securities: | $4,257,379,310 | $4,249,445,803 | $7,933,507 | $-- |
| Net unrealized depreciation on unfunded commitments | $(1,600,000) | $-- | $(1,600,000) | $-- |
See accompanying notes which are an integral part of the financial statements.
IT Services Portfolio
Financial Statements
Statement of Assets and Liabilities
| | | February 28, 2021 |
| Assets | | |
Investment in securities, at value (including securities loaned of $132,573,193) — See accompanying schedule:
Unaffiliated issuers (cost $1,698,345,800) | $4,121,145,070 | |
| Fidelity Central Funds (cost $136,234,240) | 136,234,240 | |
| Total Investment in Securities (cost $1,834,580,040) | | $4,257,379,310 |
| Receivable for investments sold | | 23,368,603 |
| Receivable for fund shares sold | | 1,912,215 |
| Dividends receivable | | 1,488,949 |
| Distributions receivable from Fidelity Central Funds | | 8,650 |
| Prepaid expenses | | 14,943 |
| Other receivables | | 16,925 |
| Total assets | | 4,284,189,595 |
| Liabilities | | |
| Payable to custodian bank | $1,106,095 | |
| Payable for investments purchased | 2,127,342 | |
| Net unrealized depreciation on unfunded commitments | 1,600,000 | |
| Payable for fund shares redeemed | 5,310,396 | |
| Accrued management fee | 1,862,485 | |
| Other affiliated payables | 591,143 | |
| Other payables and accrued expenses | 62,994 | |
| Collateral on securities loaned | 136,218,150 | |
| Total liabilities | | 148,878,605 |
| Net Assets | | $4,135,310,990 |
| Net Assets consist of: | | |
| Paid in capital | | $1,573,172,186 |
| Total accumulated earnings (loss) | | 2,562,138,804 |
| Net Assets | | $4,135,310,990 |
| Net Asset Value, offering price and redemption price per share ($4,135,310,990 ÷ 44,022,038 shares) | | $93.94 |
See accompanying notes which are an integral part of the financial statements.
Statement of Operations
| | | Year ended February 28, 2021 |
| Investment Income | | |
| Dividends | | $22,924,018 |
| Income from Fidelity Central Funds (including $1,346,410 from security lending) | | 1,446,119 |
| Total income | | 24,370,137 |
| Expenses | | |
| Management fee | $21,082,845 | |
| Transfer agent fees | 6,240,251 | |
| Accounting fees | 1,038,754 | |
| Custodian fees and expenses | 43,051 | |
| Independent trustees' fees and expenses | 22,386 | |
| Registration fees | 111,992 | |
| Audit | 46,222 | |
| Legal | 6,008 | |
| Interest | 8,632 | |
| Miscellaneous | 76,942 | |
| Total expenses before reductions | 28,677,083 | |
| Expense reductions | (117,035) | |
| Total expenses after reductions | | 28,560,048 |
| Net investment income (loss) | | (4,189,911) |
| Realized and Unrealized Gain (Loss) | | |
| Net realized gain (loss) on: | | |
| Investment securities: | | |
| Unaffiliated issuers | 390,442,553 | |
| Fidelity Central Funds | 13,507 | |
| Foreign currency transactions | 55,182 | |
| Total net realized gain (loss) | | 390,511,242 |
| Change in net unrealized appreciation (depreciation) on: | | |
| Investment securities: | | |
| Unaffiliated issuers | 770,647,050 | |
| Unfunded commitments | (1,600,000) | |
| Assets and liabilities in foreign currencies | 44,266 | |
| Total change in net unrealized appreciation (depreciation) | | 769,091,316 |
| Net gain (loss) | | 1,159,602,558 |
| Net increase (decrease) in net assets resulting from operations | | $1,155,412,647 |
See accompanying notes which are an integral part of the financial statements.
Statement of Changes in Net Assets
| | Year ended February 28, 2021 | Year ended February 29, 2020 |
| Increase (Decrease) in Net Assets | | |
| Operations | | |
| Net investment income (loss) | $(4,189,911) | $1,576,906 |
| Net realized gain (loss) | 390,511,242 | 102,599,566 |
| Change in net unrealized appreciation (depreciation) | 769,091,316 | 386,226,885 |
| Net increase (decrease) in net assets resulting from operations | 1,155,412,647 | 490,403,357 |
| Distributions to shareholders | (223,164,335) | (92,016,949) |
| Share transactions | | |
| Proceeds from sales of shares | 802,890,356 | 2,205,695,282 |
| Reinvestment of distributions | 210,531,333 | 87,345,122 |
| Cost of shares redeemed | (1,909,473,070) | (1,459,634,052) |
| Net increase (decrease) in net assets resulting from share transactions | (896,051,381) | 833,406,352 |
| Total increase (decrease) in net assets | 36,196,931 | 1,231,792,760 |
| Net Assets | | |
| Beginning of period | 4,099,114,059 | 2,867,321,299 |
| End of period | $4,135,310,990 | $4,099,114,059 |
| Other Information | | |
| Shares | | |
| Sold | 10,373,759 | 30,329,506 |
| Issued in reinvestment of distributions | 2,363,917 | 1,178,021 |
| Redeemed | (24,393,398) | (19,968,785) |
| Net increase (decrease) | (11,655,722) | 11,538,742 |
See accompanying notes which are an integral part of the financial statements.
Financial Highlights
IT Services Portfolio
| | | | | | |
| Years ended February 28, | 2021 | 2020 A | 2019 | 2018 | 2017 |
| Selected Per–Share Data | | | | | |
| Net asset value, beginning of period | $73.62 | $64.96 | $58.69 | $44.84 | $37.16 |
| Income from Investment Operations | | | | | |
| Net investment income (loss)B | (.09) | .03 | .04 | .04 | .13C |
| Net realized and unrealized gain (loss) | 25.34 | 10.36 | 8.92 | 15.50 | 7.68 |
| Total from investment operations | 25.25 | 10.39 | 8.96 | 15.54 | 7.81 |
| Distributions from net investment income | (.01) | (.03) | (.03) | (.02) | (.13) |
| Distributions from net realized gain | (4.93) | (1.70) | (2.66) | (1.67) | – |
| Total distributions | (4.93)D | (1.73) | (2.69) | (1.69) | (.13) |
| Redemption fees added to paid in capitalB | – | – | – | – | –E |
| Net asset value, end of period | $93.94 | $73.62 | $64.96 | $58.69 | $44.84 |
| Total ReturnF | 34.67% | 15.99% | 16.04% | 35.17% | 21.05% |
| Ratios to Average Net AssetsG,H | | | | | |
| Expenses before reductions | .72% | .73% | .74% | .77% | .79% |
| Expenses net of fee waivers, if any | .72% | .73% | .74% | .77% | .79% |
| Expenses net of all reductions | .72% | .73% | .74% | .77% | .79% |
| Net investment income (loss) | (.11)% | .04% | .06% | .08% | .33%C |
| Supplemental Data | | | | | |
| Net assets, end of period (000 omitted) | $4,135,311 | $4,099,114 | $2,867,321 | $2,284,152 | $1,663,802 |
| Portfolio turnover rateI | 31% | 24% | 26% | 26% | 27% |
A For the year ended February 29.
B Calculated based on average shares outstanding during the period.
C Net investment income per share reflects one or more large, non-recurring dividend which amounted to $.13 per share. Excluding such non-recurring dividend, the ratio of net investment income (loss) to average net assets would have been .02%.
D Total distributions per share do not sum due to rounding.
E Amount represents less than $.005 per share.
F Total returns would have been lower if certain expenses had not been reduced during the applicable periods shown.
G Fees and expenses of any underlying mutual funds or exchange-traded funds (ETFs) are not included in the Fund's expense ratio. The Fund indirectly bears its proportionate share of these expenses. For additional expense information related to investments in Fidelity Central Funds, please refer to the "Investments in Fidelity Central Funds" note found in the Notes to Financial Statements section of the most recent Annual or Semi-Annual report.
H Expense ratios reflect operating expenses of the class. Expenses before reductions do not reflect amounts reimbursed, waived, or reduced through arrangements with the investment advisor, brokerage services, or other offset arrangements, if applicable, and do not represent the amount paid by the class during periods when reimbursements, waivers or reductions occur.
I Amount does not include the portfolio activity of any underlying mutual funds or exchange-traded funds (ETFs).
See accompanying notes which are an integral part of the financial statements.
Semiconductors Portfolio
Performance: The Bottom Line
Average annual total return reflects the change in the value of an investment, assuming reinvestment of distributions from dividend income and capital gains (the profits earned upon the sale of securities that have grown in value, if any) and assuming a constant rate of performance each year. The hypothetical investment and the average annual total returns do not reflect the deduction of taxes that a shareholder would pay on fund distributions or the redemption of fund shares. During periods of reimbursement by Fidelity, a fund’s total return will be greater than it would be had the reimbursement not occurred. How a fund did yesterday is no guarantee of how it will do tomorrow.
Average Annual Total Returns
| For the periods ended February 28, 2021 | Past 1 year | Past 5 years | Past 10 years |
| Semiconductors Portfolio | 70.47% | 34.39% | 21.23% |
$10,000 Over 10 Years
Let's say hypothetically that $10,000 was invested in Semiconductors Portfolio on February 28, 2011.
The chart shows how the value of your investment would have changed, and also shows how the S&P 500® Index performed over the same period.
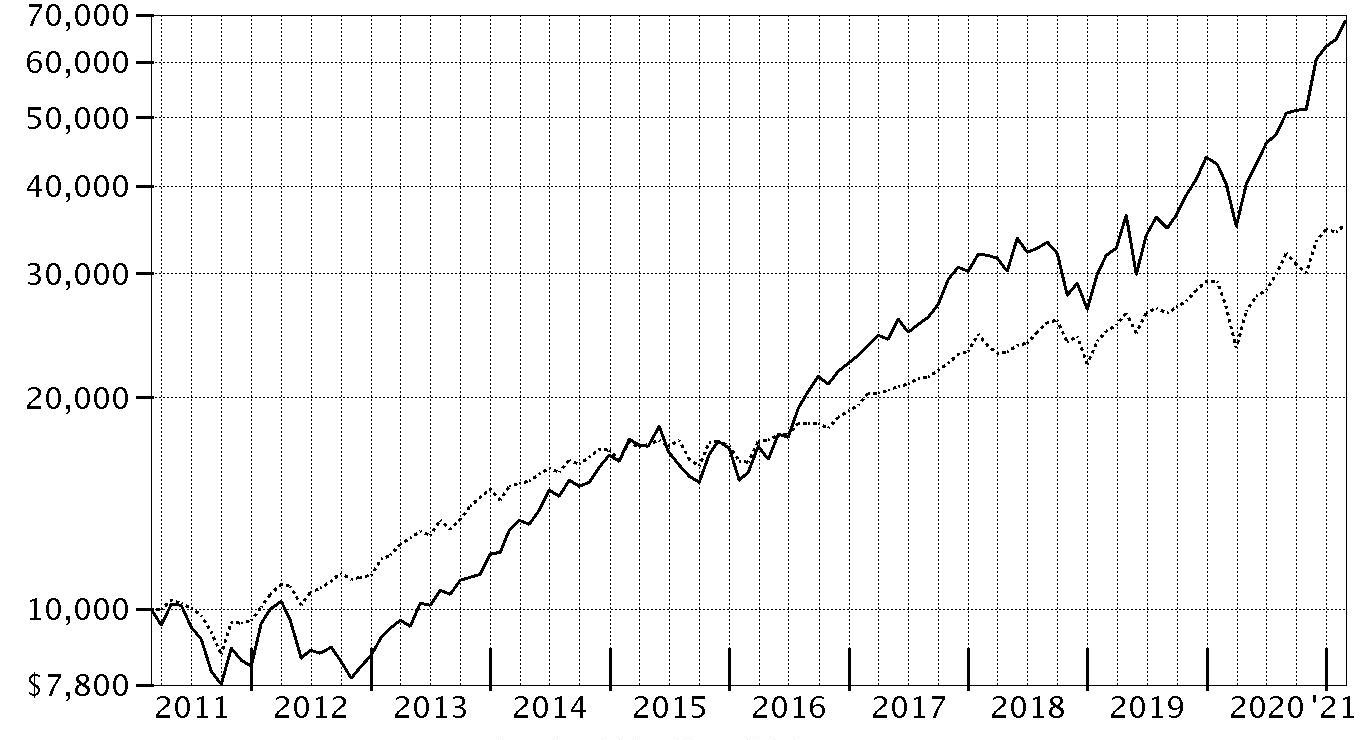
| Period Ending Values |
| $68,565 | Semiconductors Portfolio |
| $35,259 | S&P 500® Index |
Semiconductors Portfolio
Management's Discussion of Fund Performance
Market Recap: The S&P 500
® index gained 31.29% for the 12 months ending February 28, 2021, a volatile but productive period for U.S. risk assets. The early-2020 outbreak and spread of COVID-19 resulted in stocks suffering one of the quickest declines on record, through March 23, followed by a historic rebound that included the index closing 2020 at an all-time high and gaining modest ground in the first two months of the new year. The crisis and containment efforts caused broad contraction in economic activity, along with extreme uncertainty and dislocation in financial markets. A rapid and expansive U.S. monetary/fiscal-policy response partially offset the economic disruption and fueled the market surge, as did resilient corporate earnings. The rally slowed in September, when stocks began a two-month retreat amid Congress’s inability to reach a deal on additional fiscal stimulus, as well as concerns about election uncertainty, indications the U.S. economic recovery could be slowing and a new wave of COVID-19 cases. A shift in momentum began in October and accelerated following the U.S. elections, with the approval of three breakthrough COVID-19 vaccines and prospects for additional government stimulus fueling the “reflation trade” through February 28. By sector for the full 12 months, information technology (+50%) and consumer discretionary (+43%) led all gainers. Materials (+42%) and communication services (+37%) also stood out. In contrast, the defensive utilities (-3%) and real estate sectors (+5%) notably lagged.
Comments from Portfolio Manager Adam Benjamin: For the fiscal year ending February 28, 2021, the fund gained 70.47%, underperforming the 73.66% gain of the MSCI US IMI Semiconductors & Semiconductor Equipment 25/50 Index, but outperforming the broad-based S&P 500
® index. Versus the industry index, subindustry positioning was the primary detractor, especially an out-of-index stake in the electronic manufacturing services group. Non-index exposure to technology hardware, storage & peripherals and a sizable underweighting in semiconductor equipment also hurt. Our lighter-than-index stake in Advanced Micro Devices, a position we established this period, was the fund's biggest individual relative detractor, as the stock gained 86% the past year. The fund's non-index stake in CommScope Holding, a position not held at period end, returned -20%. Another key detractor was our out-of-index position in Western Digital (-19%), a position not held at period end. In contrast, the biggest contributor to performance versus the industry index was our stock picking in semiconductors. Security selection in semiconductor equipment and a non-index allocation to electronic components also boosted the fund's relative result. The biggest individual relative contributor was an underweight position in Intel (+12%), which was among the fund's largest holdings. Our second-largest contributor this period was Enphase Energy, a position we established this period. The fund's investment in Enphase Energy gained about 308% the past 12 months and boosted relative performance. Another notable relative contributor was an outsized stake in Marvell Technology Group (+126%), which was one of the fund's biggest holdings. Notable changes in positioning include increased exposure to the semiconductor equipment subindustry.
The views expressed above reflect those of the portfolio manager(s) only through the end of the period as stated on the cover of this report and do not necessarily represent the views of Fidelity or any other person in the Fidelity organization. Any such views are subject to change at any time based upon market or other conditions and Fidelity disclaims any responsibility to update such views. These views may not be relied on as investment advice and, because investment decisions for a Fidelity fund are based on numerous factors, may not be relied on as an indication of trading intent on behalf of any Fidelity fund.
Note to shareholders: On July 1, 2020, Adam Benjamin became sole manager of the fund after having served as co-manager with Steve Barwikowski since March 2020.
Semiconductors Portfolio
Investment Summary (Unaudited)
Top Ten Stocks as of February 28, 2021
| | % of fund's net assets |
| NVIDIA Corp. | 18.8 |
| Micron Technology, Inc. | 7.3 |
| NXP Semiconductors NV | 6.7 |
| Intel Corp. | 5.8 |
| Lam Research Corp. | 5.4 |
| Qualcomm, Inc. | 5.2 |
| Marvell Technology Group Ltd. | 5.0 |
| ON Semiconductor Corp. | 4.9 |
| Microchip Technology, Inc. | 4.9 |
| Broadcom, Inc. | 4.6 |
| | 68.6 |
Top Industries (% of fund's net assets)
| As of February 28, 2021 |
| | Semiconductors & Semiconductor Equipment | 95.7% |
| | Electronic Equipment & Components | 2.7% |
| | Technology Hardware, Storage & Peripherals | 0.8% |
| | Software | 0.5% |
| | All Others* | 0.3% |

* Includes short-term investments and net other assets (liabilities).
Semiconductors Portfolio
Schedule of Investments February 28, 2021
Showing Percentage of Net Assets
| Common Stocks - 99.6% | | | |
| | | Shares | Value |
| Electronic Equipment & Components - 2.7% | | | |
| Electronic Components - 0.3% | | | |
| II-VI, Inc. (a)(b) | | 175,000 | $14,752,500 |
| Electronic Manufacturing Services - 2.4% | | | |
| Flex Ltd. (a) | | 1,908,900 | 34,722,891 |
| Jabil, Inc. | | 1,702,758 | 73,508,063 |
| TTM Technologies, Inc. (a) | | 2,049,730 | 28,942,188 |
| | | | 137,173,142 |
|
| TOTAL ELECTRONIC EQUIPMENT & COMPONENTS | | | 151,925,642 |
|
| Semiconductors & Semiconductor Equipment - 95.6% | | | |
| Semiconductor Equipment - 13.7% | | | |
| Advanced Energy Industries, Inc. | | 388,464 | 40,575,065 |
| Applied Materials, Inc. | | 1,282,500 | 151,578,675 |
| Enphase Energy, Inc. (a) | | 285,400 | 50,247,524 |
| KLA Corp. | | 301,513 | 93,839,891 |
| Lam Research Corp. | | 549,973 | 311,939,186 |
| Nova Measuring Instruments Ltd. (a) | | 246,746 | 20,726,664 |
| Teradyne, Inc. | | 917,922 | 118,053,948 |
| | | | 786,960,953 |
| Semiconductors - 81.9% | | | |
| Advanced Micro Devices, Inc. (a) | | 2,227,000 | 188,203,770 |
| Alpha & Omega Semiconductor Ltd. (a) | | 742,296 | 26,121,396 |
| Ambarella, Inc. (a) | | 101,700 | 11,440,233 |
| Analog Devices, Inc. | | 455,296 | 70,944,223 |
| ASE Technology Holding Co. Ltd. ADR | | 1,396,600 | 10,572,262 |
| Broadcom, Inc. | | 555,550 | 261,036,279 |
| Cirrus Logic, Inc. (a) | | 1,311,560 | 107,259,377 |
| Dialog Semiconductor PLC (a) | | 172,700 | 13,419,104 |
| Diodes, Inc. (a) | | 729,300 | 57,264,636 |
| Inphi Corp. (a) | | 391,700 | 64,469,903 |
| Intel Corp. | | 5,476,642 | 332,870,301 |
| MACOM Technology Solutions Holdings, Inc. (a) | | 715,100 | 46,016,685 |
| Marvell Technology Group Ltd. | | 5,870,605 | 283,432,809 |
| MaxLinear, Inc. Class A (a)(b) | | 817,731 | 32,521,162 |
| Microchip Technology, Inc. | | 1,836,737 | 280,341,168 |
| Micron Technology, Inc. (a) | | 4,546,760 | 416,164,943 |
| Monolithic Power Systems, Inc. | | 16,000 | 5,992,320 |
| NVIDIA Corp. | | 1,963,092 | 1,076,913,008 |
| NXP Semiconductors NV | | 2,097,688 | 382,932,944 |
| ON Semiconductor Corp. (a) | | 6,976,640 | 280,949,293 |
| Qualcomm, Inc. | | 2,202,688 | 299,984,079 |
| Semtech Corp. (a) | | 377,500 | 27,674,525 |
| SMART Global Holdings, Inc. (a)(b) | | 641,000 | 29,928,290 |
| Synaptics, Inc. (a) | | 266,364 | 35,700,767 |
| Texas Instruments, Inc. | | 1,016,100 | 175,043,547 |
| Universal Display Corp. | | 266,887 | 56,497,309 |
| Xilinx, Inc. | | 829,766 | 108,118,510 |
| | | | 4,681,812,843 |
|
| TOTAL SEMICONDUCTORS & SEMICONDUCTOR EQUIPMENT | | | 5,468,773,796 |
|
| Software - 0.5% | | | |
| Application Software - 0.5% | | | |
| Cadence Design Systems, Inc. (a) | | 207,300 | 29,247,957 |
| Technology Hardware, Storage & Peripherals - 0.8% | | | |
| Technology Hardware, Storage & Peripherals - 0.8% | | | |
| Samsung Electronics Co. Ltd. | | 603,870 | 44,184,630 |
| TOTAL COMMON STOCKS | | | |
| (Cost $2,977,891,468) | | | 5,694,132,025 |
| | | Principal Amount | Value |
|
| Convertible Bonds - 0.1% | | | |
| Semiconductors & Semiconductor Equipment - 0.1% | | | |
| Semiconductors - 0.1% | | | |
| SMART Global Holdings, Inc. 2.25% 2/15/26 | | | |
| (Cost $3,590,000) | | 3,590,000 | 4,801,474 |
| | | Shares | Value |
|
| Money Market Funds - 1.5% | | | |
| Fidelity Cash Central Fund 0.07% (c) | | 71,814,583 | 71,828,946 |
| Fidelity Securities Lending Cash Central Fund 0.08% (c)(d) | | 17,129,441 | 17,131,154 |
| TOTAL MONEY MARKET FUNDS | | | |
| (Cost $88,960,100) | | | 88,960,100 |
| TOTAL INVESTMENT IN SECURITIES - 101.2% | | | |
| (Cost $3,070,441,568) | | | 5,787,893,599 |
| NET OTHER ASSETS (LIABILITIES) - (1.2)% | | | (70,107,466) |
| NET ASSETS - 100% | | | $5,717,786,133 |
Legend
(a) Non-income producing
(b) Security or a portion of the security is on loan at period end.
(c) Affiliated fund that is generally available only to investment companies and other accounts managed by Fidelity Investments. The rate quoted is the annualized seven-day yield of the fund at period end. A complete unaudited listing of the fund's holdings as of its most recent quarter end is available upon request. In addition, each Fidelity Central Fund's financial statements, which are not covered by the Fund's Report of Independent Registered Public Accounting Firm, are available on the SEC's website or upon request.
(d) Investment made with cash collateral received from securities on loan.
Affiliated Central Funds
Information regarding fiscal year to date income earned by the Fund from investments in Fidelity Central Funds is as follows:
| Fund | Income earned |
| Fidelity Cash Central Fund | $110,561 |
| Fidelity Securities Lending Cash Central Fund | 57,548 |
| Total | $168,109 |
Amounts in the income column in the above table include any capital gain distributions from underlying funds, which are presented in the corresponding line-item in the Statement of Operations, if applicable. Amount for Fidelity Securities Lending Cash Central Fund represents the income earned on investing cash collateral, less rebates paid to borrowers and any lending agent fees associated with the loan, plus any premium payments received for lending certain types of securities.
Other Affiliated Issuers
An affiliated company is a company in which the Fund has ownership of at least 5% of the voting securities. Fiscal year to date transactions with companies which are or were affiliates are as follows:
| Affiliate | Value, beginning of period | Purchases | Sales Proceeds | Dividend Income | Realized Gain (loss) | Change in Unrealized appreciation (depreciation) | Value, end of period |
| CommScope Holding Co., Inc. | $128,371,095 | $2,078,593 | $108,665,891 | $-- | $(48,018,179) | $26,234,382 | $-- |
| Total | $128,371,095 | $2,078,593 | $108,665,891 | $-- | $(48,018,179) | $26,234,382 | $-- |
Investment Valuation
The following is a summary of the inputs used, as of February 28, 2021, involving the Fund's assets and liabilities carried at fair value. The inputs or methodology used for valuing securities may not be an indication of the risk associated with investing in those securities. For more information on valuation inputs, and their aggregation into the levels used below, please refer to the Investment Valuation section in the accompanying Notes to Financial Statements.
| | Valuation Inputs at Reporting Date: |
| Description | Total | Level 1 | Level 2 | Level 3 |
| Investments in Securities: | | | | |
| Common Stocks | $5,694,132,025 | $5,694,132,025 | $-- | $-- |
| Convertible Bonds | 4,801,474 | -- | 4,801,474 | -- |
| Money Market Funds | 88,960,100 | 88,960,100 | -- | -- |
| Total Investments in Securities: | $5,787,893,599 | $5,783,092,125 | $4,801,474 | $-- |
Other Information
Distribution of investments by country or territory of incorporation, as a percentage of Total Net Assets, is as follows (Unaudited):
| United States of America | 85.3% |
| Netherlands | 6.7% |
| Bermuda | 5.5% |
| Others (Individually Less Than 1%) | 2.5% |
| | 100.0% |
See accompanying notes which are an integral part of the financial statements.
Semiconductors Portfolio
Financial Statements
Statement of Assets and Liabilities
| | | February 28, 2021 |
| Assets | | |
Investment in securities, at value (including securities loaned of $16,866,585) — See accompanying schedule:
Unaffiliated issuers (cost $2,981,481,468) | $5,698,933,499 | |
| Fidelity Central Funds (cost $88,960,100) | 88,960,100 | |
| Total Investment in Securities (cost $3,070,441,568) | | $5,787,893,599 |
| Receivable for investments sold | | 17,462,110 |
| Receivable for fund shares sold | | 11,600,253 |
| Dividends receivable | | 4,314,837 |
| Interest receivable | | 3,590 |
| Distributions receivable from Fidelity Central Funds | | 9,563 |
| Prepaid expenses | | 21,684 |
| Other receivables | | 265,091 |
| Total assets | | 5,821,570,727 |
| Liabilities | | |
| Payable for investments purchased | $79,540,296 | |
| Payable for fund shares redeemed | 3,680,926 | |
| Accrued management fee | 2,522,183 | |
| Other affiliated payables | 663,287 | |
| Other payables and accrued expenses | 259,627 | |
| Collateral on securities loaned | 17,118,275 | |
| Total liabilities | | 103,784,594 |
| Net Assets | | $5,717,786,133 |
| Net Assets consist of: | | |
| Paid in capital | | $2,773,097,498 |
| Total accumulated earnings (loss) | | 2,944,688,635 |
| Net Assets | | $5,717,786,133 |
| Net Asset Value, offering price and redemption price per share ($5,717,786,133 ÷ 325,023,708 shares) | | $17.59 |
See accompanying notes which are an integral part of the financial statements.
Statement of Operations
| | | Year ended February 28, 2021 |
| Investment Income | | |
| Dividends | | $52,179,258 |
| Interest | | 81,531 |
| Income from Fidelity Central Funds (including $57,548 from security lending) | | 168,109 |
| Total income | | 52,428,898 |
| Expenses | | |
| Management fee | $22,856,663 | |
| Transfer agent fees | 5,940,291 | |
| Accounting fees | 1,044,074 | |
| Custodian fees and expenses | 37,092 | |
| Independent trustees' fees and expenses | 22,712 | |
| Registration fees | 145,368 | |
| Audit | 41,179 | |
| Legal | 5,670 | |
| Interest | 5,523 | |
| Miscellaneous | 64,333 | |
| Total expenses before reductions | 30,162,905 | |
| Expense reductions | (423,314) | |
| Total expenses after reductions | | 29,739,591 |
| Net investment income (loss) | | 22,689,307 |
| Realized and Unrealized Gain (Loss) | | |
| Net realized gain (loss) on: | | |
| Investment securities: | | |
| Unaffiliated issuers | 449,419,118 | |
| Fidelity Central Funds | 11,904 | |
| Other affiliated issuers | (48,018,179) | |
| Foreign currency transactions | 188,476 | |
| Total net realized gain (loss) | | 401,601,319 |
| Change in net unrealized appreciation (depreciation) on: | | |
| Investment securities: | | |
| Unaffiliated issuers | 1,879,980,553 | |
| Fidelity Central Funds | (281) | |
| Other affiliated issuers | 26,234,382 | |
| Assets and liabilities in foreign currencies | (102,962) | |
| Total change in net unrealized appreciation (depreciation) | | 1,906,111,692 |
| Net gain (loss) | | 2,307,713,011 |
| Net increase (decrease) in net assets resulting from operations | | $2,330,402,318 |
See accompanying notes which are an integral part of the financial statements.
Statement of Changes in Net Assets
| | Year ended February 28, 2021 | Year ended February 29, 2020 |
| Increase (Decrease) in Net Assets | | |
| Operations | | |
| Net investment income (loss) | $22,689,307 | $30,185,284 |
| Net realized gain (loss) | 401,601,319 | 423,622,859 |
| Change in net unrealized appreciation (depreciation) | 1,906,111,692 | 300,175,424 |
| Net increase (decrease) in net assets resulting from operations | 2,330,402,318 | 753,983,567 |
| Distributions to shareholders | (410,556,842) | (137,447,610) |
| Share transactions | | |
| Proceeds from sales of shares | 950,485,975 | 1,132,808,025 |
| Reinvestment of distributions | 392,773,812 | 131,251,931 |
| Cost of shares redeemed | (1,323,875,912) | (1,154,544,829) |
| Net increase (decrease) in net assets resulting from share transactions | 19,383,875 | 109,515,127 |
| Total increase (decrease) in net assets | 1,939,229,351 | 726,051,084 |
| Net Assets | | |
| Beginning of period | 3,778,556,782 | 3,052,505,698 |
| End of period | $5,717,786,133 | $3,778,556,782 |
| Other Information | | |
| Shares | | |
| Sold | 69,181,684 | 100,264,558 |
| Issued in reinvestment of distributions | 32,498,838 | 10,533,281 |
| Redeemed | (106,078,454) | (105,721,572) |
| Net increase (decrease) | (4,397,932) | 5,076,267 |
See accompanying notes which are an integral part of the financial statements.
Financial Highlights
Semiconductors Portfolio
| | | | | | |
| Years ended February 28, | 2021 | 2020 A | 2019 B | 2018 B | 2017 B |
| Selected Per–Share Data | | | | | |
| Net asset value, beginning of period | $11.47 | $9.41 | $11.77 | $10.12 | $6.99 |
| Income from Investment Operations | | | | | |
| Net investment income (loss)C | .07 | .09 | .10 | .05 | .10 |
| Net realized and unrealized gain (loss) | 7.37 | 2.39 | (.35) | 3.24 | 3.40 |
| Total from investment operations | 7.44 | 2.48 | (.25) | 3.29 | 3.50 |
| Distributions from net investment income | (.08) | (.10) | (.06) | (.12) | (.07) |
| Distributions from net realized gain | (1.24) | (.33) | (2.05) | (1.52) | (.30) |
| Total distributions | (1.32) | (.42)D | (2.11) | (1.64) | (.37) |
| Redemption fees added to paid in capitalC | – | – | – | –E | –E |
| Net asset value, end of period | $17.59 | $11.47 | $9.41 | $11.77 | $10.12 |
| Total ReturnF | 70.47% | 26.01% | .19% | 34.20% | 51.79% |
| Ratios to Average Net AssetsG,H | | | | | |
| Expenses before reductions | .70% | .72% | .73% | .75% | .77% |
| Expenses net of fee waivers, if any | .70% | .72% | .73% | .75% | .77% |
| Expenses net of all reductions | .69% | .71% | .72% | .74% | .75% |
| Net investment income (loss) | .53% | .85% | .92% | .47% | 1.19% |
| Supplemental Data | | | | | |
| Net assets, end of period (000 omitted) | $5,717,786 | $3,778,557 | $3,052,506 | $3,652,565 | $3,012,372 |
| Portfolio turnover rateI | 87% | 114% | 130% | 110% | 110% |
A For the year ended February 29.
B Per share amounts have been adjusted to reflect the impact of the 10 for 1 share split that occurred on May 11, 2018.
C Calculated based on average shares outstanding during the period.
D Total distributions per share do not sum due to rounding.
E Amount represents less than $.005 per share.
F Total returns would have been lower if certain expenses had not been reduced during the applicable periods shown.
G Fees and expenses of any underlying mutual funds or exchange-traded funds (ETFs) are not included in the Fund's expense ratio. The Fund indirectly bears its proportionate share of these expenses. For additional expense information related to investments in Fidelity Central Funds, please refer to the "Investments in Fidelity Central Funds" note found in the Notes to Financial Statements section of the most recent Annual or Semi-Annual report.
H Expense ratios reflect operating expenses of the class. Expenses before reductions do not reflect amounts reimbursed, waived, or reduced through arrangements with the investment advisor, brokerage services, or other offset arrangements, if applicable, and do not represent the amount paid by the class during periods when reimbursements, waivers or reductions occur.
I Amount does not include the portfolio activity of any underlying mutual funds or exchange-traded funds (ETFs).
See accompanying notes which are an integral part of the financial statements.
Software and IT Services Portfolio
Performance: The Bottom Line
Average annual total return reflects the change in the value of an investment, assuming reinvestment of distributions from dividend income and capital gains (the profits earned upon the sale of securities that have grown in value, if any) and assuming a constant rate of performance each year. The hypothetical investment and the average annual total returns do not reflect the deduction of taxes that a shareholder would pay on fund distributions or the redemption of fund shares. During periods of reimbursement by Fidelity, a fund’s total return will be greater than it would be had the reimbursement not occurred. How a fund did yesterday is no guarantee of how it will do tomorrow.
Average Annual Total Returns
| For the periods ended February 28, 2021 | Past 1 year | Past 5 years | Past 10 years |
| Software and IT Services Portfolio | 45.80% | 28.74% | 21.01% |
$10,000 Over 10 Years
Let's say hypothetically that $10,000 was invested in Software and IT Services Portfolio on February 28, 2011.
The chart shows how the value of your investment would have changed, and also shows how the S&P 500® Index performed over the same period.
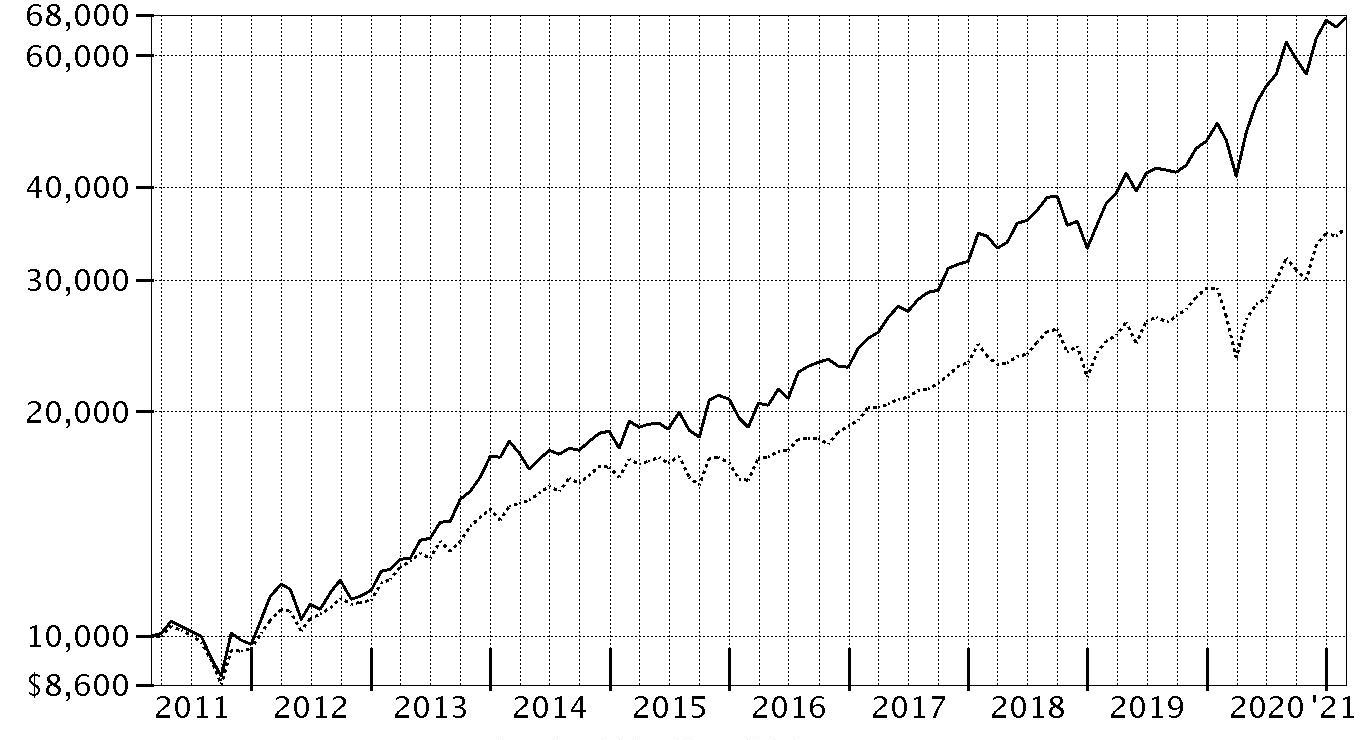
| Period Ending Values |
| $67,326 | Software and IT Services Portfolio |
| $35,259 | S&P 500® Index |
Software and IT Services Portfolio
Management's Discussion of Fund Performance
Market Recap: The S&P 500
® index gained 31.29% for the 12 months ending February 28, 2021, a volatile but productive period for U.S. risk assets. The early-2020 outbreak and spread of COVID-19 resulted in stocks suffering one of the quickest declines on record, through March 23, followed by a historic rebound that included the index closing 2020 at an all-time high and gaining modest ground in the first two months of the new year. The crisis and containment efforts caused broad contraction in economic activity, along with extreme uncertainty and dislocation in financial markets. A rapid and expansive U.S. monetary/fiscal-policy response partially offset the economic disruption and fueled the market surge, as did resilient corporate earnings. The rally slowed in September, when stocks began a two-month retreat amid Congress’s inability to reach a deal on additional fiscal stimulus, as well as concerns about election uncertainty, indications the U.S. economic recovery could be slowing and a new wave of COVID-19 cases. A shift in momentum began in October and accelerated following the U.S. elections, with the approval of three breakthrough COVID-19 vaccines and prospects for additional government stimulus fueling the “reflation trade” through February 28. By sector for the full 12 months, information technology (+50%) and consumer discretionary (+43%) led all gainers. Materials (+42%) and communication services (+37%) also stood out. In contrast, the defensive utilities (-3%) and real estate sectors (+5%) notably lagged.
Comments from Portfolio Manager Ali Khan: For the fiscal year ending February 28, 2021, the fund gained 45.80%, outperforming the 41.75% advance of the industry benchmark, the MSCI U.S. IMI Software & Services 25/50 Index, as well as the broad-based S&P 500
® index. The top contributor to performance versus the industry index was stock selection and an underweighting in data processing & outsourced services. Twilio, the fund's top individual relative contributor, rose 245% this period, and we reduced our position in the company. Also adding value was an underweighting in Fidelity National Information Services, which returned 0%. We decreased our stake this period. Another notable relative contributor was an overweighting in Hubspot (+189%). In contrast, the largest detractor from performance versus the industry benchmark were stock picks in systems software. Weak stock selection in internet & direct marketing retail and application software also detracted modestly from the fund's relative performance. Not owning Square, an index component that gained approximately 176%, was the largest individual relative detractor. Another notable relative detractor this period was avoiding Zoom Video Communications, an index component that gained 256%. Avoiding Trade Desk, an index component that gained about 180%, also hurt relative performance.
The views expressed above reflect those of the portfolio manager(s) only through the end of the period as stated on the cover of this report and do not necessarily represent the views of Fidelity or any other person in the Fidelity organization. Any such views are subject to change at any time based upon market or other conditions and Fidelity disclaims any responsibility to update such views. These views may not be relied on as investment advice and, because investment decisions for a Fidelity fund are based on numerous factors, may not be relied on as an indication of trading intent on behalf of any Fidelity fund.
Software and IT Services Portfolio
Investment Summary (Unaudited)
Top Ten Stocks as of February 28, 2021
| | % of fund's net assets |
| Microsoft Corp. | 24.7 |
| Visa, Inc. Class A | 6.3 |
| Adobe, Inc. | 5.5 |
| MasterCard, Inc. Class A | 5.4 |
| PayPal Holdings, Inc. | 5.3 |
| Salesforce.com, Inc. | 4.6 |
| Alphabet, Inc. Class A | 2.7 |
| Autodesk, Inc. | 2.3 |
| Cognizant Technology Solutions Corp. Class A | 2.1 |
| Oracle Corp. | 1.9 |
| | 60.8 |
Top Industries (% of fund's net assets)
| As of February 28, 2021 |
| | Software | 58.2% |
| | IT Services | 32.3% |
| | Interactive Media & Services | 4.4% |
| | Entertainment | 1.5% |
| | Internet & Direct Marketing Retail | 0.7% |
| | All Others* | 2.9% |

* Includes short-term investments and net other assets (liabilities).
Software and IT Services Portfolio
Schedule of Investments February 28, 2021
Showing Percentage of Net Assets
| Common Stocks - 97.7% | | | |
| | | Shares | Value |
| Electronic Equipment & Components - 0.1% | | | |
| Electronic Equipment & Instruments - 0.1% | | | |
| Trimble, Inc. (a) | | 109,000 | $8,081,260 |
| Entertainment - 1.5% | | | |
| Interactive Home Entertainment - 1.5% | | | |
| Activision Blizzard, Inc. | | 814,900 | 77,912,589 |
| Electronic Arts, Inc. | | 762,400 | 102,138,728 |
| | | | 180,051,317 |
| Interactive Media & Services - 4.4% | | | |
| Interactive Media & Services - 4.4% | | | |
| Alphabet, Inc. Class A (a) | | 155,300 | 314,002,623 |
| Facebook, Inc. Class A (a) | | 420,300 | 108,277,686 |
| Twitter, Inc. (a) | | 1,286,742 | 99,156,339 |
| | | | 521,436,648 |
| Internet & Direct Marketing Retail - 0.7% | | | |
| Internet & Direct Marketing Retail - 0.7% | | | |
| Alibaba Group Holding Ltd. sponsored ADR (a) | | 352,800 | 83,881,728 |
| IT Services - 32.3% | | | |
| Data Processing & Outsourced Services - 21.0% | | | |
| Automatic Data Processing, Inc. | | 257,100 | 44,740,542 |
| ExlService Holdings, Inc. (a) | | 630,700 | 53,369,834 |
| Fidelity National Information Services, Inc. | | 103,800 | 14,324,400 |
| Fiserv, Inc. (a) | | 272,400 | 31,426,788 |
| FleetCor Technologies, Inc. (a) | | 153,200 | 42,483,892 |
| Global Payments, Inc. | | 1,037,970 | 205,507,680 |
| MasterCard, Inc. Class A | | 1,808,700 | 640,008,495 |
| Paychex, Inc. | | 240,300 | 21,884,121 |
| PayPal Holdings, Inc. (a) | | 2,447,800 | 636,060,830 |
| StoneCo Ltd. Class A (a) | | 319,600 | 27,424,876 |
| Visa, Inc. Class A (b) | | 3,547,320 | 753,415,295 |
| WEX, Inc. (a) | | 114,700 | 23,897,745 |
| | | | 2,494,544,498 |
| Internet Services & Infrastructure - 3.5% | | | |
| Akamai Technologies, Inc. (a) | | 1,122,900 | 106,114,050 |
| GoDaddy, Inc. (a) | | 1,471,200 | 119,343,744 |
| MongoDB, Inc. Class A (a) | | 217,000 | 83,746,810 |
| Twilio, Inc. Class A (a) | | 273,600 | 107,491,968 |
| | | | 416,696,572 |
| IT Consulting & Other Services - 7.8% | | | |
| Accenture PLC Class A | | 699,500 | 175,504,550 |
| CACI International, Inc. Class A (a) | | 88,700 | 19,632,858 |
| Capgemini SA | | 948,500 | 152,378,547 |
| Cognizant Technology Solutions Corp. Class A | | 3,475,800 | 255,401,784 |
| DXC Technology Co. | | 747,400 | 18,849,428 |
| Gartner, Inc. (a) | | 700,341 | 125,389,053 |
| IBM Corp. | | 1,429,600 | 170,022,328 |
| Liveramp Holdings, Inc. (a) | | 265,300 | 16,756,348 |
| | | | 933,934,896 |
|
| TOTAL IT SERVICES | | | 3,845,175,966 |
|
| Media - 0.2% | | | |
| Publishing - 0.2% | | | |
| The New York Times Co. Class A | | 520,700 | 26,644,219 |
| Road & Rail - 0.3% | | | |
| Trucking - 0.3% | | | |
| Uber Technologies, Inc. (a) | | 657,600 | 34,030,800 |
| Software - 58.2% | | | |
| Application Software - 27.3% | | | |
| Adobe, Inc. (a) | | 1,415,000 | 650,433,050 |
| Alteryx, Inc. Class A (a)(b) | | 412,500 | 39,435,000 |
| Anaplan, Inc. (a) | | 2,236,800 | 145,369,632 |
| Aspen Technology, Inc. (a) | | 486,100 | 73,162,911 |
| Autodesk, Inc. (a) | | 997,400 | 275,282,400 |
| Blackbaud, Inc. | | 656,700 | 45,194,094 |
| Ceridian HCM Holding, Inc. (a) | | 691,300 | 61,981,958 |
| Citrix Systems, Inc. | | 459,107 | 61,327,513 |
| Constellation Software, Inc. | | 27,200 | 35,217,652 |
| Dropbox, Inc. Class A (a) | | 428,300 | 9,656,024 |
| Elastic NV (a) | | 599,200 | 80,526,488 |
| HubSpot, Inc. (a) | | 234,300 | 120,664,500 |
| Intuit, Inc. | | 263,800 | 102,918,932 |
| Micro Focus International PLC | | 1,765,964 | 10,367,682 |
| Mimecast Ltd. (a) | | 789,400 | 33,849,472 |
| New Relic, Inc. (a) | | 660,800 | 40,401,312 |
| Pluralsight, Inc. (a) | | 4,730,200 | 97,394,818 |
| PTC, Inc. (a) | | 934,400 | 127,956,736 |
| RealPage, Inc. (a) | | 1,127,300 | 97,827,094 |
| Salesforce.com, Inc. (a) | | 2,547,526 | 551,539,379 |
| SAP SE | | 73,900 | 9,140,445 |
| Slack Technologies, Inc. Class A (a) | | 4,520,080 | 185,006,874 |
| Smartsheet, Inc. (a) | | 417,600 | 28,918,800 |
| SVMK, Inc. (a) | | 850,700 | 15,840,034 |
| Topicus.Com, Inc. (a) | | 50,587 | 2,625,945 |
| Workday, Inc. Class A (a) | | 761,300 | 186,655,534 |
| Workiva, Inc. (a) | | 387,700 | 39,215,855 |
| Zendesk, Inc. (a) | | 809,000 | 118,227,260 |
| | | | 3,246,137,394 |
| Systems Software - 30.9% | | | |
| FireEye, Inc. (a) | | 3,422,300 | 66,118,836 |
| Microsoft Corp. | | 12,629,400 | 2,934,819,971 |
| NortonLifeLock, Inc. | | 4,586,800 | 89,488,468 |
| Oracle Corp. | | 3,589,127 | 231,534,583 |
| Palo Alto Networks, Inc. (a) | | 492,300 | 176,396,013 |
| Proofpoint, Inc. (a) | | 523,800 | 63,337,896 |
| Talend SA ADR (a) | | 604,685 | 30,675,670 |
| Tenable Holdings, Inc. (a) | | 1,617,600 | 66,176,016 |
| Zuora, Inc. (a) | | 1,366,700 | 20,404,831 |
| | | | 3,678,952,284 |
|
| TOTAL SOFTWARE | | | 6,925,089,678 |
|
| TOTAL COMMON STOCKS | | | |
| (Cost $5,366,031,629) | | | 11,624,391,616 |
|
| Money Market Funds - 5.2% | | | |
| Fidelity Cash Central Fund 0.07% (c) | | 285,588,012 | 285,645,129 |
| Fidelity Securities Lending Cash Central Fund 0.08% (c)(d) | | 327,986,575 | 328,019,373 |
| TOTAL MONEY MARKET FUNDS | | | |
| (Cost $613,660,657) | | | 613,664,502 |
| TOTAL INVESTMENT IN SECURITIES - 102.9% | | | |
| (Cost $5,979,692,286) | | | 12,238,056,118 |
| NET OTHER ASSETS (LIABILITIES) - (2.9)% | | | (343,512,360) |
| NET ASSETS - 100% | | | $11,894,543,758 |
Legend
(a) Non-income producing
(b) Security or a portion of the security is on loan at period end.
(c) Affiliated fund that is generally available only to investment companies and other accounts managed by Fidelity Investments. The rate quoted is the annualized seven-day yield of the fund at period end. A complete unaudited listing of the fund's holdings as of its most recent quarter end is available upon request. In addition, each Fidelity Central Fund's financial statements, which are not covered by the Fund's Report of Independent Registered Public Accounting Firm, are available on the SEC's website or upon request.
(d) Investment made with cash collateral received from securities on loan.
Affiliated Central Funds
Information regarding fiscal year to date income earned by the Fund from investments in Fidelity Central Funds is as follows:
| Fund | Income earned |
| Fidelity Cash Central Fund | $488,412 |
| Fidelity Securities Lending Cash Central Fund | 559,691 |
| Total | $1,048,103 |
Amounts in the income column in the above table include any capital gain distributions from underlying funds, which are presented in the corresponding line-item in the Statement of Operations, if applicable. Amount for Fidelity Securities Lending Cash Central Fund represents the income earned on investing cash collateral, less rebates paid to borrowers and any lending agent fees associated with the loan, plus any premium payments received for lending certain types of securities.
Investment Valuation
The following is a summary of the inputs used, as of February 28, 2021, involving the Fund's assets and liabilities carried at fair value. The inputs or methodology used for valuing securities may not be an indication of the risk associated with investing in those securities. For more information on valuation inputs, and their aggregation into the levels used below, please refer to the Investment Valuation section in the accompanying Notes to Financial Statements.
| | Valuation Inputs at Reporting Date: |
| Description | Total | Level 1 | Level 2 | Level 3 |
| Investments in Securities: | | | | |
| Common Stocks | $11,624,391,616 | $11,604,883,489 | $19,508,127 | $-- |
| Money Market Funds | 613,664,502 | 613,664,502 | -- | -- |
| Total Investments in Securities: | $12,238,056,118 | $12,218,547,991 | $19,508,127 | $-- |
See accompanying notes which are an integral part of the financial statements.
Software and IT Services Portfolio
Financial Statements
Statement of Assets and Liabilities
| | | February 28, 2021 |
| Assets | | |
Investment in securities, at value (including securities loaned of $319,187,280) — See accompanying schedule:
Unaffiliated issuers (cost $5,366,031,629) | $11,624,391,616 | |
| Fidelity Central Funds (cost $613,660,657) | 613,664,502 | |
| Total Investment in Securities (cost $5,979,692,286) | | $12,238,056,118 |
| Receivable for fund shares sold | | 6,130,369 |
| Dividends receivable | | 11,111,204 |
| Distributions receivable from Fidelity Central Funds | | 39,511 |
| Prepaid expenses | | 36,113 |
| Other receivables | | 487,753 |
| Total assets | | 12,255,861,068 |
| Liabilities | | |
| Payable for fund shares redeemed | $25,980,175 | |
| Accrued management fee | 5,435,022 | |
| Other affiliated payables | 1,477,364 | |
| Other payables and accrued expenses | 426,049 | |
| Collateral on securities loaned | 327,998,700 | |
| Total liabilities | | 361,317,310 |
| Net Assets | | $11,894,543,758 |
| Net Assets consist of: | | |
| Paid in capital | | $5,451,043,812 |
| Total accumulated earnings (loss) | | 6,443,499,946 |
| Net Assets | | $11,894,543,758 |
| Net Asset Value, offering price and redemption price per share ($11,894,543,758 ÷ 435,610,461 shares) | | $27.31 |
See accompanying notes which are an integral part of the financial statements.
Statement of Operations
| | | Year ended February 28, 2021 |
| Investment Income | | |
| Dividends | | $59,110,189 |
| Income from Fidelity Central Funds (including $559,691 from security lending) | | 1,048,103 |
| Total income | | 60,158,292 |
| Expenses | | |
| Management fee | $54,660,449 | |
| Transfer agent fees | 14,974,240 | |
| Accounting fees | 1,299,090 | |
| Custodian fees and expenses | 73,614 | |
| Independent trustees' fees and expenses | 53,650 | |
| Registration fees | 346,897 | |
| Audit | 46,285 | |
| Legal | 11,463 | |
| Miscellaneous | 144,072 | |
| Total expenses before reductions | 71,609,760 | |
| Expense reductions | (205,435) | |
| Total expenses after reductions | | 71,404,325 |
| Net investment income (loss) | | (11,246,033) |
| Realized and Unrealized Gain (Loss) | | |
| Net realized gain (loss) on: | | |
| Investment securities: | | |
| Unaffiliated issuers | 607,825,620 | |
| Fidelity Central Funds | (3,425) | |
| Foreign currency transactions | 10,713 | |
| Total net realized gain (loss) | | 607,832,908 |
| Change in net unrealized appreciation (depreciation) on: | | |
| Investment securities: | | |
| Unaffiliated issuers | 3,210,430,261 | |
| Assets and liabilities in foreign currencies | (2,124) | |
| Total change in net unrealized appreciation (depreciation) | | 3,210,428,137 |
| Net gain (loss) | | 3,818,261,045 |
| Net increase (decrease) in net assets resulting from operations | | $3,807,015,012 |
See accompanying notes which are an integral part of the financial statements.
Statement of Changes in Net Assets
| | Year ended February 28, 2021 | Year ended February 29, 2020 |
| Increase (Decrease) in Net Assets | | |
| Operations | | |
| Net investment income (loss) | $(11,246,033) | $72,771,236 |
| Net realized gain (loss) | 607,832,908 | 418,200,625 |
| Change in net unrealized appreciation (depreciation) | 3,210,428,137 | 879,024,590 |
| Net increase (decrease) in net assets resulting from operations | 3,807,015,012 | 1,369,996,451 |
| Distributions to shareholders | (582,570,452) | (906,376,597) |
| Share transactions | | |
| Proceeds from sales of shares | 3,371,109,496 | 1,845,099,056 |
| Reinvestment of distributions | 551,671,834 | 859,465,256 |
| Cost of shares redeemed | (3,284,592,962) | (1,677,168,985) |
| Net increase (decrease) in net assets resulting from share transactions | 638,188,368 | 1,027,395,327 |
| Total increase (decrease) in net assets | 3,862,632,928 | 1,491,015,181 |
| Net Assets | | |
| Beginning of period | 8,031,910,830 | 6,540,895,649 |
| End of period | $11,894,543,758 | $8,031,910,830 |
| Other Information | | |
| Shares | | |
| Sold | 150,289,904 | 94,168,380 |
| Issued in reinvestment of distributions | 24,317,272 | 46,835,753 |
| Redeemed | (142,668,627) | (86,927,730) |
| Net increase (decrease) | 31,938,549 | 54,076,403 |
See accompanying notes which are an integral part of the financial statements.
Financial Highlights
Software and IT Services Portfolio
| | | | | | |
| Years ended February 28, | 2021 | 2020 A | 2019 B | 2018 B | 2017 B |
| Selected Per–Share Data | | | | | |
| Net asset value, beginning of period | $19.90 | $18.71 | $17.89 | $14.09 | $11.11 |
| Income from Investment Operations | | | | | |
| Net investment income (loss)C | (.03) | .19D | .02 | (.02) | (.01) |
| Net realized and unrealized gain (loss) | 8.82 | 3.52 | 1.81 | 5.01 | 3.50 |
| Total from investment operations | 8.79 | 3.71 | 1.83 | 4.99 | 3.49 |
| Distributions from net investment income | (.15) | (.05) | (.01) | – | (.01) |
| Distributions from net realized gain | (1.23) | (2.47) | (1.00) | (1.19) | (.50) |
| Total distributions | (1.38) | (2.52) | (1.01) | (1.19) | (.51) |
| Redemption fees added to paid in capitalC | – | – | – | – | –E |
| Net asset value, end of period | $27.31 | $19.90 | $18.71 | $17.89 | $14.09 |
| Total ReturnF | 45.80% | 21.33% | 10.90% | 36.76% | 31.83% |
| Ratios to Average Net AssetsG,H | | | | | |
| Expenses before reductions | .70% | .70% | .72% | .73% | .76% |
| Expenses net of fee waivers, if any | .70% | .70% | .72% | .73% | .76% |
| Expenses net of all reductions | .69% | .70% | .71% | .73% | .75% |
| Net investment income (loss) | (.11)% | .98%D | .10% | (.09)% | (.11)% |
| Supplemental Data | | | | | |
| Net assets, end of period (000 omitted) | $11,894,544 | $8,031,911 | $6,540,896 | $5,539,357 | $4,155,435 |
| Portfolio turnover rateI | 22% | 23% | 48% | 31% | 44% |
A For the year ended February 29.
B Per share amounts have been adjusted to reflect the impact of the 10 for 1 share split that occurred on May 11, 2018.
C Calculated based on average shares outstanding during the period.
D Net investment income per share reflects one or more large, non-recurring dividend(s) which amounted to $.15 per share. Excluding such non-recurring dividend(s), the ratio of net investment income (loss) to average net assets would have been .22%.
E Amount represents less than $.005 per share.
F Total returns would have been lower if certain expenses had not been reduced during the applicable periods shown.
G Fees and expenses of any underlying mutual funds or exchange-traded funds (ETFs) are not included in the Fund's expense ratio. The Fund indirectly bears its proportionate share of these expenses. For additional expense information related to investments in Fidelity Central Funds, please refer to the "Investments in Fidelity Central Funds" note found in the Notes to Financial Statements section of the most recent Annual or Semi-Annual report.
H Expense ratios reflect operating expenses of the class. Expenses before reductions do not reflect amounts reimbursed, waived, or reduced through arrangements with the investment advisor, brokerage services, or other offset arrangements, if applicable, and do not represent the amount paid by the class during periods when reimbursements, waivers or reductions occur.
I Amount does not include the portfolio activity of any underlying mutual funds or exchange-traded funds (ETFs).
See accompanying notes which are an integral part of the financial statements.
Technology Portfolio
Performance: The Bottom Line
Average annual total return reflects the change in the value of an investment, assuming reinvestment of distributions from dividend income and capital gains (the profits earned upon the sale of securities that have grown in value, if any) and assuming a constant rate of performance each year. The hypothetical investment and the average annual total returns do not reflect the deduction of taxes that a shareholder would pay on fund distributions or the redemption of fund shares. During periods of reimbursement by Fidelity, a fund’s total return will be greater than it would be had the reimbursement not occurred. How a fund did yesterday is no guarantee of how it will do tomorrow.
Average Annual Total Returns
| For the periods ended February 28, 2021 | Past 1 year | Past 5 years | Past 10 years |
| Technology Portfolio | 69.87% | 33.55% | 19.64% |
$10,000 Over 10 Years
Let's say hypothetically that $10,000 was invested in Technology Portfolio on February 28, 2011.
The chart shows how the value of your investment would have changed, and also shows how the S&P 500® Index performed over the same period.
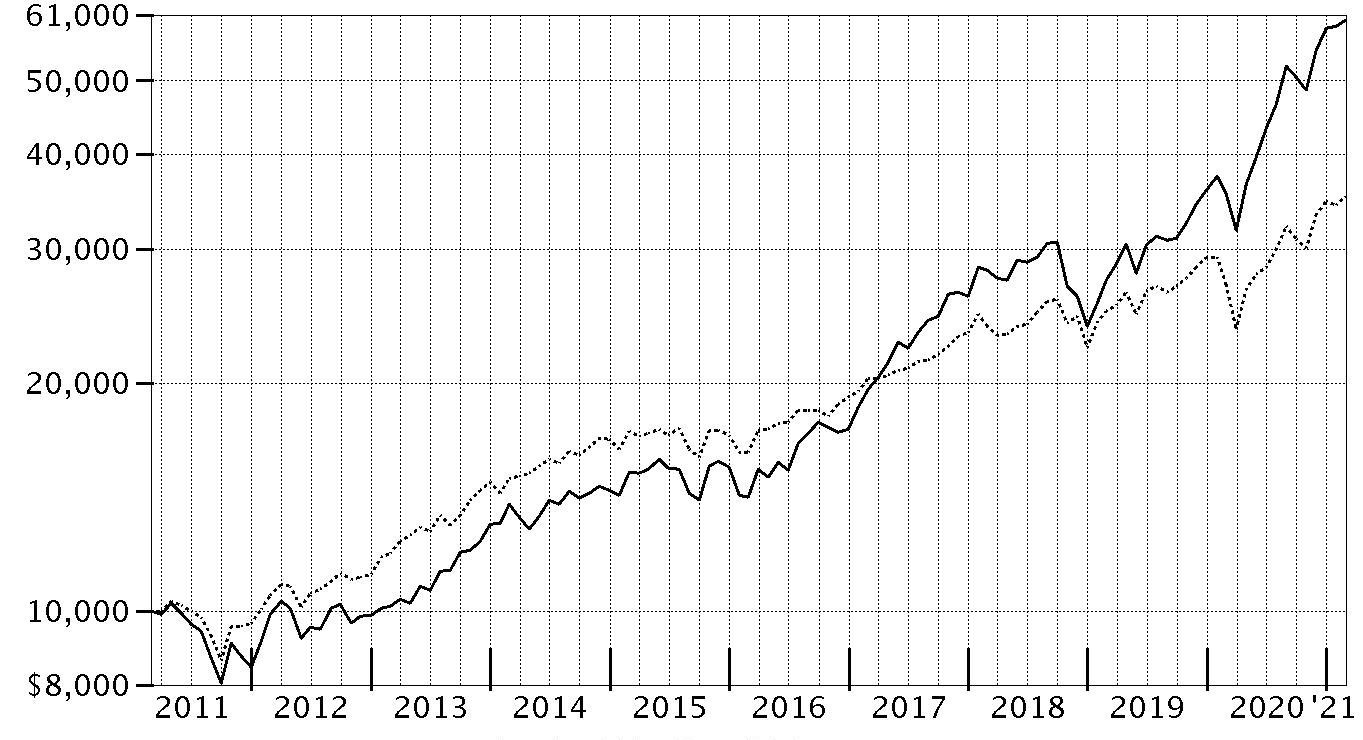
| Period Ending Values |
| $60,086 | Technology Portfolio |
| $35,259 | S&P 500® Index |
Technology Portfolio
Management's Discussion of Fund Performance
Market Recap: The S&P 500
® index gained 31.29% for the 12 months ending February 28, 2021, a volatile but productive period for U.S. risk assets. The early-2020 outbreak and spread of COVID-19 resulted in stocks suffering one of the quickest declines on record, through March 23, followed by a historic rebound that included the index closing 2020 at an all-time high and gaining modest ground in the first two months of the new year. The crisis and containment efforts caused broad contraction in economic activity, along with extreme uncertainty and dislocation in financial markets. A rapid and expansive U.S. monetary/fiscal-policy response partially offset the economic disruption and fueled the market surge, as did resilient corporate earnings. The rally slowed in September, when stocks began a two-month retreat amid Congress’s inability to reach a deal on additional fiscal stimulus, as well as concerns about election uncertainty, indications the U.S. economic recovery could be slowing and a new wave of COVID-19 cases. A shift in momentum began in October and accelerated following the U.S. elections, with the approval of three breakthrough COVID-19 vaccines and prospects for additional government stimulus fueling the “reflation trade” through February 28. By sector for the full 12 months, information technology (+50%) and consumer discretionary (+43%) led all gainers. Materials (+42%) and communication services (+37%) also stood out. In contrast, the defensive utilities (-3%) and real estate sectors (+5%) notably lagged.
Comments from Portfolio Manager Brian Lempel: For the fiscal year ending February 28, 2021, the fund gained 69.87%, outperforming the 53.25% advance of the MSCI US IMI Information Technology 25/50 Index, as well as the broad-based S&P 500
® index. The top contributor to performance versus the sector index was security selection in semiconductors. Also bolstering performance was an underweighting and stock selection in technology hardware, storage & peripherals, and in IT consulting & other services. The fund's top individual relative contributor was Apple, which gained 79% the past 12 months. Overweighting the stock early in the period and underweighting later on was timely. The company was among our biggest holdings. Another top relative contributor was an out-of-index stake in Vivint Solar (+110%). Vivint was acquired by rival Sunrun during the period. Avoiding Intel, an index component that gained about 12%, also helped boost relative performance. Conversely, the primary detractor from performance versus the sector index was out-of-index exposure to interactive media & services. An underweighting in semiconductors and a non-index allocation to the other diversified financial services segment also hurt relative performance. Our non-index stake in Alibaba Group Holding, a position we established this period, was the fund's largest individual relative detractor due to its approximately -3% result. Another key relative detractor was our out-of-index position in Sunrun (+17%). This was among the biggest holdings as of February 28. Also hurting performance was our overweighting in SVMK, which returned roughly -25%. This was a stake we established the past 12 months. Notable changes in positioning include increased exposure to the semiconductors subindustry and a lower allocation to technology hardware, storage & peripherals.
The views expressed above reflect those of the portfolio manager(s) only through the end of the period as stated on the cover of this report and do not necessarily represent the views of Fidelity or any other person in the Fidelity organization. Any such views are subject to change at any time based upon market or other conditions and Fidelity disclaims any responsibility to update such views. These views may not be relied on as investment advice and, because investment decisions for a Fidelity fund are based on numerous factors, may not be relied on as an indication of trading intent on behalf of any Fidelity fund.
Note to shareholders: On January 1, 2021, Brian Lempel became sole manager of the fund after having served as co-manager with Nidhi Gupta since July 2020.
Technology Portfolio
Investment Summary (Unaudited)
Top Ten Stocks as of February 28, 2021
| | % of fund's net assets |
| Microsoft Corp. | 13.2 |
| Apple, Inc. | 12.5 |
| MasterCard, Inc. Class A | 5.8 |
| Sunrun, Inc. | 3.7 |
| NVIDIA Corp. | 3.3 |
| Alibaba Group Holding Ltd. sponsored ADR | 3.0 |
| PayPal Holdings, Inc. | 2.9 |
| Micron Technology, Inc. | 2.3 |
| Flex Ltd. | 2.3 |
| ON Semiconductor Corp. | 2.2 |
| | 51.2 |
Top Industries (% of fund's net assets)
| As of February 28, 2021 |
| | Software | 28.5% |
| | IT Services | 18.5% |
| | Semiconductors & Semiconductor Equipment | 16.0% |
| | Technology Hardware, Storage & Peripherals | 13.9% |
| | Electrical Equipment | 4.6% |
| | All Others* | 18.5% |
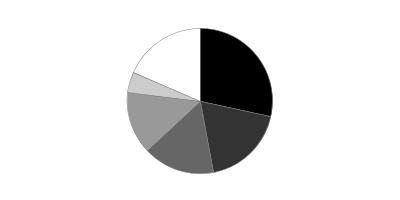
* Includes short-term investments and net other assets (liabilities).
Technology Portfolio
Schedule of Investments February 28, 2021
Showing Percentage of Net Assets
| Common Stocks - 99.5% | | | |
| | | Shares | Value |
| Chemicals - 1.3% | | | |
| Commodity Chemicals - 0.4% | | | |
| LG Chemical Ltd. | | 59,520 | $43,866,983 |
| Specialty Chemicals - 0.9% | | | |
| Amyris, Inc. (a)(b) | | 8,055,688 | 111,168,494 |
|
| TOTAL CHEMICALS | | | 155,035,477 |
|
| Communications Equipment - 0.1% | | | |
| Communications Equipment - 0.1% | | | |
| Acacia Communications, Inc. (a) | | 43,400 | 4,990,566 |
| Lumentum Holdings, Inc. (a) | | 69,400 | 6,246,000 |
| | | | 11,236,566 |
| Diversified Financial Services - 0.2% | | | |
| Other Diversified Financial Services - 0.2% | | | |
| Ant International Co. Ltd. Class C (a)(c)(d) | | 4,366,389 | 23,491,173 |
| Electrical Equipment - 4.6% | | | |
| Electrical Components & Equipment - 4.6% | | | |
| Plug Power, Inc. (a) | | 638,400 | 30,885,792 |
| Shoals Technologies Group, Inc. | | 2,095,200 | 68,345,424 |
| Sunrun, Inc. (a) | | 7,133,745 | 446,429,762 |
| | | | 545,660,978 |
| Heavy Electrical Equipment - 0.0% | | | |
| NEL ASA (a) | | 824,900 | 2,399,370 |
|
| TOTAL ELECTRICAL EQUIPMENT | | | 548,060,348 |
|
| Electronic Equipment & Components - 4.2% | | | |
| Electronic Components - 0.1% | | | |
| II-VI, Inc. (a)(b) | | 150,125 | 12,655,538 |
| Electronic Manufacturing Services - 4.0% | | | |
| Flex Ltd. (a) | | 14,752,902 | 268,355,287 |
| Jabil, Inc. | | 4,682,660 | 202,150,432 |
| | | | 470,505,719 |
| Technology Distributors - 0.1% | | | |
| Avnet, Inc. | | 391,018 | 14,886,055 |
|
| TOTAL ELECTRONIC EQUIPMENT & COMPONENTS | | | 498,047,312 |
|
| Entertainment - 0.6% | | | |
| Movies & Entertainment - 0.6% | | | |
| Cinemark Holdings, Inc. (b) | | 1,332,472 | 29,913,996 |
| Live Nation Entertainment, Inc. (a) | | 252,000 | 22,392,720 |
| Marcus Corp. | | 1,027,600 | 20,182,064 |
| | | | 72,488,780 |
| Hotels, Restaurants & Leisure - 0.4% | | | |
| Casinos & Gaming - 0.4% | | | |
| Caesars Entertainment, Inc. (a) | | 439,400 | 41,057,536 |
| SJM Holdings Ltd. | | 5,517,224 | 7,682,125 |
| | | | 48,739,661 |
| Household Durables - 0.9% | | | |
| Consumer Electronics - 0.9% | | | |
| Sony Corp. | | 951,300 | 100,458,405 |
| Sony Corp. sponsored ADR | | 115,300 | 12,199,893 |
| | | | 112,658,298 |
| Independent Power and Renewable Electricity Producers - 0.3% | | | |
| Renewable Electricity - 0.3% | | | |
| Sunnova Energy International, Inc. (a) | | 878,487 | 39,391,357 |
| Interactive Media & Services - 2.1% | | | |
| Interactive Media & Services - 2.1% | | | |
| Alphabet, Inc. Class C (a) | | 51,700 | 105,305,662 |
| JOYY, Inc. ADR | | 70,600 | 8,323,740 |
| Kakao Corp. | | 30,330 | 13,127,017 |
| Tongdao Liepin Group (a) | | 14,632,092 | 35,653,751 |
| Yandex NV Series A (a) | | 391,000 | 25,018,135 |
| Z Holdings Corp. | | 11,264,738 | 68,774,461 |
| | | | 256,202,766 |
| Internet & Direct Marketing Retail - 4.2% | | | |
| Internet & Direct Marketing Retail - 4.2% | | | |
| Alibaba Group Holding Ltd. (a) | | 413,400 | 12,422,333 |
| Alibaba Group Holding Ltd. sponsored ADR (a) | | 1,488,500 | 353,905,760 |
| Kogan.Com Ltd. | | 394,652 | 4,245,236 |
| MakeMyTrip Ltd. (a) | | 1,814,430 | 60,874,127 |
| Ozon Holdings PLC ADR (b) | | 43,600 | 2,587,660 |
| Pinduoduo, Inc. ADR (a) | | 346,700 | 59,341,172 |
| Porch Group, Inc. Class A (a) | | 473,400 | 8,502,264 |
| | | | 501,878,552 |
| IT Services - 18.4% | | | |
| Data Processing & Outsourced Services - 14.8% | | | |
| Fidelity National Information Services, Inc. | | 1,042,327 | 143,841,126 |
| Fiserv, Inc. (a) | | 174,685 | 20,153,408 |
| FleetCor Technologies, Inc. (a) | | 66,300 | 18,385,653 |
| Genpact Ltd. | | 3,333,600 | 134,810,784 |
| Global Payments, Inc. | | 252,530 | 49,998,415 |
| MasterCard, Inc. Class A | | 1,966,836 | 695,964,919 |
| PayPal Holdings, Inc. (a) | | 1,340,100 | 348,224,985 |
| Sabre Corp. | | 918,700 | 13,495,703 |
| Square, Inc. (a) | | 428,100 | 98,475,843 |
| Visa, Inc. Class A | | 1,185,500 | 251,788,345 |
| | | | 1,775,139,181 |
| Internet Services & Infrastructure - 1.6% | | | |
| GoDaddy, Inc. (a) | | 617,100 | 50,059,152 |
| MongoDB, Inc. Class A (a) | | 119,800 | 46,234,414 |
| Snowflake Computing, Inc. (b) | | 58,700 | 15,234,998 |
| Snowflake Computing, Inc.: | | | |
| Class B (e) | | 1,305 | 338,700 |
| Class B | | 3,915 | 965,294 |
| Twilio, Inc. Class A (a) | | 133,700 | 52,528,056 |
| Wix.com Ltd. (a) | | 62,100 | 21,646,197 |
| | | | 187,006,811 |
| IT Consulting & Other Services - 2.0% | | | |
| Capgemini SA | | 1,021,600 | 164,122,218 |
| Cognizant Technology Solutions Corp. Class A | | 546,900 | 40,186,212 |
| DXC Technology Co. | | 285,600 | 7,202,832 |
| Liveramp Holdings, Inc. (a) | | 454,400 | 28,699,904 |
| | | | 240,211,166 |
|
| TOTAL IT SERVICES | | | 2,202,357,158 |
|
| Life Sciences Tools & Services - 0.0% | | | |
| Life Sciences Tools & Services - 0.0% | | | |
| JHL Biotech, Inc. (a)(d) | | 1,015,442 | 0 |
| Machinery - 0.1% | | | |
| Industrial Machinery - 0.1% | | | |
| Kornit Digital Ltd. (a) | | 101,432 | 11,475,002 |
| Oil, Gas & Consumable Fuels - 1.4% | | | |
| Oil & Gas Refining & Marketing - 1.4% | | | |
| Reliance Industries Ltd. | | 4,988,770 | 140,735,714 |
| Reliance Industries Ltd. | | 206,153 | 3,375,844 |
| Reliance Industries Ltd. sponsored GDR (e) | | 79,100 | 4,540,340 |
| SK Innovation Co., Ltd. | | 95,910 | 22,158,759 |
| | | | 170,810,657 |
| Pharmaceuticals - 0.0% | | | |
| Pharmaceuticals - 0.0% | | | |
| Chime Biologics Ltd. (d) | | 1,015,442 | 528,873 |
| Road & Rail - 2.5% | | | |
| Trucking - 2.5% | | | |
| Lyft, Inc. (a) | | 1,828,157 | 101,828,345 |
| Uber Technologies, Inc. (a) | | 3,706,796 | 191,826,693 |
| | | | 293,655,038 |
| Semiconductors & Semiconductor Equipment - 16.0% | | | |
| Semiconductor Equipment - 3.2% | | | |
| Applied Materials, Inc. | | 1,275,600 | 150,763,164 |
| Array Technologies, Inc. | | 837,254 | 31,045,378 |
| Lam Research Corp. | | 346,800 | 196,701,492 |
| | | | 378,510,034 |
| Semiconductors - 12.8% | | | |
| Advanced Micro Devices, Inc. (a) | | 720,500 | 60,889,455 |
| Cirrus Logic, Inc. (a) | | 123,995 | 10,140,311 |
| eMemory Technology, Inc. | | 435,924 | 12,746,316 |
| Marvell Technology Group Ltd. | | 3,408,854 | 164,579,471 |
| MediaTek, Inc. | | 270,000 | 8,679,367 |
| Micron Technology, Inc. (a) | | 2,990,100 | 273,683,853 |
| NVIDIA Corp. | | 721,950 | 396,047,331 |
| NXP Semiconductors NV | | 917,904 | 167,563,375 |
| ON Semiconductor Corp. (a) | | 6,498,200 | 261,682,514 |
| Qualcomm, Inc. | | 860,400 | 117,177,876 |
| Semtech Corp. (a) | | 269,200 | 19,735,052 |
| SiTime Corp. (a) | | 133,400 | 12,997,162 |
| Universal Display Corp. | | 23,600 | 4,995,884 |
| Xilinx, Inc. | | 230,300 | 30,008,090 |
| | | | 1,540,926,057 |
|
| TOTAL SEMICONDUCTORS & SEMICONDUCTOR EQUIPMENT | | | 1,919,436,091 |
|
| Software - 28.3% | | | |
| Application Software - 13.3% | | | |
| Autodesk, Inc. (a) | | 841,900 | 232,364,400 |
| Cognyte Software Ltd. (a) | | 3,188,478 | 92,051,360 |
| Digital Turbine, Inc. (a) | | 740,300 | 61,126,571 |
| Elastic NV (a) | | 883,100 | 118,679,809 |
| Five9, Inc. (a) | | 33,100 | 6,131,444 |
| HubSpot, Inc. (a) | | 59,800 | 30,797,000 |
| LivePerson, Inc. (a) | | 340,556 | 22,347,285 |
| Nuance Communications, Inc. (a) | | 2,749,500 | 122,627,700 |
| Nutanix, Inc. Class B (a)(e) | | 72,872 | 2,206,929 |
| RealPage, Inc. (a) | | 67,000 | 5,814,260 |
| RingCentral, Inc. (a) | | 125,700 | 47,534,712 |
| Salesforce.com, Inc. (a) | | 1,090,188 | 236,025,702 |
| Splunk, Inc. (a) | | 288,800 | 41,301,288 |
| SVMK, Inc. (a)(f) | | 9,077,233 | 169,018,078 |
| Technology One Ltd. | | 5,233,240 | 34,066,022 |
| Verint Systems, Inc. (a) | | 1,197,900 | 59,044,491 |
| Viant Technology, Inc. | | 87,400 | 4,334,166 |
| Workday, Inc. Class A (a) | | 518,560 | 127,140,541 |
| Yext, Inc. (a)(b)(f) | | 7,565,000 | 127,999,800 |
| Zendesk, Inc. (a) | | 279,400 | 40,831,516 |
| Zoom Video Communications, Inc. Class A (a) | | 54,700 | 20,436,467 |
| | | | 1,601,879,541 |
| Systems Software - 15.0% | | | |
| Cloudflare, Inc. (a) | | 341,700 | 25,275,549 |
| Crowdstrike Holdings, Inc. (a) | | 8,900 | 1,922,400 |
| FireEye, Inc. (a) | | 238,900 | 4,615,548 |
| Microsoft Corp. | | 6,819,040 | 1,584,608,516 |
| NortonLifeLock, Inc. | | 2,996,706 | 58,465,734 |
| Palo Alto Networks, Inc. (a) | | 109,400 | 39,199,114 |
| Rapid7, Inc. (a) | | 869,500 | 66,290,680 |
| Telos Corp. | | 50,800 | 1,692,656 |
| VMware, Inc. Class A (a)(b) | | 90,800 | 12,549,468 |
| | | | 1,794,619,665 |
|
| TOTAL SOFTWARE | | | 3,396,499,206 |
|
| Technology Hardware, Storage & Peripherals - 13.9% | | | |
| Technology Hardware, Storage & Peripherals - 13.9% | | | |
| Apple, Inc. | | 12,371,088 | 1,500,118,131 |
| Samsung Electronics Co. Ltd. | | 1,981,400 | 144,977,273 |
| Western Digital Corp. | | 386,500 | 26,486,845 |
| | | | 1,671,582,249 |
| TOTAL COMMON STOCKS | | | |
| (Cost $7,941,713,255) | | | 11,933,574,564 |
|
| Convertible Preferred Stocks - 0.7% | | | |
| Communications Equipment - 0.0% | | | |
| Communications Equipment - 0.0% | | | |
| Xsight Labs Ltd. Series D (c)(d) | | 281,500 | 2,250,874 |
| Food & Staples Retailing - 0.3% | | | |
| Food Retail - 0.3% | | | |
| Roofoods Ltd. Series F (a)(c)(d) | | 41,041 | 36,023,796 |
| Internet & Direct Marketing Retail - 0.1% | | | |
| Internet & Direct Marketing Retail - 0.1% | | | |
| Reddit, Inc. Series D (a)(c)(d) | | 250,861 | 10,655,120 |
| IT Services - 0.1% | | | |
| Internet Services & Infrastructure - 0.1% | | | |
| ByteDance Ltd. Series E1 (c)(d) | | 70,707 | 7,747,662 |
| Road & Rail - 0.0% | | | |
| Trucking - 0.0% | | | |
| Convoy, Inc. Series D (a)(c)(d) | | 203,844 | 3,263,542 |
| Software - 0.2% | | | |
| Application Software - 0.2% | | | |
| Databricks, Inc. Series G (c)(d) | | 15,004 | 2,661,228 |
| Thoughtworks, Inc. Series A (c)(d) | | 25,916 | 15,864,479 |
| UiPath, Inc.: | | | |
| Series A1 (a)(c)(d) | | 76,971 | 4,793,428 |
| Series B1 (a)(c)(d) | | 3,834 | 238,765 |
| Series B2 (a)(c)(d) | | 19,095 | 1,189,156 |
| | | | 24,747,056 |
| TOTAL CONVERTIBLE PREFERRED STOCKS | | | |
| (Cost $52,545,840) | | | 84,688,050 |
|
| Money Market Funds - 0.8% | | | |
| Fidelity Cash Central Fund 0.07% (g) | | 238,349 | 238,396 |
| Fidelity Securities Lending Cash Central Fund 0.08% (g)(h) | | 92,014,558 | 92,023,760 |
| TOTAL MONEY MARKET FUNDS | | | |
| (Cost $92,262,156) | | | 92,262,156 |
| TOTAL INVESTMENT IN SECURITIES - 101.0% | | | |
| (Cost $8,086,521,251) | | | 12,110,524,770 |
| NET OTHER ASSETS (LIABILITIES) - (1.0)% | | | (124,182,653) |
| NET ASSETS - 100% | | | $11,986,342,117 |
Legend
(a) Non-income producing
(b) Security or a portion of the security is on loan at period end.
(c) Restricted securities (including private placements) - Investment in securities not registered under the Securities Act of 1933 (excluding 144A issues). At the end of the period, the value of restricted securities (excluding 144A issues) amounted to $108,179,223 or 0.9% of net assets.
(d) Level 3 security
(e) Security exempt from registration under Rule 144A of the Securities Act of 1933. These securities may be resold in transactions exempt from registration, normally to qualified institutional buyers. At the end of the period, the value of these securities amounted to $7,085,969 or 0.1% of net assets.
(f) Affiliated company
(g) Affiliated fund that is generally available only to investment companies and other accounts managed by Fidelity Investments. The rate quoted is the annualized seven-day yield of the fund at period end. A complete unaudited listing of the fund's holdings as of its most recent quarter end is available upon request. In addition, each Fidelity Central Fund's financial statements, which are not covered by the Fund's Report of Independent Registered Public Accounting Firm, are available on the SEC's website or upon request.
(h) Investment made with cash collateral received from securities on loan.
Additional information on each restricted holding is as follows:
| Security | Acquisition Date | Acquisition Cost |
| Ant International Co. Ltd. Class C | 5/16/18 | $24,495,442 |
| ByteDance Ltd. Series E1 | 11/18/20 | $7,747,662 |
| Convoy, Inc. Series D | 10/30/19 | $2,760,048 |
| Databricks, Inc. Series G | 2/1/21 | $2,661,228 |
| Reddit, Inc. Series D | 2/4/19 | $5,440,247 |
| Roofoods Ltd. Series F | 9/12/17 | $14,510,890 |
| Thoughtworks, Inc. Series A | 1/13/21 | $15,864,479 |
| UiPath, Inc. Series A1 | 6/14/19 | $1,009,647 |
| UiPath, Inc. Series B1 | 6/14/19 | $50,291 |
| UiPath, Inc. Series B2 | 6/14/19 | $250,474 |
| Xsight Labs Ltd. Series D | 2/16/21 | $2,250,874 |
Affiliated Central Funds
Information regarding fiscal year to date income earned by the Fund from investments in Fidelity Central Funds is as follows:
| Fund | Income earned |
| Fidelity Cash Central Fund | $85,954 |
| Fidelity Securities Lending Cash Central Fund | 564,463 |
| Total | $650,417 |
Amounts in the income column in the above table include any capital gain distributions from underlying funds, which are presented in the corresponding line-item in the Statement of Operations, if applicable. Amount for Fidelity Securities Lending Cash Central Fund represents the income earned on investing cash collateral, less rebates paid to borrowers and any lending agent fees associated with the loan, plus any premium payments received for lending certain types of securities.
Other Affiliated Issuers
An affiliated company is a company in which the Fund has ownership of at least 5% of the voting securities. Fiscal year to date transactions with companies which are or were affiliates are as follows:
| Affiliate | Value, beginning of period | Purchases | Sales Proceeds | Dividend Income | Realized Gain (loss) | Change in Unrealized appreciation (depreciation) | Value, end of period |
| SVMK, Inc. | $-- | $215,245,650 | $947,591 | $-- | $(191,049) | $(45,088,932) | $169,018,078 |
| Vivint Solar, Inc. | -- | 165,632,260 | 184,898,961 | -- | 19,266,701 | -- | -- |
| Yext, Inc. | 21,878,912 | 108,822,288 | 1,303,695 | -- | 16,724 | (1,414,429) | 127,999,800 |
| Total | $21,878,912 | $489,700,198 | $187,150,247 | $-- | $19,092,376 | $(46,503,361) | $297,017,878 |
Investment Valuation
The following is a summary of the inputs used, as of February 28, 2021, involving the Fund's assets and liabilities carried at fair value. The inputs or methodology used for valuing securities may not be an indication of the risk associated with investing in those securities. For more information on valuation inputs, and their aggregation into the levels used below, please refer to the Investment Valuation section in the accompanying Notes to Financial Statements.
| | Valuation Inputs at Reporting Date: |
| Description | Total | Level 1 | Level 2 | Level 3 |
| Investments in Securities: | | | | |
| Common Stocks | $11,933,574,564 | $11,726,934,025 | $182,620,493 | $24,020,046 |
| Convertible Preferred Stocks | 84,688,050 | -- | -- | 84,688,050 |
| Money Market Funds | 92,262,156 | 92,262,156 | -- | -- |
| Total Investments in Securities: | $12,110,524,770 | $11,819,196,181 | $182,620,493 | $108,708,096 |
| Net unrealized appreciation on unfunded commitments | $7,366,272 | $-- | $7,366,272 | $-- |
Other Information
Distribution of investments by country or territory of incorporation, as a percentage of Total Net Assets, is as follows (Unaudited):
| United States of America | 79.9% |
| Cayman Islands | 4.1% |
| Netherlands | 2.6% |
| Bermuda | 2.5% |
| Singapore | 2.3% |
| Korea (South) | 1.9% |
| Japan | 1.5% |
| France | 1.4% |
| India | 1.2% |
| Israel | 1.1% |
| Others (Individually Less Than 1%) | 1.5% |
| | 100.0% |
See accompanying notes which are an integral part of the financial statements.
Technology Portfolio
Financial Statements
Statement of Assets and Liabilities
| | | February 28, 2021 |
| Assets | | |
Investment in securities, at value (including securities loaned of $89,113,414) — See accompanying schedule:
Unaffiliated issuers (cost $7,649,661,067) | $11,721,244,736 | |
| Fidelity Central Funds (cost $92,262,156) | 92,262,156 | |
| Other affiliated issuers (cost $344,598,028) | 297,017,878 | |
| Total Investment in Securities (cost $8,086,521,251) | | $12,110,524,770 |
| Cash | | 20,902 |
| Foreign currency held at value (cost $5,485,563) | | 5,485,563 |
| Receivable for investments sold | | 23,790,468 |
| Net unrealized appreciation on unfunded commitments | | 7,496,761 |
| Receivable for fund shares sold | | 14,300,679 |
| Dividends receivable | | 8,251,971 |
| Distributions receivable from Fidelity Central Funds | | 39,258 |
| Prepaid expenses | | 43,041 |
| Other receivables | | 570,965 |
| Total assets | | 12,170,524,378 |
| Liabilities | | |
| Payable for investments purchased | $47,994,175 | |
| Net unrealized depreciation on unfunded commitments | 130,489 | |
| Payable for fund shares redeemed | 28,945,631 | |
| Accrued management fee | 5,504,894 | |
| Other affiliated payables | 1,392,790 | |
| Other payables and accrued expenses | 8,205,714 | |
| Collateral on securities loaned | 92,008,568 | |
| Total liabilities | | 184,182,261 |
| Net Assets | | $11,986,342,117 |
| Net Assets consist of: | | |
| Paid in capital | | $7,320,989,120 |
| Total accumulated earnings (loss) | | 4,665,352,997 |
| Net Assets | | $11,986,342,117 |
| Net Asset Value, offering price and redemption price per share ($11,986,342,117 ÷ 435,416,366 shares) | | $27.53 |
See accompanying notes which are an integral part of the financial statements.
Statement of Operations
| | | Year ended February 28, 2021 |
| Investment Income | | |
| Dividends | | $50,064,528 |
| Income from Fidelity Central Funds (including $564,463 from security lending) | | 650,417 |
| Total income | | 50,714,945 |
| Expenses | | |
| Management fee | $49,257,852 | |
| Transfer agent fees | 12,697,206 | |
| Accounting fees | 1,257,385 | |
| Custodian fees and expenses | 212,789 | |
| Independent trustees' fees and expenses | 46,541 | |
| Registration fees | 388,188 | |
| Audit | 46,354 | |
| Legal | 11,520 | |
| Interest | 44,368 | |
| Miscellaneous | 114,373 | |
| Total expenses before reductions | 64,076,576 | |
| Expense reductions | (916,448) | |
| Total expenses after reductions | | 63,160,128 |
| Net investment income (loss) | | (12,445,183) |
| Realized and Unrealized Gain (Loss) | | |
| Net realized gain (loss) on: | | |
| Investment securities: | | |
| Unaffiliated issuers (net of foreign taxes of $403,773) | 2,494,894,824 | |
| Fidelity Central Funds | 20,648 | |
| Other affiliated issuers | 19,092,376 | |
| Foreign currency transactions | (118,516) | |
| Total net realized gain (loss) | | 2,513,889,332 |
| Change in net unrealized appreciation (depreciation) on: | | |
| Investment securities: | | |
| Unaffiliated issuers (net of increase in deferred foreign taxes of $7,689,576) | 2,287,075,142 | |
| Affiliated issuers | (46,503,361) | |
| Unfunded commitments | 7,366,272 | |
| Assets and liabilities in foreign currencies | 11,204 | |
| Total change in net unrealized appreciation (depreciation) | | 2,247,949,257 |
| Net gain (loss) | | 4,761,838,589 |
| Net increase (decrease) in net assets resulting from operations | | $4,749,393,406 |
See accompanying notes which are an integral part of the financial statements.
Statement of Changes in Net Assets
| | Year ended February 28, 2021 | Year ended February 29, 2020 |
| Increase (Decrease) in Net Assets | | |
| Operations | | |
| Net investment income (loss) | $(12,445,183) | $17,587,012 |
| Net realized gain (loss) | 2,513,889,332 | 433,691,557 |
| Change in net unrealized appreciation (depreciation) | 2,247,949,257 | 981,336,641 |
| Net increase (decrease) in net assets resulting from operations | 4,749,393,406 | 1,432,615,210 |
| Distributions to shareholders | (1,867,597,939) | (116,939,082) |
| Share transactions | | |
| Proceeds from sales of shares | 4,191,878,143 | 1,714,479,733 |
| Reinvestment of distributions | 1,777,095,512 | 111,024,657 |
| Cost of shares redeemed | (3,423,005,308) | (1,706,723,713) |
| Net increase (decrease) in net assets resulting from share transactions | 2,545,968,347 | 118,780,677 |
| Total increase (decrease) in net assets | 5,427,763,814 | 1,434,456,805 |
| Net Assets | | |
| Beginning of period | 6,558,578,303 | 5,124,121,498 |
| End of period | $11,986,342,117 | $6,558,578,303 |
| Other Information | | |
| Shares | | |
| Sold | 172,897,974 | 89,932,658 |
| Issued in reinvestment of distributions | 71,641,712 | 5,624,350 |
| Redeemed | (142,814,110) | (93,619,847) |
| Net increase (decrease) | 101,725,576 | 1,937,161 |
See accompanying notes which are an integral part of the financial statements.
Financial Highlights
Technology Portfolio
| | | | | | |
| Years ended February 28, | 2021 | 2020 A | 2019 B | 2018 B | 2017 B |
| Selected Per–Share Data | | | | | |
| Net asset value, beginning of period | $19.65 | $15.45 | $19.36 | $14.70 | $10.78 |
| Income from Investment Operations | | | | | |
| Net investment income (loss)C | (.03) | .05 | .06 | – | .01 |
| Net realized and unrealized gain (loss) | 12.98 | 4.52 | (.78) | 6.15 | 4.11 |
| Total from investment operations | 12.95 | 4.57 | (.72) | 6.15 | 4.12 |
| Distributions from net investment income | (.03) | (.05) | (.02) | – | (.01) |
| Distributions from net realized gain | (5.04) | (.32) | (3.17) | (1.49) | (.19) |
| Total distributions | (5.07) | (.37) | (3.19) | (1.49) | (.20) |
| Redemption fees added to paid in capitalC | – | – | – | – | –D |
| Net asset value, end of period | $27.53 | $19.65 | $15.45 | $19.36 | $14.70 |
| Total ReturnE | 69.87% | 29.57% | (3.03)% | 43.71% | 38.52% |
| Ratios to Average Net AssetsF,G | | | | | |
| Expenses before reductions | .69% | .71% | .72% | .75% | .77% |
| Expenses net of fee waivers, if any | .69% | .71% | .72% | .75% | .77% |
| Expenses net of all reductions | .68% | .71% | .71% | .74% | .76% |
| Net investment income (loss) | (.13)% | .30% | .34% | .01% | .11% |
| Supplemental Data | | | | | |
| Net assets, end of period (000 omitted) | $11,986,342 | $6,558,578 | $5,124,121 | $7,242,300 | $4,119,489 |
| Portfolio turnover rateH | 107% | 32%I | 126%I | 71% | 82% |
A For the year ended February 29.
B Per share amounts have been adjusted to reflect the impact of the 10 for 1 share split that occurred on August 10, 2018.
C Calculated based on average shares outstanding during the period.
D Amount represents less than $.005 per share.
E Total returns would have been lower if certain expenses had not been reduced during the applicable periods shown.
F Fees and expenses of any underlying mutual funds or exchange-traded funds (ETFs) are not included in the Fund's expense ratio. The Fund indirectly bears its proportionate share of these expenses. For additional expense information related to investments in Fidelity Central Funds, please refer to the "Investments in Fidelity Central Funds" note found in the Notes to Financial Statements section of the most recent Annual or Semi-Annual report.
G Expense ratios reflect operating expenses of the class. Expenses before reductions do not reflect amounts reimbursed, waived, or reduced through arrangements with the investment advisor, brokerage services, or other offset arrangements, if applicable, and do not represent the amount paid by the class during periods when reimbursements, waivers or reductions occur.
H Amount does not include the portfolio activity of any underlying mutual funds or exchange-traded funds (ETFs).
I Portfolio turnover rate excludes securities received or delivered in-kind.
See accompanying notes which are an integral part of the financial statements.
Notes to Financial Statements
For the period ended February 28, 2021
1. Organization.
Communications Equipment Portfolio, Computers Portfolio, IT Services Portfolio, Semiconductors Portfolio, Software and IT Services Portfolio, and Technology Portfolio (the Funds) are non-diversified funds of Fidelity Select Portfolios (the Trust). The Trust is registered under the Investment Company Act of 1940, as amended (the 1940 Act), as an open-end management investment company organized as a Massachusetts business trust. The Funds invest primarily in securities of companies whose principal business activities fall within specific industries. Each Fund is authorized to issue an unlimited number of shares. Share transactions on the Statement of Changes in Net Assets may contain exchanges between affiliated funds. Certain Funds' investments in emerging markets can be subject to social, economic, regulatory, and political uncertainties and can be extremely volatile.
2. Investments in Fidelity Central Funds.
The Funds invest in Fidelity Central Funds, which are open-end investment companies generally available only to other investment companies and accounts managed by the investment adviser and its affiliates. The Funds' Schedules of Investments list each of the Fidelity Central Funds held as of period end, if any, as an investment of each Fund, but do not include the underlying holdings of each Fidelity Central Fund. As an Investing Fund, each Fund indirectly bears its proportionate share of the expenses of the underlying Fidelity Central Funds.
The Money Market Central Funds seek preservation of capital and current income and are managed by the investment adviser. Annualized expenses of the Money Market Central Funds as of their most recent shareholder report date ranged from less than .005% to .01%.
A complete unaudited list of holdings for each Fidelity Central Fund is available upon request or at the Securities and Exchange Commission (the SEC) website at www.sec.gov. In addition, the financial statements of the Fidelity Central Funds, which are not covered by the Funds' Report of Independent Registered Public Accounting Firm, are available on the SEC website or upon request.
3. Significant Accounting Policies.
Each Fund is an investment company and applies the accounting and reporting guidance of the Financial Accounting Standards Board (FASB) Accounting Standards Codification Topic 946 Financial Services - Investment Companies. The financial statements have been prepared in conformity with accounting principles generally accepted in the United States of America (GAAP), which require management to make certain estimates and assumptions at the date of the financial statements. Actual results could differ from those estimates. Subsequent events, if any, through the date that the financial statements were issued have been evaluated in the preparation of the financial statements. The following summarizes the significant accounting policies of the Funds:
Investment Valuation. Investments are valued as of 4:00 p.m. Eastern time on the last calendar day of the period. The Board of Trustees (the Board) has delegated the day to day responsibility for the valuation of each Fund's investments to the Fair Value Committee (the Committee) established by each Fund's investment adviser. In accordance with valuation policies and procedures approved by the Board, each Fund attempts to obtain prices from one or more third party pricing vendors or brokers to value its investments. When current market prices, quotations or currency exchange rates are not readily available or reliable, investments will be fair valued in good faith by the Committee, in accordance with procedures adopted by the Board. Factors used in determining fair value vary by investment type and may include market or investment specific events, changes in interest rates and credit quality. The frequency with which these procedures are used cannot be predicted and they may be utilized to a significant extent. The Committee oversees each Fund's valuation policies and procedures and reports to the Board on the Committee's activities and fair value determinations. The Board monitors the appropriateness of the procedures used in valuing each Fund's investments and ratifies the fair value determinations of the Committee.
Each Fund categorizes the inputs to valuation techniques used to value its investments into a disclosure hierarchy consisting of three levels as shown below:
- Level 1 – quoted prices in active markets for identical investments
- Level 2 – other significant observable inputs (including quoted prices for similar investments, interest rates, prepayment speeds, etc.)
- Level 3 – unobservable inputs (including the Fund's own assumptions based on the best information available)
Valuation techniques used to value each Fund's investments by major category are as follows:
Equity securities, including restricted securities, for which market quotations are readily available, are valued at the last reported sale price or official closing price as reported by a third party pricing vendor on the primary market or exchange on which they are traded and are categorized as Level 1 in the hierarchy. In the event there were no sales during the day or closing prices are not available, securities are valued at the last quoted bid price or may be valued using the last available price and are generally categorized as Level 2 in the hierarchy. For foreign equity securities, when market or security specific events arise, comparisons to the valuation of American Depositary Receipts (ADRs), futures contracts, Exchange-Traded Funds (ETFs) and certain indexes as well as quoted prices for similar securities may be used and would be categorized as Level 2 in the hierarchy. For equity securities, including restricted securities, where observable inputs are limited, assumptions about market activity and risk are used and these securities may be categorized as Level 3 in the hierarchy.
Debt securities, including restricted securities, are valued based on evaluated prices received from third party pricing vendors or from brokers who make markets in such securities. Corporate bonds are valued by pricing vendors who utilize matrix pricing which considers yield or price of bonds of comparable quality, coupon, maturity and type or by broker-supplied prices. When independent prices are unavailable or unreliable, debt securities may be valued utilizing pricing methodologies which consider similar factors that would be used by third party pricing vendors. Debt securities are generally categorized as Level 2 in the hierarchy but may be Level 3 depending on the circumstances.
Investments in open-end mutual funds, including the Fidelity Central Funds, are valued at their closing net asset value (NAV) each business day and are categorized as Level 1 in the hierarchy.
Changes in valuation techniques may result in transfers in or out of an assigned level within the disclosure hierarchy. The aggregate value of investments by input level as of February 28, 2021 is included at the end of each Fund's Schedule of Investments.
Foreign Currency. Certain Funds may use foreign currency contracts to facilitate transactions in foreign-denominated securities. Gains and losses from these transactions may arise from changes in the value of the foreign currency or if the counterparties do not perform under the contracts' terms.
Foreign-denominated assets, including investment securities, and liabilities are translated into U.S. dollars at the exchange rates at period end. Purchases and sales of investment securities, income and dividends received, and expenses denominated in foreign currencies are translated into U.S. dollars at the exchange rate in effect on the transaction date.
The effects of exchange rate fluctuations on investments are included with the net realized and unrealized gain (loss) on investment securities. Other foreign currency transactions resulting in realized and unrealized gain (loss) are disclosed separately.
Investment Transactions and Income. For financial reporting purposes, the Funds' investment holdings and NAV include trades executed through the end of the last business day of the period. The NAV per share for processing shareholder transactions is calculated as of the close of business of the New York Stock Exchange (NYSE), normally 4:00 p.m. Eastern time and includes trades executed through the end of the prior business day. Gains and losses on securities sold are determined on the basis of identified cost and for certain Funds include proceeds received from litigation. Dividend income is recorded on the ex-dividend date, except for certain dividends from foreign securities where the ex-dividend date may have passed, which are recorded as soon as the Funds are informed of the ex-dividend date. Non-cash dividends included in dividend income, if any, are recorded at the fair market value of the securities received. Income and capital gain distributions from Fidelity Central Funds, if any, are recorded on the ex-dividend date. Certain distributions received by the Funds represent a return of capital or capital gain. The Funds determine the components of these distributions subsequent to the ex-dividend date, based upon receipt of tax filings or other correspondence relating to the underlying investment. These distributions are recorded as a reduction of cost of investments and/or as a realized gain. Large, non-recurring dividends recognized by the Funds are presented separately on the Statement of Operations as "Special Dividends" and the impact of these dividends is presented in the Financial Highlights. Interest income is accrued as earned and includes coupon interest and amortization of premium and accretion of discount on debt securities as applicable. Investment income is recorded net of foreign taxes withheld where recovery of such taxes is uncertain.
Expenses. Expenses directly attributable to a fund are charged to that fund. Expenses attributable to more than one fund are allocated among the respective funds on the basis of relative net assets or other appropriate methods. Expense estimates are accrued in the period to which they relate and adjustments are made when actual amounts are known.
Deferred Trustee Compensation. Under a Deferred Compensation Plan (the Plan) for certain Funds, certain independent Trustees have elected to defer receipt of a portion of their annual compensation. Deferred amounts are invested in affiliated mutual funds, are marked-to-market and remain in a fund until distributed in accordance with the Plan. The investment of deferred amounts and the offsetting payable to the Trustees presented below are included in the accompanying Statement of Assets and Liabilities in other receivables and other payables and accrued expenses, as applicable.
| Computers Portfolio | $58,237 |
| Semiconductors Portfolio | 217,101 |
| Software and IT Services Portfolio | 360,305 |
| Technology Portfolio | 344,687 |
Income Tax Information and Distributions to Shareholders. Each year, each Fund intends to qualify as a regulated investment company under Subchapter M of the Internal Revenue Code, including distributing substantially all of its taxable income and realized gains. As a result, no provision for U.S. Federal income taxes is required. As of February 28, 2021, each Fund did not have any unrecognized tax benefits in the financial statements; nor is each Fund aware of any tax positions for which it is reasonably possible that the total amounts of unrecognized tax benefits will significantly change in the next twelve months. Each Fund files a U.S. federal tax return, in addition to state and local tax returns as required. Each Fund's federal income tax returns are subject to examination by the Internal Revenue Service (IRS) for a period of three fiscal years after they are filed. State and local tax returns may be subject to examination for an additional fiscal year depending on the jurisdiction. Foreign taxes are provided for based on each Fund's understanding of the tax rules and rates that exist in the foreign markets in which it invests. An estimated deferred tax liability for net unrealized appreciation on the applicable securities is included in Other payables and accrued expenses on each applicable Fund's Statement of Assets & Liabilities.
Distributions are declared and recorded on the ex-dividend date. Income and capital gain distributions are determined in accordance with income tax regulations, which may differ from GAAP. In addition, certain Funds claimed a portion of the payment made to redeeming shareholders as a distribution for income tax purposes.
Capital accounts within the financial statements are adjusted for permanent book-tax differences. These adjustments have no impact on net assets or the results of operations. Capital accounts are not adjusted for temporary book-tax differences which will reverse in a subsequent period.
Book-tax differences are primarily due to foreign currency transactions, certain foreign taxes, passive foreign investment companies (PFIC), deferred Trustees compensation, net operating losses and losses deferred due to wash sales and excise tax regulations.
As of period end, the cost and unrealized appreciation (depreciation) in securities, and derivatives if applicable, for federal income tax purposes were as follows for each Fund:
| | Tax cost | Gross unrealized appreciation | Gross unrealized depreciation | Net unrealized appreciation (depreciation) |
| Communications Equipment Portfolio | $125,405,305 | $57,919,700 | $(2,319,856) | $55,599,844 |
| Computers Portfolio | 440,365,790 | 334,963,553 | (7,531,857) | 327,431,696 |
| IT Services Portfolio | 1,838,147,124 | 2,435,302,484 | (17,670,298) | 2,417,632,186 |
| Semiconductors Portfolio | 3,076,985,966 | 2,716,838,784 | (5,931,151) | 2,710,907,633 |
| Software and IT Services Portfolio | 5,983,252,076 | 6,343,717,026 | (88,912,984) | 6,254,804,042 |
| Technology Portfolio | 8,122,754,545 | 4,157,719,383 | (162,582,886) | 3,995,136,497 |
The tax-based components of distributable earnings as of period end were as follows for each Fund:
| | Undistributed ordinary income | Undistributed long-term capital gain | Net unrealized appreciation (depreciation) on securities and other investments |
| Communications Equipment Portfolio | $49,064 | $1,351,015 | $55,599,845 |
| Computers Portfolio | 13,279,147 | 52,955,588 | 327,279,565 |
| IT Services Portfolio | 14,023,938 | 130,492,252 | 2,417,622,614 |
| Semiconductors Portfolio | 72,831,214 | 162,181,798 | 2,710,900,062 |
| Software and IT Services Portfolio | 83,471,604 | 105,673,784 | 6,254,714,863 |
| Technology Portfolio | 432,670,026 | 245,571,780 | 3,995,145,454 |
The Semiconductors Portfolio intends to elect to defer to its next fiscal year $1,007,339 of ordinary losses recognized during the period January 1, 2021 to February 28, 2021.
The tax character of distributions paid was as follows:
| February 28, 2021 | | | |
| | Ordinary Income | Long-term Capital Gains | Total |
| Communications Equipment Portfolio | $643,329 | $– | $643,329 |
| Computers Portfolio | 21,063,099 | 40,753,674 | 61,816,773 |
| IT Services Portfolio | 314,862 | 222,849,473 | 223,164,335 |
| Semiconductors Portfolio | 157,741,609
| 252,815,233 | 410,556,842 |
| Software and IT Services Portfolio | 251,374,950 | 331,195,503 | 582,570,453 |
| Technology Portfolio | 236,650,457 | 1,630,947,482 | 1,867,597,939 |
| February 29, 2020 | | | |
| | Ordinary Income | Long-term Capital Gains | Total |
| Communications Equipment Portfolio | $932,462 | $8,656,844 | $9,589,306 |
| Computers Portfolio | 10,240,600 | 55,894,488 | 66,135,088 |
| IT Services Portfolio | 1,583,948 | 90,433,001 | 92,016,949 |
| Semiconductors Portfolio | 31,024,498 | 106,423,112 | 137,447,610 |
| Software and IT Services Portfolio | 56,832,072 | 849,544,525 | 906,376,597 |
| Technology Portfolio | 15,486,529 | 101,452,553 | 116,939,082 |
Restricted Securities (including Private Placements). The Funds may invest in securities that are subject to legal or contractual restrictions on resale. These securities generally may be resold in transactions exempt from registration or to the public if the securities are registered. Disposal of these securities may involve time-consuming negotiations and expense, and prompt sale at an acceptable price may be difficult. Information regarding restricted securities is included at the end of each applicable Fund's Schedule of Investments.
Special Purpose Acquisition Companies. Funds may invest in stock, warrants, and other securities of special purpose acquisition companies (SPACs) or similar special purpose entities. A SPAC is a publicly traded company that raises investment capital via an initial public offering (IPO) for the purpose of acquiring the equity securities of one or more existing companies via merger, business combination, acquisition or other similar transactions within a designated time frame.
Private Investment in Public Equity. Funds may acquire equity securities of an issuer through a private investment in a public equity (PIPE) transaction, including through commitments to purchase securities on a when-issued basis. A PIPE typically involves the purchase of securities directly from a publicly traded company in a private placement transaction. Securities purchased through PIPE transactions will be restricted from trading and considered illiquid until a resale registration statement for the shares is filed and declared effective.
At period end, IT Services Portfolio and Technology Portfolio had commitments to purchase when-issued securities through PIPE transactions with SPACs. The commitments are contingent upon the SPACs acquiring the securities of target companies. Unrealized appreciation (depreciation) on these commitments is separately presented in the Statements of Assets and Liabilities as Unrealized appreciation (depreciation) on unfunded commitments, and in the Statement of Operations as Change in unrealized appreciation (depreciation) on unfunded commitments.
4. Purchases and Sales of Investments.
Purchases and sales of securities, other than short-term securities are noted in the table below.
| | Purchases ($) | Sales ($) |
| Communications Equipment Portfolio | 161,175,090 | 168,330,779 |
| Computers Portfolio | 456,163,239 | 515,489,963 |
| IT Services Portfolio | 1,233,093,106 | 2,268,181,768 |
| Semiconductors Portfolio | 3,688,776,946 | 4,049,242,249 |
| Software and IT Services Portfolio | 2,174,833,412 | 2,264,338,822 |
| Technology Portfolio | 10,554,591,466 | 9,857,476,838 |
5. Fees and Other Transactions with Affiliates.
Management Fee. Fidelity Management & Research Company LLC (the investment adviser) and its affiliates provide the Funds with investment management related services for which the Funds pay a monthly management fee. The management fee is the sum of an individual fund fee rate and an annualized group fee rate. The individual fund fee rate is applied to each Fund's average net assets. The group fee rate is based upon the monthly average net assets of a group of registered investment companies with which the investment adviser has management contracts. The group fee rate decreases as assets under management increase and increases as assets under management decrease. For the reporting period, each Fund's annual management fee rate expressed as a percentage of each Fund's average net assets was as follows:
| | Individual Rate | Group Rate | Total |
| Communications Equipment Portfolio | .30% | .23% | .53% |
| Computers Portfolio | .30% | .23% | .53% |
| IT Services Portfolio | .30% | .23% | .53% |
| Semiconductors Portfolio | .30% | .23% | .53% |
| Software and IT Services Portfolio | .30% | .23% | .53% |
| Technology Portfolio | .30% | .23% | .53% |
Transfer Agent Fees. Fidelity Investments Institutional Operations Company LLC (FIIOC), an affiliate of the investment adviser, is the Funds' transfer, dividend disbursing and shareholder servicing agent. FIIOC receives account fees and asset-based fees that vary according to account size and type of account. FIIOC pays for typesetting, printing and mailing of shareholder reports, except proxy statements. For the period, transfer agent fees were equivalent to the following annual rates expressed as a percentage of average net assets:
| Communications Equipment Portfolio | .22% |
| Computers Portfolio | .15% |
| IT Services Portfolio | .16% |
| Semiconductors Portfolio | .14% |
| Software and IT Services Portfolio | .15% |
| Technology Portfolio | .14% |
Accounting Fees. Fidelity Service Company, Inc. (FSC), an affiliate of the investment adviser, maintains each Fund's accounting records. The accounting fee is based on the level of average net assets for each month. For the period, the fees were equivalent to the following annual rates:
| | % of Average Net Assets |
| Communications Equipment Portfolio | .04 |
| Computers Portfolio | .04 |
| IT Services Portfolio | .03 |
| Semiconductors Portfolio | .02 |
| Software and IT Services Portfolio | .01 |
| Technology Portfolio | .01 |
Brokerage Commissions. A portion of portfolio transactions were placed with brokerage firms which are affiliates of the investment adviser. Brokerage commissions are included in net realized gain (loss) and change in net unrealized appreciation (depreciation) in the Statement of Operations. The commissions paid to these affiliated firms were as follows:
| | Amount |
| Communications Equipment Portfolio | $11,323 |
| Computers Portfolio | 16,776 |
| IT Services Portfolio | 37,479 |
| Semiconductors Portfolio | 119,654 |
| Software and IT Services Portfolio | 60,462 |
| Technology Portfolio | 227,978 |
Interfund Lending Program. Pursuant to an Exemptive Order issued by the SEC, each Fund, along with other registered investment companies having management contracts with Fidelity Management & Research Company LLC (FMR), or other affiliated entities of FMR, may participate in an interfund lending program. This program provides an alternative credit facility allowing each Fund to borrow from, or lend money to, other participating affiliated funds. At period end, Computers Portfolio, IT Services Portfolio, Semiconductors Portfolio and Technology Portfolio had no interfund loans outstanding. Activity in this program during the period for which loans were outstanding was as follows:
| | Borrower or Lender | Average Loan Balance | Weighted Average Interest Rate | Interest Expense |
| Computers Portfolio | Borrower | $5,465,667 | 1.25% | $570 |
| IT Services Portfolio | Borrower | 7,244,300 | .33% | 7,290 |
| Semiconductors Portfolio | Borrower | 31,172,500 | 1.59% | 5,523 |
| Technology Portfolio | Borrower | 21,525,417 | .40% | 43,816 |
Interfund Trades. Funds may purchase from or sell securities to other Fidelity Funds under procedures adopted by the Board. The procedures have been designed to ensure these interfund trades are executed in accordance with Rule 17a-7 of the 1940 Act. Any interfund trades are included within the respective purchases and sales amounts shown in the Purchases and Sales of Investments note and are noted in the table below.
| | Purchases ($) | Sales ($) |
| Communications Equipment Portfolio | 10,651,598 | 5,337,761 |
| Computers Portfolio | 17,317,780 | 30,061,282 |
| IT Services Portfolio | 132,666,691 | 151,631,167 |
| Semiconductors Portfolio | 349,648,189 | 517,201,095 |
| Software and IT Services Portfolio | 301,937,625 | 263,817,701 |
| Technology Portfolio | 1,281,754,464 | 675,109,966 |
Prior Fiscal Year Affiliated Redemptions In-Kind. During the prior period, 5,658,948 shares of Technology Portfolio were redeemed in-kind for investments and cash with a value of $97,220,739. The Fund had a net realized gain of $44,795,304 on investments delivered through in-kind redemptions. The amount of the in-kind redemptions is included in share transactions in the accompanying Statement of Changes in Net Assets. Technology Portfolio recognized no gain or loss for federal income tax purposes.
Other. During the period, the investment adviser reimbursed the Funds for certain losses as follows:
| | Amount |
| Technology Portfolio | $83,755 |
6. Committed Line of Credit.
Certain Funds participate with other funds managed by the investment adviser or an affiliate in a $4.25 billion credit facility (the "line of credit") to be utilized for temporary or emergency purposes to fund shareholder redemptions or for other short-term liquidity purposes. The participating funds have agreed to pay commitment fees on their pro-rata portion of the line of credit, which are reflected in Miscellaneous expenses on the Statement of Operations, and are listed below.
| | Amount |
| Communications Equipment Portfolio | $335 |
| Computers Portfolio | 1,272 |
| IT Services Portfolio | 9,179 |
| Semiconductors Portfolio | 9,256 |
| Software and IT Services Portfolio | 21,737 |
| Technology Portfolio | 18,790 |
During the period, there were no borrowings on this line of credit.
7. Security Lending.
Funds lend portfolio securities from time to time in order to earn additional income. Lending agents are used, including National Financial Services (NFS), an affiliate of the investment adviser. Pursuant to a securities lending agreement, NFS will receive a fee, which is capped at 9.9% of a fund's daily lending revenue, for its services as lending agent. A fund may lend securities to certain qualified borrowers, including NFS. On the settlement date of the loan, a fund receives collateral (in the form of U.S. Treasury obligations, letters of credit and/or cash) against the loaned securities and maintains collateral in an amount not less than 100% of the market value of the loaned securities during the period of the loan. The market value of the loaned securities is determined at the close of business of a fund and any additional required collateral is delivered to a fund on the next business day. A fund or borrower may terminate the loan at any time, and if the borrower defaults on its obligation to return the securities loaned because of insolvency or other reasons, a fund may apply collateral received from the borrower against the obligation. A fund may experience delays and costs in recovering the securities loaned. Any cash collateral received is invested in the Fidelity Securities Lending Cash Central Fund. Any loaned securities are identified as such in the Schedule of Investments, and the value of loaned securities and cash collateral at period end, as applicable, are presented in the Statement of Assets and Liabilities. Security lending income represents the income earned on investing cash collateral, less rebates paid to borrowers and any lending agent fees associated with the loan, plus any premium payments received for lending certain types of securities. Security lending income is presented in the Statement of Operations as a component of income from Fidelity Central Funds. Affiliated security lending activity, if any, was as follows:
| | Total Security Lending Income Fees Paid to NFS | Security Lending Income From Securities Loaned to NFS | Value of Securities Loaned to NFS at Period End |
| Communications Equipment Portfolio | $11,280 | $3,459 | $– |
| Computers Portfolio | 3,190 | 99 | – |
| IT Services Portfolio | 119,560 | 11,255 | – |
| Semiconductors Portfolio | 6,085 | 612 | – |
| Software and IT Services Portfolio | 58,604 | – | – |
| Technology Portfolio | 59,999 | 2,358 | – |
8. Bank Borrowings.
Each Fund is permitted to have bank borrowings for temporary or emergency purposes to fund shareholder redemptions or for other short-term liquidity requirements. Each Fund has established borrowing arrangements with certain banks. The interest rate on the borrowings is the bank's base rate, as revised from time to time. Any open loans, including accrued interest, at period end are presented under the caption "Notes payable" in the Statement of Assets and Liabilities, if applicable. Activity in this program during the period for which loans were outstanding was as follows:
| | Average Loan Balance | Weighted Average Interest Rate | Interest Expense |
| IT Services Portfolio | $5,847,714 | .59% | $1,342 |
| Technology Portfolio | 16,826,000 | .59% | 552 |
9. Expense Reductions.
Commissions paid to certain brokers with whom the investment adviser, or its affiliates, places trades on behalf of certain Funds include an amount in addition to trade execution, which may be rebated back to the Funds to offset expenses. In addition, through arrangements with each applicable Fund's custodian, credits realized as a result of certain uninvested cash balances were used to reduce each applicable Fund's expenses. All of the applicable expense reductions are noted in the table below.
| | Brokerage service rebates | Custodian credits |
| Communications Equipment Portfolio | $36,491 | $– |
| Computers Portfolio | 85,139 | – |
| IT Services Portfolio | 102,375 | – |
| Semiconductors Portfolio | 407,106 | 432 |
| Software and IT Services Portfolio | 168,789 | 3,335 |
| Technology Portfolio | 887,170 | – |
In addition, during the period the investment adviser or an affiliate reimbursed and/or waived a portion of operating expenses as follows:
| | Amount |
| Communications Equipment Portfolio | $570 |
| Computers Portfolio | 2,134 |
| IT Services Portfolio | 14,660 |
| Semiconductors Portfolio | 15,776 |
| Software and IT Services Portfolio | 33,311 |
| Technology Portfolio | 29,278 |
10. Other.
The Funds' organizational documents provide former and current trustees and officers with a limited indemnification against liabilities arising in connection with the performance of their duties to the Funds. In the normal course of business, the Funds may also enter into contracts that provide general indemnifications. The Funds' maximum exposure under these arrangements is unknown as this would be dependent on future claims that may be made against the Funds. The risk of material loss from such claims is considered remote.
11. Coronavirus (COVID-19) Pandemic.
An outbreak of COVID-19 first detected in China during December 2019 has since spread globally and was declared a pandemic by the World Health Organization during March 2020. Developments that disrupt global economies and financial markets, such as the COVID-19 pandemic, may magnify factors that affect the Funds' performance.
Report of Independent Registered Public Accounting Firm
To the Board of Trustees of Fidelity Select Portfolios and the Shareholders of Communications Equipment Portfolio, Computers Portfolio, IT Services Portfolio, Semiconductors Portfolio, Software and IT Services Portfolio and Technology Portfolio
Opinions on the Financial Statements
We have audited the accompanying statements of assets and liabilities, including the schedules of investments, of Communications Equipment Portfolio, Computers Portfolio, IT Services Portfolio, Semiconductors Portfolio, Software and IT Services Portfolio, and Technology Portfolio (six of the funds constituting Fidelity Select Portfolios, hereafter collectively referred to as the “Funds”) as of February 28, 2021, the related statements of operations for the year ended February 28, 2021, the statements of changes in net assets for each of the two years in the period ended February 28, 2021, including the related notes, and the financial highlights for each of the five years in the period ended February 28, 2021 (collectively referred to as the “financial statements”). In our opinion, the financial statements present fairly, in all material respects, the financial position of each of the Funds as of February 28, 2021, the results of each of their operations for the year then ended, the changes in each of their net assets for each of the two years in the period ended February 28, 2021 and each of the financial highlights for each of the five years in the period ended February 28, 2021 in conformity with accounting principles generally accepted in the United States of America.
Basis for Opinions
These financial statements are the responsibility of the Funds’ management. Our responsibility is to express an opinion on the Funds’ financial statements based on our audits. We are a public accounting firm registered with the Public Company Accounting Oversight Board (United States) (PCAOB) and are required to be independent with respect to the Funds in accordance with the U.S. federal securities laws and the applicable rules and regulations of the Securities and Exchange Commission and the PCAOB.
We conducted our audits of these financial statements in accordance with the standards of the PCAOB. Those standards require that we plan and perform the audit to obtain reasonable assurance about whether the financial statements are free of material misstatement, whether due to error or fraud.
Our audits included performing procedures to assess the risks of material misstatement of the financial statements, whether due to error or fraud, and performing procedures that respond to those risks. Such procedures included examining, on a test basis, evidence regarding the amounts and disclosures in the financial statements. Our audits also included evaluating the accounting principles used and significant estimates made by management, as well as evaluating the overall presentation of the financial statements. Our procedures included confirmation of securities owned as of February 28, 2021 by correspondence with the custodians, issuers of privately offered securities and brokers; when replies were not received from brokers, we performed other auditing procedures. We believe that our audits provide a reasonable basis for our opinions.
/s/ PricewaterhouseCoopers LLP
Boston, Massachusetts
April 16, 2021
We have served as the auditor of one or more investment companies in the Fidelity group of funds since 1932.
Trustees and Officers
The Trustees, Members of the Advisory Board (if any), and officers of the trust and funds, as applicable, are listed below. The Board of Trustees governs each fund and is responsible for protecting the interests of shareholders. The Trustees are experienced executives who meet periodically throughout the year to oversee each fund's activities, review contractual arrangements with companies that provide services to each fund, oversee management of the risks associated with such activities and contractual arrangements, and review each fund's performance. Each of the Trustees oversees 309 funds.
The Trustees hold office without limit in time except that (a) any Trustee may resign; (b) any Trustee may be removed by written instrument, signed by at least two-thirds of the number of Trustees prior to such removal; (c) any Trustee who requests to be retired or who has become incapacitated by illness or injury may be retired by written instrument signed by a majority of the other Trustees; and (d) any Trustee may be removed at any special meeting of shareholders by a two-thirds vote of the outstanding voting securities of the trust. Each Trustee who is not an interested person (as defined in the 1940 Act) of the trust and the funds is referred to herein as an Independent Trustee. Each Independent Trustee shall retire not later than the last day of the calendar year in which his or her 75th birthday occurs. The Independent Trustees may waive this mandatory retirement age policy with respect to individual Trustees. Officers and Advisory Board Members hold office without limit in time, except that any officer or Advisory Board Member may resign or may be removed by a vote of a majority of the Trustees at any regular meeting or any special meeting of the Trustees. Except as indicated, each individual has held the office shown or other offices in the same company for the past five years.
Each fund’s Statement of Additional Information (SAI) includes more information about the Trustees. To request a free copy, call Fidelity at 1-800-544-8544.
Experience, Skills, Attributes, and Qualifications of the Trustees. The Governance and Nominating Committee has adopted a statement of policy that describes the experience, qualifications, attributes, and skills that are necessary and desirable for potential Independent Trustee candidates (Statement of Policy). The Board believes that each Trustee satisfied at the time he or she was initially elected or appointed a Trustee, and continues to satisfy, the standards contemplated by the Statement of Policy. The Governance and Nominating Committee also engages professional search firms to help identify potential Independent Trustee candidates who have the experience, qualifications, attributes, and skills consistent with the Statement of Policy. From time to time, additional criteria based on the composition and skills of the current Independent Trustees, as well as experience or skills that may be appropriate in light of future changes to board composition, business conditions, and regulatory or other developments, have also been considered by the professional search firms and the Governance and Nominating Committee. In addition, the Board takes into account the Trustees' commitment and participation in Board and committee meetings, as well as their leadership of standing and ad hoc committees throughout their tenure.
In determining that a particular Trustee was and continues to be qualified to serve as a Trustee, the Board has considered a variety of criteria, none of which, in isolation, was controlling. The Board believes that, collectively, the Trustees have balanced and diverse experience, qualifications, attributes, and skills, which allow the Board to operate effectively in governing each fund and protecting the interests of shareholders. Information about the specific experience, skills, attributes, and qualifications of each Trustee, which in each case led to the Board's conclusion that the Trustee should serve (or continue to serve) as a trustee of the funds, is provided below.
Board Structure and Oversight Function. Robert A. Lawrence is an interested person and currently serves as Acting Chairman. The Trustees have determined that an interested Chairman is appropriate and benefits shareholders because an interested Chairman has a personal and professional stake in the quality and continuity of services provided to the funds. Independent Trustees exercise their informed business judgment to appoint an individual of their choosing to serve as Chairman, regardless of whether the Trustee happens to be independent or a member of management. The Independent Trustees have determined that they can act independently and effectively without having an Independent Trustee serve as Chairman and that a key structural component for assuring that they are in a position to do so is for the Independent Trustees to constitute a substantial majority for the Board. The Independent Trustees also regularly meet in executive session. David M. Thomas serves as Lead Independent Trustee and as such (i) acts as a liaison between the Independent Trustees and management with respect to matters important to the Independent Trustees and (ii) with management prepares agendas for Board meetings.
Fidelity® funds are overseen by different Boards of Trustees. The funds' Board oversees Fidelity's high income and certain equity funds, and other Boards oversee Fidelity's investment-grade bond, money market, asset allocation, and other equity funds. The asset allocation funds may invest in Fidelity® funds overseen by the funds' Board. The use of separate Boards, each with its own committee structure, allows the Trustees of each group of Fidelity® funds to focus on the unique issues of the funds they oversee, including common research, investment, and operational issues. On occasion, the separate Boards establish joint committees to address issues of overlapping consequences for the Fidelity® funds overseen by each Board.
The Trustees operate using a system of committees to facilitate the timely and efficient consideration of all matters of importance to the Trustees, each fund, and fund shareholders and to facilitate compliance with legal and regulatory requirements and oversight of the funds' activities and associated risks. The Board, acting through its committees, has charged FMR and its affiliates with (i) identifying events or circumstances the occurrence of which could have demonstrably adverse effects on the funds' business and/or reputation; (ii) implementing processes and controls to lessen the possibility that such events or circumstances occur or to mitigate the effects of such events or circumstances if they do occur; and (iii) creating and maintaining a system designed to evaluate continuously business and market conditions in order to facilitate the identification and implementation processes described in (i) and (ii) above. Because the day-to-day operations and activities of the funds are carried out by or through FMR, its affiliates, and other service providers, the funds' exposure to risks is mitigated but not eliminated by the processes overseen by the Trustees. While each of the Board's committees has responsibility for overseeing different aspects of the funds' activities, oversight is exercised primarily through the Operations, Audit, and Compliance Committees. Appropriate personnel, including but not limited to the funds' Chief Compliance Officer (CCO), FMR's internal auditor, the independent accountants, the funds' Treasurer and portfolio management personnel, make periodic reports to the Board's committees, as appropriate, including an annual review of Fidelity's risk management program for the Fidelity® funds. The responsibilities of each standing committee, including their oversight responsibilities, are described further under "Standing Committees of the Trustees."
Interested Trustees*:
Correspondence intended for a Trustee who is an interested person may be sent to Fidelity Investments, 245 Summer Street, Boston, Massachusetts 02210.
Name, Year of Birth; Principal Occupations and Other Relevant Experience+
Bettina Doulton (1964)
Year of Election or Appointment: 2020
Trustee
Ms. Doulton also serves as Trustee of other Fidelity® funds. Prior to her retirement, Ms. Doulton served in a variety of positions at Fidelity Investments, including as a managing director of research (2006-2007), portfolio manager to certain Fidelity® funds (1993-2005), equity analyst and portfolio assistant (1990-1993), and research assistant (1987-1990). Ms. Doulton currently owns and operates Phi Builders + Architects and Cellardoor Winery. Previously, Ms. Doulton served as a member of the Board of Brown Capital Management, LLC (2013-2018).
Robert A. Lawrence (1952)
Year of Election or Appointment: 2020
Trustee
Acting Chairman of the Board of Trustees
Mr. Lawrence also serves as Trustee of other funds. Previously, Mr. Lawrence served as a Member of the Advisory Board of certain funds. Prior to his retirement in 2008, Mr. Lawrence served as Vice President of certain Fidelity® funds (2006-2008), Senior Vice President, Head of High Income Division of Fidelity Management & Research Company (investment adviser firm, 2006-2008), and President of Fidelity Strategic Investments (investment adviser firm, 2002-2005).
* Determined to be an “Interested Trustee” by virtue of, among other things, his or her affiliation with the trust or various entities under common control with FMR.
+ The information includes the Trustee's principal occupation during the last five years and other information relating to the experience, attributes, and skills relevant to the Trustee's qualifications to serve as a Trustee, which led to the conclusion that the Trustee should serve as a Trustee for each fund.
Independent Trustees:
Correspondence intended for an Independent Trustee may be sent to Fidelity Investments, P.O. Box 55235, Boston, Massachusetts 02205-5235.
Name, Year of Birth; Principal Occupations and Other Relevant Experience+
Dennis J. Dirks (1948)
Year of Election or Appointment: 2018
Trustee
Mr. Dirks also serves as Trustee of other Fidelity® funds. Prior to his retirement in May 2003, Mr. Dirks served as Chief Operating Officer and as a member of the Board of The Depository Trust & Clearing Corporation (financial markets infrastructure), President, Chief Operating Officer and a member of the Board of The Depository Trust Company (DTC), President and a member of the Board of the National Securities Clearing Corporation (NSCC), Chief Executive Officer and a member of the Board of the Government Securities Clearing Corporation and Chief Executive Officer and a member of the Board of the Mortgage-Backed Securities Clearing Corporation. Mr. Dirks currently serves as a member of the Finance Committee (2016-present) and Board (2017-present) and is Treasurer (2018-present) of the Asolo Repertory Theatre.
Donald F. Donahue (1950)
Year of Election or Appointment: 2018
Trustee
Mr. Donahue also serves as Trustee of other Fidelity® funds. Mr. Donahue serves as President and Chief Executive Officer of Miranda Partners, LLC (risk consulting for the financial services industry, 2012-present). Previously, Mr. Donahue served as Chief Executive Officer (2006-2012), Chief Operating Officer (2003-2006) and Managing Director, Customer Marketing and Development (1999-2003) of The Depository Trust & Clearing Corporation (financial markets infrastructure). Mr. Donahue currently serves as a member (2007-present) and Co-Chairman (2016-present) of the Board of United Way of New York, a member of the Board of NYC Leadership Academy (2012-present) and a member of the Board of Advisors of Ripple Labs, Inc. (financial services, 2015-present). Mr. Donahue previously served as a member of the Advisory Board of certain Fidelity® funds (2015-2018).
Vicki L. Fuller (1957)
Year of Election or Appointment: 2020
Trustee
Ms. Fuller also serves as Trustee of other Fidelity® funds. Previously, Ms. Fuller served as a member of the Advisory Board of certain Fidelity® funds (2018-2020), Chief Investment Officer of the New York State Common Retirement Fund (2012-2018) and held a variety of positions at AllianceBernstein L.P. (global asset management, 1985-2012), including Managing Director (2006-2012) and Senior Vice President and Senior Portfolio Manager (2001-2006). Ms. Fuller currently serves as a member of the Board, Audit Committee and Nominating and Governance Committee of The Williams Companies, Inc. (natural gas infrastructure, 2018-present), as a member of the Board, Audit Committee and Nominating and Governance Committee of two Blackstone business development companies (2020-present) and as a member of the Board of Treliant, LLC (consulting, 2019-present).
Patricia L. Kampling (1959)
Year of Election or Appointment: 2020
Trustee
Ms. Kampling also serves as Trustee of other Fidelity® funds. Prior to her retirement, Ms. Kampling served as Chairman of the Board and Chief Executive Officer (2012-2019), President and Chief Operating Officer (2011-2012) and Executive Vice President and Chief Financial Officer (2010-2011) of Alliant Energy Corporation. Ms. Kampling currently serves as a member of the Board, Compensation Committee and Executive Committee and as Chair of the Audit Committee of Briggs & Stratton Corporation (manufacturing, 2011-present) and as a member of the Board, Audit, Finance and Risk Committee and Safety, Environmental, Technology and Operations Committee of American Water Works Company, Inc. (utilities company, 2019-present). In addition, Ms. Kampling currently serves as a member of the Board of the Nature Conservancy, Wisconsin Chapter (2019-present). Previously, Ms. Kampling served as a Member of the Advisory Board of certain Fidelity® funds (2020), a member of the Board of Interstate Power and Light Company (2012-2019) and Wisconsin Power and Light Company (2012-2019) (each a subsidiary of Alliant Energy Corporation) and as a member of the Board and Workforce Development Committee of the Business Roundtable (2018-2019).
Thomas A. Kennedy (1955)
Year of Election or Appointment: 2021
Trustee
Mr. Kennedy also serves as Trustee of other Fidelity® funds. Previously, Mr. Kennedy served as a Member of the Advisory Board of certain Fidelity® funds (2020) and held a variety of positions at Raytheon Company (aerospace and defense, 1983-2020), including Chairman and Chief Executive Officer (2014-2020) and Executive Vice President and Chief Operating Officer (2013-2014). Mr. Kennedy currently serves as Executive Chairman of the Board of Directors of Raytheon Technologies Corporation (aerospace and defense, 2020-present). He is also a member of the Rutgers School of Engineering Industry Advisory Board (2011-present) and a member of the UCLA Engineering Dean’s Executive Board (2016-present).
Garnett A. Smith (1947)
Year of Election or Appointment: 2013
Trustee
Mr. Smith also serves as Trustee of other Fidelity® funds. Prior to his retirement, Mr. Smith served as Chairman and Chief Executive Officer (1990-1997) and President (1986-1990) of Inbrand Corp. (manufacturer of personal absorbent products). Prior to his employment with Inbrand Corp., he was employed by a retail fabric chain and North Carolina National Bank (now Bank of America). Mr. Smith previously served as a member of the Advisory Board of certain Fidelity® funds (2012-2013).
David M. Thomas (1949)
Year of Election or Appointment: 2018
Trustee
Lead Independent Trustee
Mr. Thomas also serves as Trustee of other Fidelity® funds. Previously, Mr. Thomas served as Executive Chairman (2005-2006) and Chairman and Chief Executive Officer (2000-2005) of IMS Health, Inc. (pharmaceutical and healthcare information solutions). Mr. Thomas currently serves as Non-Executive Chairman of the Board of Fortune Brands Home and Security (home and security products, 2011-present), and a member of the Board (2004-present) and Presiding Director (2013-present) of Interpublic Group of Companies, Inc. (marketing communication).
Susan Tomasky (1953)
Year of Election or Appointment: 2020
Trustee
Ms. Tomasky also serves as Trustee of other Fidelity® funds. Prior to her retirement, Ms. Tomasky served in various executive officer positions at American Electric Power Company, Inc. (1998-2011), including most recently as President of AEP Transmission (2007-2011). Ms. Tomasky currently serves as a member of the Board and Sustainability Committee and as Chair of the Audit Committee of Marathon Petroleum Corporation (2018-present) and as a member of the Board, Corporate Governance Committee and Organization and Compensation Committee and as Chair of the Audit Committee of Public Service Enterprise Group, Inc. (utilities company, 2012-present). In addition, Ms. Tomasky currently serves as a member of the Board of the Columbus Regional Airport Authority (2007-present), as a member of the Board of the Royal Shakespeare Company – America (2009-present), as a member of the Board of the Columbus Association for the Performing Arts (2011-present) and as a member of the Board of Kenyon College (2016-present). Previously, Ms. Tomasky served as a Member of the Advisory Board of certain Fidelity® funds (2020), a member of the Board (2011-2019) and as Lead Independent Director (2015-2018) of Andeavor Corporation (previously Tesoro Corporation) (independent oil refiner and marketer) and as a member of the Board of Summit Midstream Partners LP (energy, 2012-2018).
Michael E. Wiley (1950)
Year of Election or Appointment: 2008
Trustee
Mr. Wiley also serves as Trustee of other Fidelity® funds. Previously, Mr. Wiley served as a member of the Advisory Board of certain Fidelity® funds (2018-2020), Chairman, President and CEO of Baker Hughes, Inc. (oilfield services, 2000-2004). Mr. Wiley also previously served as a member of the Board of Andeavor Corporation (independent oil refiner and marketer, 2005-2018), a member of the Board of Andeavor Logistics LP (natural resources logistics, 2015-2018) and a member of the Board of High Point Resources (exploration and production, 2005-2020).
+ The information includes the Trustee's principal occupation during the last five years and other information relating to the experience, attributes, and skills relevant to the Trustee's qualifications to serve as a Trustee, which led to the conclusion that the Trustee should serve as a Trustee for each fund.
Advisory Board Members and Officers:
Correspondence intended for a Member of the Advisory Board (if any) may be sent to Fidelity Investments, P.O. Box 55235, Boston, Massachusetts 02205-5235. Correspondence intended for an officer or Peter S. Lynch may be sent to Fidelity Investments, 245 Summer Street, Boston, Massachusetts 02210. Officers appear below in alphabetical order.
Name, Year of Birth; Principal Occupation
Ned C. Lautenbach (1944)
Year of Election or Appointment: 2021
Member of the Advisory Board
Mr. Lautenbach also serves as a Member of the Advisory Board of other Fidelity® funds. Mr. Lautenbach currently serves as Chair of the Board of Governors, State University System of Florida (2013-present) and is a member of the Council on Foreign Relations (1994-present). He is also a member and has in the past served as Chairman of the Board of Directors of Artis-Naples (2012-present). Previously, Mr. Lautenbach served as a Trustee of certain Fidelity® funds (2000-2020) and a member and then Lead Director of the Board of Directors of Eaton Corporation (diversified industrial, 1997-2016). He was also a Partner at Clayton, Dubilier & Rice, LLC (private equity investment, 1998-2010); as well as Director of Sony Corporation (2006-2007). In addition, Mr. Lautenbach had a 30-year career with IBM (technology company), during which time he served as Senior Vice President and as a member of the Corporate Executive Committee (1968-1998).
Peter S. Lynch (1944)
Year of Election or Appointment: 2018
Member of the Advisory Board
Mr. Lynch also serves as a Member of the Advisory Board of other Fidelity® funds. Mr. Lynch is Vice Chairman and a Director of Fidelity Management & Research Company LLC (investment adviser firm). In addition, Mr. Lynch serves as a Trustee of Boston College and as the Chairman of the Inner-City Scholarship Fund. Previously, Mr. Lynch served as Vice Chairman and a Director of FMR Co., Inc. (investment adviser firm) and on the Special Olympics International Board of Directors (1997-2006).
Craig S. Brown (1977)
Year of Election or Appointment: 2019
Assistant Treasurer
Mr. Brown also serves as Assistant Treasurer of other funds. Mr. Brown is an employee of Fidelity Investments (2013-present).
John J. Burke III (1964)
Year of Election or Appointment: 2018
Chief Financial Officer
Mr. Burke also serves as Chief Financial Officer of other funds. Mr. Burke serves as Head of Investment Operations for Fidelity Fund and Investment Operations (2018-present) and is an employee of Fidelity Investments (1998-present). Previously Mr. Burke served as head of Asset Management Investment Operations (2012-2018).
William C. Coffey (1969)
Year of Election or Appointment: 2019
Assistant Secretary
Mr. Coffey also serves as Assistant Secretary of other funds. He is Senior Vice President and Deputy General Counsel of FMR LLC (diversified financial services company, 2010-present), and is an employee of Fidelity Investments. Previously, Mr. Coffey served as Secretary and CLO of certain funds (2018-2019); CLO, Secretary, and Senior Vice President of Fidelity Management & Research Company and FMR Co., Inc. (investment adviser firms, 2018-2019); Secretary of Fidelity SelectCo, LLC and Fidelity Investments Money Management, Inc. (investment adviser firms, 2018-2019); CLO of Fidelity Management & Research (Hong Kong) Limited, FMR Investment Management (UK) Limited, and Fidelity Management & Research (Japan) Limited (investment adviser firms, 2018-2019); and Assistant Secretary of certain funds (2009-2018).
Timothy M. Cohen (1969)
Year of Election or Appointment: 2018
Vice President
Mr. Cohen also serves as Vice President of other funds. Mr. Cohen serves as Co-Head of Equity (2018-present), a Director of Fidelity Management & Research (Japan) Limited (investment adviser firm, 2016-present), and is an employee of Fidelity Investments. Previously, Mr. Cohen served as Executive Vice President of Fidelity SelectCo, LLC (2019), Head of Global Equity Research (2016-2018), Chief Investment Officer - Equity and a Director of Fidelity Management & Research (U.K.) Inc. (investment adviser firm, 2013-2015) and as a Director of Fidelity Management & Research (Hong Kong) Limited (investment adviser firm, 2017).
Jonathan Davis (1968)
Year of Election or Appointment: 2010
Assistant Treasurer
Mr. Davis also serves as Assistant Treasurer of other funds. Mr. Davis serves as Assistant Treasurer of FMR Capital, Inc. (2017-present) and is an employee of Fidelity Investments. Previously, Mr. Davis served as Vice President and Associate General Counsel of FMR LLC (diversified financial services company, 2003-2010).
Laura M. Del Prato (1964)
Year of Election or Appointment: 2018
Assistant Treasurer
Ms. Del Prato also serves as an officer of other funds. Ms. Del Prato is an employee of Fidelity Investments (2017-present). Previously, Ms. Del Prato served as President and Treasurer of The North Carolina Capital Management Trust: Cash Portfolio and Term Portfolio (2018-2020). Prior to joining Fidelity Investments, Ms. Del Prato served as a Managing Director and Treasurer of the JPMorgan Mutual Funds (2014-2017). Prior to JPMorgan, Ms. Del Prato served as a partner at Cohen Fund Audit Services (accounting firm, 2012-2013) and KPMG LLP (accounting firm, 2004-2012).
Colm A. Hogan (1973)
Year of Election or Appointment: 2020
Assistant Treasurer
Mr. Hogan also serves as an officer of other funds. Mr. Hogan serves as Assistant Treasurer of FMR Capital, Inc. (2017-present) and is an employee of Fidelity Investments (2005-present). Previously, Mr. Hogan served as Deputy Treasurer of certain Fidelity® funds (2016-2020) and Assistant Treasurer of certain Fidelity® funds (2016-2018).
Pamela R. Holding (1964)
Year of Election or Appointment: 2018
Vice President
Ms. Holding also serves as Vice President of other funds. Ms. Holding serves as Co-Head of Equity (2018-present) and is an employee of Fidelity Investments (2013-present). Previously, Ms. Holding served as Executive Vice President of Fidelity SelectCo, LLC (2019) and as Chief Investment Officer of Fidelity Institutional Asset Management (2013-2018).
Cynthia Lo Bessette (1969)
Year of Election or Appointment: 2019
Secretary and Chief Legal Officer (CLO)
Ms. Lo Bessette also serves as an officer of other funds. Ms. Lo Bessette serves as CLO, Secretary, and Senior Vice President of Fidelity Management & Research Company LLC (investment adviser firm, 2019-present); and CLO of Fidelity Management & Research (Hong Kong) Limited, FMR Investment Management (UK) Limited, and Fidelity Management & Research (Japan) Limited (investment adviser firms, 2019-present). She is a Senior Vice President and Deputy General Counsel of FMR LLC (diversified financial services company, 2019-present), and is an employee of Fidelity Investments. Previously, Ms. Lo Bessette served as CLO, Secretary, and Senior Vice President of FMR Co., Inc. (investment adviser firm, 2019); Secretary of Fidelity SelectCo, LLC and Fidelity Investments Money Management, Inc. (investment adviser firms, 2019). Prior to joining Fidelity Investments, Ms. Lo Bessette was Executive Vice President, General Counsel (2016-2019) and Senior Vice President, Deputy General Counsel (2015-2016) of OppenheimerFunds (investment management company) and Deputy Chief Legal Officer (2013-2015) of Jennison Associates LLC (investment adviser firm).
Chris Maher (1972)
Year of Election or Appointment: 2020
Deputy Treasurer
Mr. Maher also serves as an officer of other funds. Mr. Maher serves as Assistant Treasurer of FMR Capital, Inc. (2017-present), and is an employee of Fidelity Investments (2008-present). Previously, Mr. Maher served as Assistant Treasurer of certain funds (2013-2020); Vice President of Asset Management Compliance (2013), Vice President of the Program Management Group of FMR (investment adviser firm, 2010-2013), and Vice President of Valuation Oversight (2008-2010).
Jason P. Pogorelec (1975)
Year of Election or Appointment: 2020
Chief Compliance Officer
Mr. Pogorelec also serves as Chief Compliance Officer of other funds. Mr. Pogorelec is a senior Vice President of Asset Management Compliance for Fidelity Investments and is an employee of Fidelity Investments (2006-present). Previously, Mr. Pogorelec served as Vice President, Associate General Counsel for Fidelity Investments (2010-2020) and Assistant Secretary of certain Fidelity funds (2015-2020).
Brett Segaloff (1972)
Year of Election or Appointment: 2021
Anti-Money Laundering (AML) Officer
Mr. Segaloff also serves as an AML Officer of other funds and other related entities. He is Director, Anti-Money Laundering (2007-present) of FMR LLC (diversified financial services company) and is an employee of Fidelity Investments (1996-present).
Stacie M. Smith (1974)
Year of Election or Appointment: 2018
President and Treasurer
Ms. Smith also serves as an officer of other funds. Ms. Smith serves as Assistant Treasurer of FMR Capital, Inc. (2017-present), is an employee of Fidelity Investments (2009-present), and has served in other fund officer roles. Prior to joining Fidelity Investments, Ms. Smith served as Senior Audit Manager of Ernst & Young LLP (accounting firm, 1996-2009). Previously, Ms. Smith served as Assistant Treasurer (2013-2019) and Deputy Treasurer (2013-2016) of certain Fidelity® funds.
Marc L. Spector (1972)
Year of Election or Appointment: 2017
Assistant Treasurer
Mr. Spector also serves as an officer of other funds. Mr. Spector serves as Assistant Treasurer of FMR Capital, Inc. (2017-present) and is an employee of Fidelity Investments (2016-present). Prior to joining Fidelity Investments, Mr. Spector served as Director at the Siegfried Group (accounting firm, 2013-2016), and prior to Siegfried Group as audit senior manager at Deloitte & Touche LLP (accounting firm, 2005-2013).
Jim Wegmann (1979)
Year of Election or Appointment: 2019
Assistant Treasurer
Mr. Wegmann also serves as Assistant Treasurer of other funds. Mr. Wegmann is an employee of Fidelity Investments (2011-present).
Shareholder Expense Example
As a shareholder, you incur two types of costs: (1) transaction costs, which may include sales charges (loads) on purchase payments or redemption proceeds, as applicable and (2) ongoing costs, which generally include management fees, distribution and/or service (12b-1) fees and other Fund expenses. This Example is intended to help you understand your ongoing costs (in dollars) of investing in a fund and to compare these costs with the ongoing costs of investing in other mutual funds.
The Example is based on an investment of $1,000 invested at the beginning of the period and held for the entire period (September 1, 2020 to February 28, 2021).
Actual Expenses
The first line of the accompanying table provides information about actual account values and actual expenses. You may use the information in this line, together with the amount you invested, to estimate the expenses that you paid over the period. Simply divide your account value by $1,000.00 (for example, an $8,600 account value divided by $1,000.00 = 8.6), then multiply the result by the number in the first line for a class/Fund under the heading entitled "Expenses Paid During Period" to estimate the expenses you paid on your account during this period. If any fund is a shareholder of any underlying mutual funds or exchange-traded funds (ETFs) (the Underlying Funds), such fund indirectly bears its proportional share of the expenses of the Underlying Funds in addition to the direct expenses incurred presented in the table. These fees and expenses are not included in the annualized expense ratio used to calculate the expense estimate in the table below.
Hypothetical Example for Comparison Purposes
The second line of the accompanying table provides information about hypothetical account values and hypothetical expenses based on the actual expense ratio and an assumed rate of return of 5% per year before expenses, which is not the actual return. The hypothetical account values and expenses may not be used to estimate the actual ending account balance or expenses you paid for the period. You may use this information to compare the ongoing costs of investing in the Fund and other funds. To do so, compare this 5% hypothetical example with the 5% hypothetical examples that appear in the shareholder reports of the other funds. If any fund is a shareholder of any Underlying Funds, such fund indirectly bears its proportional share of the expenses of the Underlying Funds in addition to the direct expenses as presented in the table. These fees and expenses are not included in the annualized expense ratio used to calculate the expense estimate in the table below.
Please note that the expenses shown in the table are meant to highlight your ongoing costs only and do not reflect any transaction costs. Therefore, the second line of the table is useful in comparing ongoing costs only, and will not help you determine the relative total costs of owning different funds. In addition, if these transactional costs were included, your costs would have been higher.
| | Annualized Expense Ratio-A | Beginning
Account Value
September 1, 2020 | Ending
Account Value
February 28, 2021 | Expenses Paid
During Period-B
September 1, 2020
to February 28, 2021 |
| Communications Equipment Portfolio | .88% | | | |
| Actual | | $1,000.00 | $1,161.70 | $4.72 |
| Hypothetical-C | | $1,000.00 | $1,020.43 | $4.41 |
| Computers Portfolio | .73% | | | |
| Actual | | $1,000.00 | $1,304.10 | $4.17 |
| Hypothetical-C | | $1,000.00 | $1,021.17 | $3.66 |
| IT Services Portfolio | .71% | | | |
| Actual | | $1,000.00 | $1,096.90 | $3.69 |
| Hypothetical-C | | $1,000.00 | $1,021.27 | $3.56 |
| Semiconductors Portfolio | .69% | | | |
| Actual | | $1,000.00 | $1,349.50 | $4.02 |
| Hypothetical-C | | $1,000.00 | $1,021.37 | $3.46 |
| Software and IT Services Portfolio | .69% | | | |
| Actual | | $1,000.00 | $1,077.20 | $3.55 |
| Hypothetical-C | | $1,000.00 | $1,021.37 | $3.46 |
| Technology Portfolio | .68% | | | |
| Actual | | $1,000.00 | $1,150.60 | $3.63 |
| Hypothetical-C | | $1,000.00 | $1,021.42 | $3.41 |
A Annualized expense ratio reflects expenses net of applicable fee waivers.
B Expenses are equal to the annualized expense ratio, multiplied by the average account value over the period, multiplied by 181/ 365 (to reflect the one-half year period). The fees and expenses of any Underlying Funds are not included in each annualized expense ratio.
C 5% return per year before expenses
Distributions (Unaudited)
The Board of Trustees of each fund voted to pay to shareholders of record at the opening of business on record date, the following distributions per share derived from capital gains realized from sales of portfolio securities, and dividends derived from net investment income:
| | Pay Date | Record Date | Dividends | Capital Gains |
| Communications Equipment Portfolio | 04/12/21 | 04/09/21 | $0.013 | $0.331 |
| Computers Portfolio | 04/12/21 | 04/09/21 | $0.464 | $9.385 |
| IT Services Portfolio | 04/12/21 | 04/09/21 | $0.000 | $3.332 |
| Semiconductors Portfolio | 04/12/21 | 04/09/21 | $0.000 | $0.712 |
| Software and IT Services Portfolio | 04/12/21 | 04/09/21 | $0.000 | $0.442 |
| Technology Portfolio | 04/12/21 | 04/09/21 | $0.000 | $1.586 |
|
The funds hereby designate as capital gain dividend the amounts noted below for the taxable year ended February 28, 2021, or, if subsequently determined to be different, the net capital gain of such year.
| Communications Equipment Portfolio | $1,351,015 |
| Computers Portfolio | $85,711,280 |
| IT Services Portfolio | $328,945,510 |
| Semiconductors Portfolio | $320,104,308 |
| Software and IT Services Portfolio | $299,911,365 |
| Technology Portfolio | $1,645,678,845 |
|
A percentage of the dividends distributed during the fiscal year for the following funds qualify for the dividends–received deduction for corporate shareholders:
| | April 2020 | December 2020 |
| Communications Equipment Portfolio | 100% | 100% |
| Computers Portfolio | 23% | 93% |
| IT Services Portfolio | 100% | – |
| Semiconductors Portfolio | 13% | 100% |
| Software and IT Services Portfolio | 76% | 24% |
| Technology Portfolio | 99% | 15% |
|
A percentage of the dividends distributed during the fiscal year for the following funds may be taken into account as a dividend for purposes of the maximum rate under section 1(h)(11) of the Internal Revenue Code.
| | April 2020 | December 2020 |
| Communications Equipment Portfolio | 100% | 100% |
| Computers Portfolio | 22% | 100% |
| IT Services Portfolio | 100% | – |
| Semiconductors Portfolio | 17% | 100% |
| Software and IT Services Portfolio | 77% | 26% |
| Technology Portfolio | 100% | 17% |
|
The funds hereby designate the percentages noted below of the short-term capital gain dividends distributed during the fiscal year as qualifying to be taxed as short-term capital gain dividends for nonresident alien shareholders:
| | April 2020 | December 2020 |
| Communications Equipment Portfolio | – | – |
| Computers Portfolio | 100% | – |
| IT Services Portfolio | – | – |
| Semiconductors Portfolio | 99.84% | – |
| Software and IT Services Portfolio | 100% | 100% |
| Technology Portfolio | – | 100% |
|
The amounts per share which represent income derived from sources within, and taxes paid to, foreign countries or possessions of the United States are as follows:
| | Pay Date | Income | Taxes |
| Computers Portfolio | 04/09/20 | $0.7473 | $0.0957 |
| | 12/21/20 | $0.5382 | $0.0762 |
|
The funds will notify shareholders in January 2022 of amounts for use in preparing 2021 income tax returns.
Board Approval of Investment Advisory Contracts
Communications Equipment Portfolio
Computers Portfolio
IT Services Portfolio
Semiconductors Portfolio
Software and IT Services Portfolio
Technology Portfolio
At its January 2021 meeting, the Board of Trustees, including the Independent Trustees (together, the Board), voted to continue the management contract with Fidelity Management & Research Company LLC (FMR), and the sub-advisory agreements and sub-subadvisory agreements, in each case, where applicable (together, the Advisory Contracts) for each fund for four months from February 1, 2021 through May 31, 2021, in connection with changes to the Board's meeting calendar.
The Board considered that the approval of each fund's Advisory Contracts will not result in any changes in (i) the investment process or strategies employed in the management of each fund's assets; (ii) the fees and expenses paid by shareholders; (iii) the nature, extent or quality of services provided under each fund's Advisory Contracts; or (iv) the day-to-day management of each fund or the persons primarily responsible for such management. The Board also considered that since its last approval of each fund's Advisory Contracts, FMR had provided additional information on each fund in support of the annual contract renewal process, including competitive analyses on total expenses and management fees and in-depth reviews of fund performance and fund profitability information. The Board also considered the findings of certain ad hoc committees that had been previously formed to discuss matters relevant to all of the Fidelity funds, including economies of scale, fall-out benefits and retail vs. institutional funds. The Board concluded that each fund's Advisory Contracts are fair and reasonable, and that each fund's Advisory Contracts should be renewed, without modification, through May 31, 2021, with the understanding that the Board will consider the annual renewal for a full one year period in May 2021.
In connection with its consideration of future renewals of each fund's Advisory Contracts, the Board will consider: (i) the nature, extent and quality of services provided to the funds, including shareholder and administrative services and investment performance; (ii) the competitiveness of the management fee and total expenses for each fund; (iii) the costs of the services and profitability, including the revenues earned and the expenses incurred in conducting the business of developing, marketing, distributing, managing, administering, and servicing each fund and its shareholders, to the extent applicable; and (iv) whether there have been economies of scale in respect of the Fidelity funds, whether the Fidelity funds (including the funds) have appropriately benefited from any such economies of scale, and whether there is the potential for realization of any further economies.
Based on its evaluation of all of the conclusions noted above, and after considering all factors it believed relevant, the Board ultimately concluded that each fund's management fee structures are fair and reasonable, and that the continuation of the funds' Advisory Contracts should be approved for four months from February 1, 2021 through May 31, 2021.
Liquidity Risk Management Program
The Securities and Exchange Commission adopted Rule 22e-4 under the Investment Company Act of 1940 (the Liquidity Rule) to promote effective liquidity risk management throughout the open-end investment company industry, thereby reducing the risk that funds will be unable to meet their redemption obligations and mitigating dilution of the interests of fund shareholders.
The Funds have adopted and implemented a liquidity risk management program pursuant to the Liquidity Rule (the Program) effective December 1, 2018. The Program is reasonably designed to assess and manage each Fund’s liquidity risk and to comply with the requirements of the Liquidity Rule. Each Fund’s Board of Trustees (the Board) has designated each Fund’s investment adviser as administrator of the Program. The Fidelity advisers have established a Liquidity Risk Management Committee (the LRM Committee) to manage the Program for each of the Fidelity Funds. The LRM Committee monitors the adequacy and effectiveness of implementation of the Program and on a periodic basis assesses each Fund’s liquidity risk based on a variety of factors including (1) the Fund’s investment strategy, (2) portfolio liquidity and cash flow projections during normal and reasonably foreseeable stressed conditions, (3) shareholder redemptions, (4) borrowings and other funding sources and (5) in the case of exchange-traded funds, certain additional factors including the effect of the Fund’s prices and spreads, market participants, and basket compositions on the overall liquidity of the Fund’s portfolio, as applicable.
In accordance with the Program, each of the Fund’s portfolio investments is classified into one of four liquidity categories described below based on a determination of a reasonable expectation for how long it would take to convert the investment to cash (or sell or dispose of the investment) without significantly changing its market value.
- Highly liquid investments – cash or convertible to cash within three business days or less
- Moderately liquid investments – convertible to cash in three to seven calendar days
- Less liquid investments – can be sold or disposed of, but not settled, within seven calendar days
- Illiquid investments – cannot be sold or disposed of within seven calendar days
Liquidity classification determinations take into account a variety of factors including various market, trading and investment-specific considerations, as well as market depth, and generally utilize analysis from a third-party liquidity metrics service.
The Liquidity Rule places a 15% limit on a fund’s illiquid investments and requires funds that do not primarily hold assets that are highly liquid investments to determine and maintain a minimum percentage of the fund’s net assets to be invested in highly liquid investments (highly liquid investment minimum or HLIM). The Program includes provisions reasonably designed to comply with the 15% limit on illiquid investments and for determining, periodically reviewing and complying with the HLIM requirement as applicable.
At a recent meeting of the Fund’s Board of Trustees, the LRM Committee provided a written report to the Board pertaining to the operation, adequacy, and effectiveness of implementation of the Program for the annual period from December 1, 2019 through November 30, 2020. The report concluded that the Program has been implemented and is operating effectively and is reasonably designed to assess and manage the Fund’s liquidity risk.
Proxy Voting Results
A special meeting of shareholders was held on June 9, 2020. The results of votes taken among shareholders on the proposal before them are reported below. Each vote reported represents one dollar of net asset value held on the record date for the meeting.
PROPOSAL 1
To elect a Board of Trustees.
| | # of
Votes | % of
Votes |
| Dennis J. Dirks |
| Affirmative | 32,463,705,305.665 | 92.437 |
| Withheld | 2,655,951,104.308 | 7.563 |
| TOTAL | 35,119,656,409.973 | 100.000 |
| Donald F. Donahue |
| Affirmative | 32,446,843,861.354 | 92.389 |
| Withheld | 2,672,812,548.619 | 7.611 |
| TOTAL | 35,119,656,409.973 | 100.000 |
| Bettina Doulton |
| Affirmative | 32,610,463,757.584 | 92.855 |
| Withheld | 2,509,192,652.389 | 7.145 |
| TOTAL | 35,119,656,409.973 | 100.000 |
| Vicki L. Fuller |
| Affirmative | 32,688,213,522.720 | 93.077 |
| Withheld | 2,431,442,887.253 | 6.923 |
| TOTAL | 35,119,656,409.973 | 100.000 |
| Patricia L. Kampling |
| Affirmative | 32,313,755,598.535 | 92.010 |
| Withheld | 2,805,900,811.438 | 7.990 |
| TOTAL | 35,119,656,409.973 | 100.000 |
| Alan J. Lacy |
| Affirmative | 31,990,158,754.948 | 91.089 |
| Withheld | 3,129,497,655.026 | 8.911 |
| TOTAL | 35,119,656,409.973 | 100.000 |
| Ned C. Lautenbach |
| Affirmative | 32,043,019,991.143 | 91.240 |
| Withheld | 3,076,636,418.830 | 8.760 |
| TOTAL | 35,119,656,409.973 | 100.000 |
| Robert A. Lawrence |
| Affirmative | 32,150,842,398.009 | 91.547 |
| Withheld | 2,968,814,011.965 | 8.453 |
| TOTAL | 35,119,656,409.973 | 100.000 |
| Joseph Mauriello |
| Affirmative | 32,082,201,213.166 | 91.351 |
| Withheld | 3,037,455,196.807 | 8.649 |
| TOTAL | 35,119,656,409.973 | 100.000 |
| Cornelia M. Small |
| Affirmative | 32,207,976,835.934 | 91.709 |
| Withheld | 2,911,679,574.039 | 8.291 |
| TOTAL | 35,119,656,409.973 | 100.000 |
| Garnett A. Smith |
| Affirmative | 32,102,654,343.096 | 91.409 |
| Withheld | 3,017,002,066.877 | 8.591 |
| TOTAL | 35,119,656,409.973 | 100.000 |
| David M. Thomas |
| Affirmative | 32,150,749,424.556 | 91.546 |
| Withheld | 2,968,906,985.418 | 8.454 |
| TOTAL | 35,119,656,409.973 | 100.000 |
| Susan Tomasky |
| Affirmative | 32,381,933,484.515 | 92.205 |
| Withheld | 2,737,722,925.459 | 7.795 |
| TOTAL | 35,119,656,409.973 | 100.000 |
| Michael E. Wiley |
| Affirmative | 32,135,064,741.973 | 91.502 |
| Withheld | 2,984,591,668.000 | 8.498 |
| TOTAL | 35,119,656,409.973 | 100.000 |
|
| Proposal 1 reflects trust wide proposal and voting results. |
SELTEC-ANN-0421
1.813669.116
Fidelity® Select Portfolios®
Materials Sector
Chemicals Portfolio
Gold Portfolio
Materials Portfolio
Annual Report
February 28, 2021
Includes Fidelity and Fidelity Advisor share classes
Contents
To view a fund's proxy voting guidelines and proxy voting record for the 12-month period ended June 30, visit http://www.fidelity.com/proxyvotingresults or visit the Securities and Exchange Commission's (SEC) web site at http://www.sec.gov.
You may also call 1-800-544-8544 if you’re an individual investing directly with Fidelity, call 1-800-835-5092 if you’re a plan sponsor or participant with Fidelity as your recordkeeper or call 1-877-208-0098 on institutional accounts or if you’re an advisor or invest through one to request a free copy of the proxy voting guidelines.
Standard & Poor's, S&P and S&P 500 are registered service marks of The McGraw-Hill Companies, Inc. and have been licensed for use by Fidelity Distributors Corporation.
Other third-party marks appearing herein are the property of their respective owners.
All other marks appearing herein are registered or unregistered trademarks or service marks of FMR LLC or an affiliated company. © 2021 FMR LLC. All rights reserved.
This report and the financial statements contained herein are submitted for the general information of the shareholders of the Funds. This report is not authorized for distribution to prospective investors in the Funds unless preceded or accompanied by an effective prospectus.
A fund files its complete schedule of portfolio holdings with the SEC for the first and third quarters of each fiscal year on Form N-PORT. Forms N-PORT are available on the SEC’s web site at http://www.sec.gov. A fund's Forms N-PORT may be reviewed and copied at the SEC’s Public Reference Room in Washington, DC. Information regarding the operation of the SEC's Public Reference Room may be obtained by calling 1-800-SEC-0330.
For a complete list of a fund's portfolio holdings, view the most recent holdings listing, semiannual report, or annual report on Fidelity's web site at http://www.fidelity.com, http://www.institutional.fidelity.com, or http://www.401k.com, as applicable.
NOT FDIC INSURED •MAY LOSE VALUE •NO BANK GUARANTEE
Neither the Funds nor Fidelity Distributors Corporation is a bank.
Note to Shareholders:
Early in 2020, the outbreak and spread of a new coronavirus emerged as a public health emergency that had a major influence on financial markets, primarily based on its impact on the global economy and the outlook for corporate earnings. The virus causes a respiratory disease known as COVID-19. On March 11, 2020 the World Health Organization declared the COVID-19 outbreak a pandemic, citing sustained risk of further global spread.
In the weeks following, as the crisis worsened, we witnessed an escalating human tragedy with wide-scale social and economic consequences from coronavirus-containment measures. The outbreak of COVID-19 prompted a number of measures to limit the spread, including travel and border restrictions, quarantines, and restrictions on large gatherings. In turn, these resulted in lower consumer activity, diminished demand for a wide range of products and services, disruption in manufacturing and supply chains, and – given the wide variability in outcomes regarding the outbreak – significant market uncertainty and volatility. Amid the turmoil, global governments and central banks took unprecedented action to help support consumers, businesses, and the broader economies, and to limit disruption to financial systems.
The situation continues to unfold, and the extent and duration of its impact on financial markets and the economy remain highly uncertain. Extreme events such as the coronavirus crisis are “exogenous shocks” that can have significant adverse effects on mutual funds and their investments. Although multiple asset classes may be affected by market disruption, the duration and impact may not be the same for all types of assets.
Fidelity is committed to helping you stay informed amid news about COVID-19 and during increased market volatility, and we’re taking extra steps to be responsive to customer needs. We encourage you to visit our websites, where we offer ongoing updates, commentary, and analysis on the markets and our funds.
Chemicals Portfolio
Performance: The Bottom Line
Average annual total return reflects the change in the value of an investment, assuming reinvestment of distributions from dividend income and capital gains (the profits earned upon the sale of securities that have grown in value, if any) and assuming a constant rate of performance each year. The hypothetical investment and the average annual total returns do not reflect the deduction of taxes that a shareholder would pay on fund distributions or the redemption of fund shares. During periods of reimbursement by Fidelity, a fund’s total return will be greater than it would be had the reimbursement not occurred. How a fund did yesterday is no guarantee of how it will do tomorrow.
Average Annual Total Returns
| For the periods ended February 28, 2021 | Past 1 year | Past 5 years | Past 10 years |
| Chemicals Portfolio | 41.65% | 10.74% | 9.57% |
$10,000 Over 10 Years
Let's say hypothetically that $10,000 was invested in Chemicals Portfolio on February 28,2011.
The chart shows how the value of your investment would have changed, and also shows how the S&P 500® Index performed over the same period.
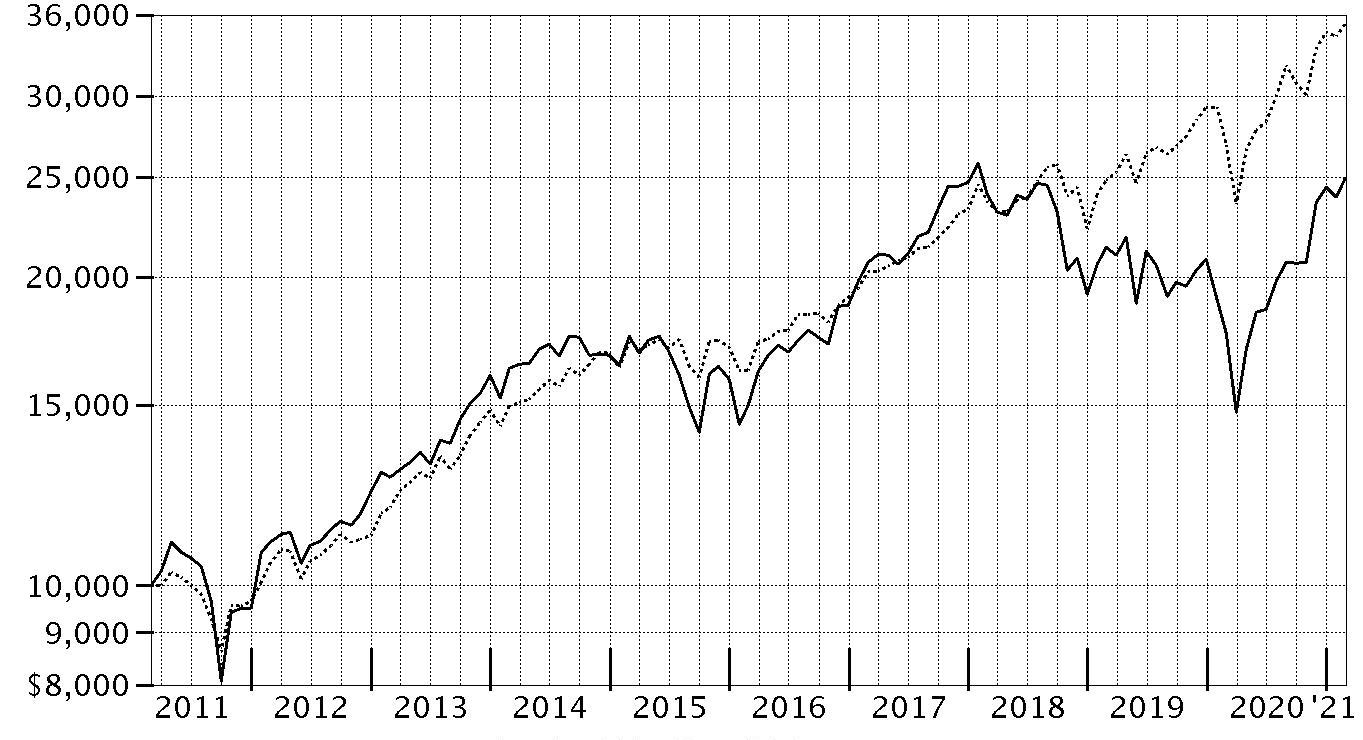
| Period Ending Values |
| $24,951 | Chemicals Portfolio |
| $35,259 | S&P 500® Index |
Chemicals Portfolio
Management's Discussion of Fund Performance
Market Recap: The S&P 500
® index gained 31.29% for the 12 months ending February 28, 2021, a volatile but productive period for U.S. risk assets. The early-2020 outbreak and spread of COVID-19 resulted in stocks suffering one of the quickest declines on record, through March 23, followed by a historic rebound that included the index closing 2020 at an all-time high and gaining modest ground in the first two months of the new year. The crisis and containment efforts caused broad contraction in economic activity, along with extreme uncertainty and dislocation in financial markets. A rapid and expansive U.S. monetary/fiscal-policy response partially offset the economic disruption and fueled the market surge, as did resilient corporate earnings. The rally slowed in September, when stocks began a two-month retreat amid Congress’s inability to reach a deal on additional fiscal stimulus, as well as concerns about election uncertainty, indications the U.S. economic recovery could be slowing and a new wave of COVID-19 cases. A shift in momentum began in October and accelerated following the U.S. elections, with the approval of three breakthrough COVID-19 vaccines and prospects for additional government stimulus fueling the “reflation trade” through February 28. By sector for the full 12 months, information technology (+50%) and consumer discretionary (+43%) led all gainers. Materials (+42%) and communication services (+37%) also stood out. In contrast, the defensive utilities (-3%) and real estate sectors (+5%) notably lagged.
Comments from Portfolio Manager David Wagner: For the fiscal year ending February 28, 2021, the fund gained 41.65%, roughly in line with the 41.48% increase in the MSCI US IMI Chemicals 25/50 Linked Index, but outperforming the broad-based S&P 500
® index. The primary contributor to performance versus the industry index was security selection in the commodity chemicals category. An overweighting in diversified chemicals and picks among specialty chemicals stocks also helped. The biggest individual relative contributor was an overweight position in Olin (+101%), one of the portfolio’s biggest holdings as of February 28. Also boosting the fund’s return versus the index was our outsized stake in Tronox Holdings, which gained 165%. Adding further value was our lighter-than-index stake in International Flavors & Fragrances (+16%). The company was among the largest holdings at period end. Conversely, the biggest detractor from performance versus the industry index was stock selection and an underweighting in fertilizers & agricultural chemicals. Subpar investment choices in diversified chemicals and an underweighting among commodity chemicals firms also hampered relative performance. The biggest individual relative detractor was an underweight position in Albemarle (+95%), where we decreased our stake the past 12 months. Further hampering the fund’s relative result was an underweighting in Livent (+109%). This period we reduced our stake in the company. Another key relative detractor was our larger-than-index holding in Innospec (+14%), a position that was sold the past year. Notable changes in positioning include a higher allocation to the fertilizers & agricultural chemicals and commodity chemicals groups.
The views expressed above reflect those of the portfolio manager(s) only through the end of the period as stated on the cover of this report and do not necessarily represent the views of Fidelity or any other person in the Fidelity organization. Any such views are subject to change at any time based upon market or other conditions and Fidelity disclaims any responsibility to update such views. These views may not be relied on as investment advice and, because investment decisions for a Fidelity fund are based on numerous factors, may not be relied on as an indication of trading intent on behalf of any Fidelity fund.
Note to shareholders: On July 1, 2020, Rick Malnight retired from Fidelity, leaving David Wagner as sole portfolio manager of the fund.
Chemicals Portfolio
Investment Summary (Unaudited)
Top Ten Stocks as of February 28, 2021
| | % of fund's net assets |
| Linde PLC | 17.1 |
| Sherwin-Williams Co. | 8.1 |
| Corteva, Inc. | 5.6 |
| Air Products & Chemicals, Inc. | 5.2 |
| DuPont de Nemours, Inc. | 4.8 |
| Olin Corp. | 4.4 |
| Ecolab, Inc. | 3.8 |
| International Flavors & Fragrances, Inc. | 3.8 |
| Celanese Corp. Class A | 3.6 |
| PPG Industries, Inc. | 3.5 |
| | 59.9 |
Top Industries (% of fund's net assets)
| As of February 28, 2021 |
| | Chemicals | 98.4% |
| | Trading Companies & Distributors | 1.2% |
| | All Others* | 0.4% |

* Includes Short-Term investments and Net Other Assets (Liabilities).
Chemicals Portfolio
Schedule of Investments February 28, 2021
Showing Percentage of Net Assets
| Common Stocks - 99.6% | | | |
| | | Shares | Value |
| Chemicals - 98.4% | | | |
| Commodity Chemicals - 13.9% | | | |
| Dow, Inc. | | 346,900 | $20,574,639 |
| LyondellBasell Industries NV Class A | | 162,900 | 16,793,361 |
| Olin Corp. | | 996,800 | 30,840,992 |
| Orion Engineered Carbons SA | | 435,826 | 7,714,120 |
| Tronox Holdings PLC | | 979,969 | 17,972,631 |
| Westlake Chemical Corp. | | 38,456 | 3,291,449 |
| | | | 97,187,192 |
| Diversified Chemicals - 8.4% | | | |
| Eastman Chemical Co. | | 113,600 | 12,411,936 |
| Huntsman Corp. | | 825,800 | 22,544,340 |
| The Chemours Co. LLC (a) | | 1,030,259 | 24,241,994 |
| | | | 59,198,270 |
| Fertilizers & Agricultural Chemicals - 13.0% | | | |
| CF Industries Holdings, Inc. | | 335,417 | 15,187,682 |
| Corteva, Inc. | | 869,893 | 39,275,669 |
| FMC Corp. | | 98,016 | 9,967,247 |
| The Mosaic Co. | | 699,000 | 20,550,600 |
| The Scotts Miracle-Gro Co. Class A | | 28,500 | 6,074,775 |
| | | | 91,055,973 |
| Industrial Gases - 22.3% | | | |
| Air Products & Chemicals, Inc. | | 142,011 | 36,300,852 |
| Linde PLC | | 491,316 | 120,013,761 |
| | | | 156,314,613 |
| Specialty Chemicals - 40.8% | | | |
| Albemarle Corp. U.S. | | 19,800 | 3,112,758 |
| Ashland Global Holdings, Inc. | | 175,400 | 14,754,648 |
| Atotech Ltd. (a) | | 275,500 | 5,589,895 |
| Avient Corp. | | 121,200 | 5,238,264 |
| Axalta Coating Systems Ltd. (b) | | 454,100 | 12,415,094 |
| Celanese Corp. Class A | | 182,300 | 25,323,293 |
| Covestro AG (c) | | 112,500 | 8,138,783 |
| DuPont de Nemours, Inc. | | 478,294 | 33,633,634 |
| Ecolab, Inc. | | 126,900 | 26,567,784 |
| Element Solutions, Inc. | | 817,243 | 14,751,236 |
| H.B. Fuller Co. | | 180,600 | 10,126,242 |
| HEXPOL AB (B Shares) | | 492,700 | 5,286,493 |
| International Flavors & Fragrances, Inc. | | 195,716 | 26,521,475 |
| Livent Corp. (b) | | 200 | 3,724 |
| PPG Industries, Inc. | | 183,600 | 24,752,952 |
| Quaker Chemical Corp. (a) | | 17,500 | 4,941,650 |
| Sherwin-Williams Co. | | 83,233 | 56,626,739 |
| W.R. Grace & Co. | | 130,550 | 7,736,393 |
| | | | 285,521,057 |
|
| TOTAL CHEMICALS | | | 689,277,105 |
|
| Trading Companies & Distributors - 1.2% | | | |
| Trading Companies & Distributors - 1.2% | | | |
| Univar, Inc. (b) | | 427,500 | 8,511,525 |
| TOTAL COMMON STOCKS | | | |
| (Cost $449,685,754) | | | 697,788,630 |
|
| Money Market Funds - 3.4% | | | |
| Fidelity Cash Central Fund 0.07% (d) | | 322,717 | 322,782 |
| Fidelity Securities Lending Cash Central Fund 0.08% (d)(e) | | 23,870,465 | 23,872,852 |
| TOTAL MONEY MARKET FUNDS | | | |
| (Cost $24,195,634) | | | 24,195,634 |
| TOTAL INVESTMENT IN SECURITIES - 103.0% | | | |
| (Cost $473,881,388) | | | 721,984,264 |
| NET OTHER ASSETS (LIABILITIES) - (3.0)% | | | (21,304,057) |
| NET ASSETS - 100% | | | $700,680,207 |
Legend
(a) Security or a portion of the security is on loan at period end.
(b) Non-income producing
(c) Security exempt from registration under Rule 144A of the Securities Act of 1933. These securities may be resold in transactions exempt from registration, normally to qualified institutional buyers. At the end of the period, the value of these securities amounted to $8,138,783 or 1.2% of net assets.
(d) Affiliated fund that is generally available only to investment companies and other accounts managed by Fidelity Investments. The rate quoted is the annualized seven-day yield of the fund at period end. A complete unaudited listing of the fund's holdings as of its most recent quarter end is available upon request. In addition, each Fidelity Central Fund's financial statements, which are not covered by the Fund's Report of Independent Registered Public Accounting Firm, are available on the SEC's website or upon request.
(e) Investment made with cash collateral received from securities on loan.
Affiliated Central Funds
Information regarding fiscal year to date income earned by the Fund from investments in Fidelity Central Funds is as follows:
| Fund | Income earned |
| Fidelity Cash Central Fund | $6,287 |
| Fidelity Securities Lending Cash Central Fund | 172,092 |
| Total | $178,379 |
Amounts in the income column in the above table include any capital gain distributions from underlying funds, which are presented in the corresponding line-item in the Statement of Operations, if applicable. Amount for Fidelity Securities Lending Cash Central Fund represents the income earned on investing cash collateral, less rebates paid to borrowers and any lending agent fees associated with the loan, plus any premium payments received for lending certain types of securities.
Investment Valuation
The following is a summary of the inputs used, as of February 28, 2021, involving the Fund's assets and liabilities carried at fair value. The inputs or methodology used for valuing securities may not be an indication of the risk associated with investing in those securities. For more information on valuation inputs, and their aggregation into the levels used below, please refer to the Investment Valuation section in the accompanying Notes to Financial Statements.
| | Valuation Inputs at Reporting Date: |
| Description | Total | Level 1 | Level 2 | Level 3 |
| Investments in Securities: | | | | |
| Common Stocks | $697,788,630 | $697,788,630 | $-- | $-- |
| Money Market Funds | 24,195,634 | 24,195,634 | -- | -- |
| Total Investments in Securities: | $721,984,264 | $721,984,264 | $-- | $-- |
Other Information
Distribution of investments by country or territory of incorporation, as a percentage of Total Net Assets, is as follows (Unaudited):
| United States of America | 73.0% |
| Ireland | 17.1% |
| United Kingdom | 2.6% |
| Netherlands | 2.4% |
| Bermuda | 1.8% |
| Germany | 1.2% |
| Luxembourg | 1.1% |
| Others (Individually Less Than 1%) | 0.8% |
| | 100.0% |
See accompanying notes which are an integral part of the financial statements.
Chemicals Portfolio
Financial Statements
Statement of Assets and Liabilities
| | | February 28, 2021 |
| Assets | | |
Investment in securities, at value (including securities loaned of $23,088,310) — See accompanying schedule:
Unaffiliated issuers (cost $449,685,754) | $697,788,630 | |
| Fidelity Central Funds (cost $24,195,634) | 24,195,634 | |
| Total Investment in Securities (cost $473,881,388) | | $721,984,264 |
| Receivable for investments sold | | 2,159,501 |
| Receivable for fund shares sold | | 176,660 |
| Dividends receivable | | 1,451,260 |
| Distributions receivable from Fidelity Central Funds | | 39,068 |
| Prepaid expenses | | 9,509 |
| Other receivables | | 153,865 |
| Total assets | | 725,974,127 |
| Liabilities | | |
| Payable for fund shares redeemed | $805,439 | |
| Accrued management fee | 313,001 | |
| Other affiliated payables | 132,005 | |
| Other payables and accrued expenses | 182,775 | |
| Collateral on securities loaned | 23,860,700 | |
| Total liabilities | | 25,293,920 |
| Net Assets | | $700,680,207 |
| Net Assets consist of: | | |
| Paid in capital | | $475,979,888 |
| Total accumulated earnings (loss) | | 224,700,319 |
| Net Assets | | $700,680,207 |
| Net Asset Value, offering price and redemption price per share ($700,680,207 ÷ 47,772,525 shares) | | $14.67 |
See accompanying notes which are an integral part of the financial statements.
Statement of Operations
| | | Year ended February 28, 2021 |
| Investment Income | | |
| Dividends | | $13,271,277 |
| Income from Fidelity Central Funds (including $172,092 from security lending) | | 178,379 |
| Total income | | 13,449,656 |
| Expenses | | |
| Management fee | $3,465,645 | |
| Transfer agent fees | 1,357,141 | |
| Accounting fees | 236,866 | |
| Custodian fees and expenses | 8,919 | |
| Independent trustees' fees and expenses | 3,698 | |
| Registration fees | 21,756 | |
| Audit | 46,786 | |
| Legal | 3,185 | |
| Interest | 70 | |
| Miscellaneous | 21,845 | |
| Total expenses before reductions | 5,165,911 | |
| Expense reductions | (69,627) | |
| Total expenses after reductions | | 5,096,284 |
| Net investment income (loss) | | 8,353,372 |
| Realized and Unrealized Gain (Loss) | | |
| Net realized gain (loss) on: | | |
| Investment securities: | | |
| Unaffiliated issuers | 17,933,756 | |
| Fidelity Central Funds | 5,936 | |
| Foreign currency transactions | (3,423) | |
| Total net realized gain (loss) | | 17,936,269 |
| Change in net unrealized appreciation (depreciation) on: | | |
| Investment securities: | | |
| Unaffiliated issuers | 200,479,267 | |
| Assets and liabilities in foreign currencies | 29,852 | |
| Total change in net unrealized appreciation (depreciation) | | 200,509,119 |
| Net gain (loss) | | 218,445,388 |
| Net increase (decrease) in net assets resulting from operations | | $226,798,760 |
See accompanying notes which are an integral part of the financial statements.
Statement of Changes in Net Assets
| | Year ended February 28, 2021 | Year ended February 29, 2020 |
| Increase (Decrease) in Net Assets | | |
| Operations | | |
| Net investment income (loss) | $8,353,372 | $11,421,771 |
| Net realized gain (loss) | 17,936,269 | (16,186,423) |
| Change in net unrealized appreciation (depreciation) | 200,509,119 | (153,952,494) |
| Net increase (decrease) in net assets resulting from operations | 226,798,760 | (158,717,146) |
| Distributions to shareholders | (7,889,774) | (64,898,786) |
| Share transactions | | |
| Proceeds from sales of shares | 51,330,497 | 51,439,480 |
| Reinvestment of distributions | 7,425,299 | 61,546,519 |
| Cost of shares redeemed | (233,425,777) | (386,307,907) |
| Net increase (decrease) in net assets resulting from share transactions | (174,669,981) | (273,321,908) |
| Total increase (decrease) in net assets | 44,239,005 | (496,937,840) |
| Net Assets | | |
| Beginning of period | 656,441,202 | 1,153,379,042 |
| End of period | $700,680,207 | $656,441,202 |
| Other Information | | |
| Shares | | |
| Sold | 4,348,003 | 4,140,804 |
| Issued in reinvestment of distributions | 515,288 | 4,713,661 |
| Redeemed | (19,763,574) | (31,186,535) |
| Net increase (decrease) | (14,900,283) | (22,332,070) |
See accompanying notes which are an integral part of the financial statements.
Financial Highlights
Chemicals Portfolio
| | | | | | |
| Years ended February 28, | 2021 | 2020 A | 2019 B | 2018 B | 2017 B |
| Selected Per–Share Data | | | | | |
| Net asset value, beginning of period | $10.47 | $13.57 | $17.34 | $16.24 | $12.32 |
| Income from Investment Operations | | | | | |
| Net investment income (loss)C | .15 | .15 | .23 | .19 | .18 |
| Net realized and unrealized gain (loss) | 4.21 | (2.39) | (2.17) | 2.36 | 4.44 |
| Total from investment operations | 4.36 | (2.24) | (1.94) | 2.55 | 4.62 |
| Distributions from net investment income | (.16) | (.20) | (.21) | (.16) | (.17) |
| Distributions from net realized gain | – | (.66) | (1.62) | (1.29) | (.53) |
| Total distributions | (.16) | (.86) | (1.83) | (1.45) | (.70) |
| Redemption fees added to paid in capitalC | – | – | – | – | –D |
| Net asset value, end of period | $14.67 | $10.47 | $13.57 | $17.34 | $16.24 |
| Total ReturnE | 41.65% | (17.63)% | (11.10)% | 16.31% | 38.02% |
| Ratios to Average Net AssetsF,G | | | | | |
| Expenses before reductions | .79% | .78% | .77% | .77% | .80% |
| Expenses net of fee waivers, if any | .79% | .78% | .77% | .77% | .80% |
| Expenses net of all reductions | .78% | .77% | .76% | .77% | .79% |
| Net investment income (loss) | 1.28% | 1.21% | 1.50% | 1.12% | 1.26% |
| Supplemental Data | | | | | |
| Net assets, end of period (000 omitted) | $700,680 | $656,441 | $1,153,379 | $1,790,221 | $1,626,642 |
| Portfolio turnover rateH | 50% | 77% | 62% | 62% | 85% |
A For the year ended February 29.
B Per share amounts have been adjusted to reflect the impact of the 10 for 1 share split that occurred on August 10, 2018.
C Calculated based on average shares outstanding during the period.
D Amount represents less than $.005 per share.
E Total returns would have been lower if certain expenses had not been reduced during the applicable periods shown.
F Fees and expenses of any underlying mutual funds or exchange-traded funds (ETFs) are not included in the Fund's expense ratio. The Fund indirectly bears its proportionate share of these expenses. For additional expense information related to investments in Fidelity Central Funds, please refer to the "Investments in Fidelity Central Funds" note found in the Notes to Financial Statements section of the most recent Annual or Semi-Annual report.
G Expense ratios reflect operating expenses of the class. Expenses before reductions do not reflect amounts reimbursed, waived, or reduced through arrangements with the investment advisor, brokerage services, or other offset arrangements, if applicable, and do not represent the amount paid by the class during periods when reimbursements, waivers or reductions occur.
H Amount does not include the portfolio activity of any underlying mutual funds or exchange-traded funds (ETFs).
See accompanying notes which are an integral part of the financial statements.
Notes to Financial Statements
For the period ended February 28, 2021
1. Organization.
Chemicals Portfolio (the Fund) is a non-diversified fund of Fidelity Select Portfolios (the Trust) and is authorized to issue an unlimited number of shares. Share transactions on the Statement of Changes in Net Assets may contain exchanges between affiliated funds. The Trust is registered under the Investment Company Act of 1940, as amended (the 1940 Act), as an open-end management investment company organized as a Massachusetts business trust. The Fund invests primarily in securities of companies whose principal business activities fall within specific industries.
2. Investments in Fidelity Central Funds.
The Fund invests in Fidelity Central Funds, which are open-end investment companies generally available only to other investment companies and accounts managed by the investment adviser and its affiliates. The Fund's Schedule of Investments lists each of the Fidelity Central Funds held as of period end, if any, as an investment of the Fund, but does not include the underlying holdings of each Fidelity Central Fund. As an Investing Fund, the Fund indirectly bears its proportionate share of the expenses of the underlying Fidelity Central Funds.
The Money Market Central Funds seek preservation of capital and current income and are managed by the investment adviser. Annualized expenses of the Money Market Central Funds as of their most recent shareholder report date ranged from less than .005% to .01%.
A complete unaudited list of holdings for each Fidelity Central Fund is available upon request or at the Securities and Exchange Commission (the SEC) website at www.sec.gov. In addition, the financial statements of the Fidelity Central Funds, which are not covered by the Fund's Report of Independent Registered Public Accounting Firm, are available on the SEC website or upon request.
3. Significant Accounting Policies.
The Fund is an investment company and applies the accounting and reporting guidance of the Financial Accounting Standards Board (FASB) Accounting Standards Codification Topic 946 Financial Services - Investment Companies. The financial statements have been prepared in conformity with accounting principles generally accepted in the United States of America (GAAP), which require management to make certain estimates and assumptions at the date of the financial statements. Actual results could differ from those estimates. Subsequent events, if any, through the date that the financial statements were issued have been evaluated in the preparation of the financial statements. The following summarizes the significant accounting policies of the Fund:
Investment Valuation. Investments are valued as of 4:00 p.m. Eastern time on the last calendar day of the period. The Board of Trustees (the Board) has delegated the day to day responsibility for the valuation of the Fund's investments to the Fair Value Committee (the Committee) established by the Fund's investment adviser. In accordance with valuation policies and procedures approved by the Board, the Fund attempts to obtain prices from one or more third party pricing vendors or brokers to value its investments. When current market prices, quotations or currency exchange rates are not readily available or reliable, investments will be fair valued in good faith by the Committee, in accordance with procedures adopted by the Board. Factors used in determining fair value vary by investment type and may include market or investment specific events. The frequency with which these procedures are used cannot be predicted and they may be utilized to a significant extent. The Committee oversees the Fund's valuation policies and procedures and reports to the Board on the Committee's activities and fair value determinations. The Board monitors the appropriateness of the procedures used in valuing the Fund's investments and ratifies the fair value determinations of the Committee.
The Fund categorizes the inputs to valuation techniques used to value its investments into a disclosure hierarchy consisting of three levels as shown below:
- Level 1 – quoted prices in active markets for identical investments
- Level 2 – other significant observable inputs (including quoted prices for similar investments, interest rates, prepayment speeds, etc.)
- Level 3 – unobservable inputs (including the Fund's own assumptions based on the best information available)
Valuation techniques used to value the Fund's investments by major category are as follows:
Equity securities, including restricted securities, for which market quotations are readily available, are valued at the last reported sale price or official closing price as reported by a third party pricing vendor on the primary market or exchange on which they are traded and are categorized as Level 1 in the hierarchy. In the event there were no sales during the day or closing prices are not available, securities are valued at the last quoted bid price or may be valued using the last available price and are generally categorized as Level 2 in the hierarchy. For foreign equity securities, when market or security specific events arise, comparisons to the valuation of American Depositary Receipts (ADRs), futures contracts, Exchange-Traded Funds (ETFs) and certain indexes as well as quoted prices for similar securities may be used and would be categorized as Level 2 in the hierarchy. For equity securities, including restricted securities, where observable inputs are limited, assumptions about market activity and risk are used and these securities may be categorized as Level 3 in the hierarchy.
Investments in open-end mutual funds, including the Fidelity Central Funds, are valued at their closing net asset value (NAV) each business day and are categorized as Level 1 in the hierarchy.
Changes in valuation techniques may result in transfers in or out of an assigned level within the disclosure hierarchy. The aggregate value of investments by input level as of February 28, 2021 is included at the end of the Fund's Schedule of Investments.
Foreign Currency. Certain Funds may use foreign currency contracts to facilitate transactions in foreign-denominated securities. Gains and losses from these transactions may arise from changes in the value of the foreign currency or if the counterparties do not perform under the contracts' terms.
Foreign-denominated assets, including investment securities, and liabilities are translated into U.S. dollars at the exchange rates at period end. Purchases and sales of investment securities, income and dividends received, and expenses denominated in foreign currencies are translated into U.S. dollars at the exchange rate in effect on the transaction date.
The effects of exchange rate fluctuations on investments are included with the net realized and unrealized gain (loss) on investment securities. Other foreign currency transactions resulting in realized and unrealized gain (loss) are disclosed separately.
Investment Transactions and Income. For financial reporting purposes, the Fund's investment holdings and NAV include trades executed through the end of the last business day of the period. The NAV per share for processing shareholder transactions is calculated as of the close of business of the New York Stock Exchange (NYSE), normally 4:00 p.m. Eastern time and includes trades executed through the end of the prior business day. Gains and losses on securities sold are determined on the basis of identified cost. Dividend income is recorded on the ex-dividend date. Income and capital gain distributions from Fidelity Central Funds, if any, are recorded on the ex-dividend date. Certain distributions received by the Fund represent a return of capital or capital gain. The Fund determines the components of these distributions subsequent to the ex-dividend date, based upon receipt of tax filings or other correspondence relating to the underlying investment. These distributions are recorded as a reduction of cost of investments and/or as a realized gain. Investment income is recorded net of foreign taxes withheld where recovery of such taxes is uncertain.
Expenses. Expenses directly attributable to a fund are charged to that fund. Expenses attributable to more than one fund are allocated among the respective funds on the basis of relative net assets or other appropriate methods. Expense estimates are accrued in the period to which they relate and adjustments are made when actual amounts are known.
Deferred Trustee Compensation. Under a Deferred Compensation Plan (the Plan) for certain Funds, certain independent Trustees have elected to defer receipt of a portion of their annual compensation. Deferred amounts are invested in affiliated mutual funds, are marked-to-market and remain in a fund until distributed in accordance with the Plan. The investment of deferred amounts and the offsetting payable to the Trustees presented below are included in the accompanying Statement of Assets and Liabilities in other receivables and other payables and accrued expenses, as applicable.
| Chemicals Portfolio | $150,356 |
Income Tax Information and Distributions to Shareholders. Each year, the Fund intends to qualify as a regulated investment company under Subchapter M of the Internal Revenue Code, including distributing substantially all of its taxable income and realized gains. As a result, no provision for U.S. Federal income taxes is required. As of February 28, 2021, the Fund did not have any unrecognized tax benefits in the financial statements; nor is the Fund aware of any tax positions for which it is reasonably possible that the total amounts of unrecognized tax benefits will significantly change in the next twelve months. The Fund files a U.S. federal tax return, in addition to state and local tax returns as required. The Fund's federal income tax returns are subject to examination by the Internal Revenue Service (IRS) for a period of three fiscal years after they are filed. State and local tax returns may be subject to examination for an additional fiscal year depending on the jurisdiction. Foreign taxes are provided for based on the Fund's understanding of the tax rules and rates that exist in the foreign markets in which it invests.
Distributions are declared and recorded on the ex-dividend date. Income and capital gain distributions are determined in accordance with income tax regulations, which may differ from GAAP. In addition, the Fund claimed a portion of the payment made to redeeming shareholders as a distribution for income tax purposes.
Capital accounts within the financial statements are adjusted for permanent book-tax differences. These adjustments have no impact on net assets or the results of operations. Capital accounts are not adjusted for temporary book-tax differences which will reverse in a subsequent period.
Book-tax differences are primarily due to foreign currency transactions, deferred Trustees compensation, capital loss carryforwards and losses deferred due to wash sales and excise tax regulations.
As of period end, the cost and unrealized appreciation (depreciation) in securities, and derivatives if applicable, for federal income tax purposes were as follows:
| Gross unrealized appreciation | $247,674,340 |
| Gross unrealized depreciation | (265,733) |
| Net unrealized appreciation (depreciation) | $247,408,607 |
| Tax Cost | $474,575,657 |
The tax-based components of distributable earnings as of period end were as follows:
| Capital loss carryforward | $(22,563,884) |
| Net unrealized appreciation (depreciation) on securities and other investments | $247,414,557 |
Capital loss carryforwards are only available to offset future capital gains of the Fund to the extent provided by regulations and may be limited. The capital loss carryforward information presented below, including any applicable limitation, is estimated as of fiscal period end and is subject to adjustment.
| No expiration | |
| Short-term | $(6,780,235) |
| Long-term | (15,783,649) |
| Total capital loss carryforward | $(22,563,884) |
The tax character of distributions paid was as follows:
| | February 28, 2021 | February 29, 2020 |
| Ordinary Income | $7,889,774 | $ 13,950,855 |
| Long-term Capital Gains | – | 50,947,931 |
| Total | $7,889,774 | $ 64,898,786 |
Restricted Securities (including Private Placements). The Fund may invest in securities that are subject to legal or contractual restrictions on resale. These securities generally may be resold in transactions exempt from registration or to the public if the securities are registered. Disposal of these securities may involve time-consuming negotiations and expense, and prompt sale at an acceptable price may be difficult. Information regarding restricted securities is included at the end of the Fund's Schedule of Investments.
4. Purchases and Sales of Investments.
Purchases and sales of securities, other than short-term securities, are noted in the table below.
| | Purchases ($) | Sales ($) |
| Chemicals Portfolio | 322,999,464 | 486,042,966 |
5. Fees and Other Transactions with Affiliates.
Management Fee. Fidelity Management & Research Company LLC (the investment adviser) and its affiliates provide the Fund with investment management related services for which the Fund pays a monthly management fee. The management fee is the sum of an individual fund fee rate that is based on an annual rate of .30% of the Fund's average net assets and an annualized group fee rate that averaged .23% during the period. The group fee rate is based upon the monthly average net assets of a group of registered investment companies with which the investment adviser has management contracts. The group fee rate decreases as assets under management increase and increases as assets under management decrease. For the reporting period, the total annual management fee rate was .53% of the Fund's average net assets.
Transfer Agent Fees. Fidelity Investments Institutional Operations Company LLC (FIIOC), an affiliate of the investment adviser, is the Fund's transfer, dividend disbursing and shareholder servicing agent. FIIOC receives account fees and asset-based fees that vary according to account size and type of account. FIIOC pays for typesetting, printing and mailing of shareholder reports, except proxy statements. For the period, the transfer agent fees were equivalent to an annual rate of .21% of average net assets.
Accounting Fees. Fidelity Service Company, Inc. (FSC), an affiliate of the investment adviser, maintains the Fund's accounting records. The accounting fee is based on the level of average net assets for each month. For the period, the fees were equivalent to the following annual rates:
| | % of Average Net Assets |
| Chemicals Portfolio | .04 |
Brokerage Commissions. A portion of portfolio transactions were placed with brokerage firms which are affiliates of the investment adviser. Brokerage commissions are included in net realized gain (loss) and change in net unrealized appreciation (depreciation) in the Statement of Operations. The commissions paid to these affiliated firms were as follows:
| | Amount |
| Chemicals Portfolio | $14,969 |
Interfund Lending Program. Pursuant to an Exemptive Order issued by the SEC, the Fund, along with other registered investment companies having management contracts with Fidelity Management & Research Company LLC (FMR), or other affiliated entities of FMR, may participate in an interfund lending program. This program provides an alternative credit facility allowing the Fund to borrow from, or lend money to, other participating affiliated funds. At period end, there were no interfund loans outstanding. Activity in this program during the period for which loans were outstanding was as follows:
| | Borrower or Lender | Average Loan Balance | Weighted Average Interest Rate | Interest Expense |
| Chemicals Portfolio | Borrower | $2,462,000 | .34% | $70 |
Interfund Trades. Funds may purchase from or sell securities to other Fidelity Funds under procedures adopted by the Board. The procedures have been designed to ensure these interfund trades are executed in accordance with Rule 17a-7 of the 1940 Act. Any interfund trades are included within the respective purchases and sales amounts shown in the Purchases and Sales of Investments note and are noted in the table below.
| | Purchases ($) | Sales ($) |
| Chemicals Portfolio | 13,183,070 | 38,116,902 |
6. Committed Line of Credit.
Certain Funds participate with other funds managed by the investment adviser or an affiliate in a $4.25 billion credit facility (the "line of credit") to be utilized for temporary or emergency purposes to fund shareholder redemptions or for other short-term liquidity purposes. The participating funds have agreed to pay commitment fees on their pro-rata portion of the line of credit, which are reflected in Miscellaneous expenses on the Statement of Operations, and are listed below.
| | Amount |
| Chemicals Portfolio | $1,509 |
During the period, there were no borrowings on this line of credit.
7. Security Lending.
Funds lend portfolio securities from time to time in order to earn additional income. Lending agents are used, including National Financial Services (NFS), an affiliate of the investment adviser. Pursuant to a securities lending agreement, NFS will receive a fee, which is capped at 9.9% of a fund's daily lending revenue, for its services as lending agent. A fund may lend securities to certain qualified borrowers, including NFS. On the settlement date of the loan, a fund receives collateral (in the form of U.S. Treasury obligations, letters of credit and/or cash) against the loaned securities and maintains collateral in an amount not less than 100% of the market value of the loaned securities during the period of the loan. The market value of the loaned securities is determined at the close of business of a fund and any additional required collateral is delivered to a fund on the next business day. A fund or borrower may terminate the loan at any time, and if the borrower defaults on its obligation to return the securities loaned because of insolvency or other reasons, a fund may apply collateral received from the borrower against the obligation. A fund may experience delays and costs in recovering the securities loaned. Any cash collateral received is invested in the Fidelity Securities Lending Cash Central Fund. Any loaned securities are identified as such in the Schedule of Investments, and the value of loaned securities and cash collateral at period end, as applicable, are presented in the Statement of Assets and Liabilities. Security lending income represents the income earned on investing cash collateral, less rebates paid to borrowers and any lending agent fees associated with the loan, plus any premium payments received for lending certain types of securities. Security lending income is presented in the Statement of Operations as a component of income from Fidelity Central Funds. Affiliated security lending activity, if any, was as follows:
| | Total Security Lending Income Fees Paid to NFS | Security Lending Income From Securities Loaned to NFS | Value of Securities Loaned to NFS at Period End |
| Chemicals Portfolio | $14,785 | $47 | $– |
8. Expense Reductions.
Commissions paid to certain brokers with whom the investment adviser, or its affiliates, places trades on behalf of the Fund include an amount in addition to trade execution, which may be rebated back to the Fund to offset expenses. This amount totaled $66,850 for the period.
In addition, during the period the investment adviser or an affiliate reimbursed and/or waived a portion of operating expenses in the amount of $2,777.
9. Other.
The Fund's organizational documents provide former and current trustees and officers with a limited indemnification against liabilities arising in connection with the performance of their duties to the Fund. In the normal course of business, the Fund may also enter into contracts that provide general indemnifications. The Fund's maximum exposure under these arrangements is unknown as this would be dependent on future claims that may be made against the Fund. The risk of material loss from such claims is considered remote.
10. Coronavirus (COVID-19) Pandemic.
An outbreak of COVID-19 first detected in China during December 2019 has since spread globally and was declared a pandemic by the World Health Organization during March 2020. Developments that disrupt global economies and financial markets, such as the COVID-19 pandemic, may magnify factors that affect the Fund's performance.
Gold Portfolio
Performance: The Bottom Line
Average annual total return reflects the change in the value of an investment, assuming reinvestment of distributions from dividend income and capital gains (the profits earned upon the sale of securities that have grown in value, if any) and assuming a constant rate of performance each year. The hypothetical investment and the average annual total returns do not reflect the deduction of taxes that a shareholder would pay on fund distributions or the redemption of fund shares. During periods of reimbursement by Fidelity, a fund’s total return will be greater than it would be had the reimbursement not occurred. How a fund did yesterday is no guarantee of how it will do tomorrow.
Average Annual Total Returns
| For the periods ended February 28, 2021 | Past 1 year | Past 5 years | Past 10 years |
| Class A (incl. 5.75% sales charge) | 9.89% | 6.89% | (6.50)% |
| Class M (incl. 3.50% sales charge) | 12.21% | 7.09% | (6.55)% |
| Class C (incl. contingent deferred sales charge) | 14.81% | 7.44% | (6.61)% |
| Gold Portfolio | 16.96% | 8.52% | (5.67)% |
| Class I | 16.96% | 8.53% | (5.64)% |
| Class Z | 17.12% | 8.60% | (5.61)% |
Class C shares' contingent deferred sales charges included in the past one year, past five years and past ten years total return figures are 1%, 0% and 0%, respectively.
The initial offering of Class Z shares took place on October 2, 2018. Returns prior to October 2, 2018, are those of Class I.
$10,000 Over 10 Years
Let's say hypothetically that $10,000 was invested in Gold Portfolio, a class of the fund, on February 28, 2011.
The chart shows how the value of your investment would have changed, and also shows how the S&P 500® Index performed over the same period.

| Period Ending Values |
| $5,578 | Gold Portfolio |
| $35,259 | S&P 500® Index |
Gold Portfolio
Management's Discussion of Fund Performance
Market Recap: The S&P 500
® index gained 31.29% for the 12 months ending February 28, 2021, a volatile but productive period for U.S. risk assets. The early-2020 outbreak and spread of COVID-19 resulted in stocks suffering one of the quickest declines on record, through March 23, followed by a historic rebound that included the index closing 2020 at an all-time high and gaining modest ground in the first two months of the new year. The crisis and containment efforts caused broad contraction in economic activity, along with extreme uncertainty and dislocation in financial markets. A rapid and expansive U.S. monetary/fiscal-policy response partially offset the economic disruption and fueled the market surge, as did resilient corporate earnings. The rally slowed in September, when stocks began a two-month retreat amid Congress’s inability to reach a deal on additional fiscal stimulus, as well as concerns about election uncertainty, indications the U.S. economic recovery could be slowing and a new wave of COVID-19 cases. A shift in momentum began in October and accelerated following the U.S. elections, with the approval of three breakthrough COVID-19 vaccines and prospects for additional government stimulus fueling the “reflation trade” through February 28. By sector for the full 12 months, information technology (+50%) and consumer discretionary (+43%) led all gainers. Materials (+42%) and communication services (+37%) also stood out. In contrast, the defensive utilities (-3%) and real estate sectors (+5%) notably lagged.
Comments from Portfolio Manager Steven Calhoun: For the fiscal year ending February 28, 2021, the fund's share classes (excluding sales charges, if applicable) gained about 16% to 17%, trailing the 20.25% advance of the S&P Global BMI Gold Capped Index 20/45 Linked Index, as well as the broad-based S&P 500
® index. Versus the industry index, security selection was the primary detractor, especially within the gold group. Stock selection in precious metals & minerals also hurt. Our lighter-than-index stake in Zijin Mining Group, a position we established this period, was the fund's biggest individual relative detractor and gained 61% the past 12 months. Another notable relative detractor was our untimely positioning in Kinross Gold (-34%). The company was among the largest holdings as of February 28, but the fund was underweight this index component, on average, during the period. Also hurting performance was our lighter-than-index stake in Sibanye Stillwater, which gained about 98%. Sibanye Stillwater was not held at period end. Conversely, the top contributor to performance versus the industry index were stock picks in silver, a group not held by the index. An underweighting in gold and security selection in diversified metals & mining also boosted the fund's relative result. Our non-index stake in Mag Silver was the fund's top individual relative contributor, driven by a 129% rise. Also adding value was our overweighting in Orla Mining, which gained 99%. Orla Mining was among the biggest holdings at period end. Another notable relative contributor was our overweighting in Premier Gold Mines (+177%), a stake we established this period.
The views expressed above reflect those of the portfolio manager(s) only through the end of the period as stated on the cover of this report and do not necessarily represent the views of Fidelity or any other person in the Fidelity organization. Any such views are subject to change at any time based upon market or other conditions and Fidelity disclaims any responsibility to update such views. These views may not be relied on as investment advice and, because investment decisions for a Fidelity fund are based on numerous factors, may not be relied on as an indication of trading intent on behalf of any Fidelity fund.
Gold Portfolio
Investment Summary (Unaudited)
The information in the following tables is based on the consolidated investments of the Fund.
Top Ten Holdings as of February 28, 2021
| (excluding repurchase agreements) | % of fund's net assets |
| Newmont Corp. | 13.1 |
| Barrick Gold Corp. (Canada) | 9.6 |
| Franco-Nevada Corp. | 8.1 |
| Wheaton Precious Metals Corp. | 6.1 |
| Agnico Eagle Mines Ltd. (Canada) | 5.7 |
| Northern Star Resources Ltd. | 3.8 |
| Zijin Mining Group Co. Ltd. (H Shares) | 3.5 |
| Kinross Gold Corp. | 3.0 |
| Novagold Resources, Inc. | 2.4 |
| Orla Mining Ltd. | 2.4 |
| | 57.7 |
Top Industries (% of fund's net assets)
| As of February 28, 2021 |
| | Gold | 90.0% |
| | Silver | 3.7% |
| | Diversified Metals & Mining | 2.5% |
| | Precious Metals & Minerals | 1.9% |
| | Commodities & Related Investments* | 0.7% |
| | All Others*,** | 1.2% |

* Includes gold bullion and/or silver bullion.
** Includes Short-Term investments and Net Other Assets (Liabilities).
Geographic Diversification (% of fund's net assets)
| As of February 28, 2021 |
| | Canada | 70.6% |
| | United States of America* | 17.1% |
| | Australia | 7.2% |
| | China | 3.5% |
| | South Africa | 1.6% |

* Includes Short-Term investments and Net Other Assets (Liabilities).
Percentages are based on country or territory of incorporation and are adjusted for the effect of futures contracts, if applicable.
Gold Portfolio
Consolidated Schedule of Investments February 28, 2021
Showing Percentage of Net Assets
| Common Stocks - 98.1% | | | |
| | | Shares | Value |
| Australia - 7.2% | | | |
| Metals & Mining - 7.2% | | | |
| Gold - 7.2% | | | |
| Evolution Mining Ltd. | | 12,669,142 | $40,942,739 |
| Newcrest Mining Ltd. | | 974,549 | 18,476,716 |
| Northern Star Resources Ltd. | | 8,283,670 | 65,077,211 |
| | | | 124,496,666 |
| Canada - 70.6% | | | |
| Metals & Mining - 70.6% | | | |
| Diversified Metals & Mining - 2.5% | | | |
| Major Drilling Group International, Inc. (a) | | 957,800 | 5,291,006 |
| New Pacific Holdings Corp. (a)(b) | | 5,213,800 | 25,606,043 |
| Western Copper & Gold Corp. (a)(b)(c) | | 7,309,100 | 11,659,180 |
| | | | 42,556,229 |
| Gold - 63.4% | | | |
| Agnico Eagle Mines Ltd. (Canada) | | 1,754,100 | 97,918,642 |
| Alamos Gold, Inc. | | 3,898,100 | 27,629,154 |
| B2Gold Corp. | | 9,000,000 | 39,179,632 |
| Barrick Gold Corp. (Canada) | | 8,868,400 | 165,507,229 |
| Battle North Gold Corp. (a)(c) | | 9,258,200 | 11,931,045 |
| Centerra Gold, Inc. | | 1,949,000 | 18,914,152 |
| Eldorado Gold Corp. (a) | | 974,500 | 10,207,516 |
| Franco-Nevada Corp. | | 1,300,000 | 139,193,777 |
| Gold Standard Ventures Corp. (a)(c) | | 23,168,300 | 14,928,498 |
| Kinross Gold Corp. | | 8,283,600 | 51,487,723 |
| Kirkland Lake Gold Ltd. | | 730,900 | 23,903,865 |
| Lundin Gold, Inc. (a) | | 3,898,100 | 31,427,397 |
| Maple Gold Mines Ltd. (a)(c) | | 20,000,000 | 4,243,281 |
| New Gold, Inc. (a) | | 4,872,700 | 7,849,312 |
| Novagold Resources, Inc. (a) | | 5,000,000 | 41,961,339 |
| OceanaGold Corp. (a) | | 11,694,500 | 16,908,597 |
| Orla Mining Ltd. (a)(c) | | 12,000,000 | 41,395,568 |
| Osisko Gold Royalties Ltd. | | 2,923,600 | 29,176,269 |
| Premier Gold Mines Ltd. (a)(c) | | 12,000,000 | 27,251,297 |
| Pretium Resources, Inc. (a) | | 2,923,600 | 28,441,119 |
| Pure Gold Mining, Inc. (a) | | 9,745,400 | 14,167,052 |
| Seabridge Gold, Inc. (a)(b) | | 1,461,800 | 24,949,156 |
| Skeena Resources Ltd. (a) | | 2,923,600 | 7,144,740 |
| SSR Mining, Inc. | | 1,461,800 | 20,756,503 |
| Torex Gold Resources, Inc. (a) | | 1,461,800 | 17,712,522 |
| Victoria Gold Corp. (a) | | 2,436,300 | 21,575,594 |
| Wesdome Gold Mines, Inc. (a) | | 2,923,600 | 19,642,291 |
| Wheaton Precious Metals Corp. | | 2,923,600 | 104,575,100 |
| Yamana Gold, Inc. | | 7,796,300 | 30,998,961 |
| | | | 1,090,977,331 |
| Precious Metals & Minerals - 1.9% | | | |
| Osisko Mining, Inc. (a) | | 3,898,100 | 8,607,309 |
| SilverCrest Metals, Inc. (a) | | 2,923,600 | 24,328,873 |
| | | | 32,936,182 |
| Silver - 2.8% | | | |
| MAG Silver Corp. (a) | | 1,364,300 | 26,179,637 |
| Pan American Silver Corp. | | 682,100 | 22,522,942 |
| | | | 48,702,579 |
| TOTAL METALS & MINING | | | 1,215,172,321 |
| China - 3.5% | | | |
| Metals & Mining - 3.5% | | | |
| Gold - 3.5% | | | |
| Zijin Mining Group Co. Ltd. (H Shares) | | 40,930,000 | 60,684,334 |
| South Africa - 1.6% | | | |
| Metals & Mining - 1.6% | | | |
| Gold - 1.6% | | | |
| AngloGold Ashanti Ltd. | | 974,500 | 19,488,334 |
| Gold Fields Ltd. | | 974,500 | 8,046,161 |
| | | | 27,534,495 |
| United States of America - 15.2% | | | |
| Metals & Mining - 15.2% | | | |
| Gold - 14.3% | | | |
| Newmont Corp. | | 4,141,800 | 225,231,085 |
| Royal Gold, Inc. | | 194,900 | 20,213,079 |
| | | | 245,444,164 |
| Silver - 0.9% | | | |
| Gatos Silver, Inc. (b) | | 1,119,857 | 15,633,204 |
| TOTAL METALS & MINING | | | 261,077,368 |
| TOTAL COMMON STOCKS | | | |
| (Cost $1,165,152,625) | | | 1,688,965,184 |
| | | Troy Ounces | |
|
| Commodities - 0.7% | | | |
| Gold Bullion(a) | | | |
| (Cost $6,051,546) | | 6,980 | 12,073,027 |
| | | Shares | |
|
| Money Market Funds - 1.1% | | | |
| Fidelity Cash Central Fund 0.07% (d) | | 17,138,885 | 17,142,312 |
| Fidelity Securities Lending Cash Central Fund 0.08% (d)(e) | | 1,230,272 | 1,230,395 |
| TOTAL MONEY MARKET FUNDS | | | |
| (Cost $18,372,707) | | | 18,372,707 |
| TOTAL INVESTMENT IN SECURITIES - 99.9% | | | |
| (Cost $1,189,576,878) | | | 1,719,410,918 |
| NET OTHER ASSETS (LIABILITIES) - 0.1% | | | 1,657,530 |
| NET ASSETS - 100% | | | $1,721,068,448 |
Legend
(a) Non-income producing
(b) Security or a portion of the security is on loan at period end.
(c) Affiliated company
(d) Affiliated fund that is generally available only to investment companies and other accounts managed by Fidelity Investments. The rate quoted is the annualized seven-day yield of the fund at period end. A complete unaudited listing of the fund's holdings as of its most recent quarter end is available upon request. In addition, each Fidelity Central Fund's financial statements, which are not covered by the Fund's Report of Independent Registered Public Accounting Firm, are available on the SEC's website or upon request.
(e) Investment made with cash collateral received from securities on loan.
Affiliated Central Funds
Information regarding fiscal year to date income earned by the Fund from investments in Fidelity Central Funds is as follows:
| Fund | Income earned |
| Fidelity Cash Central Fund | $22,986 |
| Fidelity Securities Lending Cash Central Fund | 210,661 |
| Total | $233,647 |
Amounts in the income column in the above table include any capital gain distributions from underlying funds, which are presented in the corresponding line-item in the Consolidated Statement of Operations, if applicable.
Consolidated Subsidiary
| Fund | Value, beginning of period | Purchases | Sales Proceeds | Dividend Income | Realized Gain/Loss | Change in Unrealized appreciation (depreciation) | Value, end of period |
| Fidelity Select Cayman Gold Ltd. | $11,033,003 | $537 | $-- | $-- | $-- | $1,061,344 | $12,094,884 |
Other Affiliated Issuers
An affiliated company is a company in which the Fund has ownership of at least 5% of the voting securities. Fiscal year to date transactions with companies which are or were affiliates are as follows:
| Affiliate | Value, beginning of period | Purchases | Sales Proceeds | Dividend Income | Realized Gain (loss) | Change in Unrealized appreciation (depreciation) | Value, end of period |
| Battle North Gold Corp. | $-- | $13,347,033 | $330,676 | $-- | $(63,654) | $(1,021,658) | $11,931,045 |
| Gold Standard Ventures Corp. | 12,871,008 | 2,596,215 | 627,553 | -- | (887,738) | 976,566 | 14,928,498 |
| Maple Gold Mines Ltd. | -- | 5,818,130 | -- | -- | -- | (1,574,849) | 4,243,281 |
| Orla Mining Ltd. | 17,284,411 | 2,899,165 | -- | -- | -- | 21,211,992 | 41,395,568 |
| Premier Gold Mines Ltd. | -- | 16,080,514 | -- | -- | -- | 11,170,783 | 27,251,297 |
| Western Copper & Gold Corp. | -- | 8,326,952 | 349,704 | -- | 137,755 | 3,544,177 | 11,659,180 |
| Total | $30,155,419 | $49,068,009 | $1,307,933 | $-- | $(813,637) | $34,307,011 | $111,408,869 |
Investment Valuation
The following is a summary of the inputs used, as of February 28, 2021, involving the Fund's assets and liabilities carried at fair value. The inputs or methodology used for valuing securities may not be an indication of the risk associated with investing in those securities. For more information on valuation inputs, and their aggregation into the levels used below, please refer to the Investment Valuation section in the accompanying Notes to Consolidated Financial Statements.
| | Valuation Inputs at Reporting Date: |
| Description | Total | Level 1 | Level 2 | Level 3 |
| Investments in Securities: | | | | |
| Common Stocks | $1,688,965,184 | $1,661,430,689 | $27,534,495 | $-- |
| Commodities | 12,073,027 | 12,073,027 | -- | -- |
| Money Market Funds | 18,372,707 | 18,372,707 | -- | -- |
| Total Investments in Securities: | $1,719,410,918 | $1,691,876,423 | $27,534,495 | $-- |
See accompanying notes which are an integral part of the consolidated financial statements.
Gold Portfolio
Consolidated Financial Statements
Consolidated Statement of Assets and Liabilities
| | | February 28, 2021 |
| Assets | | |
Investment in securities, at value (including securities loaned of $1,077,224) — See accompanying schedule:
Unaffiliated issuers (cost $1,083,003,088) | $1,577,556,315 | |
| Fidelity Central Funds (cost $18,372,707) | 18,372,707 | |
| Commodities (cost $6,051,546) | 12,073,027 | |
| Other affiliated issuers (cost $82,149,537) | 111,408,869 | |
| Total Investment in Securities (cost $1,189,576,878) | | $1,719,410,918 |
| Cash | | 22,625 |
| Foreign currency held at value (cost $124,856) | | 124,744 |
| Receivable for investments sold | | 286,629 |
| Receivable for fund shares sold | | 7,527,401 |
| Dividends receivable | | 1,393,008 |
| Distributions receivable from Fidelity Central Funds | | 7,785 |
| Prepaid expenses | | 8,057 |
| Other receivables | | 164,672 |
| Total assets | | 1,728,945,839 |
| Liabilities | | |
| Payable for fund shares redeemed | $5,105,998 | |
| Accrued management fee | 860,571 | |
| Distribution and service plan fees payable | 79,073 | |
| Other affiliated payables | 363,569 | |
| Other payables and accrued expenses | 237,079 | |
| Collateral on securities loaned | 1,231,101 | |
| Total liabilities | | 7,877,391 |
| Net Assets | | $1,721,068,448 |
| Net Assets consist of: | | |
| Paid in capital | | $2,721,882,841 |
| Total accumulated earnings (loss) | | (1,000,814,393) |
| Net Assets | | $1,721,068,448 |
| Net Asset Value and Maximum Offering Price | | |
| Class A: | | |
| Net Asset Value and redemption price per share ($82,988,811 ÷ 3,436,599 shares)(a) | | $24.15 |
| Maximum offering price per share (100/94.25 of $24.15) | | $25.62 |
| Class M: | | |
| Net Asset Value and redemption price per share ($24,535,271 ÷ 1,041,034 shares)(a) | | $23.57 |
| Maximum offering price per share (100/96.50 of $23.57) | | $24.42 |
| Class C: | | |
| Net Asset Value and offering price per share ($51,194,707 ÷ 2,296,172 shares)(a) | | $22.30 |
| Gold: | | |
| Net Asset Value, offering price and redemption price per share ($1,319,439,976 ÷ 52,930,261 shares) | | $24.93 |
| Class I: | | |
| Net Asset Value, offering price and redemption price per share ($137,616,576 ÷ 5,519,988 shares) | | $24.93 |
| Class Z: | | |
| Net Asset Value, offering price and redemption price per share ($105,293,107 ÷ 4,221,560 shares) | | $24.94 |
(a) Redemption price per share is equal to net asset value less any applicable contingent deferred sales charge.
See accompanying notes which are an integral part of the consolidated financial statements.
Consolidated Statement of Operations
| | | Year ended February 28, 2021 |
| Investment Income | | |
| Dividends | | $20,479,796 |
| Income from Fidelity Central Funds (including $210,661 from security lending) | | 233,647 |
| Total income | | 20,713,443 |
| Expenses | | |
| Management fee | $11,641,724 | |
| Transfer agent fees | 3,723,566 | |
| Distribution and service plan fees | 1,023,309 | |
| Accounting fees | 963,219 | |
| Custodian fees and expenses | 107,595 | |
| Independent trustees' fees and expenses | 11,845 | |
| Registration fees | 190,080 | |
| Audit | 68,482 | |
| Legal | 3,811 | |
| Interest | 3,182 | |
| Miscellaneous | 43,886 | |
| Total expenses before reductions | 17,780,699 | |
| Expense reductions | (272,715) | |
| Total expenses after reductions | | 17,507,984 |
| Net investment income (loss) | | 3,205,459 |
| Realized and Unrealized Gain (Loss) | | |
| Net realized gain (loss) on: | | |
| Investments: | | |
| Unaffiliated issuers | 212,398,945 | |
| Fidelity Central Funds | 2,621 | |
| Other affiliated issuers | (813,637) | |
| Foreign currency transactions | (69,406) | |
| Total net realized gain (loss) | | 211,518,523 |
| Change in net unrealized appreciation (depreciation) on: | | |
| Investments: | | |
| Investments | 42,772,823 | |
| Affiliated issuers | 34,307,011 | |
| Assets and liabilities in foreign currencies | (66,912) | |
| Commodities | 1,063,054 | |
| Total change in net unrealized appreciation (depreciation) | | 78,075,976 |
| Net gain (loss) | | 289,594,499 |
| Net increase (decrease) in net assets resulting from operations | | $292,799,958 |
See accompanying notes which are an integral part of the consolidated financial statements.
Consolidated Statement of Changes in Net Assets
| | Year ended February 28, 2021 | Year ended February 29, 2020 |
| Increase (Decrease) in Net Assets | | |
| Operations | | |
| Net investment income (loss) | $3,205,459 | $3,699,988 |
| Net realized gain (loss) | 211,518,523 | (62,236,379) |
| Change in net unrealized appreciation (depreciation) | 78,075,976 | 260,887,436 |
| Net increase (decrease) in net assets resulting from operations | 292,799,958 | 202,351,045 |
| Distributions to shareholders | (91,091,449) | (6,847,722) |
| Share transactions - net increase (decrease) | (120,585,130) | 185,112,852 |
| Total increase (decrease) in net assets | 81,123,379 | 380,616,175 |
| Net Assets | | |
| Beginning of period | 1,639,945,069 | 1,259,328,894 |
| End of period | $1,721,068,448 | $1,639,945,069 |
See accompanying notes which are an integral part of the consolidated financial statements.
Consolidated Financial Highlights
Gold Portfolio Class A
| Years ended February 28, | 2021 | 2020 A | 2019 | 2018 | 2017 |
| Selected Per–Share Data | | | | | |
| Net asset value, beginning of period | $21.67 | $18.52 | $18.30 | $20.54 | $17.70 |
| Income from Investment Operations | | | | | |
| Net investment income (loss)B | (.04) | (.01)C | (.03) | (.12) | (.16) |
| Net realized and unrealized gain (loss) | 3.74 | 3.20 | .25 | (2.09) | 3.59 |
| Total from investment operations | 3.70 | 3.19 | .22 | (2.21) | 3.43 |
| Distributions from net investment income | (1.22) | (.01) | – | – | – |
| Distributions from net realized gain | – | (.03) | – | (.03) | (.60) |
| Total distributions | (1.22) | (.04) | – | (.03) | (.60) |
| Redemption fees added to paid in capitalB | – | – | – | – | .01 |
| Net asset value, end of period | $24.15 | $21.67 | $18.52 | $18.30 | $20.54 |
| Total ReturnD,E | 16.59% | 17.23% | 1.20% | (10.77)% | 19.97% |
| Ratios to Average Net AssetsF,G | | | | | |
| Expenses before reductions | 1.08% | 1.13% | 1.19% | 1.18% | 1.19% |
| Expenses net of fee waivers, if any | 1.08% | 1.13% | 1.18% | 1.16% | 1.16% |
| Expenses net of all reductions | 1.07% | 1.12% | 1.18% | 1.16% | 1.16% |
| Net investment income (loss) | (.12)% | (.05)%C | (.15)% | (.58)% | (.71)% |
| Supplemental Data | | | | | |
| Net assets, end of period (000 omitted) | $82,989 | $64,971 | $50,479 | $61,703 | $83,589 |
| Portfolio turnover rateH | 46% | 56% | 37% | 13% | 28% |
A For the year ended February 29.
B Calculated based on average shares outstanding during the period.
C Net investment income per share reflects one or more large, non-recurring dividend(s) which amounted to $.05 per share. Excluding such non-recurring dividend(s), the ratio of net investment income (loss) to average net assets would have been (.26) %.
D Total returns would have been lower if certain expenses had not been reduced during the applicable periods shown.
E Total returns do not include the effect of the sales charges.
F Fees and expenses of any underlying mutual funds or exchange-traded funds (ETFs) are not included in the Fund's expense ratio. The Fund indirectly bears its proportionate share of these expenses. For additional expense information related to investments in Fidelity Central Funds, please refer to the "Investments in Fidelity Central Funds" note found in the Notes to Financial Statements section of the most recent Annual or Semi-Annual report.
G Expense ratios reflect operating expenses of the class. Expenses before reductions do not reflect amounts reimbursed, waived, or reduced through arrangements with the investment adviser, brokerage services, or other offset arrangements, if applicable, and do not represent the amount paid by the class during periods when reimbursements, waivers or reductions occur.
H Amount does not include the portfolio activity of any underlying mutual funds or exchange-traded funds (ETFs).
See accompanying notes which are an integral part of the consolidated financial statements.
Gold Portfolio Class M
| Years ended February 28, | 2021 | 2020 A | 2019 | 2018 | 2017 |
| Selected Per–Share Data | | | | | |
| Net asset value, beginning of period | $21.16 | $18.11 | $17.94 | $20.19 | $17.37 |
| Income from Investment Operations | | | | | |
| Net investment income (loss)B | (.12) | (.07)C | (.07) | (.17) | (.22) |
| Net realized and unrealized gain (loss) | 3.67 | 3.12 | .24 | (2.05) | 3.54 |
| Total from investment operations | 3.55 | 3.05 | .17 | (2.22) | 3.32 |
| Distributions from net investment income | (1.14) | – | – | – | – |
| Distributions from net realized gain | – | – | – | (.03) | (.51) |
| Total distributions | (1.14) | – | – | (.03) | (.51) |
| Redemption fees added to paid in capitalB | – | – | – | – | .01 |
| Net asset value, end of period | $23.57 | $21.16 | $18.11 | $17.94 | $20.19 |
| Total ReturnD,E | 16.28% | 16.84% | .95% | (11.04)% | 19.62% |
| Ratios to Average Net AssetsF,G | | | | | |
| Expenses before reductions | 1.37% | 1.42% | 1.48% | 1.48% | 1.49% |
| Expenses net of fee waivers, if any | 1.37% | 1.42% | 1.46% | 1.47% | 1.46% |
| Expenses net of all reductions | 1.36% | 1.41% | 1.46% | 1.47% | 1.46% |
| Net investment income (loss) | (.42)% | (.34)%C | (.43)% | (.88)% | (1.01)% |
| Supplemental Data | | | | | |
| Net assets, end of period (000 omitted) | $24,535 | $19,620 | $17,401 | $19,355 | $25,170 |
| Portfolio turnover rateH | 46% | 56% | 37% | 13% | 28% |
A For the year ended February 29.
B Calculated based on average shares outstanding during the period.
C Net investment income per share reflects one or more large, non-recurring dividend(s) which amounted to $.04 per share. Excluding such non-recurring dividend(s), the ratio of net investment income (loss) to average net assets would have been (.56) %.
D Total returns would have been lower if certain expenses had not been reduced during the applicable periods shown.
E Total returns do not include the effect of the sales charges.
F Fees and expenses of any underlying mutual funds or exchange-traded funds (ETFs) are not included in the Fund's expense ratio. The Fund indirectly bears its proportionate share of these expenses. For additional expense information related to investments in Fidelity Central Funds, please refer to the "Investments in Fidelity Central Funds" note found in the Notes to Financial Statements section of the most recent Annual or Semi-Annual report.
G Expense ratios reflect operating expenses of the class. Expenses before reductions do not reflect amounts reimbursed, waived, or reduced through arrangements with the investment adviser, brokerage services, or other offset arrangements, if applicable, and do not represent the amount paid by the class during periods when reimbursements, waivers or reductions occur.
H Amount does not include the portfolio activity of any underlying mutual funds or exchange-traded funds (ETFs).
See accompanying notes which are an integral part of the consolidated financial statements.
Gold Portfolio Class C
| Years ended February 28, | 2021 | 2020 A | 2019 | 2018 | 2017 |
| Selected Per–Share Data | | | | | |
| Net asset value, beginning of period | $20.07 | $17.24 | $17.15 | $19.36 | $16.68 |
| Income from Investment Operations | | | | | |
| Net investment income (loss)B | (.22) | (.14)C | (.13) | (.24) | (.29) |
| Net realized and unrealized gain (loss) | 3.49 | 2.97 | .22 | (1.95) | 3.42 |
| Total from investment operations | 3.27 | 2.83 | .09 | (2.19) | 3.13 |
| Distributions from net investment income | (1.04) | – | – | – | – |
| Distributions from net realized gain | – | – | – | (.02) | (.45) |
| Total distributions | (1.04) | – | – | (.02) | (.45) |
| Redemption fees added to paid in capitalB | – | – | – | – | –D |
| Net asset value, end of period | $22.30 | $20.07 | $17.24 | $17.15 | $19.36 |
| Total ReturnE,F | 15.81% | 16.42% | .52% | (11.35)% | 19.19% |
| Ratios to Average Net AssetsG,H | | | | | |
| Expenses before reductions | 1.78% | 1.80% | 1.84% | 1.85% | 1.88% |
| Expenses net of fee waivers, if any | 1.78% | 1.80% | 1.83% | 1.83% | 1.85% |
| Expenses net of all reductions | 1.77% | 1.79% | 1.83% | 1.83% | 1.84% |
| Net investment income (loss) | (.83)% | (.72)%C | (.80)% | (1.25)% | (1.40)% |
| Supplemental Data | | | | | |
| Net assets, end of period (000 omitted) | $51,195 | $52,375 | $67,760 | $92,724 | $101,215 |
| Portfolio turnover rateI | 46% | 56% | 37% | 13% | 28% |
A For the year ended February 29.
B Calculated based on average shares outstanding during the period.
C Net investment income per share reflects one or more large, non-recurring dividend(s) which amounted to $.04 per share. Excluding such non-recurring dividend(s), the ratio of net investment income (loss) to average net assets would have been (.94) %.
D Amount represents less than $.005 per share.
E Total returns would have been lower if certain expenses had not been reduced during the applicable periods shown.
F Total returns do not include the effect of the contingent deferred sales charge.
G Fees and expenses of any underlying mutual funds or exchange-traded funds (ETFs) are not included in the Fund's expense ratio. The Fund indirectly bears its proportionate share of these expenses. For additional expense information related to investments in Fidelity Central Funds, please refer to the "Investments in Fidelity Central Funds" note found in the Notes to Financial Statements section of the most recent Annual or Semi-Annual report.
H Expense ratios reflect operating expenses of the class. Expenses before reductions do not reflect amounts reimbursed, waived, or reduced through arrangements with the investment adviser, brokerage services, or other offset arrangements, if applicable, and do not represent the amount paid by the class during periods when reimbursements, waivers or reductions occur.
I Amount does not include the portfolio activity of any underlying mutual funds or exchange-traded funds (ETFs).
See accompanying notes which are an integral part of the consolidated financial statements.
Gold Portfolio
| Years ended February 28, | 2021 | 2020 A | 2019 | 2018 | 2017 |
| Selected Per–Share Data | | | | | |
| Net asset value, beginning of period | $22.33 | $19.07 | $18.78 | $21.02 | $18.12 |
| Income from Investment Operations | | | | | |
| Net investment income (loss)B | .06 | .06C | .03 | (.05) | (.09) |
| Net realized and unrealized gain (loss) | 3.84 | 3.30 | .26 | (2.14) | 3.66 |
| Total from investment operations | 3.90 | 3.36 | .29 | (2.19) | 3.57 |
| Distributions from net investment income | (1.30) | (.06) | – | – | – |
| Distributions from net realized gain | – | (.03) | – | (.05) | (.68) |
| Total distributions | (1.30) | (.10)D | – | (.05) | (.68) |
| Redemption fees added to paid in capitalB | – | – | – | – | .01 |
| Net asset value, end of period | $24.93 | $22.33 | $19.07 | $18.78 | $21.02 |
| Total ReturnE | 16.96% | 17.60% | 1.54% | (10.47)% | 20.38% |
| Ratios to Average Net AssetsF,G | | | | | |
| Expenses before reductions | .76% | .79% | .86% | .86% | .87% |
| Expenses net of fee waivers, if any | .76% | .79% | .85% | .85% | .84% |
| Expenses net of all reductions | .75% | .78% | .85% | .84% | .84% |
| Net investment income (loss) | .19% | .29%C | .18% | (.26)% | (.39)% |
| Supplemental Data | | | | | |
| Net assets, end of period (000 omitted) | $1,319,440 | $1,292,204 | $1,035,697 | $1,011,412 | $1,271,458 |
| Portfolio turnover rateH | 46% | 56% | 37% | 13% | 28% |
A For the year ended February 29.
B Calculated based on average shares outstanding during the period.
C Net investment income per share reflects one or more large, non-recurring dividend(s) which amounted to $.05 per share. Excluding such non-recurring dividend(s), the ratio of net investment income (loss) to average net assets would have been .07%.
D Total distributions per share do not sum due to rounding.
E Total returns would have been lower if certain expenses had not been reduced during the applicable periods shown.
F Fees and expenses of any underlying mutual funds or exchange-traded funds (ETFs) are not included in the Fund's expense ratio. The Fund indirectly bears its proportionate share of these expenses. For additional expense information related to investments in Fidelity Central Funds, please refer to the "Investments in Fidelity Central Funds" note found in the Notes to Financial Statements section of the most recent Annual or Semi-Annual report.
G Expense ratios reflect operating expenses of the class. Expenses before reductions do not reflect amounts reimbursed, waived, or reduced through arrangements with the investment adviser, brokerage services, or other offset arrangements, if applicable, and do not represent the amount paid by the class during periods when reimbursements, waivers or reductions occur.
H Amount does not include the portfolio activity of any underlying mutual funds or exchange-traded funds (ETFs).
See accompanying notes which are an integral part of the consolidated financial statements.
Gold Portfolio Class I
| Years ended February 28, | 2021 | 2020 A | 2019 | 2018 | 2017 |
| Selected Per–Share Data | | | | | |
| Net asset value, beginning of period | $22.33 | $19.07 | $18.78 | $21.02 | $18.13 |
| Income from Investment Operations | | | | | |
| Net investment income (loss)B | .05 | .06C | .04 | (.05) | (.09) |
| Net realized and unrealized gain (loss) | 3.85 | 3.30 | .25 | (2.14) | 3.67 |
| Total from investment operations | 3.90 | 3.36 | .29 | (2.19) | 3.58 |
| Distributions from net investment income | (1.30) | (.07) | – | – | – |
| Distributions from net realized gain | – | (.03) | – | (.05) | (.70) |
| Total distributions | (1.30) | (.10) | – | (.05) | (.70) |
| Redemption fees added to paid in capitalB | – | – | – | – | .01 |
| Net asset value, end of period | $24.93 | $22.33 | $19.07 | $18.78 | $21.02 |
| Total ReturnD | 16.96% | 17.60% | 1.54% | (10.47)% | 20.41% |
| Ratios to Average Net AssetsE,F | | | | | |
| Expenses before reductions | .77% | .79% | .84% | .85% | .87% |
| Expenses net of fee waivers, if any | .77% | .79% | .82% | .83% | .84% |
| Expenses net of all reductions | .76% | .77% | .82% | .83% | .84% |
| Net investment income (loss) | .18% | .30%C | .21% | (.24)% | (.39)% |
| Supplemental Data | | | | | |
| Net assets, end of period (000 omitted) | $137,617 | $115,699 | $84,956 | $61,677 | $58,673 |
| Portfolio turnover rateG | 46% | 56% | 37% | 13% | 28% |
A For the year ended February 29.
B Calculated based on average shares outstanding during the period.
C Net investment income per share reflects one or more large, non-recurring dividend(s) which amounted to $.05 per share. Excluding such non-recurring dividend(s), the ratio of net investment income (loss) to average net assets would have been .08%.
D Total returns would have been lower if certain expenses had not been reduced during the applicable periods shown.
E Fees and expenses of any underlying mutual funds or exchange-traded funds (ETFs) are not included in the Fund's expense ratio. The Fund indirectly bears its proportionate share of these expenses. For additional expense information related to investments in Fidelity Central Funds, please refer to the "Investments in Fidelity Central Funds" note found in the Notes to Financial Statements section of the most recent Annual or Semi-Annual report.
F Expense ratios reflect operating expenses of the class. Expenses before reductions do not reflect amounts reimbursed, waived, or reduced through arrangements with the investment adviser, brokerage services, or other offset arrangements, if applicable, and do not represent the amount paid by the class during periods when reimbursements, waivers or reductions occur.
G Amount does not include the portfolio activity of any underlying mutual funds or exchange-traded funds (ETFs).
See accompanying notes which are an integral part of the consolidated financial statements.
Gold Portfolio Class Z
| Years ended February 28, | 2021 | 2020 A | 2019 B |
| Selected Per–Share Data | | | |
| Net asset value, beginning of period | $22.34 | $19.08 | $16.62 |
| Income from Investment Operations | | | |
| Net investment income (loss)C | .09 | .10D | .07 |
| Net realized and unrealized gain (loss) | 3.85 | 3.29 | 2.39 |
| Total from investment operations | 3.94 | 3.39 | 2.46 |
| Distributions from net investment income | (1.34) | (.10) | – |
| Distributions from net realized gain | – | (.03) | – |
| Total distributions | (1.34) | (.13) | – |
| Redemption fees added to paid in capitalC | – | – | – |
| Net asset value, end of period | $24.94 | $22.34 | $19.08 |
| Total ReturnE,F | 17.12% | 17.75% | 14.80% |
| Ratios to Average Net AssetsG,H | | | |
| Expenses before reductions | .64% | .65% | .68%I |
| Expenses net of fee waivers, if any | .64% | .64% | .68%I |
| Expenses net of all reductions | .62% | .63% | .67%I |
| Net investment income (loss) | .32% | .44%D | .97%I |
| Supplemental Data | | | |
| Net assets, end of period (000 omitted) | $105,293 | $95,076 | $3,037 |
| Portfolio turnover rateJ | 46% | 56% | 37% |
A For the year ended February 29.
B For the period October 2, 2018 (commencement of sale of shares) to February 28, 2019.
C Calculated based on average shares outstanding during the period.
D Net investment income per share reflects one or more large, non-recurring dividend(s) which amounted to $.05 per share. Excluding such non-recurring dividend(s), the ratio of net investment income (loss) to average net assets would have been .22%.
E Total returns for periods of less than one year are not annualized.
F Total returns would have been lower if certain expenses had not been reduced during the applicable periods shown.
G Fees and expenses of any underlying mutual funds or exchange-traded funds (ETFs) are not included in the Fund's expense ratio. The Fund indirectly bears its proportionate share of these expenses. For additional expense information related to investments in Fidelity Central Funds, please refer to the "Investments in Fidelity Central Funds" note found in the Notes to Financial Statements section of the most recent Annual or Semi-Annual report.
H Expense ratios reflect operating expenses of the class. Expenses before reductions do not reflect amounts reimbursed, waived, or reduced through arrangements with the investment adviser, brokerage services, or other offset arrangements, if applicable, and do not represent the amount paid by the class during periods when reimbursements, waivers or reductions occur.
I Annualized
J Amount does not include the portfolio activity of any underlying mutual funds or exchange-traded funds (ETFs).
See accompanying notes which are an integral part of the consolidated financial statements.
Notes to Consolidated Financial Statements
For the period ended February 28, 2021
1. Organization.
Gold Portfolio (the Fund) is a non-diversified fund of Fidelity Select Portfolios (the Trust) and is authorized to issue an unlimited number of shares. The Trust is registered under the Investment Company Act of 1940, as amended (the 1940 Act), as an open-end management investment company organized as a Massachusetts business trust. The Fund invests primarily in securities of companies whose principal business activities fall within specific industries. The Fund offers Class A, Class M, Class C, Gold, Class I and Class Z shares, each of which has equal rights as to assets and voting privileges. Each class has exclusive voting rights with respect to matters that affect that class. Class C shares will automatically convert to Class A shares after a holding period of ten years from the initial date of purchase, with certain exceptions.
2. Consolidated Subsidiary.
The Funds included in the table below hold certain commodity-related investments through a wholly owned subsidiary (the "Subsidiary"). As of period end, the investments in the Subsidiaries, were as follows:
| | Subsidiary Name | $ Amount | % of Fund's Net Assets |
| Gold Portfolio | Fidelity Select Gold Cayman Ltd. | 12,094,884 | .7 |
The financial statements have been consolidated to include the Subsidiary accounts where applicable. Accordingly, all inter-company transactions and balances have been eliminated.
3. Investments in Fidelity Central Funds.
The Fund invests in Fidelity Central Funds, which are open-end investment companies generally available only to other investment companies and accounts managed by the investment adviser and its affiliates. The Fund's Consolidated Schedule of Investments lists each of the Fidelity Central Funds held as of period end, if any, as an investment of the Fund, but does not include the underlying holdings of each Fidelity Central Fund. As an Investing Fund, the Fund indirectly bears its proportionate share of the expenses of the underlying Fidelity Central Funds.
The Money Market Central Funds seek preservation of capital and current income and are managed by the investment adviser. Annualized expenses of the Money Market Central Funds as of their most recent shareholder report date ranged from less than .005% to .01%.
A complete unaudited list of holdings for each Fidelity Central Fund is available upon request or at the Securities and Exchange Commission (the SEC) website at www.sec.gov. In addition, the financial statements of the Fidelity Central Funds, which are not covered by the Fund's Report of Independent Registered Public Accounting Firm, are available on the SEC website or upon request.
4. Significant Accounting Policies.
The Fund is an investment company and applies the accounting and reporting guidance of the Financial Accounting Standards Board (FASB) Accounting Standards Codification Topic 946 Financial Services - Investment Companies. The consolidated financial statements have been prepared in conformity with accounting principles generally accepted in the United States of America (GAAP), which require management to make certain estimates and assumptions at the date of the financial statements. Actual results could differ from those estimates. Subsequent events, if any, through the date that the financial statements were issued have been evaluated in the preparation of the financial statements. The following summarizes the significant accounting policies of the Fund:
Investment Valuation. Investments are valued as of 4:00 p.m. Eastern time on the last calendar day of the period. The Board of Trustees (the Board) has delegated the day to day responsibility for the valuation of the Fund's investments to the Fair Value Committee (the Committee) established by the Fund's investment adviser. In accordance with valuation policies and procedures approved by the Board, the Fund attempts to obtain prices from one or more third party pricing vendors or brokers to value its investments. When current market prices, quotations or currency exchange rates are not readily available or reliable, investments will be fair valued in good faith by the Committee, in accordance with procedures adopted by the Board. Factors used in determining fair value vary by investment type and may include market or investment specific events. The frequency with which these procedures are used cannot be predicted and they may be utilized to a significant extent. The Committee oversees the Fund's valuation policies and procedures and reports to the Board on the Committee's activities and fair value determinations. The Board monitors the appropriateness of the procedures used in valuing the Fund's investments and ratifies the fair value determinations of the Committee.
The Fund categorizes the inputs to valuation techniques used to value its investments into a disclosure hierarchy consisting of three levels as shown below:
- Level 1 – quoted prices in active markets for identical investments
- Level 2 – other significant observable inputs (including quoted prices for similar investments, interest rates, prepayment speeds, etc.)
- Level 3 – unobservable inputs (including the Fund's own assumptions based on the best information available)
Valuation techniques used to value the Fund's investments by major category are as follows:
Equity securities, including restricted securities, for which market quotations are readily available, are valued at the last reported sale price or official closing price as reported by a third party pricing vendor on the primary market or exchange on which they are traded and are categorized as Level 1 in the hierarchy. In the event there were no sales during the day or closing prices are not available, securities are valued at the last quoted bid price or may be valued using the last available price and are generally categorized as Level 2 in the hierarchy. For foreign equity securities, when market or security specific events arise, comparisons to the valuation of American Depositary Receipts (ADRs), futures contracts, Exchange-Traded Funds (ETFs) and certain indexes as well as quoted prices for similar securities may be used and would be categorized as Level 2 in the hierarchy. For equity securities, including restricted securities, where observable inputs are limited, assumptions about market activity and risk are used and these securities may be categorized as Level 3 in the hierarchy.
Investments in commodities are valued at their last traded price at 4:00 p.m. Eastern time each business day and are categorized as Level 1 in the hierarchy. Investments in open-end mutual funds, including the Fidelity Central Funds, are valued at their closing net asset value (NAV) each business day and are categorized as Level 1 in the hierarchy.
Changes in valuation techniques may result in transfers in or out of an assigned level within the disclosure hierarchy. The aggregate value of investments by input level as of February 28, 2021 is included at the end of the Fund's Consolidated Schedule of Investments.
Foreign Currency. Certain Funds may use foreign currency contracts to facilitate transactions in foreign-denominated securities. Gains and losses from these transactions may arise from changes in the value of the foreign currency or if the counterparties do not perform under the contracts' terms.
Foreign-denominated assets, including investment securities, and liabilities are translated into U.S. dollars at the exchange rates at period end. Purchases and sales of investment securities, income and dividends received, and expenses denominated in foreign currencies are translated into U.S. dollars at the exchange rate in effect on the transaction date.
The effects of exchange rate fluctuations on investments are included with the net realized and unrealized gain (loss) on investment securities. Other foreign currency transactions resulting in realized and unrealized gain (loss) are disclosed separately.
Investment Transactions and Income. For financial reporting purposes, the Fund's investment holdings and NAV include trades executed through the end of the last business day of the period. The NAV per share for processing shareholder transactions is calculated as of the close of business of the New York Stock Exchange (NYSE), normally 4:00 p.m. Eastern time and includes trades executed through the end of the prior business day. Gains and losses on securities sold are determined on the basis of identified cost. Dividend income is recorded on the ex-dividend date, except for certain dividends from foreign securities where the ex-dividend date may have passed, which are recorded as soon as the Fund is informed of the ex-dividend date. Non-cash dividends included in dividend income, if any, are recorded at the fair market value of the securities received. Income and capital gain distributions from Fidelity Central Funds, if any, are recorded on the ex-dividend date. Certain distributions received by the Fund represent a return of capital or capital gain. The Fund determines the components of these distributions subsequent to the ex-dividend date, based upon receipt of tax filings or other correspondence relating to the underlying investment. These distributions are recorded as a reduction of cost of investments and/or as a realized gain. Investment income is recorded net of foreign taxes withheld where recovery of such taxes is uncertain.
Class Allocations and Expenses. Investment income, realized and unrealized capital gains and losses, common expenses of the Fund, and certain fund-level expense reductions, if any, are allocated daily on a pro-rata basis to each class based on the relative net assets of each class to the total net assets of the Fund. Each class differs with respect to transfer agent and distribution and service plan fees incurred. Certain expense reductions may also differ by class. For the reporting period, the allocated portion of income and expenses to each class as a percent of its average net assets may vary due to the timing of recording these transactions in relation to fluctuating net assets of the classes. Expenses directly attributable to a fund are charged to that fund. Expenses attributable to more than one fund are allocated among the respective funds on the basis of relative net assets or other appropriate methods. Expense estimates are accrued in the period to which they relate and adjustments are made when actual amounts are known.
Deferred Trustee Compensation. Under a Deferred Compensation Plan (the Plan) for certain Funds, certain independent Trustees have elected to defer receipt of a portion of their annual compensation. Deferred amounts are invested in affiliated mutual funds, are marked-to-market and remain in a fund until distributed in accordance with the Plan. The investment of deferred amounts and the offsetting payable to the Trustees presented below are included in the accompanying Statement of Assets and Liabilities in other receivables and other payables and accrued expenses, as applicable.
Income Tax Information and Distributions to Shareholders. Each year, the Fund intends to qualify as a regulated investment company under Subchapter M of the Internal Revenue Code, including distributing substantially all of its taxable income and realized gains. As a result, no provision for U.S. Federal income taxes is required. As of February 28, 2021, the Fund did not have any unrecognized tax benefits in the consolidated financial statements; nor is the Fund aware of any tax positions for which it is reasonably possible that the total amounts of unrecognized tax benefits will significantly change in the next twelve months. The Fund files a U.S. federal tax return, in addition to state and local tax returns as required. The Fund's federal income tax returns are subject to examination by the Internal Revenue Service (IRS) for a period of three fiscal years after they are filed. State and local tax returns may be subject to examination for an additional fiscal year depending on the jurisdiction. Foreign taxes are provided for based on the Fund's understanding of the tax rules and rates that exist in the foreign markets in which it invests.
The Subsidiary is classified as a controlled foreign corporation under Subchapter N of the Internal Revenue Code. Therefore, the Fund is required to increase its taxable income by its share of the Subsidiary's income. Net investment losses of the Subsidiary cannot be deducted by the Fund in the current period nor carried forward to offset taxable income in future periods.
Distributions are declared and recorded on the ex-dividend date. Income and capital gain distributions are declared separately for each class. Income and capital gain distributions are determined in accordance with income tax regulations, which may differ from GAAP.
Capital accounts within the consolidated financial statements are adjusted for permanent book-tax differences. These adjustments have no impact on net assets or the results of operations. Capital accounts are not adjusted for temporary book-tax differences which will reverse in a subsequent period.
Book-tax differences are primarily due to foreign currency transactions, passive foreign investment companies (PFIC), controlled foreign corporations, deferred Trustees compensation, capital loss carryforwards and losses deferred due to wash sales and excise tax regulations.
As of period end, the cost and unrealized appreciation (depreciation) in securities, and derivatives if applicable, for federal income tax purposes on an unconsolidated basis were as follows:
| Gross unrealized appreciation | $458,547,536 |
| Gross unrealized depreciation | (113,097,630) |
| Net unrealized appreciation (depreciation) | $345,449,906 |
| Tax Cost | $1,373,961,012 |
The tax-based components of distributable earnings as of period end were as follows:
| Capital loss carryforward | $(1,382,918,676) |
| Net unrealized appreciation (depreciation) on securities and other investments | $345,449,882 |
Capital loss carryforwards are only available to offset future capital gains of the Fund to the extent provided by regulations and may be limited. The capital loss carryforward information presented below, including any applicable limitation, is estimated as of fiscal period end and is subject to adjustment.
| No expiration | |
| Short-term | $(169,623,784) |
| Long-term | (1,213,294,892) |
| Total capital loss carryforward | $(1,382,918,676) |
The Fund intends to elect to defer to its next fiscal year $10,990,982 of ordinary losses recognized during the period January 1, 2021 to February 28, 2021.
The tax character of distributions paid was as follows:
| | February 28, 2021 | February 29, 2020 |
| Ordinary Income | $91,091,449 | $ 6,847,722 |
5. Purchases and Sales of Investments.
Purchases and sales of securities, other than short-term securities, are noted in the table below.
| | Purchases ($) | Sales ($) |
| Gold Portfolio | 972,481,770 | 1,195,373,912 |
6. Fees and Other Transactions with Affiliates.
Management Fee. Fidelity Management & Research Company LLC (the investment adviser) and its affiliates provide the Fund with investment management related services for which the Fund pays a monthly management fee. The management fee is the sum of an individual fund fee rate that is based on an annual rate of .30% of the Fund's average net assets and an annualized group fee rate that averaged .23% during the period. The group fee rate is based upon the monthly average net assets of a group of registered investment companies with which the investment adviser has management contracts. The group fee rate decreases as assets under management increase and increases as assets under management decrease. For the reporting period, the total annual management fee rate was .53% of the Fund's average net assets.
The investment adviser, either through itself or through an affiliate provides investment management related services to the Subsidiary. The Subsidiary does not pay the investment adviser a fee for these services. Under the management contract with the subsidiary, the investment adviser pays all other expenses of the Subsidiary, except custodian fees.
Distribution and Service Plan Fees. In accordance with Rule 12b-1 of the 1940 Act, the Fund has adopted separate Distribution and Service Plans for each class of shares. Certain classes pay Fidelity Distributors Company LLC (FDC), an affiliate of the investment adviser, separate Distribution and Service Fees, each of which is based on an annual percentage of each class' average net assets. In addition, FDC may pay financial intermediaries for selling shares of the Fund and providing shareholder support services. For the period, the Distribution and Service Fee rates, total fees and amounts retained by FDC were as follows:
| | Distribution Fee | Service Fee | Total Fees | Retained by FDC |
| Class A | -% | .25% | $230,632 | $10,737 |
| Class M | .25% | .25% | 140,134 | 1,256 |
| Class C | .75% | .25% | 652,543 | 59,867 |
| | | | $1,023,309 | $71,860 |
Sales Load. FDC may receive a front-end sales charge of up to 5.75% for selling Class A shares and 3.50% for selling Class M shares, some of which is paid to financial intermediaries for selling shares of the Fund. Depending on the holding period, FDC may receive contingent deferred sales charges levied on Class A, Class M and Class C redemptions. The deferred sales charges are 1.00% for Class C shares, 1.00% for certain purchases of Class A shares and .25% for certain purchases of Class M shares.
For the period, sales charge amounts retained by FDC were as follows:
| | Retained by FDC |
| Class A | $57,890 |
| Class M | 7,316 |
| Class C(a) | 10,863 |
| | $76,069 |
(a) When Class C shares are initially sold, FDC pays commissions from its own resources to financial intermediaries through which the sales are made.
Transfer Agent Fees. Fidelity Investments Institutional Operations Company LLC (FIIOC), an affiliate of the investment adviser, is the transfer, dividend disbursing and shareholder servicing agent for each class of the Fund. FIIOC receives account fees and asset-based fees that vary according to the account size and type of account of the shareholders of the respective classes of the Fund, except for Class Z. FIIOC receives an asset-based fee of Class Z's average net assets. FIIOC pays for typesetting, printing and mailing of shareholder reports, except proxy statements.
For the period, transfer agent fees for each class were as follows:
| | Amount | % of Class-Level Average Net Assets |
| Class A | $216,783 | .24 |
| Class M | 78,765 | .28 |
| Class C | 125,422 | .19 |
| Gold | 2,946,545 | .17 |
| Class I | 300,892 | .18 |
| Class Z | 55,159 | .04 |
| | $3,723,566 | |
Accounting Fees. Fidelity Service Company, Inc. (FSC), an affiliate of the investment adviser, maintains the Fund's accounting records. The accounting fee is based on the level of average net assets for each month. For the period, the fees were equivalent to the following annual rates:
| | % of Average Net Assets |
| Gold Portfolio | .04 |
Brokerage Commissions. A portion of portfolio transactions were placed with brokerage firms which are affiliates of the investment adviser. Brokerage commissions are included in net realized gain (loss) and change in net unrealized appreciation (depreciation) in the Consolidated Statement of Operations. The commissions paid to these affiliated firms were as follows:
| | Amount |
| Gold Portfolio | $12,019 |
Interfund Lending Program. Pursuant to an Exemptive Order issued by the SEC, the Fund, along with other registered investment companies having management contracts with Fidelity Management & Research Company LLC (FMR), or other affiliated entities of FMR, may participate in an interfund lending program. This program provides an alternative credit facility allowing the Fund to borrow from, or lend money to, other participating affiliated funds. At period end, there were no interfund loans outstanding. Activity in this program during the period for which loans were outstanding was as follows:
| | Borrower or Lender | Average Loan Balance | Weighted Average Interest Rate | Interest Expense |
| Gold Portfolio | Borrower | $49,059,714 | .33% | $3,182 |
Interfund Trades. Funds may purchase from or sell securities to other Fidelity Funds under procedures adopted by the Board. The procedures have been designed to ensure these interfund trades are executed in accordance with Rule 17a-7 of the 1940 Act. Any interfund trades are included within the respective purchases and sales amounts shown in the Purchases and Sales of Investments note and are noted in the table below.
| | Purchases ($) | Sales ($) |
| Gold Portfolio | 22,530,171 | 33,603,353 |
7. Committed Line of Credit.
Certain Funds participate with other funds managed by the investment adviser or an affiliate in a $4.25 billion credit facility (the "line of credit") to be utilized for temporary or emergency purposes to fund shareholder redemptions or for other short-term liquidity purposes. The participating funds have agreed to pay commitment fees on their pro-rata portion of the line of credit, which are reflected in Miscellaneous expenses on the Consolidated Statement of Operations, and are listed below.
| | Amount |
| Gold Portfolio | $4,805 |
During the period, there were no borrowings on this line of credit.
8. Security Lending.
Funds lend portfolio securities from time to time in order to earn additional income. Lending agents are used, including National Financial Services (NFS), an affiliate of the investment adviser. Pursuant to a securities lending agreement, NFS will receive a fee, which is capped at 9.9% of a fund's daily lending revenue, for its services as lending agent. A fund may lend securities to certain qualified borrowers, including NFS. On the settlement date of the loan, a fund receives collateral (in the form of U.S. Treasury obligations, letters of credit and/or cash) against the loaned securities and maintains collateral in an amount not less than 100% of the market value of the loaned securities during the period of the loan. The market value of the loaned securities is determined at the close of business of a fund and any additional required collateral is delivered to a fund on the next business day. A fund or borrower may terminate the loan at any time, and if the borrower defaults on its obligation to return the securities loaned because of insolvency or other reasons, a fund may apply collateral received from the borrower against the obligation. A fund may experience delays and costs in recovering the securities loaned. Any cash collateral received is invested in the Fidelity Securities Lending Cash Central Fund. Any loaned securities are identified as such in the Schedule of Investments, and the value of loaned securities and cash collateral at period end, as applicable, are presented in the Statement of Assets and Liabilities. Security lending income represents the income earned on investing cash collateral, less rebates paid to borrowers and any lending agent fees associated with the loan, plus any premium payments received for lending certain types of securities. Security lending income is presented in the Statement of Operations as a component of income from Fidelity Central Funds. Affiliated security lending activity, if any, was as follows:
| | Total Security Lending Income Fees Paid to NFS | Security Lending Income From Securities Loaned to NFS | Value of Securities Loaned to NFS at Period End |
| Gold Portfolio | $506 | $– | $– |
9. Expense Reductions.
Commissions paid to certain brokers with whom the investment adviser, or its affiliates, places trades on behalf of the Fund include an amount in addition to trade execution, which may be rebated back to the Fund to offset expenses. This amount totaled $264,309 for the period. Through arrangements with the Fund's custodian, credits realized as a result of certain uninvested cash balances were used to reduce the Fund's expenses. During the period, custodian credits reduced the Fund's expenses by $1,862.
In addition, during the period the investment adviser or an affiliate reimbursed and/or waived a portion of fund-level operating expenses in the amount of $6,544.
10. Distributions to Shareholders.
Distributions to shareholders of each class were as follows:
| | Year ended
February 28, 2021 | Year ended
February 29, 2020 |
| Distributions to shareholders | | |
| Class A | $4,010,639 | $126,430 |
| Class M | 1,115,063 | – |
| Class C | 2,524,863 | – |
| Gold | 70,600,050 | 5,685,007 |
| Class I | 7,213,998 | 512,501 |
| Class Z | 5,626,836 | 523,784 |
| Total | $91,091,449 | $6,847,722 |
11. Share Transactions.
Share transactions for each class were as follows and may contain automatic conversions between classes or exchanges between affiliated funds:
| | Shares | Shares | Dollars | Dollars |
| | Year ended February 28, 2021 | Year ended February 29, 2020 | Year ended February 28, 2021 | Year ended February 29, 2020 |
| Class A | | | | |
| Shares sold | 1,602,411 | 1,071,031 | $46,307,419 | $23,081,577 |
| Reinvestment of distributions | 147,580 | 5,541 | 3,943,292 | 124,685 |
| Shares redeemed | (1,311,852) | (803,447) | (36,279,681) | (17,157,110) |
| Net increase (decrease) | 438,139 | 273,125 | $13,971,030 | $6,049,152 |
| Class M | | | | |
| Shares sold | 473,868 | 235,440 | $13,282,274 | $4,985,960 |
| Reinvestment of distributions | 42,585 | – | 1,111,652 | – |
| Shares redeemed | (402,439) | (269,260) | (10,890,832) | (5,455,321) |
| Net increase (decrease) | 114,014 | (33,820) | $3,503,094 | $(469,361) |
| Class C | | | | |
| Shares sold | 543,437 | 447,770 | $14,501,134 | $9,285,024 |
| Reinvestment of distributions | 100,321 | – | 2,470,926 | – |
| Shares redeemed | (956,996) | (1,768,549) | (23,855,420) | (33,587,608) |
| Net increase (decrease) | (313,238) | (1,320,779) | $(6,883,360) | $(24,302,584) |
| Gold | | | | |
| Shares sold | 34,425,719 | 35,604,152 | $1,017,936,027 | $801,315,881 |
| Reinvestment of distributions | 2,470,762 | 237,526 | 67,701,953 | 5,435,729 |
| Shares redeemed | (41,839,156) | (32,282,204) | (1,230,854,903) | (714,942,656) |
| Net increase (decrease) | (4,942,675) | 3,559,474 | $(145,216,923) | $91,808,954 |
| Class I | | | | |
| Shares sold | 2,639,229 | 2,911,958 | $75,390,235 | $63,117,217 |
| Reinvestment of distributions | 255,414 | 21,730 | 7,033,514 | 497,247 |
| Shares redeemed | (2,555,501) | (2,207,535) | (72,639,886) | (48,726,909) |
| Net increase (decrease) | 339,142 | 726,153 | $9,783,863 | $14,887,555 |
| Class Z | | | | |
| Shares sold | 3,622,415 | 5,524,932 | $106,573,896 | $130,157,436 |
| Reinvestment of distributions | 201,508 | 22,294 | 5,545,241 | 509,236 |
| Shares redeemed | (3,857,752) | (1,450,995) | (107,861,971) | (33,527,536) |
| Net increase (decrease) | (33,829) | 4,096,231 | $4,257,166 | $97,139,136 |
12. Other.
The Fund's organizational documents provide former and current trustees and officers with a limited indemnification against liabilities arising in connection with the performance of their duties to the Fund. In the normal course of business, the Fund may also enter into contracts that provide general indemnifications. The Fund's maximum exposure under these arrangements is unknown as this would be dependent on future claims that may be made against the Fund. The risk of material loss from such claims is considered remote.
13. Coronavirus (COVID-19) Pandemic.
An outbreak of COVID-19 first detected in China during December 2019 has since spread globally and was declared a pandemic by the World Health Organization during March 2020. Developments that disrupt global economies and financial markets, such as the COVID-19 pandemic, may magnify factors that affect the Fund's performance.
Materials Portfolio
Performance: The Bottom Line
Average annual total return reflects the change in the value of an investment, assuming reinvestment of distributions from dividend income and capital gains (the profits earned upon the sale of securities that have grown in value, if any) and assuming a constant rate of performance each year. The hypothetical investment and the average annual total returns do not reflect the deduction of taxes that a shareholder would pay on fund distributions or the redemption of fund shares. During periods of reimbursement by Fidelity, a fund’s total return will be greater than it would be had the reimbursement not occurred. How a fund did yesterday is no guarantee of how it will do tomorrow.
Average Annual Total Returns
| For the periods ended February 28, 2021 | Past 1 year | Past 5 years | Past 10 years |
| Class A (incl. 5.75% sales charge) | 38.80% | 9.31% | 5.36% |
| Class M (incl. 3.50% sales charge) | 41.72% | 9.51% | 5.29% |
| Class C (incl. contingent deferred sales charge) | 45.18% | 9.79% | 5.19% |
| Materials Portfolio | 47.68% | 10.92% | 6.27% |
| Class I | 47.70% | 10.93% | 6.28% |
| Class Z | 47.92% | 11.01% | 6.32% |
Class C shares' contingent deferred sales charges included in the past one year, past five years and past ten years total return figures are 1%, 0% and 0%, respectively.
The initial offering of Class Z shares took place on October 2, 2018. Returns prior to October 2, 2018, are those of Class I.
$10,000 Over 10 Years
Let's say hypothetically that $10,000 was invested in Materials Portfolio, a class of the fund, on February 28, 2011.
The chart shows how the value of your investment would have changed, and also shows how the S&P 500® Index performed over the same period.
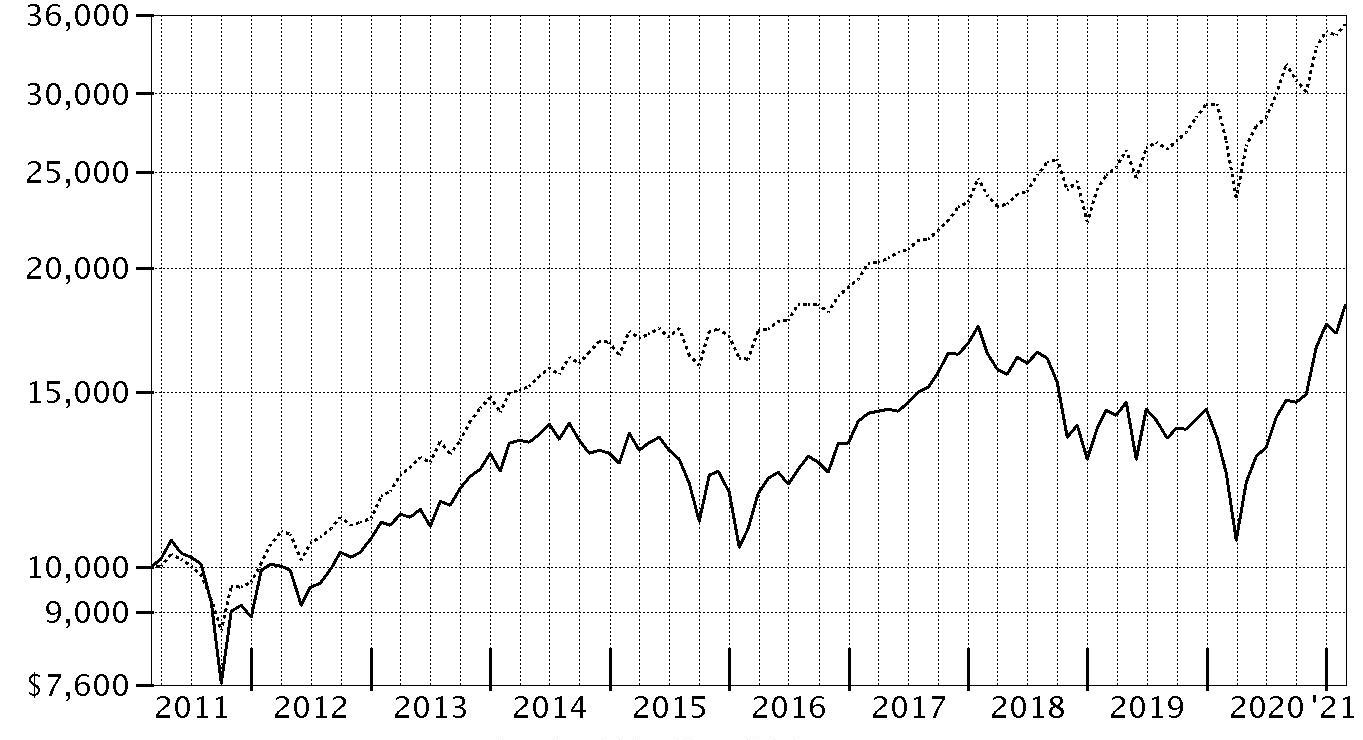
| Period Ending Values |
| $18,370 | Materials Portfolio |
| $35,259 | S&P 500® Index |
Materials Portfolio
Management's Discussion of Fund Performance
Market Recap: The S&P 500
® index gained 31.29% for the 12 months ending February 28, 2021, a volatile but productive period for U.S. risk assets. The early-2020 outbreak and spread of COVID-19 resulted in stocks suffering one of the quickest declines on record, through March 23, followed by a historic rebound that included the index closing 2020 at an all-time high and gaining modest ground in the first two months of the new year. The crisis and containment efforts caused broad contraction in economic activity, along with extreme uncertainty and dislocation in financial markets. A rapid and expansive U.S. monetary/fiscal-policy response partially offset the economic disruption and fueled the market surge, as did resilient corporate earnings. The rally slowed in September, when stocks began a two-month retreat amid Congress’s inability to reach a deal on additional fiscal stimulus, as well as concerns about election uncertainty, indications the U.S. economic recovery could be slowing and a new wave of COVID-19 cases. A shift in momentum began in October and accelerated following the U.S. elections, with the approval of three breakthrough COVID-19 vaccines and prospects for additional government stimulus fueling the “reflation trade” through February 28. By sector for the full 12 months, information technology (+50%) and consumer discretionary (+43%) led all gainers. Materials (+42%) and communication services (+37%) also stood out. In contrast, the defensive utilities (-3%) and real estate sectors (+5%) notably lagged.
Comments from Portfolio Manager Jody Simes: For the fiscal year ending February 28, 2021, the fund's share classes (excluding sales charges, if applicable) gained about 46% to 48%, outperforming the 43.33% advance of the MSCI US IMI Materials 25/50 Linked Index, as well as the broad-based S&P 500
® index. Versus the sector index, industry positioning was the primary contributor, especially the fund’s overweighting within the copper category. Security selection in commodity chemicals and specialty chemicals also boosted the fund's relative result. Our non-index stake in First Quantum Minerals was the largest individual relative contributor, driven by a roughly 198% rise. We decreased our stake in the company the past 12 months. Also helping performance was our overweighting in Tronox Holdings, which gained about 162% and was among the biggest holdings in the portfolio at period end. Adding further value was an out-of-index stake in Lundin Mining (+129%). Conversely, the primary detractor from performance versus the sector index was stock picks within the copper industry. Also hurting the fund's relative performance was security selection and an underweighting in fertilizers & agricultural chemicals, as well as diversified chemicals. The biggest individual relative detractor was an underweight position in Freeport-McMoRan (+240%), which was among the largest holdings as of February 28. The fund's non-index stake in Norilsk Nickel gained roughly 9% and further weighed on the portfolio’s relative return. Also hampering performance was an underweighting in Chemours, which gained approximately 67% and was no longer held at period end. Notable changes in positioning include increased exposure to copper stocks and a lower allocation to gold.
The views expressed above reflect those of the portfolio manager(s) only through the end of the period as stated on the cover of this report and do not necessarily represent the views of Fidelity or any other person in the Fidelity organization. Any such views are subject to change at any time based upon market or other conditions and Fidelity disclaims any responsibility to update such views. These views may not be relied on as investment advice and, because investment decisions for a Fidelity fund are based on numerous factors, may not be relied on as an indication of trading intent on behalf of any Fidelity fund.
Note to shareholders: On May 1, 2020, Richard Malnight came off the fund, leaving Jody Simes as sole manager.
Materials Portfolio
Investment Summary (Unaudited)
Top Ten Stocks as of February 28, 2021
| | % of fund's net assets |
| Linde PLC | 10.5 |
| Freeport-McMoRan, Inc. | 5.7 |
| Martin Marietta Materials, Inc. | 5.0 |
| Sherwin-Williams Co. | 4.9 |
| Air Products & Chemicals, Inc. | 4.8 |
| Ecolab, Inc. | 4.7 |
| International Flavors & Fragrances, Inc. | 4.4 |
| Newmont Corp. | 4.1 |
| Vulcan Materials Co. | 4.0 |
| Tronox Holdings PLC | 3.7 |
| | 51.8 |
Top Industries (% of fund's net assets)
| As of February 28, 2021 |
| | Chemicals | 59.7% |
| | Metals & Mining | 19.1% |
| | Construction Materials | 9.7% |
| | Containers & Packaging | 9.5% |
| | Paper & Forest Products | 0.3% |
| | All Others* | 1.7% |

* Includes Short-Term investments and Net Other Assets (Liabilities).
Materials Portfolio
Schedule of Investments February 28, 2021
Showing Percentage of Net Assets
| Common Stocks - 98.3% | | | |
| | | Shares | Value |
| Chemicals - 59.7% | | | |
| Commodity Chemicals - 9.5% | | | |
| LyondellBasell Industries NV Class A | | 244,700 | $25,226,123 |
| Olin Corp. | | 898,200 | 27,790,308 |
| Tronox Holdings PLC | | 1,864,003 | 34,185,815 |
| | | | 87,202,246 |
| Diversified Chemicals - 0.3% | | | |
| Huntsman Corp. | | 112,700 | 3,076,710 |
| Fertilizers & Agricultural Chemicals - 6.3% | | | |
| CF Industries Holdings, Inc. | | 118,500 | 5,365,680 |
| Corteva, Inc. | | 634,911 | 28,666,232 |
| FMC Corp. | | 133,917 | 13,618,020 |
| The Mosaic Co. | | 202,700 | 5,959,380 |
| The Scotts Miracle-Gro Co. Class A | | 19,400 | 4,135,110 |
| | | | 57,744,422 |
| Industrial Gases - 15.3% | | | |
| Air Products & Chemicals, Inc. | | 173,100 | 44,247,822 |
| Linde PLC | | 393,986 | 96,238,960 |
| | | | 140,486,782 |
| Specialty Chemicals - 28.3% | | | |
| Albemarle Corp. U.S. | | 84,100 | 13,221,361 |
| Ashland Global Holdings, Inc. | | 63,700 | 5,358,444 |
| Balchem Corp. | | 109,400 | 13,057,984 |
| Corbion NV | | 42,200 | 2,398,163 |
| DuPont de Nemours, Inc. | | 310,217 | 21,814,459 |
| Ecolab, Inc. | | 205,110 | 42,941,830 |
| Element Solutions, Inc. | | 874,400 | 15,782,920 |
| Ingevity Corp. (a) | | 34,100 | 2,369,268 |
| Innospec, Inc. | | 80,600 | 8,096,270 |
| International Flavors & Fragrances, Inc. | | 302,215 | 40,953,155 |
| Livent Corp. (a)(b) | | 367,897 | 6,850,242 |
| PPG Industries, Inc. | | 180,900 | 24,388,938 |
| RPM International, Inc. | | 117,100 | 9,325,844 |
| Sherwin-Williams Co. | | 65,700 | 44,698,338 |
| Stepan Co. | | 20,400 | 2,462,076 |
| Wacker Chemie AG | | 53,800 | 6,981,328 |
| | | | 260,700,620 |
|
| TOTAL CHEMICALS | | | 549,210,780 |
|
| Construction Materials - 9.7% | | | |
| Construction Materials - 9.7% | | | |
| Martin Marietta Materials, Inc. | | 134,900 | 45,443,763 |
| Summit Materials, Inc. (a) | | 239,300 | 6,631,003 |
| Vulcan Materials Co. | | 222,300 | 37,121,877 |
| | | | 89,196,643 |
| Containers & Packaging - 9.5% | | | |
| Metal & Glass Containers - 6.7% | | | |
| Aptargroup, Inc. | | 144,700 | 18,821,129 |
| Ball Corp. | | 287,400 | 24,541,086 |
| Crown Holdings, Inc. | | 193,959 | 18,534,722 |
| | | | 61,896,937 |
| Paper Packaging - 2.8% | | | |
| Avery Dennison Corp. | | 98,300 | 17,223,143 |
| Packaging Corp. of America | | 61,700 | 8,145,634 |
| | | | 25,368,777 |
|
| TOTAL CONTAINERS & PACKAGING | | | 87,265,714 |
|
| Metals & Mining - 19.1% | | | |
| Copper - 11.1% | | | |
| First Quantum Minerals Ltd. | | 808,800 | 17,433,116 |
| Freeport-McMoRan, Inc. | | 1,526,300 | 51,756,833 |
| Lundin Mining Corp. | | 2,824,600 | 32,338,851 |
| | | | 101,528,800 |
| Diversified Metals & Mining - 0.5% | | | |
| MMC Norilsk Nickel PJSC sponsored ADR | | 149,400 | 4,686,678 |
| Gold - 4.9% | | | |
| Newmont Corp. | | 698,100 | 37,962,678 |
| Royal Gold, Inc. | | 67,000 | 6,948,570 |
| | | | 44,911,248 |
| Steel - 2.6% | | | |
| Commercial Metals Co. | | 401,600 | 10,100,240 |
| Reliance Steel & Aluminum Co. | | 46,800 | 6,186,960 |
| Steel Dynamics, Inc. | | 186,600 | 7,758,828 |
| | | | 24,046,028 |
|
| TOTAL METALS & MINING | | | 175,172,754 |
|
| Paper & Forest Products - 0.3% | | | |
| Forest Products - 0.3% | | | |
| Louisiana-Pacific Corp. | | 66,000 | 3,142,260 |
| TOTAL COMMON STOCKS | | | |
| (Cost $630,709,853) | | | 903,988,151 |
|
| Money Market Funds - 2.2% | | | |
| Fidelity Cash Central Fund 0.07% (c) | | 13,781,975 | 13,784,731 |
| Fidelity Securities Lending Cash Central Fund 0.08% (c)(d) | | 6,639,766 | 6,640,430 |
| TOTAL MONEY MARKET FUNDS | | | |
| (Cost $20,425,161) | | | 20,425,161 |
| TOTAL INVESTMENT IN SECURITIES - 100.5% | | | |
| (Cost $651,135,014) | | | 924,413,312 |
| NET OTHER ASSETS (LIABILITIES) - (0.5)% | | | (4,855,490) |
| NET ASSETS - 100% | | | $919,557,822 |
Legend
(a) Non-income producing
(b) Security or a portion of the security is on loan at period end.
(c) Affiliated fund that is generally available only to investment companies and other accounts managed by Fidelity Investments. The rate quoted is the annualized seven-day yield of the fund at period end. A complete unaudited listing of the fund's holdings as of its most recent quarter end is available upon request. In addition, each Fidelity Central Fund's financial statements, which are not covered by the Fund's Report of Independent Registered Public Accounting Firm, are available on the SEC's website or upon request.
(d) Investment made with cash collateral received from securities on loan.
Affiliated Central Funds
Information regarding fiscal year to date income earned by the Fund from investments in Fidelity Central Funds is as follows:
| Fund | Income earned |
| Fidelity Cash Central Fund | $12,835 |
| Fidelity Securities Lending Cash Central Fund | 65,472 |
| Total | $78,307 |
Amounts in the income column in the above table include any capital gain distributions from underlying funds, which are presented in the corresponding line-item in the Statement of Operations, if applicable. Amount for Fidelity Securities Lending Cash Central Fund represents the income earned on investing cash collateral, less rebates paid to borrowers and any lending agent fees associated with the loan, plus any premium payments received for lending certain types of securities.
Investment Valuation
The following is a summary of the inputs used, as of February 28, 2021, involving the Fund's assets and liabilities carried at fair value. The inputs or methodology used for valuing securities may not be an indication of the risk associated with investing in those securities. For more information on valuation inputs, and their aggregation into the levels used below, please refer to the Investment Valuation section in the accompanying Notes to Financial Statements.
| | Valuation Inputs at Reporting Date: |
| Description | Total | Level 1 | Level 2 | Level 3 |
| Investments in Securities: | | | | |
| Common Stocks | $903,988,151 | $903,988,151 | $-- | $-- |
| Money Market Funds | 20,425,161 | 20,425,161 | -- | -- |
| Total Investments in Securities: | $924,413,312 | $924,413,312 | $-- | $-- |
Other Information
Distribution of investments by country or territory of incorporation, as a percentage of Total Net Assets, is as follows (Unaudited):
| United States of America | 76.0% |
| Ireland | 10.5% |
| Canada | 5.4% |
| United Kingdom | 3.7% |
| Netherlands | 3.1% |
| Others (Individually Less Than 1%) | 1.3% |
| | 100.0% |
See accompanying notes which are an integral part of the financial statements.
Materials Portfolio
Financial Statements
Statement of Assets and Liabilities
| | | February 28, 2021 |
| Assets | | |
Investment in securities, at value (including securities loaned of $6,407,142) — See accompanying schedule:
Unaffiliated issuers (cost $630,709,853) | $903,988,151 | |
| Fidelity Central Funds (cost $20,425,161) | 20,425,161 | |
| Total Investment in Securities (cost $651,135,014) | | $924,413,312 |
| Foreign currency held at value (cost $20,214) | | 20,235 |
| Receivable for fund shares sold | | 2,495,960 |
| Dividends receivable | | 959,293 |
| Distributions receivable from Fidelity Central Funds | | 5,710 |
| Prepaid expenses | | 9,957 |
| Other receivables | | 181,082 |
| Total assets | | 928,085,549 |
| Liabilities | | |
| Payable for fund shares redeemed | $1,071,360 | |
| Accrued management fee | 400,345 | |
| Distribution and service plan fees payable | 51,586 | |
| Other affiliated payables | 160,875 | |
| Other payables and accrued expenses | 219,636 | |
| Collateral on securities loaned | 6,623,925 | |
| Total liabilities | | 8,527,727 |
| Net Assets | | $919,557,822 |
| Net Assets consist of: | | |
| Paid in capital | | $721,207,989 |
| Total accumulated earnings (loss) | | 198,349,833 |
| Net Assets | | $919,557,822 |
| Net Asset Value and Maximum Offering Price | | |
| Class A: | | |
| Net Asset Value and redemption price per share ($101,237,898 ÷ 1,163,266 shares)(a) | | $87.03 |
| Maximum offering price per share (100/94.25 of $87.03) | | $92.34 |
| Class M: | | |
| Net Asset Value and redemption price per share ($24,768,041 ÷ 287,549 shares)(a) | | $86.14 |
| Maximum offering price per share (100/96.50 of $86.14) | | $89.26 |
| Class C: | | |
| Net Asset Value and offering price per share ($23,295,947 ÷ 278,118 shares)(a) | | $83.76 |
| Materials: | | |
| Net Asset Value, offering price and redemption price per share ($533,073,142 ÷ 6,095,299 shares) | | $87.46 |
| Class I: | | |
| Net Asset Value, offering price and redemption price per share ($190,132,246 ÷ 2,178,116 shares) | | $87.29 |
| Class Z: | | |
| Net Asset Value, offering price and redemption price per share ($47,050,548 ÷ 539,925 shares) | | $87.14 |
(a) Redemption price per share is equal to net asset value less any applicable contingent deferred sales charge.
See accompanying notes which are an integral part of the financial statements.
Statement of Operations
| | | Year ended February 28, 2021 |
| Investment Income | | |
| Dividends | | $11,184,441 |
| Income from Fidelity Central Funds (including $65,472 from security lending) | | 78,307 |
| Total income | | 11,262,748 |
| Expenses | | |
| Management fee | $3,837,692 | |
| Transfer agent fees | 1,489,139 | |
| Distribution and service plan fees | 533,691 | |
| Accounting fees | 256,220 | |
| Custodian fees and expenses | 10,000 | |
| Independent trustees' fees and expenses | 3,948 | |
| Registration fees | 85,016 | |
| Audit | 44,717 | |
| Legal | 3,861 | |
| Miscellaneous | 35,658 | |
| Total expenses before reductions | 6,299,942 | |
| Expense reductions | (38,136) | |
| Total expenses after reductions | | 6,261,806 |
| Net investment income (loss) | | 5,000,942 |
| Realized and Unrealized Gain (Loss) | | |
| Net realized gain (loss) on: | | |
| Investment securities: | | |
| Unaffiliated issuers | 30,752,003 | |
| Fidelity Central Funds | 9,250 | |
| Foreign currency transactions | (25,665) | |
| Total net realized gain (loss) | | 30,735,588 |
| Change in net unrealized appreciation (depreciation) on: | | |
| Investment securities: | | |
| Unaffiliated issuers | 247,943,298 | |
| Assets and liabilities in foreign currencies | 24,652 | |
| Total change in net unrealized appreciation (depreciation) | | 247,967,950 |
| Net gain (loss) | | 278,703,538 |
| Net increase (decrease) in net assets resulting from operations | | $283,704,480 |
See accompanying notes which are an integral part of the financial statements.
Statement of Changes in Net Assets
| | Year ended February 28, 2021 | Year ended February 29, 2020 |
| Increase (Decrease) in Net Assets | | |
| Operations | | |
| Net investment income (loss) | $5,000,942 | $9,745,085 |
| Net realized gain (loss) | 30,735,588 | (91,670,706) |
| Change in net unrealized appreciation (depreciation) | 247,967,950 | (34,457,826) |
| Net increase (decrease) in net assets resulting from operations | 283,704,480 | (116,383,447) |
| Distributions to shareholders | (5,297,912) | (9,657,928) |
| Share transactions - net increase (decrease) | (36,201,462) | (292,920,936) |
| Total increase (decrease) in net assets | 242,205,106 | (418,962,311) |
| Net Assets | | |
| Beginning of period | 677,352,716 | 1,096,315,027 |
| End of period | $919,557,822 | $677,352,716 |
See accompanying notes which are an integral part of the financial statements.
Financial Highlights
Materials Portfolio Class A
| Years ended February 28, | 2021 | 2020 A | 2019 | 2018 | 2017 |
| Selected Per–Share Data | | | | | |
| Net asset value, beginning of period | $59.39 | $69.57 | $88.50 | $81.27 | $62.94 |
| Income from Investment Operations | | | | | |
| Net investment income (loss)B | .33 | .58 | .84 | .55 | .70 |
| Net realized and unrealized gain (loss) | 27.72 | (10.10) | (12.01) | 11.18 | 18.26 |
| Total from investment operations | 28.05 | (9.52) | (11.17) | 11.73 | 18.96 |
| Distributions from net investment income | (.41) | (.66) | (.67) | (.50) | (.63) |
| Distributions from net realized gain | – | – | (7.09) | (4.00) | – |
| Total distributions | (.41) | (.66) | (7.76) | (4.50) | (.63) |
| Redemption fees added to paid in capitalB | – | – | – | – | –C |
| Net asset value, end of period | $87.03 | $59.39 | $69.57 | $88.50 | $81.27 |
| Total ReturnD,E | 47.27% | (13.81)% | (12.59)% | 14.65% | 30.18% |
| Ratios to Average Net AssetsF,G | | | | | |
| Expenses before reductions | 1.08% | 1.08% | 1.06% | 1.07% | 1.08% |
| Expenses net of fee waivers, if any | 1.08% | 1.08% | 1.06% | 1.07% | 1.08% |
| Expenses net of all reductions | 1.08% | 1.07% | 1.05% | 1.06% | 1.07% |
| Net investment income (loss) | .48% | .87% | 1.08% | .64% | .96% |
| Supplemental Data | | | | | |
| Net assets, end of period (000 omitted) | $101,238 | $76,869 | $126,182 | $201,933 | $229,086 |
| Portfolio turnover rateH | 36% | 69% | 77%I | 67% | 49%I |
A For the year ended February 29.
B Calculated based on average shares outstanding during the period.
C Amount represents less than $.005 per share.
D Total returns would have been lower if certain expenses had not been reduced during the applicable periods shown.
E Total returns do not include the effect of the sales charges.
F Fees and expenses of any underlying mutual funds or exchange-traded funds (ETFs) are not included in the Fund's expense ratio. The Fund indirectly bears its proportionate share of these expenses. For additional expense information related to investments in Fidelity Central Funds, please refer to the "Investments in Fidelity Central Funds" note found in the Notes to Financial Statements section of the most recent Annual or Semi-Annual report.
G Expense ratios reflect operating expenses of the class. Expenses before reductions do not reflect amounts reimbursed, waived, or reduced through arrangements with the investment adviser, brokerage services, or other offset arrangements, if applicable, and do not represent the amount paid by the class during periods when reimbursements, waivers or reductions occur.
H Amount does not include the portfolio activity of any underlying mutual funds or exchange-traded funds (ETFs).
I Portfolio turnover rate excludes securities received or delivered in-kind.
See accompanying notes which are an integral part of the financial statements.
Materials Portfolio Class M
| Years ended February 28, | 2021 | 2020 A | 2019 | 2018 | 2017 |
| Selected Per–Share Data | | | | | |
| Net asset value, beginning of period | $58.84 | $68.98 | $87.79 | $80.66 | $62.52 |
| Income from Investment Operations | | | | | |
| Net investment income (loss)B | .14 | .39 | .61 | .30 | .47 |
| Net realized and unrealized gain (loss) | 27.42 | (10.01) | (11.88) | 11.08 | 18.12 |
| Total from investment operations | 27.56 | (9.62) | (11.27) | 11.38 | 18.59 |
| Distributions from net investment income | (.26) | (.52) | (.45) | (.25) | (.45) |
| Distributions from net realized gain | – | – | (7.09) | (4.00) | – |
| Total distributions | (.26) | (.52) | (7.54) | (4.25) | (.45) |
| Redemption fees added to paid in capitalB | – | – | – | – | –C |
| Net asset value, end of period | $86.14 | $58.84 | $68.98 | $87.79 | $80.66 |
| Total ReturnD,E | 46.86% | (14.05)% | (12.84)% | 14.30% | 29.78% |
| Ratios to Average Net AssetsF,G | | | | | |
| Expenses before reductions | 1.36% | 1.37% | 1.35% | 1.36% | 1.39% |
| Expenses net of fee waivers, if any | 1.36% | 1.36% | 1.35% | 1.36% | 1.39% |
| Expenses net of all reductions | 1.36% | 1.36% | 1.34% | 1.35% | 1.38% |
| Net investment income (loss) | .21% | .58% | .79% | .35% | .65% |
| Supplemental Data | | | | | |
| Net assets, end of period (000 omitted) | $24,768 | $19,423 | $27,436 | $40,107 | $40,935 |
| Portfolio turnover rateH | 36% | 69% | 77%I | 67% | 49%I |
A For the year ended February 29.
B Calculated based on average shares outstanding during the period.
C Amount represents less than $.005 per share.
D Total returns would have been lower if certain expenses had not been reduced during the applicable periods shown.
E Total returns do not include the effect of the sales charges.
F Fees and expenses of any underlying mutual funds or exchange-traded funds (ETFs) are not included in the Fund's expense ratio. The Fund indirectly bears its proportionate share of these expenses. For additional expense information related to investments in Fidelity Central Funds, please refer to the "Investments in Fidelity Central Funds" note found in the Notes to Financial Statements section of the most recent Annual or Semi-Annual report.
G Expense ratios reflect operating expenses of the class. Expenses before reductions do not reflect amounts reimbursed, waived, or reduced through arrangements with the investment adviser, brokerage services, or other offset arrangements, if applicable, and do not represent the amount paid by the class during periods when reimbursements, waivers or reductions occur.
H Amount does not include the portfolio activity of any underlying mutual funds or exchange-traded funds (ETFs).
I Portfolio turnover rate excludes securities received or delivered in-kind.
See accompanying notes which are an integral part of the financial statements.
Materials Portfolio Class C
| Years ended February 28, | 2021 | 2020 A | 2019 | 2018 | 2017 |
| Selected Per–Share Data | | | | | |
| Net asset value, beginning of period | $57.30 | $67.13 | $85.52 | $78.72 | $61.09 |
| Income from Investment Operations | | | | | |
| Net investment income (loss)B | (.18) | .08 | .25 | (.09) | .15 |
| Net realized and unrealized gain (loss) | 26.64 | (9.76) | (11.50) | 10.80 | 17.68 |
| Total from investment operations | 26.46 | (9.68) | (11.25) | 10.71 | 17.83 |
| Distributions from net investment income | – | (.15) | (.04) | (.02) | (.20) |
| Distributions from net realized gain | – | – | (7.09) | (3.89) | – |
| Total distributions | – | (.15) | (7.14)C | (3.91) | (.20) |
| Redemption fees added to paid in capitalB | – | – | – | – | –D |
| Net asset value, end of period | $83.76 | $57.30 | $67.13 | $85.52 | $78.72 |
| Total ReturnE,F | 46.18% | (14.46)% | (13.24)% | 13.78% | 29.21% |
| Ratios to Average Net AssetsG,H | | | | | |
| Expenses before reductions | 1.83% | 1.82% | 1.81% | 1.82% | 1.83% |
| Expenses net of fee waivers, if any | 1.83% | 1.82% | 1.81% | 1.82% | 1.82% |
| Expenses net of all reductions | 1.83% | 1.81% | 1.79% | 1.82% | 1.82% |
| Net investment income (loss) | (.27)% | .12% | .33% | (.11)% | .21% |
| Supplemental Data | | | | | |
| Net assets, end of period (000 omitted) | $23,296 | $24,239 | $51,659 | $85,792 | $80,225 |
| Portfolio turnover rateI | 36% | 69% | 77%J | 67% | 49%J |
A For the year ended February 29.
B Calculated based on average shares outstanding during the period.
C Total distributions per share do not sum due to rounding.
D Amount represents less than $.005 per share.
E Total returns would have been lower if certain expenses had not been reduced during the applicable periods shown.
F Total returns do not include the effect of the contingent deferred sales charge.
G Fees and expenses of any underlying mutual funds or exchange-traded funds (ETFs) are not included in the Fund's expense ratio. The Fund indirectly bears its proportionate share of these expenses. For additional expense information related to investments in Fidelity Central Funds, please refer to the "Investments in Fidelity Central Funds" note found in the Notes to Financial Statements section of the most recent Annual or Semi-Annual report.
H Expense ratios reflect operating expenses of the class. Expenses before reductions do not reflect amounts reimbursed, waived, or reduced through arrangements with the investment adviser, brokerage services, or other offset arrangements, if applicable, and do not represent the amount paid by the class during periods when reimbursements, waivers or reductions occur.
I Amount does not include the portfolio activity of any underlying mutual funds or exchange-traded funds (ETFs).
J Portfolio turnover rate excludes securities received or delivered in-kind.
See accompanying notes which are an integral part of the financial statements.
Materials Portfolio
| Years ended February 28, | 2021 | 2020 A | 2019 | 2018 | 2017 |
| Selected Per–Share Data | | | | | |
| Net asset value, beginning of period | $59.63 | $69.84 | $88.90 | $81.64 | $63.20 |
| Income from Investment Operations | | | | | |
| Net investment income (loss)B | .53 | .77 | 1.06 | .79 | .90 |
| Net realized and unrealized gain (loss) | 27.87 | (10.14) | (12.09) | 11.24 | 18.34 |
| Total from investment operations | 28.40 | (9.37) | (11.03) | 12.03 | 19.24 |
| Distributions from net investment income | (.57) | (.84) | (.93) | (.77) | (.80) |
| Distributions from net realized gain | – | – | (7.09) | (4.00) | – |
| Total distributions | (.57) | (.84) | (8.03)C | (4.77) | (.80) |
| Redemption fees added to paid in capitalB | – | – | – | – | –D |
| Net asset value, end of period | $87.46 | $59.63 | $69.84 | $88.90 | $81.64 |
| Total ReturnE | 47.68% | (13.57)% | (12.35)% | 14.96% | 30.52% |
| Ratios to Average Net AssetsF,G | | | | | |
| Expenses before reductions | .80% | .80% | .79% | .79% | .81% |
| Expenses net of fee waivers, if any | .80% | .80% | .79% | .79% | .81% |
| Expenses net of all reductions | .80% | .79% | .78% | .79% | .81% |
| Net investment income (loss) | .76% | 1.14% | 1.35% | .91% | 1.22% |
| Supplemental Data | | | | | |
| Net assets, end of period (000 omitted) | $533,073 | $405,668 | $626,759 | $1,043,704 | $882,504 |
| Portfolio turnover rateH | 36% | 69% | 77%I | 67% | 49%I |
A For the year ended February 29.
B Calculated based on average shares outstanding during the period.
C Total distributions per share do not sum due to rounding.
D Amount represents less than $.005 per share.
E Total returns would have been lower if certain expenses had not been reduced during the applicable periods shown.
F Fees and expenses of any underlying mutual funds or exchange-traded funds (ETFs) are not included in the Fund's expense ratio. The Fund indirectly bears its proportionate share of these expenses. For additional expense information related to investments in Fidelity Central Funds, please refer to the "Investments in Fidelity Central Funds" note found in the Notes to Financial Statements section of the most recent Annual or Semi-Annual report.
G Expense ratios reflect operating expenses of the class. Expenses before reductions do not reflect amounts reimbursed, waived, or reduced through arrangements with the investment adviser, brokerage services, or other offset arrangements, if applicable, and do not represent the amount paid by the class during periods when reimbursements, waivers or reductions occur.
H Amount does not include the portfolio activity of any underlying mutual funds or exchange-traded funds (ETFs).
I Portfolio turnover rate excludes securities received or delivered in-kind.
See accompanying notes which are an integral part of the financial statements.
Materials Portfolio Class I
| Years ended February 28, | 2021 | 2020 A | 2019 | 2018 | 2017 |
| Selected Per–Share Data | | | | | |
| Net asset value, beginning of period | $59.52 | $69.70 | $88.73 | $81.49 | $63.07 |
| Income from Investment Operations | | | | | |
| Net investment income (loss)B | .55 | .78 | 1.07 | .80 | .91 |
| Net realized and unrealized gain (loss) | 27.80 | (10.12) | (12.08) | 11.22 | 18.31 |
| Total from investment operations | 28.35 | (9.34) | (11.01) | 12.02 | 19.22 |
| Distributions from net investment income | (.58) | (.84) | (.93) | (.78) | (.80) |
| Distributions from net realized gain | – | – | (7.09) | (4.00) | – |
| Total distributions | (.58) | (.84) | (8.02) | (4.78) | (.80) |
| Redemption fees added to paid in capitalB | – | – | – | – | –C |
| Net asset value, end of period | $87.29 | $59.52 | $69.70 | $88.73 | $81.49 |
| Total ReturnD | 47.70% | (13.55)% | (12.34)% | 14.97% | 30.55% |
| Ratios to Average Net AssetsE,F | | | | | |
| Expenses before reductions | .78% | .79% | .78% | .79% | .79% |
| Expenses net of fee waivers, if any | .78% | .79% | .78% | .79% | .79% |
| Expenses net of all reductions | .78% | .78% | .77% | .78% | .78% |
| Net investment income (loss) | .78% | 1.16% | 1.36% | .92% | 1.25% |
| Supplemental Data | | | | | |
| Net assets, end of period (000 omitted) | $190,132 | $137,887 | $254,240 | $511,062 | $335,124 |
| Portfolio turnover rateG | 36% | 69% | 77%H | 67% | 49%H |
A For the year ended February 29.
B Calculated based on average shares outstanding during the period.
C Amount represents less than $.005 per share.
D Total returns would have been lower if certain expenses had not been reduced during the applicable periods shown.
E Fees and expenses of any underlying mutual funds or exchange-traded funds (ETFs) are not included in the Fund's expense ratio. The Fund indirectly bears its proportionate share of these expenses. For additional expense information related to investments in Fidelity Central Funds, please refer to the "Investments in Fidelity Central Funds" note found in the Notes to Financial Statements section of the most recent Annual or Semi-Annual report.
F Expense ratios reflect operating expenses of the class. Expenses before reductions do not reflect amounts reimbursed, waived, or reduced through arrangements with the investment adviser, brokerage services, or other offset arrangements, if applicable, and do not represent the amount paid by the class during periods when reimbursements, waivers or reductions occur.
G Amount does not include the portfolio activity of any underlying mutual funds or exchange-traded funds (ETFs).
H Portfolio turnover rate excludes securities received or delivered in-kind.
See accompanying notes which are an integral part of the financial statements.
Materials Portfolio Class Z
| Years ended February 28, | 2021 | 2020 A | 2019 B |
| Selected Per–Share Data | | | |
| Net asset value, beginning of period | $59.40 | $69.58 | $79.81 |
| Income from Investment Operations | | | |
| Net investment income (loss)C | .67 | .88 | .62 |
| Net realized and unrealized gain (loss) | 27.75 | (10.10) | (6.96) |
| Total from investment operations | 28.42 | (9.22) | (6.34) |
| Distributions from net investment income | (.68) | (.96) | (.96) |
| Distributions from net realized gain | – | – | (2.93) |
| Total distributions | (.68) | (.96) | (3.89) |
| Redemption fees added to paid in capitalC | – | – | – |
| Net asset value, end of period | $87.14 | $59.40 | $69.58 |
| Total ReturnD,E | 47.92% | (13.43)% | (7.35)% |
| Ratios to Average Net AssetsF,G | | | |
| Expenses before reductions | .64% | .63% | .63%H |
| Expenses net of fee waivers, if any | .64% | .63% | .62%H |
| Expenses net of all reductions | .63% | .62% | .61%H |
| Net investment income (loss) | .93% | 1.31% | 2.27%H |
| Supplemental Data | | | |
| Net assets, end of period (000 omitted) | $47,051 | $13,267 | $10,039 |
| Portfolio turnover rateI | 36% | 69% | 77%J |
A For the year ended February 29.
B For the period October 2, 2018 (commencement of sale of shares) to February 28, 2019.
C Calculated based on average shares outstanding during the period.
D Total returns for periods of less than one year are not annualized.
E Total returns would have been lower if certain expenses had not been reduced during the applicable periods shown.
F Fees and expenses of any underlying mutual funds or exchange-traded funds (ETFs) are not included in the Fund's expense ratio. The Fund indirectly bears its proportionate share of these expenses. For additional expense information related to investments in Fidelity Central Funds, please refer to the "Investments in Fidelity Central Funds" note found in the Notes to Financial Statements section of the most recent Annual or Semi-Annual report.
G Expense ratios reflect operating expenses of the class. Expenses before reductions do not reflect amounts reimbursed, waived, or reduced through arrangements with the investment adviser, brokerage services, or other offset arrangements, if applicable, and do not represent the amount paid by the class during periods when reimbursements, waivers or reductions occur.
H Annualized
I Amount does not include the portfolio activity of any underlying mutual funds or exchange-traded funds (ETFs).
J Portfolio turnover rate excludes securities received or delivered in-kind.
See accompanying notes which are an integral part of the financial statements.
Notes to Financial Statements
For the period ended February 28, 2021
1. Organization.
Materials Portfolio (the Fund) is a non-diversified fund of Fidelity Select Portfolios (the Trust) and is authorized to issue an unlimited number of shares. The Trust is registered under the Investment Company Act of 1940, as amended (the 1940 Act), as an open-end management investment company organized as a Massachusetts business trust. The Fund invests primarily in securities of companies whose principal business activities fall within specific industries. The Fund offers Class A, Class M, Class C, Materials, Class I and Class Z shares, each of which has equal rights as to assets and voting privileges. Each class has exclusive voting rights with respect to matters that affect that class. Class C shares will automatically convert to Class A shares after a holding period of ten years from the initial date of purchase, with certain exceptions.
2. Investments in Fidelity Central Funds.
The Fund invests in Fidelity Central Funds, which are open-end investment companies generally available only to other investment companies and accounts managed by the investment adviser and its affiliates. The Fund's Schedule of Investments lists each of the Fidelity Central Funds held as of period end, if any, as an investment of the Fund, but does not include the underlying holdings of each Fidelity Central Fund. As an Investing Fund, the Fund indirectly bears its proportionate share of the expenses of the underlying Fidelity Central Funds.
The Money Market Central Funds seek preservation of capital and current income and are managed by the investment adviser. Annualized expenses of the Money Market Central Funds as of their most recent shareholder report date ranged from less than .005% to .01%.
A complete unaudited list of holdings for each Fidelity Central Fund is available upon request or at the Securities and Exchange Commission (the SEC) website at www.sec.gov. In addition, the financial statements of the Fidelity Central Funds, which are not covered by the Fund's Report of Independent Registered Public Accounting Firm, are available on the SEC website or upon request.
3. Significant Accounting Policies.
The Fund is an investment company and applies the accounting and reporting guidance of the Financial Accounting Standards Board (FASB) Accounting Standards Codification Topic 946 Financial Services - Investment Companies. The financial statements have been prepared in conformity with accounting principles generally accepted in the United States of America (GAAP), which require management to make certain estimates and assumptions at the date of the financial statements. Actual results could differ from those estimates. Subsequent events, if any, through the date that the financial statements were issued have been evaluated in the preparation of the financial statements. The following summarizes the significant accounting policies of the Fund:
Investment Valuation. Investments are valued as of 4:00 p.m. Eastern time on the last calendar day of the period. The Board of Trustees (the Board) has delegated the day to day responsibility for the valuation of the Fund's investments to the Fair Value Committee (the Committee) established by the Fund's investment adviser. In accordance with valuation policies and procedures approved by the Board, the Fund attempts to obtain prices from one or more third party pricing vendors or brokers to value its investments. When current market prices, quotations or currency exchange rates are not readily available or reliable, investments will be fair valued in good faith by the Committee, in accordance with procedures adopted by the Board. Factors used in determining fair value vary by investment type and may include market or investment specific events. The frequency with which these procedures are used cannot be predicted and they may be utilized to a significant extent. The Committee oversees the Fund's valuation policies and procedures and reports to the Board on the Committee's activities and fair value determinations. The Board monitors the appropriateness of the procedures used in valuing the Fund's investments and ratifies the fair value determinations of the Committee.
The Fund categorizes the inputs to valuation techniques used to value its investments into a disclosure hierarchy consisting of three levels as shown below:
- Level 1 – quoted prices in active markets for identical investments
- Level 2 – other significant observable inputs (including quoted prices for similar investments, interest rates, prepayment speeds, etc.)
- Level 3 – unobservable inputs (including the Fund's own assumptions based on the best information available)
Valuation techniques used to value the Fund's investments by major category are as follows:
Equity securities, including restricted securities, for which market quotations are readily available, are valued at the last reported sale price or official closing price as reported by a third party pricing vendor on the primary market or exchange on which they are traded and are categorized as Level 1 in the hierarchy. In the event there were no sales during the day or closing prices are not available, securities are valued at the last quoted bid price or may be valued using the last available price and are generally categorized as Level 2 in the hierarchy. For foreign equity securities, when market or security specific events arise, comparisons to the valuation of American Depositary Receipts (ADRs), futures contracts, Exchange-Traded Funds (ETFs) and certain indexes as well as quoted prices for similar securities may be used and would be categorized as Level 2 in the hierarchy. For equity securities, including restricted securities, where observable inputs are limited, assumptions about market activity and risk are used and these securities may be categorized as Level 3 in the hierarchy.
Investments in open-end mutual funds, including the Fidelity Central Funds, are valued at their closing net asset value (NAV) each business day and are categorized as Level 1 in the hierarchy.
Changes in valuation techniques may result in transfers in or out of an assigned level within the disclosure hierarchy. The aggregate value of investments by input level as of February 28, 2021 is included at the end of the Fund's Schedule of Investments.
Foreign Currency. Certain Funds may use foreign currency contracts to facilitate transactions in foreign-denominated securities. Gains and losses from these transactions may arise from changes in the value of the foreign currency or if the counterparties do not perform under the contracts' terms.
Foreign-denominated assets, including investment securities, and liabilities are translated into U.S. dollars at the exchange rates at period end. Purchases and sales of investment securities, income and dividends received, and expenses denominated in foreign currencies are translated into U.S. dollars at the exchange rate in effect on the transaction date.
The effects of exchange rate fluctuations on investments are included with the net realized and unrealized gain (loss) on investment securities. Other foreign currency transactions resulting in realized and unrealized gain (loss) are disclosed separately.
Investment Transactions and Income. For financial reporting purposes, the Fund's investment holdings and NAV include trades executed through the end of the last business day of the period. The NAV per share for processing shareholder transactions is calculated as of the close of business of the New York Stock Exchange (NYSE), normally 4:00 p.m. Eastern time and includes trades executed through the end of the prior business day. Gains and losses on securities sold are determined on the basis of identified cost and include proceeds received from litigation. Dividend income is recorded on the ex-dividend date, except for certain dividends from foreign securities where the ex-dividend date may have passed, which are recorded as soon as the Fund is informed of the ex-dividend date. Non-cash dividends included in dividend income, if any, are recorded at the fair market value of the securities received. Income and capital gain distributions from Fidelity Central Funds, if any, are recorded on the ex-dividend date. Certain distributions received by the Fund represent a return of capital or capital gain. The Fund determines the components of these distributions subsequent to the ex-dividend date, based upon receipt of tax filings or other correspondence relating to the underlying investment. These distributions are recorded as a reduction of cost of investments and/or as a realized gain. Investment income is recorded net of foreign taxes withheld where recovery of such taxes is uncertain.
Class Allocations and Expenses. Investment income, realized and unrealized capital gains and losses, common expenses of the Fund, and certain fund-level expense reductions, if any, are allocated daily on a pro-rata basis to each class based on the relative net assets of each class to the total net assets of the Fund. Each class differs with respect to transfer agent and distribution and service plan fees incurred. Certain expense reductions may also differ by class. For the reporting period, the allocated portion of income and expenses to each class as a percent of its average net assets may vary due to the timing of recording these transactions in relation to fluctuating net assets of the classes. Expenses directly attributable to a fund are charged to that fund. Expenses attributable to more than one fund are allocated among the respective funds on the basis of relative net assets or other appropriate methods. Expense estimates are accrued in the period to which they relate and adjustments are made when actual amounts are known.
Deferred Trustee Compensation. Under a Deferred Compensation Plan (the Plan) for certain Funds, certain independent Trustees have elected to defer receipt of a portion of their annual compensation. Deferred amounts are invested in affiliated mutual funds, are marked-to-market and remain in a fund until distributed in accordance with the Plan. The investment of deferred amounts and the offsetting payable to the Trustees presented below are included in the accompanying Statement of Assets and Liabilities in other receivables and other payables and accrued expenses, as applicable.
| Materials Portfolio | $180,215 |
Income Tax Information and Distributions to Shareholders. Each year, the Fund intends to qualify as a regulated investment company under Subchapter M of the Internal Revenue Code, including distributing substantially all of its taxable income and realized gains. As a result, no provision for U.S. Federal income taxes is required. As of February 28, 2021, the Fund did not have any unrecognized tax benefits in the financial statements; nor is the Fund aware of any tax positions for which it is reasonably possible that the total amounts of unrecognized tax benefits will significantly change in the next twelve months. The Fund files a U.S. federal tax return, in addition to state and local tax returns as required. The Fund's federal income tax returns are subject to examination by the Internal Revenue Service (IRS) for a period of three fiscal years after they are filed. State and local tax returns may be subject to examination for an additional fiscal year depending on the jurisdiction. Foreign taxes are provided for based on the Fund's understanding of the tax rules and rates that exist in the foreign markets in which it invests.
Distributions are declared and recorded on the ex-dividend date. Income and capital gain distributions are declared separately for each class. Income and capital gain distributions are determined in accordance with income tax regulations, which may differ from GAAP.
Capital accounts within the financial statements are adjusted for permanent book-tax differences. These adjustments have no impact on net assets or the results of operations. Capital accounts are not adjusted for temporary book-tax differences which will reverse in a subsequent period.
Book-tax differences are primarily due to foreign currency transactions, deferred Trustees compensation, capital loss carryforwards and losses deferred due to wash sales and excise tax regulations.
As of period end, the cost and unrealized appreciation (depreciation) in securities, and derivatives if applicable, for federal income tax purposes were as follows:
| Gross unrealized appreciation | $276,041,537 |
| Gross unrealized depreciation | (4,448,680) |
| Net unrealized appreciation (depreciation) | $271,592,857 |
| Tax Cost | $652,820,455 |
The tax-based components of distributable earnings as of period end were as follows:
| Capital loss carryforward | $(72,780,080) |
| Net unrealized appreciation (depreciation) on securities and other investments | $271,597,840 |
Capital loss carryforwards are only available to offset future capital gains of the Fund to the extent provided by regulations and may be limited. The capital loss carryforward information presented below, including any applicable limitation, is estimated as of fiscal period end and is subject to adjustment.
| No expiration | |
| Short-term | $(54,734,346) |
| Long-term | (18,045,734) |
| Total capital loss carryforward | $(72,780,080) |
The Fund intends to elect to defer to its next fiscal year $287,716 of ordinary losses recognized during the period January 1, 2021 to February 28, 2021.
The tax character of distributions paid was as follows:
| | February 28, 2021 | February 29, 2020 |
| Ordinary Income | $5,297,912 | $ 9,657,928 |
4. Purchases and Sales of Investments.
Purchases and sales of securities, other than short-term securities are noted in the table below.
| | Purchases ($) | Sales ($) |
| Materials Portfolio | 255,178,656 | 306,267,617 |
5. Fees and Other Transactions with Affiliates.
Management Fee. Fidelity Management & Research Company LLC (the investment adviser) and its affiliates provide the Fund with investment management related services for which the Fund pays a monthly management fee. The management fee is the sum of an individual fund fee rate that is based on an annual rate of .30% of the Fund's average net assets and an annualized group fee rate that averaged .23% during the period. The group fee rate is based upon the monthly average net assets of a group of registered investment companies with which the investment adviser has management contracts. The group fee rate decreases as assets under management increase and increases as assets under management decrease. For the reporting period, the total annual management fee rate was .53% of the Fund's average net assets.
Distribution and Service Plan Fees. In accordance with Rule 12b-1 of the 1940 Act, the Fund has adopted separate Distribution and Service Plans for each class of shares. Certain classes pay Fidelity Distributors Company LLC (FDC), an affiliate of the investment adviser, separate Distribution and Service Fees, each of which is based on an annual percentage of each class' average net assets. In addition, FDC may pay financial intermediaries for selling shares of the Fund and providing shareholder support services. For the period, the Distribution and Service Fee rates, total fees and amounts retained by FDC were as follows:
| | Distribution Fee | Service Fee | Total Fees | Retained by FDC |
| Class A | -% | .25% | $206,442 | $2,817 |
| Class M | .25% | .25% | 104,222 | 758 |
| Class C | .75% | .25% | 223,027 | 10,264 |
| | | | $533,691 | $13,839 |
Sales Load. FDC may receive a front-end sales charge of up to 5.75% for selling Class A shares and 3.50% for selling Class M shares, some of which is paid to financial intermediaries for selling shares of the Fund. Depending on the holding period, FDC may receive contingent deferred sales charges levied on Class A, Class M and Class C redemptions. The deferred sales charges are 1.00% for Class C shares, 1.00% for certain purchases of Class A shares and .25% for certain purchases of Class M shares.
For the period, sales charge amounts retained by FDC were as follows:
| | Retained by FDC |
| Class A | $17,861 |
| Class M | 2,336 |
| Class C(a) | 608 |
| | $20,805 |
(a) When Class C shares are initially sold, FDC pays commissions from its own resources to financial intermediaries through which the sales are made.
Transfer Agent Fees. Fidelity Investments Institutional Operations Company LLC (FIIOC), an affiliate of the investment adviser, is the transfer, dividend disbursing and shareholder servicing agent for each class of the Fund. FIIOC receives account fees and asset-based fees that vary according to the account size and type of account of the shareholders of the respective classes of the Fund, except for Class Z. FIIOC receives an asset-based fee of Class Z's average net assets. FIIOC pays for typesetting, printing and mailing of shareholder reports, except proxy statements.
For the period, transfer agent fees for each class were as follows:
| | Amount | % of Class-Level Average Net Assets |
| Class A | $198,712 | .24 |
| Class M | 55,338 | .27 |
| Class C | 53,326 | .24 |
| Materials | 885,949 | .21 |
| Class I | 285,499 | .19 |
| Class Z | 10,315 | .04 |
| | $1,489,139 | |
Accounting Fees. Fidelity Service Company, Inc. (FSC), an affiliate of the investment adviser, maintains the Fund's accounting records. The accounting fee is based on the level of average net assets for each month. For the period, the fees were equivalent to the following annual rates:
| | % of Average Net Assets |
| Materials Portfolio | .04 |
Brokerage Commissions. A portion of portfolio transactions were placed with brokerage firms which are affiliates of the investment adviser. Brokerage commissions are included in net realized gain (loss) and change in net unrealized appreciation (depreciation) in the Statement of Operations. The commissions paid to these affiliated firms were as follows:
| | Amount |
| Materials Portfolio | $6,752 |
Interfund Trades. Funds may purchase from or sell securities to other Fidelity Funds under procedures adopted by the Board. The procedures have been designed to ensure these interfund trades are executed in accordance with Rule 17a-7 of the 1940 Act. Any interfund trades are included within the respective purchases and sales amounts shown in the Purchases and Sales of Investments note and are noted in the table below.
| | Purchases ($) | Sales ($) |
| Materials Portfolio | 35,978,268 | 35,797,561 |
6. Committed Line of Credit.
Certain Funds participate with other funds managed by the investment adviser or an affiliate in a $4.25 billion credit facility (the "line of credit") to be utilized for temporary or emergency purposes to fund shareholder redemptions or for other short-term liquidity purposes. The participating funds have agreed to pay commitment fees on their pro-rata portion of the line of credit, which are reflected in Miscellaneous expenses on the Statement of Operations, and are listed below.
| | Amount |
| Materials Portfolio | $1,602 |
During the period, there were no borrowings on this line of credit.
7. Security Lending.
Funds lend portfolio securities from time to time in order to earn additional income. Lending agents are used, including National Financial Services (NFS), an affiliate of the investment adviser. Pursuant to a securities lending agreement, NFS will receive a fee, which is capped at 9.9% of a fund's daily lending revenue, for its services as lending agent. A fund may lend securities to certain qualified borrowers, including NFS. On the settlement date of the loan, a fund receives collateral (in the form of U.S. Treasury obligations, letters of credit and/or cash) against the loaned securities and maintains collateral in an amount not less than 100% of the market value of the loaned securities during the period of the loan. The market value of the loaned securities is determined at the close of business of a fund and any additional required collateral is delivered to a fund on the next business day. A fund or borrower may terminate the loan at any time, and if the borrower defaults on its obligation to return the securities loaned because of insolvency or other reasons, a fund may apply collateral received from the borrower against the obligation. A fund may experience delays and costs in recovering the securities loaned. Any cash collateral received is invested in the Fidelity Securities Lending Cash Central Fund. Any loaned securities are identified as such in the Schedule of Investments, and the value of loaned securities and cash collateral at period end, as applicable, are presented in the Statement of Assets and Liabilities. Security lending income represents the income earned on investing cash collateral, less rebates paid to borrowers and any lending agent fees associated with the loan, plus any premium payments received for lending certain types of securities. Security lending income is presented in the Statement of Operations as a component of income from Fidelity Central Funds. Affiliated security lending activity, if any, was as follows:
| | Total Security Lending Income Fees Paid to NFS | Security Lending Income From Securities Loaned to NFS | Value of Securities Loaned to NFS at Period End |
| Materials Portfolio | $6,893 | $21 | $– |
8. Expense Reductions.
Commissions paid to certain brokers with whom the investment adviser, or its affiliates, places trades on behalf of the Fund include an amount in addition to trade execution, which may be rebated back to the Fund to offset expenses. This amount totaled $35,228 for the period.
In addition, during the period the investment adviser or an affiliate reimbursed and/or waived a portion of fund-level operating expenses in the amount of $2,908.
9. Distributions to Shareholders.
Distributions to shareholders of each class were as follows:
| | Year ended
February 28, 2021 | Year ended
February 29, 2020 |
| Distributions to shareholders | | |
| Class A | $459,155 | $898,677 |
| Class M | 75,042 | 184,051 |
| Class C | – | 66,737 |
| Materials | 3,226,797 | 6,084,056 |
| Class I | 1,194,642 | 2,187,246 |
| Class Z | 342,276 | 237,161 |
| Total | $5,297,912 | $9,657,928 |
10. Share Transactions.
Share transactions for each class were as follows and may contain automatic conversions between classes or exchanges between affiliated funds:
| | Shares | Shares | Dollars | Dollars |
| | Year ended February 28, 2021 | Year ended February 29, 2020 | Year ended February 28, 2021 | Year ended February 29, 2020 |
| Class A | | | | |
| Shares sold | 232,580 | 244,450 | $16,623,421 | $16,509,685 |
| Reinvestment of distributions | 5,436 | 12,915 | 445,844 | 880,535 |
| Shares redeemed | (369,056) | (776,678) | (24,644,731) | (52,530,774) |
| Net increase (decrease) | (131,040) | (519,313) | $(7,575,466) | $(35,140,554) |
| Class M | | | | |
| Shares sold | 67,506 | 35,457 | $4,689,948 | $2,382,633 |
| Reinvestment of distributions | 920 | 2,714 | 74,674 | 183,413 |
| Shares redeemed | (110,988) | (105,772) | (7,406,306) | (7,006,735) |
| Net increase (decrease) | (42,562) | (67,601) | $(2,641,684) | $(4,440,689) |
| Class C | | | | |
| Shares sold | 32,214 | 17,268 | $2,496,383 | $1,120,535 |
| Reinvestment of distributions | – | 966 | – | 63,603 |
| Shares redeemed | (177,084) | (364,770) | (11,686,701) | (23,591,304) |
| Net increase (decrease) | (144,870) | (346,536) | $(9,190,318) | $(22,407,166) |
| Materials | | | | |
| Shares sold | 1,230,906 | 436,712 | $96,760,419 | $29,584,388 |
| Reinvestment of distributions | 36,660 | 82,761 | 3,019,633 | 5,662,504 |
| Shares redeemed | (1,975,420) | (2,690,491) | (133,695,250) | (181,389,398) |
| Net increase (decrease) | (707,854) | (2,171,018) | $(33,915,198) | $(146,142,506) |
| Class I | | | | |
| Shares sold | 1,182,584 | 507,369 | $83,979,012 | $34,230,110 |
| Reinvestment of distributions | 13,454 | 30,204 | 1,106,042 | 2,062,607 |
| Shares redeemed | (1,334,747) | (1,868,270) | (91,748,212) | (125,984,780) |
| Net increase (decrease) | (138,709) | (1,330,697) | $(6,663,158) | $(89,692,063) |
| Class Z | | | | |
| Shares sold | 507,135 | 212,839 | $36,121,225 | $13,863,966 |
| Reinvestment of distributions | 4,066 | 3,047 | 333,648 | 207,591 |
| Shares redeemed | (194,628) | (136,815) | (12,670,511) | (9,169,515) |
| Net increase (decrease) | 316,573 | 79,071 | $23,784,362 | $4,902,042 |
11. Other.
The Fund's organizational documents provide former and current trustees and officers with a limited indemnification against liabilities arising in connection with the performance of their duties to the Fund. In the normal course of business, the Fund may also enter into contracts that provide general indemnifications. The Fund's maximum exposure under these arrangements is unknown as this would be dependent on future claims that may be made against the Fund. The risk of material loss from such claims is considered remote.
12. Coronavirus (COVID-19) Pandemic.
An outbreak of COVID-19 first detected in China during December 2019 has since spread globally and was declared a pandemic by the World Health Organization during March 2020. Developments that disrupt global economies and financial markets, such as the COVID-19 pandemic, may magnify factors that affect the Fund's performance.
Report of Independent Registered Public Accounting Firm
To the Board of Trustees of Fidelity Select Portfolios and Shareholders of Chemicals Portfolio, Gold Portfolio and Materials Portfolio
Opinions on the Financial Statements
We have audited the accompanying statements of assets and liabilities, including the schedules of investments, of Chemicals Portfolio, Gold Portfolio and Materials Portfolio (three of the funds constituting Fidelity Select Portfolios, hereafter collectively referred to as the “Funds”) as of February 28, 2021, the related statements of operations for the year ended February 28, 2021, the statements of changes in net assets for each of the two years in the period ended February 28, 2021, including the related notes, and the financial highlights for each of the periods indicated therein (collectively referred to as the “financial statements”). In our opinion, the financial statements present fairly, in all material respects, the financial position of each of the Funds as of February 28, 2021, the results of each of their operations for the year then ended, the changes in each of their net assets for each of the two years in the period ended February 28, 2021 and each of the financial highlights for each of the periods indicated therein in conformity with accounting principles generally accepted in the United States of America.
Basis for Opinions
These financial statements are the responsibility of the Funds' management. Our responsibility is to express an opinion on the Funds' financial statements based on our audits. We are a public accounting firm registered with the Public Company Accounting Oversight Board (United States) (PCAOB) and are required to be independent with respect to the Funds in accordance with the U.S. federal securities laws and the applicable rules and regulations of the Securities and Exchange Commission and the PCAOB.
We conducted our audits of these financial statements in accordance with the standards of the PCAOB. Those standards require that we plan and perform the audit to obtain reasonable assurance about whether the financial statements are free of material misstatement, whether due to error or fraud.
Our audits included performing procedures to assess the risks of material misstatement of the financial statements, whether due to error or fraud, and performing procedures that respond to those risks. Such procedures included examining, on a test basis, evidence regarding the amounts and disclosures in the financial statements. Our audits also included evaluating the accounting principles used and significant estimates made by management, as well as evaluating the overall presentation of the financial statements. Our procedures included confirmation of securities owned as of February 28, 2021 by correspondence with the custodian and brokers. We believe that our audits provide a reasonable basis for our opinions.
/s/ PricewaterhouseCoopers LLP
Boston, Massachusetts
April 15, 2021
We have served as the auditor of one or more investment companies in the Fidelity group of funds since 1932.
Trustees and Officers
The Trustees, Members of the Advisory Board (if any), and officers of the trust and funds, as applicable, are listed below. The Board of Trustees governs each fund and is responsible for protecting the interests of shareholders. The Trustees are experienced executives who meet periodically throughout the year to oversee each fund's activities, review contractual arrangements with companies that provide services to each fund, oversee management of the risks associated with such activities and contractual arrangements, and review each fund's performance. Each of the Trustees oversees 309 funds.
The Trustees hold office without limit in time except that (a) any Trustee may resign; (b) any Trustee may be removed by written instrument, signed by at least two-thirds of the number of Trustees prior to such removal; (c) any Trustee who requests to be retired or who has become incapacitated by illness or injury may be retired by written instrument signed by a majority of the other Trustees; and (d) any Trustee may be removed at any special meeting of shareholders by a two-thirds vote of the outstanding voting securities of the trust. Each Trustee who is not an interested person (as defined in the 1940 Act) of the trust and the funds is referred to herein as an Independent Trustee. Each Independent Trustee shall retire not later than the last day of the calendar year in which his or her 75th birthday occurs. The Independent Trustees may waive this mandatory retirement age policy with respect to individual Trustees. Officers and Advisory Board Members hold office without limit in time, except that any officer or Advisory Board Member may resign or may be removed by a vote of a majority of the Trustees at any regular meeting or any special meeting of the Trustees. Except as indicated, each individual has held the office shown or other offices in the same company for the past five years.
Each fund's Statement of Additional Information (SAI) includes more information about the Trustees. To request a free copy, call Fidelity at 1-800-544-8544 if you’re an individual investing directly with Fidelity, call 1-800-835-5092 if you’re a plan sponsor or participant with Fidelity as your recordkeeper or call 1-877-208-0098 on institutional accounts or if you’re an advisor or invest through one.
Experience, Skills, Attributes, and Qualifications of the Trustees. The Governance and Nominating Committee has adopted a statement of policy that describes the experience, qualifications, attributes, and skills that are necessary and desirable for potential Independent Trustee candidates (Statement of Policy). The Board believes that each Trustee satisfied at the time he or she was initially elected or appointed a Trustee, and continues to satisfy, the standards contemplated by the Statement of Policy. The Governance and Nominating Committee also engages professional search firms to help identify potential Independent Trustee candidates who have the experience, qualifications, attributes, and skills consistent with the Statement of Policy. From time to time, additional criteria based on the composition and skills of the current Independent Trustees, as well as experience or skills that may be appropriate in light of future changes to board composition, business conditions, and regulatory or other developments, have also been considered by the professional search firms and the Governance and Nominating Committee. In addition, the Board takes into account the Trustees' commitment and participation in Board and committee meetings, as well as their leadership of standing and ad hoc committees throughout their tenure.
In determining that a particular Trustee was and continues to be qualified to serve as a Trustee, the Board has considered a variety of criteria, none of which, in isolation, was controlling. The Board believes that, collectively, the Trustees have balanced and diverse experience, qualifications, attributes, and skills, which allow the Board to operate effectively in governing each fund and protecting the interests of shareholders. Information about the specific experience, skills, attributes, and qualifications of each Trustee, which in each case led to the Board's conclusion that the Trustee should serve (or continue to serve) as a trustee of the funds, is provided below.
Board Structure and Oversight Function. Robert A. Lawrence is an interested person and currently serves as Acting Chairman. The Trustees have determined that an interested Chairman is appropriate and benefits shareholders because an interested Chairman has a personal and professional stake in the quality and continuity of services provided to the funds. Independent Trustees exercise their informed business judgment to appoint an individual of their choosing to serve as Chairman, regardless of whether the Trustee happens to be independent or a member of management. The Independent Trustees have determined that they can act independently and effectively without having an Independent Trustee serve as Chairman and that a key structural component for assuring that they are in a position to do so is for the Independent Trustees to constitute a substantial majority for the Board. The Independent Trustees also regularly meet in executive session. David M. Thomas serves as Lead Independent Trustee and as such (i) acts as a liaison between the Independent Trustees and management with respect to matters important to the Independent Trustees and (ii) with management prepares agendas for Board meetings.
Fidelity® funds are overseen by different Boards of Trustees. The funds' Board oversees Fidelity's high income and certain equity funds, and other Boards oversee Fidelity's investment-grade bond, money market, asset allocation, and other equity funds. The asset allocation funds may invest in Fidelity® funds overseen by the funds' Board. The use of separate Boards, each with its own committee structure, allows the Trustees of each group of Fidelity® funds to focus on the unique issues of the funds they oversee, including common research, investment, and operational issues. On occasion, the separate Boards establish joint committees to address issues of overlapping consequences for the Fidelity® funds overseen by each Board.
The Trustees operate using a system of committees to facilitate the timely and efficient consideration of all matters of importance to the Trustees, each fund, and fund shareholders and to facilitate compliance with legal and regulatory requirements and oversight of the funds' activities and associated risks. The Board, acting through its committees, has charged FMR and its affiliates with (i) identifying events or circumstances the occurrence of which could have demonstrably adverse effects on the funds' business and/or reputation; (ii) implementing processes and controls to lessen the possibility that such events or circumstances occur or to mitigate the effects of such events or circumstances if they do occur; and (iii) creating and maintaining a system designed to evaluate continuously business and market conditions in order to facilitate the identification and implementation processes described in (i) and (ii) above. Because the day-to-day operations and activities of the funds are carried out by or through FMR, its affiliates, and other service providers, the funds' exposure to risks is mitigated but not eliminated by the processes overseen by the Trustees. While each of the Board's committees has responsibility for overseeing different aspects of the funds' activities, oversight is exercised primarily through the Operations, Audit, and Compliance Committees. Appropriate personnel, including but not limited to the funds' Chief Compliance Officer (CCO), FMR's internal auditor, the independent accountants, the funds' Treasurer and portfolio management personnel, make periodic reports to the Board's committees, as appropriate, including an annual review of Fidelity's risk management program for the Fidelity® funds. The responsibilities of each standing committee, including their oversight responsibilities, are described further under "Standing Committees of the Trustees."
Interested Trustees*:
Correspondence intended for a Trustee who is an interested person may be sent to Fidelity Investments, 245 Summer Street, Boston, Massachusetts 02210.
Name, Year of Birth; Principal Occupations and Other Relevant Experience+
Bettina Doulton (1964)
Year of Election or Appointment: 2020
Trustee
Ms. Doulton also serves as Trustee of other Fidelity® funds. Prior to her retirement, Ms. Doulton served in a variety of positions at Fidelity Investments, including as a managing director of research (2006-2007), portfolio manager to certain Fidelity® funds (1993-2005), equity analyst and portfolio assistant (1990-1993), and research assistant (1987-1990). Ms. Doulton currently owns and operates Phi Builders + Architects and Cellardoor Winery. Previously, Ms. Doulton served as a member of the Board of Brown Capital Management, LLC (2013-2018).
Robert A. Lawrence (1952)
Year of Election or Appointment: 2020
Trustee
Acting Chairman of the Board of Trustees
Mr. Lawrence also serves as Trustee of other funds. Previously, Mr. Lawrence served as a Member of the Advisory Board of certain funds. Prior to his retirement in 2008, Mr. Lawrence served as Vice President of certain Fidelity® funds (2006-2008), Senior Vice President, Head of High Income Division of Fidelity Management & Research Company (investment adviser firm, 2006-2008), and President of Fidelity Strategic Investments (investment adviser firm, 2002-2005).
* Determined to be an “Interested Trustee” by virtue of, among other things, his or her affiliation with the trust or various entities under common control with FMR.
+ The information includes the Trustee's principal occupation during the last five years and other information relating to the experience, attributes, and skills relevant to the Trustee's qualifications to serve as a Trustee, which led to the conclusion that the Trustee should serve as a Trustee for each fund.
Independent Trustees:
Correspondence intended for an Independent Trustee may be sent to Fidelity Investments, P.O. Box 55235, Boston, Massachusetts 02205-5235.
Name, Year of Birth; Principal Occupations and Other Relevant Experience+
Dennis J. Dirks (1948)
Year of Election or Appointment: 2018
Trustee
Mr. Dirks also serves as Trustee of other Fidelity® funds. Prior to his retirement in May 2003, Mr. Dirks served as Chief Operating Officer and as a member of the Board of The Depository Trust & Clearing Corporation (financial markets infrastructure), President, Chief Operating Officer and a member of the Board of The Depository Trust Company (DTC), President and a member of the Board of the National Securities Clearing Corporation (NSCC), Chief Executive Officer and a member of the Board of the Government Securities Clearing Corporation and Chief Executive Officer and a member of the Board of the Mortgage-Backed Securities Clearing Corporation. Mr. Dirks currently serves as a member of the Finance Committee (2016-present) and Board (2017-present) and is Treasurer (2018-present) of the Asolo Repertory Theatre.
Donald F. Donahue (1950)
Year of Election or Appointment: 2018
Trustee
Mr. Donahue also serves as Trustee of other Fidelity® funds. Mr. Donahue serves as President and Chief Executive Officer of Miranda Partners, LLC (risk consulting for the financial services industry, 2012-present). Previously, Mr. Donahue served as Chief Executive Officer (2006-2012), Chief Operating Officer (2003-2006) and Managing Director, Customer Marketing and Development (1999-2003) of The Depository Trust & Clearing Corporation (financial markets infrastructure). Mr. Donahue currently serves as a member (2007-present) and Co-Chairman (2016-present) of the Board of United Way of New York, a member of the Board of NYC Leadership Academy (2012-present) and a member of the Board of Advisors of Ripple Labs, Inc. (financial services, 2015-present). Mr. Donahue previously served as a member of the Advisory Board of certain Fidelity® funds (2015-2018).
Vicki L. Fuller (1957)
Year of Election or Appointment: 2020
Trustee
Ms. Fuller also serves as Trustee of other Fidelity® funds. Previously, Ms. Fuller served as a member of the Advisory Board of certain Fidelity® funds (2018-2020), Chief Investment Officer of the New York State Common Retirement Fund (2012-2018) and held a variety of positions at AllianceBernstein L.P. (global asset management, 1985-2012), including Managing Director (2006-2012) and Senior Vice President and Senior Portfolio Manager (2001-2006). Ms. Fuller currently serves as a member of the Board, Audit Committee and Nominating and Governance Committee of The Williams Companies, Inc. (natural gas infrastructure, 2018-present), as a member of the Board, Audit Committee and Nominating and Governance Committee of two Blackstone business development companies (2020-present) and as a member of the Board of Treliant, LLC (consulting, 2019-present).
Patricia L. Kampling (1959)
Year of Election or Appointment: 2020
Trustee
Ms. Kampling also serves as Trustee of other Fidelity® funds. Prior to her retirement, Ms. Kampling served as Chairman of the Board and Chief Executive Officer (2012-2019), President and Chief Operating Officer (2011-2012) and Executive Vice President and Chief Financial Officer (2010-2011) of Alliant Energy Corporation. Ms. Kampling currently serves as a member of the Board, Compensation Committee and Executive Committee and as Chair of the Audit Committee of Briggs & Stratton Corporation (manufacturing, 2011-present) and as a member of the Board, Audit, Finance and Risk Committee and Safety, Environmental, Technology and Operations Committee of American Water Works Company, Inc. (utilities company, 2019-present). In addition, Ms. Kampling currently serves as a member of the Board of the Nature Conservancy, Wisconsin Chapter (2019-present). Previously, Ms. Kampling served as a Member of the Advisory Board of certain Fidelity® funds (2020), a member of the Board of Interstate Power and Light Company (2012-2019) and Wisconsin Power and Light Company (2012-2019) (each a subsidiary of Alliant Energy Corporation) and as a member of the Board and Workforce Development Committee of the Business Roundtable (2018-2019).
Thomas A. Kennedy (1955)
Year of Election or Appointment: 2021
Trustee
Mr. Kennedy also serves as Trustee of other Fidelity® funds. Previously, Mr. Kennedy served as a Member of the Advisory Board of certain Fidelity® funds (2020) and held a variety of positions at Raytheon Company (aerospace and defense, 1983-2020), including Chairman and Chief Executive Officer (2014-2020) and Executive Vice President and Chief Operating Officer (2013-2014). Mr. Kennedy currently serves as Executive Chairman of the Board of Directors of Raytheon Technologies Corporation (aerospace and defense, 2020-present). He is also a member of the Rutgers School of Engineering Industry Advisory Board (2011-present) and a member of the UCLA Engineering Dean’s Executive Board (2016-present).
Garnett A. Smith (1947)
Year of Election or Appointment: 2013
Trustee
Mr. Smith also serves as Trustee of other Fidelity® funds. Prior to his retirement, Mr. Smith served as Chairman and Chief Executive Officer (1990-1997) and President (1986-1990) of Inbrand Corp. (manufacturer of personal absorbent products). Prior to his employment with Inbrand Corp., he was employed by a retail fabric chain and North Carolina National Bank (now Bank of America). Mr. Smith previously served as a member of the Advisory Board of certain Fidelity® funds (2012-2013).
David M. Thomas (1949)
Year of Election or Appointment: 2018
Trustee
Lead Independent Trustee
Mr. Thomas also serves as Trustee of other Fidelity® funds. Previously, Mr. Thomas served as Executive Chairman (2005-2006) and Chairman and Chief Executive Officer (2000-2005) of IMS Health, Inc. (pharmaceutical and healthcare information solutions). Mr. Thomas currently serves as Non-Executive Chairman of the Board of Fortune Brands Home and Security (home and security products, 2011-present), and a member of the Board (2004-present) and Presiding Director (2013-present) of Interpublic Group of Companies, Inc. (marketing communication).
Susan Tomasky (1953)
Year of Election or Appointment: 2020
Trustee
Ms. Tomasky also serves as Trustee of other Fidelity® funds. Prior to her retirement, Ms. Tomasky served in various executive officer positions at American Electric Power Company, Inc. (1998-2011), including most recently as President of AEP Transmission (2007-2011). Ms. Tomasky currently serves as a member of the Board and Sustainability Committee and as Chair of the Audit Committee of Marathon Petroleum Corporation (2018-present) and as a member of the Board, Corporate Governance Committee and Organization and Compensation Committee and as Chair of the Audit Committee of Public Service Enterprise Group, Inc. (utilities company, 2012-present). In addition, Ms. Tomasky currently serves as a member of the Board of the Columbus Regional Airport Authority (2007-present), as a member of the Board of the Royal Shakespeare Company – America (2009-present), as a member of the Board of the Columbus Association for the Performing Arts (2011-present) and as a member of the Board of Kenyon College (2016-present). Previously, Ms. Tomasky served as a Member of the Advisory Board of certain Fidelity® funds (2020), a member of the Board (2011-2019) and as Lead Independent Director (2015-2018) of Andeavor Corporation (previously Tesoro Corporation) (independent oil refiner and marketer) and as a member of the Board of Summit Midstream Partners LP (energy, 2012-2018).
Michael E. Wiley (1950)
Year of Election or Appointment: 2008
Trustee
Mr. Wiley also serves as Trustee of other Fidelity® funds. Previously, Mr. Wiley served as a member of the Advisory Board of certain Fidelity® funds (2018-2020), Chairman, President and CEO of Baker Hughes, Inc. (oilfield services, 2000-2004). Mr. Wiley also previously served as a member of the Board of Andeavor Corporation (independent oil refiner and marketer, 2005-2018), a member of the Board of Andeavor Logistics LP (natural resources logistics, 2015-2018) and a member of the Board of High Point Resources (exploration and production, 2005-2020).
+ The information includes the Trustee's principal occupation during the last five years and other information relating to the experience, attributes, and skills relevant to the Trustee's qualifications to serve as a Trustee, which led to the conclusion that the Trustee should serve as a Trustee for each fund.
Advisory Board Members and Officers:
Correspondence intended for a Member of the Advisory Board (if any) may be sent to Fidelity Investments, P.O. Box 55235, Boston, Massachusetts 02205-5235. Correspondence intended for an officer or Peter S. Lynch may be sent to Fidelity Investments, 245 Summer Street, Boston, Massachusetts 02210. Officers appear below in alphabetical order.
Name, Year of Birth; Principal Occupation
Ned C. Lautenbach (1944)
Year of Election or Appointment: 2021
Member of the Advisory Board
Mr. Lautenbach also serves as a Member of the Advisory Board of other Fidelity® funds. Mr. Lautenbach currently serves as Chair of the Board of Governors, State University System of Florida (2013-present) and is a member of the Council on Foreign Relations (1994-present). He is also a member and has in the past served as Chairman of the Board of Directors of Artis-Naples (2012-present). Previously, Mr. Lautenbach served as a Trustee of certain Fidelity® funds (2000-2020) and a member and then Lead Director of the Board of Directors of Eaton Corporation (diversified industrial, 1997-2016). He was also a Partner at Clayton, Dubilier & Rice, LLC (private equity investment, 1998-2010); as well as Director of Sony Corporation (2006-2007). In addition, Mr. Lautenbach had a 30-year career with IBM (technology company), during which time he served as Senior Vice President and as a member of the Corporate Executive Committee (1968-1998).
Peter S. Lynch (1944)
Year of Election or Appointment: 2018
Member of the Advisory Board
Mr. Lynch also serves as a Member of the Advisory Board of other Fidelity® funds. Mr. Lynch is Vice Chairman and a Director of Fidelity Management & Research Company LLC (investment adviser firm). In addition, Mr. Lynch serves as a Trustee of Boston College and as the Chairman of the Inner-City Scholarship Fund. Previously, Mr. Lynch served as Vice Chairman and a Director of FMR Co., Inc. (investment adviser firm) and on the Special Olympics International Board of Directors (1997-2006).
Craig S. Brown (1977)
Year of Election or Appointment: 2019
Assistant Treasurer
Mr. Brown also serves as Assistant Treasurer of other funds. Mr. Brown is an employee of Fidelity Investments (2013-present).
John J. Burke III (1964)
Year of Election or Appointment: 2018
Chief Financial Officer
Mr. Burke also serves as Chief Financial Officer of other funds. Mr. Burke serves as Head of Investment Operations for Fidelity Fund and Investment Operations (2018-present) and is an employee of Fidelity Investments (1998-present). Previously Mr. Burke served as head of Asset Management Investment Operations (2012-2018).
William C. Coffey (1969)
Year of Election or Appointment: 2019
Assistant Secretary
Mr. Coffey also serves as Assistant Secretary of other funds. He is Senior Vice President and Deputy General Counsel of FMR LLC (diversified financial services company, 2010-present), and is an employee of Fidelity Investments. Previously, Mr. Coffey served as Secretary and CLO of certain funds (2018-2019); CLO, Secretary, and Senior Vice President of Fidelity Management & Research Company and FMR Co., Inc. (investment adviser firms, 2018-2019); Secretary of Fidelity SelectCo, LLC and Fidelity Investments Money Management, Inc. (investment adviser firms, 2018-2019); CLO of Fidelity Management & Research (Hong Kong) Limited, FMR Investment Management (UK) Limited, and Fidelity Management & Research (Japan) Limited (investment adviser firms, 2018-2019); and Assistant Secretary of certain funds (2009-2018).
Timothy M. Cohen (1969)
Year of Election or Appointment: 2018
Vice President
Mr. Cohen also serves as Vice President of other funds. Mr. Cohen serves as Co-Head of Equity (2018-present), a Director of Fidelity Management & Research (Japan) Limited (investment adviser firm, 2016-present), and is an employee of Fidelity Investments. Previously, Mr. Cohen served as Executive Vice President of Fidelity SelectCo, LLC (2019), Head of Global Equity Research (2016-2018), Chief Investment Officer - Equity and a Director of Fidelity Management & Research (U.K.) Inc. (investment adviser firm, 2013-2015) and as a Director of Fidelity Management & Research (Hong Kong) Limited (investment adviser firm, 2017).
Jonathan Davis (1968)
Year of Election or Appointment: 2010
Assistant Treasurer
Mr. Davis also serves as Assistant Treasurer of other funds. Mr. Davis serves as Assistant Treasurer of FMR Capital, Inc. (2017-present) and is an employee of Fidelity Investments. Previously, Mr. Davis served as Vice President and Associate General Counsel of FMR LLC (diversified financial services company, 2003-2010).
Laura M. Del Prato (1964)
Year of Election or Appointment: 2018
Assistant Treasurer
Ms. Del Prato also serves as an officer of other funds. Ms. Del Prato is an employee of Fidelity Investments (2017-present). Previously, Ms. Del Prato served as President and Treasurer of The North Carolina Capital Management Trust: Cash Portfolio and Term Portfolio (2018-2020). Prior to joining Fidelity Investments, Ms. Del Prato served as a Managing Director and Treasurer of the JPMorgan Mutual Funds (2014-2017). Prior to JPMorgan, Ms. Del Prato served as a partner at Cohen Fund Audit Services (accounting firm, 2012-2013) and KPMG LLP (accounting firm, 2004-2012).
Colm A. Hogan (1973)
Year of Election or Appointment: 2020
Assistant Treasurer
Mr. Hogan also serves as an officer of other funds. Mr. Hogan serves as Assistant Treasurer of FMR Capital, Inc. (2017-present) and is an employee of Fidelity Investments (2005-present). Previously, Mr. Hogan served as Deputy Treasurer of certain Fidelity® funds (2016-2020) and Assistant Treasurer of certain Fidelity® funds (2016-2018).
Pamela R. Holding (1964)
Year of Election or Appointment: 2018
Vice President
Ms. Holding also serves as Vice President of other funds. Ms. Holding serves as Co-Head of Equity (2018-present) and is an employee of Fidelity Investments (2013-present). Previously, Ms. Holding served as Executive Vice President of Fidelity SelectCo, LLC (2019) and as Chief Investment Officer of Fidelity Institutional Asset Management (2013-2018).
Cynthia Lo Bessette (1969)
Year of Election or Appointment: 2019
Secretary and Chief Legal Officer (CLO)
Ms. Lo Bessette also serves as an officer of other funds. Ms. Lo Bessette serves as CLO, Secretary, and Senior Vice President of Fidelity Management & Research Company LLC (investment adviser firm, 2019-present); and CLO of Fidelity Management & Research (Hong Kong) Limited, FMR Investment Management (UK) Limited, and Fidelity Management & Research (Japan) Limited (investment adviser firms, 2019-present). She is a Senior Vice President and Deputy General Counsel of FMR LLC (diversified financial services company, 2019-present), and is an employee of Fidelity Investments. Previously, Ms. Lo Bessette served as CLO, Secretary, and Senior Vice President of FMR Co., Inc. (investment adviser firm, 2019); Secretary of Fidelity SelectCo, LLC and Fidelity Investments Money Management, Inc. (investment adviser firms, 2019). Prior to joining Fidelity Investments, Ms. Lo Bessette was Executive Vice President, General Counsel (2016-2019) and Senior Vice President, Deputy General Counsel (2015-2016) of OppenheimerFunds (investment management company) and Deputy Chief Legal Officer (2013-2015) of Jennison Associates LLC (investment adviser firm).
Chris Maher (1972)
Year of Election or Appointment: 2020
Deputy Treasurer
Mr. Maher also serves as an officer of other funds. Mr. Maher serves as Assistant Treasurer of FMR Capital, Inc. (2017-present), and is an employee of Fidelity Investments (2008-present). Previously, Mr. Maher served as Assistant Treasurer of certain funds (2013-2020); Vice President of Asset Management Compliance (2013), Vice President of the Program Management Group of FMR (investment adviser firm, 2010-2013), and Vice President of Valuation Oversight (2008-2010).
Jason P. Pogorelec (1975)
Year of Election or Appointment: 2020
Chief Compliance Officer
Mr. Pogorelec also serves as Chief Compliance Officer of other funds. Mr. Pogorelec is a senior Vice President of Asset Management Compliance for Fidelity Investments and is an employee of Fidelity Investments (2006-present). Previously, Mr. Pogorelec served as Vice President, Associate General Counsel for Fidelity Investments (2010-2020) and Assistant Secretary of certain Fidelity funds (2015-2020).
Brett Segaloff (1972)
Year of Election or Appointment: 2021
Anti-Money Laundering (AML) Officer
Mr. Segaloff also serves as an AML Officer of other funds and other related entities. He is Director, Anti-Money Laundering (2007-present) of FMR LLC (diversified financial services company) and is an employee of Fidelity Investments (1996-present).
Stacie M. Smith (1974)
Year of Election or Appointment: 2018
President and Treasurer
Ms. Smith also serves as an officer of other funds. Ms. Smith serves as Assistant Treasurer of FMR Capital, Inc. (2017-present), is an employee of Fidelity Investments (2009-present), and has served in other fund officer roles. Prior to joining Fidelity Investments, Ms. Smith served as Senior Audit Manager of Ernst & Young LLP (accounting firm, 1996-2009). Previously, Ms. Smith served as Assistant Treasurer (2013-2019) and Deputy Treasurer (2013-2016) of certain Fidelity® funds.
Marc L. Spector (1972)
Year of Election or Appointment: 2017
Assistant Treasurer
Mr. Spector also serves as an officer of other funds. Mr. Spector serves as Assistant Treasurer of FMR Capital, Inc. (2017-present) and is an employee of Fidelity Investments (2016-present). Prior to joining Fidelity Investments, Mr. Spector served as Director at the Siegfried Group (accounting firm, 2013-2016), and prior to Siegfried Group as audit senior manager at Deloitte & Touche LLP (accounting firm, 2005-2013).
Jim Wegmann (1979)
Year of Election or Appointment: 2019
Assistant Treasurer
Mr. Wegmann also serves as Assistant Treasurer of other funds. Mr. Wegmann is an employee of Fidelity Investments (2011-present).
Shareholder Expense Example
As a shareholder, you incur two types of costs: (1) transaction costs, which may include sales charges (loads) on purchase payments or redemption proceeds, as applicable and (2) ongoing costs, which generally include management fees, distribution and/or service (12b-1) fees and other Fund expenses. This Example is intended to help you understand your ongoing costs (in dollars) of investing in a fund and to compare these costs with the ongoing costs of investing in other mutual funds.
The Example is based on an investment of $1,000 invested at the beginning of the period and held for the entire period (September 1, 2020 to February 28, 2021).
Actual Expenses
The first line of the accompanying table provides information about actual account values and actual expenses. You may use the information in this line, together with the amount you invested, to estimate the expenses that you paid over the period. Simply divide your account value by $1,000.00 (for example, an $8,600 account value divided by $1,000.00 = 8.6), then multiply the result by the number in the first line for a class/Fund under the heading entitled "Expenses Paid During Period" to estimate the expenses you paid on your account during this period. If any fund is a shareholder of any underlying mutual funds or exchange-traded funds (ETFs) (the Underlying Funds), such fund indirectly bears its proportional share of the expenses of the Underlying Funds in addition to the direct expenses incurred presented in the table. These fees and expenses are not included in the annualized expense ratio used to calculate the expense estimate in the table below.
Hypothetical Example for Comparison Purposes
The second line of the accompanying table provides information about hypothetical account values and hypothetical expenses based on the actual expense ratio and an assumed rate of return of 5% per year before expenses, which is not the actual return. The hypothetical account values and expenses may not be used to estimate the actual ending account balance or expenses you paid for the period. You may use this information to compare the ongoing costs of investing in the Fund and other funds. To do so, compare this 5% hypothetical example with the 5% hypothetical examples that appear in the shareholder reports of the other funds. If any fund is a shareholder of any Underlying Funds, such fund indirectly bears its proportional share of the expenses of the Underlying Funds in addition to the direct expenses as presented in the table. These fees and expenses are not included in the annualized expense ratio used to calculate the expense estimate in the table below.
Please note that the expenses shown in the table are meant to highlight your ongoing costs only and do not reflect any transaction costs. Therefore, the second line of the table is useful in comparing ongoing costs only, and will not help you determine the relative total costs of owning different funds. In addition, if these transactional costs were included, your costs would have been higher.
| | Annualized Expense Ratio-A | Beginning
Account Value
September 1, 2020 | Ending
Account Value
February 28, 2021 | Expenses Paid
During Period-B
September 1, 2020
to February 28, 2021 |
| Chemicals Portfolio | .77% | | | |
| Actual | | $1,000.00 | $1,207.70 | $4.21 |
| Hypothetical-C | | $1,000.00 | $1,020.98 | $3.86 |
| Gold Portfolio | | | | |
| Class A | 1.07% | | | |
| Actual | | $1,000.00 | $743.50 | $4.63 |
| Hypothetical-C | | $1,000.00 | $1,019.49 | $5.36 |
| Class M | 1.37% | | | |
| Actual | | $1,000.00 | $742.20 | $5.92 |
| Hypothetical-C | | $1,000.00 | $1,018.00 | $6.85 |
| Class C | 1.78% | | | |
| Actual | | $1,000.00 | $740.90 | $7.68 |
| Hypothetical-C | | $1,000.00 | $1,015.97 | $8.90 |
| Gold | .76% | | | |
| Actual | | $1,000.00 | $744.40 | $3.29 |
| Hypothetical-C | | $1,000.00 | $1,021.03 | $3.81 |
| Class I | .77% | | | |
| Actual | | $1,000.00 | $744.50 | $3.33 |
| Hypothetical-C | | $1,000.00 | $1,020.98 | $3.86 |
| Class Z | .63% | | | |
| Actual | | $1,000.00 | $745.00 | $2.73 |
| Hypothetical-C | | $1,000.00 | $1,021.67 | $3.16 |
| Materials Portfolio | | | | |
| Class A | 1.07% | | | |
| Actual | | $1,000.00 | $1,245.50 | $5.96 |
| Hypothetical-C | | $1,000.00 | $1,019.49 | $5.36 |
| Class M | 1.34% | | | |
| Actual | | $1,000.00 | $1,243.90 | $7.46 |
| Hypothetical-C | | $1,000.00 | $1,018.15 | $6.71 |
| Class C | 1.82% | | | |
| Actual | | $1,000.00 | $1,240.70 | $10.11 |
| Hypothetical-C | | $1,000.00 | $1,015.77 | $9.10 |
| Materials | .78% | | | |
| Actual | | $1,000.00 | $1,247.30 | $4.35 |
| Hypothetical-C | | $1,000.00 | $1,020.93 | $3.91 |
| Class I | .77% | | | |
| Actual | | $1,000.00 | $1,247.30 | $4.29 |
| Hypothetical-C | | $1,000.00 | $1,020.98 | $3.86 |
| Class Z | .63% | | | |
| Actual | | $1,000.00 | $1,248.10 | $3.51 |
| Hypothetical-C | | $1,000.00 | $1,021.67 | $3.16 |
A Annualized expense ratio reflects expenses net of applicable fee waivers.
B Expenses are equal to the annualized expense ratio, multiplied by the average account value over the period, multiplied by 181/ 365 (to reflect the one-half year period). The fees and expenses of any Underlying Funds are not included in each annualized expense ratio.
C 5% return per year before expenses
Distributions (Unaudited)
A percentage of the dividends distributed during the fiscal year for the following funds qualify for the dividends–received deduction for corporate shareholders:
| | April 2020 | December 2020 |
| Chemicals Portfolio | – | 96% |
| Gold Portfolio | | |
| Class A | 1% | 7% |
| Class M | 1% | 8% |
| Class C | 2% | 9% |
| Gold | 1% | 7% |
| Class I | 1% | 7% |
| Class Z | 1% | 7% |
| Materials Portfolio | | |
| Class A | – | 100% |
| Class M | – | 100% |
| Class C | – | – |
| Materials | – | 100% |
| Class I | – | 100% |
| Class Z | – | 100% |
A percentage of the dividends distributed during the fiscal year for the following funds may be taken into account as a dividend for purposes of the maximum rate under section 1(h)(11) of the Internal Revenue Code.
| | April 2020 | December 2020 |
| Chemicals Portfolio | – | 100% |
| Gold Portfolio | | |
| Class A | 82% | 25% |
| Class M | 89% | 26% |
| Class C | 98% | 29% |
| Gold | 76% | 23% |
| Class I | 76% | 23% |
| Class Z | 74% | 23% |
| Materials Portfolio | | |
| Class A | – | 100% |
| Class M | – | 100% |
| Class C | – | – |
| Materials | – | 100% |
| Class I | – | 100% |
| Class Z | – | 100% |
The amounts per share which represent income derived from sources within, and taxes paid to, foreign countries or possessions of the United States are as follows:
| | Pay Date | Income | Taxes |
| Gold Portfolio | | | |
| Class A | 04/09/2020 | $0.0278 | $0.0036 |
| Class A | 12/14/2020 | $1.0943 | $0.0253 |
| Class M | 04/09/2020 | $0.0254 | $0.0036 |
| Class M | 12/14/2020 | $1.0223 | $0.0253 |
| Class C | 04/09/2020 | $0.0231 | $0.0036 |
| Class C | 12/14/2020 | $0.9343 | $0.0253 |
| Gold | 04/09/2020 | $0.0299 | $0.0036 |
| Gold | 12/14/2020 | $1.1593 | $0.0253 |
| Class I | 04/09/2020 | $0.0299 | $0.0036 |
| Class I | 12/14/2020 | $1.1603 | $0.0253 |
| Class Z | 04/09/2020 | $0.0308 | $0.0036 |
| Class Z | 12/14/2020 | $1.1953 | $0.0253 |
The funds will notify shareholders in January 2022 of amounts for use in preparing 2021 income tax returns.
Board Approval of Investment Advisory Contracts
Chemicals Portfolio
Gold Portfolio
Materials Portfolio
At its January 2021 meeting, the Board of Trustees, including the Independent Trustees (together, the Board), voted to continue the management contract with Fidelity Management & Research Company LLC (FMR), and the sub-advisory agreements and sub-subadvisory agreements, in each case, where applicable (together, the Advisory Contracts) for each fund for four months from February 1, 2021 through May 31, 2021, in connection with changes to the Board's meeting calendar.
The Board considered that the approval of each fund's Advisory Contracts will not result in any changes in (i) the investment process or strategies employed in the management of each fund's assets; (ii) the fees and expenses paid by shareholders; (iii) the nature, extent or quality of services provided under each fund's Advisory Contracts; or (iv) the day-to-day management of each fund or the persons primarily responsible for such management. The Board also considered that since its last approval of each fund's Advisory Contracts, FMR had provided additional information on each fund in support of the annual contract renewal process, including competitive analyses on total expenses and management fees and in-depth reviews of fund performance and fund profitability information. The Board also considered the findings of certain ad hoc committees that had been previously formed to discuss matters relevant to all of the Fidelity funds, including economies of scale, fall-out benefits and retail vs. institutional funds. The Board concluded that each fund's Advisory Contracts are fair and reasonable, and that each fund's Advisory Contracts should be renewed, without modification, through May 31, 2021, with the understanding that the Board will consider the annual renewal for a full one year period in May 2021.
In connection with its consideration of future renewals of each fund's Advisory Contracts, the Board will consider: (i) the nature, extent and quality of services provided to the funds, including shareholder and administrative services and investment performance; (ii) the competitiveness of the management fee and total expenses for each fund; (iii) the costs of the services and profitability, including the revenues earned and the expenses incurred in conducting the business of developing, marketing, distributing, managing, administering, and servicing each fund and its shareholders, to the extent applicable; and (iv) whether there have been economies of scale in respect of the Fidelity funds, whether the Fidelity funds (including the funds) have appropriately benefited from any such economies of scale, and whether there is the potential for realization of any further economies.
Based on its evaluation of all of the conclusions noted above, and after considering all factors it believed relevant, the Board ultimately concluded that each fund's management fee structures are fair and reasonable, and that the continuation of the funds' Advisory Contracts should be approved for four months from February 1, 2021 through May 31, 2021.
Liquidity Risk Management Program
The Securities and Exchange Commission adopted Rule 22e-4 under the Investment Company Act of 1940 (the Liquidity Rule) to promote effective liquidity risk management throughout the open-end investment company industry, thereby reducing the risk that funds will be unable to meet their redemption obligations and mitigating dilution of the interests of fund shareholders.
The Funds have adopted and implemented a liquidity risk management program pursuant to the Liquidity Rule (the Program) effective December 1, 2018. The Program is reasonably designed to assess and manage each Fund’s liquidity risk and to comply with the requirements of the Liquidity Rule. Each Fund’s Board of Trustees (the Board) has designated each Fund’s investment adviser as administrator of the Program. The Fidelity advisers have established a Liquidity Risk Management Committee (the LRM Committee) to manage the Program for each of the Fidelity Funds. The LRM Committee monitors the adequacy and effectiveness of implementation of the Program and on a periodic basis assesses each Fund’s liquidity risk based on a variety of factors including (1) the Fund’s investment strategy, (2) portfolio liquidity and cash flow projections during normal and reasonably foreseeable stressed conditions, (3) shareholder redemptions, (4) borrowings and other funding sources and (5) in the case of exchange-traded funds, certain additional factors including the effect of the Fund’s prices and spreads, market participants, and basket compositions on the overall liquidity of the Fund’s portfolio, as applicable.
In accordance with the Program, each of the Fund’s portfolio investments is classified into one of four liquidity categories described below based on a determination of a reasonable expectation for how long it would take to convert the investment to cash (or sell or dispose of the investment) without significantly changing its market value.
- Highly liquid investments – cash or convertible to cash within three business days or less
- Moderately liquid investments – convertible to cash in three to seven calendar days
- Less liquid investments – can be sold or disposed of, but not settled, within seven calendar days
- Illiquid investments – cannot be sold or disposed of within seven calendar days
Liquidity classification determinations take into account a variety of factors including various market, trading and investment-specific considerations, as well as market depth, and generally utilize analysis from a third-party liquidity metrics service.
The Liquidity Rule places a 15% limit on a fund’s illiquid investments and requires funds that do not primarily hold assets that are highly liquid investments to determine and maintain a minimum percentage of the fund’s net assets to be invested in highly liquid investments (highly liquid investment minimum or HLIM). The Program includes provisions reasonably designed to comply with the 15% limit on illiquid investments and for determining, periodically reviewing and complying with the HLIM requirement as applicable.
At a recent meeting of the Fund’s Board of Trustees, the LRM Committee provided a written report to the Board pertaining to the operation, adequacy, and effectiveness of implementation of the Program for the annual period from December 1, 2019 through November 30, 2020. The report concluded that the Program has been implemented and is operating effectively and is reasonably designed to assess and manage the Fund’s liquidity risk.
Proxy Voting Results
A special meeting of shareholders was held on June 9, 2020. The results of votes taken among shareholders on the proposal before them are reported below. Each vote reported represents one dollar of net asset value held on the record date for the meeting.
PROPOSAL 1
To elect a Board of Trustees.
| | # of
Votes | % of
Votes |
| Dennis J. Dirks |
| Affirmative | 32,463,705,305.665 | 92.437 |
| Withheld | 2,655,951,104.308 | 7.563 |
| TOTAL | 35,119,656,409.973 | 100.000 |
| Donald F. Donahue |
| Affirmative | 32,446,843,861.354 | 92.389 |
| Withheld | 2,672,812,548.619 | 7.611 |
| TOTAL | 35,119,656,409.973 | 100.000 |
| Bettina Doulton |
| Affirmative | 32,610,463,757.584 | 92.855 |
| Withheld | 2,509,192,652.389 | 7.145 |
| TOTAL | 35,119,656,409.973 | 100.000 |
| Vicki L. Fuller |
| Affirmative | 32,688,213,522.720 | 93.077 |
| Withheld | 2,431,442,887.253 | 6.923 |
| TOTAL | 35,119,656,409.973 | 100.000 |
| Patricia L. Kampling |
| Affirmative | 32,313,755,598.535 | 92.010 |
| Withheld | 2,805,900,811.438 | 7.990 |
| TOTAL | 35,119,656,409.973 | 100.000 |
| Alan J. Lacy |
| Affirmative | 31,990,158,754.948 | 91.089 |
| Withheld | 3,129,497,655.026 | 8.911 |
| TOTAL | 35,119,656,409.973 | 100.000 |
| Ned C. Lautenbach |
| Affirmative | 32,043,019,991.143 | 91.240 |
| Withheld | 3,076,636,418.830 | 8.760 |
| TOTAL | 35,119,656,409.973 | 100.000 |
| Robert A. Lawrence |
| Affirmative | 32,150,842,398.009 | 91.547 |
| Withheld | 2,968,814,011.965 | 8.453 |
| TOTAL | 35,119,656,409.973 | 100.000 |
| Joseph Mauriello |
| Affirmative | 32,082,201,213.166 | 91.351 |
| Withheld | 3,037,455,196.807 | 8.649 |
| TOTAL | 35,119,656,409.973 | 100.000 |
| Cornelia M. Small |
| Affirmative | 32,207,976,835.934 | 91.709 |
| Withheld | 2,911,679,574.039 | 8.291 |
| TOTAL | 35,119,656,409.973 | 100.000 |
| Garnett A. Smith |
| Affirmative | 32,102,654,343.096 | 91.409 |
| Withheld | 3,017,002,066.877 | 8.591 |
| TOTAL | 35,119,656,409.973 | 100.000 |
| David M. Thomas |
| Affirmative | 32,150,749,424.556 | 91.546 |
| Withheld | 2,968,906,985.418 | 8.454 |
| TOTAL | 35,119,656,409.973 | 100.000 |
| Susan Tomasky |
| Affirmative | 32,381,933,484.515 | 92.205 |
| Withheld | 2,737,722,925.459 | 7.795 |
| TOTAL | 35,119,656,409.973 | 100.000 |
| Michael E. Wiley |
| Affirmative | 32,135,064,741.973 | 91.502 |
| Withheld | 2,984,591,668.000 | 8.498 |
| TOTAL | 35,119,656,409.973 | 100.000 |
|
| Proposal 1 reflects trust wide proposal and voting results. |
SELMT-ANN-0421
1.846032.114
Fidelity® Select Portfolios®
Telecommunications Services Sector
Telecommunications Portfolio
Wireless Portfolio
Annual Report
February 28, 2021
Includes Fidelity and Fidelity Advisor share classes
Contents
To view a fund's proxy voting guidelines and proxy voting record for the 12-month period ended June 30, visit http://www.fidelity.com/proxyvotingresults or visit the Securities and Exchange Commission's (SEC) web site at http://www.sec.gov.
You may also call 1-800-544-8544 if you’re an individual investing directly with Fidelity, call 1-800-835-5092 if you’re a plan sponsor or participant with Fidelity as your recordkeeper or call 1-877-208-0098 on institutional accounts or if you’re an advisor or invest through one to request a free copy of the proxy voting guidelines.
Standard & Poor's, S&P and S&P 500 are registered service marks of The McGraw-Hill Companies, Inc. and have been licensed for use by Fidelity Distributors Corporation.
Other third-party marks appearing herein are the property of their respective owners.
All other marks appearing herein are registered or unregistered trademarks or service marks of FMR LLC or an affiliated company. © 2021 FMR LLC. All rights reserved.
This report and the financial statements contained herein are submitted for the general information of the shareholders of the Funds. This report is not authorized for distribution to prospective investors in the Funds unless preceded or accompanied by an effective prospectus.
A fund files its complete schedule of portfolio holdings with the SEC for the first and third quarters of each fiscal year on Form N-PORT. Forms N-PORT are available on the SEC’s web site at http://www.sec.gov. A fund's Forms N-PORT may be reviewed and copied at the SEC’s Public Reference Room in Washington, DC. Information regarding the operation of the SEC's Public Reference Room may be obtained by calling 1-800-SEC-0330.
For a complete list of a fund's portfolio holdings, view the most recent holdings listing, semiannual report, or annual report on Fidelity's web site at http://www.fidelity.com, http://www.institutional.fidelity.com, or http://www.401k.com, as applicable.
NOT FDIC INSURED •MAY LOSE VALUE •NO BANK GUARANTEE
Neither the Funds nor Fidelity Distributors Corporation is a bank.
Note to Shareholders:
Early in 2020, the outbreak and spread of a new coronavirus emerged as a public health emergency that had a major influence on financial markets, primarily based on its impact on the global economy and the outlook for corporate earnings. The virus causes a respiratory disease known as COVID-19. On March 11, 2020 the World Health Organization declared the COVID-19 outbreak a pandemic, citing sustained risk of further global spread.
In the weeks following, as the crisis worsened, we witnessed an escalating human tragedy with wide-scale social and economic consequences from coronavirus-containment measures. The outbreak of COVID-19 prompted a number of measures to limit the spread, including travel and border restrictions, quarantines, and restrictions on large gatherings. In turn, these resulted in lower consumer activity, diminished demand for a wide range of products and services, disruption in manufacturing and supply chains, and – given the wide variability in outcomes regarding the outbreak – significant market uncertainty and volatility. Amid the turmoil, global governments and central banks took unprecedented action to help support consumers, businesses, and the broader economies, and to limit disruption to financial systems.
The situation continues to unfold, and the extent and duration of its impact on financial markets and the economy remain highly uncertain. Extreme events such as the coronavirus crisis are “exogenous shocks” that can have significant adverse effects on mutual funds and their investments. Although multiple asset classes may be affected by market disruption, the duration and impact may not be the same for all types of assets.
Fidelity is committed to helping you stay informed amid news about COVID-19 and during increased market volatility, and we’re taking extra steps to be responsive to customer needs. We encourage you to visit our websites, where we offer ongoing updates, commentary, and analysis on the markets and our funds.
Telecommunications Portfolio
Performance: The Bottom Line
Average annual total return reflects the change in the value of an investment, assuming reinvestment of distributions from dividend income and capital gains (the profits earned upon the sale of securities that have grown in value, if any) and assuming a constant rate of performance each year. The hypothetical investment and the average annual total returns do not reflect the deduction of taxes that a shareholder would pay on fund distributions or the redemption of fund shares. During periods of reimbursement by Fidelity, a fund’s total return will be greater than it would be had the reimbursement not occurred. How a fund did yesterday is no guarantee of how it will do tomorrow.
Average Annual Total Returns
| For the periods ended February 28, 2021 | Past 1 year | Past 5 years | Past 10 years |
| Class A (incl. 5.75% sales charge) | 11.92% | 8.03% | 8.01% |
| Class M (incl. 3.50% sales charge) | 14.24% | 8.20% | 7.93% |
| Class C (incl. contingent deferred sales charge) | 16.88% | 8.54% | 7.88% |
| Telecommunications Portfolio | 19.15% | 9.69% | 9.01% |
| Class I | 19.13% | 9.67% | 8.99% |
| Class Z | 19.31% | 9.77% | 9.04% |
Class C shares' contingent deferred sales charges included in the past one year, past five years and past ten years total return figures are 1%, 0% and 0%, respectively.
The initial offering of Class Z shares took place on October 2, 2018. Returns prior to October 2, 2018, are those of Class I.
$10,000 Over 10 Years
Let's say hypothetically that $10,000 was invested in Telecommunications Portfolio, a class of the fund, on February 28, 2011.
The chart shows how the value of your investment would have changed, and also shows how the S&P 500® Index performed over the same period.

| Period Ending Values |
| $23,700 | Telecommunications Portfolio |
| $35,259 | S&P 500® Index |
Telecommunications Portfolio
Management's Discussion of Fund Performance
Market Recap: The S&P 500
® index gained 31.29% for the 12 months ending February 28, 2021, a volatile but productive period for U.S. risk assets. The early-2020 outbreak and spread of COVID-19 resulted in stocks suffering one of the quickest declines on record, through March 23, followed by a historic rebound that included the index closing 2020 at an all-time high and gaining modest ground in the first two months of the new year. The crisis and containment efforts caused broad contraction in economic activity, along with extreme uncertainty and dislocation in financial markets. A rapid and expansive U.S. monetary/fiscal-policy response partially offset the economic disruption and fueled the market surge, as did resilient corporate earnings. The rally slowed in September, when stocks began a two-month retreat amid Congress’s inability to reach a deal on additional fiscal stimulus, as well as concerns about election uncertainty, indications the U.S. economic recovery could be slowing and a new wave of COVID-19 cases. A shift in momentum began in October and accelerated following the U.S. elections, with the approval of three breakthrough COVID-19 vaccines and prospects for additional government stimulus fueling the “reflation trade” through February 28. By sector for the full 12 months, information technology (+50%) and consumer discretionary (+43%) led all gainers. Materials (+42%) and communication services (+37%) also stood out. In contrast, the defensive utilities (-3%) and real estate sectors (+5%) notably lagged.
Comments from Co-Managers Nicole Abernethy and Matthew Drukker: For the fiscal year ending February 28, 2021, the fund's share classes (excluding sales charges, if applicable) gained roughly 18% to 19%, outperforming the 11.82% gain of the industry benchmark, the MSCI U.S. IMI Telecommunication Services 25/50 Index, but underperforming the broad-based S&P 500
® index. An underweighting and stock picks in integrated telecommunication services contributed significantly to fund performance versus the industry benchmark. Security selection in oil & gas refining & marketing and alternative carriers also boosted the fund's relative return. Among individual holdings, underweighting industry heavyweight AT&T (-15%) added more value than any other fund position. Non-index stakes in Reliance Industries (+105%) and Bezeq the Israeli Telecom (+60%) also contributed notably. The fund did not hold Bezeq the Israeli Telecom at period end. In contrast, an underweight in alternative carriers and picks among communications equipment and trucking firms hindered the fund's relative performance. An underweight position in alternative carrier Bandwidth.com (+152%) and not owning Gogo, a wireless telecommunication services firm in the index that gained about 228%, detracted notably. It also hurt to own a non-index stake in Lyft, which the fund no longer held at period end. Notable changes in fund positioning included decreased exposure to the wireless telecommunication services subindustry.
The views expressed above reflect those of the portfolio manager(s) only through the end of the period as stated on the cover of this report and do not necessarily represent the views of Fidelity or any other person in the Fidelity organization. Any such views are subject to change at any time based upon market or other conditions and Fidelity disclaims any responsibility to update such views. These views may not be relied on as investment advice and, because investment decisions for a Fidelity fund are based on numerous factors, may not be relied on as an indication of trading intent on behalf of any Fidelity fund.
Note to Shareholders: On August 17, 2020, Nicole Abernethy assumed co-management responsibilities for the fund, joining Matt Drukker until April 1, 2021, when Matt came off the fund, leaving Nicole as sole portfolio manager of the fund.
Telecommunications Portfolio
Investment Summary (Unaudited)
Top Ten Stocks as of February 28, 2021
| | % of fund's net assets |
| Verizon Communications, Inc. | 22.5 |
| AT&T, Inc. | 15.4 |
| T-Mobile U.S., Inc. | 7.7 |
| Vonage Holdings Corp. | 4.9 |
| Liberty Global PLC Class C | 4.6 |
| Comcast Corp. Class A | 4.6 |
| Liberty Broadband Corp. Class C | 4.5 |
| Bandwidth, Inc. | 4.3 |
| Iridium Communications, Inc. | 4.1 |
| Liberty Latin America Ltd. Class C | 3.9 |
| | 76.5 |
Top Industries (% of fund's net assets)
| As of February 28, 2021 |
| | Diversified Telecommunication Services | 68.6% |
| | Wireless Telecommunication Services | 13.8% |
| | Media | 11.3% |
| | Communications Equipment | 3.0% |
| | Construction & Engineering | 1.4% |
| | All Others* | 1.9% |

* Includes short-term investments and net other assets (liabilities).
Telecommunications Portfolio
Schedule of Investments February 28, 2021
Showing Percentage of Net Assets
| Common Stocks - 99.3% | | | |
| | | Shares | Value |
| Communications Equipment - 3.0% | | | |
| Communications Equipment - 3.0% | | | |
| CommScope Holding Co., Inc. (a) | | 285,800 | $4,169,822 |
| EchoStar Holding Corp. Class A (a) | | 87,700 | 1,990,790 |
| Harmonic, Inc. (a) | | 566,700 | 4,389,092 |
| | | | 10,549,704 |
| Construction & Engineering - 1.4% | | | |
| Construction & Engineering - 1.4% | | | |
| Dycom Industries, Inc. (a) | | 65,500 | 5,015,990 |
| Diversified Telecommunication Services - 68.6% | | | |
| Alternative Carriers - 29.3% | | | |
| Bandwidth, Inc. (a)(b) | | 94,300 | 14,933,348 |
| Cogent Communications Group, Inc. | | 225,339 | 13,486,539 |
| Iridium Communications, Inc. (a) | | 371,411 | 14,228,755 |
| Liberty Global PLC Class C (a) | | 668,836 | 16,252,715 |
| Liberty Latin America Ltd. Class C (a) | | 1,259,333 | 13,802,290 |
| Lumen Technologies, Inc. | | 799,300 | 9,823,397 |
| ORBCOMM, Inc. (a) | | 381,149 | 2,908,167 |
| Vonage Holdings Corp. (a) | | 1,309,971 | 17,317,817 |
| | | | 102,753,028 |
| Integrated Telecommunication Services - 39.3% | | | |
| AT&T, Inc. | | 1,944,220 | 54,224,296 |
| ATN International, Inc. | | 100,200 | 4,877,736 |
| Consolidated Communications Holdings, Inc. (a) | | 10,700 | 56,282 |
| Verizon Communications, Inc. | | 1,424,997 | 78,802,333 |
| | | | 137,960,647 |
|
| TOTAL DIVERSIFIED TELECOMMUNICATION SERVICES | | | 240,713,675 |
|
| Media - 11.3% | | | |
| Cable & Satellite - 11.3% | | | |
| Charter Communications, Inc. Class A (a) | | 12,700 | 7,790,434 |
| Comcast Corp. Class A | | 305,400 | 16,100,688 |
| Liberty Broadband Corp. Class C (a) | | 106,024 | 15,851,648 |
| | | | 39,742,770 |
| Oil, Gas & Consumable Fuels - 0.5% | | | |
| Oil & Gas Refining & Marketing - 0.5% | | | |
| Reliance Industries Ltd. | | 56,800 | 1,602,357 |
| Software - 0.7% | | | |
| Application Software - 0.7% | | | |
| RingCentral, Inc. (a) | | 6,700 | 2,533,672 |
| Wireless Telecommunication Services - 13.8% | | | |
| Wireless Telecommunication Services - 13.8% | | | |
| Boingo Wireless, Inc. (a) | | 182,700 | 2,082,780 |
| Millicom International Cellular SA (a) | | 104,000 | 3,893,760 |
| Shenandoah Telecommunications Co. | | 97,823 | 4,338,450 |
| T-Mobile U.S., Inc. | | 224,524 | 26,936,144 |
| Telephone & Data Systems, Inc. | | 286,764 | 5,130,208 |
| U.S. Cellular Corp. (a) | | 196,900 | 5,794,767 |
| | | | 48,176,109 |
| TOTAL COMMON STOCKS | | | |
| (Cost $271,660,920) | | | 348,334,277 |
|
| Money Market Funds - 2.7% | | | |
| Fidelity Cash Central Fund 0.07% (c) | | 2,584,599 | 2,585,116 |
| Fidelity Securities Lending Cash Central Fund 0.08% (c)(d) | | 6,842,992 | 6,843,676 |
| TOTAL MONEY MARKET FUNDS | | | |
| (Cost $9,428,792) | | | 9,428,792 |
| TOTAL INVESTMENT IN SECURITIES - 102.0% | | | |
| (Cost $281,089,712) | | | 357,763,069 |
| NET OTHER ASSETS (LIABILITIES) - (2.0)% | | | (6,946,914) |
| NET ASSETS - 100% | | | $350,816,155 |
Legend
(a) Non-income producing
(b) Security or a portion of the security is on loan at period end.
(c) Affiliated fund that is generally available only to investment companies and other accounts managed by Fidelity Investments. The rate quoted is the annualized seven-day yield of the fund at period end. A complete unaudited listing of the fund's holdings as of its most recent quarter end is available upon request. In addition, each Fidelity Central Fund's financial statements, which are not covered by the Fund's Report of Independent Registered Public Accounting Firm, are available on the SEC's website or upon request.
(d) Investment made with cash collateral received from securities on loan.
Affiliated Central Funds
Information regarding fiscal year to date income earned by the Fund from investments in Fidelity Central Funds is as follows:
| Fund | Income earned |
| Fidelity Cash Central Fund | $4,600 |
| Fidelity Securities Lending Cash Central Fund | 15,498 |
| Total | $20,098 |
Amounts in the income column in the above table include any capital gain distributions from underlying funds, which are presented in the corresponding line-item in the Statement of Operations, if applicable. Amount for Fidelity Securities Lending Cash Central Fund represents the income earned on investing cash collateral, less rebates paid to borrowers and any lending agent fees associated with the loan, plus any premium payments received for lending certain types of securities.
Investment Valuation
The following is a summary of the inputs used, as of February 28, 2021, involving the Fund's assets and liabilities carried at fair value. The inputs or methodology used for valuing securities may not be an indication of the risk associated with investing in those securities. For more information on valuation inputs, and their aggregation into the levels used below, please refer to the Investment Valuation section in the accompanying Notes to Financial Statements.
| | Valuation Inputs at Reporting Date: |
| Description | Total | Level 1 | Level 2 | Level 3 |
| Investments in Securities: | | | | |
| Common Stocks | $348,334,277 | $348,334,277 | $-- | $-- |
| Money Market Funds | 9,428,792 | 9,428,792 | -- | -- |
| Total Investments in Securities: | $357,763,069 | $357,763,069 | $-- | $-- |
See accompanying notes which are an integral part of the financial statements.
Telecommunications Portfolio
Financial Statements
Statement of Assets and Liabilities
| | | February 28, 2021 |
| Assets | | |
Investment in securities, at value (including securities loaned of $6,587,776) — See accompanying schedule:
Unaffiliated issuers (cost $271,660,920) | $348,334,277 | |
| Fidelity Central Funds (cost $9,428,792) | 9,428,792 | |
| Total Investment in Securities (cost $281,089,712) | | $357,763,069 |
| Cash | | 171,544 |
| Receivable for fund shares sold | | 452,825 |
| Distributions receivable from Fidelity Central Funds | | 399 |
| Prepaid expenses | | 2,084 |
| Other receivables | | 5,160 |
| Total assets | | 358,395,081 |
| Liabilities | | |
| Payable for investments purchased | $171,544 | |
| Payable for fund shares redeemed | 145,953 | |
| Accrued management fee | 159,755 | |
| Distribution and service plan fees payable | 17,004 | |
| Other affiliated payables | 63,535 | |
| Other payables and accrued expenses | 177,935 | |
| Collateral on securities loaned | 6,843,200 | |
| Total liabilities | | 7,578,926 |
| Net Assets | | $350,816,155 |
| Net Assets consist of: | | |
| Paid in capital | | $266,662,088 |
| Total accumulated earnings (loss) | | 84,154,067 |
| Net Assets | | $350,816,155 |
| Net Asset Value and Maximum Offering Price | | |
| Class A: | | |
| Net Asset Value and redemption price per share ($29,799,762 ÷ 447,981 shares)(a) | | $66.52 |
| Maximum offering price per share (100/94.25 of $66.52) | | $70.58 |
| Class M: | | |
| Net Asset Value and redemption price per share ($9,038,137 ÷ 136,758 shares)(a) | | $66.09 |
| Maximum offering price per share (100/96.50 of $66.09) | | $68.49 |
| Class C: | | |
| Net Asset Value and offering price per share ($7,800,865 ÷ 117,891 shares)(a) | | $66.17 |
| Telecommunications: | | |
| Net Asset Value, offering price and redemption price per share ($242,284,100 ÷ 3,614,157 shares) | | $67.04 |
| Class I: | | |
| Net Asset Value, offering price and redemption price per share ($30,622,103 ÷ 458,140 shares) | | $66.84 |
| Class Z: | | |
| Net Asset Value, offering price and redemption price per share ($31,271,188 ÷ 468,494 shares) | | $66.75 |
(a) Redemption price per share is equal to net asset value less any applicable contingent deferred sales charge.
See accompanying notes which are an integral part of the financial statements.
Statement of Operations
| | | Year ended February 28, 2021 |
| Investment Income | | |
| Dividends | | $6,934,336 |
| Income from Fidelity Central Funds (including $15,498 from security lending) | | 20,098 |
| Total income | | 6,954,434 |
| Expenses | | |
| Management fee | $1,753,778 | |
| Transfer agent fees | 594,799 | |
| Distribution and service plan fees | 174,779 | |
| Accounting fees | 128,751 | |
| Custodian fees and expenses | 15,528 | |
| Independent trustees' fees and expenses | 1,793 | |
| Registration fees | 93,207 | |
| Audit | 51,250 | |
| Legal | 358 | |
| Interest | 140 | |
| Miscellaneous | 10,914 | |
| Total expenses before reductions | 2,825,297 | |
| Expense reductions | (48,056) | |
| Total expenses after reductions | | 2,777,241 |
| Net investment income (loss) | | 4,177,193 |
| Realized and Unrealized Gain (Loss) | | |
| Net realized gain (loss) on: | | |
| Investment securities: | | |
| Unaffiliated issuers (net of foreign taxes of $867,549) | 27,958,663 | |
| Fidelity Central Funds | (500) | |
| Foreign currency transactions | (59,638) | |
| Total net realized gain (loss) | | 27,898,525 |
| Change in net unrealized appreciation (depreciation) on: | | |
| Investment securities: | | |
| Unaffiliated issuers (net of increase in deferred foreign taxes of $136,578) | 25,042,142 | |
| Fidelity Central Funds | (91) | |
| Assets and liabilities in foreign currencies | (4,188) | |
| Total change in net unrealized appreciation (depreciation) | | 25,037,863 |
| Net gain (loss) | | 52,936,388 |
| Net increase (decrease) in net assets resulting from operations | | $57,113,581 |
See accompanying notes which are an integral part of the financial statements.
Statement of Changes in Net Assets
| | Year ended February 28, 2021 | Year ended February 29, 2020 |
| Increase (Decrease) in Net Assets | | |
| Operations | | |
| Net investment income (loss) | $4,177,193 | $5,137,407 |
| Net realized gain (loss) | 27,898,525 | 16,201,250 |
| Change in net unrealized appreciation (depreciation) | 25,037,863 | 12,375,034 |
| Net increase (decrease) in net assets resulting from operations | 57,113,581 | 33,713,691 |
| Distributions to shareholders | (27,468,287) | (9,566,584) |
| Share transactions - net increase (decrease) | 28,880,302 | (18,459,242) |
| Total increase (decrease) in net assets | 58,525,596 | 5,687,865 |
| Net Assets | | |
| Beginning of period | 292,290,559 | 286,602,694 |
| End of period | $350,816,155 | $292,290,559 |
See accompanying notes which are an integral part of the financial statements.
Financial Highlights
Telecommunications Portfolio Class A
| Years ended February 28, | 2021 | 2020 A | 2019 | 2018 | 2017 |
| Selected Per–Share Data | | | | | |
| Net asset value, beginning of period | $60.60 | $55.68 | $55.58 | $69.61 | $62.32 |
| Income from Investment Operations | | | | | |
| Net investment income (loss)B | .66 | .87 | 1.10C | 1.05 | .88 |
| Net realized and unrealized gain (loss) | 10.61 | 5.86 | .56 | (3.38) | 10.68 |
| Total from investment operations | 11.27 | 6.73 | 1.66 | (2.33) | 11.56 |
| Distributions from net investment income | (.39) | (.96) | (.94) | (1.31) | (1.11) |
| Distributions from net realized gain | (4.96) | (.85) | (.62) | (10.39) | (3.16) |
| Total distributions | (5.35) | (1.81) | (1.56) | (11.70) | (4.27) |
| Redemption fees added to paid in capitalB | – | – | – | – | –D |
| Net asset value, end of period | $66.52 | $60.60 | $55.68 | $55.58 | $69.61 |
| Total ReturnE,F | 18.75% | 12.12% | 3.03% | (4.06)% | 18.65% |
| Ratios to Average Net AssetsG,H | | | | | |
| Expenses before reductions | 1.11% | 1.18% | 1.18% | 1.14% | 1.14% |
| Expenses net of fee waivers, if any | 1.11% | 1.17% | 1.17% | 1.14% | 1.14% |
| Expenses net of all reductions | 1.10% | 1.17% | 1.16% | 1.12% | 1.12% |
| Net investment income (loss) | 1.01% | 1.47% | 1.96%C | 1.59% | 1.28% |
| Supplemental Data | | | | | |
| Net assets, end of period (000 omitted) | $29,800 | $21,376 | $20,589 | $17,816 | $31,966 |
| Portfolio turnover rateI | 58% | 58% | 64%J | 66% | 105%J |
A For the year ended February 29.
B Calculated based on average shares outstanding during the period.
C Net investment income per share reflects one or more large, non-recurring dividend(s) which amounted to $.25 per share. Excluding such non-recurring dividend(s), the ratio of net investment income (loss) to average net assets would have been 1.52%.
D Amount represents less than $.005 per share.
E Total returns would have been lower if certain expenses had not been reduced during the applicable periods shown.
F Total returns do not include the effect of the sales charges.
G Fees and expenses of any underlying mutual funds or exchange-traded funds (ETFs) are not included in the Fund's expense ratio. The Fund indirectly bears its proportionate share of these expenses. For additional expense information related to investments in Fidelity Central Funds, please refer to the "Investments in Fidelity Central Funds" note found in the Notes to Financial Statements section of the most recent Annual or Semi-Annual report.
H Expense ratios reflect operating expenses of the class. Expenses before reductions do not reflect amounts reimbursed, waived, or reduced through arrangements with the investment adviser, brokerage services, or other offset arrangements, if applicable, and do not represent the amount paid by the class during periods when reimbursements, waivers or reductions occur.
I Amount does not include the portfolio activity of any underlying mutual funds or exchange-traded funds (ETFs).
J Portfolio turnover rate excludes securities received or delivered in-kind.
See accompanying notes which are an integral part of the financial statements.
Telecommunications Portfolio Class M
| Years ended February 28, | 2021 | 2020 A | 2019 | 2018 | 2017 |
| Selected Per–Share Data | | | | | |
| Net asset value, beginning of period | $60.25 | $55.40 | $55.31 | $69.33 | $61.95 |
| Income from Investment Operations | | | | | |
| Net investment income (loss)B | .46 | .70 | .92C | .81 | .65 |
| Net realized and unrealized gain (loss) | 10.54 | 5.83 | .55 | (3.36) | 10.62 |
| Total from investment operations | 11.00 | 6.53 | 1.47 | (2.55) | 11.27 |
| Distributions from net investment income | (.20) | (.83) | (.76) | (1.07) | (.73) |
| Distributions from net realized gain | (4.96) | (.85) | (.62) | (10.39) | (3.16) |
| Total distributions | (5.16) | (1.68) | (1.38) | (11.47)D | (3.89) |
| Redemption fees added to paid in capitalB | – | – | – | – | –E |
| Net asset value, end of period | $66.09 | $60.25 | $55.40 | $55.31 | $69.33 |
| Total ReturnF,G | 18.39% | 11.81% | 2.69% | (4.40)% | 18.26% |
| Ratios to Average Net AssetsH,I | | | | | |
| Expenses before reductions | 1.41% | 1.46% | 1.50% | 1.49% | 1.46% |
| Expenses net of fee waivers, if any | 1.41% | 1.46% | 1.49% | 1.49% | 1.46% |
| Expenses net of all reductions | 1.40% | 1.45% | 1.48% | 1.48% | 1.44% |
| Net investment income (loss) | .71% | 1.19% | 1.64%C | 1.24% | .96% |
| Supplemental Data | | | | | |
| Net assets, end of period (000 omitted) | $9,038 | $6,919 | $6,018 | $4,847 | $6,933 |
| Portfolio turnover rateJ | 58% | 58% | 64%K | 66% | 105%K |
A For the year ended February 29.
B Calculated based on average shares outstanding during the period.
C Net investment income per share reflects one or more large, non-recurring dividend(s) which amounted to $.25 per share. Excluding such non-recurring dividend(s), the ratio of net investment income (loss) to average net assets would have been 1.19%.
D Total distributions per share do not sum due to rounding.
E Amount represents less than $.005 per share.
F Total returns would have been lower if certain expenses had not been reduced during the applicable periods shown.
G Total returns do not include the effect of the sales charges.
H Fees and expenses of any underlying mutual funds or exchange-traded funds (ETFs) are not included in the Fund's expense ratio. The Fund indirectly bears its proportionate share of these expenses. For additional expense information related to investments in Fidelity Central Funds, please refer to the "Investments in Fidelity Central Funds" note found in the Notes to Financial Statements section of the most recent Annual or Semi-Annual report.
I Expense ratios reflect operating expenses of the class. Expenses before reductions do not reflect amounts reimbursed, waived, or reduced through arrangements with the investment adviser, brokerage services, or other offset arrangements, if applicable, and do not represent the amount paid by the class during periods when reimbursements, waivers or reductions occur.
J Amount does not include the portfolio activity of any underlying mutual funds or exchange-traded funds (ETFs).
K Portfolio turnover rate excludes securities received or delivered in-kind.
See accompanying notes which are an integral part of the financial statements.
Telecommunications Portfolio Class C
| Years ended February 28, | 2021 | 2020 A | 2019 | 2018 | 2017 |
| Selected Per–Share Data | | | | | |
| Net asset value, beginning of period | $60.32 | $55.45 | $55.29 | $69.24 | $62.10 |
| Income from Investment Operations | | | | | |
| Net investment income (loss)B | .17 | .46 | .70C | .57 | .37 |
| Net realized and unrealized gain (loss) | 10.54 | 5.82 | .56 | (3.36) | 10.62 |
| Total from investment operations | 10.71 | 6.28 | 1.26 | (2.79) | 10.99 |
| Distributions from net investment income | (.07) | (.56) | (.48) | (.77) | (.69) |
| Distributions from net realized gain | (4.79) | (.85) | (.62) | (10.39) | (3.16) |
| Total distributions | (4.86) | (1.41) | (1.10) | (11.16) | (3.85) |
| Redemption fees added to paid in capitalB | – | – | – | – | –D |
| Net asset value, end of period | $66.17 | $60.32 | $55.45 | $55.29 | $69.24 |
| Total ReturnE,F | 17.88% | 11.34% | 2.30% | (4.75)% | 17.77% |
| Ratios to Average Net AssetsG,H | | | | | |
| Expenses before reductions | 1.86% | 1.88% | 1.88% | 1.86% | 1.88% |
| Expenses net of fee waivers, if any | 1.86% | 1.87% | 1.88% | 1.86% | 1.88% |
| Expenses net of all reductions | 1.84% | 1.87% | 1.86% | 1.85% | 1.86% |
| Net investment income (loss) | .26% | .77% | 1.26%C | .87% | .54% |
| Supplemental Data | | | | | |
| Net assets, end of period (000 omitted) | $7,801 | $6,491 | $6,994 | $8,396 | $13,528 |
| Portfolio turnover rateI | 58% | 58% | 64%J | 66% | 105%J |
A For the year ended February 29.
B Calculated based on average shares outstanding during the period.
C Net investment income per share reflects one or more large, non-recurring dividend(s) which amounted to $.25 per share. Excluding such non-recurring dividend(s), the ratio of net investment income (loss) to average net assets would have been .81%.
D Amount represents less than $.005 per share.
E Total returns would have been lower if certain expenses had not been reduced during the applicable periods shown.
F Total returns do not include the effect of the contingent deferred sales charge.
G Fees and expenses of any underlying mutual funds or exchange-traded funds (ETFs) are not included in the Fund's expense ratio. The Fund indirectly bears its proportionate share of these expenses. For additional expense information related to investments in Fidelity Central Funds, please refer to the "Investments in Fidelity Central Funds" note found in the Notes to Financial Statements section of the most recent Annual or Semi-Annual report.
H Expense ratios reflect operating expenses of the class. Expenses before reductions do not reflect amounts reimbursed, waived, or reduced through arrangements with the investment adviser, brokerage services, or other offset arrangements, if applicable, and do not represent the amount paid by the class during periods when reimbursements, waivers or reductions occur.
I Amount does not include the portfolio activity of any underlying mutual funds or exchange-traded funds (ETFs).
J Portfolio turnover rate excludes securities received or delivered in-kind.
See accompanying notes which are an integral part of the financial statements.
Telecommunications Portfolio
| Years ended February 28, | 2021 | 2020 A | 2019 | 2018 | 2017 |
| Selected Per–Share Data | | | | | |
| Net asset value, beginning of period | $60.99 | $56.04 | $55.88 | $69.97 | $62.58 |
| Income from Investment Operations | | | | | |
| Net investment income (loss)B | .86 | 1.09 | 1.30C | 1.28 | 1.12 |
| Net realized and unrealized gain (loss) | 10.71 | 5.90 | .56 | (3.42) | 10.74 |
| Total from investment operations | 11.57 | 6.99 | 1.86 | (2.14) | 11.86 |
| Distributions from net investment income | (.57) | (1.19) | (1.08) | (1.56) | (1.31) |
| Distributions from net realized gain | (4.96) | (.85) | (.62) | (10.39) | (3.16) |
| Total distributions | (5.52)D | (2.04) | (1.70) | (11.95) | (4.47) |
| Redemption fees added to paid in capitalB | – | – | – | – | –E |
| Net asset value, end of period | $67.04 | $60.99 | $56.04 | $55.88 | $69.97 |
| Total ReturnF | 19.15% | 12.50% | 3.38% | (3.76)% | 19.06% |
| Ratios to Average Net AssetsG,H | | | | | |
| Expenses before reductions | .81% | .83% | .84% | .82% | .80% |
| Expenses net of fee waivers, if any | .81% | .82% | .83% | .82% | .80% |
| Expenses net of all reductions | .79% | .82% | .82% | .80% | .78% |
| Net investment income (loss) | 1.31% | 1.82% | 2.30%C | 1.92% | 1.62% |
| Supplemental Data | | | | | |
| Net assets, end of period (000 omitted) | $242,284 | $219,854 | $227,438 | $320,908 | $690,720 |
| Portfolio turnover rateI | 58% | 58% | 64%J | 66% | 105%J |
A For the year ended February 29.
B Calculated based on average shares outstanding during the period.
C Net investment income per share reflects one or more large, non-recurring dividend(s) which amounted to $.25 per share. Excluding such non-recurring dividend(s), the ratio of net investment income (loss) to average net assets would have been 1.85%.
D Total distributions per share do not sum due to rounding.
E Amount represents less than $.005 per share.
F Total returns would have been lower if certain expenses had not been reduced during the applicable periods shown.
G Fees and expenses of any underlying mutual funds or exchange-traded funds (ETFs) are not included in the Fund's expense ratio. The Fund indirectly bears its proportionate share of these expenses. For additional expense information related to investments in Fidelity Central Funds, please refer to the "Investments in Fidelity Central Funds" note found in the Notes to Financial Statements section of the most recent Annual or Semi-Annual report.
H Expense ratios reflect operating expenses of the class. Expenses before reductions do not reflect amounts reimbursed, waived, or reduced through arrangements with the investment adviser, brokerage services, or other offset arrangements, if applicable, and do not represent the amount paid by the class during periods when reimbursements, waivers or reductions occur.
I Amount does not include the portfolio activity of any underlying mutual funds or exchange-traded funds (ETFs).
J Portfolio turnover rate excludes securities received or delivered in-kind.
See accompanying notes which are an integral part of the financial statements.
Telecommunications Portfolio Class I
| Years ended February 28, | 2021 | 2020 A | 2019 | 2018 | 2017 |
| Selected Per–Share Data | | | | | |
| Net asset value, beginning of period | $60.86 | $55.84 | $55.74 | $69.82 | $62.46 |
| Income from Investment Operations | | | | | |
| Net investment income (loss)B | .88 | 1.04 | 1.27C | 1.26 | 1.12 |
| Net realized and unrealized gain (loss) | 10.66 | 5.91 | .57 | (3.39) | 10.70 |
| Total from investment operations | 11.54 | 6.95 | 1.84 | (2.13) | 11.82 |
| Distributions from net investment income | (.60) | (1.08) | (1.12) | (1.56) | (1.30) |
| Distributions from net realized gain | (4.96) | (.85) | (.62) | (10.39) | (3.16) |
| Total distributions | (5.56) | (1.93) | (1.74) | (11.95) | (4.46) |
| Redemption fees added to paid in capitalB | – | – | – | – | –D |
| Net asset value, end of period | $66.84 | $60.86 | $55.84 | $55.74 | $69.82 |
| Total ReturnE | 19.13% | 12.47% | 3.35% | (3.75)% | 19.03% |
| Ratios to Average Net AssetsF,G | | | | | |
| Expenses before reductions | .79% | .88% | .91% | .82% | .80% |
| Expenses net of fee waivers, if any | .79% | .88% | .90% | .82% | .80% |
| Expenses net of all reductions | .78% | .88% | .88% | .80% | .78% |
| Net investment income (loss) | 1.33% | 1.76% | 2.23%C | 1.91% | 1.62% |
| Supplemental Data | | | | | |
| Net assets, end of period (000 omitted) | $30,622 | $12,428 | $25,181 | $8,332 | $14,550 |
| Portfolio turnover rateH | 58% | 58% | 64%I | 66% | 105%I |
A For the year ended February 29.
B Calculated based on average shares outstanding during the period.
C Net investment income per share reflects one or more large, non-recurring dividend(s) which amounted to $.25 per share. Excluding such non-recurring dividend(s), the ratio of net investment income (loss) to average net assets would have been 1.79%.
D Amount represents less than $.005 per share.
E Total returns would have been lower if certain expenses had not been reduced during the applicable periods shown.
F Fees and expenses of any underlying mutual funds or exchange-traded funds (ETFs) are not included in the Fund's expense ratio. The Fund indirectly bears its proportionate share of these expenses. For additional expense information related to investments in Fidelity Central Funds, please refer to the "Investments in Fidelity Central Funds" note found in the Notes to Financial Statements section of the most recent Annual or Semi-Annual report.
G Expense ratios reflect operating expenses of the class. Expenses before reductions do not reflect amounts reimbursed, waived, or reduced through arrangements with the investment adviser, brokerage services, or other offset arrangements, if applicable, and do not represent the amount paid by the class during periods when reimbursements, waivers or reductions occur.
H Amount does not include the portfolio activity of any underlying mutual funds or exchange-traded funds (ETFs).
I Portfolio turnover rate excludes securities received or delivered in-kind.
See accompanying notes which are an integral part of the financial statements.
Telecommunications Portfolio Class Z
| Years ended February 28, | 2021 | 2020 A | 2019 B |
| Selected Per–Share Data | | | |
| Net asset value, beginning of period | $60.75 | $55.84 | $60.97 |
| Income from Investment Operations | | | |
| Net investment income (loss)C | .95 | 1.20 | .39D |
| Net realized and unrealized gain (loss) | 10.67 | 5.86 | (4.55) |
| Total from investment operations | 11.62 | 7.06 | (4.16) |
| Distributions from net investment income | (.67) | (1.30) | (.97) |
| Distributions from net realized gain | (4.96) | (.85) | – |
| Total distributions | (5.62)E | (2.15) | (.97) |
| Net asset value, end of period | $66.75 | $60.75 | $55.84 |
| Total ReturnF,G | 19.31% | 12.68% | (6.80)% |
| Ratios to Average Net AssetsH,I | | | |
| Expenses before reductions | .67% | .68% | .68%J |
| Expenses net of fee waivers, if any | .67% | .67% | .66%J |
| Expenses net of all reductions | .65% | .67% | .64%J |
| Net investment income (loss) | 1.45% | 1.97% | 1.67%D,J |
| Supplemental Data | | | |
| Net assets, end of period (000 omitted) | $31,271 | $25,223 | $383 |
| Portfolio turnover rateK | 58% | 58% | 64%L |
A For the year ended February 29.
B For the period October 2, 2018 (commencement of sale of shares) to February 28, 2019.
C Calculated based on average shares outstanding during the period.
D Net investment income per share reflects one or more large, non-recurring dividend(s) which amounted to $.10 per share. Excluding such non-recurring dividend(s), the ratio of net investment income (loss) to average net assets would have been 1.23%.
E Total distributions per share do not sum due to rounding.
F Total returns for periods of less than one year are not annualized.
G Total returns would have been lower if certain expenses had not been reduced during the applicable periods shown.
H Fees and expenses of any underlying mutual funds or exchange-traded funds (ETFs) are not included in the Fund's expense ratio. The Fund indirectly bears its proportionate share of these expenses. For additional expense information related to investments in Fidelity Central Funds, please refer to the "Investments in Fidelity Central Funds" note found in the Notes to Financial Statements section of the most recent Annual or Semi-Annual report.
I Expense ratios reflect operating expenses of the class. Expenses before reductions do not reflect amounts reimbursed, waived, or reduced through arrangements with the investment adviser, brokerage services, or other offset arrangements, if applicable, and do not represent the amount paid by the class during periods when reimbursements, waivers or reductions occur.
J Annualized
K Amount does not include the portfolio activity of any underlying mutual funds or exchange-traded funds (ETFs).
L Portfolio turnover rate excludes securities received or delivered in-kind.
See accompanying notes which are an integral part of the financial statements.
Notes to Financial Statements
For the period ended February 28, 2021
1. Organization.
Telecommunications Portfolio (the Fund) is a non-diversified fund of Fidelity Select Portfolios (the Trust) and is authorized to issue an unlimited number of shares. The Trust is registered under the Investment Company Act of 1940, as amended (the 1940 Act), as an open-end management investment company organized as a Massachusetts business trust. The Fund invests primarily in securities of companies whose principal business activities fall within specific industries. The Fund offers Class A, Class M, Class C, Telecommunications, Class I and Class Z shares, each of which has equal rights as to assets and voting privileges. Each class has exclusive voting rights with respect to matters that affect that class. Class C shares will automatically convert to Class A shares after a holding period of ten years from the initial date of purchase, with certain exceptions.
2. Investments in Fidelity Central Funds.
The Fund invests in Fidelity Central Funds, which are open-end investment companies generally available only to other investment companies and accounts managed by the investment adviser and its affiliates. The Fund's Schedule of Investments lists each of the Fidelity Central Funds held as of period end, if any, as an investment of the Fund, but does not include the underlying holdings of each Fidelity Central Fund. As an Investing Fund, the Fund indirectly bears its proportionate share of the expenses of the underlying Fidelity Central Funds.
The Money Market Central Funds seek preservation of capital and current income and are managed by the investment adviser. Annualized expenses of the Money Market Central Funds as of their most recent shareholder report date ranged from less than .005% to .01%.
A complete unaudited list of holdings for each Fidelity Central Fund is available upon request or at the Securities and Exchange Commission (the SEC) website at www.sec.gov. In addition, the financial statements of the Fidelity Central Funds, which are not covered by the Fund's Report of Independent Registered Public Accounting Firm, are available on the SEC website or upon request.
3. Significant Accounting Policies.
The Fund is an investment company and applies the accounting and reporting guidance of the Financial Accounting Standards Board (FASB) Accounting Standards Codification Topic 946 Financial Services - Investment Companies. The financial statements have been prepared in conformity with accounting principles generally accepted in the United States of America (GAAP), which require management to make certain estimates and assumptions at the date of the financial statements. Actual results could differ from those estimates. Subsequent events, if any, through the date that the financial statements were issued have been evaluated in the preparation of the financial statements. The following summarizes the significant accounting policies of the Fund:
Investment Valuation. Investments are valued as of 4:00 p.m. Eastern time on the last calendar day of the period. The Board of Trustees (the Board) has delegated the day to day responsibility for the valuation of the Fund's investments to the Fair Value Committee (the Committee) established by the Fund's investment adviser. In accordance with valuation policies and procedures approved by the Board, the Fund attempts to obtain prices from one or more third party pricing vendors or brokers to value its investments. When current market prices, quotations or currency exchange rates are not readily available or reliable, investments will be fair valued in good faith by the Committee, in accordance with procedures adopted by the Board. Factors used in determining fair value vary by investment type and may include market or investment specific events. The frequency with which these procedures are used cannot be predicted and they may be utilized to a significant extent. The Committee oversees the Fund's valuation policies and procedures and reports to the Board on the Committee's activities and fair value determinations. The Board monitors the appropriateness of the procedures used in valuing the Fund's investments and ratifies the fair value determinations of the Committee.
The Fund categorizes the inputs to valuation techniques used to value its investments into a disclosure hierarchy consisting of three levels as shown below:
- Level 1 – quoted prices in active markets for identical investments
- Level 2 – other significant observable inputs (including quoted prices for similar investments, interest rates, prepayment speeds, etc.)
- Level 3 – unobservable inputs (including the Fund's own assumptions based on the best information available)
Valuation techniques used to value the Fund's investments by major category are as follows:
Equity securities, including restricted securities, for which market quotations are readily available, are valued at the last reported sale price or official closing price as reported by a third party pricing vendor on the primary market or exchange on which they are traded and are categorized as Level 1 in the hierarchy. In the event there were no sales during the day or closing prices are not available, securities are valued at the last quoted bid price or may be valued using the last available price and are generally categorized as Level 2 in the hierarchy. For foreign equity securities, when market or security specific events arise, comparisons to the valuation of American Depositary Receipts (ADRs), futures contracts, Exchange-Traded Funds (ETFs) and certain indexes as well as quoted prices for similar securities may be used and would be categorized as Level 2 in the hierarchy. For equity securities, including restricted securities, where observable inputs are limited, assumptions about market activity and risk are used and these securities may be categorized as Level 3 in the hierarchy.
Investments in open-end mutual funds, including the Fidelity Central Funds, are valued at their closing net asset value (NAV) each business day and are categorized as Level 1 in the hierarchy.
Changes in valuation techniques may result in transfers in or out of an assigned level within the disclosure hierarchy. The aggregate value of investments by input level as of February 28, 2021 is included at the end of the Fund's Schedule of Investments.
Foreign Currency. Certain Funds may use foreign currency contracts to facilitate transactions in foreign-denominated securities. Gains and losses from these transactions may arise from changes in the value of the foreign currency or if the counterparties do not perform under the contracts' terms.
Foreign-denominated assets, including investment securities, and liabilities are translated into U.S. dollars at the exchange rates at period end. Purchases and sales of investment securities, income and dividends received, and expenses denominated in foreign currencies are translated into U.S. dollars at the exchange rate in effect on the transaction date.
The effects of exchange rate fluctuations on investments are included with the net realized and unrealized gain (loss) on investment securities. Other foreign currency transactions resulting in realized and unrealized gain (loss) are disclosed separately.
Investment Transactions and Income. For financial reporting purposes, the Fund's investment holdings and NAV include trades executed through the end of the last business day of the period. The NAV per share for processing shareholder transactions is calculated as of the close of business of the New York Stock Exchange (NYSE), normally 4:00 p.m. Eastern time and includes trades executed through the end of the prior business day. Gains and losses on securities sold are determined on the basis of identified cost and include proceeds received from litigation. Dividend income is recorded on the ex-dividend date, except for certain dividends from foreign securities where the ex-dividend date may have passed, which are recorded as soon as the Fund is informed of the ex-dividend date. Non-cash dividends included in dividend income, if any, are recorded at the fair market value of the securities received. Income and capital gain distributions from Fidelity Central Funds, if any, are recorded on the ex-dividend date. Certain distributions received by the Fund represent a return of capital or capital gain. The Fund determines the components of these distributions subsequent to the ex-dividend date, based upon receipt of tax filings or other correspondence relating to the underlying investment. These distributions are recorded as a reduction of cost of investments and/or as a realized gain. Investment income is recorded net of foreign taxes withheld where recovery of such taxes is uncertain.
Class Allocations and Expenses. Investment income, realized and unrealized capital gains and losses, common expenses of the Fund, and certain fund-level expense reductions, if any, are allocated daily on a pro-rata basis to each class based on the relative net assets of each class to the total net assets of the Fund. Each class differs with respect to transfer agent and distribution and service plan fees incurred. Certain expense reductions may also differ by class. For the reporting period, the allocated portion of income and expenses to each class as a percent of its average net assets may vary due to the timing of recording these transactions in relation to fluctuating net assets of the classes. Expenses directly attributable to a fund are charged to that fund. Expenses attributable to more than one fund are allocated among the respective funds on the basis of relative net assets or other appropriate methods. Expense estimates are accrued in the period to which they relate and adjustments are made when actual amounts are known.
Income Tax Information and Distributions to Shareholders. Each year, the Fund intends to qualify as a regulated investment company under Subchapter M of the Internal Revenue Code, including distributing substantially all of its taxable income and realized gains. As a result, no provision for U.S. Federal income taxes is required. As of February 28, 2021, the Fund did not have any unrecognized tax benefits in the financial statements; nor is the Fund aware of any tax positions for which it is reasonably possible that the total amounts of unrecognized tax benefits will significantly change in the next twelve months. The Fund files a U.S. federal tax return, in addition to state and local tax returns as required. The Fund's federal income tax returns are subject to examination by the Internal Revenue Service (IRS) for a period of three fiscal years after they are filed. State and local tax returns may be subject to examination for an additional fiscal year depending on the jurisdiction. Foreign taxes are provided for based on the Fund's understanding of the tax rules and rates that exist in the foreign markets in which it invests. The Fund is subject to a tax imposed on capital gains by certain countries in which it invests. An estimated deferred tax liability for net unrealized appreciation on the applicable securities is included in Other payables and accrued expenses on the Statement of Assets & Liabilities.
Distributions are declared and recorded on the ex-dividend date. Income and capital gain distributions are declared separately for each class. Income and capital gain distributions are determined in accordance with income tax regulations, which may differ from GAAP.
Capital accounts within the financial statements are adjusted for permanent book-tax differences. These adjustments have no impact on net assets or the results of operations. Capital accounts are not adjusted for temporary book-tax differences which will reverse in a subsequent period.
Book-tax differences are primarily due to foreign currency transactions, certain foreign taxes and losses deferred due to wash sales.
As of period end, the cost and unrealized appreciation (depreciation) in securities, and derivatives if applicable, for federal income tax purposes were as follows:
| Gross unrealized appreciation | $92,645,287 |
| Gross unrealized depreciation | (18,010,428) |
| Net unrealized appreciation (depreciation) | $74,634,859 |
| Tax Cost | $283,128,210 |
The tax-based components of distributable earnings as of period end were as follows:
| Undistributed ordinary income | $2,765,785 |
| Undistributed long-term capital gain | $6,893,985 |
| Net unrealized appreciation (depreciation) on securities and other investments | $74,630,873 |
The tax character of distributions paid was as follows:
| | February 28, 2021 | February 29, 2020 |
| Ordinary Income | $17,358,721 | $ 5,516,461 |
| Long-term Capital Gains | 10,109,566 | 4,050,123 |
| Total | $27,468,287 | $ 9,566,584 |
4. Purchases and Sales of Investments.
Purchases and sales of securities, other than short-term securities, are noted in the table below.
| | Purchases ($) | Sales ($) |
| Telecommunications Portfolio | 193,859,064 | 188,539,751 |
5. Fees and Other Transactions with Affiliates.
Management Fee. Fidelity Management & Research Company LLC (the investment adviser) and its affiliates provide the Fund with investment management related services for which the Fund pays a monthly management fee. The management fee is the sum of an individual fund fee rate that is based on an annual rate of .30% of the Fund's average net assets and an annualized group fee rate that averaged .23% during the period. The group fee rate is based upon the monthly average net assets of a group of registered investment companies with which the investment adviser has management contracts. The group fee rate decreases as assets under management increase and increases as assets under management decrease. For the reporting period, the total annual management fee rate was .53% of the Fund's average net assets.
Distribution and Service Plan Fees. In accordance with Rule 12b-1 of the 1940 Act, the Fund has adopted separate Distribution and Service Plans for each class of shares. Certain classes pay Fidelity Distributors Company LLC (FDC), an affiliate of the investment adviser, separate Distribution and Service Fees, each of which is based on an annual percentage of each class' average net assets. In addition, FDC may pay financial intermediaries for selling shares of the Fund and providing shareholder support services. For the period, the Distribution and Service Fee rates, total fees and amounts retained by FDC were as follows:
| | Distribution Fee | Service Fee | Total Fees | Retained by FDC |
| Class A | -% | .25% | $61,629 | $2,167 |
| Class M | .25% | .25% | 39,134 | 130 |
| Class C | .75% | .25% | 74,016 | 15,985 |
| | | | $174,779 | $18,282 |
Sales Load. FDC may receive a front-end sales charge of up to 5.75% for selling Class A shares and 3.50% for selling Class M shares, some of which is paid to financial intermediaries for selling shares of the Fund. Depending on the holding period, FDC may receive contingent deferred sales charges levied on Class A, Class M and Class C redemptions. The deferred sales charges are 1.00% for Class C shares, 1.00% for certain purchases of Class A shares and .25% for certain purchases of Class M shares.
For the period, sales charge amounts retained by FDC were as follows:
| | Retained by FDC |
| Class A | $23,520 |
| Class M | 1,719 |
| Class C(a) | 826 |
| | $26,065 |
(a) When Class C shares are initially sold, FDC pays commissions from its own resources to financial intermediaries through which the sales are made.
Transfer Agent Fees. Fidelity Investments Institutional Operations Company LLC (FIIOC), an affiliate of the investment adviser, is the transfer, dividend disbursing and shareholder servicing agent for each class of the Fund. FIIOC receives account fees and asset-based fees that vary according to the account size and type of account of the shareholders of the respective classes of the Fund, except for Class Z. FIIOC receives an asset-based fee of Class Z's average net assets. FIIOC pays for typesetting, printing and mailing of shareholder reports, except proxy statements.
For the period, transfer agent fees for each class were as follows:
| | Amount | % of Class-Level Average Net Assets |
| Class A | $58,370 | .24 |
| Class M | 22,366 | .29 |
| Class C | 17,154 | .23 |
| Telecommunications | 444,137 | .19 |
| Class I | 40,185 | .17 |
| Class Z | 12,587 | .04 |
| | $594,799 | |
Accounting Fees. Fidelity Service Company, Inc. (FSC), an affiliate of the investment adviser, maintains the Fund's accounting records. The accounting fee is based on the level of average net assets for each month. For the period, the fees were equivalent to the following annual rates:
| | % of Average Net Assets |
| Telecommunications Portfolio | .04 |
Brokerage Commissions. A portion of portfolio transactions were placed with brokerage firms which are affiliates of the investment adviser. Brokerage commissions are included in net realized gain (loss) and change in net unrealized appreciation (depreciation) in the Statement of Operations. The commissions paid to these affiliated firms were as follows:
| | Amount |
| Telecommunications Portfolio | $11,439 |
Interfund Lending Program. Pursuant to an Exemptive Order issued by the SEC, the Fund, along with other registered investment companies having management contracts with Fidelity Management & Research Company LLC (FMR), or other affiliated entities of FMR, may participate in an interfund lending program. This program provides an alternative credit facility allowing the Fund to borrow from, or lend money to, other participating affiliated funds. At period end, there were no interfund loans outstanding. Activity in this program during the period for which loans were outstanding was as follows:
| | Borrower or Lender | Average Loan Balance | Weighted Average Interest Rate | Interest Expense |
| Telecommunications Portfolio | Borrower | $5,305,000 | .32% | $140 |
Interfund Trades. Funds may purchase from or sell securities to other Fidelity Funds under procedures adopted by the Board. The procedures have been designed to ensure these interfund trades are executed in accordance with Rule 17a-7 of the 1940 Act. Any interfund trades are included within the respective purchases and sales amounts shown in the Purchases and Sales of Investments note and are noted in the table below.
| | Purchases ($) | Sales ($) |
| Telecommunications Portfolio | 2,349,831 | 2,758,373 |
Other. During the period, the investment adviser reimbursed the Fund for certain losses in the amount of $9,181.
6. Committed Line of Credit.
Certain Funds participate with other funds managed by the investment adviser or an affiliate in a $4.25 billion credit facility (the "line of credit") to be utilized for temporary or emergency purposes to fund shareholder redemptions or for other short-term liquidity purposes. The participating funds have agreed to pay commitment fees on their pro-rata portion of the line of credit, which are reflected in Miscellaneous expenses on the Statement of Operations, and are listed below.
| | Amount |
| Telecommunications Portfolio | $721 |
During the period, there were no borrowings on this line of credit.
7. Security Lending.
Funds lend portfolio securities from time to time in order to earn additional income. Lending agents are used, including National Financial Services (NFS), an affiliate of the investment adviser. Pursuant to a securities lending agreement, NFS will receive a fee, which is capped at 9.9% of a fund's daily lending revenue, for its services as lending agent. A fund may lend securities to certain qualified borrowers, including NFS. On the settlement date of the loan, a fund receives collateral (in the form of U.S. Treasury obligations, letters of credit and/or cash) against the loaned securities and maintains collateral in an amount not less than 100% of the market value of the loaned securities during the period of the loan. The market value of the loaned securities is determined at the close of business of a fund and any additional required collateral is delivered to a fund on the next business day. A fund or borrower may terminate the loan at any time, and if the borrower defaults on its obligation to return the securities loaned because of insolvency or other reasons, a fund may apply collateral received from the borrower against the obligation. A fund may experience delays and costs in recovering the securities loaned. Any cash collateral received is invested in the Fidelity Securities Lending Cash Central Fund. Any loaned securities are identified as such in the Schedule of Investments, and the value of loaned securities and cash collateral at period end, as applicable, are presented in the Statement of Assets and Liabilities. Security lending income represents the income earned on investing cash collateral, less rebates paid to borrowers and any lending agent fees associated with the loan, plus any premium payments received for lending certain types of securities. Security lending income is presented in the Statement of Operations as a component of income from Fidelity Central Funds. Affiliated security lending activity, if any, was as follows:
| | Total Security Lending Income Fees Paid to NFS | Security Lending Income From Securities Loaned to NFS | Value of Securities Loaned to NFS at Period End |
| Telecommunications Portfolio | $1,094 | $– | $– |
8. Expense Reductions.
Commissions paid to certain brokers with whom the investment adviser, or its affiliates, places trades on behalf of the Fund include an amount in addition to trade execution, which may be rebated back to the Fund to offset expenses. This amount totaled $46,927 for the period.
In addition, during the period the investment adviser or an affiliate reimbursed and/or waived a portion of fund-level operating expenses in the amount of $1,129.
9. Distributions to Shareholders.
Distributions to shareholders of each class were as follows:
| | Year ended
February 28, 2021 | Year ended
February 29, 2020 |
| Distributions to shareholders | | |
| Class A | $2,060,688 | $604,045 |
| Class M | 618,358 | 187,105 |
| Class C | 543,576 | 153,979 |
| Telecommunications | 19,537,940 | 7,412,079 |
| Class I | 2,189,998 | 463,300 |
| Class Z | 2,517,727 | 746,076 |
| Total | $27,468,287 | $9,566,584 |
10. Share Transactions.
Share transactions for each class were as follows and may contain automatic conversions between classes or exchanges between affiliated funds:
| | Shares | Shares | Dollars | Dollars |
| | Year ended February 28, 2021 | Year ended February 29, 2020 | Year ended February 28, 2021 | Year ended February 29, 2020 |
| Class A | | | | |
| Shares sold | 237,010 | 131,076 | $15,495,311 | $7,742,577 |
| Reinvestment of distributions | 28,925 | 9,514 | 1,927,122 | 574,157 |
| Shares redeemed | (170,717) | (157,632) | (10,895,362) | (9,303,325) |
| Net increase (decrease) | 95,218 | (17,042) | $6,527,071 | $(986,591) |
| Class M | | | | |
| Shares sold | 67,415 | 39,034 | $4,343,394 | $2,290,232 |
| Reinvestment of distributions | 9,283 | 3,102 | 615,502 | 186,377 |
| Shares redeemed | (54,788) | (35,902) | (3,462,804) | (2,107,496) |
| Net increase (decrease) | 21,910 | 6,234 | $1,496,092 | $369,113 |
| Class C | | | | |
| Shares sold | 46,003 | 20,297 | $2,905,117 | $1,201,861 |
| Reinvestment of distributions | 8,022 | 2,359 | 531,076 | 141,967 |
| Shares redeemed | (43,758) | (41,159) | (2,786,911) | (2,410,442) |
| Net increase (decrease) | 10,267 | (18,503) | $649,282 | $(1,066,614) |
| Telecommunications | | | | |
| Shares sold | 1,081,282 | 518,015 | $67,328,134 | $31,128,263 |
| Reinvestment of distributions | 273,796 | 114,924 | 18,231,068 | 6,977,492 |
| Shares redeemed | (1,345,550) | (1,086,758) | (84,870,427) | (64,730,175) |
| Net increase (decrease) | 9,528 | (453,819) | $688,775 | $(26,624,420) |
| Class I | | | | |
| Shares sold | 484,027 | 156,686 | $30,288,296 | $9,424,886 |
| Reinvestment of distributions | 30,580 | 6,643 | 2,061,536 | 401,406 |
| Shares redeemed | (260,669) | (410,057) | (16,122,830) | (24,520,400) |
| Net increase (decrease) | 253,938 | (246,728) | $16,227,002 | $(14,694,108) |
| Class Z | | | | |
| Shares sold | 150,655 | 468,706 | $9,378,903 | $28,191,952 |
| Reinvestment of distributions | 25,742 | 9,319 | 1,706,940 | 565,974 |
| Shares redeemed | (123,085) | (69,698) | (7,793,763) | (4,214,548) |
| Net increase (decrease) | 53,312 | 408,327 | $3,292,080 | $24,543,378 |
11. Other.
The Fund's organizational documents provide former and current trustees and officers with a limited indemnification against liabilities arising in connection with the performance of their duties to the Fund. In the normal course of business, the Fund may also enter into contracts that provide general indemnifications. The Fund's maximum exposure under these arrangements is unknown as this would be dependent on future claims that may be made against the Fund. The risk of material loss from such claims is considered remote.
12. Coronavirus (COVID-19) Pandemic.
An outbreak of COVID-19 first detected in China during December 2019 has since spread globally and was declared a pandemic by the World Health Organization during March 2020. Developments that disrupt global economies and financial markets, such as the COVID-19 pandemic, may magnify factors that affect the Fund's performance.
Wireless Portfolio
Performance: The Bottom Line
Average annual total return reflects the change in the value of an investment, assuming reinvestment of distributions from dividend income and capital gains (the profits earned upon the sale of securities that have grown in value, if any) and assuming a constant rate of performance each year. The hypothetical investment and the average annual total returns do not reflect the deduction of taxes that a shareholder would pay on fund distributions or the redemption of fund shares. During periods of reimbursement by Fidelity, a fund’s total return will be greater than it would be had the reimbursement not occurred. How a fund did yesterday is no guarantee of how it will do tomorrow.
Average Annual Total Returns
| For the periods ended February 28, 2021 | Past 1 year | Past 5 years | Past 10 years |
| Wireless Portfolio | 36.09% | 19.53% | 12.39% |
$10,000 Over 10 Years
Let's say hypothetically that $10,000 was invested in Wireless Portfolio on February 28, 2011.
The chart shows how the value of your investment would have changed, and also shows how the S&P 500® Index performed over the same period.

| Period Ending Values |
| $32,144 | Wireless Portfolio |
| $35,259 | S&P 500® Index |
Wireless Portfolio
Management's Discussion of Fund Performance
Market Recap: The S&P 500
® index gained 31.29% for the 12 months ending February 28, 2021, a volatile but productive period for U.S. risk assets. The early-2020 outbreak and spread of COVID-19 resulted in stocks suffering one of the quickest declines on record, through March 23, followed by a historic rebound that included the index closing 2020 at an all-time high and gaining modest ground in the first two months of the new year. The crisis and containment efforts caused broad contraction in economic activity, along with extreme uncertainty and dislocation in financial markets. A rapid and expansive U.S. monetary/fiscal-policy response partially offset the economic disruption and fueled the market surge, as did resilient corporate earnings. The rally slowed in September, when stocks began a two-month retreat amid Congress’s inability to reach a deal on additional fiscal stimulus, as well as concerns about election uncertainty, indications the U.S. economic recovery could be slowing and a new wave of COVID-19 cases. A shift in momentum began in October and accelerated following the U.S. elections, with the approval of three breakthrough COVID-19 vaccines and prospects for additional government stimulus fueling the “reflation trade” through February 28. By sector for the full 12 months, information technology (+50%) and consumer discretionary (+43%) led all gainers. Materials (+42%) and communication services (+37%) also stood out. In contrast, the defensive utilities (-3%) and real estate sectors (+5%) notably lagged.
Comments from Portfolio Manager Matthew Drukker: For the fiscal year ending February 28, 2021, the fund gained 36.09%, outperforming the 26.31% advance of the Fidelity Wireless Index, as well as the broad-based S&P 500
® index. An underweighting and stock selection in integrated telecommunication services contributed notably to the fund’s relative result. Security selection and an underweighting in wireless telecommunication services and an overweighting in alternative carriers also aided the relative return. Among individual positions, an underweight position in AT&T (-15%) added more value than any other security choice. Elsewhere, the fund's non-index stakes in Reliance Industries (+104%) and Amazon.com (+63%) contributed. We reduced the fund’s Amazon stake by period end. Conversely, stock picks among alternative carriers, positioning in communications equipment firms and an underweighting in semiconductors hampered the fund’s relative performance. Looking at individual stocks, underweighting Qualcomm, which gained about 78% the past year, and holding a lighter-than-index stake in Apple (+79%) each detracted. Notable changes in fund positioning included increased exposure to the semiconductors subindustry and a lower allocation to integrated telecommunication services.
The views expressed above reflect those of the portfolio manager(s) only through the end of the period as stated on the cover of this report and do not necessarily represent the views of Fidelity or any other person in the Fidelity organization. Any such views are subject to change at any time based upon market or other conditions and Fidelity disclaims any responsibility to update such views. These views may not be relied on as investment advice and, because investment decisions for a Fidelity fund are based on numerous factors, may not be relied on as an indication of trading intent on behalf of any Fidelity fund.
Wireless Portfolio
Investment Summary (Unaudited)
Top Ten Stocks as of February 28, 2021
| | % of fund's net assets |
| Apple, Inc. | 13.7 |
| T-Mobile U.S., Inc. | 7.3 |
| AT&T, Inc. | 6.4 |
| Verizon Communications, Inc. | 6.3 |
| American Tower Corp. | 6.0 |
| Marvell Technology Group Ltd. | 4.3 |
| Qualcomm, Inc. | 4.0 |
| RingCentral, Inc. | 3.6 |
| Ericsson (B Shares) sponsored ADR | 3.4 |
| Qorvo, Inc. | 2.7 |
| | 57.7 |
Top Industries (% of fund's net assets)
| As of February 28, 2021 |
| | Diversified Telecommunication Services | 20.7% |
| | Technology Hardware, Storage & Peripherals | 15.9% |
| | Semiconductors & Semiconductor Equipment | 12.4% |
| | Wireless Telecommunication Services | 12.0% |
| | Communications Equipment | 10.2% |
| | All Others* | 28.8% |

* Includes short-term investments and net other assets (liabilities).
Wireless Portfolio
Schedule of Investments February 28, 2021
Showing Percentage of Net Assets
| Common Stocks - 99.3% | | | |
| | | Shares | Value |
| Communications Equipment - 10.2% | | | |
| Communications Equipment - 10.2% | | | |
| CommScope Holding Co., Inc. (a) | | 454,600 | $6,632,614 |
| Ericsson: | | | |
| (B Shares) | | 165,900 | 2,073,077 |
| (B Shares) sponsored ADR | | 1,204,300 | 15,089,879 |
| Lumentum Holdings, Inc. (a) | | 25,300 | 2,277,000 |
| Motorola Solutions, Inc. | | 44,268 | 7,768,149 |
| Nokia Corp. sponsored ADR (a)(b) | | 1,962,100 | 7,691,432 |
| ViaSat, Inc. (a)(b) | | 67,301 | 3,441,773 |
| | | | 44,973,924 |
| Diversified Telecommunication Services - 20.7% | | | |
| Alternative Carriers - 2.7% | | | |
| Anterix, Inc. (a) | | 30,700 | 1,296,461 |
| Iridium Communications, Inc. (a) | | 32,500 | 1,245,075 |
| Liberty Global PLC Class A (a) | | 264,700 | 6,518,238 |
| Liberty Latin America Ltd. Class C (a) | | 249,600 | 2,735,616 |
| | | | 11,795,390 |
| Integrated Telecommunication Services - 18.0% | | | |
| AT&T, Inc. | | 1,009,300 | 28,149,377 |
| Bezeq The Israel Telecommunication Corp. Ltd. (a) | | 5,321,700 | 5,162,453 |
| Cellnex Telecom SA (c) | | 64,800 | 3,522,209 |
| Orange SA ADR (b) | | 975,300 | 11,284,221 |
| Telefonica SA sponsored ADR (b) | | 722,737 | 3,136,679 |
| Verizon Communications, Inc. | | 506,001 | 27,981,855 |
| | | | 79,236,794 |
|
| TOTAL DIVERSIFIED TELECOMMUNICATION SERVICES | | | 91,032,184 |
|
| Entertainment - 3.1% | | | |
| Interactive Home Entertainment - 3.1% | | | |
| Activision Blizzard, Inc. | | 107,000 | 10,230,270 |
| Zynga, Inc. (a) | | 311,300 | 3,470,995 |
| | | | 13,701,265 |
| Movies & Entertainment - 0.0% | | | |
| Spotify Technology SA (a) | | 200 | 61,476 |
|
| TOTAL ENTERTAINMENT | | | 13,762,741 |
|
| Equity Real Estate Investment Trusts (REITs) - 8.1% | | | |
| Specialized REITs - 8.1% | | | |
| American Tower Corp. | | 121,392 | 26,236,453 |
| Crown Castle International Corp. | | 43,201 | 6,728,556 |
| SBA Communications Corp. Class A | | 11,200 | 2,857,456 |
| | | | 35,822,465 |
| Household Durables - 1.1% | | | |
| Consumer Electronics - 1.1% | | | |
| Sony Corp. | | 46,300 | 4,889,335 |
| Interactive Media & Services - 2.5% | | | |
| Interactive Media & Services - 2.5% | | | |
| Facebook, Inc. Class A (a) | | 42,900 | 11,051,898 |
| Internet & Direct Marketing Retail - 2.4% | | | |
| Internet & Direct Marketing Retail - 2.4% | | | |
| Amazon.com, Inc. (a) | | 2,200 | 6,804,446 |
| Doordash, Inc. (b) | | 20,900 | 3,542,341 |
| | | | 10,346,787 |
| Media - 1.7% | | | |
| Cable & Satellite - 1.7% | | | |
| DISH Network Corp. Class A (a) | | 119,249 | 3,757,536 |
| Liberty Broadband Corp. Class C (a) | | 26,134 | 3,907,294 |
| | | | 7,664,830 |
| Oil, Gas & Consumable Fuels - 1.6% | | | |
| Oil & Gas Refining & Marketing - 1.6% | | | |
| Reliance Industries Ltd. | | 243,900 | 6,880,542 |
| Road & Rail - 2.7% | | | |
| Trucking - 2.7% | | | |
| Lyft, Inc. (a) | | 210,300 | 11,713,710 |
| Semiconductors & Semiconductor Equipment - 12.4% | | | |
| Semiconductors - 12.4% | | | |
| Marvell Technology Group Ltd. | | 392,200 | 18,935,416 |
| NXP Semiconductors NV | | 33,600 | 6,133,680 |
| Qorvo, Inc. (a) | | 67,100 | 11,724,383 |
| Qualcomm, Inc. | | 130,850 | 17,820,462 |
| | | | 54,613,941 |
| Software - 4.9% | | | |
| Application Software - 4.9% | | | |
| LivePerson, Inc. (a)(b) | | 87,400 | 5,735,188 |
| RingCentral, Inc. (a) | | 41,700 | 15,769,272 |
| Viant Technology, Inc. | | 600 | 29,754 |
| Zoom Video Communications, Inc. Class A (a) | | 300 | 112,083 |
| | | | 21,646,297 |
| Technology Hardware, Storage & Peripherals - 15.9% | | | |
| Technology Hardware, Storage & Peripherals - 15.9% | | | |
| Apple, Inc. | | 497,820 | 60,365,651 |
| Samsung Electronics Co. Ltd. | | 133,520 | 9,769,539 |
| | | | 70,135,190 |
| Wireless Telecommunication Services - 12.0% | | | |
| Wireless Telecommunication Services - 12.0% | | | |
| Bharti Airtel Ltd. | | 691,800 | 5,205,085 |
| Millicom International Cellular SA (a)(b) | | 120,400 | 4,507,776 |
| Rogers Communications, Inc. Class B (non-vtg.) | | 101,400 | 4,392,725 |
| Shenandoah Telecommunications Co. | | 300 | 13,305 |
| Spok Holdings, Inc. | | 1 | 11 |
| T-Mobile U.S., Inc. | | 268,116 | 32,165,877 |
| Vodafone Group PLC sponsored ADR | | 370,181 | 6,359,710 |
| | | | 52,644,489 |
| TOTAL COMMON STOCKS | | | |
| (Cost $292,509,198) | | | 437,178,333 |
|
| Money Market Funds - 4.8% | | | |
| Fidelity Cash Central Fund 0.07% (d) | | 4,130,424 | 4,131,250 |
| Fidelity Securities Lending Cash Central Fund 0.08% (d)(e) | | 16,978,305 | 16,980,003 |
| TOTAL MONEY MARKET FUNDS | | | |
| (Cost $21,111,253) | | | 21,111,253 |
| TOTAL INVESTMENT IN SECURITIES - 104.1% | | | |
| (Cost $313,620,451) | | | 458,289,586 |
| NET OTHER ASSETS (LIABILITIES) - (4.1)% | | | (17,993,823) |
| NET ASSETS - 100% | | | $440,295,763 |
Legend
(a) Non-income producing
(b) Security or a portion of the security is on loan at period end.
(c) Security exempt from registration under Rule 144A of the Securities Act of 1933. These securities may be resold in transactions exempt from registration, normally to qualified institutional buyers. At the end of the period, the value of these securities amounted to $3,522,209 or 0.8% of net assets.
(d) Affiliated fund that is generally available only to investment companies and other accounts managed by Fidelity Investments. The rate quoted is the annualized seven-day yield of the fund at period end. A complete unaudited listing of the fund's holdings as of its most recent quarter end is available upon request. In addition, each Fidelity Central Fund's financial statements, which are not covered by the Fund's Report of Independent Registered Public Accounting Firm, are available on the SEC's website or upon request.
(e) Investment made with cash collateral received from securities on loan.
Affiliated Central Funds
Information regarding fiscal year to date income earned by the Fund from investments in Fidelity Central Funds is as follows:
| Fund | Income earned |
| Fidelity Cash Central Fund | $4,517 |
| Fidelity Securities Lending Cash Central Fund | 64,250 |
| Total | $68,767 |
Amounts in the income column in the above table include any capital gain distributions from underlying funds, which are presented in the corresponding line-item in the Statement of Operations, if applicable. Amount for Fidelity Securities Lending Cash Central Fund represents the income earned on investing cash collateral, less rebates paid to borrowers and any lending agent fees associated with the loan, plus any premium payments received for lending certain types of securities.
Investment Valuation
The following is a summary of the inputs used, as of February 28, 2021, involving the Fund's assets and liabilities carried at fair value. The inputs or methodology used for valuing securities may not be an indication of the risk associated with investing in those securities. For more information on valuation inputs, and their aggregation into the levels used below, please refer to the Investment Valuation section in the accompanying Notes to Financial Statements.
| | Valuation Inputs at Reporting Date: |
| Description | Total | Level 1 | Level 2 | Level 3 |
| Investments in Securities: | | | | |
| Common Stocks | $437,178,333 | $430,215,921 | $6,962,412 | $-- |
| Money Market Funds | 21,111,253 | 21,111,253 | -- | -- |
| Total Investments in Securities: | $458,289,586 | $451,327,174 | $6,962,412 | $-- |
Other Information
Distribution of investments by country or territory of incorporation, as a percentage of Total Net Assets, is as follows (Unaudited):
| United States of America | 72.7% |
| Bermuda | 4.9% |
| Sweden | 3.9% |
| United Kingdom | 3.0% |
| India | 2.8% |
| France | 2.6% |
| Korea (South) | 2.2% |
| Finland | 1.7% |
| Spain | 1.5% |
| Netherlands | 1.4% |
| Israel | 1.2% |
| Japan | 1.1% |
| Canada | 1.0% |
| Others (Individually Less Than 1%) | 0.0% |
| | 100.0% |
See accompanying notes which are an integral part of the financial statements.
Wireless Portfolio
Financial Statements
Statement of Assets and Liabilities
| | | February 28, 2021 |
| Assets | | |
Investment in securities, at value (including securities loaned of $16,561,463) — See accompanying schedule:
Unaffiliated issuers (cost $292,509,198) | $437,178,333 | |
| Fidelity Central Funds (cost $21,111,253) | 21,111,253 | |
| Total Investment in Securities (cost $313,620,451) | | $458,289,586 |
| Receivable for fund shares sold | | 550,604 |
| Dividends receivable | | 262,874 |
| Distributions receivable from Fidelity Central Funds | | 7,793 |
| Prepaid expenses | | 1,707 |
| Other receivables | | 24,467 |
| Total assets | | 459,137,031 |
| Liabilities | | |
| Payable for fund shares redeemed | $735,123 | |
| Accrued management fee | 202,110 | |
| Other affiliated payables | 81,530 | |
| Other payables and accrued expenses | 842,432 | |
| Collateral on securities loaned | 16,980,073 | |
| Total liabilities | | 18,841,268 |
| Net Assets | | $440,295,763 |
| Net Assets consist of: | | |
| Paid in capital | | $284,046,188 |
| Total accumulated earnings (loss) | | 156,249,575 |
| Net Assets | | $440,295,763 |
| Net Asset Value, offering price and redemption price per share ($440,295,763 ÷ 33,016,825 shares) | | $13.34 |
See accompanying notes which are an integral part of the financial statements.
Statement of Operations
| | | Year ended February 28, 2021 |
| Investment Income | | |
| Dividends | | $6,254,895 |
| Income from Fidelity Central Funds (including $64,250 from security lending) | | 68,767 |
| Total income | | 6,323,662 |
| Expenses | | |
| Management fee | $2,127,334 | |
| Transfer agent fees | 749,333 | |
| Accounting fees | 156,203 | |
| Custodian fees and expenses | 43,270 | |
| Independent trustees' fees and expenses | 2,155 | |
| Registration fees | 46,581 | |
| Audit | 44,695 | |
| Legal | 429 | |
| Interest | 271 | |
| Miscellaneous | 8,532 | |
| Total expenses before reductions | 3,178,803 | |
| Expense reductions | (58,580) | |
| Total expenses after reductions | | 3,120,223 |
| Net investment income (loss) | | 3,203,439 |
| Realized and Unrealized Gain (Loss) | | |
| Net realized gain (loss) on: | | |
| Investment securities: | | |
| Unaffiliated issuers (net of foreign taxes of $657,035) | 21,505,815 | |
| Fidelity Central Funds | (253) | |
| Foreign currency transactions | (41,086) | |
| Total net realized gain (loss) | | 21,464,476 |
| Change in net unrealized appreciation (depreciation) on: | | |
| Investment securities: | | |
| Unaffiliated issuers (net of increase in deferred foreign taxes of $783,707) | 92,667,248 | |
| Assets and liabilities in foreign currencies | 12,565 | |
| Total change in net unrealized appreciation (depreciation) | | 92,679,813 |
| Net gain (loss) | | 114,144,289 |
| Net increase (decrease) in net assets resulting from operations | | $117,347,728 |
See accompanying notes which are an integral part of the financial statements.
Statement of Changes in Net Assets
| | Year ended February 28, 2021 | Year ended February 29, 2020 |
| Increase (Decrease) in Net Assets | | |
| Operations | | |
| Net investment income (loss) | $3,203,439 | $4,155,382 |
| Net realized gain (loss) | 21,464,476 | 30,802,567 |
| Change in net unrealized appreciation (depreciation) | 92,679,813 | 19,583,994 |
| Net increase (decrease) in net assets resulting from operations | 117,347,728 | 54,541,943 |
| Distributions to shareholders | (30,160,728) | (9,722,332) |
| Share transactions | | |
| Proceeds from sales of shares | 151,879,800 | 170,798,888 |
| Reinvestment of distributions | 28,391,578 | 9,037,221 |
| Cost of shares redeemed | (182,471,304) | (107,253,657) |
| Net increase (decrease) in net assets resulting from share transactions | (2,199,926) | 72,582,452 |
| Total increase (decrease) in net assets | 84,987,074 | 117,402,063 |
| Net Assets | | |
| Beginning of period | 355,308,689 | 237,906,626 |
| End of period | $440,295,763 | $355,308,689 |
| Other Information | | |
| Shares | | |
| Sold | 12,945,504 | 16,059,963 |
| Issued in reinvestment of distributions | 2,648,817 | 812,700 |
| Redeemed | (15,799,791) | (10,283,730) |
| Net increase (decrease) | (205,470) | 6,588,933 |
See accompanying notes which are an integral part of the financial statements.
Financial Highlights
Wireless Portfolio
| | | | | | |
| Years ended February 28, | 2021 | 2020 A | 2019 | 2018 | 2017 |
| Selected Per–Share Data | | | | | |
| Net asset value, beginning of period | $10.69 | $8.93 | $10.29 | $9.11 | $7.85 |
| Income from Investment Operations | | | | | |
| Net investment income (loss)B | .10 | .14 | .20C | .16 | .10 |
| Net realized and unrealized gain (loss) | 3.50 | 1.93 | (.24)D | 1.39 | 1.71 |
| Total from investment operations | 3.60 | 2.07 | (.04) | 1.55 | 1.81 |
| Distributions from net investment income | (.10) | (.12) | (.19) | (.14) | (.09) |
| Distributions from net realized gain | (.86) | (.19) | (1.13) | (.24) | (.46) |
| Total distributions | (.95)E | (.31) | (1.32) | (.37)E | (.55) |
| Redemption fees added to paid in capitalB | – | – | – | –F | –F |
| Net asset value, end of period | $13.34 | $10.69 | $8.93 | $10.29 | $9.11 |
| Total ReturnG | 36.09% | 23.01% | .21%D | 17.21% | 24.09% |
| Ratios to Average Net AssetsH,I | | | | | |
| Expenses before reductions | .79% | .81% | .83% | .83% | .87% |
| Expenses net of fee waivers, if any | .79% | .81% | .83% | .83% | .87% |
| Expenses net of all reductions | .78% | .81% | .82% | .82% | .86% |
| Net investment income (loss) | .80% | 1.39% | 2.07%C | 1.61% | 1.23% |
| Supplemental Data | | | | | |
| Net assets, end of period (000 omitted) | $440,296 | $355,309 | $237,907 | $275,742 | $239,359 |
| Portfolio turnover rateJ | 55% | 78% | 54% | 85% | 98% |
A For the year ended February 29.
B Calculated based on average shares outstanding during the period.
C Net investment income per share reflects one or more large, non-recurring dividend(s) which amounted to $.03 per share. Excluding such non-recurring dividend(s), the ratio of net investment income (loss) to average net assets would have been 1.74%.
D Net realized and unrealized gain (loss) per share reflects proceeds received from litigation which amounted to $.01 per share. Excluding these litigation proceeds, the total return would have been .12%.
E Total distributions per share do not sum due to rounding.
F Amount represents less than $.005 per share.
G Total returns would have been lower if certain expenses had not been reduced during the applicable periods shown.
H Fees and expenses of any underlying mutual funds or exchange-traded funds (ETFs) are not included in the Fund's expense ratio. The Fund indirectly bears its proportionate share of these expenses. For additional expense information related to investments in Fidelity Central Funds, please refer to the "Investments in Fidelity Central Funds" note found in the Notes to Financial Statements section of the most recent Annual or Semi-Annual report.
I Expense ratios reflect operating expenses of the class. Expenses before reductions do not reflect amounts reimbursed, waived, or reduced through arrangements with the investment advisor, brokerage services, or other offset arrangements, if applicable, and do not represent the amount paid by the class during periods when reimbursements, waivers or reductions occur.
J Amount does not include the portfolio activity of any underlying mutual funds or exchange-traded funds (ETFs).
See accompanying notes which are an integral part of the financial statements.
Notes to Financial Statements
For the period ended February 28, 2021
1. Organization.
Wireless Portfolio (the Fund) is a non-diversified fund of Fidelity Select Portfolios (the Trust) and is authorized to issue an unlimited number of shares. Share transactions on the Statement of Changes in Net Assets may contain exchanges between affiliated funds. The Trust is registered under the Investment Company Act of 1940, as amended (the 1940 Act), as an open-end management investment company organized as a Massachusetts business trust. The Fund invests primarily in securities of companies whose principal business activities fall within specific industries.
2. Investments in Fidelity Central Funds.
The Fund invests in Fidelity Central Funds, which are open-end investment companies generally available only to other investment companies and accounts managed by the investment adviser and its affiliates. The Fund's Schedule of Investments lists each of the Fidelity Central Funds held as of period end, if any, as an investment of the Fund, but does not include the underlying holdings of each Fidelity Central Fund. As an Investing Fund, the Fund indirectly bears its proportionate share of the expenses of the underlying Fidelity Central Funds.
The Money Market Central Funds seek preservation of capital and current income and are managed by the investment adviser. Annualized expenses of the Money Market Central Funds as of their most recent shareholder report date ranged from less than .005% to .01%.
A complete unaudited list of holdings for each Fidelity Central Fund is available upon request or at the Securities and Exchange Commission (the SEC) website at www.sec.gov. In addition, the financial statements of the Fidelity Central Funds, which are not covered by the Fund's Report of Independent Registered Public Accounting Firm, are available on the SEC website or upon request.
3. Significant Accounting Policies.
The Fund is an investment company and applies the accounting and reporting guidance of the Financial Accounting Standards Board (FASB) Accounting Standards Codification Topic 946 Financial Services - Investment Companies. The financial statements have been prepared in conformity with accounting principles generally accepted in the United States of America (GAAP), which require management to make certain estimates and assumptions at the date of the financial statements. Actual results could differ from those estimates. Subsequent events, if any, through the date that the financial statements were issued have been evaluated in the preparation of the financial statements. The following summarizes the significant accounting policies of the Fund:
Investment Valuation. Investments are valued as of 4:00 p.m. Eastern time on the last calendar day of the period. The Board of Trustees (the Board) has delegated the day to day responsibility for the valuation of the Fund's investments to the Fair Value Committee (the Committee) established by the Fund's investment adviser. In accordance with valuation policies and procedures approved by the Board, the Fund attempts to obtain prices from one or more third party pricing vendors or brokers to value its investments. When current market prices, quotations or currency exchange rates are not readily available or reliable, investments will be fair valued in good faith by the Committee, in accordance with procedures adopted by the Board. Factors used in determining fair value vary by investment type and may include market or investment specific events. The frequency with which these procedures are used cannot be predicted and they may be utilized to a significant extent. The Committee oversees the Fund's valuation policies and procedures and reports to the Board on the Committee's activities and fair value determinations. The Board monitors the appropriateness of the procedures used in valuing the Fund's investments and ratifies the fair value determinations of the Committee.
The Fund categorizes the inputs to valuation techniques used to value its investments into a disclosure hierarchy consisting of three levels as shown below:
- Level 1 – quoted prices in active markets for identical investments
- Level 2 – other significant observable inputs (including quoted prices for similar investments, interest rates, prepayment speeds, etc.)
- Level 3 – unobservable inputs (including the Fund's own assumptions based on the best information available)
Valuation techniques used to value the Fund's investments by major category are as follows:
Equity securities, including restricted securities, for which market quotations are readily available, are valued at the last reported sale price or official closing price as reported by a third party pricing vendor on the primary market or exchange on which they are traded and are categorized as Level 1 in the hierarchy. In the event there were no sales during the day or closing prices are not available, securities are valued at the last quoted bid price or may be valued using the last available price and are generally categorized as Level 2 in the hierarchy. For foreign equity securities, when market or security specific events arise, comparisons to the valuation of American Depositary Receipts (ADRs), futures contracts, Exchange-Traded Funds (ETFs) and certain indexes as well as quoted prices for similar securities may be used and would be categorized as Level 2 in the hierarchy. For equity securities, including restricted securities, where observable inputs are limited, assumptions about market activity and risk are used and these securities may be categorized as Level 3 in the hierarchy.
Investments in open-end mutual funds, including the Fidelity Central Funds, are valued at their closing net asset value (NAV) each business day and are categorized as Level 1 in the hierarchy.
Changes in valuation techniques may result in transfers in or out of an assigned level within the disclosure hierarchy. The aggregate value of investments by input level as of February 28, 2021 is included at the end of the Fund's Schedule of Investments.
Foreign Currency. Certain Funds may use foreign currency contracts to facilitate transactions in foreign-denominated securities. Gains and losses from these transactions may arise from changes in the value of the foreign currency or if the counterparties do not perform under the contracts' terms.
Foreign-denominated assets, including investment securities, and liabilities are translated into U.S. dollars at the exchange rates at period end. Purchases and sales of investment securities, income and dividends received, and expenses denominated in foreign currencies are translated into U.S. dollars at the exchange rate in effect on the transaction date.
The effects of exchange rate fluctuations on investments are included with the net realized and unrealized gain (loss) on investment securities. Other foreign currency transactions resulting in realized and unrealized gain (loss) are disclosed separately.
Investment Transactions and Income. For financial reporting purposes, the Fund's investment holdings and NAV include trades executed through the end of the last business day of the period. The NAV per share for processing shareholder transactions is calculated as of the close of business of the New York Stock Exchange (NYSE), normally 4:00 p.m. Eastern time and includes trades executed through the end of the prior business day. Gains and losses on securities sold are determined on the basis of identified cost and include proceeds received from litigation. Dividend income is recorded on the ex-dividend date, except for certain dividends from foreign securities where the ex-dividend date may have passed, which are recorded as soon as the Fund is informed of the ex-dividend date. Non-cash dividends included in dividend income, if any, are recorded at the fair market value of the securities received. Income and capital gain distributions from Fidelity Central Funds, if any, are recorded on the ex-dividend date. Certain distributions received by the Fund represent a return of capital or capital gain. The Fund determines the components of these distributions subsequent to the ex-dividend date, based upon receipt of tax filings or other correspondence relating to the underlying investment. These distributions are recorded as a reduction of cost of investments and/or as a realized gain. Investment income is recorded net of foreign taxes withheld where recovery of such taxes is uncertain.
Expenses. Expenses directly attributable to a fund are charged to that fund. Expenses attributable to more than one fund are allocated among the respective funds on the basis of relative net assets or other appropriate methods. Expense estimates are accrued in the period to which they relate and adjustments are made when actual amounts are known.
Income Tax Information and Distributions to Shareholders. Each year, the Fund intends to qualify as a regulated investment company under Subchapter M of the Internal Revenue Code, including distributing substantially all of its taxable income and realized gains. As a result, no provision for U.S. Federal income taxes is required. As of February 28, 2021, the Fund did not have any unrecognized tax benefits in the financial statements; nor is the Fund aware of any tax positions for which it is reasonably possible that the total amounts of unrecognized tax benefits will significantly change in the next twelve months. The Fund files a U.S. federal tax return, in addition to state and local tax returns as required. The Fund's federal income tax returns are subject to examination by the Internal Revenue Service (IRS) for a period of three fiscal years after they are filed. State and local tax returns may be subject to examination for an additional fiscal year depending on the jurisdiction. Foreign taxes are provided for based on the Fund's understanding of the tax rules and rates that exist in the foreign markets in which it invests. The Fund is subject to a tax imposed on capital gains by certain countries in which it invests. An estimated deferred tax liability for net unrealized appreciation on the applicable securities is included in Other payables and accrued expenses on the Statement of Assets & Liabilities.
Distributions are declared and recorded on the ex-dividend date. Income and capital gain distributions are determined in accordance with income tax regulations, which may differ from GAAP. In addition, the Fund claimed a portion of the payment made to redeeming shareholders as a distribution for income tax purposes.
Capital accounts within the financial statements are adjusted for permanent book-tax differences. These adjustments have no impact on net assets or the results of operations. Capital accounts are not adjusted for temporary book-tax differences which will reverse in a subsequent period.
Book-tax differences are primarily due to foreign currency transactions, certain foreign taxes and losses deferred due to wash sales and excise tax regulations.
As of period end, the cost and unrealized appreciation (depreciation) in securities, and derivatives if applicable, for federal income tax purposes were as follows:
| Gross unrealized appreciation | $161,664,013 |
| Gross unrealized depreciation | (18,220,390) |
| Net unrealized appreciation (depreciation) | $143,443,623 |
| Tax Cost | $314,845,963 |
The tax-based components of distributable earnings as of period end were as follows:
| Undistributed ordinary income | $6,266,244 |
| Undistributed long-term capital gain | $7,435,492 |
| Net unrealized appreciation (depreciation) on securities and other investments | $143,440,092 |
The tax character of distributions paid was as follows:
| | February 28, 2021 | February 29, 2020 |
| Ordinary Income | $8,561,227 | $ 5,890,403 |
| Long-term Capital Gains | 21,599,501 | 3,831,929 |
| Total | $30,160,728 | $ 9,722,332 |
Restricted Securities (including Private Placements). The Fund may invest in securities that are subject to legal or contractual restrictions on resale. These securities generally may be resold in transactions exempt from registration or to the public if the securities are registered. Disposal of these securities may involve time-consuming negotiations and expense, and prompt sale at an acceptable price may be difficult. Information regarding restricted securities is included at the end of the Fund's Schedule of Investments.
4. Purchases and Sales of Investments.
Purchases and sales of securities, other than short-term securities, are noted in the table below.
| | Purchases ($) | Sales ($) |
| Wireless Portfolio | 218,379,985 | 252,519,796 |
5. Fees and Other Transactions with Affiliates.
Management Fee. Fidelity Management & Research Company LLC (the investment adviser) and its affiliates provide the Fund with investment management related services for which the Fund pays a monthly management fee. The management fee is the sum of an individual fund fee rate that is based on an annual rate of .30% of the Fund's average net assets and an annualized group fee rate that averaged .23% during the period. The group fee rate is based upon the monthly average net assets of a group of registered investment companies with which the investment adviser has management contracts. The group fee rate decreases as assets under management increase and increases as assets under management decrease. For the reporting period, the total annual management fee rate was .53% of the Fund's average net assets.
Transfer Agent Fees. Fidelity Investments Institutional Operations Company LLC (FIIOC), an affiliate of the investment adviser, is the Fund's transfer, dividend disbursing and shareholder servicing agent. FIIOC receives account fees and asset-based fees that vary according to account size and type of account. FIIOC pays for typesetting, printing and mailing of shareholder reports, except proxy statements. For the period, the transfer agent fees were equivalent to an annual rate of .19% of average net assets.
Accounting Fees. Fidelity Service Company, Inc. (FSC), an affiliate of the investment adviser, maintains the Fund's accounting records. The accounting fee is based on the level of average net assets for each month. For the period, the fees were equivalent to the following annual rates:
| | % of Average Net Assets |
| Wireless Portfolio | .04 |
Brokerage Commissions. A portion of portfolio transactions were placed with brokerage firms which are affiliates of the investment adviser. Brokerage commissions are included in net realized gain (loss) and change in net unrealized appreciation (depreciation) in the Statement of Operations. The commissions paid to these affiliated firms were as follows:
| | Amount |
| Wireless Portfolio | $6,371 |
Interfund Lending Program. Pursuant to an Exemptive Order issued by the SEC, the Fund, along with other registered investment companies having management contracts with Fidelity Management & Research Company LLC (FMR), or other affiliated entities of FMR, may participate in an interfund lending program. This program provides an alternative credit facility allowing the Fund to borrow from, or lend money to, other participating affiliated funds. At period end, there were no interfund loans outstanding. Activity in this program during the period for which loans were outstanding was as follows:
| | Borrower or Lender | Average Loan Balance | Weighted Average Interest Rate | Interest Expense |
| Wireless Portfolio | Borrower | $6,003,800 | .33% | $271 |
Interfund Trades. Funds may purchase from or sell securities to other Fidelity Funds under procedures adopted by the Board. The procedures have been designed to ensure these interfund trades are executed in accordance with Rule 17a-7 of the 1940 Act. Any interfund trades are included within the respective purchases and sales amounts shown in the Purchases and Sales of Investments note and are noted in the table below.
| | Purchases ($) | Sales ($) |
| Wireless Portfolio | 15,094,106 | 17,592,593 |
6. Committed Line of Credit.
Certain Funds participate with other funds managed by the investment adviser or an affiliate in a $4.25 billion credit facility (the "line of credit") to be utilized for temporary or emergency purposes to fund shareholder redemptions or for other short-term liquidity purposes. The participating funds have agreed to pay commitment fees on their pro-rata portion of the line of credit, which are reflected in Miscellaneous expenses on the Statement of Operations, and are listed below.
| | Amount |
| Wireless Portfolio | $879 |
During the period, there were no borrowings on this line of credit.
7. Security Lending.
Funds lend portfolio securities from time to time in order to earn additional income. Lending agents are used, including National Financial Services (NFS), an affiliate of the investment adviser. Pursuant to a securities lending agreement, NFS will receive a fee, which is capped at 9.9% of a fund's daily lending revenue, for its services as lending agent. A fund may lend securities to certain qualified borrowers, including NFS. On the settlement date of the loan, a fund receives collateral (in the form of U.S. Treasury obligations, letters of credit and/or cash) against the loaned securities and maintains collateral in an amount not less than 100% of the market value of the loaned securities during the period of the loan. The market value of the loaned securities is determined at the close of business of a fund and any additional required collateral is delivered to a fund on the next business day. A fund or borrower may terminate the loan at any time, and if the borrower defaults on its obligation to return the securities loaned because of insolvency or other reasons, a fund may apply collateral received from the borrower against the obligation. A fund may experience delays and costs in recovering the securities loaned. Any cash collateral received is invested in the Fidelity Securities Lending Cash Central Fund. Any loaned securities are identified as such in the Schedule of Investments, and the value of loaned securities and cash collateral at period end, as applicable, are presented in the Statement of Assets and Liabilities. Security lending income represents the income earned on investing cash collateral, less rebates paid to borrowers and any lending agent fees associated with the loan, plus any premium payments received for lending certain types of securities. Security lending income is presented in the Statement of Operations as a component of income from Fidelity Central Funds. Affiliated security lending activity, if any, was as follows:
| | Total Security Lending Income Fees Paid to NFS | Security Lending Income From Securities Loaned to NFS | Value of Securities Loaned to NFS at Period End |
| Wireless Portfolio | $5,607 | $1,496 | $– |
8. Expense Reductions.
Commissions paid to certain brokers with whom the investment adviser, or its affiliates, places trades on behalf of the Fund include an amount in addition to trade execution, which may be rebated back to the Fund to offset expenses. This amount totaled $57,199 for the period.
In addition, during the period the investment adviser or an affiliate reimbursed and/or waived a portion of operating expenses in the amount of $1,381.
9. Other.
The Fund's organizational documents provide former and current trustees and officers with a limited indemnification against liabilities arising in connection with the performance of their duties to the Fund. In the normal course of business, the Fund may also enter into contracts that provide general indemnifications. The Fund's maximum exposure under these arrangements is unknown as this would be dependent on future claims that may be made against the Fund. The risk of material loss from such claims is considered remote.
10. Coronavirus (COVID-19) Pandemic.
An outbreak of COVID-19 first detected in China during December 2019 has since spread globally and was declared a pandemic by the World Health Organization during March 2020. Developments that disrupt global economies and financial markets, such as the COVID-19 pandemic, may magnify factors that affect the Fund's performance.
Report of Independent Registered Public Accounting Firm
To the Board of Trustees of Fidelity Select Portfolios and the Shareholders of Telecommunications Portfolio and Wireless Portfolio
Opinions on the Financial Statements
We have audited the accompanying statements of assets and liabilities, including the schedules of investments, of Telecommunications Portfolio and Wireless Portfolio (two of the funds constituting Fidelity Select Portfolios, hereafter collectively referred to as the “Funds”) as of February 28, 2021, the related statements of operations for the year ended February 28, 2021, the statements of changes in net assets for each of the two years in the period ended February 28, 2021, including the related notes, and the financial highlights for each of the periods indicated therein (collectively referred to as the “financial statements”). In our opinion, the financial statements present fairly, in all material respects, the financial position of each of the Funds as of February 28, 2021, the results of each of their operations for the year then ended, the changes in each of their net assets for each of the two years in the period ended February 28, 2021 and each of the financial highlights for each of the periods indicated therein in conformity with accounting principles generally accepted in the United States of America.
Basis for Opinions
These financial statements are the responsibility of the Funds’ management. Our responsibility is to express an opinion on the Funds’ financial statements based on our audits. We are a public accounting firm registered with the Public Company Accounting Oversight Board (United States) (PCAOB) and are required to be independent with respect to the Funds in accordance with the U.S. federal securities laws and the applicable rules and regulations of the Securities and Exchange Commission and the PCAOB.
We conducted our audits of these financial statements in accordance with the standards of the PCAOB. Those standards require that we plan and perform the audit to obtain reasonable assurance about whether the financial statements are free of material misstatement, whether due to error or fraud.
Our audits included performing procedures to assess the risks of material misstatement of the financial statements, whether due to error or fraud, and performing procedures that respond to those risks. Such procedures included examining, on a test basis, evidence regarding the amounts and disclosures in the financial statements. Our audits also included evaluating the accounting principles used and significant estimates made by management, as well as evaluating the overall presentation of the financial statements. Our procedures included confirmation of securities owned as of February 28, 2021 by correspondence with the custodians and brokers; when replies were not received from brokers, we performed other auditing procedures. We believe that our audits provide a reasonable basis for our opinions.
/s/ PricewaterhouseCoopers LLP
Boston, Massachusetts
April 13, 2021
We have served as the auditor of one or more investment companies in the Fidelity group of funds since 1932.
Trustees and Officers
The Trustees, Members of the Advisory Board (if any), and officers of the trust and funds, as applicable, are listed below. The Board of Trustees governs each fund and is responsible for protecting the interests of shareholders. The Trustees are experienced executives who meet periodically throughout the year to oversee each fund's activities, review contractual arrangements with companies that provide services to each fund, oversee management of the risks associated with such activities and contractual arrangements, and review each fund's performance. Each of the Trustees oversees 309 funds.
The Trustees hold office without limit in time except that (a) any Trustee may resign; (b) any Trustee may be removed by written instrument, signed by at least two-thirds of the number of Trustees prior to such removal; (c) any Trustee who requests to be retired or who has become incapacitated by illness or injury may be retired by written instrument signed by a majority of the other Trustees; and (d) any Trustee may be removed at any special meeting of shareholders by a two-thirds vote of the outstanding voting securities of the trust. Each Trustee who is not an interested person (as defined in the 1940 Act) of the trust and the funds is referred to herein as an Independent Trustee. Each Independent Trustee shall retire not later than the last day of the calendar year in which his or her 75th birthday occurs. The Independent Trustees may waive this mandatory retirement age policy with respect to individual Trustees. Officers and Advisory Board Members hold office without limit in time, except that any officer or Advisory Board Member may resign or may be removed by a vote of a majority of the Trustees at any regular meeting or any special meeting of the Trustees. Except as indicated, each individual has held the office shown or other offices in the same company for the past five years.
Each fund's Statement of Additional Information (SAI) includes more information about the Trustees. To request a free copy, call Fidelity at 1-800-544-8544 if you’re an individual investing directly with Fidelity, call 1-800-835-5092 if you’re a plan sponsor or participant with Fidelity as your recordkeeper or call 1-877-208-0098 on institutional accounts or if you’re an advisor or invest through one.
Experience, Skills, Attributes, and Qualifications of the Trustees. The Governance and Nominating Committee has adopted a statement of policy that describes the experience, qualifications, attributes, and skills that are necessary and desirable for potential Independent Trustee candidates (Statement of Policy). The Board believes that each Trustee satisfied at the time he or she was initially elected or appointed a Trustee, and continues to satisfy, the standards contemplated by the Statement of Policy. The Governance and Nominating Committee also engages professional search firms to help identify potential Independent Trustee candidates who have the experience, qualifications, attributes, and skills consistent with the Statement of Policy. From time to time, additional criteria based on the composition and skills of the current Independent Trustees, as well as experience or skills that may be appropriate in light of future changes to board composition, business conditions, and regulatory or other developments, have also been considered by the professional search firms and the Governance and Nominating Committee. In addition, the Board takes into account the Trustees' commitment and participation in Board and committee meetings, as well as their leadership of standing and ad hoc committees throughout their tenure.
In determining that a particular Trustee was and continues to be qualified to serve as a Trustee, the Board has considered a variety of criteria, none of which, in isolation, was controlling. The Board believes that, collectively, the Trustees have balanced and diverse experience, qualifications, attributes, and skills, which allow the Board to operate effectively in governing each fund and protecting the interests of shareholders. Information about the specific experience, skills, attributes, and qualifications of each Trustee, which in each case led to the Board's conclusion that the Trustee should serve (or continue to serve) as a trustee of the funds, is provided below.
Board Structure and Oversight Function. Robert A. Lawrence is an interested person and currently serves as Acting Chairman. The Trustees have determined that an interested Chairman is appropriate and benefits shareholders because an interested Chairman has a personal and professional stake in the quality and continuity of services provided to the funds. Independent Trustees exercise their informed business judgment to appoint an individual of their choosing to serve as Chairman, regardless of whether the Trustee happens to be independent or a member of management. The Independent Trustees have determined that they can act independently and effectively without having an Independent Trustee serve as Chairman and that a key structural component for assuring that they are in a position to do so is for the Independent Trustees to constitute a substantial majority for the Board. The Independent Trustees also regularly meet in executive session. David M. Thomas serves as Lead Independent Trustee and as such (i) acts as a liaison between the Independent Trustees and management with respect to matters important to the Independent Trustees and (ii) with management prepares agendas for Board meetings.
Fidelity® funds are overseen by different Boards of Trustees. The funds' Board oversees Fidelity's high income and certain equity funds, and other Boards oversee Fidelity's investment-grade bond, money market, asset allocation, and other equity funds. The asset allocation funds may invest in Fidelity® funds overseen by the funds' Board. The use of separate Boards, each with its own committee structure, allows the Trustees of each group of Fidelity® funds to focus on the unique issues of the funds they oversee, including common research, investment, and operational issues. On occasion, the separate Boards establish joint committees to address issues of overlapping consequences for the Fidelity® funds overseen by each Board.
The Trustees operate using a system of committees to facilitate the timely and efficient consideration of all matters of importance to the Trustees, each fund, and fund shareholders and to facilitate compliance with legal and regulatory requirements and oversight of the funds' activities and associated risks. The Board, acting through its committees, has charged FMR and its affiliates with (i) identifying events or circumstances the occurrence of which could have demonstrably adverse effects on the funds' business and/or reputation; (ii) implementing processes and controls to lessen the possibility that such events or circumstances occur or to mitigate the effects of such events or circumstances if they do occur; and (iii) creating and maintaining a system designed to evaluate continuously business and market conditions in order to facilitate the identification and implementation processes described in (i) and (ii) above. Because the day-to-day operations and activities of the funds are carried out by or through FMR, its affiliates, and other service providers, the funds' exposure to risks is mitigated but not eliminated by the processes overseen by the Trustees. While each of the Board's committees has responsibility for overseeing different aspects of the funds' activities, oversight is exercised primarily through the Operations, Audit, and Compliance Committees. Appropriate personnel, including but not limited to the funds' Chief Compliance Officer (CCO), FMR's internal auditor, the independent accountants, the funds' Treasurer and portfolio management personnel, make periodic reports to the Board's committees, as appropriate, including an annual review of Fidelity's risk management program for the Fidelity® funds. The responsibilities of each standing committee, including their oversight responsibilities, are described further under "Standing Committees of the Trustees."
Interested Trustees*:
Correspondence intended for a Trustee who is an interested person may be sent to Fidelity Investments, 245 Summer Street, Boston, Massachusetts 02210.
Name, Year of Birth; Principal Occupations and Other Relevant Experience+
Bettina Doulton (1964)
Year of Election or Appointment: 2020
Trustee
Ms. Doulton also serves as Trustee of other Fidelity® funds. Prior to her retirement, Ms. Doulton served in a variety of positions at Fidelity Investments, including as a managing director of research (2006-2007), portfolio manager to certain Fidelity® funds (1993-2005), equity analyst and portfolio assistant (1990-1993), and research assistant (1987-1990). Ms. Doulton currently owns and operates Phi Builders + Architects and Cellardoor Winery. Previously, Ms. Doulton served as a member of the Board of Brown Capital Management, LLC (2013-2018).
Robert A. Lawrence (1952)
Year of Election or Appointment: 2020
Trustee
Acting Chairman of the Board of Trustees
Mr. Lawrence also serves as Trustee of other funds. Previously, Mr. Lawrence served as a Member of the Advisory Board of certain funds. Prior to his retirement in 2008, Mr. Lawrence served as Vice President of certain Fidelity® funds (2006-2008), Senior Vice President, Head of High Income Division of Fidelity Management & Research Company (investment adviser firm, 2006-2008), and President of Fidelity Strategic Investments (investment adviser firm, 2002-2005).
* Determined to be an “Interested Trustee” by virtue of, among other things, his or her affiliation with the trust or various entities under common control with FMR.
+ The information includes the Trustee's principal occupation during the last five years and other information relating to the experience, attributes, and skills relevant to the Trustee's qualifications to serve as a Trustee, which led to the conclusion that the Trustee should serve as a Trustee for each fund.
Independent Trustees:
Correspondence intended for an Independent Trustee may be sent to Fidelity Investments, P.O. Box 55235, Boston, Massachusetts 02205-5235.
Name, Year of Birth; Principal Occupations and Other Relevant Experience+
Dennis J. Dirks (1948)
Year of Election or Appointment: 2018
Trustee
Mr. Dirks also serves as Trustee of other Fidelity® funds. Prior to his retirement in May 2003, Mr. Dirks served as Chief Operating Officer and as a member of the Board of The Depository Trust & Clearing Corporation (financial markets infrastructure), President, Chief Operating Officer and a member of the Board of The Depository Trust Company (DTC), President and a member of the Board of the National Securities Clearing Corporation (NSCC), Chief Executive Officer and a member of the Board of the Government Securities Clearing Corporation and Chief Executive Officer and a member of the Board of the Mortgage-Backed Securities Clearing Corporation. Mr. Dirks currently serves as a member of the Finance Committee (2016-present) and Board (2017-present) and is Treasurer (2018-present) of the Asolo Repertory Theatre.
Donald F. Donahue (1950)
Year of Election or Appointment: 2018
Trustee
Mr. Donahue also serves as Trustee of other Fidelity® funds. Mr. Donahue serves as President and Chief Executive Officer of Miranda Partners, LLC (risk consulting for the financial services industry, 2012-present). Previously, Mr. Donahue served as Chief Executive Officer (2006-2012), Chief Operating Officer (2003-2006) and Managing Director, Customer Marketing and Development (1999-2003) of The Depository Trust & Clearing Corporation (financial markets infrastructure). Mr. Donahue currently serves as a member (2007-present) and Co-Chairman (2016-present) of the Board of United Way of New York, a member of the Board of NYC Leadership Academy (2012-present) and a member of the Board of Advisors of Ripple Labs, Inc. (financial services, 2015-present). Mr. Donahue previously served as a member of the Advisory Board of certain Fidelity® funds (2015-2018).
Vicki L. Fuller (1957)
Year of Election or Appointment: 2020
Trustee
Ms. Fuller also serves as Trustee of other Fidelity® funds. Previously, Ms. Fuller served as a member of the Advisory Board of certain Fidelity® funds (2018-2020), Chief Investment Officer of the New York State Common Retirement Fund (2012-2018) and held a variety of positions at AllianceBernstein L.P. (global asset management, 1985-2012), including Managing Director (2006-2012) and Senior Vice President and Senior Portfolio Manager (2001-2006). Ms. Fuller currently serves as a member of the Board, Audit Committee and Nominating and Governance Committee of The Williams Companies, Inc. (natural gas infrastructure, 2018-present), as a member of the Board, Audit Committee and Nominating and Governance Committee of two Blackstone business development companies (2020-present) and as a member of the Board of Treliant, LLC (consulting, 2019-present).
Patricia L. Kampling (1959)
Year of Election or Appointment: 2020
Trustee
Ms. Kampling also serves as Trustee of other Fidelity® funds. Prior to her retirement, Ms. Kampling served as Chairman of the Board and Chief Executive Officer (2012-2019), President and Chief Operating Officer (2011-2012) and Executive Vice President and Chief Financial Officer (2010-2011) of Alliant Energy Corporation. Ms. Kampling currently serves as a member of the Board, Compensation Committee and Executive Committee and as Chair of the Audit Committee of Briggs & Stratton Corporation (manufacturing, 2011-present) and as a member of the Board, Audit, Finance and Risk Committee and Safety, Environmental, Technology and Operations Committee of American Water Works Company, Inc. (utilities company, 2019-present). In addition, Ms. Kampling currently serves as a member of the Board of the Nature Conservancy, Wisconsin Chapter (2019-present). Previously, Ms. Kampling served as a Member of the Advisory Board of certain Fidelity® funds (2020), a member of the Board of Interstate Power and Light Company (2012-2019) and Wisconsin Power and Light Company (2012-2019) (each a subsidiary of Alliant Energy Corporation) and as a member of the Board and Workforce Development Committee of the Business Roundtable (2018-2019).
Thomas A. Kennedy (1955)
Year of Election or Appointment: 2021
Trustee
Mr. Kennedy also serves as Trustee of other Fidelity® funds. Previously, Mr. Kennedy served as a Member of the Advisory Board of certain Fidelity® funds (2020) and held a variety of positions at Raytheon Company (aerospace and defense, 1983-2020), including Chairman and Chief Executive Officer (2014-2020) and Executive Vice President and Chief Operating Officer (2013-2014). Mr. Kennedy currently serves as Executive Chairman of the Board of Directors of Raytheon Technologies Corporation (aerospace and defense, 2020-present). He is also a member of the Rutgers School of Engineering Industry Advisory Board (2011-present) and a member of the UCLA Engineering Dean’s Executive Board (2016-present).
Garnett A. Smith (1947)
Year of Election or Appointment: 2013
Trustee
Mr. Smith also serves as Trustee of other Fidelity® funds. Prior to his retirement, Mr. Smith served as Chairman and Chief Executive Officer (1990-1997) and President (1986-1990) of Inbrand Corp. (manufacturer of personal absorbent products). Prior to his employment with Inbrand Corp., he was employed by a retail fabric chain and North Carolina National Bank (now Bank of America). Mr. Smith previously served as a member of the Advisory Board of certain Fidelity® funds (2012-2013).
David M. Thomas (1949)
Year of Election or Appointment: 2018
Trustee
Lead Independent Trustee
Mr. Thomas also serves as Trustee of other Fidelity® funds. Previously, Mr. Thomas served as Executive Chairman (2005-2006) and Chairman and Chief Executive Officer (2000-2005) of IMS Health, Inc. (pharmaceutical and healthcare information solutions). Mr. Thomas currently serves as Non-Executive Chairman of the Board of Fortune Brands Home and Security (home and security products, 2011-present), and a member of the Board (2004-present) and Presiding Director (2013-present) of Interpublic Group of Companies, Inc. (marketing communication).
Susan Tomasky (1953)
Year of Election or Appointment: 2020
Trustee
Ms. Tomasky also serves as Trustee of other Fidelity® funds. Prior to her retirement, Ms. Tomasky served in various executive officer positions at American Electric Power Company, Inc. (1998-2011), including most recently as President of AEP Transmission (2007-2011). Ms. Tomasky currently serves as a member of the Board and Sustainability Committee and as Chair of the Audit Committee of Marathon Petroleum Corporation (2018-present) and as a member of the Board, Corporate Governance Committee and Organization and Compensation Committee and as Chair of the Audit Committee of Public Service Enterprise Group, Inc. (utilities company, 2012-present). In addition, Ms. Tomasky currently serves as a member of the Board of the Columbus Regional Airport Authority (2007-present), as a member of the Board of the Royal Shakespeare Company – America (2009-present), as a member of the Board of the Columbus Association for the Performing Arts (2011-present) and as a member of the Board of Kenyon College (2016-present). Previously, Ms. Tomasky served as a Member of the Advisory Board of certain Fidelity® funds (2020), a member of the Board (2011-2019) and as Lead Independent Director (2015-2018) of Andeavor Corporation (previously Tesoro Corporation) (independent oil refiner and marketer) and as a member of the Board of Summit Midstream Partners LP (energy, 2012-2018).
Michael E. Wiley (1950)
Year of Election or Appointment: 2008
Trustee
Mr. Wiley also serves as Trustee of other Fidelity® funds. Previously, Mr. Wiley served as a member of the Advisory Board of certain Fidelity® funds (2018-2020), Chairman, President and CEO of Baker Hughes, Inc. (oilfield services, 2000-2004). Mr. Wiley also previously served as a member of the Board of Andeavor Corporation (independent oil refiner and marketer, 2005-2018), a member of the Board of Andeavor Logistics LP (natural resources logistics, 2015-2018) and a member of the Board of High Point Resources (exploration and production, 2005-2020).
+ The information includes the Trustee's principal occupation during the last five years and other information relating to the experience, attributes, and skills relevant to the Trustee's qualifications to serve as a Trustee, which led to the conclusion that the Trustee should serve as a Trustee for each fund.
Advisory Board Members and Officers:
Correspondence intended for a Member of the Advisory Board (if any) may be sent to Fidelity Investments, P.O. Box 55235, Boston, Massachusetts 02205-5235. Correspondence intended for an officer or Peter S. Lynch may be sent to Fidelity Investments, 245 Summer Street, Boston, Massachusetts 02210. Officers appear below in alphabetical order.
Name, Year of Birth; Principal Occupation
Ned C. Lautenbach (1944)
Year of Election or Appointment: 2021
Member of the Advisory Board
Mr. Lautenbach also serves as a Member of the Advisory Board of other Fidelity® funds. Mr. Lautenbach currently serves as Chair of the Board of Governors, State University System of Florida (2013-present) and is a member of the Council on Foreign Relations (1994-present). He is also a member and has in the past served as Chairman of the Board of Directors of Artis-Naples (2012-present). Previously, Mr. Lautenbach served as a Trustee of certain Fidelity® funds (2000-2020) and a member and then Lead Director of the Board of Directors of Eaton Corporation (diversified industrial, 1997-2016). He was also a Partner at Clayton, Dubilier & Rice, LLC (private equity investment, 1998-2010); as well as Director of Sony Corporation (2006-2007). In addition, Mr. Lautenbach had a 30-year career with IBM (technology company), during which time he served as Senior Vice President and as a member of the Corporate Executive Committee (1968-1998).
Peter S. Lynch (1944)
Year of Election or Appointment: 2018
Member of the Advisory Board
Mr. Lynch also serves as a Member of the Advisory Board of other Fidelity® funds. Mr. Lynch is Vice Chairman and a Director of Fidelity Management & Research Company LLC (investment adviser firm). In addition, Mr. Lynch serves as a Trustee of Boston College and as the Chairman of the Inner-City Scholarship Fund. Previously, Mr. Lynch served as Vice Chairman and a Director of FMR Co., Inc. (investment adviser firm) and on the Special Olympics International Board of Directors (1997-2006).
Craig S. Brown (1977)
Year of Election or Appointment: 2019
Assistant Treasurer
Mr. Brown also serves as Assistant Treasurer of other funds. Mr. Brown is an employee of Fidelity Investments (2013-present).
John J. Burke III (1964)
Year of Election or Appointment: 2018
Chief Financial Officer
Mr. Burke also serves as Chief Financial Officer of other funds. Mr. Burke serves as Head of Investment Operations for Fidelity Fund and Investment Operations (2018-present) and is an employee of Fidelity Investments (1998-present). Previously Mr. Burke served as head of Asset Management Investment Operations (2012-2018).
William C. Coffey (1969)
Year of Election or Appointment: 2019
Assistant Secretary
Mr. Coffey also serves as Assistant Secretary of other funds. He is Senior Vice President and Deputy General Counsel of FMR LLC (diversified financial services company, 2010-present), and is an employee of Fidelity Investments. Previously, Mr. Coffey served as Secretary and CLO of certain funds (2018-2019); CLO, Secretary, and Senior Vice President of Fidelity Management & Research Company and FMR Co., Inc. (investment adviser firms, 2018-2019); Secretary of Fidelity SelectCo, LLC and Fidelity Investments Money Management, Inc. (investment adviser firms, 2018-2019); CLO of Fidelity Management & Research (Hong Kong) Limited, FMR Investment Management (UK) Limited, and Fidelity Management & Research (Japan) Limited (investment adviser firms, 2018-2019); and Assistant Secretary of certain funds (2009-2018).
Timothy M. Cohen (1969)
Year of Election or Appointment: 2018
Vice President
Mr. Cohen also serves as Vice President of other funds. Mr. Cohen serves as Co-Head of Equity (2018-present), a Director of Fidelity Management & Research (Japan) Limited (investment adviser firm, 2016-present), and is an employee of Fidelity Investments. Previously, Mr. Cohen served as Executive Vice President of Fidelity SelectCo, LLC (2019), Head of Global Equity Research (2016-2018), Chief Investment Officer - Equity and a Director of Fidelity Management & Research (U.K.) Inc. (investment adviser firm, 2013-2015) and as a Director of Fidelity Management & Research (Hong Kong) Limited (investment adviser firm, 2017).
Jonathan Davis (1968)
Year of Election or Appointment: 2010
Assistant Treasurer
Mr. Davis also serves as Assistant Treasurer of other funds. Mr. Davis serves as Assistant Treasurer of FMR Capital, Inc. (2017-present) and is an employee of Fidelity Investments. Previously, Mr. Davis served as Vice President and Associate General Counsel of FMR LLC (diversified financial services company, 2003-2010).
Laura M. Del Prato (1964)
Year of Election or Appointment: 2018
Assistant Treasurer
Ms. Del Prato also serves as an officer of other funds. Ms. Del Prato is an employee of Fidelity Investments (2017-present). Previously, Ms. Del Prato served as President and Treasurer of The North Carolina Capital Management Trust: Cash Portfolio and Term Portfolio (2018-2020). Prior to joining Fidelity Investments, Ms. Del Prato served as a Managing Director and Treasurer of the JPMorgan Mutual Funds (2014-2017). Prior to JPMorgan, Ms. Del Prato served as a partner at Cohen Fund Audit Services (accounting firm, 2012-2013) and KPMG LLP (accounting firm, 2004-2012).
Colm A. Hogan (1973)
Year of Election or Appointment: 2020
Assistant Treasurer
Mr. Hogan also serves as an officer of other funds. Mr. Hogan serves as Assistant Treasurer of FMR Capital, Inc. (2017-present) and is an employee of Fidelity Investments (2005-present). Previously, Mr. Hogan served as Deputy Treasurer of certain Fidelity® funds (2016-2020) and Assistant Treasurer of certain Fidelity® funds (2016-2018).
Pamela R. Holding (1964)
Year of Election or Appointment: 2018
Vice President
Ms. Holding also serves as Vice President of other funds. Ms. Holding serves as Co-Head of Equity (2018-present) and is an employee of Fidelity Investments (2013-present). Previously, Ms. Holding served as Executive Vice President of Fidelity SelectCo, LLC (2019) and as Chief Investment Officer of Fidelity Institutional Asset Management (2013-2018).
Cynthia Lo Bessette (1969)
Year of Election or Appointment: 2019
Secretary and Chief Legal Officer (CLO)
Ms. Lo Bessette also serves as an officer of other funds. Ms. Lo Bessette serves as CLO, Secretary, and Senior Vice President of Fidelity Management & Research Company LLC (investment adviser firm, 2019-present); and CLO of Fidelity Management & Research (Hong Kong) Limited, FMR Investment Management (UK) Limited, and Fidelity Management & Research (Japan) Limited (investment adviser firms, 2019-present). She is a Senior Vice President and Deputy General Counsel of FMR LLC (diversified financial services company, 2019-present), and is an employee of Fidelity Investments. Previously, Ms. Lo Bessette served as CLO, Secretary, and Senior Vice President of FMR Co., Inc. (investment adviser firm, 2019); Secretary of Fidelity SelectCo, LLC and Fidelity Investments Money Management, Inc. (investment adviser firms, 2019). Prior to joining Fidelity Investments, Ms. Lo Bessette was Executive Vice President, General Counsel (2016-2019) and Senior Vice President, Deputy General Counsel (2015-2016) of OppenheimerFunds (investment management company) and Deputy Chief Legal Officer (2013-2015) of Jennison Associates LLC (investment adviser firm).
Chris Maher (1972)
Year of Election or Appointment: 2020
Deputy Treasurer
Mr. Maher also serves as an officer of other funds. Mr. Maher serves as Assistant Treasurer of FMR Capital, Inc. (2017-present), and is an employee of Fidelity Investments (2008-present). Previously, Mr. Maher served as Assistant Treasurer of certain funds (2013-2020); Vice President of Asset Management Compliance (2013), Vice President of the Program Management Group of FMR (investment adviser firm, 2010-2013), and Vice President of Valuation Oversight (2008-2010).
Jason P. Pogorelec (1975)
Year of Election or Appointment: 2020
Chief Compliance Officer
Mr. Pogorelec also serves as Chief Compliance Officer of other funds. Mr. Pogorelec is a senior Vice President of Asset Management Compliance for Fidelity Investments and is an employee of Fidelity Investments (2006-present). Previously, Mr. Pogorelec served as Vice President, Associate General Counsel for Fidelity Investments (2010-2020) and Assistant Secretary of certain Fidelity funds (2015-2020).
Brett Segaloff (1972)
Year of Election or Appointment: 2021
Anti-Money Laundering (AML) Officer
Mr. Segaloff also serves as an AML Officer of other funds and other related entities. He is Director, Anti-Money Laundering (2007-present) of FMR LLC (diversified financial services company) and is an employee of Fidelity Investments (1996-present).
Stacie M. Smith (1974)
Year of Election or Appointment: 2018
President and Treasurer
Ms. Smith also serves as an officer of other funds. Ms. Smith serves as Assistant Treasurer of FMR Capital, Inc. (2017-present), is an employee of Fidelity Investments (2009-present), and has served in other fund officer roles. Prior to joining Fidelity Investments, Ms. Smith served as Senior Audit Manager of Ernst & Young LLP (accounting firm, 1996-2009). Previously, Ms. Smith served as Assistant Treasurer (2013-2019) and Deputy Treasurer (2013-2016) of certain Fidelity® funds.
Marc L. Spector (1972)
Year of Election or Appointment: 2017
Assistant Treasurer
Mr. Spector also serves as an officer of other funds. Mr. Spector serves as Assistant Treasurer of FMR Capital, Inc. (2017-present) and is an employee of Fidelity Investments (2016-present). Prior to joining Fidelity Investments, Mr. Spector served as Director at the Siegfried Group (accounting firm, 2013-2016), and prior to Siegfried Group as audit senior manager at Deloitte & Touche LLP (accounting firm, 2005-2013).
Jim Wegmann (1979)
Year of Election or Appointment: 2019
Assistant Treasurer
Mr. Wegmann also serves as Assistant Treasurer of other funds. Mr. Wegmann is an employee of Fidelity Investments (2011-present).
Shareholder Expense Example
As a shareholder, you incur two types of costs: (1) transaction costs, which may include sales charges (loads) on purchase payments or redemption proceeds, as applicable and (2) ongoing costs, which generally include management fees, distribution and/or service (12b-1) fees and other Fund expenses. This Example is intended to help you understand your ongoing costs (in dollars) of investing in a fund and to compare these costs with the ongoing costs of investing in other mutual funds.
The Example is based on an investment of $1,000 invested at the beginning of the period and held for the entire period (September 1, 2020 to February 28, 2021).
Actual Expenses
The first line of the accompanying table provides information about actual account values and actual expenses. You may use the information in this line, together with the amount you invested, to estimate the expenses that you paid over the period. Simply divide your account value by $1,000.00 (for example, an $8,600 account value divided by $1,000.00 = 8.6), then multiply the result by the number in the first line for a class/Fund under the heading entitled "Expenses Paid During Period" to estimate the expenses you paid on your account during this period. If any fund is a shareholder of any underlying mutual funds or exchange-traded funds (ETFs) (the Underlying Funds), such fund indirectly bears its proportional share of the expenses of the Underlying Funds in addition to the direct expenses incurred presented in the table. These fees and expenses are not included in the annualized expense ratio used to calculate the expense estimate in the table below.
Hypothetical Example for Comparison Purposes
The second line of the accompanying table provides information about hypothetical account values and hypothetical expenses based on the actual expense ratio and an assumed rate of return of 5% per year before expenses, which is not the actual return. The hypothetical account values and expenses may not be used to estimate the actual ending account balance or expenses you paid for the period. You may use this information to compare the ongoing costs of investing in the Fund and other funds. To do so, compare this 5% hypothetical example with the 5% hypothetical examples that appear in the shareholder reports of the other funds. If any fund is a shareholder of any Underlying Funds, such fund indirectly bears its proportional share of the expenses of the Underlying Funds in addition to the direct expenses as presented in the table. These fees and expenses are not included in the annualized expense ratio used to calculate the expense estimate in the table below.
Please note that the expenses shown in the table are meant to highlight your ongoing costs only and do not reflect any transaction costs. Therefore, the second line of the table is useful in comparing ongoing costs only, and will not help you determine the relative total costs of owning different funds. In addition, if these transactional costs were included, your costs would have been higher.
| | Annualized Expense Ratio-A | Beginning
Account Value
September 1, 2020 | Ending
Account Value
February 28, 2021 | Expenses Paid
During Period-B
September 1, 2020
to February 28, 2021 |
| Telecommunications Portfolio | | | | |
| Class A | 1.09% | | | |
| Actual | | $1,000.00 | $1,027.90 | $5.48 |
| Hypothetical-C | | $1,000.00 | $1,019.39 | $5.46 |
| Class M | 1.40% | | | |
| Actual | | $1,000.00 | $1,026.20 | $7.03 |
| Hypothetical-C | | $1,000.00 | $1,017.85 | $7.00 |
| Class C | 1.84% | | | |
| Actual | | $1,000.00 | $1,024.00 | $9.23 |
| Hypothetical-C | | $1,000.00 | $1,015.67 | $9.20 |
| Telecommunications | .79% | | | |
| Actual | | $1,000.00 | $1,029.60 | $3.98 |
| Hypothetical-C | | $1,000.00 | $1,020.88 | $3.96 |
| Class I | .78% | | | |
| Actual | | $1,000.00 | $1,029.30 | $3.92 |
| Hypothetical-C | | $1,000.00 | $1,020.93 | $3.91 |
| Class Z | .65% | | | |
| Actual | | $1,000.00 | $1,030.20 | $3.27 |
| Hypothetical-C | | $1,000.00 | $1,021.57 | $3.26 |
| Wireless Portfolio | .78% | | | |
| Actual | | $1,000.00 | $1,054.90 | $3.97 |
| Hypothetical-C | | $1,000.00 | $1,020.93 | $3.91 |
A Annualized expense ratio reflects expenses net of applicable fee waivers.
B Expenses are equal to the annualized expense ratio, multiplied by the average account value over the period, multiplied by 181/ 365 (to reflect the one-half year period). The fees and expenses of any Underlying Funds are not included in each annualized expense ratio.
C 5% return per year before expenses
Distributions (Unaudited)
The Board of Trustees of each fund voted to pay to shareholders of record at the opening of business on record date, the following distributions per share derived from capital gains realized from sales of portfolio securities and dividends derived from net investment income:
| | Pay Date | Record Date | Dividends | Capital Gains |
| Telecommunications Portfolio | | | | |
| Class A | 04/12/21 | 04/09/21 | $0.267 | $1.716 |
| Class M | 04/12/21 | 04/09/21 | $0.231 | $1.716 |
| Class C | 04/12/21 | 04/09/21 | $0.177 | $1.716 |
| Telecommunications | 04/12/21 | 04/09/21 | $0.300 | $1.716 |
| Class I | 04/12/21 | 04/09/21 | $0.290 | $1.716 |
| Class Z | 04/12/21 | 04/09/21 | $0.306 | $1.716 |
| Wireless Portfolio | | | | |
| Wireless | 04/12/21 | 04/09/21 | $0.000 | $0.423 |
|
The funds hereby designate as capital gain dividend the amounts noted below for the taxable year ended February 28, 2021, or, if subsequently determined to be different, the net capital gain of such year.
| Telecommunications Portfolio | $ 14,780,614 |
| Wireless Portfolio | $ 14,611,968 |
|
A percentage of the dividends distributed during the fiscal year for the following funds qualify for the dividends–received deduction for corporate shareholders:
| | April 2020 | December 2020 |
| Telecommunications Portfolio | | |
| Class A | 100% | 35% |
| Class M | 100% | 37% |
| Class C | 100% | 41% |
| Telecommunications | 100% | 34% |
| Class I | 100% | 33% |
| Class Z | 99% | 33% |
| Wireless Portfolio | | |
| Wireless | 15% | 82% |
|
A percentage of the dividends distributed during the fiscal year for the following funds may be taken into account as a dividend for purposes of the maximum rate under section 1(h)(11) of the Internal Revenue Code.
| | April 2020 | December 2020 |
| Telecommunications Portfolio | | |
| Class A | 100% | 38% |
| Class M | 100% | 41% |
| Class C | 100% | 45% |
| Telecommunications | 100% | 37% |
| Class I | 100% | 36% |
| Class Z | 100% | 36% |
| Wireless Portfolio | | |
| Wireless | 11% | 100% |
|
The fund designates the below percentages of the short-term capital gain dividends distributed during the fiscal year as qualifying to be taxed as short-term capital gain dividends for nonresident alien shareholders:
| | April 2020 | December 2020 |
| Telecommunications Portfolio | 99.92% | 99.68% |
| Wireless Portfolio | 100.00% | – |
|
A percentage of the dividends distributed during the fiscal year for the following funds qualify as a section 199A dividend:
| | April 2020 | December 2020 |
| Wireless | 1% | – |
|
The funds will notify shareholders in January 2022 of amounts for use in preparing 2021 income tax returns.
Board Approval of Investment Advisory Contracts
Telecommunications Portfolio
Wireless Portfolio
At its January 2021 meeting, the Board of Trustees, including the Independent Trustees (together, the Board), voted to continue the management contract with Fidelity Management & Research Company LLC (FMR), and the sub-advisory agreements and sub-subadvisory agreements, in each case, where applicable (together, the Advisory Contracts) for each fund for four months from February 1, 2021 through May 31, 2021, in connection with changes to the Board's meeting calendar.
The Board considered that the approval of each fund's Advisory Contracts will not result in any changes in (i) the investment process or strategies employed in the management of each fund's assets; (ii) the fees and expenses paid by shareholders; (iii) the nature, extent or quality of services provided under each fund's Advisory Contracts; or (iv) the day-to-day management of each fund or the persons primarily responsible for such management. The Board also considered that since its last approval of each fund's Advisory Contracts, FMR had provided additional information on each fund in support of the annual contract renewal process, including competitive analyses on total expenses and management fees and in-depth reviews of fund performance and fund profitability information. The Board also considered the findings of certain ad hoc committees that had been previously formed to discuss matters relevant to all of the Fidelity funds, including economies of scale, fall-out benefits and retail vs. institutional funds. The Board concluded that each fund's Advisory Contracts are fair and reasonable, and that each fund's Advisory Contracts should be renewed, without modification, through May 31, 2021, with the understanding that the Board will consider the annual renewal for a full one year period in May 2021.
In connection with its consideration of future renewals of each fund's Advisory Contracts, the Board will consider: (i) the nature, extent and quality of services provided to the funds, including shareholder and administrative services and investment performance; (ii) the competitiveness of the management fee and total expenses for each fund; (iii) the costs of the services and profitability, including the revenues earned and the expenses incurred in conducting the business of developing, marketing, distributing, managing, administering, and servicing each fund and its shareholders, to the extent applicable; and (iv) whether there have been economies of scale in respect of the Fidelity funds, whether the Fidelity funds (including the funds) have appropriately benefited from any such economies of scale, and whether there is the potential for realization of any further economies.
Based on its evaluation of all of the conclusions noted above, and after considering all factors it believed relevant, the Board ultimately concluded that each fund's management fee structures are fair and reasonable, and that the continuation of the funds' Advisory Contracts should be approved for four months from February 1, 2021 through May 31, 2021.
Liquidity Risk Management Program
The Securities and Exchange Commission adopted Rule 22e-4 under the Investment Company Act of 1940 (the Liquidity Rule) to promote effective liquidity risk management throughout the open-end investment company industry, thereby reducing the risk that funds will be unable to meet their redemption obligations and mitigating dilution of the interests of fund shareholders.
The Funds have adopted and implemented a liquidity risk management program pursuant to the Liquidity Rule (the Program) effective December 1, 2018. The Program is reasonably designed to assess and manage each Fund’s liquidity risk and to comply with the requirements of the Liquidity Rule. Each Fund’s Board of Trustees (the Board) has designated each Fund’s investment adviser as administrator of the Program. The Fidelity advisers have established a Liquidity Risk Management Committee (the LRM Committee) to manage the Program for each of the Fidelity Funds. The LRM Committee monitors the adequacy and effectiveness of implementation of the Program and on a periodic basis assesses each Fund’s liquidity risk based on a variety of factors including (1) the Fund’s investment strategy, (2) portfolio liquidity and cash flow projections during normal and reasonably foreseeable stressed conditions, (3) shareholder redemptions, (4) borrowings and other funding sources and (5) in the case of exchange-traded funds, certain additional factors including the effect of the Fund’s prices and spreads, market participants, and basket compositions on the overall liquidity of the Fund’s portfolio, as applicable.
In accordance with the Program, each of the Fund’s portfolio investments is classified into one of four liquidity categories described below based on a determination of a reasonable expectation for how long it would take to convert the investment to cash (or sell or dispose of the investment) without significantly changing its market value.
- Highly liquid investments – cash or convertible to cash within three business days or less
- Moderately liquid investments – convertible to cash in three to seven calendar days
- Less liquid investments – can be sold or disposed of, but not settled, within seven calendar days
- Illiquid investments – cannot be sold or disposed of within seven calendar days
Liquidity classification determinations take into account a variety of factors including various market, trading and investment-specific considerations, as well as market depth, and generally utilize analysis from a third-party liquidity metrics service.
The Liquidity Rule places a 15% limit on a fund’s illiquid investments and requires funds that do not primarily hold assets that are highly liquid investments to determine and maintain a minimum percentage of the fund’s net assets to be invested in highly liquid investments (highly liquid investment minimum or HLIM). The Program includes provisions reasonably designed to comply with the 15% limit on illiquid investments and for determining, periodically reviewing and complying with the HLIM requirement as applicable.
At a recent meeting of the Fund’s Board of Trustees, the LRM Committee provided a written report to the Board pertaining to the operation, adequacy, and effectiveness of implementation of the Program for the annual period from December 1, 2019 through November 30, 2020. The report concluded that the Program has been implemented and is operating effectively and is reasonably designed to assess and manage the Fund’s liquidity risk.
Proxy Voting Results
A special meeting of shareholders was held on June 9, 2020. The results of votes taken among shareholders on the proposal before them are reported below. Each vote reported represents one dollar of net asset value held on the record date for the meeting.
PROPOSAL 1
To elect a Board of Trustees.
| | # of
Votes | % of
Votes |
| Dennis J. Dirks |
| Affirmative | 32,463,705,305.665 | 92.437 |
| Withheld | 2,655,951,104.308 | 7.563 |
| TOTAL | 35,119,656,409.973 | 100.000 |
| Donald F. Donahue |
| Affirmative | 32,446,843,861.354 | 92.389 |
| Withheld | 2,672,812,548.619 | 7.611 |
| TOTAL | 35,119,656,409.973 | 100.000 |
| Bettina Doulton |
| Affirmative | 32,610,463,757.584 | 92.855 |
| Withheld | 2,509,192,652.389 | 7.145 |
| TOTAL | 35,119,656,409.973 | 100.000 |
| Vicki L. Fuller |
| Affirmative | 32,688,213,522.720 | 93.077 |
| Withheld | 2,431,442,887.253 | 6.923 |
| TOTAL | 35,119,656,409.973 | 100.000 |
| Patricia L. Kampling |
| Affirmative | 32,313,755,598.535 | 92.010 |
| Withheld | 2,805,900,811.438 | 7.990 |
| TOTAL | 35,119,656,409.973 | 100.000 |
| Alan J. Lacy |
| Affirmative | 31,990,158,754.948 | 91.089 |
| Withheld | 3,129,497,655.026 | 8.911 |
| TOTAL | 35,119,656,409.973 | 100.000 |
| Ned C. Lautenbach |
| Affirmative | 32,043,019,991.143 | 91.240 |
| Withheld | 3,076,636,418.830 | 8.760 |
| TOTAL | 35,119,656,409.973 | 100.000 |
| Robert A. Lawrence |
| Affirmative | 32,150,842,398.009 | 91.547 |
| Withheld | 2,968,814,011.965 | 8.453 |
| TOTAL | 35,119,656,409.973 | 100.000 |
| Joseph Mauriello |
| Affirmative | 32,082,201,213.166 | 91.351 |
| Withheld | 3,037,455,196.807 | 8.649 |
| TOTAL | 35,119,656,409.973 | 100.000 |
| Cornelia M. Small |
| Affirmative | 32,207,976,835.934 | 91.709 |
| Withheld | 2,911,679,574.039 | 8.291 |
| TOTAL | 35,119,656,409.973 | 100.000 |
| Garnett A. Smith |
| Affirmative | 32,102,654,343.096 | 91.409 |
| Withheld | 3,017,002,066.877 | 8.591 |
| TOTAL | 35,119,656,409.973 | 100.000 |
| David M. Thomas |
| Affirmative | 32,150,749,424.556 | 91.546 |
| Withheld | 2,968,906,985.418 | 8.454 |
| TOTAL | 35,119,656,409.973 | 100.000 |
| Susan Tomasky |
| Affirmative | 32,381,933,484.515 | 92.205 |
| Withheld | 2,737,722,925.459 | 7.795 |
| TOTAL | 35,119,656,409.973 | 100.000 |
| Michael E. Wiley |
| Affirmative | 32,135,064,741.973 | 91.502 |
| Withheld | 2,984,591,668.000 | 8.498 |
| TOTAL | 35,119,656,409.973 | 100.000 |
|
| Proposal 1 reflects trust wide proposal and voting results. |
SELTS-ANN-0421
1.846050.114
Fidelity® Select Portfolios®
Consumer Staples Sector
Consumer Staples Portfolio
Annual Report
February 28, 2021
Includes Fidelity and Fidelity Advisor share classes
Contents
To view a fund's proxy voting guidelines and proxy voting record for the 12-month period ended June 30, visit http://www.fidelity.com/proxyvotingresults or visit the Securities and Exchange Commission's (SEC) web site at http://www.sec.gov.
You may also call 1-800-544-8544 if you’re an individual investing directly with Fidelity, call 1-800-835-5092 if you’re a plan sponsor or participant with Fidelity as your recordkeeper or call 1-877-208-0098 on institutional accounts or if you’re an advisor or invest through one to request a free copy of the proxy voting guidelines.
Standard & Poor's, S&P and S&P 500 are registered service marks of The McGraw-Hill Companies, Inc. and have been licensed for use by Fidelity Distributors Corporation.
Other third-party marks appearing herein are the property of their respective owners.
All other marks appearing herein are registered or unregistered trademarks or service marks of FMR LLC or an affiliated company. © 2021 FMR LLC. All rights reserved.
This report and the financial statements contained herein are submitted for the general information of the shareholders of the Fund. This report is not authorized for distribution to prospective investors in the Fund unless preceded or accompanied by an effective prospectus.
A fund files its complete schedule of portfolio holdings with the SEC for the first and third quarters of each fiscal year on Form N-PORT. Forms N-PORT are available on the SEC’s web site at http://www.sec.gov. A fund's Forms N-PORT may be reviewed and copied at the SEC’s Public Reference Room in Washington, DC. Information regarding the operation of the SEC's Public Reference Room may be obtained by calling 1-800-SEC-0330.
For a complete list of a fund's portfolio holdings, view the most recent holdings listing, semiannual report, or annual report on Fidelity's web site at http://www.fidelity.com, http://www.institutional.fidelity.com, or http://www.401k.com, as applicable.
NOT FDIC INSURED •MAY LOSE VALUE •NO BANK GUARANTEE
Neither the Fund nor Fidelity Distributors Corporation is a bank.
Note to Shareholders:
Early in 2020, the outbreak and spread of a new coronavirus emerged as a public health emergency that had a major influence on financial markets, primarily based on its impact on the global economy and the outlook for corporate earnings. The virus causes a respiratory disease known as COVID-19. On March 11, 2020 the World Health Organization declared the COVID-19 outbreak a pandemic, citing sustained risk of further global spread.
In the weeks following, as the crisis worsened, we witnessed an escalating human tragedy with wide-scale social and economic consequences from coronavirus-containment measures. The outbreak of COVID-19 prompted a number of measures to limit the spread, including travel and border restrictions, quarantines, and restrictions on large gatherings. In turn, these resulted in lower consumer activity, diminished demand for a wide range of products and services, disruption in manufacturing and supply chains, and – given the wide variability in outcomes regarding the outbreak – significant market uncertainty and volatility. Amid the turmoil, global governments and central banks took unprecedented action to help support consumers, businesses, and the broader economies, and to limit disruption to financial systems.
The situation continues to unfold, and the extent and duration of its impact on financial markets and the economy remain highly uncertain. Extreme events such as the coronavirus crisis are “exogenous shocks” that can have significant adverse effects on mutual funds and their investments. Although multiple asset classes may be affected by market disruption, the duration and impact may not be the same for all types of assets.
Fidelity is committed to helping you stay informed amid news about COVID-19 and during increased market volatility, and we’re taking extra steps to be responsive to customer needs. We encourage you to visit our websites, where we offer ongoing updates, commentary, and analysis on the markets and our funds.
Performance: The Bottom Line
Average annual total return reflects the change in the value of an investment, assuming reinvestment of distributions from dividend income and capital gains (the profits earned upon the sale of securities that have grown in value, if any) and assuming a constant rate of performance each year. The hypothetical investment and the average annual total returns do not reflect the deduction of taxes that a shareholder would pay on fund distributions or the redemption of fund shares. During periods of reimbursement by Fidelity, a fund’s total return will be greater than it would be had the reimbursement not occurred. How a fund did yesterday is no guarantee of how it will do tomorrow.
Average Annual Total Returns
| For the periods ended February 28, 2021 | Past 1 year | Past 5 years | Past 10 years |
| Class A (incl. 5.75% sales charge) | 9.33% | 4.95% | 8.39% |
| Class M (incl. 3.50% sales charge) | 11.64% | 5.16% | 8.35% |
| Class C (incl. contingent deferred sales charge) | 14.14% | 5.41% | 8.23% |
| Consumer Staples Portfolio | 16.34% | 6.51% | 9.35% |
| Class I | 16.32% | 6.49% | 9.32% |
| Class Z | 16.49% | 6.56% | 9.36% |
Class C shares' contingent deferred sales charges included in the past one year, past five years and past ten years total return figures are 1%, 0% and 0%, respectively.
The initial offering of Class Z shares took place on October 2, 2018. Returns prior to October 2, 2018, are those of Class I.
$10,000 Over 10 Years
Let's say hypothetically that $10,000 was invested in Consumer Staples Portfolio, a class of the fund, on February 28, 2011.
The chart shows how the value of your investment would have changed, and also shows how the S&P 500® Index performed over the same period.
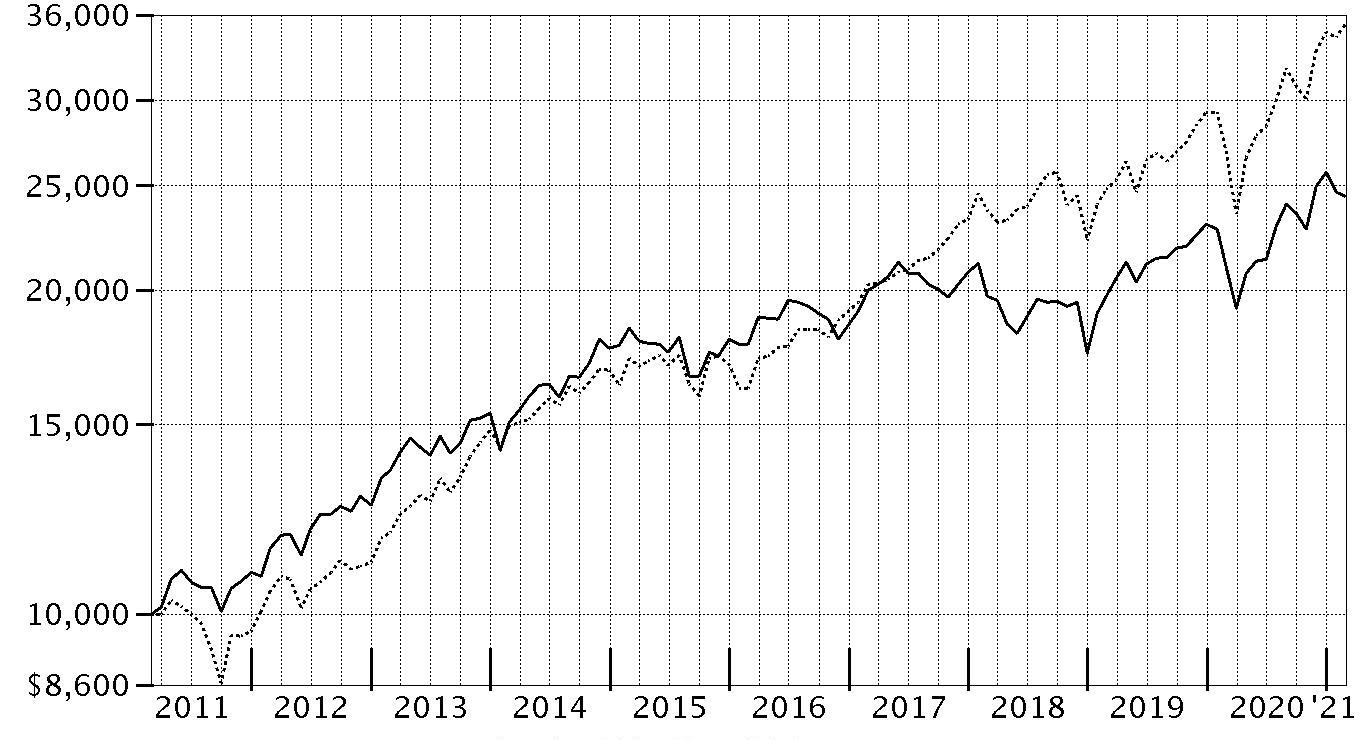
| Period Ending Values |
| $24,434 | Consumer Staples Portfolio |
| $35,259 | S&P 500® Index |
Management's Discussion of Fund Performance
Market Recap: The S&P 500
® index gained 31.29% for the 12 months ending February 28, 2021, a volatile but productive period for U.S. risk assets. The early-2020 outbreak and spread of COVID-19 resulted in stocks suffering one of the quickest declines on record, through March 23, followed by a historic rebound that included the index closing 2020 at an all-time high and gaining modest ground in the first two months of the new year. The crisis and containment efforts caused broad contraction in economic activity, along with extreme uncertainty and dislocation in financial markets. A rapid and expansive U.S. monetary/fiscal-policy response partially offset the economic disruption and fueled the market surge, as did resilient corporate earnings. The rally slowed in September, when stocks began a two-month retreat amid Congress’s inability to reach a deal on additional fiscal stimulus, as well as concerns about election uncertainty, indications the U.S. economic recovery could be slowing and a new wave of COVID-19 cases. A shift in momentum began in October and accelerated following the U.S. elections, with the approval of three breakthrough COVID-19 vaccines and prospects for additional government stimulus fueling the “reflation trade” through February 28. By sector for the full 12 months, information technology (+50%) and consumer discretionary (+43%) led all gainers. Materials (+42%) and communication services (+37%) also stood out. In contrast, the defensive utilities (-3%) and real estate sectors (+5%) notably lagged.
Comments from Portfolio Manager Ben Shuleva: For the fiscal year ending February 28, 2021, the fund's share classes (excluding sales charges, if applicable) gained about 15% to 16%, roughly in line with the 15.61% return of the MSCI US IMI Consumer Staples 25/50 Index, but underperforming the broad-based S&P 500
® index. Versus the sector index, security selection was the primary contributor, especially within the packaged foods & meats and soft drinks segments. The biggest individual relative contributor was an overweight position in Lamb Weston Holdings (+60%), which we added to the portfolio in the first half of the period. Also bolstering performance was our overweighting in Monster Beverage (+41%), one of our largest holdings, and an outsized stake in TreeHouse Foods (+41%). In contrast, stock selection and an underweighting in personal products detracted from performance versus the sector index. An overweighting in soft drinks and underweighting in agricultural products also hindered the fund’s relative result. The biggest individual relative detractor was an underweighting in Estée Lauder, which gained roughly 57% the past year and was not held at period end. Having an overweighting in Coty (-44%), which we eliminated from the portfolio before period end, and an underweighting in Archer Daniels Midland, which rose 55% this period, further detracted. Archer Daniels Midland was a new addition to the fund this period. Notable changes in positioning include increased exposure to the household products and soft drinks groups and a lower allocation to the packaged foods & meats and personal products segments.
The views expressed above reflect those of the portfolio manager(s) only through the end of the period as stated on the cover of this report and do not necessarily represent the views of Fidelity or any other person in the Fidelity organization. Any such views are subject to change at any time based upon market or other conditions and Fidelity disclaims any responsibility to update such views. These views may not be relied on as investment advice and, because investment decisions for a Fidelity fund are based on numerous factors, may not be relied on as an indication of trading intent on behalf of any Fidelity fund.
Note to shareholders: On July 1, 2020, Ben Shuleva became sole manager of the fund after having served as co-manager with Nicola Stafford since January 2020.
Investment Summary (Unaudited)
Top Ten Stocks as of February 28, 2021
| | % of fund's net assets |
| Procter & Gamble Co. | 16.9 |
| The Coca-Cola Co. | 13.2 |
| PepsiCo, Inc. | 7.6 |
| Mondelez International, Inc. | 6.9 |
| Kimberly-Clark Corp. | 5.2 |
| Walmart, Inc. | 5.0 |
| Altria Group, Inc. | 4.8 |
| Monster Beverage Corp. | 4.3 |
| Keurig Dr. Pepper, Inc. | 3.5 |
| Philip Morris International, Inc. | 3.3 |
| | 70.7 |
Top Industries (% of fund's net assets)
| As of February 28, 2021 |
| | Beverages | 33.4% |
| | Household Products | 26.1% |
| | Food Products | 16.1% |
| | Food & Staples Retailing | 11.8% |
| | Tobacco | 8.1% |
| | All Others* | 4.5% |

* Includes short-term investments and net other assets (liabilities).
Schedule of Investments February 28, 2021
Showing Percentage of Net Assets
| Common Stocks - 99.5% | | | |
| | | Shares | Value |
| Beverages - 33.4% | | | |
| Brewers - 0.4% | | | |
| Molson Coors Beverage Co. Class B | | 130,100 | $5,782,945 |
| Distillers & Vintners - 4.2% | | | |
| Constellation Brands, Inc. Class A (sub. vtg.) | | 113,800 | 24,369,132 |
| Diageo PLC | | 813,018 | 31,857,094 |
| Pernod Ricard SA | | 3,800 | 721,432 |
| | | | 56,947,658 |
| Soft Drinks - 28.8% | | | |
| Coca-Cola Bottling Co. Consolidated | | 1,800 | 461,988 |
| GURU Organic Energy Corp. (a)(b) | | 23,900 | 323,587 |
| Keurig Dr. Pepper, Inc. (b) | | 1,556,300 | 47,498,276 |
| Monster Beverage Corp. (a) | | 657,802 | 57,715,547 |
| PepsiCo, Inc. | | 791,600 | 102,266,804 |
| Primo Water Corp. | | 200,800 | 2,869,432 |
| The Coca-Cola Co. | | 3,655,118 | 179,064,231 |
| | | | 390,199,865 |
|
| TOTAL BEVERAGES | | | 452,930,468 |
|
| Food & Staples Retailing - 11.8% | | | |
| Drug Retail - 0.2% | | | |
| Walgreens Boots Alliance, Inc. | | 44,400 | 2,128,092 |
| Food Distributors - 1.4% | | | |
| Sysco Corp. | | 72,100 | 5,741,323 |
| U.S. Foods Holding Corp. (a) | | 364,916 | 13,304,837 |
| | | | 19,046,160 |
| Food Retail - 2.0% | | | |
| Grocery Outlet Holding Corp. (a) | | 5,100 | 183,549 |
| Kroger Co. | | 837,770 | 26,984,572 |
| | | | 27,168,121 |
| Hypermarkets & Super Centers - 8.2% | | | |
| BJ's Wholesale Club Holdings, Inc. (a) | | 130,400 | 5,239,472 |
| Costco Wholesale Corp. | | 116,800 | 38,660,800 |
| Walmart, Inc. | | 520,400 | 67,610,368 |
| | | | 111,510,640 |
|
| TOTAL FOOD & STAPLES RETAILING | | | 159,853,013 |
|
| Food Products - 16.1% | | | |
| Agricultural Products - 1.7% | | | |
| Archer Daniels Midland Co. | | 65,500 | 3,705,990 |
| Bunge Ltd. | | 132,600 | 10,154,508 |
| Darling Ingredients, Inc. (a) | | 139,300 | 8,781,472 |
| | | | 22,641,970 |
| Packaged Foods & Meats - 14.4% | | | |
| Conagra Brands, Inc. | | 439,400 | 14,908,842 |
| Farmer Brothers Co. (a) | | 40,447 | 315,891 |
| General Mills, Inc. | | 157,100 | 8,642,071 |
| JDE Peet's BV | | 172,100 | 6,987,330 |
| Laird Superfood, Inc. | | 2,100 | 82,887 |
| Lamb Weston Holdings, Inc. | | 313,480 | 25,006,300 |
| Mondelez International, Inc. | | 1,767,158 | 93,942,119 |
| Nomad Foods Ltd. (a) | | 436,700 | 10,314,854 |
| Pilgrim's Pride Corp. (a) | | 29,100 | 651,549 |
| Post Holdings, Inc. (a) | | 48,800 | 4,687,728 |
| Sanderson Farms, Inc. | | 17,400 | 2,653,500 |
| TreeHouse Foods, Inc. (a) | | 268,900 | 13,450,378 |
| Tyson Foods, Inc. Class A | | 210,800 | 14,264,836 |
| | | | 195,908,285 |
|
| TOTAL FOOD PRODUCTS | | | 218,550,255 |
|
| Hotels, Restaurants & Leisure - 0.9% | | | |
| Restaurants - 0.9% | | | |
| Compass Group PLC | | 575,600 | 11,688,686 |
| Household Durables - 0.1% | | | |
| Housewares & Specialties - 0.1% | | | |
| Tupperware Brands Corp. (a) | | 62,200 | 1,901,454 |
| Household Products - 26.1% | | | |
| Household Products - 26.1% | | | |
| Clorox Co. | | 105,600 | 19,118,880 |
| Energizer Holdings, Inc. (b) | | 162,900 | 6,809,220 |
| Kimberly-Clark Corp. | | 547,800 | 70,299,174 |
| Procter & Gamble Co. | | 1,856,450 | 229,327,269 |
| Reckitt Benckiser Group PLC | | 104,400 | 8,757,176 |
| Reynolds Consumer Products, Inc. (b) | | 657,213 | 18,145,651 |
| Spectrum Brands Holdings, Inc. | | 16,547 | 1,283,220 |
| | | | 353,740,590 |
| Internet & Direct Marketing Retail - 0.4% | | | |
| Internet & Direct Marketing Retail - 0.4% | | | |
| The Honest Co., Inc. (a)(c)(d) | | 212,235 | 5,617,648 |
| Personal Products - 2.6% | | | |
| Personal Products - 2.6% | | | |
| Edgewell Personal Care Co. | | 100,861 | 3,085,338 |
| Herbalife Nutrition Ltd. (a) | | 679,800 | 30,577,404 |
| Shiseido Co. Ltd. | | 28,900 | 2,160,334 |
| | | | 35,823,076 |
| Tobacco - 8.1% | | | |
| Tobacco - 8.1% | | | |
| Altria Group, Inc. | | 1,503,625 | 65,558,050 |
| Philip Morris International, Inc. | | 528,991 | 44,445,824 |
| | | | 110,003,874 |
| TOTAL COMMON STOCKS | | | |
| (Cost $1,083,759,777) | | | 1,350,109,064 |
|
| Money Market Funds - 2.5% | | | |
| Fidelity Securities Lending Cash Central Fund 0.08% (e)(f) | | | |
| (Cost $33,838,939) | | 33,835,555 | 33,838,939 |
| TOTAL INVESTMENT IN SECURITIES - 102.0% | | | |
| (Cost $1,117,598,716) | | | 1,383,948,003 |
| NET OTHER ASSETS (LIABILITIES) - (2.0)% | | | (26,962,338) |
| NET ASSETS - 100% | | | $1,356,985,665 |
Legend
(a) Non-income producing
(b) Security or a portion of the security is on loan at period end.
(c) Restricted securities (including private placements) - Investment in securities not registered under the Securities Act of 1933 (excluding 144A issues). At the end of the period, the value of restricted securities (excluding 144A issues) amounted to $5,617,648 or 0.4% of net assets.
(d) Level 3 security
(e) Affiliated fund that is generally available only to investment companies and other accounts managed by Fidelity Investments. The rate quoted is the annualized seven-day yield of the fund at period end. A complete unaudited listing of the fund's holdings as of its most recent quarter end is available upon request. In addition, each Fidelity Central Fund's financial statements, which are not covered by the Fund's Report of Independent Registered Public Accounting Firm, are available on the SEC's website or upon request.
(f) Investment made with cash collateral received from securities on loan.
Additional information on each restricted holding is as follows:
| Security | Acquisition Date | Acquisition Cost |
| The Honest Co., Inc. | 8/28/18 | $2,381,277 |
Affiliated Central Funds
Information regarding fiscal year to date income earned by the Fund from investments in Fidelity Central Funds is as follows:
| Fund | Income earned |
| Fidelity Cash Central Fund | $10,591 |
| Fidelity Securities Lending Cash Central Fund | 122,434 |
| Total | $133,025 |
Amounts in the income column in the above table include any capital gain distributions from underlying funds, which are presented in the corresponding line-item in the Statement of Operations, if applicable. Amount for Fidelity Securities Lending Cash Central Fund represents the income earned on investing cash collateral, less rebates paid to borrowers and any lending agent fees associated with the loan, plus any premium payments received for lending certain types of securities.
Investment Valuation
The following is a summary of the inputs used, as of February 28, 2021, involving the Fund's assets and liabilities carried at fair value. The inputs or methodology used for valuing securities may not be an indication of the risk associated with investing in those securities. For more information on valuation inputs, and their aggregation into the levels used below, please refer to the Investment Valuation section in the accompanying Notes to Financial Statements.
| | Valuation Inputs at Reporting Date: |
| Description | Total | Level 1 | Level 2 | Level 3 |
| Investments in Securities: | | | | |
| Common Stocks | $1,350,109,064 | $1,321,885,220 | $22,606,196 | $5,617,648 |
| Money Market Funds | 33,838,939 | 33,838,939 | -- | -- |
| Total Investments in Securities: | $1,383,948,003 | $1,355,724,159 | $22,606,196 | $5,617,648 |
See accompanying notes which are an integral part of the financial statements.
Financial Statements
Statement of Assets and Liabilities
| | | February 28, 2021 |
| Assets | | |
Investment in securities, at value (including securities loaned of $32,751,839) — See accompanying schedule:
Unaffiliated issuers (cost $1,083,759,777) | $1,350,109,064 | |
| Fidelity Central Funds (cost $33,838,939) | 33,838,939 | |
| Total Investment in Securities (cost $1,117,598,716) | | $1,383,948,003 |
| Receivable for investments sold | | 18,157,076 |
| Receivable for fund shares sold | | 768,559 |
| Dividends receivable | | 1,603,543 |
| Distributions receivable from Fidelity Central Funds | | 4,100 |
| Prepaid expenses | | 12,118 |
| Other receivables | | 286,191 |
| Total assets | | 1,404,779,590 |
| Liabilities | | |
| Payable to custodian bank | $551,647 | |
| Payable for investments purchased | 10,407,283 | |
| Payable for fund shares redeemed | 1,395,348 | |
| Accrued management fee | 619,532 | |
| Distribution and service plan fees payable | 170,801 | |
| Notes payable to affiliates | 242,000 | |
| Other affiliated payables | 238,846 | |
| Other payables and accrued expenses | 329,758 | |
| Collateral on securities loaned | 33,838,710 | |
| Total liabilities | | 47,793,925 |
| Net Assets | | $1,356,985,665 |
| Net Assets consist of: | | |
| Paid in capital | | $1,049,766,066 |
| Total accumulated earnings (loss) | | 307,219,599 |
| Net Assets | | $1,356,985,665 |
| Net Asset Value and Maximum Offering Price | | |
| Class A: | | |
| Net Asset Value and redemption price per share ($248,233,683 ÷ 2,776,530 shares)(a) | | $89.40 |
| Maximum offering price per share (100/94.25 of $89.40) | | $94.85 |
| Class M: | | |
| Net Asset Value and redemption price per share ($56,664,222 ÷ 640,763 shares)(a) | | $88.43 |
| Maximum offering price per share (100/96.50 of $88.43) | | $91.64 |
| Class C: | | |
| Net Asset Value and offering price per share ($104,954,968 ÷ 1,210,146 shares)(a) | | $86.73 |
| Consumer Staples: | | |
| Net Asset Value, offering price and redemption price per share ($770,643,994 ÷ 8,524,912 shares) | | $90.40 |
| Class I: | | |
| Net Asset Value, offering price and redemption price per share ($132,897,873 ÷ 1,473,794 shares) | | $90.17 |
| Class Z: | | |
| Net Asset Value, offering price and redemption price per share ($43,590,925 ÷ 483,918 shares) | | $90.08 |
(a) Redemption price per share is equal to net asset value less any applicable contingent deferred sales charge.
See accompanying notes which are an integral part of the financial statements.
Statement of Operations
| | | Year ended February 28, 2021 |
| Investment Income | | |
| Dividends | | $36,093,904 |
| Income from Fidelity Central Funds (including $122,434 from security lending) | | 133,025 |
| Total income | | 36,226,929 |
| Expenses | | |
| Management fee | $7,374,480 | |
| Transfer agent fees | 2,474,952 | |
| Distribution and service plan fees | 2,047,523 | |
| Accounting fees | 439,662 | |
| Custodian fees and expenses | 19,480 | |
| Independent trustees' fees and expenses | 7,853 | |
| Registration fees | 113,353 | |
| Audit | 55,196 | |
| Legal | 2,252 | |
| Interest | 3,356 | |
| Miscellaneous | 48,541 | |
| Total expenses before reductions | 12,586,648 | |
| Expense reductions | (106,956) | |
| Total expenses after reductions | | 12,479,692 |
| Net investment income (loss) | | 23,747,237 |
| Realized and Unrealized Gain (Loss) | | |
| Net realized gain (loss) on: | | |
| Investment securities: | | |
| Unaffiliated issuers | 57,779,536 | |
| Fidelity Central Funds | (1,066) | |
| Foreign currency transactions | (91,634) | |
| Total net realized gain (loss) | | 57,686,836 |
| Change in net unrealized appreciation (depreciation) on: | | |
| Investment securities: | | |
| Unaffiliated issuers | 128,298,001 | |
| Assets and liabilities in foreign currencies | 32,785 | |
| Total change in net unrealized appreciation (depreciation) | | 128,330,786 |
| Net gain (loss) | | 186,017,622 |
| Net increase (decrease) in net assets resulting from operations | | $209,764,859 |
See accompanying notes which are an integral part of the financial statements.
Statement of Changes in Net Assets
| | Year ended February 28, 2021 | Year ended February 29, 2020 |
| Increase (Decrease) in Net Assets | | |
| Operations | | |
| Net investment income (loss) | $23,747,237 | $26,852,529 |
| Net realized gain (loss) | 57,686,836 | 53,490,769 |
| Change in net unrealized appreciation (depreciation) | 128,330,786 | 13,961,676 |
| Net increase (decrease) in net assets resulting from operations | 209,764,859 | 94,304,974 |
| Distributions to shareholders | (46,152,171) | (40,720,449) |
| Share transactions - net increase (decrease) | (183,556,146) | (101,581,970) |
| Total increase (decrease) in net assets | (19,943,458) | (47,997,445) |
| Net Assets | | |
| Beginning of period | 1,376,929,123 | 1,424,926,568 |
| End of period | $1,356,985,665 | $1,376,929,123 |
See accompanying notes which are an integral part of the financial statements.
Financial Highlights
Consumer Staples Portfolio Class A
| Years ended February 28, | 2021 | 2020 A | 2019 | 2018 | 2017 |
| Selected Per–Share Data | | | | | |
| Net asset value, beginning of period | $79.57 | $76.88 | $87.07 | $96.18 | $89.78 |
| Income from Investment Operations | | | | | |
| Net investment income (loss)B | 1.34 | 1.40 | 2.08C | 1.54 | 1.28 |
| Net realized and unrealized gain (loss) | 11.24 | 3.54 | (2.64) | (2.80) | 9.12 |
| Total from investment operations | 12.58 | 4.94 | (.56) | (1.26) | 10.40 |
| Distributions from net investment income | (1.42) | (1.35) | (2.11) | (1.55) | (1.37) |
| Distributions from net realized gain | (1.33) | (.90) | (7.53) | (6.30) | (2.64) |
| Total distributions | (2.75) | (2.25) | (9.63)D | (7.85) | (4.00)D |
| Redemption fees added to paid in capitalB | – | – | – | – | –E |
| Net asset value, end of period | $89.40 | $79.57 | $76.88 | $87.07 | $96.18 |
| Total ReturnF,G | 16.00% | 6.17% | (.32)% | (1.68)% | 11.91% |
| Ratios to Average Net AssetsH,I | | | | | |
| Expenses before reductions | 1.04% | 1.04% | 1.05% | 1.05% | 1.04% |
| Expenses net of fee waivers, if any | 1.04% | 1.04% | 1.05% | 1.05% | 1.04% |
| Expenses net of all reductions | 1.03% | 1.04% | 1.04% | 1.04% | 1.03% |
| Net investment income (loss) | 1.57% | 1.67% | 2.65%C | 1.60% | 1.37% |
| Supplemental Data | | | | | |
| Net assets, end of period (000 omitted) | $248,234 | $239,067 | $232,020 | $317,366 | $522,014 |
| Portfolio turnover rateJ | 51% | 40% | 41%K | 76% | 56%K |
A For the year ended February 29.
B Calculated based on average shares outstanding during the period.
C Net investment income per share reflects one or more large, non-recurring dividend(s) which amounted to $.69 per share. Excluding such non-recurring dividend(s), the ratio of net investment income (loss) to average net assets would have been 1.78%.
D Total distributions per share do not sum due to rounding.
E Amount represents less than $.005 per share.
F Total returns would have been lower if certain expenses had not been reduced during the applicable periods shown.
G Total returns do not include the effect of the sales charges.
H Fees and expenses of any underlying mutual funds or exchange-traded funds (ETFs) are not included in the Fund's expense ratio. The Fund indirectly bears its proportionate share of these expenses. For additional expense information related to investments in Fidelity Central Funds, please refer to the "Investments in Fidelity Central Funds" note found in the Notes to Financial Statements section of the most recent Annual or Semi-Annual report.
I Expense ratios reflect operating expenses of the class. Expenses before reductions do not reflect amounts reimbursed, waived, or reduced through arrangements with the investment adviser, brokerage services, or other offset arrangements, if applicable, and do not represent the amount paid by the class during periods when reimbursements, waivers or reductions occur.
J Amount does not include the portfolio activity of any underlying mutual funds or exchange-traded funds (ETFs).
K Portfolio turnover rate excludes securities received or delivered in-kind.
See accompanying notes which are an integral part of the financial statements.
Consumer Staples Portfolio Class M
| Years ended February 28, | 2021 | 2020 A | 2019 | 2018 | 2017 |
| Selected Per–Share Data | | | | | |
| Net asset value, beginning of period | $78.74 | $76.13 | $86.30 | $95.42 | $89.10 |
| Income from Investment Operations | | | | | |
| Net investment income (loss)B | 1.10 | 1.16 | 1.85C | 1.27 | 1.01 |
| Net realized and unrealized gain (loss) | 11.11 | 3.50 | (2.61) | (2.78) | 9.07 |
| Total from investment operations | 12.21 | 4.66 | (.76) | (1.51) | 10.08 |
| Distributions from net investment income | (1.19) | (1.15) | (1.88) | (1.31) | (1.12) |
| Distributions from net realized gain | (1.33) | (.90) | (7.53) | (6.30) | (2.64) |
| Total distributions | (2.52) | (2.05) | (9.41) | (7.61) | (3.76) |
| Redemption fees added to paid in capitalB | – | – | – | – | –D |
| Net asset value, end of period | $88.43 | $78.74 | $76.13 | $86.30 | $95.42 |
| Total ReturnE,F | 15.69% | 5.88% | (.59)% | (1.94)% | 11.61% |
| Ratios to Average Net AssetsG,H | | | | | |
| Expenses before reductions | 1.31% | 1.31% | 1.33% | 1.32% | 1.32% |
| Expenses net of fee waivers, if any | 1.31% | 1.31% | 1.32% | 1.32% | 1.32% |
| Expenses net of all reductions | 1.30% | 1.31% | 1.31% | 1.31% | 1.31% |
| Net investment income (loss) | 1.30% | 1.40% | 2.37%C | 1.33% | 1.09% |
| Supplemental Data | | | | | |
| Net assets, end of period (000 omitted) | $56,664 | $55,954 | $60,069 | $76,572 | $89,925 |
| Portfolio turnover rateI | 51% | 40% | 41%J | 76% | 56%J |
A For the year ended February 29.
B Calculated based on average shares outstanding during the period.
C Net investment income per share reflects one or more large, non-recurring dividend(s) which amounted to $.68 per share. Excluding such non-recurring dividend(s), the ratio of net investment income (loss) to average net assets would have been 1.50%.
D Amount represents less than $.005 per share.
E Total returns would have been lower if certain expenses had not been reduced during the applicable periods shown.
F Total returns do not include the effect of the sales charges.
G Fees and expenses of any underlying mutual funds or exchange-traded funds (ETFs) are not included in the Fund's expense ratio. The Fund indirectly bears its proportionate share of these expenses. For additional expense information related to investments in Fidelity Central Funds, please refer to the "Investments in Fidelity Central Funds" note found in the Notes to Financial Statements section of the most recent Annual or Semi-Annual report.
H Expense ratios reflect operating expenses of the class. Expenses before reductions do not reflect amounts reimbursed, waived, or reduced through arrangements with the investment adviser, brokerage services, or other offset arrangements, if applicable, and do not represent the amount paid by the class during periods when reimbursements, waivers or reductions occur.
I Amount does not include the portfolio activity of any underlying mutual funds or exchange-traded funds (ETFs).
J Portfolio turnover rate excludes securities received or delivered in-kind.
See accompanying notes which are an integral part of the financial statements.
Consumer Staples Portfolio Class C
| Years ended February 28, | 2021 | 2020 A | 2019 | 2018 | 2017 |
| Selected Per–Share Data | | | | | |
| Net asset value, beginning of period | $77.27 | $74.79 | $84.85 | $93.89 | $87.77 |
| Income from Investment Operations | | | | | |
| Net investment income (loss)B | .68 | .75 | 1.46C | .81 | .56 |
| Net realized and unrealized gain (loss) | 10.87 | 3.44 | (2.57) | (2.73) | 8.92 |
| Total from investment operations | 11.55 | 4.19 | (1.11) | (1.92) | 9.48 |
| Distributions from net investment income | (.80) | (.81) | (1.43) | (.82) | (.73) |
| Distributions from net realized gain | (1.30) | (.90) | (7.53) | (6.30) | (2.64) |
| Total distributions | (2.09)D | (1.71) | (8.95)D | (7.12) | (3.36)D |
| Redemption fees added to paid in capitalB | – | – | – | – | –E |
| Net asset value, end of period | $86.73 | $77.27 | $74.79 | $84.85 | $93.89 |
| Total ReturnF,G | 15.14% | 5.39% | (1.05)% | (2.41)% | 11.07% |
| Ratios to Average Net AssetsH,I | | | | | |
| Expenses before reductions | 1.79% | 1.79% | 1.79% | 1.79% | 1.80% |
| Expenses net of fee waivers, if any | 1.79% | 1.79% | 1.79% | 1.79% | 1.79% |
| Expenses net of all reductions | 1.78% | 1.79% | 1.78% | 1.78% | 1.79% |
| Net investment income (loss) | .83% | .92% | 1.91%C | .86% | .61% |
| Supplemental Data | | | | | |
| Net assets, end of period (000 omitted) | $104,955 | $117,328 | $150,822 | $228,874 | $308,350 |
| Portfolio turnover rateJ | 51% | 40% | 41%K | 76% | 56%K |
A For the year ended February 29.
B Calculated based on average shares outstanding during the period.
C Net investment income per share reflects one or more large, non-recurring dividend(s) which amounted to $.67 per share. Excluding such non-recurring dividend(s), the ratio of net investment income (loss) to average net assets would have been 1.04%.
D Total distributions per share do not sum due to rounding.
E Amount represents less than $.005 per share.
F Total returns would have been lower if certain expenses had not been reduced during the applicable periods shown.
G Total returns do not include the effect of the contingent deferred sales charge.
H Fees and expenses of any underlying mutual funds or exchange-traded funds (ETFs) are not included in the Fund's expense ratio. The Fund indirectly bears its proportionate share of these expenses. For additional expense information related to investments in Fidelity Central Funds, please refer to the "Investments in Fidelity Central Funds" note found in the Notes to Financial Statements section of the most recent Annual or Semi-Annual report.
I Expense ratios reflect operating expenses of the class. Expenses before reductions do not reflect amounts reimbursed, waived, or reduced through arrangements with the investment adviser, brokerage services, or other offset arrangements, if applicable, and do not represent the amount paid by the class during periods when reimbursements, waivers or reductions occur.
J Amount does not include the portfolio activity of any underlying mutual funds or exchange-traded funds (ETFs).
K Portfolio turnover rate excludes securities received or delivered in-kind.
See accompanying notes which are an integral part of the financial statements.
Consumer Staples Portfolio
| Years ended February 28, | 2021 | 2020 A | 2019 | 2018 | 2017 |
| Selected Per–Share Data | | | | | |
| Net asset value, beginning of period | $80.42 | $77.63 | $87.85 | $97.01 | $90.48 |
| Income from Investment Operations | | | | | |
| Net investment income (loss)B | 1.60 | 1.66 | 2.34C | 1.82 | 1.56 |
| Net realized and unrealized gain (loss) | 11.39 | 3.59 | (2.67) | (2.82) | 9.20 |
| Total from investment operations | 12.99 | 5.25 | (.33) | (1.00) | 10.76 |
| Distributions from net investment income | (1.68) | (1.55) | (2.36) | (1.86) | (1.60) |
| Distributions from net realized gain | (1.33) | (.90) | (7.53) | (6.30) | (2.64) |
| Total distributions | (3.01) | (2.46)D | (9.89) | (8.16) | (4.23)D |
| Redemption fees added to paid in capitalB | – | – | – | – | –E |
| Net asset value, end of period | $90.40 | $80.42 | $77.63 | $87.85 | $97.01 |
| Total ReturnF | 16.34% | 6.48% | (.03)% | (1.40)% | 12.24% |
| Ratios to Average Net AssetsG,H | | | | | |
| Expenses before reductions | .75% | .75% | .77% | .76% | .76% |
| Expenses net of fee waivers, if any | .75% | .75% | .76% | .76% | .76% |
| Expenses net of all reductions | .74% | .75% | .75% | .76% | .76% |
| Net investment income (loss) | 1.86% | 1.96% | 2.94%C | 1.89% | 1.64% |
| Supplemental Data | | | | | |
| Net assets, end of period (000 omitted) | $770,644 | $773,437 | $814,350 | $1,328,696 | $1,665,604 |
| Portfolio turnover rateI | 51% | 40% | 41%J | 76% | 56%J |
A For the year ended February 29.
B Calculated based on average shares outstanding during the period.
C Net investment income per share reflects one or more large, non-recurring dividend(s) which amounted to $.69 per share. Excluding such non-recurring dividend(s), the ratio of net investment income (loss) to average net assets would have been 2.07%.
D Total distributions per share do not sum due to rounding.
E Amount represents less than $.005 per share.
F Total returns would have been lower if certain expenses had not been reduced during the applicable periods shown.
G Fees and expenses of any underlying mutual funds or exchange-traded funds (ETFs) are not included in the Fund's expense ratio. The Fund indirectly bears its proportionate share of these expenses. For additional expense information related to investments in Fidelity Central Funds, please refer to the "Investments in Fidelity Central Funds" note found in the Notes to Financial Statements section of the most recent Annual or Semi-Annual report.
H Expense ratios reflect operating expenses of the class. Expenses before reductions do not reflect amounts reimbursed, waived, or reduced through arrangements with the investment adviser, brokerage services, or other offset arrangements, if applicable, and do not represent the amount paid by the class during periods when reimbursements, waivers or reductions occur.
I Amount does not include the portfolio activity of any underlying mutual funds or exchange-traded funds (ETFs).
J Portfolio turnover rate excludes securities received or delivered in-kind.
See accompanying notes which are an integral part of the financial statements.
Consumer Staples Portfolio Class I
| Years ended February 28, | 2021 | 2020 A | 2019 | 2018 | 2017 |
| Selected Per–Share Data | | | | | |
| Net asset value, beginning of period | $80.23 | $77.45 | $87.68 | $96.82 | $90.34 |
| Income from Investment Operations | | | | | |
| Net investment income (loss)B | 1.60 | 1.65 | 2.33C | 1.81 | 1.54 |
| Net realized and unrealized gain (loss) | 11.34 | 3.58 | (2.68) | (2.82) | 9.19 |
| Total from investment operations | 12.94 | 5.23 | (.35) | (1.01) | 10.73 |
| Distributions from net investment income | (1.67) | (1.55) | (2.36) | (1.83) | (1.61) |
| Distributions from net realized gain | (1.33) | (.90) | (7.53) | (6.30) | (2.64) |
| Total distributions | (3.00) | (2.45) | (9.88)D | (8.13) | (4.25) |
| Redemption fees added to paid in capitalB | – | – | – | – | –E |
| Net asset value, end of period | $90.17 | $80.23 | $77.45 | $87.68 | $96.82 |
| Total ReturnF | 16.32% | 6.48% | (.04)% | (1.41)% | 12.22% |
| Ratios to Average Net AssetsG,H | | | | | |
| Expenses before reductions | .76% | .76% | .77% | .78% | .78% |
| Expenses net of fee waivers, if any | .75% | .76% | .77% | .78% | .78% |
| Expenses net of all reductions | .75% | .76% | .76% | .77% | .77% |
| Net investment income (loss) | 1.86% | 1.95% | 2.93%C | 1.88% | 1.63% |
| Supplemental Data | | | | | |
| Net assets, end of period (000 omitted) | $132,898 | $149,514 | $159,614 | $240,605 | $275,616 |
| Portfolio turnover rateI | 51% | 40% | 41%J | 76% | 56%J |
A For the year ended February 29.
B Calculated based on average shares outstanding during the period.
C Net investment income per share reflects one or more large, non-recurring dividend(s) which amounted to $.69 per share. Excluding such non-recurring dividend(s), the ratio of net investment income (loss) to average net assets would have been 2.06%.
D Total distributions per share do not sum due to rounding.
E Amount represents less than $.005 per share.
F Total returns would have been lower if certain expenses had not been reduced during the applicable periods shown.
G Fees and expenses of any underlying mutual funds or exchange-traded funds (ETFs) are not included in the Fund's expense ratio. The Fund indirectly bears its proportionate share of these expenses. For additional expense information related to investments in Fidelity Central Funds, please refer to the "Investments in Fidelity Central Funds" note found in the Notes to Financial Statements section of the most recent Annual or Semi-Annual report.
H Expense ratios reflect operating expenses of the class. Expenses before reductions do not reflect amounts reimbursed, waived, or reduced through arrangements with the investment adviser, brokerage services, or other offset arrangements, if applicable, and do not represent the amount paid by the class during periods when reimbursements, waivers or reductions occur.
I Amount does not include the portfolio activity of any underlying mutual funds or exchange-traded funds (ETFs).
J Portfolio turnover rate excludes securities received or delivered in-kind.
See accompanying notes which are an integral part of the financial statements.
Consumer Staples Portfolio Class Z
| Years ended February 28, | 2021 | 2020 A | 2019 B |
| Selected Per–Share Data | | | |
| Net asset value, beginning of period | $80.14 | $77.36 | $81.61 |
| Income from Investment Operations | | | |
| Net investment income (loss)C | 1.71 | 1.78 | .05D |
| Net realized and unrealized gain (loss) | 11.35 | 3.56 | .33E |
| Total from investment operations | 13.06 | 5.34 | .38 |
| Distributions from net investment income | (1.79) | (1.66) | (2.23) |
| Distributions from net realized gain | (1.33) | (.90) | (2.40) |
| Total distributions | (3.12) | (2.56) | (4.63) |
| Redemption fees added to paid in capitalC | – | – | – |
| Net asset value, end of period | $90.08 | $80.14 | $77.36 |
| Total ReturnF,G | 16.49% | 6.61% | .79% |
| Ratios to Average Net AssetsH,I | | | |
| Expenses before reductions | .62% | .63% | .63%J |
| Expenses net of fee waivers, if any | .62% | .63% | .62%J |
| Expenses net of all reductions | .62% | .62% | .61%J |
| Net investment income (loss) | 1.99% | 2.08% | .16%D,J |
| Supplemental Data | | | |
| Net assets, end of period (000 omitted) | $43,591 | $41,629 | $8,052 |
| Portfolio turnover rateK | 51% | 40% | 41%L |
A For the year ended February 29.
B For the period October 2, 2018 (commencement of sale of shares) to February 28, 2019.
C Calculated based on average shares outstanding during the period.
D Net investment income per share reflects one or more large, non-recurring dividend(s) which amounted to $.26 per share. Excluding such non-recurring dividend(s), the ratio of net investment income (loss) to average net assets would have been (.69) %.
E The amount shown for a share outstanding does not correspond with the aggregate net gain (loss) on investments for the period due to the timing of sales and repurchases of shares in relation to fluctuating market values of the investments of the Fund.
F Total returns for periods of less than one year are not annualized.
G Total returns would have been lower if certain expenses had not been reduced during the applicable periods shown.
H Fees and expenses of any underlying mutual funds or exchange-traded funds (ETFs) are not included in the Fund's expense ratio. The Fund indirectly bears its proportionate share of these expenses. For additional expense information related to investments in Fidelity Central Funds, please refer to the "Investments in Fidelity Central Funds" note found in the Notes to Financial Statements section of the most recent Annual or Semi-Annual report.
I Expense ratios reflect operating expenses of the class. Expenses before reductions do not reflect amounts reimbursed, waived, or reduced through arrangements with the investment adviser, brokerage services, or other offset arrangements, if applicable, and do not represent the amount paid by the class during periods when reimbursements, waivers or reductions occur.
J Annualized
K Amount does not include the portfolio activity of any underlying mutual funds or exchange-traded funds (ETFs).
L Portfolio turnover rate excludes securities received or delivered in-kind.
See accompanying notes which are an integral part of the financial statements.
Notes to Financial Statements
For the period ended February 28, 2021
1. Organization.
Consumer Staples Portfolio (the Fund) is a non-diversified fund of Fidelity Select Portfolios (the Trust) and is authorized to issue an unlimited number of shares. The Trust is registered under the Investment Company Act of 1940, as amended (the 1940 Act), as an open-end management investment company organized as a Massachusetts business trust. The Fund invests primarily in securities of companies whose principal business activities fall within specific industries. The Fund offers Class A, Class M, Class C, Consumer Staples, Class I and Class Z shares, each of which has equal rights as to assets and voting privileges. Each class has exclusive voting rights with respect to matters that affect that class. Class C shares will automatically convert to Class A shares after a holding period of ten years from the initial date of purchase, with certain exceptions.
2. Investments in Fidelity Central Funds.
The Fund invests in Fidelity Central Funds, which are open-end investment companies generally available only to other investment companies and accounts managed by the investment adviser and its affiliates. The Fund's Schedule of Investments lists each of the Fidelity Central Funds held as of period end, if any, as an investment of the Fund, but does not include the underlying holdings of each Fidelity Central Fund. As an Investing Fund, the Fund indirectly bears its proportionate share of the expenses of the underlying Fidelity Central Funds.
The Money Market Central Funds seek preservation of capital and current income and are managed by the investment adviser. Annualized expenses of the Money Market Central Funds as of their most recent shareholder report date ranged from less than .005% to .01%.
A complete unaudited list of holdings for each Fidelity Central Fund is available upon request or at the Securities and Exchange Commission (the SEC) website at www.sec.gov. In addition, the financial statements of the Fidelity Central Funds, which are not covered by the Fund's Report of Independent Registered Public Accounting Firm, are available on the SEC website or upon request.
3. Significant Accounting Policies.
The Fund is an investment company and applies the accounting and reporting guidance of the Financial Accounting Standards Board (FASB) Accounting Standards Codification Topic 946 Financial Services - Investment Companies. The financial statements have been prepared in conformity with accounting principles generally accepted in the United States of America (GAAP), which require management to make certain estimates and assumptions at the date of the financial statements. Actual results could differ from those estimates. Subsequent events, if any, through the date that the financial statements were issued have been evaluated in the preparation of the financial statements. The following summarizes the significant accounting policies of the Fund:
Investment Valuation. Investments are valued as of 4:00 p.m. Eastern time on the last calendar day of the period. The Board of Trustees (the Board) has delegated the day to day responsibility for the valuation of the Fund's investments to the Fair Value Committee (the Committee) established by the Fund's investment adviser. In accordance with valuation policies and procedures approved by the Board, the Fund attempts to obtain prices from one or more third party pricing vendors or brokers to value its investments. When current market prices, quotations or currency exchange rates are not readily available or reliable, investments will be fair valued in good faith by the Committee, in accordance with procedures adopted by the Board. Factors used in determining fair value vary by investment type and may include market or investment specific events. The frequency with which these procedures are used cannot be predicted and they may be utilized to a significant extent. The Committee oversees the Fund's valuation policies and procedures and reports to the Board on the Committee's activities and fair value determinations. The Board monitors the appropriateness of the procedures used in valuing the Fund's investments and ratifies the fair value determinations of the Committee.
The Fund categorizes the inputs to valuation techniques used to value its investments into a disclosure hierarchy consisting of three levels as shown below:
- Level 1 – quoted prices in active markets for identical investments
- Level 2 – other significant observable inputs (including quoted prices for similar investments, interest rates, prepayment speeds, etc.)
- Level 3 – unobservable inputs (including the Fund's own assumptions based on the best information available)
Valuation techniques used to value the Fund's investments by major category are as follows:
Equity securities, including restricted securities, for which market quotations are readily available, are valued at the last reported sale price or official closing price as reported by a third party pricing vendor on the primary market or exchange on which they are traded and are categorized as Level 1 in the hierarchy. In the event there were no sales during the day or closing prices are not available, securities are valued at the last quoted bid price or may be valued using the last available price and are generally categorized as Level 2 in the hierarchy. For foreign equity securities, when market or security specific events arise, comparisons to the valuation of American Depositary Receipts (ADRs), futures contracts, Exchange-Traded Funds (ETFs) and certain indexes as well as quoted prices for similar securities may be used and would be categorized as Level 2 in the hierarchy. For equity securities, including restricted securities, where observable inputs are limited, assumptions about market activity and risk are used and these securities may be categorized as Level 3 in the hierarchy.
Investments in open-end mutual funds, including the Fidelity Central Funds, are valued at their closing net asset value (NAV) each business day and are categorized as Level 1 in the hierarchy.
Changes in valuation techniques may result in transfers in or out of an assigned level within the disclosure hierarchy. The aggregate value of investments by input level as of February 28, 2021 is included at the end of the Fund's Schedule of Investments.
Foreign Currency. Certain Funds may use foreign currency contracts to facilitate transactions in foreign-denominated securities. Gains and losses from these transactions may arise from changes in the value of the foreign currency or if the counterparties do not perform under the contracts' terms.
Foreign-denominated assets, including investment securities, and liabilities are translated into U.S. dollars at the exchange rates at period end. Purchases and sales of investment securities, income and dividends received, and expenses denominated in foreign currencies are translated into U.S. dollars at the exchange rate in effect on the transaction date.
The effects of exchange rate fluctuations on investments are included with the net realized and unrealized gain (loss) on investment securities. Other foreign currency transactions resulting in realized and unrealized gain (loss) are disclosed separately.
Investment Transactions and Income. For financial reporting purposes, the Fund's investment holdings and NAV include trades executed through the end of the last business day of the period. The NAV per share for processing shareholder transactions is calculated as of the close of business of the New York Stock Exchange (NYSE), normally 4:00 p.m. Eastern time and includes trades executed through the end of the prior business day. Gains and losses on securities sold are determined on the basis of identified cost and include proceeds received from litigation. Dividend income is recorded on the ex-dividend date, except for certain dividends from foreign securities where the ex-dividend date may have passed, which are recorded as soon as the Fund is informed of the ex-dividend date. Non-cash dividends included in dividend income, if any, are recorded at the fair market value of the securities received. Income and capital gain distributions from Fidelity Central Funds, if any, are recorded on the ex-dividend date. Certain distributions received by the Fund represent a return of capital or capital gain. The Fund determines the components of these distributions subsequent to the ex-dividend date, based upon receipt of tax filings or other correspondence relating to the underlying investment. These distributions are recorded as a reduction of cost of investments and/or as a realized gain. Investment income is recorded net of foreign taxes withheld where recovery of such taxes is uncertain.
Class Allocations and Expenses. Investment income, realized and unrealized capital gains and losses, common expenses of the Fund, and certain fund-level expense reductions, if any, are allocated daily on a pro-rata basis to each class based on the relative net assets of each class to the total net assets of the Fund. Each class differs with respect to transfer agent and distribution and service plan fees incurred. Certain expense reductions may also differ by class. For the reporting period, the allocated portion of income and expenses to each class as a percent of its average net assets may vary due to the timing of recording these transactions in relation to fluctuating net assets of the classes. Expenses directly attributable to a fund are charged to that fund. Expenses attributable to more than one fund are allocated among the respective funds on the basis of relative net assets or other appropriate methods. Expense estimates are accrued in the period to which they relate and adjustments are made when actual amounts are known.
Deferred Trustee Compensation. Under a Deferred Compensation Plan (the Plan) for certain Funds, certain independent Trustees have elected to defer receipt of a portion of their annual compensation. Deferred amounts are invested in affiliated mutual funds, are marked-to-market and remain in a fund until distributed in accordance with the Plan. The investment of deferred amounts and the offsetting payable to the Trustees presented below are included in the accompanying Statement of Assets and Liabilities in other receivables and other payables and accrued expenses, as applicable.
| Consumer Staples Portfolio | $284,898 |
Income Tax Information and Distributions to Shareholders. Each year, the Fund intends to qualify as a regulated investment company under Subchapter M of the Internal Revenue Code, including distributing substantially all of its taxable income and realized gains. As a result, no provision for U.S. Federal income taxes is required. As of February 28, 2021, the Fund did not have any unrecognized tax benefits in the financial statements; nor is the Fund aware of any tax positions for which it is reasonably possible that the total amounts of unrecognized tax benefits will significantly change in the next twelve months. The Fund files a U.S. federal tax return, in addition to state and local tax returns as required. The Fund's federal income tax returns are subject to examination by the Internal Revenue Service (IRS) for a period of three fiscal years after they are filed. State and local tax returns may be subject to examination for an additional fiscal year depending on the jurisdiction. Foreign taxes are provided for based on the Fund's understanding of the tax rules and rates that exist in the foreign markets in which it invests.
Distributions are declared and recorded on the ex-dividend date. Income and capital gain distributions are declared separately for each class. Income and capital gain distributions are determined in accordance with income tax regulations, which may differ from GAAP. In addition, the Fund claimed a portion of the payment made to redeeming shareholders as a distribution for income tax purposes.
Capital accounts within the financial statements are adjusted for permanent book-tax differences. These adjustments have no impact on net assets or the results of operations. Capital accounts are not adjusted for temporary book-tax differences which will reverse in a subsequent period.
Book-tax differences are primarily due to foreign currency transactions, deferred trustees compensation and losses deferred due to wash sales.
As of period end, the cost and unrealized appreciation (depreciation) in securities, and derivatives if applicable, for federal income tax purposes were as follows:
| Gross unrealized appreciation | $287,988,454 |
| Gross unrealized depreciation | (41,323,092) |
| Net unrealized appreciation (depreciation) | $246,665,362 |
| Tax Cost | $1,137,282,641 |
The tax-based components of distributable earnings as of period end were as follows:
| Undistributed ordinary income | $17,494,640 |
| Undistributed long-term capital gain | $43,310,862 |
| Net unrealized appreciation (depreciation) on securities and other investments | $246,698,994 |
The tax character of distributions paid was as follows:
| | February 28, 2021 | February 29, 2020 |
| Ordinary Income | $33,435,414 | $ 25,010,228 |
| Long-term Capital Gains | 12,716,757 | 15,710,221 |
| Total | $46,152,171 | $ 40,720,449 |
Restricted Securities (including Private Placements). The Fund may invest in securities that are subject to legal or contractual restrictions on resale. These securities generally may be resold in transactions exempt from registration or to the public if the securities are registered. Disposal of these securities may involve time-consuming negotiations and expense, and prompt sale at an acceptable price may be difficult. Information regarding restricted securities is included at the end of the Fund's Schedule of Investments.
4. Purchases and Sales of Investments.
Purchases and sales of securities, other than short-term securities, are noted in the table below.
| | Purchases ($) | Sales ($) |
| Consumer Staples Portfolio | 694,393,731 | 891,488,856 |
5. Fees and Other Transactions with Affiliates.
Management Fee. Fidelity Management & Research Company LLC (the investment adviser) and its affiliates provide the Fund with investment management related services for which the Fund pays a monthly management fee. The management fee is the sum of an individual fund fee rate that is based on an annual rate of .30% of the Fund's average net assets and an annualized group fee rate that averaged .23% during the period. The group fee rate is based upon the monthly average net assets of a group of registered investment companies with which the investment adviser has management contracts. The group fee rate decreases as assets under management increase and increases as assets under management decrease. For the reporting period, the total annual management fee rate was .53% of the Fund's average net assets.
Distribution and Service Plan Fees. In accordance with Rule 12b-1 of the 1940 Act, the Fund has adopted separate Distribution and Service Plans for each class of shares. Certain classes pay Fidelity Distributors Company LLC (FDC), an affiliate of the investment adviser, separate Distribution and Service Fees, each of which is based on an annual percentage of each class' average net assets. In addition, FDC may pay financial intermediaries for selling shares of the Fund and providing shareholder support services. For the period, the Distribution and Service Fee rates, total fees and amounts retained by FDC were as follows:
| | Distribution Fee | Service Fee | Total Fees | Retained by FDC |
| Class A | -% | .25% | $613,881 | $10,856 |
| Class M | .25% | .25% | 287,054 | 1,682 |
| Class C | .75% | .25% | 1,146,588 | 102,742 |
| | | | $2,047,523 | $115,280 |
Sales Load. FDC may receive a front-end sales charge of up to 5.75% for selling Class A shares and 3.50% for selling Class M shares, some of which is paid to financial intermediaries for selling shares of the Fund. Depending on the holding period, FDC may receive contingent deferred sales charges levied on Class A, Class M and Class C redemptions. The deferred sales charges are 1.00% for Class C shares, 1.00% for certain purchases of Class A shares and .25% for certain purchases of Class M shares.
For the period, sales charge amounts retained by FDC were as follows:
| | Retained by FDC |
| Class A | $80,420 |
| Class M | 9,521 |
| Class C(a) | 7,838 |
| | $97,779 |
(a) When Class C shares are initially sold, FDC pays commissions from its own resources to financial intermediaries through which the sales are made.
Transfer Agent Fees. Fidelity Investments Institutional Operations Company LLC (FIIOC), an affiliate of the investment adviser, is the transfer, dividend disbursing and shareholder servicing agent for each class of the Fund. FIIOC receives account fees and asset-based fees that vary according to the account size and type of account of the shareholders of the respective classes of the Fund, except for Class Z. FIIOC receives an asset-based fee of Class Z's average net assets. FIIOC pays for typesetting, printing and mailing of shareholder reports, except proxy statements.
For the period, transfer agent fees for each class were as follows:
| | Amount | % of Class-Level Average Net Assets |
| Class A | $510,153 | .21 |
| Class M | 130,510 | .23 |
| Class C | 236,699 | .21 |
| Consumer Staples | 1,317,123 | .17 |
| Class I | 260,138 | .18 |
| Class Z | 20,329 | .04 |
| | $2,474,952 | |
Accounting Fees. Fidelity Service Company, Inc. (FSC), an affiliate of the investment adviser, maintains the Fund's accounting records. The accounting fee is based on the level of average net assets for each month. For the period, the fees were equivalent to the following annual rates:
| | % of Average Net Assets |
| Consumer Staples Portfolio | .03 |
Brokerage Commissions. A portion of portfolio transactions were placed with brokerage firms which are affiliates of the investment adviser. Brokerage commissions are included in net realized gain (loss) and change in net unrealized appreciation (depreciation) in the Statement of Operations. The commissions paid to these affiliated firms were as follows:
| | Amount |
| Consumer Staples Portfolio | $25,110 |
Interfund Lending Program. Pursuant to an Exemptive Order issued by the SEC, the Fund, along with other registered investment companies having management contracts with Fidelity Management & Research Company LLC (FMR), or other affiliated entities of FMR, may participate in an interfund lending program. This program provides an alternative credit facility allowing the Fund to borrow from, or lend money to, other participating affiliated funds. Any open loans, including accrued interest, at period end are presented under the caption “Notes payable to affiliates” in the Statement of Assets and Liabilities. Activity in this program during the period for which loans were outstanding was as follows:
| | Borrower or Lender | Average Loan Balance | Weighted Average Interest Rate | Interest Expense |
| Consumer Staples Portfolio | Borrower | $4,706,417 | .33% | $2,076 |
Interfund Trades. Funds may purchase from or sell securities to other Fidelity Funds under procedures adopted by the Board. The procedures have been designed to ensure these interfund trades are executed in accordance with Rule 17a-7 of the 1940 Act. Any interfund trades are included within the respective purchases and sales amounts shown in the Purchases and Sales of Investments note and are noted in the table below.
| | Purchases ($) | Sales ($) |
| Consumer Staples Portfolio | 60,440,976 | 78,244,880 |
6. Committed Line of Credit.
Certain Funds participate with other funds managed by the investment adviser or an affiliate in a $4.25 billion credit facility (the "line of credit") to be utilized for temporary or emergency purposes to fund shareholder redemptions or for other short-term liquidity purposes. The participating funds have agreed to pay commitment fees on their pro-rata portion of the line of credit, which are reflected in Miscellaneous expenses on the Statement of Operations, and are listed below.
| | Amount |
| Consumer Staples Portfolio | $3,200 |
During the period, there were no borrowings on this line of credit.
7. Security Lending.
Funds lend portfolio securities from time to time in order to earn additional income. Lending agents are used, including National Financial Services (NFS), an affiliate of the investment adviser. Pursuant to a securities lending agreement, NFS will receive a fee, which is capped at 9.9% of a fund's daily lending revenue, for its services as lending agent. A fund may lend securities to certain qualified borrowers, including NFS. On the settlement date of the loan, a fund receives collateral (in the form of U.S. Treasury obligations, letters of credit and/or cash) against the loaned securities and maintains collateral in an amount not less than 100% of the market value of the loaned securities during the period of the loan. The market value of the loaned securities is determined at the close of business of a fund and any additional required collateral is delivered to a fund on the next business day. A fund or borrower may terminate the loan at any time, and if the borrower defaults on its obligation to return the securities loaned because of insolvency or other reasons, a fund may apply collateral received from the borrower against the obligation. A fund may experience delays and costs in recovering the securities loaned. Any cash collateral received is invested in the Fidelity Securities Lending Cash Central Fund. Any loaned securities are identified as such in the Schedule of Investments, and the value of loaned securities and cash collateral at period end, as applicable, are presented in the Statement of Assets and Liabilities. Security lending income represents the income earned on investing cash collateral, less rebates paid to borrowers and any lending agent fees associated with the loan, plus any premium payments received for lending certain types of securities. Security lending income is presented in the Statement of Operations as a component of income from Fidelity Central Funds. Affiliated security lending activity, if any, was as follows:
| | Total Security Lending Income Fees Paid to NFS | Security Lending Income From Securities Loaned to NFS | Value of Securities Loaned to NFS at Period End |
| Consumer Staples Portfolio | $11,858 | $82 | $– |
8. Bank Borrowings.
The Fund is permitted to have bank borrowings for temporary or emergency purposes to fund shareholder redemptions or for other short-term liquidity requirements. The Fund has established borrowing arrangements with certain banks. The interest rate on the borrowings is the bank's base rate, as revised from time to time. Any open loans, including accrued interest, at period end are presented under the caption "Notes payable" in the Statement of Assets and Liabilities, if applicable. Activity in this program during the period for which loans were outstanding was as follows:
| | Average Loan Balance | Weighted Average Interest Rate | Interest Expense |
| Consumer Staples Portfolio | $2,693,345 | .59% | $1,280 |
9. Expense Reductions.
Commissions paid to certain brokers with whom the investment adviser, or its affiliates, places trades on behalf of the Fund include an amount in addition to trade execution, which may be rebated back to the Fund to offset expenses. This amount totaled $101,519 for the period. In addition, through arrangements with the Fund's custodian and each class' transfer agent, credits realized as a result of certain uninvested cash balances were used to reduce the Fund's expenses. During the period, custodian credits reduced the Fund's expenses by $124.
In addition, during the period the investment adviser or an affiliate reimbursed and/or waived a portion of fund-level operating expenses in the amount of $5,313.
10. Distributions to Shareholders.
Distributions to shareholders of each class were as follows:
| | Year ended
February 28, 2021 | Year ended
February 29, 2020 |
| Distributions to shareholders | | |
| Class A | $7,785,064 | $6,696,405 |
| Class M | 1,694,592 | 1,461,199 |
| Class C | 2,915,694 | 2,610,802 |
| Consumer Staples | 26,940,406 | 23,815,786 |
| Class I | 5,222,248 | 4,878,027 |
| Class Z | 1,594,167 | 1,258,230 |
| Total | $46,152,171 | $40,720,449 |
11. Share Transactions.
Share transactions for each class were as follows and may contain automatic conversions between classes or exchanges between affiliated funds:
| | Shares | Shares | Dollars | Dollars |
| | Year ended February 28, 2021 | Year ended February 29, 2020 | Year ended February 28, 2021 | Year ended February 29, 2020 |
| Class A | | | | |
| Shares sold | 521,136 | 673,280 | $43,136,035 | $55,409,168 |
| Reinvestment of distributions | 88,396 | 74,433 | 7,517,633 | 6,499,464 |
| Shares redeemed | (837,400) | (761,324) | (70,049,187) | (63,492,568) |
| Net increase (decrease) | (227,868) | (13,611) | $(19,395,519) | $(1,583,936) |
| Class M | | | | |
| Shares sold | 73,432 | 96,558 | $5,865,389 | $8,040,205 |
| Reinvestment of distributions | 20,110 | 16,736 | 1,683,104 | 1,447,176 |
| Shares redeemed | (163,378) | (191,768) | (13,583,465) | (15,887,658) |
| Net increase (decrease) | (69,836) | (78,474) | $(6,034,972) | $(6,400,277) |
| Class C | | | | |
| Shares sold | 141,597 | 172,528 | $11,209,401 | $14,091,994 |
| Reinvestment of distributions | 35,029 | 29,580 | 2,841,148 | 2,512,849 |
| Shares redeemed | (484,920) | (700,216) | (39,991,422) | (55,637,531) |
| Net increase (decrease) | (308,294) | (498,108) | $(25,940,873) | $(39,032,688) |
| Consumer Staples | | | | |
| Shares sold | 1,518,738 | 1,681,521 | $126,493,736 | $142,087,479 |
| Reinvestment of distributions | 285,485 | 246,658 | 24,629,835 | 21,760,149 |
| Shares redeemed | (2,896,609) | (2,801,634) | (243,910,123) | (236,743,124) |
| Net increase (decrease) | (1,092,386) | (873,455) | $(92,786,552) | $(72,895,496) |
| Class I | | | | |
| Shares sold | 850,081 | 1,013,976 | $68,795,704 | $85,980,860 |
| Reinvestment of distributions | 55,882 | 50,832 | 4,825,829 | 4,473,725 |
| Shares redeemed | (1,295,813) | (1,262,032) | (108,862,991) | (106,844,142) |
| Net increase (decrease) | (389,850) | (197,224) | $(35,241,458) | $(16,389,557) |
| Class Z | | | | |
| Shares sold | 271,537 | 503,808 | $22,735,232 | $42,214,998 |
| Reinvestment of distributions | 17,543 | 13,623 | 1,510,349 | 1,197,347 |
| Shares redeemed | (324,611) | (102,066) | (28,402,353) | (8,692,361) |
| Net increase (decrease) | (35,531) | 415,365 | $(4,156,772) | $34,719,984 |
12. Other.
The Fund's organizational documents provide former and current trustees and officers with a limited indemnification against liabilities arising in connection with the performance of their duties to the Fund. In the normal course of business, the Fund may also enter into contracts that provide general indemnifications. The Fund's maximum exposure under these arrangements is unknown as this would be dependent on future claims that may be made against the Fund. The risk of material loss from such claims is considered remote.
13. Coronavirus (COVID-19) Pandemic.
An outbreak of COVID-19 first detected in China during December 2019 has since spread globally and was declared a pandemic by the World Health Organization during March 2020. Developments that disrupt global economies and financial markets, such as the COVID-19 pandemic, may magnify factors that affect the Fund's performance.
Report of Independent Registered Public Accounting Firm
To the Board of Trustees of Fidelity Select Portfolios and Shareholders of Consumer Staples Portfolio
Opinion on the Financial Statements
We have audited the accompanying statement of assets and liabilities, including the schedule of investments, of Consumer Staples Portfolio (one of the funds constituting Fidelity Select Portfolios, referred to hereafter as the “Fund”) as of February 28, 2021, the related statement of operations for the year ended February 28, 2021, the statement of changes in net assets for each of the two years in the period ended February 28, 2021, including the related notes, and the financial highlights for each of the periods indicated therein (collectively referred to as the “financial statements”). In our opinion, the financial statements present fairly, in all material respects, the financial position of the Fund as of February 28, 2021, the results of its operations for the year then ended, the changes in its net assets for each of the two years in the period ended February 28, 2021 and the financial highlights for each of the periods indicated therein in conformity with accounting principles generally accepted in the United States of America.
Basis for Opinion
These financial statements are the responsibility of the Fund’s management. Our responsibility is to express an opinion on the Fund’s financial statements based on our audits. We are a public accounting firm registered with the Public Company Accounting Oversight Board (United States) (PCAOB) and are required to be independent with respect to the Fund in accordance with the U.S. federal securities laws and the applicable rules and regulations of the Securities and Exchange Commission and the PCAOB.
We conducted our audits of these financial statements in accordance with the standards of the PCAOB. Those standards require that we plan and perform the audit to obtain reasonable assurance about whether the financial statements are free of material misstatement, whether due to error or fraud.
Our audits included performing procedures to assess the risks of material misstatement of the financial statements, whether due to error or fraud, and performing procedures that respond to those risks. Such procedures included examining, on a test basis, evidence regarding the amounts and disclosures in the financial statements. Our audits also included evaluating the accounting principles used and significant estimates made by management, as well as evaluating the overall presentation of the financial statements. Our procedures included confirmation of securities owned as of February 28, 2021 by correspondence with the custodian, issuers of privately offered securities and brokers; when replies were not received from brokers, we performed other auditing procedures. We believe that our audits provide a reasonable basis for our opinion.
/s/ PricewaterhouseCoopers LLP
Boston, Massachusetts
April 13, 2021
We have served as the auditor of one or more investment companies in the Fidelity group of funds since 1932.
Trustees and Officers
The Trustees, Members of the Advisory Board (if any), and officers of the trust and fund, as applicable, are listed below. The Board of Trustees governs the fund and is responsible for protecting the interests of shareholders. The Trustees are experienced executives who meet periodically throughout the year to oversee the fund's activities, review contractual arrangements with companies that provide services to the fund, oversee management of the risks associated with such activities and contractual arrangements, and review the fund's performance. Each of the Trustees oversees 309 funds.
The Trustees hold office without limit in time except that (a) any Trustee may resign; (b) any Trustee may be removed by written instrument, signed by at least two-thirds of the number of Trustees prior to such removal; (c) any Trustee who requests to be retired or who has become incapacitated by illness or injury may be retired by written instrument signed by a majority of the other Trustees; and (d) any Trustee may be removed at any special meeting of shareholders by a two-thirds vote of the outstanding voting securities of the trust. Each Trustee who is not an interested person (as defined in the 1940 Act) of the trust and the fund is referred to herein as an Independent Trustee. Each Independent Trustee shall retire not later than the last day of the calendar year in which his or her 75th birthday occurs. The Independent Trustees may waive this mandatory retirement age policy with respect to individual Trustees. Officers and Advisory Board Members hold office without limit in time, except that any officer or Advisory Board Member may resign or may be removed by a vote of a majority of the Trustees at any regular meeting or any special meeting of the Trustees. Except as indicated, each individual has held the office shown or other offices in the same company for the past five years.
The fund's Statement of Additional Information (SAI) includes more information about the Trustees. To request a free copy, call Fidelity at 1-800-544-8544 if you’re an individual investing directly with Fidelity, call 1-800-835-5092 if you’re a plan sponsor or participant with Fidelity as your recordkeeper or call 1-877-208-0098 on institutional accounts or if you’re an advisor or invest through one.
Experience, Skills, Attributes, and Qualifications of the Trustees. The Governance and Nominating Committee has adopted a statement of policy that describes the experience, qualifications, attributes, and skills that are necessary and desirable for potential Independent Trustee candidates (Statement of Policy). The Board believes that each Trustee satisfied at the time he or she was initially elected or appointed a Trustee, and continues to satisfy, the standards contemplated by the Statement of Policy. The Governance and Nominating Committee also engages professional search firms to help identify potential Independent Trustee candidates who have the experience, qualifications, attributes, and skills consistent with the Statement of Policy. From time to time, additional criteria based on the composition and skills of the current Independent Trustees, as well as experience or skills that may be appropriate in light of future changes to board composition, business conditions, and regulatory or other developments, have also been considered by the professional search firms and the Governance and Nominating Committee. In addition, the Board takes into account the Trustees' commitment and participation in Board and committee meetings, as well as their leadership of standing and ad hoc committees throughout their tenure.
In determining that a particular Trustee was and continues to be qualified to serve as a Trustee, the Board has considered a variety of criteria, none of which, in isolation, was controlling. The Board believes that, collectively, the Trustees have balanced and diverse experience, qualifications, attributes, and skills, which allow the Board to operate effectively in governing the fund and protecting the interests of shareholders. Information about the specific experience, skills, attributes, and qualifications of each Trustee, which in each case led to the Board's conclusion that the Trustee should serve (or continue to serve) as a trustee of the fund, is provided below.
Board Structure and Oversight Function. Robert A. Lawrence is an interested person and currently serves as Acting Chairman. The Trustees have determined that an interested Chairman is appropriate and benefits shareholders because an interested Chairman has a personal and professional stake in the quality and continuity of services provided to the fund. Independent Trustees exercise their informed business judgment to appoint an individual of their choosing to serve as Chairman, regardless of whether the Trustee happens to be independent or a member of management. The Independent Trustees have determined that they can act independently and effectively without having an Independent Trustee serve as Chairman and that a key structural component for assuring that they are in a position to do so is for the Independent Trustees to constitute a substantial majority for the Board. The Independent Trustees also regularly meet in executive session. David M. Thomas serves as Lead Independent Trustee and as such (i) acts as a liaison between the Independent Trustees and management with respect to matters important to the Independent Trustees and (ii) with management prepares agendas for Board meetings.
Fidelity® funds are overseen by different Boards of Trustees. The fund's Board oversees Fidelity's high income and certain equity funds, and other Boards oversee Fidelity's investment-grade bond, money market, asset allocation, and other equity funds. The asset allocation funds may invest in Fidelity® funds overseen by the fund's Board. The use of separate Boards, each with its own committee structure, allows the Trustees of each group of Fidelity® funds to focus on the unique issues of the funds they oversee, including common research, investment, and operational issues. On occasion, the separate Boards establish joint committees to address issues of overlapping consequences for the Fidelity® funds overseen by each Board.
The Trustees operate using a system of committees to facilitate the timely and efficient consideration of all matters of importance to the Trustees, the fund, and fund shareholders and to facilitate compliance with legal and regulatory requirements and oversight of the fund's activities and associated risks. The Board, acting through its committees, has charged FMR and its affiliates with (i) identifying events or circumstances the occurrence of which could have demonstrably adverse effects on the fund's business and/or reputation; (ii) implementing processes and controls to lessen the possibility that such events or circumstances occur or to mitigate the effects of such events or circumstances if they do occur; and (iii) creating and maintaining a system designed to evaluate continuously business and market conditions in order to facilitate the identification and implementation processes described in (i) and (ii) above. Because the day-to-day operations and activities of the fund are carried out by or through FMR, its affiliates, and other service providers, the fund's exposure to risks is mitigated but not eliminated by the processes overseen by the Trustees. While each of the Board's committees has responsibility for overseeing different aspects of the fund's activities, oversight is exercised primarily through the Operations, Audit, and Compliance Committees. Appropriate personnel, including but not limited to the fund's Chief Compliance Officer (CCO), FMR's internal auditor, the independent accountants, the fund's Treasurer and portfolio management personnel, make periodic reports to the Board's committees, as appropriate, including an annual review of Fidelity's risk management program for the Fidelity® funds. The responsibilities of each standing committee, including their oversight responsibilities, are described further under "Standing Committees of the Trustees."
Interested Trustees*:
Correspondence intended for a Trustee who is an interested person may be sent to Fidelity Investments, 245 Summer Street, Boston, Massachusetts 02210.
Name, Year of Birth; Principal Occupations and Other Relevant Experience+
Bettina Doulton (1964)
Year of Election or Appointment: 2020
Trustee
Ms. Doulton also serves as Trustee of other Fidelity® funds. Prior to her retirement, Ms. Doulton served in a variety of positions at Fidelity Investments, including as a managing director of research (2006-2007), portfolio manager to certain Fidelity® funds (1993-2005), equity analyst and portfolio assistant (1990-1993), and research assistant (1987-1990). Ms. Doulton currently owns and operates Phi Builders + Architects and Cellardoor Winery. Previously, Ms. Doulton served as a member of the Board of Brown Capital Management, LLC (2013-2018).
Robert A. Lawrence (1952)
Year of Election or Appointment: 2020
Trustee
Acting Chairman of the Board of Trustees
Mr. Lawrence also serves as Trustee of other funds. Previously, Mr. Lawrence served as a Member of the Advisory Board of certain funds. Prior to his retirement in 2008, Mr. Lawrence served as Vice President of certain Fidelity® funds (2006-2008), Senior Vice President, Head of High Income Division of Fidelity Management & Research Company (investment adviser firm, 2006-2008), and President of Fidelity Strategic Investments (investment adviser firm, 2002-2005).
* Determined to be an “Interested Trustee” by virtue of, among other things, his or her affiliation with the trust or various entities under common control with FMR.
+ The information includes the Trustee's principal occupation during the last five years and other information relating to the experience, attributes, and skills relevant to the Trustee's qualifications to serve as a Trustee, which led to the conclusion that the Trustee should serve as a Trustee for the fund.
Independent Trustees:
Correspondence intended for an Independent Trustee may be sent to Fidelity Investments, P.O. Box 55235, Boston, Massachusetts 02205-5235.
Name, Year of Birth; Principal Occupations and Other Relevant Experience+
Dennis J. Dirks (1948)
Year of Election or Appointment: 2018
Trustee
Mr. Dirks also serves as Trustee of other Fidelity® funds. Prior to his retirement in May 2003, Mr. Dirks served as Chief Operating Officer and as a member of the Board of The Depository Trust & Clearing Corporation (financial markets infrastructure), President, Chief Operating Officer and a member of the Board of The Depository Trust Company (DTC), President and a member of the Board of the National Securities Clearing Corporation (NSCC), Chief Executive Officer and a member of the Board of the Government Securities Clearing Corporation and Chief Executive Officer and a member of the Board of the Mortgage-Backed Securities Clearing Corporation. Mr. Dirks currently serves as a member of the Finance Committee (2016-present) and Board (2017-present) and is Treasurer (2018-present) of the Asolo Repertory Theatre.
Donald F. Donahue (1950)
Year of Election or Appointment: 2018
Trustee
Mr. Donahue also serves as Trustee of other Fidelity® funds. Mr. Donahue serves as President and Chief Executive Officer of Miranda Partners, LLC (risk consulting for the financial services industry, 2012-present). Previously, Mr. Donahue served as Chief Executive Officer (2006-2012), Chief Operating Officer (2003-2006) and Managing Director, Customer Marketing and Development (1999-2003) of The Depository Trust & Clearing Corporation (financial markets infrastructure). Mr. Donahue currently serves as a member (2007-present) and Co-Chairman (2016-present) of the Board of United Way of New York, a member of the Board of NYC Leadership Academy (2012-present) and a member of the Board of Advisors of Ripple Labs, Inc. (financial services, 2015-present). Mr. Donahue previously served as a member of the Advisory Board of certain Fidelity® funds (2015-2018).
Vicki L. Fuller (1957)
Year of Election or Appointment: 2020
Trustee
Ms. Fuller also serves as Trustee of other Fidelity® funds. Previously, Ms. Fuller served as a member of the Advisory Board of certain Fidelity® funds (2018-2020), Chief Investment Officer of the New York State Common Retirement Fund (2012-2018) and held a variety of positions at AllianceBernstein L.P. (global asset management, 1985-2012), including Managing Director (2006-2012) and Senior Vice President and Senior Portfolio Manager (2001-2006). Ms. Fuller currently serves as a member of the Board, Audit Committee and Nominating and Governance Committee of The Williams Companies, Inc. (natural gas infrastructure, 2018-present), as a member of the Board, Audit Committee and Nominating and Governance Committee of two Blackstone business development companies (2020-present) and as a member of the Board of Treliant, LLC (consulting, 2019-present).
Patricia L. Kampling (1959)
Year of Election or Appointment: 2020
Trustee
Ms. Kampling also serves as Trustee of other Fidelity® funds. Prior to her retirement, Ms. Kampling served as Chairman of the Board and Chief Executive Officer (2012-2019), President and Chief Operating Officer (2011-2012) and Executive Vice President and Chief Financial Officer (2010-2011) of Alliant Energy Corporation. Ms. Kampling currently serves as a member of the Board, Compensation Committee and Executive Committee and as Chair of the Audit Committee of Briggs & Stratton Corporation (manufacturing, 2011-present) and as a member of the Board, Audit, Finance and Risk Committee and Safety, Environmental, Technology and Operations Committee of American Water Works Company, Inc. (utilities company, 2019-present). In addition, Ms. Kampling currently serves as a member of the Board of the Nature Conservancy, Wisconsin Chapter (2019-present). Previously, Ms. Kampling served as a Member of the Advisory Board of certain Fidelity® funds (2020), a member of the Board of Interstate Power and Light Company (2012-2019) and Wisconsin Power and Light Company (2012-2019) (each a subsidiary of Alliant Energy Corporation) and as a member of the Board and Workforce Development Committee of the Business Roundtable (2018-2019).
Thomas A. Kennedy (1955)
Year of Election or Appointment: 2021
Trustee
Mr. Kennedy also serves as Trustee of other Fidelity® funds. Previously, Mr. Kennedy served as a Member of the Advisory Board of certain Fidelity® funds (2020) and held a variety of positions at Raytheon Company (aerospace and defense, 1983-2020), including Chairman and Chief Executive Officer (2014-2020) and Executive Vice President and Chief Operating Officer (2013-2014). Mr. Kennedy currently serves as Executive Chairman of the Board of Directors of Raytheon Technologies Corporation (aerospace and defense, 2020-present). He is also a member of the Rutgers School of Engineering Industry Advisory Board (2011-present) and a member of the UCLA Engineering Dean’s Executive Board (2016-present).
Garnett A. Smith (1947)
Year of Election or Appointment: 2013
Trustee
Mr. Smith also serves as Trustee of other Fidelity® funds. Prior to his retirement, Mr. Smith served as Chairman and Chief Executive Officer (1990-1997) and President (1986-1990) of Inbrand Corp. (manufacturer of personal absorbent products). Prior to his employment with Inbrand Corp., he was employed by a retail fabric chain and North Carolina National Bank (now Bank of America). Mr. Smith previously served as a member of the Advisory Board of certain Fidelity® funds (2012-2013).
David M. Thomas (1949)
Year of Election or Appointment: 2018
Trustee
Lead Independent Trustee
Mr. Thomas also serves as Trustee of other Fidelity® funds. Previously, Mr. Thomas served as Executive Chairman (2005-2006) and Chairman and Chief Executive Officer (2000-2005) of IMS Health, Inc. (pharmaceutical and healthcare information solutions). Mr. Thomas currently serves as Non-Executive Chairman of the Board of Fortune Brands Home and Security (home and security products, 2011-present), and a member of the Board (2004-present) and Presiding Director (2013-present) of Interpublic Group of Companies, Inc. (marketing communication).
Susan Tomasky (1953)
Year of Election or Appointment: 2020
Trustee
Ms. Tomasky also serves as Trustee of other Fidelity® funds. Prior to her retirement, Ms. Tomasky served in various executive officer positions at American Electric Power Company, Inc. (1998-2011), including most recently as President of AEP Transmission (2007-2011). Ms. Tomasky currently serves as a member of the Board and Sustainability Committee and as Chair of the Audit Committee of Marathon Petroleum Corporation (2018-present) and as a member of the Board, Corporate Governance Committee and Organization and Compensation Committee and as Chair of the Audit Committee of Public Service Enterprise Group, Inc. (utilities company, 2012-present). In addition, Ms. Tomasky currently serves as a member of the Board of the Columbus Regional Airport Authority (2007-present), as a member of the Board of the Royal Shakespeare Company – America (2009-present), as a member of the Board of the Columbus Association for the Performing Arts (2011-present) and as a member of the Board of Kenyon College (2016-present). Previously, Ms. Tomasky served as a Member of the Advisory Board of certain Fidelity® funds (2020), a member of the Board (2011-2019) and as Lead Independent Director (2015-2018) of Andeavor Corporation (previously Tesoro Corporation) (independent oil refiner and marketer) and as a member of the Board of Summit Midstream Partners LP (energy, 2012-2018).
Michael E. Wiley (1950)
Year of Election or Appointment: 2008
Trustee
Mr. Wiley also serves as Trustee of other Fidelity® funds. Previously, Mr. Wiley served as a member of the Advisory Board of certain Fidelity® funds (2018-2020), Chairman, President and CEO of Baker Hughes, Inc. (oilfield services, 2000-2004). Mr. Wiley also previously served as a member of the Board of Andeavor Corporation (independent oil refiner and marketer, 2005-2018), a member of the Board of Andeavor Logistics LP (natural resources logistics, 2015-2018) and a member of the Board of High Point Resources (exploration and production, 2005-2020).
+ The information includes the Trustee's principal occupation during the last five years and other information relating to the experience, attributes, and skills relevant to the Trustee's qualifications to serve as a Trustee, which led to the conclusion that the Trustee should serve as a Trustee for the fund.
Advisory Board Members and Officers:
Correspondence intended for a Member of the Advisory Board (if any) may be sent to Fidelity Investments, P.O. Box 55235, Boston, Massachusetts 02205-5235. Correspondence intended for an officer or Peter S. Lynch may be sent to Fidelity Investments, 245 Summer Street, Boston, Massachusetts 02210. Officers appear below in alphabetical order.
Name, Year of Birth; Principal Occupation
Ned C. Lautenbach (1944)
Year of Election or Appointment: 2021
Member of the Advisory Board
Mr. Lautenbach also serves as a Member of the Advisory Board of other Fidelity® funds. Mr. Lautenbach currently serves as Chair of the Board of Governors, State University System of Florida (2013-present) and is a member of the Council on Foreign Relations (1994-present). He is also a member and has in the past served as Chairman of the Board of Directors of Artis-Naples (2012-present). Previously, Mr. Lautenbach served as a Trustee of certain Fidelity® funds (2000-2020) and a member and then Lead Director of the Board of Directors of Eaton Corporation (diversified industrial, 1997-2016). He was also a Partner at Clayton, Dubilier & Rice, LLC (private equity investment, 1998-2010); as well as Director of Sony Corporation (2006-2007). In addition, Mr. Lautenbach had a 30-year career with IBM (technology company), during which time he served as Senior Vice President and as a member of the Corporate Executive Committee (1968-1998).
Peter S. Lynch (1944)
Year of Election or Appointment: 2018
Member of the Advisory Board
Mr. Lynch also serves as a Member of the Advisory Board of other Fidelity® funds. Mr. Lynch is Vice Chairman and a Director of Fidelity Management & Research Company LLC (investment adviser firm). In addition, Mr. Lynch serves as a Trustee of Boston College and as the Chairman of the Inner-City Scholarship Fund. Previously, Mr. Lynch served as Vice Chairman and a Director of FMR Co., Inc. (investment adviser firm) and on the Special Olympics International Board of Directors (1997-2006).
Craig S. Brown (1977)
Year of Election or Appointment: 2019
Assistant Treasurer
Mr. Brown also serves as Assistant Treasurer of other funds. Mr. Brown is an employee of Fidelity Investments (2013-present).
John J. Burke III (1964)
Year of Election or Appointment: 2018
Chief Financial Officer
Mr. Burke also serves as Chief Financial Officer of other funds. Mr. Burke serves as Head of Investment Operations for Fidelity Fund and Investment Operations (2018-present) and is an employee of Fidelity Investments (1998-present). Previously Mr. Burke served as head of Asset Management Investment Operations (2012-2018).
William C. Coffey (1969)
Year of Election or Appointment: 2019
Assistant Secretary
Mr. Coffey also serves as Assistant Secretary of other funds. He is Senior Vice President and Deputy General Counsel of FMR LLC (diversified financial services company, 2010-present), and is an employee of Fidelity Investments. Previously, Mr. Coffey served as Secretary and CLO of certain funds (2018-2019); CLO, Secretary, and Senior Vice President of Fidelity Management & Research Company and FMR Co., Inc. (investment adviser firms, 2018-2019); Secretary of Fidelity SelectCo, LLC and Fidelity Investments Money Management, Inc. (investment adviser firms, 2018-2019); CLO of Fidelity Management & Research (Hong Kong) Limited, FMR Investment Management (UK) Limited, and Fidelity Management & Research (Japan) Limited (investment adviser firms, 2018-2019); and Assistant Secretary of certain funds (2009-2018).
Timothy M. Cohen (1969)
Year of Election or Appointment: 2018
Vice President
Mr. Cohen also serves as Vice President of other funds. Mr. Cohen serves as Co-Head of Equity (2018-present), a Director of Fidelity Management & Research (Japan) Limited (investment adviser firm, 2016-present), and is an employee of Fidelity Investments. Previously, Mr. Cohen served as Executive Vice President of Fidelity SelectCo, LLC (2019), Head of Global Equity Research (2016-2018), Chief Investment Officer - Equity and a Director of Fidelity Management & Research (U.K.) Inc. (investment adviser firm, 2013-2015) and as a Director of Fidelity Management & Research (Hong Kong) Limited (investment adviser firm, 2017).
Jonathan Davis (1968)
Year of Election or Appointment: 2010
Assistant Treasurer
Mr. Davis also serves as Assistant Treasurer of other funds. Mr. Davis serves as Assistant Treasurer of FMR Capital, Inc. (2017-present) and is an employee of Fidelity Investments. Previously, Mr. Davis served as Vice President and Associate General Counsel of FMR LLC (diversified financial services company, 2003-2010).
Laura M. Del Prato (1964)
Year of Election or Appointment: 2018
Assistant Treasurer
Ms. Del Prato also serves as an officer of other funds. Ms. Del Prato is an employee of Fidelity Investments (2017-present). Previously, Ms. Del Prato served as President and Treasurer of The North Carolina Capital Management Trust: Cash Portfolio and Term Portfolio (2018-2020). Prior to joining Fidelity Investments, Ms. Del Prato served as a Managing Director and Treasurer of the JPMorgan Mutual Funds (2014-2017). Prior to JPMorgan, Ms. Del Prato served as a partner at Cohen Fund Audit Services (accounting firm, 2012-2013) and KPMG LLP (accounting firm, 2004-2012).
Colm A. Hogan (1973)
Year of Election or Appointment: 2020
Assistant Treasurer
Mr. Hogan also serves as an officer of other funds. Mr. Hogan serves as Assistant Treasurer of FMR Capital, Inc. (2017-present) and is an employee of Fidelity Investments (2005-present). Previously, Mr. Hogan served as Deputy Treasurer of certain Fidelity® funds (2016-2020) and Assistant Treasurer of certain Fidelity® funds (2016-2018).
Pamela R. Holding (1964)
Year of Election or Appointment: 2018
Vice President
Ms. Holding also serves as Vice President of other funds. Ms. Holding serves as Co-Head of Equity (2018-present) and is an employee of Fidelity Investments (2013-present). Previously, Ms. Holding served as Executive Vice President of Fidelity SelectCo, LLC (2019) and as Chief Investment Officer of Fidelity Institutional Asset Management (2013-2018).
Cynthia Lo Bessette (1969)
Year of Election or Appointment: 2019
Secretary and Chief Legal Officer (CLO)
Ms. Lo Bessette also serves as an officer of other funds. Ms. Lo Bessette serves as CLO, Secretary, and Senior Vice President of Fidelity Management & Research Company LLC (investment adviser firm, 2019-present); and CLO of Fidelity Management & Research (Hong Kong) Limited, FMR Investment Management (UK) Limited, and Fidelity Management & Research (Japan) Limited (investment adviser firms, 2019-present). She is a Senior Vice President and Deputy General Counsel of FMR LLC (diversified financial services company, 2019-present), and is an employee of Fidelity Investments. Previously, Ms. Lo Bessette served as CLO, Secretary, and Senior Vice President of FMR Co., Inc. (investment adviser firm, 2019); Secretary of Fidelity SelectCo, LLC and Fidelity Investments Money Management, Inc. (investment adviser firms, 2019). Prior to joining Fidelity Investments, Ms. Lo Bessette was Executive Vice President, General Counsel (2016-2019) and Senior Vice President, Deputy General Counsel (2015-2016) of OppenheimerFunds (investment management company) and Deputy Chief Legal Officer (2013-2015) of Jennison Associates LLC (investment adviser firm).
Chris Maher (1972)
Year of Election or Appointment: 2020
Deputy Treasurer
Mr. Maher also serves as an officer of other funds. Mr. Maher serves as Assistant Treasurer of FMR Capital, Inc. (2017-present), and is an employee of Fidelity Investments (2008-present). Previously, Mr. Maher served as Assistant Treasurer of certain funds (2013-2020); Vice President of Asset Management Compliance (2013), Vice President of the Program Management Group of FMR (investment adviser firm, 2010-2013), and Vice President of Valuation Oversight (2008-2010).
Jason P. Pogorelec (1975)
Year of Election or Appointment: 2020
Chief Compliance Officer
Mr. Pogorelec also serves as Chief Compliance Officer of other funds. Mr. Pogorelec is a senior Vice President of Asset Management Compliance for Fidelity Investments and is an employee of Fidelity Investments (2006-present). Previously, Mr. Pogorelec served as Vice President, Associate General Counsel for Fidelity Investments (2010-2020) and Assistant Secretary of certain Fidelity funds (2015-2020).
Brett Segaloff (1972)
Year of Election or Appointment: 2021
Anti-Money Laundering (AML) Officer
Mr. Segaloff also serves as an AML Officer of other funds and other related entities. He is Director, Anti-Money Laundering (2007-present) of FMR LLC (diversified financial services company) and is an employee of Fidelity Investments (1996-present).
Stacie M. Smith (1974)
Year of Election or Appointment: 2018
President and Treasurer
Ms. Smith also serves as an officer of other funds. Ms. Smith serves as Assistant Treasurer of FMR Capital, Inc. (2017-present), is an employee of Fidelity Investments (2009-present), and has served in other fund officer roles. Prior to joining Fidelity Investments, Ms. Smith served as Senior Audit Manager of Ernst & Young LLP (accounting firm, 1996-2009). Previously, Ms. Smith served as Assistant Treasurer (2013-2019) and Deputy Treasurer (2013-2016) of certain Fidelity® funds.
Marc L. Spector (1972)
Year of Election or Appointment: 2017
Assistant Treasurer
Mr. Spector also serves as an officer of other funds. Mr. Spector serves as Assistant Treasurer of FMR Capital, Inc. (2017-present) and is an employee of Fidelity Investments (2016-present). Prior to joining Fidelity Investments, Mr. Spector served as Director at the Siegfried Group (accounting firm, 2013-2016), and prior to Siegfried Group as audit senior manager at Deloitte & Touche LLP (accounting firm, 2005-2013).
Jim Wegmann (1979)
Year of Election or Appointment: 2019
Assistant Treasurer
Mr. Wegmann also serves as Assistant Treasurer of other funds. Mr. Wegmann is an employee of Fidelity Investments (2011-present).
Shareholder Expense Example
As a shareholder, you incur two types of costs: (1) transaction costs, which may include sales charges (loads) on purchase payments or redemption proceeds, as applicable and (2) ongoing costs, which generally include management fees, distribution and/or service (12b-1) fees and other Fund expenses. This Example is intended to help you understand your ongoing costs (in dollars) of investing in a fund and to compare these costs with the ongoing costs of investing in other mutual funds.
The Example is based on an investment of $1,000 invested at the beginning of the period and held for the entire period (September 1, 2020 to February 28, 2021).
Actual Expenses
The first line of the accompanying table provides information about actual account values and actual expenses. You may use the information in this line, together with the amount you invested, to estimate the expenses that you paid over the period. Simply divide your account value by $1,000.00 (for example, an $8,600 account value divided by $1,000.00 = 8.6), then multiply the result by the number in the first line for a class/Fund under the heading entitled "Expenses Paid During Period" to estimate the expenses you paid on your account during this period. If any fund is a shareholder of any underlying mutual funds or exchange-traded funds (ETFs) (the Underlying Funds), such fund indirectly bears its proportional share of the expenses of the Underlying Funds in addition to the direct expenses incurred presented in the table. These fees and expenses are not included in the annualized expense ratio used to calculate the expense estimate in the table below.
Hypothetical Example for Comparison Purposes
The second line of the accompanying table provides information about hypothetical account values and hypothetical expenses based on the actual expense ratio and an assumed rate of return of 5% per year before expenses, which is not the actual return. The hypothetical account values and expenses may not be used to estimate the actual ending account balance or expenses you paid for the period. You may use this information to compare the ongoing costs of investing in the Fund and other funds. To do so, compare this 5% hypothetical example with the 5% hypothetical examples that appear in the shareholder reports of the other funds. If any fund is a shareholder of any Underlying Funds, such fund indirectly bears its proportional share of the expenses of the Underlying Funds in addition to the direct expenses as presented in the table. These fees and expenses are not included in the annualized expense ratio used to calculate the expense estimate in the table below.
Please note that the expenses shown in the table are meant to highlight your ongoing costs only and do not reflect any transaction costs. Therefore, the second line of the table is useful in comparing ongoing costs only, and will not help you determine the relative total costs of owning different funds. In addition, if these transactional costs were included, your costs would have been higher.
| | Annualized Expense Ratio-A | Beginning
Account Value
September 1, 2020 | Ending
Account Value
February 28, 2021 | Expenses Paid
During Period-B
September 1, 2020
to February 28, 2021 |
| Consumer Staples Portfolio | | | | |
| Class A | 1.03% | | | |
| Actual | | $1,000.00 | $1,016.10 | $5.15 |
| Hypothetical-C | | $1,000.00 | $1,019.69 | $5.16 |
| Class M | 1.29% | | | |
| Actual | | $1,000.00 | $1,014.70 | $6.44 |
| Hypothetical-C | | $1,000.00 | $1,018.40 | $6.46 |
| Class C | 1.78% | | | |
| Actual | | $1,000.00 | $1,012.40 | $8.88 |
| Hypothetical-C | | $1,000.00 | $1,015.97 | $8.90 |
| Consumer Staples | .74% | | | |
| Actual | | $1,000.00 | $1,017.60 | $3.70 |
| Hypothetical-C | | $1,000.00 | $1,021.12 | $3.71 |
| Class I | .75% | | | |
| Actual | | $1,000.00 | $1,017.50 | $3.75 |
| Hypothetical-C | | $1,000.00 | $1,021.08 | $3.76 |
| Class Z | .62% | | | |
| Actual | | $1,000.00 | $1,018.20 | $3.10 |
| Hypothetical-C | | $1,000.00 | $1,021.72 | $3.11 |
A Annualized expense ratio reflects expenses net of applicable fee waivers.
B Expenses are equal to the annualized expense ratio, multiplied by the average account value over the period, multiplied by 181/ 365 (to reflect the one-half year period). The fees and expenses of any Underlying Funds are not included in each annualized expense ratio.
C 5% return per year before expenses
Distributions (Unaudited)
The Board of Trustees of Consumer Staples Portfolio voted to pay to shareholders of record at the opening of business on record date, the following distributions per share derived from capital gains realized from sales of portfolio securities, and dividends derived from net investment income:
| | Pay Date | Record Date | Dividends | Capital Gains |
| Consumer Staples Portfolio | | | | |
| Class A | 04/12/21 | 04/09/21 | $0.062 | $4.002 |
| Class M | 04/12/21 | 04/09/21 | $0.020 | $4.002 |
| Class C | 04/12/21 | 04/09/21 | $0.000 | $3.939 |
| Consumer Staples | 04/12/21 | 04/09/21 | $0.106 | $4.002 |
| Class I | 04/12/21 | 04/09/21 | $0.103 | $4.002 |
| Class Z | 04/12/21 | 04/09/21 | $0.125 | $4.002 |
|
The fund hereby designates as a capital gain dividend with respect to the taxable year ended February 28, 2021 $44,300,596, or, if subsequently determined to be different, the net capital gain of such year.
The fund designates 100% of the short-term capital gain dividends distributed during the fiscal year as qualifying to be taxed as short-term capital gain dividends for nonresident alien shareholders.
Class A, Class M, Class C, Consumer Staples, Class I, and Class Z designate 100% of the dividends distributed during the fiscal year as qualifying for the dividends–received deduction for corporate shareholders.
Class A, Class M, Class C, Consumer Staples, Class I, and Class Z designate 100% of the dividends distributed during the fiscal year as amounts which may be taken into account as a dividend for purposes of the maximum rate under section 1(h)(11) of the Internal Revenue Code.
The fund will notify shareholders in January 2022 of amounts for use in preparing 2021 income tax returns.
Board Approval of Investment Advisory Contracts and Management Fees
Consumer Staples Portfolio
At its January 2021 meeting, the Board of Trustees, including the Independent Trustees (together, the Board), voted to continue the management contract with Fidelity Management & Research Company LLC (FMR), and the sub-advisory agreements and sub-subadvisory agreements, in each case, where applicable (together, the Advisory Contracts) for the fund for four months from February 1, 2021 through May 31, 2021, in connection with changes to the Board's meeting calendar.
The Board considered that the approval of the fund's Advisory Contracts will not result in any changes in (i) the investment process or strategies employed in the management of the fund's assets; (ii) the fees and expenses paid by shareholders; (iii) the nature, extent or quality of services provided under the fund's Advisory Contracts; or (iv) the day-to-day management of the fund or the persons primarily responsible for such management. The Board also considered that since its last approval of the fund's Advisory Contracts, FMR had provided additional information on the fund in support of the annual contract renewal process, including competitive analyses on total expenses and management fees and in-depth reviews of fund performance and fund profitability information. The Board also considered the findings of certain ad hoc committees that had been previously formed to discuss matters relevant to all of the Fidelity funds, including economies of scale, fall-out benefits and retail vs. institutional funds. The Board concluded that the fund's Advisory Contracts are fair and reasonable, and that the fund's Advisory Contracts should be renewed, without modification, through May 31, 2021, with the understanding that the Board will consider the annual renewal for a full one year period in May 2021.
In connection with its consideration of future renewals of the fund's Advisory Contracts, the Board will consider: (i) the nature, extent and quality of services provided to the funds, including shareholder and administrative services and investment performance; (ii) the competitiveness of the management fee and total expenses for the fund; (iii) the costs of the services and profitability, including the revenues earned and the expenses incurred in conducting the business of developing, marketing, distributing, managing, administering, and servicing the fund and its shareholders, to the extent applicable; and (iv) whether there have been economies of scale in respect of the Fidelity funds, whether the Fidelity funds (including the fund) have appropriately benefited from any such economies of scale, and whether there is the potential for realization of any further economies.
Based on its evaluation of all of the conclusions noted above, and after considering all factors it believed relevant, the Board ultimately concluded that the fund's management fee structure is fair and reasonable, and that the continuation of the fund's Advisory Contracts should be approved for four months from February 1, 2021 through May 31, 2021.
Liquidity Risk Management Program
The Securities and Exchange Commission adopted Rule 22e-4 under the Investment Company Act of 1940 (the Liquidity Rule) to promote effective liquidity risk management throughout the open-end investment company industry, thereby reducing the risk that funds will be unable to meet their redemption obligations and mitigating dilution of the interests of fund shareholders.
The Fund has adopted and implemented a liquidity risk management program pursuant to the Liquidity Rule (the Program) effective December 1, 2018. The Program is reasonably designed to assess and manage the Fund’s liquidity risk and to comply with the requirements of the Liquidity Rule. The Fund’s Board of Trustees (the Board) has designated the Fund’s investment adviser as administrator of the Program. The Fidelity advisers have established a Liquidity Risk Management Committee (the LRM Committee) to manage the Program for each of the Fidelity Funds. The LRM Committee monitors the adequacy and effectiveness of implementation of the Program and on a periodic basis assesses each Fund’s liquidity risk based on a variety of factors including (1) the Fund’s investment strategy, (2) portfolio liquidity and cash flow projections during normal and reasonably foreseeable stressed conditions, (3) shareholder redemptions, (4) borrowings and other funding sources and (5) in the case of exchange-traded funds, certain additional factors including the effect of the Fund’s prices and spreads, market participants, and basket compositions on the overall liquidity of the Fund’s portfolio, as applicable.
In accordance with the Program, each of the Fund’s portfolio investments is classified into one of four liquidity categories described below based on a determination of a reasonable expectation for how long it would take to convert the investment to cash (or sell or dispose of the investment) without significantly changing its market value.
- Highly liquid investments – cash or convertible to cash within three business days or less
- Moderately liquid investments – convertible to cash in three to seven calendar days
- Less liquid investments – can be sold or disposed of, but not settled, within seven calendar days
- Illiquid investments – cannot be sold or disposed of within seven calendar days
Liquidity classification determinations take into account a variety of factors including various market, trading and investment-specific considerations, as well as market depth, and generally utilize analysis from a third-party liquidity metrics service.
The Liquidity Rule places a 15% limit on a fund’s illiquid investments and requires funds that do not primarily hold assets that are highly liquid investments to determine and maintain a minimum percentage of the fund’s net assets to be invested in highly liquid investments (highly liquid investment minimum or HLIM). The Program includes provisions reasonably designed to comply with the 15% limit on illiquid investments and for determining, periodically reviewing and complying with the HLIM requirement as applicable.
At a recent meeting of the Fund’s Board of Trustees, the LRM Committee provided a written report to the Board pertaining to the operation, adequacy, and effectiveness of implementation of the Program for the annual period from December 1, 2019 through November 30, 2020. The report concluded that the Program has been implemented and is operating effectively and is reasonably designed to assess and manage the Fund’s liquidity risk.
Proxy Voting Results
A special meeting of shareholders was held on June 9, 2020. The results of votes taken among shareholders on the proposal before them are reported below. Each vote reported represents one dollar of net asset value held on the record date for the meeting.
PROPOSAL 1
To elect a Board of Trustees.
| | # of
Votes | % of
Votes |
| Dennis J. Dirks |
| Affirmative | 32,463,705,305.665 | 92.437 |
| Withheld | 2,655,951,104.308 | 7.563 |
| TOTAL | 35,119,656,409.973 | 100.000 |
| Donald F. Donahue |
| Affirmative | 32,446,843,861.354 | 92.389 |
| Withheld | 2,672,812,548.619 | 7.611 |
| TOTAL | 35,119,656,409.973 | 100.000 |
| Bettina Doulton |
| Affirmative | 32,610,463,757.584 | 92.855 |
| Withheld | 2,509,192,652.389 | 7.145 |
| TOTAL | 35,119,656,409.973 | 100.000 |
| Vicki L. Fuller |
| Affirmative | 32,688,213,522.720 | 93.077 |
| Withheld | 2,431,442,887.253 | 6.923 |
| TOTAL | 35,119,656,409.973 | 100.000 |
| Patricia L. Kampling |
| Affirmative | 32,313,755,598.535 | 92.010 |
| Withheld | 2,805,900,811.438 | 7.990 |
| TOTAL | 35,119,656,409.973 | 100.000 |
| Alan J. Lacy |
| Affirmative | 31,990,158,754.948 | 91.089 |
| Withheld | 3,129,497,655.026 | 8.911 |
| TOTAL | 35,119,656,409.973 | 100.000 |
| Ned C. Lautenbach |
| Affirmative | 32,043,019,991.143 | 91.240 |
| Withheld | 3,076,636,418.830 | 8.760 |
| TOTAL | 35,119,656,409.973 | 100.000 |
| Robert A. Lawrence |
| Affirmative | 32,150,842,398.009 | 91.547 |
| Withheld | 2,968,814,011.965 | 8.453 |
| TOTAL | 35,119,656,409.973 | 100.000 |
| Joseph Mauriello |
| Affirmative | 32,082,201,213.166 | 91.351 |
| Withheld | 3,037,455,196.807 | 8.649 |
| TOTAL | 35,119,656,409.973 | 100.000 |
| Cornelia M. Small |
| Affirmative | 32,207,976,835.934 | 91.709 |
| Withheld | 2,911,679,574.039 | 8.291 |
| TOTAL | 35,119,656,409.973 | 100.000 |
| Garnett A. Smith |
| Affirmative | 32,102,654,343.096 | 91.409 |
| Withheld | 3,017,002,066.877 | 8.591 |
| TOTAL | 35,119,656,409.973 | 100.000 |
| David M. Thomas |
| Affirmative | 32,150,749,424.556 | 91.546 |
| Withheld | 2,968,906,985.418 | 8.454 |
| TOTAL | 35,119,656,409.973 | 100.000 |
| Susan Tomasky |
| Affirmative | 32,381,933,484.515 | 92.205 |
| Withheld | 2,737,722,925.459 | 7.795 |
| TOTAL | 35,119,656,409.973 | 100.000 |
| Michael E. Wiley |
| Affirmative | 32,135,064,741.973 | 91.502 |
| Withheld | 2,984,591,668.000 | 8.498 |
| TOTAL | 35,119,656,409.973 | 100.000 |
|
| Proposal 1 reflects trust wide proposal and voting results. |
SELCS-ANN-0421
1.846042.114
Fidelity® Select Portfolios®
Utilities Sector
Utilities Portfolio
Annual Report
February 28, 2021
Contents
To view a fund's proxy voting guidelines and proxy voting record for the 12-month period ended June 30, visit http://www.fidelity.com/proxyvotingresults or visit the Securities and Exchange Commission's (SEC) web site at http://www.sec.gov.
You may also call 1-800-544-8544 to request a free copy of the proxy voting guidelines.
Standard & Poor's, S&P and S&P 500 are registered service marks of The McGraw-Hill Companies, Inc. and have been licensed for use by Fidelity Distributors Corporation.
Other third-party marks appearing herein are the property of their respective owners.
All other marks appearing herein are registered or unregistered trademarks or service marks of FMR LLC or an affiliated company. © 2021 FMR LLC. All rights reserved.
This report and the financial statements contained herein are submitted for the general information of the shareholders of the Fund. This report is not authorized for distribution to prospective investors in the Fund unless preceded or accompanied by an effective prospectus.
A fund files its complete schedule of portfolio holdings with the SEC for the first and third quarters of each fiscal year on Form N-PORT. Forms N-PORT are available on the SEC’s web site at http://www.sec.gov. A fund's Forms N-PORT may be reviewed and copied at the SEC’s Public Reference Room in Washington, DC. Information regarding the operation of the SEC's Public Reference Room may be obtained by calling 1-800-SEC-0330.
For a complete list of a fund's portfolio holdings, view the most recent holdings listing, semiannual report, or annual report on Fidelity's web site at http://www.fidelity.com, http://www.institutional.fidelity.com, or http://www.401k.com, as applicable.
NOT FDIC INSURED •MAY LOSE VALUE •NO BANK GUARANTEE
Neither the Fund nor Fidelity Distributors Corporation is a bank.
Note to Shareholders:
Early in 2020, the outbreak and spread of a new coronavirus emerged as a public health emergency that had a major influence on financial markets, primarily based on its impact on the global economy and the outlook for corporate earnings. The virus causes a respiratory disease known as COVID-19. On March 11, 2020 the World Health Organization declared the COVID-19 outbreak a pandemic, citing sustained risk of further global spread.
In the weeks following, as the crisis worsened, we witnessed an escalating human tragedy with wide-scale social and economic consequences from coronavirus-containment measures. The outbreak of COVID-19 prompted a number of measures to limit the spread, including travel and border restrictions, quarantines, and restrictions on large gatherings. In turn, these resulted in lower consumer activity, diminished demand for a wide range of products and services, disruption in manufacturing and supply chains, and – given the wide variability in outcomes regarding the outbreak – significant market uncertainty and volatility. Amid the turmoil, global governments and central banks took unprecedented action to help support consumers, businesses, and the broader economies, and to limit disruption to financial systems.
The situation continues to unfold, and the extent and duration of its impact on financial markets and the economy remain highly uncertain. Extreme events such as the coronavirus crisis are “exogenous shocks” that can have significant adverse effects on mutual funds and their investments. Although multiple asset classes may be affected by market disruption, the duration and impact may not be the same for all types of assets.
Fidelity is committed to helping you stay informed amid news about COVID-19 and during increased market volatility, and we’re taking extra steps to be responsive to customer needs. We encourage you to visit our websites, where we offer ongoing updates, commentary, and analysis on the markets and our funds.
Performance: The Bottom Line
Average annual total return reflects the change in the value of an investment, assuming reinvestment of distributions from dividend income and capital gains (the profits earned upon the sale of securities that have grown in value, if any) and assuming a constant rate of performance each year. The hypothetical investment and the average annual total returns do not reflect the deduction of taxes that a shareholder would pay on fund distributions or the redemption of fund shares. During periods of reimbursement by Fidelity, a fund’s total return will be greater than it would be had the reimbursement not occurred. How a fund did yesterday is no guarantee of how it will do tomorrow.
Average Annual Total Returns
| For the periods ended February 28, 2021 | Past 1 year | Past 5 years | Past 10 years |
| Utilities Portfolio | (0.05)% | 10.27% | 9.97% |
$10,000 Over 10 Years
Let's say hypothetically that $10,000 was invested in Utilities Portfolio on February 28, 2011.
The chart shows how the value of your investment would have changed, and also shows how the S&P 500® Index performed over the same period.
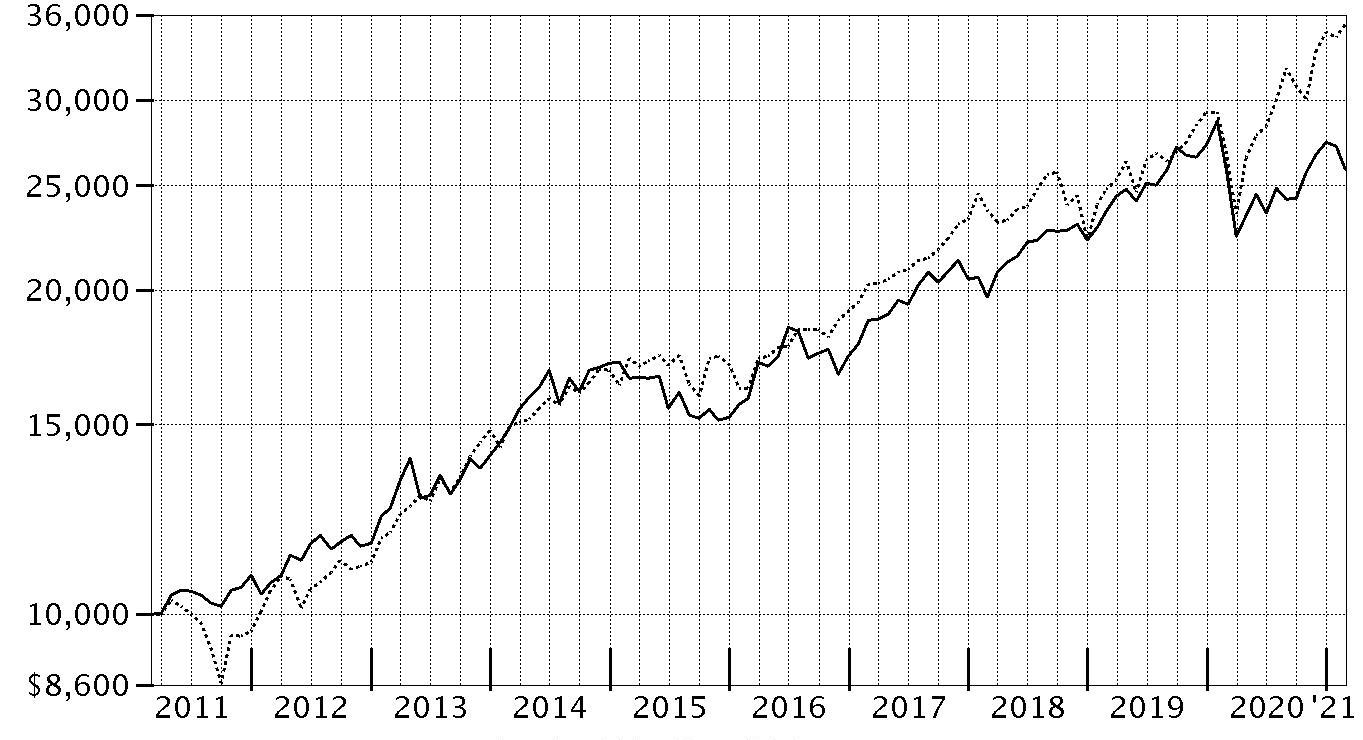
| Period Ending Values |
| $25,878 | Utilities Portfolio |
| $35,259 | S&P 500® Index |
Management's Discussion of Fund Performance
Market Recap: The S&P 500
® Index gained 31.29% for the 12 months ending February 28, 2021, a volatile but productive period for U.S. risk assets. The early-2020 outbreak and spread of COVID-19 resulted in stocks suffering one of the quickest declines on record, through March 23, followed by a historic rebound that included the index closing 2020 at an all-time high and gaining modest ground in the first two months of the new year. The crisis and containment efforts caused broad contraction in economic activity, along with extreme uncertainty and dislocation in financial markets. A rapid and expansive U.S. monetary/fiscal-policy response partially offset the economic disruption and fueled the market surge, as did resilient corporate earnings. The rally slowed in September, when stocks began a two-month retreat amid Congress’s inability to reach a deal on additional fiscal stimulus, as well as concerns about election uncertainty, indications the U.S. economic recovery could be slowing and a new wave of COVID-19 cases. A shift in momentum began in October and accelerated following the U.S. elections, with the approval of three breakthrough COVID-19 vaccines and prospects for additional government stimulus fueling the “reflation trade” through February 28. By sector for the full 12 months, information technology (+50%) and consumer discretionary (+43%) led all gainers. Materials (+42%) and communication services (+37%) also stood out. In contrast, the defensive utilities (-3%) and real estate sectors (+5%) notably lagged.
Comments from Portfolio Manager Douglas Simmons: For the fiscal year ending February 28, 2021, the fund returned -0.05%, outperforming the -2.70% result of the sector benchmark, the MSCI U.S. IMI Utilities 25/50 Index, but underperforming the broad-based S&P 500
® Index. An overweighting and stock picks among independent power producers & energy traders contributed notably to the fund’s relative result, as did stock choices and an underweighting in multi-utilities and an overweighting in renewable electricity. Overweighting two independent power producer & energy traders – AES (+69% for the fund) and Clearway Energy (+38% for the fund) – added more value than any other holding. The fund’s lighter-than-index stake in Consolidated Edison (-13%), a stock not held at period end, also contributed. Conversely, stock selection in electric utilities and an underweight among water utilities hindered the fund’s relative performance. Overweightings in electric utilities Evergy (-14%) and Edison International (-16%) detracted. Also, a lighter-than-index stake in NextEra Energy, which gained roughly 19%, hurt the fund’s relative return. We added significantly to the fund’s NextEra Energy position by period end. Notable positioning changes included the fund’s decreased exposure to the multi-utilities subindustry and an increase among electric utilities.
The views expressed above reflect those of the portfolio manager(s) only through the end of the period as stated on the cover of this report and do not necessarily represent the views of Fidelity or any other person in the Fidelity organization. Any such views are subject to change at any time based upon market or other conditions and Fidelity disclaims any responsibility to update such views. These views may not be relied on as investment advice and, because investment decisions for a Fidelity fund are based on numerous factors, may not be relied on as an indication of trading intent on behalf of any Fidelity fund.
Investment Summary (Unaudited)
Top Ten Stocks as of February 28, 2021
| | % of fund's net assets |
| NextEra Energy, Inc. | 14.1 |
| Southern Co. | 8.2 |
| Sempra Energy | 7.2 |
| Edison International | 6.1 |
| FirstEnergy Corp. | 5.9 |
| PG&E Corp. | 5.8 |
| Dominion Energy, Inc. | 4.8 |
| The AES Corp. | 4.8 |
| CenterPoint Energy, Inc. | 4.8 |
| Evergy, Inc. | 4.8 |
| | 66.5 |
Top Industries (% of fund's net assets)
| As of February 28, 2021 |
| | Electric Utilities | 63.2% |
| | Multi-Utilities | 21.6% |
| | Independent Power and Renewable Electricity Producers | 11.3% |
| | All Others* | 3.9% |

* Includes short-term investments and net other assets (liabilities).
Schedule of Investments February 28, 2021
Showing Percentage of Net Assets
| Common Stocks - 96.1% | | | |
| | | Shares | Value |
| Electric Utilities - 63.2% | | | |
| Electric Utilities - 63.2% | | | |
| American Electric Power Co., Inc. | | 558,150 | $41,777,528 |
| Duke Energy Corp. | | 472,179 | 40,413,801 |
| Edison International | | 1,006,726 | 54,353,137 |
| Evergy, Inc. | | 796,182 | 42,699,241 |
| Exelon Corp. | | 1,080,289 | 41,699,155 |
| FirstEnergy Corp. | | 1,607,392 | 53,268,971 |
| NextEra Energy, Inc. | | 1,715,888 | 126,083,448 |
| NRG Energy, Inc. | | 663,114 | 24,210,292 |
| PG&E Corp. (a) | | 4,984,294 | 52,384,930 |
| Portland General Electric Co. | | 54,605 | 2,302,147 |
| PPL Corp. | | 510,479 | 13,369,445 |
| Southern Co. | | 1,298,477 | 73,649,615 |
| | | | 566,211,710 |
| Independent Power and Renewable Electricity Producers - 11.3% | | | |
| Independent Power Producers & Energy Traders - 7.9% | | | |
| Clearway Energy, Inc.: | | | |
| Class A | | 119,624 | 3,128,168 |
| Class C (b) | | 281,491 | 7,729,743 |
| The AES Corp. | | 1,622,515 | 43,093,998 |
| Vistra Corp. | | 944,910 | 16,299,698 |
| | | | 70,251,607 |
| Renewable Electricity - 3.4% | | | |
| NextEra Energy Partners LP | | 242,344 | 17,603,868 |
| Sunnova Energy International, Inc. (a) | | 291,300 | 13,061,892 |
| | | | 30,665,760 |
|
| TOTAL INDEPENDENT POWER AND RENEWABLE ELECTRICITY PRODUCERS | | | 100,917,367 |
|
| Multi-Utilities - 21.6% | | | |
| Multi-Utilities - 21.6% | | | |
| CenterPoint Energy, Inc. | | 2,210,208 | 42,966,444 |
| Dominion Energy, Inc. | | 631,060 | 43,114,019 |
| NiSource, Inc. | | 588,043 | 12,701,729 |
| Public Service Enterprise Group, Inc. | | 574,405 | 30,920,221 |
| Sempra Energy | | 552,608 | 64,091,476 |
| | | | 193,793,889 |
| TOTAL COMMON STOCKS | | | |
| (Cost $737,636,568) | | | 860,922,966 |
|
| Money Market Funds - 3.7% | | | |
| Fidelity Cash Central Fund 0.07% (c) | | 33,113,214 | 33,119,837 |
| Fidelity Securities Lending Cash Central Fund 0.08% (c)(d) | | 57,494 | 57,500 |
| TOTAL MONEY MARKET FUNDS | | | |
| (Cost $33,177,337) | | | 33,177,337 |
| TOTAL INVESTMENT IN SECURITIES - 99.8% | | | |
| (Cost $770,813,905) | | | 894,100,303 |
| NET OTHER ASSETS (LIABILITIES) - 0.2% | | | 2,184,352 |
| NET ASSETS - 100% | | | $896,284,655 |
Legend
(a) Non-income producing
(b) Security or a portion of the security is on loan at period end.
(c) Affiliated fund that is generally available only to investment companies and other accounts managed by Fidelity Investments. The rate quoted is the annualized seven-day yield of the fund at period end. A complete unaudited listing of the fund's holdings as of its most recent quarter end is available upon request. In addition, each Fidelity Central Fund's financial statements, which are not covered by the Fund's Report of Independent Registered Public Accounting Firm, are available on the SEC's website or upon request.
(d) Investment made with cash collateral received from securities on loan.
Affiliated Central Funds
Information regarding fiscal year to date income earned by the Fund from investments in Fidelity Central Funds is as follows:
| Fund | Income earned |
| Fidelity Cash Central Fund | $14,011 |
| Fidelity Securities Lending Cash Central Fund | 14,284 |
| Total | $28,295 |
Amounts in the income column in the above table include any capital gain distributions from underlying funds, which are presented in the corresponding line-item in the Statement of Operations, if applicable. Amount for Fidelity Securities Lending Cash Central Fund represents the income earned on investing cash collateral, less rebates paid to borrowers and any lending agent fees associated with the loan, plus any premium payments received for lending certain types of securities.
Investment Valuation
The following is a summary of the inputs used, as of February 28, 2021, involving the Fund's assets and liabilities carried at fair value. The inputs or methodology used for valuing securities may not be an indication of the risk associated with investing in those securities. For more information on valuation inputs, and their aggregation into the levels used below, please refer to the Investment Valuation section in the accompanying Notes to Financial Statements.
| | Valuation Inputs at Reporting Date: |
| Description | Total | Level 1 | Level 2 | Level 3 |
| Investments in Securities: | | | | |
| Common Stocks | $860,922,966 | $860,922,966 | $-- | $-- |
| Money Market Funds | 33,177,337 | 33,177,337 | -- | -- |
| Total Investments in Securities: | $894,100,303 | $894,100,303 | $-- | $-- |
See accompanying notes which are an integral part of the financial statements.
Financial Statements
Statement of Assets and Liabilities
| | | February 28, 2021 |
| Assets | | |
Investment in securities, at value (including securities loaned of $54,920) — See accompanying schedule:
Unaffiliated issuers (cost $737,636,568) | $860,922,966 | |
| Fidelity Central Funds (cost $33,177,337) | 33,177,337 | |
| Total Investment in Securities (cost $770,813,905) | | $894,100,303 |
| Receivable for investments sold | | 2,026,853 |
| Receivable for fund shares sold | | 1,131,048 |
| Dividends receivable | | 3,745,290 |
| Distributions receivable from Fidelity Central Funds | | 549 |
| Prepaid expenses | | 4,480 |
| Other receivables | | 13,059 |
| Total assets | | 901,021,582 |
| Liabilities | | |
| Payable for investments purchased | $2,347,950 | |
| Payable for fund shares redeemed | 1,713,046 | |
| Accrued management fee | 422,325 | |
| Other affiliated payables | 163,068 | |
| Other payables and accrued expenses | 33,038 | |
| Collateral on securities loaned | 57,500 | |
| Total liabilities | | 4,736,927 |
| Net Assets | | $896,284,655 |
| Net Assets consist of: | | |
| Paid in capital | | $778,355,916 |
| Total accumulated earnings (loss) | | 117,928,739 |
| Net Assets | | $896,284,655 |
| Net Asset Value, offering price and redemption price per share ($896,284,655 ÷ 10,355,308 shares) | | $86.55 |
See accompanying notes which are an integral part of the financial statements.
Statement of Operations
| | | Year ended February 28, 2021 |
| Investment Income | | |
| Dividends | | $26,092,253 |
| Income from Fidelity Central Funds (including $14,284 from security lending) | | 28,295 |
| Total income | | 26,120,548 |
| Expenses | | |
| Management fee | $5,258,151 | |
| Transfer agent fees | 1,778,529 | |
| Accounting fees | 329,756 | |
| Custodian fees and expenses | 8,153 | |
| Independent trustees' fees and expenses | 5,943 | |
| Registration fees | 57,527 | |
| Audit | 41,022 | |
| Legal | 72,839 | |
| Interest | 961 | |
| Miscellaneous | 26,262 | |
| Total expenses before reductions | 7,579,143 | |
| Expense reductions | (105,503) | |
| Total expenses after reductions | | 7,473,640 |
| Net investment income (loss) | | 18,646,908 |
| Realized and Unrealized Gain (Loss) | | |
| Net realized gain (loss) on: | | |
| Investment securities: | | |
| Unaffiliated issuers | 145,110 | |
| Fidelity Central Funds | 526 | |
| Foreign currency transactions | (1,315) | |
| Total net realized gain (loss) | | 144,321 |
| Change in net unrealized appreciation (depreciation) on: | | |
| Investment securities: | | |
| Unaffiliated issuers | (44,462,640) | |
| Assets and liabilities in foreign currencies | 1,623 | |
| Total change in net unrealized appreciation (depreciation) | | (44,461,017) |
| Net gain (loss) | | (44,316,696) |
| Net increase (decrease) in net assets resulting from operations | | $(25,669,788) |
See accompanying notes which are an integral part of the financial statements.
Statement of Changes in Net Assets
| | Year ended February 28, 2021 | Year ended February 29, 2020 |
| Increase (Decrease) in Net Assets | | |
| Operations | | |
| Net investment income (loss) | $18,646,908 | $27,938,096 |
| Net realized gain (loss) | 144,321 | 71,638,581 |
| Change in net unrealized appreciation (depreciation) | (44,461,017) | (2,937,838) |
| Net increase (decrease) in net assets resulting from operations | (25,669,788) | 96,638,839 |
| Distributions to shareholders | (52,597,101) | (29,428,267) |
| Share transactions | | |
| Proceeds from sales of shares | 248,831,567 | 668,747,776 |
| Reinvestment of distributions | 49,416,895 | 27,518,824 |
| Cost of shares redeemed | (570,705,990) | (557,231,194) |
| Net increase (decrease) in net assets resulting from share transactions | (272,457,528) | 139,035,406 |
| Total increase (decrease) in net assets | (350,724,417) | 206,245,978 |
| Net Assets | | |
| Beginning of period | 1,247,009,072 | 1,040,763,094 |
| End of period | $896,284,655 | $1,247,009,072 |
| Other Information | | |
| Shares | | |
| Sold | 2,920,974 | 7,178,573 |
| Issued in reinvestment of distributions | 585,913 | 286,923 |
| Redeemed | (6,824,868) | (5,990,923) |
| Net increase (decrease) | (3,317,981) | 1,474,573 |
See accompanying notes which are an integral part of the financial statements.
Financial Highlights
Utilities Portfolio
| | | | | | |
| Years ended February 28, | 2021 | 2020 A | 2019 | 2018 | 2017 |
| Selected Per–Share Data | | | | | |
| Net asset value, beginning of period | $91.20 | $85.32 | $76.75 | $77.05 | $66.88 |
| Income from Investment Operations | | | | | |
| Net investment income (loss)B | 1.61 | 2.09 | 2.06 | 1.62 | 1.52 |
| Net realized and unrealized gain (loss) | (1.81) | 5.99 | 13.35 | 2.56 | 10.44 |
| Total from investment operations | (.20) | 8.08 | 15.41 | 4.18 | 11.96 |
| Distributions from net investment income | (2.12) | (1.94) | (1.37) | (1.29) | (1.77) |
| Distributions from net realized gain | (2.34) | (.26) | (5.46) | (3.19) | (.02) |
| Total distributions | (4.45)C | (2.20) | (6.84)C | (4.48) | (1.79) |
| Redemption fees added to paid in capitalB | – | – | – | –D | –D |
| Net asset value, end of period | $86.55 | $91.20 | $85.32 | $76.75 | $77.05 |
| Total ReturnE | (.05)% | 9.34% | 20.17% | 4.99% | 18.21% |
| Ratios to Average Net AssetsF,G | | | | | |
| Expenses before reductions | .76% | .75% | .78% | .78% | .79% |
| Expenses net of fee waivers, if any | .76% | .75% | .78% | .78% | .79% |
| Expenses net of all reductions | .75% | .74% | .76% | .77% | .78% |
| Net investment income (loss) | 1.88% | 2.25% | 2.45% | 2.00% | 2.09% |
| Supplemental Data | | | | | |
| Net assets, end of period (000 omitted) | $896,285 | $1,247,009 | $1,040,763 | $716,979 | $696,138 |
| Portfolio turnover rateH | 64% | 65%I | 97%I | 66%I | 70%I |
A For the year ended February 29.
B Calculated based on average shares outstanding during the period.
C Total distributions per share do not sum due to rounding.
D Amount represents less than $.005 per share.
E Total returns would have been lower if certain expenses had not been reduced during the applicable periods shown.
F Fees and expenses of any underlying mutual funds or exchange-traded funds (ETFs) are not included in the Fund's expense ratio. The Fund indirectly bears its proportionate share of these expenses. For additional expense information related to investments in Fidelity Central Funds, please refer to the "Investments in Fidelity Central Funds" note found in the Notes to Financial Statements section of the most recent Annual or Semi-Annual report.
G Expense ratios reflect operating expenses of the class. Expenses before reductions do not reflect amounts reimbursed, waived, or reduced through arrangements with the investment advisor, brokerage services, or other offset arrangements, if applicable, and do not represent the amount paid by the class during periods when reimbursements, waivers or reductions occur.
H Amount does not include the portfolio activity of any underlying mutual funds or exchange-traded funds (ETFs).
I Portfolio turnover rate excludes securities received or delivered in-kind.
See accompanying notes which are an integral part of the financial statements.
Notes to Financial Statements
For the period ended February 28, 2021
1. Organization.
Utilities Portfolio (the Fund) is a non-diversified fund of Fidelity Select Portfolios (the Trust) and is authorized to issue an unlimited number of shares. Share transactions on the Statement of Changes in Net Assets may contain exchanges between affiliated funds. The Trust is registered under the Investment Company Act of 1940, as amended (the 1940 Act), as an open-end management investment company organized as a Massachusetts business trust. The Fund invests primarily in securities of companies whose principal business activities fall within specific industries.
2. Investments in Fidelity Central Funds.
The Fund invests in Fidelity Central Funds, which are open-end investment companies generally available only to other investment companies and accounts managed by the investment adviser and its affiliates. The Fund's Schedule of Investments lists each of the Fidelity Central Funds held as of period end, if any, as an investment of the Fund, but does not include the underlying holdings of each Fidelity Central Fund. As an Investing Fund, the Fund indirectly bears its proportionate share of the expenses of the underlying Fidelity Central Funds.
The Money Market Central Funds seek preservation of capital and current income and are managed by the investment adviser. Annualized expenses of the Money Market Central Funds as of their most recent shareholder report date ranged from less than .005% to .01%.
A complete unaudited list of holdings for each Fidelity Central Fund is available upon request or at the Securities and Exchange Commission (the SEC) website at www.sec.gov. In addition, the financial statements of the Fidelity Central Funds, which are not covered by the Fund's Report of Independent Registered Public Accounting Firm, are available on the SEC website or upon request.
3. Significant Accounting Policies.
The Fund is an investment company and applies the accounting and reporting guidance of the Financial Accounting Standards Board (FASB) Accounting Standards Codification Topic 946 Financial Services - Investment Companies. The financial statements have been prepared in conformity with accounting principles generally accepted in the United States of America (GAAP), which require management to make certain estimates and assumptions at the date of the financial statements. Actual results could differ from those estimates. Subsequent events, if any, through the date that the financial statements were issued have been evaluated in the preparation of the financial statements. The following summarizes the significant accounting policies of the Fund:
Investment Valuation. Investments are valued as of 4:00 p.m. Eastern time on the last calendar day of the period. The Board of Trustees (the Board) has delegated the day to day responsibility for the valuation of the Fund's investments to the Fair Value Committee (the Committee) established by the Fund's investment adviser. In accordance with valuation policies and procedures approved by the Board, the Fund attempts to obtain prices from one or more third party pricing vendors or brokers to value its investments. When current market prices, quotations or currency exchange rates are not readily available or reliable, investments will be fair valued in good faith by the Committee, in accordance with procedures adopted by the Board. Factors used in determining fair value vary by investment type and may include market or investment specific events. The frequency with which these procedures are used cannot be predicted and they may be utilized to a significant extent. The Committee oversees the Fund's valuation policies and procedures and reports to the Board on the Committee's activities and fair value determinations. The Board monitors the appropriateness of the procedures used in valuing the Fund's investments and ratifies the fair value determinations of the Committee.
The Fund categorizes the inputs to valuation techniques used to value its investments into a disclosure hierarchy consisting of three levels as shown below:
- Level 1 – quoted prices in active markets for identical investments
- Level 2 – other significant observable inputs (including quoted prices for similar investments, interest rates, prepayment speeds, etc.)
- Level 3 – unobservable inputs (including the Fund's own assumptions based on the best information available)
Valuation techniques used to value the Fund's investments by major category are as follows:
Equity securities, including restricted securities, for which market quotations are readily available, are valued at the last reported sale price or official closing price as reported by a third party pricing vendor on the primary market or exchange on which they are traded and are categorized as Level 1 in the hierarchy. In the event there were no sales during the day or closing prices are not available, securities are valued at the last quoted bid price or may be valued using the last available price and are generally categorized as Level 2 in the hierarchy. For foreign equity securities, when market or security specific events arise, comparisons to the valuation of American Depositary Receipts (ADRs), futures contracts, Exchange-Traded Funds (ETFs) and certain indexes as well as quoted prices for similar securities may be used and would be categorized as Level 2 in the hierarchy. For equity securities, including restricted securities, where observable inputs are limited, assumptions about market activity and risk are used and these securities may be categorized as Level 3 in the hierarchy.
Investments in open-end mutual funds, including the Fidelity Central Funds, are valued at their closing net asset value (NAV) each business day and are categorized as Level 1 in the hierarchy.
Changes in valuation techniques may result in transfers in or out of an assigned level within the disclosure hierarchy. The aggregate value of investments by input level as of February 28, 2021 is included at the end of the Fund's Schedule of Investments.
Foreign Currency. Certain Funds may use foreign currency contracts to facilitate transactions in foreign-denominated securities. Gains and losses from these transactions may arise from changes in the value of the foreign currency or if the counterparties do not perform under the contracts' terms.
Foreign-denominated assets, including investment securities, and liabilities are translated into U.S. dollars at the exchange rates at period end. Purchases and sales of investment securities, income and dividends received, and expenses denominated in foreign currencies are translated into U.S. dollars at the exchange rate in effect on the transaction date.
The effects of exchange rate fluctuations on investments are included with the net realized and unrealized gain (loss) on investment securities. Other foreign currency transactions resulting in realized and unrealized gain (loss) are disclosed separately.
Investment Transactions and Income. For financial reporting purposes, the Fund's investment holdings and NAV include trades executed through the end of the last business day of the period. The NAV per share for processing shareholder transactions is calculated as of the close of business of the New York Stock Exchange (NYSE), normally 4:00 p.m. Eastern time and includes trades executed through the end of the prior business day. Gains and losses on securities sold are determined on the basis of identified cost and include proceeds received from litigation. Dividend income is recorded on the ex-dividend date, except for certain dividends from foreign securities where the ex-dividend date may have passed, which are recorded as soon as the Fund is informed of the ex-dividend date. Non-cash dividends included in dividend income, if any, are recorded at the fair market value of the securities received. Income and capital gain distributions from Fidelity Central Funds, if any, are recorded on the ex-dividend date. Certain distributions received by the Fund represent a return of capital or capital gain. The Fund determines the components of these distributions subsequent to the ex-dividend date, based upon receipt of tax filings or other correspondence relating to the underlying investment. These distributions are recorded as a reduction of cost of investments and/or as a realized gain. Investment income is recorded net of foreign taxes withheld where recovery of such taxes is uncertain.
Expenses. Expenses directly attributable to a fund are charged to that fund. Expenses attributable to more than one fund are allocated among the respective funds on the basis of relative net assets or other appropriate methods. Expense estimates are accrued in the period to which they relate and adjustments are made when actual amounts are known.
Income Tax Information and Distributions to Shareholders. Each year, the Fund intends to qualify as a regulated investment company under Subchapter M of the Internal Revenue Code, including distributing substantially all of its taxable income and realized gains. As a result, no provision for U.S. Federal income taxes is required. As of February 28, 2021, the Fund did not have any unrecognized tax benefits in the financial statements; nor is the Fund aware of any tax positions for which it is reasonably possible that the total amounts of unrecognized tax benefits will significantly change in the next twelve months. The Fund files a U.S. federal tax return, in addition to state and local tax returns as required. The Fund's federal income tax returns are subject to examination by the Internal Revenue Service (IRS) for a period of three fiscal years after they are filed. State and local tax returns may be subject to examination for an additional fiscal year depending on the jurisdiction. Foreign taxes are provided for based on the Fund's understanding of the tax rules and rates that exist in the foreign markets in which it invests.
Distributions are declared and recorded on the ex-dividend date. Income and capital gain distributions are determined in accordance with income tax regulations, which may differ from GAAP.
Capital accounts within the financial statements are adjusted for permanent book-tax differences. These adjustments have no impact on net assets or the results of operations. Capital accounts are not adjusted for temporary book-tax differences which will reverse in a subsequent period.
Book-tax differences are primarily due to foreign currency transactions, partnerships, capital loss carryforwards and losses deferred due to wash sales and excise tax regulations.
As of period end, the cost and unrealized appreciation (depreciation) in securities, and derivatives if applicable, for federal income tax purposes were as follows:
| Gross unrealized appreciation | $146,132,432 |
| Gross unrealized depreciation | (25,304,401) |
| Net unrealized appreciation (depreciation) | $120,828,031 |
| Tax Cost | $773,272,272 |
The tax-based components of distributable earnings as of period end were as follows:
| Capital loss carryforward | $(825,347) |
| Net unrealized appreciation (depreciation) on securities and other investments | $120,829,412 |
Capital loss carryforwards are only available to offset future capital gains of the Fund to the extent provided by regulations and may be limited. The capital loss carryforward information presented below, including any applicable limitation, is estimated as of fiscal period end and is subject to adjustment.
| No expiration | |
| Short-term | $(825,347) |
The Fund intends to elect to defer to its next fiscal year $2,075,326 of ordinary losses recognized during the period January 1, 2021 to February 28, 2021.
The tax character of distributions paid was as follows:
| | February 28, 2021 | February 29, 2020 |
| Ordinary Income | $22,682,991 | $ 25,895,270 |
| Long-term Capital Gains | 29,914,110 | 3,532,997 |
| Total | $52,597,101 | $ 29,428,267 |
4. Purchases and Sales of Investments.
Purchases and sales of securities, other than short-term securities, are noted in the table below.
| | Purchases ($) | Sales ($) |
| Utilities Portfolio | 632,299,107 | 962,157,117 |
5. Fees and Other Transactions with Affiliates.
Management Fee. Fidelity Management & Research Company LLC (the investment adviser) and its affiliates provide the Fund with investment management related services for which the Fund pays a monthly management fee. The management fee is the sum of an individual fund fee rate that is based on an annual rate of .30% of the Fund's average net assets and an annualized group fee rate that averaged .23% during the period. The group fee rate is based upon the monthly average net assets of a group of registered investment companies with which the investment adviser has management contracts. The group fee rate decreases as assets under management increase and increases as assets under management decrease. For the reporting period, the total annual management fee rate was .53% of the Fund's average net assets.
Transfer Agent Fees. Fidelity Investments Institutional Operations Company LLC (FIIOC), an affiliate of the investment adviser, is the Fund's transfer, dividend disbursing and shareholder servicing agent. FIIOC receives account fees and asset-based fees that vary according to account size and type of account. FIIOC pays for typesetting, printing and mailing of shareholder reports, except proxy statements. For the period, the transfer agent fees were equivalent to an annual rate of .18% of average net assets.
Accounting Fees. Fidelity Service Company, Inc. (FSC), an affiliate of the investment adviser, maintains the Fund's accounting records. The accounting fee is based on the level of average net assets for each month. For the period, the fees were equivalent to the following annual rates:
| | % of Average Net Assets |
| Utilities Portfolio | .03 |
Brokerage Commissions. A portion of portfolio transactions were placed with brokerage firms which are affiliates of the investment adviser. Brokerage commissions are included in net realized gain (loss) and change in net unrealized appreciation (depreciation) in the Statement of Operations. The commissions paid to these affiliated firms were as follows:
| | Amount |
| Utilities Portfolio | $33,843 |
Interfund Lending Program. Pursuant to an Exemptive Order issued by the SEC, the Fund, along with other registered investment companies having management contracts with Fidelity Management & Research Company LLC (FMR), or other affiliated entities of FMR, may participate in an interfund lending program. This program provides an alternative credit facility allowing the Fund to borrow from, or lend money to, other participating affiliated funds. At period end, there were no interfund loans outstanding. Activity in this program during the period for which loans were outstanding was as follows:
| | Borrower or Lender | Average Loan Balance | Weighted Average Interest Rate | Interest Expense |
| Utilities Portfolio | Borrower | $11,327,250 | .76% | $961 |
Interfund Trades. Funds may purchase from or sell securities to other Fidelity Funds under procedures adopted by the Board. The procedures have been designed to ensure these interfund trades are executed in accordance with Rule 17a-7 of the 1940 Act. Any interfund trades are included within the respective purchases and sales amounts shown in the Purchases and Sales of Investments note and are noted in the table below.
| | Purchases ($) | Sales ($) |
| Utilities Portfolio | 11,872,185 | 15,706,097 |
Prior Fiscal Year Affiliated Redemptions In-Kind. During the prior period, 272,865 shares of the Fund were redeemed in-kind for investments and cash with a value of $24,994,414. The Fund had a net realized gain of $7,538,422 on investments delivered through in-kind redemptions. The amount of the in-kind redemptions is included in share transactions in the accompanying Statement of Changes in Net Assets. The Fund recognized no gain or loss for federal income tax purposes.
6. Committed Line of Credit.
Certain Funds participate with other funds managed by the investment adviser or an affiliate in a $4.25 billion credit facility (the "line of credit") to be utilized for temporary or emergency purposes to fund shareholder redemptions or for other short-term liquidity purposes. The participating funds have agreed to pay commitment fees on their pro-rata portion of the line of credit, which are reflected in Miscellaneous expenses on the Statement of Operations, and are listed below.
| | Amount |
| Utilities Portfolio | $2,435 |
During the period, there were no borrowings on this line of credit.
7. Security Lending.
Funds lend portfolio securities from time to time in order to earn additional income. Lending agents are used, including National Financial Services (NFS), an affiliate of the investment adviser. Pursuant to a securities lending agreement, NFS will receive a fee, which is capped at 9.9% of a fund's daily lending revenue, for its services as lending agent. A fund may lend securities to certain qualified borrowers, including NFS. On the settlement date of the loan, a fund receives collateral (in the form of U.S. Treasury obligations, letters of credit and/or cash) against the loaned securities and maintains collateral in an amount not less than 100% of the market value of the loaned securities during the period of the loan. The market value of the loaned securities is determined at the close of business of a fund and any additional required collateral is delivered to a fund on the next business day. A fund or borrower may terminate the loan at any time, and if the borrower defaults on its obligation to return the securities loaned because of insolvency or other reasons, a fund may apply collateral received from the borrower against the obligation. A fund may experience delays and costs in recovering the securities loaned. Any cash collateral received is invested in the Fidelity Securities Lending Cash Central Fund. Any loaned securities are identified as such in the Schedule of Investments, and the value of loaned securities and cash collateral at period end, as applicable, are presented in the Statement of Assets and Liabilities. Security lending income represents the income earned on investing cash collateral, less rebates paid to borrowers and any lending agent fees associated with the loan, plus any premium payments received for lending certain types of securities. Security lending income is presented in the Statement of Operations as a component of income from Fidelity Central Funds. Affiliated security lending activity, if any, was as follows:
| | Total Security Lending Income Fees Paid to NFS | Security Lending Income From Securities Loaned to NFS | Value of Securities Loaned to NFS at Period End |
| Utilities Portfolio | $1,499 | $– | $– |
8. Expense Reductions.
Commissions paid to certain brokers with whom the investment adviser, or its affiliates, places trades on behalf of the Fund include an amount in addition to trade execution, which may be rebated back to the Fund to offset expenses. This amount totaled $101,458 for the period.
In addition, during the period the investment adviser or an affiliate reimbursed and/or waived a portion of operating expenses in the amount of $4,045.
9. Other.
The Fund's organizational documents provide former and current trustees and officers with a limited indemnification against liabilities arising in connection with the performance of their duties to the Fund. In the normal course of business, the Fund may also enter into contracts that provide general indemnifications. The Fund's maximum exposure under these arrangements is unknown as this would be dependent on future claims that may be made against the Fund. The risk of material loss from such claims is considered remote.
10. Coronavirus (COVID-19) Pandemic.
An outbreak of COVID-19 first detected in China during December 2019 has since spread globally and was declared a pandemic by the World Health Organization during March 2020. Developments that disrupt global economies and financial markets, such as the COVID-19 pandemic, may magnify factors that affect the Fund's performance.
Report of Independent Registered Public Accounting Firm
To the Board of Trustees of Fidelity Select Portfolios and Shareholders of Utilities Portfolio
Opinion on the Financial Statements
We have audited the accompanying statement of assets and liabilities, including the schedule of investments, of Utilities Portfolio (one of the funds constituting Fidelity Select Portfolios, referred to hereafter as the “Fund”) as of February 28, 2021, the related statement of operations for the year ended February 28, 2021, the statement of changes in net assets for each of the two years in the period ended February 28, 2021, including the related notes, and the financial highlights for each of the five years in the period ended February 28, 2021 (collectively referred to as the “financial statements”). In our opinion, the financial statements present fairly, in all material respects, the financial position of the Fund as of February 28, 2021, the results of its operations for the year then ended, the changes in its net assets for each of the two years in the period ended February 28, 2021 and the financial highlights for each of the five years in the period ended February 28, 2021 in conformity with accounting principles generally accepted in the United States of America.
Basis for Opinion
These financial statements are the responsibility of the Fund’s management. Our responsibility is to express an opinion on the Fund’s financial statements based on our audits. We are a public accounting firm registered with the Public Company Accounting Oversight Board (United States) (PCAOB) and are required to be independent with respect to the Fund in accordance with the U.S. federal securities laws and the applicable rules and regulations of the Securities and Exchange Commission and the PCAOB.
We conducted our audits of these financial statements in accordance with the standards of the PCAOB. Those standards require that we plan and perform the audit to obtain reasonable assurance about whether the financial statements are free of material misstatement, whether due to error or fraud.
Our audits included performing procedures to assess the risks of material misstatement of the financial statements, whether due to error or fraud, and performing procedures that respond to those risks. Such procedures included examining, on a test basis, evidence regarding the amounts and disclosures in the financial statements. Our audits also included evaluating the accounting principles used and significant estimates made by management, as well as evaluating the overall presentation of the financial statements. Our procedures included confirmation of securities owned as of February 28, 2021 by correspondence with the custodian and brokers; when replies were not received from brokers, we performed other auditing procedures. We believe that our audits provide a reasonable basis for our opinion.
/s/ PricewaterhouseCoopers LLP
Boston, Massachusetts
April 15, 2021
We have served as the auditor of one or more investment companies in the Fidelity group of funds since 1932.
Trustees and Officers
The Trustees, Members of the Advisory Board (if any), and officers of the trust and fund, as applicable, are listed below. The Board of Trustees governs the fund and is responsible for protecting the interests of shareholders. The Trustees are experienced executives who meet periodically throughout the year to oversee the fund's activities, review contractual arrangements with companies that provide services to the fund, oversee management of the risks associated with such activities and contractual arrangements, and review the fund's performance. Each of the Trustees oversees 309 funds.
The Trustees hold office without limit in time except that (a) any Trustee may resign; (b) any Trustee may be removed by written instrument, signed by at least two-thirds of the number of Trustees prior to such removal; (c) any Trustee who requests to be retired or who has become incapacitated by illness or injury may be retired by written instrument signed by a majority of the other Trustees; and (d) any Trustee may be removed at any special meeting of shareholders by a two-thirds vote of the outstanding voting securities of the trust. Each Trustee who is not an interested person (as defined in the 1940 Act) of the trust and the fund is referred to herein as an Independent Trustee. Each Independent Trustee shall retire not later than the last day of the calendar year in which his or her 75th birthday occurs. The Independent Trustees may waive this mandatory retirement age policy with respect to individual Trustees. Officers and Advisory Board Members hold office without limit in time, except that any officer or Advisory Board Member may resign or may be removed by a vote of a majority of the Trustees at any regular meeting or any special meeting of the Trustees. Except as indicated, each individual has held the office shown or other offices in the same company for the past five years.
The fund’s Statement of Additional Information (SAI) includes more information about the Trustees. To request a free copy, call Fidelity at 1-800-544-8544.
Experience, Skills, Attributes, and Qualifications of the Trustees. The Governance and Nominating Committee has adopted a statement of policy that describes the experience, qualifications, attributes, and skills that are necessary and desirable for potential Independent Trustee candidates (Statement of Policy). The Board believes that each Trustee satisfied at the time he or she was initially elected or appointed a Trustee, and continues to satisfy, the standards contemplated by the Statement of Policy. The Governance and Nominating Committee also engages professional search firms to help identify potential Independent Trustee candidates who have the experience, qualifications, attributes, and skills consistent with the Statement of Policy. From time to time, additional criteria based on the composition and skills of the current Independent Trustees, as well as experience or skills that may be appropriate in light of future changes to board composition, business conditions, and regulatory or other developments, have also been considered by the professional search firms and the Governance and Nominating Committee. In addition, the Board takes into account the Trustees' commitment and participation in Board and committee meetings, as well as their leadership of standing and ad hoc committees throughout their tenure.
In determining that a particular Trustee was and continues to be qualified to serve as a Trustee, the Board has considered a variety of criteria, none of which, in isolation, was controlling. The Board believes that, collectively, the Trustees have balanced and diverse experience, qualifications, attributes, and skills, which allow the Board to operate effectively in governing the fund and protecting the interests of shareholders. Information about the specific experience, skills, attributes, and qualifications of each Trustee, which in each case led to the Board's conclusion that the Trustee should serve (or continue to serve) as a trustee of the fund, is provided below.
Board Structure and Oversight Function. Robert A. Lawrence is an interested person and currently serves as Acting Chairman. The Trustees have determined that an interested Chairman is appropriate and benefits shareholders because an interested Chairman has a personal and professional stake in the quality and continuity of services provided to the fund. Independent Trustees exercise their informed business judgment to appoint an individual of their choosing to serve as Chairman, regardless of whether the Trustee happens to be independent or a member of management. The Independent Trustees have determined that they can act independently and effectively without having an Independent Trustee serve as Chairman and that a key structural component for assuring that they are in a position to do so is for the Independent Trustees to constitute a substantial majority for the Board. The Independent Trustees also regularly meet in executive session. David M. Thomas serves as Lead Independent Trustee and as such (i) acts as a liaison between the Independent Trustees and management with respect to matters important to the Independent Trustees and (ii) with management prepares agendas for Board meetings.
Fidelity® funds are overseen by different Boards of Trustees. The fund's Board oversees Fidelity's high income and certain equity funds, and other Boards oversee Fidelity's investment-grade bond, money market, asset allocation, and other equity funds. The asset allocation funds may invest in Fidelity® funds overseen by the fund's Board. The use of separate Boards, each with its own committee structure, allows the Trustees of each group of Fidelity® funds to focus on the unique issues of the funds they oversee, including common research, investment, and operational issues. On occasion, the separate Boards establish joint committees to address issues of overlapping consequences for the Fidelity® funds overseen by each Board.
The Trustees operate using a system of committees to facilitate the timely and efficient consideration of all matters of importance to the Trustees, the fund, and fund shareholders and to facilitate compliance with legal and regulatory requirements and oversight of the fund's activities and associated risks. The Board, acting through its committees, has charged FMR and its affiliates with (i) identifying events or circumstances the occurrence of which could have demonstrably adverse effects on the fund's business and/or reputation; (ii) implementing processes and controls to lessen the possibility that such events or circumstances occur or to mitigate the effects of such events or circumstances if they do occur; and (iii) creating and maintaining a system designed to evaluate continuously business and market conditions in order to facilitate the identification and implementation processes described in (i) and (ii) above. Because the day-to-day operations and activities of the fund are carried out by or through FMR, its affiliates, and other service providers, the fund's exposure to risks is mitigated but not eliminated by the processes overseen by the Trustees. While each of the Board's committees has responsibility for overseeing different aspects of the fund's activities, oversight is exercised primarily through the Operations, Audit, and Compliance Committees. Appropriate personnel, including but not limited to the fund's Chief Compliance Officer (CCO), FMR's internal auditor, the independent accountants, the fund's Treasurer and portfolio management personnel, make periodic reports to the Board's committees, as appropriate, including an annual review of Fidelity's risk management program for the Fidelity® funds. The responsibilities of each standing committee, including their oversight responsibilities, are described further under "Standing Committees of the Trustees."
Interested Trustees*:
Correspondence intended for a Trustee who is an interested person may be sent to Fidelity Investments, 245 Summer Street, Boston, Massachusetts 02210.
Name, Year of Birth; Principal Occupations and Other Relevant Experience+
Bettina Doulton (1964)
Year of Election or Appointment: 2020
Trustee
Ms. Doulton also serves as Trustee of other Fidelity® funds. Prior to her retirement, Ms. Doulton served in a variety of positions at Fidelity Investments, including as a managing director of research (2006-2007), portfolio manager to certain Fidelity® funds (1993-2005), equity analyst and portfolio assistant (1990-1993), and research assistant (1987-1990). Ms. Doulton currently owns and operates Phi Builders + Architects and Cellardoor Winery. Previously, Ms. Doulton served as a member of the Board of Brown Capital Management, LLC (2013-2018).
Robert A. Lawrence (1952)
Year of Election or Appointment: 2020
Trustee
Acting Chairman of the Board of Trustees
Mr. Lawrence also serves as Trustee of other funds. Previously, Mr. Lawrence served as a Member of the Advisory Board of certain funds. Prior to his retirement in 2008, Mr. Lawrence served as Vice President of certain Fidelity® funds (2006-2008), Senior Vice President, Head of High Income Division of Fidelity Management & Research Company (investment adviser firm, 2006-2008), and President of Fidelity Strategic Investments (investment adviser firm, 2002-2005).
* Determined to be an “Interested Trustee” by virtue of, among other things, his or her affiliation with the trust or various entities under common control with FMR.
+ The information includes the Trustee's principal occupation during the last five years and other information relating to the experience, attributes, and skills relevant to the Trustee's qualifications to serve as a Trustee, which led to the conclusion that the Trustee should serve as a Trustee for the fund.
Independent Trustees:
Correspondence intended for an Independent Trustee may be sent to Fidelity Investments, P.O. Box 55235, Boston, Massachusetts 02205-5235.
Name, Year of Birth; Principal Occupations and Other Relevant Experience+
Dennis J. Dirks (1948)
Year of Election or Appointment: 2018
Trustee
Mr. Dirks also serves as Trustee of other Fidelity® funds. Prior to his retirement in May 2003, Mr. Dirks served as Chief Operating Officer and as a member of the Board of The Depository Trust & Clearing Corporation (financial markets infrastructure), President, Chief Operating Officer and a member of the Board of The Depository Trust Company (DTC), President and a member of the Board of the National Securities Clearing Corporation (NSCC), Chief Executive Officer and a member of the Board of the Government Securities Clearing Corporation and Chief Executive Officer and a member of the Board of the Mortgage-Backed Securities Clearing Corporation. Mr. Dirks currently serves as a member of the Finance Committee (2016-present) and Board (2017-present) and is Treasurer (2018-present) of the Asolo Repertory Theatre.
Donald F. Donahue (1950)
Year of Election or Appointment: 2018
Trustee
Mr. Donahue also serves as Trustee of other Fidelity® funds. Mr. Donahue serves as President and Chief Executive Officer of Miranda Partners, LLC (risk consulting for the financial services industry, 2012-present). Previously, Mr. Donahue served as Chief Executive Officer (2006-2012), Chief Operating Officer (2003-2006) and Managing Director, Customer Marketing and Development (1999-2003) of The Depository Trust & Clearing Corporation (financial markets infrastructure). Mr. Donahue currently serves as a member (2007-present) and Co-Chairman (2016-present) of the Board of United Way of New York, a member of the Board of NYC Leadership Academy (2012-present) and a member of the Board of Advisors of Ripple Labs, Inc. (financial services, 2015-present). Mr. Donahue previously served as a member of the Advisory Board of certain Fidelity® funds (2015-2018).
Vicki L. Fuller (1957)
Year of Election or Appointment: 2020
Trustee
Ms. Fuller also serves as Trustee of other Fidelity® funds. Previously, Ms. Fuller served as a member of the Advisory Board of certain Fidelity® funds (2018-2020), Chief Investment Officer of the New York State Common Retirement Fund (2012-2018) and held a variety of positions at AllianceBernstein L.P. (global asset management, 1985-2012), including Managing Director (2006-2012) and Senior Vice President and Senior Portfolio Manager (2001-2006). Ms. Fuller currently serves as a member of the Board, Audit Committee and Nominating and Governance Committee of The Williams Companies, Inc. (natural gas infrastructure, 2018-present), as a member of the Board, Audit Committee and Nominating and Governance Committee of two Blackstone business development companies (2020-present) and as a member of the Board of Treliant, LLC (consulting, 2019-present).
Patricia L. Kampling (1959)
Year of Election or Appointment: 2020
Trustee
Ms. Kampling also serves as Trustee of other Fidelity® funds. Prior to her retirement, Ms. Kampling served as Chairman of the Board and Chief Executive Officer (2012-2019), President and Chief Operating Officer (2011-2012) and Executive Vice President and Chief Financial Officer (2010-2011) of Alliant Energy Corporation. Ms. Kampling currently serves as a member of the Board, Compensation Committee and Executive Committee and as Chair of the Audit Committee of Briggs & Stratton Corporation (manufacturing, 2011-present) and as a member of the Board, Audit, Finance and Risk Committee and Safety, Environmental, Technology and Operations Committee of American Water Works Company, Inc. (utilities company, 2019-present). In addition, Ms. Kampling currently serves as a member of the Board of the Nature Conservancy, Wisconsin Chapter (2019-present). Previously, Ms. Kampling served as a Member of the Advisory Board of certain Fidelity® funds (2020), a member of the Board of Interstate Power and Light Company (2012-2019) and Wisconsin Power and Light Company (2012-2019) (each a subsidiary of Alliant Energy Corporation) and as a member of the Board and Workforce Development Committee of the Business Roundtable (2018-2019).
Thomas A. Kennedy (1955)
Year of Election or Appointment: 2021
Trustee
Mr. Kennedy also serves as Trustee of other Fidelity® funds. Previously, Mr. Kennedy served as a Member of the Advisory Board of certain Fidelity® funds (2020) and held a variety of positions at Raytheon Company (aerospace and defense, 1983-2020), including Chairman and Chief Executive Officer (2014-2020) and Executive Vice President and Chief Operating Officer (2013-2014). Mr. Kennedy currently serves as Executive Chairman of the Board of Directors of Raytheon Technologies Corporation (aerospace and defense, 2020-present). He is also a member of the Rutgers School of Engineering Industry Advisory Board (2011-present) and a member of the UCLA Engineering Dean’s Executive Board (2016-present).
Garnett A. Smith (1947)
Year of Election or Appointment: 2013
Trustee
Mr. Smith also serves as Trustee of other Fidelity® funds. Prior to his retirement, Mr. Smith served as Chairman and Chief Executive Officer (1990-1997) and President (1986-1990) of Inbrand Corp. (manufacturer of personal absorbent products). Prior to his employment with Inbrand Corp., he was employed by a retail fabric chain and North Carolina National Bank (now Bank of America). Mr. Smith previously served as a member of the Advisory Board of certain Fidelity® funds (2012-2013).
David M. Thomas (1949)
Year of Election or Appointment: 2018
Trustee
Lead Independent Trustee
Mr. Thomas also serves as Trustee of other Fidelity® funds. Previously, Mr. Thomas served as Executive Chairman (2005-2006) and Chairman and Chief Executive Officer (2000-2005) of IMS Health, Inc. (pharmaceutical and healthcare information solutions). Mr. Thomas currently serves as Non-Executive Chairman of the Board of Fortune Brands Home and Security (home and security products, 2011-present), and a member of the Board (2004-present) and Presiding Director (2013-present) of Interpublic Group of Companies, Inc. (marketing communication).
Susan Tomasky (1953)
Year of Election or Appointment: 2020
Trustee
Ms. Tomasky also serves as Trustee of other Fidelity® funds. Prior to her retirement, Ms. Tomasky served in various executive officer positions at American Electric Power Company, Inc. (1998-2011), including most recently as President of AEP Transmission (2007-2011). Ms. Tomasky currently serves as a member of the Board and Sustainability Committee and as Chair of the Audit Committee of Marathon Petroleum Corporation (2018-present) and as a member of the Board, Corporate Governance Committee and Organization and Compensation Committee and as Chair of the Audit Committee of Public Service Enterprise Group, Inc. (utilities company, 2012-present). In addition, Ms. Tomasky currently serves as a member of the Board of the Columbus Regional Airport Authority (2007-present), as a member of the Board of the Royal Shakespeare Company – America (2009-present), as a member of the Board of the Columbus Association for the Performing Arts (2011-present) and as a member of the Board of Kenyon College (2016-present). Previously, Ms. Tomasky served as a Member of the Advisory Board of certain Fidelity® funds (2020), a member of the Board (2011-2019) and as Lead Independent Director (2015-2018) of Andeavor Corporation (previously Tesoro Corporation) (independent oil refiner and marketer) and as a member of the Board of Summit Midstream Partners LP (energy, 2012-2018).
Michael E. Wiley (1950)
Year of Election or Appointment: 2008
Trustee
Mr. Wiley also serves as Trustee of other Fidelity® funds. Previously, Mr. Wiley served as a member of the Advisory Board of certain Fidelity® funds (2018-2020), Chairman, President and CEO of Baker Hughes, Inc. (oilfield services, 2000-2004). Mr. Wiley also previously served as a member of the Board of Andeavor Corporation (independent oil refiner and marketer, 2005-2018), a member of the Board of Andeavor Logistics LP (natural resources logistics, 2015-2018) and a member of the Board of High Point Resources (exploration and production, 2005-2020).
+ The information includes the Trustee's principal occupation during the last five years and other information relating to the experience, attributes, and skills relevant to the Trustee's qualifications to serve as a Trustee, which led to the conclusion that the Trustee should serve as a Trustee for the fund.
Advisory Board Members and Officers:
Correspondence intended for a Member of the Advisory Board (if any) may be sent to Fidelity Investments, P.O. Box 55235, Boston, Massachusetts 02205-5235. Correspondence intended for an officer or Peter S. Lynch may be sent to Fidelity Investments, 245 Summer Street, Boston, Massachusetts 02210. Officers appear below in alphabetical order.
Name, Year of Birth; Principal Occupation
Ned C. Lautenbach (1944)
Year of Election or Appointment: 2021
Member of the Advisory Board
Mr. Lautenbach also serves as a Member of the Advisory Board of other Fidelity® funds. Mr. Lautenbach currently serves as Chair of the Board of Governors, State University System of Florida (2013-present) and is a member of the Council on Foreign Relations (1994-present). He is also a member and has in the past served as Chairman of the Board of Directors of Artis-Naples (2012-present). Previously, Mr. Lautenbach served as a Trustee of certain Fidelity® funds (2000-2020) and a member and then Lead Director of the Board of Directors of Eaton Corporation (diversified industrial, 1997-2016). He was also a Partner at Clayton, Dubilier & Rice, LLC (private equity investment, 1998-2010); as well as Director of Sony Corporation (2006-2007). In addition, Mr. Lautenbach had a 30-year career with IBM (technology company), during which time he served as Senior Vice President and as a member of the Corporate Executive Committee (1968-1998).
Peter S. Lynch (1944)
Year of Election or Appointment: 2018
Member of the Advisory Board
Mr. Lynch also serves as a Member of the Advisory Board of other Fidelity® funds. Mr. Lynch is Vice Chairman and a Director of Fidelity Management & Research Company LLC (investment adviser firm). In addition, Mr. Lynch serves as a Trustee of Boston College and as the Chairman of the Inner-City Scholarship Fund. Previously, Mr. Lynch served as Vice Chairman and a Director of FMR Co., Inc. (investment adviser firm) and on the Special Olympics International Board of Directors (1997-2006).
Craig S. Brown (1977)
Year of Election or Appointment: 2019
Assistant Treasurer
Mr. Brown also serves as Assistant Treasurer of other funds. Mr. Brown is an employee of Fidelity Investments (2013-present).
John J. Burke III (1964)
Year of Election or Appointment: 2018
Chief Financial Officer
Mr. Burke also serves as Chief Financial Officer of other funds. Mr. Burke serves as Head of Investment Operations for Fidelity Fund and Investment Operations (2018-present) and is an employee of Fidelity Investments (1998-present). Previously Mr. Burke served as head of Asset Management Investment Operations (2012-2018).
William C. Coffey (1969)
Year of Election or Appointment: 2019
Assistant Secretary
Mr. Coffey also serves as Assistant Secretary of other funds. He is Senior Vice President and Deputy General Counsel of FMR LLC (diversified financial services company, 2010-present), and is an employee of Fidelity Investments. Previously, Mr. Coffey served as Secretary and CLO of certain funds (2018-2019); CLO, Secretary, and Senior Vice President of Fidelity Management & Research Company and FMR Co., Inc. (investment adviser firms, 2018-2019); Secretary of Fidelity SelectCo, LLC and Fidelity Investments Money Management, Inc. (investment adviser firms, 2018-2019); CLO of Fidelity Management & Research (Hong Kong) Limited, FMR Investment Management (UK) Limited, and Fidelity Management & Research (Japan) Limited (investment adviser firms, 2018-2019); and Assistant Secretary of certain funds (2009-2018).
Timothy M. Cohen (1969)
Year of Election or Appointment: 2018
Vice President
Mr. Cohen also serves as Vice President of other funds. Mr. Cohen serves as Co-Head of Equity (2018-present), a Director of Fidelity Management & Research (Japan) Limited (investment adviser firm, 2016-present), and is an employee of Fidelity Investments. Previously, Mr. Cohen served as Executive Vice President of Fidelity SelectCo, LLC (2019), Head of Global Equity Research (2016-2018), Chief Investment Officer - Equity and a Director of Fidelity Management & Research (U.K.) Inc. (investment adviser firm, 2013-2015) and as a Director of Fidelity Management & Research (Hong Kong) Limited (investment adviser firm, 2017).
Jonathan Davis (1968)
Year of Election or Appointment: 2010
Assistant Treasurer
Mr. Davis also serves as Assistant Treasurer of other funds. Mr. Davis serves as Assistant Treasurer of FMR Capital, Inc. (2017-present) and is an employee of Fidelity Investments. Previously, Mr. Davis served as Vice President and Associate General Counsel of FMR LLC (diversified financial services company, 2003-2010).
Laura M. Del Prato (1964)
Year of Election or Appointment: 2018
Assistant Treasurer
Ms. Del Prato also serves as an officer of other funds. Ms. Del Prato is an employee of Fidelity Investments (2017-present). Previously, Ms. Del Prato served as President and Treasurer of The North Carolina Capital Management Trust: Cash Portfolio and Term Portfolio (2018-2020). Prior to joining Fidelity Investments, Ms. Del Prato served as a Managing Director and Treasurer of the JPMorgan Mutual Funds (2014-2017). Prior to JPMorgan, Ms. Del Prato served as a partner at Cohen Fund Audit Services (accounting firm, 2012-2013) and KPMG LLP (accounting firm, 2004-2012).
Colm A. Hogan (1973)
Year of Election or Appointment: 2020
Assistant Treasurer
Mr. Hogan also serves as an officer of other funds. Mr. Hogan serves as Assistant Treasurer of FMR Capital, Inc. (2017-present) and is an employee of Fidelity Investments (2005-present). Previously, Mr. Hogan served as Deputy Treasurer of certain Fidelity® funds (2016-2020) and Assistant Treasurer of certain Fidelity® funds (2016-2018).
Pamela R. Holding (1964)
Year of Election or Appointment: 2018
Vice President
Ms. Holding also serves as Vice President of other funds. Ms. Holding serves as Co-Head of Equity (2018-present) and is an employee of Fidelity Investments (2013-present). Previously, Ms. Holding served as Executive Vice President of Fidelity SelectCo, LLC (2019) and as Chief Investment Officer of Fidelity Institutional Asset Management (2013-2018).
Cynthia Lo Bessette (1969)
Year of Election or Appointment: 2019
Secretary and Chief Legal Officer (CLO)
Ms. Lo Bessette also serves as an officer of other funds. Ms. Lo Bessette serves as CLO, Secretary, and Senior Vice President of Fidelity Management & Research Company LLC (investment adviser firm, 2019-present); and CLO of Fidelity Management & Research (Hong Kong) Limited, FMR Investment Management (UK) Limited, and Fidelity Management & Research (Japan) Limited (investment adviser firms, 2019-present). She is a Senior Vice President and Deputy General Counsel of FMR LLC (diversified financial services company, 2019-present), and is an employee of Fidelity Investments. Previously, Ms. Lo Bessette served as CLO, Secretary, and Senior Vice President of FMR Co., Inc. (investment adviser firm, 2019); Secretary of Fidelity SelectCo, LLC and Fidelity Investments Money Management, Inc. (investment adviser firms, 2019). Prior to joining Fidelity Investments, Ms. Lo Bessette was Executive Vice President, General Counsel (2016-2019) and Senior Vice President, Deputy General Counsel (2015-2016) of OppenheimerFunds (investment management company) and Deputy Chief Legal Officer (2013-2015) of Jennison Associates LLC (investment adviser firm).
Chris Maher (1972)
Year of Election or Appointment: 2020
Deputy Treasurer
Mr. Maher also serves as an officer of other funds. Mr. Maher serves as Assistant Treasurer of FMR Capital, Inc. (2017-present), and is an employee of Fidelity Investments (2008-present). Previously, Mr. Maher served as Assistant Treasurer of certain funds (2013-2020); Vice President of Asset Management Compliance (2013), Vice President of the Program Management Group of FMR (investment adviser firm, 2010-2013), and Vice President of Valuation Oversight (2008-2010).
Jason P. Pogorelec (1975)
Year of Election or Appointment: 2020
Chief Compliance Officer
Mr. Pogorelec also serves as Chief Compliance Officer of other funds. Mr. Pogorelec is a senior Vice President of Asset Management Compliance for Fidelity Investments and is an employee of Fidelity Investments (2006-present). Previously, Mr. Pogorelec served as Vice President, Associate General Counsel for Fidelity Investments (2010-2020) and Assistant Secretary of certain Fidelity funds (2015-2020).
Brett Segaloff (1972)
Year of Election or Appointment: 2021
Anti-Money Laundering (AML) Officer
Mr. Segaloff also serves as an AML Officer of other funds and other related entities. He is Director, Anti-Money Laundering (2007-present) of FMR LLC (diversified financial services company) and is an employee of Fidelity Investments (1996-present).
Stacie M. Smith (1974)
Year of Election or Appointment: 2018
President and Treasurer
Ms. Smith also serves as an officer of other funds. Ms. Smith serves as Assistant Treasurer of FMR Capital, Inc. (2017-present), is an employee of Fidelity Investments (2009-present), and has served in other fund officer roles. Prior to joining Fidelity Investments, Ms. Smith served as Senior Audit Manager of Ernst & Young LLP (accounting firm, 1996-2009). Previously, Ms. Smith served as Assistant Treasurer (2013-2019) and Deputy Treasurer (2013-2016) of certain Fidelity® funds.
Marc L. Spector (1972)
Year of Election or Appointment: 2017
Assistant Treasurer
Mr. Spector also serves as an officer of other funds. Mr. Spector serves as Assistant Treasurer of FMR Capital, Inc. (2017-present) and is an employee of Fidelity Investments (2016-present). Prior to joining Fidelity Investments, Mr. Spector served as Director at the Siegfried Group (accounting firm, 2013-2016), and prior to Siegfried Group as audit senior manager at Deloitte & Touche LLP (accounting firm, 2005-2013).
Jim Wegmann (1979)
Year of Election or Appointment: 2019
Assistant Treasurer
Mr. Wegmann also serves as Assistant Treasurer of other funds. Mr. Wegmann is an employee of Fidelity Investments (2011-present).
Shareholder Expense Example
As a shareholder, you incur two types of costs: (1) transaction costs, which may include sales charges (loads) on purchase payments or redemption proceeds, as applicable and (2) ongoing costs, which generally include management fees, distribution and/or service (12b-1) fees and other Fund expenses. This Example is intended to help you understand your ongoing costs (in dollars) of investing in a fund and to compare these costs with the ongoing costs of investing in other mutual funds.
The Example is based on an investment of $1,000 invested at the beginning of the period and held for the entire period (September 1, 2020 to February 28, 2021).
Actual Expenses
The first line of the accompanying table provides information about actual account values and actual expenses. You may use the information in this line, together with the amount you invested, to estimate the expenses that you paid over the period. Simply divide your account value by $1,000.00 (for example, an $8,600 account value divided by $1,000.00 = 8.6), then multiply the result by the number in the first line for a class/Fund under the heading entitled "Expenses Paid During Period" to estimate the expenses you paid on your account during this period. If any fund is a shareholder of any underlying mutual funds or exchange-traded funds (ETFs) (the Underlying Funds), such fund indirectly bears its proportional share of the expenses of the Underlying Funds in addition to the direct expenses incurred presented in the table. These fees and expenses are not included in the annualized expense ratio used to calculate the expense estimate in the table below.
Hypothetical Example for Comparison Purposes
The second line of the accompanying table provides information about hypothetical account values and hypothetical expenses based on the actual expense ratio and an assumed rate of return of 5% per year before expenses, which is not the actual return. The hypothetical account values and expenses may not be used to estimate the actual ending account balance or expenses you paid for the period. You may use this information to compare the ongoing costs of investing in the Fund and other funds. To do so, compare this 5% hypothetical example with the 5% hypothetical examples that appear in the shareholder reports of the other funds. If any fund is a shareholder of any Underlying Funds, such fund indirectly bears its proportional share of the expenses of the Underlying Funds in addition to the direct expenses as presented in the table. These fees and expenses are not included in the annualized expense ratio used to calculate the expense estimate in the table below.
Please note that the expenses shown in the table are meant to highlight your ongoing costs only and do not reflect any transaction costs. Therefore, the second line of the table is useful in comparing ongoing costs only, and will not help you determine the relative total costs of owning different funds. In addition, if these transactional costs were included, your costs would have been higher.
| | Annualized Expense Ratio-A | Beginning
Account Value
September 1, 2020 | Ending
Account Value
February 28, 2021 | Expenses Paid
During Period-B
September 1, 2020
to February 28, 2021 |
| Utilities Portfolio | .75% | | | |
| Actual | | $1,000.00 | $1,065.80 | $3.84 |
| Hypothetical-C | | $1,000.00 | $1,021.08 | $3.76 |
A Annualized expense ratio reflects expenses net of applicable fee waivers.
B Expenses are equal to the annualized expense ratio, multiplied by the average account value over the period, multiplied by 181/ 365 (to reflect the one-half year period). The fees and expenses of any Underlying Funds are not included in each annualized expense ratio.
C 5% return per year before expenses
Distributions (Unaudited)
The fund designates 100% of the dividends distributed during the fiscal year as qualifying for the dividends–received deduction for corporate shareholders.
The fund designates 100% of the dividends distributed during the fiscal year as amounts which may be taken into account as a dividend for the purposes of the maximum rate under section 1(h)(11) of the Internal Revenue Code.
The fund will notify shareholders in January 2022 of amounts for use in preparing 2021 income tax returns.
Board Approval of Investment Advisory Contracts
Utilities Portfolio
At its January 2021 meeting, the Board of Trustees, including the Independent Trustees (together, the Board), voted to continue the management contract with Fidelity Management & Research Company LLC (FMR), and the sub-advisory agreements and sub-subadvisory agreements, in each case, where applicable (together, the Advisory Contracts) for the fund for four months from February 1, 2021 through May 31, 2021, in connection with changes to the Board's meeting calendar.
The Board considered that the approval of the fund's Advisory Contracts will not result in any changes in (i) the investment process or strategies employed in the management of the fund's assets; (ii) the fees and expenses paid by shareholders; (iii) the nature, extent or quality of services provided under the fund's Advisory Contracts; or (iv) the day-to-day management of the fund or the persons primarily responsible for such management. The Board also considered that since its last approval of the fund's Advisory Contracts, FMR had provided additional information on the fund in support of the annual contract renewal process, including competitive analyses on total expenses and management fees and in-depth reviews of fund performance and fund profitability information. The Board also considered the findings of certain ad hoc committees that had been previously formed to discuss matters relevant to all of the Fidelity funds, including economies of scale, fall-out benefits and retail vs. institutional funds. The Board concluded that the fund's Advisory Contracts are fair and reasonable, and that the fund's Advisory Contracts should be renewed, without modification, through May 31, 2021, with the understanding that the Board will consider the annual renewal for a full one year period in May 2021.
In connection with its consideration of future renewals of the fund's Advisory Contracts, the Board will consider: (i) the nature, extent and quality of services provided to the funds, including shareholder and administrative services and investment performance; (ii) the competitiveness of the management fee and total expenses for the fund; (iii) the costs of the services and profitability, including the revenues earned and the expenses incurred in conducting the business of developing, marketing, distributing, managing, administering, and servicing the fund and its shareholders, to the extent applicable; and (iv) whether there have been economies of scale in respect of the Fidelity funds, whether the Fidelity funds (including the fund) have appropriately benefited from any such economies of scale, and whether there is the potential for realization of any further economies.
Based on its evaluation of all of the conclusions noted above, and after considering all factors it believed relevant, the Board ultimately concluded that the fund's management fee structure is fair and reasonable, and that the continuation of the fund's Advisory Contracts should be approved for four months from February 1, 2021 through May 31, 2021.
Liquidity Risk Management Program
The Securities and Exchange Commission adopted Rule 22e-4 under the Investment Company Act of 1940 (the Liquidity Rule) to promote effective liquidity risk management throughout the open-end investment company industry, thereby reducing the risk that funds will be unable to meet their redemption obligations and mitigating dilution of the interests of fund shareholders.
The Fund has adopted and implemented a liquidity risk management program pursuant to the Liquidity Rule (the Program) effective December 1, 2018. The Program is reasonably designed to assess and manage the Fund’s liquidity risk and to comply with the requirements of the Liquidity Rule. The Fund’s Board of Trustees (the Board) has designated the Fund’s investment adviser as administrator of the Program. The Fidelity advisers have established a Liquidity Risk Management Committee (the LRM Committee) to manage the Program for each of the Fidelity Funds. The LRM Committee monitors the adequacy and effectiveness of implementation of the Program and on a periodic basis assesses each Fund’s liquidity risk based on a variety of factors including (1) the Fund’s investment strategy, (2) portfolio liquidity and cash flow projections during normal and reasonably foreseeable stressed conditions, (3) shareholder redemptions, (4) borrowings and other funding sources and (5) in the case of exchange-traded funds, certain additional factors including the effect of the Fund’s prices and spreads, market participants, and basket compositions on the overall liquidity of the Fund’s portfolio, as applicable.
In accordance with the Program, each of the Fund’s portfolio investments is classified into one of four liquidity categories described below based on a determination of a reasonable expectation for how long it would take to convert the investment to cash (or sell or dispose of the investment) without significantly changing its market value.
- Highly liquid investments – cash or convertible to cash within three business days or less
- Moderately liquid investments – convertible to cash in three to seven calendar days
- Less liquid investments – can be sold or disposed of, but not settled, within seven calendar days
- Illiquid investments – cannot be sold or disposed of within seven calendar days
Liquidity classification determinations take into account a variety of factors including various market, trading and investment-specific considerations, as well as market depth, and generally utilize analysis from a third-party liquidity metrics service.
The Liquidity Rule places a 15% limit on a fund’s illiquid investments and requires funds that do not primarily hold assets that are highly liquid investments to determine and maintain a minimum percentage of the fund’s net assets to be invested in highly liquid investments (highly liquid investment minimum or HLIM). The Program includes provisions reasonably designed to comply with the 15% limit on illiquid investments and for determining, periodically reviewing and complying with the HLIM requirement as applicable.
At a recent meeting of the Fund’s Board of Trustees, the LRM Committee provided a written report to the Board pertaining to the operation, adequacy, and effectiveness of implementation of the Program for the annual period from December 1, 2019 through November 30, 2020. The report concluded that the Program has been implemented and is operating effectively and is reasonably designed to assess and manage the Fund’s liquidity risk.
Proxy Voting Results
A special meeting of shareholders was held on June 9, 2020. The results of votes taken among shareholders on the proposal before them are reported below. Each vote reported represents one dollar of net asset value held on the record date for the meeting.
PROPOSAL 1
To elect a Board of Trustees.
| | # of
Votes | % of
Votes |
| Dennis J. Dirks |
| Affirmative | 32,463,705,305.665 | 92.437 |
| Withheld | 2,655,951,104.308 | 7.563 |
| TOTAL | 35,119,656,409.973 | 100.000 |
| Donald F. Donahue |
| Affirmative | 32,446,843,861.354 | 92.389 |
| Withheld | 2,672,812,548.619 | 7.611 |
| TOTAL | 35,119,656,409.973 | 100.000 |
| Bettina Doulton |
| Affirmative | 32,610,463,757.584 | 92.855 |
| Withheld | 2,509,192,652.389 | 7.145 |
| TOTAL | 35,119,656,409.973 | 100.000 |
| Vicki L. Fuller |
| Affirmative | 32,688,213,522.720 | 93.077 |
| Withheld | 2,431,442,887.253 | 6.923 |
| TOTAL | 35,119,656,409.973 | 100.000 |
| Patricia L. Kampling |
| Affirmative | 32,313,755,598.535 | 92.010 |
| Withheld | 2,805,900,811.438 | 7.990 |
| TOTAL | 35,119,656,409.973 | 100.000 |
| Alan J. Lacy |
| Affirmative | 31,990,158,754.948 | 91.089 |
| Withheld | 3,129,497,655.026 | 8.911 |
| TOTAL | 35,119,656,409.973 | 100.000 |
| Ned C. Lautenbach |
| Affirmative | 32,043,019,991.143 | 91.240 |
| Withheld | 3,076,636,418.830 | 8.760 |
| TOTAL | 35,119,656,409.973 | 100.000 |
| Robert A. Lawrence |
| Affirmative | 32,150,842,398.009 | 91.547 |
| Withheld | 2,968,814,011.965 | 8.453 |
| TOTAL | 35,119,656,409.973 | 100.000 |
| Joseph Mauriello |
| Affirmative | 32,082,201,213.166 | 91.351 |
| Withheld | 3,037,455,196.807 | 8.649 |
| TOTAL | 35,119,656,409.973 | 100.000 |
| Cornelia M. Small |
| Affirmative | 32,207,976,835.934 | 91.709 |
| Withheld | 2,911,679,574.039 | 8.291 |
| TOTAL | 35,119,656,409.973 | 100.000 |
| Garnett A. Smith |
| Affirmative | 32,102,654,343.096 | 91.409 |
| Withheld | 3,017,002,066.877 | 8.591 |
| TOTAL | 35,119,656,409.973 | 100.000 |
| David M. Thomas |
| Affirmative | 32,150,749,424.556 | 91.546 |
| Withheld | 2,968,906,985.418 | 8.454 |
| TOTAL | 35,119,656,409.973 | 100.000 |
| Susan Tomasky |
| Affirmative | 32,381,933,484.515 | 92.205 |
| Withheld | 2,737,722,925.459 | 7.795 |
| TOTAL | 35,119,656,409.973 | 100.000 |
| Michael E. Wiley |
| Affirmative | 32,135,064,741.973 | 91.502 |
| Withheld | 2,984,591,668.000 | 8.498 |
| TOTAL | 35,119,656,409.973 | 100.000 |
|
| Proposal 1 reflects trust wide proposal and voting results. |
SELUTL-ANN-0421
1.813626.116
Item 2.
Code of Ethics
As of the end of the period, February 28, 2021, Fidelity Select Portfolios (the trust) has adopted a code of ethics, as defined in Item 2 of Form N-CSR, that applies to its President and Treasurer and its Chief Financial Officer. A copy of the code of ethics is filed as an exhibit to this Form N-CSR.
Item 3.
Audit Committee Financial Expert
The Board of Trustees of the trust has determined that Donald F. Donahue is an audit committee financial expert, as defined in Item 3 of Form N-CSR. Mr. Donahue is independent for purposes of Item 3 of Form N-CSR.
Item 4.
Principal Accountant Fees and Services
Fees and Services
The following table presents fees billed by PricewaterhouseCoopers LLP (“PwC”) in each of the last two fiscal years for services rendered to Air Transportation Portfolio, Automotive Portfolio, Banking Portfolio, Biotechnology Portfolio, Brokerage and Investment Management Portfolio, Chemicals Portfolio, Communication Services Portfolio, Communications Equipment Portfolio, Computers Portfolio, Construction and Housing Portfolio, Consumer Discretionary Portfolio, Consumer Finance Portfolio, Consumer Staples Portfolio, Defense and Aerospace Portfolio, Energy Portfolio, Energy Service Portfolio, Environment and Alternative Energy Portfolio, Financial Services Portfolio, Gold Portfolio, Health Care Portfolio, Health Care Services Portfolio, Industrials Portfolio, Insurance Portfolio, IT Services Portfolio, Leisure Portfolio, Materials Portfolio, Medical Technology and Devices Portfolio, Natural Gas Portfolio, Natural Resources Portfolio, Pharmaceuticals Portfolio, Retailing Portfolio, Semiconductors Portfolio, Software and IT Services Portfolio, Technology Portfolio, Telecommunications Portfolio, Transportation Portfolio, Utilities Portfolio and Wireless Portfolio (the “Funds”):
Services Billed by PwC
February 28, 2021 FeesA
| | | | |
| Audit Fees | Audit-Related Fees | Tax Fees | All Other Fees |
Air Transportation Portfolio | $27,600 | $2,400 | $6,300 | $1,000 |
Automotive Portfolio | $27,300 | $2,400 | $7,200 | $1,000 |
Banking Portfolio | $27,400 | $2,400 | $6,300 | $1,000 |
Biotechnology Portfolio | $58,300 | $4,600 | $46,600 | $1,900 |
Brokerage and Investment Management Portfolio | $27,600 | $2,400 | $6,500 | $1,000 |
Chemicals Portfolio | $27,100 | $2,400 | $7,200 | $1,000 |
Communication Services Portfolio | $32,700 | $2,800 | $6,300 | $1,100 |
Communications Equipment Portfolio | $27,600 | $2,400 | $6,300 | $1,000 |
Computers Portfolio | $28,100 | $2,500 | $7,700 | $1,000 |
Construction and Housing Portfolio | $26,900 | $2,400 | $6,300 | $900 |
Consumer Discretionary Portfolio | $29,600 | $2,400 | $7,200 | $1,000 |
Consumer Finance Portfolio | $27,600 | $2,400 | $6,300 | $1,000 |
Consumer Staples Portfolio | $32,900 | $2,800 | $6,300 | $1,100 |
Defense and Aerospace Portfolio | $27,600 | $2,400 | $7,000 | $1,000 |
Energy Portfolio | $30,600 | $2,500 | $8,000 | $1,000 |
Energy Service Portfolio | $28,100 | $2,500 | $6,500 | $1,000 |
Environment and Alternative Energy Portfolio | $27,100 | $2,400 | $6,300 | $1,000 |
Financial Services Portfolio | $30,600 | $2,500 | $6,500 | $1,000 |
Gold Portfolio | $46,900 | $4,400 | $13,000 | $1,700 |
Health Care Portfolio | $41,400 | $3,200 | $7,200 | $1,300 |
Health Care Services Portfolio | $27,300 | $2,400 | $7,000 | $1,000 |
Industrials Portfolio | $29,600 | $2,400 | $6,300 | $1,000 |
Insurance Portfolio | $27,600 | $2,400 | $6,300 | $1,000 |
IT Services Portfolio | $27,800 | $2,400 | $6,300 | $1,000 |
Leisure Portfolio | $27,600 | $2,400 | $6,300 | $1,000 |
Materials Portfolio | $32,900 | $2,800 | $6,500 | $1,100 |
Medical Technology and Devices Portfolio | $27,300 | $2,400 | $7,200 | $1,000 |
Natural Gas Portfolio | $27,100 | $2,400 | $6,500 | $1,000 |
Natural Resources Portfolio | $26,600 | $2,400 | $6,500 | $900 |
Pharmaceuticals Portfolio | $27,100 | $2,400 | $6,300 | $1,000 |
Retailing Portfolio | $27,600 | $2,400 | $8,600 | $1,000 |
Semiconductors Portfolio | $27,800 | $2,400 | $7,000 | $1,000 |
Software and IT Services Portfolio | $26,900 | $2,400 | $7,200 | $900 |
Technology Portfolio | $33,800 | $2,700 | $7,200 | $1,100 |
Telecommunications Portfolio | $32,400 | $2,800 | $6,300 | $1,100 |
Transportation Portfolio | $27,300 | $2,400 | $7,000 | $1,000 |
Utilities Portfolio | $30,100 | $2,400 | $6,500 | $1,000 |
Wireless Portfolio | $26,600 | $2,400 | $6,300 | $900 |
| | | | |
| Audit Fees | Audit-Related Fees | Tax Fees | All Other Fees |
Air Transportation Portfolio | $28,200 | $2,700 | $6,400 | $1,200 |
Automotive Portfolio | $28,000 | $2,700 | $6,400 | $1,200 |
Banking Portfolio | $28,000 | $2,700 | $6,600 | $1,200 |
Biotechnology Portfolio | $59,100 | $5,200 | $20,600 | $2,200 |
Brokerage and Investment Management Portfolio | $28,200 | $2,700 | $6,600 | $1,200 |
Chemicals Portfolio | $29,100 | $2,700 | $6,600 | $1,100 |
Communication Services Portfolio | $33,400 | $3,100 | $6,400 | $1,300 |
Communications Equipment Portfolio | $28,200 | $2,700 | $6,400 | $1,200 |
Computers Portfolio | $28,700 | $2,800 | $6,400 | $1,200 |
Construction and Housing Portfolio | $27,500 | $2,700 | $6,400 | $1,100 |
Consumer Discretionary Portfolio | $32,700 | $2,700 | $6,600 | $1,100 |
Consumer Finance Portfolio | $28,200 | $2,700 | $7,400 | $1,200 |
Consumer Staples Portfolio | $36,000 | $3,200 | $6,400 | $1,300 |
Defense and Aerospace Portfolio | $28,200 | $2,700 | $6,400 | $1,200 |
Energy Portfolio | $33,700 | $2,800 | $7,600 | $1,200 |
Energy Service Portfolio | $29,400 | $2,800 | $6,800 | $1,200 |
Environment and Alternative Energy Portfolio | $27,700 | $2,700 | $6,400 | $1,100 |
Financial Services Portfolio | $33,700 | $2,800 | $6,400 | $1,200 |
Gold Portfolio | $48,300 | $4,900 | $14,100 | $2,100 |
Health Care Portfolio | $44,600 | $3,100 | $6,400 | $1,300 |
Health Care Services Portfolio | $28,000 | $2,700 | $6,400 | $1,200 |
Industrials Portfolio | $32,700 | $2,700 | $6,400 | $1,100 |
Insurance Portfolio | $28,200 | $2,700 | $6,600 | $1,200 |
IT Services Portfolio | $28,500 | $2,800 | $6,400 | $1,200 |
Leisure Portfolio | $28,200 | $2,700 | $6,600 | $1,200 |
Materials Portfolio | $36,000 | $3,200 | $7,500 | $1,300 |
Medical Technology and Devices Portfolio | $28,000 | $2,700 | $6,400 | $1,200 |
Natural Gas Portfolio | $27,800 | $2,700 | $6,600 | $1,100 |
Natural Resources Portfolio | $27,300 | $2,700 | $6,800 | $1,100 |
Pharmaceuticals Portfolio | $28,400 | $2,700 | $6,400 | $1,100 |
Retailing Portfolio | $28,200 | $2,700 | $6,600 | $1,200 |
Semiconductors Portfolio | $28,500 | $2,800 | $6,400 | $1,200 |
Software and IT Services Portfolio | $27,500 | $2,700 | $7,200 | $1,100 |
Technology Portfolio | $36,900 | $3,000 | $6,400 | $1,300 |
Telecommunications Portfolio | $36,300 | $3,100 | $6,400 | $1,300 |
Transportation Portfolio | $28,000 | $2,700 | $6,400 | $1,200 |
Utilities Portfolio | $33,200 | $2,700 | $7,200 | $1,200 |
Wireless Portfolio | $27,300 | $2,700 | $6,400 | $1,100 |
A Amounts may reflect rounding.
The following table(s) present(s) fees billed by PwC that were required to be approved by the Audit Committee for services that relate directly to the operations and financial reporting of the Fund(s) and that are rendered on behalf of Fidelity Management & Research Company LLC ("FMR") and entities controlling, controlled by, or under common control with FMR (not including any sub-adviser whose role is primarily portfolio management and is subcontracted with or overseen by another investment adviser) that provide ongoing services to the Fund(s) (“Fund Service Providers”):
Services Billed by PwC
| | |
| February 28, 2021A | February 29, 2020A |
Audit-Related Fees | $9,436,200 | $7,927,700 |
Tax Fees | $14,300 | $28,000 |
All Other Fees | $- | $- |
A Amounts may reflect rounding.
“Audit-Related Fees” represent fees billed for assurance and related services that are reasonably related to the performance of the fund audit or the review of the fund's financial statements and that are not reported under Audit Fees.
“Tax Fees” represent fees billed for tax compliance, tax advice or tax planning that relate directly to the operations and financial reporting of the fund.
“All Other Fees” represent fees billed for services provided to the fund or Fund Service Provider, a significant portion of which are assurance related, that relate directly to the operations and financial reporting of the fund, excluding those services that are reported under Audit Fees, Audit-Related Fees or Tax Fees.
Assurance services must be performed by an independent public accountant.
* * *
The aggregate non-audit fees billed by PwC for services rendered to the Fund(s), FMR (not including any sub-adviser whose role is primarily portfolio management and is subcontracted with or overseen by another investment adviser), and any Fund Service Provider for each of the last two fiscal years of the Fund(s) are as follows:
| | |
Billed By | February 28, 2021A | February 29, 2020A |
PwC | $14,966,200 | $13,023,300 |
A Amounts may reflect rounding.
The trust's Audit Committee has considered non-audit services that were not pre-approved that were provided by PwC to Fund Service Providers to be compatible with maintaining the independence of PwC in its(their) audit of the Fund(s), taking into account representations from PwC, in accordance with Public Company Accounting Oversight Board rules, regarding its independence from the Fund(s) and its(their) related entities and FMR’s review of the appropriateness and permissibility under applicable law of such non-audit services prior to their provision to the Fund(s) Service Providers.
Audit Committee Pre-Approval Policies and Procedures
The trust’s Audit Committee must pre-approve all audit and non-audit services provided by a fund’s independent registered public accounting firm relating to the operations or financial reporting of the fund. Prior to the commencement of any audit or non-audit services to a fund, the Audit Committee reviews the services to determine whether they are appropriate and permissible under applicable law.
The Audit Committee has adopted policies and procedures to, among other purposes, provide a framework for the Committee’s consideration of non-audit services by the audit firms that audit the Fidelity funds. The policies and procedures require that any non-audit service provided by a fund audit firm to a Fidelity fund and any non-audit service provided by a fund auditor to a Fund Service Provider that relates directly to the operations and financial reporting of a Fidelity fund (“Covered Service”) are subject to approval by the Audit Committee before such service is provided.
All Covered Services must be approved in advance of provision of the service either: (i) by formal resolution of the Audit Committee, or (ii) by oral or written approval of the service by the Chair of the Audit Committee (or if the Chair is unavailable, such other
member of the Audit Committee as may be designated by the Chair to act in the Chair’s absence). The approval contemplated by (ii) above is permitted where the Treasurer determines that action on such an engagement is necessary before the next meeting of the Audit Committee.
Non-audit services provided by a fund audit firm to a Fund Service Provider that do not relate directly to the operations and financial reporting of a Fidelity fund are reported to the Audit Committee periodically.
Non-Audit Services Approved Pursuant to Rule 2-01(c)(7)(i)(C) and (ii) of Regulation S-X (“De Minimis Exception”)
There were no non-audit services approved or required to be approved by the Audit Committee pursuant to the De Minimis Exception during the Fund’s(s’) last two fiscal years relating to services provided to (i) the Fund(s) or (ii) any Fund Service Provider that relate directly to the operations and financial reporting of the Fund(s).
Item 5.
Audit Committee of Listed Registrants
Not applicable.
Item 6.
Investments
(a)
Not applicable.
(b)
Not applicable.
Item 7.
Disclosure of Proxy Voting Policies and Procedures for Closed-End Management Investment Companies
Not applicable.
Item 8.
Portfolio Managers of Closed-End Management Investment Companies
Not applicable.
Item 9.
Purchase of Equity Securities by Closed-End Management Investment Company and Affiliated Purchasers
Not applicable.
Item 10.
Submission of Matters to a Vote of Security Holders
There were no material changes to the procedures by which shareholders may recommend nominees to the trust’s Board of Trustees.
Item 11.
Controls and Procedures
(a)(i) The President and Treasurer and the Chief Financial Officer have concluded that the trust’s disclosure controls and procedures (as defined in Rule 30a-3(c) under the Investment Company Act) provide reasonable assurances that material information relating to the trust is made known to them by the appropriate persons, based on their evaluation of these controls and procedures as of a date within 90 days of the filing date of this report.
(a)(ii) There was no change in the trust’s internal control over financial reporting (as defined in Rule 30a-3(d) under the Investment Company Act) that occurred during the period covered by this report that has materially affected, or is reasonably likely to materially affect, the trust’s internal control over financial reporting.
Item 12.
Disclosure of Securities Lending Activities for Closed-End Management
Investment Companies
Not applicable.
Item 13.
Exhibits
SIGNATURES
Pursuant to the requirements of the Securities Exchange Act of 1934 and the Investment Company Act of 1940, the registrant has duly caused this report to be signed on its behalf by the undersigned, thereunto duly authorized.
Fidelity Select Portfolios
| |
By: | /s/Stacie M. Smith |
| Stacie M. Smith |
| President and Treasurer |
|
|
Date: | April 21, 2021 |
Pursuant to the requirements of the Securities Exchange Act of 1934 and the Investment Company Act of 1940, this report has been signed below by the following persons on behalf of the registrant and in the capacities and on the dates indicated.
| |
By: | /s/Stacie M. Smith |
| Stacie M. Smith |
| President and Treasurer |
|
|
Date: | April 21, 2021 |
| |
By: | /s/John J. Burke III |
| John J. Burke III |
| Chief Financial Officer |
|
|
Date: | April 21, 2021 |