UNITED STATES
SECURITIES AND EXCHANGE COMMISSION
Washington, D.C. 20549
FORM N-CSR
CERTIFIED SHAREHOLDER REPORT OF REGISTERED
MANAGEMENT INVESTMENT COMPANIES
Investment Company Act file number: 811-00483
Elfun Trusts
(Exact name of registrant as specified in charter)
1600 Summer Street
Stamford, Connecticut 06905
(Address of principal executive offices)(Zip code)
GE Asset Management, Inc.
1600 Summer Street
Stamford, Connecticut 06905
(Name and Address of Agent for Service)
Registrant’s telephone number, including area code: 800-242-0134
Date of fiscal year end: 12/31
Date of reporting period: 12/31/14
| Item 1. | Reports to Stockholders |
Elfun Funds
Annual Report
December 31, 2014


This report has been prepared for shareholders and may be distributed to others only if preceded or accompanied by a current summary prospectus or prospectus.

Information on the following performance pages relates to the Elfun Funds.
Total returns take into account changes in share price and assume reinvestment of all dividends and capital gains distributions, if any. Total returns shown are net of Fund expenses.
The performance data quoted represents past performance; past performance does not guarantee future results. Investment return and principal value will fluctuate so your shares, when redeemed, may be worth more or less than their original cost. Current performance may be higher or lower than the performance data quoted. Periods less than one year are not annualized. Please call toll-free 800-242-0134 or visit the Funds’ website at http://www.geam.com for the most recent month-end performance data.
A portion of the Elfun Tax-Exempt Income Fund’s income may be subject to state, federal and/or alternative minimum tax. Capital gains, if any, are subject to capital gains tax.
An investment in a Fund is not a deposit of any bank and is not insured or guaranteed by the Federal Deposit Insurance Corporation (FDIC) or any other government agency. An investment in a Fund is subject to risk, including possible loss of principal invested.
The Standard & Poor’s (“S&P”) 500® Composite Price Index of stocks (S&P 500 Index), Morgan Stanley Capital International Europe, Australasia, Far East Index (MSCI EAFE® Index), MSCI® ACWI ex-U.S. Index, Barclays U.S. Aggregate Bond Index, the Barclays U.S. Municipal Bond Index, and the 90 Day U.S. T-Bill are unmanaged indices and do not reflect the actual cost of investing in the instruments that comprise each index. The results shown for the foregoing indices assume the reinvestment of net dividends or interest and do not reflect the fees, expenses or taxes.
S&P 500 Index is an unmanaged, market capitalization-weighted index of stocks of 500 large U.S. companies, which is widely used as a measure of large-cap U.S. stock market performance.
MSCI® EAFE® Index is a market capitalization-weighted index of equity securities of companies domiciled in various countries. The index is designed to represent the performance of developed stock markets outside the U.S. and Canada and excludes certain market segments unavailable to U.S. based investors.
MSCI ACWI Ex-U.S. Index is a market-capitalization weighted index designed to provide a broad measure of stock performance throughout the world, with the exception of U.S. based companies. The MSCI ACWI Ex-U.S. Index includes both developed and emerging markets.
Barclays U.S. Aggregate Bond Index is a market value-weighted index of taxable investment-grade debt issues, including government, corporate, asset-backed and mortgage-backed securities, with maturities of one year or more. This index is designed to represent the performance of the U.S. investment-grade first-rate bond market.
Barclays U.S. Municipal Bond Index is an unmanaged index comprised of investment-grade, fixed rate securities with maturities of at least eight years and less than twelve years.
The 90 Day U.S. T-Bill is an unmanaged measure/index of the performance of the most recently auctioned 90 Day U.S. Treasury bills (i.e. having a total maturity of 90 days) currently available in the marketplace.
The peer universe of underlying funds used for the peer group average annual total return calculation is based on the blend of Morningstar peer categories, as shown. Morningstar is an independent mutual fund rating service. A Fund’s performance may be compared to or ranked within a universe of mutual funds with investment objectives and policies similar but not necessarily identical to the Fund.
©2015 Morningstar, Inc. All Rights Reserved. The Morningstar information contained herein: (1) is proprietary to Morningstar and/or its content providers; (2) may not be copied or distributed; and (3) is not warranted to be accurate, complete or timely. Neither Morningstar nor its content providers are responsible for any damage or losses relating from any use of this information. Past performance is no guarantee of future results.
The views, expressed in this document reflect our judgment as of the publication date and are subject to change at any time without notice.
GE Investment Distributors, Inc., member of FINRA, is the principal underwriter and distributor of the Elfun Funds and a wholly owned subsidiary of GE Asset Management Incorporated, the investment adviser of the Funds.
1
(Unaudited)


Ralph R. Layman
Executive Vice President and
Chief Investment Officer Emeritus

Michael J. Solecki
Senior Vice President and Chief Investment Officer International Equities
The Elfun International Equity Fund is managed by a team of portfolio managers that includes Ralph R. Layman and Michael J. Solecki. As lead portfolio manager for the Fund, Mr. Layman oversees the entire team and assigns a portion of the Fund to Mr. Solecki and himself. Each portfolio manager is limited to the management of his portion of the Fund, the size of which Mr. Layman determines on an annual basis. The portfolio managers do not operate independently of each other, rather, the team operates collaboratively, communicating purchases or sales of securities on behalf of the Fund. See portfolio managers’ biographical information beginning on page 124.
| Q. | How did the Elfun International Equity Fund perform compared to its benchmark and Morningstar peer group for the twelve-month period ended December 31, 2014? |
| A. | For the twelve-month period ended December 31, 2014, the Elfun International Equity Fund returned -7.62%. The MSCI EAFE Index, the Fund’s benchmark, returned -4.90% and the Fund’s Morningstar peer group of 749 Foreign Large Blend Funds returned an average of -5.16% over the same period. |
| Q. | What factors affected the Fund’s performance? |
| A. | 2014 was a tale of two halves in the market and in the Fund. The first half was marked by a flat to down U.S. Dollar, value stocks outperforming growth, small cap stocks outperforming large cap, and a surprisingly weak U.S. GDP result in the first quarter. Overall, the international |
| | equity market (MSCI EAFE) was up nearly 5% in the first half of the year. |
| | These trends began to shift in June, starting with the introduction of a negative deposit rate in Europe by the European Central Bank. This was followed by renewed rhetoric from the administration of Japanese Prime Minister Shinzo Abe and the Bank of Japan on their commitment to “Abenomics”, their two year old effort to revive the Japanese economy. U.S. economic growth also rebounded strongly. The result in the second half of the year was a falling Yen and Euro versus the U.S. Dollar. Japanese and European exporters began to outperform. Growth overtook value. Large cap outperformed small. The market was up 2.7% in the second half of the year excluding the impact of currency, but with the falling value of foreign currencies against the U.S. Dollar, the market was down -9.2% in U.S. Dollar terms. The second half shift was also registered in the Fund, which after underperforming the market significantly in the first half of the year, outperformed in the second. |
| Q. | What were the primary drivers of Fund performance? |
| A. | In the first half of the year, peripheral smaller cap names in Europe outperformed on Euro weakness, and Japanese stocks fell on dissipating enthusiasm with the pace of reform in Japan. The Fund, which was overweight |
2
(Unaudited)

| | in Japan and large high-quality European exporters, suffered as a result. This turned around abruptly in the second half of the year as the Euro and Yen began to weaken against the U.S. Dollar, a benefit to many of the Fund’s holdings. The Fund outperformed significantly in the second half, but overall it was not enough to overcome the deficit of the first half and the Fund closed the year down against the MSCI EAFE index. |
| Q. | Were there any significant changes to the Fund during the period? |
| A. | The Fund’s overweights in Japan and the Emerging Markets were modestly increased and holdings in the U.K. reduced. The Fund saw its weight in consumer staples continue to fall due to high valuations and the weight in industrials and IT increase, notably in the area associated with autonomous driving. In energy, exposure was switched out of oil service and into integrated and gas plays. High quality but under-performing holdings in Japan were increased including real estate, exporters and component manufacturers. |
3
(Unaudited)
Understanding Your Fund’s Expenses
As a shareholder of the Fund you incur ongoing costs. Ongoing costs include portfolio management fees, professional fees, administrative fees and other Fund expenses. The following example is intended to help you understand your ongoing costs (in dollars) of investing in the Fund and to compare these costs with the ongoing costs of investing in other mutual funds.
To illustrate these ongoing costs, we have provided an example and calculated the expenses paid by investors in units of the Fund during the period. The information in the following table is based on an investment of $1,000, which is invested at the beginning of the period and held for the entire six-month period ended December 31, 2014.
Actual Expenses
The first section of the table provides information about actual account values and actual expenses. You may use the information in this section, together with the amount you invested, to estimate the expenses that you paid over the period. To do so, simply divide your account value by $1,000 (for example, an $8,600 account value divided by $1,000 = 8.6), then multiply the result by the number given under the heading “Expenses paid during the
period” to estimate the expenses you paid on your account during the period.
Hypothetical Example for Comparison Purposes
The second section of the table provides information about hypothetical account values and hypothetical expenses based on the Fund’s actual expense ratio and an assumed rate of return of 5% per year before expenses, which is not the Fund’s actual return. The hypothetical account values and expenses may not be used to estimate the actual ending account balance or expenses you paid for the period. You may use this information to compare the ongoing costs of investing in the Fund and other funds. To do so, compare this 5% hypothetical example with the 5% hypothetical examples that appear in the shareholders reports of other funds.
Please note that the expenses shown in the table are meant to highlight and help you compare ongoing costs only and do not reflect transaction costs, such as sales charges or redemption fees, if any. Therefore, the second section of the table is useful in comparing ongoing costs only, and will not help you determine the relative total costs of owning different funds.
July 1, 2014 – December 31, 2014
| | | | | | | | | | | | |
| | | Account value at
the beginning of
the period ($) | | | Account value
at the end of
the period ($) | | | Expenses
paid during
the period ($)* | |
| | | |
Actual Fund Return | | | 1,000.00 | | | | 927.20 | | | | 1.85 | |
| | | |
Hypothetical 5% Return
(2.5% for the period) | | | 1,000.00 | | | | 1,023.29 | | | | 1.94 | |
| * | | Expenses are equal to the Fund’s annualized net expense ratio of 0.38%** (for the period July 1, 2014 – December 31, 2014), multiplied by the average account value over the period, multiplied by 184/365 (to reflect the one-half year period). |
| ** | | May differ from expense ratio disclosed in the financial highlights, which is calculated based on the entire fiscal year’s data. |
4
(Unaudited)
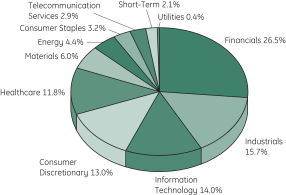
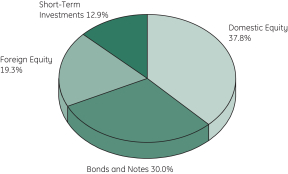
A mutual fund designed for investors who seek long-term growth of capital and future income by investing principally in foreign securities consistent with prudent investment management and the preservation of capital. The Fund seeks to achieve its investment objectives by investing at least 80% of its net assets under normal circumstances in equity securities, such as common and preferred stocks and invests primarily (meaning at least 65%) in companies in both developed and emerging market countries outside the United States.
as of December 31, 2014 (as a % of Investments)(b)(c)
| | | | |
Roche Holding AG | | | 2.51% | |
Toyota Motor Corp. | | | 2.43% | |
Nidec Corp. | | | 2.40% | |
AIA Group Ltd. | | | 2.34% | |
Mitsui Fudosan Company Ltd. | | | 2.23% | |
Sanofi | | | 2.11% | |
Barclays PLC | | | 2.09% | |
Tokio Marine Holdings Inc. | | | 2.07% | |
Telefonaktiebolaget LM Ericsson, Class B | | | 2.02% | |
Total S.A. | | | 1.97% | |
as a % of Investments of $254,256 (in thousands) on December 31, 2014(b)(c)
|
| Morningstar Performance Comparison |
Based on average annual returns for periods ended December 31, 2014
| | | | | | | | | | | | |
| | | One
Year | | | Five
Year | | | Ten
Year | |
Number of funds in peer group | | | 749 | | | | 585 | | | | 316 | |
Peer group average annual total return | | | -5.16 | % | | | 4.91 | % | | | 4.16 | % |
Morningstar Category in peer group: U.S. Foreign Large Blend | |
|
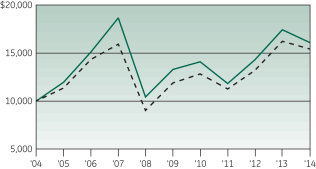
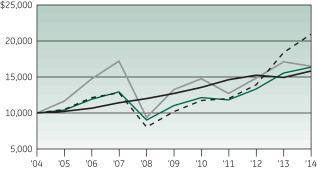
| Change in Value of a $10,000 Investment(a) |

|
| Average Annual Total Return |
for the periods ended December 31, 2014
| | | | | | | | | | | | | | | | |
| (Inception date: 01/01/88) | | | | | | | | | | |
| | | One
Year | | | Five
Year | | | Ten
Year | | | Ending Value of a
$10,000
Investment (a) | |
| | | | |
Elfun International
Equity Fund | | | -7.62% | | | | 3.87% | | | | 4.88% | | | | $16,097 | |
| | | | |
MSCI EAFE Index | | | -4.90% | | | | 5.34% | | | | 4.43% | | | | $15,429 | |
| (a) | Ending value of a $10,000 investment for the ten-year period or since inception, whichever is less. |
| (b) | Fair Value basis is inclusive of short-term investment in State Street Institutional U.S. Government Money Market Fund Premier Class. |
| (c) | The securities information regarding holdings, allocations and other characteristics is presented to illustrate examples of securities that the Fund has bought and the diversity of areas in which the Fund may invest as of a particular date. It may not be representative of the Fund’s current or future investments and should not be construed as a recommendation to purchase or sell a particular security. |
See Notes to Performance beginning on page 1 for further information, including an explanation of Morningstar peer categories.
Past performance does not predict future performance. The performance shown in the graphs and tables does not reflect the deduction of taxes that a shareholder would pay on Fund distributions or the redemption of Fund shares.
5
| | |
| Elfun International Equity Fund | | December 31, 2014 |

| | | | | | | | | | |
| | | Number
of Shares | | | Fair
Value | | | |
| | | | | | | | | | |
Common Stock — 96.2%† |
| |
| Australia — 2.0% | | | |
| | | |
CSL Ltd. | | | 31,396 | | | $ | 2,210,702 | | | |
Insurance Australia Group Ltd. | | | 584,873 | | | | 2,976,793 | | | |
| | | | | | | 5,187,495 | | | |
|
| Belgium — 1.8% |
| | | |
Anheuser-Busch InBev N.V. | | | 41,326 | | | | 4,650,883 | | | |
|
| Canada — 2.7% |
| | | |
Brookfield Asset Management Inc., Class A | | | 37,407 | | | | 1,880,281 | | | |
Cenovus Energy Inc. | | | 97,813 | | | | 2,024,241 | | | |
Peyto Exploration & Development Corp. | | | 38,792 | | | | 1,120,974 | | | |
Valeant Pharmaceuticals International Inc. | | | 12,287 | | | | 1,764,470 | | | (a) |
| | | | | | | 6,789,966 | | | |
|
| China — 1.5% |
| | | |
Baidu Inc. ADR | | | 16,822 | | | | 3,834,911 | | | (a) |
|
| France — 13.3% |
| | | |
Airbus Group N.V. | | | 59,412 | | | | 2,937,211 | | | |
AXA S.A. | | | 144,804 | | | | 3,336,724 | | | |
BNP Paribas S.A. | | | 69,362 | | | | 4,094,721 | | | |
Credit Agricole S.A. | | | 254,359 | | | | 3,283,398 | | | |
Safran S.A. | | | 57,934 | | | | 3,574,235 | | | |
Sanofi | | | 58,887 | | | | 5,368,754 | | | |
Schneider Electric SE | | | 36,932 | | | | 2,689,729 | | | |
Technip S.A. | | | 51,379 | | | | 3,060,520 | | | |
Total S.A. | | | 97,576 | | | | 4,999,013 | | | |
Zodiac Aerospace | | | 12,328 | | | | 415,056 | | | |
| | | | | | | 33,759,361 | | | |
|
| Germany — 9.9% |
| | | |
Bayer AG | | | 32,944 | | | | 4,490,543 | | | |
Continental AG | | | 22,796 | | | | 4,808,193 | | | |
Fresenius SE & Company KGaA | | | 71,497 | | | | 3,717,418 | | | |
HeidelbergCement AG | | | 49,633 | | | | 3,503,091 | | | |
Linde AG | | | 24,129 | | | | 4,444,618 | | | |
SAP SE | | | 60,774 | | | | 4,243,749 | | | |
| | | | | | | 25,207,612 | | | |
| | | | | | | | | | |
| | | Number
of Shares | | | Fair
Value | | | |
| | | | | | | | | | |
|
| Hong Kong — 2.6% |
| | | |
AIA Group Ltd. | | | 1,082,262 | | | $ | 5,948,274 | | | |
Sands China Ltd. | | | 143,907 | | | | 701,460 | | | |
| | | | | | | 6,649,734 | | | |
|
| India — 2.6% |
| | | |
ICICI Bank Ltd. | | | 666,535 | | | | 3,700,300 | | | |
Larsen & Toubro Ltd. | | | 76,479 | | | | 1,801,040 | | | |
Power Grid Corporation of India Ltd. | | | 484,780 | | | | 1,055,242 | | | |
| | | | | | | 6,556,582 | | | |
|
| Italy — 2.1% |
| | | |
Intesa Sanpaolo S.p.A. | | | 1,107,842 | | | | 3,213,739 | | | |
Luxottica Group S.p.A. | | | 37,270 | | | | 2,043,098 | | | |
| | | | | | | 5,256,837 | | | |
|
| Japan — 29.0% |
| | | |
Astellas Pharma Inc. | | | 123,100 | | | | 1,712,167 | | | |
East Japan Railway Co. | | | 35,300 | | | | 2,658,039 | | | |
FANUC Corp. | | | 27,800 | | | | 4,579,275 | | | |
Fast Retailing Company Ltd. | | | 5,766 | | | | 2,096,207 | | | |
Hitachi Ltd. | | | 433,000 | | | | 3,192,805 | | | |
Keyence Corp. | | | 5,300 | | | | 2,359,387 | | | |
Mazda Motor Corp. | | | 149,100 | | | | 3,577,287 | | | |
Mitsubishi Estate Company Ltd. | | | 198,459 | | | | 4,177,691 | | | |
Mitsubishi Heavy Industries Ltd. | | | 705,000 | | | | 3,886,871 | | | |
Mitsubishi UFJ Financial Group Inc. | | | 746,500 | | | | 4,097,505 | | | |
Mitsui Fudosan Company Ltd. | | | 211,618 | | | | 5,669,208 | | | |
Murata Manufacturing Company Ltd. | | | 45,097 | | | | 4,916,305 | | | |
Nidec Corp. | | | 94,700 | | | | 6,110,394 | | | |
Rakuten Inc. | | | 350,997 | | | | 4,876,216 | | | (a) |
SoftBank Corp. | | | 80,301 | | | | 4,775,192 | | | |
Sumitomo Mitsui Financial Group Inc. | | | 98,300 | | | | 3,550,402 | | | |
Tokio Marine Holdings Inc. | | | 161,900 | | | | 5,253,093 | | | |
Toyota Motor Corp. | | | 99,382 | | | | 6,187,282 | | | |
| | | | | | | 73,675,326 | | | |
|
| Mexico — 0.4% |
| | | |
Grupo Financiero Banorte SAB de C.V., Class O | | | 191,988 | | | | 1,061,813 | | | |
See Notes to Schedules of Investments and Notes to Financial Statements.
6
| | |
| Elfun International Equity Fund | | December 31, 2014 |
| | | | | | | | | | |
| | | Number
of Shares | | | Fair
Value | | | |
| | | | | | | | | | |
| | | |
| Netherlands — 3.2% | | | | | | | | | | |
| | | |
ASML Holding N.V. | | | 39,777 | | | $ | 4,297,805 | | | |
ING Groep N.V. | | | 304,415 | | | | 3,932,938 | | | (a,h) |
| | | | | | | 8,230,743 | | | |
|
| South Korea — 1.0% |
| | | |
Samsung Electronics Company Ltd. | | | 2,159 | | | | 2,595,645 | | | |
| | | |
| Sweden — 4.0% | | | | | | | | | | |
| | | |
Assa Abloy AB, Class B | | | 56,555 | | | | 2,974,558 | | | |
Hexagon AB, Class B | | | 43,410 | | | | 1,333,583 | | | |
Svenska Cellulosa AB SCA, Class B | | | 35,922 | | | | 771,197 | | | |
Telefonaktiebolaget LM Ericsson, Class B | | | 426,568 | | | | 5,143,356 | | | |
| | | | | | | 10,222,694 | | | |
|
| Switzerland — 5.9% |
| | | |
ABB Ltd. | | | 106,398 | | | | 2,252,429 | | | |
Givaudan S.A. | | | 1,098 | | | | 1,970,745 | | | |
Nestle S.A. | | | 37,331 | | | | 2,722,973 | | | |
Roche Holding AG | | | 23,501 | | | | 6,370,937 | | | |
The Swatch Group AG | | | 3,896 | | | | 1,731,781 | | | |
| | | | | | | 15,048,865 | | | |
|
| Taiwan — 1.5% |
| | | |
Taiwan Semiconductor Manufacturing Company Ltd. | | | 858,900 | | | | 3,783,859 | | | |
|
| United Kingdom — 12.7% |
| | | |
Barclays PLC | | | 1,410,084 | | | | 5,303,180 | | | |
BHP Billiton PLC | | | 148,917 | | | | 3,192,820 | | | |
Capita PLC | | | 128,529 | | | | 2,156,031 | | | |
Experian PLC | | | 107,164 | | | | 1,807,211 | | | |
GlaxoSmithKline PLC | | | 135,440 | | | | 2,906,885 | | | |
HSBC Holdings PLC | | | 252,118 | | | | 2,383,447 | | | |
International Consolidated Airlines Group S.A. | | | 263,000 | | | | 1,980,706 | | | (a) |
Johnson Matthey PLC | | | 40,909 | | | | 2,153,151 | | | |
Prudential PLC | | | 150,099 | | | | 3,471,655 | | | |
Shire PLC | | | 19,835 | | | | 1,406,888 | | | |
Vodafone Group PLC | | | 768,970 | | | | 2,637,608 | | | |
WPP PLC | | | 135,764 | | | | 2,823,935 | | | |
| | | | | | | 32,223,517 | | | |
| | | |
Total Common Stock
(Cost $226,495,980) | | | | | | | 244,735,843 | | | |
| | | | | | | | | | |
| | | Number
of Shares | | | Fair
Value | | | |
| | | | | | | | | | |
Preferred Stock — 1.7% |
|
| Germany — 1.7% |
| | | |
Volkswagen AG
(Cost $3,966,296) | | | 19,315 | | | $ | 4,292,862 | | | |
| | | |
Total Investments in Securities
(Cost $230,462,276) | | | | | | | 249,028,705 | | | |
Short-Term Investments — 2.1% |
| | | |
State Street Institutional U.S. Government Money Market Fund — Premier Class 0.00% | | | | | | | | | | |
(Cost $5,227,089) | | | | | | | 5,227,089 | | | (d,h,o) |
| | | |
Total Investments
(Cost $235,689,365) | | | | | | | 254,255,794 | | | |
| | | |
Other Assets and Liabilities,
net — 0.0%* | | | | | | | 54,119 | | | |
| | | | | | | | | | |
| | | |
NET ASSETS — 100.0% | | | | | | $ | 254,309,913 | | | |
| | | | | | | | | | |
Other Information:
The Fund had the following long futures contracts open at December 31, 2014:
| | | | | | | | | | | | | | |
| Description | | Expiration
date | | Number
of
Contracts | | | Current
Notional
Value | | | Unrealized
Appreciation
(Depreciation) | |
| | | | |
EURO Stoxx 50 Index Futures | | March 2015 | | | 19 | | | $ | 720,307 | | | $ | (2,646 | ) |
| | | | |
FTSE 100 Index Futures | | March 2015 | | | 2 | | | | 203,404 | | | | 2,302 | |
| | | | |
Topix Index Futures | | March 2015 | | | 4 | | | | 469,577 | | | | (4,432 | ) |
| | | | | | | | | | | | | | |
| | | | | | | | | | | | $ | (4,776) | |
| | | | | | | | | | | | | | |
See Notes to Schedules of Investments and Notes to Financial Statements.
7
| | |
| Elfun International Equity Fund | | December 31, 2014 |
The Fund was invested in the following sectors at December 31, 2014 (unaudited):
| | | | |
| Sector | | Percentage
(based on
Fair Value) | |
Diversified Banks | | | 12.07% | |
Pharmaceuticals | | | 9.45% | |
Automobile Manufacturers | | | 5.53% | |
Diversified Real Estate Activities | | | 4.61% | |
Life & Health Insurance | | | 3.70% | |
Electrical Components & Equipment | | | 3.46% | |
Industrial Machinery | | | 3.33% | |
Property & Casualty Insurance | | | 3.24% | |
Wireless Telecommunication Services | | | 2.92% | |
Integrated Oil & Gas | | | 2.76% | |
Aerospace & Defense | | | 2.72% | |
Electronic Equipment & Instruments | | | 2.71% | |
Semiconductors | | | 2.51% | |
Communications Equipment | | | 2.02% | |
Electronic Components | | | 1.93% | |
Internet Retail | | | 1.92% | |
Auto Parts & Equipment | | | 1.89% | |
Brewers | | | 1.83% | |
Industrial Gases | | | 1.75% | |
Semiconductor Equipment | | | 1.69% | |
Application Software | | | 1.67% | |
Specialty Chemicals | | | 1.62% | |
Other Diversified Financial Services | | | 1.55% | |
Internet Software & Services | | | 1.51% | |
Apparel, Accessories & Luxury Goods | | | 1.48% | |
Healthcare Services | | | 1.46% | |
Construction Materials | | | 1.38% | |
Multi-Line Insurance | | | 1.31% | |
Diversified Metals & Mining | | | 1.26% | |
Oil & Gas Equipment & Services | | | 1.20% | |
Building Products | | | 1.17% | |
Advertising | | | 1.11% | |
Packaged Foods & Meats | | | 1.07% | |
Railroads | | | 1.05% | |
Heavy Electrical Equipment | | | 0.89% | |
Biotechnology | | | 0.87% | |
Human Resource & Employment Services | | | 0.85% | |
Apparel Retail | | | 0.82% | |
Airlines | | | 0.78% | |
| | | | |
| Sector | | Percentage
(based on
Fair Value) | |
Research & Consulting Services | | | 0.71% | |
Construction & Engineering | | | 0.71% | |
Oil & Gas Exploration & Production | | | 0.44% | |
Electric Utilities | | | 0.41% | |
Household Products | | | 0.30% | |
Casinos & Gaming | | | 0.28% | |
| | | | |
| | | 97.94% | |
| | | | |
| | | | |
| Short-Term Investments | | Percentage
(based on
Fair Value) | |
Short-Term Investments | | | 2.06% | |
| | | | |
| | | 2.06% | |
| | | | |
| | | 100.00% | |
| | | | |
See Notes to Schedules of Investments and Notes to Financial Statements.
8
(Unaudited)


David B. Carlson
Chief Investment Officer — U.S. Equities
The Elfun Trusts is managed by David B. Carlson. See portfolio managers’ biographical information beginning on page 124.
| Q. | How did the Elfun Trusts Fund perform compared to its benchmark and Morningstar peer group for the twelve-month period ended December 31, 2014? |
| A. | For the twelve-month period ended December 31, 2014, the Elfun Trusts Fund returned 13.13%. The S&P 500® Index (S&P 500 Index), the Fund’s benchmark, returned 13.69% and the Fund’s Morningstar peer group of 1,712 U.S. Large Cap Growth Funds returned an average of 10.07% over the same period. Elfun Trusts finished in the top quartile of its Morningstar peer group. |
| Q. | What market factors affected the Fund’s performance? |
| A. | The stock market generally tracks growth in earnings and dividends with a lot of volatility along the way. Earnings are estimated to have been up 7-8% and dividends up 10-12% for the overall market in 2014. As Elfun Trusts remains fully invested in equities (cash is typically 1-4% of the Fund), the key to performance is our stock and industry selection. The big driver for Elfun Trusts last year was the Fund’s overweight in healthcare and its underweight in energy. However, while the Fund’s sector weights were positive, its stock selection was less effective resulting in an overall return modestly below the S&P 500 Index. |
| Q. | What were the primary drivers of Fund performance? |
| A. | There were two big surprises in macro events last year: the drop in oil prices and the drop in interest rates. In response to lower interest rates, utilities were the best performing sector with a return of 28%. We thought interest rates would rise last year and hence, the Fund did not own utility stocks. Utility stocks typically lag the market when interest rates are rising. We did not foresee the magnitude of the drop in oil prices, but we were underweighted the sector all year. Energy stocks were the worst performing sector with a decline of about 8%. The Fund’s energy holdings were down 3%. Healthcare was a significant positive contributor to Fund performance. The sector was up 25%, the Fund was overweighted, and the Fund’s healthcare holdings were up 30%. Leading the way was Covidien, up over 50% on a take-out offer by Medtronic. The Fund’s worst sector on a relative basis was consumer discretionary with the Fund’s holdings in media and retail lagging the market. |
| Q. | Were there any significant changes to the Fund during the period? |
| A. | Changes were modest throughout the year. The Fund ended the year with 51 holdings, up from 49 at the start. Portfolio turnover remained low at 12%. The Fund’s sector overweights continue to be technology, consumer discretionary, and healthcare. The Fund is underweighted in |
9
(Unaudited)
| | five sectors: industrials, consumer staples, utilities, telecomm and energy. The Fund is about equal weighted in the financial sector. The Fund is tilted toward growth, meaning its sector and stock emphasis is on above-average growth companies. Last year marked the fifth year of economic expansion and fifth year of a rising stock market. Corporate profits are at record highs, and profit margins are near peak levels. We believe growth will be modest from this point of the cycle and we think growth companies will be favored in the market. |
| | As always, we focus on high quality companies with great financial characteristics and management teams we admire and trust. |
10
(Unaudited)
Understanding Your Fund’s Expenses
As a shareholder of the Fund you incur ongoing costs. Ongoing costs include portfolio management fees, professional fees, administrative fees and other Fund expenses. The following example is intended to help you understand your ongoing costs (in dollars) of investing in the Fund and to compare these costs with the ongoing costs of investing in other mutual funds.
To illustrate these ongoing costs, we have provided an example and calculated the expenses paid by investors in units of the Fund during the period. The information in the following table is based on an investment of $1,000, which is invested at the beginning of the period and held for the entire six-month period ended December 31, 2014.
Actual Expenses
The first section of the table provides information about actual account values and actual expenses. You may use the information in this section, together with the amount you invested, to estimate the expenses that you paid over the period. To do so, simply divide your account value by $1,000 (for example, an $8,600 account value divided by $1,000 = 8.6), then multiply the result by the number given under the heading “Expenses paid during the
period” to estimate the expenses you paid on your account during the period.
Hypothetical Example for Comparison Purposes
The second section of the table provides information about hypothetical account values and hypothetical expenses based on the Fund’s actual expense ratio and an assumed rate of return of 5% per year before expenses, which is not the Fund’s actual return. The hypothetical account values and expenses may not be used to estimate the actual ending account balance or expenses you paid for the period. You may use this information to compare the ongoing costs of investing in the Fund and other funds. To do so, compare this 5% hypothetical example with the 5% hypothetical examples that appear in the shareholders reports of other funds.
Please note that the expenses shown in the table are meant to highlight and help you compare ongoing costs only and do not reflect transaction costs, such as sales charges or redemption fees, if any. Therefore, the second section of the table is useful in comparing ongoing costs only, and will not help you determine the relative total costs of owning different funds.
July 1, 2014 – December 31, 2014
| | | | | | | | | | | | |
| | | Account value at
the beginning of
the period ($) | | | Account value
at the end of
the period ($) | | | Expenses
paid during
the period ($)* | |
| | | |
Actual Fund Return | | | 1,000.00 | | | | 1,083.20 | | | | 1.21 | |
| | | |
Hypothetical 5% Return
(2.5% for the period) | | | 1,000.00 | | | | 1,024.05 | | | | 1.17 | |
| * | | Expenses are equal to the Fund’s annualized net expense ratio of 0.23%** (for the period July 1, 2014 – December 31, 2014), multiplied by the average account value over the period, multiplied by 184/365 (to reflect the one-half year period). |
| ** | | May differ from expense ratio disclosed in the financial highlights, which is calculated based on the entire fiscal year’s data. |
11
(Unaudited)
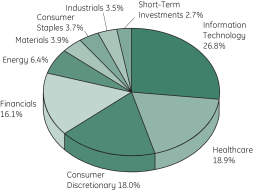
A mutual fund designed for investors who seek long-term growth of capital and future income rather than current income. The Fund seeks to achieve its investment objectives by investing in equity securities of U.S. companies, such as common and preferred stocks.
as of December 31, 2014 (as a % of Investments)(b)(c)
| | | | |
QUALCOMM Inc. | | | 4.06% | |
Visa Inc., Class A | | | 3.92% | |
CME Group Inc. | | | 3.84% | |
State Street Corp. | | | 3.81% | |
Schlumberger Ltd. | | | 3.80% | |
Lowe’s Companies Inc. | | | 3.73% | |
Liberty Global PLC, Class C | | | 3.71% | |
Baidu Inc. ADR | | | 3.69% | |
PepsiCo Inc. | | | 3.67% | |
Monsanto Co. | | | 3.48% | |
as a % of Investments of $2,472,858 (in thousands) on
December 31, 2014(b)(c)
|
| Morningstar Performance Comparison |
Based on average annual returns for periods ended December 31, 2014
| | | | | | | | | | | | |
| | | One
Year | | | Five
Year | | | Ten
Year | |
Number of funds in peer group | | | 1,712 | | | | 1,331 | | | | 917 | |
Peer group average annual total return | | | 10.07 | % | | | 13.81 | % | | | 7.02 | % |
Morningstar Category in peer group: U.S. Large Growth | |
|
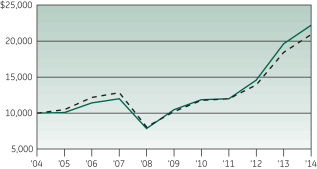
| Change in Value of a $10,000 Investment(a) |

|
| Average Annual Total Return |
for the periods ended December 31, 2014
| | | | | | | | | | | | | | | | |
| (Inception date: 5/27/35) | | | | | | | | | | |
| | | One
Year | | | Five
Year | | | Ten
Year | | | Ending Value of a
$10,000
Investment (a) | |
| | | | |
Elfun Trusts | | | 13.13% | | | | 16.23% | | | | 8.32% | | | | $22,228 | |
| | | | |
S&P 500 Index | | | 13.69% | | | | 15.46% | | | | 7.68% | | | | $20,945 | |
| (a) | Ending value of a $10,000 investment for the ten-year period or since inception, whichever is less. |
| (b) | Fair Value basis is inclusive of short-term investment in State Street Institutional U.S. Government Money Market Fund Premier Class. |
| (c) | The securities information regarding holdings, allocations and other characteristics is presented to illustrate examples of securities that the Fund has bought and the diversity of areas in which the Fund may invest as of a particular date. It may not be representative of the Fund’s current or future investments and should not be construed as a recommendation to purchase or sell a particular security. |
See Notes to Performance beginning on page 1 for further information, including an explanation of Morningstar peer categories.
Past performance does not predict future performance. The performance shown in the graphs and tables does not reflect the deduction of taxes that a shareholder would pay on Fund distributions or the redemption of Fund shares.
12
| | |
| Elfun Trusts | | December 31, 2014 |
| | | | | | | | | | |
| | | Number
of Shares | | | Fair
Value | | | |
Common Stock — 97.2%† |
|
| Aerospace & Defense — 0.8% |
| | | |
Hexcel Corp. | | | 100,000 | | | $ | 4,149,000 | | | (a) |
Honeywell International Inc. | | | 160,000 | | | | 15,987,200 | | | |
| | | | | | | 20,136,200 | | | |
|
| Air Freight & Logistics — 1.4% |
| | | |
United Parcel Service Inc., Class B | | | 320,000 | | | | 35,574,400 | | | |
| |
| Application Software — 2.1% | | | |
| | | |
Intuit Inc. | | | 550,000 | | | | 50,704,500 | | | |
|
| Asset Management & Custody Banks — 3.8% |
| | | |
State Street Corp. | | | 1,200,000 | | | | 94,200,000 | | | (e) |
|
| Biotechnology — 6.0% |
| | | |
Alexion Pharmaceuticals Inc. | | | 85,000 | | | | 15,727,550 | | | (a) |
Amgen Inc. | | | 425,000 | | | | 67,698,250 | | | |
Gilead Sciences Inc. | | | 680,000 | | | | 64,096,800 | | | (a) |
| | | | | | | 147,522,600 | | | |
|
| Broadcasting — 1.6% |
| | | |
Discovery Communications Inc., Class C | | | 1,200,000 | | | | 40,464,000 | | | (a) |
|
| Cable & Satellite — 7.0% |
| | | |
Comcast Corp., Special Class A | | | 1,250,000 | | | | 71,956,250 | | | |
Liberty Global PLC, Class C | | | 1,900,000 | | | | 91,789,000 | | | (a) |
Sirius XM Holdings Inc. | | | 3,000,000 | | | | 10,500,000 | | | (a) |
| | | | | | | 174,245,250 | | | |
|
| Casinos & Gaming — 0.7% |
| | | |
Las Vegas Sands Corp. | | | 300,000 | | | | 17,448,000 | | | |
|
| Communications Equipment — 4.1% |
| | | |
QUALCOMM Inc. | | | 1,350,000 | | | | 100,345,500 | | | |
|
| Data Processing & Outsourced Services — 4.9% |
| | | |
Automatic Data Processing Inc. | | | 200,000 | | | | 16,674,000 | | | |
Paychex Inc. | | | 170,000 | | | | 7,848,900 | | | |
| | | | | | | | | | |
| | | Number
of Shares | | | Fair
Value | | | |
| | | |
Visa Inc., Class A | | | 370,000 | | | $ | 97,014,000 | | | |
| | | | | | | 121,536,900 | | | |
|
| Diversified Banks — 2.9% |
| | | |
JPMorgan Chase & Co. | | | 1,150,000 | | | | 71,967,000 | | | |
|
| Environmental & Facilities Services — 0.2% |
| | | |
Stericycle Inc. | | | 45,000 | | | | 5,898,600 | | | (a) |
|
| Fertilizers & Agricultural Chemicals — 3.5% |
| | | |
Monsanto Co. | | | 720,000 | | | | 86,018,400 | | | |
|
| Healthcare Equipment — 3.9% |
| | | |
Abbott Laboratories | | | 600,000 | | | | 27,012,000 | | | |
Covidien PLC | | | 670,000 | | | | 68,527,600 | | | |
| | | | | | | 95,539,600 | | | |
|
| Healthcare Services — 2.6% |
| | | |
Express Scripts Holding Co. | | | 760,000 | | | | 64,349,200 | | | (a) |
|
| Healthcare Supplies — 0.9% |
| | | |
The Cooper Companies Inc. | | | 130,000 | | | | 21,071,700 | | | |
|
| Home Improvement Retail — 3.7% |
| | | |
Lowe’s Companies Inc. | | | 1,340,000 | | | | 92,192,000 | | | |
|
| Industrial Gases — 0.4% |
| | | |
Praxair Inc. | | | 80,000 | | | | 10,364,800 | | | |
|
| Industrial Machinery — 1.0% |
| | | |
Dover Corp. | | | 350,000 | | | | 25,102,000 | | | |
|
| Integrated Oil & Gas — 1.5% |
| | | |
Chevron Corp. | | | 330,000 | | | | 37,019,400 | | | |
|
| Internet Retail — 1.9% |
| | | |
Amazon.com Inc. | | | 155,000 | | | | 48,104,250 | | | (a) |
|
| Internet Software & Services — 9.2% |
| | | |
Baidu Inc. ADR | | | 400,000 | | | | 91,188,000 | | | (a,h) |
eBay Inc. | | | 1,225,000 | | | | 68,747,000 | | | (a) |
Facebook Inc., Class A | | | 140,000 | | | | 10,922,800 | | | (a) |
Google Inc., Class A | | | 38,000 | | | | 20,165,080 | | | (a) |
Google Inc., Class C | | | 60,000 | | | | 31,584,000 | | | (a) |
See Notes to Schedules of Investments and Notes to Financial Statements.
13
| | |
| Elfun Trusts | | December 31, 2014 |
| | | | | | | | | | |
| | | Number
of Shares | | | Fair
Value | | | |
| | | |
LinkedIn Corp. | | | 20,000 | | | $ | 4,594,200 | | | (a) |
| | | | | | | 227,201,080 | | | |
|
| Investment Banking & Brokerage — 1.3% |
| | | |
The Charles Schwab Corp. | | | 1,100,000 | | | | 33,209,000 | | | |
|
| Movies & Entertainment — 1.1% |
| | | |
The Walt Disney Co. | | | 300,000 | | | | 28,257,000 | | | |
|
| Oil & Gas Equipment & Services — 3.8% |
| | | |
Schlumberger Ltd. | | | 1,100,000 | | | | 93,951,000 | | | |
|
| Oil & Gas Exploration & Production — 1.1% |
| | | |
Anadarko Petroleum Corp. | | | 330,000 | | | | 27,225,000 | | | |
|
| Pharmaceuticals — 5.6% |
| | | |
Actavis PLC | | | 260,000 | | | | 66,926,600 | | | (a) |
Johnson & Johnson | | | 480,000 | | | | 50,193,600 | | | |
Merck & Company Inc. | | | 220,000 | | | | 12,493,800 | | | |
Pfizer Inc. | | | 300,000 | | | | 9,345,000 | | | |
| | | | | | | 138,959,000 | | | |
|
| Reinsurance — 0.4% |
| | | |
Alleghany Corp. | | | 20,000 | | | | 9,270,000 | | | (a) |
|
| Soft Drinks — 3.7% |
| | | |
PepsiCo Inc. | | | 960,000 | | | | 90,777,600 | | | |
|
| Specialized Finance — 5.3% |
| | | |
CME Group Inc. | | | 1,070,000 | | | | 94,855,500 | | | |
McGraw Hill Financial Inc. | | | 400,000 | | | | 35,592,000 | | | |
| | | | | | | 130,447,500 | | | |
|
| Specialized REITs — 2.4% |
| | | |
American Tower Corp. | | | 600,000 | | | | 59,310,000 | | | |
|
| Specialty Stores — 1.8% |
| | | |
Dick’s Sporting Goods Inc. | | | 900,000 | | | | 44,685,000 | | | |
|
| Technology Hardware, Storage & Peripherals — 6.6% |
| | | |
Apple Inc. | | | 770,000 | | | | 84,992,600 | | | |
EMC Corp. | | | 2,650,000 | | | | 78,811,000 | | | |
| | | | | | | 163,803,600 | | | |
| | | |
Total Common Stock
(Cost $1,332,584,681) | | | | | | | 2,406,900,080 | | | |
| | | | | | | | |
| | | Number
of Shares | | Fair
Value | | | |
Short-Term Investments — 2.6% |
| | |
State Street Institutional U.S.
Government Money Market
Fund — Premier
Class | | | | | | |
0.00%
(Cost $65,958,047) | | | | $ | 65,958,047 | | | (d,o) |
| | | |
Total Investments
(Cost $1,398,542,728) | | | | | 2,472,858,127 | | | |
| | | |
Other Assets and Liabilities,
net — 0.2% | | | | | 3,778,965 | | | |
| | | | | | | | |
| | | |
NET ASSETS — 100.0% | | | | $ | 2,476,637,092 | | | |
| | | | | | | | |
See Notes to Schedules of Investments and Notes to Financial Statements.
14
(Unaudited)


David Wiederecht
President and
Chief Investment
Officer — Investment Solutions

Jeffrey Palma
Senior Vice President and Chief Market Strategist
The Elfun Diversified Fund is managed by Jeffrey Palma and David Wiederecht. Messrs. Palma and Wiederecht are vested with oversight authority for determining asset allocations for the Fund. Each of the U.S. equity, international equity and fixed income portions of the Fund are managed by separate teams of portfolio managers and analysts. The sub-portfolios underlying the Fund are managed independently of each other, and the portfolio managers have full discretion over their particular sub-portfolio; however, the portfolio management team is collaborative to ensure strict adherence to seek the Fund’s objective. See portfolio managers’ biographical information beginning on page 124.
| Q. | How did the Elfun Diversified Fund perform compared to its benchmark and Morningstar peer group for the twelve-month period ended December 31, 2014? |
| A. | For the twelve-month period ended December 31, 2014, the Elfun Diversified Fund returned 4.95%. The Fund’s broad based benchmarks, the S&P 500® Index (S&P 500 Index), the MSCI All Country World ex-U.S. Index, and the Barclays U.S. Aggregate Bond Index, returned 13.69%, -3.87%, and 5.97%, respectively. The Fund’s Morningstar peer group of 867 U.S. Moderate Allocation funds returned an average of 5.83% over the same period. |
| Q. | What market factors affected the Fund’s performance? |
| A. | Within equity markets, the U.S. produced the best gains for the year as a whole, while returns elsewhere were weaker and, |
| | in many cases, negative. Bond markets produced solid gains across the board driven by the drop in interest rates. Of course, these moves came against broad expectations for yields to continue to rise in 2014 following the increase witnessed in 2013. A weak start to growth early in the year, a tepid outlook, plus still accommodative policy from central banks worked to keep rates low. Moreover, European Central Bank (ECB) President Draghi’s action to cut deposit rates to negative territory provided enormous support to peripheral country bond markets as did his rhetoric as markets have moved to anticipate full scale quantitative easing (QE) in Europe in early 2015. |
| | This year was a challenging one for investors. Aside from the U.S., returns in global equity markets were generally weak. The sharp drop in interest rates around the world was unanticipated, particularly given the stability of U.S. equity markets and, while growth was weaker than forecast, it was hardly a collapse. The Bank of Japan and the ECB both became more aggressive in their policy actions to boost growth and inflation while also weakening their currencies relative to the U.S. dollar. Finally, the drop in oil prices has had large market and economic impacts that will be felt well into 2015. |
| | For 2014, growth disappointed expectations around most of the world. While the U.S. looks to have produced stronger second half growth and labor |
15
(Unaudited)

| | markets have clearly improved, overall GDP remained subdued. Elsewhere, in Europe, Japan, and emerging markets, particularly China growth remained more sluggish than hoped. Meanwhile inflation remains at bay and continues to decline in Europe. This fragility has kept monetary policy very accommodative in the U.S. for some time and the Fed acted only modestly to change that stance this year by ending its QE program. Outside of the U.S., the ECB and the Bank of Japan have clearly taken more aggressive action toward easier policy. In particular, the ECB cut deposit rates into negative territory twice in 2014. This policy shift has had major impacts on fixed income markets around the world with steep declines in rates and currencies versus the U.S. dollar. |
| | Looking at 2014 in total, it was also a mixed year for stocks and was broadly consistent with the fourth quarter trends. The U.S. and Japan led the way higher with gains in local currency terms, while all other major markets declined. But all major non-U.S. markets fell in 2014 in common currency terms, given the steep decline in foreign exchange markets witnessed during the year. |
| | There was a mix of factors driving returns this year. For the U.S., gains were driven by a combination of earnings growth and price-earnings (PE) multiple expansion. As we have noted in recent quarters, the steady rise of valuations makes additional gains through PEs more challenging and boosts the possibility of spikes in volatility. Support of valuations has been aided by reasonable growth as well as continued global monetary policy accommodation, as discussed above. Outside of the U.S., Europe continues to see more modest economic and earnings growth, while Japan fared better in 2014. Geopolitics also played a role with various events creating challenges for markets |
| | throughout the year. Of course, the drop in oil prices late in the year had a major impact within the energy sector. |
| | As was the case for virtually all of 2014, bond yields fell sharply throughout the final quarter of the year. The drop was most pronounced in Europe, where expectations for additional ECB policy action in the form of QE have risen. But the U.S. has seen sharp declines in yields as well – despite expectations for rising short-term rates in 2015. The decline in oil prices and the associated impact on inflation and inflation expectations clearly played a material role in driving central bank expectations in Europe and has added to uncertainty about the exact timing of Fed moves. |
| | In corporate credit markets, spreads on bonds moved a bit wider throughout the second half of the year, somewhat offsetting the decline in Treasury yields. Weaker oil prices and the associated impact on the energy sector in corporate bonds was a clear contributor to this move. Further, there were periods of more challenging liquidity conditions in credit markets toward the end of the year, which added to pressure on spreads. |
| Q. | What were the primary drivers of Fund performance? |
| A. | The Fund’s performance was primarily driven by its asset allocation and underlying security selection. A higher allocation to U.S. equity and lower allocation to fixed income positively impacted the Fund’s performance as U.S. equity markets outperformed fixed income during the period. A higher allocation to cash and security selection within U.S. and international equity negatively impacted the Fund’s performance. |
16
(Unaudited)
| Q. | Were there any significant changes to the Fund during the period? |
| A. | The Fund’s exposure to equity, fixed income, and cash remained fairly consistent throughout the period. Allocations within the Fund were periodically rebalanced to stay within guidelines. |
| | Earlier this year, we reduced fixed income and increased cash. We also decreased growth equity and equity yield and increased international equity to rebalance the Fund and keep equity allocations close to their strategic targets. We continued to decrease fixed income and growth equity and increase cash. Also, value equity was reduced and fixed income was increased. Within U.S. equity, the allocations to growth, value, and equity yield were consolidated into a multistyle large-cap blend strategy. The final allocation change to the Fund for the year was to reduce multistyle equity and increase fixed income. |
| | Our preference for equity over bonds has been driven by an expectation for bond yields to rise in the short to medium-term, equity valuations that are in line with long-term averages, and our view that the economic recovery will be sustained. Nevertheless, we believe short-term setbacks in the equity markets are likely to continue to occur. We, therefore, favor being disciplined in rebalancing the Fund, rather than simply letting the Fund’s allocation to equity increase significantly. Returns in both bond and equity markets may be more modest and range-bound going forward. We continue to believe it prudent to maintain a diversified portfolio and remain vigilant in the search for attractive investment opportunities. By tactically allocating between U.S. equity, international equity, and fixed income, we believe the Fund will continue to seek to produce attractive returns while maintaining a prudent level of risk. |
17
(Unaudited)
Understanding Your Fund’s Expenses
As a shareholder of the Fund you incur ongoing costs. Ongoing costs include portfolio management fees, professional fees, administrative fees and other Fund expenses. The following example is intended to help you understand your ongoing costs (in dollars) of investing in the Fund and to compare these costs with the ongoing costs of investing in other mutual funds.
To illustrate these ongoing costs, we have provided an example and calculated the expenses paid by investors in units of the Fund during the period. The information in the following table is based on an investment of $1,000, which is invested at the beginning of the period and held for the entire six-month period ended December 31, 2014.
Actual Expenses
The first section of the table provides information about actual account values and actual expenses. You may use the information in this section, together with the amount you invested, to estimate the expenses that you paid over the period. To do so, simply divide your account value by $1,000 (for example, an $8,600 account value divided by $1,000 = 8.6), then multiply the result by the number given under the heading “Expenses paid during the
period” to estimate the expenses you paid on your account during the period.
Hypothetical Example for Comparison Purposes
The second section of the table provides information about hypothetical account values and hypothetical expenses based on the Fund’s actual expense ratio and an assumed rate of return of 5% per year before expenses, which is not the Fund’s actual return. The hypothetical account values and expenses may not be used to estimate the actual ending account balance or expenses you paid for the period. You may use this information to compare the ongoing costs of investing in the Fund and other funds. To do so, compare this 5% hypothetical example with the 5% hypothetical examples that appear in the shareholders reports of other funds.
Please note that the expenses shown in the table are meant to highlight and help you compare ongoing costs only and do not reflect transaction costs, such as sales charges or redemption fees, if any. Therefore, the second section of the table is useful in comparing ongoing costs only, and will not help you determine the relative total costs of owning different funds.
July 1, 2014 – December 31, 2014
| | | | | | | | | | | | |
| | | Account value at
the beginning of the period ($) | | | Account value
at the end of
the period ($) | | | Expenses
paid during
the period ($)* | |
| | | |
Actual Fund Return | | | 1,000.00 | | | | 1,007.40 | | | | 2.13 | |
| | | |
Hypothetical 5% Return
(2.5% for the period) | | | 1,000.00 | | | | 1,023.09 | | | | 2.14 | |
| * | | Expenses are equal to the Fund’s annualized net expense ratio of 0.42%** (for the period July 1, 2014 – December 31, 2014), multiplied by the average account value over the period, multiplied by 184/365 (to reflect the one-half year period). |
| ** | | May differ from expense ratio disclosed in the financial highlights, which is calculated based on the entire fiscal year’s data. |
18
(Unaudited)
A mutual fund designed for investors who seek the highest total return, composed of income and capital appreciation, as is consistent with prudent investment management and the preservation of capital. The Fund seeks to achieve its investment objective by investing primarily in a combination of U.S. and foreign (non-U.S.) equity and debt securities and cash. The Fund’s asset allocation process utilizes information from GE Asset Management’s Asset Allocation Committee to diversify holdings across these asset classes and to adjust the asset class weightings based on market and economic conditions.
|
| Top Ten Largest Equity Holdings |
as of December 31, 2014 (as a % of Investments)(b)(c)
| | | | |
Amgen Inc. | | | 1.01% | |
Actavis PLC | | | 0.98% | |
QUALCOMM Inc. | | | 0.94% | |
EMC Corp. | | | 0.91% | |
Apple Inc. | | | 0.89% | |
JPMorgan Chase & Co. | | | 0.81% | |
Cisco Systems Inc. | | | 0.74% | |
Schlumberger Ltd. | | | 0.73% | |
Pfizer Inc. | | | 0.70% | |
CVS Health Corp. | | | 0.70% | |
as a % of Investments of $235,614 (in thousands) on
December 31, 2014(b)(c)
|
| Morningstar Performance Comparison |
Based on average annual returns for periods ended December 31, 2014
| | | | | | | | | | | | |
| | | One
Year | | | Five
Year | | | Ten
Year | |
Number of funds in peer group | | | 867 | | | | 654 | | | | 440 | |
Peer group average annual total return | | | 5.83 | % | | | 8.87 | % | | | 5.38 | % |
Morningstar Category in peer group: U.S. Moderate Allocation | |
|
| Change in Value of a $10,000 Investment(a) |

|
| Average Annual Total Return |
for the periods ended December 31, 2014
| | | | | | | | | | | | | | | | |
| (Inception date: 01/01/88) | |
| | | One
Year | | | Five
Year | | | Ten
Year | | | Ending value of a
$10,000
investment (a) | |
| | | | |
Elfun Diversified Fund | | | 4.95% | | | | 8.17% | | | | 5.04% | | | | $16,354 | |
| | | | |
S&P 500 Index | | | 13.69% | | | | 15.46% | | | | 7.68% | | | | $20,945 | |
| | | | |
Barclays U.S. Aggregate Bond Index | | | 5.97% | | | | 4.45% | | | | 4.71% | | | | $15,842 | |
| | | | |
MSCI All Country World ex U.S. | | | -3.87% | | | | 4.43% | | | | 5.13% | | | | $16,488 | |
| (a) | Ending value of a $10,000 investment for the ten-year period or since inception, whichever is less. |
| (b) | Fair Value basis is inclusive of short-term investment in State Street Institutional U.S. Government Money Market Fund Premier Class. |
| (c) | The securities information regarding holdings, allocations and other characteristics is presented to illustrate examples of securities that the Fund has bought and the diversity of areas in which the Fund may invest as of a particular date. It may not be representative of the Fund’s current or future investments and should not be construed as a recommendation to purchase or sell a particular security. |
See Notes to Performance beginning on page 1 for further information, including an explanation of Morningstar peer categories. Past performance does not predict future performance. The performance shown in the graphs and tables does not reflect the deduction of taxes that a shareholder would pay on Fund distributions or the redemption of Fund shares.
19
| | |
| Elfun Diversified Fund | | December 31, 2014 |
| | | | | | | | | | |
| | | Number
of Shares | | | Fair
Value | | | |
Domestic Equity – 35.1%† | | | | | | | | | | |
| | |
| Common Stock — 35.1% | | | | | | | |
| |
| Aerospace & Defense — 1.6% | | | |
| | | |
General Dynamics Corp. | | | 7,929 | | | $ | 1,091,189 | | | |
Hexcel Corp. | | | 14,055 | | | | 583,142 | | | (a) |
Honeywell International Inc. | | | 14,380 | | | | 1,436,849 | | | |
The Boeing Co. | | | 3,604 | | | | 468,448 | | | |
| | | | | | | 3,579,628 | | | |
| |
| Agricultural Products — 0.5% | | | |
| | | |
Archer-Daniels-Midland Co. | | | 20,508 | | | | 1,066,416 | | | |
| |
| Air Freight & Logistics — 0.2% | | | |
| | | |
United Parcel Service Inc., Class B | | | 3,604 | | | | 400,657 | | | |
| |
| Airlines — 0.3% | | | |
| | | |
Delta Air Lines Inc. | | | 16,219 | | | | 797,813 | | | |
| |
| Application Software — 0.3% | | | |
| | | |
Intuit Inc. | | | 6,488 | | | | 598,129 | | | |
| |
| Asset Management & Custody Banks — 1.7% | | | |
| | | |
Ameriprise Financial Inc. | | | 9,767 | | | | 1,291,686 | | | |
Invesco Ltd. | | | 33,303 | | | | 1,316,135 | | | |
State Street Corp. | | | 17,229 | | | | 1,352,476 | | | (e) |
| | | | | | | 3,960,297 | | | |
| |
| Auto Parts & Equipment — 0.1% | | | |
| | | |
Delphi Automotive PLC | | | 2,883 | | | | 209,652 | | | |
| |
| Automobile Manufacturers — 0.2% | | | |
| | | |
Ford Motor Co. | | | 30,636 | | | | 474,858 | | | |
| |
| Automotive Retail — 0.2% | | | |
| | | |
Advance Auto Parts Inc. | | | 2,090 | | | | 332,895 | | | |
AutoZone Inc. | | | 217 | | | | 134,347 | | | (a) |
| | | | | | | 467,242 | | | |
| |
| Biotechnology — 1.6% | | | |
| | | |
Alexion Pharmaceuticals Inc. | | | 3,100 | | | | 573,593 | | | (a) |
Amgen Inc. | | | 14,994 | | | | 2,388,394 | | | |
Gilead Sciences Inc. | | | 8,724 | | | | 822,324 | | | (a) |
| | | | | | | 3,784,311 | | | |
| | | | | | | | | | |
| | | Number
of Shares | | | Fair
Value | | | |
| |
| Broadcasting — 0.3% | | | |
| | | |
CBS Corp., Class B | | | 5,407 | | | $ | 299,223 | | | |
Discovery Communications Inc., Class C | | | 12,471 | | | | 420,522 | | | (a) |
| | | | | | | 719,745 | | | |
| |
| Cable & Satellite — 1.4% | | | |
| | | |
Comcast Corp., Class A | | | 24,616 | | | | 1,427,974 | | | |
Comcast Corp., Special Class A | | | 12,110 | | | | 697,112 | | | |
Liberty Global PLC, Class C | | | 21,049 | | | | 1,016,877 | | | (a) |
| | | | | | | 3,141,963 | | | |
| |
| Casinos & Gaming — 0.1% | | | |
| | | |
Las Vegas Sands Corp. | | | 5,983 | | | | 347,971 | | | |
| |
| Commodity Chemicals — 0.1% | | | |
| | | |
LyondellBasell Industries N.V., Class A | | | 3,065 | | | | 243,330 | | | |
| |
| Communications Equipment — 1.7% | | | |
| | | |
Cisco Systems Inc. | | | 62,353 | | | | 1,734,349 | | | |
QUALCOMM Inc. | | | 29,882 | | | | 2,221,129 | | | |
| | | | | | | 3,955,478 | | | |
| |
| Consumer Finance — 0.6% | | | |
| | | |
American Express Co. | | | 14,128 | | | | 1,314,469 | | | |
|
| Data Processing & Outsourced Services — 0.4% |
| | | |
Visa Inc., Class A | | | 3,965 | | | | 1,039,623 | | | |
| |
| Diversified Banks — 2.1% | | | |
| | | |
Bank of America Corp. | | | 29,555 | | | | 528,739 | | | |
Citigroup Inc. | | | 24,869 | | | | 1,345,662 | | | |
JPMorgan Chase & Co. | | | 30,421 | | | | 1,903,746 | | | |
Wells Fargo & Co. | | | 18,382 | | | | 1,007,701 | | | |
| | | | | | | 4,785,848 | | | |
| |
| Drug Retail — 0.7% | | | |
| | | |
CVS Health Corp. | | | 17,120 | | | | 1,648,827 | | | |
| |
| Electric Utilities — 0.2% | | | |
| | | |
NextEra Energy Inc. | | | 3,604 | | | | 383,069 | | | |
| |
| Electrical Components & Equipment — 0.0%* | | | |
| | | |
Eaton Corporation PLC | | | 1,082 | | | | 73,533 | | | |
See Notes to Schedules of Investments and Notes to Financial Statements.
20
| | |
| Elfun Diversified Fund | | December 31, 2014 |
| | | | | | | | | | |
| | | Number
of Shares | | | Fair
Value | | | |
| |
| Fertilizers & Agricultural Chemicals — 0.4% | | | |
| | | |
Monsanto Co. | | | 7,569 | | | $ | 904,268 | | | |
| |
| General Merchandise Stores — 0.9% | | | |
| | | |
Dollar General Corp. | | | 8,831 | | | | 624,352 | | | (a) |
Target Corp. | | | 19,643 | | | | 1,491,100 | | | |
| | | | | | | 2,115,452 | | | |
| |
| Healthcare Distributors — 0.2% | | | |
| | | |
Cardinal Health Inc. | | | 7,209 | | | | 581,983 | | | |
| |
| Healthcare Equipment — 1.4% | | | |
| | | |
Abbott Laboratories | | | 15,498 | | | | 697,720 | | | |
Boston Scientific Corp. | | | 84,701 | | | | 1,122,288 | | | (a) |
Covidien PLC | | | 10,453 | | | | 1,069,133 | | | |
Stryker Corp. | | | 3,244 | | | | 306,007 | | | |
| | | | | | | 3,195,148 | | | |
| |
| Healthcare Services — 0.3% | | | |
| | | |
Express Scripts Holding Co. | | | 7,641 | | | | 646,963 | | | (a) |
| |
| Healthcare Supplies — 0.2% | | | |
| | | |
The Cooper Companies Inc. | | | 2,739 | | | | 443,965 | | | |
| |
| Home Improvement Retail — 0.7% | | | |
| | | |
Lowe’s Companies Inc. | | | 23,607 | | | | 1,624,162 | | | |
| |
| Household Products — 0.1% | | | |
| | | |
Energizer Holdings Inc. | | | 1,442 | | | | 185,384 | | | |
| |
| Independent Power Producers & Energy Traders — 0.2% | | | |
| | | |
AES Corp. | | | 3,065 | | | | 42,205 | | | |
Calpine Corp. | | | 12,171 | | | | 269,344 | | | (a) |
NRG Energy Inc. | | | 9,783 | | | | 263,652 | | | |
| | | | | | | 575,201 | | | |
| |
| Industrial Machinery — 0.3% | | | |
| | | |
Dover Corp. | | | 4,325 | | | | 310,189 | | | |
Ingersoll-Rand PLC | | | 5,300 | | | | 335,967 | | | |
| | | | | | | 646,156 | | | |
| |
| Integrated Oil & Gas — 1.6% | | | |
| | | |
Chevron Corp. | | | 5,046 | | | | 566,060 | | | |
Exxon Mobil Corp. | | | 16,399 | | | | 1,516,088 | | | |
| | | | | | | | | | |
| | | Number
of Shares | | | Fair
Value | | | |
| | | |
Hess Corp. | | | 9,804 | | | $ | 723,731 | | | |
Occidental Petroleum Corp. | | | 10,452 | | | | 842,536 | | | |
| | | | | | | 3,648,415 | | | |
|
| Integrated Telecommunication Services — 0.3% |
| | | |
Verizon Communications Inc. | | | 12,615 | | | | 590,130 | | | |
| |
| Internet Retail — 0.3% | | | |
| | | |
Amazon.com Inc. | | | 1,946 | | | | 603,941 | | | (a) |
| |
| Internet Software & Services — 1.1% | | | |
| | | |
eBay Inc. | | | 12,110 | | | | 679,613 | | | (a) |
Facebook Inc., Class A | | | 4,326 | | | | 337,515 | | | (a) |
Google Inc., Class A | | | 1,838 | | | | 975,353 | | | (a) |
Google Inc., Class C | | | 937 | | | | 493,237 | | | (a) |
| | | | | | | 2,485,718 | | | |
| |
| Investment Banking & Brokerage — 0.3% | | | |
| | | |
The Charles Schwab Corp. | | | 19,823 | | | | 598,456 | | | |
| |
| Life & Health Insurance — 0.1% | | | |
| | | |
Lincoln National Corp. | | | 5,128 | | | | 295,732 | | | |
| |
| Life Sciences Tools & Services — 0.1% | | | |
| | | |
PerkinElmer Inc. | | | 4,325 | | | | 189,132 | | | |
| |
| Movies & Entertainment — 0.7% | | | |
| | | |
The Walt Disney Co. | | | 6,127 | | | | 577,102 | | | |
Time Warner Inc. | | | 13,155 | | | | 1,123,700 | | | |
| | | | | | | 1,700,802 | | | |
| |
| Multi-Line Insurance — 1.1% | | | |
| | | |
American International Group Inc. | | | 18,742 | | | | 1,049,739 | | | |
The Hartford Financial Services Group Inc. | | | 34,781 | | | | 1,450,020 | | | |
| | | | | | | 2,499,759 | | | |
| |
| Oil & Gas Equipment & Services — 0.9% | | | |
| | | |
Cameron International Corp. | | | 2,523 | | | | 126,024 | | | (a) |
Halliburton Co. | | | 5,757 | | | | 226,423 | | | |
Schlumberger Ltd. | | | 20,144 | | | | 1,720,499 | | | |
| | | | | | | 2,072,946 | | | |
See Notes to Schedules of Investments and Notes to Financial Statements.
21
| | |
| Elfun Diversified Fund | | December 31, 2014 |
| | | | | | | | | | |
| | | Number
of Shares | | | Fair
Value | | | |
|
| Oil & Gas Exploration & Production — 0.1% |
| | | |
California Resources Corp. | | | 596 | | | $ | 3,284 | | | (a) |
Marathon Oil Corp. | | | 9,011 | | | | 254,921 | | | |
| | | | | | | 258,205 | | | |
|
| Packaged Foods & Meats — 0.4% |
| | | |
Mondelez International Inc., Class A | | | 25,951 | | | | 942,670 | | | |
|
| Pharmaceuticals — 2.6% |
| | | |
Actavis PLC | | | 9,011 | | | | 2,319,522 | | | (a) |
Johnson & Johnson | | | 6,849 | | | | 716,200 | | | |
Merck & Company Inc. | | | 22,381 | | | | 1,271,017 | | | |
Pfizer Inc. | | | 52,982 | | | | 1,650,389 | | | |
| | | | | | | 5,957,128 | | | |
|
| Publishing — 0.0%* |
| | | |
Tribune Media Co., Class A | | | 865 | | | | 51,701 | | | (a) |
|
| Railroads — 0.1% |
| | | |
CSX Corp. | | | 5,046 | | | | 182,817 | | | |
|
| Regional Banks — 0.4% |
| | | |
Regions Financial Corp. | | | 83,259 | | | | 879,215 | | | |
|
| Research & Consulting Services — 0.5% |
| | | |
Nielsen N.V. | | | 23,931 | | | | 1,070,434 | | | |
|
| Semiconductor Equipment — 0.2% |
| | | |
Applied Materials Inc. | | | 15,498 | | | | 386,210 | | | |
|
| Soft Drinks — 1.1% |
| | | |
Coca-Cola Enterprises Inc. | | | 22,600 | | | | 999,372 | | | |
PepsiCo Inc. | | | 16,184 | | | | 1,530,359 | | | |
| | | | | | | 2,529,731 | | | |
|
| Specialized Finance — 0.7% |
| | | |
CME Group Inc. | | | 11,029 | | | | 977,721 | | | |
McGraw Hill Financial Inc. | | | 7,569 | | | | 673,489 | | | |
| | | | | | | 1,651,210 | | | |
|
| Specialized REITs — 0.6% |
| | | |
American Tower Corp. | | | 12,975 | | | | 1,282,579 | | | |
| | | | | | | | | | |
| | | Number
of Shares | | | Fair
Value | | | |
|
| Specialty Chemicals — 0.1% |
| | | |
Axalta Coating Systems Ltd. | | | 11,853 | | | $ | 308,415 | | | (a) |
|
| Specialty Stores — 0.2% |
| | | |
Dick’s Sporting Goods Inc. | | | 11,173 | | | | 554,739 | | | |
|
| Systems Software — 0.2% |
| | | |
Microsoft Corp. | | | 3,604 | | | | 167,406 | | | |
Oracle Corp. | | | 8,290 | | | | 372,801 | | | |
| | | | | | | 540,207 | | | |
|
Technology Hardware, Storage &
Peripherals — 2.4% |
| | | |
Apple Inc. | | | 19,031 | | | | 2,100,642 | | | |
EMC Corp. | | | 71,725 | | | | 2,133,102 | | | |
Hewlett-Packard Co. | | | 33,880 | | | | 1,359,604 | | | |
| | | | | | | 5,593,348 | | | |
| | | |
Total Common Stock
(Cost $64,621,258) | | | | | | | 80,785,181 | | | |
Preferred Stock — 0.0%* |
|
| Diversified Banks — 0.0%* |
| | | |
Wells Fargo & Co. | | | 2,735 | | | | 70,153 | | | |
| | | |
Total Preferred Stock
(Cost $68,375) | | | | | | | 70,153 | | | |
| | | |
Total Domestic Equity
(Cost $64,689,633) | | | | | | | 80,855,334 | | | |
Foreign Equity — 19.7% |
|
| Common Stock — 19.4% |
|
| Advertising — 0.2% |
| | | |
WPP PLC | | | 23,904 | | | | 497,211 | | | |
|
| Aerospace & Defense — 0.5% |
| | | |
Airbus Group N.V. | | | 10,511 | | | | 519,643 | | | |
Safran S.A. | | | 10,221 | | | | 630,584 | | | |
Zodiac Aerospace | | | 2,149 | | | | 72,352 | | | |
| | | | | | | 1,222,579 | | | |
See Notes to Schedules of Investments and Notes to Financial Statements.
22
| | |
| Elfun Diversified Fund | | December 31, 2014 |
| | | | | | | | | | |
| | | Number
of Shares | | | Fair
Value | | | |
|
| Airlines — 0.2% |
| | | |
International Consolidated Airlines Group S.A. | | | 48,197 | | | $ | 362,981 | | | (a) |
|
| Apparel Retail — 0.2% |
| | | |
Fast Retailing Company Ltd. | | | 1,014 | | | | 368,636 | | | |
|
| Apparel, Accessories & Luxury Goods — 0.3% |
| | | |
Luxottica Group S.p.A. | | | 6,562 | | | | 359,721 | | | |
The Swatch Group AG | | | 686 | | | | 304,929 | | | |
| | | | | | | 664,650 | | | |
|
| Application Software — 0.3% |
| | | |
SAP SE | | | 10,700 | | | | 747,163 | | | |
|
| Auto Parts & Equipment — 0.4% |
| | | |
Continental AG | | | 4,014 | | | | 846,644 | | | |
|
| Automobile Manufacturers — 0.7% |
| | | |
Mazda Motor Corp. | | | 26,300 | | | | 631,004 | | | |
Toyota Motor Corp. | | | 17,530 | | | | 1,091,375 | | | |
| | | | | | | 1,722,379 | | | |
|
| Biotechnology — 0.2% |
| | | |
CSL Ltd. | | | 5,528 | | | | 389,246 | | | |
|
| Brewers — 0.4% |
| | | |
Anheuser-Busch InBev N.V. | | | 7,276 | | | | 818,851 | | | |
|
| Building Products — 0.2% |
| | | |
Assa Abloy AB, Class B | | | 9,958 | | | | 523,749 | | | |
|
| Casinos & Gaming — 0.1% |
| | | |
Sands China Ltd. | | | 25,480 | | | | 124,200 | | | |
|
| Communications Equipment — 0.4% |
| | | |
Telefonaktiebolaget LM Ericsson, Class B | | | 75,106 | | | | 905,593 | | | |
|
| Construction & Engineering — 0.1% |
| | | |
Larsen & Toubro Ltd. | | | 13,466 | | | | 317,117 | | | |
|
| Construction Materials — 0.3% |
| | | |
HeidelbergCement AG | | | 8,739 | | | | 616,797 | | | |
| | | | | | | | | | |
| | | Number
of Shares | | | Fair
Value | | | |
|
| Diversified Banks — 2.3% |
| | | |
Barclays PLC | | | 248,273 | | | $ | 933,729 | | | |
BNP Paribas S.A. | | | 12,211 | | | | 720,865 | | | |
Credit Agricole S.A. | | | 44,785 | | | | 578,108 | | | |
Grupo Financiero Banorte SAB de C.V., Class O | | | 33,803 | | | | 186,952 | | | |
HSBC Holdings PLC | | | 44,390 | | | | 419,649 | | | |
ICICI Bank Ltd. | | | 117,356 | | | | 651,507 | | | |
Intesa Sanpaolo S.p.A. | | | 195,057 | | | | 565,841 | | | |
Mitsubishi UFJ Financial Group Inc. | | | 131,400 | | | | 721,249 | | | |
Sumitomo Mitsui Financial Group Inc. | | | 17,300 | | | | 624,842 | | | |
| | | | | | | 5,402,742 | | | |
|
| Diversified Metals & Mining — 0.2% |
| | | |
BHP Billiton PLC | | | 26,220 | | | | 562,164 | | | |
|
| Diversified Real Estate Activities — 0.9% |
| | | |
Brookfield Asset Management Inc., Class A | | | 6,586 | | | | 331,048 | | | |
Mitsubishi Estate Company Ltd. | | | 34,918 | | | | 735,047 | | | |
Mitsui Fudosan Company Ltd. | | | 37,306 | | | | 999,421 | | | |
| | | | | | | 2,065,516 | | | |
|
| Electric Utilities — 0.1% |
| | | |
Power Grid Corporation of India Ltd. | | | 85,355 | | | | 185,796 | | | |
|
| Electrical Components & Equipment — 0.7% |
| | | |
Nidec Corp. | | | 16,700 | | | | 1,077,546 | | | |
Schneider Electric SE | | | 6,503 | | | | 473,608 | | | |
| | | | | | | 1,551,154 | | | |
|
| Electronic Components — 0.4% |
| | | |
Murata Manufacturing Company Ltd. | | | 7,900 | | | | 861,228 | | | |
|
| Electronic Equipment & Instruments — 0.5% |
| | | |
Hexagon AB, Class B | | | 7,643 | | | | 234,798 | | | |
Hitachi Ltd. | | | 76,500 | | | | 564,087 | | | |
Keyence Corp. | | | 900 | | | | 400,650 | | | |
| | | | | | | 1,199,535 | | | |
|
| Healthcare Services — 0.3% |
| | | |
Fresenius SE & Company KGaA | | | 12,589 | | | | 654,553 | | | |
See Notes to Schedules of Investments and Notes to Financial Statements.
23
| | |
| Elfun Diversified Fund | | December 31, 2014 |
| | | | | | | | | | |
| | | Number
of Shares | | | Fair
Value | | | |
|
| Heavy Electrical Equipment — 0.2% |
| | | |
ABB Ltd. | | | 18,733 | | | $ | 396,575 | | | |
|
| Household Products — 0.1% |
| | | |
Svenska Cellulosa AB SCA, Class B | | | 6,325 | | | | 135,789 | | | |
|
| Human Resource & Employment Services — 0.2% |
| | | |
Capita PLC | | | 22,630 | | | | 379,611 | | | |
|
| Industrial Gases — 0.3% |
| | | |
Linde AG | | | 4,248 | | | | 782,491 | | | |
|
| Industrial Machinery — 0.6% |
| | | |
FANUC Corp. | | | 4,900 | | | | 807,139 | | | |
Mitsubishi Heavy Industries Ltd. | | | 124,000 | | | | 683,648 | | | |
| | | | | | | 1,490,787 | | | |
|
| Integrated Oil & Gas — 0.8% |
| | | |
Cenovus Energy Inc. | | | 24,509 | | | | 505,376 | | | |
Cenovus Energy Inc. | | | 17,379 | | | | 359,659 | | | |
Total S.A. | | | 17,179 | | | | 880,114 | | | |
| | | | | | | 1,745,149 | | | |
|
| Internet Retail — 0.4% |
| | | |
Rakuten Inc. | | | 61,800 | | | | 858,555 | | | (a) |
|
| Internet Software & Services — 0.7% |
| | | |
Baidu Inc. ADR | | | 7,143 | | | | 1,628,390 | | | (a) |
|
| Life & Health Insurance — 0.7% |
| | | |
AIA Group Ltd. | | | 190,587 | | | | 1,047,494 | | | |
Prudential PLC | | | 26,428 | | | | 611,256 | | | |
| | | | | | | 1,658,750 | | | |
|
| Multi-Line Insurance — 0.2% |
| | | |
AXA S.A. | | | 25,496 | | | | 587,505 | | | |
|
| Oil & Gas Equipment & Services — 0.3% |
| | | |
Technip S.A. | | | 9,046 | | | | 538,848 | | | |
Weatherford International PLC | | | 12,615 | | | | 144,442 | | | (a) |
| | | | | | | 683,290 | | | |
| | | | | | | | | | |
| | | Number
of Shares | | | Fair
Value | | | |
|
| Oil & Gas Exploration & Production — 0.1% |
| | | |
Peyto Exploration & Development Corp. | | | 6,830 | | | $ | 197,367 | | | |
|
| Other Diversified Financial Services — 0.3% |
| | | |
ING Groep N.V. | | | 53,598 | | | | 692,468 | | | (a) |
|
| Packaged Foods & Meats — 0.2% |
| | | |
Nestle S.A. | | | 6,573 | | | | 479,443 | | | |
|
| Pharmaceuticals — 1.8% |
| | | |
Astellas Pharma Inc. | | | 21,700 | | | | 301,820 | | | |
Bayer AG | | | 5,800 | | | | 790,589 | | | |
GlaxoSmithKline PLC | | | 23,847 | | | | 511,817 | | | |
Roche Holding AG | | | 4,138 | | | | 1,121,779 | | | |
Sanofi | | | 10,368 | | | | 945,255 | | | |
Shire PLC | | | 3,490 | | | | 247,544 | | | |
Valeant Pharmaceuticals International Inc. | | | 2,163 | | | | 310,617 | | | (a) |
| | | | | | | 4,229,421 | | | |
|
| Property & Casualty Insurance — 0.6% |
| | | |
Insurance Australia Group Ltd. | | | 102,978 | | | | 524,121 | | | |
Tokio Marine Holdings Inc. | | | 28,500 | | | | 924,726 | | | |
| | | | | | | 1,448,847 | | | |
|
| Railroads — 0.2% |
| | | |
East Japan Railway Co. | | | 6,200 | | | | 466,851 | | | |
|
| Research & Consulting Services — 0.1% |
| | | |
Experian PLC | | | 18,868 | | | | 318,189 | | | |
|
| Semiconductor Equipment — 0.3% |
| | | |
ASML Holding N.V. | | | 7,003 | | | | 756,657 | | | |
|
| Semiconductors — 0.5% |
| | | |
Samsung Electronics Company Ltd. | | | 380 | | | | 456,853 | | | |
Taiwan Semiconductor Manufacturing Company Ltd. | | | 151,484 | | | | 667,358 | | | |
| | | | | | | 1,124,211 | | | |
|
| Specialty Chemicals — 0.3% |
| | | |
Givaudan S.A. | | | 193 | | | | 346,406 | | | |
Johnson Matthey PLC | | | 7,203 | | | | 379,113 | | | |
| | | | | | | 725,519 | | | |
See Notes to Schedules of Investments and Notes to Financial Statements.
24
| | |
| Elfun Diversified Fund | | December 31, 2014 |
| | | | | | | | | | |
| | | Number
of Shares | | | Fair
Value | | | |
|
| Wireless Telecommunication Services — 0.6% |
| | | |
SoftBank Corp. | | | 14,100 | | | $ | 838,473 | | | |
Vodafone Group PLC | | | 135,392 | | | | 464,402 | | | |
| | | | | | | 1,302,875 | | | |
| | | |
Total Common Stock
(Cost $42,032,810) | | | | | | | 44,699,224 | | | |
Preferred Stock — 0.3% |
|
| Automobile Manufacturers — 0.3% |
| | | |
Volkswagen AG | | | 3,401 | | | | 755,890 | | | |
| | | |
Total Preferred Stock
(Cost $719,978) | | | | | | | 755,890 | | | |
| | | |
Total Foreign Equity
(Cost $42,752,788) | | | | | | | 45,455,114 | | | |
| | | | | | | | | | | | |
| | | | |
| | | | | Principal
Amount | | | | | | |
Bonds and Notes — 30.8% |
|
| U.S. Treasuries — 6.4% |
| | |
U.S. Treasury Bonds | | | | | | | |
| 3.00% | | 11/15/44 | | $ | 1,358,700 | | | | 1,427,909 | | | |
U.S. Treasury Notes | | | | | | | |
| 0.50% | | 06/30/16 | | | 5,950,900 | | | | 5,952,757 | | | (h) |
| 0.88% | | 07/31/19 | | | 487,000 | | | | 471,895 | | | |
| 1.50% | | 06/30/16 - 11/30/19 | | | 5,267,300 | | | | 5,265,200 | | | |
| 2.25% | | 11/15/24 | | | 1,468,900 | | | | 1,478,770 | | | |
| | | | | | | | | 14,596,531 | | | |
|
| Agency Mortgage Backed — 9.1% |
| | | |
Federal Home Loan Mortgage Corp. | | | | | | | | | | |
| 4.00% | | 05/01/44 | | | 911,699 | | | | 978,865 | | | |
| 4.50% | | 06/01/33 - 02/01/35 | | | 5,262 | | | | 5,707 | | | |
| 5.00% | | 07/01/35 - 06/01/41 | | | 284,805 | | | | 319,765 | | | |
| 5.50% | | 05/01/20 - 04/01/39 | | | 83,278 | | | | 94,065 | | | |
| 6.00% | | 04/01/17 - 11/01/37 | | | 198,985 | | | | 226,432 | | | |
| 6.50% | | 11/01/28 - 07/01/29 | | | 8,226 | | | | 9,429 | | | |
| | | | | | | | | | | | |
| | | | | Principal
Amount | | | Fair Value | | | |
| | | | |
| 7.00% | | 10/01/16 - 08/01/36 | | $ | 28,545 | | | | 32,227 | | | |
| 7.50% | | 09/01/33 | | | 1,265 | | | | 1,353 | | | |
| 8.00% | | 07/01/26 - 11/01/30 | | | 4,455 | | | | 5,151 | | | |
| 8.50% | | 04/01/30 | | | 8,095 | | | | 10,131 | | | |
Federal National Mortgage Assoc. | | | | | | | | | | |
| 2.10% | | 04/01/37 | | | 550 | | | | 567 | | | (i) |
| 3.00% | | 02/01/43 - 06/01/43 | | | 3,565,409 | | | | 3,613,311 | | | |
| 3.50% | | 11/01/42 - 02/01/43 | | | 1,880,465 | | | | 1,964,918 | | | |
| 4.00% | | 05/01/19 - 03/01/44 | | | 1,649,835 | | | | 1,769,279 | | | |
| 4.50% | | 05/01/18 - 01/01/41 | | | 2,025,913 | | | | 2,200,516 | | | |
| 5.00% | | 07/01/20 - 06/01/41 | | | 509,886 | | | | 571,694 | | | |
| 5.50% | | 06/01/20 - 01/01/39 | | | 372,681 | | | | 416,423 | | | |
| 6.00% | | 02/01/20 - 08/01/35 | | | 240,923 | | | | 276,352 | | | |
| 6.50% | | 08/01/17 - 08/01/36 | | | 42,559 | | | | 47,444 | | | |
| 7.00% | | 01/01/16 - 12/01/33 | | | 3,368 | | | | 3,534 | | | |
| 7.50% | | 05/01/15 - 12/01/33 | | | 11,423 | | | | 12,440 | | | |
| 8.00% | | 12/01/15 - 01/01/33 | | | 12,640 | | | | 14,171 | | | |
| 9.00% | | 12/01/17 - 12/01/22 | | | 3,059 | | | | 3,340 | | | |
| 3.00% | | TBA | | | 774,000 | | | | 782,949 | | | (c) |
| 3.50% | | TBA | | | 2,329,184 | | | | 2,427,993 | | | (c) |
| 4.50% | | TBA | | | 88,000 | | | | 92,462 | | | (c) |
| 5.00% | | TBA | | | 485,000 | | | | 535,840 | | | (c) |
| 6.00% | | TBA | | | 695,000 | | | | 788,146 | | | (c) |
| 6.50% | | TBA | | | 490,000 | | | | 559,423 | | | (c) |
Government National Mortgage Assoc. | | | | | | | | | | |
| 3.00% | | 04/20/43 - 06/20/43 | | | 661,801 | | | | 677,590 | | | |
| 3.50% | | 05/20/43 | | | 639,780 | | | | 672,523 | | | |
| 4.00% | | 01/20/41 - 04/20/43 | | | 780,626 | | | | 838,899 | | | |
| 4.50% | | 08/15/33 - 03/20/41 | | | 396,695 | | | | 435,801 | | | |
| 5.00% | | 08/15/33 | | | 15,546 | | | | 17,281 | | | |
| 6.00% | | 07/15/33 - 09/15/36 | | | 14,363 | | | | 16,520 | | | |
| 6.50% | | 04/15/28 - 07/15/36 | | | 19,997 | | | | 22,868 | | | |
| 7.00% | | 04/15/28 - 10/15/36 | | | 11,199 | | | | 12,542 | | | |
| 7.50% | | 07/15/23 - 04/15/28 | | | 16,085 | | | | 16,541 | | | |
| 8.00% | | 05/15/30 | | | 490 | | | | 562 | | | |
| 8.50% | | 10/15/17 | | | 4,810 | | | | 5,104 | | | |
| 9.00% | | 11/15/16 - 12/15/21 | | | 5,529 | | | | 5,879 | | | |
| 3.00% | | TBA | | | 473,786 | | | | 484,505 | | | (c) |
| 5.50% | | TBA | | | 50,000 | | | | 55,822 | | | (c) |
| | | | | | | | | 21,026,364 | | | |
See Notes to Schedules of Investments and Notes to Financial Statements.
25
| | |
| Elfun Diversified Fund | | December 31, 2014 |
| | | | | | | | | | | | |
| | | | | Principal
Amount | | | Fair Value | | | |
|
| Agency Collateralized Mortgage Obligations — 0.1% |
| | | |
Collateralized Mortgage Obligation Trust | | | | | | | | | | |
| 0.01% | | 11/01/18 | | $ | 346 | | | $ | 344 | | | (d,f) |
| | | |
Federal Home Loan Mortgage Corp. | | | | | | | | | | |
| 0.08% | | 09/25/43 | | | 232,262 | | | | 679 | | | (g,i) |
Federal Home Loan Mortgage Corp. REMIC | | | | | | | | | | |
| 3.50% | | 11/15/24 - 11/15/30 | | | 261,938 | | | | 24,501 | | | (g) |
| 4.50% | | 03/15/18 | | | 5,296 | | | | 96 | | | (g) |
| 5.00% | | 10/15/18 | | | 4,405 | | | | 89 | | | (g) |
| 5.50% | | 06/15/33 | | | 13,840 | | | | 2,498 | | | (g) |
| 6.44% | | 08/15/25 | | | 112,588 | | | | 13,940 | | | (g,i) |
| 7.50% | | 07/15/27 | | | 10,765 | | | | 1,838 | | | (g) |
| 8.00% | | 04/15/20 | | | 171 | | | | 181 | | | |
Federal Home Loan Mortgage Corp. STRIPS | | | | | | | | | | |
| 1.47% | | 08/01/27 | | | 454 | | | | 419 | | | (d,f) |
| 8.00% | | 02/01/23 - 07/01/24 | | | 1,907 | | | | 421 | | | (g) |
Federal National Mortgage Assoc. REMIC | | | | | | | | | | |
| 0.51% | | 12/25/22 | | | 729 | | | | 711 | | | (d,f) |
| 1.24% | | 12/25/42 | | | 54,815 | | | | 2,140 | | | (g,i) |
| 5.00% | | 09/25/40 | | | 156,562 | | | | 16,463 | | | (g) |
| 5.83% | | 07/25/38 | | | 29,470 | | | | 3,665 | | | (g,i) |
| 5.93% | | 09/25/42 | | | 524,441 | | | | 94,649 | | | (g,i) |
| 7.33% | | 05/25/18 | | | 69,968 | | | | 5,774 | | | (g,i) |
| 8.00% | | 05/25/22 | | | 2 | | | | 46 | | | (g) |
Federal National Mortgage Assoc. STRIPS | | | | | | | | | | |
| 4.50% | | 08/25/35 - 01/25/36 | | | 38,414 | | | | 5,595 | | | (g) |
| 5.00% | | 03/25/38 - 05/25/38 | | | 23,325 | | | | 3,263 | | | (g) |
| 5.50% | | 12/25/33 | | | 6,381 | | | | 1,209 | | | (g) |
| 6.00% | | 01/25/35 | | | 17,130 | | | | 2,938 | | | (g) |
| 7.50% | | 11/25/23 | | | 19,207 | | | | 3,146 | | | (g) |
| 8.00% | | 08/25/23 - 07/25/24 | | | 3,894 | | | | 872 | | | (g) |
| 8.50% | | 03/25/17 - 07/25/22 | | | 1,068 | | | | 141 | | | (g) |
| 9.00% | | 05/25/22 | | | 660 | | | | 133 | | | (g) |
Government National Mortgage Assoc. | | | | | | | | | | |
| 4.50% | | 10/20/37 - 08/16/39 | | | 248,192 | | | | 20,170 | | | (g) |
| | | | | | | | | | | | |
| | | | | Principal
Amount | | | Fair Value | | | |
| | | | |
| 5.00% | | 12/20/35 - 09/20/38 | | $ | 136,964 | | | $ | 9,856 | | | (g) |
| 6.08% | | 02/20/40 | | | 442,636 | | | | 79,609 | | | (g,i) |
| | | | | | | | | 295,386 | | | |
| |
| Asset Backed — 0.0%* | | | |
| | | |
Ford Credit Auto Lease Trust 2013-A | | | | | | | | | | |
| 1.28% | | 06/15/16 | | | 30,000 | | | | 30,073 | | | |
| |
| Corporate Notes — 12.9% | | | |
| | | |
21st Century Fox America Inc. | | | | | | | | | | |
| 6.65% | | 11/15/37 | | | 55,000 | | | | 73,439 | | | (h) |
ABB Finance USA Inc. | | | | | | | | | | |
| 1.63% | | 05/08/17 | | | 76,000 | | | | 76,250 | | | (h) |
AbbVie Inc. | | | | | | | | | | |
| 1.75% | | 11/06/17 | | | 68,000 | | | | 68,148 | | | (h) |
| 2.00% | | 11/06/18 | | | 57,000 | | | | 56,809 | | | (h) |
ACCO Brands Corp. | | | | | | | | | | |
| 6.75% | | 04/30/20 | | | 97,000 | | | | 101,510 | | | (h) |
Actavis Funding SCS | | | | | | | | | | |
| 1.30% | | 06/15/17 | | | 110,000 | | | | 107,996 | | | |
| 4.85% | | 06/15/44 | | | 34,000 | | | | 34,501 | | | |
Activision Blizzard Inc. | | | | | | | | | | |
| 5.63% | | 09/15/21 | | | 98,000 | | | | 102,900 | | | (b,h) |
Aetna Inc. | | | | | | | | | | |
| 3.50% | | 11/15/24 | | | 47,000 | | | | 47,773 | | | |
Agrium Inc. | | | | | | | | | | |
| 4.90% | | 06/01/43 | | | 67,000 | | | | 69,402 | | | (h) |
Alcoa Inc. | | | | | | | | | | |
| 5.13% | | 10/01/24 | | | 20,000 | | | | 21,195 | | | |
Altria Group Inc. | | | | | | | | | | |
| 2.95% | | 05/02/23 | | | 39,000 | | | | 37,712 | | | (h) |
| 4.50% | | 05/02/43 | | | 39,000 | | | | 39,275 | | | (h) |
America Movil SAB de C.V. | | | | | | | | | | |
| 5.00% | | 03/30/20 | | | 138,000 | | | | 152,178 | | | (h) |
American Axle & Manufacturing Inc. | | | | | | | | | | |
| 6.25% | | 03/15/21 | | | 52,000 | | | | 54,600 | | | (h) |
| 6.63% | | 10/15/22 | | | 59,000 | | | | 62,540 | | | (h) |
| 7.75% | | 11/15/19 | | | 15,000 | | | | 16,800 | | | (h) |
American Campus Communities Operating Partnership LP | | | | | | | | | | |
| 4.13% | | 07/01/24 | | | 69,000 | | | | 69,695 | | | (h) |
See Notes to Schedules of Investments and Notes to Financial Statements.
26
| | |
| Elfun Diversified Fund | | December 31, 2014 |
| | | | | | | | | | | | |
| | | | | Principal
Amount | | | Fair Value | | | |
| | | |
American Electric Power Company Inc. | | | | | | | | | | |
| 2.95% | | 12/15/22 | | $ | 75,000 | | | $ | 73,570 | | | |
American Express Co. | | | | | | | | | | |
| 3.63% | | 12/05/24 | | | 93,000 | | | | 93,775 | | | |
American International Group Inc. | | | | | | | | | | |
| 3.38% | | 08/15/20 | | | 94,000 | | | | 97,647 | | | (h) |
| 4.13% | | 02/15/24 | | | 65,000 | | | | 69,193 | | | (h) |
| 4.50% | | 07/16/44 | | | 47,000 | | | | 49,656 | | | |
American Seafoods Group LLC/ American Seafoods Finance Inc. | | | | | | | | | | |
| 10.75% | | 05/15/16 | | | 125,000 | | | | 111,875 | | | (b,h) |
American Tower Corp. (REIT) | | | | | | | | | | |
| 3.40% | | 02/15/19 | | | 142,000 | | | | 144,530 | | | (h) |
| 3.50% | | 01/31/23 | | | 22,000 | | | | 21,257 | | | (h) |
Amgen Inc. | | | | | | | | | | |
| 2.20% | | 05/22/19 | | | 188,000 | | | | 187,210 | | | (h) |
Amkor Technology Inc. | | | | | | | | | | |
| 6.63% | | 06/01/21 | | | 59,000 | | | | 58,410 | | | (h) |
Anadarko Petroleum Corp. | | | | | | | | | | |
| 6.20% | | 03/15/40 | | | 67,000 | | | | 78,487 | | | (h) |
Anheuser-Busch InBev Worldwide Inc. | | | | | | | | | | |
| 2.50% | | 07/15/22 | | | 155,000 | | | | 150,642 | | | (h) |
Anthem Inc. | | | | | | | | | | |
| 3.30% | | 01/15/23 | | | 50,000 | | | | 49,951 | | | (h) |
AP Moeller - Maersk A/S | | | | | | | | | | |
| 2.55% | | 09/22/19 | | | 65,000 | | | | 65,182 | | | (b) |
| 3.75% | | 09/22/24 | | | 65,000 | | | | 66,736 | | | (b) |
Apple Inc. | | | | | | | | | | |
| 2.85% | | 05/06/21 | | | 145,000 | | | | 148,329 | | | (h) |
| 3.45% | | 05/06/24 | | | 97,000 | | | | 101,585 | | | (h) |
Aramark Services Inc. | | | | | | | | | | |
| 5.75% | | 03/15/20 | | | 135,000 | | | | 139,387 | | | (h) |
Archer-Daniels-Midland Co. | | | | | | | | | | |
| 4.02% | | 04/16/43 | | | 49,000 | | | | 49,166 | | | (h) |
Ares Capital Corp. | | | | | | | | | | |
| 3.88% | | 01/15/20 | | | 65,000 | | | | 64,813 | | | |
Ascension Health | | | | | | | | | | |
| 4.85% | | 11/15/53 | | | 65,000 | | | | 73,424 | | | |
| | | | | | | | | | | | |
| | | | | Principal
Amount | | | Fair Value | | | |
| | | |
AT&T Inc. | | | | | | | | | | |
| 2.38% | | 11/27/18 | | $ | 134,000 | | | $ | 135,038 | | | (h) |
| 4.80% | | 06/15/44 | | | 55,000 | | | | 56,043 | | | (h) |
Bank of America Corp. | | | | | | | | | | |
| 1.70% | | 08/25/17 | | | 48,000 | | | | 48,011 | | | (h) |
| 2.00% | | 01/11/18 | | | 279,000 | | | | 278,788 | | | (h) |
| 2.60% | | 01/15/19 | | | 81,000 | | | | 81,630 | | | (h) |
| 4.00% | | 04/01/24 | | | 145,000 | | | | 150,978 | | | (h) |
| 4.10% | | 07/24/23 | | | 80,000 | | | | 84,252 | | | (h) |
| 4.25% | | 10/22/26 | | | 85,000 | | | | 84,809 | | | |
Barclays Bank PLC | | | | | | | | | | |
| 2.25% | | 05/10/17 | | | 500,000 | | | | 510,108 | | | (b,h) |
Bayer US Finance LLC | | | | | | | | | | |
| 2.38% | | 10/08/19 | | | 200,000 | | | | 200,794 | | | (b) |
Baytex Energy Corp. | | | | | | | | | | |
| 5.13% | | 06/01/21 | | | 59,000 | | | | 50,150 | | | (b) |
BB&T Corp. | | | | | | | | | | |
| 2.45% | | 01/15/20 | | | 93,000 | | | | 92,621 | | | |
Bed Bath & Beyond Inc. | | | | | | | | | | |
| 3.75% | | 08/01/24 | | | 47,000 | | | | 47,648 | | | (h) |
| 4.92% | | 08/01/34 | | | 14,000 | | | | 14,446 | | | (h) |
| 5.17% | | 08/01/44 | | | 65,000 | | | | 68,009 | | | (h) |
Berkshire Hathaway Energy Co. | | | | | | | | | | |
| 6.13% | | 04/01/36 | | | 45,000 | | | | 56,535 | | | (h) |
Berkshire Hathaway Finance Corp. | | | | | | | | | | |
| 2.90% | | 10/15/20 | | | 115,000 | | | | 117,919 | | | (h) |
| 3.00% | | 05/15/22 | | | 49,000 | | | | 49,765 | | | (h) |
Berkshire Hathaway Inc. | | | | | | | | | | |
| 4.50% | | 02/11/43 | | | 134,000 | | | | 146,544 | | | (h) |
BHP Billiton Finance USA Ltd. | | | | | | | | | | |
| 5.00% | | 09/30/43 | | | 48,000 | | | | 54,409 | | | (h) |
Bombardier Inc. | | | | | | | | | | |
| 4.75% | | 04/15/19 | | | 58,000 | | | | 58,218 | | | (b,h) |
| 6.00% | | 10/15/22 | | | 96,000 | | | | 96,960 | | | (b,h) |
| 7.75% | | 03/15/20 | | | 354,000 | | | | 384,090 | | | (b,h) |
BP Capital Markets PLC | | | | | | | | | | |
| 1.38% | | 05/10/18 | | | 56,000 | | | | 55,006 | | | (h) |
| 3.81% | | 02/10/24 | | | 191,000 | | | | 192,240 | | | (h) |
Brocade Communications Systems Inc. | | | | | | | | | | |
| 4.63% | | 01/15/23 | | | 156,000 | | | | 149,760 | | | (h) |
See Notes to Schedules of Investments and Notes to Financial Statements.
27
| | |
| Elfun Diversified Fund | | December 31, 2014 |
| | | | | | | | | | | | |
| | | | | Principal
Amount | | | Fair Value | | | |
| | | |
Building Materials Corporation of America | | | | | | | | | | |
| 5.38% | | 11/15/24 | | $ | 59,000 | | | $ | 58,852 | | | (b) |
Cadence Design Systems Inc. | | | | | | | | | | |
| 4.38% | | 10/15/24 | | | 95,000 | | | | 96,524 | | | |
Calpine Corp. | | | | | | | | | | |
| 5.75% | | 01/15/25 | | | 57,000 | | | | 57,713 | | | (h) |
| 5.88% | | 01/15/24 | | | 70,000 | | | | 74,550 | | | (b,h) |
Caterpillar Inc. | | | | | | | | | | |
| 4.30% | | 05/15/44 | | | 48,000 | | | | 51,258 | | | (h) |
Catholic Health Initiatives | | | | | | | | | | |
| 2.60% | | 08/01/18 | | | 30,000 | | | | 30,392 | | | |
| 4.35% | | 11/01/42 | | | 24,000 | | | | 23,827 | | | |
CBS Corp. | | | | | | | | | | |
| 3.70% | | 08/15/24 | | | 73,000 | | | | 72,800 | | | (h) |
CCOH Safari LLC | | | | | | | | | | |
| 5.50% | | 12/01/22 | | | 39,000 | | | | 39,585 | | | |
| 5.75% | | 12/01/24 | | | 59,000 | | | | 59,664 | | | |
Cequel Capital Corp. | | | | | | | | | | |
| 5.13% | | 12/15/21 | | | 115,000 | | | | 111,550 | | | (b,h) |
CF Industries Inc. | | | | | | | | | | |
| 5.38% | | 03/15/44 | | | 48,000 | | | | 51,787 | | | (h) |
Chesapeake Energy Corp. | | | | | | | | | | |
| 3.25% | | 03/15/16 | | | 46,000 | | | | 45,885 | | | (h) |
| 5.38% | | 06/15/21 | | | 98,000 | | | | 97,939 | | | (h) |
Citigroup Inc. | | | | | | | | | | |
| 1.75% | | 05/01/18 | | | 228,000 | | | | 225,332 | | | (h) |
| 5.50% | | 09/13/25 | | | 140,000 | | | | 154,911 | | | (h) |
CMS Energy Corp. | | | | | | | | | | |
| 4.88% | | 03/01/44 | | | 47,000 | | | | 51,418 | | | (h) |
CNA Financial Corp. | | | | | | | | | | |
| 5.88% | | 08/15/20 | | | 60,000 | | | | 68,492 | | | (h) |
Cogeco Cable Inc. | | | | | | | | | | |
| 4.88% | | 05/01/20 | | | 75,000 | | | | 75,000 | | | (b,h) |
Comcast Corp. | | | | | | | | | | |
| 4.20% | | 08/15/34 | | | 48,000 | | | | 50,191 | | | (h) |
| 4.75% | | 03/01/44 | | | 47,000 | | | | 52,376 | | | (h) |
ConocoPhillips Co. | | | | | | | | | | |
| 3.35% | | 11/15/24 | | | 94,000 | | | | 94,973 | | | |
Constellation Brands Inc. | | | | | | | | | | |
| 7.25% | | 09/01/16 | | | 74,000 | | | | 79,920 | | | (h) |
Continental Resources Inc. | | | | | | | | | | |
| 4.90% | | 06/01/44 | | | 46,000 | | | | 39,866 | | | |
| | | | | | | | | | | | |
| | | | | Principal
Amount | | | Fair Value | | | |
| | | |
Corp Andina de Fomento | | | | | | | | | | |
| 4.38% | | 06/15/22 | | $ | 121,000 | | | $ | 130,058 | | | (h) |
Corporate Office Properties LP (REIT) | | | | | | | | | | |
| 3.60% | | 05/15/23 | | | 114,000 | | | | 109,536 | | | (h) |
| 3.70% | | 06/15/21 | | | 46,000 | | | | 45,801 | | | (h) |
Cott Beverages Inc. | | | | | | | | | | |
| 5.38% | | 07/01/22 | | | 59,000 | | | | 54,133 | | | (b) |
COX Communications Inc. | | | | | | | | | | |
| 4.70% | | 12/15/42 | | | 17,000 | | | | 16,985 | | | (b,h) |
Crown Americas LLC/Crown Americas Capital Corp. IV | | | | | | | | | | |
| 4.50% | | 01/15/23 | | | 38,000 | | | | 36,860 | | | (h) |
CSX Corp. | | | | | | | | | | |
| 4.50% | | 08/01/54 | | | 48,000 | | | | 50,271 | | | (h) |
CVS Health Corp. | | | | | | | | | | |
| 2.25% | | 08/12/19 | | | 143,000 | | | | 142,403 | | | (h) |
Daimler Finance North America LLC | | | | | | | | | | |
| 2.38% | | 08/01/18 | | | 150,000 | | | | 152,104 | | | (b,h) |
DaVita HealthCare Partners Inc. | | | | | | | | | | |
| 5.13% | | 07/15/24 | | | 39,000 | | | | 39,780 | | | (h) |
Denbury Resources Inc. | | | | | | | | | | |
| 6.38% | | 08/15/21 | | | 99,000 | | | | 94,050 | | | (h) |
Dexia Credit Local S.A. | | | | | | | | | | |
| 2.25% | | 01/30/19 | | | 250,000 | | | | 253,156 | | | (b,h) |
Diageo Capital PLC | | | | | | | | | | |
| 1.13% | | 04/29/18 | | | 108,000 | | | | 105,683 | | | (h) |
Diageo Investment Corp. | | | | | | | | | | |
| 2.88% | | 05/11/22 | | | 105,000 | | | | 104,937 | | | (h) |
DigitalGlobe Inc. | | | | | | | | | | |
| 5.25% | | 02/01/21 | | | 131,000 | | | | 124,450 | | | (b,h) |
DIRECTV Holdings LLC | | | | | | | | | | |
| 4.45% | | 04/01/24 | | | 72,000 | | | | 75,334 | | | (h) |
| 5.15% | | 03/15/42 | | | 86,000 | | | | 88,869 | | | (h) |
Dollar General Corp. | | | | | | | | | | |
| 1.88% | | 04/15/18 | | | 95,000 | | | | 91,798 | | | |
| 4.13% | | 07/15/17 | | | 94,000 | | | | 96,944 | | | (h) |
Dominion Resources Inc. | | | | | | | | | | |
| 1.95% | | 08/15/16 | | | 154,000 | | | | 155,654 | | | (h) |
Duke Energy Corp. | | | | | | | | | | |
| 3.75% | | 04/15/24 | | | 89,000 | | | | 92,580 | | | (h) |
Duke Energy Progress Inc. | | | | | | | | | | |
| 4.15% | | 12/01/44 | | | 30,000 | | | | 31,890 | | | |
See Notes to Schedules of Investments and Notes to Financial Statements.
28
| | |
| Elfun Diversified Fund | | December 31, 2014 |
| | | | | | | | | | | | |
| | | | | Principal
Amount | | | Fair Value | | | |
| | | |
Eaton Corp. | | | | | | | | | | |
| 2.75% | | 11/02/22 | | $ | 94,000 | | | $ | 92,345 | | | (h) |
Ecopetrol S.A. | | | | | | | | | | |
| 5.88% | | 05/28/45 | | | 24,000 | | | | 22,200 | | | (h) |
El Paso Pipeline Partners Operating Company LLC | | | | | | | | | | |
| 4.30% | | 05/01/24 | | | 97,000 | | | | 97,188 | | | (h) |
Electricite de France S.A. | | | | | | | | | | |
| 2.15% | | 01/22/19 | | | 193,000 | | | | 193,475 | | | (b,h) |
Energy Transfer Equity LP | | | | | | | | | | |
| 5.88% | | 01/15/24 | | | 194,000 | | | | 196,910 | | | (h) |
Energy Transfer Partners LP | | | | | | | | | | |
| 6.50% | | 02/01/42 | | | 62,000 | | | | 71,266 | | | (h) |
Ensco PLC | | | | | | | | | | |
| 4.50% | | 10/01/24 | | | 93,000 | | | | 90,394 | | | |
| 5.75% | | 10/01/44 | | | 45,000 | | | | 45,152 | | | |
Enterprise Products Operating LLC | | | | | | | | | | |
| 3.75% | | 02/15/25 | | | 74,000 | | | | 74,282 | | | |
ERP Operating LP | | | | | | | | | | |
| 4.50% | | 07/01/44 | | | 55,000 | | | | 57,321 | | | (h) |
European Investment Bank | | | | | | | | | | |
| 4.88% | | 01/17/17 | | | 150,000 | | | | 162,129 | | | (h) |
Express Scripts Holding Co. | | | | | | | | | | |
| 2.25% | | 06/15/19 | | | 94,000 | | | | 92,993 | | | (h) |
Five Corners Funding Trust | | | | | | | | | | |
| 4.42% | | 11/15/23 | | | 200,000 | | | | 211,484 | | | (b,h) |
Florida Power & Light Co. | | | | | | | | | | |
| 4.13% | | 02/01/42 | | | 92,000 | | | | 98,230 | | | (h) |
Forest Laboratories Inc. | | | | | | | | | | |
| 5.00% | | 12/15/21 | | | 95,000 | | | | 102,868 | | | (b,h) |
Freeport-McMoRan Inc. | | | | | | | | | | |
| 5.45% | | 03/15/43 | | | 34,000 | | | | 32,150 | | | (h) |
Fresenius Medical Care US Finance Inc. | | | | | | | | | | |
| 5.75% | | 02/15/21 | | | 123,000 | | | | 131,149 | | | (b,h) |
Frontier Communications Corp. | | | | | | | | | | |
| 7.13% | | 03/15/19 | | | 71,000 | | | | 77,745 | | | (h) |
General Motors Co. | | | | | | | | | | |
| 4.88% | | 10/02/23 | | | 36,000 | | | | 38,520 | | | (h) |
| 5.00% | | 04/01/35 | | | 98,000 | | | | 102,125 | | | |
General Motors Financial Company Inc. | | | | | | | | | | |
| 2.63% | | 07/10/17 | | | 38,000 | | | | 38,165 | | | (h) |
| 3.00% | | 09/25/17 | | | 58,000 | | | | 58,654 | | | |
| | | | | | | | | | | | |
| | | | | Principal
Amount | | | Fair Value | | | |
| | | | |
| 3.50% | | 07/10/19 | | $ | 38,000 | | | $ | 38,803 | | | (h) |
| 4.38% | | 09/25/21 | | | 97,000 | | | | 101,244 | | | |
Georgia-Pacific LLC | | | | | | | | | | |
| 3.60% | | 03/01/25 | | | 140,000 | | | | 140,598 | | | (b) |
Gilead Sciences Inc. | | | | | | | | | | |
| 4.80% | | 04/01/44 | | | 102,000 | | | | 113,144 | | | (h) |
Glencore Funding LLC | | | | | | | | | | |
| 2.50% | | 01/15/19 | | | 51,000 | | | | 50,218 | | | (b,h) |
| 4.13% | | 05/30/23 | | | 104,000 | | | | 101,479 | | | (b,h) |
| 4.63% | | 04/29/24 | | | 105,000 | | | | 105,504 | | | (b,h) |
HCA Inc. | | | | | | | | | | |
| 4.75% | | 05/01/23 | | | 160,000 | | | | 162,800 | | | (h) |
| 6.50% | | 02/15/20 | | | 138,000 | | | | 154,629 | | | (h) |
Hewlett-Packard Co. | | | | | | | | | | |
| 2.75% | | 01/14/19 | | | 195,000 | | | | 195,249 | | | (h) |
Hexion US Finance Corp. | | | | | | | | | | |
| 6.63% | | 04/15/20 | | | 127,000 | | | | 124,460 | | | (h) |
Hughes Satellite Systems Corp. | | | | | | | | | | |
| 6.50% | | 06/15/19 | | | 33,000 | | | | 35,393 | | | (h) |
Humana Inc. | | | | | | | | | | |
| 3.85% | | 10/01/24 | | | 95,000 | | | | 96,252 | | | |
Huntsman International LLC | | | | | | | | | | |
| 4.88% | | 11/15/20 | | | 77,000 | | | | 76,422 | | | (h) |
Hyundai Capital America | | | | | | | | | | |
| 2.13% | | 10/02/17 | | | 35,000 | | | | 35,171 | | | (b,h) |
Illinois Tool Works Inc. | | | | | | | | | | |
| 3.50% | | 03/01/24 | | | 95,000 | | | | 98,884 | | | (h) |
Ingersoll-Rand Luxembourg Finance S.A. | | | | | | | | | | |
| 3.55% | | 11/01/24 | | | 65,000 | | | | 64,604 | | | |
Ingles Markets Inc. | | | | | | | | | | |
| 5.75% | | 06/15/23 | | | 53,000 | | | | 53,218 | | | (h) |
Intelsat Jackson Holdings S.A. | | | | | | | | | | |
| 5.50% | | 08/01/23 | | | 96,000 | | | | 95,414 | | | (h) |
Invesco Finance PLC | | | |
| 3.13% | | 11/30/22 | | | 107,000 | | | | 106,044 | | | (h) |
Iron Mountain Inc. | | | |
| 6.00% | | 08/15/23 | | | 96,000 | | | | 99,840 | | | (h) |
JB Poindexter & Company Inc. | | | |
| 9.00% | | 04/01/22 | | | 23,000 | | | | 24,840 | | | (b,h) |
JBS USA LLC/JBS USA Finance Inc. | | | |
| 5.88% | | 07/15/24 | | | 53,000 | | | | 52,073 | | | (b,h) |
Jefferies Group Inc. | | | |
| 5.13% | | 01/20/23 | | | 83,000 | | | | 84,371 | | | (h) |
| 6.50% | | 01/20/43 | | | 26,000 | | | | 26,522 | | | (h) |
See Notes to Schedules of Investments and Notes to Financial Statements.
29
| | |
| Elfun Diversified Fund | | December 31, 2014 |
| | | | | | | | | | | | |
| | | | | Principal
Amount | | | Fair Value | | | |
| |
John Deere Capital Corp. | | | |
| 3.35% | | 06/12/24 | | $ | 92,000 | | | $ | 94,293 | | | (h) |
Johnson Controls Inc. | | | |
| 4.63% | | 07/02/44 | | | 46,000 | | | | 47,338 | | | (h) |
JPMorgan Chase & Co. | | | |
| 3.88% | | 09/10/24 | | | 140,000 | | | | 140,119 | | | (h) |
| 5.00% | | 12/29/49 | | | 68,000 | | | | 66,534 | | | (h,i) |
| 6.10% | | 10/29/49 | | | 110,000 | | | | 109,725 | | | (i) |
KB Home | | | |
| 7.00% | | 12/15/21 | | | 96,000 | | | | 100,980 | | | (h) |
Kerr-McGee Corp. | | | |
| 6.95% | | 07/01/24 | | | 30,000 | | | | 36,667 | | | (h) |
| Keysight Technologies Inc. | | | | | | | |
| 4.55% | | 10/30/24 | | | 95,000 | | | | 95,038 | | | (b) |
KFW | | | |
| 2.00% | | 10/04/22 | | | 246,000 | | | | 242,332 | | | (h) |
| 4.50% | | 07/16/18 | | | 102,000 | | | | 112,697 | | | (h) |
Kilroy Realty LP | | | |
| 4.25% | | 08/15/29 | | | 48,000 | | | | 48,004 | | | (h) |
Kinder Morgan Energy Partners LP | | | |
| 3.50% | | 09/01/23 | | | 69,000 | | | | 65,505 | | | (h) |
Kinder Morgan Inc. | | | |
| 3.05% | | 12/01/19 | | | 49,000 | | | | 48,610 | | | |
| 5.63% | | 11/15/23 | | | 135,000 | | | | 144,508 | | | (b,h) |
Kinross Gold Corp. | | | |
| 5.95% | | 03/15/24 | | | 47,000 | | | | 44,102 | | | (b,h) |
| 6.88% | | 09/01/41 | | | 5,000 | | | | 4,754 | | | (h) |
Korea National Oil Corp. | | | |
| 2.88% | | 11/09/15 | | | 100,000 | | | | 101,445 | | | (b,h) |
L Brands Inc. | | | |
| 5.63% | | 02/15/22 | | | 96,000 | | | | 103,200 | | | (h) |
L-3 Communications Corp. | | | |
| 1.50% | | 05/28/17 | | | 65,000 | | | | 64,361 | | | (h) |
| 3.95% | | 05/28/24 | | | 34,000 | | | | 34,281 | | | (h) |
Lamar Media Corp. | | | |
| 5.00% | | 05/01/23 | | | 96,000 | | | | 95,040 | | | (h) |
Land O’ Lakes Inc. | | | |
| 6.00% | | 11/15/22 | | | 27,000 | | | | 28,890 | | | (b,h) |
Lear Corp. | | | |
| 5.25% | | 01/15/25 | | | 98,000 | | | | 99,225 | | | |
Lennar Corp. | | | |
| 4.50% | | 11/15/19 | | | 59,000 | | | | 58,557 | | | |
Liberty Mutual Group Inc. | | | |
| 4.25% | | 06/15/23 | | | 87,000 | | | | 89,652 | | | (b,h) |
| | | | | | | | | | | | |
| | | | | Principal
Amount | | | Fair Value | | | |
| |
Linn Energy LLC | | | |
| 6.25% | | 11/01/19 | | $ | 40,000 | | | $ | 33,800 | | | (h) |
Macquarie Bank Ltd. | | | |
| 2.60% | | 06/24/19 | | | 47,000 | | | | 47,394 | | | (b,h) |
Macy’s Retail Holdings Inc. | | | |
| 4.50% | | 12/15/34 | | | 94,000 | | | | 94,653 | | | |
Marathon Petroleum Corp. | | | |
| 3.63% | | 09/15/24 | | | 95,000 | | | | 93,100 | | | (h) |
| 4.75% | | 09/15/44 | | | 73,000 | | | | 68,942 | | | (h) |
MarkWest Energy Partners LP/ MarkWest Energy Finance Corp. | | | | | | | | | | |
| 4.88% | | 12/01/24 | | | 39,000 | | | | 38,123 | | | |
| 5.50% | | 02/15/23 | | | 40,000 | | | | 40,500 | | | (h) |
| Marsh & McLennan Companies Inc. | | | |
| 3.50% | | 03/10/25 | | | 95,000 | | | | 95,604 | | | (h) |
| Mattel Inc. | | | |
| 2.35% | | 05/06/19 | | | 143,000 | | | | 142,494 | | | (h) |
Medtronic Inc. | | | |
| 2.50% | | 03/15/20 | | | 75,000 | | | | 75,197 | | | (b) |
| 3.50% | | 03/15/25 | | | 93,000 | | | | 95,136 | | | (b) |
| 4.63% | | 03/15/45 | | | 45,000 | | | | 48,780 | | | (b) |
MEG Energy Corp. | | | |
| 6.50% | | 03/15/21 | | | 58,000 | | | | 52,925 | | | (b,h) |
Memorial Sloan-Kettering Cancer Center | | | | | | | | | | |
| 4.13% | | 07/01/52 | | | 30,000 | | | | 29,826 | | | (h) |
MetLife Inc. | | | |
| 4.72% | | 12/15/44 | | | 37,000 | | | | 41,154 | | | |
MGM Resorts International | | | |
| 5.25% | | 03/31/20 | | | 98,000 | | | | 97,265 | | | |
Mizuho Bank Ltd. | | | |
| 2.45% | | 04/16/19 | | | 200,000 | | | | 198,699 | | | (b,h) |
Monsanto Co. | | | |
| 3.38% | | 07/15/24 | | | 45,000 | | | | 45,723 | | | (h) |
| 4.70% | | 07/15/64 | | | 27,000 | | | | 28,310 | | | (h) |
Morgan Stanley | | | |
| 2.13% | | 04/25/18 | | | 149,000 | | | | 149,086 | | | (h) |
| 2.38% | | 07/23/19 | | | 143,000 | | | | 142,473 | | | (h) |
| 3.70% | | 10/23/24 | | | 95,000 | | | | 96,294 | | | |
| 4.10% | | 05/22/23 | | | 111,000 | | | | 112,381 | | | (h) |
| 4.35% | | 09/08/26 | | | 75,000 | | | | 75,448 | | | (h) |
| 4.88% | | 11/01/22 | | | 75,000 | | | | 79,656 | | | (h) |
| 5.00% | | 11/24/25 | | | 60,000 | | | | 64,027 | | | (h) |
See Notes to Schedules of Investments and Notes to Financial Statements.
30
| | |
| Elfun Diversified Fund | | December 31, 2014 |
| | | | | | | | | | | | |
| | | | | Principal
Amount | | | Fair Value | | | |
| |
Motorola Solutions Inc. | | | |
| 4.00% | | 09/01/24 | | $ | 95,000 | | | $ | 95,572 | | | (h) |
Mylan Inc. | | | |
| 7.88% | | 07/15/20 | | | 23,000 | | | | 24,499 | | | (b,h) |
National Retail Properties Inc. | | | |
| 3.90% | | 06/15/24 | | | 77,000 | | | | 78,530 | | | (h) |
NCL Corporation Ltd. | | | |
| 5.00% | | 02/15/18 | | | 7,000 | | | | 7,000 | | | (h) |
Newfield Exploration Co. | | | |
| 5.63% | | 07/01/24 | | | 36,000 | | | | 35,618 | | | (h) |
| 5.75% | | 01/30/22 | | | 126,000 | | | | 124,740 | | | (h) |
Newmont Mining Corp. | | | |
| 4.88% | | 03/15/42 | | | 37,000 | | | | 32,227 | | | (h) |
Nexen Energy ULC | | | |
| 6.40% | | 05/15/37 | | | 41,000 | | | | 51,067 | | | (h) |
Noble Energy Inc. | | | |
| 3.90% | | 11/15/24 | | | 56,000 | | | | 55,347 | | | |
NRG Energy Inc. | | | |
| 6.25% | | 07/15/22 | | | 98,000 | | | | 100,205 | | | |
Omnicom Group Inc. | | | |
| 3.63% | | 05/01/22 | | | 31,000 | | | | 31,824 | | | (h) |
Oracle Corp. | | | |
| 2.25% | | 10/08/19 | | | 187,000 | | | | 188,336 | | | (h) |
| 3.63% | | 07/15/23 | | | 62,000 | | | | 65,020 | | | (h) |
| 4.50% | | 07/08/44 | | | 46,000 | | | | 49,964 | | | (h) |
Outfront Media Capital LLC/ Outfront Media Capital Corp. | | | | | | | | | | |
| 5.63% | | 02/15/24 | | | 58,000 | | | | 58,290 | | | (b,h) |
Owens & Minor Inc. | | | |
| 3.88% | | 09/15/21 | | | 95,000 | | | | 96,075 | | | |
Owens-Brockway Glass Container Inc. | | | | | | | | | | |
| 5.00% | | 01/15/22 | | | 39,000 | | | | 39,780 | | | (b) |
| 5.38% | | 01/15/25 | | | 20,000 | | | | 20,200 | | | (b) |
Pacific Gas & Electric Co. | | | |
| 3.40% | | 08/15/24 | | | 140,000 | | | | 141,674 | | | |
PacifiCorp | | | |
| 6.25% | | 10/15/37 | | | 132,000 | | | | 178,635 | | | (h) |
| PepsiCo Inc. | | | |
| 4.25% | | 10/22/44 | | | 56,000 | | | | 58,444 | | | |
Petrobras International Finance Company S.A. | | | | | | | | | | |
| 3.50% | | 02/06/17 | | | 76,000 | | | | 72,573 | | | (h) |
| 3.88% | | 01/27/16 | | | 34,000 | | | | 33,364 | | | (h) |
| | | | | | | | | | | | |
| | | | | Principal
Amount | | | Fair Value | | | |
| |
Petroleos Mexicanos | | | |
| 3.50% | | 01/30/23 | | $ | 41,000 | | | $ | 39,217 | | | (h) |
Philip Morris International Inc. | | | |
| 4.13% | | 03/04/43 | | | 39,000 | | | | 38,230 | | | (h) |
Pitney Bowes Inc. | | | |
| 4.63% | | 03/15/24 | | | 90,000 | | | | 92,125 | | | (h) |
PNC Bank NA | | | |
| 2.40% | | 10/18/19 | | | 260,000 | | | | 261,092 | | | |
Post Holdings Inc. | | | |
| 6.75% | | 12/01/21 | | | 59,000 | | | | 57,230 | | | (b) |
Prudential Financial Inc. | | | |
| 5.63% | | 06/15/43 | | | 46,000 | | | | 47,026 | | | (h,i) |
Public Service Electric & Gas Co. | | | |
| 2.38% | | 05/15/23 | | | 117,000 | | | | 112,520 | | | (h) |
Range Resources Corp. | | | | | | | | | | |
| 5.75% | | 06/01/21 | | | 49,000 | | | | 50,593 | | | (h) |
Raytheon Co. | | | | | | | | | | |
| 4.20% | | 12/15/44 | | | 35,000 | | | | 36,354 | | | |
Regency Energy Partners LP/ Regency Energy Finance Corp. | | | | | | | | | | |
| 5.00% | | 10/01/22 | | | 131,000 | | | | 123,795 | | | (h) |
Revlon Consumer Products Corp. | | | | | | | | | | |
| 5.75% | | 02/15/21 | | | 50,000 | | | | 50,000 | | | (h) |
Roche Holdings Inc. | | | | | | | | | | |
| 2.25% | | 09/30/19 | | | 286,000 | | | | 287,812 | | | (b) |
Rockwood Specialties Group Inc. | | | | | | | | | | |
| 4.63% | | 10/15/20 | | | 230,000 | | | | 237,475 | | | |
Rowan Companies Inc. | | | | | | | | | | |
| 4.75% | | 01/15/24 | | | 68,000 | | | | 64,183 | | | (h) |
| 5.85% | | 01/15/44 | | | 19,000 | | | | 17,522 | | | (h) |
Royal Bank of Canada | | | | | | | | | | |
| 1.20% | | 09/19/18 | | | 323,000 | | | | 321,156 | | | (h) |
RSI Home Products Inc. | | | | | | | | | | |
| 6.88% | | 03/01/18 | | | 75,000 | | | | 78,375 | | | (b,h) |
Ryder System Inc. | | | | | | | | | | |
| 2.45% | | 09/03/19 | | | 116,000 | | | | 115,183 | | | (h) |
Sabine Pass Liquefaction LLC | | | | | | | | | | |
| 5.63% | | 02/01/21 | | | 115,000 | | | | 112,987 | | | (h) |
Schaeffler Holding Finance BV | | | | | | | | | | |
| 6.25% | | Cash/7.00% PIK 11/15/19 | | | 200,000 | | | | 206,000 | | | (b,p) |
| 6.88% | | Cash/7.63% PIK 08/15/18 | | | 200,000 | | | | 208,500 | | | (b,h,p) |
Scripps Networks Interactive Inc. | | | | | | | | | | |
| 2.75% | | 11/15/19 | | | 45,000 | | | | 45,188 | | | |
See Notes to Schedules of Investments and Notes to Financial Statements.
31
| | |
| Elfun Diversified Fund | | December 31, 2014 |
| | | | | | | | | | | | |
| | | | | Principal
Amount | | | Fair Value | | | |
| | | |
Seagate HDD Cayman | | | | | | | | | | |
| 4.75% | | 01/01/25 | | $ | 71,000 | | | $ | 73,142 | | | (b,h) |
Sealed Air Corp. | | | | | | | | | | |
| 4.88% | | 12/01/22 | | | 20,000 | | | | 19,850 | | | (b) |
| 5.13% | | 12/01/24 | | | 20,000 | | | | 20,200 | | | (b) |
Shell International Finance BV | | | | | | | | | | |
| 3.40% | | 08/12/23 | | | 141,000 | | | | 145,527 | | | (h) |
Sinclair Television Group Inc. | | | | | | | | | | |
| 5.38% | | 04/01/21 | | | 44,000 | | | | 43,670 | | | |
Sinopec Capital 2013 Ltd. | | | | | | | | | | |
| 3.13% | | 04/24/23 | | | 200,000 | | | | 190,679 | | | (b,h) |
Spectra Energy Partners LP | | | | | | | | | | |
| 4.75% | | 03/15/24 | | | 95,000 | | | | 101,832 | | | (h) |
Sprint Corp. | | | | | | | | | | |
| 7.25% | | 09/15/21 | | | 52,000 | | | | 51,545 | | | |
Statoil ASA | | | | | | | | | | |
| 3.70% | | 03/01/24 | | | 143,000 | | | | 148,053 | | | (h) |
| 4.80% | | 11/08/43 | | | 48,000 | | | | 54,574 | | | (h) |
Steel Dynamics Inc. | | | | | | | | | | |
| 5.13% | | 10/01/21 | | | 58,000 | | | | 59,087 | | | (b,h) |
Sysco Corp. | | | | | | | | | | |
| 2.35% | | 10/02/19 | | | 95,000 | | | | 95,517 | | | |
| 3.50% | | 10/02/24 | | | 65,000 | | | | 66,886 | | | |
| 4.35% | | 10/02/34 | | | 35,000 | | | | 37,681 | | | |
T-Mobile USA Inc. | | | | | | | | | | |
| 6.25% | | 04/01/21 | | | 50,000 | | | | 51,175 | | | (h) |
Talisman Energy Inc. | | | | | | | | | | |
| 6.25% | | 02/01/38 | | | 33,000 | | | | 33,502 | | | (h) |
| Tampa Electric Co. | | | | | | | | | | |
| 4.35% | | 05/15/44 | | | 47,000 | | | | 50,116 | | | (h) |
Tanger Properties LP | | | | | | | | | | |
| 3.75% | | 12/01/24 | | | 45,000 | | | | 45,349 | | | |
Targa Resources Partners LP/ Targa Resources Partners Finance Corp. | | | | | | | | | | |
| 4.13% | | 11/15/19 | | | 100,000 | | | | 96,250 | | | (b) |
Target Corp. | | | | | | | | | | |
| 3.50% | | 07/01/24 | | | 106,000 | | | | 110,046 | | | (h) |
Teachers Insurance & Annuity Association of America | | | | | | | | | | |
| 4.90% | | 09/15/44 | | | 95,000 | | | | 105,863 | | | (b) |
Teck Resources Ltd. | | | | | | | | | | |
| 3.75% | | 02/01/23 | | | 89,000 | | | | 79,770 | | | (h) |
| 5.40% | | 02/01/43 | | | 39,000 | | | | 32,963 | | | (h) |
| | | | | | | | | | | | |
| | | | | Principal
Amount | | | Fair Value | | | |
| | | |
Tenet Healthcare Corp. | | | | | | | | | | |
| 4.75% | | 06/01/20 | | $ | 196,000 | | | $ | 198,940 | | | (h) |
| 6.00% | | 10/01/20 | | | 96,000 | | | | 103,088 | | | (h) |
Textron Inc. | | | | | | | | | | |
| 6.20% | | 03/15/15 | | | 62,000 | | | | 62,620 | | | (h) |
The Allstate Corp. | | | | | | | | | | |
| 5.75% | | 08/15/53 | | | 52,000 | | | | 54,795 | | | (h,i) |
The Bank of Tokyo-Mitsubishi UFJ Ltd. | | | | | | | | | | |
| 2.35% | | 09/08/19 | | | 210,000 | | | | 208,604 | | | (b,h) |
The Boeing Co. | | | | | | | | | | |
| 2.85% | | 10/30/24 | | | 65,000 | | | | 64,591 | | | |
| The Dow Chemical Co. | | | | | | | | | | |
| 3.50% | | 10/01/24 | | | 185,000 | | | | 183,125 | | | |
| 4.25% | | 10/01/34 | | | 90,000 | | | | 88,393 | | | |
The Goldman Sachs Group Inc. | | | | | | | | | | |
| 2.38% | | 01/22/18 | | | 92,000 | | | | 92,929 | | | (h) |
| 2.63% | | 01/31/19 | | | 146,000 | | | | 146,891 | | | (h) |
| 2.90% | | 07/19/18 | | | 62,000 | | | | 63,605 | | | (h) |
| 4.00% | | 03/03/24 | | | 113,000 | | | | 117,311 | | | (h) |
| 4.80% | | 07/08/44 | | | 55,000 | | | | 58,909 | | | (h) |
The Korea Development Bank | | | | | | | | | | |
| 3.25% | | 03/09/16 | | | 122,000 | | | | 124,874 | | | (h) |
The Kroger Co. | | | | | | | | | | |
| 2.95% | | 11/01/21 | | | 65,000 | | | | 64,467 | | | |
The Timken Co. | | | | | | | | | | |
| 3.88% | | 09/01/24 | | | 73,000 | | | | 72,887 | | | (b,h) |
The Williams Companies Inc. | | | | | | | | | | |
| 4.55% | | 06/24/24 | | | 30,000 | | | | 27,899 | | | (h) |
| 5.75% | | 06/24/44 | | | 93,000 | | | | 80,897 | | | (h) |
| 8.75% | | 03/15/32 | | | 36,000 | | | | 42,014 | | | (h) |
TIAA Asset Management Finance Company LLC | | | | | | | | | | |
| 4.13% | | 11/01/24 | | | 95,000 | | | | 97,320 | | | (b) |
Time Inc. | | | | | | | | | | |
| 5.75% | | 04/15/22 | | | 99,000 | | | | 95,782 | | | (b,h) |
Time Warner Cable Inc. | | | | | | | | | | |
| 6.55% | | 05/01/37 | | | 28,000 | | | | 36,050 | | | (h) |
Time Warner Inc. | | | | | | | | | | |
| 5.35% | | 12/15/43 | | | 85,000 | | | | 96,541 | | | (h) |
Tops Holding Corp. | | | | | | | | | | |
| 8.88% | | 12/15/17 | | | 24,000 | | | | 24,480 | | | (h) |
Tyco Electronics Group S.A. | | | | | | | | | | |
| 2.35% | | 08/01/19 | | | 95,000 | | | | 94,913 | | | (h) |
See Notes to Schedules of Investments and Notes to Financial Statements.
32
| | |
| Elfun Diversified Fund | | December 31, 2014 |
| | | | | | | | | | | | |
| | | | | Principal
Amount | | | Fair Value | | | |
| | | |
Tyson Foods Inc. | | | | | | | | | | |
| 2.65% | | 08/15/19 | | $ | 48,000 | | | $ | 48,437 | | | (h) |
| 3.95% | | 08/15/24 | | | 32,000 | | | | 33,079 | | | (h) |
| 5.15% | | 08/15/44 | | | 32,000 | | | | 35,942 | | | (h) |
U.S. Bancorp | | | | | | | | | | |
| 3.44% | | 02/01/16 | | | 118,000 | | | | 120,817 | | | (h) |
Ultra Petroleum Corp. | | | | | | | | | | |
| 6.13% | | 10/01/24 | | | 99,000 | | | | 85,140 | | | (b) |
Unit Corp. | | | | | | | | | | |
| 6.63% | | 05/15/21 | | | 73,000 | | | | 65,335 | | | (h) |
United Rentals North America Inc. | | | | | | | | | | |
| 5.75% | | 07/15/18 | | | 74,000 | | | | 77,145 | | | (h) |
| 6.13% | | 06/15/23 | | | 38,000 | | | | 39,900 | | | (h) |
UnitedHealth Group Inc. | | | | | | | | | | |
| 2.30% | | 12/15/19 | | | 93,000 | | | | 93,384 | | | |
Vail Resorts Inc. | | | | | | | | | | |
| 6.50% | | 05/01/19 | | | 45,000 | | | | 46,575 | | | (h) |
Valeant Pharmaceuticals International Inc. | | | | | | | | | | |
| 6.38% | | 10/15/20 | | | 71,000 | | | | 74,195 | | | (b,h) |
| 6.75% | | 08/15/18 | | | 69,000 | | | | 73,400 | | | (b,h) |
Verizon Communications Inc. | | | | | | | | | | |
| 1.35% | | 06/09/17 | | | 230,000 | | | | 228,936 | | | (h) |
| 3.50% | | 11/01/24 | | | 93,000 | | | | 91,372 | | | |
| 4.15% | | 03/15/24 | | | 93,000 | | | | 96,277 | | | |
| 4.40% | | 11/01/34 | | | 47,000 | | | | 46,717 | | | |
| 5.05% | | 03/15/34 | | | 29,000 | | | | 30,935 | | | (h) |
| 5.15% | | 09/15/23 | | | 113,000 | | | | 124,778 | | | (h) |
| 6.55% | | 09/15/43 | | | 53,000 | | | | 67,901 | | | (h) |
Viasystems Inc. | | | | | | | | | | |
| 7.88% | | 05/01/19 | | | 44,000 | | | | 46,420 | | | (b,h) |
Volkswagen Group of America Finance LLC | | | | | | | | | | |
| 2.13% | | 05/23/19 | | | 234,000 | | | | 232,772 | | | (b,h) |
W.R. Grace & Co. | | | | | | | | | | |
| 5.63% | | 10/01/24 | | | 98,000 | | | | 102,165 | | | (b) |
Wal-Mart Stores Inc. | | | | | | | | | | |
| 3.30% | | 04/22/24 | | | 78,000 | | | | 80,536 | | | (h) |
| 4.30% | | 04/22/44 | | | 97,000 | | | | 105,880 | | | (h) |
Walgreens Boots Alliance Inc. | | | | | | | | | | |
| 3.80% | | 11/18/24 | | | 94,000 | | | | 95,871 | | | |
| 4.80% | | 11/18/44 | | | 35,000 | | | | 36,903 | | | |
Weatherford International Ltd. | | | | | | | | | | |
| 5.95% | | 04/15/42 | | | 41,000 | | | | 34,716 | | | (h) |
| 6.75% | | 09/15/40 | | | 19,000 | | | | 17,698 | | | (h) |
| | | | | | | | | | | | |
| | | | | Principal
Amount | | | Fair Value | | | |
| | | |
Wells Fargo & Co. | | | | | | | | | | |
| 4.10% | | 06/03/26 | | $ | 107,000 | | | $ | 109,360 | | | (h) |
| 5.90% | | 12/29/49 | | | 62,000 | | | | 62,465 | | | (h,i) |
Windstream Corp. | | | | | | | | | | |
| 6.38% | | 08/01/23 | | | 73,000 | | | | 68,255 | | | (h) |
WPP Finance 2010 | | | | | | | | | | |
| 3.75% | | 09/19/24 | | | 95,000 | | | | 95,351 | | | |
WPX Energy Inc. | | | | | | | | | | |
| 5.25% | | 01/15/17 | | | 75,000 | | | | 75,750 | | | (h) |
Xilinx Inc. | | | | | | | | | | |
| 2.13% | | 03/15/19 | | | 48,000 | | | | 47,692 | | | (h) |
XLIT Ltd. | | | | | | | | | | |
| 5.25% | | 12/15/43 | | | 64,000 | | | | 72,335 | | | (h) |
Yamana Gold Inc. | | | | | | | | | | |
| 4.95% | | 07/15/24 | | | 39,000 | | | | 38,063 | | | |
| | | | | | | | | 29,756,414 | | | |
|
Non-Agency Collateralized Mortgage
Obligations — 1.7% |
| | | |
American Tower Trust I (REIT) | | | | | | | | | | |
| 1.55% | | 03/15/43 | | | 117,000 | | | | 115,615 | | | (b) |
Banc of America Commercial Mortgage Trust 2006-4 | | | | | | | | | | |
| 5.68% | | 07/10/46 | | | 30,000 | | | | 31,953 | | | |
Banc of America Commercial Mortgage Trust 2007-1 | | | | | | | | | | |
| 5.48% | | 01/15/49 | | | 160,000 | | | | 167,667 | | | (i) |
Banc of America Commercial Mortgage Trust 2007-4 | | | | | | | | | | |
| 5.75% | | 02/10/51 | | | 19,439 | | | | 21,190 | | | (i) |
Banc of America Commercial Mortgage Trust 2008-1 | | | | | | | | | | |
| 6.24% | | 02/10/51 | | | 199,879 | | | | 220,616 | | | (i) |
Banc of America Merrill Lynch Commercial Mortgage Inc. 2005-1 | | | | | | | | | | |
| 5.28% | | 11/10/42 | | | 70,000 | | | | 69,981 | | | (i) |
Banc of America Merrill Lynch Commercial Mortgage Inc. 2005-6 | | | | | | | | | | |
| 5.15% | | 09/10/47 | | | 72,843 | | | | 74,345 | | | (i) |
Banc of America Merrill Lynch Commercial Mortgage Trust 2014-520M | | | | | | | | | | |
| 4.18% | | 08/15/46 | | | 38,035 | | | | 41,199 | | | (b,i) |
See Notes to Schedules of Investments and Notes to Financial Statements.
33
| | |
| Elfun Diversified Fund | | December 31, 2014 |
| | | | | | | | | | | | |
| | | | | Principal
Amount | | | Fair Value | | | |
| | | |
Bear Stearns Commercial Mortgage Securities Trust 2005-T18 | | | | | | | | | | |
| 4.93% | | 02/13/42 | | $ | 14,034 | | | $ | 14,035 | | | (i) |
Bear Stearns Commercial Mortgage Securities Trust 2006-T22 | | | | | | | | | | |
| 5.58% | | 04/12/38 | | | 40,000 | | | | 41,746 | | | (i) |
Bear Stearns Commercial Mortgage Securities Trust 2007-PW18 | | | | | | | | | | |
| 6.09% | | 06/11/50 | | | 80,000 | | | | 88,115 | | | (i) |
Citigroup Commercial Mortgage Trust 2014-GC23 | | | | | | | | | | |
| 4.51% | | 07/10/47 | | | 96,000 | | | | 89,441 | | | (b,i) |
COMM 2005-LP5 Mortgage Trust | | | | | | | | | | |
| 4.98% | | 05/10/43 | | | 34,616 | | | | 34,783 | | | (i) |
COMM 2014-CR14 Mortgage Trust | | | | | | | | | | |
| 4.53% | | 02/10/47 | | | 55,000 | | | | 60,168 | | | (i) |
COMM 2014-CR19 Mortgage Trust | | | | | | | | | | |
| 4.72% | | 08/10/47 | | | 100,000 | | | | 91,394 | | | (b,i) |
| 4.72% | | 08/10/47 | | | 50,000 | | | | 52,352 | | | (i) |
COMM 2014-CR20 Mortgage Trust | | | | | | | | | | |
| 4.51% | | 11/10/47 | | | 48,472 | | | | 49,258 | | | (i) |
COMM 2014-CR21 Morgage Trust | | | | | | | | | | |
| 3.99% | | 12/10/47 | | | 93,831 | | | | 96,774 | | | |
Credit Suisse Commercial Mortgage Trust 2006-C1 | | | | | | | | | | |
| 5.47% | | 02/15/39 | | | 160,000 | | | | 166,368 | | | (i) |
Credit Suisse First Boston Mortgage Securities Corp. 2005-9 | | | | | | | | | | |
| 5.19% | | 10/25/35 | | | 16,138 | | | | — | | | (**,i,q) |
GS Mortgage Securities Trust 2011-GC5 | | | | | | | | | | |
| 3.00% | | 08/10/44 | | | 80,000 | | | | 82,114 | | | |
| 5.31% | | 08/10/44 | | | 30,000 | | | | 33,852 | | | (b,i) |
GS Mortgage Securities Trust 2014-GC20 | | | | | | | | | | |
| 4.26% | | 04/10/47 | | | 50,000 | | | | 53,439 | | | |
GS Mortgage Securities Trust 2014-GC24 | | | | | | | | | | |
| 4.53% | | 09/10/47 | | | 173,000 | | | | 156,142 | | | (b,i) |
| | | | | | | | | | | | |
| | | | | Principal
Amount | | | Fair Value | | | |
| | | |
GS Mortgage Securities Trust 2014-NEW | | | | | | | | | | |
| 3.79% | | 01/10/31 | | $ | 100,000 | �� | | $ | 100,458 | | | (b) |
JP Morgan Chase Commercial Mortgage Securities Trust 2007-CB18 | | | | | | | | | | |
| 5.44% | | 06/12/47 | | | 96,322 | | | | 102,417 | | | |
JPMBB Commercial Mortgage Securities Trust 2013-C12 | | | | | | | | | | |
| 4.03% | | 07/15/45 | | | 25,000 | | | | 26,621 | | | (i) |
JPMBB Commercial Mortgage Securities Trust 2013-C15 | | | | | | | | | | |
| 5.08% | | 11/15/45 | | | 40,000 | | | | 43,574 | | | (i) |
JPMBB Commercial Mortgage Securities Trust 2013-C17 | | | | | | | | | | |
| 4.89% | | 01/15/47 | | | 71,000 | | | | 75,743 | | | (i) |
JPMBB Commercial Mortgage Securities Trust 2014-C18 | | | | | | | | | | |
| 4.81% | | 02/15/47 | | | 50,000 | | | | 52,953 | | | (i) |
LB-UBS Commercial Mortgage Trust 2004-C8 | | | | | | | | | | |
| 0.66% | | 12/15/39 | | | 58,975 | | | | 248 | | | (b,g,i) |
LB-UBS Commercial Mortgage Trust 2005-C5 | | | | | | | | | | |
| 4.95% | | 09/15/30 | | | 33,560 | | | | 33,727 | | | |
LB-UBS Commercial Mortgage Trust 2006-C1 | | | | | | | | | | |
| 5.16% | | 02/15/31 | | | 78,138 | | | | 80,026 | | | |
LB-UBS Commercial Mortgage Trust 2006-C4 | | | | | | | | | | |
| 5.83% | | 06/15/38 | | | 28,752 | | | | 30,201 | | | (i) |
LB-UBS Commercial Mortgage Trust 2007-C6 | | | | | | | | | | |
| 6.11% | | 07/15/40 | | | 100,000 | | | | 108,405 | | | (i) |
| 6.11% | | 07/15/40 | | | 120,000 | | | | 129,902 | | | (b) |
MASTR Alternative Loan Trust 2003-5 | | | | | | | | | | |
| 5.00% | | 08/25/18 | | | 7,415 | | | | 532 | | | (g) |
ML-CFC Commercial Mortgage Trust 2006-3 | | | | | | | | | | |
| 5.46% | | 07/12/46 | | | 110,000 | | | | 116,770 | | | (i) |
Morgan Stanley Bank of America Merrill Lynch Trust 2013-C10 | | | | | | | | | | |
| 4.08% | | 07/15/46 | | | 89,000 | | | | 90,329 | | | (i) |
See Notes to Schedules of Investments and Notes to Financial Statements.
34
| | |
| Elfun Diversified Fund | | December 31, 2014 |
| | | | | | | | | | | | |
| | | | | Principal
Amount | | | Fair Value | | | |
| | | |
Morgan Stanley Bank of America Merrill Lynch Trust 2014-C19 | | | | | | | | | | |
| 3.25% | | 12/15/47 | | $ | 100,000 | | | $ | 80,834 | | | (b) |
Morgan Stanley Capital I Trust 2005-T17 | | | | | | | | | | |
| 4.84% | | 12/13/41 | | | 60,432 | | | | 60,607 | | | (i) |
Morgan Stanley Capital I Trust 2006-IQ11 | | | | | | | | | | |
| 5.66% | | 10/15/42 | | | 40,000 | | | | 41,070 | | | (i) |
Morgan Stanley Capital I Trust 2006-T21 | | | | | | | | | | |
| 5.16% | | 10/12/52 | | | 100,000 | | | | 102,533 | | | (i) |
| 5.27% | | 10/12/52 | | | 55,000 | | | | 56,797 | | | (i) |
Morgan Stanley Capital I Trust 2006-T23 | | | | | | | | | | |
| 5.81% | | 08/12/41 | | | 30,000 | | | | 31,475 | | | (i) |
Morgan Stanley Capital I Trust 2007-IQ16 | | | | | | | | | | |
| 6.08% | | 12/12/49 | | | 80,000 | | | | 87,169 | | | (i) |
Morgan Stanley Capital I Trust 2008-T29 | | | | | | | | | | |
| 6.28% | | 01/11/43 | | | 50,000 | | | | 55,769 | | | (i) |
Wells Fargo Commercial Mortgage Trust 2014-LC18 | | | | | | | | | | |
| 3.96% | | 12/15/47 | | | 93,627 | | | | 79,404 | | | (b,i) |
WFRBS Commercial Mortgage Trust 2013-C17 | | | | | | | | | | |
| 4.26% | | 12/15/46 | | | 55,000 | | | | 59,111 | | | |
| 5.13% | | 12/15/46 | | | 40,000 | | | | 39,735 | | | (b,i) |
WFRBS Commercial Mortgage Trust 2014-C19 | | | | | | | | | | |
| 4.72% | | 03/15/47 | | | 65,000 | | | | 70,694 | | | (i) |
WFRBS Commercial Mortgage Trust 2014-C22 | | | | | | | | | | |
| 3.91% | | 09/15/57 | | | 56,723 | | | | 49,608 | | | (b,i) |
WFRBS Commercial Mortgage Trust 2014-LC14 | | | | | | | | | | |
| 4.35% | | 03/15/47 | | | 123,000 | | | | 132,645 | | | (i) |
| | | | | | | | | 3,791,904 | | | |
|
| Sovereign Bonds — 0.4% |
| | | |
Government of Argentina | | | | | | | | | | |
| 2.50% | | 12/31/38 | | | 9 | | | | 5 | | | (n) |
Government of Chile | | | | | | | | | | |
| 3.63% | | 10/30/42 | | | 27,000 | | | | 24,502 | | | (h) |
| | | | | | | | | | | | |
| | | | | Principal
Amount | | | Fair Value | | | |
| | | |
Government of Colombia | | | | | | | | | | |
| 2.63% | | 03/15/23 | | $ | 200,000 | | | $ | 185,700 | | | |
Government of Mexico | | | | | | | | | | |
| 3.60% | | 01/30/25 | | | 205,000 | | | | 204,282 | | | |
| 4.00% | | 10/02/23 | | | 46,000 | | | | 47,725 | | | (h) |
| 4.75% | | 03/08/44 | | | 176,000 | | | | 183,480 | | | (h) |
Government of Peru | | | | | | | | | | |
| 5.63% | | 11/18/50 | | | 15,000 | | | | 17,663 | | | |
Government of Turkey | | | | | | | | | | |
| 3.25% | | 03/23/23 | | | 200,000 | | | | 189,750 | | | (h) |
| | | | | | | | | 853,107 | | | |
|
| Municipal Bonds and Notes — 0.2% |
| | | |
American Municipal Power Inc. | | | | | | | | | | |
| 6.27% | | 02/15/50 | | | 50,000 | | | | 64,000 | | | |
Municipal Electric Authority of Georgia | | | | | | | | | | |
| 6.64% | | 04/01/57 | | | 54,000 | | | | 71,589 | | | |
New Jersey Transportation Trust Fund Authority | | | | | | | | | | |
| 6.88% | | 12/15/39 | | | 15,000 | | | | 16,736 | | | |
Port Authority of New York & New Jersey | | | | | | | | | | |
| 4.46% | | 10/01/62 | | | 95,000 | | | | 100,836 | | | |
South Carolina State Public Service Authority | | | | | | | | | | |
| 6.45% | | 01/01/50 | | | 40,000 | | | | 54,767 | | | |
State of California | | | | | | | | | | |
| 5.70% | | 11/01/21 | | | 55,000 | | | | 65,157 | | | |
| | | | | | | | | 373,085 | | | |
| |
| FNMA – 0.0%* | | | |
| | | |
Lehman TBA
| | | | | | | | | | |
| 5.50% | | TBA | | | 49,568 | | | | 12,392 | | | (n,q) |
| | | |
Total Bonds and Notes
(Cost $69,915,577) | | | | | | | 70,735,256 | | | |
See Notes to Schedules of Investments and Notes to Financial Statements.
35
| | |
| Elfun Diversified Fund | | December 31, 2014 |
| | | | | | | | | | |
| | | Number
of Shares | | | Fair Value | | | |
Exchange Traded Funds — 3.6% | | | |
| | | |
Financial Select Sector SPDR Fund | | | 9,369 | | | $ | 231,695 | | | (o) |
Industrial Select Sector SPDR Fund | | | 16,146 | | | | 913,379 | | | (o) |
Vanguard FTSE Emerging Markets ETF | | | 175,136 | | | | 7,008,943 | | | |
| | | |
Total Exchange Traded Funds (Cost $8,015,647) | | | | | | | 8,154,017 | | | |
| | | |
Total Investments in Securities (Cost $185,373,645) | | | | | | | 205,199,721 | | | |
Short-Term Investments — 13.2% | | | |
| | | |
State Street Institutional U.S. Government Money Market Fund — Premier Class | | | | | | | | | | |
0.00%
(Cost $30,414,288) | | | | | | | 30,414,288 | | | (d,h,o) |
| | | |
Total Investments
(Cost $215,787,933) | | | | | | | 235,614,009 | | | |
| | | |
Liabilities in Excess of Other Assets, net — (2.4)% | | | | | | | (5,490,732) | | | |
| | | | | | | | | | |
| | | |
NET ASSETS — 100.0% | | | | | | $ | 230,123,277 | | | |
| | | | | | | | | | |
Other Information:
The Fund had the following long futures contracts open at December 31, 2014:
| | | | | | | | | | | | | | |
| Description | | Expiration
date | | Number
of
Contracts | | | Current
Notional
Value | | | Unrealized
Appreciation
(Depreciation) | |
| | | | |
EURO Stoxx 50 Index Futures | | March 2015 | | | 11 | | | $ | 417,020 | | | $ | (1,955) | |
| | | | |
FTSE 100 Index Futures | | March 2015 | | | 1 | | | | 101,702 | | | | 1,782 | |
| | | | | | | | | | | | | | |
| Description | | Expiration
date | | Number
of
Contracts | | | Current
Notional
Value | | | Unrealized
Appreciation
(Depreciation) | |
| | | | |
S&P Mid 400 Emini Index Futures | | March 2015 | | | 49 | | | $ | 7,098,140 | | | $ | 165,747 | |
| | | | |
Topix Index Futures | | March 2015 | | | 3 | | | | 352,183 | | | | 7,356 | |
| | | | |
U.S. Long Bond Futures | | March 2015 | | | 14 | | | | 2,023,875 | | | | (5,746) | |
| | | | |
Ultra Long-Term U.S. Treasury Bond Futures | | March 2015 | | | 1 | | | | 165,187 | | | | 6,966 | |
| | | | |
2 Yr. U.S. Treasury Notes Futures | | March 2015 | | | 40 | | | | 8,743,750 | | | | (12,309) | |
| | | | | | | | | | | | | | |
| | | | | | | | $ | 161,841 | |
| | | | | | | | | | | | | | |
The Fund had the following short futures contracts open at December 31, 2014:
| | | | | | | | | | | | | | |
| Description | | Expiration
date | | Number
of
Contracts | | | Current
Notional
Value | | | Unrealized
Appreciation
(Depreciation) | |
| | | | |
S&P 500 Emini Index Futures | | March 2015 | | | 6 | | | $ | (615,720) | | | $ | 4,401 | |
| | | | |
5 Yr. U.S. Treasury Notes Futures | | March 2015 | | | 9 | | | | (1,070,367) | | | | (1,122) | |
| | | | |
10 Yr. U.S. Treasury Notes Futures | | March 2015 | | | 55 | | | | (6,973,828) | | | | (20,038) | |
| | | | | | | | | | | | | | |
| | | | | | | | | | | | $ | (16,759) | |
| | | | | | | | | | | | | | |
| | | | | | | | | | | | $ | 145,082 | |
| | | | | | | | | | | | | | |
See Notes to Schedules of Investments and Notes to Financial Statements.
36
| | |
| Elfun Diversified Fund | | December 31, 2014 |
The Fund was invested in the following countries at December 31, 2014 (unaudited):
| | | | |
| Country | | Percentage
(based on
Fair Value) | |
United States | | | 77.36% | |
Japan | | | 5.67% | |
United Kingdom | | | 2.97% | |
France | | | 2.71% | |
Germany | | | 2.56% | |
Canada | | | 1.36% | |
Switzerland | | | 1.22% | |
China | | | 0.79% | |
Netherlands | | | 0.76% | |
Sweden | | | 0.76% | |
Hong Kong | | | 0.50% | |
India | | | 0.49% | |
Australia | | | 0.43% | |
Italy | | | 0.39% | |
Belgium | | | 0.35% | |
Mexico | | | 0.35% | |
South Korea | | | 0.31% | |
Taiwan | | | 0.28% | |
Luxembourg | | | 0.17% | |
Supranational | | | 0.12% | |
Colombia | | | 0.09% | |
Norway | | | 0.09% | |
Turkey | | | 0.08% | |
Cayman Islands | | | 0.06% | |
Denmark | | | 0.06% | |
Brazil | | | 0.05% | |
Chile | | | 0.01% | |
Peru | | | 0.01% | |
Bermuda | | | 0.00% | *** |
Argentina | | | 0.00% | *** |
| | | | |
| | | 100.00% | |
| | | | |
The Fund’s % share of investment in the various categories, based on Fair Value, is as follows at December 31, 2014 (unaudited):
| | | | | | | | | | | | |
| Equity Securities | | | | | | | | | |
| Industry | | Domestic | | | Foreign | | | Total | |
Diversified Banks | | | 2.06% | | | | 2.29% | | | | 4.35% | |
Pharmaceuticals | | | 2.52% | | | | 1.80% | | | | 4.32% | |
Exchange Traded Funds | | | 3.46% | | | | 0.00% | | | | 3.46% | |
Technology Hardware, Storage & Peripherals | | | 2.37% | | | | 0.00% | | | | 2.37% | |
Integrated Oil & Gas | | | 1.55% | | | | 0.74% | | | | 2.29% | |
Communications Equipment | | | 1.68% | | | | 0.38% | | | | 2.06% | |
Aerospace & Defense | | | 1.52% | | | | 0.52% | | | | 2.04% | |
Biotechnology | | | 1.60% | | | | 0.17% | | | | 1.77% | |
Internet Software & Services | | | 1.05% | | | | 0.70% | | | | 1.75% | |
Asset Management & Custody Banks | | | 1.68% | | | | 0.00% | | | | 1.68% | |
Healthcare Equipment | | | 1.36% | | | | 0.00% | | | | 1.36% | |
Cable & Satellite | | | 1.33% | | | | 0.00% | | | | 1.33% | |
Multi-Line Insurance | | | 1.07% | | | | 0.24% | | | | 1.31% | |
Automobile Manufacturers | | | 0.20% | | | | 1.05% | | | | 1.25% | |
Oil & Gas Equipment & Services | | | 0.88% | | | | 0.29% | | | | 1.17% | |
Soft Drinks | | | 1.07% | | | | 0.00% | | | | 1.07% | |
Industrial Machinery | | | 0.27% | | | | 0.64% | | | | 0.91% | |
General Merchandise Stores | | | 0.90% | | | | 0.00% | | | | 0.90% | |
Diversified Real Estate Activities | | | 0.00% | | | | 0.88% | | | | 0.88% | |
Life & Health Insurance | | | 0.13% | | | | 0.70% | | | | 0.83% | |
Movies & Entertainment | | | 0.72% | | | | 0.00% | | | | 0.72% | |
Specialized Finance | | | 0.70% | | | | 0.00% | | | | 0.70% | |
Drug Retail | | | 0.70% | | | | 0.00% | | | | 0.70% | |
Electrical Components & Equipment | | | 0.03% | | | | 0.66% | | | | 0.69% | |
Home Improvement Retail | | | 0.69% | | | | 0.00% | | | | 0.69% | |
Internet Retail | | | 0.26% | | | | 0.36% | | | | 0.62% | |
Property & Casualty Insurance | | | 0.00% | | | | 0.62% | | | | 0.62% | |
Packaged Foods & Meats | | | 0.40% | | | | 0.20% | | | | 0.60% | |
Research & Consulting Services | | | 0.45% | | | | 0.14% | | | | 0.59% | |
Application Software | | | 0.25% | | | | 0.32% | | | | 0.57% | |
Consumer Finance | | | 0.56% | | | | 0.00% | | | | 0.56% | |
Wireless Telecommunication Services | | | 0.00% | | | | 0.55% | | | | 0.55% | |
Healthcare Services | | | 0.27% | | | | 0.28% | | | | 0.55% | |
Specialized REITs | | | 0.55% | | | | 0.00% | | | | 0.55% | |
See Notes to Schedules of Investments and Notes to Financial Statements.
37
| | |
| Elfun Diversified Fund | | December 31, 2014 |
| | | | | | | | | | | | |
| Industry | | Domestic | | | Foreign | | | Total | |
Electronic Equipment & Instruments | | | 0.00% | | | | 0.51% | | | | 0.51% | |
Airlines | | | 0.34% | | | | 0.15% | | | | 0.49% | |
Semiconductor Equipment | | | 0.16% | | | | 0.33% | | | | 0.49% | |
Semiconductors | | | 0.00% | | | | 0.48% | | | | 0.48% | |
Agricultural Products | | | 0.45% | | | | 0.00% | | | | 0.45% | |
Auto Parts & Equipment | | | 0.09% | | | | 0.36% | | | | 0.45% | |
Data Processing & Outsourced Services | | | 0.44% | | | | 0.00% | | | | 0.44% | |
Specialty Chemicals | | | 0.13% | | | | 0.31% | | | | 0.44% | |
Fertilizers & Agricultural Chemicals | | | 0.38% | | | | 0.00% | | | | 0.38% | |
Regional Banks | | | 0.37% | | | | 0.00% | | | | 0.37% | |
Electronic Components | | | 0.00% | | | | 0.37% | | | | 0.37% | |
Brewers | | | 0.00% | | | | 0.35% | | | | 0.35% | |
Industrial Gases | | | 0.00% | | | | 0.33% | | | | 0.33% | |
Broadcasting | | | 0.31% | | | | 0.00% | | | | 0.31% | |
Other Diversified Financial Services | | | 0.00% | | | | 0.29% | | | | 0.29% | |
Apparel, Accessories & Luxury Goods | | | 0.00% | | | | 0.28% | | | | 0.28% | |
Railroads | | | 0.08% | | | | 0.20% | | | | 0.28% | |
Construction Materials | | | 0.00% | | | | 0.26% | | | | 0.26% | |
Investment Banking & Brokerage | | | 0.25% | | | | 0.00% | | | | 0.25% | |
Integrated Telecommunication Services | | | 0.25% | | | | 0.00% | | | | 0.25% | |
Healthcare Distributors | | | 0.25% | | | | 0.00% | | | | 0.25% | |
Independent Power Producers & Energy Traders | | | 0.24% | | | | 0.00% | | | | 0.24% | |
Electric Utilities | | | 0.16% | | | | 0.08% | | | | 0.24% | |
Diversified Metals & Mining | | | 0.00% | | | | 0.24% | | | | 0.24% | |
Specialty Stores | | | 0.24% | | | | 0.00% | | | | 0.24% | |
Systems Software | | | 0.23% | | | | 0.00% | | | | 0.23% | |
Building Products | | | 0.00% | | | | 0.22% | | | | 0.22% | |
Advertising | | | 0.00% | | | | 0.21% | | | | 0.21% | |
Casinos & Gaming | | | 0.15% | | | | 0.05% | | | | 0.20% | |
Automotive Retail | | | 0.20% | | | | 0.00% | | | | 0.20% | |
Oil & Gas Exploration & Production | | | 0.11% | | | | 0.08% | | | | 0.19% | |
Healthcare Supplies | | | 0.19% | | | | 0.00% | | | | 0.19% | |
Air Freight & Logistics | | | 0.17% | | | | 0.00% | | | | 0.17% | |
Heavy Electrical Equipment | | | 0.00% | | | | 0.17% | | | | 0.17% | |
Human Resource & Employment Services | | | 0.00% | | | | 0.16% | | | | 0.16% | |
| | | | | | | | | | | | |
| Industry | | Domestic | | | Foreign | | | Total | |
Apparel Retail | | | 0.00% | | | | 0.16% | | | | 0.16% | |
Household Products | | | 0.08% | | | | 0.06% | | | | 0.14% | |
Construction & Engineering | | | 0.00% | | | | 0.14% | | | | 0.14% | |
Commodity Chemicals | | | 0.10% | | | | 0.00% | | | | 0.10% | |
Life Sciences Tools & Services | | | 0.08% | | | | 0.00% | | | | 0.08% | |
Publishing | | | 0.02% | | | | 0.00% | | | | 0.02% | |
| | | | | | | | | | | | |
| | | | | | | | | | | 57.07% | |
| | | | | | | | | | | | |
| | | | |
| Bonds and Notes | | | |
| Sector | | Percentage
(based on
Fair Value) | |
Corporate Notes | | | 12.63% | |
Agency Mortgage Backed | | | 8.92% | |
U.S. Treasuries | | | 6.19% | |
Non-Agency Collateralized Mortgage Obligations | | | 1.61% | |
Sovereign Bonds | | | 0.36% | |
Municipal Bonds and Notes | | | 0.16% | |
Agency Collateralized Mortgage Obligations | | | 0.13% | |
Asset Backed | | | 0.01% | |
FNMA | | | 0.01% | |
| | | | |
| | | 30.02% | |
| | | | |
| | | | |
| Short-Term Investments | |
Short-Term Investments | | | 12.91% | |
| | | | |
| | | 12.91% | |
| | | | |
| | | 100.00% | |
| | | | |
See Notes to Schedules of Investments and Notes to Financial Statements.
38
(Unaudited)


Michael J.Caufield
Senior Vice President
The Elfun Tax-Exempt Income Fund is managed by Michael J. Caufield. See portfolio managers’ biographical information beginning on page 124.
| Q. | How did the Elfun Tax-Exempt Income Fund perform compared to its benchmark and Morningstar peer group for the twelve-month period ended December 31, 2014? |
| A. | For the twelve-month period ended December 31, 2014, the Elfun Tax-Exempt Income Fund returned 9.85%. The Barclay’s Capital U.S. Municipal Bond Index (the Index), the Fund’s benchmark, returned 9.05% and the Fund’s Morningstar peer group of 221 U.S. Long-term Municipal Bond funds returned an average of 10.49% over the same period. |
| Q. | What market conditions affected the Fund’s performance? |
| A. | Throughout the early months of 2014 the market listened to the Federal Reserve’s forward guidance, prepared itself for higher rates, witnessed the successive tapering process, and then was taken by surprise as global weakness and declining inflation drove interest rates lower. The return of the individual investor was a significant factor in the municipal bond market for 2014 as tax-exempt open ended mutual funds reversed the massive outflow trend of 2013 and reported net inflows exceeding $21 billion. Municipal yields responded favorably as improving credit trends combined with limited new issuance to mitigate the risk premium in |
| | the market. The municipal yield curve, given a favorable technical climate, characterized by broad based demand, tightened significantly over the course of the year. Longer maturities were the top performing segment of the yield curve, attracting considerable capital which drove rates 165 basis points lower. Longer assets and lower credit were the clear winners in 2014 as all forms of risk were greatly rewarded. The Fund was well positioned for a curve flattening scenario and benefitted from its diverse positioning favoring the 15-20 year sector. The Funds’ credit exposure, on the other hand, was underweight compared to the Index, as well as that of its peers, slightly constraining return potential. Overall, however, our approach remained consistent to our conservative, long term commitment to high grade credit quality and the maximization of tax-exempt income. |
| Q. | What were the primary drivers of Fund performance? |
| A. | Curve and duration were the primary drivers of Fund returns for 2014. From the outset of the year our duration strategy was implemented to take advantage of one of the steepest yields curves in recent memory. The Fund’s exposure initially exceeded the duration of the Index by roughly three quarters of a year and was maintained between one half and six tenths of a year throughout the period. The majority of our interest rate risk budget was diversely positioned across the 15-25 year segment, which possessed the best risk reward |
39
(Unaudited)
| | characteristics, relative to our objectives, at the time. Sector selection emphasizing essential service revenue supported debt, continued to be a strong contributor, as that sector outperformed General Obligation debt by over 300 basis points. |
| Q. | Were there any significant changes to the Fund during the period? |
| A. | Active management of the Fund’s interest rate risk profile was a key strategy utilized over the course of the year. While longer fund duration was maintained given sound fundamentals, risk was managed within a narrow band. In response to spike in new issue activity in early December we adopted a more conservative approach and we reduced the Fund’s interest rate exposure by one-half year. On the selection front we added to the Fund’s weighting in California and were rewarded with a credit rating upgrade to the AA level by both rating agencies. As the market hit new lows in yield causing investors to reach for yield in a limited supply environment, we were active sellers of lower rated credits, reducing exposure to just 3.5% of Fund holdings. In addition, recognizing the challenges placed upon the health care industry by the Affordable Care Act, we reduced the Fund’s overall exposure from an Index overweight to an underweighted position, removing stand -alone hospitals while restricting the Fund’s participation to larger, regional and national system providers and major teaching affiliated facilities. |
40
(Unaudited)

Understanding Your Fund’s Expenses
As a shareholder of the Fund you incur ongoing costs. Ongoing costs include portfolio management fees, professional fees, administrative fees and other Fund expenses. The following example is intended to help you understand your ongoing costs (in dollars) of investing in the Fund and to compare these costs with the ongoing costs of investing in other mutual funds.
To illustrate these ongoing costs, we have provided an example and calculated the expenses paid by investors in units of the Fund during the period. The information in the following table is based on an investment of $1,000, which is invested at the beginning of the period and held for the entire six-month period ended December 31, 2014.
Actual Expenses
The first section of the table provides information about actual account values and actual expenses. You may use the information in this section, together with the amount you invested, to estimate the expenses that you paid over the period. To do so, simply divide your account value by $1,000 (for example, an $8,600 account value divided by $1,000 = 8.6), then multiply the result by the number given under the heading “Expenses paid during the
period” to estimate the expenses you paid on your account during the period.
Hypothetical Example for Comparison Purposes
The second section of the table provides information about hypothetical account values and hypothetical expenses based on the Fund’s actual expense ratio and an assumed rate of return of 5% per year before expenses, which is not the Fund’s actual return. The hypothetical account values and expenses may not be used to estimate the actual ending account balance or expenses you paid for the period. You may use this information to compare the ongoing costs of investing in the Fund and other funds. To do so, compare this 5% hypothetical example with the 5% hypothetical examples that appear in the shareholders reports of other funds.
Please note that the expenses shown in the table are meant to highlight and help you compare ongoing costs only and do not reflect transaction costs, such as sales charges or redemption fees, if any. Therefore, the second section of the table is useful in comparing ongoing costs only, and will not help you determine the relative total costs of owning different funds.
July 1, 2014 – December 31, 2014
| | | | | | | | | | | | |
| | | Account value at
the beginning of
the period ($) | | | Account value
at the end of
the period ($) | | | Expenses
paid during
the period ($)* | |
| | | |
Actual Fund Return | | | 1,000.00 | | | | 1,032.00 | | | | 0.82 | |
| | | |
Hypothetical 5% Return
(2.5% for the period) | | | 1,000.00 | | | | 1,024.40 | | | | 0.82 | |
| * | | Expenses are equal to the Fund’s annualized net expense ratio of 0.16%** (for the period July 1, 2014 – December 31, 2014), multiplied by the average account value over the period, multiplied by 184/365 (to reflect the one-half year period). |
| ** | | May differ from expense ratio disclosed in the financial highlights, which is calculated based on the entire fiscal year’s data. |
41
(Unaudited)
A mutual fund designed for investors who seek as high a level of current interest income exempt from federal income taxation as is available from a concentration of investments in municipal bonds consistent with prudent investment management and the preservation of capital. The Fund seeks to achieve its investment objective by investing primarily in investment-grade municipal obligations.
as of December 31, 2014 as a % of Investments(b)
| | | | |
| Moody’s / S&P Rating* | | Percentage of Fair Value | |
Aaa / AAA | | | 11.23% | |
Aa / AA | | | 51.47% | |
A / A | | | 32.41% | |
Baa / BBB | | | 2.76% | |
Ba / BB and lower | | | 1.24% | |
NR / Other | | | 0.89% | |
| | | | 100.00% | |
as a % of Investments of $1,637,097 (in thousands) on December 31, 2014(b)
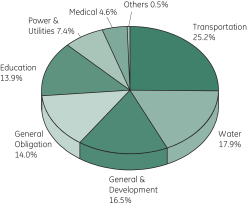
|
| Morningstar Performance Comparison |
Based on average annual returns for periods ended December 31, 2014
| | | | | | | | | | | | |
| | | One
Year | | | Five
Year | | | Ten Year | |
Number of funds in peer group | | | 221 | | | | 185 | | | | 151 | |
Peer group average annual total return | | | 10.49 | % | | | 5.24 | % | | | 4.15 | % |
Morningstar Category in peer group: Muni National Long | |
|
| Change in Value of a $10,000 Investment(a) |
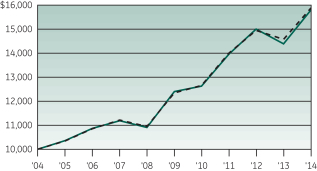
|
| Average Annual Total Return |
for the periods ended December 31, 2014
| | | | | | | | | | | | | | | | |
| (Inception date: 01/01/80) | | | | | | | |
| | | One
Year | | | Five
Year | | | Ten
Year | | | Ending value of a $10,000
investment (a) | |
| | | | |
Elfun Tax-Exempt Income Fund | | | 9.85% | | | | 4.98% | | | | 4.68% | | | | $15,804 | |
| | | | |
Barclays U.S. Municipal Bond Index | | | 9.05% | | | | 5.16% | | | | 4.74% | | | | $15,885 | |
| (a) | Ending value of a $10,000 investment for the ten-year period or since inception, whichever is less. |
| (b) | The securities information regarding holdings, allocations and other characteristics is presented to illustrate examples of securities that the Fund has bought and the diversity of areas in which the Fund may invest as of a particular date. It may not be representative of the Fund’s current or future investments and should not be construed as a recommendation to purchase or sell a particular security. |
| * | Moody’s Investors Services, Inc. (“Moody’s”) and Standard & Poor’s Corporation (“S&P”) are nationally recognized statistical rating organizations. The quality ratings represent the lower of Moody’s or S&P credit ratings. When a rating from only one of the rating agencies is available, that rating is used. Securities not rated by Moody’s or S&P are categorized as not rated. Credit qualitymeasures a bond issuer’s ability to repay interest and principal in a timely manner. Credit quality ratings assigned by a rating agency are subject to change periodically and are not absolute standards of quality. In formulating investment decisions for the Fund, GEAM develops its own analysis of the credit quality and risks associated with individual debt instruments, rather than relying exclusively on rating agency ratings. |
See Notes to Performance beginning on page 1 for further information, including an explanation of Morningstar peer categories.
Past performance does not predict future performance. The performance shown in the graphs and tables does not reflect the deduction of taxes that a shareholder would pay on Fund distributions or the redemption of Fund shares.
42
| | |
| Elfun Tax-Exempt Income Fund | | December 31, 2014 |
| | | | | | | | | | | | |
| | | | | Principal
Amount | | | Fair
Value | | | |
| | | | | | | | | | | | |
Municipal Bonds and Notes – 99.0%† |
|
| Alaska — 0.2% |
| | | |
Alaska Housing Finance Corp. | | | | | | | | | | |
| 5.00% | | 12/01/27 | | $ | 2,500,000 | | | $ | 2,925,475 | | | |
|
| Arizona – 3.1% |
| | | |
Arizona Department of Transportation State Highway Fund Revenue | | | | | | | | | | |
| 5.00% | | 07/01/33 | | | 15,000,000 | | | | 17,897,850 | | | (c) |
Arizona Health Facilities Authority | | | | | | | | | | |
| 4.00% | | 01/01/44 | | | 5,000,000 | | | | 5,048,900 | | | |
City of Phoenix | | | | | | | | | | |
| 5.00% | | 07/01/19 | | | 5,000,000 | | | | 5,515,900 | | | (h) |
Phoenix Civic Improvement Corp. (FGIC Insured) | | | | | | | | | | |
| 5.50% | | 07/01/23 -07/01/24 | | | 7,260,000 | | | | 9,243,598 | | | (m) |
Salt River Project Agricultural Improvement & Power District | | | | | | | | | | |
| 5.00% | | 12/01/21 | | | 10,000,000 | | | | 11,845,800 | | | |
University Medical Center Corp. | | | | | | | | | | |
| 6.50% | | 07/01/39 | | | 1,000,000 | | | | 1,165,510 | | | |
| | | | | | | | | 50,717,558 | | | |
|
| California – 12.1% |
| | | |
Bay Area Toll Authority | | | | | | | | | | |
| 4.00% | | 04/01/31 | | | 4,000,000 | | | | 4,336,840 | | | |
| 5.00% | | 04/01/31 | | | 10,000,000 | | | | 10,583,300 | | | (l) |
California Educational Facilities Authority | | | | | | | | | | |
| 5.00% | | 10/01/32 | | | 5,255,000 | | | | 6,966,869 | | | |
| 5.25% | | 10/01/39 | | | 6,000,000 | | | | 6,819,060 | | | |
| 6.13% | | 10/01/36 | | | 1,500,000 | | | | 1,828,875 | | | |
California Health Facilities Financing Authority | | | | | | | | | | |
| 5.50% | | 08/15/26 | | | 5,000,000 | | | | 5,953,200 | | | |
| 6.00% | | 07/01/39 | | | 5,000,000 | | | | 5,717,700 | | | |
| 6.50% | | 10/01/33 | | | 3,500,000 | | | | 4,209,870 | | | (l) |
| | | | | | | | | | | | |
| | | | | Principal
Amount | | | Fair
Value | | | |
| | | | | | | | | | | | |
| | | |
California State Department of Water Resources | | | | | | | | | | |
| 5.00% | | 05/01/21 -12/01/21 | | $ | 6,585,000 | | | $ | 7,967,680 | | | |
California State Public Works Board | | | | | | | | | | |
| 5.00% | | 10/01/28 | | | 1,500,000 | | | | 1,745,235 | | | |
| 5.13% | | 10/01/31 | | | 2,000,000 | | | | 2,304,780 | | | |
| 5.25% | | 09/01/29 | | | 10,160,000 | | | | 12,103,709 | | | |
| 6.00% | | 04/01/26 | | | 8,475,000 | | | | 10,121,523 | | | |
Coast Community College District (AGMC Insured) | | | | | | | | | | |
| 5.00% | | 08/01/33 | | | 8,750,000 | | | | 9,742,600 | | | (h,m) |
Foothill-De Anza Community College District
(AMBAC Insured) | | | | | | | | | | |
| 4.50% | | 08/01/31 | | | 2,600,000 | | | | 2,795,858 | | | (h,m) |
Los Angeles Community College District | | | | | | | | | | |
| 4.00% | | 08/01/39 | | | 5,000,000 | | | | 5,272,500 | | | (c) |
Los Angeles Harbor Department | | | | | | | | | | |
| 5.00% | | 08/01/26 | | | 8,000,000 | | | | 9,305,120 | | | |
Metropolitan Water District of Southern California | | | | | | | | | | |
| 5.00% | | 07/01/35 | | | 5,000,000 | | | | 5,293,500 | | | |
Sacramento County Sanitation Districts Financing Authority | | | | | | | | | | |
| 5.00% | | 12/01/44 | | | 2,000,000 | | | | 2,299,040 | | | |
San Diego Community College District | | | | | | | | | | |
| 5.00% | | 08/01/41 | | | 10,000,000 | | | | 11,408,200 | | | (h) |
San Diego County Regional Transportation Commission | | | | | | | | | | |
| 4.75% | | 04/01/48 | | | 4,000,000 | | | | 4,512,680 | | | |
State of California | | | | | | | | | | |
| 5.00% | | 02/01/31 - 12/01/43 | | | 18,220,000 | | | | 20,756,985 | | | (h) |
| 5.00% | | 08/01/31 | | | 10,000,000 | | | | 11,881,600 | | | |
| 5.25% | | 04/01/35 - 11/01/40 | | | 12,750,000 | | | | 14,743,105 | | | (h) |
State of California Department of Water Resources | | | | | | | | | | |
| 5.00% | | 12/01/29 | | | 9,000,000 | | | | 11,113,920 | | | |
See Notes to Schedules of Investments and Notes to Financial Statements.
43
| | |
| Elfun Tax-Exempt Income Fund | | December 31, 2014 |
| | | | | | | | | | | | |
| | | | | Principal
Amount | | | Fair
Value | | | |
| | | | | | | | | | | | |
| | | |
University of California | | | | | | | | | | |
| 5.00% | | 05/15/38 | | $ | 4,000,000 | | | $ | 4,603,360 | | | |
| | | | | | | | | | | | |
University of California (AMBAC Insured) | | | | | | | | | | |
| 5.00% | | 05/15/34 | | | 2,225,000 | | | | 2,226,780 | | | (m) |
| | | | | | | | | 196,613,889 | | | |
|
| Colorado — 2.1% |
| | | |
Metro Wastewater Reclamation District | | | | | | | | | | |
| 5.00% | | 04/01/27 | | | 1,730,000 | | | | 2,057,437 | | | |
Regional Transportation District | | | | | | | | | | |
| 4.25% | | 11/01/36 | | | 3,405,000 | | | | 3,974,997 | | | |
| 5.00% | | 11/01/27 - 11/01/29 | | | 20,015,000 | | | | 24,959,171 | | | |
| 5.38% | | 06/01/31 | | | 2,500,000 | | | | 2,839,425 | | | |
| | | | | | | | | 33,831,030 | | | |
|
| Connecticut — 4.5% |
| | | |
Connecticut State Health & Educational Facility Authority | | | | | | | | | | |
| 5.00% | | 07/01/40 | | | 7,775,000 | | | | 8,556,154 | | | |
Greater New Haven Water Pollution Control Authority | | | | | | | | | | |
| 4.00% | | 08/15/35 | | | 1,500,000 | | | | 1,559,460 | | | |
Hartford County Metropolitan District | | | | | | | | | | |
| 5.00% | | 11/01/42 | | | 10,000,000 | | | | 11,551,700 | | | |
South Central Connecticut Regional Water Authority | | | | | | | | | | |
| 5.00% | | 08/01/27 -08/01/44 | | | 4,545,000 | | | | 5,280,264 | | | |
State of Connecticut | | | | | | | | | | |
| 5.00% | | 01/01/22 - 01/01/24 | | | 8,600,000 | | | | 10,215,072 | | | |
State of Connecticut Special Tax Revenue | | | | | | | | | | |
| 5.00% | | 11/01/26 - 09/01/34 | | | 30,250,000 | | | | 35,240,565 | | | |
Town of Fairfield | | | | | | | | | | |
| 5.00% | | 08/01/21 | | | 1,000,000 | | | | 1,202,230 | | | (h) |
| | | | | | | | | 73,605,445 | | | |
|
| Delaware — 1.2% |
| | | |
County of New Castle | | | | | | | | | | |
| 5.00% | | 07/15/33 - 07/15/39 | | | 10,000,000 | | | | 11,077,380 | | | (h) |
| | | | | | | | | | | | |
| | | | | Principal
Amount | | | Fair
Value | | | |
| | | | | | | | | | | | |
| | | |
Delaware State Health Facilities Authority | | | | | | | | | | |
| 5.00% | | 10/01/40 | | $ | 6,800,000 | | | $ | 7,470,140 | | | |
State of Delaware | | | | | | | | | | |
| 5.00% | | 07/01/28 | | | 1,000,000 | | | | 1,180,200 | | | (h) |
| | | | | | | | | 19,727,720 | | | |
|
| District of Columbia — 1.6% |
| | | |
District of Columbia | | | | | | | | | | |
| 5.00% | | 06/01/38 | | | 3,000,000 | | | | 3,488,340 | | | (h) |
| 5.50% | | 04/01/36 | | | 15,000,000 | | | | 17,066,100 | | | |
District of Columbia Water & Sewer Authority | | | | | | | | | | |
| 5.25% | | 10/01/29 | | | 5,000,000 | | | | 5,765,350 | | | (h,l) |
| | | | | | | | | 26,319,790 | | | |
|
| Florida — 0.7% |
| | | |
Brevard County Health Facilities Authority | | | | | | | | | | |
| 7.00% | | 04/01/39 | | | 1,000,000 | | | | 1,236,490 | | | (l) |
City of Tampa Water & Wastewater System Revenue | | | | | | | | | | |
| 5.00% | | 10/01/27 | | | 8,560,000 | | | | 10,017,597 | | | |
| | | | | | | | | 11,254,087 | | | |
|
| Georgia — 6.5% |
| | | |
Athens-Clarke County Unified Government Development Authority | | | | | | | | | | |
| 5.00% | | 06/15/31 | | | 6,050,000 | | | | 6,710,297 | | | |
Athens-Clarke County Unified Government Water & Sewerage Revenue | | | | | | | | | | |
| 5.50% | | 01/01/38 | | | 7,000,000 | | | | 7,997,710 | | | |
City of Atlanta Department of Aviation | | | | | | | | | | |
| 5.00% | | 01/01/25 - 01/01/34 | | | 20,500,000 | | | | 24,007,975 | | | |
City of Atlanta Water & Wastewater Revenue | | | | | | | | | | |
| 5.25% | | 11/01/30 | | | 5,690,000 | | | | 6,806,890 | | | |
| 6.25% | | 11/01/39 | | | 10,000,000 | | | | 11,917,700 | | | |
City of Atlanta Water & Wastewater Revenue (AGMC Insured) | | | | | | | | | | |
| 5.75% | | 11/01/27 - 11/01/30 | | | 9,500,000 | | | | 12,672,105 | | | (m) |
See Notes to Schedules of Investments and Notes to Financial Statements.
44
| | |
| Elfun Tax-Exempt Income Fund | | December 31, 2014 |
| | | | | | | | | | | | |
| | | | | Principal
Amount | | | Fair
Value | | | |
| | | |
DeKalb Newton & Gwinnett Counties Joint Development Authority | | | | | | | | | | |
| 6.00% | | 07/01/34 | | $ | 8,500,000 | | | $ | 9,716,265 | | | |
Fayette County School District (AGMC Insured) | | | | | | | | | | |
| 4.80% | | 03/01/22 | | | 2,520,000 | | | | 2,652,199 | | | (h,l,m) |
| 4.85% | | 03/01/23 | | | 2,290,000 | | | | 2,411,439 | | | (h,l,m) |
Municipal Electric Authority of Georgia | | | | | | | | | | |
| 5.25% | | 01/01/19 | | | 2,490,000 | | | | 2,857,275 | | | |
Private Colleges & Universities Authority (MBIA Insured) | | | | | | | | | | |
| 6.50% | | 11/01/15 | | | 1,095,000 | | | | 1,151,732 | | | (k,m) |
State of Georgia | | | | | | | | | | |
| 4.00% | | 07/01/32 | | | 3,350,000 | | | | 3,669,557 | | | (h) |
| 4.50% | | 01/01/29 | | | 3,000,000 | | | | 3,359,340 | | | (h) |
| 5.00% | | 08/01/22 | | | 4,460,000 | | | | 4,952,339 | | | (h,l) |
| 5.00% | | 08/01/22 - 01/01/26 | | | 4,790,000 | | | | 5,395,223 | | | (h) |
| | | | | | | | | 106,278,046 | | | |
| | |
| Hawaii — 1.8% | | | | | | | |
| | | |
City & County of Honolulu | | | | | | | | | | |
| 5.00% | | 04/01/33 | | | 10,000,000 | | | | 11,255,700 | | | (h) |
State of Hawaii Airports System Revenue | | | | | | | | | | |
| 5.25% | | 07/01/24 | | | 15,800,000 | | | | 18,518,232 | | | |
| | | | | | | | | 29,773,932 | | | |
| | |
| Idaho — 1.4% | | | | | | | |
| | | |
Idaho Health Facilities Authority | | | | | | | | | | |
| 6.75% | | 11/01/37 | | | 4,000,000 | | | | 4,656,680 | | | |
Idaho Housing & Finance Assoc. (MBIA Insured) | | | | | | | | | | |
| 5.00% | | 07/15/22 - 07/15/24 | | | 17,625,000 | | | | 18,697,731 | | | (m) |
| | | | | | | | | 23,354,411 | | | |
| | |
| Illinois — 2.0% | | | | | | | |
| | | |
City of Chicago O’Hare International Airport Revenue | | | | | | | | | | |
| 5.63% | | 01/01/35 | | | 5,000,000 | | | | 5,731,950 | | | |
| 5.75% | | 01/01/39 | | | 11,500,000 | | | | 13,323,440 | | | |
| | | | | | | | | | | | |
| | | | | Principal
Amount | | | Fair
Value | | | |
| | | |
Metropolitan Pier & Exposition Authority (MBIA Insured) | | | | | | | | | | |
| 3.62% | | 06/15/22 | | $ | 4,305,000 | | | $ | 4,422,570 | | | (m) |
| 5.40% | | 06/15/19 | | | 4,000,000 | | | | 4,377,680 | | | (m) |
Southwestern Illinois Development Authority (MBIA Insured) | | | | | | | | | | |
| 5.00% | | 10/01/21 | | | 4,000,000 | | | | 4,653,960 | | | (m) |
| | | | | | | | | 32,509,600 | | | |
| | |
| Indiana — 0.8% | | | | | | | |
| | | |
City of Whiting | | | | | | | | | | |
| 1.85% | | 06/01/44 | | | 2,500,000 | | | | 2,518,075 | | | |
Indiana Municipal Power Agency | | | | | | | | | | |
| 5.50% | | 01/01/27 | | | 2,500,000 | | | | 2,870,875 | | | |
Indianapolis Local Public Improvement Bond Bank | | | | | | | | | | |
| 5.75% | | 01/01/38 | | | 7,000,000 | | | | 7,949,130 | | | |
| | | | | | | | | 13,338,080 | | | |
| | |
| Iowa — 1.0% | | | | | | | |
| | | |
Iowa Finance Authority | | | | | | | | | | |
| 5.00% | | 12/01/19 | | | 10,000,000 | | | | 10,559,300 | | | |
| 5.25% | | 12/01/25 | | | 5,000,000 | | | | 5,417,300 | | | |
| | | | | | | | | 15,976,600 | | | |
| | |
| Kentucky — 1.3% | | | | | | | |
| | | |
Kentucky State Property & Building Commission (AGC Insured) | | | | | | | | | | |
| 5.25% | | 02/01/27 | | | 10,665,000 | | | | 12,057,636 | | | (m) |
Louisville & Jefferson County Metropolitan Sewer District | | | | | | | | | | |
| 5.00% | | 05/15/30 | | | 8,040,000 | | | | 9,315,867 | | | |
| | | | | | | | | 21,373,503 | | | |
| | |
| Louisiana — 1.6% | | | | | | | |
| | | |
City of New Orleans LA Sewerage Service Revenue | | | | | | | | | | |
| 5.00% | | 06/01/44 | | | 5,100,000 | | | | 5,639,376 | | | |
See Notes to Schedules of Investments and Notes to Financial Statements.
45
| | |
| Elfun Tax-Exempt Income Fund | | December 31, 2014 |
| | | | | | | | | | | | |
| | | | | Principal
Amount | | | Fair
Value | | | |
| | | |
East Baton Rouge Sewerage Commission | | | | | | | | | | |
| 5.00% | | 02/01/39 | | $ | 4,000,000 | | | $ | 4,645,440 | | | |
Louisiana Local Government Environmental Facilities & Community Development Authority | | | | | | | | | | |
| 5.00% | | 02/01/44 | | | 4,000,000 | | | | 4,482,520 | | | |
State of Louisiana | | | | | | | | | | |
| 5.00% | | 09/01/19 | | | 10,050,000 | | | | 11,683,929 | | | (h) |
| | | | | | | | | 26,451,265 | | | |
| | |
| Maine — 0.3% | | | | | | | |
| | | |
Maine Health & Higher Educational Facilities Authority | | | | | | | | | | |
| 5.25% | | 07/01/21 | | | 270,000 | | | | 323,919 | | | (l) |
| 5.25% | | 07/01/21 | | | 1,520,000 | | | | 1,787,566 | | | |
Maine Turnpike Authority | | | | | | | | | | |
| 5.00% | | 07/01/42 | | | 1,000,000 | | | | 1,129,630 | | | |
| 6.00% | | 07/01/34 | | | 1,250,000 | | | | 1,465,275 | | | |
| | | | | | | | | 4,706,390 | | | |
| | |
| Maryland — 3.4% | | | | | | | |
| | | |
City of Baltimore | | | | | | | | | | |
| 5.00% | | 07/01/38 | | | 9,375,000 | | | | 10,802,437 | | | |
County of Baltimore | | | | | | | | | | |
| 5.00% | | 02/01/23 | | | 7,525,000 | | | | 9,099,983 | | | (h) |
County of Prince George’s | | | | | | | | | | |
| 5.00% | | 09/15/24 - 09/15/25 | | | 8,790,000 | | | | 10,570,049 | | | (h) |
Maryland Economic Development Corp. | | | | | | | | | | |
| 5.75% | | 06/01/35 | | | 3,000,000 | | | | 3,218,040 | | | |
Maryland Health & Higher Educational Facilities Authority | | | | | | | | | | |
| 5.00% | | 07/01/34 - 10/01/45 | | | 7,400,000 | | | | 8,234,548 | | | |
State of Maryland | | | | | | | | | | |
| 5.00% | | 11/01/18 | | | 4,000,000 | | | | 4,589,960 | | | (h) |
Washington Suburban Sanitary Commission | | | | | | | | | | |
| 4.50% | | 06/01/26 | | | 8,470,000 | | | | 9,429,143 | | | (h) |
| | | | | | | | | 55,944,160 | | | |
| | | | | | | | | | | | |
| | | | | Principal
Amount | | | Fair
Value | | | |
| | |
| Massachusetts — 5.9% | | | | | | | |
| | | |
Commonwealth of Massachusetts | | | | | | | | | | |
| 5.00% | | 06/15/27 | | $ | 15,000,000 | | | $ | 18,419,400 | | | |
Massachusetts Department of Transportation | | | | | | | | | | |
| 5.00% | | 01/01/37 | | | 11,130,000 | | | | 12,105,322 | | | |
Massachusetts Development Finance Agency | | | | | | | | | | |
| 5.00% | | 10/01/46 | | | 6,250,000 | | | | 7,156,312 | | | |
Massachusetts Health & Educational Facilities Authority | | | | | | | | | | |
| 5.00% | | 07/01/34 - 07/15/35 | | | 17,000,000 | | | | 18,641,680 | | | |
| 5.50% | | 11/15/36 | | | 4,000,000 | | | | 4,666,320 | | | |
| 5.75% | | 07/01/39 | | | 5,000,000 | | | | 5,537,700 | | | |
Massachusetts School Building Authority | | | | | | | | | | |
| 5.00% | | 08/15/28 - 05/15/43 | | | 8,170,000 | | | | 9,548,680 | | | |
Massachusetts Water Resources Authority | | | | | | | | | | |
| 5.00% | | 08/01/32 - 08/01/41 | | | 7,140,000 | | | | 8,277,624 | | | |
| 6.50% | | 07/15/19 | | | 10,275,000 | | | | 11,542,524 | | | (k) |
| | | | | | | | | 95,895,562 | | | |
| | |
| Michigan — 1.0% | | | | | | | |
| | | |
Lansing Board of Water & Light | | | | | | | | | | |
| 5.00% | | 07/01/37 | | | 3,500,000 | | | | 3,925,110 | | | |
State of Michigan (AGMC Insured) | | | | | | | | | | |
| 5.25% | | 09/15/27 | | | 5,000,000 | | | | 5,536,100 | | | (m) |
State of Michigan Trunk Line Revenue | | | | | | | | | | |
| 5.50% | | 11/01/18 | | | 6,000,000 | | | | 6,955,380 | | | |
| | | | | | | | | 16,416,590 | | | |
| | |
| Minnesota — 0.1% | | | | | | | |
| | | |
University of Minnesota | | | | | | | | | | |
| 5.00% | | 01/01/39 | | | 1,250,000 | | | | 1,453,125 | | | |
See Notes to Schedules of Investments and Notes to Financial Statements.
46
| | |
| Elfun Tax-Exempt Income Fund | | December 31, 2014 |
| | | | | | | | | | | | |
| | | | | Principal
Amount | | | Fair
Value | | | |
| |
| Missouri — 1.9% | | | |
| | | |
Bi-State Development Agency of the Missouri- Illinois Metropolitan District | | | | | | | | | | |
| 5.00% | | 10/01/44 | | $ | 8,010,000 | | | $ | 8,938,439 | | | |
Metropolitan St. Louis Sewer District | | | | | | | | | | |
| 5.00% | | 05/01/34 - 05/01/43 | | | 7,500,000 | | | | 8,631,625 | | | |
Missouri Highway & Transportation Commission | | | | | | | | | | |
| 5.00% | | 05/01/21 | | | 4,610,000 | | | | 5,408,682 | | | |
Missouri Joint Municipal Electric Utility Commission | | | | | | | | | | |
| 5.00% | | 01/01/34 | | | 1,950,000 | | | | 2,253,537 | | | |
| 5.75% | | 01/01/29 | | | 4,500,000 | | | | 4,744,080 | | | (l) |
Missouri State Environmental Improvement & Energy Resources Authority | | | | | | | | | | |
| 5.00% | | 01/01/24 | | | 525,000 | | | | 526,481 | | | |
| | | | | | | | | 30,502,844 | | | |
| | |
| Nebraska — 0.7% | | | | | | | |
| | | |
Omaha Public Power District | | | | | | | | | | |
| 4.00% | | 02/01/34 - 02/01/36 | | | 11,000,000 | | | | 11,630,680 | | | |
| | |
| Nevada — 0.5% | | | | | | | |
| | | |
City of Las Vegas (AGMC Insured) | | | | | | | | | | |
| 5.55% | | 06/01/16 | | | 1,305,000 | | | | 1,330,722 | | | (m) |
Las Vegas Valley Water District | | | | | | | | | | |
| 5.00% | | 06/01/31 | | | 6,360,000 | | | | 7,544,486 | | | (c) |
| | | | | | | | | 8,875,208 | | | |
| | |
| New Jersey — 5.6% | | | | | | | |
| | | |
Cape May County Municipal Utilities Authority (AGMC Insured) | | | | | | | | | | |
| 5.75% | | 01/01/15 | | | 5,000,000 | | | | 5,000,000 | | | (h,m) |
| | | | | | | | | | | | |
| | | | | Principal
Amount | | | Fair
Value | | | |
| | | | |
| 5.75% | | 01/01/16 | | $ | 3,500,000 | | | $ | 3,689,490 | | | (m) |
New Jersey Economic Development Authority | | | | | | | | | | |
| 5.50% | | 12/15/29 | | | 5,000,000 | | | | 5,600,000 | | | |
New Jersey Educational Facilities Authority | | | | | | | | | | |
| 6.00% | | 12/01/17 | | | 10,000,000 | | | | 11,224,500 | | | (k) |
New Jersey Higher Education Student Assistance Authority | | | | | | | | | | |
| 5.63% | | 06/01/30 | | | 7,500,000 | | | | 8,338,800 | | | |
New Jersey State Turnpike Authority | | | | | | | | | | |
| 5.00% | | 01/01/33 - 01/01/38 | | | 15,000,000 | | | | 17,222,850 | | | |
| 5.25% | | 01/01/40 | | | 10,000,000 | | | | 11,133,600 | | | |
New Jersey State Turnpike Authority (AMBAC Insured) | | | | | | | | | | |
| 6.50% | | 01/01/16 | | | 13,610,000 | | | | 14,008,063 | | | (k,m) |
| 6.50% | | 01/01/16 | | | 5,135,000 | | | | 5,441,919 | | | (m) |
New Jersey Transportation Trust Fund Authority | | | | | | | | | | |
| 5.25% | | 06/15/36 | | | 8,600,000 | | | | 9,491,390 | | | |
| | | | | | | | | 91,150,612 | | | |
|
| New Mexico — 1.5% |
| | |
New Mexico Finance Authority | | | | | | | |
| 5.00% | | 06/15/18 - 06/15/23 | | | 9,200,000 | | | | 10,602,470 | | | |
| 5.00% | | 12/15/26 | | | 12,000,000 | | | | 13,047,000 | | | (l) |
| | | | | | | | | 23,649,470 | | | |
|
| New York — 8.6% |
| | |
Long Island Power Authority | | | | | | | |
| 6.00% | | 05/01/33 | | | 7,500,000 | | | | 8,789,550 | | | |
Metropolitan Transportation Authority | | | | | | | | | | |
| 5.00% | | 11/15/29 | | | 5,000,000 | | | | 5,929,750 | | | |
Nassau County Sewer & Storm Water Finance Authority | | | | | | | | | | |
| 5.00% | | 10/01/29 - 10/01/30 | | | 2,975,000 | | | | 3,580,324 | | | |
New York City Transitional Finance Authority Building Aid Revenue | | | | | | | | | | |
| 5.50% | | 07/15/31 | | | 10,000,000 | | | | 11,302,100 | | | |
See Notes to Schedules of Investments and Notes to Financial Statements.
47
| | |
| Elfun Tax-Exempt Income Fund | | December 31, 2014 |
| | | | | | | | | | | | |
| | | | | Principal
Amount | | | Fair
Value | | | |
| | | |
New York City Transitional Finance Authority Future Tax Secured Revenue | | | | | | | | | | |
| 5.00% | | 11/01/21 - 11/01/39 | | $ | 28,220,000 | | | $ | 32,732,689 | | | |
New York City Water & Sewer System | | | | | | | | | | |
| 5.00% | | 06/15/36 - 06/15/45 | | | 17,000,000 | | | | 19,632,640 | | | |
New York Liberty Development Corp. | | | | | | | | | | |
| 5.00% | | 11/15/44 | | | 5,000,000 | | | | 5,543,600 | | | |
| 5.13% | | 01/15/44 | | | 10,000,000 | | | | 11,003,900 | | | |
New York State Dormitory Authority | | | | | | | | | | |
| 5.00% | | 07/01/44 | | | 1,000,000 | | | | 1,131,400 | | | (c) |
| 5.50% | | 07/01/36 - 05/01/37 | | | 4,000,000 | | | | 4,569,085 | | | |
| 6.00% | | 07/01/40 | | | 2,000,000 | | | | 2,346,700 | | | |
New York State Thruway Authority | | | | | | | | | | |
| 5.00% | | 05/01/19 | | | 6,000,000 | | | | 6,866,880 | | | |
New York State Urban Development Corp. | | | | | | | | | | |
| 5.50% | | 01/01/19 | | | 9,000,000 | | | | 10,463,760 | | | |
Port Authority of New York & New Jersey | | | | | | | | | | |
| 5.00% | | 09/01/36 | | | 1,000,000 | | | | 1,172,910 | | | |
Triborough Bridge & Tunnel Authority | | | | | | | | | | |
| 5.00% | | 11/15/26 | | | 10,000,000 | | | | 11,339,300 | | | |
Westchester County Healthcare Corp. | | | | | | | | | | |
| 6.13% | | 11/01/37 | | | 2,500,000 | | | | 2,895,400 | | | |
| | | | | | | | | 139,299,988 | | | |
|
| North Carolina — 2.3% |
| | | |
Cape Fear Public Utility Authority Water & Sewer System Revenue | | | | | | | | | | |
| 5.00% | | 06/01/40 | | | 1,215,000 | | | | 1,417,103 | | | |
City of Charlotte | | | | | | | | | | |
| 5.00% | | 06/01/23 | | | 4,320,000 | | | | 5,089,521 | | | (h) |
City of Charlotte NC Storm Water Revenue | | | | | | | | | | |
| 4.00% | | 12/01/43 | | | 3,790,000 | | | | 4,005,878 | | | |
| | | | | | | | | | | | |
| | | | | Principal
Amount | | | Fair
Value | | | |
| | | |
City of Charlotte Water & Sewer System Revenue | | | | | | | | | | |
| 5.00% | | 07/01/38 | | $ | 5,000,000 | | | $ | 5,592,200 | | | |
North Carolina Eastern Municipal Power Agency | | | | | | | | | | |
| 5.00% | | 01/01/26 | | | 5,000,000 | | | | 5,643,600 | | | |
North Carolina State University at Raleigh | | | | | | | | | | |
| 5.00% | | 10/01/42 | | | 2,500,000 | | | | 2,898,300 | | | |
North Carolina Turnpike Authority | | | | | | | | | | |
| 5.00% | | 07/01/30 | | | 3,230,000 | | | | 3,721,154 | | | |
State of North Carolina | | | | | | | | | | |
| 4.75% | | 05/01/30 | | | 4,130,000 | | | | 4,655,832 | | | |
University of North Carolina at Greensboro | | | | | | | | | | |
| 5.00% | | 04/01/36 | | | 4,000,000 | | | | 4,507,480 | | | |
| | | | | | | | | 37,531,068 | | | |
|
| Ohio — 5.1% |
| | | |
American Municipal Power Inc. | | | | | | | | | | |
| 5.00% | | 02/15/38 | | | 5,000,000 | | | | 5,415,150 | | | |
City of Cincinnati Water System Revenue | | | | | | | | | | |
| 5.00% | | 12/01/36 | | | 2,500,000 | | | | 2,893,950 | | | |
City of Cleveland Airport System Revenue | | | | | | | | | | |
| 5.00% | | 01/01/29 - 01/01/31 | | | 4,225,000 | | | | 4,666,366 | | | |
City of Columbus | | | | | | | | | | |
| 5.00% | | 07/01/26 - 08/15/30 | | | 28,790,000 | | | | 34,769,807 | | | (h) |
City of Columbus Sewerage Revenue | | | | | | | | | | |
| 4.50% | | 06/01/32 | | | 700,000 | | | | 746,242 | | | |
| 4.75% | | 06/01/31 | | | 5,000,000 | | | | 5,562,500 | | | (l) |
Cuyahoga Community College District | | | | | | | | | | |
| 5.00% | | 08/01/26 | | | 1,800,000 | | | | 2,037,726 | | | |
Northeast Ohio Regional Sewer District | | | | | | | | | | |
| 5.00% | | 11/15/38 | | | 12,000,000 | | | | 13,790,880 | | | |
Ohio Higher Educational Facility Commission | | | | | | | | | | |
| 6.25% | | 05/01/38 | | | 5,000,000 | | | | 5,789,500 | | | |
See Notes to Schedules of Investments and Notes to Financial Statements.
48
| | |
| Elfun Tax-Exempt Income Fund | | December 31, 2014 |
| | | | | | | | | | | | |
| | | | | Principal
Amount | | | Fair
Value | | | |
| | | |
Ohio State Turnpike Commission | | | | | | | | | | |
| 5.25% | | 02/15/39 | | $ | 6,000,000 | | | $ | 6,895,200 | | | |
| | | | | | | | | 82,567,321 | | | |
|
| Oklahoma — 0.8% |
| | | |
Oklahoma Capital Improvement Authority | | | | | | | | | | |
| 5.00% | | 07/01/28 - 07/01/29 | | | 5,000,000 | | | | 6,021,730 | | | |
Oklahoma Municipal Power Authority (FGIC Insured) | | | | | | | | | | |
| 4.50% | | 01/01/47 | | | 2,000,000 | | | | 2,033,040 | | | (m) |
Oklahoma Turnpike Authority | | | | | | | | | | |
| 5.00% | | 01/01/28 | | | 3,500,000 | | | | 4,081,000 | | | |
| | | | | | | | | 12,135,770 | | | |
|
| Oregon — 0.7% |
| | | |
Washington & Multnomah Counties School District No 48J Beaverton | | | | | | | | | | |
| 5.00% | | 06/15/33 - 06/15/34 | | | 9,000,000 | | | | 10,760,030 | | | (h) |
|
| Pennsylvania — 3.7% |
| | | |
City of Philadelphia Water & Wastewater Revenue | | | | | | | | | | |
| 5.00% | | 01/01/36 | | | 10,000,000 | | | | 11,071,100 | | | |
Delaware River Port Authority | | | | | | | | | | |
| 5.00% | | 01/01/29 | | | 5,000,000 | | | | 5,855,550 | | | |
Pennsylvania Higher Educational Facilities Authority | | | | | | | | | | |
| 5.25% | | 08/15/25 | | | 1,750,000 | | | | 2,080,120 | | | |
Pennsylvania Turnpike Commission | | | | | | | |
| 1.00% | | 12/01/34 | | | 12,000,000 | | | | 12,898,800 | | | |
| 5.00% | | 06/01/29 - 12/01/32 | | | 11,500,000 | | | | 12,736,620 | | | |
| 5.25% | | 06/01/39 | | | 9,500,000 | | | | 10,449,240 | | | |
Philadelphia Authority for Industrial Development | | | | | | | | | | |
| 5.00% | | 07/01/42 | | | 4,000,000 | | | | 4,574,480 | | | |
| | | | | | | | | 59,665,910 | | | |
| | | | | | | | | | | | |
| | | | | Principal
Amount | | | Fair
Value | | | |
|
| Puerto Rico — 0.2% |
| | | |
Puerto Rico Sales Tax Financing Corp. | | | | | | | | | | |
| 5.50% | | 08/01/28 | | $ | 5,000,000 | | | $ | 3,962,100 | | | |
|
| Rhode Island — 0.2% |
| | | |
Rhode Island Health & Educational Building Corp. | | | | | | | | | | |
| 6.25% | | 09/15/34 | | | 1,300,000 | | | | 1,500,642 | | | |
| 6.50% | | 09/15/28 | | | 1,000,000 | | | | 1,171,020 | | | |
| | | | | | | | | 2,671,662 | | | |
|
| South Carolina — 3.0% |
| | | |
Charleston Educational Excellence Finance Corp. | | | | | | | | | | |
| 5.25% | | 12/01/27 - 12/01/30 | | | 21,850,000 | | | | 22,852,915 | | | (l) |
Piedmont Municipal Power Agency | | | | | | | | | | |
| 5.00% | | 01/01/25 | | | 2,315,000 | | | | 2,674,242 | | | |
Piedmont Municipal Power Agency (AGC Insured) | | | | | | | | | | |
| 5.75% | | 01/01/34 | | | 5,500,000 | | | | 6,438,465 | | | (m) |
South Carolina State Public Service Authority | | | | | | | | | | |
| 5.50% | | 01/01/38 | | | 14,970,000 | | | | 17,078,824 | | | |
| | | | | | | | | 49,044,446 | | | |
|
| Tennessee — 1.4% |
| | | |
County of Shelby | | | | | | | | | | |
| 5.00% | | 03/01/21 | | | 3,500,000 | | | | 4,097,590 | | | (h) |
Metropolitan Government of Nashville & Davidson County | | | | | | | | | | |
| 5.00% | | 05/15/25 | | | 10,000,000 | | | | 11,031,200 | | | (h,l) |
State of Tennessee | | | | | | | | | | |
| 5.00% | | 05/01/19 | | | 1,000,000 | | | | 1,135,890 | | | (h,l) |
Tennessee State School Bond Authority | | | | | | | | | | |
| 5.00% | | 11/01/35 - 11/01/37 | | | 4,950,000 | | | | 5,875,630 | | | |
| | | | | | | | | 22,140,310 | | | |
|
| Texas — 7.3% |
Board of Regents of the University of Texas System | | | | | | | | | | |
| 5.00% | | 07/01/41 | | | 3,000,000 | | | | 3,478,230 | | | |
See Notes to Schedules of Investments and Notes to Financial Statements.
49
| | |
| Elfun Tax-Exempt Income Fund | | December 31, 2014 |
| | | | | | | | | | | | |
| | | | | Principal
Amount | | | Fair
Value | | | |
| | | |
City of Austin Water & Wastewater System Revenue | | | | | | | | | | |
| 5.00% | | 11/15/42 | | $ | 13,595,000 | | | $ | 15,536,638 | | | |
City of Austin Water & Wastewater System Revenue (AMBAC Insured) | | | | | | | | | | |
| 5.50% | | 11/15/16 | | | 5,450,000 | | | | 5,950,201 | | | (m) |
City of Houston Utility System Revenue | | | | | | | | | | |
| 5.00% | | 05/15/28 - 11/15/33 | | | 10,470,000 | | | | 12,261,829 | | | |
| 5.25% | | 11/15/30 - 11/15/31 | | | 12,000,000 | | | | 14,058,700 | | | |
Dallas/Fort Worth International Airport | | | | | | | | | | |
| 5.25% | | 11/01/29 | | | 5,000,000 | | | | 5,968,500 | | | |
Harris County-Houston Sports Authority | | | | | | | | | | |
| 5.00% | | 11/15/30 | | | 2,000,000 | | | | 2,307,720 | | | |
North Texas Tollway Authority | | | | | | | | | | |
| 5.00% | | 09/01/31 | | | 3,500,000 | | | | 4,028,465 | | | |
| 5.75% | | 01/01/38 - 01/01/40 | | | 21,475,000 | | | | 23,622,124 | | | |
| 6.00% | | 01/01/38 | | | 5,000,000 | | | | 5,897,300 | | | |
Texas Transportation Commission State Highway Fund | | | | | | | | | | |
| 5.00% | | 04/01/23 | | | 9,750,000 | | | | 11,993,962 | | | |
The University of Texas System | | | | | | | | | | |
| 5.00% | | 08/15/26 | | | 10,000,000 | | | | 12,678,400 | | | |
| | | | | | | | | 117,782,069 | | | |
|
| Utah — 1.7% |
| | | |
County of Utah Transportation Sales Tax Revenue (AGMC Insured) | | | | | | | | | | |
| 4.00% | | 12/01/37 - 12/01/38 | | | 11,830,000 | | | | 12,409,425 | | | (m) |
Utah State Board of Regents | | | | | | | |
| 5.00% | | 11/01/30 | | | 4,000,000 | | | | 4,522,120 | | | |
Utah Transit Authority | | | | | | | |
| 5.00% | | 06/15/42 | | | 10,000,000 | | | | 10,961,300 | | | |
| | | | | | | | | 27,892,845 | | | |
|
| Virginia — 1.2% |
| | | |
City of Richmond | | | | | | | | | | |
| 5.00% | | 01/15/38 | | | 2,000,000 | | | | 2,306,500 | | | |
| | | | | | | | | | | | |
| | | | | Principal
Amount | | | Fair
Value | | | |
| | | |
Virginia Commonwealth Transportation Board | | | | | | | | | | |
| 5.00% | | 03/15/23 | | $ | 9,000,000 | | | $ | 10,916,820 | | | |
Virginia Resources Authority | | | | | | | | | | |
| 5.25% | | 11/01/38 | | | 400,000 | | | | 462,568 | | | (l) |
| 5.25% | | 11/01/38 | | | 4,600,000 | | | | 5,134,382 | | | |
| | | | | | | | | 18,820,270 | | | |
| | | |
Total Municipal Bonds and Notes
(Cost $1,480,087,766) | | | | | | | 1,608,548,861 | | | |
Short-Term Investments — 1.8% | | | |
| | | |
State Street Institutional U.S. Government Money Market Fund — Premier Class 0.00%
(Cost $28,548,000) | | | | | | | 28,548,000 | | | (d,h,o) |
| | | |
Total Investments
(Cost $1,508,635,766) | | | | | | | 1,637,096,861 | | | |
| | | |
Liabilities in Excess of Other Assets, net —(0.8)% | | | | | | | (12,831,101) | | | |
| | | | | | | | | | | | |
| | | |
NET ASSETS — 100.0% | | | | | | $ | 1,624,265,760 | | | |
| | | | | | | | | | | | |
See Notes to Schedules of Investments and Notes to Financial Statements.
50
(Unaudited)


William M. Healey
Senior Vice President and Chief Investment Officer — Core Fixed Income Investments

Mark H. Johnson
Senior Vice President and Chief Investment Officer — Insurance and Long Duration
The Elfun Income Fund is co-managed by William M. Healey and Mark H. Johnson. Messrs. Healey and Johnson are each responsible for a portion of the Fund, the size of which is determined by consensus and adjusted on a periodic basis, if necessary. Although each portfolio manager manages his portion of the fund independent of the other, they are highly collaborative and communicative. See portfolio managers’ biographical information beginning on page 124.
| Q. | How did the Elfun Income Fund perform compared to its benchmark for the twelve-month period ended December 31, 2014? |
| A. | For the twelve-month period ended December 31, 2014, the Elfun Income Fund returned 5.75%. The Barclays Capital U.S. Aggregate Bond Index, the Fund’s benchmark, returned 5.97% and the Fund’s Morningstar peer group of 1,042 U.S. Intermediate-Term Funds returned an average of 5.13% over the same period. |
| Q. | What market factors affected the Fund’s performance? |
| A. | The market factors that most influenced the Fund’s total return over the last twelve months were the decline in U.S. treasury yields, particularly in ten to thirty year maturity bonds, and the backup in credit spreads in the second half of 2014. Negative GDP in the first quarter, due to poor weather, and a series of risk off events including the unrest between Russia and Ukraine, the growing insurgency of ISIS and the Ebola virus |
| | scare drove interest rates lower in the first half of the year. Despite stronger U.S. economic fundamentals in the second and third quarters, U.S. Treasury yields continued to decline in the second half of the year, predominantly due to growth concerns outside the U.S., disinflation fears, collapsing oil prices and lower comparative yields in Europe and Japan. The 30-year U.S. Treasury bond yield fell roughly 125 bps last year while the yield on the 2-year note increased nearly 30 bps, tied more to expectations for a Fed rate hike in 2015. Credit spreads, particularly high yield, widened with the drop in oil prices and fear of slowing global demand. Due to wider spreads in the second half of the year, high grade corporate bonds underperformed U.S. treasuries on a duration adjusted basis in 2014 and high yield debt underperformed the broader investment grade market by roughly 350 bps. |
| Q. | What were the primary drivers of Fund performance? |
| A. | The primary drivers of Fund performance relative to its benchmark were duration positioning and sector allocation. The duration of the Fund was tactically traded between neutral and 1 year short relative to the benchmark which negatively impacted performance in the declining rate environment. The Fund’s non-index exposure to high yield debt was a drag on performance in the second half of the year due to negative returns in that sector during the period. In general, individual security selection in |
51
(Unaudited)
| | investment grade credit and mortgage-backed securities contributed positively to performance. |
| Q. | Were there any significant changes to the Fund during the period? |
| A. | The most significant change in Fund positioning during the period was the reduction in the non-index exposure to emerging market debt from roughly 5% to zero in the first quarter. The allocation to investment grade credit increased from neutral to 3% overweight and exposure to high yield debt increased from 6% to 10%. These changes occurred later during the year after credit spreads began to widen. While the Fund’s duration began and ended the year neutral relative to the benchmark, the position was tactically traded between neutral and 1 year short. |
52
(Unaudited)
Understanding Your Fund’s Expenses
As a shareholder of the Fund you incur ongoing costs. Ongoing costs include portfolio management fees, professional fees, administrative fees and other Fund expenses. The following example is intended to help you understand your ongoing costs (in dollars) of investing in the Fund and to compare these costs with the ongoing costs of investing in other mutual funds.
To illustrate these ongoing costs, we have provided an example and calculated the expenses paid by investors in units of the Fund during the period. The information in the following table is based on an investment of $1,000, which is invested at the beginning of the period and held for the entire six-month period ended December 31, 2014.
Actual Expenses
The first section of the table provides information about actual account values and actual expenses. You may use the information in this section, together with the amount you invested, to estimate the expenses that you paid over the period. To do so, simply divide your account value by $1,000 (for example, an $8,600 account value divided by $1,000 = 8.6), then multiply the result by the number given under the heading “Expenses paid during the
period” to estimate the expenses you paid on your account during the period.
Hypothetical Example for Comparison Purposes
The second section of the table provides information about hypothetical account values and hypothetical expenses based on the Fund’s actual expense ratio and an assumed rate of return of 5% per year before expenses, which is not the Fund’s actual return. The hypothetical account values and expenses may not be used to estimate the actual ending account balance or expenses you paid for the period. You may use this information to compare the ongoing costs of investing in the Fund and other funds. To do so, compare this 5% hypothetical example with the 5% hypothetical examples that appear in the shareholders reports of other funds.
Please note that the expenses shown in the table are meant to highlight and help you compare ongoing costs only and do not reflect transaction costs, such as sales charges or redemption fees, if any. Therefore, the second section of the table is useful in comparing ongoing costs only, and will not help you determine the relative total costs of owning different funds.
July 1, 2014 – December 31, 2014
| | | | | | | | | | | | |
| | | Account value at
the beginning of
the period ($) | | | Account value
at the end of
the period ($) | | | Expenses
paid during
the period ($)* | |
| | | |
Actual Fund Return | | | 1,000.00 | | | | 1,015.40 | | | | 1.32 | |
| | | |
Hypothetical 5% Return
(2.5% for the period) | | | 1,000.00 | | | | 1,023.90 | | | | 1.33 | |
| * | | Expenses are equal to the Fund’s annualized net expense ratio of 0.26%** (for the period July 1, 2014 – December 31, 2014), multiplied by the average account value over the period, multiplied by 184/365 (to reflect the one-half year period). |
| ** | | May differ from expense ratio disclosed in the financial highlights, which is calculated based on the entire fiscal year’s data. |
53
(Unaudited)
A mutual fund designed for investors who seek a high level of income consistent with prudent investment management and the preservation of capital. The Fund seeks to achieve its investment objective by investing at least 80% of its net assets under normal circumstances in debt securities. The Fund invests primarily in a variety of investment-grade debt securities, such as mortgage-backed securities, corporate bonds, U.S. Government securities and money market instruments.
as of December 31, 2014 as a % of Investments(b)(c)
| | | | |
| Moody’s / S&P Rating* | | Percentage of
Fair Value | |
Aaa / AAA | | | 12.60% | |
Aa / AA | | | 48.14% | |
A / A | | | 8.91% | |
Baa / BBB | | | 18.29% | |
Ba / BB and lower | | | 11.17% | |
NR / Other | | | 0.89% | |
| | | | 100.00% | |
as a % of Investments of $332,645 (in thousands) on December 31, 2014(b)(c)
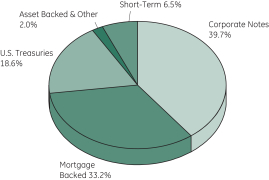
|
| Morningstar Performance Comparison |
Based on average annual returns for periods ended December 31, 2014
| | | | | | | | | | | | |
| | | One
Year | | | Five
Year | | | Ten
Year | |
Number of funds in peer group | | | 1,042 | | | | 811 | | | | 590 | |
Peer group average annual total return | | | 5.13 | % | | | 4.77 | % | | | 4.19 | % |
Morningstar Category in peer group: U.S. Intermediate-Term Bond | |
|
| Change in Value of a $10,000 Investment(a) |


|
| Average Annual Total Return |
for the periods ended December 31, 2014
| | | | | | | | | | | | | | | | |
| (Inception date: 12/31/84) | | | | | | | | | | | | |
| | | One
Year | | | Five
Year | | | Ten
Year | | | Ending value of a $10,000
investment (a) | |
| | | | |
Elfun Income Fund | | | 5.75% | | | | 5.33% | | | | 4.58% | | | | $15,648 | |
| | | | |
Barclays U.S. Aggregate
Bond Index | | | 5.97% | | | | 4.45% | | | | 4.71% | | | | $15,842 | |
| (a) | Ending value of a $10,000 investment for the ten-year period or since inception, whichever is less. |
| (b) | Fair Value basis is inclusive of short-term investment in State Street Institutional U.S. Government Money Market Fund Premier Class. |
| (c) | The securities information regarding holdings, allocations and other characteristics is presented to illustrate examples of securities that the Fund has bought and the diversity of areas in which the Fund may invest as of a particular date. It may not be representative of the Fund’s current or future investments and should not be construed as a recommendation to purchase or sell a particular security. |
| * | Moody’s Investors Services, Inc. (“Moody’s”) and Standard & Poor’s Corporation (“S&P”) are nationally recognized statistical rating organizations. The quality ratings represent the lower of Moody’s or S&P credit ratings. When a rating from only one of the rating agencies is available, that rating is used. Securities not rated by Moody’s or S&P are categorized as not rated. Credit qualitymeasures a bond issuer’s ability to repay interest and principal in a timely manner. Credit quality ratings assigned by a rating agency are subject to change periodically and are not absolute standards of quality. In formulating investment decisions for the Fund, GEAM develops its own analysis of the credit quality and risks associated with individual debt instruments, rather than relying exclusively on rating agency ratings. |
See Notes to Performance beginning on page 1 for further information, including an explanation of Morningstar peer categories.
Past performance does not predict future performance. The performance shown in the graphs and tables does not reflect the deduction of taxes that a shareholder would pay on Fund distributions or the redemption of Fund shares.
54
| | |
| Elfun Income Fund | | December 31, 2014 |
| | | | | | | | | | | | |
| | | | | Principal
Amount | | | Fair
Value | | | |
Bonds and Notes - 99.4%† | | | |
|
U.S. Treasuries — 19.7%
|
| | | |
U.S. Treasury Bonds | | | | | | | | | | |
| 3.00% | | 11/15/44 | | $ | 6,118,200 | | | $ | 6,429,849 | | | |
U.S. Treasury Notes | | | | | | | | | | |
| 0.50% | | 06/30/16 | | | 26,642,400 | | | | 26,650,712 | | | (h) |
| 0.88% | | 07/31/19 | | | 2,050,000 | | | | 1,986,417 | | | (h) |
| 1.50% | | 06/30/16 | | | 6,147,000 | | | | 6,239,684 | | | (h) |
| 1.50% | | 11/30/19 | | | 14,575,900 | | | | 14,483,664 | | | |
| 2.25% | | 11/15/24 | | | 5,915,700 | | | | 5,955,448 | | | |
| | | | | | | | | 61,745,774 | | | |
|
| Agency Mortgage Backed — 28.9% |
| | | |
Federal Home Loan Mortgage Corp. | | | | | | | | | | |
| 4.00% | | 05/01/44 | | | 3,988,076 | | | | 4,281,878 | | | |
| 4.50% | | 06/01/33 - 02/01/35 | | | 28,405 | | | | 30,789 | | | |
| 5.00% | | 07/01/35 - 06/01/41 | | | 1,552,288 | | | | 1,742,282 | | | |
| 5.50% | | 05/01/20 - 04/01/39 | | | 535,186 | | | | 603,175 | | | |
| 6.00% | | 04/01/17 - 11/01/37 | | | 999,479 | | | | 1,137,044 | | | |
| 6.50% | | 07/01/29 | | | 2,197 | | | | 2,496 | | | |
| 7.00% | | 10/01/16 - 08/01/36 | | | 152,842 | | | | 172,901 | | | |
| 7.50% | | 11/01/29 - 09/01/33 | | | 8,616 | | | | 9,262 | | | |
| 8.00% | | 11/01/30 | | | 8,956 | | | | 10,302 | | | |
Federal National Mortgage Assoc. | | | | | | | | | | |
| 2.10% | | 04/01/37 | | | 2,866 | | | | 2,959 | | | (i) |
| 3.00% | | 02/01/43 - 06/01/43 | | | 17,420,865 | | | | 17,655,388 | | | |
| 3.50% | | 11/01/42 - 02/01/43 | | | 4,151,144 | | | | 4,345,418 | | | |
| 4.00% | | 05/01/19 - 03/01/44 | | | 7,744,750 | | | | 8,303,493 | | | |
| 4.50% | | 05/01/18 - 01/01/41 | | | 7,731,215 | | | | 8,397,290 | | | |
| 5.00% | | 07/01/20 - 06/01/41 | | | 2,625,563 | | | | 2,945,296 | | | |
| 5.50% | | 06/01/20 - 01/01/39 | | | 2,200,489 | | | | 2,458,507 | | | |
| 6.00% | | 05/01/19 - 08/01/35 | | | 1,774,130 | | | | 2,032,717 | | | |
| 6.50% | | 07/01/17 - 08/01/36 | | | 254,838 | | | | 287,615 | | | |
| 7.00% | | 10/01/16 - 02/01/34 | | | 32,176 | | | | 34,361 | | | |
| 7.50% | | 02/01/15 - 12/01/33 | | | 96,785 | | | | 109,900 | | | |
| 8.00% | | 12/01/15 - 01/01/33 | | | 30,864 | | | | 35,037 | | | |
| 8.50% | | 04/01/30 | | | 4,965 | | | | 6,156 | | | |
| 9.00% | | 12/01/17 - 12/01/22 | | | 12,387 | | | | 13,517 | | | |
| 3.00% | | TBA | | | 4,170,000 | | | | 4,218,216 | | | (c) |
| | | | | | | | | | | | |
| | | | | Principal
Amount | | | Fair
Value | | | |
| | | | |
| 3.50% | | TBA | | $ | 6,789,718 | | | $ | 7,077,751 | | | (c) |
| 5.00% | | TBA | | | 2,719,000 | | | | 2,868,038 | | | (c) |
| 6.00% | | TBA | | | 2,132,000 | | | | 2,417,738 | | | (c) |
| 6.50% | | TBA | | | 878,000 | | | | 1,002,395 | | | (c) |
Government National Mortgage Assoc. | | | | | | | | | | |
| 3.00% | | 04/20/43 - 06/20/43 | | | 2,578,746 | | | | 2,640,268 | | | |
| 3.50% | | 05/20/43 | | | 3,434,519 | | | | 3,610,291 | | | |
| 4.00% | | 01/20/41 - 04/20/43 | | | 4,211,030 | | | | 4,525,469 | | | |
| 4.50% | | 08/15/33 - 03/20/41 | | | 2,229,101 | | | | 2,447,377 | | | |
| 5.00% | | 08/15/33 | | | 97,329 | | | | 108,196 | | | |
| 6.00% | | 04/15/27 - 09/15/36 | | | 411,245 | | | | 472,502 | | | |
| 6.50% | | 04/15/19 - 09/15/36 | | | 167,617 | | | | 191,695 | | | |
| 7.00% | | 11/15/27 - 10/15/36 | | | 99,631 | | | | 110,481 | | | |
| 7.50% | | 03/15/23 - 11/15/31 | | | 45,303 | | | | 47,731 | | | |
| 8.00% | | 09/15/27 - 06/15/30 | | | 33,622 | | | | 35,411 | | | |
| 8.50% | | 10/15/17 | | | 9,620 | | | | 10,207 | | | |
| 9.00% | | 11/15/16 - 12/15/21 | | | 23,410 | | | | 24,888 | | | |
| 3.00% | | TBA | | | 2,031,275 | | | | 2,077,233 | | | (c) |
| 5.00% | | TBA | | | 1,167,000 | | | | 1,285,227 | | | (c) |
| 5.50% | | TBA | | | 435,000 | | | | 485,654 | | | (c) |
| | | | | | | | | 90,274,551 | | | |
|
| Agency Collateralized Mortgage Obligations — 0.5% |
| | | |
Collateralized Mortgage Obligation Trust | | | | | | | | | | |
| 0.01% | | 11/01/18 | | | 2,896 | | | | 2,882 | | | (d,f) |
Federal Home Loan Mortgage Corp. | | | | | | | | | | |
| 0.08% | | 09/25/43 | | | 1,586,525 | | | | 4,641 | | | (g,i) |
Federal Home Loan Mortgage Corp. REMIC | | | | | | | | | | |
| 3.50% | | 11/15/24 - 11/15/30 | | | 1,375,017 | | | | 128,907 | | | (g) |
| 4.50% | | 03/15/18 | | | 33,100 | | | | 601 | | | (g) |
| 5.00% | | 10/15/18 - 02/15/38 | | | 55,566 | | | | 1,595 | | | (g) |
| 5.50% | | 06/15/33 | | | 98,419 | | | | 17,765 | | | (g) |
| 6.44% | | 08/15/25 | | | 531,120 | | | | 65,759 | | | (g,i) |
| 8.00% | | 04/15/20 | | | 1,640 | | | | 1,736 | | | |
Federal Home Loan Mortgage Corp. STRIPS | | | | | | | | | | |
| 1.47% | | 08/01/27 | | | 1,638 | | | | 1,511 | | | (d,f) |
| 8.00% | | 02/01/23 - 07/01/24 | | | 6,318 | | | | 1,396 | | | (g) |
See Notes to Schedules of Investments and Notes to Financial Statements.
55
| | |
| Elfun Income Fund | | December 31, 2014 |
| | | | | | | | | | | | |
| | | | | Principal
Amount | | | Fair
Value | | | |
| | | |
Federal National Mortgage Assoc. REMIC | | | | | | | | | | |
| 0.51% | | 12/25/22 | | $ | 4,250 | | | $ | 4,147 | | | (d,f) |
| 1.24% | | 12/25/42 | | | 383,707 | | | | 14,978 | | | (g,i) |
| 5.00% | | 02/25/40 - 09/25/40 | | | 808,830 | | | | 86,072 | | | (g) |
| 5.83% | | 07/25/38 | | | 140,684 | | | | 17,495 | | | (g,i) |
| 5.93% | | 09/25/42 | | | 2,287,116 | | | | 412,770 | | | (g,i) |
| 8.00% | | 05/25/22 | | | 9 | | | | 183 | | | (g) |
Federal National Mortgage Assoc. STRIPS | | | | | | | | | | |
| 1.87% | | 12/25/34 | | | 108,952 | | | | 101,448 | | | (d,f) |
| 4.50% | | 08/25/35 - 01/25/36 | | | 235,312 | | | | 34,139 | | | (g) |
| 5.00% | | 03/25/38 - 05/25/38 | | | 138,347 | | | | 19,363 | | | (g) |
| 5.50% | | 12/25/33 | | | 30,743 | | | | 5,824 | | | (g) |
| 6.00% | | 01/25/35 | | | 114,075 | | | | 19,552 | | | (g) |
| 7.50% | | 11/25/23 | | | 19,704 | | | | 3,228 | | | (g) |
| 8.00% | | 08/25/23 - 07/25/24 | | | 12,500 | | | | 2,790 | | | (g) |
| 8.50% | | 03/25/17 - 07/25/22 | | | 8,460 | | | | 1,113 | | | (g) |
| 9.00% | | 05/25/22 | | | 3,851 | | | | 774 | | | (g) |
Government National Mortgage Assoc. | | | | | | | | | | |
| 4.50% | | 10/20/37 - 08/16/39 | | | 1,429,508 | | | | 113,807 | | | (g) |
| 5.00% | | 12/20/35 - 09/20/38 | | | 881,997 | | | | 66,152 | | | (g) |
| 6.08% | | 02/20/40 | | | 1,926,267 | | | | 346,501 | | | (g,i) |
| | | | | | | | | 1,477,129 | | | |
|
| Asset Backed — 0.3% |
| | | |
Capital One Multi-Asset Execution Trust 2006-B1 | | | | | | | | | | |
| 0.44% | | 01/15/19 | | | 500,000 | | | | 498,358 | | | (i) |
Chase Funding Trust 2004-1 | | | | | | | | | | |
| 3.99% | | 11/25/33 | | | 320,033 | | | | 327,981 | | | (j) |
Ford Credit Auto Lease Trust 2013-A | | | | | | | | | | |
| 1.28% | | 06/15/16 | | | 150,000 | | | | 150,364 | | | |
| | | | | | | | | 976,703 | | | |
|
| Corporate Notes — 42.3% |
| | | |
21st Century Fox America Inc. | | | | | | | | | | |
| 6.65% | | 11/15/37 | | | 248,000 | | | | 331,144 | | | (h) |
ABB Finance USA Inc. | | | | | | | | | | |
| 1.63% | | 05/08/17 | | | 392,000 | | | | 393,292 | | | (h) |
| | | | | | | | | | | | |
| | | | | Principal
Amount | | | Fair
Value | | | |
| | | |
AbbVie Inc. | | | | | | | | | | |
| 1.75% | | 11/06/17 | | $ | 372,000 | | | $ | 372,808 | | | (h) |
| 2.00% | | 11/06/18 | | | 423,000 | | | | 421,581 | | | (h) |
ACCO Brands Corp. | | | | | | | | | | |
| 6.75% | | 04/30/20 | | | 426,000 | | | | 445,809 | | | (h) |
Actavis Funding SCS | | | | | | | | | | |
| 1.30% | | 06/15/17 | | | 489,000 | | | | 480,092 | | | |
| 4.85% | | 06/15/44 | | | 152,000 | | | | 154,240 | | | |
Activision Blizzard Inc. | | | | | | | | | | |
| 5.63% | | 09/15/21 | | | 428,000 | | | | 449,400 | | | (b,h) |
Aetna Inc. | | | | | | | | | | |
| 3.50% | | 11/15/24 | | | 208,000 | | | | 211,420 | | | |
Agrium Inc. | | | | | | | | | | |
| 4.90% | | 06/01/43 | | | 305,000 | | | | 315,933 | | | (h) |
Alcoa Inc. | | | | | | | | | | |
| 5.13% | | 10/01/24 | | | 85,000 | | | | 90,080 | | | (h) |
Alibaba Group Holding Ltd. | | | | | | | | | | |
| 3.60% | | 11/28/24 | | | 300,000 | | | | 297,553 | | | (b) |
| 4.50% | | 11/28/34 | | | 205,000 | | | | 210,743 | | | (b) |
Altria Group Inc. | | | | | | | | | | |
| 2.95% | | 05/02/23 | | | 210,000 | | | | 203,063 | | | (h) |
| 4.50% | | 05/02/43 | | | 210,000 | | | | 211,482 | | | (h) |
America Movil SAB de C.V. | | | | | | | | | | |
| 5.00% | | 03/30/20 | | | 609,000 | | | | 671,569 | | | (h) |
American Axle & Manufacturing Inc. | | | | | | | | | | |
| 6.25% | | 03/15/21 | | | 279,000 | | | | 292,950 | | | (h) |
| 6.63% | | 10/15/22 | | | 257,000 | | | | 272,420 | | | (h) |
| 7.75% | | 11/15/19 | | | 81,000 | | | | 90,720 | | | (h) |
American Campus Communities Operating Partnership LP | | | | | | | | | | |
| 4.13% | | 07/01/24 | | | 305,000 | | | | 308,074 | | | (h) |
American Electric Power Company Inc. | | | | | | | | | | |
| 2.95% | | 12/15/22 | | | 332,000 | | | | 325,670 | | | |
American Express Co. | | | | | | | | | | |
| 3.63% | | 12/05/24 | | | 415,000 | | | | 418,459 | | | |
American International Group Inc. | | | | | | | | | | |
| 3.38% | | 08/15/20 | | | 378,000 | | | | 392,667 | | | (h) |
| 4.13% | | 02/15/24 | | | 291,000 | | | | 309,773 | | | (h) |
| 4.50% | | 07/16/44 | | | 208,000 | | | | 219,754 | | | |
See Notes to Schedules of Investments and Notes to Financial Statements.
56
| | |
| Elfun Income Fund | | December 31, 2014 |
| | | | | | | | | | | | |
| | | | | Principal
Amount | | | Fair
Value | | | |
| | | |
American Seafoods Group LLC/ American Seafoods Finance Inc. | | | | | | | | | | |
| 10.75% | | 05/15/16 | | $ | 385,000 | | | $ | 344,575 | | | (b,h) |
American Tower Corp. (REIT) | | | | | | | | | | |
| 3.40% | | 02/15/19 | | | 513,000 | | | | 522,141 | | | (h) |
| 3.50% | | 01/31/23 | | | 122,000 | | | | 117,877 | | | (h) |
Amgen Inc. | | | | | | | | | | |
| 2.20% | | 05/22/19 | | | 612,000 | | | | 609,428 | | | (h) |
Amkor Technology Inc. | | | | | | | | | | |
| 6.63% | | 06/01/21 | | | 257,000 | | | | 254,430 | | | (h) |
Anadarko Petroleum Corp. | | | | | | | | | | |
| 6.20% | | 03/15/40 | | | 221,000 | | | | 258,891 | | | (h) |
Anheuser-Busch InBev Worldwide Inc. | | | | | | | | | | |
| 2.50% | | 07/15/22 | | | 515,000 | | | | 500,519 | | | (h) |
Anthem Inc. | | | | | | | | | | |
| 3.30% | | 01/15/23 | | | 211,000 | | | | 210,794 | | | (h) |
AP Moeller - Maersk A/S | | | | | | | | | | |
| 2.55% | | 09/22/19 | | | 290,000 | | | | 290,813 | | | (b,h) |
| 3.75% | | 09/22/24 | | | 290,000 | | | | 297,747 | | | (b,h) |
Apple Inc. | | | | | | | | | | |
| 2.85% | | 05/06/21 | | | 634,000 | | | | 648,556 | | | (h) |
| 3.45% | | 05/06/24 | | | 423,000 | | | | 442,993 | | | (h) |
Aramark Services Inc. | | | | | | | | | | |
| 5.75% | | 03/15/20 | | | 587,000 | | | | 606,077 | | | (h) |
Archer-Daniels-Midland Co. | | | | | | | | | | |
| 4.02% | | 04/16/43 | | | 234,000 | | | | 234,795 | | | (h) |
Ardagh Packaging Finance PLC/ Ardagh Holdings USA Inc. | | | | | | | | | | |
| 3.24% | | 12/15/19 | | | 450,000 | | | | 434,250 | | | (b,h,i) |
Ares Capital Corp. | | | | | | | | | | |
| 3.88% | | 01/15/20 | | | 290,000 | | | | 289,167 | | | |
Ascension Health | | | | | | | | | | |
| 4.85% | | 11/15/53 | | | 326,000 | | | | 368,251 | | | |
AT&T Inc. | | | | | | | | | | |
| 2.38% | | 11/27/18 | | | 458,000 | | | | 461,548 | | | (h) |
| 4.80% | | 06/15/44 | | | 244,000 | | | | 248,625 | | | (h) |
Bank of America Corp. | | | | | | | | | | |
| 1.70% | | 08/25/17 | | | 206,000 | | | | 206,047 | | | (h) |
| 2.00% | | 01/11/18 | | | 854,000 | | | | 853,351 | | | (h) |
| 2.60% | | 01/15/19 | | | 147,000 | | | | 148,143 | | | (h) |
| 4.00% | | 04/01/24 | | | 640,000 | | | | 666,384 | | | (h) |
| | | | | | | | | | | | |
| | | | | Principal
Amount | | | Fair
Value | | | |
| | | | |
| 4.10% | | 07/24/23 | | $ | 218,000 | | | $ | 229,587 | | | (h) |
| 4.25% | | 10/22/26 | | | 375,000 | | | | 374,158 | | | |
Bank of China Ltd. | | | | | | | | | | |
| 5.00% | | 11/13/24 | | | 200,000 | | | | 205,514 | | | (b) |
Barclays Bank PLC | | | | | | | | | | |
| 2.25% | | 05/10/17 | | | 1,186,000 | | | | 1,209,977 | | | (b,h) |
Barclays PLC | | | | | | | | | | |
| 2.75% | | 11/08/19 | | | 435,000 | | | | 432,342 | | | |
Bayer US Finance LLC | | | | | | | | | | |
| 2.38% | | 10/08/19 | | | 620,000 | | | | 622,460 | | | (b,h) |
| 3.38% | | 10/08/24 | | | 422,000 | | | | 429,415 | | | (b,h) |
Baytex Energy Corp. | | | | | | | | | | |
| 5.13% | | 06/01/21 | | | 257,000 | | | | 218,450 | | | (b) |
BB&T Corp. | | | | | | | | | | |
| 2.45% | | 01/15/20 | | | 416,000 | | | | 414,306 | | | |
Bed Bath & Beyond Inc. | | | | | | | | | | |
| 3.75% | | 08/01/24 | | | 203,000 | | | | 205,799 | | | (h) |
| 4.92% | | 08/01/34 | | | 61,000 | | | | 62,945 | | | (h) |
| 5.17% | | 08/01/44 | | | 285,000 | | | | 298,192 | | | (h) |
Berkshire Hathaway Energy Co. | | | | | | | | | | |
| 6.13% | | 04/01/36 | | | 330,000 | | | | 414,590 | | | (h) |
Berkshire Hathaway Finance Corp. | | | | | | | | | | |
| 2.90% | | 10/15/20 | | | 510,000 | | | | 522,945 | | | (h) |
| 3.00% | | 05/15/22 | | | 194,000 | | | | 197,028 | | | (h) |
Berkshire Hathaway Inc. | | | | | | | | | | |
| 4.50% | | 02/11/43 | | | 419,000 | | | | 458,223 | | | (h) |
BHP Billiton Finance USA Ltd. | | | | | | | | | | |
| 5.00% | | 09/30/43 | | | 212,000 | | | | 240,306 | | | (h) |
Bombardier Inc. | | | | | | | | | | |
| 4.75% | | 04/15/19 | | | 251,000 | | | | 251,941 | | | (b,h) |
| 6.00% | | 10/15/22 | | | 421,000 | | | | 425,210 | | | (b,h) |
| 7.75% | | 03/15/20 | | | 299,000 | | | | 324,415 | | | (b,h) |
BP Capital Markets PLC | | | | | | | | | | |
| 1.38% | | 05/10/18 | | | 211,000 | | | | 207,255 | | | (h) |
| 3.81% | | 02/10/24 | | | 833,000 | | | | 838,406 | | | (h) |
Branch Banking & Trust Co. | | | | | | | | | | |
| 3.80% | | 10/30/26 | | | 255,000 | | | | 259,981 | | | (h) |
Brocade Communications Systems Inc. | | | | | | | | | | |
| 4.63% | | 01/15/23 | | | 152,000 | | | | 145,920 | | | (h) |
See Notes to Schedules of Investments and Notes to Financial Statements.
57
| | |
| Elfun Income Fund | | December 31, 2014 |
| | | | | | | | | | | | |
| | | | | Principal
Amount | | | Fair
Value | | | |
| | | |
Building Materials Corporation of America | | | | | | | | | | |
| 5.38% | | 11/15/24 | | $ | 257,000 | | | $ | 256,358 | | | (b) |
Cadence Design Systems Inc. | | | | | | | | | | |
| 4.38% | | 10/15/24 | | | 415,000 | | | | 421,658 | | | (h) |
Calpine Corp. | | | | | | | | | | |
| 5.75% | | 01/15/25 | | | 251,000 | | | | 254,138 | | | (h) |
| 5.88% | | 01/15/24 | | | 306,000 | | | | 325,890 | | | (b,h) |
Caterpillar Inc. | | | | | | | | | | |
| 4.30% | | 05/15/44 | | | 211,000 | | | | 225,322 | | | (h) |
Catholic Health Initiatives | | | | | | | | | | |
| 2.60% | | 08/01/18 | | | 125,000 | | | | 126,634 | | | |
| 4.35% | | 11/01/42 | | | 130,000 | | | | 129,066 | | | |
CBS Corp. | | | | | | | | | | |
| 3.70% | | 08/15/24 | | | 319,000 | | | | 318,126 | | | (h) |
CCOH Safari LLC | | | | | | | | | | |
| 5.50% | | 12/01/22 | | | 171,000 | | | | 173,565 | | | |
| 5.75% | | 12/01/24 | | | 257,000 | | | | 259,891 | | | |
Cequel Capital Corp. | | | | | | | | | | |
| 5.13% | | 12/15/21 | | | 570,000 | | | | 552,900 | | | (b,h) |
CF Industries Inc. | | | | | | | | | | |
| 5.38% | | 03/15/44 | | | 212,000 | | | | 228,726 | | | (h) |
Chesapeake Energy Corp. | | | | | | | | | | |
| 3.25% | | 03/15/16 | | | 240,000 | | | | 239,400 | | | (h) |
| 5.38% | | 06/15/21 | | | 428,000 | | | | 427,732 | | | (h) |
Citigroup Inc. | | | | | | | | | | |
| 1.75% | | 05/01/18 | | | 419,000 | | | | 414,098 | | | (h) |
| 5.50% | | 09/13/25 | | | 608,000 | | | | 672,755 | | | (h) |
CMS Energy Corp. | | | | | | | | | | |
| 4.88% | | 03/01/44 | | | 209,000 | | | | 228,646 | | | (h) |
CNA Financial Corp. | | | | | | | | | | |
| 5.88% | | 08/15/20 | | | 326,000 | | | | 372,141 | | | (h) |
CNOOC Nexen Finance 2014 ULC | | | | | | | | | | |
| 4.25% | | 04/30/24 | | | 423,000 | | | | 437,669 | | | (h) |
Cogeco Cable Inc. | | | | | | | | | | |
| 4.88% | | 05/01/20 | | | 400,000 | | | | 400,000 | | | (b,h) |
Comcast Corp. | | | | | | | | | | |
| 4.20% | | 08/15/34 | | | 206,000 | | | | 215,403 | | | (h) |
| 4.75% | | 03/01/44 | | | 209,000 | | | | 232,908 | | | (h) |
Commonwealth Bank of Australia | | | | | | | | | | |
| 0.75% | | 01/15/16 | | | 547,000 | | | | 546,939 | | | (b,h) |
| | | | | | | | | | | | |
| | | | | Principal
Amount | | | Fair
Value | | | |
| | | |
ConocoPhillips Co. | | | | | | | | | | |
| 3.35% | | 11/15/24 | | $ | 416,000 | | | $ | 420,304 | | | |
Constellation Brands Inc. | | | | | | | | | | |
| 7.25% | | 09/01/16 | | | 400,000 | | | | 432,000 | | | (h) |
Continental Resources Inc. | | | | | | | | | | |
| 4.90% | | 06/01/44 | | | 203,000 | | | | 175,932 | | | (h) |
Corp Andina de Fomento | | | | | | | | | | |
| 4.38% | | 06/15/22 | | | 604,000 | | | | 649,214 | | | (h) |
Corporate Office Properties LP (REIT) | | | | | | | | | | |
| 3.60% | | 05/15/23 | | | 399,000 | | | | 383,378 | | | (h) |
| 3.70% | | 06/15/21 | | | 204,000 | | | | 203,117 | | | (h) |
Cott Beverages Inc. | | | | | | | | | | |
| 5.38% | | 07/01/22 | | | 257,000 | | | | 235,798 | | | (b) |
COX Communications Inc. | | | | | | | | | | |
| 4.70% | | 12/15/42 | | | 92,000 | | | | 91,918 | | | (b,h) |
Credit Suisse AG | | | | | | | | | | |
| 2.60% | | 05/27/16 | | | 405,000 | | | | 414,666 | | | (b,h) |
Crown Americas LLC/Crown Americas Capital Corp. IV | | | | | | | | | | |
| 4.50% | | 01/15/23 | | | 166,000 | | | | 161,020 | | | (h) |
CSX Corp. | | | | | | | | | | |
| 4.50% | | 08/01/54 | | | 207,000 | | | | 216,793 | | | (h) |
CVS Health Corp. | | | | | | | | | | |
| 2.25% | | 08/12/19 | | | 618,000 | | | | 615,419 | | | (h) |
Daimler Finance North America LLC | | | | | | | | | | |
| 2.38% | | 08/01/18 | | | 628,000 | | | | 636,811 | | | (b,h) |
DaVita HealthCare Partners Inc. | | | | | | | | | | |
| 5.13% | | 07/15/24 | | | 171,000 | | | | 174,420 | | | (h) |
Denbury Resources Inc. | | | | | | | | | | |
| 6.38% | | 08/15/21 | | | 475,000 | | | | 451,250 | | | (h) |
Dexia Credit Local S.A. | | | | | | | | | | |
| 2.25% | | 01/30/19 | | | 843,000 | | | | 853,641 | | | (b,h) |
Diageo Capital PLC | | | | | | | | | | |
| 1.13% | | 04/29/18 | | | 419,000 | | | | 410,012 | | | (h) |
Diageo Investment Corp. | | | | | | | | | | |
| 2.88% | | 05/11/22 | | | 506,000 | | | | 505,694 | | | (h) |
DigitalGlobe Inc. | | | | | | | | | | |
| 5.25% | | 02/01/21 | | | 649,000 | | | | 616,550 | | | (b,h) |
DIRECTV Holdings LLC | | | | | | | | | | |
| 4.45% | | 04/01/24 | | | 319,000 | | | | 333,771 | | | (h) |
| 5.15% | | 03/15/42 | | | 467,000 | | | | 482,579 | | | (h) |
See Notes to Schedules of Investments and Notes to Financial Statements.
58
| | |
| Elfun Income Fund | | December 31, 2014 |
| | | | | | | | | | | | |
| | | | | Principal
Amount | | | Fair
Value | | | |
| | | |
Dollar General Corp. | | | | | | | | | | |
| 1.88% | | 04/15/18 | | $ | 410,000 | | | $ | 396,179 | | | (h) |
| 4.13% | | 07/15/17 | | | 412,000 | | | | 424,902 | | | (h) |
Dominion Resources Inc. | | | | | | | | | | |
| 1.95% | | 08/15/16 | | | 783,000 | | | | 791,412 | | | (h) |
Duke Energy Corp. | | | | | | | | | | |
| 3.75% | | 04/15/24 | | | 396,000 | | | | 411,929 | | | (h) |
Duke Energy Progress Inc. | | | | | | | | | | |
| 4.15% | | 12/01/44 | | | 125,000 | | | | 132,875 | | | |
Eaton Corp. | | | | | | | | | | |
| 2.75% | | 11/02/22 | | | 453,000 | | | | 445,026 | | | (h) |
Ecopetrol S.A. | | | | | | | | | | |
| 5.88% | | 05/28/45 | | | 104,000 | | | | 96,200 | | | (h) |
El Paso Pipeline Partners Operating Company LLC | | | | | | | | | | |
| 4.30% | | 05/01/24 | | | 422,000 | | | | 422,817 | | | (h) |
Electricite de France S.A. | | | | | | | | | | |
| 2.15% | | 01/22/19 | | | 838,000 | | | | 840,063 | | | (b,h) |
Energy Transfer Equity LP | | | | | | | | | | |
| 5.88% | | 01/15/24 | | | 844,000 | | | | 856,660 | | | (h) |
Energy Transfer Partners LP | | | | | | | | | | |
| 6.50% | | 02/01/42 | | | 344,000 | | | | 395,411 | | | (h) |
Ensco PLC | | | | | | | | | | |
| 4.50% | | 10/01/24 | | | 417,000 | | | | 405,314 | | | (h) |
| 5.75% | | 10/01/44 | | | 210,000 | | | | 210,707 | | | (h) |
Enterprise Products Operating LLC | | | | | | | | | | |
| 3.75% | | 02/15/25 | | | 332,000 | | | | 333,264 | | | (h) |
ERP Operating LP | | | | | | | | | | |
| 4.50% | | 07/01/44 | | | 244,000 | | | | 254,295 | | | (h) |
European Investment Bank | | | | | | | | | | |
| 4.88% | | 01/17/17 | | | 850,000 | | | | 918,731 | | | (h) |
Express Scripts Holding Co. | | | | | | | | | | |
| 2.25% | | 06/15/19 | | | 415,000 | | | | 410,556 | | | (h) |
Five Corners Funding Trust | | | | | | | | | | |
| 4.42% | | 11/15/23 | | | 457,000 | | | | 483,241 | | | (b,h) |
Florida Power & Light Co. | | | | | | | | | | |
| 4.13% | | 02/01/42 | | | 222,000 | | | | 237,034 | | | (h) |
Ford Motor Credit Company LLC | | | | | | | | | | |
| 5.88% | | 08/02/21 | | | 318,000 | | | | 368,177 | | | (h) |
Forest Laboratories Inc. | | | | | | | | | | |
| 5.00% | | 12/15/21 | | | 412,000 | | | | 446,124 | | | (b,h) |
| | | | | | | | | | | | |
| | | | | Principal
Amount | | | Fair
Value | | | |
| | | |
Freeport-McMoRan Inc. | | | | | | | | | | |
| 5.45% | | 03/15/43 | | $ | 178,000 | | | $ | 168,312 | | | (h) |
Fresenius Medical Care US Finance Inc. | | | | | | | | | | |
| 5.75% | | 02/15/21 | | | 344,000 | | | | 366,790 | | | (b,h) |
Frontier Communications Corp. | | | | | | | | | | |
| 7.13% | | 03/15/19 | | | 354,000 | | | | 387,630 | | | (h) |
General Motors Co. | | | | | | | | | | |
| 4.88% | | 10/02/23 | | | 154,000 | | | | 164,780 | | | (h) |
| 5.00% | | 04/01/35 | | | 428,000 | | | | 446,015 | | | |
General Motors Financial Company Inc. | | | | | | | | | | |
| 2.63% | | 07/10/17 | | | 167,000 | | | | 167,724 | | | (h) |
| 3.00% | | 09/25/17 | | | 257,000 | | | | 259,899 | | | (h) |
| 3.50% | | 07/10/19 | | | 167,000 | | | | 170,527 | | | (h) |
| 4.38% | | 09/25/21 | | | 429,000 | | | | 447,769 | | | (h) |
Georgia-Pacific LLC | | | | | | | | | | |
| 3.60% | | 03/01/25 | | | 625,000 | | | | 627,668 | | | (b) |
Gilead Sciences Inc. | | | | | | | | | | |
| 4.80% | | 04/01/44 | | | 319,000 | | | | 353,852 | | | (h) |
Glencore Funding LLC | | | | | | | | | | |
| 2.50% | | 01/15/19 | | | 263,000 | | | | 258,970 | | | (b,h) |
| 4.13% | | 05/30/23 | | | 312,000 | | | | 304,437 | | | (b,h) |
| 4.63% | | 04/29/24 | | | 378,000 | | | | 379,814 | | | (b,h) |
Grupo Televisa SAB | | | | | | | | | | |
| 5.00% | | 05/13/45 | | | 204,000 | | | | 207,517 | | | (h) |
HCA Inc. | | | | | | | | | | |
| 4.75% | | 05/01/23 | | | 693,000 | | | | 705,127 | | | (h) |
| 6.50% | | 02/15/20 | | | 392,000 | | | | 439,236 | | | (h) |
Hewlett-Packard Co. | | | | | | | | | | |
| 2.75% | | 01/14/19 | | | 842,000 | | | | 843,076 | | | (h) |
Hexion US Finance Corp. | | | | | | | | | | |
| 6.63% | | 04/15/20 | | | 371,000 | | | | 363,580 | | | (h) |
Hughes Satellite Systems Corp. | | | | | | | | | | |
| 6.50% | | 06/15/19 | | | 238,000 | | | | 255,255 | | | (h) |
Humana Inc. | | | | | | | | | | |
| 3.85% | | 10/01/24 | | | 415,000 | | | | 420,468 | | | (h) |
Huntsman International LLC | | | | | | | | | | |
| 4.88% | | 11/15/20 | | | 399,000 | | | | 396,008 | | | (h) |
Hyundai Capital America | | | | | | | | | | |
| 2.13% | | 10/02/17 | | | 189,000 | | | | 189,921 | | | (b,h) |
See Notes to Schedules of Investments and Notes to Financial Statements.
59
| | |
| Elfun Income Fund | | December 31, 2014 |
| | | | | | | | | | | | |
| | | | | Principal
Amount | | | Fair
Value | | | |
| | | |
Illinois Tool Works Inc. | | | | | | | | | | |
| 3.50% | | 03/01/24 | | $ | 418,000 | | | $ | 435,091 | | | (h) |
Ingersoll-Rand Luxembourg Finance S.A. | | | | | | | | | | |
| 3.55% | | 11/01/24 | | | 291,000 | | | | 289,226 | | | |
Ingles Markets Inc. | | | | | | | | | | |
| 5.75% | | 06/15/23 | | | 379,000 | | | | 380,558 | | | (h) |
Intelsat Jackson Holdings S.A. | | | | | | | | | | |
| 5.50% | | 08/01/23 | | | 417,000 | | | | 414,456 | | | (h) |
International Business Machines Corp. | | | | | | | | | | |
| 3.63% | | 02/12/24 | | | 426,000 | | | | 443,817 | | | (h) |
Intesa Sanpaolo S.p.A. | | | | | | | | | | |
| 5.02% | | 06/26/24 | | | 126,000 | | | | 122,285 | | | (b,h) |
Invesco Finance PLC | | | | | | | | | | |
| 3.13% | | 11/30/22 | | | 573,000 | | | | 567,882 | | | (h) |
Iron Mountain Inc. | | | | | | | | | | |
| 6.00% | | 08/15/23 | | | 417,000 | | | | 433,680 | | | (h) |
JB Poindexter & Company Inc. | | | | | | | | | | |
| 9.00% | | 04/01/22 | | | 120,000 | | |
| 129,600
|
| | (b,h) |
JBS USA LLC/JBS USA Finance Inc. | | | | | | | | | | |
| 5.88% | | 07/15/24 | | | 232,000 | | | | 227,940 | | | (b,h) |
Jefferies Group Inc. | | | | | | | | | | |
| 5.13% | | 01/20/23 | | | 168,000 | | | | 170,775 | | | (h) |
| 6.50% | | 01/20/43 | | | 140,000 | | | | 142,811 | | | (h) |
John Deere Capital Corp. | | | | | | | | | | |
| 3.35% | | 06/12/24 | | | 408,000 | | | | 418,170 | | | (h) |
Johnson Controls Inc. | | | | | | | | | | |
| 4.63% | | 07/02/44 | | | 204,000 | | | | 209,932 | | | (h) |
JPMorgan Chase & Co. | | | | | | | | | | |
| 3.88% | | 09/10/24 | | | 617,000 | | | | 617,525 | | | (h) |
| 5.00% | | 12/29/49 | | | 299,000 | | | | 292,553 | | | (h,i) |
| 6.10% | | 10/29/49 | | | 500,000 | | | | 498,750 | | | (h,i) |
| KB Home | | | | | | | | | | |
| 7.00% | | 12/15/21 | | | 417,000 | | | | 438,632 | | | (h) |
Kerr-McGee Corp. | | | | | | | | | | |
| 6.95% | | 07/01/24 | | | 131,000 | | | | 160,110 | | | (h) |
Keysight Technologies Inc. | | | | | | | | | | |
| 4.55% | | 10/30/24 | | | 415,000 | | | | 415,165 | | | (b,h) |
KFW | | | | | | | | | | |
| 2.00% | | 10/04/22 | | | 929,000 | | | | 915,150 | | | (h) |
| 4.50% | | 07/16/18 | | | 238,000 | | | | 262,959 | | | (h) |
| | | | | | | | | | | | |
| | | | | Principal
Amount | | | Fair
Value | | | |
| | | |
Kilroy Realty LP | | | | | | | | | | |
| 4.25% | | 08/15/29 | | $ | 206,000 | | | $ | 206,017 | | | (h) |
Kinder Morgan Energy Partners LP | | | | | | | | | | |
| 3.50% | | 09/01/23 | | | 346,000 | | | | 328,474 | | | (h) |
Kinder Morgan Inc. | | | | | | | | | | |
| 3.05% | | 12/01/19 | | | 207,000 | | | | 205,354 | | | |
| 5.63% | | 11/15/23 | | | 590,000 | | | | 631,551 | | | (b,h) |
Kinross Gold Corp. | | | | | | | | | | |
| 5.95% | | 03/15/24 | | | 209,000 | | | | 196,113 | | | (b,h) |
| 6.88% | | 09/01/41 | | | 30,000 | | | | 28,523 | | | (h) |
Korea National Oil Corp. | | | | | | | | | | |
| 2.88% | | 11/09/15 | | | 278,000 | | | | 282,018 | | | (b,h) |
L Brands Inc. | | | | | | | | | | |
| 5.63% | | 02/15/22 | | | 417,000 | | | | 448,275 | | | (h) |
L-3 Communications Corp. | | | | | | | | | | |
| 1.50% | | 05/28/17 | | | 286,000 | | | | 283,187 | | | (h) |
| 3.95% | | 05/28/24 | | | 151,000 | | | | 152,249 | | | (h) |
Lamar Media Corp. | | | | | | | | | | |
| 5.00% | | 05/01/23 | | | 417,000 | | | | 412,830 | | | (h) |
Land O’ Lakes Inc. | | | | | | | | | | |
| 6.00% | | 11/15/22 | | | 116,000 | | | | 124,120 | | | (b,h) |
Lear Corp. | | | | | | | | | | |
| 5.25% | | 01/15/25 | | | 428,000 | | | | 433,350 | | | |
Lennar Corp. | | | | | | | | | | |
| 4.50% | | 11/15/19 | | | 257,000 | | | | 255,073 | | | |
Liberty Mutual Group Inc. |
| 4.25% | | 06/15/23 | | | 434,000 | | | | 447,228 | | | (b,h) |
Linn Energy LLC |
| 6.25% | | 11/01/19 | | | 216,000 | | | | 182,520 | | | (h) |
Macquarie Bank Ltd. |
| 2.60% | | 06/24/19 | | | 207,000 | | | | 208,734 | | | (b,h) |
Macy’s Retail Holdings Inc. |
| 4.50% | | 12/15/34 | | | 417,000 | | | | 419,897 | | | |
Marathon Petroleum Corp. |
| 3.63% | | 09/15/24 | | | 415,000 | | | | 406,701 | | | (h) |
| 4.75% | | 09/15/44 | | | 317,000 | | | | 299,377 | | | (h) |
MarkWest Energy Partners LP/MarkWest Energy Finance Corp. | | | | | | | | | | |
| 4.88% | | 12/01/24 | | | 171,000 | | | | 167,153 | | | |
| 5.50% | | 02/15/23 | | | 170,000 | | | | 172,125 | | | (h) |
Marsh & McLennan Companies Inc. |
| 3.50% | | 03/10/25 | | | 410,000 | | | | 412,606 | | | (h) |
See Notes to Schedules of Investments and Notes to Financial Statements.
60
| | |
| Elfun Income Fund | | December 31, 2014 |
| | | | | | | | | | | | |
| | | | | Principal
Amount | | | Fair
Value | | | |
|
Mattel Inc. |
| 2.35% | | 05/06/19 | | $ | 633,000 | | | $ | 630,762 | | | (h) |
Medtronic Inc. |
| 2.50% | | 03/15/20 | | | 333,000 | | | | 333,873 | | | (b) |
| 3.50% | | 03/15/25 | | | 417,000 | | | | 426,578 | | | (b) |
| 4.63% | | 03/15/45 | | | 210,000 | | | | 227,638 | | | (b) |
MEG Energy Corp. |
| 6.50% | | 03/15/21 | | | 250,000 | | | | 228,125 | | | (b,h) |
Memorial Sloan-Kettering Cancer Center | | | | | | | | | | |
| 4.13% | | 07/01/52 | | | 165,000 | | | | 164,046 | | | (h) |
MetLife Inc. |
| 4.72% | | 12/15/44 | | | 166,000 | | | | 184,635 | | | (h) |
MGM Resorts International |
| 5.25% | | 03/31/20 | | | 428,000 | | | | 424,790 | | | (h) |
Mizuho Bank Ltd. |
| 2.45% | | 04/16/19 | | | 508,000 | | | | 504,695 | | | (b,h) |
Monsanto Co. |
| 3.38% | | 07/15/24 | | | 203,000 | | | | 206,262 | | | (h) |
| 4.70% | | 07/15/64 | | | 120,000 | | | | 125,823 | | | (h) |
Morgan Stanley |
| 2.13% | | 04/25/18 | | | 410,000 | | | | 410,237 | | | (h) |
| 2.38% | | 07/23/19 | | | 621,000 | | | | 618,710 | | | (h) |
| 3.70% | | 10/23/24 | | | 415,000 | | | | 420,652 | | | |
| 4.10% | | 05/22/23 | | | 487,000 | | | | 493,057 | | | (h) |
| 4.35% | | 09/08/26 | | | 320,000 | | | | 321,912 | | | (h) |
| 4.88% | | 11/01/22 | | | 406,000 | | | | 431,204 | | | (h) |
| 5.00% | | 11/24/25 | | | 267,000 | | | | 284,920 | | | (h) |
Motorola Solutions Inc. |
| 4.00% | | 09/01/24 | | | 412,000 | | | | 414,481 | | | (h) |
Mylan Inc. |
| 7.88% | | 07/15/20 | | | 436,000 | | | | 464,425 | | | (b,h) |
National Agricultural Cooperative Federation | | | | | | | | | | |
| 4.25% | | 01/28/16 | | | 231,000 | | | | 238,223 | | | (b,h) |
National Retail Properties Inc. |
| 3.90% | | 06/15/24 | | | 338,000 | | | | 344,716 | | | (h) |
NCL Corporation Ltd. |
| 5.00% | | 02/15/18 | | | 222,000 | | | | 222,000 | | | (h) |
Newfield Exploration Co. |
| 5.63% | | 07/01/24 | | | 445,000 | | | | 440,272 | | | (h) |
| 5.75% | | 01/30/22 | | | 612,000 | | | | 605,880 | | | (h) |
Newmont Mining Corp. |
| 4.88% | | 03/15/42 | | | 158,000 | | | | 137,616 | | | (h) |
| | | | | | | | | | | | |
| | | | | Principal
Amount | | | Fair
Value | | | |
|
Nexen Energy ULC |
| 6.40% | | 05/15/37 | | $ | 223,000 | | | $ | 277,757 | | | (h) |
Noble Energy Inc. |
| 3.90% | | 11/15/24 | | | 249,000 | | | | 246,099 | | | |
NRG Energy Inc. |
| 6.25% | | 07/15/22 | | | 428,000 | | | | 437,630 | | | |
Omnicom Group Inc. |
| 3.63% | | 05/01/22 | | | 170,000 | | | | 174,521 | | | (h) |
Oracle Corp. |
| 2.25% | | 10/08/19 | | | 818,000 | | | | 823,844 | | | (h) |
| 3.63% | | 07/15/23 | | | 302,000 | | | | 316,710 | | | (h) |
| 4.50% | | 07/08/44 | | | 203,000 | | | | 220,494 | | | (h) |
Outfront Media Capital LLC/ Outfront Media Capital Corp. | | | | | | | | | | |
| 5.63% | | 02/15/24 | | | 250,000 | | | | 251,250 | | | (b,h) |
Owens & Minor Inc. |
| 3.88% | | 09/15/21 | | | 415,000 | | | | 419,694 | | | (h) |
Owens-Brockway Glass Container Inc. | | | | | | | | | | |
| 5.00% | | 01/15/22 | | | 171,000 | | | | 174,420 | | | (b) |
| 5.38% | | 01/15/25 | | | 86,000 | | | | 86,860 | | | (b) |
Pacific Gas & Electric Co. |
| 3.40% | | 08/15/24 | | | 617,000 | | | | 624,376 | | | (h) |
| PacifiCorp | | | | | | | | | | | | |
| 6.25% | | 10/15/37 | | | 8,000 | | | | 10,826 | | | (h) |
People’s United Bank |
| 4.00% | | 07/15/24 | | | 478,000 | | | | 484,162 | | | (h) |
PepsiCo Inc. |
| 4.25% | | 10/22/44 | | | 249,000 | | | | 259,868 | | | |
Perrigo Company PLC |
| 2.30% | | 11/08/18 | | | 425,000 | | | | 424,665 | | | (h) |
Perrigo Finance PLC |
| 4.90% | | 12/15/44 | | | 200,000 | | | | 211,936 | | | |
Petrobras International Finance Company S.A. | | | | | | | | | | |
| 3.50% | | 02/06/17 | | | 393,000 | | | | 375,280 | | | (h) |
| 3.88% | | 01/27/16 | | | 159,000 | | | | 156,027 | | | (h) |
Petroleos Mexicanos |
| 3.50% | | 01/30/23 | | | 197,000 | | | | 188,431 | | | (h) |
Philip Morris International Inc. |
| 4.13% | | 03/04/43 | | | 209,000 | | | | 204,874 | | | (h) |
Pitney Bowes Inc. |
| 4.63% | | 03/15/24 | | | 400,000 | | | | 409,445 | | | (h) |
See Notes to Schedules of Investments and Notes to Financial Statements.
61
| | |
| Elfun Income Fund | | December 31, 2014 |
| | | | | | | | | | | | |
| | | | | Principal
Amount | | | Fair
Value | | | |
|
PNC Bank NA |
| 2.40% | | 10/18/19 | | $ | 840,000 | | | $ | 843,529 | | | (h) |
Post Holdings Inc. |
| 6.75% | | 12/01/21 | | | 257,000 | | | | 249,290 | | | (b) |
Prudential Financial Inc. |
| 5.63% | | 06/15/43 | | | 257,000 | | | | 262,731 | | | (h,i) |
Public Service Electric & Gas Co. |
| 2.38% | | 05/15/23 | | | 632,000 | | | | 607,798 | | | (h) |
Range Resources Corp. |
| 5.75% | | 06/01/21 | | | 258,000 | | | | 266,385 | | | (h) |
Raytheon Co. |
| 4.20% | | 12/15/44 | | | 145,000 | | | | 150,611 | | | |
Regency Energy Partners LP/ Regency Energy Finance Corp. | | | | | | | | | | |
| 5.00% | | 10/01/22 | | | 569,000 | | | | 537,705 | | | (h) |
Revlon Consumer Products Corp. |
| 5.75% | | 02/15/21 | | | 857,000 | | | | 857,000 | | | (h) |
Roche Holdings Inc. |
| 2.25% | | 09/30/19 | | | 414,000 | | | | 416,623 | | | (b,h) |
| 2.88% | | 09/29/21 | | | 445,000 | | | | 450,560 | | | (b,h) |
| 3.35% | | 09/30/24 | | | 445,000 | | | | 457,997 | | | (b,h) |
Rockwood Specialties Group Inc. |
| 4.63% | | 10/15/20 | | | 995,000 | | | | 1,027,337 | | | (h) |
Rowan Companies Inc. |
| 4.75% | | 01/15/24 | | | 294,000 | | | | 277,497 | | | (h) |
| 5.85% | | 01/15/44 | | | 84,000 | | | | 77,468 | | | (h) |
Royal Bank of Canada |
| 1.20% | | 09/19/18 | | | 663,000 | | | | 659,214 | | | (h) |
RSI Home Products Inc. |
| 6.88% | | 03/01/18 | | | 399,000 | | | | 416,955 | | | (b,h) |
Ryder System Inc. |
| 2.45% | | 09/03/19 | | | 507,000 | | | | 503,428 | | | (h) |
Sabine Pass Liquefaction LLC |
| 5.63% | | 02/01/21 | | | 160,000 | | | | 157,200 | | | (h) |
Schaeffler Holding Finance BV |
| 6.25% | | Cash/7.00% PIK 11/15/19 | | | 425,000 | | | | 437,750 | | | (b,p) |
| 6.88% | | Cash/7.63% PIK 08/15/18 | | | 240,000 | | | | 250,200 | | | (b,h,p) |
Scripps Networks Interactive Inc. |
| 2.75% | | 11/15/19 | | | 210,000 | | | | 210,879 | | | |
Seagate HDD Cayman |
| 4.75% | | 01/01/25 | | | 314,000 | | | | 323,472 | | | (b,h) |
| | | | | | | | | | | | |
| | | | | Principal
Amount | | | Fair
Value | | | |
|
Sealed Air Corp. |
| 4.88% | | 12/01/22 | | $ | 86,000 | | | $ | 85,355 | | | (b) |
| 5.13% | | 12/01/24 | | | 86,000 | | | | 86,860 | | | (b) |
Shell International Finance BV |
| 3.40% | | 08/12/23 | | | 642,000 | | | | 662,614 | | | (h) |
Sinclair Television Group Inc. |
| 5.38% | | 04/01/21 | | | 193,000 | | | | 191,553 | | | |
Sinopec Capital 2013 Ltd. |
| 3.13% | | 04/24/23 | | | 336,000 | | | | 320,341 | | | (b,h) |
Smurfit Kappa Acquisitions |
| 4.88% | | 09/15/18 | | | 440,000 | | | | 455,400 | | | (b,h) |
Spectra Energy Partners LP |
| 4.75% | | 03/15/24 | | | 412,000 | | | | 441,631 | | | (h) |
Sprint Corp. | | | | | | | | | | |
| 7.25% | | 09/15/21 | | | 235,000 | | | | 232,944 | | | |
Statoil ASA | | | | | | | | | | |
| 3.70% | | 03/01/24 | | | 638,000 | | | | 660,544 | | | (h) |
| 4.80% | | 11/08/43 | | | 213,000 | | | | 242,171 | | | (h) |
Steel Dynamics Inc. | | | | | | | | | | |
| 5.13% | | 10/01/21 | | | 257,000 | | | | 261,819 | | | (b,h) |
Sysco Corp. | | | | | | | | | | |
| 2.35% | | 10/02/19 | | | 415,000 | | | | 417,259 | | | (h) |
| 3.50% | | 10/02/24 | | | 290,000 | | | | 298,415 | | | (h) |
| 4.35% | | 10/02/34 | | | 165,000 | | | | 177,637 | | | (h) |
T-Mobile USA Inc. | | | | | | | | | | |
| 6.25% | | 04/01/21 | | | 69,000 | | | | 70,622 | | | (h) |
Talisman Energy Inc. | | | | | | | | | | |
| 6.25% | | 02/01/38 | | | 172,000 | | | | 174,616 | | | (h) |
Tampa Electric Co. | | | | | | | | | | |
| 4.35% | | 05/15/44 | | | 204,000 | | | | 217,524 | | | (h) |
Tanger Properties LP | | | | | | | | | | |
| 3.75% | | 12/01/24 | | | 210,000 | | | | 211,628 | | | |
Targa Resources Partners LP/ Targa Resources Partners Finance Corp. | | | | | | | | | | |
| 4.13% | | 11/15/19 | | | 430,000 | | | | 413,875 | | | (b) |
Target Corp. | | | | | | | | | | |
| 3.50% | | 07/01/24 | | | 468,000 | | | | 485,865 | | | (h) |
Teachers Insurance & Annuity Association of America | | | | | | | | | | |
| 4.90% | | 09/15/44 | | | 415,000 | | | | 462,454 | | | (b,h) |
See Notes to Schedules of Investments and Notes to Financial Statements.
62
| | |
| Elfun Income Fund | | December 31, 2014 |
| | | | | | | | | | | | |
| | | | | Principal
Amount | | | Fair
Value | | | |
Teck Resources Ltd. | | | | | | | | | | |
| 3.75% | | 02/01/23 | | $ | 392,000 | | | $ | 351,346 | | | (h) |
| 5.40% | | 02/01/43 | | | 210,000 | | | | 177,495 | | | (h) |
Telecom Italia S.p.A. | | | | | | | | | | |
| 5.30% | | 05/30/24 | | | 650,000 | | | | 658,125 | | | (b,h) |
Tenet Healthcare Corp. | | | | | | | | | | |
| 4.75% | | 06/01/20 | | | 158,000 | | | | 160,370 | | | (h) |
| 6.00% | | 10/01/20 | | | 416,000 | | | | 446,713 | | | (h) |
Textron Inc. | | | | | | | | | | |
| 6.20% | | 03/15/15 | | | 334,000 | | | | 337,342 | | | (h) |
The Allstate Corp. | | | | | | | | | | |
| 5.75% | | 08/15/53 | | | 235,000 | | | | 247,631 | | | (h,i) |
The Bank of Tokyo-Mitsubishi UFJ Ltd. | | | | | | | | | | |
| 2.30% | | 03/10/19 | | | 600,000 | | | | 596,762 | | | (b,h) |
| 2.35% | | 09/08/19 | | | 630,000 | | | | 625,813 | | | (b,h) |
The Boeing Co. | | | | | | | | | | |
| 2.85% | | 10/30/24 | | | 291,000 | | | | 289,171 | | | |
The Dow Chemical Co. | | | | | | | | | | |
| 3.50% | | 10/01/24 | | | 830,000 | | | | 821,587 | | | (h) |
| 4.25% | | 10/01/34 | | | 420,000 | | | | 412,501 | | | (h) |
The Goldman Sachs Group Inc. | | | | | | | | | | |
| 2.38% | | 01/22/18 | | | 501,000 | | | | 506,060 | | | (h) |
| 2.63% | | 01/31/19 | | | 624,000 | | | | 627,810 | | | (h) |
| 2.90% | | 07/19/18 | | | 179,000 | | | | 183,633 | | | (h) |
| 4.00% | | 03/03/24 | | | 501,000 | | | | 520,113 | | | (h) |
| 4.80% | | 07/08/44 | | | 244,000 | | | | 261,343 | | | (h) |
The Korea Development Bank | | | | | | | | | | |
| 3.25% | | 03/09/16 | | | 380,000 | | | | 388,953 | | | (h) |
| 4.00% | | 09/09/16 | | | 220,000 | | | | 229,647 | | | (h) |
The Kroger Co. | | | | | | | | | | |
| 2.95% | | 11/01/21 | | | 291,000 | | | | 288,613 | | | |
The Timken Co. | | | | | | | | | | |
| 3.88% | | 09/01/24 | | | 316,000 | | | | 315,510 | | | (b,h) |
The Williams Companies Inc. | | | | | | | | | | |
| 4.55% | | 06/24/24 | | | 132,000 | | | | 122,757 | | | (h) |
| 5.75% | | 06/24/44 | | | 412,000 | | | | 358,381 | | | (h) |
| 8.75% | | 03/15/32 | | | 164,000 | | | | 191,399 | | | (h) |
TIAA Asset Management Finance Company LLC | | | | | | | | | | |
| 4.13% | | 11/01/24 | | | 415,000 | | | | 425,133 | | | (b) |
Time Inc. | | | | | | | | | | |
| 5.75% | | 04/15/22 | | | 433,000 | | | | 418,927 | | | (b,h) |
| | | | | | | | | | | | |
| | | | | Principal
Amount | | | Fair
Value | | | |
| | | |
Time Warner Cable Inc. | | | | | | | | | | |
| 6.55% | | 05/01/37 | | $ | 123,000 | | | $ | 158,361 | | | (h) |
Time Warner Inc. | | | | | | | | | | |
| 5.35% | | 12/15/43 | | | 359,000 | | | | 407,744 | | | (h) |
Tops Holding Corp. | | | | | | | | | | |
| 8.88% | | 12/15/17 | | | 778,000 | | | | 793,560 | | | (h) |
Tyco Electronics Group S.A. | | | | | | | | | | |
| 2.35% | | 08/01/19 | | | 413,000 | | | | 412,622 | | | (h) |
Tyson Foods Inc. | | | | | | | | | | |
| 2.65% | | 08/15/19 | | | 206,000 | | | | 207,877 | | | (h) |
| 3.95% | | 08/15/24 | | | 137,000 | | | | 141,620 | | | (h) |
| 5.15% | | 08/15/44 | | | 137,000 | | | | 153,875 | | | (h) |
U.S. Bancorp | | | | | | | | | | |
| 3.44% | | 02/01/16 | | | 645,000 | | | | 660,398 | | | (h) |
Ultra Petroleum Corp. | | | | | | | | | | |
| 6.13% | | 10/01/24 | | | 428,000 | | | | 368,080 | | | (b,h) |
Unit Corp. | | | | | | | | | | |
| 6.63% | | 05/15/21 | | | 400,000 | | | | 358,000 | | | (h) |
United Rentals North America Inc. | | | | | | | | | | |
| 5.75% | | 07/15/18 | | | 399,000 | | | | 415,958 | | | (h) |
| 6.13% | | 06/15/23 | | | 167,000 | | | | 175,350 | | | (h) |
UnitedHealth Group Inc. | | | | | | | | | | |
| 2.30% | | 12/15/19 | | | 416,000 | | | | 417,718 | | | |
Vail Resorts Inc. | | | | | | | | | | |
| 6.50% | | 05/01/19 | | | 238,000 | | | | 246,330 | | | (h) |
Valeant Pharmaceuticals International Inc. | | | | | | | | | | |
| 6.38% | | 10/15/20 | | | 229,000 | | | | 239,305 | | | (b,h) |
| 6.75% | | 08/15/18 | | | 309,000 | | | | 328,705 | | | (b,h) |
Verizon Communications Inc. | | | | | | | | | | |
| 1.35% | | 06/09/17 | | | 1,018,000 | | | | 1,013,290 | | | (h) |
| 3.50% | | 11/01/24 | | | 416,000 | | | | 408,720 | | | |
| 4.15% | | 03/15/24 | | | 415,000 | | | | 429,622 | | | |
| 4.40% | | 11/01/34 | | | 208,000 | | | | 206,748 | | | |
| 5.05% | | 03/15/34 | | | 128,000 | | | | 136,541 | | | (h) |
| 5.15% | | 09/15/23 | | | 431,000 | | | | 475,924 | | | (h) |
| 6.55% | | 09/15/43 | | | 236,000 | | | | 302,351 | | | (h) |
Viasystems Inc. | | | | | | | | | | |
| 7.88% | | 05/01/19 | | | 240,000 | | | | 253,200 | | | (b,h) |
Virgin Media Finance PLC | | | | | | | | | | |
| 6.00% | | 10/15/24 | | | 257,000 | | | | 268,886 | | | (b,h) |
See Notes to Schedules of Investments and Notes to Financial Statements.
63
| | |
| Elfun Income Fund | | December 31, 2014 |
| | | | | | | | | | | | |
| | | | | Principal
Amount | | | Fair
Value | | | |
| | | |
Virgin Media Secured Finance PLC | | | | | | | | | | |
| 5.25% | | 01/15/21 | | $ | 200,000 | | | $ | 209,000 | | | (h) |
Volkswagen Group of America Finance LLC | | | | | | | | | | |
| 2.13% | | 05/23/19 | | | 1,020,000 | | | | 1,014,647 | | | (b,h) |
| 2.45% | | 11/20/19 | | | 205,000 | | | | 206,335 | | | (b) |
W.R. Grace & Co. | | | | | | | | | | |
| 5.63% | | 10/01/24 | | | 428,000 | | | | 446,190 | | | (b,h) |
Wal-Mart Stores Inc. | | | | | | | | | | |
| 3.30% | | 04/22/24 | | | 338,000 | | | | 348,990 | | | (h) |
| 4.30% | | 04/22/44 | | | 423,000 | | | | 461,724 | | | (h) |
Walgreens Boots Alliance Inc. | | | | | | | | | | |
| 3.80% | | 11/18/24 | | | 416,000 | | | | 424,278 | | | |
| 4.80% | | 11/18/44 | | | 165,000 | | | | 173,971 | | | |
Weatherford International Ltd. | | | | | | | | | | |
| 5.95% | | 04/15/42 | | | 167,000 | | | | 141,403 | | | (h) |
| 6.75% | | 09/15/40 | | | 105,000 | | | | 97,806 | | | (h) |
Wells Fargo & Co. | | | | | | | | | | |
| 4.10% | | 06/03/26 | | | 474,000 | | | | 484,455 | | | (h) |
| 5.90% | | 12/29/49 | | | 273,000 | | | | 275,048 | | | (h,i) |
Windstream Corp. | | | | | | | | | | |
| 6.38% | | 08/01/23 | | | 400,000 | | | | 374,000 | | | (h) |
WPP Finance 2010 | | | | | | | | | | |
| 3.75% | | 09/19/24 | | | 415,000 | | | | 416,532 | | | (h) |
WPX Energy Inc. | | | | | | | | | | |
| 5.25% | | 01/15/17 | | | 399,000 | | | | 402,990 | | | (h) |
Wynn Macau Ltd. | | | | | | | | | | |
| 5.25% | | 10/15/21 | | | 876,000 | | | | 823,440 | | | (b,h) |
Xilinx Inc. | | | | | | | | | | |
| 2.13% | | 03/15/19 | | | 213,000 | | | | 211,631 | | | (h) |
XLIT Ltd. | | | | | | | | | | |
| 5.25% | | 12/15/43 | | | 284,000 | | | | 320,987 | | | (h) |
Yamana Gold Inc. | | | | | | | | | | |
| 4.95% | | 07/15/24 | | | 173,000 | | | | 168,844 | | | |
| | | | | | | | | 132,159,197 | | | |
|
Non-Agency Collateralized Mortgage
Obligations — 5.9% |
| | | |
American Tower Trust I (REIT) | | | | | | | | | | |
| 1.55% | | 03/15/43 | | | 627,000 | | | | 619,576 | | | (b) |
Banc of America Commercial Mortgage Trust 2006-4 | | | | | | | | | | |
| 5.68% | | 07/10/46 | | | 190,000 | | | | 202,369 | | | |
| | | | | | | | | | | | |
| | | | | Principal
Amount | | | Fair
Value | | | |
| | | |
Banc of America Commercial Mortgage Trust 2007-1 | | | | | | | | | | |
| 5.48% | | 01/15/49 | | $ | 880,000 | | | $ | 922,168 | | | (i) |
Banc of America Commercial Mortgage Trust 2007-4 | | | | | | | | | | |
| 5.75% | | 02/10/51 | | | 31,102 | | | | 33,904 | | | (i) |
Banc of America Commercial Mortgage Trust 2008-1 | | | | | | | | | | |
| 6.24% | | 02/10/51 | | | 149,909 | | | | 165,462 | | | (i) |
Banc of America Merrill Lynch Commercial Mortgage Inc. 2005-1 | | | | | | | | | | |
| 5.28% | | 11/10/42 | | | 390,000 | | | | 389,894 | | | (i) |
Banc of America Merrill Lynch Commercial Mortgage Inc. 2005-6 | | | | | | | | | | |
| 5.15% | | 09/10/47 | | | 382,425 | | | | 390,314 | | | (i) |
Banc of America Merrill Lynch Commercial Mortgage Trust 2014-520M | | | | | | | | | | |
| 4.18% | | 08/15/46 | | | 165,040 | | | | 178,770 | | | (b,i) |
Bear Stearns Commercial Mortgage Securities Trust 2005-T18 | | | | | | | | | | |
| 4.93% | | 02/13/42 | | | 75,432 | | | | 75,436 | | | (i) |
Bear Stearns Commercial Mortgage Securities Trust 2006-T22 | | | | | | | | | | |
| 5.58% | | 04/12/38 | | | 210,000 | | | | 219,166 | | | (i) |
Bear Stearns Commercial Mortgage Securities Trust 2007-PW18 | | | | | | | | | | |
| 6.09% | | 06/11/50 | | | 430,000 | | | | 473,619 | | | (i) |
Citigroup Commercial Mortgage Trust 2014-GC23 | | | | | | | | | | |
| 4.51% | | 07/10/47 | | | 417,000 | | | | 388,511 | | | (b,i) |
COMM 2005-LP5 Mortgage Trust | | | | | | | | | | |
| 4.98% | | 05/10/43 | | | 190,390 | | | | 191,307 | | | (i) |
COMM 2013-LC13 Mortgage Trust | | | | | | | | | | |
| 4.56% | | 08/10/46 | | | 170,000 | | | | 186,235 | | | (b,i) |
See Notes to Schedules of Investments and Notes to Financial Statements.
64
| | |
| Elfun Income Fund | | December 31, 2014 |
| | | | | | | | | | | | |
| | | | | Principal
Amount | | | Fair
Value | | | |
| | | |
COMM 2014-CR14 Mortgage Trust | | | | | | | | | | |
| 4.53% | | 02/10/47 | | $ | 240,000 | | | $ | 262,551 | | | (i) |
COMM 2014-CR19 Mortgage Trust | | | | | | | | | | |
| 4.72% | | 08/10/47 | | | 205,000 | | | | 214,644 | | | (i) |
COMM 2014-CR20 Mortgage Trust | | | | | | | | | | |
| 4.51% | | 11/10/47 | | | 204,175 | | | | 207,485 | | | (i) |
COMM 2014-CR21 Morgage Trust | | | | | | | | | | |
| 3.99% | | 12/10/47 | | | 403,396 | | | | 416,048 | | | |
Credit Suisse Commercial Mortgage Trust 2006-C1 | | | | | | | | | | |
| 5.47% | | 02/15/39 | | | 715,000 | | | | 743,457 | | | (i) |
Credit Suisse First Boston Mortgage Securities Corp. 2005-9 | | | | | | | | | | |
| 5.19% | | 10/25/35 | | | 91,450 | | | | — | | | (**,i,q) |
GS Mortgage Securities Corp. II 2012-GCJ9 | | | | | | | | | | |
| 2.36% | | 11/10/45 | | | 972,485 | | | | 115,171 | | | (g,i) |
GS Mortgage Securities Corp. Trust 2012-ALOH | | | | | | | | | | |
| 3.55% | | 04/10/34 | | | 210,000 | | | | 218,811 | | | (b) |
GS Mortgage Securities Trust 2011-GC5 | | | | | | | | | | |
| 3.00% | | 08/10/44 | | | 410,000 | | | | 420,836 | | | |
| 5.31% | | 08/10/44 | | | 190,000 | | | | 214,395 | | | (b,i) |
GS Mortgage Securities Trust 2014-GC20 | | | | | | | | | | |
| 4.26% | | 04/10/47 | | | 215,000 | | | | 229,788 | | | |
GS Mortgage Securities Trust 2014-GC24 | | | | | | | | | | |
| 4.53% | | 09/10/47 | | | 751,000 | | | | 677,820 | | | (b,i) |
GS Mortgage Securities Trust 2014-NEW | | | | | | | | | | |
| 3.79% | | 01/10/31 | | | 420,000 | | | | 421,924 | | | (b) |
Impac CMB Trust Series 2004-5 | | | | | | | | | | |
| 0.89% | | 10/25/34 | | | 172,859 | | | | 167,309 | | | (i) |
| | | | | | | | | | | | |
| | | | | Principal
Amount | | | Fair
Value | | | |
| | | |
JP Morgan Chase Commercial Mortgage Securities Corp. 2012-LC9 | | | | | | | | | | |
| 1.93% | | 12/15/47 | | $ | 1,247,289 | | | $ | 119,184 | | | (g,i) |
JP Morgan Chase Commercial Mortgage Securities Trust 2005-CB11 | | | | | | | | | | |
| 5.34% | | 08/12/37 | | | 286,756 | | | | 287,093 | | | (i) |
JP Morgan Chase Commercial Mortgage Securities Trust 2006-LDP8 | | | | | | | | | | |
| 5.44% | | 05/15/45 | | | 270,000 | | | | 285,887 | | | |
JP Morgan Chase Commercial Mortgage Securities Trust 2007-CB18 | | | | | | | | | | |
| 5.44% | | 06/12/47 | | | 683,887 | | | | 727,158 | | | |
JPMBB Commercial Mortgage Securities Trust 2013-C12 | | | | | | | | | | |
| 4.03% | | 07/15/45 | | | 125,000 | | | | 133,106 | | | (i) |
JPMBB Commercial Mortgage Securities Trust 2013-C15 | | | | | | | | | | |
| 5.08% | | 11/15/45 | | | 170,000 | | | | 185,191 | | | (i) |
JPMBB Commercial Mortgage Securities Trust 2013-C17 | | | | | | | | | | |
| 4.89% | | 01/15/47 | | | 310,000 | | | | 330,710 | | | (i) |
JPMBB Commercial Mortgage Securities Trust 2014-C18 | | | | | | | | | | |
| 4.81% | | 02/15/47 | | | 210,000 | | | | 222,401 | | | (i) |
LB-UBS Commercial Mortgage Trust 2004-C8 | | | | | | | | | | |
| 0.66% | | 12/15/39 | | | 374,408 | | | | 1,573 | | | (b,g,i) |
LB-UBS Commercial Mortgage Trust 2005-C5 | | | | | | | | | | |
| 4.95% | | 09/15/30 | | | 208,069 | | | | 209,107 | | | |
LB-UBS Commercial Mortgage Trust 2006-C1 | | | | | | | | | | |
| 5.16% | | 02/15/31 | | | 400,456 | | | | 410,135 | | | |
LB-UBS Commercial Mortgage Trust 2006-C4 | | | | | | | | | | |
| 5.83% | | 06/15/38 | | | 182,093 | | | | 191,272 | | | (i) |
See Notes to Schedules of Investments and Notes to Financial Statements.
65
| | |
| Elfun Income Fund | | December 31, 2014 |
| | | | | | | | | | | | |
| | | | | Principal
Amount | | | Fair
Value | | | |
| | | |
LB-UBS Commercial Mortgage Trust 2007-C6 | | | | | | | | | | |
| 6.11% | | 07/15/40 | | $ | 445,000 | | | $ | 482,403 | | | (i) |
| 6.11% | | 07/15/40 | | | 520,000 | | | | 562,910 | | | (b) |
MASTR Alternative Loan Trust 2003-5 | | | | | | | | | | |
| 5.00% | | 08/25/18 | | | 50,422 | | | | 3,620 | | | (g) |
ML-CFC Commercial Mortgage Trust 2006-3 | | | | | | | | | | |
| 5.46% | | 07/12/46 | | | 570,000 | | | | 605,079 | | | (i) |
| | | |
Morgan Stanley Bank of America Merrill Lynch Trust 2013-C10 | | | | | | | | | | |
| 4.08% | | 07/15/46 | | | 388,000 | | | | 393,793 | | | (i) |
Morgan Stanley Bank of America Merrill Lynch Trust 2014-C18 | | | | | | | | | | |
| 3.39% | | 10/15/47 | | | 205,642 | | | | 164,734 | | | (b) |
Morgan Stanley Bank of America Merrill Lynch Trust 2014-C19 | | | | | | | | | | |
| 3.25% | | 12/15/47 | | | 242,461 | | | | 195,991 | | | (b) |
Morgan Stanley Capital I Trust 2005-T17 | | | | | | | | | | |
| 4.84% | | 12/13/41 | | | 335,121 | | | | 336,095 | | | (i) |
Morgan Stanley Capital I Trust 2006-IQ11 | | | | | | | | | | |
| 5.66% | | 10/15/42 | | | 250,000 | | | | 256,686 | | | (i) |
Morgan Stanley Capital I Trust 2006-T21 | | | | | | | | | | |
| 5.16% | | 10/12/52 | | | 450,000 | | | | 461,399 | | | (i) |
| 5.27% | | 10/12/52 | | | 320,000 | | | | 330,454 | | | (i) |
Morgan Stanley Capital I Trust 2006-T23 | | | | | | | | | | |
| 5.81% | | 08/12/41 | | | 160,000 | | | | 167,866 | | | (i) |
Morgan Stanley Capital I Trust 2007-IQ16 | | | | | | | | | | |
| 6.08% | | 12/12/49 | | | 430,000 | | | | 468,532 | | | (i) |
Morgan Stanley Capital I Trust 2008-T29 | | | | | | | | | | |
| 6.28% | | 01/11/43 | | | 210,000 | | | | 234,231 | | | (i) |
| | | | | | | | | | | | |
| | | | | Principal
Amount | | | Fair
Value | | | |
| | | |
Morgan Stanley Capital I Trust 2012-C4 | | | | | | | | | | |
| 5.21% | | 03/15/45 | | $ | 190,000 | | | $ | 212,316 | | | (b,i) |
Wells Fargo Commercial Mortgage Trust 2014-LC18 | | | | | | | | | | |
| 3.96% | | 12/15/47 | | | 402,815 | | | | 341,621 | | | (b,i) |
Wells Fargo Mortgage Backed Securities Trust 2006-3 | | | | | | | | | | |
| 5.50% | | 03/25/36 | | | 138,138 | | | | 8,174 | | | |
WFRBS Commercial Mortgage Trust 2013-C17 | | | | | | | | | | |
| 4.26% | | 12/15/46 | | | 235,000 | | | | 252,566 | | | |
| 5.13% | | 12/15/46 | | | 170,000 | | | | 168,874 | | | (b,i) |
WFRBS Commercial Mortgage Trust 2014-C19 | | | | | | | | | | |
| 4.72% | | 03/15/47 | | | 290,000 | | | | 315,402 | | | (i) |
WFRBS Commercial Mortgage Trust 2014-C22 | | | | | | | | | | |
| 3.91% | | 09/15/57 | | | 247,584 | | | | 216,529 | | | (b,i) |
WFRBS Commercial Mortgage Trust 2014-LC14 | | | | | | | | | | |
| 4.35% | | 03/15/47 | | | 533,000 | | | | 574,793 | | | (i) |
| | | | | | | | | 18,603,855 | | | |
| | |
| Sovereign Bonds — 1.1% | | | | | | | |
| | | |
Government of Brazil | | | | | | | | | | |
| 4.25% | | 01/07/25 | | | 602,000 | | | | 602,000 | | | (h) |
Government of Chile | | | | | | | | | | |
| 3.63% | | 10/30/42 | | | 148,000 | | | | 134,310 | | | (h) |
Government of Colombia | | | | | | | | | | |
| 2.63% | | 03/15/23 | | | 323,000 | | | | 299,906 | | | |
| 5.63% | | 02/26/44 | | | 334,000 | | | | 375,750 | | | (h) |
Government of Mexico | | | | | | | | | | |
| 3.60% | | 01/30/25 | | | 319,000 | | | | 317,883 | | | |
| 4.00% | | 10/02/23 | | | 208,000 | | | | 215,800 | | | (h) |
| 4.75% | | 03/08/44 | | | 398,000 | | | | 414,915 | | | (h) |
Government of Panama | | | | | | | | | | |
| 4.00% | | 09/22/24 | | | 200,000 | | | | 205,500 | | | (h) |
Government of Peru | | | | | | | | | | |
| 5.63% | | 11/18/50 | | | 67,000 | | | | 78,893 | | | |
Government of Philippines | | | | | | | | | | |
| 4.20% | | 01/21/24 | | | 200,000 | | | | 217,000 | | | (h) |
See Notes to Schedules of Investments and Notes to Financial Statements.
66
| | |
| Elfun Income Fund | | December 31, 2014 |
| | | | | | | | | | | | |
| | | | | Principal
Amount | | | Fair
Value | | | |
| | | |
Government of Turkey | | | | | | | | | | |
| 3.25% | | 03/23/23 | | $ | 293,000 | | | $ | 277,984 | | | (h) |
| 6.63% | | 02/17/45 | | | 137,000 | | | | 168,133 | | | (h) |
| | | | | | | | | 3,308,074 | | | |
|
| Municipal Bonds and Notes — 0.7% |
| | | |
American Municipal Power Inc. | | | | | | | | | | |
| 6.27% | | 02/15/50 | | | 275,000 | | | | 352,000 | | | |
Municipal Electric Authority of Georgia | | | | | | | | | | |
| 6.64% | | 04/01/57 | | | 317,000 | | | | 420,253 | | | |
New Jersey Transportation Trust Fund Authority | | | | | | | | | | |
| 6.88% | | 12/15/39 | | | 165,000 | | | | 184,102 | | | |
Port Authority of New York & New Jersey | | | | | | | | | | |
| 4.46% | | 10/01/62 | | | 520,000 | | | | 551,943 | | | |
South Carolina State Public Service Authority | | | | | | | | | | |
| 6.45% | | 01/01/50 | | | 200,000 | | | | 273,836 | | | |
State of California | | | | | | | | | | |
| 5.70% | | 11/01/21 | | | 280,000 | | | | 331,708 | | | |
| | | | | | | | | 2,113,842 | | | |
| | |
| FNMA — 0.0% * | | | | | | | |
| | | |
Lehman TBA | | | | | | | | | | |
| 5.50% | | TBA | | | 198,633 | | | | 49,658 | | | (n,q) |
| | | |
Total Bonds and Notes
(Cost $306,965,647) | | | | | | | 310,708,783 | | | |
| | | | | | | | |
| | | |
| | | Number of Shares | | | | | |
Domestic Equity — 0.1% |
|
| Preferred Stock — 0.1% |
| | | |
Wells Fargo & Co.
(Cost $322,150) | | 12,886 | | | 330,526 | | | |
| | | |
Total Investments in Securities
(Cost $307,287,797) | | | | | 311,039,309 | | | |
| | | | | | | | |
| | | | | Fair Value | | | |
| | | | | | | | |
Short-Term Investments — 6.9% | | | |
| | | |
State Street Institutional U.S. Government Money Market Fund — Premier Class | | | | | | | | |
0.00%
(Cost $21,605,685) | | | | $ | 21,605,685 | | | (d,h,o) |
| | | |
Total Investments
(Cost $328,893,482) | | | | | 332,644,994 | | | |
| | | |
Liabilities in Excess of Other Assets, net — (6.4)% | | | | | (19,888,660) | | | |
| | | | | | | | |
| | | | | | | | |
| | | |
NET
ASSETS — 100.0% | | | | $ | 312,756,334 | | | |
| | | | | | | | |
Other Information:
The Fund had the following long futures contracts open at December 31, 2014:
| | | | | | | | | | | | | | |
| Description | | Expiration
date | | Number
of
Contracts | | | Current Notional Value | | | Unrealized
Appreciation
(Depreciation) | |
| | | | |
2 Yr. U.S. Treasury Notes Futures | | March 2015 | | | 158 | | | $ | 34,537,812 | | | $ | (48,480) | |
| | | | |
U.S. Long Bond Futures | | March 2015 | | | 26 | | | | 3,758,625 | | | | 46,558 | |
| | | | |
Ultra Long-Term U.S. Treasury Bond Futures | | March 2015 | | | 5 | | | | 825,938 | | | | 34,844 | |
| | | | | | | | | | | | | | |
| | | | | | | | $ | 32,922 | |
| | | | | | | | | | | | | | |
See Notes to Schedules of Investments and Notes to Financial Statements.
67
| | |
| Elfun Income Fund | | December 31, 2014 |
The Fund had the following short futures contracts open at December 31, 2014:
| | | | | | | | | | | | | | |
| Description | | Expiration
date | | Number
of
Contracts | | | Current Notional Value | | | Unrealized
Depreciation | |
| | | | |
5 Yr. U.S. Treasury Notes Futures | | March 2015 | | | 67 | | | $ | (7,968,289) | | | $ | (8,667) | |
| | | | |
10 Yr. U.S. Treasury Notes Futures | | March 2015 | | | 198 | | | | (25,105,781) | | | | (54,463) | |
| | | | | | | | | | | | | | |
| | | | | | | | | | | | $ | (63,130) | |
| | | | | | | | | | | | | | |
| | | | | | | | | | | | $ | (30,208) | |
| | | | | | | | | | | | | | |
See Notes to Schedules of Investments and Notes to Financial Statements.
68
(Unaudited)

SSgA Funds Management, Inc. (“SSgA FM”) is the sub-adviser to the Elfun Government Money Market Fund. SSgA FM is registered with the SEC as an investment adviser under the Investment Advisers Act of 1940, as amended, and is a wholly owned subsidiary of State Street Corporation (State Street), a publicly held bank holding company. SSgA FM, and other advisory affiliates of State Street make up State Street Global Advisors (SSgA), the investment management arm of State Street. The Fund is managed by a team of portfolio managers and the key professionals involved in the day-to-day portfolio management for the Fund include: Jeff A. St. Peters and Todd N. Bean. See portfolio managers’ biographical information beginning on page 124.
| Q. | How did the Elfun Government Money Market Fund perform compared to its benchmark for the twelve-month period ended December 31, 2014? |
| A. | For the twelve-month period ended December 31, 2014, the Elfun Government Money Market Fund returned 0.05%. The 90-day Treasury Bill, the Fund’s benchmark, returned 0.03% over the same period. |
| Q. | What market factors affected the Fund’s performance? |
| A. | Overall, the short-term market held a three to five basis point range over the course of 2014. Repurchase agreements, agency discount notes and short U.S. Treasuries were stable due to the accommodative Central Bank environment. The Fed’s 0-25 bps target range continues to keep market rates low, however, the Fed’s Reverse Repurchase Facility program kept short-term market rates off the zero-bound. |
| Q. | What were the primary drivers of Fund performance? |
| A. | During the first half of 2014, the short-term market was focused on the anticipated regulatory changes from the Securities and Exchange Commission (SEC). In July, the SEC approved new money market reform rules that will force certain prime money market funds to abandon the stable $1.00 net asset value and impose liquidity fees and redemption gates under certain circumstances. The adopted rules were largely in-line with expectations and have a two-year implementation period. |
| | During the fourth quarter of 2014, the market was affected by worries of European growth prospects. Deflation concerns hit the market in mid-October, causing a steep sell-off in stock markets. U.S. Treasuries rallied initially, but subsequently retreated as the fundamentals in the U.S. remained robust. The Fed wrapped up the third round of quantitative easing and completed their final U.S. treasury and mortgage-backed security purchases in October. As we moved into November, energy concerns became more apparent and resulted in a major sell-off. Specific to the short-term markets, the Fed announced an expansion of its Reverse Repurchase Facility to include term repurchase agreements (repos) for year-end liquidity needs. In addition, the Fed adjusted the rate they paid on overnight repos (conducted daily). This allowed short-term rates to remain positive and Fed Funds to trade three to five basis points higher than it had for months. Overall, year-end liquidity was more intact than it had been in prior years. |
69
(Unaudited)
| Q. | Were there any significant changes to the Fund during the period? |
| A. | In April 2014, the Fund was restructured from a prime money market fund to a government money market fund ahead of anticipated regulatory changes. Then, effective October 1, 2014, GE Asset Management Incorporated (GEAM) entered into an investment sub-advisory agreement with SSgA Funds Management, Inc. (SSgA FM), pursuant to which SSgA FM became investment sub-adviser to the Fund. In an effort to ensure a seamless transition to SSgA FM, GEAM adjusted the positioning of the Fund during the third quarter of 2014 such that the Fund had a shorter duration and did not require trading just ahead of the transition. Upon taking over as sub-adviser, SSgA FM reported no significant changes in the composition of the Fund. |
70
(Unaudited)
Understanding Your Fund’s Expenses
As a shareholder of the Fund you incur ongoing costs. Ongoing costs include portfolio management fees, professional fees, administrative fees and other Fund expenses. The following example is intended to help you understand your ongoing costs (in dollars) of investing in the Fund and to compare these costs with the ongoing costs of investing in other mutual funds.
To illustrate these ongoing costs, we have provided an example and calculated the expenses paid by investors in units of the Fund during the period. The information in the following table is based on an investment of $1,000, which is invested at the beginning of the period and held for the entire six-month period ended December 31, 2014.
Actual Expenses
The first section of the table provides information about actual account values and actual expenses. You may use the information in this section, together with the amount you invested, to estimate the expenses that you paid over the period. To do so, simply divide your account value by $1,000 (for example, an $8,600 account value divided by $1,000 = 8.6), then multiply the result by the number given under the heading “Expenses paid during the
period” to estimate the expenses you paid on your account during the period.
Hypothetical Example for Comparison Purposes
The second section of the table provides information about hypothetical account values and hypothetical expenses based on the Fund’s actual expense ratio and an assumed rate of return of 5% per year before expenses, which is not the Fund’s actual return. The hypothetical account values and expenses may not be used to estimate the actual ending account balance or expenses you paid for the period. You may use this information to compare the ongoing costs of investing in the Fund and other funds. To do so, compare this 5% hypothetical example with the 5% hypothetical examples that appear in the shareholders reports of other funds.
Please note that the expenses shown in the table are meant to highlight and help you compare ongoing costs only and do not reflect transaction costs, such as sales charges or redemption fees, if any. Therefore, the second section of the table is useful in comparing ongoing costs only, and will not help you determine the relative total costs of owning different funds.
July 1, 2014 – December 31, 2014
| | | | | | | | | | | | |
| | | Account value at
the beginning of
the period ($) | | | Account value
at the end of
the period ($) | | | Expenses
paid during
the period ($)* | |
| | | |
Actual Fund Return | | | 1,000.00 | | | | 1,000.50 | | | | 0.20 | |
| | | |
Hypothetical 5% Return
(2.5% for the period) | | | 1,000.00 | | | | 1,025.00 | | | | 0.20 | |
| * | | Expenses are equal to the Fund’s annualized net expense ratio of 0.04%** (for the period July 1, 2014 – December 31, 2014), multiplied by the average account value over the period, multiplied by 184/365 (to reflect the one-half year period). |
| ** | | May differ from expense ratio disclosed in the financial highlights, which is calculated based on the entire fiscal year’s data. |
71
(Unaudited)
A mutual fund designed for investors who seek a high level of current income consistent with prudent investment management and the preservation of capital. The Fund seeks to achieve its investment objective by investing primarily in short-term, U.S. dollar denominated money market instruments.
as a % of Investments of $139,199 (in thousands) on December 31, 2014 (b)
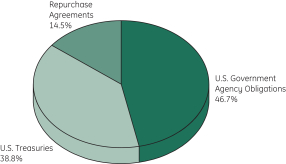
|
| Change in Value of a $10,000 Investment(a) |
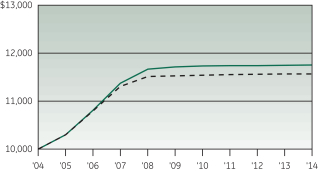

|
| Average Annual Total Return |
for the periods ended December 31, 2014
| | | | | | | | | | | | | | | | |
| (Inception date: 6/13/90) | | | | | | | | | | |
| | | One
Year | | | Five
Year | | | Ten
Year | | | Ending value of a
$10,000
investment (a) | |
| | | | |
Elfun Government Money Market Fund | | | 0.05% | | | | 0.06% | | | | 1.63% | | | $ | 11,753 | |
| | | | |
90 Day U.S. T-Bill | | | 0.03% | | | | 0.07% | | | | 1.42% | | | $ | 11,569 | |
| (a) | Ending value of a $10,000 investment for the ten-year period or since inception, whichever is less. |
| (b) | The securities information regarding holdings, allocations and other characteristics is presented to illustrate examples of securities that the Fund has bought and the diversity of areas in which the Fund may invest as of a particular date. It may not be representative of the Fund’s current or future investments and should not be construed as a recommendation to purchase or sell a particular security. |
See Notes to Performance beginning on page 1 for further information, including an explanation of Morningstar peer categories. Past performance does not predict future performance. The performance shown in the graphs and tables does not reflect the deduction of taxes that a shareholder would pay on Fund distributions or the redemption of Fund shares. An investment in the Elfun Government Money Market Fund is not insured or guaranteed by the Federal Deposit Insurance Corporation or by any other Government agency. Although the Fund seeks to preserve the value of your investment at $1.00 per unit, it is possible to lose money by investing in the Fund.
72
| | |
| Elfun Government Money Market Fund | | December 31, 2014 |
| | | | | | | | | | | | |
| | | | | Principal
Amount | | | Amortized
Cost | | | |
| | | | | | | | | | | | |
Short-Term Investments — 100.0%† | | | |
| |
| U.S. Treasuries — 38.8% | | | |
| | | |
U.S. Treasury Bills | | | | | | | | | | |
| 0.01% | | 01/15/15 | | $ | 10,000,000 | | | $ | 9,999,969 | | | (d) |
| 0.02% | | 01/02/15 - 02/26/15 | | | 36,000,000 | | | | 35,999,659 | | | (d) |
| 0.03% | | 02/12/15 - 02/19/15 | | | 8,000,000 | | | | 7,999,710 | | | (d) |
| 0.05% | | 04/16/15 | | | 75,000 | | | | 74,989 | | | (d) |
| | | | | | | | | 54,074,327 | | | |
|
| U.S. Government Agency Obligations — 46.7% |
| | | |
Fannie Mae Discount Notes | | | | | | | | | | |
| 0.05% | | 01/07/15 - 02/26/15 | | | 3,110,000 | | | | 3,109,822 | | | (d) |
| 0.06% | | 04/15/15 | | | 1,500,000 | | | | 1,499,727 | | | (d) |
| 0.07% | | 04/27/15 | | | 1,000,000 | | | | 999,774 | | | (d) |
| 0.09% | | 04/01/15 | | | 2,000,000 | | | | 1,999,575 | | | (d) |
| 0.10% | | 04/16/15 | | | 2,000,000 | | | | 1,999,446 | | | (d) |
| 0.11% | | 03/18/15 | | | 1,000,000 | | | | 999,768 | | | (d) |
| 0.14% | | 06/10/15 | | | 1,500,000 | | | | 1,499,067 | | | (d) |
Federal Farm Credit Discount Notes | | | | | | | | | | |
| 0.08% | | 04/21/15 | | | 500,000 | | | | 499,878 | | | (d) |
Federal Home Loan Bank Discount Notes | | | | | | | | | | |
| 0.04% | | 01/02/15 | | | 3,000,000 | | | | 2,999,997 | | | (d) |
| 0.05% | | 01/07/15 | | | 4,000,000 | | | | 3,999,969 | | | (d) |
| 0.06% | | 01/21/15 | | | 2,000,000 | | | | 1,999,931 | | | (d) |
| 0.07% | | 01/28/15 - 01/30/15 | | | 4,500,000 | | | | 4,499,764 | | | (d) |
| 0.08% | | 02/06/15 | | | 4,750,000 | | | | 4,749,608 | | | (d) |
| 0.09% | | 04/22/15 - 04/29/15 | | | 2,450,000 | | | | 2,449,340 | | | (d) |
| 0.10% | | 02/13/15 - 04/29/15 | | | 8,085,000 | | | | 8,083,446 | | | (d) |
| 0.13% | | 05/20/15 | | | 210,000 | | | | 209,895 | | | (d) |
| 0.18% | | 03/20/15 | | | 1,000,000 | | | | 999,617 | | | (d) |
Freddie Mac Discount Notes | | | | | | | | | | |
| 0.04% | | 01/12/15 - 01/28/15 | | | 4,200,000 | | | | 4,199,911 | | | (d) |
| 0.06% | | 03/12/15 | | | 610,000 | | | | 609,935 | | | (d) |
| 0.07% | | 03/25/15 - 04/01/15 | | | 4,000,000 | | | | 3,999,327 | | | (d) |
| 0.09% | | 03/09/15 - 05/08/15 | | | 3,000,000 | | | | 2,999,207 | | | (d) |
| 0.10% | | 03/16/15 - 04/24/15 | | | 3,000,000 | | | | 2,999,219 | | | (d) |
| 0.11% | | 03/30/15 - 04/13/15 | | | 4,600,000 | | | | 4,598,684 | | | (d) |
| 0.13% | | 06/08/15 | | | 2,000,000 | | | | 1,998,854 | | | (d) |
| | | | | | | | | | | | |
| 0.15% | | 06/15/15 | | | 1,000,000 | | | | 999,322 | | | (d) |
| | | | | | | | | 65,003,083 | | | |
| | | | | | | | | | | | |
| | | | | Principal
Amount | | | Amortized
Cost | | | |
| |
| Repurchase Agreement — 14.5% | | | |
| | | |
Merrill Lynch, Pierce, Fenner & Smith, Inc. U.S. Treasury Repo 0.07% dated 12/31/14, to be repurchased at $20,122,039 on 01/02/15 collateralized by $20,524,474 U.S. Treasury Note, 0.50%, maturing on 09/30/16. 01/02/15 | | $ | 20,122,000 | | | $ | 20,122,000 | | | |
| | | |
Total Short-Term Investments (Cost $139,199,410) | | | | | | | 139,199,410 | | | |
| | | |
Other Assets and Liabilities, net — 0.0%* | | | | | | | 18,667 | | | |
| | | | | | | | | | | | |
| | | |
NET ASSETS — 100.0% | | | | | | $ | 139,218,077 | | | |
| | | | | | | | | | | | |
See Notes to Schedules of Investments and Notes to Financial Statements.
73

December 31, 2014
The views expressed in this document reflect our judgment as of the publication date and are subject to change at any time without notice. The securities cited may not be representative of the Funds’ future investments and should not be construed as a recommendation to purchase or sell a particular security. See each Funds’ summary prospectus and the Funds’ statutory prospectus for complete descriptions of investment objectives, policies, risks and permissible investments.
| (a) | Non-income producing security. |
| (b) | Pursuant to Rule 144A of the Securities Act of 1933, as amended, these securities may be resold in transactions exempt from registration, normally to qualified institutional buyers. At December 31, 2014, these securities amounted to $8,380,692 and $37,410,402 or 3.64% and 11.96% of the net assets of the Elfun Diversified Fund and Elfun Income Fund, respectively. These securities have been determined to be liquid using procedures established by the Fund’s Board of Directors. |
| (c) | Settlement is on a delayed delivery or when-issued basis with final maturity to be announced (TBA) in the future. |
| (d) | Coupon amount represents effective yield. |
| (e) | State Street Corp. is the parent company of State Street Bank & Trust Co., the Fund’s sub-administrator, custodian and accounting agent. |
| (f) | Principal only security. These securities represent the right to receive the monthly principal payments on an underlying pool of mortgages. No payments of interest on the pool are passed through to the “principal only” holder. |
| (g) | Interest only security. These securities represent the right to receive the monthly interest payments on an underlying pool of mortgages. Payments of principal on the pool reduce the value of the “interest only” holding. |
| (h) | At December 31, 2014, all or a portion of this security was pledged to cover collateral requirements for futures and/or TBA’s. |
| (i) | Variable or floating rate security. The stated rate represents the rate at December 31, 2014. |
| (k) | Escrowed to maturity Bonds are collateralized by U.S. Treasury securities which are held in escrow by a trustee and are used to pay principal and interest on such bonds. |
| (l) | Pre-refunded Bonds are collateralized by U.S. Treasury securities, which are held in escrow by a trustee and are used to pay principal and interest on the tax-exempt issue to retire the bonds at the earliest refunding date. |
| (m) | The security is insured by AGC, AGMC, AMBAC, FGIC or MBIA. The Elfun Tax-Exempt Fund had no insurance concentrations of 5% or greater as of December 31, 2014 (as a percentage of net assets). |
| (n) | Security is in default. |
| (o) | Sponsored by SSgA Funds Management, Inc., an affiliate of State Street Bank & Trust Co., the Fund’s sub-administrator, custodian and accounting agent. |
| (p) | Represents a payment-in-kind (PIK) security which may pay all or a portion of interest in additional par. |
| (q) | Security is fair valued by the Valuation Committee, in accordance with the procedures approved by GEAM’s Board of Trustees. |
| † | Percentages are based on net assets as of December 31, 2014. |
| ** | Amount is less than $ 0.50. |
74
December 31, 2014
Abbreviations:
| | | | | | |
| ADR | | | — | | | American Depositary Receipt |
| AGC | | | — | | | Assured Guaranty Corporation |
| AGMC | | | — | | | Assured Guaranty Municipal Company |
| AMBAC | | | — | | | AMBAC Indemnity Corporation |
| FGIC | | | — | | | Financial Guaranty Insurance Corporation |
| MBIA | | | — | | | Municipal Bond Investors Assurance Corporation |
| REIT | | | — | | | Real Estate Investment Trust |
REMIC | | | — | | | Real Estate Mortgage Investment Conduit |
SPDR | | | — | | | Standard and Poor’s Depositary Receipt |
STRIPS | | | — | | | Separate Trading of Registered Interest and Principal of Security |
TBA | | | — | | | To Be Announced |
75

Selected data based on a share outstanding throughout the fiscal years indicated
| | | | | | | | | | | | | | | | | | | | |
| Elfun International Equity Fund | | 2014 | | | 2013 | | | 2012 | | | 2011 | | | 2010 | |
Inception date | | | — | | | | — | | | | — | | | | — | | | | 1/1/88 | |
Net asset value, beginning of period | | | $21.93 | | | | $18.31 | | | | $15.43 | | | | $18.92 | | | | $18.24 | |
Income/(loss) from investment operations: | | | | | | | | | | | | | | | | | | | | |
Net investment income | | | 0.58 | | | | 0.37 | | | | 0.35 | | | | 0.44 | | | | 0.36 | |
Net realized and unrealized
gains/(losses) on investments | | | (2.24 | ) | | | 3.62 | | | | 2.88 | | | | (3.48 | ) | | | 0.69 | |
Total income/(loss) from investment operations | | | (1.66 | ) | | | 3.99 | | | | 3.23 | | | | (3.04 | ) | | | 1.05 | |
Less distributions from: | | | | | | | | | | | | | | | | | | | | |
Net investment income | | | 0.57 | | | | 0.37 | | | | 0.35 | | | | 0.44 | | | | 0.37 | |
Return of capital | | | — | | | | — | | | | 0.00 | * | | | 0.01 | | | | — | |
Total distributions | | | 0.57 | | | | 0.37 | | | | 0.35 | | | | 0.45 | | | | 0.37 | |
Net asset value, end of period | | | $19.70 | | | | $21.93 | | | | $18.31 | | | | $15.43 | | | | $18.92 | |
TOTAL RETURN (a) | | | (7.62 | )% | | | 21.81 | % | | | 20.95 | % | | | (16.02 | )% | | | 5.77 | % |
RATIOS/SUPPLEMENTAL DATA: | | | | | | | | | | | | | | | | | | | | |
Net assets, end of period (in thousands) | | | $254,310 | | | | $306,922 | | | | $260,728 | | | | $240,572 | | | | $309,473 | |
Ratios to average net assets: | | | | | | | | | | | | | | | | | | | | |
Net investment income | | | 2.54 | % | | | 1.83 | % | | | 1.98 | % | | | 2.34 | % | | | 2.05 | % |
Net expenses | | | 0.33 | %(b) | | | 0.31 | %(b) | | | 0.45 | %(b) | | | 0.30 | %(b) | | | 0.32 | %(b) |
Gross expenses | | | 0.33 | % | | | 0.31 | % | | | 0.45 | % | | | 0.31 | % | | | 0.34 | % |
Portfolio turnover rate | | | 36 | % | | | 49 | % | | | 47 | % | | | 39 | % | | | 42 | % |
Notes to Financial Highlights
| (a) | Total returns are historical and assume changes in share price, reinvestment of dividends and capital gains distributions and assume no sales charge. Past performance does not guarantee future results. |
| (b) | Includes contractual management fee waiver related to the Fund’s investments in the GE Institutional Money Market Fund (the “Fund”). The fee waiver agreement was terminated effective June 30, 2014 with the closure of the Fund. |
The accompanying Notes are an integral part of these financial statements.
76
Selected data based on a share outstanding throughout the fiscal years indicated
| | | | | | | | | | | | | | | | | | | | |
| Elfun Trusts | | 2014 | | | 2013 | | | 2012 | | | 2011 | | | 2010 | |
Inception date | | | — | | | | — | | | | — | | | | — | | | | 5/27/35 | |
Net asset value, beginning of period | | | $56.07 | | | | $44.06 | | | | $40.35 | | | | $41.38 | | | | $38.50 | |
Income/(loss) from investment operations: | | | | | | | | | | | | | | | | | | | | |
Net investment income | | | 0.75 | | | | 0.71 | | | | 0.77 | | | | 0.48 | | | | 0.40 | |
Net realized and unrealized
gains/(losses) on investments | | | 6.67 | | | | 14.68 | | | | 7.77 | | | | 0.06 | | | | 4.64 | |
Total income from investment operations | | | 7.42 | | | | 15.39 | | | | 8.54 | | | | 0.54 | | | | 5.04 | |
Less distributions from: | | | | | | | | | | | | | | | | | | | | |
Net investment income | | | 0.75 | | | | 0.72 | | | | 0.76 | | | | 0.48 | | | | 0.41 | |
Net realized gains | | | 4.72 | | | | 2.66 | | | | 4.07 | | | | 1.09 | | | | 1.75 | |
Total distributions | | | 5.47 | | | | 3.38 | | | | 4.83 | | | | 1.57 | | | | 2.16 | |
Net asset value, end of period | | | $58.02 | | | | $56.07 | | | | $44.06 | | | | $40.35 | | | | $41.38 | |
TOTAL RETURN (a) | | | 13.13 | % | | | 34.98 | % | | | 21.27 | % | | | 1.33 | % | | | 13.07 | % |
RATIOS/SUPPLEMENTAL DATA: | | | | | | | | | | | | | | | | | | | | |
Net assets, end of period (in thousands) | | | $2,476,637 | | | | $2,326,948 | | | | $1,820,262 | | | | $1,647,396 | | | | $1,731,716 | |
Ratios to average net assets: | | | | | | | | | | | | | | | | | | | | |
Net investment income | | | 1.26 | % | | | 1.36 | % | | | 1.60 | % | | | 1.09 | % | | | 1.00 | % |
Net expenses | | | 0.18 | %(b) | | | 0.15 | %(b) | | | 0.19 | %(b) | | | 0.21 | %(b) | | | 0.21 | %(b) |
Gross expenses | | | 0.18 | % | | | 0.15 | % | | | 0.19 | % | | | 0.21 | % | | | 0.22 | % |
Portfolio turnover rate | | | 13 | % | | | 12 | % | | | 11 | % | | | 16 | % | | | 14 | % |
Notes to Financial Highlights
| (a) | Total returns are historical and assume changes in share price, reinvestment of dividends and capital gains distributions and do not include the effect of insurance contract charges. Past performance does not guarantee future results. |
| (b) | Includes contractual management fee waiver related to the Fund’s investments in the GE Institutional Money Market Fund (the “Fund”). The fee waiver agreement was terminated effective June 30, 2014 with the closure of the Fund. |
The accompanying Notes are an integral part of these financial statements.
77
Selected data based on a share outstanding throughout the fiscal years indicated
| | | | | | | | | | | | | | | | | | | | |
| Elfun Diversified Fund | | 2014 | | | 2013 | | | 2012 | | | 2011 | | | 2010 | |
Inception date | | | — | | | | — | | | | — | | | | — | | | | 1/1/88 | |
Net asset value, beginning of period | | | $19.84 | | | | $18.30 | | | | $16.53 | | | | $17.41 | | | | $16.08 | |
Income/(loss) from investment operations: | | | | | | | | | | | | | | | | | | | | |
Net investment income | | | 0.37 | | | | 0.36 | | | | 0.33 | | | | 0.38 | | | | 0.28 | |
Net realized and unrealized
gains/(losses) on investments | | | 0.62 | | | | 2.70 | | | | 1.78 | | | | (0.83 | ) | | | 1.32 | |
Total income/(loss) from investment operations | | | 0.99 | | | | 3.06 | | | | 2.11 | | | | (0.45 | ) | | | 1.60 | |
Less distributions from: | | | | | | | | | | | | | | | | | | | | |
Net investment income | | | 0.37 | | | | 0.35 | | | | 0.34 | | | | 0.43 | | | | 0.27 | |
Net realized gains | | | 1.65 | | | | 1.17 | | | | — | | | | — | | | | — | |
Return of capital | | | 0.03 | | | | — | | | | — | | | | — | | | | — | |
Total distributions | | | 2.05 | | | | 1.52 | | | | 0.34 | | | | 0.43 | | | | 0.27 | |
Net asset value, end of period | | | $18.78 | | | | $19.84 | | | | $18.30 | | | | $16.53 | | | | $17.41 | |
TOTAL RETURN (a) | | | 4.95 | % | | | 16.79 | % | | | 12.77 | % | | | (2.60 | )% | | | 9.98 | % |
RATIOS/SUPPLEMENTAL DATA: | | | | | | | | | | | | | | | | | | | | |
Net assets, end of period (in thousands) | | | $230,123 | | | | $235,903 | | | | $213,168 | | | | $210,095 | | | | $229,881 | |
Ratios to average net assets: | | | | | | | | | | | | | | | | | | | | |
Net investment income | | | 1.79 | % | | | 1.78 | % | | | 1.75 | % | | | 2.11 | % | | | 1.76 | % |
Net expenses | | | 0.39 | %(b) | | | 0.33 | %(b) | | | 0.46 | %(b) | | | 0.40 | %(b) | | | 0.48 | %(b) |
Gross expenses | | | 0.39 | % | | | 0.34 | % | | | 0.47 | % | | | 0.41 | % | | | 0.75 | % |
Portfolio turnover rate | | | 176 | % | | | 144 | % | | | 173 | % | | | 197 | % | | | 148 | % |
Notes to Financial Highlights
| (a) | Total returns are historical and assume changes in share price, reinvestment of dividends and capital gains distributions and do not include the effect of insurance contract charges. Past performance does not guarantee future results. |
| (b) | Includes contractual management fee waiver related to the Fund’s investments in the GE Institutional Money Market Fund (the “Fund”). The fee waiver agreement was terminated effective June 30, 2014 with the closure of the Fund. |
The accompanying Notes are an integral part of these financial statements.
78
Selected data based on a share outstanding throughout the fiscal years indicated
| | | | | | | | | | | | | | | | | | | | |
| Elfun Tax-Exempt Income Fund | | 2014 | | | 2013 | | | 2012 | | | 2011 | | | 2010 | |
Inception date | | | — | | | | — | | | | — | | | | — | | | | 1/1/80 | |
Net asset value, beginning of period | | | $11.34 | | | | $12.32 | | | | $11.97 | | | | $11.33 | | | | $11.64 | |
Income/(loss) from investment operations: | | | | | | | | | | | | | | | | | | | | |
Net investment income | | | 0.47 | | | | 0.49 | | | | 0.51 | | | | 0.53 | | | | 0.53 | |
Net realized and unrealized
gains/(losses) on investments | | | 0.63 | | | | (0.98 | ) | | | 0.37 | | | | 0.64 | | | | (0.31 | ) |
Total income/(loss) from investment operations | | | 1.10 | | | | (0.49 | ) | | | 0.88 | | | | 1.17 | | | | 0.22 | |
Less distributions from: | | | | | | | | | | | | | | | | | | | | |
Net investment income | | | 0.47 | | | | 0.49 | | | | 0.51 | | | | 0.53 | | | | 0.53 | |
Net realized gains | | | — | | | | 0.00 | * | | | 0.02 | | | | — | | | | — | |
Total distributions | | | 0.47 | | | | 0.49 | | | | 0.53 | | | | 0.53 | | | | 0.53 | |
Net asset value, end of period | | | $11.97 | | | | $11.34 | | | | $12.32 | | | | $11.97 | | | | $11.33 | |
TOTAL RETURN (a) | | | 9.85 | % | | | (4.06 | )% | | | 7.45 | % | | | 10.57 | % | | | 1.86 | % |
RATIOS/SUPPLEMENTAL DATA: | | | | | | | | | | | | | | | | | | | | |
Net assets, end of period (in thousands) | | | $1,624,266 | | | | $1,568,533 | | | | $1,785,176 | | | | $1,730,904 | | | | $1,677,925 | |
Ratios to average net assets: | | | | | | | | | | | | | | | | | | | | |
Net investment income | | | 4.01 | % | | | 4.14 | % | | | 4.18 | % | | | 4.56 | % | | | 4.54 | % |
Net expenses | | | 0.21 | % | | | 0.23 | % | | | 0.18 | % | | | 0.19 | % | | | 0.19 | % |
Gross expenses | | | 0.21 | % | | | 0.23 | % | | | 0.18 | % | | | 0.19 | % | | | 0.19 | % |
Portfolio turnover rate | | | 34 | % | | | 28 | % | | | 28 | % | | | 31 | % | | | 26 | % |
Notes to Financial Highlights
| (a) | Total returns are historical and assume changes in share price, reinvestment of dividends and capital gains distributions and assume no sales charge. Past performance does not guarantee future results. |
The accompanying Notes are an integral part of these financial statements.
79
Selected data based on a share outstanding throughout the fiscal years indicated
| | | | | | | | | | | | | | | | | | | | |
| Elfun Income Fund | | 2014 | | | 2013 | | | 2012 | | | 2011 | | | 2010 | |
Inception date | | | — | | | | — | | | | — | | | | — | | | | 12/31/84 | |
Net asset value, beginning of period | | | $11.22 | | | | $11.65 | | | | $11.58 | | | | $11.18 | | | | $10.73 | |
Income/(loss) from investment operations: | | | | | | | | | | | | | | | | | | | | |
Net investment income | | | 0.29 | | | | 0.29 | | | | 0.26 | | | | 0.39 | | | | 0.36 | |
Net realized and unrealized
gains/(losses) on investments | | | 0.35 | | | | (0.40 | ) | | | 0.42 | | | | 0.48 | | | | 0.52 | |
Total income/(loss) from investment operations | | | 0.64 | | | | (0.11 | ) | | | 0.68 | | | | 0.87 | | | | 0.88 | |
Less distributions from: | | | | | | | | | | | | | | | | | | | | |
Net investment income | | | 0.29 | | | | 0.29 | | | | 0.26 | | | | 0.38 | | | | 0.43 | |
Net realized gains | | | 0.00 | * | | | 0.03 | | | | 0.35 | | | | 0.09 | | | | — | |
Total distributions | | | 0.29 | | | | 0.32 | | | | 0.61 | | | | 0.47 | | | | 0.43 | |
Net asset value, end of period | | | $11.57 | | | | $11.22 | | | | $11.65 | | | | $11.58 | | | | $11.18 | |
TOTAL RETURN (a) | | | 5.75 | % | | | (0.95 | )% | | | 5.94 | % | | | 7.87 | % | | | 8.31 | % |
RATIOS/SUPPLEMENTAL DATA: | | | | | | | | | | | | | | | | | | | | |
Net assets, end of period (in thousands) | | | $312,756 | | | | $319,994 | | | | $364,407 | | | | $363,029 | | | | $350,325 | |
Ratios to average net assets: | | | | | | | | | | | | | | | | | | | | |
Net investment income | | | 2.50 | % | | | 2.53 | % | | | 2.20 | % | | | 3.39 | % | | | 3.34 | % |
Net expenses | | | 0.29 | %(b) | | | 0.28 | %(b) | | | 0.23 | %(b) | | | 0.24 | %(b) | | | 0.23 | %(b) |
Gross expenses | | | 0.29 | % | | | 0.29 | % | | | 0.25 | % | | | 0.26 | % | | | 0.27 | % |
Portfolio turnover rate | | | 326 | % | | | 330 | % | | | 402 | % | | | 438 | % | | | 357 | % |
Notes to Financial Highlights
| (a) | Total returns are historical and assume changes in share price, reinvestment of dividends and capital gains distributions and do not include the effect of insurance contract charges. Past performance does not guarantee future results. |
| (b) | Includes contractual management fee waiver related to the Fund’s investments in the GE Institutional Money Market Fund (the “Fund”). The fee waiver agreement was terminated effective June 30, 2014 with the closure of the Fund. |
The accompanying Notes are an integral part of these financial statements.
80
Selected data based on a share outstanding throughout the fiscal years indicated
| | | | | | | | | | | | | | | | | | | | |
| Elfun Government Money Market Fund | | 2014 | | | 2013 | | | 2012 | | | 2011 | | | 2010 | |
Inception date | | | — | | | | — | | | | — | | | | — | | | | 6/13/90 | |
Net asset value, beginning of period | | | $1.00 | | | | $1.00 | | | | $1.00 | | | | $1.00 | | | | $1.00 | |
Income/(loss) from investment operations: | | | | | | | | | | | | | | | | | | | | |
Net investment income | | | — | | | | — | | | | — | | | | 0.00 | * | | | 0.00 | * |
Total income from investment operations | | | — | | | | — | | | | — | | | | 0.00 | * | | | 0.00 | * |
Less distributions from: | | | | | | | | | | | | | | | | | | | | |
Net investment income | | | 0.00 | * | | | — | | | | — | | | | 0.00 | * | | | 0.00 | * |
Net realized gains | | | — | | | | 0.00 | * | | | — | | | | — | | | | — | |
Total distributions | | | 0.00 | * | | | 0.00 | * | | | — | | | | 0.00 | * | | | 0.00 | * |
Net asset value, end of period | | | $1.00 | | | | $1.00 | | | | $1.00 | | | | $1.00 | | | | $1.00 | |
TOTAL RETURN (a) | | | 0.05 | % | | | 0.04 | % | | | 0.00 | % | | | 0.07 | % | | | 0.15 | %(c) |
RATIOS/SUPPLEMENTAL DATA: | | | | | | | | | | | | | | | | | | | | |
Net assets, end of period (in thousands) | | | $139,218 | | | | $166,530 | | | | $164,529 | | | | $177,378 | | | | $207,108 | |
Ratios to average net assets: | | | | | | | | | | | | | | | | | | | | |
Net investment income | | | — | % | | | — | % | | | — | % | | | 0.01 | % | | | 0.06 | % |
Net expenses | | | 0.05 | %** | | | 0.11 | %** | | | 0.18 | %** | | | 0.23 | %** | | | 0.26 | %** |
Gross expenses | | | 0.36 | % | | | 0.34 | % | | | 0.32 | % | | | 0.32 | % | | | 0.28 | % |
Notes to Financial Highlights
| (a) | Total returns are historical and assume changes in share price, reinvestment of dividends and capital gains distributions and assume no sales charge. Past performance does not guarantee future results. |
| (c) | Total return is revised to correct an error in the total return calculation, which was determined not to be material to previously issued financial statements. |
| ** | GEAM has voluntarily undertaken to reduce its management fee and/or subsidize certain expenses of the Fund to the extent necessary to maintain a minimum annualized yield of 0.00%. |
The accompanying Notes are an integral part of these financial statements.
81
| | | | | | | | | | |
| | |
Statements of Assets and Liabilities December 31, 2014 | | ELFUN
INTERNATIONAL
EQUITY FUND | | ELFUN TRUSTS |
| | |
ASSETS | | | | | | | | | | |
Investments in securities, at Fair Value (cost $230,462,276; $1,332,584,681; $185,373,645; $1,480,087,766; $307,287,797 and $0, respectively) | | | $ | 249,028,705 | | | | $ | 2,406,900,080 | |
Short-term investments, at Amortized Cost | | | | 5,227,089 | | | | | 65,958,047 | |
Repurchase agreements | | | | — | | | | | — | |
Cash | | | | 10,344 | | | | | — | |
Restricted cash | | | | 122,039 | | | | | — | |
Foreign currency (cost $9,857; $0; $774; $0; $0 and $0, respectively) | | | | 9,869 | | | | | — | |
Receivable from GEAM | | | | 11,126 | | | | | — | |
Receivable for investments sold | | | | — | | | | | — | |
Income receivables | | | | 374,362 | | | | | 4,857,854 | |
Receivable for fund shares sold | | | | 5,115 | | | | | 210,366 | |
Other assets | | | | — | | | | | 31,770 | |
Total assets | | | | 254,788,649 | | | | | 2,477,958,117 | |
LIABILITIES | | | | | | | | | | |
Distribution payable to shareholders | | | | — | | | | | — | |
Payable for investments purchased | | | | — | | | | | — | |
Payable for fund shares redeemed | | | | 223,844 | | | | | 612,401 | |
Payable to GEAM | | | | — | | | | | 474,538 | |
Accrued other expenses | | | | 136,968 | | | | | 234,086 | |
Variation margin payable | | | | 19,723 | | | | | — | |
Accrued foreign capital gains tax | | | | 98,201 | | | | | — | |
Total liabilities | | | | 478,736 | | | | | 1,321,025 | |
NET ASSETS | | | $ | 254,309,913 | | | | $ | 2,476,637,092 | |
NET ASSETS CONSIST OF: | | | | | | | | | | |
Capital paid in | | | $ | 260,285,653 | | | | $ | 1,398,450,431 | |
Undistributed (distributions in excess of) net investment income | | | | 32 | | | | | 80,067 | |
Accumulated net realized gain (loss) | | | | (24,410,347 | ) | | | | 3,791,195 | |
Net unrealized appreciation (depreciation) on: | | | | | | | | | | |
Investments | | | | 18,468,228 | | | | | 1,074,315,399 | |
Futures | | | | (4,776 | ) | | | | — | |
Foreign currency related transactions | | | | (28,877 | ) | | | | — | |
NET ASSETS | | | $ | 254,309,913 | | | | $ | 2,476,637,092 | |
Shares outstanding (Par value $10; $10; $10; $10; $10; and $1, respectively; unlimited shares authorized) | | | | 12,907,100 | | | | | 42,687,400 | |
Net asset value, offering and redemption price per share | | | $ | 19.70 | | | | $ | 58.02 | |
The accompanying Notes are an integral part of these financial statements.
82
| | | | | | | | | | | | | | | | | | |
| | | |
ELFUN
DIVERSIFIED
FUND | | ELFUN TAX-EXEMPT
INCOME FUND | | ELFUN
INCOME FUND | | ELFUN
GOVERNMENT
MONEY MARKET
FUND |
| | | |
| | | | | | | | | | | | | | | | | | | |
| | | |
| | $ | 205,199,721 | | | | $ | 1,608,548,861 | | | | $ | 311,039,309 | | | | $ | — | |
| | | 30,414,288 | | | | | 28,548,000 | | | | | 21,605,685 | | | | | 119,077,410 | |
| | | — | | | | | — | | | | | — | | | | | 20,122,000 | |
| | | 8,313 | | | | | — | | | | | 1,685 | | | | | 336 | |
| | | 103,200 | | | | | — | | | | | — | | | | | — | |
| | | |
| | | 770 | | | | | — | | | | | — | | | | | — | |
| | | — | | | | | — | | | | | — | | | | | — | |
| | | 1 | | | | | — | | | | | 95 | | | | | — | |
| | | 602,268 | | | | | 20,647,403 | | | | | 1,903,649 | | | | | 39 | |
| | | 2,555 | | | | | 215,663 | | | | | 26,517 | | | | | 512,814 | |
| | | — | | | | | 11,990 | | | | | — | | | | | — | |
| | | 236,331,116 | | | | | 1,657,971,917 | | | | | 334,576,940 | | | | | 139,712,599 | |
| | | | | | | | | | | | | | | | | | | |
| | | — | | | | | 1,629,881 | | | | | 163,514 | | | | | — | |
| | | 5,724,969 | | | | | 31,629,078 | | | | | 21,418,414 | | | | | — | |
| | | 215,481 | | | | | 79,365 | | | | | 64,235 | | | | | 401,473 | |
| | | 497 | | | | | 209,329 | | | | | 27,724 | | | | | 3,950 | |
| | | 163,027 | | | | | 158,504 | | | | | 107,472 | | | | | 89,099 | |
| | | 103,865 | | | | | — | | | | | 39,247 | | | | | — | |
| | | — | | | | | — | | | | | — | | | | | — | |
| | | 6,207,839 | | | | | 33,706,157 | | | | | 21,820,606 | | | | | 494,522 | |
| | $ | 230,123,277 | | | | $ | 1,624,265,760 | | | | $ | 312,756,334 | | | | $ | 139,218,077 | |
| | | | | | | | | | | | | | | | | | | |
| | $ | 211,038,862 | | | | $ | 1,520,989,459 | | | | $ | 308,363,824 | | | | $ | 139,216,864 | |
| | | 24 | | | | | 62,784 | | | | | 331,472 | | | | | — | |
| | | (881,057 | ) | | | | (25,247,578 | ) | | | | 339,734 | | | | | 1,213 | |
| | | | | | | | | | | | | | | | | | | |
| | | 19,826,076 | | | | | 128,461,095 | | | | | 3,751,512 | | | | | — | |
| | | 145,082 | | | | | — | | | | | (30,208 | ) | | | | — | |
| | | (5,710 | ) | | | | — | | | | | — | | | | | — | |
| | $ | 230,123,277 | | | | $ | 1,624,265,760 | | | | $ | 312,756,334 | | | | $ | 139,218,077 | |
| | | |
| | | 12,255,524 | | | | | 135,740,070 | | | | | 27,041,854 | | | | | 139,415,803 | |
| | $ | 18.78 | | | | $ | 11.97 | | | | $ | 11.57 | | | | $ | 1.00 | |
83
| | | | | | | | | | |
| | |
Statements of Operations For the year ended December 31, 2014 | |
ELFUN
INTERNATIONAL
EQUITY FUND | | ELFUN
TRUSTS |
| | |
INVESTMENT INCOME | | | | | | | | | | |
Income | | | | | | | | | | |
Dividend | | | $ | 8,782,970 | | | | $ | 34,214,190 | |
Interest | | | | 9 | | | | | 105 | |
Less: Foreign taxes withheld | | | | (598,358 | ) | | | | — | |
Total income | | | | 8,184,621 | | | | | 34,214,295 | |
Expenses | | | | | | | | | | |
Advisory and administration fees | | | | 498,814 | | | | | 3,425,374 | |
Blue Sky fees | | | | 24,033 | | | | | 30,977 | |
Transfer agent fees | | | | 163,019 | | | | | 573,537 | |
Custody and accounting expenses | | | | 143,203 | | | | | 92,804 | |
Professional fees | | | | 25,604 | | | | | 34,417 | |
Other expenses | | | | 85,951 | | | | | 214,989 | |
Total expenses before waivers | | | | 940,624 | | | | | 4,372,098 | |
Less: Fees waived and expenses reimbursed by the adviser | | | | (1,181 | ) | | | | (14,936 | ) |
Net expenses | | | | 939,443 | | | | | 4,357,162 | |
Net investment income | | | $ | 7,245,178 | | | | $ | 29,857,133 | |
NET REALIZED AND UNREALIZED GAIN (LOSS) ON INVESTMENTS | | | | | | | | | | |
| | |
Realized gain (loss) on: | | | | | | | | | | |
Investments | | | | 20,400,655 | | | | | 191,149,342 | |
Futures | | | | 39,186 | | | | | — | |
Foreign currency transactions | | | | (136,051 | ) | | | | — | |
| | |
Increase (decrease) in unrealized appreciation/depreciation on: | | | | | | | | | | |
Investments | | | | (49,326,360 | ) | | | | 76,152,832 | |
Futures | | | | (271,702 | ) | | | | — | |
Foreign currency translations | | | | (43,659 | ) | | | | — | |
Net realized and unrealized gain (loss) on investments | | | | (29,337,931 | ) | | | | 267,302,174 | |
Net increase (decrease) in net assets resulting from operations | | | $ | (22,092,753 | ) | | | $ | 297,159,307 | |
The accompanying Notes are an integral part of these financial statements.
84
| | | | | | | | | | | | | | | | | | |
| | | |
ELFUN
DIVERSIFIED
FUND | | ELFUN
TAX-EXEMPT
INCOME FUND | | ELFUN
INCOME FUND | | ELFUN
GOVERNMENT
MONEY MARKET
FUND |
| | | |
| | | | | | | | | | | | | | | | | | | |
| | | | | | | | | | | | | | | | | | | |
| | $ | 3,320,876 | | | | $ | — | | | | $ | 18,846 | | | | $ | — | |
| | | 1,975,302 | | | | | 68,106,603 | | | | | 8,881,539 | | | | | 76,191 | |
| | | (103,884 | ) | | | | — | | | | | — | | | | | — | |
| | | 5,192,294 | | | | | 68,106,603 | | | | | 8,900,385 | | | | | 76,191 | |
| | | | | | | | | | | | | | | | | | | |
| | | 407,250 | | | | | 2,850,467 | | | | | 560,498 | | | | | 264,501 | |
| | | 23,069 | | | | | 30,186 | | | | | 21,280 | | | | | 34,601 | |
| | | 121,995 | | | | | 258,420 | | | | | 144,540 | | | | | 113,659 | |
| | | 280,140 | | | | | 69,843 | | | | | 114,656 | | | | | 62,213 | |
| | | 29,331 | | | | | 44,104 | | | | | 25,990 | | | | | 16,129 | |
| | | 69,614 | | | | | 195,370 | | | | | 80,599 | | | | | 55,579 | |
| | | 931,399 | | | | | 3,448,390 | | | | | 947,563 | | | | | 546,682 | |
| | | (6,374 | ) | | | | — | | | | | (7,747 | ) | | | | (470,491 | ) |
| | | 925,025 | | | | | 3,448,390 | | | | | 939,816 | | | | | 76,191 | |
| | $ | 4,267,269 | | | | $ | 64,658,213 | | | | $ | 7,960,569 | | | | $ | — | |
| | | | | | | | | | | | | | | | | | | |
| | | |
| | | | | | | | | | | | | | | | | | | |
| | | 18,148,802 | | | | | (4,091,383 | ) | | | | 3,952,966 | | | | | 1,213 | |
| | | 402,398 | | | | | (4,255,025 | ) | | | | (2,620,819 | ) | | | | — | |
| | | (19,696 | ) | | | | — | | | | | — | | | | | — | |
| | | |
| | | | | | | | | | | | | | | | | | | |
| | | (11,147,232 | ) | | | | 93,958,249 | | | | | 8,712,223 | | | | | — | |
| | | (255,752 | ) | | | | — | | | | | (341,186 | ) | | | | — | |
| | | (8,195 | ) | | | | — | | | | | — | | | | | — | |
| | | 7,120,325 | | | | | 85,611,841 | | | | | 9,703,184 | | | | | 1,213 | |
| | $ | 11,387,594 | | | | $ | 150,270,054 | | | | $ | 17,663,753 | | | | $ | 1,213 | |
85
| | | | | | | | | | |
| |
Statements of Changes in Net Assets For the year ended December 31, 2014 and 2013 | |
ELFUN
INTERNATIONAL EQUITY FUND |
| | | 2014 | | 2013 |
INCREASE (DECREASE) IN NET ASSETS | | | | | | | | | | |
Operations: | | | | | | | | | | |
Net investment income | | | $ | 7,245,178 | | | | $ | 5,092,422 | |
Net realized gain (loss) on investments, futures and foreign
currency transactions | | | | 20,303,790 | | | | | 20,498,760 | |
Net increase (decrease) in unrealized appreciation/depreciation on investments, futures and foreign currency translations | | | | (49,641,721 | ) | | | | 30,068,363 | |
Net increase (decrease) from operations | | | | (22,092,753 | ) | | | | 55,659,545 | |
Distributions to shareholders from: | | | | | | | | | | |
Net investment income | | | | (7,173,676 | ) | | | | (5,047,548 | ) |
Net realized gains | | | | — | | | | | — | |
Return of capital | | | | — | | | | | — | |
Total distributions | | | | (7,173,676 | ) | | | | (5,047,548 | ) |
Increase (decrease) in assets from operations and distributions | | | | (29,266,429 | ) | | | | 50,611,997 | |
Share transactions: | | | | | | | | | | |
Proceeds from sale of shares | | | | 5,989,812 | | | | | 8,363,427 | |
Value of distributions reinvested | | | | 6,310,419 | | | | | 4,490,586 | |
Cost of shares redeemed | | | | (35,645,662 | ) | | | | (17,272,192 | ) |
Net increase (decrease) from share transactions | | | | (23,345,431 | ) | | | | (4,418,179 | ) |
Total increase (decrease) in net assets | | | | (52,611,860 | ) | | | | 46,193,818 | |
| | |
NET ASSETS | | | | | | | | | | |
Beginning of year | | | | 306,921,773 | | | | | 260,727,955 | |
End of year | | | $ | 254,309,913 | | | | $ | 306,921,773 | |
Undistributed (distributions in excess of) net investment income, end
of year | | | $ | 32 | | | | $ | (7 | ) |
| | | | | | | | | | |
| | |
CHANGES IN FUND SHARES | | | | |
Shares sold | | | | 281,667 | | | | | 421,399 | |
Issued for distributions reinvested | | | | 315,205 | | | | | 208,476 | |
Shares redeemed | | | | (1,685,316 | ) | | | | (875,133 | ) |
Net increase (decrease) in fund shares | | | | (1,088,444 | ) | | | | (245,258 | ) |
The accompanying Notes are an integral part of these financial statements.
86
| | | | | | | | | | | | | | | | | | |
| |
| | | | | ELFUN
TRUSTS | | | | | | | | | |
ELFUN
DIVERSIFIED
FUND | | | |
| 2014 | | 2013 | | 2014 | | 2013 |
| | | | | | | | | | | | | | | | | | | |
| | | | | | | | | | | | | | | | | | | |
| | $ | 29,857,133 | | | | $ | 28,188,095 | | | | $ | 4,267,269 | | | | $ | 4,005,901 | |
| |
|
191,149,342 |
| | | | 105,313,057 | | | | | 18,531,504 | | | | | 15,552,659 | |
| | | 76,152,832 | | | | | 488,564,280 | | | | | (11,411,179 | ) | | | | 15,309,064 | |
| | | 297,159,307 | | | | | 622,065,432 | | | | | 11,387,594 | | | | | 34,867,624 | |
| | | | | | | | | | | | | | | | | | | |
| | | (29,624,777 | ) | | | | (28,390,137 | ) | | | | (4,188,445 | ) | | | | (3,909,807 | ) |
| | | (187,625,045 | ) | | | | (105,323,220 | ) | | | | (18,371,427 | ) | | | | (13,026,535 | ) |
| | | — | | | | | — | | | | | (379,499 | ) | | | | — | |
| | | (217,249,822 | ) | | | | (133,713,357 | ) | | | | (22,939,371 | ) | | | | (16,936,342 | ) |
| | | 79,909,485 | | | | | 488,352,075 | | | | | (11,551,777 | ) | | | | 17,931,282 | |
| | | | | | | | | | | | | | | | | | | |
| | | 53,464,351 | | | | | 52,506,920 | | | | | 11,842,915 | | | | | 10,856,991 | |
| | | 173,632,057 | | | | | 106,119,503 | | | | | 20,221,724 | | | | | 14,739,769 | |
| | | (157,316,644 | ) | | | | (140,293,251 | ) | | | | (26,292,570 | ) | | | | (20,793,272 | ) |
| | | 69,779,764 | | | | | 18,333,172 | | | | | 5,772,069 | | | | | 4,803,488 | |
| | | 149,689,249 | | | | | 506,685,247 | | | | | (5,779,708 | ) | | | | 22,734,770 | |
| | | |
| | | | | | | | | | | | | | | | | | | |
| | | 2,326,947,843 | | | | | 1,820,262,596 | | | | | 235,902,985 | | | | | 213,168,215 | |
| | $ | 2,476,637,092 | | | | $ | 2,326,947,843 | | | | $ | 230,123,277 | | | | $ | 235,902,985 | |
| | $ | 80,067 | | | | $ | — | | | | $ | 24 | | | | $ | (1 | ) |
| | | | | | | | | | | | | | | | | | | |
| | | |
| | | | | | | |
| | | 922,288 | | | | | 1,021,591 | | | | | 592,677 | | | | | 547,872 | |
| | | 2,962,497 | | | | | 1,906,579 | | | | | 1,070,499 | | | | | 747,832 | |
| | | (2,698,432 | ) | | | | (2,737,265 | ) | | | | (1,295,036 | ) | | | | (1,054,014 | ) |
| | | 1,186,353 | | | | | 190,905 | | | | | 368,140 | | | | | 241,690 | |
87
| | | | | | | | | | |
| |
Statements of Changes in Net Assets For the year ended December 31, 2014 and 2013 | |
ELFUN
TAX-EXEMPT INCOME
FUND |
| | | 2014 | | 2013 |
INCREASE (DECREASE) IN NET ASSETS | | | | | | |
Operations: | | | | | | | | | | |
Net investment income | | | $ | 64,658,213 | | | | $ | 69,805,656 | |
Net realized gain (loss) on investments, futures and foreign currency transactions | | | | (8,346,408 | ) | | | | (16,789,836 | ) |
Net increase (decrease) in unrealized appreciation/depreciation on investments, futures and foreign currency translations | | | | 93,958,249 | | | | | (123,267,193 | ) |
Net increase (decrease) from operations | | | | 150,270,054 | | | | | (70,251,373 | ) |
Distributions to shareholders from: | | | | | | | | | | |
Net investment income | | | | (64,658,255 | ) | | | | (69,805,656 | ) |
Net realized gains | | | | — | | | | | (19,351 | ) |
Return of capital | | | | — | | | | | — | |
Total distributions | | | | (64,658,255 | ) | | | | (69,825,007 | ) |
Increase (decrease) in assets from operations and distributions | | | | 85,611,799 | | | | | (140,076,380 | ) |
Share transactions: | | | | | | | | | | |
Proceeds from sale of shares | | | | 47,814,369 | | | | | 51,347,357 | |
Value of distributions reinvested | | | | 43,941,692 | | | | | 47,821,362 | |
Cost of shares redeemed | | | | (121,634,739 | ) | | | | (175,736,389 | ) |
Net increase (decrease) from share transactions | | | | (29,878,678 | ) | | | | (76,567,670 | ) |
Total increase (decrease) in net assets | | | | 55,733,121 | | | | | (216,644,050 | ) |
| | |
NET ASSETS | | | | | | | | | | |
Beginning of year | | | | 1,568,532,639 | | | | | 1,785,176,689 | |
End of year | | | $ | 1,624,265,760 | | | | $ | 1,568,532,639 | |
Undistributed (distributions in excess of) net investment income, end of year | | | $ | 62,784 | | | | $ | 62,826 | |
| | | | | | | | | | |
|
CHANGES IN FUND SHARES |
Shares sold | | | | 4,057,975 | | | | | 4,304,139 | |
Issued for distributions reinvested | | | | 3,720,994 | | | | | 4,061,921 | |
Shares redeemed | | | | (10,321,944 | ) | | | | (15,039,292 | ) |
Net increase (decrease) in fund shares | | | | (2,542,975 | ) | | | | (6,673,232 | ) |
The accompanying Notes are an integral part of these financial statements.
88
| | | | | | | | | | | | | | | | | | |
| |
| | | | ELFUN INCOME FUND | | | | | | | | | |
ELFUN GOVERNMENT MONEY MARKET FUND | | | |
| 2014 | | 2013 | | 2014 | | 2013 |
| | | | | | | | | | | | | | | | | | | |
| | | | | | | | | | | | | | | | | | | |
| | $ | 7,960,569 | | | | $ | 8,675,262 | | | | $ | — | | | | $ | — | |
| |
|
1,332,147 |
| | | | (270,034 | ) | | | | 1,213 | | | | | 2,604 | |
| |
|
8,371,037 |
| | | | (11,892,194 | ) | | | | — | | | | | — | |
| | | 17,663,753 | | | | | (3,486,966 | ) | | | | 1,213 | | | | | 2,604 | |
| | | | | | | | | | | | | | | | | | | |
| | | (7,994,297 | ) | | | | (8,585,695 | ) | | | | (62,739 | ) | | | | — | |
| | | (58,810 | ) | | | | (928,338 | ) | | | | — | | | | | (67,655 | ) |
| | | — | | | | | — | | | | | — | | | | | — | |
| | | (8,053,107 | ) | | | | (9,514,033 | ) | | | | (62,739 | ) | | | | (67,655 | ) |
| | | 9,610,646 | | | | | (13,000,999 | ) | | | | (61,526 | ) | | | | (65,051 | ) |
| | | | | | | | | | | | | | | | | | | |
| | | 12,278,351 | | | | | 16,866,303 | | | | | 62,655,321 | | | | | 109,988,330 | |
| | | 5,997,828 | | | | | 7,097,620 | | | | | 56,986 | | | | | 61,134 | |
| | | (35,124,433 | ) | | | | (55,375,961 | ) | | | | (89,963,152 | ) | | | | (107,982,347 | ) |
| | | (16,848,254 | ) | | | | (31,412,038 | ) | | | | (27,250,845 | ) | | | | 2,067,117 | |
| | | (7,237,608 | ) | | | | (44,413,037 | ) | | | | (27,312,371 | ) | | | | 2,002,066 | |
| | | |
| | | | | | | | | | | | | | | | | | | |
| | | 319,993,942 | | | | | 364,406,979 | | | | | 166,530,448 | | | | | 164,528,382 | |
| | $ | 312,756,334 | | | | $ | 319,993,942 | | | | $ | 139,218,077 | | | | $ | 166,530,448 | |
| | $ | 331,472 | | | | $ | 365,200 | | | | $ | — | | | | $ | — | |
| | | | | | | | | | | | | | | | | | | |
| | | | | | | | | | | | | | | | | | | |
| | | |
| | | | | | | |
| | | 1,071,105 | | | | | 1,472,564 | | | | | 62,592,321 | | | | | 109,920,330 | |
| | | 522,120 | | | | | 624,675 | | | | | 56,986 | | | | | 61,134 | |
| | | (3,064,658 | ) | | | | (4,861,886 | ) | | | | (89,963,152 | ) | | | | (107,982,347 | ) |
| | | (1,471,433 | ) | | | | (2,764,647 | ) | | | | (27,313,845 | ) | | | | 1,999,117 | |
89
December 31, 2014

| 1. | Organization of the Funds |
The Elfun Funds (each a “Fund” and collectively the “Funds”) are registered under the Investment Company Act of 1940, as amended (the “1940 Act”), as open-end management investment companies. The Funds operate as Employees’ Securities Companies (as defined in the 1940 Act) and as such are exempt from certain provisions of the 1940 Act. Each Fund is an investment company and accordingly follows the investment company accounting and reporting guidance of the Financial Accounting Standards Board (“FASB”) Accounting Standard Codification (“ASC) Topic 946 Financial Services—Investment Companies.
GE Asset Management Incorporated (“GEAM”), the Funds’ investment adviser, is a wholly owned subsidiary of General Electric Company.
| 2. | Summary of Significant Accounting Policies |
The preparation of financial statements in conformity with U.S. generally accepted accounting principles (“GAAP”) requires management to make estimates and assumptions that affect the reported amounts of assets and liabilities and disclosure of contingent assets and liabilities at the date of the financial statements and the reported amounts of increases and decreases in net assets from operations during the reporting period. Actual results may differ from those estimates.
Subsequent events after the balance sheet date through the date the financial statements were issued have been evaluated in the preparation of the financial statements. There are no items to report.
The following summarizes the significant accounting policies of the Funds:
Securities Valuation and Transactions All investments in securities are recorded at their estimated fair value, as described in Note 3.
Securities transactions are accounted for as of the trade date. Realized gains and losses on investments sold are recorded on the basis of identified cost for both financial statement and federal tax purposes.
Repurchase Agreements Certain Funds engage in repurchase agreement transactions with respect to instruments that are consistent with the Fund’s investment objectives or policies. The Funds’ custodian takes possession of the collateral pledged for investments in repurchase agreements on behalf of the Funds. The Funds value the underlying collateral daily on a mark-to-market basis to determine that the value, including accrued interest, is at least equal to 102% for domestic securities and 105% for international securities of the repurchase price. In the event the seller defaults and the value of the security declines, or if the seller enters an insolvency proceeding, realization of the collateral by the Funds may be delayed or limited.
Foreign Currency Accounting records of the Funds are maintained in U.S. dollars. Investment securities and other assets and liabilities denominated in a foreign currency are translated to U.S. dollars at the prevailing rates of exchange at period end. Purchases and sales of securities, income receipts and expense payments denominated in foreign currencies are translated into U.S. dollars at the prevailing exchange rate on the respective dates of such transactions.
All assets and liabilities of the Funds initially expressed in foreign currency values will be converted into U.S. dollars at the WM/Reuter exchange rate computed at 11:00 a.m., Eastern time.
The Funds do not isolate the portion of the results of operations resulting from changes in foreign exchange rates from the fluctuations arising from changes in the market prices of securities during the year. Such fluctuations are included in the net realized or unrealized gain or loss from investments. Net realized gains or losses on foreign currency transactions represent net gains or losses on sales and maturities of foreign currency contracts, disposition of foreign currencies, the difference between the amount of net investment income and withholding taxes accrued and the U.S. dollar amount actually received or paid, and gains or losses between the trade and settlement date on purchases and sales of foreign securities. Net unrealized foreign exchange gains and losses arising from changes in the value of other assets and liabilities (including foreign currencies and open foreign currency contracts) as a result of changes in foreign
90
December 31, 2014
exchange rates are included as increases or decreases in unrealized appreciation/depreciation on foreign currency related transactions.
Derivatives The Funds are subject to equity price risk, interest rate risk, credit risk, and foreign currency exchange rate risk in the normal course of pursuing their investment objectives. Certain Funds entered into derivative transactions to gain market exposure for residual and accumulating cash positions and for managing the duration of fixed-income investments.
Futures Contracts A futures contract represents a commitment for the future purchase or sale of an asset at a specified price on a specified date. Certain Funds invest in interest rate, financial and stock or bond index futures contracts subject to certain limitations. The Elfun International Equity Fund entered into stock index futures contracts for the purpose of gaining market exposure and investing residual cash positions. The Elfun Diversified Fund entered into futures contracts on various stock indices, bonds and notes for the purposes of gaining market exposure, investing residual cash positions and managing duration of fixed income investments. The Elfun Tax-Exempt Income Fund entered into futures contracts on bonds and notes for the purpose of managing duration of fixed income investments. The Elfun Income Fund entered into futures contracts on bonds and notes for the purpose of managing duration of fixed income investments. Buying futures tends to increase a Fund’s exposure to the underlying instrument while selling futures tends to decrease a Fund’s exposure to the underlying instrument, or to hedge other Fund investments. With futures contracts, there is minimal counterparty credit risk to the Funds since futures contracts are exchange traded and the exchange’s clearinghouse, as counterparty to all traded futures, guarantees the futures against default. A Fund’s risks in using these contracts include changes in the value of the underlying instruments, non-performance of the counterparties under the contracts’ terms and changes in the liquidity of the secondary market for the contracts. Futures contracts are valued at the settlement price established each day by the board of trade or exchange on which they principally trade.
Upon entering into a financial futures contract, the Funds are required to pledge to the broker an amount of cash
and/or other assets equal to a certain percentage of the contract amount, known as initial margin deposit. Subsequent payments, known as variation margin, are made or received by the Funds each day, depending on the daily fluctuation in the fair value of the underlying security. The Funds record an unrealized gain or loss equal to the daily variation margin. Should market conditions move unexpectedly, the Funds may not achieve the anticipated benefits of the futures contracts and may incur a loss. The Funds recognize a realized gain or loss on the expiration or closing of a futures contract.
When-Issued Securities and Forward Commitments Elfun Income Fund and Elfun Diversified Fund purchases or sells securities on a when-issued or forward commitment basis. These transactions are arrangements in which the Fund purchases and sells securities with payment and delivery scheduled a month or more after entering into the transaction. The price of the underlying securities and the date when these securities will be delivered and paid for are fixed at the time the transaction is negotiated. Losses may arise due to changes in the market value of the underlying securities or if the counterparty does not perform under the commitments. In connection with such purchases, the Funds maintain cash or liquid assets in an amount equal to the purchase commitments for such underlying securities until settlement date and for sales commitments the Funds maintain equivalent deliverable securities as “cover” for the transaction. Unsettled commitments are valued at the current market value of the underlying security. Daily fluctuations in the value of such commitments are recorded as unrealized gains or losses. The Funds will not enter into such commitments for the purpose of investment leverage.
Forward Foreign Currency Exchange Contracts Certain Funds may enter into forward foreign currency exchange contracts to facilitate transactions in foreign denominated securities and to manage currency exposure. Forward foreign currency exchange contracts are valued at the mean between the bid and the offered forward rates as last quoted by a recognized dealer. The aggregate principal amounts of the contracts are not recorded in a Fund’s financial statements. Such amounts appear under the caption Forward Foreign Currency
91
December 31, 2014
Contracts in the Schedule of Investments. Fluctuations in the value of the contracts are recorded in the Statement of Assets and Liabilities as an asset (or liability) and in the Statement of Operations as unrealized appreciation (depreciation) until the contracts are closed, when they are recorded as realized gains or losses on foreign currency related transactions. A Fund’s risks in using these contracts include changes in the value of foreign currency or the possibility that the counterparties do not perform under the contracts’ terms. When a Fund enters into a forward foreign currency exchange contract, it is required to segregate cash or liquid securities with its custodian in an amount equal to the value of a Fund’s total assets committed to the consummation of the forward contract. If the value of the segregated securities declines, additional cash or securities are segregated so that the value of the account will equal the amount of the Fund’s commitment with respect to the contract.
Investments in Foreign Markets Investments in foreign markets involve special risks and considerations not typically associated with investing in the United States. These risks include revaluation of currencies, high rates of inflation, restrictions on repatriation of income and capital, and adverse political and economic developments. Moreover, securities issued in these markets may be less liquid, subject to government ownership controls, tariffs and taxes, subject to delays in settlements, and their prices may be more volatile.
The Funds may be subject to capital gains and repatriation taxes imposed by certain countries in which they invest. Such taxes are generally based upon income and/or capital gains earned or repatriated. Taxes are accrued based on net investment income, net realized gains and net unrealized appreciation as income and/or capital gains are earned.
Investment Income Corporate actions (including cash dividends) are recorded on ex-dividend date, net of applicable withholding taxes, except for certain foreign corporate actions which are recorded as soon after ex-dividend date as such information becomes available. Withholding taxes on foreign dividends have been provided for in accordance with the Funds’ understanding of the applicable country’s tax rules and rates.
Interest income is recorded on the accrual basis. Accretion of discounts and amortization premiums on taxable bonds are to the call or maturity date, whichever is shorter, using the effective yield method.
Expenses Fund specific expenses are charged to the Fund that incurs such expenses. Such expenses may include custodial fees, legal and accounting fees, printing costs and registration fees. Expenses that are not fund specific are allocated pro rata across the Funds. Expenses of the Fund are generally paid directly by the Fund; however, expenses may be paid by GEAM and reimbursed by the Fund.
Federal Income Taxes The Funds intend to comply with all sections of the Internal Revenue Code of 1986 as amended (the “Internal Revenue Code”) applicable to regulated investment companies including the distribution of substantially all of their taxable net investment income, tax-exempt income and net realized capital gains to their shareholders. Therefore, no provision for federal income tax has been made. Each Fund is treated as a separate taxpayer for federal income tax purposes.
| 3. | Security Valuation and Transactions |
The Funds utilize various methods to measure the fair value of most of its investments on a recurring basis. GAAP establishes a framework for measuring fair value and providing related disclosures. Broadly, the framework requires fair value to be determined based on the exchange price that would be received for an asset or paid to transfer a liability (an exit price) in the principal or most advantageous market for the asset or liability in an orderly transaction between market participants at the measurement date. In the absence of active markets for the identical assets or liabilities, such measurements involve developing assumptions based on market observable data and, in the absence of such data, internal information that is consistent with what market participants would use in a hypothetical transaction that occurs at the measurement date. It also establishes a three-level valuation hierarchy based upon observable and non-observable inputs.
92
December 31, 2014
Observable inputs reflect market data obtained from independent sources, while unobservable inputs reflect our market assumptions. Preference is given to observable inputs. These two types of inputs create the following fair value hierarchy:
Level 1 — Quoted prices for identical investments in active markets.
Level 2 — Quoted prices for similar investments in active markets; quoted prices for identical or similar investments in markets that are not active; and model-derived valuations whose inputs are observable or whose significant value drivers are observable.
Level 3 — Significant inputs to the valuation model are unobservable.
Policies and procedures are maintained to value investments using the best and most relevant data available. In addition, pricing vendors are utilized to assist in valuing investments. GEAM performs periodic reviews of the methodologies used by independent pricing services including price validation of individual securities.
Fair Value Measurement The following section describes the valuation methodologies the Funds use to measure different financial investments at fair value.
A Fund’s portfolio securities are valued generally on the basis of market quotations. Equity securities generally are valued at the last reported sale price on the primary market in which they are traded. Portfolio securities listed on NASDAQ are valued using the NASDAQ Official Closing Price, Level 1 securities primarily include publicly-traded equity securities. If no sales occurred on the exchange or NASDAQ that day, the portfolio security generally is valued using the last reported bid price. In those circumstances the Fund typically classifies the investment securities in Level 2.
Debt securities (other than short-term securities described below) generally are valued at an evaluated bid price as reported by independent pricing services. The pricing services use various pricing models for each asset class. The inputs and assumptions to the model of the pricing services are derived from market observable sources, including: benchmark yields, reported trades, broker/dealer quotes, issuer spreads, benchmark securities, bids, offers,
and other market related data. Since many fixed income securities do not trade on a daily basis, the methodology of the pricing service uses other available information as applicable such as benchmark curves, benchmarking of similar securities, sector groupings, and matrix pricing. Thus, certain securities may not be priced using quoted prices, but rather determined from market observable information. These investments are included in Level 2 and are primarily comprised of corporate fixed income, government, mortgage and asset-backed securities. In the absence of a reliable bid price from such a pricing service, debt securities may be valued based on broker or dealer supplied valuations or quotations. In these infrequent circumstances, pricing services may provide the Fund with valuations that are based on significant unobservable inputs, and in those circumstances the investment securities are classified as Level 3.
A Fund may use non-binding broker or dealer quotes for valuation when there is limited or no relevant market activity for a specific investment or for other investments that share similar characteristics and a price is not provided by a pricing service or is deemed not to be reliable. The Funds have not adjusted the prices obtained. Investment securities priced using non-binding broker or dealer quotes are included in Level 3.
Portfolio securities and any short-term investments of sufficient credit quality with remaining maturities of sixty days or less at the time of purchase are typically valued on the basis of amortized cost which approximates fair value and these are included in Level 2. If it is determined that amortized cost does not approximate fair value, securities may be valued based on dealer supplied valuations or quotations. In these infrequent circumstances, pricing services may provide the Fund with valuations that are based on significant unobservable inputs, and in those circumstances the investment securities are classified in Level 3.
Investments in Registered Investment Companies are valued at the published daily net asset value and classified in Level 1.
If prices are not readily available for a portfolio security, or if it is believed that a price for a portfolio security does not represent its fair value, the security may be valued using procedures approved by the Funds’ Board of Trustees that
93
December 31, 2014
are designed to establish its “fair” value. These securities are typically classified in Level 3. Those procedures require that the fair value of a security be established by a valuation committee of GEAM. The valuation committee follows different protocols for different types of investments and circumstances. The fair value procedures may be used to value any investment of any Fund in the appropriate circumstances.
Foreign securities may be valued with the assistance of an independent fair value pricing service in circumstances where it is believed that they have been or would be materially affected by events occurring after the close of the portfolio security’s primary market and before the close of regular trading on the New York Stock Exchange (“NYSE”). In these circumstances, the Fund classifies the investment securities in Level 2. This independent fair value pricing service uses a proprietary model to identify affected securities, taking into consideration various factors, and the fair value of such securities may be something other than the last available quotation or other market price.
All assets and liabilities of the Funds initially expressed in foreign currency values will be converted into U.S. dollars at the WM/Reuters exchange rate computed at 11:00 a.m. Eastern time.
Fair value determinations generally are used for securities whose value is affected by a significant event that will materially affect the value of a security and which occurs subsequent to the time of the close of the principal market on which such security trades but prior to the calculation of the Fund’s net asset value (“NAV”).
The value established for such a portfolio security valued other than by use of a market quotation (as described above) may be different than what would be produced through the use of market quotations or another methodology. Portfolio securities that are valued using techniques other than market quotations, including “fair valued” securities, may be subject to greater fluctuation in their value from one day to the next than would be the case if market quotations were used. In addition, there is no assurance that a Fund could sell a portfolio security for the value established for it at any time and it is possible that the Fund would incur a loss because a portfolio security is sold at a discount to its established value.
Other financial investments are derivative instruments that are not reflected in total investments, such as futures, forwards, swaps, and written options contracts, which are valued based on fair value as discussed above.
The Funds use closing prices for derivatives included in Level 1, which are traded either on exchanges or liquid over-the counter markets. Derivative assets and liabilities included in Level 2 primarily represent interest rate swaps, cross-currency swaps and foreign currency and commodity forward and option contracts. Derivative assets and liabilities included in Level 3 primarily represent interest rate products that contain embedded optionality or prepayment features.
The inputs or methodology used for valuing securities are not an indication of the risk associated with investing in those securities.
The following tables present the Funds’ investments measured at fair value on a recurring basis at December 31, 2014:
| | | | | | | | | | | | | | | | | | |
| Fund | | Investments | | Level 1 | | | Level 2 | | | Level 3 | | | Total | |
Elfun International
Equity Fund | | Investments in Securities † | | | | | | | | | | | | | | | | |
| | Common Stock | | $ | 11,686,690 | | | $ | 233,049,153 | | | $ | — | | | $ | 244,735,843 | |
| | Preferred Stock | | | — | | | | 4,292,862 | | | | — | | | | 4,292,862 | |
| | | Short-Term Investments | | | 5,227,089 | | | | — | | | | — | | | | 5,227,089 | |
| | | Total Investments in Securities | | $ | 16,913,779 | | | $ | 237,342,015 | | | $ | — | | | $ | 254,255,794 | |
94
December 31, 2014
| | | | | | | | | | | | | | | | | | |
| Fund | | Investments | | Level 1 | | | Level 2 | | | Level 3 | | | Total | |
| | Other Financial Instruments * | | | | | | | | | | | | | | | | |
| | Long Futures Contracts — Unrealized Appreciation | | $ | 2,302 | | | $ | — | | | $ | — | | | $ | 2,302 | |
| | | Long Futures Contracts — Unrealized Depreciation | | | (7,078 | ) | | | — | | | | — | | | | (7,078 | ) |
| | | Total Other Financial Instruments | | $ | (4,776 | ) | | $ | — | | | $ | — | | | $ | (4,776 | ) |
Elfun Trusts | | Investments in Securities † | | | | | | | | | | | | | | | | |
| | Common Stock | | $ | 2,406,900,080 | | | $ | — | | | $ | — | | | $ | 2,406,900,080 | |
| | | Short-Term Investments | | | 65,958,047 | | | | — | | | | — | | | | 65,958,047 | |
| | | Total Investments in Securities | | $ | 2,472,858,127 | | | $ | — | | | $ | — | | | $ | 2,472,858,127 | |
Elfun Diversified Fund | | Investments in Securities † | | | | | | | | | | | | | | | | |
| | Domestic Equity | | $ | 80,855,334 | | | $ | — | | | $ | — | | | $ | 80,855,334 | |
| | Foreign Equity | | | 3,663,851 | | | | 41,791,263 | | | | — | | | | 45,455,114 | |
| | U.S. Treasuries | | | — | | | | 14,596,531 | | | | — | | | | 14,596,531 | |
| | Agency Mortgage Backed | | | — | | | | 21,026,364 | | | | — | | | | 21,026,364 | |
| | Agency Collateralized Mortgage Obligations | | | — | | | | 295,386 | | | | — | | | | 295,386 | |
| | Asset Backed | | | — | | | | 30,073 | | | | — | | | | 30,073 | |
| | Corporate Notes | | | — | | | | 29,756,414 | | | | — | | | | 29,756,414 | |
| | Non-Agency Collateralized Mortgage Obligations | | | — | | | | 3,791,904 | | | | — | | | | 3,791,904 | |
| | Sovereign Bonds | | | — | | | | 853,107 | | | | — | | | | 853,107 | |
| | Municipal Bonds and Notes | | | — | | | | 373,085 | | | | — | | | | 373,085 | |
| | FNMA | | | — | | | | — | | | | 12,392 | | | | 12,392 | |
| | Exchange Traded Funds | | | 8,154,017 | | | | — | | | | — | | | | 8,154,017 | |
| | | Short-Term Investments | | | 30,414,288 | | | | — | | | | — | | | | 30,414,288 | |
| | | Total Investments in Securities | | $ | 123,087,490 | | | $ | 112,514,127 | | | $ | 12,392 | | | $ | 235,614,009 | |
| | Other Financial Instruments * | | | | | | | | | | | | | | | | |
| | Long Futures Contracts — Unrealized Appreciation | | $ | 181,851 | | | $ | — | | | $ | — | | | $ | 181,851 | |
| | Long Futures Contracts — Unrealized Depreciation | | | (20,010 | ) | | | — | | | | — | | | | (20,010 | ) |
| | Short Futures Contracts — Unrealized Appreciation | | | 4,401 | | | | — | | | | — | | | | 4,401 | |
| | | Short Futures Contracts — Unrealized Depreciation | | | (21,160 | ) | | | — | | | | — | | | | (21,160 | ) |
| | | Total Other Financial Instruments | | $ | 145,082 | | | $ | — | | | $ | — | | | $ | 145,082 | |
95
December 31, 2014
| | | | | | | | | | | | | | | | | | |
| Fund | | Investments | | Level 1 | | | Level 2 | | | Level 3 | | | Total | |
Elfun Tax-Exempt Income Fund | | Investments in Securities † | | | | | | | | | | | | | | | | |
| | Municipal Bonds and Notes | | $ | — | | | $ | 1,608,548,861 | | | $ | — | | | $ | 1,608,548,861 | |
| | | Short-Term Investments | | | 28,548,000 | | | | — | | | | — | | | | 28,548,000 | |
| | | Total Investments in Securities | | $ | 28,548,000 | | | $ | 1,608,548,861 | | | $ | — | | | $ | 1,637,096,861 | |
Elfun Income Fund | | Investments in Securities † | | | | | | | | | | | | | | | | |
| | U.S. Treasuries | | $ | — | | | $ | 61,745,774 | | | $ | — | | | $ | 61,745,774 | |
| | Agency Mortgage Backed | | | — | | | | 90,274,551 | | | | — | | | | 90,274,551 | |
| | Agency Collateralized Mortgage Obligations | | | — | | | | 1,477,129 | | | | — | | | | 1,477,129 | |
| | Asset Backed | | | — | | | | 976,703 | | | | — | | | | 976,703 | |
| | Corporate Notes | | | — | | | | 132,159,197 | | | | — | | | | 132,159,197 | |
| | Non-Agency Collateralized Mortgage Obligations | | | — | | | | 18,603,855 | | | | — | | | | 18,603,855 | |
| | Sovereign Bonds | | | — | | | | 3,308,074 | | | | — | | | | 3,308,074 | |
| | Municipal Bonds and Notes | | | — | | | | 2,113,842 | | | | — | | | | 2,113,842 | |
| | FNMA | | | — | | | | — | | | | 49,658 | | | | 49,658 | |
| | Preferred Stock | | | 330,526 | | | | — | | | | — | | | | 330,526 | |
| | | Short-Term Investments | | | 21,605,685 | | | | — | | | | — | | | | 21,605,685 | |
| | | Total Investments in Securities | | $ | 21,936,211 | | | $ | 310,659,125 | | | $ | 49,658 | | | $ | 332,644,994 | |
| | Other Financial Instruments * | | | | | | | | | | | | | | | | |
| | Long Futures Contracts — Unrealized Appreciation | | $ | 81,402 | | | $ | — | | | $ | — | | | $ | 81,402 | |
| | Long Futures Contracts — Unrealized Depreciation | | | (48,480 | ) | | | — | | | | — | | | | (48,480 | ) |
| | | Short Futures Contracts — Unrealized Depreciation | | | (63,130 | ) | | | — | | | | — | | | | (63,130 | ) |
| | | Total Other Financial Instruments | | $ | (30,208 | ) | | $ | — | | | $ | — | | | $ | (30,208 | ) |
Elfun Government Money Market Fund | | Investments in Securities † | | | | | | | | | | | | | | | | |
| | U.S. Treasuries | | $ | — | | | $ | 54,074,327 | | | $ | — | | | $ | 54,074,327 | |
| | U.S. Government Agency Obligations | | | — | | | | 65,003,083 | | | | — | | | | 65,003,083 | |
| | | Repurchase Agreements | | | — | | | | 20,122,000 | | | | — | | | | 20,122,000 | |
| | | Total Investments in Securities | | $ | — | | | $ | 139,199,410 | | | $ | — | | | $ | 139,199,410 | |
| † | See Schedules of Investments for industry classification. |
| * | Other financial instruments include derivative instruments such as futures contracts. Amounts shown represent unrealized appreciation (depreciation), at period end. |
96
December 31, 2014
The Elfun International Equity Fund and the Elfun Diversified Fund utilized the fair value pricing service on December 31, 2014 due to events occurring after the close of foreign local markets and before the close of regular trading on the NYSE. This resulted in certain foreign securities being classified as Level 1 at the beginning of the period which were classified as Level 2 at December 31, 2014. The value of securities that were transferred to Level 2 from Level 1 as a result was $233,495,095 and $39,153,556 for the Elfun International Equity Fund and the Elfun Diversified Fund, respectively. There were no other significant transfers between fair value levels. Transfers between fair value levels are considered to occur at the beginning of the period.
Level 3 investments at the beginning and/or end of the period in relation to net assets were not significant and, accordingly, a reconciliation of Level 3 assets for the year ended December 31, 2014 is not presented.
Shown below are the derivative contracts entered into by each Fund, summarized by primary risk exposure as they appear on the Statements of Assets and Liabilities, none of which are accounted for as hedging instruments under FASB ASC No. 815 Derivatives and Hedging as of December 31, 2014.
| | | | | | | | | | | | |
| | | Asset Derivatives December 31, 2014 | | | Liability Derivatives December 31, 2014 | |
Derivatives not accounted for as
hedging instruments under ASC 815 | | Location in the Statements of
Assets and Liabilities | | Fair
Value ($) | | | Location in the Statements of
Assets and Liabilities | | Fair
Value ($) | |
Elfun International Equity Fund | |
Equity Contracts | | Assets, Net Assets — Net Unrealized Appreciation/ (Depreciation) on Futures | | | 2,302 | * | | Liabilities, Net Assets — Net Unrealized Appreciation/ (Depreciation) on Futures | | | (7,078 | )* |
Elfun Diversified Fund | |
Equity Contracts | | Assets, Net Assets — Net Unrealized Appreciation/ (Depreciation) on Futures | | | 179,286 | * | | Liabilities, Net Assets — Net Unrealized Appreciation/ (Depreciation) on Futures | | | (1,955 | )* |
Interest Rate Contracts | | Assets, Net Assets — Net Unrealized Appreciation/ (Depreciation) on Futures | | | 6,966 | * | | Liabilities, Net Assets — Net Unrealized Appreciation/ (Depreciation) on Futures | | | (39,215 | )* |
Elfun Income Fund | |
Interest Rate Contracts | | Assets, Net Assets — Net Unrealized Appreciation/ (Depreciation) on Futures | | | 81,402 | * | | Liabilities, Net Assets — Net Unrealized Appreciation/ (Depreciation) on Futures | | | (111,610 | )* |
| * | Includes cumulative unrealized appreciation/(depreciation) of futures contracts as reported in the Schedule of Investments and within the components of the net assets section of the Statement of Assets and Liabilities. Only the current day’s variation margin is reported within the Assets and/or Liabilities section on the Statement of Assets and Liabilities. |
97
December 31, 2014
Shown below are the effects of derivative instruments on the Fund’s Statements of Operation, summarized by primary risk exposure all of which are not accounted for as hedging instruments under ASC 815.
| | | | | | | | | | | | | | | | | |
Derivatives not accounted
for as hedging instruments
under ASC 815 | | Location in the
Statements of
Operations | | Total Notional Amount
of Futures Contracts
Purchased/(Sold) ($) | | Realized Gain
(Loss) on
Derivatives
Recognized
in Income ($) | | Change in Unrealized
Appreciation (Depreciation)
on Derivatives
Recognized in Income ($) |
Elfun International Equity Fund | |
Equity Contracts | | Realized gain (loss) on Futures, Increase (decrease) in unrealized appreciation/ (depreciation) on Futures | | | | 30,692,032/(35,593,302) | | | | | 39,186 | | | | | (271,702 | ) |
Elfun Diversified Fund | |
Equity Contracts | | Realized gain (loss) on Futures, Increase (decrease) in unrealized appreciation/ (depreciation) on Futures | | | | 51,662,853/(55,374,253) | | | | | 1,046,324 | | | | | (159,331 | ) |
Interest Rate Contracts | | Realized gain/(loss) on futures, Increase/(decrease) in unrealized appreciation/ (depreciation) on Futures | | | | 219,729,930/(222,834,916) | | | | | (643,926 | ) | | | | (96,421 | ) |
Elfun Tax-Exempt Income Fund | |
Interest Rate Contracts | | Realized gain/(loss) on futures, Increase/(decrease) in unrealized appreciation/ (depreciation) on Futures | | | | 546,380,539/(542,125,514) | | | | | (4,255,025 | ) | | | | — | |
Elfun Income Fund | |
Interest Rate Contracts | | Realized gain/(loss) on futures, Increase/(decrease) in unrealized appreciation/ (depreciation) on Futures | | | | 929,731,509/939,709,974 | | | | | (2,620,819 | ) | | | | (341,186 | ) |
98
December 31, 2014
During the year ended December 31, 2014, the Funds had an average notional value of long and short futures contracts as shown below. Please refer to the table following the Portfolio of Investments for open futures contracts at December 31, 2014.
| | | | | | | | |
| Fund | | Long Contracts | | | Short Contracts | |
GE Elfun International Equity Fund | | $ | 3,267,613 | | | $ | (2,627,052 | ) |
GE Elfun Diversified Fund | | | 18,243,127 | | | | (10,778,250 | ) |
GE Elfun Tax-Exempt Income Fund | | | — | | | | (43,806,336 | ) |
GE Elfun Income Fund | | | 38,983,573 | | | | (44,539,913 | ) |
The Funds share a revolving credit facility of up to $150 million with a number of their affiliates. The credit facility is with its custodian bank, State Street Bank and Trust Company (“State Street”). The revolving credit facility requires the payment of a commitment fee equal to 0.125% per annum on the daily unused portion of the credit facility, payable quarterly. The portion borne by the Funds generally is borne proportionally based upon net assets. In addition, the Funds have a $100 million uncommitted, unsecured line of credit with State Street. Generally, borrowings under the credit facilities would accrue interest at the Federal Funds Rate plus 50 basis points and would be borne by the borrowing Fund. The maximum amount allowed to be borrowed by any one Fund is the lesser of (i) its prospectus limitation or (ii) 20% of its net assets. The credit facilities were not utilized by the Funds during the period ended December 31, 2014.
| 6. | Compensation and Fees paid to Affiliates |
During 2014, the Funds incurred expenses for the cost of services rendered by GEAM as investment adviser and administrator.
These expenses are included as advisory and administration fees (“Management Fees”) in the Statements of Operations. The Trustees received no compensation as Trustees for the Elfun Funds.
GEAM had a contractual arrangement with each Fund (except the Elfun Tax-Exempt Income Fund and the Elfun Government Money Market Fund) to waive a portion of its Management Fee earned by GEAM with respect to the Fund’s investment in the GE Institutional Money Market Fund (the “Fee Waiver Agreement”). Effective June 26, 2014, the State Street Institutional U.S. Government Money Market Fund replaced the GE Institutional Money Market Fund as the cash sweep vehicle for each Fund’s cash holdings. As a result, the Fee Waiver Agreement was terminated effective June 30, 2014 with the closure of the GE Institutional Money Market Fund.
Pursuant to an investment sub-advisory agreement with GEAM effective October 1, 2014, SSgA Funds Management, Inc. (“SSgA FM”) became the sub-adviser to the Elfun Government Money Market Fund. SSgA FM is responsible for the day-to-day portfolio management of the assets of the Elfun Government Money Market Fund, including the responsibility for making decisions to buy, sell or hold a particular security, under the general supervision of GEAM and the Board. For their services, GEAM pays SSgA FM monthly sub-advisory fees which are calculated as a percentage of the average daily net assets of the Elfun Government Money Market Fund.
99
December 31, 2014
| 8. | Investment Transactions |
Purchases and Sales of Securities
The cost of purchases and the proceeds from sales of investments, other than short-term securities, for the year ended December 31, 2014, were as follows:
| | | | | | | | | | | | | | | | |
| | | U.S. Government Securities | | | Other Securities | |
| Fund | | Purchases | | | Sales | | | Purchases | | | Sales | |
Elfun International Equity Fund | | $ | — | | | $ | — | | | $ | 99,588,969 | | | $ | 117,741,254 | |
Elfun Trusts | | | — | | | | — | | | | 293,087,567 | | | | 403,528,641 | |
Elfun Diversified Fund | | | 211,077,290 | | | | 208,538,214 | | | | 160,229,426 | | | | 175,080,012 | |
Elfun Tax-Exempt Income Fund | | | — | | | | — | | | | 537,665,644 | | | | 531,716,358 | |
Elfun Income Fund | | | 852,682,179 | | | | 848,505,409 | | | | 142,532,100 | | | | 157,847,310 | |
In July 2014, the Securities and Exchange Commission adopted amendments to the rules that govern money market funds. The new rules require a floating net asset value for institutional prime money market funds (including institutional municipal money market funds). Retail (as defined in the rules) and government money market funds, such as the Elfun Government Money Market Fund, are permitted to continue to use the amortized cost method to value their securities and to transact at a $1.00 stable share price. The final rules also include enhanced diversification, disclosure and stress testing requirements. Implementation of the amendments extends up to two years, depending on the specific rule. GEAM is currently evaluating the implications of these amendments to the Elfun Government Money Market Fund.
The Funds are subject to ASC 740, Income Taxes. ASC 740 provides guidance for financial accounting and reporting for the effects of income taxes that result from an entity’s activities during the year. ASC 740 also provides guidance regarding how certain tax positions should be recognized, measured, presented and disclosed in the financial statements. ASC 740 requires evaluation of tax positions taken or expected to be taken in the course of preparing the Funds’ tax returns to determine whether the tax positions are “more likely than not” of being sustained by the applicable tax authority. There are no adjustments to any Fund’s net assets required under ASC 740. Each Fund’s 2011, 2012, 2013 and 2014 fiscal years tax returns are still open to examination by the Federal and applicable state tax authorities.
At December 31, 2014, information on the tax cost of investments and distributable earnings on a tax basis was as follows:
| | | | | | | | | | | | | | | | | | | | | | | | | | | | | | | | |
| | | | | | Gross Tax | | | Net Tax Appreciation/
(Depreciation) | | | | | | | |
| Fund | | Cost of Investments for
Tax Purposes | | | Appreciation | | | Depreciation | | | Investments | | | Derivatives/
Currency | | | Undistributed
Income | | | Undistributed Accum.
Capital Gain/(Loss) | | | Late-Year
Losses | |
Elfun International Equity Fund | | $ | 236,928,325 | | | $ | 32,825,572 | | | $ | (15,596,303 | ) | | $ | 17,229,269 | | | $ | (33,653 | ) | | $ | — | | | $ | (23,173,974 | ) | | $ | — | |
Elfun Trusts | | | 1,398,467,737 | | | | 1,074,390,390 | | | | — | | | | 1,074,390,390 | | | | — | | | | 80,067 | | | | 3,716,204 | | | | — | |
Elfun Diversified Fund | | | 216,533,048 | | | | 23,313,076 | | | | (4,232,115 | ) | | | 19,080,961 | | | | 139,372 | | | | — | | | | — | | | | — | |
100
December 31, 2014
| | | | | | | | | | | | | | | | | | | | | | | | | | | | | | | | |
| | | | | | Gross Tax | | | Net Tax Appreciation/
(Depreciation) | | | | | | | |
| Fund | | Cost of Investments for
Tax Purposes | | | Appreciation | | | Depreciation | | | Investments | | | Derivatives/
Currency | | | Undistributed
Income | | | Undistributed Accum.
Capital Gain/(Loss) | | | Late-Year
Losses | |
Elfun Tax-Exempt Income Fund | | $ | 1,508,668,786 | | | $ | 128,731,033 | | | $ | (302,958 | ) | | $ | 128,428,075 | | | $ | — | | | $ | 62,784 | | | $ | (24,270,464 | ) | | $ | (944,094 | ) |
Elfun Income Fund | | | 329,090,253 | | | | 6,117,656 | | | | (2,562,915 | ) | | | 3,554,741 | | | | (30,208 | ) | | | 890,151 | | | | — | | | | (52,382 | ) |
Elfun Government Money Market Fund | | | 139,199,410 | | | | — | | | | — | | | | — | | | | — | | | | 51,447 | | | | — | | | | (354 | ) |
As of December 31, 2014, the following Funds have capital loss carryovers as indicated below. The capital loss carryover is available to offset future realized capital gains to the extent provided in the Internal Revenue Code and regulations thereunder. To the extent that these carryover losses are used to offset future capital gains, it is probable that the gains offset will not be distributed to shareholders.
| | | | | | | | | | | | |
| | | Amount | |
| Fund | | Short-Term | | | Long-Term | | | Expires | |
Elfun International Equity Fund | | $ | 9,691,471 | | | $ | — | | | | 12/31/17 | |
| | | 13,482,503 | | | | — | | | | 12/31/18 | |
Elfun Tax-Exempt Income Fund | | | 18,743,383 | | | | 5,527,081 | | | | Unlimited | |
These amounts will be available to offset future taxable capital gains. Under the Regulated Investment Company Modernization Act of 2010, the Fund will be permitted to carry forward capital losses incurred in taxable years beginning after December 22, 2010 for an unlimited period. However, any losses incurred during those future years will be required to be utilized prior to the losses incurred in pre-enactment tax years. As a result of this ordering rule, pre-enactment capital loss carryforwards may be more likely to expire unused. Additionally, post-enactment capital losses that are carried forward will retain their character as either short-term or long-term capital losses rather than being considered all short-term as under previous law.
During the year ended December 31, 2014, the Funds utilized prior year capital loss carryovers as follows:
| | | | |
| Fund | | Amount | |
Elfun International Equity Fund | | $ | 19,352,104 | |
Elfun Income Fund | | | 359,461 | |
Any qualified late-year loss is deemed to arise on the first day of the Funds’ next tax year (if the Funds elect to defer such loss). Under this regime, generally, the Funds can elect to defer any post-October capital loss and/or any late-year ordinary loss as defined by the Internal Revenue Code.
The Funds elected to defer qualified late-year losses for the year ended December 31, 2014 as follows:
| | | | |
| Fund | | Capital | |
Elfun Tax-Exempt Income Fund | | $ | (944,094 | ) |
Elfun Income Fund | | | (52,382 | ) |
Elfun Government Money Market Fund | | | (354 | ) |
101
December 31, 2014
The tax character of distributions paid during the year ended December 31, 2014, were as follows:
| | | | | | | | | | | | | | | | | | | | |
| Fund | | Exempt
Income | | | Ordinary
Income | | | Long-Term
Capital Gains | | | Return of
Capital | | | Total | |
Elfun International Equity Fund | | $ | — | | | $ | 7,173,676 | | | $ | — | | | $ | — | | | $ | 7,173,676 | |
Elfun Trusts | | | — | | | | 30,164,147 | | | | 187,085,675 | | | | — | | | | 217,249,822 | |
Elfun Diversified Fund | | | — | | | | 5,932,099 | | | | 16,627,773 | | | | 379,499 | | | | 22,939,371 | |
Elfun Tax-Exempt Income Fund | | | 63,284,972 | | | | 1,373,283 | | | | — | | | | — | | | | 64,658,255 | |
Elfun Income Fund | | | — | | | | 8,053,107 | | | | — | | | | — | | | | 8,053,107 | |
Elfun Government Money Market Fund | | | — | | | | 62,739 | | | | — | | | | — | | | | 62,739 | |
The tax character of distributions paid during the year ended December 31, 2013, were as follows:
| | | | | | | | | | | | | | | | | | | | |
| Fund | | Exempt Income | | | Ordinary
Income | | | Long-Term
Capital Gains | | | Return of
Capital | | | Total | |
Elfun International Equity Fund | | $ | — | | | $ | 5,047,548 | | | $ | — | | | $ | — | | | $ | 5,047,548 | |
Elfun Trusts | | | — | | | | 28,390,283 | | | | 105,323,074 | | | | — | | | | 133,713,357 | |
Elfun Diversified Fund | | | — | | | | 4,299,523 | | | | 12,636,819 | | | | — | | | | 16,936,342 | |
Elfun Tax-Exempt Income Fund | | | 67,843,440 | | | | 1,963,314 | | | | 18,253 | | | | — | | | | 69,825,007 | |
Elfun Income Fund | | | — | | | | 9,514,033 | | | | — | | | | — | | | | 9,514,033 | |
Elfun Government Money Market Fund | | | — | | | | 67,655 | | | | — | | | | — | | | | 67,655 | |
Distributions to Shareholders
Elfun Tax-Exempt Income Fund, Elfun Income Fund and Elfun Government Money Market Fund declare net investment income dividends daily and pay them monthly. All other Funds declare and pay dividends from net investment income, if any, annually. All Funds declare and pay net realized capital gains distributions, if any, annually. The character of income and gains to be distributed is determined in accordance with income tax regulations which may differ from generally accepted accounting principles. These differences include (but are not limited to) treatment of realized and unrealized gains (losses) on
foreign currency contracts, investments in futures, late year loss deferrals, distributions from Real Estate Investment Trusts (REITs) and other equity investments, distributions in excess of earnings, litigation proceeds, straddle loss deferrals, and losses deferred due to wash sale transactions. Reclassifications are made to the Funds’ capital accounts to reflect income and gains available for distribution (or available capital loss carryovers) under income tax regulations. These reclassifications have no impact on net investment income, realized gains or losses, or net asset value of the Funds. The calculation of net investment income per share in the Financial Highlights table excludes these adjustments.
The reclassifications for the year ended December 31, 2014 were as follows:
| | | | | | | | | | | | |
| Fund | | Undistributed
Net Investment
Income | | | Accumulated
Net Realized
Loss | | | Paid In
Capital | |
Elfun International Equity Fund | | $ | (71,463 | ) | | $ | 157,805 | | | $ | (86,342 | ) |
Elfun Trusts | | | (152,289 | ) | | | 339,812 | | | | (187,523 | ) |
Elfun Diversified Fund | | | (78,799 | ) | | | 78,799 | | | | — | |
Elfun Government Money Market Fund | | | 62,739 | | | | (2,604 | ) | | | (60,135 | ) |
102

The Unitholders and Board of Trustees
Elfun Funds:
We have audited the accompanying statements of assets and liabilities, including the schedules of investments, of the Elfun International Equity Fund, Elfun Trusts, Elfun Diversified Fund, Elfun Tax-Exempt Income Fund, Elfun Income Fund and Elfun Government Money Market Fund (collectively the “Funds”), as of December 31, 2014, and the related statements of operations for the year then ended, the statements of changes in net assets for each of the years in the two-year period then ended, and the financial highlights for each of the years in the five-year period then ended. These financial statements and financial highlights are the responsibility of the Fund’s management. Our responsibility is to express an opinion on these financial statements and financial highlights based on our audits.
We conducted our audits in accordance with the auditing standards of the Public Company Accounting Oversight Board (United States). Those standards require that we plan and perform the audit to obtain reasonable assurance about whether the financial statements and financial highlights are free of material misstatement. An audit includes examining, on a test basis, evidence supporting the amounts and disclosures in the financial statements. Our procedures included confirmation of securities owned as of December 31, 2014, by correspondence with the custodian and brokers, or by other appropriate auditing procedures where replies from brokers were not received. An audit also includes assessing the accounting principles used and significant estimates made by management, as well as evaluating the overall financial statement presentation. We believe that our audits provide a reasonable basis for our opinion.
In our opinion, the financial statements and financial highlights referred to above present fairly, in all material respects, the financial position of the Elfun International Equity Fund, Elfun Trusts, Elfun Diversified Fund, Elfun Tax-Exempt Income Fund, Elfun Income Fund and Elfun Government Money Market Fund as of December 31, 2014, the results of their operations for the year then ended, the changes in their net assets for each of the years in the two-year period then ended, and the financial highlights for each of the years in the five-year period then ended, in conformity with U.S. generally accepted accounting principles.

Boston, Massachusetts
February 25, 2015
103

For the year ended December 31, 2014
The following Funds intend to make an election under Internal Revenue Code Section 853. The election will allow shareholders to treat their attributable share of foreign taxes paid by the Funds to be paid by them directly. For the fiscal year ended December 31, 2014, the total amount of income received by the Funds from sources within foreign countries and possessions of the United States and the total amount of taxes paid by the Funds follows:
| | | | | | | | |
| | | Total Foreign Source Income | | | Total Foreign Taxes Paid | |
Elfun International Equity Fund | | $ | 8,782,970 | | | $ | 598,358 | |
For the year ended December 31, 2014, the following Funds hereby designate as capital gain dividends the amounts set forth, or the amount ultimately treated as capital gain net income:
| | | | |
| Fund | | Gross Amount | |
Elfun Trusts | | $ | 187,085,675 | |
Elfun Diversfied Fund | | | 16,627,773 | |
For the year ended December 31, 2014, certain dividends paid by the following funds may be subject to a maximum income tax rate of 20%. The following represent the amounts that may be considered qualified dividend income:
| | | | |
| Fund | | Qualified Dividend Income | |
Elfun International Equity Fund | | $ | 8,534,838 | |
Elfun Trusts | | | 33,202,882 | |
Elfun Diversified Fund | | | 3,186,482 | |
For corporate shareholders, of the ordinary dividends paid, the following represent the amounts that may be eligible for the dividends received deduction:
| | | | |
| Fund | | Dividends Received Deduction | |
Elfun Trusts | | | 97.51 | % |
Elfun Diversified Fund | | | 22.23 | % |
For the year ended December 31, 2014, the following Fund hereby designates as exempt-interest dividends the amounts set forth, or the amount ultimately treated as exempt-interest dividends:
| | | | |
| Fund | | Gross Amount | |
Elfun Tax-Exempt Income Fund | | $ | 63,284,972 | |
The amounts presented herein may differ from amounts presented elsewhere in the financial statements due to differences between tax and financial accounting principles. Please consult a tax advisor if you have any questions about Federal or State income tax laws or on how to prepare your tax returns. If you have specific questions about your Fund account, please consult your investment representative or call 1-800-242-0134.
104

The Board of Trustees of the Elfun Funds1 (the “Board”) considered and all those that were present unanimously approved the continuance for an additional year of the investment advisory agreements with GE Asset Management Incorporated (“GEAM”) at a meeting held on December 11, 2014. The Board did not consider the continuance of the Investment Sub-Advisory Agreement with SSGA Funds Management, Inc. with respect to the Elfun Government Money Market Fund due to the fact that renewal of the agreement is not required until December 2015.
In considering whether to approve the Funds’ investment advisory agreements, the Board members considered and discussed a substantial amount of information and analysis provided by GEAM personnel. The Board members also considered detailed information regarding performance and expenses of other investment companies, including those with similar investment strategies and sizes, which was prepared by independent third party provider Morningstar, Inc. (“Morningstar”). The Board members reviewed the fees charged by GEAM for other mutual funds and investment products other than mutual funds that employ the same investment strategies as the Funds. The Board had the opportunity to ask questions and request additional information in connection with its considerations.
Before approving each Fund’s investment advisory agreement, the Board members received and considered memoranda prepared by GEAM personnel that set forth detailed information, including numerous exhibits and other materials related to GEAM’s business and the services it provides to each Fund. The Board members also reviewed materials discussing the legal standards for the consideration of the proposed continuances. The Board members reviewed and discussed the proposed continuance of the agreements with GEAM personnel, including representatives from the legal, compliance and finance departments and senior members of each relevant investment group (e.g., equity, fixed income). The Board members also heard presentations by these representatives, and posed questions and engaged in substantive discussions with them concerning the Funds’ operations and the investment process
employed for each Fund. The Board members took into account that many of them possess multi-year experience as Board members and that all of them possess a great deal of knowledge about GEAM and the Funds in their capacities as senior officers of GEAM. They also took into account their consideration of these types of agreements in recent years. The information was presented in a manner to facilitate comparison to prior periods and to reflect certain enhancements to GEAM’s infrastructure, systems, research and analytics capabilities and shareholder servicing model. To focus their review, the Board members asked GEAM personnel, in its oral presentations, to highlight material differences from the information presented in recent years.
In reaching their determinations relating to continuance of the Funds’ investment advisory agreements, the Board members considered all factors that they deemed relevant, including the factors discussed below. In their deliberations, the Board members did not identify any particular information that was all-important or controlling, and each Board member may have attributed different weights to the various factors. The Board members evaluated this information, and all other information available to them, for each Fund separately, and their determinations were made separately in respect of each Fund. In particular, the Board members focused on the following with respect to each Fund:
The Nature, Extent And Quality Of Services Provided
The Board members reviewed the services provided by GEAM and concurred that GEAM provides high quality advisory and administrative services to the Funds. In connection with their consideration of GEAM’s services, the Board members focused on the favorable attributes of GEAM, including (i) an investment philosophy oriented toward long-term performance; (ii) effective processes used for selecting investments and brokers; (iii) effective processes used for providing Fund administration, including controllership and compliance functions, the optimization of its Fund administration platform and the continued oversight of the performance of other companies that provide services to the Funds; (iv) highly skilled professionals, including analysts, research professionals and portfolio managers with a depth of experience relevant to the Funds; (v) access to significant and enhanced technological resources from which the Funds may benefit and the implementation of a new platform to increase the quality and efficiency of
1 The Elfun Funds include the Elfun Trusts, Elfun International Equity Fund, Elfun Diversified Fund, Elfun Tax-Exempt Income Fund, Elfun Income Fund, Elfun Government Money Market Fund (each, a “Fund” and collectively, the “Funds”).
105
analytics and research; and (vi) a favorable history and reputation. The Board members noted that each Fund represents only a small amount of the overall assets managed by GEAM, but benefits from a full array of services and resources provided by GEAM. In particular, the Board members discussed that the Funds benefit from a large staff of research analysts employed by GEAM.
In light of the foregoing, the Board members concluded that the services provided by GEAM continue to be satisfactory.
Investment Performance Of The Funds
The Board members considered the investment performance of the Funds for various periods. The Board members reviewed detailed comparisons of the performance of the Funds with the relevant securities indices and peer and category groupings of mutual funds prepared by Morningstar with respect to various periods. The Board members also engaged in discussions with GEAM personnel regarding the investment process and performance results for each Fund. These discussions focused on each Fund’s investment objective, the number and experience of portfolio management and supporting research personnel, the investment style and approach employed, the likely market cycles for the investment style and, in some instances, relative underperformance of certain Funds in certain periods. The Board members discussed GEAM’s investment approach with respect to each of the Funds, and the reasons for certain Funds’ relative underperformance.
The Board members concluded that the Funds’ performance was acceptable overall taking into consideration the factors discussed above.
Cost Of The Services Provided To The Funds
The Board members considered the cost of the services provided by GEAM, noting that, pursuant to each investment advisory agreement, GEAM is reimbursed for its reasonable costs incurred in providing the services contemplated by those agreements and is not paid a management fee. The Board also noted that GE Investment Distributors, Inc. (“GEID”), a subsidiary of GEAM, is reimbursed for its reasonable costs incurred in providing services specified in its agreement with the Funds as unitholder servicing agent and is not paid a unitholder
servicing fee. The Board members considered that the charges resulting from this arrangement involve all of the expenses incurred by GEAM and GEID with respect to the management and unitholder operations of the Funds, including, without limitation, indirect allocable overhead costs and the direct and indirect costs of GEAM and GEID personnel providing investment management and other services to the Funds. The Board members noted and discussed the additional services provided by GEAM to the Funds compared to other investment products managed by GEAM and the charges that result from those services. The Board members also noted that none of the charges resulting from the Funds’ arrangements with GEAM and GEID may include any element of profit.
The Board members also noted that the Board had in prior years reviewed with GEAM personnel the underlying assumptions and methods of cost allocation used by GEAM in allocating its costs and those of the other Fund service providers, including GEID, to the Funds, and that such assumptions and methods used in cost allocation had not changed for this year. The Board members also discussed with GEAM personnel that the basis for their belief that the methods of allocation used by GEAM continue to be reasonable for each area of GEAM’s business.
Based on their review, the Board members concluded that they were satisfied that the assumptions and methods used in cost allocation and the level of expenses incurred by the Funds were not unreasonable or excessive.
The Extent To Which Economies Of Scale Would Be Realized For The Benefit Of Fund Shareholders As The Funds Grow
The Board members considered the extent to which economies of scale would be realized for the benefit of Fund investors as the Funds grow. The Board noted that, because of a moderate increase in assets, the Funds slightly benefited from economies of scale, which, in some instances, lowered the Funds’ operating expenses. The Board noted that the Funds (except for the Elfun Government Money Market Fund) continue to enjoy fee and expense levels within or below the group of lowest fee and expense funds in their respective peer group comparisons. The Board also noted that, with respect to the Elfun Government Money Market Fund, GEAM voluntarily undertook to reduce its management fee or sub-
106
sidize certain expenses of the Fund to the extent necessary to maintain a minimum annualized net yield of 0.00%.
The Board members recognized the significant benefits to the Funds resulting from their arrangement with GEAM, which causes them to bear only the reasonable costs incurred by GEAM and GEID, without any element of profit, for the substantial services they provide to the Funds. The Board members also recognized the benefits to the Funds of being able to leverage a favorable cost structure achieved with respect to the Funds’ other operating expenses as a result of GEAM’s large overall base of assets under management and its vendor management practices.
Comparison Of Services To Be Rendered And Costs To Be Incurred
The Board members discussed the services provided to the Funds by GEAM, and the costs incurred by the Funds for those services. The Board members reviewed information concerning the Funds’ expense ratios, and comparative information with respect to peer groupings of mutual funds prepared by Morningstar. They discussed that, in all cases, the Funds enjoy expense levels within or below the group of lowest cost funds in each peer group comparison. In light of
this information, the Board members determined that the level of expenses incurred was reasonable in relation to the services provided to the Funds.
Fall-Out Benefits
The Board members considered other actual and potential financial benefits that GEAM may derive from its relationship with the Funds, including, where applicable, soft dollar commission benefits generated through Fund portfolio transactions. The Board members noted, however, that the Funds benefit from the vast array of resources available through GEAM, and that each Fund represents only a small amount of the overall assets managed by GEAM.
Conclusion
No single factor was determinative to the Board’s decision. Based on their discussion and such other matters as were deemed relevant, the Board members concluded that the proposed level of cost reimbursement to GEAM and projected total expense ratios for the Funds are reasonable in relation to the services provided. In view of these facts, the Board members concluded that the renewal of each investment advisory agreement was in the best interests of the Funds and their shareholders.
107

On September 15, 2014, the Elfun Government Money Market Fund (the “Money Market Fund”), Elfun Tax-Exempt Income Fund (the “Tax-Exempt Fund”) and Elfun Income Fund (the “Income Fund”) (each, a “Fund” and collectively, the “Funds”) held a special meeting of unitholders. Unitholders of record on July 7, 2014 were entitled to vote on the proposals. For each proposal, unitholders voted on a fund-by-fund basis. At the meeting, all proposals were approved by the respective unitholders of each Fund, and the following votes were recorded:
Proposal 1:
Approval of an investment sub-advisory agreement between GE Asset Management Incorporated (“GEAM”) and SSGA Funds Management, Inc. (“SSGA FM”), pursuant to which SSGA FM will serve as investment sub-adviser to the Money Market Fund.
| | | | | | | | | | | | |
| Money Market Fund | | No. of Shares | | | % of
Outstanding
Shares | | | % of
Shares
Present | |
Affirmative | | | 96,647,569.490 | | | | 62.982% | | | | 94.517% | |
Against | | | 2,750,068.330 | | | | 1.792% | | | | 2.689% | |
Abstain | | | 2,856,829.560 | | | | 1.862% | | | | 2.794% | |
Total | | | 102,254,467.380 | | | | 66.636% | | | | 100.000% | |
Proposal 2:
Approval of the implementation of a “manager of managers” structure whereby GEAM would be given increased flexibility to enter into and materially amend sub-advisory agreements with unaffiliated sub-advisers without unitholder approval.
| | | | | | | | | | | | |
| Money Market Fund | | No. of Shares | | | % of
Outstanding
Shares | | | % of
Shares
Present | |
Affirmative | | | 95,955,889.420 | | | | 62.531% | | | | 93.840% | |
Against | | | 3,961,515.550 | | | | 2.582% | | | | 3.874% | |
Abstain | | | 2,337,062.410 | | | | 1.523% | | | | 2.286% | |
Total | | | 102,254,467.380 | | | | 66.636% | | | | 100.000% | |
| | | | | | | | | | | | |
| Tax-Exempt Fund | | No. of Shares | | | % of
Outstanding
Shares | | | % of
Shares
Present | |
Affirmative | | | 75,334,726.478 | | | | 54.836% | | | | 90.601% | |
Against | | | 6,480,062.301 | | | | 4.717% | | | | 7.794% | |
Abstain | | | 1,334,962.752 | | | | 0.972% | | | | 1.605% | |
Total | | | 83,149,751.531 | | | | 60.525% | | | | 100.000% | |
108
| | | | | | | | | | | | |
| Income Fund | | No. of Shares | | | % of
Outstanding
Shares | | | % of
Shares
Present | |
Affirmative | | | 15,563,650.529 | | | | 55.979% | | | | 90.206% | |
Against | | | 1,240,660.971 | | | | 4.463% | | | | 7.191% | |
Abstain | | | 449,065.736 | | | | 1.615% | | | | 2.603% | |
Total | | | 17,253,377.236 | | | | 62.057% | | | | 100.000% | |
Proposal 3:
Approval of the amendment, elimination or reclassification of certain of the fundamental investment policies of the Funds, as follows:
| A. | Amendment of each Fund’s fundamental investment policies on diversification to allow each Fund to invest a majority of its assets in cash and cash items, government securities, securities of other investment companies and other securities subject to certain limitations. |
| | | | | | | | | | | | |
| Money Market Fund | | No. of Shares | | | % of
Outstanding
Shares | | | % of Shares
Present | |
Affirmative | | | 96,231,090.914 | | | | 62.710% | | | | 94.109% | |
Against | | | 3,031,781.476 | | | | 1.976% | | | | 2.965% | |
Abstain | | | 2,991,594.990 | | | | 1.950% | | | | 2.926% | |
Total | | | 102,254,467.380 | | | | 66.636% | | | | 100.000% | |
| | | |
| Tax-Exempt Fund | | No. of Shares | | | % of
Outstanding
Shares | | | % of
Shares
Present | |
Affirmative | | | 75,098,761.530 | | | | 54.665% | | | | 90.317% | |
Against | | | 6,637,466.508 | | | | 4.831% | | | | 7.983% | |
Abstain | | | 1,413,523.493 | | | | 1.029% | | | | 1.700% | |
Total | | | 83,149,751.531 | | | | 60.525% | | | | 100.000% | |
| | | |
| Income Fund | | No. of Shares | | | % of
Outstanding
Shares | | | % of
Shares
Present | |
Affirmative | | | 15,422,675.574 | | | | 55.472% | | | | 89.389% | |
Against | | | 1,402,953.413 | | | | 5.046% | | | | 8.132% | |
Abstain | | | 427,748.249 | | | | 1.539% | | | | 2.479% | |
Total | | | 17,253,377.236 | | | | 62.057% | | | | 100.000% | |
109
| B. | Amendment of each Fund’s fundamental investment policy on concentration of investments to prevent each Fund from making investments that would result in the concentration of that Fund’s assets in securities of issuers in any one industry. |
| | | | | | | | | | | | |
| Money Market Fund | | No. of Shares | | | % of
Outstanding
Shares | | | % of
Shares
Present | |
Affirmative | | | 96,249,425.180 | | | | 62.722% | | | | 94.127% | |
Against | | | 2,852,210.510 | | | | 1.859% | | | | 2.789% | |
Abstain | | | 3,152,831.690 | | | | 2.055% | | | | 3.084% | |
Total | | | 102,254,467.380 | | | | 66.636% | | | | 100.000% | |
| | | |
| Tax-Exempt Fund | | No. of Shares | | | % of
Outstanding
Shares | | | % of
Shares
Present | |
Affirmative | | | 76,518,327.603 | | | | 55.698% | | | | 92.025% | |
Against | | | 5,549,822.497 | | | | 4.040% | | | | 6.674% | |
Abstain | | | 1,081,601.431 | | | | 0.787% | | | | 1.301% | |
Total | | | 83,149,751.531 | | | | 60.525% | | | | 100.000% | |
| | | |
| Income Fund | | No. of Shares | | | % of
Outstanding
Shares | | | % of
Shares
Present | |
Affirmative | | | 15,663,672.911 | | | | 56.339% | | | | 90.786% | |
Against | | | 1,241,892.744 | | | | 4.467% | | | | 7.198% | |
Abstain | | | 347,811.581 | | | | 1.251% | | | | 2.016% | |
Total | | | 17,253,377.236 | | | | 62.057% | | | | 100.000% | |
| C. | Amendment of each Fund’s fundamental investment policies on borrowing to allow each Fund to borrow money from specific entities, through the use of specific investment instruments and subject to certain limitations on the amount of any borrowing. |
| | | | | | | | | | | | |
| Money Market Fund | | No. of Shares | | | % of
Outstanding
Shares | | | % of
Shares
Present | |
Affirmative | | | 93,456,545.864 | | | | 60.902% | | | | 91.396% | |
Against | | | 5,749,181.486 | | | | 3.747% | | | | 5.622% | |
Abstain | | | 3,048,740.030 | | | | 1.987% | | | | 2.982% | |
Total | | | 102,254,467.380 | | | | 66.636% | | | | 100.000% | |
110
| | | | | | | | | | | | |
| Tax-Exempt Fund | | No. of Shares | | | % of
Outstanding
Shares | | | % of
Shares
Present | |
Affirmative | | | 72,901,877.380 | | | | 53.066% | | | | 87.675% | |
Against | | | 8,799,680.346 | | | | 6.405% | | | | 10.538% | |
Abstain | | | 1,448,193.805 | | | | 1.054% | | | | 1.742% | |
Total | | | 83,149,751.531 | | | | 60.525% | | | | 100.000% | |
| | | |
| Income Fund | | No. of Shares | | | % of
Outstanding
Shares | | | % of
Shares
Present | |
Affirmative | | | 15,094,332.062 | | | | 54.291% | | | | 87.486% | |
Against | | | 1,738,573.851 | | | | 6.254% | | | | 10.077% | |
Abstain | | | 420,471.323 | | | | 1.512% | | | | 2.437% | |
Total | | | 17,253,377.236 | | | | 62.057% | | | | 100.000% | |
| D. | Amendment of each Fund’s fundamental investment policy on making loans to allow each Fund to lend its assets or money to other persons under certain limited circumstances. |
| | | | | | | | | | | | |
| Money Market Fund | | No. of Shares | | | % of
Outstanding
Shares | | | % of
Shares
Present | |
Affirmative | | | 93,447,743.224 | | | | 60.897% | | | | 91.387% | |
Against | | | 5,765,474.736 | | | | 3.757% | | | | 5.638% | |
Abstain | | | 3,041,249.420 | | | | 1.982% | | | | 2.975% | |
Total | | | 102,254,467.380 | | | | 66.636% | | | | 100.000% | |
| | | |
| Tax-Exempt Fund | | No. of Shares | | | % of
Outstanding
Shares | | | % of
Shares
Present | |
Affirmative | | | 71,693,549.376 | | | | 52.186% | | | | 86.222% | |
Against | | | 9,938,163.806 | | | | 7.234% | | | | 11.952% | |
Abstain | | | 1,518,038.349 | | | | 1.105% | | | | 1.826% | |
Total | | | 83,149,751.531 | | | | 60.525% | | | | 100.000% | |
111
| | | | | | | | | | | | |
| Income Fund | | No. of Shares | | | % of
Outstanding
Shares | | | % of
Shares
Present | |
Affirmative | | | 15,016,331.458 | | | | 54.010% | | | | 87.034% | |
Against | | | 1,815,987.191 | | | | 6.533% | | | | 10.526% | |
Abstain | | | 421,058.587 | | | | 1.514% | | | | 2.440% | |
Total | | | 17,253,377.236 | | | | 62.057% | | | | 100.000% | |
| E. | Amendment of each Fund’s fundamental investment policy on real estate investments to allow each Fund to purchase or sell real estate (or direct or indirect interests in real estate), subject to each Fund’s other investment policies and applicable law. |
| | | | | | | | | | | | |
| Money Market Fund | | No. of Shares | | | % of
Outstanding
Shares | | | % of
Shares
Present | |
Affirmative | | | 94,002,694.634 | | | | 61.258% | | | | 91.930% | |
Against | | | 5,308,414.416 | | | | 3.460% | | | | 5.191% | |
Abstain | | | 2,943,358.330 | | | | 1.918% | | | | 2.879% | |
Total | | | 102,254,467.380 | | | | 66.636% | | | | 100.000% | |
| | | |
| Tax-Exempt Fund | | No. of Shares | | | % of
Outstanding
Shares | | | % of
Shares
Present | |
Affirmative | | | 72,064,655.040 | | | | 52.456% | | | | 86.668% | |
Against | | | 9,797,508.130 | | | | 7.132% | | | | 11.783% | |
Abstain | | | 1,287,588.361 | | | | 0.937% | | | | 1.549% | |
Total | | | 83,149,751.531 | | | | 60.525% | | | | 100.000% | |
| | | |
| Income Fund | | No. of Shares | | | % of
Outstanding
Shares | | | % of
Shares
Present | |
Affirmative | | | 15,041,393.369 | | | | 54.101% | | | | 87.179% | |
Against | | | 1,829,404.619 | | | | 6.580% | | | | 10.604% | |
Abstain | | | 382,579.248 | | | | 1.376% | | | | 2.217% | |
Total | | | 17,253,377.236 | | | | 62.057% | | | | 100.000% | |
112
| F. | Amendment of each Fund’s fundamental investment policy on investments in commodities to allow each Fund to invest in commodities to the extent allowed by each Fund’s other investment policies and applicable law. |
| | | | | | | | | | | | |
| Money Market Fund | | No. of Shares | | | % of
Outstanding
Shares | | | % of
Shares
Present | |
Affirmative | | | 93,414,002.164 | | | | 60.875% | | | | 91.354% | |
Against | | | 5,819,555.706 | | | | 3.792% | | | | 5.691% | |
Abstain | | | 3,020,909.510 | | | | 1.969% | | | | 2.955% | |
Total | | | 102,254,467.380 | | | | 66.636% | | | | 100.000% | |
| | | |
| Tax-Exempt Fund | | No. of Shares | | | % of
Outstanding
Shares | | | % of
Shares
Present | |
Affirmative | | | 72,440,053.542 | | | | 52.729% | | | | 87.120% | |
Against | | | 9,341,374.441 | | | | 6.800% | | | | 11.234% | |
Abstain | | | 1,368,323.548 | | | | 0.996% | | | | 1.646% | |
Total | | | 83,149,751.531 | | | | 60.525% | | | | 100.000% | |
| | | |
| Income Fund | | No. of Shares | | | % of
Outstanding
Shares | | | % of
Shares
Present | |
Affirmative | | | 14,874,414.101 | | | | 53.500% | | | | 86.212% | |
Against | | | 1,874,929.926 | | | | 6.744% | | | | 10.867% | |
Abstain | | | 504,033.209 | | | | 1.813% | | | | 2.921% | |
Total | | | 17,253,377.236 | | | | 62.057% | | | | 100.000% | |
| G. | Amendment and reclassification as non-fundamental each Fund’s fundamental investment policy on illiquid and restricted securities. |
| | | | | | | | | | | | |
| Money Market Fund | | No. of Shares | | | % of
Outstanding
Shares | | | % of
Shares
Present | |
Affirmative | | | 94,210,693.674 | | | | 61.394% | | | | 92.134% | |
Against | | | 4,738,937.296 | | | | 3.088% | | | | 4.634% | |
Abstain | | | 3,304,836.410 | | | | 2.154% | | | | 3.232% | |
Total | | | 102,254,467.380 | | | | 66.636% | | | | 100.000% | |
113
| | | | | | | | | | | | |
| Tax-Exempt Fund | | No. of Shares | | | % of
Outstanding
Shares | | | % of
Shares
Present | |
Affirmative | | | 72,365,057.639 | | | | 52.675% | | | | 87.030% | |
Against | | | 9,144,000.880 | | | | 6.656% | | | | 10.997% | |
Abstain | | | 1,640,693.012 | | | | 1.194% | | | | 1.973% | |
Total | | | 83,149,751.531 | | | | 60.525% | | | | 100.000% | |
| | | |
| Income Fund | | No. of Shares | | | % of
Outstanding
Shares | | | % of
Shares
Present | |
Affirmative | | | 15,101,527.078 | | | | 54.317% | | | | 87.528% | |
Against | | | 1,608,542.648 | | | | 5.786% | | | | 9.323% | |
Abstain | | | 543,307.510 | | | | 1.954% | | | | 3.149% | |
Total | | | 17,253,377.236 | | | | 62.057% | | | | 100.000% | |
| H. | Amendment and reclassification as fundamental each Fund’s non-fundamental investment policy on senior securities. |
| | | | | | | | | | | | |
| Money Market Fund | | No. of Shares | | | % of
Outstanding
Shares | | | % of
Shares
Present | |
Affirmative | | | 95,285,029.024 | | | | 62.094% | | | | 93.184% | |
Against | | | 3,821,746.776 | | | | 2.491% | | | | 3.737% | |
Abstain | | | 3,147,691.580 | | | | 2.051% | | | | 3.097% | |
Total | | | 102,254,467.380 | | | | 66.636% | | | | 100.000% | |
| | | |
| Tax-Exempt Fund | | No. of Shares | | | % of
Outstanding
Shares | | | % of
Shares
Present | |
Affirmative | | | 74,193,491.155 | | | | 54.006% | | | | 89.229% | |
Against | | | 6,628,923.203 | | | | 4.825% | | | | 7.972% | |
Abstain | | | 2,327,337.173 | | | | 1.694% | | | | 2.799% | |
Total | | | 83,149,751.531 | | | | 60.525% | | | | 100.000% | |
114
| | | | | | | | | | | | |
| Income Fund | | No. of Shares | | | % of
Outstanding
Shares | | | % of
Shares
Present | |
Affirmative | | | 15,405,750.882 | | | | 55.411% | | | | 89.291% | |
Against | | | 1,344,057.302 | | | | 4.835% | | | | 7.790% | |
Abstain | | | 503,569.052 | | | | 1.811% | | | | 2.919% | |
Total | | | 17,253,377.236 | | | | 62.057% | | | | 100.000% | |
| I. | Elimination of each Fund’s fundamental investment policy on short selling. |
| | | | | | | | | | | | |
| Money Market Fund | | No. of Shares | | | % of
Outstanding
Shares | | | % of
Shares
Present | |
Affirmative | | | 93,689,278.924 | | | | 61.054% | | | | 91.623% | |
Against | | | 5,377,253.636 | | | | 3.505% | | | | 5.259% | |
Abstain | | | 3,187,934.820 | | | | 2.077% | | | | 3.118% | |
Total | | | 102,254,467.380 | | | | 66.636% | | | | 100.000% | |
| | | |
| Tax-Exempt Fund | | No. of Shares | | | % of
Outstanding
Shares | | | % of
Shares
Present | |
Affirmative | | | 71,569,328.753 | | | | 52.096% | | | | 86.073% | |
Against | | | 9,618,108.945 | | | | 7.001% | | | | 11.567% | |
Abstain | | | 1,962,313.833 | | | | 1.428% | | | | 2.360% | |
Total | | | 83,149,751.531 | | | | 60.525% | | | | 100.000% | |
| | | |
| Income Fund | | No. of Shares | | | % of
Outstanding
Shares | | | % of
Shares
Present | |
Affirmative | | | 15,084,997.747 | | | | 54.257% | | | | 87.432% | |
Against | | | 1,737,476.481 | | | | 6.250% | | | | 10.071% | |
Abstain | | | 430,903.008 | | | | 1.550% | | | | 2.497% | |
Total | | | 17,253,377.236 | | | | 62.057% | | | | 100.000% | |
115
| J. | Elimination of each Fund’s fundamental investment policy on investments in other investment companies. |
| | | | | | | | | | | | |
| Money Market Fund | | No. of Shares | | | % of
Outstanding
Shares | | | % of
Shares
Present | |
Affirmative | | | 94,420,894.214 | | | | 61.531% | | | | 92.339% | |
Against | | | 4,747,492.186 | | | | 3.094% | | | | 4.643% | |
Abstain | | | 3,086,080.980 | | | | 2.011% | | | | 3.018% | |
Total | | | 102,254,467.380 | | | | 66.636% | | | | 100.000% | |
| | | |
| Tax-Exempt Fund | | No. of Shares | | | % of
Outstanding
Shares | | | % of
Shares
Present | |
Affirmative | | | 72,508,730.849 | | | | 52.779% | | | | 87.203% | |
Against | | | 8,800,934.800 | | | | 6.407% | | | | 10.584% | |
Abstain | | | 1,840,085.882 | | | | 1.339% | | | | 2.213% | |
Total | | | 83,149,751.531 | | | | 60.525% | | | | 100.000% | |
| | | |
| Income Fund | | No. of Shares | | | % of
Outstanding
Shares | | | % of
Shares
Present | |
Affirmative | | | 15,131,910.386 | | | | 54.426% | | �� | | 87.704% | |
Against | | | 1,669,164.171 | | | | 6.004% | | | | 9.674% | |
Abstain | | | 452,302.679 | | | | 1.627% | | | | 2.622% | |
Total | | | 17,253,377.236 | | | | 62.057% | | | | 100.000% | |
| K. | Elimination of the Tax-Exempt Fund’s and Income Fund’s fundamental investment policy on mortgaging, pledging or hypothecating of investments. |
| | | | | | | | | | | | |
| Tax-Exempt Fund | | No. of Shares | | | % of
Outstanding
Shares | | | % of
Shares
Present | |
Affirmative | | | 70,996,872.884 | | | | 51.679% | | | | 85.384% | |
Against | | | 10,074,463.731 | | | | 7.333% | | | | 12.116% | |
Abstain | | | 2,078,414.916 | | | | 1.513% | | | | 2.500% | |
Total | | | 83,149,751.531 | | | | 60.525% | | | | 100.000% | |
116
| | | | | | | | | | | | |
| Income Fund | | No. of Shares | | | % of
Outstanding
Shares | | | % of
Shares
Present | |
Affirmative | | | 15,038,613.547 | | | | 54.091% | | | | 87.163% | |
Against | | | 1,772,553.108 | | | | 6.375% | | | | 10.274% | |
Abstain | | | 442,210.581 | | | | 1.591% | | | | 2.563% | |
Total | | | 17,253,377.236 | | | | 62.057% | | | | 100.000% | |
| L. | Elimination of the Tax-Exempt Fund’s fundamental investment policy on oil, gas and mineral exploration. |
| | | | | | | | | | | | |
| Tax-Exempt Fund | | No. of Shares | | | % of
Outstanding
Shares | | | % of
Shares
Present | |
Affirmative | | | 72,464,530.865 | | | | 52.747% | | | | 87.149% | |
Against | | | 8,787,689.375 | | | | 6.397% | | | | 10.569% | |
Abstain | | | 1,897,531.291 | | | | 1.381% | | | | 2.282% | |
Total | | | 83,149,751.531 | | | | 60.525% | | | | 100.000% | |
| M. | Elimination of each Fund’s fundamental investment policy on options (and straddles and spreads). |
| | | | | | | | | | | | |
| Money Market Fund | | No. of Shares | | | % of
Outstanding
Shares | | | % of
Shares
Present | |
Affirmative | | | 93,566,830.984 | | | | 60.974% | | | | 91.504% | |
Against | | | 5,438,004.706 | | | | 3.544% | | | | 5.318% | |
Abstain | | | 3,249,631.690 | | | | 2.118% | | | | 3.178% | |
Total | | | 102,254,467.380 | | | | 66.636% | | | | 100.000% | |
| | | |
| Tax-Exempt Fund | | No. of Shares | | | % of
Outstanding
Shares | | | % of
Shares
Present | |
Affirmative | | | 70,869,347.931 | | | | 51.586% | | | | 85.231% | |
Against | | | 10,118,076.390 | | | | 7.365% | | | | 12.168% | |
Abstain | | | 2,162,327.210 | | | | 1.574% | | | | 2.601% | |
Total | | | 83,149,751.531 | | | | 60.525% | | | | 100.000% | |
117
| | | | | | | | | | | | |
| Income Fund | | No. of Shares | | | % of
Outstanding
Shares | | | % of
Shares
Present | |
Affirmative | | | 14,984,889.786 | | | | 53.897% | | | | 86.852% | |
Against | | | 1,794,379.856 | | | | 6.455% | | | | 10.400% | |
Abstain | | | 474,107.594 | | | | 1.705% | | | | 2.748% | |
Total | | | 17,253,377.236 | | | | 62.057% | | | | 100.000% | |
| N. | Reclassification as non-fundamental the Tax-Exempt Fund’s and Income Fund’s fundamental investment policy on transactions with affiliates. |
| | | | | | | | | | | | |
| Tax-Exempt Fund | | No. of Shares | | | % of
Outstanding
Shares | | | % of
Shares
Present | |
Affirmative | | | 72,708,445.044 | | | | 52.924% | | | | 87.443% | |
Against | | | 8,511,531.079 | | | | 6.196% | | | | 10.236% | |
Abstain | | | 1,929,775.408 | | | | 1.405% | | | | 2.321% | |
Total | | | 83,149,751.531 | | | | 60.525% | | | | 100.000% | |
| | | |
| Income Fund | | No. of Shares | | | % of
Outstanding
Shares | | | % of
Shares
Present | |
Affirmative | | | 15,264,179.909 | | | | 54.902% | | | | 88.471% | |
Against | | | 1,483,667.111 | | | | 5.337% | | | | 8.599% | |
Abstain | | | 505,530.216 | | | | 1.818% | | | | 2.930% | |
Total | | | 17,253,377.236 | | | | 62.057% | | | | 100.000% | |
| O. | Reclassification as non-fundamental the Tax-Exempt Fund’s and Income Fund’s fundamental investment policy on affiliate ownership. |
| | | | | | | | | | | | |
| Tax-Exempt Fund | | No. of Shares | | | % of
Outstanding
Shares | | | % of
Shares
Present | |
Affirmative | | | 72,418,988.320 | | | | 52.714% | | | | 87.095% | |
Against | | | 8,492,043.730 | | | | 6.181% | | | | 10.213% | |
Abstain | | | 2,238,719.481 | | | | 1.630% | | | | 2.692% | |
Total | | | 83,149,751.531 | | | | 60.525% | | | | 100.000% | |
118
| | | | | | | | | | | | |
| Income Fund | | No. of Shares | | | % of
Outstanding
Shares | | | % of
Shares
Present | |
Affirmative | | | 15,202,708.684 | | | | 54.681% | | | | 88.114% | |
Against | | | 1,548,498.100 | | | | 5.570% | | | | 8.975% | |
Abstain | | | 502,170.452 | | | | 1.806% | | | | 2.911% | |
Total | | | 17,253,377.236 | | | | 62.057% | | | | 100.000% | |
| P. | Reclassification as non-fundamental the Tax-Exempt Fund’s fundamental investment policy on control/management. |
| | | | | | | | | | | | |
| Tax-Exempt Fund | | No. of Shares | | | % of
Outstanding
Shares | | | % of
Shares
Present | |
Affirmative | | | 72,828,911.776 | | | | 53.013% | | | | 87.588% | |
Against | | | 8,406,769.547 | | | | 6.119% | | | | 10.110% | |
Abstain | | | 1,914,070.208 | | | | 1.393% | | | | 2.302% | |
Total | | | 83,149,751.531 | | | | 60.525% | | | | 100.000% | |
119

Information about Trustees and Executive Officers:
The business and affairs of the Funds are managed under the direction of the Funds’ Board of Trustees. Information pertaining to the Trustees and officers of the Funds is set forth below.
Interested Trustees and Executive Officers
Dmitri Stockton
Address c/o GEAM 1600 Summer St. Stamford, CT 06905
Age 50
Position(s) Held with Fund Chairman of the Board
Term of Office and Length of Time Served Until successor is elected and qualified – 3 years
Principal Occupation(s) During Past 5 Years President and Chief Executive Officer of GEAM since May 2011; President and Chief Executive Officer of GE Capital’s Global Banking unit from January 2009 to April 2011; President and CEO of GE Money’s Central and Eastern European Banking Group from January 2005 to December 2008.
Number of Portfolios in Fund Complex Overseen by Trustee 8
Other Directorships Held by Trustee Director of GEAM since May 2011; Member of the Board of GE Foundation since November 2009; Member of the Executive Advisory Council at North Carolina A&T State University School of Business and Economics since March 2011; Trustee of GE Retirement Savings Plan Funds (formerly GE Savings & Security Funds) and General Electric Pension Trust since May 2011 and Member of the National Board of Directors of A Better Chance since January 2012.
George A. Bicher
Address c/o GEAM 1600 Summer St. Stamford, CT 06905
Age 56
Position(s) Held with Fund Trustee
Term of Office and Length of Time Served Until successor is elected and qualified – 3 years
Principal Occupation(s) During Past 5 Years Chief Investment Officer – Emerging Markets Equities since February 2014; formerly, Chief Risk Officer of GEAM from March 2011 to February 2014; Senior Vice President and
Portfolio Manager of GEAM from 2009 to 2011; Director of U.S. Equity Research and Portfolio Manager of GEAM from 2006 to 2009; U.S. equity research analyst of GEAM from 2002 to 2006.
Number of Portfolios in Fund Complex Overseen by Trustee 8
Other Directorships Held by Trustee Trustee of GE Retirement Savings Plan Funds (formerly GE Savings & Security Funds) and General Electric Pension Trust and Director of GEAM since March 2011.
JoonWon Choe
Address c/o GEAM 1600 Summer St. Stamford, CT 06905
Age 45
Position(s) Held with Fund Vice President & Assistant Secretary
Term of Office and Length of Time Served Until successor is elected and qualified – 4 years
Principal Occupation(s) During Past 5 Years Senior Vice President and Deputy General Counsel of GEAM since March 2011; Vice President and Secretary of GE Institutional Funds and GE Investments Funds, Inc. since September 2010; Vice President and Assistant Secretary of GE Retirement Savings Plan Funds (formerly GE Savings & Security Funds) since September 2010; Senior Vice President and Associate General Counsel of GEAM from June 2010 to March 2011; Vice President and Associate General Counsel of GEAM from November 2005 to June 2010; and Vice President and Secretary of GE Funds from September 2010 to February 2011.
Number of Portfolios in Fund Complex Overseen by Officer N/A
Other Directorships Held by Officer N/A
Paul M. Colonna
Address c/o GEAM, 1600 Summer St. Stamford, CT 06905
Age 46
Position Held with Fund Trustee
Term of Office and Length of Time Served Until successor is elected and qualified – 7 years
Principal Occupation(s) During Past 5 Years President and Chief Investment Officer – Public Investments of GEAM
120
since March 2012; President and Chief Investment Officer – Fixed Income from March 2007 to March 2012; Executive Vice President of GEAM from February 2007 to March 2007; Senior Vice President – Total Return Management of GEAM from March 2005 to March 2007.
Number of Portfolios in Fund Complex Overseen by Trustee 8
Other Directorships Held by Trustee Trustee of GE Retirement Savings Plan Funds (formerly GE Savings & Security Funds) and General Electric Pension Trust since February 2007; Director of GEAM since March 2007; and Director of GE Asset Management Limited (GEAML) since December 2007.
Gregory B. Hartch
Address c/o GEAM 1600 Summer St. Stamford, CT 06905
Age 45
Position(s) Held with Fund Trustee
Term of Office and Length of Time Served Until successor is elected and qualified – 3 years
Principal Occupation(s) During Past 5 Years Chief Risk Officer of GEAM since February 2014; Executive Vice President and Strategy and Business Development Leader of GEAM from December 2011 to February 2014; Senior Vice President – Tactical Asset Allocation from 2010 to December 2011; Managing Director – International Real Estate from 2007 to 2010; and Director of Fixed Income Research from 2004 to 2007.
Number of Portfolios in Fund Complex Overseen by Trustee 8
Other Directorships Held by Trustee Trustee of GE Retirement Savings Plan Funds (formerly GE Savings & Security Funds) and General Electric Pension Trust since January 2012.
Arthur A. Jensen
Address c/o GEAM 1600 Summer St. Stamford, CT 06905
Age 48
Position(s) Held with Fund Treasurer
Term of Office and Length of Time Served Until successor is elected and qualified – 3 years
Principal Occupation(s) During Past 5 Years Treasurer of GE Institutional Funds, GE Investments Funds, Inc. and GE Retirement Savings Plan Funds (formerly GE Savings & Security Funds) since June 2011; Mutual Funds Controller of GEAM since April 2011; Senior Vice President at Citigroup from 2008 to 2010 and Vice President at JPMorgan from 2005 to 2008.
Number of Portfolios in Fund Complex Overseen by Officer N/A
Other Directorships Held by Officer N/A
Jeanne M. La Porta
Address c/o GEAM 1600 Summer St. Stamford, CT 06905
Age 49
Position(s) Held with Fund Vice President
Term of Office and Length of Time Served Until successor is elected and qualified – 11 years
Principal Occupation(s) During Past 5 Years Senior Vice President and Commercial Operations Leader at GEAM since March 2014; President of GE Institutional Funds and GE Investments Funds, Inc. since April 2014; President and Trustee of GEAM’s UCITs Funds since March 2014; Senior Vice President and Commercial Administrative Officer at GEAM from April 2010 to March 2014; Vice President of GE Investments Funds, Inc. and GE Institutional Funds since July 2003; Vice President of GE Retirement Savings Plan Funds (formerly GE Savings & Security Funds) and Elfun Funds since October 2003; Secretary of GE Funds from July 2007 to September 2010 and Vice President from July 2007 to February 2011; Senior Vice President and Deputy General Counsel of GEAM from October 2007 to April 2010; Vice President and Assistant Secretary of GE Funds from September 2003 to July 2007 and Assistant Secretary of Elfun Funds and GE Retirement Savings Plan Funds from July 2003 to June 2010; and Vice President and Associate General Counsel – Marketing and Client Services (formerly Asset Management Services) of GEAM from May 1997 to October 2007.
Number of Portfolios in Fund Complex Overseen by Officer 24
Other Directorships Held by Officer Director of GE Investments Funds, Inc. since 2014; Trustee of GE Institutional Funds since 2014; Trustee of Elfun Funds, GE Retirement Savings Funds and General Electric Pension Trust since 2014; Director of GE Investment Distributors, Inc. since June 2011.
121
Ralph R. Layman
Address c/o GEAM 1600 Summer St. Stamford, CT 06905
Age 58
Position(s) Held with Fund Trustee
Term of Office and Length of Time Served Until successor is elected and qualified – 23 years
Principal Occupation(s) During Past 5 Years Executive Vice President and Chief Investment Officer – Emeritus of GEAM since March 2012; President and Chief Investment Officer – Public Equities from July 2009 to March 2012; President – International Equities from March 2007 to July 2009; Executive Vice President – International Investments from 1992 to March 2007 and Senior Vice President International Investments from 1991 to 1992.
Number of Portfolios in Fund Complex Overseen by Trustee 8
Other Directorships Held by Trustee Trustee of GE Retirement Savings Plan Funds (formerly GE Savings & Security Funds) and General Electric Pension Trust since 1993; Director of GE Asset Management Limited (GEAML) since September 1995 and Director of GEAM since July 2009.
Matthew J. Simpson
Address c/o GEAM 1600 Summer St. Stamford, CT 06905
Age 53
Position(s) Held with Fund Trustee
Term of Office and Length of Time Served 7 years
Principal Occupation(s) During Past 5 Years Executive Vice President, General Counsel and Secretary of GEAM since July 2007; Secretary of Elfun Funds and GE Retirement Savings Plan Funds (formerly GE Savings & Security Funds) since July 2007; Senior Vice President and General Counsel – Marketing and Client Services (formerly Asset Management Services) of GEAM and Senior Vice President and General Counsel of GE Asset Management Services from February 1997 to July 2007; Vice President and Associate General Counsel of GEAM from October 1992 to February 1997; Secretary of GE Institutional Funds and GE Investments Funds, Inc. from 1997 to July 2007 and Vice President from September 2003 to July 2007; Assistant Secretary of Elfun Funds and GE Retirement Savings Plan Funds from 1998 to July 2007 and Vice President from October 2003 to July 2007; and Secretary of GE Funds from 1993 to July 2007 and Vice President from September 2003 to July 2007.
Number of Portfolios in Fund Complex Overseen by Trustee 24
Other Directorships Held by Trustee Trustee of GE Retirement Savings Plan Funds (formerly GE Savings & Security Funds) and General Electric Pension Trust since July 2007; Trustee of GE Institutional Funds since July 2007; Director of GE Investments Funds, Inc. and GEAM since July 2007; and Trustee of GE Funds from July 2007 to February 2011.
Donald W. Torey
Address c/o GEAM 1600 Summer St. Stamford, CT 06905
Age 57
Position(s) Held with Fund Trustee
Term of Office and Length of Time Served Until successor is elected and qualified – 21 years
Principal Occupation(s) During Past 5 years President and Chief Investment Officer – Alternative Investments of GEAM since March 2007; Executive Vice President of GEAM from 1997 to March 2007; Executive Vice President – Alternative Investments from 1997 to March 2007.
Number of Portfolios in Fund Complex Overseen by Trustee 8
Other Directorships Held by Trustee Trustee of GE Retirement Savings Plan Funds (formerly GE Savings & Security Funds) and General Electric Pension Trust since 1993 and Director of GEAM since 1997.
David Wiederecht
Address c/o GEAM, 1600 Summer St. Stamford, CT 06905
Age 58
Position Held with Fund Trustee
Term of Office and Length of Time Served Until successor is elected and qualified – 6 years
Principal Occupation(s) During Past 5 Years President and Chief Investment Officer – Investment Solutions since February 2008; Portfolio Manager – GE Institutional Funds since September 2010; Managing Director – Alternative Investments from 2004 to 2008; Vice President – Alternative Investments/Private Equity/Hedge Fund from 1998 to 2004.
122
Number of Portfolios in Fund Complex Overseen by Trustee 8
Other Directorships Held by Trustee Trustee of GE Retirement Savings Plan Funds (formerly GE Savings & Security Funds) and General Electric Pension Trust since 2008; Director of GEAM since August 2008 and Director of Edmunds Holding Company since 1999.
Matthew Zakrzewski
Address c/o GEAM 1600 Summer St. Stamford, CT 06905
Age 54
Position(s) Held with Fund Trustee
Term of Office and Length of Time Served Until successor is elected and qualified – 2 years
Principal Occupation(s) During Past 5 Years Executive Vice President and Chief Financial Officer of GEAM since August 2013; formerly, Chief Financial Officer for GE Ventures from 2012 to 2013 and Chief Financial Officer for GE Risk, Insurance and Corporate Financing from 2006 to 2012.
Number of Portfolios in Fund Complex Overseen by Trustee 8
Other Directorships Held by Trustee Trustee of GE Retirement Savings Plan Funds (formerly GE Savings & Security Funds) and General Electric Pension Trust since September 2013 and Director of GEAM since September 2013.
The Statement of Additional Information for the Funds includes additional information about the Trustees and Officers and is available, without charge, upon request by calling 1-800-242-0134.
123

Portfolio Manager Biographies
The following sets forth biographical information for those individuals who are primarily responsible for managing the specified Fund’s investments. The portfolio managers may change from time to time.
David B. Carlson is Chief Investment Officer – U.S. Equities at GEAM. He manages the overall U.S. equity investments for GEAM. Mr. Carlson has served as the portfolio manager for Elfun Trusts since 1988. Mr. Carlson joined GEAM in 1982 as a securities analyst for investment operations. He became a Vice President for Mutual Fund Portfolios in 1987, a Senior Vice President in 1989 and an Executive Vice President in 2003.
Michael J. Caufield is a Senior Vice President of GEAM. He is the portfolio manager of the Elfun Tax-Exempt Income Fund and has served in that capacity since October 2000. Mr. Caufield joined GEAM in 1987 as Vice President, Manager of Fixed Income Research & Analysis and was promoted to Senior Vice President in 1994.
William M. Healey is a Senior Vice President and Chief Investment Officer – Core Fixed Income Investments of GEAM. He has served on the portfolio management team for the Elfun Income Fund since joining GEAM in 1996. Mr. Healey became Vice President in June 2001, Senior Vice President in January 2007 and Chief Investment Officer – Core Fixed Income Investments in April 2012. Prior to joining GEAM, Mr. Healey spent over 11 years in the fixed income group at MetLife.
Mark H. Johnson is a Senior Vice President and Chief Investment Officer – Insurance and Long Duration of GEAM. He has been a member of the portfolio management team for the Elfun Income Fund since 2007. Mr. Johnson joined GE in 1998 and GEAM as a Vice President and portfolio manager in 2002. He became Senior Vice President in September 2007 and Chief Investment Officer – Insurance and Long Duration in April 2012. Prior to joining GEAM, Mr. Johnson held positions at various insurance companies and public accounting firms.
Ralph R. Layman is an Executive Vice President and Chief Investment Officer Emeritus and a Director of GEAM. Mr. Layman has led the team of portfolio managers for the
Elfun International Equity Fund since 1991. Mr. Layman joined GEAM in 1991 as a Senior Vice President for International Investments, became an Executive Vice President in 1992, served as President – International Equities from March 2007 to July 2009, President and Chief Investment Officer – Public Equities from July 2009 to March 2012, and has served as Chief Investment Officer Emeritus since March 2012.
Jeffrey Palma is a Senior Vice President and Chief Market Strategist of GE Asset Management, and a portfolio manager of the Elfun Diversified Fund. He became a member of the portfolio management team for the Elfun Diversified Fund in May 2013. Prior to joining GE Asset Management in 2012, Mr. Palma worked for UBS Investment Bank where he held a variety of global research and macro strategy roles supporting UBS’ global equities and fixed income businesses including Managing Director, Head of Global Equity Strategy rom 2007 to 2012, Executive Director, Global Asset Allocation Strategist from 2001 to 2007 and Director, U.S. Economist from 1999 to 2001.
Michael J. Solecki is a Senior Vice President and Chief Investment Officer – International Equities at GEAM. He has served as a portfolio manager of the Elfun International Equity Fund since August 1999. He joined GEAM in 1990 as an international equity analyst. He became a Vice President for international equity portfolios in 1996, Senior Vice President in 2000, Co-Chief Investment Officer – International Equities in March 2009 and Chief Investment Officer – International Equities in March 2012.
David Wiederecht is the President and Chief Investment Officer – Investment Solutions and a Director at GEAM. He has served as a portfolio manager to the Elfun Diversified Fund since January 2011. Mr. Wiederecht joined GEAM in 1988 and has held various positions at GEAM including Vice President – Alternative Investments/Private Equity/Hedge Fund from 1998 to 2004, Managing Director – Alternative Investments from 2004 to 2008, and President and Chief Investment Officer – Investment Solutions since 2008.
Todd N. Bean, CFA is a Vice President and Senior Portfolio Manager of State Street Global Advisors in the firm’s US Cash Management Group. Mr. Bean has served as portfolio manager of the Elfun Government Money Market Fund since September 2014. Mr. Bean began his career at State
124
| Portfolio | Manager Biographies (continued) |
Street in 1999, joining the firm as an analyst in the firm’s custody and settlements area. Following a stint on the money markets operations staff, he joined the Cash Management Group in 2004.
Jeff A. St. Peters is a Managing Director of State Street Global Advisors and the head of U.S. Cash Management within the Global Cash Management division. Mr. St. Peters has served as portfolio manager of the Elfun Government Money Market Fund since September 2014. Mr. St. Peters manages a team of portfolio managers that focus on traditional money market and securities lending cash collateral funds. He is also a Senior Portfolio Manager
responsible for several securities lending, enhanced cash, offshore, and SSgA’s registered money market portfolios for both retail and institutional clients. Mr. St. Peters has been managing short duration cash and securities lending portfolios at SSgA for over 12 years. He is a member of SSgA’s Senior Leadership Team.
Prior to joining SSgA, Jeff was employed nearly 9 years with Fidelity Investments, the latter years within the Fidelity Management and Research Company, where he worked as a trader within the Money Market area of the Fixed Income division. In addition, he held several positions within Fidelity’s Investment Technology area, where he assisted in designing and implementing an internal proprietary trading system.
125
Portfolio Managers
Elfun International Equity Fund
Ralph R. Layman
Michael J. Solecki
Elfun Trusts
David B. Carlson
Elfun Diversified Fund
David Wiederecht
Jeffrey Palma
Elfun Tax-Exempt Income Fund
Michael Caufield
Elfun Income Fund
William M. Healey
Mark H. Johnson
Elfun Government Money Market Fund
SSgA Funds Management, Inc.
Investment Adviser
GE Asset Management Incorporated
Independent Registered Public Accounting Firm
KPMG LLP
Custodian
State Street Bank & Trust Company
Unitholder Servicing Agent
Address all inquiries to:
Elfun Mutual Funds
c/o U.S. Bancorp Fund Services, LLC
P.O. Box 701
Milwaukee, WI 53201-0701
126

New Online Service
Your Elfun Mutual Fund accounts can now be accessed on the Internet at www.elfun.org.
Here are some of the benefits of our online service:
| | |
• View account balance and transaction history • Make exchanges • Redeem shares • Purchase shares | | • View and order tax forms • View quarterly statements • Change address • Re-order money market checks |
Many more features will be added to the web site in the future for your convenience.
New Extended Telephone Service
Our Representatives at the Customer Service Center are available Monday to Friday from 8:30 AM to 8:00 PM Eastern Standard Time. Call toll-free, 1-800-242-0134, for assistance.
Automated Voice Response System
You can also access your account anytime during the day, 7 days a week by dialing 1-800-242-0134. Simply follow the menu to obtain information or make certain transactions.
Contact Us By Mail
If you’d like to write to us, address your inquiries regarding your account(s) to:
Elfun Mutual Funds
c/o U.S. Bancorp Fund Services, LLC
P.O. Box 701
Milwaukee, WI 53201-0701
We are continuing to upgrade a variety of services in order to give you the tools you need to manage your financial objectives. In the meantime, we welcome all your comments and suggestions.
(Unaudited)

MORNINGSTAR RATINGS™
Through December 31, 2014
| | | | | | | | |
FUND
(CATEGORY) | | NUMBER OF
FUNDS IN CATEGORY | | STAR
RATING | | | | |
| Elfun International Equity — (Foreign Large Blend) | | |
Overall | | 803 | | 
| | | | |
3 year | | 652 | | 
| | | | |
5 year | | 585 | | 
| | | | |
10 year | | 316 | |
| | | | |
| Elfun Trusts — (Large Growth) | | |
Overall | | 1768 | |
| | | | |
3 year | | 1530 | | 
| | | | |
5 year | | 1331 | |
| | | | |
10 year | | 917 | |
| | | | |
| Elfun Diversified — (Moderate Allocation) | | |
Overall | | 910 | |
| | | | |
3 year | | 742 | |
| | | | |
5 year | | 654 | |
| | | | |
10 year | | 440 | |
| | | | |
| Elfun Tax-Exempt Income — (Muni National Long) | | |
Overall | | 222 | |
| | | | |
3 year | | 205 | |
| | | | |
5 year | | 185 | |
| | | | |
10 year | | 151 | |
| | | | |
| Elfun Income — (Intermediate-Term Bond) | | |
Overall | | 1078 | |
| | | | |
3 year | | 917 | |
| | | | |
5 year | | 811 | |
| | | | |
10 year | | 590 | |
| | | | |
Morningstar is an independent fund rating company that seeks to provide a non-biased rating system used in making investment decisions. A fund is rated in its broad asset class on a scale of one to five stars through the evaluation of the historical balance of risk and return after 3 years of performance.
Morningstar calculates a Morningstar Rating based on a Morningstar Risk-Adjusted Return measure that accounts for variation in a fund’s monthly performance (including the effects of sales charges, loads and redemption fees), placing more emphasis on downward variations and rewarding consistent performance. The top ten percent of the funds in each category receive five stars, the next 22.5% receive four stars, the next 35% receive three stars, the next 22.5% receive 2 stars and the bottom 10% receive 1 star. The ratings are subject to change every month. The overall Morningstar Rating for a fund is derived from a weighted average of the performance figures associated with its three-, five- and ten year (if applicable) Morningstar Rating metrics.
Investment return and principal value of an investment will fluctuate and you may have a gain or loss when you sell your shares. Returns assume changes in share price and reinvestment of dividends and capital gains.
Past performance is no guarantee of future results.
This does not constitute a part of the Funds’ Shareholder Report
PRSRT STD
U.S. POSTAGE
PAID
Permit No. 1793
Lancaster, PA
Elfun Funds
1600 Summer Street
Stamford, CT 06905
Distributor
GE Investment Distributors Inc.
Member FINRA and SIPC
1600 Summer Street
P.O. Box 7900
Stamford, CT 06904-7900
www.gefunds.com/elfun
The Funds file their complete schedules of portfolio holdings with the Securities and Exchange Commission for the first, second and third quarters of each fiscal year on Form N-Q. The Funds’ Forms N-Q, as well as a description of the policies and procedures that the Funds use to determine how to vote proxies (if any) relating to portfolio securities is available without charge (i) upon request, by calling 1-800-242-0134; (ii) on the Funds’ website at http://www.geam.com; and (iii) on the Commission’s website at http://www.sec.gov. The Funds’ Forms N-Q may be reviewed and copied at the Commission’s Public Reference Room in Washington, DC — information on the operation of the Public Reference Room may be obtained by calling 1-800-SEC-0330.
Information (if any) regarding how the Funds voted proxies relating to portfolio securities during the most recently disclosed 12-months period ended June 30 is available without charge (i) through the Funds’ website at http://www.geam.com; and (ii) on the Commission’s website at http://www.sec.gov.
| | |
 | | ELF 1 (2/15) |
The Registrant has adopted a code of ethics, as defined in Item 2 of Form N-CSR, applicable to its principal executive officer, principal financial officer, principal accounting officer or controller, or persons performing similar functions. A copy of this code of ethics is filed as an exhibit to this Form N-CSR and is included in the following link:
https://www.geam.com/ExternalWar/common/docs/pdf/Spirit_Letter.pdf
There have been no amendments to, nor any waivers granted from, a provision that relates to any element of the code of ethics definition set forth in paragraph (b) of Item 2 of Form N-CSR during the period covered by this report.
| Item 3. | Audit Committee Financial Expert. |
The Board of Trustees of the Registrant has determined that Matthew Zakrzewski and Donald W. Torey are designated as the audit committee financial experts for the Registrant; and further that it is the finding of the Board of Trustees that Messrs. Zakrzewski and Torey qualify as audit committee financial experts and are deemed to be “interested persons” of the Registrant as defined in Section 2(a)(19) of the Act (15 U.S.C. 80a-2(a)(19)).
| Item 4. | Principal Accountant Fees and Services. |
(a) AUDIT FEES. The aggregate fees billed for each of the last two fiscal years (the “Reporting Periods”) for professional services rendered by the Registrant’s principal accountant (the “Auditor”) for the audit of the Registrant’s annual financial statements, or services that are normally provided by the Auditor in connection with the statutory and regulatory filings or engagements for the Reporting Periods were $16,700 in 2013 and $17,100 in 2014.
(b) AUDIT RELATED FEES. There were no fees billed by the Auditor for assurance and related services that were related to the performance of the audit of the Registrant during the Reporting Periods.
(c) TAX FEES. There were no fees billed for professional services rendered by the Auditor for tax compliance, tax advice or tax planning for the Registrant during the Reporting Periods.
(d) ALL OTHER FEES. There were no fees billed for products and services provided by the Auditor, other than the services reported in paragraphs (a) through (c) of this Item for the Registrant during the Reporting Periods.
(e)(1) AUDIT COMMITTEE PRE-APPROVAL POLICIES AND PROCEDURES.
The Audit Committee of the Elfun Funds (the “Funds”) Board of Trustees is responsible, among other things, for the appointment, compensation and oversight of the work of the Funds’ Auditor. As part of this responsibility and to ensure that the Auditor’s independence is not impaired, the Audit Committee (1) pre-approves the audit and non-audit services provided to the Funds by the Auditor, and (2) all non-audit services provided to the Funds’ investment adviser and covered affiliates (as defined in the Audit Committee Charter) that provide ongoing services to the Funds if the services directly impact the Funds’ operations or financial reporting, in accordance with the Audit Committee Charter. The following excerpt from the Audit Committee Charter sets forth the pre-approval policies and procedures:
Pre-Approval of Audit Related Services and Permissible Non-Audit Services. The Audit Committee shall pre-approve both audit (including audit, review, and attest) services and permissible non-audit services provided to the Fund and, if the nature of the engagement relates directly to the operations and financial reporting of the Fund, permissible non-audit services provided to any Covered Affiliate.
The Audit Committee may determine to delegate the authority to grant pre-approvals to one or more Audit Committee members, each acting on behalf of the Audit Committee. In this event, the member of the Audit Committee so delegated shall report each delegated pre-approval to the Audit Committee at its next regularly scheduled meeting. The Audit Committee may also adopt and follow, in lieu of explicit pre-approval described above, written policies and procedures detailed as to the particular service, designed to safeguard the continued independence of the Auditor, consistent with the requirements of the Investment Company Act of 1940, as amended (the “1940 Act”), and SEC regulations there under.
Notwithstanding the foregoing, the pre-approval requirement concerning permissible non-audit services provided to the Fund or any Covered Affiliate is waived if: (1) the aggregate amount of all such non-audit services provided constitutes no more than five percent (5%) of the total amount of revenues paid to the Auditor by the Fund and the Covered Affiliates during the fiscal year in which the services are provided that would have to be pre-approved by the Audit Committee, (2) the non-audit services were not recognized as non-audit services at the time of the engagement, and (3) such non-audit services are promptly brought to the attention of the Audit Committee and approved by the Audit Committee or one or more designated members of the Audit Committee prior to the completion of the audit.
(2) PERCENTAGE OF SERVICES DESCRIBED IN PARAGRAPHS (b) THROUGH (d) APPROVED BY AUDIT COMMITTEE. No fees were charged during the Reporting Period for audit related, tax or other services as indicated in sections (b) through (d) of this Item.
(f) Not applicable.
(g) NON-AUDIT FEES. The aggregate non-audit fees billed by the Auditor for services rendered to the Registrant, and rendered to the Registrant’s investment adviser and any entity controlling, controlled by, or under common control with the Registrant’s adviser (“Service Affiliates”), for the Reporting Periods were $0 in 2013 and $0 in 2014.
(h) AUDITOR INDEPENDENCE. There were no non-audit services rendered to Service Affiliates during the Reporting Period that were not pre-approved.
| Item 5. | Audit Committee of Listed Registrants. |
Applicable only to Closed-End Management Investment Companies.
| Item 6. | Schedule of Investments. |
(a) Schedule of Investments is included as part of Item 1 of this Form N-CSR.
(b) Not applicable.
| Item 7. | Disclosure of Proxy Voting Policies and Procedures for Closed-End Management Investment Companies. |
Applicable only to Closed-End Management Investment Companies.
| Item 8. | Portfolio Managers of Closed-End Management Investment Companies. |
Applicable only to Closed-End Management Investment Companies.
| Item 9. | Purchases of Equity Securities by Closed-End Management Investment Company and Affiliated Purchasers. |
Applicable only to Closed-End Management Investment Companies.
| Item 10. | Submission of Matters to a Vote of Security Holders. |
During the reporting period, there have been no material changes to the procedures by which the shareholders may recommend nominees to the Registrant’s Board of Trustees.
| Item 11. | Controls and Procedures. |
(a) The Registrant’s principal executive officer and principal financial officer have concluded that the Registrant’s disclosure controls and procedures (as defined in Rule 30a-3(c) under the 1940 Act) are effective as of a date within 90 days of the filing date of the report included in Item 1 of this Form N-CSR, based on the evaluation of these controls and procedures required by Rule 30a-3(b) under the 1940 Act and Rules 13a-15(b) or 15d-15(b) under the Securities Exchange Act of 1934.
(b) There were no changes in the Registrant’s internal control over financial reporting (as defined in Rule 30a-3(d) under the 1940 Act) that occurred during the Registrant’s second fiscal quarter of the period covered by this Form N-CSR that have materially affected, or are reasonably likely to materially affect, the Registrant’s internal control over financial reporting.
(a)(1) The Code of Ethics that applies to the Registrant’s principal executive officer and principal financial officer is attached hereto.
(a)(2) The certifications required by Rule 30a-2(a) of the 1940 Act and Section 302 of the Sarbanes-Oxley Act of 2002 are attached hereto.
(a)(3) Not applicable.
(b) The certifications by the Registrant’s principal executive officer and principal financial officer, as required by Rule 30a-2(b) of the 1940 Act and Section 906 of the Sarbanes-Oxley Act of 2002, are attached hereto.
SIGNATURES
Pursuant to the requirements of the Securities Exchange Act of 1934 and the Investment Company Act of 1940, the below Registrants have duly caused each report to be signed on their behalf by the undersigned, thereunto duly authorized.
Elfun International Equity Fund
Elfun Trusts
Elfun Diversified Fund
Elfun Tax-Exempt Income Fund
Elfun Income Fund
Elfun Government Money Market Fund
| | |
| By: | | /s/ Dmitri L. Stockton |
| | Dmitri L. Stockton |
| | Trustee, President and Chief Executive Officer |
| | GE Asset Management Incorporated |
| |
| Date: | | February 23, 2015 |
Pursuant to the requirements of the Securities Exchange Act of 1934 and the Investment Company Act of 1940, each report has been signed below by the following persons on behalf of the Registrants and in the capacities and on the dates indicated.
| | |
| By: | | /s/ Dmitri L. Stockton |
| | Dmitri L. Stockton |
| | Trustee, President and Chief Executive Officer |
| | GE Asset Management Incorporated |
| |
| Date: | | February 23, 2015 |
| |
| By: | | /s/ Arthur A. Jensen |
| | Arthur A. Jensen |
| | Treasurer, Elfun Funds |
| |
| Date: | | February 23, 2015 |