UNITED STATES
SECURITIES AND EXCHANGE COMMISSION
Washington, D.C. 20549
FORM N-CSR
CERTIFIED SHAREHOLDER REPORT OF REGISTERED
MANAGEMENT INVESTMENT COMPANIES
Investment Company Act file number: 811-00483
Elfun Trusts
(Exact name of registrant as specified in charter)
1600 Summer Street
Stamford, Connecticut 06905
(Address of principal executive offices)(Zip code)
GE Asset Management, Inc.
1600 Summer Street
Stamford, Connecticut 06905
(Name and Address of Agent for Service)
Registrant’s telephone number, including area code: 800-242-0134
Date of fiscal year end: 12/31
Date of reporting period: 12/31/15
| Item 1. | Reports to Stockholders |
Elfun Funds
Annual Report
December 31, 2015


This report has been prepared for shareholders and may be distributed to others only if preceded or accompanied by a current summary prospectus or prospectus.

Information on the following performance pages relates to the Elfun Funds.
Total returns take into account changes in share price and assume reinvestment of all dividends and capital gains distributions, if any. Total returns shown are net of Fund expenses.
The performance data quoted represents past performance; past performance does not guarantee future results. Investment return and principal value will fluctuate so your shares, when redeemed, may be worth more or less than their original cost. Current performance may be higher or lower than the performance data quoted. Periods less than one year are not annualized. Please call toll-free (800) 242-0134 or visit the Funds’ website at http://www.geam.com for the most recent month-end performance data.
A portion of the Elfun Tax-Exempt Income Fund’s income may be subject to state, federal and/or alternative minimum tax. Capital gains, if any, are subject to capital gains tax.
An investment in a Fund is not a deposit of any bank and is not insured or guaranteed by the Federal Deposit Insurance Corporation (FDIC) or any other government agency. An investment in a Fund is subject to risk, including possible loss of principal invested.
The Standard & Poor’s (“S&P”) 500® Composite Price Index of stocks (S&P 500 Index), Morgan Stanley Capital International Europe, Australasia, Far East Index (MSCI EAFE® Index), MSCI® ACWI ex-U.S. Index, Barclays U.S. Aggregate Bond Index, the Barclays U.S. Municipal Bond Index, and the 90 Day U.S. T-Bill are unmanaged indices and do not reflect the actual cost of investing in the instruments that comprise each index. The results shown for the foregoing indices assume the reinvestment of net dividends or interest and do not reflect the fees, expenses or taxes.
S&P 500 Index is an unmanaged, market capitalization-weighted index of stocks of 500 large U.S. companies, which is widely used as a measure of large-cap U.S. stock market performance.
MSCI® EAFE® Index is a market capitalization-weighted index of equity securities of companies domiciled in various countries. The index is designed to represent the performance of developed stock markets outside the U.S. and Canada and excludes certain market segments unavailable to U.S. based investors.
MSCI ACWI Ex-U.S. Index is a market-capitalization weighted index designed to provide a broad measure of stock performance throughout the world, with the exception of U.S. based companies. The MSCI ACWI Ex-U.S. Index includes both developed and emerging markets.
Barclays U.S. Aggregate Bond Index is a market value-weighted index of taxable investment-grade debt issues, including government, corporate, asset-backed and mortgage-backed securities, with maturities of one year or more. This index is designed to represent the performance of the U.S. investment-grade first-rate bond market.
Barclays U.S. Municipal Bond Index is an unmanaged index comprised of investment-grade, fixed rate securities with maturities of at least eight years and less than twelve years.
The 90 Day U.S. T-Bill is an unmanaged measure/index of the performance of the most recently auctioned 90 Day U.S. Treasury bills (i.e. having a total maturity of 90 days) currently available in the marketplace.
The peer universe of underlying funds used for the peer group average annual total return calculation is based on the blend of Morningstar peer categories, as shown. Morningstar is an independent mutual fund rating service. A Fund’s performance may be compared to or ranked within a universe of mutual funds with investment objectives and policies similar but not necessarily identical to the Fund.
©2016 Morningstar, Inc. All Rights Reserved. The Morningstar information contained herein: (1) is proprietary to Morningstar and/or its content providers; (2) may not be copied or distributed; and (3) is not warranted to be accurate, complete or timely. Neither Morningstar nor its content providers are responsible for any damage or losses relating from any use of this information. Past performance is no guarantee of future results.
The views, expressed in this document reflect our judgment as of the publication date and are subject to change at any time without notice.
GE Investment Distributors, Inc., member of FINRA, is the principal underwriter and distributor of the Elfun Funds and a wholly owned subsidiary of GE Asset Management Incorporated, the investment adviser of the Funds.
1
(Unaudited)


Ralph R. Layman
Executive Vice President and
Chief Investment
Officer Emeritus

Michael J. Solecki
Senior Vice President and Chief Investment Officer International Equities
The Elfun International Equity Fund is co-managed by Ralph R. Layman and Michael J. Solecki. Messrs. Layman and Solecki both manage the Fund as a collaborative team. Both portfolio managers have the authority to increase or decrease existing positions in the Fund. See portfolio managers’ biographical information beginning on page 98.
| Q. | How did the Elfun International Equity Fund perform compared to its benchmark and Morningstar peer group for the twelve-month period ended December 31, 2015? |
| A. | For the twelve-month period ended December 31, 2015, the Elfun International Equity Fund returned -0.18%. The MSCI EAFE Index, the Fund’s benchmark, returned -0.81% and the Fund’s Morningstar peer group of 821 Foreign Large Blend Funds returned an average of -1.64% over the same period. The Fund performed better than 63% of its Morningstar peer group in 2015. |
| Q. | What market factors affected the Fund’s performance? |
| A. | 2015 began on an optimistic note, with international equity markets surging strongly ahead, as central banks around the world eased monetary conditions in the face of very low inflation. Fears of slowing global growth, volatility in China, and various geo-political tensions soon began to weigh on the equity markets, which reached a high for the year in mid-May. From peak to trough in mid-September, the MSCI EAFE Index fell over 17%, narrowly avoiding the 20% pull-back that typically defines a bear market (a threshold it would pass in early 2016). The market recovered a bit from its September low but nevertheless finished the year down, the second year in a row of negative returns for the MSCI EAFE Index and the third year in a row that the international developed markets have lagged U.S. large caps. |
| | Underneath the overall market performance number was a significant amount of |
| | variability by region and industry. Japan, where the Fund was overweight relative to the MSCI EAFE Index, continued to be a bright spot, returning just under 10% and outperforming the broader index for the third year in a row. By contrast, the U.K. and the Pacific region excluding Japan were weak being more exposed to energy and emerging markets. By industry, the energy and materials sectors were predictably the weakest in 2015, impacted by plummeting commodity prices, while the relatively defensive consumer staples and healthcare enjoyed modest positive returns. In the currency markets, the U.S. dollar strengthened in 2015 against all major currencies, reducing realized returns for U.S. based investors in international equities. |
| Q. | What were the primary drivers of Fund performance? |
| A. | Among sectors, industrials was the biggest contributor to Fund returns, perhaps surprisingly given the negative sentiment around economic growth that existed much of the year. Within industrials, the Fund was overweight relative to the MSCI EAFE Index in areas such as aerospace, airlines, and building products, all of which had solid positive returns. Another positive area was the financial sector, where the Fund did well in insurance and banks both in Japan and the Eurozone. Geographically, the Fund benefitted from its large weight in Japan, where it held just under 30% of its assets on average during 2015, a significantly higher weight than the MSCI EAFE Index. Within Japan, the Fund’s holdings underperformed the MSCI EAFE Index, but still did better than the rest of the world and so helped overall performance. |
| | Hurting performance this year were the Fund’s holdings in energy and mining. The Fund held only a small percent of its assets in these areas and a lower weight than the MSCI EAFE Index, but any exposure was painful, as the fall in commodity prices hurt |
2
(Unaudited)

| | the sector. Related to this, the emerging markets region was under pressure in 2015 and another source of negative returns for the Fund. The Fund had both direct exposure, holding a small weight in companies based in emerging markets, and indirect exposure through developed market companies that sell into emerging market countries. |
| Q. | Were there any significant changes to the Fund during the period? |
| A. | Geographically, the Fund’s weights in Japan, Canada, and the Eurozone were reduced in 2015, while Continental Europe outside of the Eurozone and the U.K. were increased. These changes did not impact the Fund’s positioning relative to the MSCI EAFE Index, where the Fund’s biggest overweights remain Japan and the emerging markets region and biggest underweights remain the U.K. and the Pacific Basin. |
| | Similarly the Fund’s sector positioning relative to the Index changed little in 2015. The biggest changes were in industrials, which was reduced from a modest to a slight overweight, consumer discretionary, from a slight overweight to modest underweight, and consumer staples, where the Fund’s large underweight was reduced. Within industrials, machinery and professional services were reduced in favor of building products. In consumer discretionary, auto exposure was reduced in favor of leisure. In healthcare, while the overall weight didn’t change significantly, pharma was reduced in favor of healthcare equipment and services. |
3
(Unaudited)
Understanding Your Fund’s Expenses
As a shareholder of the Fund you incur ongoing costs. Ongoing costs include portfolio management fees, professional fees, administrative fees and other Fund expenses. The following example is intended to help you understand your ongoing costs (in dollars) of investing in the Fund and to compare these costs with the ongoing costs of investing in other mutual funds.
To illustrate these ongoing costs, we have provided an example and calculated the expenses paid by investors in units of the Fund during the period. The information in the following table is based on an investment of $1,000, which is invested at the beginning of the period and held for the entire six-month period ended December 31, 2015.
Actual Expenses
The first section of the table provides information about actual account values and actual expenses. You may use the information in this section, together with the amount you invested, to estimate the expenses that you paid over the period. To do so, simply divide your account value by $1,000 (for example, an $8,600 account value divided by $1,000 = 8.6), then multiply the result by the number given under the heading “Expenses paid during
the period” to estimate the expenses you paid on your account during the period.
Hypothetical Example for Comparison Purposes
The second section of the table provides information about hypothetical account values and hypothetical expenses based on the Fund’s actual expense ratio and an assumed rate of return of 5% per year before expenses, which is not the Fund’s actual return. The hypothetical account values and expenses may not be used to estimate the actual ending account balance or expenses you paid for the period. You may use this information to compare the ongoing costs of investing in the Fund and other funds. To do so, compare this 5% hypothetical example with the 5% hypothetical examples that appear in the shareholders reports of other funds.
Please note that the expenses shown in the table are meant to highlight and help you compare ongoing costs only and do not reflect transaction costs, such as sales charges or redemption fees, if any. Therefore, the second section of the table is useful in comparing ongoing costs only, and will not help you determine the relative total costs of owning different funds.
July 1, 2015 – December 31, 2015
| | | | | | | | | | | | |
| | | Account value at
the beginning of
the period ($) | | | Account value
at the end of
the period ($) | | | Expenses
paid during
the period ($)* | |
Actual Fund Return | | | 1,000.00 | | | | 918.90 | | | | 1.79 | |
Hypothetical 5% Return
(2.5% for the period) | | | 1,000.00 | | | | 1,023.34 | | | | 1.89 | |
| * | | Expenses are equal to the Fund’s annualized net expense ratio of 0.37%** (for the period July 1, 2015 – December 31, 2015), multiplied by the average account value over the period, multiplied by 184/365 (to reflect the one-half year period). |
| ** | | May differ from expense ratio disclosed in the financial highlights, which is calculated based on the entire fiscal year’s data. |
4
(Unaudited)
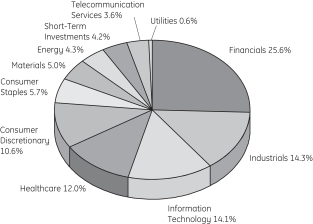
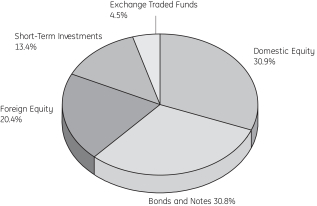
A mutual fund designed for investors who seek long-term growth of capital and future income by investing principally in foreign securities consistent with prudent investment management and the preservation of capital. The Fund seeks to achieve its investment objectives by investing at least 80% of its net assets under normal circumstances in equity securities, such as common and preferred stocks and invests primarily (meaning at least 65%) in companies in both developed and emerging market countries outside the United States.
(as a % of Fair Value of Investments of $233,852 (in thousands) on December 31, 2015) (a)(b)
| | | | |
Roche Holding AG | | | 3.11% | |
AIA Group Ltd. | | | 2.43% | |
Nidec Corp. | | | 2.43% | |
Continental AG | | | 2.34% | |
Sanofi | | | 2.12% | |
Baidu Inc. ADR | | | 2.09% | |
Vodafone Group PLC | | | 2.05% | |
Anheuser-Busch InBev S.A. | | | 1.99% | |
BNP Paribas S.A. | | | 1.88% | |
Toyota Motor Corp. | | | 1.85% | |
Portfolio composition as a % of Fair Value of Investments of $233,852 (in thousands) on December 31, 2015 (a)(b)
|
| Morningstar Performance Comparison |
Based on average annual returns for periods ended December 31, 2015
| | | | | | | | | | | | |
| | | One
Year | | | Five
Year | | | Ten
Year | |
Number of funds in peer group | | | 821 | | | | 699 | | | | 529 | |
Peer group average annual total return | | | -1.64 | % | | | 2.54 | % | | | 2.56 | % |
Morningstar Category in peer group: U.S. Foreign Large Blend | |
|
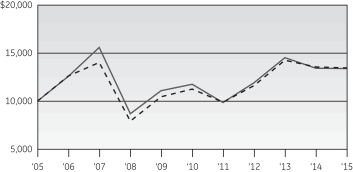
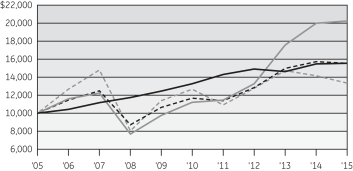
| Change in Value of a $10,000 Investment |

|
| Average Annual Total Return |
For the periods ended December 31, 2015
| | | | | | | | | | | | | | | | | | | | |
| (Inception date: 1/1/88) | | | | | | |
| | | One
Year | | Five
Year | | Ten
Year | | Ending Value of a
$10,000
Investment |
Elfun International
Equity Fund | | | | -0.18% | | | | | 2.67% | | | | | 2.99% | | | | | $13,424 | |
MSCI EAFE Index | | | | -0.81% | | | | | 3.61% | | | | | 3.03% | | | | | $13,479 | |
| (a) | Fair Value basis is inclusive of short-term investment in State Street Institutional U.S. Government Money Market Fund Premier Class. |
| (b) | The securities information regarding holdings, allocations and other characteristics is presented to illustrate examples of securities that the Fund has bought and the diversity of areas in which the Fund may invest as of a particular date. It may not be representative of the Fund’s current or future investments and should not be construed as a recommendation to purchase or sell a particular security. |
See Notes to Performance beginning on page 1 for further information, including an explanation of Morningstar peer categories.
Past performance does not predict future performance. The performance shown in the graphs and tables does not reflect the deduction of taxes that a shareholder would pay on Fund distributions or the redemption of Fund shares.
5
| | |
Elfun International Equity Fund | | December 31, 2015 |

| | | | |
| Elfun International Equity Fund |
| | | | | | | | | | |
| | | Number
of Shares | | | Fair
Value | | | |
Common Stock — 95.5%† | | | |
| |
Australia — 1.3% | | | |
| | | |
Insurance Australia Group Ltd. | | | 746,565 | | | $ | 3,019,988 | | | |
| | | |
Belgium — 2.0% | | | | | | | | | | |
| | | |
Anheuser-Busch InBev S.A. | | | 37,415 | | | | 4,649,664 | | | |
| | | |
Canada — 1.3% | | | | | | | | | | |
| | | |
Brookfield Asset Management Inc., Class A | | | 33,715 | | | | 1,059,434 | | | |
Cenovus Energy Inc. | | | 166,236 | | | | 2,094,255 | | | |
| | | | 3,153,689 | | | |
| | | |
China — 2.1% | | | | | | | | | | |
| | | |
Baidu Inc. ADR | | | 25,824 | | | | 4,881,769 | | | (a) |
| | | |
France — 13.4% | | | | | | | | | | |
| | | |
Airbus Group SE | | | 18,642 | | | | 1,255,550 | | | |
AXA S.A. | | | 142,904 | | | | 3,916,620 | | | |
BNP Paribas S.A. | | | 77,637 | | | | 4,404,925 | | | |
Credit Agricole S.A. | | | 182,632 | | | | 2,158,518 | | | |
Safran S.A. | | | 26,294 | | | | 1,810,048 | | | |
Sanofi | | | 58,134 | | | | 4,963,666 | | | |
Schneider Electric SE | | | 42,171 | | | | 2,407,793 | | | |
Technip S.A. | | | 62,762 | | | | 3,118,137 | | | |
Total S.A. | | | 53,505 | | | | 2,398,424 | | | |
Vivendi S.A. | | | 103,570 | | | | 2,234,411 | | | |
Zodiac Aerospace | | | 109,834 | | | | 2,621,896 | | | |
| | | | 31,289,988 | | | |
| | | |
Germany — 8.9% | | | | | | | | | | |
| | | |
Bayer AG | | | 29,829 | | | | 3,752,296 | | | |
Continental AG | | | 22,430 | | | | 5,471,320 | | | |
Fresenius SE & Company KGaA | | | 50,928 | | | | 3,649,664 | | | |
HeidelbergCement AG | | | 33,256 | | | | 2,731,848 | | | |
Linde AG | | | 17,354 | | | | 2,524,236 | | | |
SAP SE | | | 35,063 | | | | 2,794,966 | | | |
| | | | 20,924,330 | | | |
| | | |
Hong Kong — 2.4% | | | | | | | | | | |
| | | |
AIA Group Ltd. | | | 946,962 | | | | 5,693,881 | | | |
| | | |
India — 2.0% | | | | | | | | | | |
| | | |
ICICI Bank Ltd. | | | 561,369 | | | | 2,214,716 | | | |
Larsen & Toubro Ltd. | | | 61,477 | | | | 1,186,677 | | | |
Power Grid Corporation of India Ltd. | | | 621,316 | | | | 1,331,266 | | | |
| | | | 4,732,659 | | | |
| | | |
Ireland — 0.8% | | | | | | | | | | |
| | | |
Kerry Group PLC, Class A | | | 22,199 | | | | 1,840,198 | | | |
| | | | | | | | | | |
| | | Number
of Shares | | | Fair
Value | | | |
| | | |
Italy — 1.4% | | | | | | | | | | |
| | | |
Intesa Sanpaolo S.p.A. | | | 962,834 | | | $ | 3,229,821 | | | |
| | | |
Japan — 28.0% | | | | | | | | | | |
| | | |
Astellas Pharma Inc. | | | 134,800 | | | | 1,940,282 | | | |
East Japan Railway Co. | | | 30,200 | | | | 2,874,517 | | | |
FANUC Corp. | | | 18,900 | | | | 3,311,958 | | | |
Fast Retailing Company Ltd. | | | 5,266 | | | | 1,866,597 | | | |
Fuji Heavy Industries Ltd. | | | 46,600 | | | | 1,947,364 | | | |
Hitachi Ltd. | | | 631,000 | | | | 3,627,221 | | | |
Japan Post Holdings Company Ltd. | | | 76,000 | | | | 1,178,270 | | | (a) |
Kao Corp. | | | 50,500 | | | | 2,625,857 | | | |
Keyence Corp. | | | 4,800 | | | | 2,676,620 | | | |
Mitsubishi Estate Company Ltd. | | | 179,459 | | | | 3,764,618 | | | |
Mitsubishi Heavy Industries Ltd. | | | 559,000 | | | | 2,478,197 | | | |
Mitsubishi UFJ Financial Group Inc. | | | 630,700 | | | | 3,969,433 | | | |
Mitsui Fudosan Company Ltd. | | | 167,118 | | | | 4,245,502 | | | |
Murata Manufacturing Company Ltd. | | | 17,597 | | | | 2,570,176 | | | |
Nidec Corp. | | | 77,500 | | | | 5,693,233 | | | |
Rakuten Inc. | | | 217,597 | | | | 2,537,833 | | | (a) |
Secom Company Ltd. | | | 24,600 | | | | 1,685,058 | | | |
Shimano Inc. | | | 8,700 | | | | 1,349,532 | | | |
SoftBank Group Corp. | | | 72,701 | | | | 3,710,141 | | | |
Sumitomo Mitsui Financial Group Inc. | | | 93,000 | | | | 3,560,896 | | | |
Tokio Marine Holdings Inc. | | | 91,500 | | | | 3,584,089 | | | |
Toyota Motor Corp. | | | 69,482 | | | | 4,325,044 | | | |
| | | | 65,522,438 | | | |
| | | |
Mexico — 0.4% | | | | | | | | | | |
| | | |
Grupo Financiero Banorte SAB de C.V., Class O | | | 173,832 | | | | 954,150 | | | |
| | | |
Netherlands — 3.0% | | | | | | | | | | |
| | | |
ASML Holding N.V. | | | 42,813 | | | | 3,839,216 | | | |
ING Groep N.V. | | | 239,758 | | | | 3,242,591 | | | |
| | | | 7,081,807 | | | |
| | | |
Norway — 1.1% | | | | | | | | | | |
| | | |
Statoil ASA | | | 178,582 | | | | 2,495,732 | | | |
| | | |
South Korea — 0.9% | | | | | | | | | | |
| | | |
Samsung Electronics Company Ltd. | | | 1,955 | | | | 2,100,806 | | | |
| | | |
Spain — 0.6% | | | | | | | | | | |
| | | |
Banco Bilbao Vizcaya Argentaria S.A. | | | 199,324 | | | | 1,459,166 | | | |
| | | |
Sweden — 5.0% | | | | | | | | | | |
| | | |
Assa Abloy AB, Class B | | | 153,618 | | | | 3,243,423 | | | |
Hexagon AB, Class B | | | 82,026 | | | | 3,062,864 | | | |
See Notes to Schedules of Investments and Notes to Financial Statements.
6
| | |
Elfun International Equity Fund | | December 31, 2015 |
| | | | | | | | | | |
| | | Number
of Shares | | | Fair
Value | | | |
Svenska Cellulosa AB SCA, Class B | | | 53,416 | | | $ | 1,561,816 | | | |
Telefonaktiebolaget LM Ericsson, Class B | | | 405,238 | | | | 3,955,957 | | | |
| | | | 11,824,060 | | | |
| | | |
Switzerland — 7.5% | | | | | | | | | | |
| | | |
Geberit AG | | | 6,967 | | | | 2,367,805 | | | |
Givaudan S.A. | | | 1,726 | | | | 3,143,355 | | | |
Nestle S.A. | | | 33,800 | | | | 2,517,273 | | | |
Roche Holding AG | | | 26,338 | | | | 7,272,551 | | | |
The Swatch Group AG | | | 6,219 | | | | 2,175,718 | | | |
| | | | 17,476,702 | | | |
| | | |
Taiwan — 1.4% | | | | | | | | | | |
| | | |
Taiwan Semiconductor Manufacturing Company Ltd. | | | 777,900 | | | | 3,386,602 | | | |
| | | |
United Kingdom — 12.0% | | | | | | | | | | |
| | | |
Barclays PLC | | | 1,193,380 | | | | 3,850,282 | | | |
BHP Billiton PLC | | | 113,574 | | | | 1,272,215 | | | |
Capita PLC | | | 58,199 | | | | 1,036,217 | | | |
HSBC Holdings PLC | | | 185,477 | | | | 1,465,834 | | | |
International Consolidated Airlines Group S.A. | | | 166,964 | | | | 1,502,369 | | | |
Johnson Matthey PLC | | | 51,013 | | | | 1,997,747 | | | |
Prudential PLC | | | 129,932 | | | | 2,931,969 | | | |
Shire PLC | | | 38,222 | | | | 2,646,638 | | | |
Smith & Nephew PLC | | | 218,499 | | | | 3,890,312 | | | |
Vodafone Group PLC | | | 1,474,875 | | | | 4,804,139 | | | |
WPP PLC | | | 122,925 | | | | 2,831,831 | | | |
| | | | 28,229,553 | | | |
| | | |
Total Common Stock
(Cost $218,447,011) | | | | | | | 223,947,003 | | | |
| | | | | | | | | | |
Short-Term Investments — 4.2% | | | |
| | | |
State Street Institutional U.S. Government Money Market Fund — Premier Class | | | | | | | | | | |
0.09% | | | | | | $ | 9,904,614 | | | (d,h,p) |
(Cost $9,904,614) | | | | | | | | | | |
| | | |
Total Investments
(Cost $228,351,625) | | | | | | | 233,851,617 | | | |
| | | |
Other Assets and Liabilities, net — 0.3% | | | | | | | 596,201 | | | |
| | | | | | | | | | |
| | | |
NET ASSETS — 100.0% | | | | | | $ | 234,447,818 | | | |
| | | | | | | | | | |
| | | | | | | | | | |
The Fund had the following long futures contracts open at December 31, 2015:
| | | | | | | | | | | | | | | | | |
| Description | | Expiration
date | | Number
of
Contracts | | Current
Notional
Value | | Unrealized
Appreciation |
EURO Stoxx 50 Index Futures | | March 2016 | | | | 65 | | | | $ | 2,317,404 | | | | $ | 12,171 | |
FTSE 100 Index Futures | | March 2016 | | | | 7 | | | | | 639,466 | | | | | 17,173 | |
Topix Index Futures | | March 2016 | | | | 12 | | | | | 1,543,705 | | | | | 25,723 | |
| | | | | | | | | | | | | | | | | |
| | | | | | | | | | | | | | | $ | 55,067 | |
| | | | | | | | | | | | | | | | | |
The Fund was invested in the following sectors at December 31, 2015 (unaudited):
| | | | | |
| Sector | | Percentage
(based on
Fair Value) |
Diversified Banks | | | | 13.05% | |
Pharmaceuticals | | | | 8.80% | |
Life & Health Insurance | | | | 4.19% | |
Electronic Equipment & Instruments | | | | 4.01% | |
Diversified Real Estate Activities | | | | 3.88% | |
Wireless Telecommunication Services | | | | 3.64% | |
Electrical Components & Equipment | | | | 3.46% | |
Integrated Oil & Gas | | | | 2.99% | |
Property & Casualty Insurance | | | | 2.82% | |
Automobile Manufacturers | | | | 2.68% | |
Industrial Machinery | | | | 2.48% | |
Aerospace & Defense | | | | 2.43% | |
Building Products | | | | 2.40% | |
Auto Parts & Equipment | | | | 2.34% | |
Specialty Chemicals | | | | 2.20% | |
Internet Software & Services | | | | 2.09% | |
Brewers | | | | 1.99% | |
Packaged Foods & Meats | | | | 1.86% | |
Communications Equipment | | | | 1.69% | |
Multi-Line Insurance | | | | 1.67% | |
Healthcare Equipment | | | | 1.66% | |
Semiconductor Equipment | | | | 1.64% | |
Healthcare Services | | | | 1.56% | |
Semiconductors | | | | 1.45% | |
Oil & Gas Equipment & Services | | | | 1.33% | |
Railroads | | | | 1.23% | |
Advertising | | | | 1.21% | |
Application Software | | | | 1.19% | |
Construction Materials | | | | 1.17% | |
Personal Products | | | | 1.12% | |
Electronic Components | | | | 1.10% | |
Internet Retail | | | | 1.09% | |
Industrial Gases | | | | 1.08% | |
Movies & Entertainment | | | | 0.96% | |
Apparel, Accessories & Luxury Goods | | | | 0.93% | |
See Notes to Schedules of Investments and Notes to Financial Statements.
7
| | |
Elfun International Equity Fund | | December 31, 2015 |
| | | | | |
| | | | | |
Technology Hardware, Storage & Peripherals | | | | 0.90% | |
Apparel Retail | | | | 0.80% | |
Security & Alarm Services | | | | 0.72% | |
Household Products | | | | 0.67% | |
Airlines | | | | 0.64% | |
Leisure Products | | | | 0.58% | |
Electric Utilities | | | | 0.57% | |
Diversified Metals & Mining | | | | 0.54% | |
Construction & Engineering | | | | 0.51% | |
Human Resource & Employment Services | | | | 0.44% | |
| | | | | |
| | | | 95.76% | |
| | | | | |
| | | | | |
| Short-Term Investments | | |
Short-Term Investments | | | | 4.24% | |
| | | | | |
| | | | 4.24% | |
| | | | | |
| | | | 100.00% | |
| | | | | |
See Notes to Schedules of Investments and Notes to Financial Statements.
8
(Unaudited)


David B. Carlson
Chief Investment Officer – U.S. Equities
The Elfun Trusts is managed by David B. Carlson. See portfolio managers’ biographical information beginning on page 98.
| Q. | How did the Elfun Trusts Fund perform compared to its benchmark and Morningstar peer group for the twelve-month period ended December 31, 2015? |
| A. | For the twelve-month period ended December 31, 2015, the Elfun Trusts Fund returned 1.70%. The S&P 500® Index (S&P 500 Index), the Fund’s benchmark, returned 1.38% and the Fund’s Morningstar peer group of 1,744 U.S. Large Cap Growth Funds returned an average of 3.57% over the same period. |
| Q. | What market factors affected the Fund’s performance? |
| A. | The overall market as measured by the S&P 500 was only up 1.4%, but the dividend yield was approximately 2%, so prices were generally lower for the year. More stocks declined in price than gained for the year. Earnings growth for the S&P 500 was flattish. Energy sector earnings were down sharply and the rest of the market’s earnings grew modestly. Elfun Trusts’ return was slightly better than the S&P 500 Index, but we trailed the median return of our Morningstar peer group of growth funds. In January of this year, Barron’s magazine recognized Elfun Trusts in an article on long term performance noting that Elfun Trusts was one of a small number of funds that have beaten the S&P 500 on a 1, 3, 5, 10, 15, and 25 rolling year basis. |
| Q. | What were the primary drivers of Fund performance? |
| A. | We look at performance in two buckets: sector allocation and stock selection. Last year, we did better in sector allocation than we did in stock selection, meaning our decision to underweight energy and overweight healthcare was more beneficial than our stock selection within sectors. Energy stocks were down about 20% last year and we owned less than the market. |
| | Healthcare stocks were up about 6% and make up 20% of the portfolio vs. 15% for the market. We were helped by our overweight in financial stocks which were up about 3% for the year. |
| | The technology sector is our largest weight representing 27% of the portfolio compared with 21% of the S&P 500. Stocks within the tech sector had a very wide range of performance and that was true of our holdings as well. Our holdings of Amazon (+118%) and Google (+45%) helped while our holdings of Qualcomm (-31%) and Baidu (-17%) hurt performance. Our decision to underweight energy, materials, utilities and industrials helped relative performance as all four sectors declined for the year. |
| Q. | Were there any significant changes to the Fund during the period? |
| A. | Changes in the portfolio were modest and our turnover rate remained below 20%. We continue to focus on the long term in our stock selection. We ended the year with 53 names in the portfolio, up from 51 at the start. We continue to have a growth tilt with overweights in the technology, healthcare and consumer-discretionary sectors. We have a growing weight in internet companies as we believe we are in an era of significant disruption to traditional business models. We are underweighted in cyclicals such as energy, materials and industrials. We have no holdings in the utility sector. It’s been six years since the last recession and bear market, and it’s been the slowest recovery on record in terms of economic growth. We think the slow growth continues and we are concentrated in companies with above-average organic growth, meaning they don’t need a strong economy to meet our growth expectations. We also favor financial strength, market leadership and great management teams. We believe this combination of high-quality characteristics in our companies will lead to long term outperformance in their share prices. |
9
(Unaudited)

Understanding Your Fund’s Expenses
As a shareholder of the Fund you incur ongoing costs. Ongoing costs include portfolio management fees, professional fees, administrative fees and other Fund expenses. The following example is intended to help you understand your ongoing costs (in dollars) of investing in the Fund and to compare these costs with the ongoing costs of investing in other mutual funds.
To illustrate these ongoing costs, we have provided an example and calculated the expenses paid by investors in units of the Fund during the period. The information in the following table is based on an investment of $1,000, which is invested at the beginning of the period and held for the entire six-month period ended December 31, 2015.
Actual Expenses
The first section of the table provides information about actual account values and actual expenses. You may use the information in this section, together with the amount you invested, to estimate the expenses that you paid over the period. To do so, simply divide your account value by $1,000 (for example, an $8,600 account value divided by $1,000 = 8.6), then multiply the result by the number given under the heading “Expenses paid during
the period” to estimate the expenses you paid on your account during the period.
Hypothetical Example for Comparison Purposes
The second section of the table provides information about hypothetical account values and hypothetical expenses based on the Fund’s actual expense ratio and an assumed rate of return of 5% per year before expenses, which is not the Fund’s actual return. The hypothetical account values and expenses may not be used to estimate the actual ending account balance or expenses you paid for the period. You may use this information to compare the ongoing costs of investing in the Fund and other funds. To do so, compare this 5% hypothetical example with the 5% hypothetical examples that appear in the shareholders reports of other funds.
Please note that the expenses shown in the table are meant to highlight and help you compare ongoing costs only and do not reflect transaction costs, such as sales charges or redemption fees, if any. Therefore, the second section of the table is useful in comparing ongoing costs only, and will not help you determine the relative total costs of owning different funds.
July 1, 2015 – December 31, 2015
| | | | | | | | | | | | |
| | | Account value at
the beginning of
the period ($) | | | Account value
at the end of
the period ($) | | | Expenses
paid during
the period ($)* | |
Actual Fund Return | | | 1,000.00 | | | | 994.40 | | | | 0.75 | |
Hypothetical 5% Return
(2.5% for the period) | | | 1,000.00 | | | | 1,024.45 | | | | 0.77 | |
| * | | Expenses are equal to the Fund’s annualized net expense ratio of 0.15%** (for the period July 1, 2015 – December 31, 2015), multiplied by the average account value over the period, multiplied by 184/365 (to reflect the one-half year period). |
| ** | | May differ from expense ratio disclosed in the financial highlights, which is calculated based on the entire fiscal year’s data. |
10
(Unaudited)
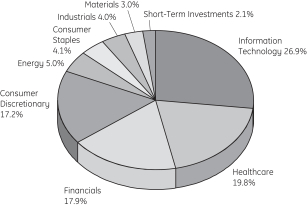
A mutual fund designed for investors who seek long-term growth of capital and future income rather than current income. The Fund seeks to achieve its investment objectives by investing in equity securities of U.S. companies, such as common and preferred stocks.
(as a % of Fair Value of Investments of $2,359,040 (in thousands) on December 31, 2015) (a)(b)
| | | | |
Visa Inc., Class A | | | 4.57% | |
Allergan PLC | | | 4.50% | |
PepsiCo Inc. | | | 4.07% | |
Amazon.com Inc. | | | 4.01% | |
Baidu Inc. ADR | | | 3.69% | |
CME Group Inc. | | | 3.57% | |
State Street Corp. | | | 3.38% | |
Amgen Inc. | | | 3.37% | |
Liberty Global PLC, Class C | | | 3.37% | |
Comcast Corp., Class A | | | 3.35% | |
Portfolio composition as a % of Fair Value of Investments of $2,359,040 (in thousands) on December 31, 2015 (a)(b)
|
| Morningstar Performance Comparison |
Based on average annual returns for periods ended December 31, 2015
| | | | | | | | | | | | |
| | | One
Year | | | Five
Year | | | Ten
Year | |
Number of funds in peer group | | | 1,744 | | | | 1,547 | | | | 1,330 | |
Peer group average annual total return | | | 3.57 | % | | | 11.37 | % | | | 6.70 | % |
Morningstar Category in peer group: U.S. Large Growth | |
|
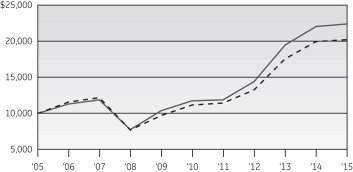
| Change in Value of a $10,000 Investment |

|
| Average Annual Total Return |
For the periods ended December 31, 2015
| | | | | | | | | | | | | | | | | | | | |
| (Inception date: 5/27/35) | | | | | | |
| | | One
Year | | Five
Year | | Ten
Year | | Ending Value of a
$10,000
Investment |
Elfun Trusts | | | | 1.70% | | | | | 13.80% | | | | | 8.41% | | | | | $22,425 | |
S&P 500 Index | | | | 1.38% | | | | | 12.57% | | | | | 7.31% | | | | | $20,242 | |
| (a) | Fair Value basis is inclusive of short-term investment in State Street Institutional U.S. Government Money Market Fund Premier Class. |
| (b) | The securities information regarding holdings, allocations and other characteristics is presented to illustrate examples of securities that the Fund has bought and the diversity of areas in which the Fund may invest as of a particular date. It may not be representative of the Fund’s current or future investments and should not be construed as a recommendation to purchase or sell a particular security. |
See Notes to Performance beginning on page 1 for further information, including an explanation of Morningstar peer categories.
Past performance does not predict future performance. The performance shown in the graphs and tables does not reflect the deduction of taxes that a shareholder would pay on Fund distributions or the redemption of Fund shares.
11
| | |
Elfun Trusts | | December 31, 2015 |
| | | | | | | | | | |
| | | Number
of Shares | | | Fair Value | | | |
Common Stock — 97.7%† | | | |
| |
Aerospace & Defense — 1.0% | | | |
| | | |
Hexcel Corp. | | | 130,000 | | | $ | 6,038,500 | | | |
Honeywell International Inc. | | | 160,000 | | | | 16,571,200 | | | |
| | | | 22,609,700 | | | |
| |
Air Freight & Logistics — 1.0% | | | |
| | | |
United Parcel Service Inc., Class B | | | 250,000 | | | | 24,057,500 | | | |
| |
Application Software — 2.2% | | | |
| | | |
Intuit Inc. | | | 550,000 | | | | 53,075,000 | | | |
|
Asset Management & Custody Banks — 3.4% |
| | | |
State Street Corp. | | | 1,200,000 | | | | 79,632,000 | | | (e) |
| |
Biotechnology — 7.0% | | | |
| | | |
Alexion Pharmaceuticals Inc. | | | 160,000 | | | | 30,520,000 | | | (a) |
Amgen Inc. | | | 490,000 | | | | 79,541,700 | | | |
Gilead Sciences Inc. | | | 550,000 | | | | 55,654,500 | | | |
| | | | 165,716,200 | | | |
| |
Broadcasting — 0.6% | | | |
| | | |
Discovery Communications Inc.,
Class C | | | 550,000 | | | | 13,871,000 | | | (a) |
| | | |
Cable & Satellite — 7.5% | | | | | | | | | | |
| | | |
Comcast Corp., Class A | | | 1,400,000 | | | | 79,002,000 | | | |
Liberty Global PLC, Class C | | | 1,950,000 | | | | 79,501,500 | | | (a) |
Sirius XM Holdings Inc. | | | 4,500,000 | | | | 18,315,000 | | | (a) |
| | | | 176,818,500 | | | |
| |
Casinos & Gaming — 0.6% | | | |
| | | |
Las Vegas Sands Corp. | | | 350,000 | | | | 15,344,000 | | | |
|
Communications Equipment — 2.5% |
| | | |
QUALCOMM Inc. | | | 1,200,000 | | | | 59,982,000 | | | |
|
Data Processing & Outsourced Services — 7.5% |
| | | |
Automatic Data Processing Inc. | | | 200,000 | | | | 16,944,000 | | | |
Paychex Inc. | | | 170,000 | | | | 8,991,300 | | | |
PayPal Holdings Inc. | | | 1,150,000 | | | | 41,630,000 | | | (a) |
Square Inc. Class A | | | 60,000 | | | | 785,400 | | | (a) |
Visa Inc., Class A | | | 1,390,000 | | | | 107,794,500 | | | |
| | | | 176,145,200 | | | |
| | | |
Diversified Banks — 3.2% | | | | | | | | | | |
| | | |
JPMorgan Chase & Co. | | | 1,150,000 | | | | 75,934,500 | | | |
| | | | | | | | | | |
| | | Number
of Shares | | | Fair Value | | | |
|
Environmental & Facilities Services — 0.2% |
| | | |
Stericycle Inc. | | | 45,000 | | | $ | 5,427,000 | | | (a) |
|
Fertilizers & Agricultural Chemicals — 3.0% |
| | | |
Monsanto Co. | | | 720,000 | | | | 70,934,400 | | | |
|
Healthcare Equipment — 4.1% |
| | | |
Abbott Laboratories | | | 600,000 | | | | 26,946,000 | | | |
Medtronic PLC | | | 900,000 | | | | 69,228,000 | | | |
| | | | 96,174,000 | | | |
| | | |
Healthcare Supplies — 1.2% | | | | | | | | | | |
| | | |
The Cooper Companies Inc. | | | 210,000 | | | | 28,182,000 | | | |
|
Home Improvement Retail — 3.1% |
| | | |
Lowe’s Companies Inc. | | | 960,000 | | | | 72,998,400 | | | |
| | | |
Industrial Machinery — 0.7% | | | | | | | | | | |
| | | |
Dover Corp. | | | 275,000 | | | | 16,860,250 | | | |
| | | |
Integrated Oil & Gas — 1.3% | | | | | | | | | | |
| | | |
Chevron Corp. | | | 330,000 | | | | 29,686,800 | | | |
| | | |
Internet Retail — 4.0% | | | | | | | | | | |
| | | |
Amazon.com Inc. | | | 140,000 | | | | 94,624,600 | | | (a) |
|
Internet Software & Services — 11.4% |
| | | |
Alibaba Group Holding Ltd. ADR | | | 80,000 | | | | 6,501,600 | | | (a) |
Alphabet Inc., Class A | | | 38,000 | | | | 29,564,380 | | | (a) |
Alphabet Inc., Class C | | | 83,000 | | | | 62,987,040 | | | (a) |
Baidu Inc. ADR | | | 460,000 | | | | 86,958,400 | | | (a) |
eBay Inc. | | | 1,700,000 | | | | 46,716,000 | | | (a) |
Facebook Inc., Class A | | | 190,000 | | | | 19,885,400 | | | (a) |
LinkedIn Corp., Class A | | | 70,000 | | | | 15,755,600 | | | (a) |
| | | | 268,368,420 | | | |
|
Investment Banking & Brokerage — 2.6% |
| | | |
The Charles Schwab Corp. | | | 1,880,000 | | | | 61,908,400 | | | |
|
Movies & Entertainment — 1.3% |
| | | |
The Walt Disney Co. | | | 300,000 | | | | 31,524,000 | | | |
|
Oil & Gas Equipment & Services — 3.1% |
| | | |
Schlumberger Ltd. | | | 1,050,000 | | | | 73,237,500 | | | |
|
Oil & Gas Exploration & Production — 0.7% |
| | | |
Anadarko Petroleum Corp. | | | 330,000 | | | | 16,031,400 | | | |
|
Pharmaceuticals — 7.5% |
| | | |
Allergan PLC | | | 340,000 | | | | 106,250,000 | | | (a) |
Johnson & Johnson | | | 460,000 | | | | 47,251,200 | | | |
Merck & Company Inc. | | | 250,000 | | | | 13,205,000 | | | |
Pfizer Inc. | | | 300,000 | | | | 9,684,000 | | | |
| | | | 176,390,200 | | | |
See Notes to Schedules of Investments and Notes to Financial Statements.
12
| | |
Elfun Trusts | | December 31, 2015 |
| | | | | | | | | | |
| | | Number
of Shares | | | Fair Value | | | |
| | | |
Reinsurance — 0.4% | | | | | | | | | | |
| | | |
Alleghany Corp. | | | 20,000 | | | $ | 9,558,600 | | | (a) |
| | | |
Soft Drinks — 4.1% | | | | | | | | | | |
| | | |
PepsiCo Inc. | | | 960,000 | | | | 95,923,200 | | | |
|
Specialized Finance — 5.6% |
| | | |
CME Group Inc. | | | 930,000 | | | | 84,258,000 | | | |
McGraw Hill Financial Inc. | | | 500,000 | | | | 49,290,000 | | | |
| | | | 133,548,000 | | | |
|
Specialized REITs — 2.6% |
| | | |
American Tower Corp. | | | 640,000 | | | | 62,048,000 | | | |
|
Technology Hardware, Storage & Peripherals — 3.2% |
| | | |
Apple Inc. | | | 720,000 | | | | 75,787,200 | | | |
|
Trading Companies & Distributors — 1.1% |
| | | |
United Rentals Inc. | | | 360,000 | | | | 26,114,400 | | | (a) |
| | | |
Total Common Stock
(Cost $1,368,999,454) | | | | | | | 2,308,512,370 | | | |
| | | | | | | | | | |
Short-Term Investments — 2.1% | | | |
| | | |
State Street Institutional U.S. Government Money Market
Fund — Premier Class | | | | | | | | | | |
0.09% | | | | | | $ | 50,527,506 | | | (d,p) |
(Cost $50,527,506) | | | | | | | | | | |
| | | |
Total Investments
(Cost $1,419,526,960) | | | | | | | 2,359,039,876 | | | |
| | | |
Other Assets and Liabilities,
net — 0.2% | | | | | | | 5,279,602 | | | |
| | | | | | | | | | |
| | | |
NET ASSETS — 100.0% | | | | | | $ | 2,364,319,478 | | | |
| | | | | | | | | | |
See Notes to Schedules of Investments and Notes to Financial Statements.
13
(Unaudited)


David Wiederecht
President and
Chief Investment
Officer – Investment Solutions

Jeffrey Palma
Senior Vice President and Chief Market Strategist
The Elfun Diversified Fund is managed by Jeffrey Palma and David Wiederecht. Messrs. Palma and Wiederecht are vested with oversight authority for determining asset allocations for the Fund. Each of the U.S. equity, international equity and fixed income portions of the Fund are managed by separate teams of portfolio managers and analysts. The sub-portfolios underlying the Fund are managed independently of each other, and the portfolio managers have full discretion over their particular sub-portfolio; however, the portfolio management team is collaborative to ensure strict adherence to seek the Fund’s objective. See portfolio managers’ biographical information beginning on page 98.
| Q. | How did the Elfun Diversified Fund perform compared to its benchmark and Morningstar peer group for the twelve-month period ended December 31, 2015? |
| A. | For the twelve-month period ended December 31, 2015, the Elfun Diversified Fund returned -1.25%. The Fund’s broad based benchmarks, the S&P 500® Index (S&P 500 Index), the MSCI All Country World ex-U.S. Index, and the Barclays U.S. Aggregate Bond Index, returned 1.38%, -5.66%, and 0.55%, respectively. The Fund’s Morningstar peer group of 967 U.S. Moderate Allocation funds returned an average of -1.98% over the same period. |
| Q. | What market factors affected the Fund’s performance? |
| A. | 2015 was a challenging year for markets across asset classes. Indeed, returns were negative or only slightly positive in both equity and fixed income markets. Overall, global growth trends were challenging in 2015 with Global GDP expected to have decelerated to just 3.1% (from 3.4% in 2014). The US and Japan showed little change, Europe fared a bit better, but China and the emerging market complex was clearly weaker. For most of the second half of the year, economic growth surprised to the downside in the US, while Europe was a bit more resilient. |
| | Global equity market returns for the year were lackluster with only low single-digit total returns in most markets. The overhang of macro and policy uncertainty, weakness in energy markets, and weak earnings (and a strong dollar for US companies) were contributing fundamental factors. Further, PE multiples were unable to provide the support to drive gains. With valuations already above long-term averages, this is not particularly surprising, but underscores an ongoing headwind for equity returns moving forward. Indeed, it is difficult to count on valuations to drive returns higher at this advanced stage of the cycle. |
| | In 2015, most of the major fixed income markets saw rates move higher. In credit, returns struggled all year. With investment grade and high yield spreads both wider through 2015, returns were under pressure, while the rise in Treasury yields further depressed returns. |
| | On top of challenging returns, volatility across markets also presented a difficult market backdrop. The combination of macro weakness and uncertainty, policy shift from the Fed, weakness in commodity and credit markets, and geopolitical unrest created an unsettled environment. Alongside valuations and fundamentals, this combination resulted in low aggregate returns and weak returns in stocks and bonds. |
| Q. | What were the primary drivers of Fund performance? |
| A. | Soft returns in US equities acted as the biggest drag on performance. Moreover, an underweight allocation to fixed income markets was also a headwind as returns, though modest, were positive. Returns on cash were positive courtesy of tactical asset allocation positions taken on crude oil during the year and downside equity market hedges put in place in the second half of 2015. |
14
(Unaudited)
| Q. | Were there any significant changes to the Fund during the period? |
| A. | Over the course of 2015, our allocation to equity markets declined slightly as we reduced our overweight position in US equity markets to neutral. Our positioning in international equities was relatively constant, though we did add a bit to Emerging Market equities towards the end of the year. |
| | We have maintained an underweight allocation to fixed income markets and a matching overweight position in cash for some time based on our view that valuations in bond markets are relatively unattractive and that tighter Fed policy could exert some upward pressure on bond yields. To that end, we have preferred to hold a larger position in cash than in our benchmark to reflect this view. Looking ahead, we expect another volatile and challenging environment in 2016. As a result, we have reduced our long-standing overweight allocation to equity markets back towards neutral. We believe there will be opportunities to take advantage of volatility through the year but managing downside risk will be a critical element of tactical asset allocation in the year ahead. |
15
(Unaudited)
Understanding Your Fund’s Expenses
As a shareholder of the Fund you incur ongoing costs. Ongoing costs include portfolio management fees, professional fees, administrative fees and other Fund expenses. The following example is intended to help you understand your ongoing costs (in dollars) of investing in the Fund and to compare these costs with the ongoing costs of investing in other mutual funds.
To illustrate these ongoing costs, we have provided an example and calculated the expenses paid by investors in units of the Fund during the period. The information in the following table is based on an investment of $1,000, which is invested at the beginning of the period and held for the entire six-month period ended December 31, 2015.
Actual Expenses
The first section of the table provides information about actual account values and actual expenses. You may use the information in this section, together with the amount you invested, to estimate the expenses that you paid over the period. To do so, simply divide your account value by $1,000 (for example, an $8,600 account value divided by $1,000 = 8.6), then multiply the result by the number given under the heading “Expenses paid during
the period” to estimate the expenses you paid on your account during the period.
Hypothetical Example for Comparison Purposes
The second section of the table provides information about hypothetical account values and hypothetical expenses based on the Fund’s actual expense ratio and an assumed rate of return of 5% per year before expenses, which is not the Fund’s actual return. The hypothetical account values and expenses may not be used to estimate the actual ending account balance or expenses you paid for the period. You may use this information to compare the ongoing costs of investing in the Fund and other funds. To do so, compare this 5% hypothetical example with the 5% hypothetical examples that appear in the shareholders reports of other funds.
Please note that the expenses shown in the table are meant to highlight and help you compare ongoing costs only and do not reflect transaction costs, such as sales charges or redemption fees, if any. Therefore, the second section of the table is useful in comparing ongoing costs only, and will not help you determine the relative total costs of owning different funds.
July 1, 2015 – December 31, 2015
| | | | | | | | | | | | |
| | | Account value at
the beginning of
the period ($) | | | Account value
at the end of
the period ($) | | | Expenses paid during
the period ($)* | |
Actual Fund Return | | | 1,000.00 | | | | 964.90 | | | | 1.78 | |
Hypothetical 5% Return
(2.5% for the period) | | | 1,000.00 | | | | 1,023.39 | | | | 1.84 | |
| * | | Expenses are equal to the Fund’s annualized net expense ratio of 0.36%** (for the period July 1, 2015 – December 31, 2015), multiplied by the average account value over the period, multiplied by 184/365 (to reflect the one-half year period). |
| ** | | May differ from expense ratio disclosed in the financial highlights, which is calculated based on the entire fiscal year’s data. |
16
(Unaudited)
A mutual fund designed for investors who seek the highest total return, composed of income and capital appreciation, as is consistent with prudent investment management and the preservation of capital. The Fund seeks to achieve its investment objective by investing primarily in a combination of U.S. and foreign (non-U.S.) equity and debt securities and cash. The Fund’s asset allocation process utilizes information from GE Asset Management’s Asset Allocation Committee to diversify holdings across these asset classes and to adjust the asset class weightings based on market and economic conditions.
|
| Top Ten Largest Equity Holdings |
(as a % of Fair Value of Investments of $212,685 (in thousands) on December 31, 2015) (a)(b)
| | | | |
Allergan PLC | | | 1.14% | |
Comcast Corp., Class A | | | 0.94% | |
Amgen Inc. | | | 0.93% | |
JPMorgan Chase & Co. | | | 0.87% | |
Apple Inc. | | | 0.82% | |
Baidu Inc. ADR | | | 0.80% | |
Johnson & Johnson | | | 0.74% | |
Exxon Mobil Corp. | | | 0.73% | |
Cisco Systems Inc. | | | 0.72% | |
Medtronic PLC | | | 0.70% | |
Portfolio composition as a % of Fair Value of Investments of $212,685 (in thousands) on December 31, 2015 (a)(b)
|
| Morningstar Performance Comparison |
Based on average annual returns for periods ended December 31, 2015
| | | | | | | | | | | | |
| | | One
Year | | | Five
Year | | | Ten
Year | |
Number of funds in peer group | | | 967 | | | | 834 | | | | 670 | |
Peer group average annual total return | | | -1.98 | % | | | 6.05 | % | | | 4.64 | % |
Morningstar Category in peer group: U.S. Moderate Allocation | |
|
| Change in Value of a $10,000 Investment |

|
| Average Annual Total Return |
For the periods ended December 31, 2015
| | | | | | | | | | | | | | | | | | | | |
(Inception date: 1/1/88) |
| | | One
Year | | Five
Year | | Ten
Year | | Ending Value of a
$10,000
Investment |
Elfun Diversified Fund | | | | -1.25% | | | | | 5.86% | | | | | 4.50% | | | | | $15,525 | |
S&P 500 Index | | | | 1.38% | | | | | 12.57% | | | | | 7.31% | | | | | $20,242 | |
MSCI All Country World Index ex-U.S. | | | | -5.66% | | | | | 1.06% | | | | | 2.92% | | | | | $13,338 | |
Barclays U.S. Aggregate Bond Index | | | | 0.55% | | | | | 3.25% | | | | | 4.51% | | | | | $15,552 | |
| (a) | Fair Value basis is inclusive of short-term investment in State Street Institutional U.S. Government Money Market Fund Premier Class. |
| (b) | The securities information regarding holdings, allocations and other characteristics is presented to illustrate examples of securities that the Fund has bought and the diversity of areas in which the Fund may invest as of a particular date. It may not be representative of the Fund’s current or future investments and should not be construed as a recommendation to purchase or sell a particular security. |
See Notes to Performance beginning on page 1 for further information, including an explanation of Morningstar peer categories.
Past performance does not predict future performance. The performance shown in the graphs and tables does not reflect the deduction of taxes that a shareholder would pay on Fund distributions or the redemption of Fund shares.
17
| | |
Elfun Diversified Fund | | December 31, 2015 |
| | | | | | | | | | |
| | | Number
of Shares | | | Fair
Value | | | |
Domestic Equity — 31.3%† | | | | | | | | | | |
| | | |
Common Stock — 31.3% | | | | | | | | | | |
| | | |
Aerospace & Defense — 1.1% | | | | | | | | | | |
| | | |
General Dynamics Corp. | | | 4,206 | | | $ | 577,736 | | | |
Hexcel Corp. | | | 11,596 | | | | 538,634 | | | |
Honeywell International Inc. | | | 8,411 | | | | 871,127 | | | |
The Boeing Co. | | | 2,443 | | | | 353,234 | | | |
| | | | | | | 2,340,731 | | | |
| | | |
Agricultural Products — 0.3% | | | | | | | | | | |
| | | |
Archer-Daniels-Midland Co. | | | 16,134 | | | | 591,795 | | | |
| | | |
Air Freight & Logistics — 0.1% | | | | | | | | | | |
| | | |
United Parcel Service Inc., Class B | | | 2,474 | | | | 238,073 | | | |
| | | |
Airlines — 0.4% | | | | | | | | | | |
| | | |
Delta Air Lines Inc. | | | 14,843 | | | | 752,392 | | | |
| | |
Application Software — 0.2% | | | | | | | |
| | | |
Intuit Inc. | | | 5,566 | | | | 537,119 | | | |
| |
Asset Management & Custody Banks — 1.4% | | | |
| | | |
Ameriprise Financial Inc. | | | 7,886 | | | | 839,228 | | | |
Invesco Ltd. | | | 31,184 | | | | 1,044,040 | | | |
State Street Corp. | | | 15,400 | | | | 1,021,944 | | | (e) |
| | | | | | | 2,905,212 | | | |
| | |
Automobile Manufacturers — 0.2% | | | | | | | |
| | | |
Ford Motor Co. | | | 30,924 | | | | 435,719 | | | |
| | | |
Automotive Retail — 0.1% | | | | | | | | | | |
| | | |
Advance Auto Parts Inc. | | | 928 | | | | 139,673 | | | |
| | |
Biotechnology — 1.8% | | | | | | | |
| | | |
Alexion Pharmaceuticals Inc. | | | 3,463 | | | | 660,567 | | | (a) |
Amgen Inc. | | | 12,215 | | | | 1,982,861 | | | |
Gilead Sciences Inc. | | | 12,265 | | | | 1,241,096 | | | |
| | | | | | | 3,884,524 | | | |
| | | |
Broadcasting — 0.1% | | | | | | | | | | |
| | | |
CBS Corp., Class B | | | 4,020 | | | | 189,463 | | | |
| | | |
Cable & Satellite — 1.5% | | | | | | | | | | |
| | | |
Comcast Corp., Class A | | | 35,431 | | | | 1,999,372 | | | |
Liberty Global PLC, Class C | | | 19,482 | | | | 794,281 | | | (a) |
Sirius XM Holdings Inc. | | | 80,402 | | | | 327,236 | | | (a) |
| | | | | | | 3,120,889 | | | |
| | | |
Casinos & Gaming — 0.1% | | | | | | | | | | |
| | | |
Las Vegas Sands Corp. | | | 5,133 | | | | 225,031 | | | |
| | | | | | | | | | |
| | | Number
of Shares | | | Fair
Value | | | |
| | |
Communications Equipment — 1.3% | | | | | | | |
| | | |
Cisco Systems Inc. | | | 56,436 | | | $ | 1,532,520 | | | |
QUALCOMM Inc. | | | 22,861 | | | | 1,142,707 | | | |
| | | | | | | 2,675,227 | | | |
| | | |
Consumer Finance — 0.5% | | | | | | | | | | |
| | | |
Discover Financial Services | | | 18,400 | | | | 986,608 | | | |
| |
Data Processing & Outsourced Services — 0.7% | | | |
| | | |
PayPal Holdings Inc. | | | 11,133 | | | | 403,015 | | | (a) |
Visa Inc., Class A | | | 13,606 | | | | 1,055,145 | | | |
| | | | | | | 1,458,160 | | | |
| | | |
Diversified Banks — 2.3% | | | | | | | | | | |
| | | |
Bank of America Corp. | | | 82,033 | | | | 1,380,616 | | | |
Citigroup Inc. | | | 3,711 | | | | 192,044 | | | |
JPMorgan Chase & Co. | | | 27,938 | | | | 1,844,746 | | | |
Wells Fargo & Co. | | | 25,976 | | | | 1,412,055 | | | |
| | | | | | | 4,829,461 | | | |
| | |
Diversified Chemicals — 0.1% | | | | | | | |
| | | |
The Dow Chemical Co. | | | 2,165 | | | | 111,454 | | | |
| | | |
Drug Retail — 0.1% | | | | | | | | | | |
| | | |
CVS Health Corp. | | | 1,546 | | | | 151,152 | | | |
| | | |
Electric Utilities — 0.2% | | | | | | | | | | |
| | | |
NextEra Energy Inc. | | | 4,720 | | | | 490,361 | | | |
| | |
Fertilizers & Agricultural Chemicals — 0.3% | | | | | | | |
| | | |
Monsanto Co. | | | 6,494 | | | | 639,789 | | | |
| | |
General Merchandise Stores — 0.3% | | | | | | | |
| | | |
Dollar General Corp. | | | 9,092 | | | | 653,442 | | | |
| | | |
Healthcare Distributors — 0.2% | | | | | | | | | | |
| | | |
Cardinal Health Inc. | | | 5,566 | | | | 496,877 | | | |
| | | |
Healthcare Equipment — 0.9% | | | | | | | | | | |
| | | |
Abbott Laboratories | | | 14,843 | | | | 666,599 | | | |
Boston Scientific Corp. | | | 51,643 | | | | 952,297 | | | (a) |
Stryker Corp. | | | 2,714 | | | | 252,239 | | | |
| | | | 1,871,135 | | | |
| | | |
Healthcare Supplies — 0.2% | | | | | | | | | | |
| | | |
The Cooper Companies Inc. | | | 3,031 | | | | 406,760 | | | |
| | | |
Home Improvement
Retail — 0.6% | | | | | | | | | | |
| | | |
Lowe’s Companies Inc. | | | 16,173 | | | | 1,229,795 | | | |
| | | |
Household Products — 0.1% | | | | | | | | | | |
| | | |
The Procter & Gamble Co. | | | 2,448 | | | | 194,396 | | | |
See Notes to Schedules of Investments and Notes to Financial Statements.
18
| | |
Elfun Diversified Fund | | December 31, 2015 |
| | | | | | | | | | |
| | | Number
of Shares | | | Fair
Value | | | |
| |
Independent Power Producers & Energy Traders — 0.1% | | | |
| | | |
Calpine Corp. | | | 9,252 | | | $ | 133,876 | | | (a) |
| | | |
Industrial Machinery — 0.4% | | | | | | | | | | |
| | | |
Ingersoll-Rand PLC | | | 16,699 | | | | 923,288 | | | |
| | | |
Integrated Oil & Gas — 1.5% | | | | | | | | | | |
| | | |
Chevron Corp. | | | 7,267 | | | | 653,740 | | | |
Exxon Mobil Corp. | | | 20,038 | | | | 1,561,962 | | | |
Occidental Petroleum Corp. | | | 14,192 | | | | 959,521 | | | |
| | | | 3,175,223 | | | |
| |
Integrated Telecommunication Services — 0.2% | | | |
| | | |
Verizon Communications Inc. | | | 8,659 | | | | 400,219 | | | |
| | | |
Internet Retail — 0.5% | | | | | | | | | | |
| | | |
Amazon.com Inc. | | | 1,608 | | | | 1,086,831 | | | (a) |
| | |
Internet Software & Services — 1.8% | | | | | | | |
| | | |
Alphabet Inc., Class A | | | 1,273 | | | | 990,407 | | | (a) |
Alphabet Inc., Class C | | | 1,546 | | | | 1,173,228 | | | (a) |
eBay Inc. | | | 26,986 | | | | 741,575 | | | (a) |
Facebook Inc., Class A | | | 5,257 | | | | 550,198 | | | (a) |
LinkedIn Corp., Class A | | | 1,484 | | | | 334,019 | | | (a) |
| | | | 3,789,427 | | | |
| | |
Investment Banking & Brokerage — 0.3% | | | | | | | |
| | | |
The Charles Schwab Corp. | | | 22,265 | | | | 733,186 | | | |
| | |
IT Consulting & Other Services — 0.1% | | | | | | | |
| | | |
Cognizant Technology Solutions Corp., Class A | | | 4,112 | | | | 246,802 | | | (a) |
| | | |
Life & Health Insurance — 0.2% | | | | | | | | | | |
| | | |
Lincoln National Corp. | | | 6,803 | | | | 341,919 | | | |
| | | |
Movies & Entertainment — 0.7% | | | | | | | | | | |
| | | |
The Walt Disney Co. | | | 5,937 | | | | 623,860 | | | |
Time Warner Inc. | | | 13,452 | | | | 869,941 | | | |
| | | | 1,493,801 | | | |
| | | |
Multi-Line Insurance — 0.7% | | | | | | | | | | |
| | | |
American International Group Inc. | | | 6,497 | | | | 402,619 | | | |
The Hartford Financial Services Group Inc. | | | 22,977 | | | | 998,581 | | | |
| | | | 1,401,200 | | | |
| | | |
Multi-Utilities — 0.3% | | | | | | | | | | |
| | | |
Dominion Resources Inc. | | | 8,102 | | | | 548,019 | | | |
| | |
Oil & Gas Equipment & Services — 0.5% | | | | | | | |
| | | |
Schlumberger Ltd. | | | 13,827 | | | | 964,433 | | | |
| | | | | | | | | | |
| | | Number
of Shares | | | Fair
Value | | | |
| | |
Oil & Gas Exploration & Production — 0.4% | | | | | | | |
| | | |
Hess Corp. | | | 14,952 | | | $ | 724,873 | | | |
Marathon Oil Corp. | | | 12,354 | | | | 155,537 | | | |
| | | | 880,410 | | | |
| |
Packaged Foods & Meats — 0.4% | | | |
| | | |
Mondelez International Inc., Class A | | | 17,317 | | | | 776,494 | | | |
| | | |
Paper Packaging — 0.1% | | | | | | | | | | |
| | | |
Packaging Corporation of America | | | 2,165 | | | | 136,503 | | | |
| | | |
Pharmaceuticals — 2.9% | | | | | | | | | | |
| | | |
Allergan PLC | | | 7,789 | | | | 2,434,062 | | | (a) |
Johnson & Johnson | | | 15,342 | | | | 1,575,930 | | | |
Merck & Company Inc. | | | 24,430 | | | | 1,290,393 | | | |
Pfizer Inc. | | | 24,275 | | | | 783,597 | | | |
| | | | 6,083,982 | | | |
| | | |
Railroads — 0.1% | | | | | | | | | | |
| | | |
CSX Corp. | | | 5,257 | | | | 136,419 | | | |
| | | |
Regional Banks — 0.1% | | | | | | | | | | |
| | | |
First Republic Bank | | | 2,288 | | | | 151,145 | | | |
| |
Research & Consulting Services — 0.4% | | | |
| | | |
Nielsen Holdings PLC | | | 19,502 | | | | 908,793 | | | |
| |
Semiconductor Equipment — 0.4% | | | |
| | | |
Applied Materials Inc. | | | 42,056 | | | | 785,186 | | | |
| | | |
Soft Drinks — 0.7% | | | | | | | | | | |
| | | |
PepsiCo Inc. | | | 14,503 | | | | 1,449,140 | | | |
| |
Specialized Finance — 0.7% | | | |
| | | |
CME Group Inc. | | | 8,349 | | | | 756,419 | | | |
McGraw Hill Financial Inc. | | | 7,422 | | | | 731,661 | | | |
| | | | | | | 1,488,080 | | | |
| | | |
Specialized REITs — 0.7% | | | | | | | | | | |
| | | |
American Tower Corp. | | | 12,988 | | | | 1,259,187 | | | |
Extra Space Storage Inc. | | | 2,474 | | | | 218,231 | | | |
| | | | | | | 1,477,418 | | | |
| | | |
Systems Software — 0.5% | | | | | | | | | | |
| | | |
Microsoft Corp. | | | 8,195 | | | | 454,659 | | | |
Oracle Corp. | | | 12,679 | | | | 463,164 | | | |
VMware Inc., Class A | | | 3,808 | | | | 215,418 | | | (a) |
| | | | | | | 1,133,241 | | | |
| |
Technology Hardware, Storage & Peripherals — 1.3% | | | |
| | | |
Apple Inc. | | | 16,637 | | | | 1,751,211 | | | |
HP Inc. | | | 36,800 | | | | 435,712 | | | |
Western Digital Corp. | | | 9,741 | | | | 584,947 | | | |
| | | | | | | 2,771,870 | | | |
See Notes to Schedules of Investments and Notes to Financial Statements.
19
| | |
Elfun Diversified Fund | | December 31, 2015 |
| | | | | | | | | | |
| | | Number
of Shares | | | Fair
Value | | | |
| |
Trading Companies & Distributors — 0.2% | | | |
| | | |
United Rentals Inc. | | | 7,422 | | | $ | 538,392 | | | (a) |
| | | |
Total Common Stock
(Cost $58,095,321) | | | | | | | 65,510,535 | | | |
| | | | | | | | | | |
Preferred Stock — 0.0%* | | | | | | | | | | |
| | | |
Diversified Banks — 0.0%* | | | | | | | | | | |
| | | |
Wells Fargo & Co. | | | 2,735 | | | | 71,438 | | | |
| | | |
Total Preferred Stock
(Cost $68,375) | | | | | | | 71,438 | | | |
| | | |
Total Domestic Equity
(Cost $58,163,696) | | | | | | | 65,581,973 | | | |
| | | | | | | | | | |
Foreign Equity — 20.7% | | | | | | | | | | |
| | | |
Common Stock — 20.7% | | | | | | | | | | |
| | | |
Advertising — 0.2% | | | | | | | | | | |
| | | |
WPP PLC | | | 21,736 | | | | 500,734 | | | |
| | | |
Aerospace & Defense — 0.5% | | | | | | | | | | |
| | | |
Airbus Group SE | | | 3,296 | | | | 221,988 | | | |
Safran S.A. | | | 4,649 | | | | 320,032 | | | |
Zodiac Aerospace | | | 19,421 | | | | 463,607 | | | |
| | | | | | | 1,005,627 | | | |
| | | |
Airlines — 0.1% | | | | | | | | | | |
| | | |
International Consolidated Airlines Group S.A. | | | 29,523 | | | | 265,653 | | | |
| | | |
Apparel Retail — 0.2% | | | | | | | | | | |
| | | |
Fast Retailing Company Ltd. | | | 914 | | | | 323,978 | | | |
| |
Apparel, Accessories & Luxury Goods — 0.2% | | | |
| | | |
The Swatch Group AG | | | 1,100 | | | | 384,835 | | | |
| | | |
Application Software — 0.2% | | | | | | | | | | |
| | | |
SAP SE | | | 6,200 | | | | 494,219 | | | |
| | | |
Auto Parts & Equipment — 0.7% | | | | | | | | | | |
| | | |
Continental AG | | | 3,966 | | | | 967,421 | | | |
Delphi Automotive PLC | | | 5,659 | | | | 485,146 | | | |
| | | | | | | 1,452,567 | | | |
| | |
Automobile Manufacturers — 0.5% | | | | | | | |
| | | |
Fuji Heavy Industries Ltd. | | | 8,200 | | | | 342,669 | | | |
Toyota Motor Corp. | | | 12,330 | | | | 767,505 | | | |
| | | | | | | 1,110,174 | | | |
| | | | | | | | | | |
| | | Number
of Shares | | | Fair
Value | | | |
| | | |
Brewers — 0.4% | | | | | | | | | | |
| | | |
Anheuser-Busch InBev S.A. | | | 6,616 | | | $ | 822,188 | | | |
| | | |
Building Products — 0.5% | | | | | | | | | | |
| | | |
Assa Abloy AB, Class B | | | 27,163 | | | | 573,508 | | | |
Geberit AG | | | 1,232 | | | | 418,707 | | | |
| | | | | | | 992,215 | | | |
| | |
Communications Equipment — 0.3% | | | | | | | |
| | | |
Telefonaktiebolaget LM Ericsson, Class B | | | 71,656 | | | | 699,510 | | | |
| |
Construction & Engineering — 0.1% | | | |
| | | |
Larsen & Toubro Ltd. | | | 10,870 | | | | 209,821 | | | |
| | | |
Construction Materials — 0.2% | | | | | | | | | | |
| | | |
HeidelbergCement AG | | | 5,880 | | | | 483,019 | | | |
| | | |
Diversified Banks — 2.6% | | | | | | | | | | |
| | | |
Banco Bilbao Vizcaya Argentaria S.A. | | | 35,245 | | | | 258,014 | | | |
Barclays PLC | | | 211,017 | | | | 680,818 | | | |
BNP Paribas S.A. | | | 13,747 | | | | 779,970 | | | |
Credit Agricole S.A. | | | 32,294 | | | | 381,681 | | | |
Grupo Financiero Banorte SAB de C.V., Class O | | | 30,737 | | | | 168,713 | | | |
HSBC Holdings PLC | | | 32,797 | | | | 259,196 | | | |
ICICI Bank Ltd. | | | 99,263 | | | | 391,613 | | | |
ING Groep N.V. | | | 42,395 | | | | 573,368 | | | |
Intesa Sanpaolo S.p.A. | | | 170,251 | | | | 571,106 | | | |
Mitsubishi UFJ Financial Group Inc. | | | 111,500 | | | | 701,747 | | | |
Sumitomo Mitsui Financial Group Inc. | | | 16,400 | | | | 627,943 | | | |
| | | | | | | 5,394,169 | | | |
| |
Diversified Metals & Mining — 0.1% | | | |
| | | |
BHP Billiton PLC | | | 20,083 | | | | 224,963 | | | |
| |
Diversified Real Estate Activities — 0.8% | | | |
| | | |
Brookfield Asset Management Inc., Class A | | | 5,962 | | | | 187,345 | | | |
Mitsubishi Estate Company Ltd. | | | 31,918 | | | | 669,563 | | | |
Mitsui Fudosan Company Ltd. | | | 29,306 | | | | 744,496 | | | |
| | | | | | | 1,601,404 | | | |
| | | |
Electric Utilities — 0.1% | | | | | | | | | | |
| | | |
Power Grid Corporation of India Ltd. | | | 109,861 | | | | 235,394 | | | |
| |
Electrical Components & Equipment — 0.7% | | | |
| | | |
Nidec Corp. | | | 13,700 | | | | 1,006,417 | | | |
Schneider Electric SE | | | 7,457 | | | | 425,764 | | | |
| | | | | | | 1,432,181 | | | |
See Notes to Schedules of Investments and Notes to Financial Statements.
20
| | |
Elfun Diversified Fund | | December 31, 2015 |
| | | | | | | | | | |
| | | Number
of Shares | | | Fair
Value | | | |
| | | |
Electronic Components — 0.2% | | | | | | | | | | |
| | | |
Murata Manufacturing Company Ltd. | | | 3,100 | | | $ | 452,779 | | | |
| |
Electronic Equipment & Instruments — 0.8% | | | |
| | | |
Hexagon AB, Class B | | | 14,504 | | | | 541,582 | | | |
Hitachi Ltd. | | | 111,500 | | | | 640,943 | | | |
Keyence Corp. | | | 900 | | | | 501,866 | | | |
| | | | | | | 1,684,391 | | | |
| | | |
Healthcare Equipment — 1.0% | | | | | | | | | | |
| | | |
Medtronic PLC | | | 19,296 | | | | 1,484,248 | | | |
Smith & Nephew PLC | | | 38,636 | | | | 687,903 | | | |
| | | | | | | 2,172,151 | | | |
| | | |
Healthcare Services — 0.3% | | | | | | | | | | |
| | | |
Fresenius SE & Company KGaA | | | 9,005 | | | | 645,327 | | | |
| | | |
Household Products — 0.1% | | | | | | | | | | |
| | | |
Svenska Cellulosa AB SCA, Class B | | | 9,445 | | | | 276,160 | | | |
| |
Human Resource & Employment Services — 0.1% | | | |
| | | |
Capita PLC | | | 10,291 | | | | 183,228 | | | |
| | | |
Industrial Gases — 0.2% | | | | | | | | | | |
| | | |
Linde AG | | | 3,069 | | | | 446,403 | | | |
| | | |
Industrial Machinery — 0.5% | | | | | | | | | | |
| | | |
FANUC Corp. | | | 3,300 | | | | 578,278 | | | |
Mitsubishi Heavy Industries Ltd. | | | 99,000 | | | | 438,894 | | | |
| | | | | | | 1,017,172 | | | |
| | | |
Integrated Oil & Gas — 0.8% | | | | | | | | | | |
| | | |
Cenovus Energy Inc. | | | 29,506 | | | | 372,366 | | | |
Cenovus Energy Inc. | | | 29,394 | | | | 370,308 | | | |
Statoil ASA | | | 31,577 | | | | 441,297 | | | |
Total S.A. | | | 9,461 | | | | 424,100 | | | |
| | | | | | | 1,608,071 | | | |
| | | |
Internet Retail — 0.2% | | | | | | | | | | |
| | | |
Rakuten Inc. | | | 38,500 | | | | 449,025 | | | |
| |
Internet Software & Services — 0.8% | | | |
| | | |
Baidu Inc. ADR | | | 9,016 | | | | 1,704,385 | | | (a) |
| | | |
Leisure Products — 0.1% | | | | | | | | | | |
| | | |
Shimano Inc. | | | 1,500 | | | | 232,678 | | | |
| | | |
Life & Health Insurance — 0.8% | | | | | | | | | | |
| | | |
AIA Group Ltd. | | | 167,387 | | | | 1,006,463 | | | |
Japan Post Holdings Company Ltd. | | | 13,200 | | | | 204,647 | | | (a) |
| | | | | | | | | | |
| | | Number
of Shares | | | Fair
Value | | | |
Prudential PLC | | | 22,975 | | | $ | 518,440 | | | |
| | | | | | | 1,729,550 | | | |
| | | |
Movies & Entertainment — 0.2% | | | | | | | | | | |
| | | |
Vivendi S.A. | | | 18,314 | | | | 395,105 | | | |
| | | |
Multi-Line Insurance — 0.3% | | | | | | | | | | |
| | | |
AXA S.A. | | | 25,269 | | | | 692,556 | | | |
| | |
Oil & Gas Equipment & Services — 0.3% | | | | | | | |
| | | |
Technip S.A. | | | 11,098 | | | | 551,370 | | | |
| | | |
Packaged Foods & Meats — 0.4% | | | | | | | | | | |
| | | |
Kerry Group PLC, Class A | | | 3,981 | | | | 330,007 | | | |
Nestle S.A. | | | 5,977 | | | | 445,140 | | | |
| | | | | | | 775,147 | | | |
| | | |
Personal Products — 0.2% | | | | | | | | | | |
| | | |
Kao Corp. | | | 8,900 | | | | 462,775 | | | |
| | | |
Pharmaceuticals — 1.7% | | | | | | | | | | |
| | | |
Astellas Pharma Inc. | | | 23,800 | | | | 342,572 | | | |
Bayer AG | | | 5,274 | | | | 663,435 | | | |
Roche Holding AG | | | 4,657 | | | | 1,285,909 | | | |
Sanofi | | | 10,279 | | | | 877,654 | | | |
Shire PLC | | | 6,759 | | | | 468,019 | | | |
| | | | | | | 3,637,589 | | | |
| | |
Property & Casualty Insurance — 0.9% | | | | | | | |
| | | |
ACE Ltd. | | | 5,556 | | | | 649,219 | | | |
Insurance Australia Group Ltd. | | | 132,010 | | | | 534,004 | | | |
Tokio Marine Holdings Inc. | | | 16,200 | | | | 634,560 | | | |
| | | | | | | 1,817,783 | | | |
| | | |
Railroads — 0.3% | | | | | | | | | | |
| | | |
East Japan Railway Co. | | | 5,300 | | | | 504,468 | | | |
| |
Security & Alarm Services — 0.2% | | | |
| | | |
Secom Company Ltd. | | | 4,300 | | | | 294,543 | | | |
| |
Semiconductor Equipment — 0.3% | | | |
| | | |
ASML Holding N.V. | | | 7,570 | | | | 678,833 | | | |
| | | |
Semiconductors — 0.3% | | | | | | | | | | |
| | | |
Taiwan Semiconductor Manufacturing Company Ltd. | | | 137,484 | | | | 598,539 | | | |
| | | |
Specialty Chemicals — 0.4% | | | | | | | | | | |
| | | |
Givaudan S.A. | | | 305 | | | | 555,460 | | | |
Johnson Matthey PLC | | | 9,020 | | | | 353,237 | | | |
| | | | | | | 908,697 | | | |
See Notes to Schedules of Investments and Notes to Financial Statements.
21
| | |
Elfun Diversified Fund | | December 31, 2015 |
| | | | | | | | | | |
| | | Number
of Shares | | | Fair
Value | | | |
| |
Technology Hardware, Storage & Peripherals — 0.2% | | | |
| | | |
Samsung Electronics Company Ltd. | | | 346 | | | $ | 371,805 | | | |
| |
Wireless Telecommunication Services — 0.7% | | | |
| | | |
SoftBank Group Corp. | | | 12,900 | | | | 658,324 | | | |
Vodafone Group PLC | | | 260,790 | | | | 849,476 | | | |
| | | | | | | 1,507,800 | | | |
| | | |
Total Foreign Equity
(Cost $43,022,492) | | | | | | | 43,430,981 | | | |
| | | | | | | | | | |
| | | | | | | | | | | | |
| | | | | Principal
Amount | | | Fair
Value | | | |
Bonds and Notes — 31.2% | | | | | | | | | | |
| | |
U.S. Treasuries — 5.0% | | | | | | | |
| | | |
U.S. Treasury Bonds | | | | | | | | | | |
| 2.50% | | 02/15/45 | | $ | 220,800 | | | $ | 197,703 | | | |
| 3.13% | | 11/15/41 | | | 1,211,000 | | | | 1,248,532 | | | |
U.S. Treasury Notes | | | | | | | | | | |
| 0.63% | | 05/31/17 | | | 1,987,100 | | | | 1,978,369 | | | (h) |
| 0.88% | | 10/15/18 | | | 1,230,000 | | | | 1,216,570 | | | (h) |
| 1.38% | | 10/31/20 | | | 3,287,200 | | | | 3,229,934 | | | (h) |
| 1.88% | | 10/31/22 | | | 2,664,300 | | | | 2,630,626 | | | (h) |
| 2.00% | | 08/15/25 | | | 55,200 | | | | 53,819 | | | (h) |
| | | | | | | | | 10,555,553 | | | |
| | |
Agency Mortgage Backed — 7.8% | | | | | | | |
| | | |
Federal Home Loan Mortgage Corp. | | | | | | | | | | |
| 4.50% | | 06/01/33 - 02/01/35 | | | 4,192 | | | | 4,532 | | | |
| 5.00% | | 07/01/35 - 06/01/41 | | | 238,142 | | | | 265,589 | | | |
| 5.50% | | 05/01/20 - 04/01/39 | | | 61,089 | | | | 68,877 | | | |
| 6.00% | | 04/01/17 - 11/01/37 | | | 155,150 | | | | 175,837 | | | |
| 6.50% | | 11/01/28 - 07/01/29 | | | 7,201 | | | | 8,199 | | | |
| 7.00% | | 10/01/16 - 08/01/36 | | | 23,457 | | | | 26,355 | | | |
| 7.50% | | 09/01/33 | | | 1,235 | | | | 1,308 | | | |
| 8.00% | | 07/01/26 - 11/01/30 | | | 2,423 | | | | 2,658 | | | |
| 8.50% | | 04/01/30 | | | 7,392 | | | | 8,986 | | | |
Federal National Mortgage Assoc. | | | | | | | | | | |
| 2.22% | | 04/01/37 | | | 533 | | | | 542 | | | (i) |
| 3.00% | | 02/01/43 - 06/01/43 | | | 2,568,267 | | | | 2,576,197 | | | |
| 3.50% | | 11/01/42 - 08/01/45 | | | 2,600,410 | | | | 2,685,213 | | | |
| 4.00% | | 05/01/19 - 03/01/44 | | | 1,401,415 | | | | 1,489,230 | | | |
| 4.50% | | 05/01/18 - 01/01/41 | | | 1,528,873 | | | | 1,653,315 | | | |
| 5.00% | | 07/01/20 - 06/01/41 | | | 415,143 | | | | 465,029 | | | |
| 5.50% | | 06/01/20 - 01/01/39 | | | 280,778 | | | | 312,871 | | | |
| 6.00% | | 02/01/20 - 05/01/41 | | | 735,696 | | | | 837,122 | | | |
| 6.50% | | 08/01/17 - 08/01/36 | | | 29,589 | | | | 32,991 | | | |
| 7.00% | | 10/01/16 - 12/01/33 | | | 2,073 | | | | 2,155 | | | |
| 7.50% | | 12/01/26 - 12/01/33 | | | 6,310 | | | | 7,110 | | | |
| 8.00% | | 06/01/24 - 01/01/33 | | | 10,390 | | | | 10,947 | | | |
| | | | | | | | | | | | |
| | | | | Principal
Amount | | | Fair
Value | | | |
| 9.00% | | 12/01/17 - 12/01/22 | | $ | 1,910 | | | $ | 2,070 | | | |
| 2.50% | | TBA | | | 944,461 | | | | 951,725 | | | (c) |
| 3.00% | | TBA | | | 40,000 | | | | 39,986 | | | (c) |
| 3.50% | | TBA | | | 1,026,138 | | | | 1,058,355 | | | (c) |
| 4.00% | | TBA | | | 268,888 | | | | 284,460 | | | (c) |
| 5.00% | | TBA | | | 260,000 | | | | 286,151 | | | (c) |
Government National Mortgage Assoc. | | | | | | | | | | |
| 3.00% | | 04/20/43 - 06/20/43 | | | 569,152 | | | | 578,902 | | | |
| 3.50% | | 05/20/43 | | | 523,786 | | | | 547,344 | | | |
| 4.00% | | 01/20/41 - 04/20/43 | | | 616,410 | | | | 659,885 | | | |
| 4.50% | | 08/15/33 - 03/20/41 | | | 299,396 | | | | 326,010 | | | |
| 5.00% | | 08/15/33 | | | 13,350 | | | | 14,846 | | | |
| 6.00% | | 07/15/33 - 09/15/36 | | | 12,569 | | | | 14,631 | | | |
| 6.50% | | 04/15/28 - 07/15/36 | | | 16,078 | | | | 18,393 | | | |
| 7.00% | | 04/15/28 - 10/15/36 | | | 8,411 | | | | 9,233 | | | |
| 7.50% | | 07/15/23 - 04/15/28 | | | 15,196 | | | | 15,578 | | | |
| 8.00% | | 05/15/30 | | | 462 | | | | 523 | | | |
| 8.50% | | 10/15/17 | | | 1,925 | | | | 1,983 | | | |
| 9.00% | | 11/15/16 - 12/15/21 | | | 2,272 | | | | 2,374 | | | |
| 3.00% | | TBA | | | 473,786 | | | | 480,038 | | | (c) |
| 5.00% | | TBA | | | 400,000 | | | | 438,158 | | | (c) |
| 5.50% | | TBA | | | 50,000 | | | | 55,545 | | | (c) |
| | | | | | | | | 16,421,253 | | | |
| |
Agency Collateralized Mortgage Obligations — 0.1% | | | |
| | | |
Collateralized Mortgage Obligation Trust | | | | | | | | | | |
| 0.01% | | 11/01/18 | | | 178 | | | | 177 | | | (d,f) |
Federal Home Loan Mortgage Corp. | | | | | | | | | | |
| 0.08% | | 09/25/43 | | | 207,793 | | | | 592 | | | (g,i) |
Federal Home Loan Mortgage Corp. REMIC | | | | | | | | | | |
| 3.50% | | 11/15/24 - 11/15/30 | | | 198,301 | | | | 16,008 | | | (g) |
| 5.50% | | 06/15/33 | | | 10,570 | | | | 2,211 | | | (g) |
| 6.27% | | 08/15/25 | | | 83,418 | | | | 8,218 | | | (g,i) |
| 7.50% | | 07/15/27 | | | 8,859 | | | | 1,173 | | | (g) |
| 8.00% | | 04/15/20 | | | 81 | | | | 84 | | | |
Federal Home Loan Mortgage Corp. STRIPS | | | | | | | | | | |
| 1.47% | | 08/01/27 | | | 391 | | | | 355 | | | (d,f) |
| 5.62% | | 08/15/43 | | | 182,272 | | | | 39,388 | | | (g,i) |
| 8.00% | | 02/01/23 - 07/01/24 | | | 1,564 | | | | 328 | | | (g) |
Federal National Mortgage Assoc. REMIC | | | | | | | | | | |
| 0.51% | | 12/25/22 | | | 552 | | | | 534 | | | (d,f) |
| 1.22% | | 12/25/42 | | | 47,594 | | | | 1,581 | | | (g,i) |
| 5.00% | | 09/25/40 | | | 100,758 | | | | 10,820 | | | (g) |
| 5.58% | | 07/25/38 | | | 21,757 | | | | 3,003 | | | (g,i) |
| 7.08% | | 05/25/18 | | | 38,471 | | | | 2,165 | | | (g,i) |
| 8.00% | | 05/25/22 | | | 2 | | | | 28 | | | (g) |
See Notes to Schedules of Investments and Notes to Financial Statements.
22
| | |
Elfun Diversified Fund | | December 31, 2015 |
| | | | | | | | | | | | |
| | | | | Principal
Amount | | | Fair
Value | | | |
Federal National Mortgage Assoc. STRIPS | | | | | | | | | | |
| 4.50% | | 08/25/35 - 01/25/36 | | $ | 29,356 | | | $ | 5,281 | | | (g) |
| 5.00% | | 03/25/38 - 05/25/38 | | | 16,661 | | | | 3,016 | | | (g) |
| 5.50% | | 12/25/33 | | | 5,065 | | | | 990 | | | (g) |
| 6.00% | | 01/25/35 | | | 13,557 | | | | 2,797 | | | (g) |
| 7.50% | | 11/25/23 | | | 15,170 | | | | 3,252 | | | (g) |
| 8.00% | | 08/25/23 - 07/25/24 | | | 3,254 | | | | 691 | | | (g) |
| 8.50% | | 03/25/17 - 07/25/22 | | | 620 | | | | 74 | | | (g) |
| 9.00% | | 05/25/22 | | | 457 | | | | 80 | | | (g) |
Government National Mortgage Assoc. | | | | | | | | | | |
| 4.50% | | 10/20/37 - 08/16/39 | | | 146,578 | | | | 9,994 | | | (g) |
| 5.00% | | 10/20/37 - 09/20/38 | | | 62,980 | | | | 3,719 | | | (g) |
| 5.85% | | 02/20/40 | | | 77,252 | | | | 13,218 | | | (g,i) |
| 6.46% | | 01/16/40 | | | 126,101 | | | | 23,302 | | | (g,i) |
| | | | | | | | | 153,079 | | | |
| | | |
Corporate Notes — 14.5% | | | | | | | | | | |
| | | |
21st Century Fox America Inc. | | | | | | | | | | |
| 3.70% | | 10/15/25 | | | 23,000 | | | | 22,959 | | | (b) |
| 4.95% | | 10/15/45 | | | 9,000 | | | | 8,864 | | | (b) |
| 6.65% | | 11/15/37 | | | 55,000 | | | | 63,913 | | | |
ABB Finance USA Inc. | | | | | | | | | | |
| 1.63% | | 05/08/17 | | | 76,000 | | | | 76,054 | | | |
AbbVie Inc. | | | | | | | | | | |
| 1.75% | | 11/06/17 | | | 68,000 | | | | 67,872 | | | |
| 2.00% | | 11/06/18 | | | 57,000 | | | | 56,761 | | | |
| 2.50% | | 05/14/20 | | | 95,000 | | | | 94,061 | | | |
| 3.60% | | 05/14/25 | | | 36,000 | | | | 35,534 | | | |
| 4.70% | | 05/14/45 | | | 20,000 | | | | 19,559 | | | |
ACCO Brands Corp. | | | | | | | | | | |
| 6.75% | | 04/30/20 | | | 97,000 | | | | 99,910 | | | |
ACE INA Holdings Inc. | | | | | | | | | | |
| 2.30% | | 11/03/20 | | | 94,000 | | | | 93,366 | | | |
| 3.15% | | 03/15/25 | | | 66,000 | | | | 65,267 | | | |
| 3.35% | | 05/03/26 | | | 66,000 | | | | 65,810 | | | |
| 4.35% | | 11/03/45 | | | 20,000 | | | | 20,325 | | | |
Actavis Funding SCS | | | | | | | | | | |
| 1.30% | | 06/15/17 | | | 110,000 | | | | 108,959 | | | |
| 3.00% | | 03/12/20 | | | 47,000 | | | | 46,963 | | | |
| 3.45% | | 03/15/22 | | | 66,000 | | | | 66,105 | | | |
| 3.80% | | 03/15/25 | | | 94,000 | | | | 93,529 | | | |
| 4.75% | | 03/15/45 | | | 10,000 | | | | 9,749 | | | |
Activision Blizzard Inc. | | | | | | | | | | |
| 5.63% | | 09/15/21 | | | 98,000 | | | | 102,655 | | | (b) |
Aetna Inc. | | | | | | | | | | |
| 3.50% | | 11/15/24 | | | 59,000 | | | | 58,939 | | | |
Agrium Inc. | | | | | | | | | | |
| 3.38% | | 03/15/25 | | | 23,000 | | | | 20,996 | | | |
| 4.90% | | 06/01/43 | | | 41,000 | | | | 36,676 | | | |
Altria Group Inc. | | | | | | | | | | |
| 2.95% | | 05/02/23 | | | 39,000 | | | | 37,957 | | | |
| | | | | | | | | | | | |
| | | | | Principal
Amount | | | Fair
Value | | | |
| 4.50% | | 05/02/43 | | $ | 39,000 | | | $ | 36,989 | | | |
American Axle & Manufacturing Inc. | | | | | | | | | | |
| 6.25% | | 03/15/21 | | | 52,000 | | | | 53,820 | | | |
| 6.63% | | 10/15/22 | | | 20,000 | | | | 20,950 | | | |
American Campus Communities Operating Partnership LP | | | | | | | | | | |
| 3.35% | | 10/01/20 | | | 38,000 | | | | 37,956 | | | |
| 4.13% | | 07/01/24 | | | 28,000 | | | | 27,805 | | | |
American Electric Power Company Inc. | | | | | | | | | | |
| 2.95% | | 12/15/22 | | | 75,000 | | | | 74,126 | | | |
American Express Co. | | | | | | | | | | |
| 3.63% | | 12/05/24 | | | 93,000 | | | | 91,016 | | | |
American Express Credit Corp. | | | | | | | | | | |
| 2.60% | | 09/14/20 | | | 94,000 | | | | 94,265 | | | |
American International Group Inc. | | | | | | | | | | |
| 3.75% | | 07/10/25 | | | 94,000 | | | | 93,215 | | | |
| 4.13% | | 02/15/24 | | | 28,000 | | | | 28,776 | | | |
| 4.50% | | 07/16/44 | | | 19,000 | | | | 17,572 | | | |
| 4.80% | | 07/10/45 | | | 47,000 | | | | 45,446 | | | |
American Tower Corp. (REIT) | | | | | | | | | | |
| 3.40% | | 02/15/19 | | | 142,000 | | | | 145,690 | | | |
Amgen Inc. | | | | | | | | | | |
| 2.20% | | 05/22/19 | | | 188,000 | | | | 187,791 | | | |
Amkor Technology Inc. | | | | | | | | | | |
| 6.63% | | 06/01/21 | | | 98,000 | | | | 97,265 | | | |
Anadarko Petroleum Corp. | | | | | | | | | | |
| 3.45% | | 07/15/24 | | | 19,000 | | | | 16,888 | | | |
| 6.20% | | 03/15/40 | | | 67,000 | | | | 61,640 | | | |
Anheuser-Busch InBev Worldwide Inc. | | | | | | | | | | |
| 2.50% | | 07/15/22 | | | 155,000 | | | | 149,197 | | | |
Anthem Inc. | | | | | | | | | | |
| 3.30% | | 01/15/23 | | | 50,000 | | | | 48,613 | | | |
Apache Corp. | | | | | | | | | | |
| 5.10% | | 09/01/40 | | | 47,000 | | | | 40,178 | | | |
Apple Inc. | | | | | | | | | | |
| 2.50% | | 02/09/25 | | | 50,000 | | | | 47,844 | | | |
| 2.85% | | 05/06/21 | | | 145,000 | | | | 148,561 | | | |
| 3.45% | | 02/09/45 | | | 45,000 | | | | 38,739 | | | |
Aramark Services Inc. | | | | | | | | | | |
| 5.75% | | 03/15/20 | | | 105,000 | | | | 108,609 | | | |
Ascension Health | | | | | | | | | | |
| 4.85% | | 11/15/53 | | | 65,000 | | | | 70,033 | | | |
AstraZeneca PLC | | | | | | | | | | |
| 2.38% | | 11/16/20 | | | 33,000 | | | | 32,777 | | | |
| 3.38% | | 11/16/25 | | | 47,000 | | | | 46,664 | | | |
| 4.38% | | 11/16/45 | | | 19,000 | | | | 19,041 | | | |
AT&T Inc. | | | | | | | | | | |
| 2.38% | | 11/27/18 | | | 134,000 | | | | 135,033 | | | |
| 2.45% | | 06/30/20 | | | 93,000 | | | | 91,624 | | | |
See Notes to Schedules of Investments and Notes to Financial Statements.
23
| | |
Elfun Diversified Fund | | December 31, 2015 |
| | | | | | | | | | | | |
| | | | | Principal
Amount | | | Fair Value | | | |
| 3.40% | | 05/15/25 | | $ | 93,000 | | | $ | 89,393 | | | |
| 4.50% | | 05/15/35 | | | 47,000 | | | | 43,473 | | | |
| 4.75% | | 05/15/46 | | | 22,000 | | | | 20,139 | | | |
| 4.80% | | 06/15/44 | | | 37,000 | | | | 33,897 | | | |
AutoNation Inc. | | | | | | | | | | |
| 4.50% | | 10/01/25 | | | 66,000 | | | | 67,004 | | | |
AutoZone Inc. | | | | | | | | | | |
| 3.25% | | 04/15/25 | | | 94,000 | | | | 90,963 | | | |
Bank of America Corp. | | | | | | | | | | |
| 1.70% | | 08/25/17 | | | 234,000 | | | | 233,349 | | | |
| 2.60% | | 01/15/19 | | | 81,000 | | | | 81,275 | | | |
| 2.63% | | 10/19/20 | | | 47,000 | | | | 46,429 | | | |
| 3.88% | | 08/01/25 | | | 19,000 | | | | 19,289 | | | |
| 3.95% | | 04/21/25 | | | 106,000 | | | | 103,229 | | | |
| 4.00% | | 01/22/25 | | | 48,000 | | | | 47,027 | | | |
| 4.10% | | 07/24/23 | | | 80,000 | | | | 82,752 | | | |
| 4.25% | | 10/22/26 | | | 85,000 | | | | 84,145 | | | |
Barclays Bank PLC | | | | | | | | | | |
| 2.25% | | 05/10/17 | | | 500,000 | | | | 505,322 | | | (b) |
Barrick Gold Corp. | | | | | | | | | | |
| 4.10% | | 05/01/23 | | | 15,000 | | | | 12,869 | | | |
Baxalta Inc. | | | | | | | | | | |
| 2.88% | | 06/23/20 | | | 94,000 | | | | 92,872 | | | (b) |
| 4.00% | | 06/23/25 | | | 71,000 | | | | 70,300 | | | (b) |
Bed Bath & Beyond Inc. | | | | | | | | | | |
| 4.92% | | 08/01/34 | | | 14,000 | | | | 12,483 | | | |
Berkshire Hathaway Energy Co. | | | | | | | | | | |
| 6.13% | | 04/01/36 | | | 45,000 | | | | 52,444 | | | |
Berkshire Hathaway Finance Corp. | | | | | | | | | | |
| 3.00% | | 05/15/22 | | | 49,000 | | | | 49,865 | | | |
Berkshire Hathaway Inc. | | | | | | | | | | |
| 4.50% | | 02/11/43 | | | 39,000 | | | | 39,240 | | | |
Berry Plastics Corp. | | | | | | | | | | |
| 5.13% | | 07/15/23 | | | 60,000 | | | | 58,350 | | | |
BHP Billiton Finance USA Ltd. | | | | | | | | | | |
| 5.00% | | 09/30/43 | | | 26,000 | | | | 23,561 | | | |
Biogen Inc. | | | | | | | | | | |
| 2.90% | | 09/15/20 | | | 48,000 | | | | 47,895 | | | |
| 4.05% | | 09/15/25 | | | 48,000 | | | | 48,249 | | | |
| 5.20% | | 09/15/45 | | | 18,000 | | | | 18,005 | | | |
Bombardier Inc. | | | | | | | | | | |
| 4.75% | | 04/15/19 | | | 38,000 | | | | 31,255 | | | (b) |
| 6.00% | | 10/15/22 | | | 37,000 | | | | 25,937 | | | (b) |
| 7.75% | | 03/15/20 | | | 334,000 | | | | 269,705 | | | (b) |
Boston Scientific Corp. | | | | | | | | | | |
| 3.85% | | 05/15/25 | | | 45,000 | | | | 44,285 | | | |
BP Capital Markets PLC | | | | | | | | | | |
| 1.38% | | 05/10/18 | | | 56,000 | | | | 55,201 | | | |
| 3.81% | | 02/10/24 | | | 49,000 | | | | 48,991 | | | |
Building Materials Corporation of America | | | | | | | | | | |
| 5.38% | | 11/15/24 | | | 118,000 | | | | 117,705 | | | (b) |
| | | | | | | | | | | | |
| | | | | Principal
Amount | | | Fair
Value | | | |
Burlington Northern Santa Fe LLC | | | | | | | | | | |
| 3.65% | | 09/01/25 | | $ | 75,000 | | | $ | 76,006 | | | |
Calpine Corp. | | | | | | | | | | |
| 5.75% | | 01/15/25 | | | 57,000 | | | | 50,303 | | | |
| 5.88% | | 01/15/24 | | | 129,000 | | | | 132,225 | | | (b) |
Calumet Specialty Products Partners LP/Calumet Finance Corp. | | | | | | | | | | |
| 6.50% | | 04/15/21 | | | 98,000 | | | | 85,260 | | | |
Canadian Pacific Railway Co. | | | | | | | | | | |
| 2.90% | | 02/01/25 | | | 115,000 | | | | 108,259 | | | |
Capital One Financial Corp. | | | | | | | | | | |
| 4.20% | | 10/29/25 | | | 94,000 | | | | 92,859 | | | |
Capital One NA | | | | | | | | | | |
| 2.35% | | 08/17/18 | | | 250,000 | | | | 250,515 | | | |
Caterpillar Inc. | | | | | | | | | | |
| 4.30% | | 05/15/44 | | | 30,000 | | | | 28,949 | | | |
Catholic Health Initiatives | | | | | | | | | | |
| 2.60% | | 08/01/18 | | | 30,000 | | | | 30,124 | | | |
| 4.35% | | 11/01/42 | | | 24,000 | | | | 22,445 | | | |
CBS Corp. | | | | | | | | | | |
| 3.70% | | 08/15/24 | | | 73,000 | | | | 71,031 | | | |
CCO Safari II LLC | | | | | | | | | | |
| 3.58% | | 07/23/20 | | | 71,000 | | | | 70,593 | | | (b) |
| 4.91% | | 07/23/25 | | | 71,000 | | | | 70,930 | | | (b) |
| 6.38% | | 10/23/35 | | | 9,000 | | | | 9,083 | | | (b) |
| 6.48% | | 10/23/45 | | | 19,000 | | | | 19,007 | | | (b) |
Celgene Corp. | | | | | | | | | | |
| 3.88% | | 08/15/25 | | | 94,000 | | | | 93,701 | | | |
| 5.00% | | 08/15/45 | | | 47,000 | | | | 47,180 | | | |
CenturyLink Inc. | | | | | | | | | | |
| 5.80% | | 03/15/22 | | | 196,000 | | | | 179,634 | | | |
Cequel Capital Corp. | | | | | | | | | | |
| 5.13% | | 12/15/21 | | | 96,000 | | | | 86,400 | | | (b) |
Chevron Corp. | | | | | | | | | | |
| 3.33% | | 11/17/25 | | | 66,000 | | | | 66,476 | | | |
Cigna Corp. | | | | | | | | | | |
| 3.25% | | 04/15/25 | | | 94,000 | | | | 92,316 | | | |
Cinemark USA Inc. | | | | | | | | | | |
| 4.88% | | 06/01/23 | | | 98,000 | | | | 95,550 | | | |
Citigroup Inc. | | | | | | | | | | |
| 1.55% | | 08/14/17 | | | 206,000 | | | | 205,167 | | | |
| 1.75% | | 05/01/18 | | | 228,000 | | | | 226,086 | | | |
| 1.85% | | 11/24/17 | | | 45,000 | | | | 44,936 | | | |
| 2.05% | | 12/07/18 | | | 85,000 | | | | 84,549 | | | |
| 2.65% | | 10/26/20 | | | 94,000 | | | | 93,317 | | | |
| 4.40% | | 06/10/25 | | | 47,000 | | | | 47,493 | | | |
| 4.65% | | 07/30/45 | | | 75,000 | | | | 75,857 | | | |
CMS Energy Corp. | | | | | | | | | | |
| 4.88% | | 03/01/44 | | | 47,000 | | | | 47,660 | | | |
CNA Financial Corp. | | | | | | | | | | |
| 5.88% | | 08/15/20 | | | 60,000 | | | | 66,513 | | | |
See Notes to Schedules of Investments and Notes to Financial Statements.
24
| | |
Elfun Diversified Fund | | December 31, 2015 |
| | | | | | | | | | | | |
| | | | | Principal
Amount | | | Fair
Value | | | |
Cogeco Cable Inc. | | | | | | | | | | |
| 4.88% | | 05/01/20 | | $ | 75,000 | | | $ | 74,812 | | | (b) |
Colgate-Palmolive Co. | | | | | | | | | | |
| 4.00% | | 08/15/45 | | | 47,000 | | | | 47,104 | | | |
Columbia Pipeline Group Inc. | | | | | | | | | | |
| 3.30% | | 06/01/20 | | | 66,000 | | | | 64,291 | | | (b) |
| 4.50% | | 06/01/25 | | | 47,000 | | | | 42,600 | | | (b) |
Comcast Corp. | | | | | | | | | | |
| 3.38% | | 08/15/25 | | | 159,000 | | | | 161,063 | | | |
| 4.20% | | 08/15/34 | | | 48,000 | | | | 47,541 | | | |
| 4.60% | | 08/15/45 | | | 45,000 | | | | 45,559 | | | |
ConocoPhillips Co. | | | | | | | | | | |
| 3.35% | | 11/15/24 | | | 94,000 | | | | 86,007 | | | |
Continental Resources Inc. | | | | | | | | | | |
| 3.80% | | 06/01/24 | | | 20,000 | | | | 14,094 | | | |
| 4.50% | | 04/15/23 | | | 18,000 | | | | 12,940 | | | |
| 4.90% | | 06/01/44 | | | 11,000 | | | | 6,635 | | | |
Corp Andina de Fomento | | | | | | | | | | |
| 4.38% | | 06/15/22 | | | 121,000 | | | | 128,817 | | | |
Crown Americas LLC/Crown Americas Capital Corp. IV | | | | | | | | | | |
| 4.50% | | 01/15/23 | | | 116,000 | | | | 113,390 | | | |
CSX Corp. | | | | | | | | | | |
| 4.50% | | 08/01/54 | | | 29,000 | | | | 26,304 | | | |
CubeSmart LP | | | | | | | | | | |
| 4.00% | | 11/15/25 | | | 26,000 | | | | 25,816 | | | |
CVS Health Corp. | | | | | | | | | | |
| 2.25% | | 08/12/19 | | | 143,000 | | | | 142,865 | | | |
| 3.88% | | 07/20/25 | | | 94,000 | | | | 95,950 | | | |
| 5.13% | | 07/20/45 | | | 69,000 | | | | 72,687 | | | |
Daimler Finance North America LLC | | | | | | | | | | |
| 2.38% | | 08/01/18 | | | 150,000 | | | | 150,228 | | | (b) |
Danaher Corp. | | | | | | | | | | |
| 2.40% | | 09/15/20 | | | 46,000 | | | | 46,004 | | | |
| 3.35% | | 09/15/25 | | | 48,000 | | | | 48,757 | | | |
| 4.38% | | 09/15/45 | | | 26,000 | | | | 26,856 | | | |
Denbury Resources Inc. | | | | | | | | | | |
| 5.50% | | 05/01/22 | | | 98,000 | | | | 32,534 | | | |
| 6.38% | | 08/15/21 | | | 54,000 | | | | 19,440 | | | |
Devon Energy Corp. | | | | | | | | | | |
| 5.85% | | 12/15/25 | | | 38,000 | | | | 36,960 | | | |
Dexia Credit Local S.A. | | | | | | | | | | |
| 2.25% | | 01/30/19 | | | 250,000 | | | | 251,627 | | | (b) |
Diageo Investment Corp. | | | | | | | | | | |
| 2.88% | | 05/11/22 | | | 105,000 | | | | 104,092 | | | |
DigitalGlobe Inc. | | | | | | | | | | |
| 5.25% | | 02/01/21 | | | 81,000 | | | | 68,040 | | | (b) |
DIRECTV Holdings LLC/DIRECTV Financing Company Inc. | | | | | | | | | | |
| 4.45% | | 04/01/24 | | | 72,000 | | | | 73,957 | | | |
Dollar General Corp. | | | | | | | | | | |
| 1.88% | | 04/15/18 | | | 95,000 | | | | 94,086 | | | |
| | | | | | | | | | | | |
| | | | | Principal
Amount | | | Fair
Value | | | |
| 4.13% | | 07/15/17 | | $ | 94,000 | | | $ | 96,531 | | | |
| 4.15% | | 11/01/25 | | | 47,000 | | | | 46,721 | | | |
Dollar Tree Inc. | | | | | | | | | | |
| 5.75% | | 03/01/23 | | | 117,000 | | | | 121,972 | | | (b) |
Dominion Resources Inc. | | | | | | | | | | |
| 1.95% | | 08/15/16 | | | 154,000 | | | | 154,387 | | | |
Dr Pepper Snapple Group Inc. | | | | | | | | | | |
| 3.40% | | 11/15/25 | | | 94,000 | | | | 92,347 | | | |
Duke Energy Progress LLC | | | | | | | | | | |
| 4.15% | | 12/01/44 | | | 30,000 | | | | 29,299 | | | |
Eastman Chemical Co. | | | | | | | | | | |
| 3.60% | | 08/15/22 | | | 93,000 | | | | 92,596 | | | |
Ecopetrol S.A. | | | | | | | | | | |
| 5.88% | | 05/28/45 | | | 24,000 | | | | 17,040 | | | |
Electricite de France S.A. | | | | | | | | | | |
| 2.15% | | 01/22/19 | | | 193,000 | | | | 192,103 | | | (b) |
Eli Lilly & Co. | | | | | | | | | | |
| 3.70% | | 03/01/45 | | | 10,000 | | | | 9,353 | | | |
EMD Finance LLC | | | | | | | | | | |
| 3.25% | | 03/19/25 | | | 46,000 | | | | 43,619 | | | (b) |
Energizer Holdings Inc. | | | | | | | | | | |
| 5.50% | | 06/15/25 | | | 98,000 | | | | 92,120 | | | (b) |
Energy Transfer Equity LP | | | | | | | | | | |
| 5.88% | | 01/15/24 | | | 194,000 | | | | 158,110 | | | |
Energy Transfer Partners LP | | | | | | | | | | |
| 4.05% | | 03/15/25 | | | 19,000 | | | | 15,612 | | | |
| 5.15% | | 03/15/45 | | | 33,000 | | | | 23,327 | | | |
| 6.50% | | 02/01/42 | | | 62,000 | | | | 50,428 | | | |
Ensco PLC | | | | | | | | | | |
| 4.50% | | 10/01/24 | | | 46,000 | | �� | | 31,679 | | | |
| 5.20% | | 03/15/25 | | | 29,000 | | | | 20,648 | | | |
| 5.75% | | 10/01/44 | | | 17,000 | | | | 11,200 | | | |
Enterprise Products Operating LLC | | | | | | | | | | |
| 3.70% | | 02/15/26 | | | 95,000 | | | | 85,286 | | | |
Equinix Inc. | | | | | | | | | | |
| 5.88% | | 01/15/26 | | | 20,000 | | | | 20,600 | | | |
ERP Operating LP | | | | | | | | | | |
| 4.50% | | 07/01/44 | | | 19,000 | | | | 19,067 | | | |
European Investment Bank | | | | | | | | | | |
| 4.88% | | 01/17/17 | | | 150,000 | | | | 155,957 | | | |
FedEx Corp. | | | | | | | | | | |
| 3.20% | | 02/01/25 | | | 30,000 | | | | 29,203 | | | |
Five Corners Funding Trust | | | | | | | | | | |
| 4.42% | | 11/15/23 | | | 200,000 | | | | 208,819 | | | (b) |
Florida Power & Light Co. | | | | | | | | | | |
| 4.13% | | 02/01/42 | | | 92,000 | | | | 91,562 | | | |
Freeport-McMoRan Inc. | | | | | | | | | | |
| 4.55% | | 11/14/24 | | | 26,000 | | | | 14,885 | | | |
Fresenius Medical Care US Finance Inc. | | | | | | | | | | |
| 5.75% | | 02/15/21 | | | 123,000 | | | | 131,610 | | | (b) |
See Notes to Schedules of Investments and Notes to Financial Statements.
25
| | |
Elfun Diversified Fund | | December 31, 2015 |
| | | | | | | | | | | | |
| | | | | Principal
Amount | | | Fair
Value | | | |
Frontier Communications Corp. | | | | | | | | | | |
| 7.13% | | 03/15/19 | | $ | 110,000 | | | $ | 109,989 | | | |
| 11.00% | | 09/15/25 | | | 89,000 | | | | 88,110 | | | (b) |
General Motors Co. | | | | | | | | | | |
| 5.20% | | 04/01/45 | | | 9,000 | | | | 8,473 | | | |
General Motors Financial Company Inc. | | | | | | | | | | |
| 3.15% | | 01/15/20 | | | 66,000 | | | | 65,413 | | | |
| 3.20% | | 07/13/20 | | | 188,000 | | | | 185,105 | | | |
| 4.30% | | 07/13/25 | | | 94,000 | | | | 91,212 | | | |
Georgia-Pacific LLC | | | | | | | | | | |
| 3.60% | | 03/01/25 | | | 140,000 | | | | 138,448 | | | (b) |
Gilead Sciences Inc. | | | | | | | | | | |
| 2.55% | | 09/01/20 | | | 45,000 | | | | 45,004 | | | |
| 3.65% | | 03/01/26 | | | 50,000 | | | | 50,444 | | | |
| 4.80% | | 04/01/44 | | | 51,000 | | | | 51,161 | | | |
Halliburton Co. | | | | | | | | | | |
| 2.70% | | 11/15/20 | | | 47,000 | | | | 46,476 | | | |
| 3.80% | | 11/15/25 | | | 47,000 | | | | 45,794 | | | |
| 5.00% | | 11/15/45 | | | 28,000 | | | | 27,659 | | | |
HCA Inc. | | | | | | | | | | |
| 4.75% | | 05/01/23 | | | 160,000 | | | | 158,400 | | | |
| 6.50% | | 02/15/20 | | | 138,000 | | | | 150,351 | | | |
HSBC USA Inc. | | | | | | | | | | |
| 2.75% | | 08/07/20 | | | 141,000 | | | | 141,074 | | | |
Hyundai Capital America | | | | | | | | | | |
| 2.13% | | 10/02/17 | | | 35,000 | | | | 34,792 | | | (b) |
Illinois Tool Works Inc. | | | | | | | |
| 3.50% | | 03/01/24 | | | 95,000 | | | | 97,670 | | | |
Ingersoll-Rand Luxembourg Finance S.A. | | | | | | | | | | |
| 3.55% | | 11/01/24 | | | 65,000 | | | | 63,640 | | | |
Ingles Markets Inc. | | | | | | | |
| 5.75% | | 06/15/23 | | | 92,000 | | | | 91,770 | | | |
Intel Corp. | | | | | | | |
| 2.45% | | 07/29/20 | | | 47,000 | | | | 47,558 | | | |
Intelsat Jackson Holdings S.A. | | | | | | | | | | |
| 5.50% | | 08/01/23 | | | 96,000 | | | | 75,360 | | | |
Interstate Power & Light Co. | | | | | | | |
| 3.40% | | 08/15/25 | | | 150,000 | | | | 150,904 | | | |
Invesco Finance PLC | | | | | | | |
| 3.13% | | 11/30/22 | | | 107,000 | | | | 105,558 | | | |
JB Poindexter & Company Inc. | | | | | | | | | | |
| 9.00% | | 04/01/22 | | | 23,000 | | | | 24,035 | | | (b) |
JBS USA LLC/JBS USA Finance Inc. | | | | | | | | | | |
| 5.75% | | 06/15/25 | | | 78,000 | | | | 67,860 | | | (b) |
| 5.88% | | 07/15/24 | | | 53,000 | | | | 47,965 | | | (b) |
Jefferies Group LLC | | | | | | | | | | |
| 5.13% | | 01/20/23 | | | 83,000 | | | | 82,354 | | | |
| 6.50% | | 01/20/43 | | | 26,000 | | | | 24,038 | | | |
Johnson Controls Inc. | | | | | | | | | | |
| 4.63% | | 07/02/44 | | | 46,000 | | | | 38,985 | | | |
| | | | | | | | | | | | |
| | | | | Principal
Amount | | | Fair
Value | | | |
JPMorgan Chase & Co. | | | | | | | | | | |
| 2.55% | | 10/29/20 | | $ | 94,000 | | | $ | 93,163 | | | |
| 3.88% | | 09/10/24 | | | 190,000 | | | | 189,098 | | | |
| 5.00% | | 12/29/49 | | | 68,000 | | | | 64,600 | | | (i) |
| 6.10% | | 10/29/49 | | | 110,000 | | | | 110,561 | | | (i) |
KB Home | | | | | | | |
| 7.00% | | 12/15/21 | | | 116,000 | | | | 114,405 | | | |
Keysight Technologies Inc. | | | | | | | | | | |
| 4.55% | | 10/30/24 | | | 95,000 | | | | 91,336 | | | |
KFW | | | | | | | | | | |
| 2.00% | | 10/04/22 | | | 246,000 | | | | 242,033 | | | |
| 4.50% | | 07/16/18 | | | 102,000 | | | | 109,652 | | | |
Kinder Morgan Energy Partners LP | | | | | | | | | | |
| 3.50% | | 09/01/23 | | | 22,000 | | | | 18,251 | | | |
| 4.30% | | 05/01/24 | | | 50,000 | | | | 42,994 | | | |
Kinder Morgan Inc. | | | | | | | | | | |
| 3.05% | | 12/01/19 | | | 19,000 | | | | 17,591 | | | |
| 4.30% | | 06/01/25 | | | 38,000 | | | | 32,849 | | | |
| 5.55% | | 06/01/45 | | | 28,000 | | | | 21,866 | | | |
Kinross Gold Corp. | | | | | | | | | | |
| 6.88% | | 09/01/41 | | | 5,000 | | | | 2,740 | | | |
Kraft Heinz Foods Co. | | | | | | | |
| 2.80% | | 07/02/20 | | | 141,000 | | | | 140,669 | | | (b) |
| 3.95% | | 07/15/25 | | | 122,000 | | | | 123,181 | | | (b) |
L Brands Inc. | | | | | | | |
| 5.63% | | 02/15/22 | | | 102,000 | | | | 108,375 | | | |
L-3 Communications Corp. | | | | | | | | | | |
| 1.50% | | 05/28/17 | | | 65,000 | | | | 64,194 | | | |
Lee Enterprises Inc. | | | | | | | |
| 9.50% | | 03/15/22 | | | 78,000 | | | | 71,760 | | | (b) |
Lennar Corp. | | | | | | | | | | |
| 4.50% | | 11/15/19 | | | 118,000 | | | | 119,991 | | | |
| 4.75% | | 05/30/25 | | | 39,000 | | | | 38,123 | | | |
Levi Strauss & Co. | | | | | | | |
| 5.00% | | 05/01/25 | | | 59,000 | | | | 58,705 | | | |
Lockheed Martin Corp. | | | | | | | | | | |
| 2.50% | | 11/23/20 | | | 66,000 | | | | 65,768 | | | |
| 3.55% | | 01/15/26 | | | 94,000 | | | | 94,483 | | | |
| 3.80% | | 03/01/45 | | | 20,000 | | | | 17,715 | | | |
| 4.70% | | 05/15/46 | | | 21,000 | | | | 21,609 | | | |
Lowe’s Companies Inc. | | | | | | | | | | |
| 4.38% | | 09/15/45 | | | 35,000 | | | | 35,975 | | | |
LyondellBasell Industries N.V. | | | | | | | | | | |
| 4.63% | | 02/26/55 | | | 19,000 | | | | 15,408 | | | |
Marathon Petroleum Corp. | | | | | | | |
| 3.63% | | 09/15/24 | | | 95,000 | | | | 88,572 | | | |
Marsh & McLennan Companies Inc. | | | | | | | | | | |
| 3.50% | | 03/10/25 | | | 68,000 | | | | 66,983 | | | |
| 3.75% | | 03/14/26 | | | 65,000 | | | | 65,004 | | | |
Mattel Inc. | | | | | | | |
| 2.35% | | 05/06/19 | | | 143,000 | | | | 141,810 | | | |
See Notes to Schedules of Investments and Notes to Financial Statements.
26
| | |
Elfun Diversified Fund | | December 31, 2015 |
| | | | | | | | | | | | |
| | | | | Principal
Amount | | | Fair
Value | | | |
McDonald’s Corp. | | | | | | | | | | |
| 2.75% | | 12/09/20 | | $ | 25,000 | | | $ | 24,988 | | | |
| 3.70% | | 01/30/26 | | | 59,000 | | | | 58,966 | | | |
| 4.88% | | 12/09/45 | | | 20,000 | | | | 20,108 | | | |
Mead Johnson Nutrition Co. | | | | | | | |
| 3.00% | | 11/15/20 | | | 66,000 | | | | 66,010 | | | |
| 4.13% | | 11/15/25 | | | 66,000 | | | | 66,531 | | | |
Medtronic Inc. | | | | | | | |
| 2.50% | | 03/15/20 | | | 28,000 | | | | 28,206 | | | |
| 3.50% | | 03/15/25 | | | 187,000 | | | | 189,214 | | | |
| 4.63% | | 03/15/45 | | | 120,000 | | | | 123,723 | | | |
Memorial Sloan-Kettering Cancer Center | | | | | | | | | | |
| 4.13% | | 07/01/52 | | | 30,000 | | | | 27,985 | | | |
Merck & Company Inc. | | | | | | | |
| 2.75% | | 02/10/25 | | | 95,000 | | | | 92,492 | | | |
MetLife Inc. | | | | | | | |
| 3.60% | | 11/13/25 | | | 47,000 | | | | 47,362 | | | |
| 4.05% | | 03/01/45 | | | 24,000 | | | | 22,236 | | | |
| 4.72% | | 12/15/44 | | | 28,000 | | | | 28,595 | | | |
MGM Resorts International | | | | | | | | | | |
| 5.25% | | 03/31/20 | | | 59,000 | | | | 58,410 | | | |
| 6.63% | | 12/15/21 | | | 98,000 | | | | 100,327 | | | |
Microsoft Corp. | | | | | | | |
| 4.00% | | 02/12/55 | | | 45,000 | | | | 40,391 | | | |
Mid-America Apartments LP | | | | | | | | | | |
| 4.00% | | 11/15/25 | | | 47,000 | | | | 46,694 | | | |
Mizuho Bank Ltd. | | | | | | | |
| 2.45% | | 04/16/19 | | | 200,000 | | | | 200,146 | | | (b) |
Monsanto Co. | | | | | | | |
| 4.70% | | 07/15/64 | | | 27,000 | | | | 20,501 | | | |
Morgan Stanley | | | | | | | | | | |
| 2.65% | | 01/27/20 | | | 45,000 | | | | 44,893 | | | |
| 3.70% | | 10/23/24 | | | 145,000 | | | | 145,710 | | | |
| 3.95% | | 04/23/27 | | | 94,000 | | | | 91,274 | | | |
| 4.00% | | 07/23/25 | | | 46,000 | | | | 47,409 | | | |
| 4.10% | | 05/22/23 | | | 154,000 | | | | 155,684 | | | |
| 4.88% | | 11/01/22 | | | 10,000 | | | | 10,619 | | | |
| 5.00% | | 11/24/25 | | | 36,000 | | | | 38,238 | | | |
Motorola Solutions Inc. | | | | | | | |
| 4.00% | | 09/01/24 | | | 33,000 | | | | 28,641 | | | |
National Retail Properties Inc. | | | | | | | | | | |
| 4.00% | | 11/15/25 | | | 47,000 | | | | 46,178 | | | |
NCL Corporation Ltd. | | | | | | | |
| 4.63% | | 11/15/20 | | | 49,000 | | | | 47,982 | | | (b) |
Newfield Exploration Co. | | | | | | | | | | |
| 5.63% | | 07/01/24 | | | 36,000 | | | | 30,690 | | | |
| 5.75% | | 01/30/22 | | | 89,000 | | | | 78,765 | | | |
Newmont Mining Corp. | | | | | | | |
| 4.88% | | 03/15/42 | | | 37,000 | | | | 26,433 | | | |
Nexen Energy ULC | | | | | | | |
| 6.40% | | 05/15/37 | | | 41,000 | | | | 45,855 | | | |
| | | | | | | | | | | | |
| | | | | Principal
Amount | | | Fair
Value | | | |
NIKE Inc. | | | | | | | | | | |
| 3.88% | | 11/01/45 | | $ | 47,000 | | | $ | 45,321 | | | |
Noble Energy Inc. | | | | | | | |
| 3.90% | | 11/15/24 | | | 56,000 | | | | 49,870 | | | |
Northern States Power Co. | | | | | | | | | | |
| 2.20% | | 08/15/20 | | | 94,000 | | | | 93,366 | | | |
Northrop Grumman Corp. | | | | | | | | | | |
| 3.85% | | 04/15/45 | | | 11,000 | | | | 9,890 | | | |
Novartis Capital Corp. | | | | | | | |
| 3.00% | | 11/20/25 | | | 124,000 | | | | 122,238 | | | |
| 4.00% | | 11/20/45 | | | 62,000 | | | | 60,670 | | | |
NRG Energy Inc. | | | | | | | |
| 6.25% | | 07/15/22 | | | 59,000 | | | | 51,183 | | | |
Occidental Petroleum Corp. | | | | | | | | | | |
| 3.50% | | 06/15/25 | | | 94,000 | | | | 91,864 | | | |
Omnicom Group Inc. | | | | | | | | | | |
| 3.63% | | 05/01/22 | | | 31,000 | | | | 31,303 | | | |
Oracle Corp. | | | | | | | | | | |
| 2.25% | | 10/08/19 | | | 187,000 | | | | 189,019 | | | |
| 2.95% | | 05/15/25 | | | 95,000 | | | | 92,754 | | | |
| 4.13% | | 05/15/45 | | | 17,000 | | | | 16,090 | | | |
Owens & Minor Inc. | | | | | | | | | | |
| 3.88% | | 09/15/21 | | | 95,000 | | | | 94,630 | | | |
Pacific Gas & Electric Co. | | | | | | | | | | |
| 3.40% | | 08/15/24 | | | 140,000 | | | | 140,581 | | | |
PacifiCorp | | | | | | | | | | | | |
| 6.25% | | 10/15/37 | | | 132,000 | | | | 163,271 | | | |
Penn National Gaming Inc. | | | | | | | | | | |
| 5.88% | | 11/01/21 | | | 58,000 | | | | 56,260 | | | |
PepsiCo Inc. | | | | | | | | | | |
| 3.10% | | 07/17/22 | | | 24,000 | | | | 24,614 | | | |
| 4.25% | | 10/22/44 | | | 28,000 | | | | 27,783 | | | |
| 4.60% | | 07/17/45 | | | 28,000 | | | | 29,606 | | | |
Petrobras Global Finance BV | | | | | | | | | | |
| 3.50% | | 02/06/17 | | | 76,000 | | | | 71,060 | | | |
| 3.88% | | 01/27/16 | | | 34,000 | | | | 33,864 | | | |
Petroleos Mexicanos | | | | | | | | | | |
| 3.50% | | 01/30/23 | | | 41,000 | | | | 35,773 | | | |
Pfizer Inc. | | | | | | | | | | |
| 4.40% | | 05/15/44 | | | 29,000 | | | | 29,449 | | | |
Philip Morris International Inc. | | | | | | | | | | |
| 4.13% | | 03/04/43 | | | 39,000 | | | | 36,870 | | | |
Phillips 66 Partners LP | | | | | | | | | | |
| 2.65% | | 02/15/20 | | | 28,000 | | | | 26,428 | | | |
| 3.61% | | 02/15/25 | | | 47,000 | | | | 41,272 | | | |
Pitney Bowes Inc. | | | | | | | | | | |
| 4.63% | | 03/15/24 | | | 81,000 | | | | 79,388 | | | |
Plains All American Pipeline LP/PAA Finance Corp. | | | | | | | | | | |
| 4.65% | | 10/15/25 | | | 28,000 | | | | 24,456 | | | |
Precision Castparts Corp. | | | | | | | | | | |
| 4.38% | | 06/15/45 | | | 28,000 | | | | 28,056 | | | |
See Notes to Schedules of Investments and Notes to Financial Statements.
27
| | |
Elfun Diversified Fund | | December 31, 2015 |
| | | | | | | | | | | | |
| | | | | Principal
Amount | | | Fair
Value | | | |
Principal Financial Group Inc. | | | | | | | | | | |
| 4.70% | | 05/15/55 | | $ | 95,000 | | | $ | 94,430 | | | (i) |
Prologis LP | | | | | | | | | | |
| 3.75% | | 11/01/25 | | | 47,000 | | | | 46,622 | | | |
Prudential Financial Inc. | | | | | | | | | | |
| 5.38% | | 05/15/45 | | | 47,000 | | | | 46,941 | | | (i) |
| 5.63% | | 06/15/43 | | | 46,000 | | | | 47,035 | | | (i) |
Public Service Electric & Gas Co. | | | | | | | | | | |
| 2.38% | | 05/15/23 | | | 117,000 | | | | 112,092 | | | |
QUALCOMM Inc. | | | | | | | | | | |
| 2.25% | | 05/20/20 | | | 37,000 | | | | 36,657 | | | |
| 3.45% | | 05/20/25 | | | 34,000 | | | | 32,617 | | | |
| 4.80% | | 05/20/45 | | | 32,000 | | | | 28,445 | | | |
Quest Diagnostics Inc. | | | | | | | | | | |
| 4.70% | | 03/30/45 | | | 28,000 | | | | 25,214 | | | |
Regency Energy Partners LP/Regency Energy Finance Corp. | | | | | | | | | | |
| 4.50% | | 11/01/23 | | | 66,000 | | | | 57,126 | | | |
Revlon Consumer Products Corp. | | | | | | | | | | |
| 5.75% | | 02/15/21 | | | 152,000 | | | | 147,060 | | | |
| Reynolds American Inc. | | | | | | | | | | |
| 4.45% | | 06/12/25 | | | 28,000 | | | | 29,300 | | | |
Rio Tinto Finance USA Ltd. | | | | | | | | | | |
| 3.75% | | 06/15/25 | | | 24,000 | | | | 21,803 | | | |
Rogers Communications Inc. | | | | | | | | | | |
| 5.00% | | 03/15/44 | | | 30,000 | | | | 30,182 | | | |
Rowan Companies Inc. | | | | | | | | | | |
| 5.85% | | 01/15/44 | | | 19,000 | | | | 11,465 | | | |
Royal Bank of Canada | | | | | | | | | | |
| 1.20% | | 09/19/17 | | | 323,000 | | | | 321,491 | | | |
Ryder System Inc. | | | | | | | | | | |
| 2.45% | | 09/03/19 | | | 116,000 | | | | 114,316 | | | |
Schaeffler Holding Finance BV (6.25% Cash/7.00% PIK) | | | | | | | | | | |
| 6.25% | | 11/15/19 | | | 200,000 | | | | 209,000 | | | (b,n) |
Schaeffler Holding Finance BV (6.88% Cash/7.63% PIK) | | | | | | | | | | |
| 6.88% | | 08/15/18 | | | 200,000 | | | | 206,000 | | | (b,n) |
Schlumberger Holdings Corp. | | | | | | | | | | |
| 3.00% | | 12/21/20 | | | 128,000 | | | | 126,365 | | | (b) |
| 4.00% | | 12/21/25 | | | 85,000 | | | | 83,921 | | | (b) |
Sealed Air Corp. | | | | | | | | | | |
| 4.88% | | 12/01/22 | | | 59,000 | | | | 59,148 | | | (b) |
| 5.13% | | 12/01/24 | | | 59,000 | | | | 59,000 | | | (b) |
Shell International Finance BV | | | | | | | | | | |
| 2.25% | | 11/10/20 | | | 94,000 | | | | 92,590 | | | |
| 3.40% | | 08/12/23 | | | 141,000 | | | | 140,198 | | | |
Sinclair Television Group Inc. | | | | | | | | | | |
| 5.38% | | 04/01/21 | | | 103,000 | | | | 103,257 | | | |
Sinopec Capital 2013 Ltd. | | | | | | | | | | |
| 3.13% | | 04/24/23 | | | 200,000 | | | | 190,658 | | | (b) |
Southern California Edison Co. | | | | | | | | | | |
| 2.40% | | 02/01/22 | | | 35,000 | | | | 34,323 | | | |
| | | | | | | | | | | | |
| | | | | Principal
Amount | | | Fair
Value | | | |
Spectra Energy Partners LP | | | | | | | | | | |
| 4.75% | | 03/15/24 | | $ | 48,000 | | | $ | 46,518 | | | |
Sprint Corp. | | | | | | | | | | |
| 7.25% | | 09/15/21 | | | 52,000 | | | | 38,740 | | | |
| 7.63% | | 02/15/25 | | | 114,000 | | | | 83,220 | | | |
State Street Corp. | | | | | | | | | | |
| 3.55% | | 08/18/25 | | | 100,000 | | | | 103,160 | | | (e) |
Statoil ASA | | | | | | | | | | |
| 3.70% | | 03/01/24 | | | 42,000 | | | | 42,574 | | | |
| 3.95% | | 05/15/43 | | | 23,000 | | | | 20,775 | | | |
Sunoco LP/Sunoco Finance Corp. | | | | | | | | | | |
| 5.50% | | 08/01/20 | | | 39,000 | | | | 36,953 | | | (b) |
SUPERVALU Inc. | | | | | | | | | | |
| 6.75% | | 06/01/21 | | | 97,000 | | | | 87,785 | | | |
| T-Mobile USA Inc. | | | | | | | | | | |
| 6.25% | | 04/01/21 | | | 50,000 | | | | 51,625 | | | |
| 6.50% | | 01/15/26 | | | 29,000 | | | | 29,275 | | | |
| 6.63% | | 04/01/23 | | | 98,000 | | | | 99,960 | | | |
Tampa Electric Co. | | | | | | | | | | |
| 4.35% | | 05/15/44 | | | 47,000 | | | | 46,043 | | | |
Target Corp. | | | | | | | | | | |
| 3.50% | | 07/01/24 | | | 59,000 | | | | 61,244 | | | |
TD Ameritrade Holding Corp. | | | | | | | | | | |
| 2.95% | | 04/01/22 | | | 48,000 | | | | 47,578 | | | |
Teachers Insurance & Annuity Association of America | | | | | | | | | | |
| 4.90% | | 09/15/44 | | | 95,000 | | | | 95,955 | | | (b) |
Teck Resources Ltd. | | | | | | | | | | |
| 2.50% | | 02/01/18 | | | 27,000 | | | | 20,520 | | | |
| 3.15% | | 01/15/17 | | | 39,000 | | | | 35,100 | | | |
Tenet Healthcare Corp. | | | | | | | | | | |
| 4.75% | | 06/01/20 | | | 196,000 | | | | 196,980 | | | |
| 6.00% | | 10/01/20 | | | 96,000 | | | | 101,040 | | | |
The Allstate Corp. | | | | | | | | | | |
| 5.75% | | 08/15/53 | | | 52,000 | | | | 53,456 | | | (i) |
The Boeing Co. | | | | | | | | | | |
| 1.65% | | 10/30/20 | | | 47,000 | | | | 46,012 | | | |
| 2.60% | | 10/30/25 | | | 47,000 | | | | 45,500 | | | |
| 2.85% | | 10/30/24 | | | 140,000 | | | | 138,680 | | | |
The Coca-Cola Co. | | | | | | | | | | |
| 2.88% | | 10/27/25 | | | 94,000 | | | | 92,687 | | | |
The Dow Chemical Co. | | | | | | | | | | |
| 4.25% | | 10/01/34 | | | 43,000 | | | | 38,800 | | | |
The Goldman Sachs Group Inc. | | | | | | | | | | |
| 2.38% | | 01/22/18 | | | 92,000 | | | | 92,801 | | | |
| 2.60% | | 04/23/20 | | | 95,000 | | | | 94,784 | | | |
| 2.63% | | 01/31/19 | | | 53,000 | | | | 53,386 | | | |
| 2.90% | | 07/19/18 | | | 62,000 | | | | 63,213 | | | |
| 3.75% | | 05/22/25 | | | 78,000 | | | | 78,552 | | | |
| 4.00% | | 03/03/24 | | | 47,000 | | | | 48,265 | | | |
| 4.25% | | 10/21/25 | | | 82,000 | | | | 81,424 | | | |
| 4.80% | | 07/08/44 | | | 102,000 | | | | 101,316 | | | |
| 5.15% | | 05/22/45 | | | 47,000 | | | | 45,623 | | | |
See Notes to Schedules of Investments and Notes to Financial Statements.
28
| | |
Elfun Diversified Fund | | December 31, 2015 |
| | | | | | | | | | | | |
| | | | | Principal
Amount | | | Fair
Value | | | |
The Home Depot Inc. | | | | | | | | | | |
| 3.35% | | 09/15/25 | | $ | 66,000 | | | $ | 67,483 | | | |
The Korea Development Bank | | | | | | | | | | |
| 3.25% | | 03/09/16 | | | 122,000 | | | | 122,482 | | | |
The Kroger Co. | | | | | | | | | | |
| 2.95% | | 11/01/21 | | | 65,000 | | | | 64,370 | | | |
The Progressive Corp. | | | | | | | | | | |
| 3.70% | | 01/26/45 | | | 36,000 | | | | 32,581 | | | |
The Toronto-Dominion Bank | | | | | | | | | | |
| 2.50% | | 12/14/20 | | | 85,000 | | | | 84,962 | | | |
The Walt Disney Co. | | | | | | | | | | |
| 2.15% | | 09/17/20 | | | 31,000 | | | | 30,996 | | | |
| 3.15% | | 09/17/25 | | | 14,000 | | | | 14,161 | | | |
The Williams Companies Inc. | | | | | | | | | | |
| 8.75% | | 03/15/32 | | | 18,000 | | | | 13,569 | | | |
TIAA Asset Management Finance Company LLC | | | | | | | | | | |
| 4.13% | | 11/01/24 | | | 48,000 | | | | 48,189 | | | (b) |
Time Inc. | | | | | | | | | | |
| 5.75% | | 04/15/22 | | | 99,000 | | | | 90,585 | | | (b) |
Time Warner Cable Inc. | | | | | | | | | | |
| 4.50% | | 09/15/42 | | | 9,000 | | | | 7,063 | | | |
| 6.55% | | 05/01/37 | | | 28,000 | | | | 28,320 | | | |
Time Warner Inc. | | | | | | | | | | |
| 3.60% | | 07/15/25 | | | 102,000 | | | | 99,340 | | | |
| 3.88% | | 01/15/26 | | | 86,000 | | | | 85,293 | | | |
| 5.35% | | 12/15/43 | | | 85,000 | | | | 84,805 | | | |
Tyco Electronics Group S.A. | | | | | | | | | | |
| 2.35% | | 08/01/19 | | | 95,000 | | | | 94,689 | | | |
Tyco International Finance S.A. | | | | | | | | | | |
| 5.13% | | 09/14/45 | | | 30,000 | | | | 31,126 | | | |
Tyson Foods Inc. | | | | | | | | | | |
| 2.65% | | 08/15/19 | | | 48,000 | | | | 48,039 | | | |
| 3.95% | | 08/15/24 | | | 32,000 | | | | 32,857 | | | |
| 5.15% | | 08/15/44 | | | 32,000 | | | | 33,418 | | | |
U.S. Bancorp | | | | | | | | | | |
| 3.44% | | 02/01/16 | | | 118,000 | | | | 118,151 | | | |
| 5.13% | | 12/29/49 | | | 94,000 | | | | 94,442 | | | (i) |
Ultra Petroleum Corp. | | | | | | | | | | |
| 6.13% | | 10/01/24 | | | 99,000 | | | | 22,523 | | | (b) |
United Rentals North America Inc. | | | | | | | | | | |
| 6.13% | | 06/15/23 | | | 77,000 | | | | 78,732 | | | |
UnitedHealth Group Inc. | | | | | | | | | | |
| 2.70% | | 07/15/20 | | | 111,000 | | | | 112,206 | | | |
| 4.75% | | 07/15/45 | | | 74,000 | | | | 77,871 | | | |
Valeant Pharmaceuticals International Inc. | | | | | | | | | | |
| 6.13% | | 04/15/25 | | | 78,000 | | | | 69,615 | | | (b) |
| 6.38% | | 10/15/20 | | | 71,000 | | | | 68,515 | | | (b) |
Ventas Realty LP | | | | | | | | | | |
| 4.13% | | 01/15/26 | | | 40,000 | | | | 39,873 | | | |
| | | | | | | | | | | | |
| | | | | Principal
Amount | | | Fair
Value | | | |
Verizon Communications Inc. | | | | | | | | | | |
| 1.35% | | 06/09/17 | | $ | 230,000 | | | $ | 229,345 | | | |
| 3.50% | | 11/01/24 | | | 46,000 | | | | 45,457 | | | |
| 4.15% | | 03/15/24 | | | 93,000 | | | | 95,632 | | | |
| 4.40% | | 11/01/34 | | | 47,000 | | | | 43,364 | | | |
| 4.67% | | 03/15/55 | | | 32,000 | | | | 27,759 | | | |
| 4.86% | | 08/21/46 | | | 47,000 | | | | 44,465 | | | |
| 5.05% | | 03/15/34 | | | 29,000 | | | | 28,876 | | | |
| 5.15% | | 09/15/23 | | | 68,000 | | | | 74,762 | | | |
| 6.55% | | 09/15/43 | | | 32,000 | | | | 37,990 | | | |
Visa Inc. | | | | | | | | | | |
| 2.80% | | 12/14/22 | | | 60,000 | | | | 60,108 | | | |
| 3.15% | | 12/14/25 | | | 60,000 | | | | 60,127 | | | |
| 4.30% | | 12/14/45 | | | 28,000 | | | | 28,380 | | | |
Volkswagen Group of America Finance LLC | | | | | | | | | | |
| 2.13% | | 05/23/19 | | | 234,000 | | | | 222,062 | | | (b) |
W.R. Grace & Co. | | | | | | | | | | |
| 5.13% | | 10/01/21 | | | 35,000 | | | | 35,350 | | | (b) |
| 5.63% | | 10/01/24 | | | 98,000 | | | | 98,980 | | | (b) |
Wal-Mart Stores Inc. | | | | | | | | | | |
| 4.30% | | 04/22/44 | | | 88,000 | | | | 89,725 | | | |
Wells Fargo & Co. | | | | | | | | | | |
| 2.55% | | 12/07/20 | | | 85,000 | | | | 84,574 | | | |
| 3.00% | | 02/19/25 | | | 47,000 | | | | 45,719 | | | |
| 3.90% | | 05/01/45 | | | 47,000 | | | | 43,334 | | | |
| 4.10% | | 06/03/26 | | | 60,000 | | | | 60,570 | | | |
| 4.30% | | 07/22/27 | | | 38,000 | | | | 38,823 | | | |
| 5.88% | | 12/29/49 | | | 66,000 | | | | 69,465 | | | (i) |
| 5.90% | | 12/29/49 | | | 62,000 | | | | 62,542 | | | (i) |
Williams Partners LP | | | | | | | | | | |
| 5.40% | | 03/04/44 | | | 9,000 | | | | 6,030 | | | |
Windstream Services LLC | | | | | | | | | | |
| 6.38% | | 08/01/23 | | | 73,000 | | | | 52,560 | | | |
WMG Acquisition Corp. | | | | | | | | | | |
| 6.00% | | 01/15/21 | | | 20,000 | | | | 20,100 | | | (b) |
WPP Finance 2010 | | | | | | | | | | |
| 3.75% | | 09/19/24 | | | 95,000 | | | | 94,559 | | | |
WPX Energy Inc. | | | | | | | | | | |
| 5.25% | | 01/15/17 | | | 75,000 | | | | 70,125 | | | |
XLIT Ltd. | | | | | | | | | | |
| 5.25% | | 12/15/43 | | | 40,000 | | | | 41,366 | | | |
Zimmer Biomet Holdings Inc. | | | | | | | | | | |
| 3.55% | | 04/01/25 | | | 47,000 | | | | 45,696 | | | |
| | | | 30,359,517 | | | |
|
Non-Agency Collateralized Mortgage Obligations — 3.2% |
American Tower Trust I (REIT) | | | | | | | | | | |
| 1.55% | | 03/15/43 | | | 117,000 | | | | 114,267 | | | (b) |
Banc of America Commercial Mortgage Trust 2006-4 | | | | | | | | | | |
| 5.68% | | 07/10/46 | | | 30,000 | | | | 30,625 | | | |
See Notes to Schedules of Investments and Notes to Financial Statements.
29
| | |
Elfun Diversified Fund | | December 31, 2015 |
| | | | | | | | | | | | |
| | | | | Principal
Amount | | | Fair
Value | | | |
Banc of America Commercial Mortgage Trust 2007-1 | | | | | | | | | | |
| 5.48% | | 01/15/49 | | $ | 160,000 | | | $ | 163,836 | | | (i) |
Banc of America Commercial Mortgage Trust 2007-4 | | | | | | | | | | |
| 5.74% | | 02/10/51 | | | 17,177 | | | | 17,871 | | | (i) |
Banc of America Commercial Mortgage Trust 2008-1 | | | | | | | | | | |
| 6.22% | | 02/10/51 | | | 189,612 | | | | 200,801 | | | (i) |
Banc of America Merrill Lynch Commercial Mortgage Inc. 2005-1 | | | | | | | | | | |
| 5.34% | | 11/10/42 | | | 17,234 | | | | 17,215 | | | (i) |
Banc of America Merrill Lynch Commercial Mortgage Trust 2014-520M | | | | | | | | | | |
| 4.18% | | 08/15/46 | | | 38,035 | | | | 39,294 | | | (b,i) |
Bear Stearns Commercial Mortgage Securities Trust 2006-T22 | | | | | | | | | | |
| 5.62% | | 04/12/38 | | | 40,000 | | | | 40,270 | | | (i) |
Bear Stearns Commercial Mortgage Securities Trust 2007-PW18 | | | | | | | | | | |
| 6.09% | | 06/11/50 | | | 80,000 | | | | 84,895 | | | (i) |
Citigroup Commercial Mortgage Trust 2014-GC23 | | | | | | | | | | |
| 4.51% | | 07/10/47 | | | 192,000 | | | | 160,132 | | | (b,i) |
Citigroup Commercial Mortgage Trust 2015-GC33 | | | | | | | | | | |
| 3.17% | | 09/10/58 | | | 39,319 | | | | 27,478 | | | |
Citigroup Commercial Mortgage Trust 2015-P1 | | | | | | | | | | |
| 3.72% | | 09/15/48 | | | 161,993 | | | | 165,080 | | | |
COMM 2014-CR14 Mortgage Trust | | | | | | | | | | |
| 4.53% | | 02/10/47 | | | 55,000 | | | | 59,008 | | | (i) |
COMM 2014-CR19 Mortgage Trust | | | | | | | | | | |
| 4.72% | | 08/10/47 | | | 100,000 | | | | 86,502 | | | (b,i) |
COMM 2014-CR20 Mortgage Trust | | | | | | | | | | |
| 4.51% | | 11/10/47 | | | 48,472 | | | | 47,110 | | | (i) |
COMM 2014-CR21 Mortgage Trust | | | | | | | | | | |
| 3.99% | | 12/10/47 | | | 93,831 | | | | 96,582 | | | |
COMM 2015-CR23 Mortgage Trust | | | | | | | | | | |
| 4.26% | | 05/10/48 | | | 46,009 | | | | 42,392 | | | (i) |
COMM 2015-CR24 Mortgage Trust | | | | | | | | | | |
| 3.46% | | 08/10/55 | | | 100,000 | | | | 74,125 | | | |
| 3.70% | | 08/10/55 | | | 78,578 | | | | 79,860 | | | |
| 4.37% | | 08/10/55 | | | 70,790 | | | | 67,398 | | | (i) |
| | | | | | | | | | | | |
| | | | | Principal
Amount | | | Fair
Value | | | |
COMM 2015-LC19 Mortgage Trust | | | | | | | | | | |
| 2.87% | | 02/10/48 | | $ | 104,000 | | | $ | 77,385 | | | (b) |
COMM 2015-PC1 Mortgage Trust | | | | | | | | | | |
| 4.44% | | 07/10/50 | | | 46,053 | | | | 45,848 | | | (i) |
Core Industrial Trust 2015-CALW | | | | | | | | | | |
| 3.25% | | 02/10/34 | | | 100,000 | | | | 99,400 | | | (b) |
Credit Suisse Commercial Mortgage Trust 2006-C1 | | | | | | | | | | |
| 5.46% | | 02/15/39 | | | 114,614 | | | | 114,514 | | | (i) |
CSAIL 2015-C3 Commercial Mortgage Trust | | | | | | | | | | |
| 3.36% | | 08/15/48 | | | 47,194 | | | | 34,116 | | | (i) |
| 4.11% | | 08/15/48 | | | 62,926 | | | | 61,638 | | | (i) |
GS Mortgage Securities Trust 2011-GC5 | | | | | | | | | | |
| 3.00% | | 08/10/44 | | | 78,834 | | | | 79,228 | | | |
| 5.31% | | 08/10/44 | | | 30,000 | | | | 33,052 | | | (b,i) |
GS Mortgage Securities Trust 2014-GC20 | | | | | | | | | | |
| 4.26% | | 04/10/47 | | | 50,000 | | | | 52,248 | | | |
GS Mortgage Securities Trust 2014-NEW | | | | | | | | | | |
| 3.79% | | 01/10/31 | | | 100,000 | | | | 99,823 | | | (b) |
GS Mortgage Securities Trust 2015-GC28 | | | | | | | | | | |
| 1.17% | | 02/10/48 | | | 993,504 | | | | 68,108 | | | (g,i) |
GS Mortgage Securities Trust 2015-GC32 | | | | | | | | | | |
| 3.35% | | 07/10/48 | | | 43,241 | | | | 31,495 | | | |
| 4.41% | | 07/10/48 | | | 20,300 | | | | 19,540 | | | (i) |
GS Mortgage Securities Trust 2015-GC34 | | | | | | | | | | |
| 2.98% | | 10/10/48 | | | 103,476 | | | | 71,848 | | | |
GS Mortgage Securities Trust 2015-GS1 | | | | | | | | | | |
| 3.27% | | 11/10/48 | | | 113,380 | | | | 82,047 | | | |
JP Morgan Chase Commercial Mortgage Securities Trust 2007-CB18 | | | | | | | | | | |
| 5.44% | | 06/12/47 | | | 90,156 | | | | 92,317 | | | |
JPMBB Commercial Mortgage Securities Trust 2013-C12 | | | | | | | | | | |
| 4.03% | | 07/15/45 | | | 25,000 | | | | 25,981 | | | (i) |
JPMBB Commercial Mortgage Securities Trust 2013-C15 | | | | | | | | | | |
| 5.08% | | 11/15/45 | | | 40,000 | | | | 41,590 | | | (i) |
JPMBB Commercial Mortgage Securities Trust 2013-C17 | | | | | | | | | | |
| 4.89% | | 01/15/47 | | | 71,000 | | | | 71,633 | | | (i) |
JPMBB Commercial Mortgage Securities Trust 2014-C18 | | | | | | | | | | |
| 4.81% | | 02/15/47 | | | 50,000 | | | | 49,901 | | | (i) |
See Notes to Schedules of Investments and Notes to Financial Statements.
30
| | |
Elfun Diversified Fund | | December 31, 2015 |
| | | | | | | | | | | | |
| | | | | Principal
Amount | | | Fair
Value | | | |
JPMBB Commercial Mortgage Securities Trust 2015-C29 | | | | | | | | | | |
| 3.70% | | 05/15/48 | | $ | 85,183 | | | $ | 63,584 | | | (i) |
JPMBB Commercial Mortgage Securities Trust 2015-C30 | | | | | | | | | | |
| 4.31% | | 07/15/48 | | | 78,620 | | | | 69,993 | | | (i) |
JPMBB Commercial Mortgage Securities Trust 2015-C31 | | | | | | | | | | |
| 3.80% | | 08/15/48 | | | 117,952 | | | | 120,607 | | | |
LB-UBS Commercial Mortgage
Trust 2004-C8 | | | | | | | | | | |
| 0.47% | | 12/15/39 | | | 27,238 | | | | 141 | | | (b,g,i) |
LB-UBS Commercial Mortgage
Trust 2006-C4 | | | | | | | | | | |
| 5.82% | | 06/15/38 | | | 24,769 | | | | 24,986 | | | (i) |
LB-UBS Commercial Mortgage
Trust 2007-C6 | | | | | | | | | | |
| 6.11% | | 07/15/40 | | | 120,000 | | | | 125,327 | | | (b) |
| 6.11% | | 07/15/40 | | | 52,305 | | | | 54,623 | | | (i) |
MASTR Alternative Loan Trust 2003-5 | | | | | | | | | | |
| 5.00% | | 08/25/18 | | | 4,430 | | | | 184 | | | (g) |
ML-CFC Commercial Mortgage
Trust 2006-3 | | | | | | | | | | |
| 5.46% | | 07/12/46 | | | 110,000 | | | | 111,802 | | | (i) |
Morgan Stanley Bank of America
Merrill Lynch Trust 2013-C10 | | | | | | | | | | |
| 4.08% | | 07/15/46 | | | 89,000 | | | | 86,549 | | | (i) |
Morgan Stanley Bank of America
Merrill Lynch Trust 2014-C15 | | | | | | | | | | |
| 4.90% | | 04/15/47 | | | 200,000 | | | | 181,397 | | | (b,i) |
Morgan Stanley Bank of America
Merrill Lynch Trust 2014-C18 | | | | | | | | | | |
| 3.39% | | 10/15/47 | | | 100,000 | | | | 77,087 | | | (b) |
Morgan Stanley Bank of America
Merrill Lynch Trust 2014-C19 | | | | | | | | | | |
| 3.25% | | 12/15/47 | | | 100,000 | | | | 74,448 | | | (b) |
Morgan Stanley Bank of America
Merrill Lynch Trust 2015-C20 | | | | | | | | | | |
| 1.42% | | 02/15/48 | | | 728,361 | | | | 62,888 | | | (g,i) |
Morgan Stanley Bank of America
Merrill Lynch Trust 2015-C21 | | | | | | | | | | |
| 0.99% | | 03/15/48 | | | 869,643 | | | | 56,077 | | | (g,i) |
Morgan Stanley Bank of America
Merrill Lynch Trust 2015-C22 | | | | | | | | | | |
| 3.88% | | 04/15/48 | | | 82,660 | | | | 80,736 | | | (i) |
| 4.24% | | 04/15/48 | | | 206,915 | | | | 167,966 | | | (b,i) |
Morgan Stanley Bank of America
Merrill Lynch Trust 2015-C23 | | | | | | | | | | |
| 4.14% | | 07/15/50 | | | 203,800 | | | | 164,883 | | | (b,i) |
Morgan Stanley Bank of America
Merrill Lynch Trust 2015-C24 | | | | | | | | | | |
| 3.73% | | 05/15/48 | | | 183,686 | | | | 187,292 | | | |
| 4.35% | | 05/15/48 | | | 157,312 | | | | 155,864 | | | (i) |
| | | | | | | | | | | | |
| | | | | Principal
Amount | | | Fair
Value | | | |
Morgan Stanley Capital I Trust 2005-T17 | | | | | | | | | | |
| 4.84% | | 12/13/41 | | $ | 11,802 | | | $ | 11,845 | | | (i) |
Morgan Stanley Capital I
Trust 2006-IQ11 | | | | | | | | | | |
| 5.78% | | 10/15/42 | | | 40,000 | | | | 39,971 | | | (i) |
Morgan Stanley Capital I Trust 2006-T21 | | | | | | | | | | |
| 5.27% | | 10/12/52 | | | 40,336 | | | | 40,313 | | | (i) |
Morgan Stanley Capital I Trust 2006-T23 | | | | | | | | | | |
| 5.85% | | 08/12/41 | | | 24,983 | | | | 25,158 | | | (i) |
Morgan Stanley Capital I
Trust 2007-IQ16 | | | | | | | | | | |
| 6.05% | | 12/12/49 | | | 80,000 | | | | 83,879 | | | (i) |
Morgan Stanley Capital I Trust 2008-T29 | | | | | | | | | | |
| 6.27% | | 01/11/43 | | | 50,000 | | | | 53,570 | | | (i) |
Morgan Stanley Capital I Trust 2015-MS1 | | | | | | | | | | |
| 4.03% | | 05/15/48 | | | 100,000 | | | | 78,562 | | | (b,i) |
Morgan Stanley Capital I Trust 2015-UBS8 | | | | | | | | | | |
| 3.81% | | 12/15/48 | | | 171,169 | | | | 174,089 | | | |
Wells Fargo Commercial Mortgage
Trust 2015-C26 | | | | | | | | | | |
| 1.41% | | 02/15/48 | | | 990,077 | | | | 85,346 | | | (g,i) |
Wells Fargo Commercial Mortgage
Trust 2015-C29 | | | | | | | | | | |
| 4.01% | | 06/15/48 | | | 138,309 | | | | 141,047 | | | |
| 4.22% | | 06/15/48 | | | 64,245 | | | | 50,475 | | | (i) |
Wells Fargo Commercial Mortgage
Trust 2015-C30 | | | | | | | | | | |
| 4.50% | | 09/15/58 | | | 39,326 | | | | 31,986 | | | (b,i) |
Wells Fargo Commercial Mortgage
Trust 2015-C31 | | | | | | | | | | |
| 3.70% | | 11/15/48 | | | 78,643 | | | | 79,739 | | | |
Wells Fargo Commercial Mortgage
Trust 2015-LC22 | | | | | | | | | | |
| 4.54% | | 09/15/58 | | | 39,338 | | | | 32,153 | | | (i) |
Wells Fargo Commercial Mortgage
Trust 2015-NXS2 | | | | | | | | | | |
| 4.25% | | 07/15/58 | | | 39,311 | | | | 30,972 | | | (i) |
Wells Fargo Commercial Mortgage Trust 2015-P2 | | | | | | | | | | |
| 4.90% | | 12/15/48 | | | 199,241 | | | | 194,868 | | | (i) |
Wells Fargo Commercial Mortgage Trust 2015-SG1 | | | | | | | | | | |
| 3.79% | | 12/15/47 | | | 102,189 | | | | 104,514 | | | |
| 4.47% | | 12/15/47 | | | 39,317 | | | | 37,050 | | | (i) |
See Notes to Schedules of Investments and Notes to Financial Statements.
31
| | |
Elfun Diversified Fund | | December 31, 2015 |
| | | | | | | | | | | | |
| | | | | Principal
Amount | | | Fair
Value | | | |
WFRBS Commercial Mortgage Trust 2013-C17 | | | | | | | | | | |
| 4.26% | | 12/15/46 | | $ | 55,000 | | | $ | 58,137 | | | |
| 5.13% | | 12/15/46 | | | 40,000 | | | | 38,080 | | | (b,i) |
WFRBS Commercial Mortgage Trust 2013-C18 | | | | | | | | | | |
| 4.67% | | 12/15/46 | | | 47,667 | | | | 44,304 | | | (b,i) |
WFRBS Commercial Mortgage Trust 2014-C19 | | | | | | | | | | |
| 4.23% | | 03/15/47 | | | 78,742 | | | | 66,103 | | | (b) |
| 4.72% | | 03/15/47 | | | 65,000 | | | | 68,103 | | | (i) |
WFRBS Commercial Mortgage Trust 2014-C22 | | | | | | | | | | |
| 3.91% | | 09/15/57 | | | 124,695 | | | | 100,597 | | | (b,i) |
WFRBS Commercial Mortgage Trust 2014-C24 | | | | | | | | | | |
| 3.69% | | 11/15/47 | | | 156,648 | | | | 120,436 | | | (b) |
WFRBS Commercial Mortgage Trust 2014-C25 | | | | | | | | | | |
| 3.80% | | 11/15/47 | | | 23,000 | | | | 17,591 | | | (b,i) |
WFRBS Commercial Mortgage Trust 2014-LC14 | | | | | | | | | | |
| 4.35% | | 03/15/47 | | | 123,000 | | | | 129,792 | | | (i) |
| 4.59% | | 03/15/47 | | | 130,681 | | | | 111,893 | | | (b,i) |
WFRBS Commercial Mortgage Trust 2015-C31 | | | | | | | | | | |
| 3.85% | | 11/15/48 | | | 19,659 | | | | 14,443 | | | |
| | | | 6,797,903 | | | |
| | | |
Sovereign Bonds — 0.4% | | | | | | | | | | |
Government of Argentina | | | | | | | | | | |
| 2.50% | | 12/31/38 | | | 9 | | | | 6 | | | (o) |
Government of Colombia | | | | | | | | | | |
| 2.63% | | 03/15/23 | | | 200,000 | | | | 175,700 | | | |
Government of Mexico | | | | | | | | | | |
| 3.60% | | 01/30/25 | | | 205,000 | | | | 199,772 | | | |
| 4.00% | | 10/02/23 | | | 46,000 | | | | 46,598 | | | |
| 4.75% | | 03/08/44 | | | 176,000 | | | | 160,336 | | | |
Government of Peru | | | | | | | | | | |
| 4.13% | | 08/25/27 | | | 27,000 | | | | 26,460 | | | |
| 5.63% | | 11/18/50 | | | 15,000 | | | | 15,300 | | | |
Government of Turkey | | | | | | | | | | |
| 3.25% | | 03/23/23 | | | 200,000 | | | | 183,211 | | | |
| | | | 807,383 | | | |
| | |
Municipal Bonds and Notes — 0.2% | | | | | | | |
American Municipal Power Inc. | | | | | | | | | | |
| 6.27% | | 02/15/50 | | | 50,000 | | | | 58,146 | | | |
Municipal Electric Authority of Georgia | | | | | | | | | | |
| 6.64% | | 04/01/57 | | | 54,000 | | | | 64,806 | | | |
New Jersey Transportation Trust Fund Authority | | | | | | | | | | |
| 6.88% | | 12/15/39 | | | 15,000 | | | | 15,719 | | | |
| | | | | | | | | | | | |
| | | | | Principal
Amount | | | Fair
Value | | | |
Port Authority of New York & New Jersey | | | | | | | | | | |
| 4.46% | | 10/01/62 | | $ | 95,000 | | | $ | 91,302 | | | |
South Carolina State Public Service Authority | | | | | | | | | | |
| 6.45% | | 01/01/50 | | | 40,000 | | | | 50,103 | | | |
State of California | | | | | | | | | | |
| 5.70% | | 11/01/21 | | | 55,000 | | | | 64,520 | | | |
State of Illinois | | | | | | | | | | |
| 5.10% | | 06/01/33 | | | 30,000 | | | | 28,370 | | | |
| | | | 372,966 | | | |
| | | |
FNMA (TBA) — 0.0%* | | | | | | | | | | |
| | | |
Lehman TBA | | | | | | | | | | |
| 5.50% | | TBA | | | 38,818 | | | | 2,135 | | | (o,q) |
| | | |
Total Bonds and Notes
(Cost $66,388,778) | | | | | | | 65,469,789 | | | |
| | | | | | | | | | | | |
| | | | | Number
of Shares | | | Fair
Value | | | |
Exchange Traded Funds — 4.6% |
| | | |
Financial Select Sector SPDR Fund | | | 8,884 | | | $ | 211,262 | | | (p) |
Industrial Select Sector SPDR Fund | | | 16,195 | | | | 858,497 | | | (p) |
Vanguard FTSE Emerging Markets ETF | | | 262,019 | | | | 8,570,641 | | | |
| | | |
Total Exchange Traded Funds
(Cost $10,768,050) | | | | | | | 9,640,400 | | | |
| | | |
Total Investments in Securities
(Cost $178,343,016) | | | | | | | 184,123,143 | | | |
| | | | | | | | | | | | |
Short-Term Investments — 13.6% |
| | | |
State Street Institutional U.S. Government Money Market Fund — Premier Class | | | | | | | | | | |
0.09% | | | | | | $ | 28,561,801 | | | (d,h,p) |
(Cost $28,561,801) | | | | | | | | | | |
| | | |
Total Investments
(Cost $206,904,817) | | | | | | | 212,684,944 | | | |
| | | |
Liabilities in Excess of Other
Assets, net — (1.4)% | | | | | | | (2,996,687 | ) | | |
| | | | | | | | | | | | |
| | | |
NET ASSETS — 100.0% | | | | | | $ | 209,688,257 | | | |
| | | | | | | | | | | | |
| | | | | | | | | | | | |
See Notes to Schedules of Investments and Notes to Financial Statements.
32
| | |
Elfun Diversified Fund | | December 31, 2015 |
Centrally Cleared Credit Default Swaps – Sell Protection
| | | | | | | | | | | | | | | | | | | | | | | | | | | | | | | | |
Reference Entity | | Counterparty | | Notional
Amount
(000s
omitted) | | Contract
annual
Fixed Rate | | Termination
Date | | Market
Value | | Unamortized
Upfront
Payments
Received | | Unrealized
Appreciation |
Markit CDX North America High Yield Index | | CME Group Inc. | | | $ | 700 | | | | | 5.00 | % | | | | 12/20/20 | | | | $ | 8,982 | | | | $ | (3,746 | ) | | | $ | 12,728 | |
The Fund had the following long futures contracts open at December 31, 2015:
| | | | | | | | | | | | | | | | | |
| Description | | Expiration
date | | Number
of
Contracts | | Current
Notional
Value | | Unrealized
Appreciation
(Depreciation) |
EURO Stoxx 50 Index Futures | | March 2016 | | | | 23 | | | | $ | 820,005 | | | | $ | 4,682 | |
FTSE 100 Index Futures | | March 2016 | | | | 3 | | | | | 274,057 | | | | | 7,177 | |
S&P 500 Emini Index Futures | | March 2016 | | | | 13 | | | | | 1,323,010 | | | | | 14,584 | |
S&P Mid 400 Emini Index Futures | | March 2016 | | | | 46 | | | | | 6,410,100 | | | | | 93,447 | |
Topix Index Futures | | March 2016 | | | | 4 | | | | | 514,568 | | | | | 8,571 | |
U.S. Long Bond Futures | | March 2016 | | | | 3 | | | | | 461,250 | | | | | (6,663 | ) |
Ultra Long-Term U.S. Treasury Bond Futures | | March 2016 | | | | 6 | | | | | 952,125 | | | | | 2,705 | |
2 Yr. U.S. Treasury Notes Futures | | March 2016 | | | | 29 | | | | | 6,299,797 | | | | | (13,253 | ) |
5 Yr. U.S. Treasury Notes Futures | | March 2016 | | | | 9 | | | | | 1,064,883 | | | | | (3,485 | ) |
| | | | | | | | | | | | | | | | | |
| | | | | | | | | | $ | 107,765 | |
| | | | | | | | | | | | | | | | | |
The Fund had the following short futures contracts open at December 31, 2015:
| | | | | | | | | | | | | | | | | |
| Description | | Expiration
date | | Number
of
Contracts | | Current
Notional
Value | | Unrealized
Appreciation
(Depreciation) |
S&P 500 Emini Index Futures | | March 2016 | | | | 45 | | | | $ | (4,579,650 | ) | | | $ | (58,159 | ) |
10 Yr. U.S. Treasury Notes Futures | | March 2016 | | | | 70 | | | | | (8,813,438 | ) | | | | 57,119 | |
| | | | | | | | | | | | | | | | | |
| | | | | | | | | | $ | (1,040 | ) |
| | | | | | | | | | | | | | | | | |
| | | | | | | | | | $ | 106,725 | |
| | | | | | | | | | | | | | | | | |
The Fund was invested in the following countries/territories at December 31, 2015:
| | | | | |
| Country/Territory | | Percentage
(based on Fair Value) |
United States | | | | 76.44% | |
Japan | | | | 5.54% | |
United Kingdom | | | | 3.08% | |
France | | | | 2.81% | |
Germany | | | | 2.14% | |
Switzerland | | | | 1.79% | |
Canada | | | | 0.99% | |
Sweden | | | | 0.98% | |
China | | | | 0.91% | |
Ireland | | | | 0.85% | |
Netherlands | | | | 0.80% | |
Hong Kong | | | | 0.47% | |
India | | | | 0.39% | |
Belgium | | | | 0.39% | |
Mexico | | | | 0.29% | |
Taiwan | | | | 0.28% | |
Luxembourg | | | | 0.28% | |
Australia | | | | 0.27% | |
Italy | | | | 0.27% | |
South Korea | | | | 0.25% | |
Norway | | | | 0.24% | |
Supranational | | | | 0.13% | |
Spain | | | | 0.12% | |
Colombia | | | | 0.09% | |
Turkey | | | | 0.09% | |
Brazil | | | | 0.05% | |
Bermuda | | | | 0.02% | |
Peru | | | | 0.02% | |
Cayman Islands | | | | 0.02% | |
Argentina | | | | 0.00% | ** |
| | | | | |
| | | | 100.00% | |
| | | | | |
See Notes to Schedules of Investments and Notes to Financial Statements.
33
| | |
Elfun Diversified Fund | | December 31, 2015 |
The Fund’s % share of investment in the various categories, based on Fair Value, is as follows at December 31, 2015 (unaudited):
| | | | | | | | | | | | | | | |
| Industry | | Domestic | | Foreign | | Total |
Diversified Banks | | | | 2.30% | | | | | 2.54% | | | | | 4.84% | |
Pharmaceuticals | | | | 2.86% | | | | | 1.71% | | | | | 4.57% | |
Exchange Traded Funds | | | | 4.53% | | | | | 0.00% | | | | | 4.53% | |
Internet Software & Services | | | | 1.79% | | | | | 0.79% | | | | | 2.58% | |
Integrated Oil & Gas | | | | 1.49% | | | | | 0.76% | | | | | 2.25% | |
Healthcare Equipment | | | | 0.88% | | | | | 1.02% | | | | | 1.90% | |
Biotechnology | | | | 1.83% | | | | | 0.00% | | | | | 1.83% | |
Communications Equipment | | | | 1.26% | | | | | 0.33% | | | | | 1.59% | |
Aerospace & Defense | | | | 1.10% | | | | | 0.47% | | | | | 1.57% | |
Technology Hardware, Storage & Peripherals | | | | 1.30% | | | | | 0.18% | | | | | 1.48% | |
Cable & Satellite | | | | 1.47% | | | | | 0.00% | | | | | 1.47% | |
Asset Management & Custody Banks | | | | 1.37% | | | | | 0.00% | | | | | 1.37% | |
Multi-Line Insurance | | | | 0.66% | | | | | 0.32% | | | | | 0.98% | |
Life & Health Insurance | | | | 0.16% | | | | | 0.81% | | | | | 0.97% | |
Industrial Machinery | | | | 0.43% | | | | | 0.48% | | | | | 0.91% | |
Movies & Entertainment | | | | 0.70% | | | | | 0.19% | | | | | 0.89% | |
Property & Casualty Insurance | | | | 0.00% | | | | | 0.86% | | | | | 0.86% | |
Electronic Equipment & Instruments | | | | 0.00% | | | | | 0.79% | | | | | 0.79% | |
Diversified Real Estate Activities | | | | 0.00% | | | | | 0.75% | | | | | 0.75% | |
Packaged Foods & Meats | | | | 0.37% | | | | | 0.36% | | | | | 0.73% | |
Automobile Manufacturers | | | | 0.20% | | | | | 0.53% | | | | | 0.73% | |
Internet Retail | | | | 0.51% | | | | | 0.21% | | | | | 0.72% | |
Oil & Gas Equipment & Services | | | | 0.45% | | | | | 0.26% | | | | | 0.71% | |
Wireless Telecommunication Services | | | | 0.00% | | | | | 0.71% | | | | | 0.71% | |
Specialized Finance | | | | 0.70% | | | | | 0.00% | | | | | 0.70% | |
Specialized REITs | | | | 0.69% | | | | | 0.00% | | | | | 0.69% | |
Semiconductor Equipment | | | | 0.37% | | | | | 0.32% | | | | | 0.69% | |
Data Processing & Outsourced Services | | | | 0.69% | | | | | 0.00% | | | | | 0.69% | |
Auto Parts & Equipment | | | | 0.00% | | | | | 0.68% | | | | | 0.68% | |
Soft Drinks | | | | 0.68% | | | | | 0.00% | | | | | 0.68% | |
Electrical Components & Equipment | | | | 0.00% | | | | | 0.67% | | | | | 0.67% | |
Home Improvement Retail | | | | 0.58% | | | | | 0.00% | | | | | 0.58% | |
Systems Software | | | | 0.53% | | | | | 0.00% | | | | | 0.53% | |
Application Software | | | | 0.25% | | | | | 0.24% | | | | | 0.49% | |
Airlines | | | | 0.35% | | | | | 0.13% | | | | | 0.48% | |
Building Products | | | | 0.00% | | | | | 0.47% | | | | | 0.47% | |
Consumer Finance | | | | 0.46% | | | | | 0.00% | | | | | 0.46% | |
Research & Consulting Services | | | | 0.43% | | | | | 0.00% | | | | | 0.43% | |
Specialty Chemicals | | | | 0.00% | | | | | 0.43% | | | | | 0.43% | |
Oil & Gas Exploration & Production | | | | 0.41% | | | | | 0.00% | | | | | 0.41% | |
Brewers | | | | 0.00% | | | | | 0.39% | | | | | 0.39% | |
Investment Banking & Brokerage | | | | 0.34% | | | | | 0.00% | | | | | 0.34% | |
Electric Utilities | | | | 0.23% | | | | | 0.11% | | | | | 0.34% | |
General Merchandise Stores | | | | 0.31% | | | | | 0.00% | | | | | 0.31% | |
Healthcare Services | | | | 0.00% | | | | | 0.30% | | | | | 0.30% | |
Railroads | | | | 0.06% | | | | | 0.24% | | | | | 0.30% | |
Fertilizers & Agricultural Chemicals | | | | 0.30% | | | | | 0.00% | | | | | 0.30% | |
Semiconductors | | | | 0.00% | | | | | 0.28% | | | | | 0.28% | |
Agricultural Products | | | | 0.28% | | | | | 0.00% | | | | | 0.28% | |
| | | | | | | | | | | | | | | |
| Industry | | Domestic | | Foreign | | Total |
Multi-Utilities | | | | 0.26% | | | | | 0.00% | | | | | 0.26% | |
Trading Companies & Distributors | | | | 0.25% | | | | | 0.00% | | | | | 0.25% | |
Advertising | | | | 0.00% | | | | | 0.24% | | | | | 0.24% | |
Healthcare Distributors | | | | 0.23% | | | | | 0.00% | | | | | 0.23% | |
Construction Materials | | | | 0.00% | | | | | 0.23% | | | | | 0.23% | |
Household Products | | | | 0.09% | | | | | 0.13% | | | | | 0.22% | |
Personal Products | | | | 0.00% | | | | | 0.22% | | | | | 0.22% | |
Electronic Components | | | | 0.00% | | | | | 0.21% | | | | | 0.21% | |
Industrial Gases | | | | 0.00% | | | | | 0.21% | | | | | 0.21% | |
Healthcare Supplies | | | | 0.19% | | | | | 0.00% | | | | | 0.19% | |
Integrated Telecommunication Services | | | | 0.19% | | | | | 0.00% | | | | | 0.19% | |
Apparel, Accessories & Luxury Goods | | | | 0.00% | | | | | 0.18% | | | | | 0.18% | |
Apparel Retail | | | | 0.00% | | | | | 0.15% | | | | | 0.15% | |
Security & Alarm Services | | | | 0.00% | | | | | 0.14% | | | | | 0.14% | |
IT Consulting & Other Services | | | | 0.12% | | | | | 0.00% | | | | | 0.12% | |
Air Freight & Logistics | | | | 0.11% | | | | | 0.00% | | | | | 0.11% | |
Leisure Products | | | | 0.00% | | | | | 0.11% | | | | | 0.11% | |
Casinos & Gaming | | | | 0.11% | | | | | 0.00% | | | | | 0.11% | |
Diversified Metals & Mining | | | | 0.00% | | | | | 0.11% | | | | | 0.11% | |
Construction & Engineering | | | | 0.00% | | | | | 0.10% | | | | | 0.10% | |
Broadcasting | | | | 0.09% | | | | | 0.00% | | | | | 0.09% | |
Human Resource & Employment Services | | | | 0.00% | | | | | 0.09% | | | | | 0.09% | |
Drug Retail | | | | 0.07% | | | | | 0.00% | | | | | 0.07% | |
Regional Banks | | | | 0.07% | | | | | 0.00% | | | | | 0.07% | |
Automotive Retail | | | | 0.07% | | | | | 0.00% | | | | | 0.07% | |
Paper Packaging | | | | 0.06% | | | | | 0.00% | | | | | 0.06% | |
Independent Power Producers & Energy Traders | | | | 0.06% | | | | | 0.00% | | | | | 0.06% | |
Diversified Chemicals | | | | 0.05% | | | | | 0.00% | | | | | 0.05% | |
| | | | | | | | | | | | | | | |
| | | | | | | | | | | | | | 55.79% | |
| | | | | | | | | | | | | | | |
| | | | | |
| Sector | | |
Corporate Notes | | | | 14.27% | |
Agency Mortgage Backed | | | | 7.72% | |
U.S. Treasuries | | | | 4.96% | |
Non-Agency Collateralized Mortgage Obligations | | | | 3.20% | |
Sovereign Bonds | | | | 0.38% | |
Municipal Bonds and Notes | | | | 0.18% | |
Agency Collateralized Mortgage Obligations | | | | 0.07% | |
FNMA (TBA) | | | | 0.00% | ** |
| | | | | |
| | | | 30.78% | |
| | | | | |
| |
| Short-Term Investments | | |
Short-Term Investments | | | | 13.43% | |
| | | | | |
| | | | 13.43% | |
| | | | | |
| | | | 100.00% | |
| | | | | |
See Notes to Schedules of Investments and Notes to Financial Statements.
34
(Unaudited)


Michael J.Caufield
Senior
Vice President
The Elfun Tax-Exempt Income Fund is managed by Michael J. Caufield. See portfolio managers’ biographical information beginning on page 98.
| Q. | How did the Elfun Tax-Exempt Income Fund perform compared to its benchmark and Morningstar peer group for the twelve-month period ended December 31, 2015? |
| A. | For the twelve-month period ended December 31, 2015, the Elfun Tax-Exempt Income Fund returned 3.21%. The Barclay’s Capital U.S. Municipal Bond Index (the Index), the Fund’s benchmark, returned 3.30% and the Fund’s Morningstar peer group of 198 U.S. Long-term Municipal Bond funds returned an average of 3.05% over the same period. |
| Q. | What market conditions affected the Fund’s performance? |
| A. | Financial markets across the globe spent the majority of 2015 in the” hurry up and wait mode” for a return to higher interest rates in the U.S. After several false alarms, the Federal Open Market Committee finally acted in December, raising the target range of the Fed funds rate by 25 basis points, signaling that rate policy would likely be gradual and economic data dependent. Most asset class sectors lacked conviction and experienced modest losses or close to break-even returns over the course of 2015. The tax-exempt bond market was the exception to the case however. The tax-exempt sector was the best returning market, outperforming taxable securities substantially on the year, given modest new issue supply, strong mutual fund flows and a stable macro credit profile. Municipal supply increased by 19% over 2015 yet given low historical rates and favorable relationships with treasuries, many issuers chose to refund their debt while shortening their debt exposure, leading to a demand/supply imbalance. The municipal yield curve, given such compelling technical fundamentals, flattened late in the year with bonds held in the intermediate sector representing the Fund’s largest exposure, being a key driver of returns. |
| Q. | What were the primary drivers of Fund performance? |
| A. | Curve placement and a longer duration strategy were key elements in our approach to maximize tax-exempt income in the Fund. Given the relative steepness of the curve inside of eight years, which did not offer sufficient yield for our objectives, we concentrated exposure within the intermediate sector of the curve and managed exposure to both long dated securities and lower rated issuers, both of which were underweighted to the Index. The fund’s long-term preference for structure and quality supported competitive with minimal risk while differentiating the Fund from its peers. |
| Q. | Were there any significant changes to the Fund during the period? |
| A. | Over the course of the year, the Fund duration was managed within a tight range varying from neutral in early 2015 to long 8% by year-end. Fund positioning was strongly biased to a flattening yield curve scenario which began late in 2015 as tax-exempt bonds rallied into year-end. The Fund was positioned throughout the year with income and capital preservation objectives paramount. Our adherence to a conservative investment process continued to provide low volatility and contribute to consistent long-term returns. |
35
(Unaudited)

Understanding Your Fund’s Expenses
As a shareholder of the Fund you incur ongoing costs. Ongoing costs include portfolio management fees, professional fees, administrative fees and other Fund expenses. The following example is intended to help you understand your ongoing costs (in dollars) of investing in the Fund and to compare these costs with the ongoing costs of investing in other mutual funds.
To illustrate these ongoing costs, we have provided an example and calculated the expenses paid by investors in units of the Fund during the period. The information in the following table is based on an investment of $1,000, which is invested at the beginning of the period and held for the entire six-month period ended December 31, 2015.
Actual Expenses
The first section of the table provides information about actual account values and actual expenses. You may use the information in this section, together with the amount you invested, to estimate the expenses that you paid over the period. To do so, simply divide your account value by $1,000 (for example, an $8,600 account value divided by $1,000 = 8.6), then multiply the result by the number given under the heading “Expenses paid during
the period” to estimate the expenses you paid on your account during the period.
Hypothetical Example for Comparison Purposes
The second section of the table provides information about hypothetical account values and hypothetical expenses based on the Fund’s actual expense ratio and an assumed rate of return of 5% per year before expenses, which is not the Fund’s actual return. The hypothetical account values and expenses may not be used to estimate the actual ending account balance or expenses you paid for the period. You may use this information to compare the ongoing costs of investing in the Fund and other funds. To do so, compare this 5% hypothetical example with the 5% hypothetical examples that appear in the shareholders reports of other funds.
Please note that the expenses shown in the table are meant to highlight and help you compare ongoing costs only and do not reflect transaction costs, such as sales charges or redemption fees, if any. Therefore, the second section of the table is useful in comparing ongoing costs only, and will not help you determine the relative total costs of owning different funds.
July 1, 2015 – December 31, 2015
| | | | | | | | | | | | |
| | | Account value at the beginning of the period ($) | | | Account value at the end of
the period ($) | | | Expenses paid during the period ($)* | |
| | | |
Actual Fund Return | | | 1,000.00 | | | | 1,033.00 | | | | 0.77 | |
| | | |
Hypothetical 5% Return
(2.5% for the period) | | | 1,000.00 | | | | 1,024.45 | | | | 0.77 | |
| * | | Expenses are equal to the Fund’s annualized net expense ratio of 0.15%** (for the period July 1, 2015 – December 31, 2015), multiplied by the average account value over the period, multiplied by 184/365 (to reflect the one-half year period). |
| ** | | May differ from expense ratio disclosed in the financial highlights, which is calculated based on the entire fiscal year’s data. |
36
(Unaudited)
A mutual fund designed for investors who seek as high a level of current interest income exempt from federal income taxation as is available from a concentration of investments in municipal bonds consistent with prudent investment management and the preservation of capital. The Fund seeks to achieve its investment objective by investing primarily in investment-grade municipal obligations.
(as a % of Fair Value of Investments of $1,598,346 (in thousands) on December 31, 2015) (a)(b)
| | | | |
| Moody’s / S&P /Rating * | | Percentage of Fair Value | |
| |
Aaa / AAA | | | 12.6% | |
| |
Aa / AA | | | 51.7% | |
| |
A / A | | | 31.5% | |
| |
Baa / BBB | | | 1.4% | |
| |
Ba / BB and lower | | | 1.0% | |
| |
NR / Other | | | 1.8% | |
Portfolio composition as a % of Fair Value of Investments of $1,598,346 (in thousands) on December 31, 2015 (a)(b)
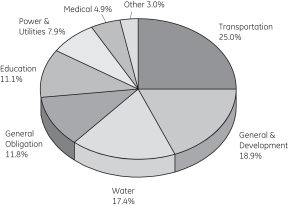
|
| Morningstar Performance Comparison |
Based on average annual returns for periods ended December 31, 2015
| | | | | | | | | | | | |
| | | One Year | | | Five Year | | | Ten Year | |
Number of funds in peer group | | | 198 | | | | 190 | | | | 180 | |
Peer group average annual total return | | | 3.05 | % | | | 5.53 | % | | | 4.14 | % |
Morningstar Category in peer group: Muni National Long | |
|
| Change in Value of a $10,000 Investment |
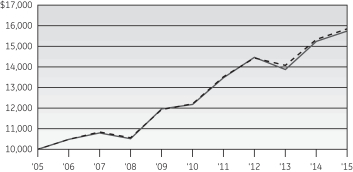

|
| Average Annual Total Return |
For the periods ended December 31, 2015
| | | | | | | | | | | | | | | | |
| (Inception date: 1/1/80) | | | | | | | |
| | | One
Year | | | Five
Year | | | Ten
Year | | | Ending Value of a $10,000 Investment | |
Elfun Tax-Exempt Income Fund | | | 3.21% | | | | 5.26% | | | | 4.64% | | | | $15,739 | |
Barclays U.S. Municipal Bond Index | | | 3.30% | | | | 5.35% | | | | 4.72% | | | | $15,853 | |
| (a) | Fair Value basis is inclusive of short-term investment in State Street Institutional U.S. Government Money Market Fund Premier Class. |
| (b) | The securities information regarding holdings, allocations and other characteristics is presented to illustrate examples of securities that the Fund has bought and the diversity of areas in which the Fund may invest as of a particular date. It may not be representative of the Fund’s current or future investments and should not be construed as a recommendation to purchase or sell a particular security. |
See Notes to Performance beginning on page 1 for further information, including an explanation of Morningstar peer categories.
Past performance does not predict future performance. The performance shown in the graphs and tables does not reflect the deduction of taxes that a shareholder would pay on Fund distributions or the redemption of Fund shares.
37
| | |
Elfun Tax-Exempt Income Fund | | December 31, 2015 |
|
| Elfun Tax-Exempt Income Fund |
| | | | | | | | | | | | |
| | | | | Principal Amount | | | Fair Value | | | |
Municipal Bonds and Notes — 98.1%† |
|
Alaska — 0.2% |
| | | |
Alaska Housing Finance Corp. | | | | | | | | | | |
| 5.00% | | 12/01/27 | | $ | 2,500,000 | | | $ | 2,942,000 | | | |
| | | |
Arizona — 1.7% | | | | | | | | | | |
| | | |
City of Phoenix | | | | | | | | | | |
| 5.00% | | 07/01/19 | | | 5,000,000 | | | | 5,321,900 | | | |
Phoenix Civic Improvement Corp. (FGIC Insured) | | | | | | | | | | |
| 5.50% | | 07/01/23 - 07/01/24 | | | 7,260,000 | | | | 9,222,560 | | | (m) |
Salt River Project Agricultural Improvement & Power District | | | | | | | | | | |
| 5.00% | | 12/01/21 | | | 10,000,000 | | | | 11,668,900 | | | |
University Medical Center Corp. | | | | | | | | | | |
| 6.50% | | 07/01/39 | | | 1,000,000 | | | | 1,179,670 | | | (l) |
| | | | | | | | | 27,393,030 | | | |
| | | |
California — 10.9% | | | | | | | | | | |
| | | |
Bay Area Toll Authority | | | | | | | | | | |
| 5.00% | | 04/01/31 | | | 10,000,000 | | | | 10,113,500 | | | (l) |
California Educational Facilities Authority | | | | | | | | | | |
| 5.00% | | 10/01/32 | | | 5,255,000 | | | | 6,907,014 | | | |
| 5.25% | | 10/01/39 | | | 6,000,000 | | | | 6,660,600 | | | |
| 6.13% | | 10/01/36 | | | 1,500,000 | | | | 1,792,365 | | | |
California Health Facilities Financing Authority | | | | | | | | | | |
| 5.50% | | 08/15/26 | | | 5,000,000 | | | | 5,933,850 | | | |
| 6.00% | | 07/01/39 | | | 5,000,000 | | | | 5,730,200 | | | |
| 6.50% | | 10/01/33 | | | 3,500,000 | | | | 4,027,450 | | | (l) |
California State Department of Water Resources | | | | | | | | | | |
| 5.00% | | 05/01/21 - 12/01/21 | | | 6,585,000 | | | | 7,866,883 | | | |
California State Public Works Board | | | | | | | | | | |
| 5.00% | | 10/01/28 | | | 1,500,000 | | | | 1,755,090 | | | |
| 5.13% | | 10/01/31 | | | 2,000,000 | | | | 2,341,780 | | | |
| 5.25% | | 09/01/29 | | | 10,160,000 | | | | 12,188,749 | | | |
| 6.00% | | 04/01/26 | | | 8,475,000 | | | | 9,706,926 | | | |
Coast Community College District | | | | | | | | | | |
| 5.00% | | 08/01/33 | | | 1,260,000 | | | | 1,520,644 | | | |
Coast Community College District (AGMC Insured) | | | | | | | | | | |
| 5.00% | | 08/01/33 | | | 8,750,000 | | | | 9,656,762 | | | (l,m) |
Kaweah Delta Health Care District | | | | | | | | | | |
| 4.00% | | 06/01/45 | | | 2,500,000 | | | | 2,499,925 | | | |
Los Angeles Harbor Department | | | | | | | | | | |
| 5.00% | | 08/01/26 | | | 8,000,000 | | | | 9,002,240 | | | |
Marin Healthcare District | | | | | | | | | | |
| 4.00% | | 08/01/45 | | | 2,000,000 | | | | 2,077,380 | | | |
| | | | | | | | | | | | |
| | | | | Principal Amount | | | Fair Value | | | |
Metropolitan Water District of Southern California | | | | | | | | | | |
| 5.00% | | 07/01/35 - 07/01/40 | | $ | 9,000,000 | | | $ | 9,831,290 | | | |
San Diego Community College District | | | | | | | | | | |
| 5.00% | | 08/01/41 | | | 10,000,000 | | | | 11,253,300 | | | |
State of California | | | | | | | | | | |
| 5.00% | | 02/01/31 - 12/01/43 | | | 18,220,000 | | | | 21,084,947 | | | |
| 5.25% | | 04/01/35 - 11/01/40 | | | 12,750,000 | | | | 14,934,972 | | | |
State of California Department of Water Resources | | | | | | | | | | |
| 5.00% | | 12/01/29 | | | 8,150,000 | | | | 9,912,193 | | | |
University of California | | | | | | | | | | |
| 5.00% | | 05/15/38 | | | 4,000,000 | | | | 4,636,160 | | | |
University of California (AMBAC Insured) | | | | | | | | | | |
| 5.00% | | 05/15/34 | | | 2,225,000 | | | | 2,225,757 | | | (m) |
| | | | | | | | | 173,659,977 | | | |
| | | |
Colorado — 1.6% | | | | | | | | | | |
| | | |
Metro Wastewater Reclamation District | | | | | | | | | | |
| 5.00% | | 04/01/27 | | | 1,730,000 | | | | 2,037,248 | | | |
Regional Transportation District | | | | | | | | | | |
| 4.25% | | 11/01/36 | | | 3,405,000 | | | | 3,967,915 | | | |
| 5.00% | | 11/01/27 - 11/01/29 | | | 13,760,000 | | | | 17,062,252 | | | |
| 5.38% | | 06/01/31 | | | 2,500,000 | | | | 2,814,500 | | | |
| | | | | | | | | 25,881,915 | | | |
| | | |
Connecticut — 4.6% | | | | | | | | | | |
| | | |
Connecticut State Health & Educational Facility Authority | | | | | | | | | | |
| 5.00% | | 07/01/40 | | | 6,775,000 | | | | 7,414,221 | | | |
Hartford County Metropolitan District | | | | | | | | | | |
| 5.00% | | 11/01/42 | | | 9,000,000 | | | | 10,423,170 | | | |
South Central Connecticut Regional Water Authority | | | | | | | | | | |
| 5.00% | | 08/01/27 - 08/01/28 | | | 3,295,000 | | | | 3,871,366 | | | |
State of Connecticut | | | | | | | | | | |
| 5.00% | | 01/01/22 - 01/01/24 | | | 8,600,000 | | | | 10,029,560 | | | |
State of Connecticut Special Tax Revenue | | | | | | | | | | |
| 5.00% | | 11/01/26 - 09/01/34 | | | 35,250,000 | | | | 40,983,148 | | | |
Town of Fairfield | | | | | | | | | | |
| 5.00% | | 08/01/21 | | | 1,000,000 | | | | 1,186,920 | | | |
| | | | | | | | | 73,908,385 | | | |
| | | |
Delaware — 1.5% | | | | | | | | | | |
| | | |
County of New Castle | | | | | | | | | | |
| 5.00% | | 07/15/33 - 07/15/39 | | | 10,000,000 | | | | 11,018,600 | | | (l) |
Delaware State Health Facilities Authority | | | | | | | | | | |
| 5.00% | | 10/01/40 | | | 6,300,000 | | | | 7,008,057 | | | |
See Notes to Schedules of Investments and Notes to Financial Statements.
38
| | |
Elfun Tax-Exempt Income Fund | | December 31, 2015 |
| | | | | | | | | | | | |
| | | | | Principal Amount | | | Fair Value | | | |
Delaware Transportation Authority Rev., | | | | | | | | | | |
| 5.00% | | 06/01/45 | | $ | 4,000,000 | | | $ | 4,594,560 | | | |
State of Delaware | | | | | | | | | | |
| 5.00% | | 07/01/28 | | | 1,000,000 | | | | 1,154,590 | | | |
| | | | | | | | | 23,775,807 | | | |
| | | |
District of Columbia — 1.6% | | | | | | | | | | |
| | | |
District of Columbia | | | | | | | | | | |
| 5.00% | | 06/01/38 | | | 3,000,000 | | | | 3,481,290 | | | |
| 5.50% | | 04/01/36 | | | 15,000,000 | | | | 16,525,650 | | | |
District of Columbia Water & Sewer Authority | | | | | | | | | | |
| 5.25% | | 10/01/29 | | | 5,000,000 | | | | 5,577,800 | | | (l) |
| | | | | | | | | 25,584,740 | | | |
| | | |
Florida — 1.0% | | | | | | | | | | |
| | | |
Brevard County Health Facilities Authority | | | | | | | | | | |
| 7.00% | | 04/01/39 | | | 1,000,000 | | | | 1,184,580 | | | (l) |
City of Tampa Water & Wastewater System Revenue | | | | | | | | | | |
| 5.00% | | 10/01/27 | | | 8,560,000 | | | | 10,066,646 | | | |
County of Miami-Dade Public Facilities Revenue | | | | | | | | | | |
| 4.00% | | 06/01/34 - 06/01/36 | | | 4,970,000 | | | | 5,097,589 | | | |
| | | | | | | | | 16,348,815 | | | |
| | | |
Georgia — 7.4% | | | | | | | | | | |
| | | |
Athens-Clarke County Unified Government Development Authority | | | | | | | | | | |
| 5.00% | | 06/15/31 | | | 6,050,000 | | | | 6,564,855 | | | |
Athens-Clarke County Unified Government Water & Sewerage Revenue | | | | | | | | | | |
| 5.50% | | 01/01/38 | | | 7,000,000 | | | | 7,908,950 | | | (l) |
Atlanta Development Authority | | | | | | | | | | |
| 5.25% | | 07/01/40 | | | 8,925,000 | | | | 10,427,613 | | | |
City of Atlanta Department of Aviation | | | | | | | | | | |
| 5.00% | | 01/01/25 - 01/01/34 | | | 20,500,000 | | | | 23,713,195 | | | |
City of Atlanta Water & Wastewater Revenue | | | | | | | | | | |
| 5.25% | | 11/01/30 | | | 5,690,000 | | | | 6,786,008 | | | |
| 6.25% | | 11/01/39 | | | 10,000,000 | | | | 11,891,900 | | | (l) |
City of Atlanta Water & Wastewater Revenue (AGMC Insured) | | | | | | | | | | |
| 5.75% | | 11/01/27 - 11/01/30 | | | 9,500,000 | | | | 12,704,475 | | | (m) |
DeKalb Newton & Gwinnett Counties Joint Development Authority | | | | | | | | | | |
| 6.00% | | 07/01/34 | | | 8,500,000 | | | | 9,673,255 | | | |
| | | | | | | | | | | | |
| | | | | Principal Amount | | | Fair Value | | | |
Fayette County School District (AGMC Insured) | | | | | | | | | | |
| 4.80% | | 03/01/22 | | $ | 2,520,000 | | | $ | 2,537,615 | | | (l,m) |
| 4.85% | | 03/01/23 | | | 2,290,000 | | | | 2,306,190 | | | (l,m) |
Municipal Electric Authority of Georgia | | | | | | | | | | |
| 5.00% | | 01/01/35 | | | 2,500,000 | | | | 2,880,650 | | | |
| 5.25% | | 01/01/19 | | | 2,490,000 | | | | 2,781,803 | | | |
State of Georgia | | | | | | | | | | |
| 4.00% | | 07/01/32 | | | 3,350,000 | | | | 3,670,159 | | | |
| 4.50% | | 01/01/29 | | | 3,000,000 | | | | 3,277,500 | | | |
| 5.00% | | 08/01/22 | | | 4,460,000 | | | | 4,760,247 | | | (l) |
| 5.00% | | 08/01/22 - 01/01/26 | | | 4,790,000 | | | | 5,208,246 | | | |
| | | | | | | | | 117,092,661 | | | |
| | | |
Hawaii — 1.9% | | | | | | | | | | |
| | | |
City & County of Honolulu | | | | | | | | | | |
| 5.00% | | 04/01/33 | | | 10,000,000 | | | | 11,229,600 | | | (l) |
State of Hawaii Airports System Revenue | | | | | | | | | | |
| 5.25% | | 07/01/24 | | | 15,800,000 | | | | 18,496,112 | | | |
| | | | | | | | | 29,725,712 | | | |
|
Idaho — 1.4% |
| | | |
Idaho Health Facilities Authority | | | | | | | | | | |
| 6.75% | | 11/01/37 | | | 4,000,000 | | | | 4,540,640 | | | |
Idaho Housing & Finance Assoc. (NPFG Insured) | | | | | | | | | | |
| 5.00% | | 07/15/22 - 07/15/24 | | | 17,625,000 | | | | 18,050,644 | | | (l,m) |
| | | | | | | | | 22,591,284 | | | |
|
Illinois — 3.2% |
| | | |
City of Chicago O’Hare International Airport Revenue | | | | | | | | | | |
| 5.00% | | 01/01/46 | | | 1,000,000 | | | | 1,109,910 | | | |
| 5.63% | | 01/01/35 | | | 5,000,000 | | | | 5,773,850 | | | |
| 5.75% | | 01/01/39 | | | 11,500,000 | | | | 13,364,840 | | | |
Illinois State Toll Highway Authority | | | | | | | | | | |
| 5.00% | | 12/01/32 | | | 10,050,000 | | | | 11,826,840 | | | (c) |
| 5.00% | | 01/01/40 | | | 5,000,000 | | | | 5,727,300 | | | |
Metropolitan Pier & Exposition Authority (NPFG Insured) | | | | | | | | | | |
| 5.40% | | 06/15/19 | | | 1,065,000 | | | | 1,146,728 | | | (l,m) |
| 5.40% | | 06/15/19 | | | 2,935,000 | | | | 3,114,123 | | | (m) |
| 5.65% | | 06/15/22 | | | 375,000 | | | | 435,225 | | | (j,k,m) |
| 5.65% | | 06/15/22 | | | 3,930,000 | | | | 4,306,887 | | | (j,m) |
Southwestern Illinois Development Authority (NPFG Insured) | | | | | | | | | | |
| 5.00% | | 10/01/21 | | | 4,000,000 | | | | 4,666,040 | | | (m) |
| | | | | | | | | 51,471,743 | | | |
See Notes to Schedules of Investments and Notes to Financial Statements.
39
| | |
Elfun Tax-Exempt Income Fund | | December 31, 2015 |
| | | | | | | | | | | | |
| | | | | Principal Amount | | | Fair Value | | | |
|
Indiana — 1.2% |
| | | |
Indiana Municipal Power Agency | | | | | | | | | | |
| 5.00% | | 01/01/42 | | $ | 7,000,000 | | | $ | 8,039,220 | | | (c) |
| 5.50% | | 01/01/27 | | | 2,500,000 | | | | 2,780,875 | | | |
Indianapolis Local Public Improvement Bond Bank | | | | | | | | | | |
| 5.75% | | 01/01/38 | | �� | 7,000,000 | | | | 7,848,120 | | | |
| | | | | | | | | 18,668,215 | | | |
|
Iowa — 0.8% |
| | | |
Iowa Finance Authority | | | | | | | | | | |
| 5.00% | | 12/01/19 | | | 7,500,000 | | | | 7,906,800 | | | |
| 5.25% | | 12/01/25 | | | 5,000,000 | | | | 5,433,850 | | | |
| | | | | | | | | 13,340,650 | | | |
|
Kentucky — 1.8% |
| | | |
Kentucky State Property & Building Commission (AGC Insured) | | | | | | | | | | |
| 5.25% | | 02/01/27 | | | 10,665,000 | | | | 11,826,312 | | | (m) |
Louisville & Jefferson County Metropolitan Sewer District | | | | | | | | | | |
| 5.00% | | 05/15/30 | | | 14,340,000 | | | | 16,603,569 | | | |
| | | | | | | | | 28,429,881 | | | |
|
Louisiana — 2.0% |
| | | |
City of New Orleans LA Sewerage Service Revenue | | | | | | | | | | |
| 5.00% | | 06/01/44 | | | 7,100,000 | | | | 7,891,153 | | | |
| 5.00% | | 06/01/45 | | | 1,800,000 | | | | 2,008,566 | | | |
East Baton Rouge Sewerage Commission | | | | | | | | | | |
| 5.00% | | 02/01/39 | | | 4,000,000 | | | | 4,596,760 | | | |
Louisiana Local Government Environmental Facilities & Community Development Authority | | | | | | | | | | |
| 5.00% | | 02/01/44 | | | 5,165,000 | | | | 5,739,968 | | | |
State of Louisiana | | | | | | | | | | |
| 5.00% | | 09/01/19 | | | 10,050,000 | | | | 11,375,997 | | | |
| | | | | | | | | 31,612,444 | | | |
|
Maine — 0.3% |
| | | |
Maine Health & Higher Educational Facilities Authority | | | | | | | | | | |
| 5.25% | | 07/01/21 | | | 315,000 | | | | 369,545 | | | (l) |
| 5.25% | | 07/01/21 | | | 1,475,000 | | | | 1,712,018 | | | |
Maine Turnpike Authority | | | | | | | | | | |
| 5.00% | | 07/01/42 | | | 1,000,000 | | | | 1,139,200 | | | |
| 6.00% | | 07/01/34 | | | 1,250,000 | | | | 1,460,325 | | | (l) |
| | | | | | | | | 4,681,088 | | | |
| | | | | | | | | | | | |
| | | | | Principal Amount | | | Fair Value | | | |
|
Maryland — 3.2% |
| | | |
City of Baltimore | | | | | | | | | | |
| 5.00% | | 07/01/38 | | $ | 9,375,000 | | | $ | 10,712,062 | | | |
County of Baltimore | | | | | | | | | | |
| 5.00% | | 02/01/23 | | | 7,525,000 | | | | 9,023,228 | | | |
County of Prince George’s | | | | | | | | | | |
| 5.00% | | 09/15/24 - 09/15/25 | | | 8,790,000 | | | | 10,439,892 | | | |
Maryland Economic Development Corp. | | | | | | | | | | |
| 5.75% | | 06/01/35 | | | 3,000,000 | | | | 3,282,060 | | | |
Maryland Health & Higher Educational Facilities Authority | | | | | | | | | | |
| 5.00% | | 07/01/34 - 08/15/41 | | | 3,300,000 | | | | 3,608,522 | | | |
State of Maryland | | | | | | | | | | |
| 5.00% | | 11/01/18 | | | 4,000,000 | | | | 4,443,680 | | | |
Washington Suburban Sanitary Commission | | | | | | | | | | |
| 4.50% | | 06/01/26 | | | 8,470,000 | | | | 9,190,966 | | | (l) |
| | | | | | | | | 50,700,410 | | | |
|
Massachusetts — 5.9% |
| | | |
Commonwealth of Massachusetts | | | | | | | | | | |
| 5.00% | | 06/15/27 | | | 14,000,000 | | | | 17,125,500 | | | |
Massachusetts Bay Transportation Authority | | | | | | | | | | |
| 5.00% | | 07/01/45 | | | 5,000,000 | | | | 5,824,750 | | | |
Massachusetts Department of Transportation | | | | | | | | | | |
| 5.00% | | 01/01/37 | | | 11,130,000 | | | | 12,357,973 | | | |
Massachusetts Development Finance Agency | | | | | | | | | | |
| 5.00% | | 10/01/46 | | | 4,250,000 | | | | 4,893,153 | | | |
Massachusetts Health & Educational Facilities Authority | | | | | | | | | | |
| 5.00% | | 07/01/34 | | | 10,000,000 | | | | 11,180,800 | | | |
| 5.50% | | 11/15/36 | | | 4,000,000 | | | | 4,505,920 | | | |
| 5.75% | | 07/01/39 | | | 5,000,000 | | | | 5,549,850 | | | (l) |
Massachusetts School Building Authority | | | | | | | | | | |
| 5.00% | | 08/15/28 | | | 5,000,000 | | | | 5,958,250 | | | |
Massachusetts Water Resources Authority | | | | | | | | | | |
| 5.00% | | 08/01/32 - 08/01/41 | | | 7,140,000 | | | | 8,325,323 | | | |
| 6.50% | | 07/15/19 | | | 8,160,000 | | | | 8,902,723 | | | (k) |
University of Massachusetts Building Authority | | | | | | | | | | |
| 5.00% | | 11/01/31 | | | 7,450,000 | | | | 9,012,041 | | | |
| | | | | | | | | 93,636,283 | | | |
See Notes to Schedules of Investments and Notes to Financial Statements.
40
| | |
Elfun Tax-Exempt Income Fund | | December 31, 2015 |
| | | | | | | | | | | | |
| | | | | Principal Amount | | | Fair Value | | | |
|
Michigan — 1.1% |
| | | |
Lansing Board of Water & Light | | | | | | | | | | |
| 5.00% | | 07/01/37 | | $ | 3,500,000 | | | $ | 3,923,080 | | | |
State of Michigan (AGMC Insured) | | | | | | | | | | |
| 5.25% | | 09/15/27 | | | 5,000,000 | | | | 5,329,300 | | | (m) |
State of Michigan Trunk Line Revenue | | | | | | | | | | |
| 5.50% | | 11/01/18 | | | 6,000,000 | | | | 6,730,800 | | | |
University of Michigan Revenue | | | | | | | | | | |
| 5.00% | | 04/01/46 | | | 1,000,000 | | | | 1,182,850 | | | |
| | | | | | | | | 17,166,030 | | | |
|
Missouri — 1.5% |
| | | |
Bi-State Development Agency of the Missouri-Illinois Metropolitan District | | | | | | | | | | |
| 5.00% | | 10/01/44 | | | 8,010,000 | | | | 8,918,174 | | | |
Metropolitan St. Louis Sewer District | | | | | | | | | | |
| 5.00% | | 05/01/45 | | | 1,500,000 | | | | 1,758,240 | | | |
Missouri Highway & Transportation Commission | | | | | | | | | | |
| 5.00% | | 05/01/21 | | | 4,610,000 | | | | 5,330,451 | | | |
Missouri Joint Municipal Electric Utility Commission | | | | | | | | | | |
| 5.00% | | 01/01/34 | | | 1,950,000 | | | | 2,217,716 | | | |
| 5.75% | | 01/01/29 | | | 4,500,000 | | | | 4,500,000 | | | (l) |
Missouri State Environmental Improvement & Energy Resources Authority | | | | | | | | | | |
| 5.00% | | 01/01/24 | | | 525,000 | | | | 526,418 | | | |
| | | | | | | | | 23,250,999 | | | |
|
Nebraska — 0.7% |
| | | |
Omaha Public Power District | | | | | | | | | | |
| 4.00% | | 02/01/34 - 02/01/36 | | | 10,250,000 | | | | 10,903,547 | | | |
|
Nevada — 0.1% |
| | | |
City of Las Vegas (AGMC Insured) | | | | | | | | | | |
| 5.55% | | 06/01/16 | | | 985,000 | | | | 1,004,700 | | | (m) |
|
New Jersey — 5.7% |
| | | |
Cape May County Municipal Utilities Authority (AGMC Insured) | | | | | | | | | | |
| 5.75% | | 01/01/16 | | | 3,500,000 | | | | 3,500,000 | | | (m) |
New Jersey Economic Development Authority | | | | | | | | | | |
| 5.50% | | 12/15/29 | | | 5,000,000 | | | | 5,460,550 | | | |
New Jersey Educational Facilities Authority | | | | | | | | | | |
| 6.00% | | 12/01/17 | | | 10,000,000 | | | | 10,728,700 | | | (k) |
| | | | | | | | | | | | |
| | | | | Principal Amount | | | Fair Value | | | |
New Jersey Educational Facilities Authority (AGMC Insured) | | | | | | | | | | |
| 4.00% | | 07/01/33 | | $ | 2,500,000 | | | $ | 2,567,600 | | | (m) |
New Jersey Healthcare Facilities Financing Authority (AGMC Insured) | | | | | | | | | | |
| 4.13% | | 07/01/38 | | | 1,000,000 | | | | 1,018,490 | | | (m) |
New Jersey Higher Education Student Assistance Authority | | | | | | | | | | |
| 5.63% | | 06/01/30 | | | 7,500,000 | | | | 8,195,625 | | | |
New Jersey State Economic Develpoment Authority | | | | | | | | | | |
| 5.25% | | 06/15/40 | | | 4,000,000 | | | | 4,163,000 | | | |
New Jersey State Turnpike Authority | | | | | | | | | | |
| 5.00% | | 01/01/33 - 01/01/45 | | | 21,000,000 | | | | 24,003,650 | | | |
| 5.25% | | 01/01/40 | | | 10,000,000 | | | | 11,103,500 | | | |
New Jersey State Turnpike Authority (AMBAC Insured) | | | | | | | | | | |
| 6.50% | | 01/01/16 | | | 6,805,000 | | | | 6,805,000 | | | (k,m) |
| 6.50% | | 01/01/16 | | | 5,135,000 | | | | 5,135,000 | | | (m) |
New Jersey Transportation Trust Fund Authority | | | | | | | | | | |
| 5.00% | | 06/15/45 | | | 2,250,000 | | | | 2,348,010 | | | |
| 5.25% | | 06/15/36 | | | 5,000,000 | | | | 5,297,800 | | | |
| | | | | | | | | 90,326,925 | | | |
|
New Mexico — 1.4% |
New Mexico Finance Authority | | | | | | | | | | |
| 5.00% | | 06/15/18 - 06/15/23 | | | 9,200,000 | | | | 10,334,920 | | | |
| 5.00% | | 12/15/26 | | | 12,000,000 | | | | 12,500,880 | | | (l) |
| | | | | | | | | 22,835,800 | | | |
|
New York — 10.2% |
Long Island Power Authority | | | | | | | | | | |
| 6.00% | | 05/01/33 | | | 7,500,000 | | | | 8,683,875 | | | (l) |
Metropolitan Transportation Authority | | | | | | | | | | |
| 5.00% | | 11/15/29 - 11/15/45 | | | 14,920,000 | | | | 17,269,786 | | | |
Nassau County Sewer & Storm Water Finance Authority | | | | | | | | | | |
| 5.00% | | 10/01/30 | | | 1,690,000 | | | | 2,025,533 | | | |
New York City Transitional Finance Authority Building Aid Revenue | | | | | | | | | | |
| 5.50% | | 07/15/31 | | | 10,000,000 | | | | 11,090,100 | | | |
New York City Transitional Finance Authority Future Tax Secured Revenue | | | | | | | | | | |
| 5.00% | | 11/01/21 - 02/01/41 | | | 30,220,000 | | | | 35,013,029 | | | |
New York City Water & Sewer System | | | | | | | | | | |
| 5.00% | | 06/15/36 | | | 9,000,000 | | | | 10,471,950 | | | |
New York Convention Center Development Corp. | | | | | | | | | | |
| 5.00% | | 11/15/40 | | | 5,000,000 | | | | 5,778,500 | | | |
See Notes to Schedules of Investments and Notes to Financial Statements.
41
| | |
Elfun Tax-Exempt Income Fund | | December 31, 2015 |
| | | | | | | | | | | | |
| | | | | Principal Amount | | | Fair Value | | | |
New York Liberty Development Corp. | | | | | | | | | | |
| 5.00% | | 11/15/44 | | $ | 5,000,000 | | | $ | 5,584,650 | | | |
| 5.13% | | 01/15/44 | | | 10,000,000 | | | | 11,063,800 | | | |
New York State Dormitory Authority | | | | | | | | | | |
| 5.00% | | 03/15/36 - 10/01/45 | | | 15,000,000 | | | | 18,571,700 | | | |
| 5.50% | | 05/01/37 | | | 2,500,000 | | | | 2,858,425 | | | (l) |
| 6.00% | | 07/01/40 | | | 2,000,000 | | | | 2,321,480 | | | |
New York State Thruway Authority | | | | | | | | | | |
| 5.00% | | 05/01/19 | | | 6,000,000 | | | | 6,727,200 | | | |
New York State Urban Development Corp. | | | | | | | | | | |
| 5.50% | | 01/01/19 | | | 9,000,000 | | | | 10,154,430 | | | |
Triborough Bridge & Tunnel Authority | | | | | | | | | | |
| 5.00% | | 11/15/26 | | | 10,000,000 | | | | 11,112,300 | | | |
Westchester County Healthcare Corp. | | | | | | | | | | |
| 6.13% | | 11/01/37 | | | 2,500,000 | | | | 2,854,050 | | | |
| | | | | | | | | 161,580,808 | | | |
|
North Carolina — 1.3% |
City of Charlotte | | | | | | | | | | |
| 5.00% | | 06/01/23 | | | 4,320,000 | | | | 4,985,755 | | | |
City of Charlotte Water & Sewer System Revenue | | | | | | | | | | |
| 5.00% | | 07/01/38 | | | 5,000,000 | | | | 5,411,450 | | | |
North Carolina Eastern Municipal Power Agency | | | | | | | | | | |
| 5.00% | | 01/01/26 | | | 5,000,000 | | | | 5,583,800 | | | (l) |
State of North Carolina | | | | | | | | | | |
| 4.75% | | 05/01/30 | | | 4,130,000 | | | | 4,628,574 | | | |
| | | | | | | | | 20,609,579 | | | |
|
Ohio — 4.1% |
American Municipal Power Inc. | | | | | | | | | | |
| 5.00% | | 02/15/38 | | | 295,000 | | | | 312,296 | | | |
| 5.00% | | 02/15/38 | | | 4,705,000 | | | | 5,111,088 | | | (l) |
City of Cincinnati Water System Revenue | | | | | | | | | | |
| 5.00% | | 12/01/36 | | | 2,500,000 | | | | 2,873,500 | | | |
City of Columbus | | | | | | | | | | |
| 5.00% | | 07/01/26 - 08/15/30 | | | 18,055,000 | | | | 21,907,495 | | | |
City of Columbus Sewerage Revenue | | | | | | | | | | |
| 4.50% | | 06/01/32 | | | 700,000 | | | | 748,391 | | | (l) |
| 4.75% | | 06/01/31 | | | 5,000,000 | | | | 5,369,200 | | | (l) |
Cuyahoga Community College District | | | | | | | | | | |
| 5.00% | | 08/01/26 | | | 1,800,000 | | | | 2,050,074 | | | |
Northeast Ohio Regional Sewer District | | | | | | | | | | |
| 5.00% | | 11/15/38 | | | 12,000,000 | | | | 13,839,000 | | | |
| | | | | | | | | | | | |
| | | | | Principal Amount | | | Fair Value | | | |
Ohio Higher Educational Facility Commission | | | | | | | | | | |
| 6.25% | | 05/01/38 | | $ | 5,000,000 | | | $ | 5,733,900 | | | (l) |
Ohio State Turnpike Commission | | | | | | | | | | |
| 5.25% | | 02/15/39 | | | 6,000,000 | | | | 6,837,660 | | | |
| | | | | | | | | 64,782,604 | | | |
|
Oklahoma — 0.8% |
Oklahoma Capital Improvement Authority | | | | | | | | | | |
| 5.00% | | 07/01/28 - 07/01/29 | | | 5,000,000 | | | | 5,933,760 | | | |
Oklahoma Municipal Power Authority (FGIC Insured) | | | | | | | | | | |
| 4.50% | | 01/01/47 | | | 2,000,000 | | | | 2,014,000 | | | (m) |
Oklahoma Turnpike Authority | | | | | | | | | | |
| 5.00% | | 01/01/28 | | | 3,500,000 | | | | 4,057,165 | | | |
| | | | | | | | | 12,004,925 | | | |
|
Pennsylvania — 4.7% |
City of Philadelphia Water & Wastewater Revenue | | | | | | | | | | |
| 5.00% | | 01/01/36 | | | 8,000,000 | | | | 8,856,880 | | | |
Delaware County Authority | | | | | | | | | | |
| 4.00% | | 08/01/40 | | | 1,200,000 | | | | 1,262,376 | | | |
Delaware River Port Authority | | | | | | | | | | |
| 5.00% | | 01/01/29 | | | 5,000,000 | | | | 5,840,700 | | | |
Pennsylvania Economic Development Financing Authority | | | | | | | | | | |
| 4.00% | | 03/15/40 | | | 4,000,000 | | | | 4,093,520 | | | |
Pennsylvania Higher Educational Facilities Authority | | | | | | | | | | |
| 5.25% | | 08/15/25 | | | 1,750,000 | | | | 2,059,417 | | | |
Pennsylvania Turnpike Commission | | | | | | | | | | |
| 5.00% | | 06/01/29 - 12/01/45 | | | 21,500,000 | | | | 23,889,770 | | | |
| 5.25% | | 06/01/39 | | | 9,500,000 | | | | 10,346,925 | | | |
| 6.00% | | 12/01/34 | | | 12,000,000 | | | | 14,169,240 | | | (j) |
Philadelphia Authority for Industrial Development | | | | | | | | | | |
| 5.00% | | 07/01/42 | | | 4,000,000 | | | | 4,513,600 | | | |
| | | | | | | | | 75,032,428 | | | |
|
Puerto Rico — 0.1% |
Puerto Rico Sales Tax Financing Corp. | | | | | | | | | | |
| 5.50% | | 08/01/28 | | | 5,000,000 | | | | 2,125,000 | | | |
|
Rhode Island — 0.2% |
Rhode Island Health & Educational Building Corp. | | | | | | | | | | |
| 6.25% | | 09/15/34 | | | 1,300,000 | | | | 1,463,735 | | | |
| 6.50% | | 09/15/28 | | | 1,000,000 | | | | 1,139,660 | | | |
| | | | | | | | | 2,603,395 | | | |
See Notes to Schedules of Investments and Notes to Financial Statements.
42
| | |
Elfun Tax-Exempt Income Fund | | December 31, 2015 |
| | | | | | | | | | | | |
| | | | | Principal Amount | | | Fair Value | | | |
|
South Carolina — 1.6% |
Piedmont Municipal Power Agency | | | | | | | | | | |
| 5.00% | | 01/01/25 | | $ | 2,315,000 | | | $ | 2,636,299 | | | |
Piedmont Municipal Power Agency (AGC Insured) | | | | | | | | | | |
| 5.75% | | 01/01/34 | | | 5,500,000 | | | | 6,472,730 | | | (m) |
South Carolina State Public Service Authority | | | | | | | | | | |
| 5.50% | | 01/01/38 | | | 1,190,000 | | | | 1,346,402 | | | (l) |
| 5.50% | | 01/01/38 | | | 13,780,000 | | | | 15,281,331 | | | |
| | | | | | | | | 25,736,762 | | | |
|
Tennessee — 1.8% |
County of Shelby | | | | | | | | | | |
| 5.00% | | 03/01/21 | | | 3,500,000 | | | | 4,032,560 | | | |
Metropolitan Government of Nashville & Davidson County | | | | | | | | | | |
| 5.00% | | 05/15/25 | | | 10,000,000 | | | | 10,590,100 | | | (l) |
State of Tennessee | | | | | | | | | | |
| 5.00% | | 05/01/19 | | | 1,000,000 | | | | 1,093,650 | | | (l) |
Tennessee State School Bond Authority | | | | | | | | | | |
| 5.00% | | 11/01/37 - 11/01/40 | | | 11,150,000 | | | | 13,133,866 | | | |
| | | | | | | | | 28,850,176 | | | |
|
Texas — 8.3% |
City of Austin Water & Wastewater System Revenue | | | | | | | | | | |
| 5.00% | | 11/15/42 | | | 13,595,000 | | | | 15,367,652 | | | |
City of Austin Water & Wastewater System Revenue (AMBAC Insured) | | | | | | | | | | |
| 5.50% | | 11/15/16 | | | 5,450,000 | | | | 5,684,023 | | | (m) |
City of Houston Utility System Revenue | | | | | | | | | | |
| 5.00% | | 05/15/28 - 11/15/33 | | | 10,470,000 | | | | 12,162,193 | | | |
| 5.25% | | 11/15/30 - 11/15/31 | | | 12,000,000 | | | | 13,941,720 | | | |
Dallas/Fort Worth International Airport | | | | | | | | | | |
| 5.25% | | 11/01/29 | | | 5,000,000 | | | | 5,978,800 | | | |
Harris County-Houston Sports Authority | | | | | | | | | | |
| 5.00% | | 11/15/30 | | | 2,000,000 | | | | 2,307,380 | | | |
North Texas Tollway Authority | | | | | | | | | | |
| 5.00% | | 09/01/31 - 01/01/38 | | | 5,500,000 | | | | 6,270,650 | | | |
| 5.75% | | 01/01/38 - 01/01/40 | | | 16,470,000 | | | | 18,013,150 | | | (l) |
| 5.75% | | 01/01/40 | | | 5,005,000 | | | | 5,378,823 | | | |
| 6.00% | | 01/01/38 | | | 5,000,000 | | | | 5,882,250 | | | |
Tarrant Regional Water District | | | | | | | | | | |
| 5.00% | | 03/01/29 | | | 14,000,000 | | | | 16,898,000 | | | |
Texas Transportation Commission State Highway Fund | | | | | | | | | | |
| 5.00% | | 04/01/23 | | | 9,750,000 | | | | 11,924,348 | | | |
| | | | | | | | | | | | |
| | | | | Principal Amount | | | Fair Value | | | |
The University of Texas System | | | | | | | | | | |
| 5.00% | | 08/15/26 | | $ | 10,000,000 | | | $ | 12,592,900 | | | |
| | | | | | | | | 132,401,889 | | | |
|
Utah – 1.8% |
| | | |
County of Utah Transportation Sales Tax Revenue (AGMC Insured) | | | | | | | | | | |
| 4.00% | | 12/01/37 - 12/01/38 | | | 11,830,000 | | | | 12,392,456 | | | (m) |
Utah State Board of Regents | | | | | | | | | | |
| 5.00% | | 11/01/30 | | | 4,000,000 | | | | 4,566,400 | | | |
Utah Transit Authority | | | | | | | | | | |
| 5.00% | | 06/15/42 | | | 10,000,000 | | | | 11,225,700 | | | |
| | | | | | | | | 28,184,556 | | | |
|
Virginia – 0.5% |
| | | |
Virginia Resources Authority | | | | | | | | | | |
| 5.25% | | 11/01/38 | | | 2,390,000 | | | | 2,663,870 | | | (l) |
| 5.25% | | 11/01/38 | | | 2,610,000 | | | | 2,862,439 | | | |
Wise County Industrial Development Authority | | | | | | | | | | |
| 1.88% | | 11/01/40 | | | 2,000,000 | | | | 2,010,540 | | | |
| | | | 7,536,849 | | | |
| | | |
Total Municipal Bonds and Notes
(Cost $1,446,747,853) | | | | | | | 1,558,382,012 | | | |
| | | | | | | | | | | | |
Short-Term Investments – 2.5% |
| | | |
State Street Institutional U.S. Government Money Market Fund — Premier Class | | | | | | | | | | |
0.09% | | | | | | $ | 39,963,873 | | | (d,p) |
(Cost $39,963,873) | | | | | | | | | | |
| | | |
Total Investments
(Cost $1,486,711,726) | | | | | | | 1,598,345,885 | | | |
| | | |
Liabilities in Excess of Other Assets, net — (0.6)% | | | | | | | (10,073,599 | ) | | |
| | | | | | | | | | | | |
| | | |
NET ASSETS — 100.0% | | | | | | $ | 1,588,272,286 | | | |
| | | | | | | | | | | | |
| | | | | | | | | | | | |
See Notes to Schedules of Investments and Notes to Financial Statements.
43
(Unaudited)


William M. Healey
Senior Vice President and Chief Investment Officer — Core Fixed Income Investments

Mark H. Johnson
Senior Vice President and Chief Investment Officer — Insurance and Long Duration
The Elfun Income Fund is co-managed by William M. Healey and Mark H. Johnson. Messrs. Healey and Johnson are each responsible for a portion of the Fund, the size of which is determined by consensus and adjusted on a periodic basis, if necessary. Although each portfolio manager manages his portion of the fund independent of the other, they are highly collaborative and communicative. See portfolio managers’ biographical information beginning on page 98.
| Q. | How did the Elfun Income Fund perform compared to its benchmark for the twelve-month period ended December 31, 2015? |
| A. | For the twelve-month period ended December 31, 2015, the Elfun Income Fund returned 0.22%. The Barclays Capital U.S. Aggregate Bond Index, the Fund’s benchmark, returned 0.55% and the Fund’s Morningstar peer group of 1,086 U.S. Intermediate-Term Funds returned an average of -0.27% over the same period. |
| Q. | What market factors affected the Fund’s performance? |
| A. | The two major factors which affected the Fund’s performance were the movement in interest rates and credit spreads. The 10-year US Treasury note finished the year at 2.3%, up just 10 bps but traded down to 1.65% in January, then moved to 2.5% by the end of June before drifting down by year end as inflation remained well below the Fed’s target of 2%. The 2-year treasury yield, basically unchanged for the first nine months of the year, jumped from 0.65% to 1.05% in the fourth quarter as expectations for a Fed Funds rate hike became reality in December. Economic growth in the US slowed from 3% in Q1 to 2% (Bloomberg estimate) in Q4 as the price of oil plummeted over 30% and the US dollar rose 9% versus a basket of major world currencies. As economic growth decelerated, credit spreads widened putting pressure on corporate bond prices. The option-adjusted spread (OAS) of the Barclays Investment Grade Bond Index widened 35 |
| | bps beginning in May and the OAS of Barclays US High Yield Index hurt primarily by the energy sector widened 180 bps. |
| Q. | What were the primary drivers of Fund performance? |
| A. | The primary driver of the Fund’s underperformance versus its benchmark was the allocation to high yield securities which are not in the index. The significant widening of credit spreads resulted in a negative return for the high yield market of -4.5% and while the Fund was not heavily exposed to energy companies, the allocation was the largest performance detractor. The overweight in high grade corporate bonds also negatively impacted the Fund’s total return. Security selection among the high grade credit sector, primarily underweight commodity-related sectors and overweight financials, and residential mortgage-backed securities contributed positively to the Fund’s performance. Tactically trading the Fund’s duration relative to the index, as treasury yields bounced within a range, also benefited the Fund. |
| Q. | Were there any significant changes to the Fund during the period? |
| A. | The most significant change to the Fund was a general increase in the allocation to spread sectors during the year. The allocation to high grade credit started the year slightly overweight and ended the year 10% overweight by market value, which added roughly 0.3 years to the Fund’s spread duration. The allocation to commercial mortgage-backed securities was also increased from 3% to 10% overweight by market value and from 0.1 to 0.5 spread duration contribution. The Fund’s duration was tactically traded within neutral to 0.5 years long relative to the benchmark during the period. |
44
(Unaudited)

Understanding Your Fund’s Expenses
As a shareholder of the Fund you incur ongoing costs. Ongoing costs include portfolio management fees, professional fees, administrative fees and other Fund expenses. The following example is intended to help you understand your ongoing costs (in dollars) of investing in the Fund and to compare these costs with the ongoing costs of investing in other mutual funds.
To illustrate these ongoing costs, we have provided an example and calculated the expenses paid by investors in units of the Fund during the period. The information in the following table is based on an investment of $1,000, which is invested at the beginning of the period and held for the entire six-month period ended December 31, 2015.
Actual Expenses
The first section of the table provides information about actual account values and actual expenses. You may use the information in this section, together with the amount you invested, to estimate the expenses that you paid over the period. To do so, simply divide your account value by $1,000 (for example, an $8,600 account value divided by $1,000 = 8.6), then multiply the result by the number given under the heading “Expenses paid during
the period” to estimate the expenses you paid on your account during the period.
Hypothetical Example for Comparison Purposes
The second section of the table provides information about hypothetical account values and hypothetical expenses based on the Fund’s actual expense ratio and an assumed rate of return of 5% per year before expenses, which is not the Fund’s actual return. The hypothetical account values and expenses may not be used to estimate the actual ending account balance or expenses you paid for the period. You may use this information to compare the ongoing costs of investing in the Fund and other funds. To do so, compare this 5% hypothetical example with the 5% hypothetical examples that appear in the shareholders reports of other funds.
Please note that the expenses shown in the table are meant to highlight and help you compare ongoing costs only and do not reflect transaction costs, such as sales charges or redemption fees, if any. Therefore, the second section of the table is useful in comparing ongoing costs only, and will not help you determine the relative total costs of owning different funds.
July 1, 2015 – December 31, 2015
| | | | | | | | | | | | |
| | | Account value at
the beginning of
the period ($) | | | Account value
at the end of
the period ($) | | | Expenses
paid during
the period ($)* | |
Actual Fund Return | | | 1,000.00 | | | | 1,002.70 | | | | 1.26 | |
Hypothetical 5% Return
(2.5% for the period) | | | 1,000.00 | | | | 1,023.95 | | | | 1.28 | |
| * | | Expenses are equal to the Fund’s annualized net expense ratio of 0.25%** (for the period July 1, 2015 – December 31, 2015), multiplied by the average account value over the period, multiplied by 184/365 (to reflect the one-half year period). |
| ** | | May differ from expense ratio disclosed in the financial highlights, which is calculated based on the entire fiscal year’s data. |
45
(Unaudited)
A mutual fund designed for investors who seek a high level of income consistent with prudent investment management and the preservation of capital. The Fund seeks to achieve its investment objective by investing at least 80% of its net assets under normal circumstances in debt securities. The Fund invests primarily in a variety of investment-grade debt securities, such as mortgage-backed securities, corporate bonds, U.S. Government securities and money market instruments.
(as a % of Fair Value of Investments of $302,338 (in thousands) on December 31, 2015) (a)(b)
| | | | |
| Moody’s / S&P /Rating * | | Percentage of
Fair Value | |
Aaa / AAA | | | 8.8% | |
Aa / AA | | | 43.4% | |
A / A | | | 9.9% | |
Baa / BBB | | | 21.5% | |
Ba / BB and lower | | | 10.7% | |
NR / Other | | | 5.7% | |
Portfolio composition as a % of Fair Value of Investments of $302,338 (in thousands) on December 31, 2015 (a)(b)
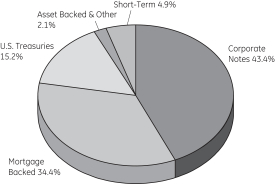
|
| Morningstar Performance Comparison |
Based on average annual returns for periods ended December 31, 2015
| | | | | | | | | | | | |
| | | One
Year | | | Five
Year | | | Ten
Year | |
Number of funds in peer group | | | 1,086 | | | | 990 | | | | 860 | |
Peer group average annual total return | | | -0.27 | % | | | 3.17 | % | | | 3.98 | % |
Morningstar Category in peer group: U.S. Intermediate-Term Bond | |
|
| Change in Value of a $10,000 Investment |
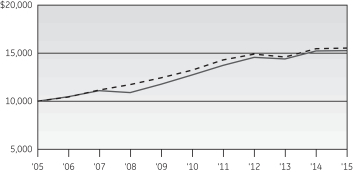

|
| Average Annual Total Return |
For the periods ended December 31, 2015
| | | | | | | | | | | | | | | | | | | | |
| (Inception date: 12/31/84) | | | | | | | | |
| | | One
Year | | Five
Year | | Ten
Year | | Ending value of a
$10,000
investment |
Elfun Income Fund | | | | 0.22% | | | | | 3.71% | | | | | 4.34% | | | | | $15,288 | |
Barclays U.S. Aggregate
Bond Index | | | | 0.55% | | | | | 3.25% | | | | | 4.51% | | | | | $15,552 | |
| (a) | Fair Value basis is inclusive of short-term investment in State Street Institutional U.S. Government Money Market Fund Premier Class. |
| (b) | The securities information regarding holdings, allocations and other characteristics is presented to illustrate examples of securities that the Fund has bought and the diversity of areas in which the Fund may invest as of a particular date. It may not be representative of the Fund’s current or future investments and should not be construed as a recommendation to purchase or sell a particular security. |
See Notes to Performance beginning on page 1 for further information, including an explanation of Morningstar peer categories.
Past performance does not predict future performance. The performance shown in the graphs and tables does not reflect the deduction of taxes that a shareholder would pay on Fund distributions or the redemption of Fund shares.
46
| | |
Elfun Income Fund | | December 31, 2015 |
| | | | | | | | | | | | |
| | | | | Principal
Amount | | | Fair
Value | | | |
Bonds and Notes – 99.1%† |
|
U.S. Treasuries — 15.9% |
| | | |
U.S. Treasury Bonds | | | | | | | | | | |
| 2.50% | | 02/15/45 | | $ | 203,000 | | | $ | 181,765 | | | |
| 3.13% | | 11/15/41 | | | 6,057,000 | | | | 6,244,725 | | | |
| U.S. Treasury Notes | | | | | | | | | | |
| 0.63% | | 05/31/17 | | | 3,318,100 | | | | 3,303,520 | | | (h) |
| 0.75% | | 12/31/17 | | | 2,500,000 | | | | 2,483,313 | | | (h) |
| 0.88% | | 10/15/18 | | | 3,434,000 | | | | 3,396,504 | | | (h) |
| 1.38% | | 10/31/20 | | | 13,847,700 | | | | 13,606,459 | | | (h) |
| 1.88% | | 10/31/22 | | | 12,956,300 | | | | 12,792,545 | | | (h) |
| 2.00% | | 08/15/25 | | | 4,189,900 | | | | 4,085,085 | | | (h) |
| | | | | | | | | 46,093,916 | | | |
|
Agency Mortgage Backed — 24.4% |
| | | |
Federal Home Loan Mortgage Corp. | | | | | | | | | | |
| 4.50% | | 06/01/33 - 02/01/35 | | | 22,438 | | | | 24,258 | | | (h) |
| 5.00% | | 07/01/35 - 06/01/41 | | | 1,299,629 | | | | 1,449,139 | | | (h) |
| 5.50% | | 05/01/20 - 01/01/38 | | | 328,076 | | | | 370,374 | | | |
| 5.50% | | 04/01/39 | | | 67,597 | | | | 74,653 | | | (h) |
| 6.00% | | 04/01/17 - 06/01/37 | | | 226,010 | | | | 255,576 | | | |
| 6.00% | | 04/01/29 - 11/01/37 | | | 562,991 | | | | 639,346 | | | (h) |
| 6.50% | | 07/01/29 | | | 2,107 | | | | 2,399 | | | (h) |
| 7.00% | | 10/01/16 | | | 326 | | | | 328 | | | |
| 7.00% | | 01/01/27 - 08/01/36 | | | 133,169 | | | | 149,716 | | | (h) |
| 7.50% | | 11/01/29 - 09/01/33 | | | 8,351 | | | | 8,901 | | | (h) |
| 8.00% | | 11/01/30 | | | 4,551 | | | | 4,886 | | | (h) |
Federal National Mortgage Assoc. | | | | | | | | | | |
| 2.22% | | 04/01/37 | | | 2,777 | | | | 2,829 | | | (i) |
| 3.00% | | 02/01/43 - 06/01/43 | | | 12,921,839 | | | | 12,963,097 | | | (h) |
| 3.50% | | 11/01/42 - 08/01/45 | | | 7,349,458 | | | | 7,587,184 | | | (h) |
| 4.00% | | 05/01/19 - 06/01/19 | | | 54,917 | | | | 57,247 | | | |
| 4.00% | | 01/01/41 - 03/01/44 | | | 6,504,957 | | | | 6,912,560 | | | (h) |
| 4.50% | | 05/01/18 - 08/01/20 | | | 96,232 | | | | 100,002 | | | |
| 4.50% | | 07/01/33 - 01/01/41 | | | 5,758,638 | | | | 6,230,864 | | | (h) |
| 5.00% | | 07/01/20 | | | 33,234 | | | | 35,342 | | | |
| 5.00% | | 03/01/34 - 06/01/41 | | | 2,112,884 | | | | 2,370,442 | | | (h) |
| 5.50% | | 06/01/20 - 11/01/35 | | | 288,733 | | | | 308,919 | | | |
| 5.50% | | 12/01/32 - 01/01/39 | | | 1,372,754 | | | | 1,541,520 | | | (h) |
| 6.00% | | 05/01/19 - 09/01/21 | | | 36,579 | | | | 38,414 | | | |
| 6.00% | | 01/01/29 - 05/01/41 | | | 3,025,973 | | | | 3,445,916 | | | (h) |
| 6.50% | | 07/01/17 - 05/01/21 | | | 22,630 | | | | 23,540 | | | |
| 6.50% | | 05/01/24 - 08/01/36 | | | 160,853 | | | | 183,842 | | | (h) |
| 7.00% | | 10/01/16 - 08/01/17 | | | 6,298 | | | | 6,447 | | | |
| 7.00% | | 10/01/32 - 02/01/34 | | | 14,629 | | | | 15,574 | | | (h) |
| 7.50% | | 12/01/26 - 12/01/33 | | | 77,577 | | | | 88,331 | | | (h) |
| 8.00% | | 06/01/24 - 01/01/33 | | | 25,817 | | | | 28,912 | | | (h) |
| 8.50% | | 04/01/30 | | | 4,120 | | | | 5,205 | | | (h) |
| 9.00% | | 12/01/17 - 12/01/22 | | | 7,689 | | | | 8,326 | | | (h) |
| 2.50% | | TBA | | | 3,774,641 | | | | 3,796,741 | | | (c) |
| | | | | | | | | | | | |
| | | | | Principal
Amount | | | Fair
Value | | | |
| 3.50% | | TBA | | $ | 2,503,500 | | | $ | 2,582,100 | | | (c) |
| 4.00% | | TBA | | | 1,228,691 | | | | 1,299,845 | | | (c) |
Government National Mortgage Assoc. | | | | | | | | | | |
| 3.00% | | 04/20/43 | | | 1,457,211 | | | | 1,482,174 | | | |
| 3.00% | | 06/20/43 | | | 759,734 | | | | 772,748 | | | (h) |
| 3.50% | | 05/20/43 | | | 2,811,831 | | | | 2,938,294 | | | (h) |
| 4.00% | | 01/20/41 - 04/20/43 | | | 3,324,928 | | | | 3,559,462 | | | (h) |
| 4.50% | | 08/15/33 - 09/15/34 | | | 198,959 | | | | 216,066 | | | |
| 4.50% | | 05/20/40 - 03/20/41 | | | 1,497,577 | | | | 1,631,058 | | | (h) |
| 5.00% | | 08/15/33 | | | 83,580 | | | | 92,947 | | | |
| 6.00% | | 04/15/27 - 09/15/36 | | | 346,683 | | | | 396,922 | | | |
| 6.50% | | 04/15/19 - 09/15/36 | | | 138,302 | | | | 157,896 | | | |
| 7.00% | | 11/15/27 - 10/15/36 | | | 87,269 | | | | 95,961 | | | |
| 7.50% | | 03/15/23 - 11/15/31 | | | 34,242 | | | | 35,738 | | | |
| 8.00% | | 09/15/27 - 06/15/30 | | | 32,043 | | | | 33,488 | | | |
| 8.50% | | 10/15/17 | | | 3,851 | | | | 3,965 | | | |
| 9.00% | | 11/15/16 - 12/15/21 | | | 9,609 | | | | 10,034 | | | |
| 3.00% | | TBA | | | 2,031,275 | | | | 2,058,078 | | | (c) |
| 4.00% | | TBA | | | 2,628,537 | | | | 2,787,591 | | | (c) |
| 5.00% | | TBA | | | 1,167,000 | | | | 1,278,327 | | | (c) |
| 5.50% | | TBA | | | 435,000 | | | | 483,243 | | | (c) |
| | | | | | | | | 70,646,767 | | | |
|
Agency Collateralized Mortgage Obligations — 0.3% |
| | | |
Collateralized Mortgage Obligation Trust | | | | | | | | | | |
| 0.01% | | 11/01/18 | | | 1,492 | | | | 1,483 | | | (d,f) |
Federal Home Loan Mortgage Corp. | | | | | | | | | | |
| 0.08% | | 09/25/43 | | | 1,419,387 | | | | 4,041 | | | (g,i) |
Federal Home Loan Mortgage Corp. REMIC | | | | | | | | | | |
| 3.50% | | 11/15/24 - 11/15/30 | | | 1,041,769 | | | | 84,295 | | | (g) |
| 5.00% | | 02/15/38 | | | 11,268 | | | | 199 | | | (g) |
| 5.50% | | 06/15/33 | | | 75,161 | | | | 15,722 | | | (g) |
| 6.27% | | 08/15/25 | | | 393,512 | | | | 38,768 | | | (g,i) |
| 8.00% | | 04/15/20 | | | 777 | | | | 804 | | | |
Federal Home Loan Mortgage Corp. STRIPS | | | | | | | | | | |
| 1.47% | | 08/01/27 | | | 1,410 | | | | 1,282 | | | (d,f) |
| 5.62% | | 08/15/43 | | | 785,669 | | | | 169,777 | | | (g,i) |
| 8.00% | | 02/01/23 - 07/01/24 | | | 5,182 | | | | 1,089 | | | (g) |
Federal National Mortgage Assoc. REMIC | | | | | | | | | | |
| 0.51% | | 12/25/22 | | | 3,222 | | | | 3,117 | | | (d,f) |
| 1.22% | | 12/25/42 | | | 333,157 | | | | 11,069 | | | (g,i) |
| 5.00% | | 02/25/40 - 09/25/40 | | | 526,128 | | | | 57,438 | | | (g) |
| 5.58% | | 07/25/38 | | | 103,865 | | | | 14,334 | | | (g,i) |
| 8.00% | | 05/25/22 | | | 7 | | | | 113 | | | (g) |
Federal National Mortgage Assoc. STRIPS | | | | | | | | | | |
| 1.87% | | 12/25/34 | | | 83,874 | | | | 77,565 | | | (d,f) |
| 4.50% | | 08/25/35 - 01/25/36 | | | 179,599 | | | | 32,234 | | | (g) |
| 5.00% | | 03/25/38 - 05/25/38 | | | 98,804 | | | | 17,897 | | | (g) |
| 5.50% | | 12/25/33 | | | 24,406 | | | | 4,770 | | | (g) |
| 6.00% | | 01/25/35 | | | 90,304 | | | | 18,633 | | | (g) |
See Notes to Schedules of Investments and Notes to Financial Statements.
47
| | |
Elfun Income Fund | | December 31, 2015 |
| | | | | | | | | | | | |
| | | | | Principal
Amount | | | Fair
Value | | | |
| 7.50% | | 11/25/23 | | $ | 15,563 | | | $ | 3,336 | | | (g) |
| 8.00% | | 08/25/23 - 07/25/24 | | | 10,472 | | | | 2,223 | | | (g) |
| 8.50% | | 03/25/17 - 07/25/22 | | | 4,877 | | | | 574 | | | (g) |
| 9.00% | | 05/25/22 | | | 2,665 | | | | 467 | | | (g) |
Government National Mortgage Assoc. | | | | | | | | | | |
| 4.50% | | 10/20/37 - 08/16/39 | | | 833,848 | | | | 55,261 | | | (g) |
| 5.00% | | 10/20/37 - 09/20/38 | | | 429,307 | | | | 25,385 | | | (g) |
| 5.85% | | 02/20/40 | | | 325,528 | | | | 55,698 | | | (g,i) |
| 6.46% | | 01/16/40 | | | 544,008 | | | | 100,527 | | | (g,i) |
| | | | | | | | | 798,101 | | | |
|
Asset Backed — 0.3% |
| | | |
Capital One Multi-Asset Execution Trust 2006-B1 | | | | | | | | | | |
| 0.61% | | 01/15/19 | | | 500,000 | | | | 499,691 | | | (i) |
Chase Funding Trust 2004-1 | | | | | | | | | | |
| 3.99% | | 11/25/33 | | | 274,709 | | | | 280,537 | | | (j) |
| | | | | | | | | 780,228 | | | |
|
Corporate Notes — 45.2% |
| | | |
21st Century Fox America Inc. | | | | | | | | | | |
| 3.70% | | 10/15/25 | | | 104,000 | | | | 103,812 | | | (b) |
| 4.95% | | 10/15/45 | | | 42,000 | | | | 41,366 | | | (b) |
| 6.65% | | 11/15/37 | | | 248,000 | | | | 288,191 | | | |
ABB Finance USA Inc. | | | | | | | | | | |
| 1.63% | | 05/08/17 | | | 392,000 | | | | 392,279 | | | |
AbbVie Inc. | | | | | | | | | | |
| 1.75% | | 11/06/17 | | | 372,000 | | | | 371,297 | | | |
| 2.00% | | 11/06/18 | | | 423,000 | | | | 421,223 | | | |
| 2.50% | | 05/14/20 | | | 415,000 | | | | 410,897 | | | |
| 3.60% | | 05/14/25 | | | 167,000 | | | | 164,839 | | | |
| 4.70% | | 05/14/45 | | | 85,000 | | | | 83,125 | | | |
ACCO Brands Corp. | | | | | | | | | | |
| 6.75% | | 04/30/20 | | | 426,000 | | | | 438,780 | | | |
ACE INA Holdings Inc. | | | | | | | | | | |
| 2.30% | | 11/03/20 | | | 416,000 | | | | 413,196 | | | |
| 3.15% | | 03/15/25 | | | 292,000 | | | | 288,756 | | | |
| 3.35% | | 05/03/26 | | | 291,000 | | | | 290,161 | | | |
| 4.35% | | 11/03/45 | | | 87,000 | | | | 88,413 | | | |
Actavis Funding SCS | | | | | | | | | | |
| 1.30% | | 06/15/17 | | | 489,000 | | | | 484,371 | | | |
| 3.00% | | 03/12/20 | | | 208,000 | | | | 207,834 | | | |
| 3.45% | | 03/15/22 | | | 292,000 | | | | 292,466 | | | |
| 3.80% | | 03/15/25 | | | 217,000 | | | | 215,912 | | | |
| 4.75% | | 03/15/45 | | | 41,000 | | | | 39,969 | | | |
Activision Blizzard Inc. | | | | | | | | | | |
| 5.63% | | 09/15/21 | | | 428,000 | | | | 448,330 | | | (b) |
Aetna Inc. | | | | | | | | | | |
| 3.50% | | 11/15/24 | | | 260,000 | | | | 259,730 | | | |
Agrium Inc. | | | | | | | | | | |
| 3.38% | | 03/15/25 | | | 104,000 | | | | 94,940 | | | |
| 4.90% | | 06/01/43 | | | 189,000 | | | | 169,069 | | | |
Alibaba Group Holding Ltd. | | | | | | | | | | |
| 4.50% | | 11/28/34 | | | 205,000 | | | | 196,136 | | | |
| | | | | | | | | | | | |
| | | | | Principal
Amount | | | Fair
Value | | | |
Altria Group Inc. | | | | | | | | | | |
| 2.95% | | 05/02/23 | | $ | 210,000 | | | $ | 204,386 | | | |
| 4.50% | | 05/02/43 | | | 210,000 | | | | 199,174 | | | |
America Movil SAB de C.V. | | | | | | | | | | |
| 3.13% | | 07/16/22 | | | 205,000 | | | | 201,426 | | | |
| 5.00% | | 03/30/20 | | | 317,000 | | | | 344,015 | | | |
American Axle & Manufacturing Inc. | | | | | | | | | | |
| 6.25% | | 03/15/21 | | | 279,000 | | | | 288,765 | | | |
| 6.63% | | 10/15/22 | | | 84,000 | | | | 87,990 | | | |
American Campus Communities Operating Partnership LP | | | | | | | | | | |
| 3.35% | | 10/01/20 | | | 167,000 | | | | 166,805 | | | |
| 4.13% | | 07/01/24 | | | 124,000 | | | | 123,135 | | | |
American Electric Power Company Inc. | | | | | | | | | | |
| 2.95% | | 12/15/22 | | | 332,000 | | | | 328,132 | | | |
American Express Co. | | | | | | | | | | |
| 3.63% | | 12/05/24 | | | 215,000 | | | | 210,414 | | | |
American Express Credit Corp. | | | | | | | | | | |
| 2.60% | | 09/14/20 | | | 417,000 | | | | 418,174 | | | |
American International Group Inc. | | | | | | | | | | |
| 3.75% | | 07/10/25 | | | 417,000 | | | | 413,516 | | | |
| 4.13% | | 02/15/24 | | | 125,000 | | | | 128,465 | | | |
| 4.50% | | 07/16/44 | | | 83,000 | | | | 76,762 | | | |
| 4.80% | | 07/10/45 | | | 208,000 | | | | 201,125 | | | |
American Tower Corp. (REIT) | | | | | | | | | | |
| 3.40% | | 02/15/19 | | | 513,000 | | | | 526,332 | | | |
Amgen Inc. | | | | | | | | | | |
| 2.20% | | 05/22/19 | | | 612,000 | | | | 611,321 | | | |
Amkor Technology Inc. | | | | | | | | | | |
| 6.63% | | 06/01/21 | | | 429,000 | | | | 425,783 | | | |
Anadarko Petroleum Corp. | | | | | | | | | | |
| 3.45% | | 07/15/24 | | | 83,000 | | | | 73,772 | | | |
| 6.20% | | 03/15/40 | | | 221,000 | | | | 203,320 | | | |
Anheuser-Busch InBev Worldwide Inc. | | | | | | | | | | |
| 2.50% | | 07/15/22 | | | 515,000 | | | | 495,719 | | | |
Anthem Inc. | | | | | | | | | | |
| 3.30% | | 01/15/23 | | | 211,000 | | | | 205,149 | | | |
Apache Corp. | | | | | | | | | | |
| 5.10% | | 09/01/40 | | | 208,000 | | | | 177,811 | | | |
Apple Inc. | | | | | | | | | | |
| 2.85% | | 05/06/21 | | | 634,000 | | | | 649,572 | | | |
| 3.45% | | 02/09/45 | | | 210,000 | | | | 180,782 | | | |
Aramark Services Inc. | | | | | | | | | | |
| 5.75% | | 03/15/20 | | | 457,000 | | | | 472,709 | | | |
Ascension Health | | | | | | | | | | |
| 4.85% | | 11/15/53 | | | 326,000 | | | | 351,245 | | | |
AstraZeneca PLC | | | | | | | | | | |
| 2.38% | | 11/16/20 | | | 147,000 | | | | 146,006 | | | |
| 3.38% | | 11/16/25 | | | 209,000 | | | | 207,507 | | | |
| 4.38% | | 11/16/45 | | | 83,000 | | | | 83,180 | | | |
See Notes to Schedules of Investments and Notes to Financial Statements.
48
| | |
Elfun Income Fund | | December 31, 2015 |
| | | | | | | | | | | | |
| | | | | Principal
Amount | | | Fair
Value | | | |
AT&T Inc. | | | | | | | | | | |
| 2.38% | | 11/27/18 | | $ | 458,000 | | | $ | 461,529 | | | |
| 2.45% | | 06/30/20 | | | 418,000 | | | | 411,815 | | | |
| 3.40% | | 05/15/25 | | | 421,000 | | | | 404,672 | | | |
| 4.50% | | 05/15/35 | | | 208,000 | | | | 192,391 | | | |
| 4.75% | | 05/15/46 | | | 106,000 | | | | 97,035 | | | |
| 4.80% | | 06/15/44 | | | 163,000 | | | | 149,330 | | | |
AutoNation Inc. | | | | | | | | | | |
| 4.50% | | 10/01/25 | | | 292,000 | | | | 296,440 | | | |
AutoZone Inc. | | | | | | | | | | |
| 3.25% | | 04/15/25 | | | 217,000 | | | | 209,989 | | | |
Bank of America Corp. | | | | | | | | | | |
| 1.70% | | 08/25/17 | | | 1,050,000 | | | | 1,047,081 | | | |
| 2.60% | | 01/15/19 | | | 147,000 | | | | 147,499 | | | |
| 3.88% | | 08/01/25 | | | 82,000 | | | | 83,248 | | | |
| 3.95% | | 04/21/25 | | | 251,000 | | | | 244,439 | | | |
| 4.00% | | 01/22/25 | | | 207,000 | | | | 202,805 | | | |
| 4.10% | | 07/24/23 | | | 218,000 | | | | 225,500 | | | |
| 4.25% | | 10/22/26 | | | 375,000 | | | | 371,226 | | | |
Barclays Bank PLC | | | | | | | | | | |
| 2.25% | | 05/10/17 | | | 1,186,000 | | | | 1,198,625 | | | (b) |
Barclays PLC | | | | | | | | | | |
| 5.25% | | 08/17/45 | | | 205,000 | | | | 206,493 | | | |
Barrick Gold Corp. | | | | | | | | | | |
| 4.10% | | 05/01/23 | | | 66,000 | | | | 56,623 | | | |
Baxalta Inc. | | | | | | | | | | |
| 2.88% | | 06/23/20 | | | 417,000 | | | | 411,996 | | | (b) |
| 4.00% | | 06/23/25 | | | 313,000 | | | | 309,916 | | | (b) |
Bed Bath & Beyond Inc. | | | | | | | | | | |
| 4.92% | | 08/01/34 | | | 61,000 | | | | 54,392 | | | |
Berkshire Hathaway Energy Co. | | | | | | | | | | |
| 6.13% | | 04/01/36 | | | 330,000 | | | | 384,587 | | | |
Berkshire Hathaway Finance Corp. | | | | | | | | | | |
| 3.00% | | 05/15/22 | | | 194,000 | | | | 197,424 | | | |
Berkshire Hathaway Inc. | | | | | | | | | | |
| 4.50% | | 02/11/43 | | | 3,000 | | | | 3,018 | | | |
Berry Plastics Corp. | | | | | | | | | | |
| 5.13% | | 07/15/23 | | | 260,000 | | | | 252,850 | | | |
| 6.00% | | 10/15/22 | | | 200,000 | | | | 203,500 | | | (b) |
BHP Billiton Finance USA Ltd. | | | | | | | | | | |
| 5.00% | | 09/30/43 | | | 115,000 | | | | 104,211 | | | |
Biogen Inc. | | | | | | | | | | |
| 2.90% | | 09/15/20 | | | 207,000 | | | | 206,546 | | | |
| 4.05% | | 09/15/25 | | | 207,000 | | | | 208,074 | | | |
| 5.20% | | 09/15/45 | | | 82,000 | | | | 82,023 | | | |
Bombardier Inc. | | | | | | | | | | |
| 4.75% | | 04/15/19 | | | 164,000 | | | | 134,890 | | | (b) |
| 6.00% | | 10/15/22 | | | 164,000 | | | | 114,964 | | | (b) |
| 7.75% | | 03/15/20 | | | 212,000 | | | | 171,190 | | | (b) |
Boston Scientific Corp. | | | | | | | | | | |
| 3.85% | | 05/15/25 | | | 210,000 | | | | 206,663 | | | |
BP Capital Markets PLC | | | | | | | | | | |
| 1.38% | | 05/10/18 | | | 211,000 | | | | 207,989 | | | |
| 3.81% | | 02/10/24 | | | 200,000 | | | | 199,961 | | | |
| | | | | | | | | | | | |
| | | | | Principal
Amount | | | Fair
Value | | | |
Branch Banking & Trust Co. | | | | | | | | | | |
| 3.63% | | 09/16/25 | | $ | 430,000 | | | $ | 434,258 | | | |
Building Materials Corporation of America | | | | | | | | | | |
| 5.38% | | 11/15/24 | | | 516,000 | | | | 514,710 | | | (b) |
Burlington Northern Santa Fe LLC | | | | | | | | | | |
| 3.65% | | 09/01/25 | | | 145,000 | | | | 146,945 | | | |
Calpine Corp. | | | | | | | | | | |
| 5.75% | | 01/15/25 | | | 251,000 | | | | 221,508 | | | |
| 5.88% | | 01/15/24 | | | 565,000 | | | | 579,125 | | | (b) |
Calumet Specialty Products Partners LP/Calumet Finance Corp. | | | | | | | | | | |
| 6.50% | | 04/15/21 | | | 431,000 | | | | 374,970 | | | |
Canadian Pacific Railway Co. | | | | | | | | | | |
| 2.90% | | 02/01/25 | | | 150,000 | | | | 141,207 | | | |
Capital One Financial Corp. | | | | | | | | | | |
| 4.20% | | 10/29/25 | | | 416,000 | | | | 410,952 | | | |
Caterpillar Inc. | | | | | | | | | | |
| 4.30% | | 05/15/44 | | | 133,000 | | | | 128,342 | | | |
Catholic Health Initiatives | | | | | | | | | | |
| 2.60% | | 08/01/18 | | | 125,000 | | | | 125,517 | | | |
| 4.35% | | 11/01/42 | | | 130,000 | | | | 121,575 | | | |
CBS Corp. | | | | | | | | | | |
| 3.70% | | 08/15/24 | | | 319,000 | | | | 310,397 | | | |
CCO Safari II LLC | | | | | | | | | | |
| 3.58% | | 07/23/20 | | | 313,000 | | | | 311,207 | | | (b) |
| 4.91% | | 07/23/25 | | | 313,000 | | | | 312,692 | | | (b) |
| 6.38% | | 10/23/35 | | | 42,000 | | | | 42,388 | | | (b) |
| 6.48% | | 10/23/45 | | | 83,000 | | | | 83,029 | | | (b) |
Celgene Corp. | | | | | | | | | | |
| 3.88% | | 08/15/25 | | | 417,000 | | | | 415,675 | | | |
| 5.00% | | 08/15/45 | | | 208,000 | | | | 208,796 | | | |
CenturyLink Inc. | | | | | | | | | | |
| 5.80% | | 03/15/22 | | | 862,000 | | | | 790,023 | | | |
Cequel Capital Corp. | | | | | | | | | | |
| 5.13% | | 12/15/21 | | | 484,000 | | | | 435,600 | | | (b) |
Chevron Corp. | | | | | | | | | | |
| 3.33% | | 11/17/25 | | | 292,000 | | | | 294,105 | | | |
Cigna Corp. | | | | | | | | | | |
| 3.25% | | 04/15/25 | | | 417,000 | | | | 409,530 | | | |
Cinemark USA Inc. | | | | | | | | | | |
| 4.88% | | 06/01/23 | | | 431,000 | | | | 420,225 | | | |
Citigroup Inc. | | | | | | | | | | |
| 1.55% | | 08/14/17 | | | 917,000 | | | | 913,293 | | | |
| 1.75% | | 05/01/18 | | | 419,000 | | | | 415,483 | | | |
| 1.85% | | 11/24/17 | | | 200,000 | | | | 199,715 | | | |
| 2.05% | | 12/07/18 | | | 378,000 | | | | 375,995 | | | |
| 2.65% | | 10/26/20 | | | 207,000 | | | | 205,497 | | | |
| 4.40% | | 06/10/25 | | | 209,000 | | | | 211,190 | | | |
| 4.65% | | 07/30/45 | | | 333,000 | | | | 336,805 | | | |
CMS Energy Corp. | | | | | | | | | | |
| 4.88% | | 03/01/44 | | | 209,000 | | | | 211,934 | | | |
See Notes to Schedules of Investments and Notes to Financial Statements.
49
| | |
Elfun Income Fund | | December 31, 2015 |
| | | | | | | | | | | | |
| | | | | Principal
Amount | | | Fair
Value | | | |
CNA Financial Corp. | | | | | | | | | | |
| 5.88% | | 08/15/20 | | $ | 326,000 | | | $ | 361,387 | | | |
CNOOC Nexen Finance 2014 ULC | | | | | | | | | | |
| 4.25% | | 04/30/24 | | | 423,000 | | | | 426,352 | | | |
Cogeco Cable Inc. | | | | | | | | | | |
| 4.88% | | 05/01/20 | | | 400,000 | | | | 399,000 | | | (b) |
Colgate-Palmolive Co. | | | | | | | | | | |
| 4.00% | | 08/15/45 | | | 208,000 | | | | 208,461 | | | |
Columbia Pipeline Group Inc. | | | | | | | | | | |
| 3.30% | | 06/01/20 | | | 292,000 | | | | 284,437 | | | (b) |
| 4.50% | | 06/01/25 | | | 209,000 | | | | 189,434 | | | (b) |
Comcast Corp. | | | | | | | | | | |
| 3.38% | | 08/15/25 | | | 709,000 | | | | 718,198 | | | |
| 4.20% | | 08/15/34 | | | 206,000 | | | | 204,030 | | | |
| 4.60% | | 08/15/45 | | | 210,000 | | | | 212,609 | | | |
ConocoPhillips Co. | | | | | | | | | | |
| 3.35% | | 11/15/24 | | | 416,000 | | | | 380,625 | | | |
Continental Resources Inc. | | | | | | | | | | |
| 3.80% | | 06/01/24 | | | 91,000 | | | | 64,127 | | | |
| 4.50% | | 04/15/23 | | | 82,000 | | | | 58,948 | | | |
| 4.90% | | 06/01/44 | | | 47,000 | | | | 28,349 | | | |
Corp Andina de Fomento | | | | | | | | | | |
| 4.38% | | 06/15/22 | | | 604,000 | | | | 643,018 | | | |
Credit Suisse AG | | | | | | | | | | |
| 1.70% | | 04/27/18 | | | 411,000 | | | | 408,075 | | | |
| 2.60% | | 05/27/16 | | | 405,000 | | | | 407,167 | | | (b) |
Credit Suisse Group Funding Guernsey Ltd. | | | | | | | | | | |
| 3.75% | | 03/26/25 | | | 252,000 | | | | 243,456 | | | (b) |
Crown Americas LLC/Crown Americas Capital Corp. IV | | | | | | | | | | |
| 4.50% | | 01/15/23 | | | 511,000 | | | | 499,503 | | | |
CSX Corp. | | | | | | | | | | |
| 4.50% | | 08/01/54 | | | 124,000 | | | | 112,474 | | | |
CubeSmart LP | | | | | | | | | | |
| 4.00% | | 11/15/25 | | | 116,000 | | | | 115,177 | | | |
CVS Health Corp. | | | | | | | | | | |
| 2.25% | | 08/12/19 | | | 618,000 | | | | 617,417 | | | |
| 3.88% | | 07/20/25 | | | 417,000 | | | | 425,651 | | | |
| 5.13% | | 07/20/45 | | | 312,000 | | | | 328,671 | | | |
Daimler Finance North America LLC | | | | | | | | | | |
| 2.38% | | 08/01/18 | | | 628,000 | | | | 628,956 | | | (b) |
Danaher Corp. | | | | | | | | | | |
| 2.40% | | 09/15/20 | | | 207,000 | | | | 207,016 | | | |
| 3.35% | | 09/15/25 | | | 207,000 | | | | 210,263 | | | |
| 4.38% | | 09/15/45 | | | 112,000 | | | | 115,688 | | | |
Denbury Resources Inc. | | | | | | | | | | |
| 5.50% | | 05/01/22 | | | 431,000 | | | | 143,083 | | | |
| 6.38% | | 08/15/21 | | | 276,000 | | | | 99,360 | | | |
Deutsche Bank AG | | | | | | | | | | |
| 4.50% | | 04/01/25 | | | 423,000 | | | | 389,169 | | | |
Devon Energy Corp. | | | | | | | | | | |
| 5.85% | | 12/15/25 | | | 171,000 | | | | 166,320 | | | |
| | | | | | | | | | | | |
| | | | | Principal
Amount | | | Fair
Value | | | |
Dexia Credit Local S.A. | | | | | | | | | | |
| 2.25% | | 01/30/19 | | $ | 843,000 | | | $ | 848,487 | | | (b) |
Diageo Investment Corp. | | | | | | | | | | |
| 2.88% | | 05/11/22 | | | 506,000 | | | | 501,626 | | | |
DigitalGlobe Inc. | | | | | | | | | | |
| 5.25% | | 02/01/21 | | | 427,000 | | | | 358,680 | | | (b) |
DIRECTV Holdings LLC/DIRECTV Financing Company Inc. | | | | | | | | | | |
| 4.45% | | 04/01/24 | | | 319,000 | | | | 327,669 | | | |
Discover Bank | | | | | | | | | | |
| 3.10% | | 06/04/20 | | | 291,000 | | | | 291,797 | | | |
Dollar General Corp. | | | | | | | | | | |
| 1.88% | | 04/15/18 | | | 410,000 | | | | 406,056 | | | |
| 4.13% | | 07/15/17 | | | 412,000 | | | | 423,095 | | | |
| 4.15% | | 11/01/25 | | | 208,000 | | | | 206,767 | | | |
Dollar Tree Inc. | | | | | | | | | | |
| 5.75% | | 03/01/23 | | | 517,000 | | | | 538,973 | | | (b) |
Dominion Resources Inc. | | | | | | | | | | |
| 1.95% | | 08/15/16 | | | 783,000 | | | | 784,967 | | | |
Dr Pepper Snapple Group Inc. | | | | | | | | | | |
| 3.40% | | 11/15/25 | | | 416,000 | | | | 408,683 | | | |
Duke Energy Progress LLC | | | | | | | | | | |
| 4.15% | | 12/01/44 | | | 125,000 | | | | 122,079 | | | |
Eastman Chemical Co. | | | | | | | | | | |
| 3.60% | | 08/15/22 | | | 416,000 | | | | 414,195 | | | |
Ecopetrol S.A. | | | | | | | | | | |
| 5.88% | | 05/28/45 | | | 104,000 | | | | 73,840 | | | |
Electricite de France S.A. | | | | | | | | | | |
| 2.15% | | 01/22/19 | | | 838,000 | | | | 834,106 | | | (b) |
Eli Lilly & Co. | | | | | | | | | | |
| 3.70% | | 03/01/45 | | | 41,000 | | | | 38,348 | | | |
EMD Finance LLC | | | | | | | | | | |
| 3.25% | | 03/19/25 | | | 208,000 | | | | 197,233 | | | (b) |
Energizer Holdings Inc. | | | | | | | | | | |
| 5.50% | | 06/15/25 | | | 433,000 | | | | 407,020 | | | (b) |
Energy Transfer Equity LP | | | | | | | | | | |
| 5.88% | | 01/15/24 | | | 844,000 | | | | 687,860 | | | |
Energy Transfer Partners LP | | | | | | | | | | |
| 4.05% | | 03/15/25 | | | 83,000 | | | | 68,202 | | | |
| 5.15% | | 03/15/45 | | | 146,000 | | | | 103,206 | | | |
| 6.50% | | 02/01/42 | | | 344,000 | | | | 279,793 | | | |
Ensco PLC | | | | | | | | | | |
| 4.50% | | 10/01/24 | | | 209,000 | | | | 143,932 | | | |
| 5.20% | | 03/15/25 | | | 125,000 | | | | 89,001 | | | |
| 5.75% | | 10/01/44 | | | 86,000 | | | | 56,659 | | | |
Enterprise Products Operating LLC | | | | | | | | | | |
| 3.70% | | 02/15/26 | | | 415,000 | | | | 372,565 | | | |
Equinix Inc. | | | | | | | | | | |
| 5.88% | | 01/15/26 | | | 85,000 | | | | 87,550 | | | |
ERP Operating LP | | | | | | | | | | |
| 4.50% | | 07/01/44 | | | 83,000 | | | | 83,291 | | | |
European Investment Bank | | | | | | | | | | |
| 4.88% | | 01/17/17 | | | 850,000 | | | | 883,759 | | | |
See Notes to Schedules of Investments and Notes to Financial Statements.
50
| | |
Elfun Income Fund | | December 31, 2015 |
| | | | | | | | | | | | |
| | | | | Principal
Amount | | | Fair
Value | | | |
FedEx Corp. | | | | | | | | | | |
| 3.20% | | 02/01/25 | | $ | 130,000 | | | $ | 126,547 | | | |
| 4.10% | | 02/01/45 | | | 2,000 | | | | 1,781 | | | |
Fiat Chrysler Automobiles N.V. | | | | | | | | | | |
| 4.50% | | 04/15/20 | | | 265,000 | | | | 268,313 | | | |
| 5.25% | | 04/15/23 | | | 200,000 | | | | 196,500 | | | |
Five Corners Funding Trust | | | | | | | | | | |
| 4.42% | | 11/15/23 | | | 457,000 | | | | 477,152 | | | (b) |
Florida Power & Light Co. | | | | | | | | | | |
| 4.13% | | 02/01/42 | | | 222,000 | | | | 220,942 | | | |
Ford Motor Credit Company LLC | | | | | | | | | | |
| 3.20% | | 01/15/21 | | | 439,000 | | | | 436,064 | | | |
| 3.22% | | 01/09/22 | | | 440,000 | | | | 430,797 | | | |
| 5.88% | | 08/02/21 | | | 318,000 | | | | 354,627 | | | |
Fresenius Medical Care US Finance Inc. | | | | | | | | | | |
| 5.75% | | 02/15/21 | | | 344,000 | | | | 368,080 | | | (b) |
Frontier Communications Corp. | | | | | | | | | | |
| 7.13% | | 03/15/19 | | | 526,000 | | | | 525,947 | | | |
| 11.00% | | 09/15/25 | | | 393,000 | | | | 389,070 | | | (b) |
General Motors Co. | | | | | | | | | | |
| 5.20% | | 04/01/45 | | | 42,000 | | | | 39,540 | | | |
General Motors Financial Company Inc. | | | | | | | | | | |
| 3.15% | | 01/15/20 | | | 292,000 | | | | 289,404 | | | |
| 3.20% | | 07/13/20 | | | 834,000 | | | | 821,157 | | | |
| 4.30% | | 07/13/25 | | | 417,000 | | | | 404,634 | | | |
Georgia-Pacific LLC | | | | | | | | | | |
| 3.60% | | 03/01/25 | | | 625,000 | | | | 618,069 | | | (b) |
Gilead Sciences Inc. | | | | | | | | | | |
| 2.55% | | 09/01/20 | | | 210,000 | | | | 210,019 | | | |
| 3.65% | | 03/01/26 | | | 235,000 | | | | 237,088 | | | |
| 4.80% | | 04/01/44 | | | 94,000 | | | | 94,296 | | | |
Grupo Televisa SAB | | | | | | | | | | |
| 5.00% | | 05/13/45 | | | 204,000 | | | | 175,272 | | | |
Halliburton Co. | | | | | | | | | | |
| 2.70% | | 11/15/20 | | | 208,000 | | | | 205,682 | | | |
| 3.80% | | 11/15/25 | | | 210,000 | | | | 204,612 | | | |
| 5.00% | | 11/15/45 | | | 125,000 | | | | 123,479 | | | |
HCA Inc. | | | | | | | | | | |
| 4.75% | | 05/01/23 | | | 693,000 | | | | 686,070 | | | |
| 6.50% | | 02/15/20 | | | 392,000 | | | | 427,084 | | | |
HSBC Holdings PLC | | | | | | | | | | |
| 4.25% | | 08/18/25 | | | 201,000 | | | | 199,507 | | | |
HSBC USA Inc. | | | | | | | | | | |
| 2.75% | | 08/07/20 | | | 624,000 | | | | 624,329 | | | |
Hyundai Capital America | | | | | | | | | | |
| 2.13% | | 10/02/17 | | | 189,000 | | | | 187,876 | | | (b) |
Illinois Tool Works Inc. | | | | | | | | | | |
| 3.50% | | 03/01/24 | | | 418,000 | | | | 429,747 | | | |
ING Bank N.V. | | | | | | | | | | |
| 2.70% | | 08/17/20 | | | 200,000 | | | | 200,976 | | | (b) |
| | | | | | | | | | | | |
| | | | | Principal
Amount | | | Fair
Value | | | |
Ingersoll-Rand Luxembourg Finance S.A. | | | | | | | | | | |
| 3.55% | | 11/01/24 | | $ | 291,000 | | | $ | 284,911 | | | |
Ingles Markets Inc. | | | | | | | | | | |
| 5.75% | | 06/15/23 | | | 551,000 | | | | 549,623 | | | |
Intel Corp. | | | | | | | | | | |
| 2.45% | | 07/29/20 | | | 208,000 | | | | 210,469 | | | |
Intelsat Jackson Holdings S.A. | | | | | | | | | | |
| 5.50% | | 08/01/23 | | | 417,000 | | | | 327,345 | | | |
International Business Machines Corp. | | | | | | | | | | |
| 3.63% | | 02/12/24 | | | 426,000 | | | | 438,748 | | | |
Interstate Power & Light Co. | | | | | | | | | | |
| 3.40% | | 08/15/25 | | | 415,000 | | | | 417,500 | | | |
Intesa Sanpaolo S.p.A. | | | | | | | | | | |
| 5.02% | | 06/26/24 | | | 126,000 | | | | 124,028 | | | (b) |
Invesco Finance PLC | | | | | | | | | | |
| 3.13% | | 11/30/22 | | | 573,000 | | | | 565,277 | | | |
JB Poindexter & Company Inc. | | | | | | | | | | |
| 9.00% | | 04/01/22 | | | 120,000 | | | | 125,400 | | | (b) |
JBS USA LLC/JBS USA Finance Inc. | | | | | | | | | | |
| 5.75% | | 06/15/25 | | | 345,000 | | | | 300,150 | | | (b) |
| 5.88% | | 07/15/24 | | | 232,000 | | | | 209,960 | | | (b) |
Jefferies Group LLC | | | | | | | | | | |
| 5.13% | | 01/20/23 | | | 168,000 | | | | 166,693 | | | |
| 6.50% | | 01/20/43 | | | 140,000 | | | | 129,434 | | | |
Johnson Controls Inc. | | | | | | | | | | |
| 4.63% | | 07/02/44 | | | 204,000 | | | | 172,888 | | | |
JPMorgan Chase & Co. | | | | | | | | | | |
| 2.55% | | 10/29/20 | | | 207,000 | | | | 205,157 | | | |
| 3.88% | | 09/10/24 | | | 617,000 | | | | 614,070 | | | |
| 5.00% | | 12/29/49 | | | 299,000 | | | | 284,050 | | | (i) |
| 6.10% | | 10/29/49 | | | 500,000 | | | | 502,550 | | | (i) |
KB Home | | | | | | | | | | |
| 7.00% | | 12/15/21 | | | 506,000 | | | | 499,043 | | | |
Keysight Technologies Inc. | | | | | | | | | | |
| 4.55% | | 10/30/24 | | | 415,000 | | | | 398,993 | | | |
KFW | | | | | | | | | | |
| 2.00% | | 10/04/22 | | | 929,000 | | | | 914,017 | | | |
| 4.50% | | 07/16/18 | | | 238,000 | | | | 255,855 | | | |
Kinder Morgan Energy Partners LP | | | | | | | | | | |
| 3.50% | | 09/01/23 | | | 137,000 | | | | 113,653 | | | |
| 4.30% | | 05/01/24 | | | 214,000 | | | | 184,015 | | | |
Kinder Morgan Inc. | | | | | | | | | | |
| 3.05% | | 12/01/19 | | | 83,000 | | | | 76,845 | | | |
| 4.30% | | 06/01/25 | | | 166,000 | | | | 143,500 | | | |
| 5.55% | | 06/01/45 | | | 125,000 | | | | 97,614 | | | |
Kinross Gold Corp. | | | | | | | | | | |
| 6.88% | | 09/01/41 | | | 30,000 | | | | 16,438 | | | |
Kraft Heinz Foods Co. | | | | | | | | | | |
| 2.80% | | 07/02/20 | | | 626,000 | | | | 624,533 | | | (b) |
| 3.95% | | 07/15/25 | | | 543,000 | | | | 548,257 | | | (b) |
See Notes to Schedules of Investments and Notes to Financial Statements.
51
| | |
Elfun Income Fund | | December 31, 2015 |
| | | | | | | | | | | | |
| | | | | Principal
Amount | | | Fair
Value | | | |
L Brands Inc. | | | | | | | | | | |
| 5.63% | | 02/15/22 | | $ | 443,000 | | | $ | 470,688 | | | |
L-3 Communications Corp. | | | | | | | | | | |
| 1.50% | | 05/28/17 | | | 286,000 | | | | 282,452 | | | |
Lee Enterprises Inc. | | | | | | | | | | |
| 9.50% | | 03/15/22 | | | 347,000 | | | | 319,240 | | | (b) |
Lennar Corp. | | | | | | | | | | |
| 4.50% | | 11/15/19 | | | 516,000 | | | | 524,708 | | | |
| 4.75% | | 05/30/25 | | | 174,000 | | | | 170,085 | | | |
Levi Strauss & Co. | | | | | | | | | | |
| 5.00% | | 05/01/25 | | | 259,000 | | | | 257,705 | | | |
Lockheed Martin Corp. | | | | | | | | | | |
| 2.50% | | 11/23/20 | | | 292,000 | | | | 290,972 | | | |
| 3.55% | | 01/15/26 | | | 417,000 | | | | 419,141 | | | |
| 4.70% | | 05/15/46 | | | 94,000 | | | | 96,728 | | | |
Lowe’s Companies Inc. | | | | | | | | | | |
| 4.38% | | 09/15/45 | | | 165,000 | | | | 169,596 | | | |
LyondellBasell Industries N.V. | | | | | | | | | | |
| 4.63% | | 02/26/55 | | | 83,000 | | | | 67,309 | | | |
Macquarie Bank Ltd. | | | | | | | | | | |
| 4.88% | | 06/10/25 | | | 423,000 | | | | 417,714 | | | (b) |
Marathon Petroleum Corp. | | | | | | | | | | |
| 3.63% | | 09/15/24 | | | 415,000 | | | | 386,922 | | | |
Marsh & McLennan Companies Inc. | | | | | | | | | | |
| 3.50% | | 03/10/25 | | | 288,000 | | | | 283,693 | | | |
| 3.75% | | 03/14/26 | | | 290,000 | | | | 290,018 | | | |
Mattel Inc. | | | | | | | | | | |
| 2.35% | | 05/06/19 | | | 633,000 | | | | 627,730 | | | |
McDonald’s Corp. | | | | | | | | | | |
| 2.75% | | 12/09/20 | | | 113,000 | | | | 112,944 | | | |
| 3.70% | | 01/30/26 | | | 265,000 | | | | 264,848 | | | |
| 4.88% | | 12/09/45 | | | 87,000 | | | | 87,469 | | | |
Mead Johnson Nutrition Co. | | | | | | | | | | |
| 3.00% | | 11/15/20 | | | 291,000 | | | | 291,043 | | | |
| 4.13% | | 11/15/25 | | | 291,000 | | | | 293,339 | | | |
Medtronic Inc. | | | | | | | | | | |
| 2.50% | | 03/15/20 | | | 125,000 | | | | 125,920 | | | |
| 3.50% | | 03/15/25 | | | 500,000 | | | | 505,920 | | | |
| 4.63% | | 03/15/45 | | | 210,000 | | | | 216,516 | | | |
Memorial Sloan-Kettering Cancer Center | | | | | | | | | | |
| 4.13% | | 07/01/52 | | | 165,000 | | | | 153,916 | | | |
Merck & Company Inc. | | | | | | | | | | |
| 2.75% | | 02/10/25 | | | 215,000 | | | | 209,324 | | | |
MetLife Inc. | | | | | | | | | | |
| 3.60% | | 11/13/25 | | | 208,000 | | | | 209,602 | | | |
| 4.05% | | 03/01/45 | | | 104,000 | | | | 96,355 | | | |
| 4.72% | | 12/15/44 | | | 128,000 | | | | 130,720 | | | |
MGM Resorts International | | | | | | | | | | |
| 5.25% | | 03/31/20 | | | 258,000 | | | | 255,420 | | | |
| 6.63% | | 12/15/21 | | | 431,000 | | | | 441,236 | | | |
Microsoft Corp. | | | | | | | | | | |
| 4.00% | | 02/12/55 | | | 217,000 | | | | 194,776 | | | |
| | | | | | | | | | | | |
| | | | | Principal
Amount | | | Fair
Value | | | |
Mid-America Apartments LP | | | | | | | | | | |
| 4.00% | | 11/15/25 | | $ | 209,000 | | | $ | 207,639 | | | |
Mizuho Bank Ltd. | | | | | | | | | | |
| 2.45% | | 04/16/19 | | | 508,000 | | | | 508,372 | | | (b) |
Monsanto Co. | | | | | | | | | | |
| 4.70% | | 07/15/64 | | | 120,000 | | | | 91,115 | | | |
Morgan Stanley | | | | | | | | | | |
| 2.65% | | 01/27/20 | | | 210,000 | | | | 209,502 | | | |
| 3.70% | | 10/23/24 | | | 416,000 | | | | 418,038 | | | |
| 3.95% | | 04/23/27 | | | 417,000 | | | | 404,905 | | | |
| 4.10% | | 05/22/23 | | | 680,000 | | | | 687,434 | | | |
| 4.88% | | 11/01/22 | | | 116,000 | | | | 123,181 | | | |
| 5.00% | | 11/24/25 | | | 161,000 | | | | 171,009 | | | |
Motorola Solutions Inc. | | | | | | | | | | |
| 4.00% | | 09/01/24 | | | 141,000 | | | | 122,376 | | | |
National Agricultural Cooperative Federation | | | | | | | | | | |
| 4.25% | | 01/28/16 | | | 231,000 | | | | 231,379 | | | (b) |
National Retail Properties Inc. | | | | | | | | | | |
| 4.00% | | 11/15/25 | | | 208,000 | | | | 204,362 | | | |
NCL Corporation Ltd. | | | | | | | | | | |
| 4.63% | | 11/15/20 | | | 217,000 | | | | 212,491 | | | (b) |
Newfield Exploration Co. | | | | | | | | | | |
| 5.63% | | 07/01/24 | | | 445,000 | | | | 379,363 | | | |
| 5.75% | | 01/30/22 | | | 451,000 | | | | 399,135 | | | |
Newmont Mining Corp. | | | | | | | | | | |
| 4.88% | | 03/15/42 | | | 158,000 | | | | 112,874 | | | |
Nexen Energy ULC | | | | | | | | | | |
| 6.40% | | 05/15/37 | | | 223,000 | | | | 249,405 | | | |
NIKE Inc. | | | | | | | | | | |
| 3.88% | | 11/01/45 | | | 208,000 | | | | 200,571 | | | |
Noble Energy Inc. | | | | | | | | | | |
| 3.90% | | 11/15/24 | | | 249,000 | | | | 221,743 | | | |
Northern States Power Co. | | | | | | | | | | |
| 2.20% | | 08/15/20 | | | 417,000 | | | | 414,186 | | | |
Northrop Grumman Corp. | | | | | | | | | | |
| 3.85% | | 04/15/45 | | | 49,000 | | | | 44,057 | | | |
Novartis Capital Corp. | | | | | | | | | | |
| 3.00% | | 11/20/25 | | | 552,000 | | | | 544,158 | | | |
| 4.00% | | 11/20/45 | | | 276,000 | | | | 270,077 | | | |
NRG Energy Inc. | | | | | | | | | | |
| 6.25% | | 07/15/22 | | | 257,000 | | | | 222,948 | | | |
Occidental Petroleum Corp. | | | | | | | | | | |
| 3.50% | | 06/15/25 | | | 417,000 | | | | 407,525 | | | |
Omnicom Group Inc. | | | | | | | | | | |
| 3.63% | | 05/01/22 | | | 170,000 | | | | 171,664 | | | |
Oracle Corp. | | | | | | | | | | |
| 2.25% | | 10/08/19 | | | 818,000 | | | | 826,833 | | | |
| 2.95% | | 05/15/25 | | | 215,000 | | | | 209,916 | | | |
| 4.13% | | 05/15/45 | | | 85,000 | | | | 80,448 | | | |
Owens & Minor Inc. | | | | | | | | | | |
| 3.88% | | 09/15/21 | | | 415,000 | | | | 413,384 | | | |
See Notes to Schedules of Investments and Notes to Financial Statements.
52
| | |
Elfun Income Fund | | December 31, 2015 |
| | | | | | | | | | | | |
| | | | | Principal
Amount | | | Fair
Value | | | |
Pacific Gas & Electric Co. | | | | | | | | | | |
| 3.40% | | 08/15/24 | | $ | 617,000 | | | $ | 619,560 | | | |
PacifiCorp | | | | | | | | | | |
| 6.25% | | 10/15/37 | | | 8,000 | | | | 9,895 | | | |
Penn National Gaming Inc. | | | | | | | | | | |
| 5.88% | | 11/01/21 | | | 261,000 | | | | 253,170 | | | |
People’s United Bank NA | | | | | | | | | | |
| 4.00% | | 07/15/24 | | | 478,000 | | | | 472,708 | | | |
PepsiCo Inc. | | | | | | | | | | |
| 3.10% | | 07/17/22 | | | 105,000 | | | | 107,686 | | | |
| 4.25% | | 10/22/44 | | | 123,000 | | | | 122,045 | | | |
| 4.60% | | 07/17/45 | | | 125,000 | | | | 132,170 | | | |
Petrobras Global Finance BV | | | | | | | | | | |
| 3.88% | | 01/27/16 | | | 159,000 | | | | 158,364 | | | |
Petroleos Mexicanos | | | | | | | | | | |
| 3.50% | | 01/30/23 | | | 197,000 | | | | 171,883 | | | |
Pfizer Inc. | | | | | | | | | | |
| 4.40% | | 05/15/44 | | | 131,000 | | | | 133,028 | | | |
Philip Morris International Inc. | | | | | | | | | | |
| 4.13% | | 03/04/43 | | | 209,000 | | | | 197,584 | | | |
Phillips 66 Partners LP | | | | | | | | | | |
| 2.65% | | 02/15/20 | | | 125,000 | | | | 117,981 | | | |
| 3.61% | | 02/15/25 | | | 208,000 | | | | 182,648 | | | |
Pitney Bowes Inc. | | | | | | | | | | |
| 4.63% | | 03/15/24 | | | 358,000 | | | | 350,876 | | | |
Plains All American Pipeline LP/PAA Finance Corp. | | | | | | | | | | |
| 4.65% | | 10/15/25 | | | 125,000 | | | | 109,180 | | | |
PNC Bank NA | | | | | | | | | | |
| 2.40% | | 10/18/19 | | | 440,000 | | | | 441,731 | | | |
Precision Castparts Corp. | | | | | | | | | | |
| 4.38% | | 06/15/45 | | | 125,000 | | | | 125,252 | | | |
Principal Financial Group Inc. | | | | | | | | | | |
| 4.70% | | 05/15/55 | | | 415,000 | | | | 412,510 | | | (i) |
Prologis LP | | | | | | | | | | |
| 3.75% | | 11/01/25 | | | 208,000 | | | | 206,328 | | | |
Prudential Financial Inc. | | | | | | | | | | |
| 5.38% | | 05/15/45 | | | 209,000 | | | | 208,739 | | | (i) |
| 5.63% | | 06/15/43 | | | 257,000 | | | | 262,783 | | | (i) |
Public Service Electric & Gas Co. | | | | | | | | | | |
| 2.38% | | 05/15/23 | | | 632,000 | | | | 605,486 | | | |
QUALCOMM Inc. | | | | | | | | | | |
| 2.25% | | 05/20/20 | | | 166,000 | | | | 164,460 | | | |
| 3.45% | | 05/20/25 | | | 148,000 | | | | 141,979 | | | |
| 4.80% | | 05/20/45 | | | 149,000 | | | | 132,448 | | | |
Quest Diagnostics Inc. | | | | | | | | | | |
| 4.70% | | 03/30/45 | | | 125,000 | | | | 112,563 | | | |
Regency Energy Partners LP/Regency Energy Finance Corp. | | | | | | | | | | |
| 4.50% | | 11/01/23 | | | 292,000 | | | | 252,740 | | | |
Revlon Consumer Products Corp. | | | | | | | | | | |
| 5.75% | | 02/15/21 | | | 1,308,000 | | | | 1,265,490 | | | |
| | | | | | | | | | | | |
| | | | | Principal
Amount | | | Fair
Value | | | |
Reynolds American Inc. | | | | | | | | | | |
| 4.45% | | 06/12/25 | | $ | 126,000 | | | $ | 131,849 | | | |
Rio Tinto Finance USA Ltd. | | | | | | | | | | |
| 3.75% | | 06/15/25 | | | 104,000 | | | | 94,480 | | | |
Roche Holdings Inc. | | | | | | | | | | |
| 3.35% | | 09/30/24 | | | 245,000 | | | | 250,879 | | | (b) |
Rogers Communications Inc. | | | | | | | | | | |
| 5.00% | | 03/15/44 | | | 132,000 | | | | 132,799 | | | |
Rowan Companies Inc. | | | | | | | | | | |
| 5.85% | | 01/15/44 | | | 84,000 | | | | 50,686 | | | |
Royal Bank of Canada | | | | | | | | | | |
| 1.20% | | 09/19/17 | | | 663,000 | | | | 659,903 | | | |
Ryder System Inc. | | | | | | | | | | |
| 2.45% | | 09/03/19 | | | 507,000 | | | | 499,638 | | | |
Santander Bank NA | | | | | | | | | | |
| 2.00% | | 01/12/18 | | | 508,000 | | | | 504,310 | | | |
Santander UK Group Holdings PLC | | | | | | | | | | |
| 4.75% | | 09/15/25 | | | 200,000 | | | | 197,361 | | | (b) |
Schaeffler Holding Finance BV (6.25% Cash/7.00% PIK) | | | | | | | | | | |
| 6.25% | | 11/15/19 | | | 225,000 | | | | 235,125 | | | (b,n) |
Schaeffler Holding Finance BV (6.88% Cash/7.63% PIK) | | | | | | | | | | |
| 6.88% | | 08/15/18 | | | 240,000 | | | | 247,200 | | | (b,n) |
Schlumberger Holdings Corp. | | | | | | | | | | |
| 3.00% | | 12/21/20 | | | 567,000 | | | | 559,759 | | | (b) |
| 4.00% | | 12/21/25 | | | 378,000 | | | | 373,203 | | | (b) |
Sealed Air Corp. | | | | | | | | | | |
| 4.88% | | 12/01/22 | | | 258,000 | | | | 258,645 | | | (b) |
| 5.13% | | 12/01/24 | | | 258,000 | | | | 258,000 | | | (b) |
Shell International Finance BV | | | | | | | | | | |
| 2.25% | | 11/10/20 | | | 417,000 | | | | 410,745 | | | |
| 3.40% | | 08/12/23 | | | 642,000 | | | | 638,350 | | | |
Sinclair Television Group Inc. | | | | | | | | | | |
| 5.38% | | 04/01/21 | | | 452,000 | | | | 453,130 | | | |
Sinopec Capital 2013 Ltd. | | | | | | | | | | |
| 3.13% | | 04/24/23 | | | 336,000 | | | | 320,305 | | | (b) |
Southern California Edison Co. | | | | | | | | | | |
| 2.40% | | 02/01/22 | | | 165,000 | | | | 161,809 | | | |
Spectra Energy Partners LP | | | | | | | | | | |
| 4.75% | | 03/15/24 | | | 205,000 | | | | 198,672 | | | |
Sprint Corp. | | | | | | | | | | |
| 7.25% | | 09/15/21 | | | 235,000 | | | | 175,075 | | | |
| 7.63% | | 02/15/25 | | | 472,000 | | | | 344,560 | | | |
State Street Corp. | | | | | | | | | | |
| 3.55% | | 08/18/25 | | | 415,000 | | | | 428,114 | | | (e) |
Statoil ASA | | | | | | | | | | |
| 3.70% | | 03/01/24 | | | 190,000 | | | | 192,597 | | | |
| 3.95% | | 05/15/43 | | | 104,000 | | | | 93,941 | | | |
Sunoco LP/Sunoco Finance Corp. | | | | | | | | | | |
| 5.50% | | 08/01/20 | | | 173,000 | | | | 163,918 | | | (b) |
SUPERVALU Inc. | | | | | | | | | | |
| 6.75% | | 06/01/21 | | | 433,000 | | | | 391,865 | | | |
See Notes to Schedules of Investments and Notes to Financial Statements.
53
| | |
Elfun Income Fund | | December 31, 2015 |
| | | | | | | | | | | | |
| | | | | Principal
Amount | | | Fair
Value | | | |
T-Mobile USA Inc. | | | | | | | | | | |
| 6.25% | | 04/01/21 | | $ | 69,000 | | | $ | 71,243 | | | |
| 6.50% | | 01/15/26 | | | 130,000 | | | | 131,234 | | | |
| 6.63% | | 04/01/23 | | | 431,000 | | | | 439,620 | | | |
Tampa Electric Co. | | | | | | | | | | |
| 4.35% | | 05/15/44 | | | 204,000 | | | | 199,845 | | | |
Target Corp. | | | | | | | | | | |
| 3.50% | | 07/01/24 | | | 60,000 | | | | 62,282 | | | |
TD Ameritrade Holding Corp. | | | | | | | | | | |
| 2.95% | | 04/01/22 | | | 207,000 | | | | 205,179 | | | |
Teachers Insurance & Annuity Association of America | | | | | | | | | | |
| 4.90% | | 09/15/44 | | | 415,000 | | | | 419,172 | | | (b) |
Teck Resources Ltd. | | | | | | | | | | |
| 2.50% | | 02/01/18 | | | 122,000 | | | | 92,720 | | | |
| 3.15% | | 01/15/17 | | | 174,000 | | | | 156,600 | | | |
Telecom Italia S.p.A. | | | | | | | | | | |
| 5.30% | | 05/30/24 | | | 850,000 | | | | 839,375 | | | (b) |
Tenet Healthcare Corp. | | | | | | | | | | |
| 4.75% | | 06/01/20 | | | 158,000 | | | | 158,790 | | | |
| 6.00% | | 10/01/20 | | | 416,000 | | | | 437,840 | | | |
The Allstate Corp. | | | | | | | | | | |
| 5.75% | | 08/15/53 | | | 235,000 | | | | 241,580 | | | (i) |
The Bank of Tokyo-Mitsubishi UFJ Ltd. | | | | | | | | | | |
| 2.30% | | 03/10/19 | | | 600,000 | | | | 597,615 | | | (b) |
The Boeing Co. | | | | | | | | | | |
| 1.65% | | 10/30/20 | | | 208,000 | | | | 203,630 | | | |
| 2.60% | | 10/30/25 | | | 208,000 | | | | 201,363 | | | |
| 2.85% | | 10/30/24 | | | 291,000 | | | | 288,256 | | | |
The Coca-Cola Co. | | | | | | | | | | |
| 2.88% | | 10/27/25 | | | 416,000 | | | | 410,188 | | | |
The Dow Chemical Co. | | | | | | | | | | |
| 4.25% | | 10/01/34 | | | 213,000 | | | | 192,197 | | | |
The Goldman Sachs Group Inc. | | | | | | | | | | |
| 2.38% | | 01/22/18 | | | 501,000 | | | | 505,362 | | | |
| 2.60% | | 04/23/20 | | | 415,000 | | | | 414,058 | | | |
| 2.63% | | 01/31/19 | | | 207,000 | | | | 208,509 | | | |
| 2.90% | | 07/19/18 | | | 179,000 | | | | 182,501 | | | |
| 3.75% | | 05/22/25 | | | 356,000 | | | | 358,517 | | | |
| 4.00% | | 03/03/24 | | | 208,000 | | | | 213,597 | | | |
| 4.25% | | 10/21/25 | | | 69,000 | | | | 68,515 | | | |
| 4.80% | | 07/08/44 | | | 452,000 | | | | 448,968 | | | |
| 5.15% | | 05/22/45 | | | 209,000 | | | | 202,878 | | | |
The Home Depot Inc. | | | | | | | | | | |
| 3.35% | | 09/15/25 | | | 292,000 | | | | 298,563 | | | |
The Korea Development Bank | | | | | | | | | | |
| 3.25% | | 03/09/16 | | | 380,000 | | | | 381,502 | | | |
| 3.38% | | 09/16/25 | | | 205,000 | | | | 208,724 | | | |
| 4.00% | | 09/09/16 | | | 220,000 | | | | 224,093 | | | |
The Kroger Co. | | | | | | | | | | |
| 2.95% | | 11/01/21 | | | 291,000 | | | | 288,179 | | | |
The Progressive Corp. | | | | | | | | | | |
| 3.70% | | 01/26/45 | | | 168,000 | | | | 152,043 | | | |
| | | | | | | | | | | | |
| | | | | Principal
Amount | | | Fair
Value | | | |
The Toronto-Dominion Bank | | | | | | | | | | |
| 2.50% | | 12/14/20 | | $ | 378,000 | | | $ | 377,831 | | | |
The Williams Companies Inc. | | | | | | | | | | |
| 8.75% | | 03/15/32 | | | 82,000 | | | | 61,814 | | | |
TIAA Asset Management Finance Company LLC | | | | | | | | | | |
| 4.13% | | 11/01/24 | | | 208,000 | | | | 208,820 | | | (b) |
Time Inc. | | | | | | | | | | |
| 5.75% | | 04/15/22 | | | 433,000 | | | | 396,195 | | | (b) |
Time Warner Cable Inc. | | | | | | | | | | |
| 4.50% | | 09/15/42 | | | 42,000 | | | | 32,959 | | | |
| 6.55% | | 05/01/37 | | | 123,000 | | | | 124,407 | | | |
Time Warner Inc. | | | | | | | | | | |
| 3.60% | | 07/15/25 | | | 229,000 | | | | 223,027 | | | |
| 3.88% | | 01/15/26 | | | 382,000 | | | | 378,861 | | | |
| 5.35% | | 12/15/43 | | | 359,000 | | | | 358,175 | | | |
Tyco Electronics Group S.A. | | | | | | | | | | |
| 2.35% | | 08/01/19 | | | 413,000 | | | | 411,650 | | | |
Tyco International Finance S.A. | | | | | | | | | | |
| 5.13% | | 09/14/45 | | | 125,000 | | | | 129,690 | | | |
Tyson Foods Inc. | | | | | | | | | | |
| 2.65% | | 08/15/19 | | | 206,000 | | | | 206,166 | | | |
| 3.95% | | 08/15/24 | | | 137,000 | | | | 140,671 | | | |
| 5.15% | | 08/15/44 | | | 137,000 | | | | 143,069 | | | |
U.S. Bancorp | | | | | | | | | | |
| 3.44% | | 02/01/16 | | | 645,000 | | | | 645,824 | | | |
| 5.13% | | 12/29/49 | | | 417,000 | | | | 418,960 | | | (i) |
UBS Group Funding Jersey Ltd. | | | | | | | | | | |
| 2.95% | | 09/24/20 | | | 200,000 | | | | 198,154 | | | (b) |
| 4.13% | | 09/24/25 | | | 250,000 | | | | 249,897 | | | (b) |
Ultra Petroleum Corp. | | | | | | | | | | |
| 6.13% | | 10/01/24 | | | 428,000 | | | | 97,370 | | | (b) |
United Rentals North America Inc. | | | | | | | | | | |
| 6.13% | | 06/15/23 | | | 340,000 | | | | 347,650 | | | |
UnitedHealth Group Inc. | | | | | | | | | | |
| 2.70% | | 07/15/20 | | | 501,000 | | | | 506,445 | | | |
| 4.75% | | 07/15/45 | | | 332,000 | | | | 349,369 | | | |
US Bank NA | | | | | | | | | | |
| 2.80% | | 01/27/25 | | | 310,000 | | | | 301,849 | | | |
Valeant Pharmaceuticals International Inc. | | | | | | | | | | |
| 6.13% | | 04/15/25 | | | 345,000 | | | | 307,913 | | | (b) |
| 6.38% | | 10/15/20 | | | 229,000 | | | | 220,985 | | | (b) |
Ventas Realty LP | | | | | | | | | | |
| 4.13% | | 01/15/26 | | | 169,000 | | | | 168,463 | | | |
Verizon Communications Inc. | | | | | | | | | | |
| 1.35% | | 06/09/17 | | | 1,018,000 | | | | 1,015,102 | | | |
| 3.50% | | 11/01/24 | | | 207,000 | | | | 204,555 | | | |
| 4.15% | | 03/15/24 | | | 415,000 | | | | 426,745 | | | |
| 4.40% | | 11/01/34 | | | 208,000 | | | | 191,907 | | | |
| 4.67% | | 03/15/55 | | | 146,000 | | | | 126,650 | | | |
| 4.86% | | 08/21/46 | | | 208,000 | | | | 196,782 | | | |
| 5.05% | | 03/15/34 | | | 128,000 | | | | 127,455 | | | |
| 5.15% | | 09/15/23 | | | 229,000 | | | | 251,772 | | | |
| 6.55% | | 09/15/43 | | | 141,000 | | | | 167,392 | | | |
See Notes to Schedules of Investments and Notes to Financial Statements.
54
| | |
Elfun Income Fund | | December 31, 2015 |
| | | | | | | | | | | | |
| | | | | Principal
Amount | | | Fair
Value | | | |
Virgin Media Finance PLC | | | | | | | | | | |
| 5.75% | | 01/15/25 | | $ | 435,000 | | | $ | 418,688 | | | (b) |
Visa Inc. | | | | | | | | | | |
| 2.80% | | 12/14/22 | | | 265,000 | | | | 265,476 | | | |
| 3.15% | | 12/14/25 | | | 265,000 | | | | 265,560 | | | |
| 4.30% | | 12/14/45 | | | 124,000 | | | | 125,685 | | | |
Volkswagen Group of America Finance LLC | | | | | | | | | | |
| 0.81% | | 11/20/17 | | | 206,000 | | | | 197,949 | | | (b,i) |
| 2.13% | | 05/23/19 | | | 152,000 | | | | 144,246 | | | (b) |
| 2.45% | | 11/20/19 | | | 205,000 | | | | 196,574 | | | (b) |
W.R. Grace & Co. | | | | | | | | | | |
| 5.13% | | 10/01/21 | | | 160,000 | | | | 161,600 | | | (b) |
| 5.63% | | 10/01/24 | | | 428,000 | | | | 432,280 | | | (b) |
Wal-Mart Stores Inc. | | | | | | | | | | |
| 4.30% | | 04/22/44 | | | 179,000 | | | | 182,508 | | | |
Wells Fargo & Co. | | | | | | | | | | |
| 2.55% | | 12/07/20 | | | 378,000 | | | | 376,104 | | | |
| 3.00% | | 02/19/25 | | | 208,000 | | | | 202,332 | | | |
| 3.90% | | 05/01/45 | | | 208,000 | | | | 191,778 | | | |
| 4.10% | | 06/03/26 | | | 266,000 | | | | 268,526 | | | |
| 4.30% | | 07/22/27 | | | 167,000 | | | | 170,615 | | | |
| 5.88% | | 12/29/49 | | | 290,000 | | | | 305,225 | | | (i) |
| 5.90% | | 12/29/49 | | | 273,000 | | | | 275,389 | | | (i) |
Williams Partners LP | | | | | | | | | | |
| 5.40% | | 03/04/44 | | | 42,000 | | | | 28,138 | | | |
Windstream Services LLC | | | | | | | | | | |
| 6.38% | | 08/01/23 | | | 400,000 | | | | 288,000 | | | |
WMG Acquisition Corp. | | | | | | | | | | |
| 6.00% | | 01/15/21 | | | 90,000 | | | | 90,450 | | | (b) |
WPP Finance 2010 | | | | | | | | | | |
| 3.75% | | 09/19/24 | | | 415,000 | | | | 413,074 | | | |
WPX Energy Inc. | | | | | | | | | | |
| 5.25% | | 01/15/17 | | | 399,000 | | | | 373,065 | | | |
XLIT Ltd. | | | | | | | | | | |
| 5.25% | | 12/15/43 | | | 175,000 | | | | 180,975 | | | |
Zimmer Biomet Holdings Inc. | | | | | | | | | | |
| 3.55% | | 04/01/25 | | | 208,000 | | | | 202,228 | | | |
| | | | 131,080,864 | | | |
| |
Non-Agency Collateralized Mortgage Obligations — 11.2% | | | |
American Tower Trust I (REIT) | | | |
| 1.55% | | 03/15/43 | | | 627,000 | | | | 612,356 | | | (b) |
Banc of America Commercial Mortgage Trust 2006-4 | | | | | | | | | | |
| 5.68% | | 07/10/46 | | | 190,000 | | | | 193,959 | | | |
Banc of America Commercial Mortgage Trust 2007-1 | | | | | | | | | | |
| 5.48% | | 01/15/49 | | | 880,000 | | | | 901,099 | | | (i) |
Banc of America Commercial Mortgage Trust 2007-4 | | | | | | | | | | |
| 5.74% | | 02/10/51 | | | 27,484 | | | | 28,594 | | | (i) |
Banc of America Commercial Mortgage Trust 2008-1 | | | | | | | | | | |
| 6.22% | | 02/10/51 | | | 142,209 | | | | 150,600 | | | (i) |
| | | | | | | | | | | | |
| | | | | Principal
Amount | | | Fair
Value | | | |
Banc of America Merrill Lynch Commercial Mortgage Inc. 2005-1 | | | | | | | | | | |
| 5.34% | | 11/10/42 | | $ | 96,019 | | | $ | 95,912 | | | (i) |
Banc of America Merrill Lynch Commercial Mortgage Trust 2014-520M | | | | | | | | | | |
| 4.18% | | 08/15/46 | | | 165,040 | | | | 170,505 | | | (b,i) |
Bear Stearns Commercial Mortgage Securities Trust 2006-T22 | | | | | | | | | | |
| 5.62% | | 04/12/38 | | | 210,000 | | | | 211,416 | | | (i) |
Bear Stearns Commercial Mortgage Securities Trust 2007-PW18 | | | | | | | | | | |
| 6.09% | | 06/11/50 | | | 430,000 | | | | 456,312 | | | (i) |
Citigroup Commercial Mortgage Trust 2014-GC23 | | | | | | | | | | |
| 4.51% | | 07/10/47 | | | 834,000 | | | | 695,573 | | | (b,i) |
Citigroup Commercial Mortgage Trust 2015-GC33 | | | | | | | | | | |
| 3.17% | | 09/10/58 | | | 200,411 | | | | 140,055 | | | |
Citigroup Commercial Mortgage Trust 2015-P1 | | | | | | | | | | |
| 3.72% | | 09/15/48 | | | 825,222 | | | | 840,949 | | | |
COMM 2013-CR12 Mortgage Trust | | | | | | | | | | |
| 5.08% | | 10/10/46 | | | 100,000 | | | | 93,926 | | | (b,i) |
COMM 2013-LC13 Mortgage Trust | | | | | | | | | | |
| 4.56% | | 08/10/46 | | | 170,000 | | | | 182,649 | | | (b,i) |
COMM 2014-CR14 Mortgage Trust | | | | | | | | | | |
| 4.53% | | 02/10/47 | | | 240,000 | | | | 257,488 | | | (i) |
COMM 2014-CR19 Mortgage Trust | | | | | | | | | | |
| 4.72% | | 08/10/47 | | | 195,777 | | | | 169,351 | | | (b,i) |
COMM 2014-CR20 Mortgage Trust | | | | | | | | | | |
| 4.51% | | 11/10/47 | | | 204,175 | | | | 198,437 | | | (i) |
COMM 2014-CR21 Mortgage Trust | | | | | | | | | | |
| 3.99% | | 12/10/47 | | | 403,396 | | | | 415,223 | | | |
COMM 2015-CR23 Mortgage Trust | | | | | | | | | | |
| 4.26% | | 05/10/48 | | | 197,046 | | | | 181,555 | | | (i) |
COMM 2015-CR24 Mortgage Trust | | | | | | | | | | |
| 3.46% | | 08/10/55 | | | 401,080 | | | | 297,300 | | | |
| 3.70% | | 08/10/55 | | | 400,511 | | | | 407,044 | | | |
| 4.37% | | 08/10/55 | | | 360,571 | | | | 343,292 | | | (i) |
COMM 2015-LC19 Mortgage Trust | | | | | | | | | | |
| 2.87% | | 02/10/48 | | | 312,000 | | | | 232,156 | | | (b) |
COMM 2015-PC1 Mortgage Trust | | | | | | | | | | |
| 4.44% | | 07/10/50 | | | 196,196 | | | | 195,324 | | | (i) |
Core Industrial Trust 2015-CALW | | | | | | | | | | |
| 3.25% | | 02/10/34 | | | 395,784 | | | | 393,409 | | | (b) |
Credit Suisse Commercial Mortgage Trust 2006-C1 | | | | | | | | | | |
| 5.46% | | 02/15/39 | | | 512,183 | | | | 511,735 | | | (i) |
CSAIL 2015-C2 Commercial Mortgage Trust | | | | | | | | | | |
| 4.21% | | 06/15/57 | | | 135,000 | | | | 104,427 | | | (i) |
See Notes to Schedules of Investments and Notes to Financial Statements.
55
| | |
Elfun Income Fund | | December 31, 2015 |
| | | | | | | | | | | | |
| | | | | Principal
Amount | | | Fair
Value | | | |
CSAIL 2015-C3 Commercial Mortgage Trust | | | | | | | | | | |
| 3.36% | | 08/15/48 | | $ | 240,335 | | | $ | 173,737 | | | (i) |
| 4.11% | | 08/15/48 | | | 320,447 | | | | 313,887 | | | (i) |
GS Mortgage Securities Corp. II 2012-GCJ9 | | | | | | | | | | |
| 2.33% | | 11/10/45 | | | 951,262 | | | | 91,595 | | | (g,i) |
GS Mortgage Securities Corp. Trust 2012-ALOH | | | | | | | | | | |
| 3.55% | | 04/10/34 | | | 210,000 | | | | 215,849 | | | (b) |
GS Mortgage Securities Trust 2011-GC5 | | | | | | | | | | |
| 3.00% | | 08/10/44 | | | 404,023 | | | | 406,043 | | | |
| 5.31% | | 08/10/44 | | | 190,000 | | | | 209,329 | | | (b,i) |
GS Mortgage Securities Trust 2014-GC20 | | | | | | | | | | |
| 4.26% | | 04/10/47 | | | 215,000 | | | | 224,668 | | | |
GS Mortgage Securities Trust 2014-NEW | | | | | | | | | | |
| 3.79% | | 01/10/31 | | | 420,000 | | | | 419,259 | | | (b) |
GS Mortgage Securities Trust 2015-GC28 | | | | | | | | | | |
| 1.17% | | 02/10/48 | | | 2,736,928 | | | | 187,625 | | | (g,i) |
GS Mortgage Securities Trust 2015-GC32 | | | | | | | | | | |
| 3.35% | | 07/10/48 | | | 220,408 | | | | 160,537 | | | |
| 4.41% | | 07/10/48 | | | 103,472 | | | | 99,596 | | | (i) |
GS Mortgage Securities Trust 2015-GC34 | | | | | | | | | | |
| 2.98% | | 10/10/48 | | | 460,912 | | | | 320,034 | | | |
GS Mortgage Securities Trust 2015-GS1 | | | | | | | | | | |
| 3.27% | | 11/10/48 | | | 556,028 | | | | 402,367 | | | |
Impac CMB Trust Series 2004-5 | | | | | | | | | | |
| 1.14% | | 10/25/34 | | | 137,563 | | | | 129,630 | | | (i) |
JP Morgan Chase Commercial Mortgage Securities Corp. 2012-LC9 | | | | | | | | | | |
| 1.87% | | 12/15/47 | | | 1,233,892 | | | | 94,164 | | | (g,i) |
JP Morgan Chase Commercial Mortgage Securities Trust 2006-LDP8 | | | | | | | | | | |
| 5.44% | | 05/15/45 | | | 270,000 | | | | 274,702 | | | |
JP Morgan Chase Commercial Mortgage Securities Trust 2007-CB18 | | | | | | | | | | |
| 5.44% | | 06/12/47 | | | 640,106 | | | | 655,450 | | | |
JPMBB Commercial Mortgage Securities Trust 2013-C12 | | | | | | | | | | |
| 4.03% | | 07/15/45 | | | 125,000 | | | | 129,905 | | | (i) |
JPMBB Commercial Mortgage Securities Trust 2013-C15 | | | | | | | | | | |
| 5.08% | | 11/15/45 | | | 170,000 | | | | 176,758 | | | (i) |
JPMBB Commercial Mortgage Securities Trust 2013-C17 | | | | | | | | | | |
| 4.89% | | 01/15/47 | | | 310,000 | | | | 312,765 | | | (i) |
| | | | | | | | | | | | |
| | | | | Principal
Amount | | | Fair
Value | | | |
JPMBB Commercial Mortgage Securities Trust 2014-C18 | | | | | | | | | | |
| 4.81% | | 02/15/47 | | $ | 125,901 | | | $ | 109,239 | | | (b,i) |
| 4.81% | | 02/15/47 | | | 210,000 | | | | 209,585 | | | (i) |
JPMBB Commercial Mortgage Securities Trust 2015-C29 | | | | | | | | | | |
| 3.70% | | 05/15/48 | | | 394,870 | | | | 294,746 | | | (i) |
JPMBB Commercial Mortgage Securities Trust 2015-C30 | | | | | | | | | | |
| 4.31% | | 07/15/48 | | | 400,742 | | | | 356,768 | | | (i) |
JPMBB Commercial Mortgage Securities Trust 2015-C31 | | | | | | | | | | |
| 3.80% | | 08/15/48 | | | 600,916 | | | | 614,444 | | | |
LB-UBS Commercial Mortgage Trust 2004-C8 | | | | | | | | | | |
| 0.47% | | 12/15/39 | | | 172,925 | | | | 894 | | | (b,g,i) |
LB-UBS Commercial Mortgage Trust 2006-C4 | | | | | | | | | | |
| 5.82% | | 06/15/38 | | | 156,871 | | | | 158,245 | | | (i) |
LB-UBS Commercial Mortgage Trust 2007-C6 | | | | | | | | | | |
| 6.11% | | 07/15/40 | | | 243,078 | | | | 253,850 | | | (i) |
| 6.11% | | 07/15/40 | | | 520,000 | | | | 543,085 | | | (b) |
MASTR Alternative Loan Trust 2003-5 | | | | | | | | | | |
| 5.00% | | 08/25/18 | | | 30,121 | | | | 1,254 | | | (g) |
ML-CFC Commercial Mortgage Trust 2006-3 | | | | | | | | | | |
| 5.46% | | 07/12/46 | | | 570,000 | | | | 579,336 | | | (i) |
Morgan Stanley Bank of America Merrill Lynch Trust 2013-C10 | | | | | | | | | | |
| 4.08% | | 07/15/46 | | | 388,000 | | | | 377,316 | | | (i) |
Morgan Stanley Bank of America Merrill Lynch Trust 2013-C9 | | | | | | | | | | |
| 4.16% | | 05/15/46 | | | 152,326 | | | | 137,884 | | | (b,i) |
Morgan Stanley Bank of America Merrill Lynch Trust 2014-C14 | | | | | | | | | | |
| 4.83% | | 02/15/47 | | | 219,667 | | | | 203,971 | | | (b,i) |
Morgan Stanley Bank of America Merrill Lynch Trust 2014-C15 | | | | | | | | | | |
| 4.90% | | 04/15/47 | | | 585,125 | | | | 530,700 | | | (b,i) |
Morgan Stanley Bank of America Merrill Lynch Trust 2014-C18 | | | | | | | | | | |
| 3.39% | | 10/15/47 | | | 843,762 | | | | 650,430 | | | (b) |
Morgan Stanley Bank of America Merrill Lynch Trust 2014-C19 | | | | | | | | | | |
| 3.25% | | 12/15/47 | | | 242,461 | | | | 180,506 | | | (b) |
Morgan Stanley Bank of America Merrill Lynch Trust 2015-C20 | | | | | | | | | | |
| 1.42% | | 02/15/48 | | | 3,137,524 | | | | 270,901 | | | (g,i) |
Morgan Stanley Bank of America Merrill Lynch Trust 2015-C21 | | | | | | | | | | |
| 0.99% | | 03/15/48 | | | 3,743,993 | | | | 241,422 | | | (g,i) |
Morgan Stanley Bank of America Merrill Lynch Trust 2015-C22 | | | | | | | | | | |
| 3.88% | | 04/15/48 | | | 355,828 | | | | 347,547 | | | (i) |
| 4.24% | | 04/15/48 | | | 990,221 | | | | 803,823 | | | (b,i) |
See Notes to Schedules of Investments and Notes to Financial Statements.
56
| | |
Elfun Income Fund | | December 31, 2015 |
| | | | | | | | | | | | |
| | | | | Principal
Amount | | | Fair
Value | | | |
Morgan Stanley Bank of America Merrill Lynch Trust 2015-C23 | | | | | | | | | | |
| 4.14% | | 07/15/50 | | $ | 1,039,616 | | | $ | 841,096 | | | (b,i) |
Morgan Stanley Bank of America Merrill Lynch Trust 2015-C24 | | | | | | | | | | |
| 3.73% | | 05/15/48 | | | 777,954 | | | | 793,225 | | | |
| 4.35% | | 05/15/48 | | | 801,268 | | | | 793,893 | | | (i) |
Morgan Stanley Capital I Trust 2005-T17 | | | | | | | | | | |
| 4.84% | | 12/13/41 | | | 65,448 | | | | 65,685 | | | (i) |
Morgan Stanley Capital I Trust 2006-IQ11 | | | | | | | | | | |
| 5.78% | | 10/15/42 | | | 250,000 | | | | 249,820 | | | (i) |
Morgan Stanley Capital I Trust 2006-T21 | | | | | | | | | | |
| 5.27% | | 10/12/52 | | | 234,684 | | | | 234,548 | | | (i) |
Morgan Stanley Capital I Trust 2006-T23 | | | | | | | | | | |
| 5.85% | | 08/12/41 | | | 133,241 | | | | 134,175 | | | (i) |
Morgan Stanley Capital I Trust 2007-IQ16 | | | | | | | | | | |
| 6.05% | | 12/12/49 | | | 430,000 | | | | 450,849 | | | (i) |
Morgan Stanley Capital I Trust 2008-T29 | | | | | | | | | | |
| 6.27% | | 01/11/43 | | | 210,000 | | | | 224,995 | | | (i) |
Morgan Stanley Capital I Trust 2012-C4 | | | | | | | | | | |
| 5.21% | | 03/15/45 | | | 190,000 | | | | 204,547 | | | (b,i) |
Morgan Stanley Capital I Trust 2015-MS1 | | | | | | | | | | |
| 4.03% | | 05/15/48 | | | 270,000 | | | | 212,116 | | | (b,i) |
Morgan Stanley Capital I Trust 2015-UBS8 | | | | | | | | | | |
| 3.81% | | 12/15/48 | | | 730,575 | | | | 743,039 | | | |
Wells Fargo Commercial Mortgage Trust 2015-C26 | | | | | | | | | | |
| 1.41% | | 02/15/48 | | | 3,184,875 | | | | 274,539 | | | (g,i) |
Wells Fargo Commercial Mortgage Trust 2015-C29 | | | | | | | | | | |
| 4.01% | | 06/15/48 | | | 589,167 | | | | 600,831 | | | |
| 4.22% | | 06/15/48 | | | 327,315 | | | | 257,158 | | | (i) |
Wells Fargo Commercial Mortgage Trust 2015-C30 | | | | | | | | | | |
| 4.50% | | 09/15/58 | | | 200,306 | | | | 162,918 | | | (b,i) |
Wells Fargo Commercial Mortgage Trust 2015-C31 | | | | | | | | | | |
| 3.70% | | 11/15/48 | | | 400,660 | | | | 406,245 | | | |
Wells Fargo Commercial Mortgage Trust 2015-LC22 | | | | | | | | | | |
| 4.54% | | 09/15/58 | | | 200,550 | | | | 163,923 | | | (i) |
Wells Fargo Commercial Mortgage Trust 2015-NXS2 | | | | | | | | | | |
| 4.25% | | 07/15/58 | | | 200,441 | | | | 157,922 | | | (i) |
Wells Fargo Commercial Mortgage Trust 2015-P2 | | | | | | | | | | |
| 4.90% | | 12/15/48 | | | 1,016,442 | | | | 994,131 | | | (i) |
| | | | | | | | | | | | |
| | | | | Principal
Amount | | | Fair
Value | | | |
Wells Fargo Commercial Mortgage Trust 2015-SG1 | | | | | | | | | | |
| 3.79% | | 12/15/47 | | $ | 520,937 | | | $ | 532,790 | | | |
| 4.47% | | 12/15/47 | | | 200,305 | | | | 188,756 | | | (i) |
Wells Fargo Mortgage Backed Securities Trust 2006-3 | | | | | | | | | | |
| 5.50% | | 03/25/36 | | | 107,679 | | | | 4,323 | | | |
WFRBS Commercial Mortgage Trust 2013-C17 | | | | | | | | | | |
| 4.26% | | 12/15/46 | | | 235,000 | | | | 248,403 | | | |
| 5.13% | | 12/15/46 | | | 170,000 | | | | 161,841 | | | (b,i) |
WFRBS Commercial Mortgage Trust 2013-C18 | | | | | | | | | | |
| 4.67% | | 12/15/46 | | | 230,603 | | | | 214,332 | | | (b,i) |
WFRBS Commercial Mortgage Trust 2014-C19 | | | | | | | | | | |
| 4.23% | | 03/15/47 | | | 400,926 | | | | 336,572 | | | (b) |
| 4.72% | | 03/15/47 | | | 290,000 | | | | 303,842 | | | (i) |
WFRBS Commercial Mortgage Trust 2014-C22 | | | | | | | | | | |
| 3.91% | | 09/15/57 | | | 535,456 | | | | 431,975 | | | (b,i) |
WFRBS Commercial Mortgage Trust 2014-C24 | | | | | | | | | | |
| 3.69% | | 11/15/47 | | | 769,611 | | | | 591,701 | | | (b) |
WFRBS Commercial Mortgage Trust 2014-C25 | | | | | | | | | | |
| 3.80% | | 11/15/47 | | | 96,000 | | | | 73,422 | | | (b,i) |
WFRBS Commercial Mortgage Trust 2014-LC14 | | | | | | | | | | |
| 4.35% | | 03/15/47 | | | 533,000 | | | | 562,433 | | | (i) |
| 4.59% | | 03/15/47 | | | 590,543 | | | | 505,641 | | | (b,i) |
WFRBS Commercial Mortgage Trust 2015-C31 | | | | | | | | | | |
| 3.85% | | 11/15/48 | | | 100,165 | | | | 73,590 | | | |
| | | | 32,539,768 | | | |
| | | |
Sovereign Bonds — 1.1% | | | | | | | | | | |
| | | |
Government of Colombia | | | | | | | | | | |
| 2.63% | | 03/15/23 | | | 323,000 | | | | 283,756 | | | |
| 5.63% | | 02/26/44 | | | 334,000 | | | | 304,775 | | | |
Government of Mexico | | | | | | | | | | |
| 3.60% | | 01/30/25 | | | 319,000 | | | | 310,866 | | | |
| 4.00% | | 10/02/23 | | | 208,000 | | | | 210,704 | | | |
| 4.60% | | 01/23/46 | | | 300,000 | | | | 265,500 | | | |
| 4.75% | | 03/08/44 | | | 398,000 | | | | 362,578 | | | |
Government of Panama | | | | | | | | | | |
| 4.00% | | 09/22/24 | | | 200,000 | | | | 200,000 | | | |
Government of Peru | | | | | | | | | | |
| 4.13% | | 08/25/27 | | | 123,000 | | | | 120,540 | | | |
| 5.63% | | 11/18/50 | | | 67,000 | | | | 68,340 | | | |
Government of Philippines | | | | | | | | | | |
| 3.95% | | 01/20/40 | | | 200,000 | | | | 202,327 | | | |
| 4.20% | | 01/21/24 | | | 200,000 | | | | 216,637 | | | |
See Notes to Schedules of Investments and Notes to Financial Statements.
57
| | |
Elfun Income Fund | | December 31, 2015 |
| | | | | | | | | | | | |
| | | | | Principal
Amount | | | Fair
Value | | | |
Government of Turkey | | | | | | | | | | |
| 3.25% | | 03/23/23 | | $ | 293,000 | | | $ | 268,404 | | | |
| 4.88% | | 04/16/43 | | | 206,000 | | | | 181,280 | | | |
| 6.63% | | 02/17/45 | | | 137,000 | | | | 153,522 | | | |
| | | | | | | | | 3,149,229 | | | |
| |
Municipal Bonds and Notes — 0.7% | | | |
| | | |
American Municipal Power Inc. | | | | | | | | | | |
| 6.27% | | 02/15/50 | | | 275,000 | | | | 319,806 | | | |
Municipal Electric Authority of Georgia | | | | | | | | | | |
| 6.64% | | 04/01/57 | | | 317,000 | | | | 380,435 | | | |
New Jersey Transportation Trust Fund Authority | | | | | | | | | | |
| 6.88% | | 12/15/39 | | | 165,000 | | | | 172,907 | | | |
Port Authority of New York & New Jersey | | | | | | | | | | |
| 4.46% | | 10/01/62 | | | 520,000 | | | | 499,756 | | | |
South Carolina State Public Service Authority | | | | | | | | | | |
| 6.45% | | 01/01/50 | | | 200,000 | | | | 250,514 | | | |
State of California | | | | | | | | | | |
| 5.70% | | 11/01/21 | | | 280,000 | | | | 328,468 | | | |
State of Illinois | | | | | | | | | | |
| 5.10% | | 06/01/33 | | | 125,000 | | | | 118,206 | | | |
| | | | | | | | | 2,070,092 | | | |
| | | |
FNMA (TBA) — 0.0%* | | | | | | | | | | |
| | | |
Lehman TBA | | | | | | | | | | |
| 5.50% | | TBA | | | 155,556 | | | | 8,556 | | | (o,q) |
| | | |
Total Bonds and Notes
(Cost $290,865,806) | | | | | | | 287,167,521 | | | |
| | | | | | | | |
| | | Number
of Shares | | Fair
Value | | | |
Domestic Equity — 0.1% |
|
Preferred Stock — 0.1% |
| | | |
Wells Fargo & Co. | | | | | | | | |
(Cost $322,150) | | 12,886 | | $ | 336,582 | | | |
| | | |
Total Investments in Securities
(Cost $291,187,956) | | | | | 287,504,103 | | | |
| | | | | | | | |
Short-Term Investments — 5.1% | | | | | | | | |
| | | |
State Street Institutional U.S. Government Money Market Fund — Premier Class | | | | | | | | |
0.09% | | | | $ | 14,834,395 | | | (d,h,p) |
(Cost $14,834,395) | | | | | | | | |
| | | |
Total Investments
(Cost $306,022,351) | | | | | 302,338,498 | | | |
| | | |
Liabilities in Excess of Other
Assets, net — (4.3)% | | | | | (12,466,060 | ) | | |
| | | | | | | | |
| | | |
NET ASSETS — 100.0% | | | | $ | 289,872,438 | | | |
| | | | | | | | |
| | | | | | | | |
Centrally Cleared Credit Default Swaps – Sell Protection
| | | | | | | | | | | | | | | | | | | | | | | | | | | | | | | | |
Reference
Entity | | Counterparty | | Notional
Amount
(000s
omitted) | | Contract
annual
Fixed Rate | | Termination
Date | | Market
Value | | Unamortized
Upfront
Payments
Received | | Unrealized
Appreciation |
Markit CDX North America High Yield Index | | CME Group Inc. | | | $ | 3,300 | | | | | 5.00 | % | | | | 12/20/20 | | | | $ | 42,342 | | | | $ | (17,656 | ) | | | $ | 59,998 | |
See Notes to Schedules of Investments and Notes to Financial Statements.
58
| | |
Elfun Income Fund | | December 31, 2015 |
The Fund had the following long futures contracts open at December 31, 2015:
| | | | | | | | | | | | | | | | | |
| Description | | Expiration
date | | Number
of
Contracts | | Current
Notional
Value | | Unrealized
Appreciation
(Depreciation) |
Ultra Long-Term U.S. Treasury Bond Futures | | March 2016 | | | | 24 | | | | $ | 3,808,500 | | | | $ | 8,510 | |
2 Yr. U.S. Treasury Notes Futures | | March 2016 | | | | 160 | | | | | 34,757,500 | | | | | (72,283 | ) |
| | | | | | | | | | | | | | | | | |
| | | | | | | | | | | | | | | $ | (63,773 | ) |
| | | | | | | | | | | | | | | | | |
The Fund had the following short futures contracts open at December 31, 2015:
| | | | | | | | | | | | | | | | | |
| Description | | Expiration
date | | Number
of
Contracts | | Current
Notional
Value | | Unrealized
Appreciation
(Depreciation) |
U.S. Long Bond Futures | | March 2016 | | | | 2 | | | | $ | (307,500 | ) | | | $ | (1,317 | ) |
5 Yr. U.S. Treasury Notes Futures | | March 2016 | | | | 49 | | | | | (5,797,695 | ) | | | | 9,051 | |
10 Yr. U.S. Treasury Notes Futures | | March 2016 | | | | 276 | | | | | (34,750,125 | ) | | | | 221,840 | |
| | | | | | | | | | | | | | | | | |
| | | | | | | | | | $ | 229,574 | |
| | | | | | | | | | | | | | | | | |
| | | | | | | | | | $ | 165,801 | |
| | | | | | | | | | | | | | | | | |
See Notes to Schedules of Investments and Notes to Financial Statements.
59
(Unaudited)

SSgA Funds Management, Inc. (“SSgA FM”) is the sub-adviser to the Elfun Government Money Market Fund. SSgA FM is registered with the SEC as an investment adviser under the Investment Advisers Act of 1940, as amended, and is a wholly owned subsidiary of State Street Corporation (State Street), a publicly held bank holding company. SSgA FM, and other advisory affiliates of State Street make up State Street Global Advisors (SSgA), the investment management arm of State Street. The Fund is managed by a team of portfolio managers and the key professionals involved in the day-to-day portfolio management for the Fund include: Jeff A. St. Peters and Todd N. Bean. See portfolio managers’ biographical information beginning on page 98.
| Q. | How did the Elfun Government Money Market Fund perform compared to its benchmark for the twelve-month period ended December 31, 2015? |
| A. | For the twelve-month period ended December 31, 2015, the Elfun Government Money Market Fund returned 0.08%. The 90-day Treasury Bill, the Fund’s benchmark, returned 0.05% over the same period. |
| Q. | What market factors affected the Fund’s performance? |
| A. | There were two market factors that affected the Fund’s performance. First the Federal Reserve’s rate hike and second the debt ceiling debate. |
| | It was anticipated the Fed would raise their benchmark interest rate at some point in 2015. Early in the year market participants expected rates to rise at the June meeting. Hopes were dashed as winter weather dampened economic output and put the Fed on hold. As spring and summer took hold once again the Fed’s possible hike at their September meeting became a likely scenario. But global fears took over and put the Fed on hold once again. It was not until we received strong economic data in the fourth quarter coupled with comments by Fed officials that a December hike became a reality. |
| | The second challenge for the short term markets was the debt ceiling debate. Given the negotiations in Washington took longer than expected the US treasury began paying down their Treasury Bill issuance. 1 month Bills auctions shrank to as little as $5 billion in size from $30 billion. This caused all Treasury Bills from 1 week to 12 weeks to trade at negative yields at certain points in the cycle. |
| Q. | What were the primary drivers of Fund performance? |
| A. | The primary drivers of the Fund’s performance were the use of floating rate notes. Both US Treasury and US Government Agency Floating rate notes were used in the portfolio and continue to be core positions. These floating rate notes can offer a pickup in yield to fixed rate offerings while allowing the portfolio manager to manage duration risk more closely. |
| | The portfolio manager also purchased US treasury coupons and US government agency coupons when they saw a relative value advantage to the equivalent discounted securities. |
| Q. | Were there any significant changes to the Fund during the period? |
| A. | There were no significant changes to the Fund during the period. The Fund abides by the SEC’s Rule 2a-7 for Government Money Market Fund strategies. The holdings were balanced throughout the year and did not see any significant shift in investment type. |
60
(Unaudited)

Understanding Your Fund’s Expenses
As a shareholder of the Fund you incur ongoing costs. Ongoing costs include portfolio management fees, professional fees, administrative fees and other Fund expenses. The following example is intended to help you understand your ongoing costs (in dollars) of investing in the Fund and to compare these costs with the ongoing costs of investing in other mutual funds.
To illustrate these ongoing costs, we have provided an example and calculated the expenses paid by investors in units of the Fund during the period. The information in the following table is based on an investment of $1,000, which is invested at the beginning of the period and held for the entire six-month period ended December 31, 2015.
Actual Expenses
The first section of the table provides information about actual account values and actual expenses. You may use the information in this section, together with the amount you invested, to estimate the expenses that you paid over the period. To do so, simply divide your account value by $1,000 (for example, an $8,600 account value divided by $1,000 = 8.6), then multiply the result by the number given under the heading “Expenses paid during
the period” to estimate the expenses you paid on your account during the period.
Hypothetical Example for Comparison Purposes
The second section of the table provides information about hypothetical account values and hypothetical expenses based on the Fund’s actual expense ratio and an assumed rate of return of 5% per year before expenses, which is not the Fund’s actual return. The hypothetical account values and expenses may not be used to estimate the actual ending account balance or expenses you paid for the period. You may use this information to compare the ongoing costs of investing in the Fund and other funds. To do so, compare this 5% hypothetical example with the 5% hypothetical examples that appear in the shareholders reports of other funds.
Please note that the expenses shown in the table are meant to highlight and help you compare ongoing costs only and do not reflect transaction costs, such as sales charges or redemption fees, if any. Therefore, the second section of the table is useful in comparing ongoing costs only, and will not help you determine the relative total costs of owning different funds.
July 1, 2015 – December 31, 2015
| | | | | | | | | | | | |
| | | Account value at
the beginning of
the period ($) | | | Account value
at the end of
the period ($) | | | Expenses
paid during
the period ($)* | |
Actual Fund Return | | | 1,000.00 | | | | 1,000.80 | | | | 0.55 | |
Hypothetical 5% Return
(2.5% for the period) | | | 1,000.00 | | | | 1,024.65 | | | | 0.56 | |
| * | | Expenses are equal to the Fund’s annualized net expense ratio of 0.11%** (for the period July 1, 2015 – December 31, 2015), multiplied by the average account value over the period, multiplied by 184/365 (to reflect the one-half year period). |
| ** | | May differ from expense ratio disclosed in the financial highlights, which is calculated based on the entire fiscal year’s data. |
61
(Unaudited)
A mutual fund designed for investors who seek a high level of current income consistent with prudent investment management and the preservation of capital. The Fund seeks to achieve its investment objective by investing at least 99.5% of its assets under normal circumstances in short-term, U.S. Government securities, cash and/or repurchase agreements that are collateralized by cash or government securities.
Portfolio composition as a % of Fair Value of Investments of $130,929 (in thousands) on December 31, 2015 (a)
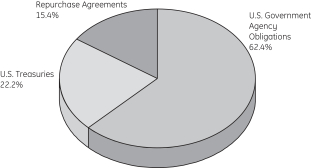
|
| Change in Value of a $10,000 Investment |
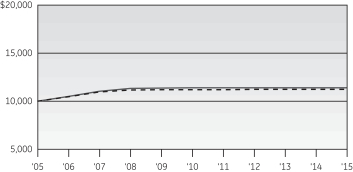

|
| Average Annual Total Return |
For the Periods Ended December 31, 2015
| | | | | | | | | | | | | | | | | | | | |
| (Inception date: 6/13/90) | | | | | | |
| | | One
Year | | Five
Year | | Ten
Year | | Ending Value of a
$10,000
Investment |
Elfun Government Money Market Fund | | | | 0.08% | | | | | 0.05% | | | | | 1.34% | | | | | $11,420 | |
90 Day U.S. T-Bill | | | | 0.05% | | | | | 0.06% | | | | | 1.11% | | | | | $11,235 | |
| (a) | The securities information regarding holdings, allocations and other characteristics is presented to illustrate examples of securities that the Fund has bought and the diversity of areas in which the Fund may invest as of a particular date. It may not be representative of the Fund’s current or future investments and should not be construed as a recommendation to purchase or sell a particular security. |
See Notes to Performance beginning on page 1 for further information, including an explanation of Morningstar peer categories.
Past performance does not predict future performance. The performance shown in the graphs and tables does not reflect the deduction of taxes that a shareholder would pay on Fund distributions or the redemption of Fund shares.
An investment in the Elfun Government Money Market Fund is not insured or guaranteed by the Federal Deposit Insurance
Corporation or by any other Government agency. Although the Fund seeks to preserve the value of your investment at $1.00 per
unit, it is possible to lose money by investing in the Fund.
62
| | |
Elfun Government Money Market Fund | | December 31, 2015 |
| | | | | | |
| Elfun Government Money Market Fund |
| | | | | | | | | | | | |
| | | | | Principal
Amount | | | Amortized
Cost | | | |
Short-Term Investments — 101.5%† | | | |
| |
U.S. Treasuries — 22.6% | | | |
| | | |
U.S. Treasury Bills | | | | | | | | | | |
| 0.06% | | 01/07/16 | | $ | 13,000,000 | | | $ | 12,999,875 | | | (d) |
| 0.07% | | 01/14/16 | | | 5,000,000 | | | | 4,999,872 | | | (d) |
| 0.12% | | 02/04/16 | | | 5,000,000 | | | | 4,999,455 | | | (d) |
| 0.14% | | 02/25/16 | | | 3,000,000 | | | | 2,999,358 | | | (d) |
| 0.15% | | 02/18/16 | | | 3,000,000 | | | | 2,999,420 | | | (d) |
| 0.18% | | 03/17/16 | | | 125,000 | | | | 124,953 | | | (d) |
| | | | | | | | | 29,122,933 | | | |
| | |
U.S. Government Agency Obligations — 63.3% | | | | | | | |
| | | |
Fannie Mae Discount Notes | | | | | | | | | | |
| 0.06% | | 01/27/16 | | | 200,000 | | | | 199,991 | | | (d) |
| 0.07% | | 02/03/16 | | | 350,000 | | | | 349,979 | | | (d) |
| 0.08% | | 01/13/16 - 01/20/16 | | | 1,300,000 | | | | 1,299,952 | | | (d) |
| 0.09% | | 01/06/16 - 01/08/16 | | | 2,100,000 | | | | 2,099,970 | | | (d) |
| 0.15% | | 02/17/16 | | | 500,000 | | | | 499,902 | | | (d) |
| 0.20% | | 02/24/16 | | | 750,000 | | | | 749,775 | | | (d) |
| 0.34% | | 03/30/16 | | | 400,000 | | | | 399,669 | | | (d) |
| 0.38% | | 04/06/16 | | | 1,500,000 | | | | 1,498,480 | | | (d) |
| 0.40% | | 03/16/16 | | | 1,000,000 | | | | 999,167 | | | (d) |
Federal Farm Credit Banks | | | | | | | | | | |
| 0.24% | | 01/05/16 | | | 750,000 | | | | 750,000 | | | (i) |
| 0.27% | | 01/11/16 | | | 725,000 | | | | 725,000 | | | (i) |
| 0.28% | | 09/09/16 | | | 400,000 | | | | 400,004 | | | (i) |
| 0.32% | | 02/18/16 | | | 1,000,000 | | | | 999,988 | | | (i) |
| 0.41% | | 10/26/16 | | | 700,000 | | | | 700,000 | | | (i) |
Federal Farm Credit Discount Notes | | | | | | | | | | |
| 0.09% | | 01/19/16 | | | 300,000 | | | | 299,986 | | | (d) |
| 0.18% | | 01/21/16 - 01/28/16 | | | 400,000 | | | | 399,951 | | | (d) |
Federal Home Loan Bank Discount Notes | | | | | | | | | | |
| 0.10% | | 01/05/16 | | | 700,000 | | | | 699,993 | | | (d) |
| 0.11% | | 01/04/16 - 01/13/16 | | | 14,900,000 | | | | 14,899,670 | | | (d) |
| 0.12% | | 01/15/16 - 01/27/16 | | | 5,500,000 | | | | 5,499,688 | | | (d) |
| 0.15% | | 01/28/16 | | | 600,000 | | | | 599,935 | | | (d) |
| 0.17% | | 02/05/16 | | | 1,000,000 | | | | 999,839 | | | (d) |
| 0.37% | | 04/01/16 | | | 2,500,000 | | | | 2,497,678 | | | (d) |
| 0.38% | | 03/30/16 | | | 1,000,000 | | | | 999,073 | | | (d) |
| 0.40% | | 03/23/16 | | | 3,000,000 | | | | 2,997,280 | | | (d) |
Federal Home Loan Banks | | | | | | | | | | |
| 0.23% | | 07/08/16 | | | 1,000,000 | | | | 1,000,000 | | | (i) |
| 0.26% | | 08/12/16 | | | 2,000,000 | | | | 2,000,000 | | | (i) |
| 0.28% | | 07/15/16 | | | 2,000,000 | | | | 2,000,000 | | | (i) |
| 0.37% | | 06/24/16 | | | 2,665,000 | | | | 2,665,000 | | | (i) |
| 0.39% | | 09/20/16 | | | 1,000,000 | | | | 1,000,000 | | | (i) |
| 0.40% | | 01/25/16 | | | 1,000,000 | | | | 1,000,000 | | | (i) |
| | | | | | | | | | | | |
| | | | | Principal
Amount | | | Amortized
Cost | | | |
Federal Home Loan Mortgage Corp. | | | | | | | | | | |
| 0.30% | | 08/17/16 | | $ | 1,200,000 | | | $ | 1,200,000 | | | (i) |
| 0.37% | | 08/24/16 | | | 1,250,000 | | | | 1,250,000 | | | (i) |
Freddie Mac Discount Notes | | | | | | | | | | |
| 0.07% | | 01/25/16 | | | 200,000 | | | | 199,991 | | | (d) |
| 0.09% | | 01/14/16 - 01/20/16 | | | 6,600,000 | | | | 6,599,729 | | | (d) |
| 0.10% | | 01/04/16 | | | 200,000 | | | | 199,998 | | | (d) |
| 0.12% | | 01/07/16 | | | 3,000,000 | | | | 2,999,940 | | | (d) |
| 0.14% | | 01/15/16 - 02/11/16 | | | 4,100,000 | | | | 4,099,668 | | | (d) |
| 0.15% | | 03/04/16 | | | 800,000 | | | | 799,790 | | | (d) |
| 0.18% | | 02/09/16 | | | 1,000,000 | | | | 999,810 | | | (d) |
| 0.20% | | 02/17/16 | | | 2,000,000 | | | | 1,999,478 | | | (d) |
| 0.23% | | 01/08/16 - 03/09/16 | | | 4,500,000 | | | | 4,498,680 | | | (d) |
| 0.27% | | 02/26/16 | | | 2,200,000 | | | | 2,199,079 | | | (d) |
| 0.28% | | 03/14/16 | | | 1,400,000 | | | | 1,399,205 | | | (d) |
| 0.43% | | 03/08/16 | | | 1,000,000 | | | | 999,200 | | | (d) |
| 0.45% | | 04/11/16 | | | 1,000,000 | | | | 998,737 | | | (d) |
| | | | | | | | | 81,673,275 | | | |
| | |
Repurchase Agreements — 15.6% | | | | | | | |
| | | |
Citigroup Global Markets, Inc. U.S. Treasury Repo 0.32% dated 12/31/15, to be repurchased at $9,000,080 on 01/04/16 collateralized by $9,180,019 U.S. Treasury Note, 2.00%, maturing on 09/30/20, respectively. 01/04/16 | | | 9,000,000 | | | | 9,000,000 | | | |
| | | |
Merrill Lynch, Pierce, Fenner & Smith, Inc. U.S. Treasury Repo 0.29% dated 12/31/15, to be repurchased at $11,133,090 on 01/04/16 collateralized by $11,355,750 U.S. Treasury Note, 1.38%, maturing on 02/29/20. 01/04/16 | | | 11,133,000 | | | | 11,133,000 | | | |
| | | | | | | | | 20,133,000 | | | |
| | | |
Total Short-Term Investments
(Cost $130,929,208) | | | | | | | 130,929,208 | | | |
| | | |
Liabilities in Excess of Other Assets, net — (1.5)% | | | | | | | (1,890,440 | ) | | |
| | | | | | | | | | | | |
| | | |
NET ASSETS — 100.0% | | | | | | $ | 129,038,768 | | | |
| | | | | | | | | | | | |
See Notes to Schedules of Investments and Notes to Financial Statements.
63

December 31, 2015
The views expressed in this document reflect our judgment as of the publication date and are subject to change at any time without notice. The securities cited may not be representative of the Funds’ future investments and should not be construed as a recommendation to purchase or sell a particular security. See each Funds’ summary prospectus and the Funds’ statutory prospectus for complete descriptions of investment objectives, policies, risks and permissible investments.
| (a) | Non-income producing security. |
| (b) | Pursuant to Rule 144A of the Securities Act of 1933, as amended, these securities may be resold in transactions exempt from registration, normally to qualified institutional buyers. At December 31, 2015, these securities amounted to $7,916,176 and $34,949,769 or 3.78% and 12.06% of the net assets of the Elfun Diversified Fund and Elfun Income Fund, respectively. These securities have been determined to be liquid using procedures established by the Fund’s Board of Directors. |
| (c) | Settlement is on a delayed delivery or when-issued basis with final maturity to be announced (TBA) in the future. |
| (d) | Coupon amount represents effective yield. |
| (e) | State Street Corp. is the parent company of State Street Bank & Trust Co., the Fund’s sub-administrator, custodian and accounting agent. |
| (f) | Principal only security. These securities represent the right to receive the monthly principal payments on an underlying pool of mortgages. No payments of interest on the pool are passed through to the “principal only” holder. |
| (g) | Interest only security. These securities represent the right to receive the monthly interest payments on an underlying pool of mortgages. Payments of principal on the pool reduce the value of the “interest only” holding. |
| (h) | At December 31, 2015, all or a portion of this security was pledged to cover collateral requirements for futures, swaps and/or TBA’s. |
| (i) | Variable or floating rate security. The stated rate represents the rate at December 31, 2015. |
| (k) | Escrowed to maturity Bonds are collateralized by U.S. Treasury securities which are held in escrow by a trustee and are used to pay principal and interest on such bonds. |
| (l) | Pre-refunded Bonds are collateralized by U.S. Treasury securities, which are held in escrow by a trustee and are used to pay principal and interest on the tax-exempt issue to retire the bonds at the earliest refunding date. |
| (m) | The security is insured by AGC, AGMC, AMBAC, FGIC or NPFG. The Elfun Tax-Exempt Fund had no insurance concentrations of 5% or greater as of December 31, 2015 (as a percentage of net assets). |
| (n) | Represents a payment-in-kind security which may pay all or a portion of interest in additional par. |
| (o) | Security is in default. |
| (p) | Sponsored by SSGA Funds Management, Inc., an affiliate of State Street Bank & Trust Co., the Fund’s sub-administrator, custodian and accounting agent. |
| (q) | Security is fair valued by the Valuation Committee, in accordance with the procedures approved by GEAM’s Board of Trustees. |
| † | Percentages are based on net assets as of December 31, 2015. |
Abbreviations:
| | | | |
| ADR | | — | | American Depositary Receipt |
| | |
| AGC | | — | | Assured Guaranty Corporation |
| | |
| AGMC | | — | | Assured Guaranty Municipal Company |
| | |
| AMBAC | | — | | AMBAC Indemnity Corporation |
| | |
| FGIC | | — | | Financial Guaranty Insurance Corporation |
| | |
| NPFG | | — | | National Public Finance Guaranty Corporation |
| | |
| REIT | | — | | Real Estate Investment Trust |
| | |
| REMIC | | — | | Real Estate Mortgage Investment Conduit |
| | |
| SPDR | | — | | Standard and Poor’s Depositary Receipt |
| | |
| STRIPS | | — | | Separate Trading of Registered Interest and Principal of Security |
| | |
| TBA | | — | | To Be Announced |
64

Selected data based on a share outstanding throughout the fiscal years indicated
| | | | | | | | | | | | | | | | | | | | |
| Elfun International Equity Fund | | 12/31/15 | | | 12/31/14 | | | 12/31/13 | | | 12/31/12 | | | 12/31/11 | |
| Inception date | | — | | | — | | | — | | | — | | | 1/1/88 | |
Net asset value, beginning of period | | $ | 19.70 | | | $ | 21.93 | | | $ | 18.31 | | | $ | 15.43 | | | $ | 18.92 | |
Income/(loss) from investment operations: | | | | | | | | | | | | | | | | | | | | |
Net investment income | | | 0.34 | | | | 0.58 | | | | 0.37 | | | | 0.35 | | | | 0.44 | |
Net realized and unrealized gains/(losses) on investments | | | (0.37) | | | | (2.24) | | | | 3.62 | | | | 2.88 | | | | (3.48) | |
Total income/(loss) from investment operations | | | (0.03) | | | | (1.66) | | | | 3.99 | | | | 3.23 | | | | (3.04) | |
| | | | | |
Less distributions from: | | | | | | | | | | | | | | | | | | | | |
Net investment income | | | 0.36 | | | | 0.57 | | | | 0.37 | | | | 0.35 | | | | 0.44 | |
Return of capital | | | — | | | | — | | | | — | | | | 0.00 | * | | | 0.01 | |
Total distributions | | | 0.36 | | | | 0.57 | | | | 0.37 | | | | 0.35 | | | | 0.45 | |
| | | | | |
Net asset value, end of period | | $ | 19.31 | | | $ | 19.70 | | | $ | 21.93 | | | $ | 18.31 | | | $ | 15.43 | |
| | | | | |
TOTAL RETURN(a) | | | (0.18)% | | | | (7.62)% | | | | 21.81% | | | | 20.95% | | | | (16.02)% | |
| | | | | |
RATIOS/SUPPLEMENTAL DATA: | | | | | | | | | | | | | | | | | | | | |
Net assets, end of period (in thousands) | | $ | 234,448 | | | $ | 254,310 | | | $ | 306,922 | | | $ | 260,728 | | | $ | 240,572 | |
Ratios to average net assets: | | | | | | | | | | | | | | | | | | | | |
Net expenses | | | 0.35% | | | | 0.33% | (b) | | | 0.31% | (b) | | | 0.45% | (b) | | | 0.30% | (b) |
Gross expenses | | | 0.35% | | | | 0.33% | | | | 0.31% | | | | 0.45% | | | | 0.31% | |
Net investment income | | | 1.59% | | | | 2.54% | | | | 1.83% | | | | 1.98% | | | | 2.34% | |
Portfolio turnover rate | | | 24% | | | | 36% | | | | 49% | | | | 47% | | | | 39% | |
| (a) | Total returns are historical and assume changes in share price, reinvestment of dividends and capital gains distributions and assume no sales charge. Past performance does not guarantee future results. |
| (b) | Includes contractual management fee waiver related to the Fund’s investments in the GE Institutional Money Market Fund (the “Money Market Fund”). The fee waiver agreement was terminated effective June 30, 2014 with the closure of the Money Market Fund. |
| * | Rounds to less than $0.005. |
The accompanying Notes are an integral part of these financial statements.
65
Selected data based on a share outstanding throughout the fiscal years indicated
| | | | | | | | | | | | | | | | | | | | |
| Elfun Trusts | | 12/31/15 | | | 12/31/14 | | | 12/31/13 | | | 12/31/12 | | | 12/31/11 | |
| Inception date | | — | | | — | | | — | | | — | | | 5/27/35 | |
Net asset value, beginning of period | | $ | 58.02 | | | $ | 56.07 | | | $ | 44.06 | | | $ | 40.35 | | | $ | 41.38 | |
Income/(loss) from investment operations: | | | | | | | | | | | | | | | | | | | | |
Net investment income | | | 0.80 | | | | 0.75 | | | | 0.71 | | | | 0.77 | | | | 0.48 | |
Net realized and unrealized gains/(losses) on investments | | | 0.25 | | | | 6.67 | | | | 14.68 | | | | 7.77 | | | | 0.06 | |
Total income from investment operations | | | 1.05 | | | | 7.42 | | | | 15.39 | | | | 8.54 | | | | 0.54 | |
| | | | | |
Less distributions from: | | | | | | | | | | | | | | | | | | | | |
Net investment income | | | 0.80 | | | | 0.75 | | | | 0.72 | | | | 0.76 | | | | 0.48 | |
Net realized gains | | | 3.68 | | | | 4.72 | | | | 2.66 | | | | 4.07 | | | | 1.09 | |
Total distributions | | | 4.48 | | | | 5.47 | | | | 3.38 | | | | 4.83 | | | | 1.57 | |
| | | | | |
Net asset value, end of period | | $ | 54.59 | | | $ | 58.02 | | | $ | 56.07 | | | $ | 44.06 | | | $ | 40.35 | |
| | | | | |
TOTAL RETURN(a) | | | 1.70% | | | | 13.13% | | | | 34.98% | | | | 21.27% | | | | 1.33% | |
| | | | | |
RATIOS/SUPPLEMENTAL DATA: | | | | | | | | | | | | | | | | | | | | |
Net assets, end of period (in thousands) | | $ | 2,364,319 | | | $ | 2,476,637 | | | $ | 2,326,948 | | | $ | 1,820,262 | | | $ | 1,647,396 | |
Ratios to average net assets: | | | | | | | | | | | | | | | | | | | | |
Net expenses | | | 0.16% | | | | 0.18% | (b) | | | 0.15% | (b) | | | 0.19% | (b) | | | 0.21% | (b) |
Gross expenses | | | 0.16% | | | | 0.18% | | | | 0.15% | | | | 0.19% | | | | 0.21% | |
Net investment income | | | 1.32% | | | | 1.26% | | | | 1.36% | | | | 1.60% | | | | 1.09% | |
Portfolio turnover rate | | | 11% | | | | 13% | | | | 12% | | | | 11% | | | | 16% | |
| (a) | Total returns are historical and assume changes in share price, reinvestment of dividends and capital gains distributions and do not include the effect of insurance contract charges. Past performance does not guarantee future results. |
| (b) | Includes contractual management fee waiver related to the Fund’s investments in the GE Institutional Money Market Fund (the “Money Market Fund”). The fee waiver agreement was terminated effective June 30, 2014 with the closure of the Money Market Fund. |
The accompanying Notes are an integral part of these financial statements.
66
Selected data based on a share outstanding throughout the fiscal years indicated
| | | | | | | | | | | | | | | | | | | | |
| Elfun Diversified Fund | | 12/31/15 | | | 12/31/14 | | | 12/31/13 | | | 12/31/12 | | | 12/31/11 | |
| Inception date | | — | | | — | | | — | | | — | | | 1/1/88 | |
Net asset value, beginning of period | | $ | 18.78 | | | $ | 19.84 | | | $ | 18.30 | | | $ | 16.53 | | | $ | 17.41 | |
Income/(loss) from investment operations: | | | | | | | | | | | | | | | | | | | | |
Net investment income | | | 0.34 | | | | 0.37 | | | | 0.36 | | | | 0.33 | | | | 0.38 | |
Net realized and unrealized gains/(losses) on investments | | | (0.57) | | | | 0.62 | | | | 2.70 | | | | 1.78 | | | | (0.83) | |
Total income/(loss) from investment operations | | | (0.23) | | | | 0.99 | | | | 3.06 | | | | 2.11 | | | | (0.45) | |
| | | | | |
Less distributions from: | | | | | | | | | | | | | | | | | | | | |
Net investment income | | | 0.34 | | | | 0.37 | | | | 0.35 | | | | 0.34 | | | | 0.43 | |
Net realized gains | | | 0.71 | | | | 1.65 | | | | 1.17 | | | | — | | | | — | |
Return of capital | | | — | | | | 0.03 | | | | — | | | | — | | | | — | |
Total distributions | | | 1.05 | | | | 2.05 | | | | 1.52 | | | | 0.34 | | | | 0.43 | |
| | | | | |
Net asset value, end of period | | $ | 17.50 | | | $ | 18.78 | | | $ | 19.84 | | | $ | 18.30 | | | $ | 16.53 | |
| | | | | |
TOTAL RETURN(a) | | | (1.25)% | | | | 4.95% | | | | 16.79% | | | | 12.77% | | | | (2.60)% | |
| | | | | |
RATIOS/SUPPLEMENTAL DATA: | | | | | | | | | | | | | | | | | | | | |
Net assets, end of period (in thousands) | | $ | 209,688 | | | $ | 230,123 | | | $ | 235,903 | | | $ | 213,168 | | | $ | 210,095 | |
Ratios to average net assets: | | | | | | | | | | | | | | | | | | | | |
Net expenses | | | 0.37% | | | | 0.39% | (b) | | | 0.33% | (b) | | | 0.46% | (b) | | | 0.40% | (b) |
Gross expenses | | | 0.37% | | | | 0.39% | | | | 0.34% | | | | 0.47% | | | | 0.41% | |
Net investment income | | | 1.69% | | | | 1.79% | | | | 1.78% | | | | 1.75% | | | | 2.11% | |
Portfolio turnover rate | | | 123% | | | | 176% | | | | 144% | | | | 173% | | | | 197% | |
| (a) | Total returns are historical and assume changes in share price, reinvestment of dividends and capital gains distributions and do not include the effect of insurance contract charges. Past performance does not guarantee future results. |
| (b) | Includes contractual management fee waiver related to the Fund’s investments in the GE Institutional Money Market Fund (the “Money Market Fund”). The fee waiver agreement was terminated effective June 30, 2014 with the closure of the Money Market Fund. |
The accompanying Notes are an integral part of these financial statements.
67
Selected data based on a share outstanding throughout the fiscal years indicated
| | | | | | | | | | | | | | | | | | | | |
| Elfun Tax-Exempt Income Fund | | 12/31/15 | | | 12/31/14 | | | 12/31/13 | | | 12/31/12 | | | 12/31/11 | |
| Inception date | | — | | | — | | | — | | | — | | | 1/1/80 | |
Net asset value, beginning of period | | $ | 11.97 | | | $ | 11.34 | | | $ | 12.32 | | | $ | 11.97 | | | $ | 11.33 | |
Income/(loss) from investment operations: | | | | | | | | | | | | | | | | | | | | |
Net investment income | | | 0.46 | | | | 0.47 | | | | 0.49 | | | | 0.51 | | | | 0.53 | |
Net realized and unrealized gains/(losses) on investments | | | (0.09) | | | | 0.63 | | | | (0.98) | | | | 0.37 | | | | 0.64 | |
Total income/(loss) from investment operations | | | 0.37 | | | | 1.10 | | | | (0.49) | | | | 0.88 | | | | 1.17 | |
| | | | | |
Less distributions from: | | | | | | | | | | | | | | | | | | | | |
Net investment income | | | 0.46 | | | | 0.47 | | | | 0.49 | | | | 0.51 | | | | 0.53 | |
Net realized gains | | | — | | | | — | | | | 0.00 | * | | | 0.02 | | | | — | |
Total distributions | | | 0.46 | | | | 0.47 | | | | 0.49 | | | | 0.53 | | | | 0.53 | |
| | | | | |
Net asset value, end of period | | $ | 11.88 | | | $ | 11.97 | | | $ | 11.34 | | | $ | 12.32 | | | $ | 11.97 | |
| | | | | |
TOTAL RETURN(a) | | | 3.21% | | | | 9.85% | | | | (4.06)% | | | | 7.45% | | | | 10.57% | |
| | | | | |
RATIOS/SUPPLEMENTAL DATA: | | | | | | | | | | | | | | | | | | | | |
Net assets, end of period (in thousands) | | $ | 1,588,272 | | | $ | 1,624,266 | | | $ | 1,568,533 | | | $ | 1,785,176 | | | $ | 1,730,904 | |
Ratios to average net assets: | | | | | | | | | | | | | | | | | | | | |
Net expenses | | | 0.18% | | | | 0.21% | | | | 0.23% | | | | 0.18% | | | | 0.19% | |
Gross expenses | | | 0.18% | | | | 0.21% | | | | 0.23% | | | | 0.18% | | | | 0.19% | |
Net investment income | | | 3.92% | | | | 4.01% | | | | 4.14% | | | | 4.18% | | | | 4.56% | |
Portfolio turnover rate | | | 22% | | | | 34% | | | | 28% | | | | 28% | | | | 31% | |
| (a) | Total returns are historical and assume changes in share price, reinvestment of dividends and capital gains distributions and assume no sales charge. Past performance does not guarantee future results. |
| * | Rounds to less than $0.005. |
The accompanying Notes are an integral part of these financial statements.
68
Selected data based on a share outstanding throughout the fiscal years indicated
| | | | | | | | | | | | | | | | | | | | |
| Elfun Income Fund | | 12/31/15 | | | 12/31/14 | | | 12/31/13 | | | 12/31/12 | | | 12/31/11 | |
| Inception date | | — | | | — | | | — | | | — | | | 12/31/84 | |
Net asset value, beginning of period | | $ | 11.57 | | | $ | 11.22 | | | $ | 11.65 | | | $ | 11.58 | | | $ | 11.18 | |
Income/(loss) from investment operations: | | | | | | | | | | | | | | | | | | | | |
Net investment income | | | 0.32 | | | | 0.29 | | | | 0.29 | | | | 0.26 | | | | 0.39 | |
Net realized and unrealized gains/(losses) on investments | | | (0.29) | | | | 0.35 | | | | (0.40) | | | | 0.42 | | | | 0.48 | |
Total income/(loss) from investment operations | | | 0.03 | | | | 0.64 | | | | (0.11) | | | | 0.68 | | | | 0.87 | |
| | | | | |
Less distributions from: | | | | | | | | | | | | | | | | | | | | |
Net investment income | | | 0.32 | | | | 0.29 | | | | 0.29 | | | | 0.26 | | | | 0.38 | |
Net realized gains | | | 0.02 | | | | 0.00 | * | | | 0.03 | | | | 0.35 | | | | 0.09 | |
Total distributions | | | 0.34 | | | | 0.29 | | | | 0.32 | | | | 0.61 | | | | 0.47 | |
| | | | | |
Net asset value, end of period | | $ | 11.26 | | | $ | 11.57 | | | $ | 11.22 | | | $ | 11.65 | | | $ | 11.58 | |
| | | | | |
TOTAL RETURN(a) | | | 0.22% | | | | 5.75% | | | | (0.95)% | | | | 5.94% | | | | 7.87% | |
| | | | | |
RATIOS/SUPPLEMENTAL DATA: | | | | | | | | | | | | | | | | | | | | |
Net assets, end of period (in thousands) | | $ | 289,872 | | | $ | 312,756 | | | $ | 319,994 | | | $ | 364,407 | | | $ | 363,029 | |
Ratios to average net assets: | | | | | | | | | | | | | | | | | | | | |
Net expenses | | | 0.28% | | | | 0.29% | (b) | | | 0.28% | (b) | | | 0.23% | (b) | | | 0.24% | (b) |
Gross expenses | | | 0.28% | | | | 0.29% | | | | 0.29% | | | | 0.25% | | | | 0.26% | |
Net investment income | | | 2.71% | | | | 2.50% | | | | 2.53% | | | | 2.20% | | | | 3.39% | |
Portfolio turnover rate | | | 278% | | | | 326% | | | | 330% | | | | 402% | | | | 438% | |
| (a) | Total returns are historical and assume changes in share price, reinvestment of dividends and capital gains distributions and do not include the effect of insurance contract charges. Past performance does not guarantee future results. |
| (b) | Includes contractual management fee waiver related to the Fund’s investments in the GE Institutional Money Market Fund (the “Money Market Fund”). The fee waiver agreement was terminated effective June 30, 2014 with the closure of the Money Market Fund. |
| * | Rounds to less than $0.005. |
The accompanying Notes are an integral part of these financial statements.
69
Selected data based on a share outstanding throughout the fiscal years indicated
| | | | | | | | | | | | | | | | | | | | |
| Elfun Government Money Market Fund | | 12/31/15 | | | 12/31/14 | | | 12/31/13 | | | 12/31/12 | | | 12/31/11 | |
| Inception date | | — | | | — | | | — | | | — | | | 6/13/90 | |
Net asset value, beginning of period | | $ | 1.00 | | | $ | 1.00 | | | $ | 1.00 | | | $ | 1.00 | | | $ | 1.00 | |
Income/(loss) from investment operations: | | | | | | | | | | | | | | | | | | | | |
Net investment income | | | — | | | | — | | | | — | | | | — | | | | 0.00 | * |
Total income from investment operations | | | — | | | | — | | | | — | | | | — | | | | 0.00 | * |
| | | | | |
Less distributions from: | | | | | | | | | | | | | | | | | | | | |
Net investment income | | | 0.00 | * | | | 0.00 | * | | | — | | | | — | | | | 0.00 | * |
Net realized gains | | | — | | | | — | | | | 0.00 | * | | | — | | | | — | |
Total distributions | | | 0.00 | * | | | 0.00 | * | | | 0.00 | * | | | — | | | | 0.00 | * |
| | | | | |
Net asset value, end of period | | $ | 1.00 | | | $ | 1.00 | | | $ | 1.00 | | | $ | 1.00 | | | $ | 1.00 | |
| | | | | |
TOTAL RETURN(a) | | | 0.08% | | | | 0.05% | | | | 0.04% | | | | 0.00% | | | | 0.07% | |
| | | | | |
RATIOS/SUPPLEMENTAL DATA: | | | | | | | | | | | | | | | | | | | | |
Net assets, end of period (in thousands) | | $ | 129,039 | | | $ | 139,218 | | | $ | 166,530 | | | $ | 164,529 | | | $ | 177,378 | |
Ratios to average net assets: | | | | | | | | | | | | | | | | | | | | |
Net expenses | | | 0.09% | ** | | | 0.05% | ** | | | 0.11% | ** | | | 0.18% | ** | | | 0.23% | ** |
Gross expenses | | | 0.25% | | | | 0.36% | | | | 0.34% | | | | 0.32% | | | | 0.32% | |
Net investment income | | | —% | | | | —% | | | | —% | | | | —% | | | | 0.01% | |
| (a) | Total returns are historical and assume changes in share price, reinvestment of dividends and capital gains distributions and assume no sales charge. Past performance does not guarantee future results. |
| * | Rounds to less than $0.005. |
| ** | GEAM has voluntarily undertaken to reduce its management fee and/or subsidize certain expenses of the Fund to the extent necessary to maintain a minimum annualized yield of 0.00%. |
The accompanying Notes are an integral part of these financial statements.
70

[This page intentionally left blank.]
71
| | | | | | | | | | | | |
| | | |
Statements of Assets and Liabilities December 31, 2015 | | ELFUN
INTERNATIONAL
EQUITY FUND | | ELFUN TRUSTS | | |
| | | |
ASSETS | | | | | | | | | | | | |
Investments in securities, at fair value (cost $218,447,011; $1,368,999,454; $178,343,016; $1,446,747,853; $291,187,956 and $0, respectively) | | | $ | 223,947,003 | | | | $ | 2,308,512,370 | | | |
Short-term investments, at Amortized Cost | | | | 9,904,614 | | | | | 50,527,506 | | | |
Repurchase agreements | | | | — | | | | | — | | | |
Cash | | | | — | | | | | — | | | |
Restricted cash(1) | | | | 389,039 | | | | | — | | | |
Foreign currency (cost $16,951; $0; $3,049; $0; $0 and $0, respectively) | | | | 16,946 | | | | | — | | | |
Receivable from GEAM | | | | — | | | | | — | | | |
Receivable for investments sold | | | | — | | | | | — | | | |
Income receivables | | | | 450,321 | | | | | 5,425,666 | | | |
Receivable for fund shares sold | | | | 15,608 | | | | | 757,236 | | | |
Receivable for variation margin on open centrally cleared swap contracts | | | | — | | | | | — | | | |
Other assets | | | | — | | | | | 46,611 | | | |
Total assets | | | | 234,723,531 | | | | | 2,365,269,389 | | | |
LIABILITIES | | | | | | | | | | | | |
Distribution payable to shareholders | | | | — | | | | | — | | | |
Payable for investments purchased | | | | — | | | | | — | | | |
Payable for fund shares redeemed | | | | 54,142 | | | | | 421,453 | | | |
Payable to GEAM | | | | 67,680 | | | | | 142,862 | | | |
Accrued other expenses | | | | 150,761 | | | | | 385,596 | | | |
Variation margin payable on open futures contracts | | | | 375 | | | | | — | | | |
Accrued foreign capital gains tax | | | | 2,755 | | | | | — | | | |
Total liabilities | | | | 275,713 | | | | | 949,911 | | | |
NET ASSETS | | | $ | 234,447,818 | | | | $ | 2,364,319,478 | | | |
NET ASSETS CONSIST OF: | | | | | | | | | | | | |
Capital paid in | | | $ | 243,991,584 | | | | $ | 1,424,730,859 | | | |
Undistributed (distributions in excess of) net investment income | | | | — | | | | | — | | | |
Accumulated net realized gain (loss) | | | | (15,068,007 | ) | | | | 75,703 | | | |
Net unrealized appreciation (depreciation) on: | | | | | | | | | | | | |
Investments | | | | 5,497,237 | | | | | 939,512,916 | | | |
Futures | | | | 55,067 | | | | | — | | | |
Swap contracts | | | | — | | | | | — | | | |
Foreign currency related transactions | | | | (28,063 | ) | | | | — | | | |
NET ASSETS | | | $ | 234,447,818 | | | | $ | 2,364,319,478 | | | |
Shares outstanding (Par value $10; $10; $10; $10; $10; and $1, respectively; unlimited shares authorized) | | | | 12,141,072 | | | | | 43,307,307 | | | |
Net asset value, offering and redemption price per share | | | | $19.31 | | | | | $54.59 | | | |
| (1) | Deposits at broker for futures contracts. |
The accompanying Notes are an integral part of these financial statements.
72
| | | | | | | | | | | | | | | | | | | | |
| | | | |
| | | ELFUN
DIVERSIFIED
FUND | | ELFUN
TAX-EXEMPT
INCOME FUND | | ELFUN
INCOME FUND | | ELFUN GOVERNMENT
MONEY MARKET FUND |
| | | | |
| | | | | | | | | | | | | | | | | | | | |
| | | | |
| | | $ | 184,123,143 | | | | $ | 1,558,382,012 | | | | $ | 287,504,103 | | | | $ | — | |
| | | | 28,561,801 | | | | | 39,963,873 | | | | | 14,834,395 | | | | | 110,796,208 | |
| | | | — | | | | | — | | | | | — | | | | | 20,133,000 | |
| | | | 9,579 | | | | | — | | | | | — | | | | | 973 | |
| | | | 409,200 | | | | | — | | | | | — | | | | | — | |
| | | | 3,049 | | | | | — | | | | | — | | | | | — | |
| | | | — | | | | | — | | | | | — | | | | | 4,751 | |
| | | | — | | | | | — | | | | | 4,222,391 | | | | | — | |
| | | | 650,544 | | | | | 20,176,428 | | | | | 1,979,795 | | | | | 2,034 | |
| | | | 11,528 | | | | | 141,117 | | | | | 90,093 | | | | | 978,139 | |
| | | | 308 | | | | | — | | | | | 1,462 | | | | | — | |
| | | | — | | | | | 10,648 | | | | | — | | | | | — | |
| | | | 213,769,152 | | | | | 1,618,674,078 | | | | | 308,632,239 | | | | | 131,915,105 | |
| | | | | | | | | | | | | | | | | | | | |
| | | | — | | | | | 1,657,637 | | | | | 202,184 | | | | | — | |
| | | | 3,601,900 | | | | | 27,965,751 | | | | | 18,124,117 | | | | | 2,497,678 | |
| | | | 170,124 | | | | | 448,437 | | | | | 177,077 | | | | | 274,497 | |
| | | | 21,825 | | | | | 66,671 | | | | | 10,760 | | | | | 1,600 | |
| | | | 246,383 | | | | | 263,296 | | | | | 181,366 | | | | | 102,562 | |
| | | | 40,663 | | | | | — | | | | | 64,297 | | | | | — | |
| | | | — | | | | | — | | | | | — | | | | | — | |
| | | | 4,080,895 | | | | | 30,401,792 | | | | | 18,759,801 | | | | | 2,876,337 | |
| | | $ | 209,688,257 | | | | $ | 1,588,272,286 | | | | $ | 289,872,438 | | | | $ | 129,038,768 | |
| | | | | | | | | | | | | | | | | | | | |
| | | | 205,210,013 | | | | | 1,497,243,832 | | | | | 293,500,638 | | | | | 129,046,990 | |
| | | | — | | | | | 62,821 | | | | | 359,740 | | | | | (8,222 | ) |
| | | | (1,415,667 | ) | | | | (20,668,526 | ) | | | | (529,886 | ) | | | | — | |
| | | | | | | | | | | | | | | | | | | | |
| | | | 5,780,127 | | | | | 111,634,159 | | | | | (3,683,853 | ) | | | | — | |
| | | | 106,725 | | | | | — | | | | | 165,801 | | | | | — | |
| | | | 12,728 | | | | | — | | | | | 59,998 | | | | | — | |
| | | | (5,669 | ) | | | | — | | | | | — | | | | | — | |
| | | $ | 209,688,257 | | | | $ | 1,588,272,286 | | | | $ | 289,872,438 | | | | $ | 129,038,768 | |
| | | | |
| | | | 11,981,915 | | | | | 133,727,714 | | | | | 25,747,104 | | | | | 129,235,307 | |
| | | | $17.50 | | | | | $11.88 | | | | | $11.26 | | | | | $1.00 | |
The accompanying Notes are an integral part of these financial statements.
73
| | | | | | | | | | | | |
| | | |
Statements of Operations For the year ended December 31, 2015 | | ELFUN
INTERNATIONAL
EQUITY FUND | | ELFUN
TRUSTS | | |
| | | |
INVESTMENT INCOME | | | | | | | | | | | | |
Income | | | | | | | | | | | | |
Dividend | | | $ | 5,500,357 | | | | $ | 36,522,628 | | | |
Interest | | | | 1,096 | | | | | 14,014 | | | |
Less: Foreign taxes withheld | | | | (547,279 | ) | | | | — | | | |
Total income | | | | 4,954,174 | | | | | 36,536,642 | | | |
Expenses | | | | | | | | | | | | |
Advisory and administration fees | | | | 553,510 | | | | | 3,053,498 | | | |
Blue Sky fees | | | | 10,222 | | | | | 16,709 | | | |
Transfer agent fees | | | | 151,768 | | | | | 563,436 | | | |
Custody and accounting expenses | | | | 102,924 | | | | | 98,059 | | | |
Professional fees | | | | 27,570 | | | | | 42,617 | | | |
Other expenses | | | | 47,248 | | | | | 141,120 | | | |
Total expenses before waivers | | | | 893,242 | | | | | 3,915,439 | | | |
Less: Fees waived by the adviser | | | | — | | | | | — | | | |
Total expenses | | | | 893,242 | | | | | 3,915,439 | | | |
Net investment income | | | | 4,060,932 | | | | | 32,621,203 | | | |
NET REALIZED AND UNREALIZED GAIN (LOSS) ON INVESTMENTS | | | | | | | | | | | | |
| | | |
Realized gain (loss) on: | | | | | | | | | | | | |
Investments | | | | 9,326,514 | | | | | 145,937,417 | | | |
Futures | | | | 245,720 | | | | | — | | | |
Swap contracts | | | | — | | | | | — | | | |
Foreign currency transactions | | | | (81,419 | ) | | | | — | | | |
| | | |
Increase (decrease) in unrealized appreciation/depreciation on: | | | | | | | | | | | | |
Investments | | | | (12,970,991 | ) | | | | (134,802,483 | ) | | |
Futures | | | | 59,843 | | | | | — | | | |
Swap contracts | | | | — | | | | | — | | | |
Foreign currency translations | | | | 814 | | | | | — | | | |
Net realized and unrealized gain (loss) on investments | | | | (3,419,519 | ) | | | | 11,134,934 | | | |
Net increase (decrease) in net assets resulting from operations | | | $ | 641,413 | | | | $ | 43,756,137 | | | |
The accompanying Notes are an integral part of these financial statements.
74
| | | | | | | | | | | | | | | | | | | | |
| | | | |
| | | ELFUN
DIVERSIFIED
FUND | | ELFUN
TAX-EXEMPT
INCOME FUND | | ELFUN
INCOME FUND | | ELFUN
GOVERNMENT MONEY
MARKET FUND |
| | | | |
| | | | | | | | | | | | | | | | | | | | |
| | | | | | | | | | | | | | | | | | | | |
| | | $ | 2,745,426 | | | | $ | — | | | | $ | 20,853 | | | | $ | — | |
| | | | 2,048,965 | | | | | 65,621,525 | | | | | 9,078,173 | | | | | 121,463 | |
| | | | (106,324 | ) | | | | — | | | | | — | | | | | — | |
| | | | 4,688,067 | | | | | 65,621,525 | | | | | 9,099,026 | | | | | 121,463 | |
| | | | | | | | | | | | | | | | | | | | |
| | | | 355,562 | | | | | 2,446,145 | | | | | 469,900 | | | | | 121,428 | |
| | | | 6,898 | | | | | 14,477 | | | | | 9,511 | | | | | 13,902 | |
| | | | 117,790 | | | | | 252,014 | | | | | 139,503 | | | | | 82,814 | |
| | | | 291,979 | | | | | 92,367 | | | | | 178,064 | | | | | 61,188 | |
| | | | 30,721 | | | | | 29,323 | | | | | 22,867 | | | | | 22,357 | |
| | | | 38,467 | | | | | 98,214 | | | | | 33,194 | | | | | 23,664 | |
| | | | 841,417 | | | | | 2,932,540 | | | | | 853,039 | | | | | 325,353 | |
| | | | — | | | | | — | | | | | — | | | | | (203,890 | ) |
| | | | 841,417 | | | | | 2,932,540 | | | | | 853,039 | | | | | 121,463 | |
| | | | 3,846,650 | | | | | 62,688,985 | | | | | 8,245,987 | | | | | — | |
| | | | | | | | | | | | | | | | | | | | |
| | | | |
| | | | | | | | | | | | | | | | | | | | |
| | | | 7,296,596 | | | | | 5,292,646 | | | | | (932,811 | ) | | | | 533 | |
| | | | 285,664 | | | | | (713,594 | ) | | | | 628,434 | | | | | — | |
| | | | 24,652 | | | | | — | | | | | 120,017 | | | | | — | |
| | | | (5,925 | ) | | | | — | | | | | — | | | | | — | |
| | | | |
| | | | | | | | | | | | | | | | | | | | |
| | | | (14,045,949 | ) | | | | (16,826,936 | ) | | | | (7,435,365 | ) | | | | — | |
| | | | (38,357 | ) | | | | — | | | | | 196,009 | | | | | — | |
| | | | 12,728 | | | | | — | | | | | 59,998 | | | | | — | |
| | | | 41 | | | | | — | | | | | — | | | | | — | |
| | | | (6,470,550 | ) | | | | (12,247,884 | ) | | | | (7,363,718 | ) | | | | 533 | |
| | | $ | (2,623,900 | ) | | | $ | 50,441,101 | | | | $ | 882,269 | | | | $ | 533 | |
The accompanying Notes are an integral part of these financial statements.
75
| | | | | | | | | | | | | | | | | | | | | | |
Statements of Changes in Net Assets | | ELFUN
INTERNATIONAL
EQUITY FUND | | ELFUN
TRUSTS | | |
| | | | | |
| | | YEAR ENDED DECEMBER 31,
2015 | | YEAR ENDED DECEMBER 31,
2014 | | YEAR ENDED DECEMBER 31,
2015 | | YEAR ENDED DECEMBER 31,
2014 | | |
INCREASE (DECREASE) IN NET ASSETS | | | | | | | | | | | | | | | | | | | | | | |
Operations: | | | | | | | | | | | | | | | | | | | | | | |
Net investment income | | | $ | 4,060,932 | | | | $ | 7,245,178 | | | | $ | 32,621,203 | | | | $ | 29,857,133 | | | |
Net realized gain (loss) on investments, futures, swap contracts and foreign currency transactions | | | | 9,490,815 | | | | | 20,303,790 | | | | | 145,937,417 | | | | | 191,149,342 | | | |
Net increase (decrease) in unrealized appreciation/depreciation on investments, futures, swap contracts and foreign currency translations | | | | (12,910,334 | ) | | | | (49,641,721 | ) | | | | (134,802,483 | ) | | | | 76,152,832 | | | |
Net increase (decrease) from operations | | | | 641,413 | | | | | (22,092,753 | ) | | | | 43,756,137 | | | | | 297,159,307 | | | |
Distributions to shareholders from: | | | | | | | | | | | | | | | | | | | | | | |
Net investment income | | | | (4,270,754 | ) | | | | (7,173,676 | ) | | | | (32,631,167 | ) | | | | (29,624,777 | ) | | |
Net realized gains | | | | — | | | | | — | | | | | (149,723,012 | ) | | | | (187,625,045 | ) | | |
Return of capital | | | | — | | | | | — | | | | | — | | | | | — | | | |
Total distributions | | | | (4,270,754 | ) | | | | (7,173,676 | ) | | | | (182,354,179 | ) | | | | (217,249,822 | ) | | |
Increase (decrease) in assets from operations and distributions | | | | (3,629,341 | ) | | | | (29,266,429 | ) | | | | (138,598,042 | ) | | | | 79,909,485 | | | |
Share transactions: | | | | | | | | | | | | | | | | | | | | | | |
Proceeds from sale of shares | | | | 7,687,967 | | | | | 5,989,812 | | | | | 52,198,319 | | | | | 53,464,351 | | | |
Value of distributions reinvested | | | | 3,767,932 | | | | | 6,310,419 | | | | | 145,097,677 | | | | | 173,632,057 | | | |
Cost of shares redeemed | | | | (27,688,653 | ) | | | | (35,645,662 | ) | | | | (171,015,568 | ) | | | | (157,316,644 | ) | | |
Net increase (decrease) from share transactions | | | | (16,232,754 | ) | | | | (23,345,431 | ) | | | | 26,280,428 | | | | | 69,779,764 | | | |
Total increase (decrease) in net assets | | | | (19,862,095 | ) | | | | (52,611,860 | ) | | | | (112,317,614 | ) | | | | 149,689,249 | | | |
| | | | | |
NET ASSETS | | | | | | | | | | | | | | | | | | | | | | |
Beginning of year | | | | 254,309,913 | | | | | 306,921,773 | | | | | 2,476,637,092 | | | | | 2,326,947,843 | | | |
End of year | | | $ | 234,447,818 | | | | $ | 254,309,913 | | | | $ | 2,364,319,478 | | | | $ | 2,476,637,092 | | | |
Undistributed (distributions in excess of) net investment income, end of year | | | $ | — | | | | $ | 32 | | | | $ | — | | | | $ | 80,067 | | | |
| | | | | | | | | | | | | | | | | | | | | | |
CHANGES IN FUND SHARES | | | | | | | | | | |
| | | | | |
Shares sold | | | | 373,067 | | | | | 281,667 | | | | | 891,191 | | | | | 922,288 | | | |
Shares issued for distributions reinvested | | | | 193,525 | | | | | 315,205 | | | | | 2,617,674 | | | | | 2,962,497 | | | |
Shares redeemed | | | | (1,332,620 | ) | | | | (1,685,316 | ) | | | | (2,888,958 | ) | | | | (2,698,432 | ) | | |
Net increase (decrease) in fund shares | | | | (766,028 | ) | | | | (1,088,444 | ) | | | | 619,907 | | | | | 1,186,353 | | | |
The accompanying Notes are an integral part of these financial statements.
76
| | | | | | | | | | | | | | | | | | | | |
| | | ELFUN
DIVERSIFIED
FUND | | ELFUN
TAX-EXEMPT
INCOME FUND |
| | | | |
| | | YEAR ENDED DECEMBER 31,
2015 | | YEAR ENDED DECEMBER 31,
2014 | | YEAR ENDED DECEMBER 31,
2015 | | YEAR ENDED DECEMBER 31,
2014 |
| | | | | | | | | | | | | | | | | | | | |
| | | | | | | | | | | | | | | | | | | | |
| | | $ | 3,846,650 | | | | $ | 4,267,269 | | | | $ | 62,688,985 | | | | $ | 64,658,213 | |
| | | | |
| | |
|
7,600,987 |
| | | | 18,531,504 | | | | | 4,579,052 | | | | | (8,346,408 | ) |
| | | | |
| | | | (14,071,537 | ) | | | | (11,411,179 | ) | | | | (16,826,936 | ) | | | | 93,958,249 | |
| | | | (2,623,900 | ) | | | | 11,387,594 | | | | | 50,441,101 | | | | | 150,270,054 | |
| | | | | | | | | | | | | | | | | | | | |
| | | | (3,857,222 | ) | | | | (4,188,445 | ) | | | | (62,688,948 | ) | | | | (64,658,255 | ) |
| | | | (8,123,421 | ) | | | | (18,371,427 | ) | | | | — | | | | | — | |
| | | | — | | | | | (379,499 | ) | | | | — | | | | | — | |
| | | | (11,980,643 | ) | | | | (22,939,371 | ) | | | | (62,688,948 | ) | | | | (64,658,255 | ) |
| | | | (14,604,543 | ) | | | | (11,551,777 | ) | | | | (12,247,847 | ) | | | | 85,611,799 | |
| | | | | | | | | | | | | | | | | | | | |
| | | | 7,810,219 | | | | | 11,842,915 | | | | | 43,503,495 | | | | | 47,814,369 | |
| | | | 10,589,249 | | | | | 20,221,724 | | | | | 42,770,187 | | | | | 43,941,692 | |
| | | | (24,229,945 | ) | | | | (26,292,570 | ) | | | | (110,019,309 | ) | | | | (121,634,739 | ) |
| | | | (5,830,477 | ) | | | | 5,772,069 | | | | | (23,745,627 | ) | | | | (29,878,678 | ) |
| | | | (20,435,020 | ) | | | | (5,779,708 | ) | | | | (35,993,474 | ) | | | | 55,733,121 | |
| | | | |
| | | | | | | | | | | | | | | | | | | | |
| | | | 230,123,277 | | | | | 235,902,985 | | | | | 1,624,265,760 | | | | | 1,568,532,639 | |
| | | $ | 209,688,257 | | | | $ | 230,123,277 | | | | $ | 1,588,272,286 | | | | $ | 1,624,265,760 | |
| | | $ | — | | | | $ | 24 | | | | $ | 62,821 | | | | $ | 62,784 | |
| | | | | | | | | | | | | | | | | | | | |
| | | | | | | | | |
| | | | |
| | | | 410,432 | | | | | 592,677 | | | | | 3,667,801 | | | | | 4,057,975 | |
| | | | 600,638 | | | | | 1,070,499 | | | | | 3,606,297 | | | | | 3,720,994 | |
| | | | (1,284,679 | ) | | | | (1,295,036 | ) | | | | (9,286,454 | ) | | | | (10,321,944 | ) |
| | | | (273,609 | ) | | | | 368,140 | | | | | (2,012,356 | ) | | | | (2,542,975 | ) |
The accompanying Notes are an integral part of these financial statements.
77
| | | | | | | | | | | | | | | | |
Statements of Changes in Net Assets | | Elfun
Income
Fund | | | Elfun
Government
Money Market Fund | |
| | | | |
| | | YEAR ENDED DECEMBER 31,
2015 | | | YEAR ENDED DECEMBER 31,
2014 | | | YEAR ENDED DECEMBER 31,
2015 | | | YEAR ENDED DECEMBER 31,
2014 | |
INCREASE (DECREASE) IN NET ASSETS | | | | | | | | | | | | | | | | |
Operations: | | | | | | | | | | | | | | | | |
Net investment income | | $ | 8,245,987 | | | $ | 7,960,569 | | | $ | — | | | $ | — | |
Net realized gain (loss) on investments, futures and swap contracts | | | (184,360 | ) | | | 1,332,147 | | | | 533 | | | | 1,213 | |
Net increase (decrease) in unrealized appreciation/depreciation on investments, futures and swap contracts | | | (7,179,358 | ) | | | 8,371,037 | | | | — | | | | — | |
Net increase (decrease) from operations | | | 882,269 | | | | 17,663,753 | | | | 533 | | | | 1,213 | |
Distributions to shareholders from: | | | | | | | | | | | | | | | | |
Net investment income | | | (8,344,196 | ) | | | (7,994,297 | ) | | | (104,346 | ) | | | (62,739 | ) |
Net realized gains | | | (558,783 | ) | | | (58,810 | ) | | | — | | | | — | |
Total distributions | | | (8,902,979 | ) | | | (8,053,107 | ) | | | (104,346 | ) | | | (62,739 | ) |
Increase (decrease) in assets from operations and distributions | | | (8,020,710 | ) | | | 9,610,646 | | | | (103,813 | ) | | | (61,526 | ) |
Share transactions: | | | | | | | | | | | | | | | | |
Proceeds from sale of shares | | | 12,735,564 | | | | 12,278,351 | | | | 51,231,809 | | | | 62,655,321 | |
Value of distributions reinvested | | | 6,651,913 | | | | 5,997,828 | | | | 94,069 | | | | 56,986 | |
Cost of shares redeemed | | | (34,250,663 | ) | | | (35,124,433 | ) | | | (61,401,374 | ) | | | (89,963,152 | ) |
Net increase (decrease) from share transactions | | | (14,863,186 | ) | | | (16,848,254 | ) | | | (10,075,496 | ) | | | (27,250,845 | ) |
Total increase (decrease) in net assets | | | (22,883,896 | ) | | | (7,237,608 | ) | | | (10,179,309 | ) | | | (27,312,371 | ) |
| | | | |
NET ASSETS | | | | | | | | | | | | | | | | |
Beginning of year | | | 312,756,334 | | | | 319,993,942 | | | | 139,218,077 | | | | 166,530,448 | |
End of year | | $ | 289,872,438 | | | $ | 312,756,334 | | | $ | 129,038,768 | | | $ | 139,218,077 | |
Undistributed (distributions in excess of) net investment income, end of year | | $ | 359,740 | | | $ | 331,472 | | | $ | (8,222 | ) | | $ | — | |
| | | | | | | | | | | | | | | | |
CHANGES IN FUND SHARES | | | | | | | | | | | | |
| | | | |
Shares sold | | | 1,106,849 | | | | 1,071,105 | | | | 51,126,809 | | | | 62,592,321 | |
Shares issued for distributions reinvested | | | 579,525 | | | | 522,120 | | | | 94,069 | | | | 56,986 | |
Shares redeemed | | | (2,981,124 | ) | | | (3,064,658 | ) | | | (61,401,374 | ) | | | (89,963,152 | ) |
Net decrease in fund shares | | | (1,294,750 | ) | | | (1,471,433 | ) | | | (10,180,496 | ) | | | (27,313,845 | ) |
The accompanying Notes are an integral part of these financial statements.
78
December 31, 2015

| 1. | Organization of the Funds |
The Elfun Funds (each a “Fund” and collectively the “Funds”) are registered under the Investment Company Act of 1940, as amended (the “1940 Act”), as open-end management investment companies. The Funds operate as Employees’ Securities Companies (as defined in the 1940 Act) and as such are exempt from certain provisions of the 1940 Act. Each Fund is an investment company and accordingly follows the investment company accounting and reporting guidance of the Financial Accounting Standards Board (“FASB”) Accounting Standard Codification (“ASC”) Topic 946 Financial Services — Investment Companies.
GE Asset Management Incorporated (“GEAM”), the Funds’ investment adviser, is a wholly owned subsidiary of General Electric Company.
| 2. | Summary of Significant Accounting Policies |
The preparation of financial statements in conformity with U.S. generally accepted accounting principles (“GAAP”) requires management to make estimates and assumptions that affect the reported amounts of assets and liabilities and disclosure of contingent assets and liabilities at the date of the financial statements and the reported amounts of increases and decreases in net assets from operations during the reporting period. Actual results may differ from those estimates.
Subsequent events after the balance sheet date through the date the financial statements were issued have been evaluated in the preparation of the financial statements. There are no items to report.
The following summarizes the significant accounting policies of the Funds:
Securities Valuation and Transactions All investments in securities are recorded at their estimated fair value, as described in Note 3.
Securities transactions are accounted for as of the trade date. Realized gains and losses on investments sold are recorded on the basis of identified cost for both financial statement and federal tax purposes.
Repurchase Agreements Some of the Funds engage in repurchase agreement transactions with respect to instruments that are consistent with the Fund’s
investment objectives or policies. The Funds’ custodian takes possession of the collateral pledged for investments in repurchase agreements on behalf of the Funds. The Funds value the underlying collateral daily on a mark-to-market basis to determine that the value, including accrued interest, is at least equal to 102% for domestic securities and 105% for international securities of the repurchase price. In the event the seller defaults and the value of the security declines, or if the seller enters an insolvency proceeding, realization of the collateral by the Funds may be delayed or limited.
At December 31, 2015, the Elfun Government Money Market Fund had investments in repurchase agreements with a gross value of $20,133,000, which is included as part of repurchase agreements on the Statement of Assets and Liabilities. The value of the related collateral exceeded the value of the repurchase agreements at December 31, 2015.
Foreign Currency Accounting records of the Funds are maintained in U.S. dollars. Investment securities and other assets and liabilities denominated in a foreign currency are translated to U.S. dollars at the prevailing rates of exchange at period end. Purchases and sales of securities, income receipts and expense payments denominated in foreign currencies are translated into U.S. dollars at the prevailing exchange rate on the respective dates of such transactions.
All assets and liabilities of the Funds initially expressed in foreign currency values will be converted into U.S. dollars at the WM/Reuters exchange rate computed at 11:00 a.m., Eastern time.
The Funds do not isolate the portion of the results of operations resulting from changes in foreign exchange rates from the fluctuations arising from changes in the market prices of securities during the year. Such fluctuations are included in the net realized or unrealized gain or loss from investments. Net realized gains or losses on foreign currency transactions represent net gains or losses on sales and maturities of foreign currency contracts, disposition of foreign currencies, the difference between the amount of net investment income and withholding taxes accrued and the U.S. dollar amount actually received or paid, and gains or losses between the trade and settlement date on purchases and sales of foreign securities. Net unrealized foreign exchange gains and losses arising from changes in the value of other
79
December 31, 2015
assets and liabilities (including foreign currencies and open foreign currency contracts) as a result of changes in foreign exchange rates are included as increases or decreases in unrealized appreciation/depreciation on foreign currency related transactions.
Derivatives The Funds are subject to equity price risk, interest rate risk, credit risk, and foreign currency exchange rate risk in the normal course of pursuing their investment objectives. Certain Funds entered into derivative transactions (such as options, futures, options on future, interest rate futures, interest rate swaps and credit default swaps) to gain or hedge exposure to certain types of securities as an alternative to investing directly in or selling such securities, or to manage: yield, interest rate exposure (also known as duration), exposure to credit quality, and to gain exposure to certain market segments.
Futures Contracts A futures contract is an agreement to buy or sell a specific amount of a commodity, financial instrument, currency or index at a particular price and future date. Certain Funds may invest in interest rate, financial and stock or bond index futures contracts subject to certain limitations. During the year ended December 31, 2015, the Elfun International Equity Fund entered into stock index futures contracts for the purpose of gaining market exposure and investing residual cash positions. The Elfun Diversified Fund entered into futures contracts on various stock indices, bonds and notes for the purposes of gaining market exposure, investing residual cash positions and managing duration of fixed income investments. The Elfun Tax-Exempt Income Fund and Elfun Income Fund invested in futures contracts on bonds and notes for to manage duration of fixed income securities. Buying futures tends to increase a Fund’s exposure to the underlying instrument while selling futures tends to decrease a Fund’s exposure to the underlying instrument, or hedge other Fund investments. With futures contracts, there is minimal counterparty credit risk to a Fund since futures contracts are exchange traded and the exchange’s clearinghouse, as counterparty to all traded futures, guarantees the futures against default. A Fund’s risks in using these contracts include changes in the value of the underlying instruments, non-performance of the counterparties under the contracts’ terms and changes in the liquidity of the secondary market for the contracts. Futures
contracts are valued at the settlement price established each day by the board of trade or exchange on which they principally trade.
Upon entering into a financial futures contract, a Fund is required to pledge to the broker an amount of cash and/or other assets equal to a certain percentage of the contract amount, known as initial margin deposit. Subsequent payments, known as variation margin, are made or received by a Fund each day, depending on the daily fluctuation in the fair value of the underlying security. A Fund records an unrealized gain or loss equal to the daily variation margin. Should market conditions move unexpectedly, a Fund may not achieve the anticipated benefits of the futures contracts and may incur a loss. A Fund recognize a realized gain or loss on the expiration or closing of a futures contract.
When-Issued Securities and Forward Commitments The Elfun Income Fund and Elfun Diversified Fund may purchase or sell securities on a when-issued or forward commitment basis. These transactions are arrangements in which a Fund purchases and sells securities with payment and delivery scheduled a month or more after entering into the transaction. The price of the underlying securities and the date when these securities will be delivered and paid for are fixed at the time the transaction is negotiated. Losses may arise due to changes in the market value of the underlying securities or if the counterparty does not perform under the commitments. In connection with such purchases, a Fund maintains cash or liquid assets in an amount equal to the purchase commitments for such underlying securities until settlement date and for sales commitments a Fund maintains equivalent deliverable securities as “cover” for the transaction. Unsettled commitments are valued at the current market value of the underlying security. Daily fluctuations in the value of such commitments are recorded as unrealized gains or losses. The Funds will not enter into such commitments for the purpose of investment leverage.
Credit Default Swaps During the year ended December 31, 2015, the Elfun Diversified Fund and the Elfun Income Fund engaged in credit default swaps to manage credit risk. When a Fund is the buyer in a credit default swap contract, a Fund is entitled to receive the par (or other agreed upon) value (full notional value) of a referenced debt obligation (or basket of debt obligations)
80
December 31, 2015
from the counterparty (or central clearing party (“CCP”) in the case of a centrally cleared swap) to the contract if a credit event by a third party, such as a U.S. or foreign corporate issuer or sovereign issuer, on the debt obligation occurs. In return, a Fund pays the counterparty a periodic stream of payments over the term of the contract provided that no credit event has occurred. If no credit event occurs, a Fund loses its investment and recovers nothing. However, if a credit event occurs, a Fund receives full notional value for a referenced debt obligation that may have little or no value. When a Fund is the seller of a credit default swap, it receives a fixed rate of income throughout the term of the contract, provided there is no credit event. If a credit event occurs, a Fund is obligated to pay the notional amount of the swap and in certain instances take delivery of securities of the reference entity upon the occurrence of a credit event, as defined under the terms of that particular swap agreement. Credit events are contract specific but may include bankruptcy, failure to pay, restructuring, obligation acceleration and repudiation/moratorium. If a Fund is a seller of protection and a credit event occurs, the maximum potential amount of future payments that a Fund could be required to make would be an amount equal to the notional amount of the agreement. This potential amount would be partially offset by any recovery value of the respective referenced obligation, or net amount received from the settlement of a buy protection credit default swap agreement entered into by a Fund for the same referenced obligation. As the seller, a Fund may create economic leverage to its portfolio because, in addition to its total net assets, a Fund is subject to investment exposure on the notional amount of the swap. The interest fee paid or received on the swap, which is based on a specified interest rate on a fixed notional amount, is accrued daily as a component of unrealized appreciation (depreciation) and is recorded as realized gain upon receipt or realized loss upon payment. A Fund also records an increase or decrease to unrealized appreciation (depreciation) in an amount equal to the daily valuation. For centrally cleared swaps, the daily change in valuation is recorded as a receivable or payable for variation margin and settled in cash with the CCP daily. All upfront payments, if any, are amortized over the life of the swap as realized gains or losses. Those upfront payments that are paid or received, typically for non-centrally cleared swaps, are recorded as other assets or other liabilities, respectively, net of amortization.
For financial reporting purposes, unamortized upfront payments, if any, are netted with unrealized appreciation or depreciation on swaps to determine the market value of swaps. A Fund segregates assets in the form of cash or liquid securities in an amount equal to the notional amount of the credit default swaps of which it is the seller. A Fund segregates assets in the form of cash or liquid securities in an amount equal to any unrealized depreciation of the credit default swaps of which it is the buyer, marked to market on a daily basis. Credit default swaps involve greater risks than if a Fund had invested in the referenced debt obligation directly. If a Fund is a buyer of a credit default swap and no credit event occurs, a Fund will not earn any return on its investment. If a Fund is a seller of a credit default swap, a Fund’s risk of loss may be the entire notional amount of the swap. Swaps may also subject a Fund to the risk that the counterparty to the transaction may not fulfill its obligation. In the case of centrally cleared swaps, counterparty risk is minimal due to protections provided by the CCP.
Forward Foreign Currency Exchange Contracts Certain Funds may enter into forward foreign currency exchange contracts to facilitate transactions in foreign denominated securities and to manage currency exposure. Forward foreign currency exchange contracts are valued at the mean between the bid and the offered forward rates as last quoted by a recognized dealer. The aggregate principal amounts of the contracts are not recorded in a Fund’s financial statements. Such amounts appear under the caption Forward Foreign Currency Contracts in the Schedules of Investments. Fluctuations in the value of the contracts are recorded in the Statements of Assets and Liabilities as an asset (or liability) and in the Statements of Operations as unrealized appreciation (depreciation) until the contracts are closed, when they are recorded as realized gains or losses on foreign currency related transactions. A Fund’s risks in using these contracts include changes in the value of foreign currency or the possibility that the counterparties do not perform under the contracts’ terms. When a Fund enters into a forward foreign currency exchange contract, it is required to segregate cash or liquid securities with its custodian in an amount equal to the value of a Fund’s total assets committed to the consummation of the forward contract. If the value of the segregated securities declines, additional cash or securities are segregated so
81
December 31, 2015
that the value of the account will equal the amount of a Fund’s commitment with respect to the contract.
Investments in Foreign Markets Investments in foreign markets involve special risks and considerations not typically associated with investing in the United States. These risks include revaluation of currencies, high rates of inflation, restrictions on repatriation of income and capital, and adverse political and economic developments. Moreover, securities issued in these markets may be less liquid, subject to government ownership controls, tariffs and taxes, subject to delays in settlements, and their prices may be more volatile.
A Fund may be subject to capital gains and repatriation taxes imposed by certain countries in which it invests. Such taxes are generally based upon income and/or capital gains earned or repatriated. Taxes are accrued based on net investment income, net realized gains and net unrealized appreciation as income and/or capital gains are earned.
Investment Income Corporate actions (including cash dividends) are recorded on the ex-dividend date, net of applicable withholding taxes, except for certain foreign corporate actions which are recorded as soon after the ex-dividend date as such information becomes available. Withholding taxes on foreign dividends, if any, have been provided for in accordance with a Fund’s understanding of the applicable country’s tax rules and rates.
Interest income is recorded on the accrual basis. Accretion of discounts and amortization of premiums on taxable bonds are to the call or maturity date, whichever is shorter, using the effective yield method.
Expenses Fund specific expenses are charged to the Fund that incurs such expenses. Such expenses may include custodial fees, legal and accounting fees, printing costs and registration fees. Expenses that are not fund specific are allocated pro rata across the Funds. Expenses of the Fund are generally paid directly by the Fund; however, expenses may be paid by GEAM and reimbursed by the Fund.
Federal Income Taxes The Funds intend to comply with all sections of the Internal Revenue Code of 1986, as amended (the “Internal Revenue Code”) applicable to regulated investment companies, including the distribution of substantially all of their taxable net investment income, tax-exempt income and net realized
capital gains to their shareholders. Therefore, no provision for federal income tax has been made. Each Fund is treated as a separate taxpayer for federal income tax purposes.
| 3. | Security Valuation and Transactions |
The Funds utilize various methods to measure the fair value of most of their investments on a recurring basis. GAAP establishes a framework for measuring fair value and providing related disclosures. Broadly, the framework requires fair value to be determined based on the exchange price that would be received for an asset or paid to transfer a liability (an exit price) in the principal or most advantageous market for the asset or liability in an orderly transaction between market participants at the measurement date. In the absence of active markets for the identical assets or liabilities, such measurements involve developing assumptions based on market observable data and, in the absence of such data, internal information that is consistent with what market participants would use in a hypothetical transaction that occurs at the measurement date. It also establishes a three-level valuation hierarchy based upon observable and non-observable inputs.
Observable inputs reflect market data obtained from independent sources, while unobservable inputs reflect our market assumptions. Preference is given to observable inputs. These two types of inputs create the following fair value hierarchy:
Level 1 – Quoted prices for identical investments in active markets.
Level 2 – Quoted prices for similar investments in active markets; quoted prices for identical or similar investments in markets that are not active; and model-derived valuations whose inputs are observable or whose significant value drivers are observable.
Level 3 – Significant inputs to the valuation model are unobservable.
Policies and procedures are maintained to value investments using the best and most relevant data available. In addition, pricing vendors are utilized to assist in valuing investments. GEAM performs periodic reviews of the methodologies used by independent pricing services including price validation of individual securities.
82
December 31, 2015
Fair Value Measurement The following section describes the valuation methodologies the Funds use to measure different financial investments at fair value.
A Fund’s portfolio securities are valued generally on the basis of market quotations. Equity securities generally are valued at the last reported sale price on the primary market in which they are traded. Portfolio securities listed on NASDAQ are valued using the NASDAQ Official Closing Price, Level 1 securities primarily include publicly-traded equity securities, which may not necessarily represent the last sales price. If no sales occurred on the exchange or NASDAQ that day, the portfolio security generally is valued using the last reported bid price. In those circumstances the Fund typically classifies the investment securities in Level 2.
Debt securities (other than short-term securities described below) generally are valued at an evaluated bid price as reported by independent pricing services. The pricing services use various pricing models for each asset class. The inputs and assumptions to the model of the pricing services are derived from market observable sources, which may include: benchmark yields, reported trades, broker/dealer quotes, issuer spreads, benchmark securities, bids, offers, and other market related data. Since many fixed income securities do not trade on a daily basis, the methodology of the pricing service may use other available information such as benchmark curves, benchmarking of similar securities, sector groupings, and matrix pricing, as applicable. Thus, certain securities may not be priced using market quotations, but rather determined from market observable information. These investments are included in Level 2 and are primarily comprised of corporate fixed income, government, mortgage and asset-backed securities. In the absence of a reliable bid price from such a pricing service, debt securities may be valued based on broker or dealer supplied valuations or quotations. In these infrequent circumstances, pricing services may provide the Funds with valuations that are based on significant unobservable inputs, and in those circumstances the investment securities are classified as Level 3.
A Fund may use non-binding broker or dealer quotes for valuation when there is limited or no relevant market activity for a specific investment or for other investments that share similar characteristics and a price is not provided by a pricing service or is deemed not to be reliable. The Funds have not adjusted the prices obtained. Investment securities priced using non-binding broker or dealer quotes are included in Level 3.
Short-term securities of sufficient credit quality with remaining maturities of sixty days or less at the time of purchase are typically valued on the basis of amortized cost which approximates fair value and these are included in Level 2. If it is determined that amortized cost does not approximate fair value, securities may be valued based on dealer supplied valuations or quotations. In these infrequent circumstances, pricing services may provide the Fund with valuations that are based on significant unobservable inputs, and in those circumstances the investment securities are classified in Level 3.
Investments in registered investment companies are valued at the published daily net asset value (“NAV”) and classified in Level 1.
If prices are not readily available for a portfolio security, or if it is believed that a price for a portfolio security does not represent its fair value, the security may be valued using procedures approved by the Funds’ Board of Trustees that are designed to establish its “fair” value. These securities are typically classified in Level 3. Those procedures require that the fair value of a security be established by a valuation committee of GEAM. The valuation committee follows different protocols for different types of investments and circumstances. The fair value procedures may be used to value any investment of any Fund in the appropriate circumstances.
Foreign securities may be valued with the assistance of an independent fair value pricing service in circumstances where it is believed that they have been or would be materially affected by events occurring after the close of the portfolio security’s primary market and before the close of regular trading on the New York Stock Exchange (“NYSE”). In these circumstances, the Funds classify the investment securities in Level 2. This independent fair value pricing service uses a proprietary model to identify affected securities, taking into consideration various factors, and the fair value of such securities may be something other than the last available quotation or other market price.
All assets and liabilities of the Funds initially expressed in foreign currency values will be converted into U.S. dollars at the WM/Reuters exchange rate computed at 11:00 a.m. Eastern time.
Fair value determinations generally are used for securities whose value is affected by a significant event
83
December 31, 2015
that will materially affect the value of a security and which occurs subsequent to the time of the close of the principal market on which such security trades but prior to the calculation of a Fund’s NAV.
The value established for such a portfolio security valued other than by use of a market quotation (as described above) may be different than what would be produced through the use of market quotations or another methodology. Portfolio securities that are valued using techniques other than market quotations, including “fair valued” securities, may be subject to greater fluctuation in their value from one day to the next than would be the case if market quotations were used. In addition, there is no assurance that a Fund could sell a portfolio security for the value established for it at any time and it is possible that a Fund would incur a loss because a portfolio security is sold at a discount to its established value.
Other financial investments are derivative instruments that are not reflected in total investments, such as futures, forwards, swaps, and written options contracts, which are valued based on fair value as discussed above.
The Funds use closing prices for derivatives included in Level 1, which are traded either on exchanges or liquid over-the counter markets. Derivative assets and liabilities included in Level 2 primarily represent interest rate swaps, cross-currency swaps and foreign currency and commodity forward and option contracts. Derivative assets and liabilities included in Level 3 primarily represent interest rate products that contain embedded optionality or prepayment features.
The inputs or methodology used for valuing securities are not an indication of the risk associated with investing in those securities.
The following tables present each Fund’s investments measured at fair value on a recurring basis at December 31, 2015:
| | | | | | | | | | | | | | | | | | |
| Fund | | Investments | | Level 1 | | | Level 2 | | | Level 3 | | | Total | |
| | | | | |
| Elfun International Equity Fund | | Investments in Securities† | | | | | | | | | | | | | | | | |
| | Common Stock | | $ | 223,947,003 | | | $ | — | | | $ | — | | | $ | 223,947,003 | |
| | Short-Term Investments | | | 9,904,614 | | | | — | | | | — | | | | 9,904,614 | |
| | | | | | | | | | | | | | | | | | |
| | Total Investments in Securities | | $ | 233,851,617 | | | $ | — | | | $ | — | | | $ | 233,851,617 | |
| | | | | | | | | | | | | | | | | | |
| | | | | |
| | Other Financial Instruments* | | | | | | | | | | | | | | | | |
| | Long Futures Contracts — Unrealized Appreciation | | $ | 55,067 | | | $ | — | | | $ | — | | | $ | 55,067 | |
| | | | | | | | | | | | | | | | | | |
| | | | | |
| | | | | | | | | | | | | | | | | | | |
| | | | | |
| Elfun Trusts | | Investments in Securities† | | | | | | | | | | | | | | | | |
| | Common Stock | | $ | 2,308,512,370 | | | $ | — | | | $ | — | | | $ | 2,308,512,370 | |
| | Short-Term Investments | | | 50,527,506 | | | | — | | | | — | | | | 50,527,506 | |
| | | | | | | | | | | | | | | | | | |
| | Total Investments in Securities | | $ | 2,359,039,876 | | | $ | — | | | $ | — | | | $ | 2,359,039,876 | |
| | | | | | | | | | | | | | | | | | |
| | | | | |
| | | | | | | | | | | | | | | | | | | |
| | | | |
| Elfun Diversified Fund | | Investments in Securities† | | | | | | | | | | | | |
| | Domestic Equity | | $ | 65,581,973 | | | $ | — | | | $ | — | | | $ | 65,581,973 | |
| | Foreign Equity | | | 43,430,981 | | | | — | | | | — | | | | 43,430,981 | |
| | U.S. Treasuries | | | — | | | | 10,555,553 | | | | — | | | | 10,555,553 | |
| | Agency Mortgage Backed | | | — | | | | 16,421,253 | | | | — | | | | 16,421,253 | |
| | Agency Collateralized Mortgage Obligations | | | — | | | | 153,079 | | | | — | | | | 153,079 | |
| | Corporate Notes | | | — | | | | 30,359,517 | | | | — | | | | 30,359,517 | |
| | Non-Agency Collateralized Mortgage Obligations | | | — | | | | 6,797,903 | | | | — | | | | 6,797,903 | |
| | Sovereign Bonds | | | — | | | | 807,383 | | | | — | | | | 807,383 | |
| | Municipal Bonds and Notes | | | — | | | | 372,966 | | | | — | | | | 372,966 | |
| | FNMA (TBA) | | | — | | | | — | | | | 2,135 | | | | 2,135 | |
| | Exchange Traded Funds | | | 9,640,400 | | | | — | | | | — | | | | 9,640,400 | |
| | Short-Term Investments | | | 28,561,801 | | | | — | | | | — | | | | 28,561,801 | |
| | | | | | | | | | | | | | | | | | |
| | Total Investments in Securities | | $ | 147,215,155 | | | $ | 65,467,654 | | | $ | 2,135 | | | $ | 212,684,944 | |
| | | | | | | | | | | | | | | | | | |
84
December 31, 2015
| | | | | | | | | | | | | | | | | | |
| Fund | | Investments | | Level 1 | | | Level 2 | | | Level 3 | | | Total | |
| | | | |
| | Other Financial Instruments* | | | | | | | | | | | | |
| | Credit Default Swap Contracts
— Unrealized Appreciation | | $ | — | | | $ | 12,728 | | | $ | — | | | $ | 12,728 | |
| | Long Futures Contracts — Unrealized Appreciation | | | 131,166 | | | | — | | | | — | | | | 131,166 | |
| | Long Futures Contracts — Unrealized Depreciation | | | (23,401 | ) | | | — | | | | — | | | | (23,401 | ) |
| | Short Futures Contracts — Unrealized Appreciation | | | 57,119 | | | | — | | | | — | | | | 57,119 | |
| | Short Futures Contracts — Unrealized Depreciation | | | (58,159 | ) | | | — | | | | — | | | | (58,159 | ) |
| | | | | | | | | | | | | | | | | | |
| | Total Other Financial Instruments | | $ | 106,725 | | | $ | 12,728 | | | $ | — | | | $ | 119,453 | |
| | | | | | | | | | | | | | | | | | |
| | | | | |
| | | | | | | | | | | | | | | | | | | |
| | | | | |
| Elfun Tax-Exempt Income Fund | | Investments in Securities† | | | | | | | | | | | | | | | | |
| | Municipal Bonds and Notes | | $ | — | | | $ | 1,558,382,012 | | | $ | — | | | $ | 1,558,382,012 | |
| | Short-Term Investments | | | 39,963,873 | | | | — | | | | — | | | | 39,963,873 | |
| | | | | | | | | | | | | | | | | | |
| | Total Investments in Securities | | $ | 39,963,873 | | | $ | 1,558,382,012 | | | $ | — | | | $ | 1,598,345,885 | |
| | | | | | | | | | | | | | | | | | |
| | | | | |
| | | | | | | | | | | | | | | | | | | |
| | | | |
| Elfun Income Fund | | Investments in Securities† | | | | | | | | | | | | |
| | U.S. Treasuries | | $ | — | | | $ | 46,093,916 | | | $ | — | | | $ | 46,093,916 | |
| | Agency Mortgage Backed | | | — | | | | 70,646,767 | | | | — | | | | 70,646,767 | |
| | Agency Collateralized Mortgage Obligations | | | — | | | | 798,101 | | | | — | | | | 798,101 | |
| | Asset Backed | | | — | | | | 780,228 | | | | — | | | | 780,228 | |
| | Corporate Notes | | | — | | | | 131,080,864 | | | | — | | | | 131,080,864 | |
| | Non-Agency Collateralized Mortgage Obligations | | | — | | | | 32,539,768 | | | | — | | | | 32,539,768 | |
| | Sovereign Bonds | | | — | | | | 3,149,229 | | | | — | | | | 3,149,229 | |
| | Municipal Bonds and Notes | | | — | | | | 2,070,092 | | | | — | | | | 2,070,092 | |
| | FNMA (TBA) | | | — | | | | — | | | | 8,556 | | | | 8,556 | |
| | Preferred Stock | | | 336,582 | | | | — | | | | — | | | | 336,582 | |
| | Short-Term Investments | | | 14,834,395 | | | | — | | | | — | | | | 14,834,395 | |
| | | | | | | | | | | | | | | | | | |
| | Total Investments in Securities | | $ | 15,170,977 | | | $ | 287,158,965 | | | $ | 8,556 | | | $ | 302,338,498 | |
| | | | | | | | | | | | | | | | | | |
| | | | |
| | Other Financial Instruments* | | | | | | | | | | | | |
| | Credit Default Swap Contracts — Unrealized Appreciation | | $ | — | | | $ | 59,998 | | | $ | — | | | $ | 59,998 | |
| | Long Futures Contracts — Unrealized Appreciation | | | 8,510 | | | | — | | | | — | | | | 8,510 | |
| | Long Futures Contracts — Unrealized Depreciation | | | (72,283 | ) | | | — | | | | — | | | | (72,283 | ) |
| | Short Futures Contracts — Unrealized Appreciation | | | 230,891 | | | | — | | | | — | | | | 230,891 | |
| | Short Futures Contracts — Unrealized Depreciation | | | (1,317 | ) | | | — | | | | — | | | | (1,317 | ) |
| | | | | | | | | | | | | | | | | | |
| | Total Other Financial Instruments | | $ | 165,801 | | | $ | 59,998 | | | $ | — | | | $ | 225,799 | |
| | | | | | | | | | | | | | | | | | |
| | | | | |
| | | | | | | | | | | | | | | | | | | |
85
December 31, 2015
| | | | | | | | | | | | | | | | | | |
| Fund | | Investments | | Level 1 | | | Level 2 | | | Level 3 | | | Total | |
| | | | | |
| Elfun Government Money Market Fund | | Investments in Securities† | | | | | | | | | | | | | | | | |
| | U.S. Treasuries | | $ | — | | | $ | 29,122,933 | | | $ | — | | | $ | 29,122,933 | |
| | U.S. Government Agency Obligations | | | — | | | | 81,673,275 | | | | — | | | | 81,673,275 | |
| | Repurchase Agreements | | | — | | | | 20,133,000 | | | | — | | | | 20,133,000 | |
| | | | | | | | | | | | | | | | | | |
| | Total Investments in Securities | | $ | — | | | $ | 130,929,208 | | | $ | — | | | $ | 130,929,208 | |
| | | | | | | | | | | | | | | | | | |
| | | | | |
| | | | | | | | | | | | | | | | | | | |
| † | See Schedules of Investments for Industry Classification. |
| * | Other financial instruments include derivative instruments such as futures contracts and credit default swaps. Amounts shown represent unrealized appreciation (depreciation), at period end. |
The Elfun International Equity Fund and the Elfun Diversified Fund utilized the fair value pricing service on December 31, 2014 due to events occurring after the close of foreign local markets and before the close of regular trading on the NYSE, which resulted in certain foreign securities being classified as Level 2 at the beginning of the period that were classified as Level 1 at December 31, 2015. The value of securities that were transferred to Level 2 from Level 1 as a result was $214,575,522 and $37,780,873 for the Elfun International Equity Fund and Elfun Diversified Fund, respectively. There were no other significant transfers between fair value levels. Transfers between fair value levels are considered to occur at the beginning of the period.
Level 3 investments at the beginning and/or end of the period in relation to net assets were not significant and accordingly, a reconciliation of Level 3 assets for the year ended December 31, 2015 is not presented.
Shown below are the derivative contracts entered into by each Fund, summarized by primary risk exposure as they appear on the Statements of Assets and Liabilities, none of which are accounted for as hedging instruments under FASB ASC No. 815 Derivatives and Hedging (“ASC 815”) as of December 31, 2015.
| | | | | | | | | | | | |
| | | Asset Derivatives December 31, 2015 | | | Liability Derivatives December 31, 2015 | |
Derivatives not accounted for as hedging instruments under ASC 815 | | Location in the Statements
of Assets and Liabilities | | Fair
Value ($) | | | Location in the Statements
of Assets and Liabilities | | Fair
Value ($) | |
| Elfun International Equity Fund | | | | | | | | | | | | |
Equity Contracts | | Assets, Net Assets — Net Unrealized Appreciation/ (Depreciation) on Futures | | | 55,067 | * | | Liabilities, Net Assets — Net Unrealized Appreciation/ (Depreciation) on Futures | | | — | |
| Elfun Diversified Fund | |
Equity Contracts | | Assets, Net Assets — Net Unrealized Appreciation/ (Depreciation) on Futures | | | 128,461 | * | | Liabilities, Net Assets — Net Unrealized Appreciation/ (Depreciation) on Futures | | | (58,159 | )* |
Interest Rate Contracts | | Assets, Net Assets — Net Unrealized Appreciation/ (Depreciation) on Futures | | | 59,824 | * | | Liabilities, Net Assets — Net Unrealized Appreciation/ (Depreciation) on Futures | | | (23,401 | )* |
Credit Risk Contracts | | Assets, Net Assets — Net Unrealized Appreciation/ (Depreciation) on Swap Contracts | | | 12,728 | * | | Liabilities, Net Assets — Net Unrealized Appreciation/ (Depreciation) on Swap Contracts | | | — | |
| Elfun Income Fund | |
Interest Rate Contracts | | Assets, Net Assets — Net Unrealized Appreciation/ (Depreciation) on Futures | | | 239,401 | * | | Liabilities, Net Assets — Net Unrealized Appreciation/ (Depreciation) on Futures | | | (73,600 | )* |
| | | | |
Credit Risk Contracts | | Assets, Net Assets — Net Unrealized Appreciation/ (Depreciation) on Swap Contracts | | | 59,998 | * | | Liabilites, Net Assets — Net Unrealized Appreciation/ (Depreciation) on Swap Contracts | | | — | |
| * | Includes cumulative unrealized appreciation/(depreciation) of futures and credit default swap contracts as reported in the Schedule of Investments and within the components of the net assets section of the Statement of Assets and Liabilities. Only the current day’s variation margin is reported within the Assets and/or Liabilities section on the Statement of Assets and Liabilities. |
86
December 31, 2015
Shown below are the effects of derivative instruments on each Fund’s Statements of Operation, summarized by primary risk exposure, none of which are accounted for as hedging instruments under ASC 815.
| | | | | | | | | | | | |
Derivatives not accounted for as hedging instruments under ASC 815 | | Location in the
Statements of Operations | | Total
Notional Amount of
Futures Contracts
Purchased/(Sold) ($) | | Realized Gain (Loss) on
Derivatives Recognized
in Income ($) | | | Change in Unrealized
Appreciation (Depreciation)
on Derivatives
Recognized in Income ($) | |
| Elfun International Equity Fund | | | | | | | | |
Equity Contracts | | Realized gain (loss) on Futures, Increase (decrease) in unrealized appreciation/ (depreciation) on Futures | | 34,121,584/
(31,292,919) | | | 245,720 | | | | 59,843 | |
| Elfun Diversified Fund | |
Equity Contracts | | Realized gain (loss) on Futures, Increase (decrease) in unrealized appreciation/ (depreciation) on Futures | | 55,971,627/
(58,521,450) | | | 142,512 | | | | (107,029 | ) |
Interest Rate Contracts | | Realized gain/(loss) on Futures, Increase/(decrease) in unrealized appreciation/ (depreciation) on Futures | | 250,542,182/
(253,678,697) | | | 143,152 | | | | 68,672 | |
Credit Risk Contracts | | Realized gain/(loss) on Swap Contracts Increase/ (decrease) in unrealized appreciation/(depreciation) on Swap Contracts | | —/— | | | 24,652 | | | | 12,728 | |
| Elfun Tax-Exempt Income Fund | |
Interest Rate Contracts | | Realized gain/(loss) on Futures, Increase/(decrease) in unrealized appreciation/ (depreciation) on Futures | | 81,188,828/
(80,475,585) | | | (713,594 | ) | | | — | |
| Elfun Income Fund | |
Interest Rate Contracts | | Realized gain/(loss) on Futures, Increase/(decrease) in unrealized appreciation/ (depreciation) on Futures | | 1,109,623,204/
(1,118,788,938) | | | 628,434 | | | | 196,009 | |
Credit Risk Contracts | | Realized gain/(loss) on Swap Contracts Increase/ (decrease) in unrealized appreciation/(depreciation) on Swap Contracts | | —/— | | | 120,017 | | | | 59,998 | |
During the year ended December 31, 2015, the Funds had an average notional value of long and short futures contracts as shown below. The Elfun Diversifed and Elfun Income Fund had average notional values of $1,638,028 and $7,180,789 on credit default swaps, respectively. Please refer to the table following the Schedule of Investments for open futures contracts and open swap contracts at December 31, 2015.
| | | | | | | | |
| Fund | | Long Futures
Contracts | | | Short Futures
Contracts | |
Elfun International Equity Fund | | $ | 2,650,686 | | | $ | (1,053,327 | ) |
Elfun Diversified Fund | | | 13,611,792 | | | | (10,282,569 | ) |
Elfun Tax-Exempt Income Fund | | | — | | | | (45,117,188 | ) |
Elfun Income Fund | | | 21,781,084 | | | | (34,465,528 | ) |
87
December 31, 2015
The Funds (excluding Elfun Government Money Market Fund) share a revolving credit facility of up to $150 million with a number of their affiliates. The credit facility is with the Funds’ custodian bank, State Street Bank and Trust Company (“State Street”). The revolving credit facility requires the payment of a commitment fee equal to 0.20% (0.125% prior to October 28, 2015) per annum on the daily unused portion of the credit facility, payable quarterly. The portion borne by each Fund generally is borne proportionally based upon net assets. In addition, the Funds had a $100 million uncommitted, unsecured line of credit with State Street which expired effective October 28, 2015. Generally, borrowings under the credit facilities would accrue interest at the higher of the 1-Month LIBOR plus 1.25% and the Overnight Federal Funds Rate plus 1.25% and would be borne by the borrowing Fund. The maximum amount allowed to be borrowed by any one Fund is the lesser of (i) its prospectus limitation or (ii) 20% of its net assets. The credit facilities were not utilized by the Funds during the year ended December 31, 2015.
| 6. | Compensation and Fees paid to Affiliates |
During 2015, the Funds incurred expenses for the cost of services rendered by GEAM as investment adviser and administrator.
These expenses are included as advisory and administration fees (“Management Fees”) in the Statements of Operations. The Trustees received no compensation as Trustees for the Elfun Funds.
GEAM may, from time to time, voluntarily subsidize certain expenses of the Elfun Government Money Market Fund (the “Fund”) and, to the extent necessary, reduce its management expense in order to maintain a minimum annualized net yield of 0.00% for the Fund. GEAM may, in its sole and absolute discretion, discontinue any subsidy of Fund expenses or reduction in management expenses
at any time by providing notice to the Trust and by the Board of Trustees.
GEAM may, from time to time, voluntarily subsidize certain expenses of the Elfun Government Money Market Fund (the “Fund”) and, to the extent necessary, reduce its management expense in order to maintain a minimum annualized net yield of 0.00% for the Fund (collectively known as “fee waivers”). GEAM may, in its sole and absolute discretion, discontinue any fee waivers at any time by providing notice to the Fund and its Board of Trustees.
Pursuant to an agreement between GEAM and the Fund, the Fund has agreed to reimburse GEAM for such fee waivers for a period of up to three years from the date of such fee waivers, as long as the Fund’s total operating expense ratio does not exceed 0.60% for the fiscal year in which the reimbursement is made.
Fee waivers subject to potential reimbursement to GEAM by year of expiration are as follows:
| | | | |
| Year | | Amount ($) | |
2018 | | | 203,890 | |
2017 | | | 674,381 | |
2016 | | | 1,051,482 | |
As of December 31, 2015, the Fund had not reimbursed any fee waivers previously made by GEAM.
Pursuant to an investment sub-advisory agreement with GEAM SSGA Funds Management, Inc. (“SSGA FM”) is the sub-adviser to the Elfun Government Money Market Fund. SSGA FM is responsible for the day-to-day portfolio management of the assets of the Elfun Government Money Market Fund, including the responsibility for making decisions to buy, sell or hold a particular security, under the general supervision of GEAM and the Board. For its services, GEAM pays SSGA FM monthly sub-advisory fees which are calculated as a percentage of the average daily net assets of the Elfun Government Money Market Fund.
88
December 31, 2015
| 8. | Investment Transactions |
Purchases and Sales of Securities
The cost of purchases and the proceeds from sales of investments, other than short-term securities, for the year ended December 31, 2015, were as follows:
| | | | | | | | | | | | | | | | |
| | | U.S. Government Securities | | | Other Securities | |
| Fund | | Purchases | | | Sales | | | Purchases | | | Sales | |
Elfun International Equity Fund | | $ | — | | | $ | — | | | $ | 59,606,076 | | | $ | 80,717,961 | |
Elfun Trusts | | | — | | | | — | | | | 257,439,314 | | | | 366,912,458 | |
Elfun Diversified Fund | | | 174,178,072 | | | | 182,296,006 | | | | 73,926,820 | | | | 79,876,938 | |
Elfun Tax-Exempt Income Fund | | | — | | | | — | | | | 346,113,592 | | | | 380,395,953 | |
Elfun Income Fund | | | 720,826,293 | | | | 754,007,232 | | | | 117,731,516 | | | | 98,528,293 | |
The Funds are subject to ASC 740, Income Taxes (“ASC 740”). ASC 740 provides guidance for financial accounting and reporting for the effects of income taxes that result from an entity’s activities during the year. ASC 740 also provides guidance regarding how certain tax positions should be recognized, measured, presented and disclosed in the financial statements. ASC 740 requires evaluation of tax positions taken or expected to be taken
in the course of preparing each Fund’s tax returns to determine whether the tax positions are “more likely than not” of being sustained by the applicable tax authority. There are no adjustments to any Fund’s net assets required under ASC 740. Each Fund’s 2012, 2013, 2014 and 2015 fiscal year tax returns are still open to examination by the Federal and applicable state tax authorities.
At December 31, 2015, information on the tax cost of investments and distributable earnings on a tax basis was as follows:
| | | | | | | | | | | | | | | | | | | | | | | | | | | | | | | | |
Fund | | Cost of
Investment
for Tax
Purposes | | | Gross Tax | | | Net Tax Appreciation/
(Depreciation) | | | Undistributed | | | Late-Year
Losses | |
| | | Appreciation | | | Depreciation | | | Investments | | | Derivatives/ Currency | | | Income | | | Accum. Capital
Gain/(Loss) | | |
Elfun International Equity Fund | | $ | 230,223,929 | | | $ | 26,600,840 | | | $ | (22,975,907 | ) | | $ | 3,624,933 | | | $ | 27,004 | | | $ | — | | | $ | (13,166,355 | ) | | $ | — | |
Elfun Trusts | | | 1,419,451,969 | | | | 965,796,554 | | | | (26,208,647 | ) | | | 939,587,907 | | | | — | | | | — | | | | 712 | | | | — | |
Elfun Diversified Fund | | | 208,347,208 | | | | 14,288,683 | | | | (9,950,947 | ) | | | 4,337,736 | | | | 113,784 | | | | 33,364 | | | | 92,580 | | | | — | |
Elfun Tax-Exempt Income Fund | | | 1,486,755,403 | | | | 114,217,983 | | | | (2,627,501 | ) | | | 111,590,482 | | | | — | | | | 62,821 | | | | (20,624,849 | ) | | | — | |
Elfun Income Fund | | | 306,046,148 | | | | 2,799,401 | | | | (6,507,051 | ) | | | (3,707,650 | ) | | | 225,799 | | | | 359,740 | | | | (40,119 | ) | | | (295,128 | ) |
Elfun Government Money Market Fund | | | 130,929,208 | | | | — | | | | — | | | | — | | | | — | | | | 8,294 | | | | — | | | | — | |
During the year ended December 31, 2015, the Funds utilized prior year capital loss carryovers as follows:
| | | | |
| Fund | | Amount | |
Elfun International Equity | | $ | 10,005,376 | |
Elfun Tax-Exempt Income Fund | | $ | 3,645,615 | |
Any qualified late-year loss is deemed to arise on the first day of a Fund’s next tax year (if the Fund elects to defer such loss). Under this regime, generally, a Fund can elect
to defer any post-October capital loss and/or any late-year ordinary loss as defined by the Internal Revenue Code.
The following Funds elected to defer qualified late-year losses for the year ended December 31, 2015 as follows:
| | | | | | | | |
| Fund | | Capital | | | Ordinary | |
Elfun Income Fund | | $ | (295,128 | ) | | $ | — | |
89
December 31, 2015
As of December 31, 2015, the following Funds have capital loss carryovers as indicated below. The capital loss carryover is available to offset future realized capital gains to the extent provided in the Internal Revenue Code and regulations thereunder. To the extent that these carryover losses are used to offset future capital gains, it is probable that the gains offset will not be distributed to shareholders.
| | | | | | | | | | | | |
| | | Amount | | | | |
| Fund | | Short-Term | | | Long-Term | | | Expires | |
Elfun International Equity Fund | | $ | 13,166,355 | | | $ | — | | | | 12/31/18 | |
Elfun Income Fund | | | — | | | | 40,119 | | | | Unlimited | |
Elfun Tax-Exempt Income Fund | | | 18,068,222 | | | | 2,556,627 | | | | Unlimited | |
These amounts will be available to offset future taxable capital gains. Under the Regulated Investment Company Modernization Act of 2010, the Fund is permitted to carry forward capital losses incurred in taxable years beginning after December 22, 2010 for an unlimited period. However, any losses incurred during those future years will be required to be utilized prior to the losses incurred in pre-enactment tax years. As a result of this ordering rule, pre-enactment capital loss carryforwards may be more likely to expire unused. Additionally, post-enactment capital losses that are carried forward will retain their character as either short-term or long-term capital losses rather than being considered all short-term as under previous law.
The tax character of distributions paid during the year ended December 31, 2015, were as follows:
| | | | | | | | | | | | | | | | | | | | |
| Fund | | Exempt
Income | | | Ordinary
Income | | | Long-Term
Capital Gains | | | Return of
Capital | | | Total | |
Elfun International Equity Fund | | $ | — | | | $ | 4,270,754 | | | $ | — | | | $ | — | | | $ | 4,270,754 | |
Elfun Trusts | | | — | | | | 32,340,902 | | | | 150,013,277 | | | | — | | | | 182,354,179 | |
Elfun Diversified Fund | | | — | | | | 4,151,007 | | | | 7,829,636 | | | | — | | | | 11,980,643 | |
Elfun Tax-Exempt Income Fund | | | 61,714,924 | | | | 974,024 | | | | — | | | | — | | | | 62,688,948 | |
Elfun Income Fund | | | — | | | | 8,902,979 | | | | — | | | | — | | | | 8,902,979 | |
Elfun Government Money Market Fund | | | — | | | | 104,346 | | | | — | | | | — | | | | 104,346 | |
The tax character of distributions paid during the year ended December 31, 2014, were as follows:
| | | | | | | | | | | | | | | | | | | | |
| Fund | | Exempt
Income | | | Ordinary
Income | | | Long-Term
Capital Gains | | | Return of
Capital | | | Total | |
Elfun International Equity Fund | | $ | — | | | $ | 7,173,676 | | | $ | — | | | $ | — | | | $ | 7,173,676 | |
Elfun Trusts | | | — | | | | 30,164,147 | | | | 187,085,675 | | | | — | | | | 217,249,822 | |
Elfun Diversified Fund | | | — | | | | 5,932,099 | | | | 16,627,773 | | | | 379,499 | | | | 22,939,371 | |
Elfun Tax-Exempt Income Fund | | | 63,284,972 | | | | 1,373,283 | | | | — | | | | — | | | | 64,658,255 | |
Elfun Income Fund | | | — | | | | 8,053,107 | | | | — | | | | — | | | | 8,053,107 | |
Elfun Government Money Market Fund | | | — | | | | 62,739 | | | | — | | | | — | | | | 62,739 | |
Distributions to Shareholders
Elfun Tax-Exempt Income Fund, Elfun Income Fund and Elfun Government Money Market Fund declare net investment income dividends daily and pay them monthly. All other Funds declare and pay dividends from net investment income, if any, annually. All Funds declare and pay net realized capital gains distributions, if any, annually. The character of income and gains to be distributed is determined in accordance with income tax regulations which may differ from GAAP. These differences include (but are not limited to) treatment of realized and unrealized gains (losses) on foreign currency contracts, investments in futures, late year loss deferrals, unused capital losses, distribution re-designations, investments in swaps, distributions from real estate investment trusts (“REITs”) and other equity investments, distributions in excess of earnings, litigation proceeds, corporate actions, mixed straddles, return of capital distribution from securities, and losses deferred due to wash sale transactions. Reclassifications are made to a Fund’s capital accounts to reflect income and gains available for distribution (or available capital loss carryovers) under income tax regulations. These reclassifications have no impact on net investment income, realized gains or losses, or NAV of any of the Funds. The calculation of net investment income per share in the Financial Highlights table excludes these adjustments.
90
December 31, 2015
The reclassifications for the year ended December 31, 2015 were as follows:
| | | | | | | | | | | | |
| Fund | | Undistributed
Net Investment
Income | | | Accumulated
Net Realized
Gain (Loss) | | | Paid In
Capital | |
Elfun International Equity Fund | | $ | 209,790 | | | $ | (148,475 | ) | | $ | (61,315 | ) |
Elfun Trusts | | | (70,103 | ) | | | 70,103 | | | | — | |
Elfun Diversified Fund | | | 10,548 | | | | (12,176 | ) | | | 1,628 | |
Elfun Income Fund | | | 126,477 | | | | (126,477 | ) | | | — | |
Elfun Government Money Market Fund | | | 96,124 | | | | (1,746 | ) | | | (94,378 | ) |
91

The Unitholders and Board of Trustees
Elfun Funds:
We have audited the accompanying statement of assets and liabilities, including the schedule of investments, of Elfun International Equity Fund, Elfun Trusts, Elfun Diversified Fund, Elfun Tax-Exempt Income Fund, Elfun Income Fund, and Elfun Government Money Market Fund, each a series of Elfun Funds (collectively the “Funds”) as of December 31, 2015, and the related statement of operations for the year then ended, the statements of changes in net assets for each of the years in the two-year period then ended, and the financial highlights for each of the years in the five-year period then ended. These financial statements and financial highlights are the responsibility of the Fund’s management. Our responsibility is to express an opinion on these financial statements and financial highlights based on our audits.
We conducted our audits in accordance with the auditing standards of the Public Company Accounting Oversight Board (United States). Those standards require that we plan and perform the audit to obtain reasonable assurance about whether the financial statements and financial highlights are free of material misstatement. An audit includes examining, on a test basis, evidence supporting the amounts and disclosures in the financial statements. Our procedures included confirmation of securities owned as of December 31, 2015, by correspondence with the custodian and brokers. An audit also includes assessing the accounting principles used and significant estimates made by management, as well as evaluating the overall financial statement presentation. We believe that our audits provide a reasonable basis for our opinion.
In our opinion, the financial statements and financial highlights referred to above present fairly, in all material respects, the financial position of Elfun International Equity Fund, Elfun Trusts, Elfun Diversified Fund, Elfun Tax-Exempt Income Fund, Elfun Income Fund, and Elfun Government Money Market Fund as of December 31, 2015, the results of its operations for the year then ended, the changes in its net assets for each of the years in the two-year period then ended, and the financial highlights for each of the years in the five-year period then ended, in conformity with U.S. generally accepted accounting principles.

Boston, Massachusetts
February 24, 2016
92

For the year ended December 31, 2015
The following Funds intend to make an election under Internal Revenue Code Section 853. The election will allow shareholders to treat their attributable share of foreign taxes paid by the Funds to be paid by them directly. For the fiscal year ended December 31, 2015, the total amount of income received by the Funds from sources within foreign countries and possessions of the United States and the total amount of taxes paid by the Funds follows:
| | | | | | | | | | |
| | | Total Foreign
Source Income | | Total Foreign
Taxes Paid |
Elfun International Equity Fund | | | $ | 5,727,962 | | | | $ | 547,279 | |
For the year ended December 31, 2015, the following Funds hereby designate as capital gain dividends the amounts set forth, or the amount ultimately treated as capital gain net income:
| | | | | |
| Fund | | Gross
Amount |
Elfun Trusts | | | $ | 150,013,277 | |
Elfun Diversfied Fund | | | | 7,829,636 | |
For the fiscal year ended December 31, 2015, certain dividends paid by the Funds may be subject to a maximum income tax rate of 20% as provided for by the American Taxpayer Relief Act of 2012. The following represent the amounts that may be considered qualified dividend income:
| | | | | |
| Fund | | Qualified
Dividend
Income |
Elfun International Equity Fund | | | $ | 4,818,033 | |
Elfun Trusts | | | | 35,318,700 | |
Elfun Diversified Fund | | | | 2,403,744 | |
For corporate shareholders the following represent the percentages of respective fund distributions that may be eligible for the dividends received deduction:
| | | | | |
| Fund | | Dividends
Received
Deduction |
Elfun Trusts | | | | 98.96% | |
Elfun Diversified Fund | | | | 29.51% | |
For the year ended December 31, 2015, the following Fund hereby designates as exempt-interest dividends the amounts set forth, or the amount ultimately treated as exempt-interest dividends:
| | | | | |
| Fund | | Gross
Amount |
Elfun Tax-Exempt Income Fund | | | $ | 61,714,924 | |
The amounts presented herein may differ from amounts presented elsewhere in the financial statements due to differences between tax and financial accounting principles. Please consult a tax advisor if you have any questions about Federal or State income tax laws or on how to prepare your tax returns. If you have specific questions about your Fund account, please consult your investment representative.
93

The Board of Trustees of the Elfun Funds1 (the “Board”) considered and all those that were present unanimously approved the continuance for an additional year of each of the Funds’ investment advisory agreements with GE Asset Management Incorporated (“GEAM”); and with respect to the Elfun Government Money Market Fund, the continuance of the investment sub-advisory agreement with SSGA Funds Management, Inc. (“SSGA FM”), at a meeting held on December 14, 2015.
In considering whether to approve the Funds’ investment advisory agreements and the Elfun Government Money Market Fund’s investment sub-advisory agreement, the Board members considered and discussed a substantial amount of information and analysis provided by GEAM and SSGA FM. The Board members also considered detailed information regarding performance and expenses of other investment companies, including those with similar investment strategies and sizes, which was prepared by an independent third party provider, Morningstar, Inc. (“Morningstar”). The Board members reviewed the fees charged by GEAM for other mutual funds and investment products other than mutual funds that employ similar investment strategies as the Funds. The Board had the opportunity to ask questions and request additional information in connection with its considerations.
Before approving each Fund’s investment advisory agreement and the Elfun Government Money Market Fund’s sub-advisory agreement, the Board members received and considered memoranda prepared by GEAM personnel that set forth detailed information, including numerous exhibits and other materials related to GEAM’s business and the services it provides to each Fund. Also, in advance of the meeting, the Board members received from SSGA FM a written response to a letter of inquiry prepared by GEAM at the Board’s request, which included substantial exhibits and other materials related to the business of, and services provided by, SSGA FM. The Board members also reviewed materials discussing the legal standards for the consideration of the proposed continuances. The Board members reviewed and discussed the proposed continuance of the agreements with GEAM personnel, including representatives from the legal, compliance and finance departments and senior
members of each relevant investment group (e.g., equity, fixed income), and heard presentations by these representatives. The Board members posed questions to these representatives and engaged in substantive discussions with them concerning the Funds’ operations and each of their investment processes. The Board members took into account that many of them possess multi-year experience as Board members and that all of them possess a great deal of knowledge about GEAM and the Funds in their capacities as senior officers of GEAM. They also took into account their consideration of these types of agreements in recent years. The information was presented in a manner to facilitate comparisons to prior periods and to reflect certain enhancements to GEAM’s infrastructure, systems, research and analytics capabilities and shareholder servicing model. To focus their review, the Board members asked GEAM personnel and SSGA FM, in their oral presentations and/or written materials, to highlight material differences from the information presented in recent years.
In reaching their determinations relating to the continuance of the Funds’ investment advisory agreements and the Elfun Government Money Market Fund’s investment sub-advisory agreement, the Board members considered all factors that they deemed relevant, including the factors discussed below. In their deliberations, the Board members did not identify any particular information that was all-important or controlling, and each Board member may have attributed different weights to the various factors. The Board members evaluated this information, and all other information available to them, for each Fund separately, and their determinations were made separately in respect of each Fund. In particular, the Board members focused on the following with respect to each Fund:
The Nature, Extent And Quality Of Services Provided
The Board members reviewed the services provided by GEAM and concurred that GEAM provides high quality advisory and administrative services to the Funds. The Board members also reviewed the services provided to the Elfun Government Money Market Fund by SSGA FM, taking into account their past experiences with SSGA FM. In connection with their consideration of GEAM’s services, the Board members focused on the favorable attributes of GEAM, including (i) an investment philosophy oriented toward long-term performance; (ii) effective processes
1 The Elfun Funds include the Elfun Trusts, Elfun International Equity Fund, Elfun Diversified Fund, Elfun Tax-Exempt Income Fund, Elfun Income Fund, Elfun Government Money Market Fund (each, a “Fund” and collectively, the “Funds”).
94
used for selecting investments and brokers; with respect to the Elfun Government Money Market Fund, effective processes used for overseeing sub-advisers; (iii) effective processes used for providing Fund administration, including controllership and compliance functions, the optimization of its Fund administration platform and the continued oversight of the performance of other companies that provide services to the Funds; (iv) highly skilled professionals, including analysts, research professionals, traders and portfolio managers with a depth of experience relevant to the Funds; (v) access to significant and enhanced technological resources from which the Funds may benefit, including a platform that increases the quality and efficiency of analytics and research; and (vi) a favorable history and reputation. The Board members noted that each Fund represents only a small amount of the overall assets managed by GEAM, but benefits from a full array of services and resources provided by GEAM. In particular, the Board members discussed that the Funds benefit from a large staff of research analysts employed by GEAM.
In connection with their consideration of the services provided to the Elfun Government Money Market Fund by SSGA FM, the Board members focused on SSGA FM’s favorable attributes, including its substantial experience managing funds of this type, investment philosophy and discipline, experienced investment and trading personnel, systems and other resources, and favorable history and reputation.
In light of the foregoing, the Board members concluded that the services provided by GEAM and SSGA FM continue to be satisfactory.
Investment Performance Of The Funds And The Sub-Adviser
The Board members considered the investment performance of the Funds for various periods. The Board members reviewed detailed comparisons of the performance of the Funds with the relevant securities indices and peer and category groupings of mutual funds prepared by Morningstar with respect to various periods. The Board members also engaged in discussions with GEAM personnel regarding the investment process and performance results for each Fund. These discussions focused on each Fund’s investment objective, the number and experience of portfolio management and supporting research personnel, the investment style and approach
employed, the likely market cycles for the investment style and, in some instances, relative underperformance of certain Funds in certain periods. The Board members discussed GEAM’s investment approach with respect to each of the Funds, and the reasons for certain Funds’ relative underperformance.
The Board members concluded that the Funds’ performance was acceptable overall, taking into consideration the factors discussed above.
Cost Of The Services Provided To The Funds
The Board members considered the cost of the services provided by GEAM, noting that, pursuant to each investment advisory agreement, GEAM is reimbursed for its reasonable costs incurred in providing the services contemplated by those agreements and is not paid a management fee. The Board also noted that GE Investment Distributors, Inc. (“GEID”), a subsidiary of GEAM, is reimbursed for its reasonable costs incurred in providing services specified in its agreement with the Funds as unitholder servicing agent and is not paid a unitholder servicing fee. The Board members considered that the charges resulting from this arrangement involve all of the expenses incurred by GEAM and GEID with respect to the management and unitholder operations of the Funds, including, without limitation, indirect allocable overhead costs and the direct and indirect costs of GEAM and GEID personnel providing investment management and other services to the Funds. The Board members noted and discussed the additional services provided by GEAM to the Funds compared to other investment products managed by GEAM and the charges that result from those services. The Board members also noted that none of the charges resulting from the Funds’ arrangements with GEAM and GEID may include any element of profit.
The Board members also noted that the Board had in prior years reviewed with GEAM personnel the underlying assumptions and methods of cost allocation used by GEAM in allocating its costs and those of the other Fund service providers, including GEID, to the Funds, and considered the new cost allocation method that was implemented for the Funds in the second half of 2015. The Board members also discussed with GEAM personnel the basis for their belief that the methods of allocation used by GEAM continue to be reasonable for each area of GEAM’s business.
95
The Board members considered the fees paid to SSGA FM by the Elfun Government Money Market Fund, and the cost of the services provided by SSGA FM to the Elfun Government Money Market Fund. The Board members considered the information they had requested from SSGA FM concerning its profitability. Information was presented regarding SSGA FM’s financial condition for various past periods. The Board members determined that SSGA FM should be entitled to earn a reasonable level of profit for the services it provides to the Elfun Government Money Market Fund.
Based on their review, the Board members concluded that they were satisfied that the assumptions and methods used in cost allocation and the level of expenses incurred by the Funds, as well as the level of profitability to SSGA FM from its relationship with the Elfun Government Money Market Fund, were not unreasonable or excessive.
The Extent To Which Economies Of Scale Would Be Realized For The Benefit Of Fund Shareholders As The Funds Grow
Although the Funds did not experience an increase in assets over the past year, the Board members considered the extent to which economies of scale would be realized for the benefit of Fund investors as the Funds grow. The Board noted that the Funds continue to enjoy fee and expense levels within or below the group of lowest fee and expense funds in their respective peer group comparisons. The Board also noted that, with respect to the Elfun Government Money Market Fund, GEAM voluntarily undertook to reduce its management fee or subsidize certain expenses of the Fund to the extent necessary to maintain a minimum annualized net yield of 0.00%.
The Board members recognized the significant benefits to the Funds resulting from their arrangement with GEAM, which causes them to bear only the reasonable costs incurred by GEAM and GEID, without any element of profit, for the substantial services they provide to the Funds. The Board members also recognized the benefits to the Funds of being able to leverage a favorable cost structure achieved with respect to the Funds’ other operating expenses as a result of GEAM’s large overall base of assets under management and its vendor management practices.
Comparison Of Services To Be Rendered And Costs To Be Incurred
The Board members discussed the services provided to the Funds by GEAM and to the Elfun Government Money Market Fund by SSGA FM, and the costs incurred by the Funds for those services, including the services required of GEAM to oversee the services provided by SSGA FM, the sub-adviser to the Elfun Government Money Market Fund. The Board members reviewed information concerning the Funds’ expense ratios, and comparative information with respect to peer groupings of mutual funds prepared by Morningstar. They discussed that, in all cases, the Funds enjoy expense levels within or below the group of lowest cost funds in each peer group comparison. In connection with the Elfun Government Money Market Fund, the Board members reviewed comparative mutual fund and/or other account fee information provided by SSGA FM. In light of this information, the Board members determined that the level of expenses incurred and, with respect to the Elfun Government Money Market Fund, the sub-advisory fees paid to SSGA GM, considered in relation to the services provided to the Funds, supported the Board’s approval of the investment advisory and sub-advisory agreements.
Fall-Out Benefits
The Board members considered other actual and potential financial benefits that GEAM and SSGA FM may derive from their relationship with the Funds, including, where applicable, soft dollar commission benefits generated through Fund portfolio transactions. The Board members noted, however, that the Funds benefit from the vast array of resources available through GEAM, and that each Fund represents only a small amount of the overall assets managed by GEAM.
Conclusion
No single factor was determinative to the Board’s decision. Based on their discussion and such other matters as were deemed relevant, the Board members concluded that the proposed level of cost reimbursement to GEAM and projected total expense ratios for the Funds are reasonable in relation to the services provided. In view of these facts, the Board members concluded that the renewal of each investment advisory agreement and the sub-advisory agreement with SSGA FM was in the best interests of the Funds.
96

Matters Considered by the Board in Approving a Sub-Advisory Agreement with SSgA FM
At a Board meeting held on June 9, 2014 (the “Board Meeting”), members of the Board who were present at the Board Meeting considered and unanimously approved the Proposed Sub-Advisory Agreement with SSgA Funds Management, Inc. (“SSgA FM”). In advance of the Board Meeting, the Board received materials from both GE Asset Management Incorporated (“GEAM”) and SSgA FM, and had the opportunity to ask questions and request additional information in connection with its consideration. The materials detailed, among other things, information about SSgA FM and its professional staff, SSgA FM’s historical performance in managing money market funds for its other clients, and information detailing SSgA FM’s investment experience and expertise in managing money market funds and in servicing institutional clients.
During a series of meetings prior to the Board Meeting, representatives of GEAM had explained and discussed with the Board the specific reasons why GEAM was recommending SSgA FM and responded to questions raised by the Board. The Board members posed questions to these representatives and engaged in substantive discussions.
In approving the Proposed Sub-Advisory Agreement with SSgA FM, the Board members considered those factors it deemed relevant, including the nature, quality and extent of services expected to be provided by SSgA FM. In its deliberations, the Board did not identify any single factor that was dispositive and each Board member may have attributed different weights to the various factors. The Board members evaluated this information and all other information made available to them by GEAM and SSgA FM, as well as the presentations and discussions that occurred at the Board Meeting.
The material factors and conclusions that formed the basis for the Board’s determinations to approve the Proposed Sub-Advisory Agreement with SSgA FM are as discussed below.
The Nature, Extent and Quality of Services Expected to be Provided.
The Board members reviewed the services expected to be provided to the Elfun Government Money Market Fund (the “Money Market Fund”) by SSgA FM. The Board
considered SSgA FM’s favorable attributes, including its substantial experience managing funds of this type, investment philosophy and discipline, experienced investment and trading personnel, systems and other resources, and favorable history and reputation.
In light of the foregoing, the Board concluded that the services expected to be provided by SSgA FM would be satisfactory and would have the potential to benefit the Money Market Fund.
Investment Performance of SSgA FM.
The Board members considered the investment performance of SSgA FM for various periods focusing on SSgA FM’s investment performance with respect to registered investment companies that have an investment objective similar to that of the Money Market Fund. The Board members reviewed detailed information provided by GEAM management and SSgA FM comparing SSgA FM’s performance to that of similarly managed accounts over these periods. The Board also engaged in detailed discussions with GEAM about SSgA FM’s investment processes, focusing on the number and experience of portfolio management and supporting research personnel and SSgA FM’s investment style and approach employed. The Board discussed the extent to which the expected investment style and approach would be consistent with GEAM’s articulated long-term approach and overall investment philosophy.
Taking these factors into consideration, the Board concluded the investment performance of SSgA FM to be satisfactory.
Cost of the Services to be Provided to the Fund.
The Board members considered the proposed fees that would be paid to SSgA FM by the Money Market Fund and the cost of the services that would be provided by SSgA FM to the Money Market Fund. The Board members also reviewed actual and pro forma information concerning the fees and expenses for the Money Market Fund if SSgA FM were to be retained as a sub-adviser. The Board considered that the proposed fees to be paid to SSgA FM by the Money Market Fund had been negotiated at arm’s-length, and that GEAM had used its influence with respect to the total assets it proposes to be managed by SSgA FM to obtain what it regards as a favorable and highly competitive fee arrangement. Given the arm’s-length nature of the negotiations, the Board did not
97
examine the specific levels of profitability for SSgA FM with respect to the Money Market Fund at this time.
The Extent to Which Economies of Scale Would be Realized as the Fund Grows and Whether Fee Levels Would Reflect Such Economies of Scale.
The Board members considered and noted the limited economies of scale that unitholders would realize as the Money Market Fund grows and recognized that various economies of scale are already reflected in the very competitive sub-advisory fee rate for SSgA FM given the existing scale of the management of similar assets.
Comparison of Services to be Rendered and Fees to be Paid.
The Board discussed the services expected to be provided to the Money Market Fund by SSgA FM, and SSgA FM’s proposed fees to be charged to the Money Market Fund for those services. The Board members reviewed information regarding the proposed sub-advisory fees.
The Board concluded that based on this information, the proposed sub-advisory fees would be reasonable in relation to the services expected to be provided to the Money Market Fund.
Fall-Out Benefits.
The Board considered that there might be financial benefits that SSgA FM could derive from its relationship with GEAM and the Money Market Fund. The Board did not view this consideration as having a material effect on its overall view of the reasonableness of the proposed fees for the Money Market Fund.
Conclusion
No single factor was determinative to the Board’s decision. Based on their discussion and such other matters as were deemed relevant, the Board members concluded that the approval of the Proposed Sub-Advisory Agreement with SSgA FM was in the best interests of the Money Market Fund and its unitholders.
98

Information about Trustees and Executive Officers:
The business and affairs of the Funds are managed under the direction of the Funds’ Board of Trustees. Information pertaining to the Trustees and officers of the Funds is set forth below.
Interested Trustees and Executive Officers
Dmitri Stockton
Address c/o GEAM 1600 Summer St. Stamford, CT 06905
Age 51
Position(s) Held with Fund Chairman of the Board and President
Term of Office and Length of Time Served Until successor is elected and qualified – 4 years
Principal Occupation(s) During Past 5 Years President and Chief Executive Officer of GEAM since May 2011; President and Chief Executive Officer of GE Capital’s Global Banking unit from January 2009 to April 2011; President and CEO of GE Money’s Central and Eastern European Banking Group from January 2005 to December 2008.
Number of Portfolios in Fund Complex Overseen by Trustee 8
Other Directorships Held by Trustee Director of Synchrony Financial since February 2014; Director of GEAM since May 2011; Member of the Board of GE Foundation since November 2009; Member of the Executive Advisory Council at North Carolina A&T State University School of Business and Economics since March 2011; Trustee of GE Retirement Savings Plan Funds (formerly GE Savings & Security Funds) and General Electric Pension Trust since May 2011 and Member of the National Board of Directors of A Better Chance since January 2012.
George A. Bicher
Address c/o GEAM 1600 Summer St. Stamford, CT 06905
Age 57
Position(s) Held with Fund Trustee
Term of Office and Length of Time Served Until successor is elected and qualified – 4 years
Principal Occupation(s) During Past 5 Years Chief Investment Officer – Emerging Markets Equities since February 2014; Chief Risk Officer of GEAM from March 2011 to February 2014; Senior Vice President and Portfolio Manager of GEAM from 2009 to 2011; Director of U.S. Equity Research and Portfolio Manager of GEAM from 2006 to 2009; U.S. equity research analyst of GEAM from 2002 to 2006.
Number of Portfolios in Fund Complex Overseen by Trustee 8
Other Directorships Held by Trustee Trustee of GE Retirement Savings Plan Funds (formerly GE Savings & Security Funds) and General Electric Pension Trust and Director of GEAM since March 2011.
JoonWon Choe
Address c/o GEAM 1600 Summer St. Stamford, CT 06905
Age 46
Position(s) Held with Fund Assistant Secretary
Term of Office and Length of Time Served Until successor is elected and qualified – 5 years
Principal Occupation(s) During Past 5 Years Senior Vice President and Deputy General Counsel of GEAM since March 2011; Vice President and Secretary of GE Institutional Funds and GE Investments Funds, Inc. since September 2010; Vice President and Assistant Secretary of GE Retirement Savings Plan Funds (formerly GE Savings & Security Funds) since September 2010; Senior Vice President and Associate General Counsel of GEAM from June 2010 to March 2011; Vice President and Associate General Counsel of GEAM from November 2005 to June 2010; and Vice President and Secretary of GE Funds from September 2010 to February 2011.
Number of Portfolios in Fund Complex Overseen by Officer N/A
Other Directorships Held by Officer N/A
Paul M. Colonna
Address c/o GEAM, 1600 Summer St. Stamford, CT 06905
Age 47
Position Held with Fund Trustee
Term of Office and Length of Time Served Until successor is elected and qualified – 8 years
Principal Occupation(s) During Past 5 Years President and Chief Investment Officer – Public Investments of GEAM since March 2012; President and Chief Investment Officer – Fixed Income Investments at GEAM from March 2007 to March 2012; Executive Vice President of GEAM from February 2007 to March 2007; Senior Vice President – Total Return Management of GEAM from March 2005 to March 2007.
Number of Portfolios in Fund Complex Overseen by Trustee 8
Other Directorships Held by Trustee Trustee of GE Retirement Savings Plan Funds (formerly GE Savings & Security Funds) and General Electric Pension Trust since February 2007; Director of GEAM since March 2007; and Director of GE Asset Management Limited since December 2007.
Gregory B. Hartch
Address c/o GEAM 1600 Summer St. Stamford, CT 06905
Age 46
Position(s) Held with Fund Trustee
Term of Office and Length of Time Served Until successor is elected and qualified – 4 years
Principal Occupation(s) During Past 5 Years Chief Risk Officer of GEAM since February 2014; Executive Vice President and Strategy and Business Development Leader of GEAM from December 2011 to February 2014; Senior Vice President – Tactical Asset Allocation from 2010 to December 2011; Managing Director – International Real Estate from 2007 to 2010; and Director of Fixed Income Research from 2004 to 2007.
Number of Portfolios in Fund Complex Overseen by Trustee 8
Other Directorships Held by Trustee Trustee of GE Retirement Savings Plan Funds (formerly GE Savings & Security Funds) and General Electric Pension Trust since January 2012.
99
Arthur A. Jensen
Address c/o GEAM 1600 Summer St. Stamford, CT 06905
Age 49
Position(s) Held with Fund Treasurer
Term of Office and Length of Time Served Until successor is elected and qualified – 4 years
Principal Occupation(s) During Past 5 Years Treasurer of GE Institutional Funds, GE Investments Funds, Inc. and GE Retirement Savings Plan Funds (formerly GE Savings & Security Funds) since June 2011; Mutual Funds Controller of GEAM since April 2011; Senior Vice President at Citigroup from 2008 to 2010; and Vice President at JPMorgan from 2005 to 2008.
Number of Portfolios in Fund Complex Overseen by Officer N/A
Other Directorships Held by Officer N/A
Jeanne M. La Porta
Address c/o GEAM 1600 Summer St. Stamford, CT 06905
Age 50
Position(s) Held with Fund Trustee
Term of Office and Length of Time Served Until successor is elected and qualified – 1 year
Principal Occupation(s) During Past 5 Years Senior Vice President and Commercial Operations Leader at GEAM since March 2014; President of GE Institutional Funds and GE Investments Funds, Inc. since April 2014; President and Trustee of GEAM’s UCITs Funds since March 2014; Senior Vice President and Commercial Administrative Officer at GEAM from April 2010 to March 2014; Vice President of GE Investments Funds, Inc. and GE Institutional Funds since July 2003; Vice President of GE Retirement Savings Plan Funds (formerly GE Savings & Security Funds) and Elfun Funds since October 2003; Secretary of GE Funds from July 2007 to September 2010 and Vice President from July 2007 to February 2011; Senior Vice President and Deputy General Counsel of GEAM from October 2007 to April 2010; Vice President and Assistant Secretary of GE Funds from September 2003 to July 2007 and Assistant Secretary of Elfun Funds and GE Retirement Savings Plan Funds from July 2003 to June 2010; and Vice President and Associate General Counsel – Marketing and Client Services (formerly Asset Management Services) of GEAM from May 1997 to October 2007.
Number of Portfolios in Fund Complex Overseen by Trustee 24
Other Directorships Held by Trustee Director of GE Investments Funds, Inc. since 2014; Trustee of GE Institutional Funds since 2014; Trustee of GE Retirement Savings Funds and General Electric Pension Trust since 2014; Director of GE Investment Distributors, Inc. since June 2011.
Ralph R. Layman
Address c/o GEAM 1600 Summer St. Stamford, CT 06905
Age 59
Position(s) Held with Fund Trustee
Term of Office and Length of Time Served Until successor is elected and qualified – 24 years
Principal Occupation(s) During Past 5 Years Executive Vice President and Chief Investment Officer – Emeritus of GEAM since March 2012; President and Chief Investment Officer – Public Equity Investments of GEAM from June 2009 to March 2012; President – International Equities from March 2007 to July 2009; Executive Vice President – International Equity Investments of GEAM from 1992 to March 2007 and Senior Vice President International Investments from 1991 to 1992.
Number of Portfolios in Fund Complex Overseen by Trustee 8
Other Directorships Held by Trustee Trustee of GE Retirement Savings Plan Funds (formerly GE Savings & Security Funds) and General Electric Pension Trust since 1993; Director of GE Asset Management Limited since September 2005 and Director of GEAM since July 2009.
Matthew J. Simpson
Address c/o GEAM 1600 Summer St. Stamford, CT 06905
Age 54
Position(s) Held with Fund Trustee and Secretary
Term of Office and Length of Time Served 8 years
Principal Occupation(s) During Past 5 Years Executive Vice President, General Counsel and Secretary of GEAM since July 2007; Secretary of Elfun Funds and GE Retirement Savings Plan Funds (formerly GE Savings & Security Funds) since July 2007; Senior Vice President and General Counsel – Marketing and Client Services (formerly Asset Management Services) of GEAM and Senior Vice President and General Counsel of GE Asset Management Services from February 1997 to July 2007; Vice President and Associate General Counsel of GEAM from October 1992 to February 1997; Secretary of GE Institutional Funds and GE Investments Funds, Inc. from 1997 to July 2007 and Vice President from September 2003 to July 2007; Assistant Secretary of Elfun Funds and GE Retirement Savings Plan Funds from 1998 to July 2007 and Vice President from October 2003 to July 2007; and Secretary of GE Funds from 1993 to July 2007 and Vice President from September 2003 to July 2007.
Number of Portfolios in Fund Complex Overseen by Trustee 24
Other Directorships Held by Trustee Trustee of GE Retirement Savings Plan Funds (formerly GE Savings & Security Funds) and General Electric Pension Trust since July 2007; Trustee of GE Institutional Funds since July 2007; Director of GE Investments Funds, Inc. and GEAM since July 2007; and Trustee of GE Funds from July 2007 to February 2011.
100
Donald W. Torey
Address c/o GEAM 1600 Summer St. Stamford, CT 06905
Age 58
Position(s) Held with Fund Trustee
Term of Office and Length of Time Served Until successor is elected and qualified – 22 years
Principal Occupation(s) During Past 5 years President and Chief Investment Officer – Alternative Investments of GEAM since March 2007; Executive Vice President of GEAM from 1997 to March 2007; Executive Vice President – Alternative Investments of GEIC from 1997 to March 2007.
Number of Portfolios in Fund Complex Overseen by Trustee 8
Other Directorships Held by Trustee Trustee of GE Retirement Savings Plan Funds (formerly GE Savings & Security Funds) and General Electric Pension Trust since 1993 and Director of GEAM since 1997.
David Wiederecht
Address c/o GEAM, 1600 Summer St. Stamford, CT 06905
Age 59
Position Held with Fund Trustee
Term of Office and Length of Time Served Until successor is elected and qualified – 7 years
Principal Occupation(s) During Past 5 Years President and Chief Investment Officer – Investment Solutions of GEAM since February 2008; Portfolio Manager – GE Institutional Funds since September 2010; Managing Director – Alternative Investments from 2004 to 2008; Vice President – Alternative Investments/Private Equity/Hedge Fund from 1998 to 2004.
Number of Portfolios in Fund Complex Overseen by Trustee 8
Other Directorships Held by Trustee Trustee of GE Retirement Savings Plan Funds (formerly GE Savings & Security Funds) and General Electric Pension Trust since 2008; Director of GEAM since August 2008 and Director of Edmunds Holding Company since 1999.
Matthew Zakrzewski
Address c/o GEAM 1600 Summer St. Stamford, CT 06905
Age 55
Position(s) Held with Fund Trustee
Term of Office and Length of Time Served Until successor is elected and qualified – 3 years
Principal Occupation(s) During Past 5 Years Executive Vice President and Chief Financial Officer of GEAM since August 2013; formerly, Chief Financial Officer for GE Ventures from 2012 to 2013 and Chief Financial Officer for GE Risk, Insurance and Corporate Financing from 2006 to 2012.
Number of Portfolios in Fund Complex Overseen by Trustee 8
Other Directorships Held by Trustee Trustee of GE Retirement Savings Plan Funds (formerly GE Savings & Security Funds) and General Electric Pension Trust since September 2013 and Director of GEAM since September 2013.
101

Portfolio Manager Biographies
The following sets forth biographical information for those individuals who are primarily responsible for managing the specified Fund’s investments. The portfolio managers may change from time to time.
David B. Carlson is Chief Investment Officer – U.S. Equities at GEAM. He manages the overall U.S. equity investments for GEAM. Mr. Carlson has served as the portfolio manager for Elfun Trusts since 1988. Mr. Carlson joined GEAM in 1982 as a securities analyst for investment operations. He became a Vice President for Mutual Fund Portfolios in 1987, a Senior Vice President in 1989 and an Executive Vice President in 2003.
Michael J. Caufield is a Senior Vice President of GEAM. He is the portfolio manager of the Elfun Tax-Exempt Income Fund and has served in that capacity since October 2000. Mr. Caufield joined GEAM in 1987 as Vice President, Manager of Fixed Income Research & Analysis and was promoted to Senior Vice President in 1994.
William M. Healey is a Senior Vice President and Chief Investment Officer – Core Fixed Income Investments of GEAM. He has served on the portfolio management team for the Elfun Income Fund since joining GEAM in 1996. Mr. Healey became Vice President in June 2001, Senior Vice President in January 2007 and Chief Investment Officer – Core Fixed Income Investments in April 2012. Prior to joining GEAM, Mr. Healey spent over 11 years in the fixed income group at MetLife.
Mark H. Johnson is a Senior Vice President and Chief Investment Officer – Insurance and Long Duration of GEAM. He has been a member of the portfolio management team for the Elfun Income Fund since 2007. Mr. Johnson joined GE in 1998 and GEAM as a Vice President and portfolio manager in 2002. He became Senior Vice President in September 2007 and Chief Investment Officer – Insurance and Long Duration in April 2012. Prior to joining GEAM, Mr. Johnson held positions at various insurance companies and public accounting firms.
Ralph R. Layman is an Executive Vice President, Chief Investment Officer Emeritus and a Director of GEAM. Mr. Layman has served as a portfolio manager of the
Elfun International Equity Fund since 1991. Mr. Layman joined GEAM in 1991 as a Senior Vice President for International Investments, became an Executive Vice
President in 1992, served as President – International Equities from March 2007 to July 2009, President and Chief Investment Officer – Public Equities from July 2009 to March 2012, and has served as Chief Investment Officer Emeritus since March 2012.
Jeffrey Palma is a Senior Vice President and Chief Market Strategist of GEAM, and a portfolio manager of the Elfun Diversified Fund. He became a member of the portfolio management team for the Elfun Diversified Fund in May 2013. Prior to joining GE Asset Management in 2012, Mr. Palma worked for UBS Investment Bank where he held a variety of global research and macro strategy roles supporting UBS’ global equities and fixed income businesses including Managing Director, Head of Global Equity Strategy rom 2007 to 2012, Executive Director, Global Asset Allocation Strategist from 2001 to 2007 and Director, U.S. Economist from 1999 to 2001.
Michael J. Solecki is a Senior Vice President and Chief Investment Officer – International Equities at GEAM. He has served as a portfolio manager of the Elfun International Equity Fund since August 1999. He joined GEAM in 1990 as an international equity analyst. He became a Vice President for international equity portfolios in 1996, Senior Vice President in 2000, Co-Chief Investment Officer – International Equities in March 2009 and Chief Investment Officer – International Equities in March 2012.
David Wiederecht is the President and Chief Investment Officer – Investment Solutions and a Director at GEAM. He has served as a portfolio manager to the Elfun Diversified Fund since January 2011. Mr. Wiederecht joined GEAM in 1988 and has held various positions at GEAM including Vice President – Alternative Investments/Private Equity/Hedge Fund from 1998 to 2004, Managing Director – Alternative Investments from 2004 to 2008, and President and Chief Investment Officer – Investment Solutions since 2008.
Todd N. Bean, CFA is a Vice President and Senior Portfolio Manager of State Street Global Advisors in the firm’s US Cash Management Group. Mr. Bean has served as portfolio manager of the Elfun Government Money Market Fund since September 2014. Mr. Bean began his career at State Street in 1999, joining the firm as an analyst in the firm’s custody and settlements area.
102
Portfolio Manager Biographies (continued)
Following a stint on the money markets operations staff, he joined the Cash Management Group in 2004.
Jeff A. St. Peters is a Managing Director of State Street Global Advisors and the head of U.S. Cash Management within the Global Cash Management division. Mr. St. Peters has served as portfolio manager of the Elfun Government Money Market Fund since September 2014. Mr. St. Peters manages a team of portfolio managers that focus on traditional money market and securities lending cash collateral funds. He is also a Senior Portfolio Manager responsible for several securities lending, enhanced cash, offshore, and SSgA’s registered money market portfolios for both retail and institutional clients. Mr. St. Peters has been managing short duration cash and securities lending portfolios at SSgA for over 12 years. He is a member of SSgA’s Senior Leadership Team.
Prior to joining SSgA, Jeff was employed nearly 9 years with Fidelity Investments, the latter years within the Fidelity Management and Research Company, where he worked as a trader within the Money Market area of the Fixed Income division. In addition, he held several positions within Fidelity’s Investment Technology area, where he assisted in designing and implementing an internal proprietary trading system.
103
Portfolio Managers
Elfun International Equity Fund
Ralph R. Layman
Michael J. Solecki
Elfun Trusts
David B. Carlson
Elfun Diversified Fund
David Wiederecht
Jeffrey Palma
Elfun Tax-Exempt Income Fund
Michael Caufield
Elfun Income Fund
William M. Healey
Mark H. Johnson
Elfun Government Money Market Fund
SSGA Funds Management, Inc.
Investment Adviser
GE Asset Management Incorporated
Independent Registered Public Accounting Firm
KPMG LLP
Custodian
State Street Bank & Trust Company
Unitholder Servicing Agent
Address all inquiries to:
Elfun Mutual Funds
c/o U.S. Bancorp Fund Services, LLC
P.O. Box 701
Milwaukee, WI 53201-0701
104

Online Service
Your Elfun Mutual Fund accounts can now be accessed on the Internet at www.geam.com.
Here are some of the online services:
| • | | View account balance and transaction history |
| • | | View and order tax forms |
| • | | View quarterly statements |
| • | | Re-order money market checks |
Telephone Service
Our GE Mutual Funds Shareholder Service Associates are available Monday to Friday from 9:00 AM to 8:00 PM Eastern Standard Time. Call toll-free, 1-800-242-0134, for assistance.
Automated Voice Response System
You can also access your account anytime during the day, 7 days a week by dialing 1-800-242-0134. Simply follow the menu to obtain information or make certain transactions.
Contact Us By Mail
If you’d like to write to us, address your inquiries regarding your account(s) to:
Elfun Mutual Funds
c/o U.S. Bancorp Fund Services, LLC
P.O. Box 701
Milwaukee, WI 53201-0701
105

M O R N I N G S T A R R A T I N G S TM Through December 31, 2015
| | | | |
| FUND (CATEGORY) | | NUMBER OF
FUNDS IN CATEGORY | | STAR
RATING |
| Elfun International Equity (Foreign Large Blend) |
| Overall | | 891 | | ¶ ¶ ¶ |
| | |
3 year | | 772 | | ¶ ¶ ¶ |
| | |
5 year | | 699 | | ¶ ¶ ¶ |
| | |
10 year | | 529 | | ¶ ¶ ¶ |
| Elfun Trusts (Large Growth) |
| Overall | | 1,779 | | ¶ ¶ ¶ ¶ |
| | |
3 year | | 1,702 | | ¶ ¶ ¶ |
| | |
5 year | | 1,547 | | ¶ ¶ ¶ ¶ |
| | |
10 year | | 1,330 | | ¶ ¶ ¶ ¶ |
| Elfun Diversified (Moderate Allocation) |
| Overall | | 993 | | ¶ ¶ ¶ |
| | |
3 year | | 933 | | ¶ ¶ ¶ |
| | |
5 year | | 834 | | ¶ ¶ ¶ |
| | |
10 year | | 670 | | ¶ ¶ |
| Elfun Tax-Exempt Income (Muni National Long) |
| Overall | | 210 | | ¶ ¶ ¶ ¶ |
| | |
3 year | | 190 | | ¶ ¶ ¶ |
| | |
5 year | | 190 | | ¶ ¶ ¶ |
| | |
10 year | | 180 | | ¶ ¶ ¶ ¶ ¶ |
| Elfun Income (Intermediate-Term Bond) |
| Overall | | 1,107 | | ¶ ¶ ¶ ¶ |
| | |
3 year | | 1,040 | | ¶ ¶ ¶ ¶ |
| | |
5 year | | 990 | | ¶ ¶ ¶ ¶ |
| | |
10 year | | 860 | | ¶ ¶ ¶ |
Morningstar is an independent fund rating company that seeks to provide a non-biased rating system used in making investment decisions. A fund is rated in its broad asset class on a scale of one to five stars through the evaluation of the historical balance of risk and return after 3 years of performance.
Morningstar calculates a Morningstar Rating based on a Morningstar Risk-Adjusted Return measure that accounts for variation in a fund’s monthly performance (including the effects of sales charges, loads and redemption fees), placing more emphasis on downward variations and rewarding consistent performance. The top ten percent of the funds in each category receive five stars, the next 22.5% receive four stars, the next 35% receive three stars, the next 22.5% receive 2 stars and the bottom 10% receive 1 star. The ratings are subject to change every month. The overall Morningstar Rating for a fund is derived from a weighted average of the performance figures associated with its three-, five- and ten year (if applicable) Morningstar Rating metrics.
Investment return and principal value of an investment will fluctuate and you may have a gain or loss when you sell your shares. Returns assume changes in share price and reinvestment of dividends and capital gains.
Past performance is no guarantee of future results.
This does not constitute a part of the Funds’ Shareholder Report
Elfun Funds
c/o U.S. Bancorp Fund Services, Ltd.
PO Box 701
Milwaukee, WI 53201-0701
Distributor
GE Investment Distributors Inc.
Member FINRA and SIPC
1600 Summer Street
PO Box 7900
Stamford, CT 06904-7900
|
| PRSRT STD |
U.S. POSTAGE PAID |
| Permit No. 1793 |
| Lancaster, PA |
The Funds file their complete schedules of portfolio holdings with the Securities and Exchange Commission for the first, second and third quarters of each fiscal year on Form N-Q. The Funds’ Forms N-Q, as well as a description of the policies and procedures that the Funds use to determine how to vote proxies (if any) relating to portfolio securities is available without charge (i) upon request, by calling 1-800-242-0134; (ii) on the Funds’ website at http://www.geam.com; and (iii) on the Commission’s website at http://www.sec.gov. The Funds’ Forms N-Q may be reviewed and copied at the Commission’s Public Reference Room in Washington, DC — information on the operation of the Public Reference Room may be obtained by calling 1-800-SEC-0330.
Information (if any) regarding how the Funds voted proxies relating to portfolio securities during the most recently disclosed 12-months period ended June 30 is available without charge (i) through the Funds’ website at http://www.geam.com; and (ii) on the Commission’s website at http://www.sec.gov.

ELF 1 (2/16)
The Registrant has adopted a code of ethics, as defined in Item 2 of Form N-CSR, applicable to its principal executive officer, principal financial officer, principal accounting officer or controller, or persons performing similar functions. A copy of this code of ethics is filed as an exhibit to this Form N-CSR and is included in the following link:
https://www.geam.com/ExternalWar/common/docs/pdf/Spirit_Letter.pdf
There have been no amendments to, nor any waivers granted from, a provision that relates to any element of the code of ethics definition set forth in paragraph (b) of Item 2 of Form N-CSR during the period covered by this report.
| Item 3. | Audit Committee Financial Expert. |
The Board of Trustees of the Registrant has determined that Matthew Zakrzewski and Donald W. Torey are designated as the audit committee financial experts for the Registrant; and further that it is the finding of the Board of Trustees that Messrs. Zakrzewski and Torey qualify as audit committee financial experts and are deemed to be “interested persons” of the Registrant as defined in Section 2(a)(19) of the Act (15 U.S.C. 80a-2(a)(19)).
| Item 4. | Principal Accountant Fees and Services. |
(a) AUDIT FEES. The aggregate fees billed for each of the last two fiscal years (the “Reporting Periods”) for professional services rendered by the Registrant’s principal accountant (the “Auditor”) for the audit of the Registrant’s annual financial statements, or services that are normally provided by the Auditor in connection with the statutory and regulatory filings or engagements for the Reporting Periods were $17,100 in 2014 and $17,400 in 2015.
(b) AUDIT RELATED FEES. There were no fees billed by the Auditor for assurance and related services that were related to the performance of the audit of the Registrant during the Reporting Periods.
(c) TAX FEES. There were no fees billed for professional services rendered by the Auditor for tax compliance, tax advice or tax planning for the Registrant during the Reporting Periods.
(d) ALL OTHER FEES. There were no fees billed for products and services provided by the Auditor, other than the services reported in paragraphs (a) through (c) of this Item for the Registrant during the Reporting Periods.
(e)(1) AUDIT COMMITTEE PRE-APPROVAL POLICIES AND PROCEDURES.
The Audit Committee of the Elfun Funds (the “Funds”) Board of Trustees is responsible for, among other things, the appointment, compensation and oversight of the work of the Funds’ Auditor. As part of this responsibility and to ensure that the Auditor’s independence is not impaired, the Audit Committee (1) pre-approves the audit and non-audit services provided to the Funds by the Auditor, and (2) all non-audit services provided to the Funds’ investment adviser and Covered Affiliates (as defined in the Audit Committee Charter) that provide ongoing services to the Funds if the services directly impact the Funds’ operations or financial reporting, in accordance with the Audit Committee Charter. The following excerpt from the Audit Committee Charter sets forth the pre-approval policies and procedures:
Pre-Approval of Audit Related Services and Permissible Non-Audit Services. The Audit Committee shall pre-approve both audit (including audit, review, and attest) services and permissible non-audit services provided to the Fund and, if the nature of the engagement relates directly to the operations and financial reporting of the Fund, permissible non-audit services provided to any Covered Affiliate.
The Audit Committee may determine to delegate the authority to grant pre-approvals to one or more Audit Committee members, each acting on behalf of the Audit Committee. In this event, the member of the Audit Committee so delegated shall report each delegated pre-approval to the Audit Committee at its next regularly scheduled meeting. The Audit Committee may also adopt and follow, in lieu of explicit pre-approval described above, written policies and procedures detailed as to the particular service, designed to safeguard the continued independence of the Auditor, consistent with the requirements of the Investment Company Act of 1940, as amended (the “1940 Act”), and SEC regulations there under.
Notwithstanding the foregoing, the pre-approval requirement concerning permissible non-audit services provided to the Fund or any Covered Affiliate is waived if: (1) the aggregate amount of all such non-audit services provided constitutes no more than five percent (5%) of the total amount of revenues paid to the Auditor by the Fund and the Covered Affiliates during the fiscal year in which the services are provided that would have to be pre-approved by the Audit Committee, (2) the non-audit services were not recognized as non-audit services at the time of the engagement, and (3) such non-audit services are promptly brought to the attention of the Audit Committee and approved by the Audit Committee or one or more designated members of the Audit Committee prior to the completion of the audit.
(2) PERCENTAGE OF SERVICES DESCRIBED IN PARAGRAPHS (b) THROUGH (d) APPROVED BY AUDIT COMMITTEE. No fees were charged during the Reporting Periods for audit related, tax or other services as indicated in sections (b) through (d) of this Item.
(f) Not applicable.
(g) NON-AUDIT FEES. The aggregate non-audit fees billed by the Auditor for services rendered to the Registrant, and rendered to the Registrant’s investment adviser and any entity controlling, controlled by, or under common control with the Registrant’s adviser (“Service Affiliates”), for the Reporting Periods were $0 in 2014 and $0 in 2015.
(h) AUDITOR INDEPENDENCE. There were no non-audit services rendered to Service Affiliates during the Reporting Periods that were not pre-approved.
| Item 5. | Audit Committee of Listed Registrants. |
Applicable only to Closed-End Management Investment Companies.
| Item 6. | Schedule of Investments. |
(a) Schedule of Investments is included as part of the Report to Shareholders filed under Item 1 of this Form N-CSR.
(b) Not applicable.
| Item 7. | Disclosure of Proxy Voting Policies and Procedures for Closed-End Management Investment Companies. |
Applicable only to Closed-End Management Investment Companies.
| Item 8. | Portfolio Managers of Closed-End Management Investment Companies. |
Applicable only to Closed-End Management Investment Companies.
| Item 9. | Purchases of Equity Securities by Closed-End Management Investment Company and Affiliated Purchasers. |
Applicable only to Closed-End Management Investment Companies.
| Item 10. | Submission of Matters to a Vote of Security Holders. |
During the reporting period, there have been no material changes to the procedures by which the shareholders may recommend nominees to the Registrant’s Board of Trustees.
| Item 11. | Controls and Procedures. |
(a) The Registrant’s principal executive officer and principal financial officer have concluded that the Registrant’s disclosure controls and procedures (as defined in Rule 30a-3(c) under the 1940 Act) are effective as of a date within 90 days of the filing date of the report included in Item 1 of this Form N-CSR, based on the evaluation of these controls and procedures required by Rule 30a-3(b) under the 1940 Act and Rules 13a-15(b) or 15d-15(b) under the Securities Exchange Act of 1934, as amended.
(b) There were no changes in the Registrant’s internal control over financial reporting (as defined in Rule 30a-3(d) under the 1940 Act) that occurred during the Registrant’s second fiscal quarter of the period covered by this Form N-CSR that have materially affected, or are reasonably likely to materially affect, the Registrant’s internal control over financial reporting.
(a)(1) The Code of Ethics that applies to the Registrant’s principal executive officer and principal financial officer is attached hereto.
(a)(2) The certifications required by Rule 30a-2(a) under the 1940 Act and Section 302 of the Sarbanes-Oxley Act of 2002 are attached hereto.
(a)(3) Not applicable.
(b) The certifications by the Registrant’s principal executive officer and principal financial officer, as required by Rule 30a-2(b) under the 1940 Act and Section 906 of the Sarbanes-Oxley Act of 2002, are attached hereto.
SIGNATURES
Pursuant to the requirements of the Securities Exchange Act of 1934 and the Investment Company Act of 1940, the below Registrants have duly caused each report to be signed on their behalf by the undersigned, thereunto duly authorized.
Elfun International Equity Fund
Elfun Trusts
Elfun Diversified Fund
Elfun Tax-Exempt Income Fund
Elfun Income Fund
Elfun Government Money Market Fund
| | |
| By: | | /s/ Dmitri L. Stockton |
| | Dmitri L. Stockton |
| | Trustee, President and Chief Executive Officer |
| | GE Asset Management Incorporated |
|
| Date: February 18, 2016 |
Pursuant to the requirements of the Securities Exchange Act of 1934 and the Investment Company Act of 1940, each report has been signed below by the following persons on behalf of the Registrants and in the capacities and on the dates indicated.
| | |
| By: | | /s/ Dmitri L. Stockton |
| | Dmitri L. Stockton |
| | Trustee, President and Chief Executive Officer |
| | GE Asset Management Incorporated |
|
| Date: February 18, 2016 |
| |
| By: | | /s/ Arthur A. Jensen |
| | Arthur A. Jensen |
| | Treasurer, Elfun Funds |
|
| Date: February 18, 2016 |