UNITED STATES
SECURITIES AND EXCHANGE COMMISSION
Washington, D.C. 20549
FORMN-CSR
CERTIFIED SHAREHOLDER REPORT OF REGISTERED
MANAGEMENT INVESTMENT COMPANIES
Investment Company Act file number: 811-00483
ELFUN TRUSTS
(Exact name of registrant as specified in charter)
One Iron Street
Boston, Massachusetts 02210
(Address of principal executive offices) (Zip code)
Copy to:
| | |
Joshua A. Weinberg, Esq. Managing Director and Managing Counsel c/o SSGA Funds Management, Inc. One Iron Street Boston, Massachusetts 02210 | | Timothy W. Diggins, Esq. Ropes & Gray LLP 800 Boylston Street Boston, Massachusetts 02110-2624 |
| (Name and Address of Agent for Service) | | |
Registrant’s telephone number, including area code: (617) 664-7037
Date of fiscal year end: December 31
Date of reporting period: December 31, 2018
Item 1. Shareholder Report.
Annual Report
December 31, 2018
Elfun Funds
Elfun International Equity Fund
Elfun Trusts
Elfun Diversified Fund
ElfunTax-Exempt Income Fund
Elfun Income Fund
Elfun Government Money Market Fund
Beginning on January 1, 2021, as permitted by regulations adopted by the U.S. Securities and Exchange Commission, paper copies of a Fund’s annual and semi-annual shareholder reports will no longer be sent by mail, unless you specifically request paper copies of the reports from the Fund (or from your financial intermediary, such as a broker-dealer or bank). Instead, the reports will be made available on a Fund’s website (www.ssga.com/geam), and you will be notified by mail each time a report is posted, and provided with a website link to access the report.
Beginning on January 1, 2019, you may elect to receive all future reports in paper free of charge. If you invest through a financial intermediary, you can contact your financial intermediary to request that you continue to receive paper copies of your shareholder reports. Your election to receive reports in paper will apply to all funds held in your account, if you invest through your financial intermediary or all funds held with the fund complex if you invest directly with a Fund.

Elfun Funds
Annual Report
December 31, 2018
Table of Contents
This report has been prepared for shareholders and may be distributed to others only if accompanied with a current prospectus and/or summary prospectus.
Elfun Funds
Notes to Performance — December 31, 2018 (Unaudited)
Information on the following performance pages relates to the Elfun Funds.
Total returns take into account changes in share price and assume reinvestment of all dividends and capital gains distributions, if any. Total returns shown are net of Fund expenses.
The performance data quoted represents past performance; past performance does not guarantee future results. Investment return and principal value will fluctuate so your shares, when redeemed, may be worth more or less than their original cost. Current performance may be higher or lower than the performance data quoted. Periods less than one year are not annualized. Please call toll-free (800)242-0134 or visit the Funds’ website at http://www.ssga.com/geam for the most recentmonth-end performance data.
A portion of the ElfunTax-Exempt Income Fund’s income may be subject to state, federal and/or alternative minimum tax. Capital gains, if any, are subject to capital gains tax.
An investment in a Fund is not a deposit of any bank and is not insured or guaranteed by the Federal Deposit Insurance Corporation (“FDIC”) or any other government agency. An investment in a Fund is subject to risk, including possible loss of principal invested.
The S&P 500® Index, MSCI® Europe, Australasia, Far East Index (“MSCI® EAFE® Index”), MSCI® All-Country World ex-U.S. Index (“MSCI® ACWI ex-U.S. Index”), Bloomberg Barclays U.S. Aggregate Bond Index, Bloomberg Barclays U.S. Municipal Bond Index and 90 Day U.S. T-Bill are unmanaged indices and do not reflect the actual cost of investing in the instruments that comprise each index. The results shown for the foregoing indices assume the reinvestment of net dividends or interest and do not reflect the fees, expenses or taxes.
The S&P 500® Index is an unmanaged, market capitalization-weighted index of stocks of 500 large U.S. companies, which is widely used as a measure oflarge-cap U.S. stock market performance.
The MSCI® EAFE® Index is a market capitalization-weighted index of equity securities of companies domiciled in various countries. The index is designed to represent the performance of developed stock markets outside the U.S. and Canada and excludes certain market segments unavailable to U.S. based investors.
The MSCI® ACWI ex-U.S. Index is a market-capitalization weighted index designed to provide a broad measure of stock performance throughout the world, with the exception of U.S. based companies. The MSCI® ACWI ex-U.S. Index includes both developed and emerging markets.
The Bloomberg Barclays U.S. Aggregate Bond Index is a market value-weighted index of taxable investment-grade debt issues, including government, corporate, asset-backed and mortgage-backed securities, with maturities of one year or more. This index is designed to represent the performance of the U.S. investment-grade first-rate bond market.
The Bloomberg Barclays U.S. Municipal Bond Index is an unmanaged index comprised of investment-grade, fixed rate securities with maturities of at least eight years and less than twelve years.
The 90 Day U.S.T-Bill is an unmanaged measure/index of the performance of the most recently auctioned 90 Day U.S. Treasury bills (i.e. having a total maturity of 90 days) currently available in the marketplace.
The views, expressed in this document reflect our judgment as of the publication date and are subject to change at any time without notice.
State Street Global Advisors Funds Distributors, LLC, member of FINRA & SIPC is the principal underwriter and distributor of the Elfun Funds and an indirect wholly-owned subsidiary of State Street Corporation. References to State Street may include State Street Corporation and its affiliates. The Funds pay State Street Bank and Trust Company for its services as custodian and Fund Accounting agent, and pay SSGA Funds Management, Inc. for investment advisory and administrative services.
Elfun International Equity Fund
Management Discussion of Fund Performance — December 31, 2018 (Unaudited)
The Elfun International Equity Fund (the “Fund”) seeks to provide long-term growth of capital and future income by investing principally in foreign securities consistent with prudent investment management and the preservation of capital. The Fund’s benchmark is the MSCI® EAFE® Index (the “Index”).
For the12-month period ended December 31, 2018 (the “Reporting Period”), the total return for the Fund was-16.33% and the Index was-13.79%. The Fund and Index returns reflect the reinvestment of dividends and other income. The Fund’s performance reflects the expenses of managing the Fund, including brokerage and advisory expenses. The Index is unmanaged and Index returns do not reflect fees and expenses of any kind, which would have a negative impact on returns.
Underperformance in machinery companies, underperformance in consumer discretionary, and outperformance in information technology (“IT”) were primary drivers of Fund performance during the Reporting Period relative to the Index. Machinery companies were generally weak in 2018 as concerns around trade wars and a downturn in the semiconductor cycle took hold. The Fund’s holdings in this space were exposed in both of these areas. In consumer discretionary, the Fund was impacted by a combination of macro and company-specific issues. For example, French auto-supplier Valeo fell on concerns over a slowdown in China, the world’s largest auto market, as well as new emissions regulations in Europe which disrupted production for many auto producers. The Fund’s higher quality IT holdings outperformed in a challenging environment. For example, Japanese electronics manufacturer Murata, while exposed to some of the most challenged markets including China, auto, and smartphones, was able to outperform due to its very strong market position in some vital electronic components.
The Fund used equity futures in order to efficiently manage cash flows during the Reporting Period. The Fund’s use of futures had a negligible impact on Fund performance.
On an individual security level, the top positive contributors to the Fund’s performance on an absolute basis during the Reporting Period were Hoya Corp, Shire PLC and Kao Corp. The top negative contributors to the Fund’s performance on an absolute basis during the Reporting Period were Valeo SA, Bayer AG and Komatsu LTD.
The views expressed above reflect those of the Fund’s portfolio manager only through the Reporting Period, and do not necessarily represent the views of the Adviser as a whole. Any such views are subject to change at any time based upon market or other conditions and the Adviser disclaims any responsibility to update such views. These views may not be relied on as investment advice and, because investment decisions for a fund are based on numerous factors, may not be relied on as an indication of trading intent on behalf of any fund.
| | |
| 2 | | Elfun International Equity Fund |
Elfun International Equity Fund
Understanding Your Fund’s Expenses (Unaudited)
As a shareholder of the Fund you incur ongoing costs. Ongoing costs include portfolio management fees, professional fees, administrative fees and other Fund expenses. The following example is intended to help you understand your ongoing costs (in dollars) of investing in the Fund and to compare these costs with the ongoing costs of investing in other mutual funds.
To illustrate these ongoing costs, we have provided an example and calculated the expenses paid by investors in units of the Fund during the period. The information in the following table is based on an investment of $1,000, which is invested at the beginning of the period and held for the entiresix-month period ended December 31, 2018.
Actual Expenses
The first section of the table provides information about actual account values and actual expenses. You may use the information in this section, together with the amount you invested, to estimate the expenses that you paid over the period. To do so, simply divide your account value by $1,000 (for example, an $8,600 account value divided by $1,000 = 8.6), then multiply the result by the number given under the heading “Expenses paid during the period” to estimate the expenses you paid on your account during the period.
Hypothetical Example for Comparison Purposes
The second section of the table provides information about hypothetical account values and hypothetical expenses based on the Fund’s actual expense ratio and an assumed rate of return of 5% per year before expenses, which is not the Fund’s actual return. The hypothetical account values and expenses may not be used to estimate the actual ending account balance or expenses you paid for the period. You may use this information to compare the ongoing costs of investing in the Fund and other funds. To do so, compare this 5% hypothetical example with the 5% hypothetical examples that appear in the shareholders reports of other funds.
Please note that the expenses shown in the table are meant to highlight and help you compare ongoing costs only and do not reflect transaction costs, such as sales charges or redemption fees, if any. Therefore, the second section of the table is useful in comparing ongoing costs only, and will not help you determine the relative total costs of owning different funds.
| | | | | | | | |
| | | Actual
Fund Return | | | Hypothetical
5% Return
(2.5% for
the period) | |
Actual Fund Return | | | | | | | | |
Beginning Account Value July 1, 2018 | | $ | 1,000.00 | | | $ | 1,000.00 | |
Ending Account Value December 31, 2018 | | $ | 865.70 | | | $ | 1,023.34 | |
Expenses Paid During Period* | | $ | 1.74 | | | $ | 1.89 | |
| * | Expenses are equal to the Fund’s annualized expense ratio of 0.37%** (for the period July 1, 2018-December 31, 2018), multiplied by the average account value over the period, multiplied by 184/365 (to reflect theone-half year period). |
| ** | May differ from expense ratio disclosed in the financial highlights, which is calculated based on the entire fiscal year’s data. |
| | | | |
| Elfun International Equity Fund | | | 3 | |
Elfun International Equity Fund
Performance Summary — December 31, 2018 (Unaudited)
Top Ten Largest Holdings
as of December 31, 2018 (as a % of Fair Value)(a)(b)
| | | | |
Nestle S.A. | | | 4.43 | % |
| |
Novartis AG | | | 3.48 | % |
| |
Roche Holding AG | | | 2.86 | % |
| |
AIA Group Ltd. | | | 2.74 | % |
| |
AstraZeneca PLC | | | 2.65 | % |
| |
Air Liquide S.A. | | | 2.53 | % |
| |
SAP SE | | | 2.52 | % |
| |
Hoya Corp. | | | 2.50 | % |
| |
Mitsubishi UFJ Financial Group Inc. | | | 2.19 | % |
| |
Keyence Corp. | | | 2.15 | % |
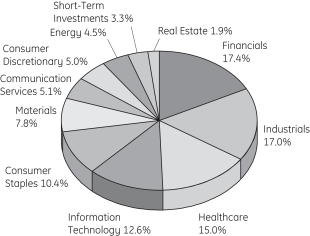
Sector Allocation as of December 31, 2018
Portfolio composition as a % of Fair Value of $184,239 (in thousands) as of December 31, 2018(a)(b)
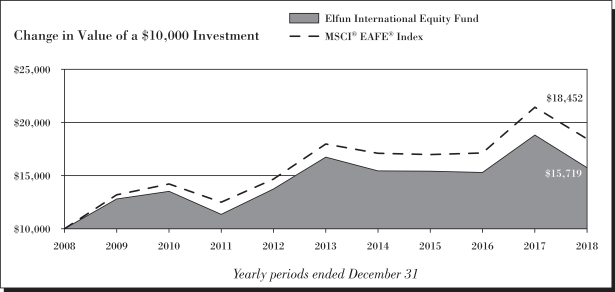
Average Annual Total Return for the periods ended December 31, 2018
(Inception date: 01/01/88)
| | | | | | | | | | | | | | | | |
| | | One Year | | | Five Year | | | Ten Year | | | Ending Value
of a $10,000
Investment | |
Elfun International Equity Fund | | | -16.33 | % | | | -1.22 | % | | | 4.63 | % | | $ | 15,719 | |
| | | | |
MSCI® EAFE® Index | | | -13.79 | % | | | 0.53 | % | | | 6.32 | % | | $ | 18,452 | |
| (a) | Fair Value basis is inclusive of short-term investment in money market funds. |
| (b) | The securities information regarding holdings, allocations and other characteristics is presented to illustrate examples of securities that the Fund has bought and the diversity of areas in which the Fund may invest as of a particular date. It may not be representative of the Fund’s current or future investments and should not be construed as a recommendation to purchase or sell a particular security. |
| | |
| 4 | | Elfun International Equity Fund |
Elfun International Equity Fund
Performance Summary, continued — December 31, 2018 (Unaudited)
See Notes to Performance beginning on page 1 for further information.
Past performance does not predict future performance. The performance shown in the graphs and tables does not reflect the deduction of taxes that a shareholder would pay on Fund distributions or the redemption of Fund shares.
| | | | |
| Elfun International Equity Fund | | | 5 | |
Elfun International Equity Fund
Schedule of Investments — December 31, 2018
| | | | | | | | |
| | | Number
of Shares | | | Fair
Value
$ | |
| | | | | | | | |
|
| Common Stock - 96.8%† | |
Australia - 2.7% | |
BHP Group PLC | | | 175,216 | | | | 3,685,629 | |
Suncorp Group Ltd. | | | 143,979 | | | | 1,280,192 | |
| | | | | | | | |
| | | | 4,965,821 | |
| | | | | | | | |
|
Belgium - 1.3% | |
Anheuser-Busch InBev S.A. | | | 35,225 | | | | 2,323,432 | |
| | | | | | | | |
|
Canada - 1.3% | |
Brookfield Asset Management Inc., Class A (h) | | | 26,732 | | | | 1,024,028 | |
Seven Generations Energy Ltd., Class A (a) | | | 172,571 | | | | 1,407,557 | |
| | | | | | | | |
| | | | 2,431,585 | |
| | | | | | | | |
|
China - 0.5% | |
New Oriental Education & Technology Group Inc. ADR (a) | | | 15,824 | | | | 867,313 | |
| | | | | | | | |
|
France - 13.0% | |
Air Liquide S.A. | | | 37,609 | | | | 4,662,561 | |
Airbus SE | | | 31,481 | | | | 3,021,510 | |
AXA S.A. | | | 156,990 | | | | 3,384,315 | |
BNP Paribas S.A. | | | 78,223 | | | | 3,529,878 | |
Schneider Electric SE | | | 55,192 | | | | 3,767,897 | |
Valeo S.A. | | | 65,668 | | | | 1,914,994 | |
Vivendi S.A. | | | 148,585 | | | | 3,614,513 | |
| | | | | | | | |
| | | | 23,895,668 | |
| | | | | | | | |
|
Germany - 8.1% | |
Bayer AG | | | 39,128 | | | | 2,708,798 | |
Fresenius SE & Company KGaA | | | 19,792 | | | | 958,857 | |
HeidelbergCement AG | | | 46,674 | | | | 2,848,110 | |
Infineon Technologies AG | | | 105,258 | | | | 2,089,455 | |
KION Group AG (h) | | | 34,048 | | | | 1,725,411 | |
SAP SE | | | 46,615 | | | | 4,632,319 | |
| | | | | | | | |
| | | | 14,962,950 | |
| | | | | | | | |
|
Hong Kong - 2.7% | |
AIA Group Ltd. | | | 608,167 | | | | 5,049,060 | |
| | | | | | | | |
|
India - 1.8% | |
ICICI Bank Ltd. | | | 657,170 | | | | 3,390,099 | |
| | | | | | | | |
|
Ireland - 2.0% | |
Kerry Group PLC, Class A | | | 37,493 | | | | 3,707,400 | |
| | | | | | | | |
|
Italy - 0.5% | |
Intesa Sanpaolo S.p.A. | | | 376,910 | | | | 835,791 | |
| | | | | | | | |
| | | | | | | | |
| | | Number
of Shares | | | Fair
Value
$ | |
Japan - 29.1% | |
Daikin Industries Ltd. | | | 36,900 | | | | 3,933,332 | |
Disco Corp. | | | 16,800 | | | | 1,967,643 | |
FANUC Corp. | | | 15,000 | | | | 2,279,087 | |
Hoya Corp. | | | 76,300 | | | | 4,600,324 | |
Kao Corp. | | | 50,500 | | | | 3,753,151 | |
Keyence Corp. | | | 7,800 | | | | 3,958,474 | |
Komatsu Ltd. | | | 135,300 | | | | 2,917,123 | |
Mitsubishi UFJ Financial Group Inc. | | | 823,600 | | | | 4,037,866 | |
Mitsui Fudosan Company Ltd. | | | 154,518 | | | | 3,443,435 | |
Murata Manufacturing Company Ltd. | | | 24,097 | | | | 3,284,607 | |
Nidec Corp. | | | 31,400 | | | | 3,570,296 | |
Secom Company Ltd. | | | 40,500 | | | | 3,364,326 | |
Sekisui House Ltd. | | | 194,100 | | | | 2,864,220 | |
Shiseido Company Ltd. | | | 20,600 | | | | 1,294,036 | |
SoftBank Group Corp. | | | 31,901 | | | | 2,124,019 | |
Subaru Corp. | | | 103,500 | | | | 2,226,314 | |
Suzuki Motor Corp. | | | 28,900 | | | | 1,466,402 | |
Tokio Marine Holdings Inc. | | | 51,898 | | | | 2,476,762 | |
| | | | | | | | |
| | | | 53,561,417 | |
| | | | | | | | |
|
Netherlands - 3.6% | |
ASML Holding N.V. | | | 20,817 | | | | 3,263,990 | |
ING Groep N.V. | | | 310,477 | | | | 3,339,813 | |
| | | | | | | | |
| | | | 6,603,803 | |
| | | | | | | | |
|
Norway - 2.1% | |
Equinor ASA | | | 180,122 | | | | 3,822,248 | |
| | | | | | | | |
|
Portugal - 1.7% | |
Galp Energia SGPS S.A. | | | 195,485 | | | | 3,082,750 | |
| | | | | | | | |
|
Sweden - 3.1% | |
Assa Abloy AB, Class B | | | 208,546 | | | | 3,720,067 | |
Hexagon AB, Class B | | | 43,169 | | | | 1,986,606 | |
| | | | | | | | |
| | | | 5,706,673 | |
| | | | | | | | |
|
Switzerland - 12.5% | |
Givaudan S.A. | | | 1,399 | | | | 3,229,990 | |
Nestle S.A. | | | 100,858 | | | | 8,164,403 | |
Novartis AG | | | 75,232 | | | | 6,413,570 | |
Roche Holding AG | | | 21,340 | | | | 5,268,975 | |
| | | | | | | | |
| | | | 23,076,938 | |
| | | | | | | | |
|
Taiwan - 1.1% | |
Taiwan Semiconductor Manufacturing Company Ltd. | | | 267,900 | | | | 1,965,431 | |
| | | | | | | | |
|
United Kingdom - 9.7% | |
AstraZeneca PLC | | | 65,323 | | | | 4,886,063 | |
See Notes to Schedules of Investments and Notes to Financial Statements.
| | |
| 6 | | Elfun International Equity Fund |
Elfun International Equity Fund
Schedule of Investments, continued — December 31, 2018
| | | | | | | | |
| | | Number
of Shares | | | Fair
Value
$ | |
| | | | | | | | |
Prudential PLC | | | 205,605 | | | | 3,671,256 | |
Smith & Nephew PLC | | | 144,896 | | | | 2,701,659 | |
Smiths Group PLC | | | 169,909 | | | | 2,951,642 | |
Vodafone Group PLC | | | 1,871,955 | | | | 3,645,322 | |
| | | | | | | | |
| | | | 17,855,942 | |
| | | | | | | | |
| |
Total Common Stock
(Cost $173,067,843) | | | | 178,104,321 | |
| | | | | | | | |
|
| Short-Term Investments - 3.3% | |
State Street Institutional Treasury Money Market Fund - Premier Class 2.24% (d)(n) | | | 3,394,148 | | | | 3,394,148 | |
State Street Institutional U.S. Government Money Market Fund - Class G Shares 2.31% (d)(n) | | | 2,740,984 | | | | 2,740,984 | |
| | | | | | | | |
| |
Total Short-Term Investments
(Cost $6,135,132) | | | | 6,135,132 | |
| | | | | | | | |
| | |
Total Investments
(Cost $179,202,975) | | | | | | | 184,239,453 | |
| |
| Liabilities in Excess of Other Assets, net - (0.1)% | | | | (257,484 | ) |
| | | | | | | | |
| |
| NET ASSETS - 100.0% | | | | 183,981,969 | |
| | | | | | | | |
During the period ended December 31, 2018, average notional value related to long futures contracts was $1,521,691 or 0.8% of net assets and short futures contracts was $584,740 or 0.3% of net assets.
The following table presents the Fund’s investments measured at fair value on a recurring basis at December 31, 2018:
| | | | | | | | | | | | | | | | | | |
| Fund | | Investments | | Level 1 | | | Level 2 | | | Level 3 | | | Total | |
| | | | | | | | | | | | | | | | | | |
| | | | | |
| Elfun International Equity Fund | | Investments in Securities | | | | | | | | | | | | | | | | |
| | | | | |
| | Common Stock | | $ | 178,104,321 | | | $ | — | | | $ | — | | | $ | 178,104,321 | |
| | | | | |
| | Short-Term Investments | | | 6,135,132 | | | | — | | | | — | | | | 6,135,132 | |
| | | | | | | | | | | | | | | | | | |
| | | | | |
| | Total Investments in Securities | | $ | 184,239,453 | | | $ | — | | | $ | — | | | $ | 184,239,453 | |
| | | | | | | | | | | | | | | | | | |
See Notes to Schedules of Investments and Notes to Financial Statements.
| | | | |
| Elfun International Equity Fund | | | 7 | |
Elfun International Equity Fund
Schedule of Investments, continued — December 31, 2018
The Fund was invested in the following sectors at December 31, 2018 (unaudited):
| | | | |
| Sector | | Percentage
(based on
Fair Value) | |
| | | | |
Pharmaceuticals | | | 10.46% | |
Diversified Banks | | | 8.21% | |
Packaged Foods & Meats | | | 6.44% | |
Life & Health Insurance | | | 4.73% | |
Building Products | | | 4.15% | |
Electrical Components & Equipment | | | 3.98% | |
Integrated Oil & Gas | | | 3.75% | |
Electronic Equipment & Instruments | | | 3.23% | |
Wireless Telecommunication Services | | | 3.13% | |
Semiconductor Equipment | | | 2.84% | |
Personal Products | | | 2.74% | |
Industrial Gases | | | 2.53% | |
Construction Machinery & Heavy Trucks | | | 2.52% | |
Application Software | | | 2.52% | |
Healthcare Supplies | | | 2.50% | |
Semiconductors | | | 2.20% | |
Property & Casualty Insurance | | | 2.04% | |
Automobile Manufacturers | | | 2.00% | |
Diversified Metals & Mining | | | 2.00% | |
Movies & Entertainment | | | 1.96% | |
Diversified Real Estate Activities | | | 1.87% | |
Multi-Line Insurance | | | 1.84% | |
| | | | |
| Sector | | Percentage
(based on
Fair Value) | |
| | | | |
Security & Alarm Services | | | 1.83% | |
Electronic Components | | | 1.78% | |
Specialty Chemicals | | | 1.75% | |
Aerospace & Defense | | | 1.64% | |
Industrial Conglomerates | | | 1.60% | |
Home Building | | | 1.56% | |
Construction Materials | | | 1.55% | |
Healthcare Equipment | | | 1.47% | |
Brewers | | | 1.26% | |
Industrial Machinery | | | 1.24% | |
Auto Parts & Equipment | | | 1.04% | |
Oil & Gas Exploration & Production | | | 0.76% | |
Asset Management & Custody Banks | | | 0.56% | |
Healthcare Services | | | 0.52% | |
Education Services | | | 0.47% | |
| | | | |
| | | 96.67% | |
| | | | |
| |
Short-Term Investments | | | | |
Short-Term Investments | | | 3.33% | |
| | | | |
| | | 3.33% | |
| | | | |
| |
| | | 100.00% | |
| | | | |
Affiliate Table
| | | | | | | | | | | | | | | | | | | | | | | | | | | | | | | | | | | | |
| | | Number
of Shares
Held at
12/31/17 | | | Value At
12/31/17 | | | Cost of
Purchases | | | Proceeds
from
Shares
Sold | | | Realized
Gain
(Loss) | | | Change in
Unrealized
Appreciation/
Depreciation | | | Number
of Shares
Held at
12/31/18 | | | Value at
12/31/18 | | | Dividend
Income | |
State Street Institutional Treasury Money Market Fund - Premier Class | | | — | | | $ | — | | | $ | 23,906,090 | | | $ | 20,511,942 | | | $ | — | | | $ | — | | | | 3,394,148 | | | $ | 3,394,148 | | | $ | 56,532 | |
State Street Institutional U.S. Government Money Market Fund - Class G Shares | | | 10,975,209 | | | | 10,975,209 | | | | 26,977,357 | | | | 35,211,582 | | | | — | | | | — | | | | 2,740,984 | | | | 2,740,984 | | | | 69,631 | |
| | | | | | | | | | | | | | | | | | | | | | | | | | | | | | | | | | | | |
| | | | | | | | | |
TOTAL | | | | | | $ | 10,975,209 | | | $ | 50,883,447 | | | $ | 55,723,524 | | | $ | — | | | $ | — | | | | | | | $ | 6,135,132 | | | $ | 126,163 | |
| | | | | | | | | | | | | | | | | | | | | | | | | | | | | | | | | | | | |
See Notes to Schedules of Investments and Notes to Financial Statements.
| | |
| 8 | | Elfun International Equity Fund |
Elfun Trusts
Management Discussion of Fund Performance — December 31, 2018 (Unaudited)
The Elfun Trusts (the “Fund”) seeks to provide long-term growth of capital and future income rather than current income. The Fund’s benchmark is the S&P® 500 Index (the “Index”).
For the12-month period ended December 31, 2018 (the “Reporting Period”), the total return for the Fund was-3.39% and the Index was-4.38%. The Fund and Index returns reflect the reinvestment of dividends and other income. The Fund’s performance reflects the expenses of managing the Fund, including brokerage and advisory expenses. The Index is unmanaged and Index returns do not reflect fees and expenses of any kind, which would have a negative impact on returns.
A style tilt toward growth and positive sector allocation were the primary drivers of Fund performance during the Reporting Period relative to the Index. The Fund has a style tilt toward growth versus value and this was beneficial last year. (The Russell 1000 Growth Index outperformed the Russell 1000 Value Index.) The Fund had an overweight in Healthcare and Technology and both sectors outperformed the Index. The Fund had an underweight in Energy, Materials, and Industrials and all three sectors underperformed the Index. The Financial sector underperformed the Index, but was a positive contributor to Fund performance. Bank stocks led the sector lower, but the Fund was underweighted in banks and overweighted in outperformingnon-bank financials such as CME Group and S&P Global.
On an individual security level, the top positive contributors to the Fund’s performance on an absolute basis during the Reporting Period were CME Group, Visa Inc. and Salesforce.com Inc. The top negative contributors to the Fund’s performance on an absolute basis during the Reporting Period were Schlumberger, United Rentals Inc. and Applied Materials Inc.
The Fund did not invest in derivatives during the Reporting Period.
The views expressed above reflect those of the Fund’s portfolio manager only through the Reporting Period, and do not necessarily represent the views of the Adviser as a whole. Any such views are subject to change at any time based upon market or other conditions and the Adviser disclaims any responsibility to update such views. These views may not be relied on as investment advice and, because investment decisions for a fund are based on numerous factors, may not be relied on as an indication of trading intent on behalf of any fund.
Elfun Trusts
Understanding Your Fund’s Expenses (Unaudited)
As a shareholder of the Fund you incur ongoing costs. Ongoing costs include portfolio management fees, professional fees, administrative fees and other Fund expenses. The following example is intended to help you understand your ongoing costs (in dollars) of investing in the Fund and to compare these costs with the ongoing costs of investing in other mutual funds.
To illustrate these ongoing costs, we have provided an example and calculated the expenses paid by investors in units of the Fund during the period. The information in the following table is based on an investment of $1,000, which is invested at the beginning of the period and held for the entiresix-month period ended December 31, 2018.
Actual Expenses
The first section of the table provides information about actual account values and actual expenses. You may use the information in this section, together with the amount you invested, to estimate the expenses that you paid over the period. To do so, simply divide your account value by $1,000 (for example, an $8,600 account value divided by $1,000 = 8.6), then multiply the result by the number given under the heading “Expenses paid during the period” to estimate the expenses you paid on your account during the period.
Hypothetical Example for Comparison Purposes
The second section of the table provides information about hypothetical account values and hypothetical expenses based on the Fund’s actual expense ratio and an assumed rate of return of 5% per year before expenses, which is not the Fund’s actual return. The hypothetical account values and expenses may not be used to estimate the actual ending account balance or expenses you paid for the period. You may use this information to compare the ongoing costs of investing in the Fund and other funds. To do so, compare this 5% hypothetical example with the 5% hypothetical examples that appear in the shareholders reports of other funds.
Please note that the expenses shown in the table are meant to highlight and help you compare ongoing costs only and do not reflect transaction costs, such as sales charges or redemption fees, if any. Therefore, the second section of the table is useful in comparing ongoing costs only, and will not help you determine the relative total costs of owning different funds.
| | | | | | | | |
| | | Actual
Fund Return | | | Hypothetical
5% Return
(2.5% for
the period) | |
| | |
Actual Fund Return | | | | | | | | |
| | |
Beginning Account Value July 1, 2018 | | $ | 1,000.00 | | | $ | 1,000.00 | |
| | |
Ending Account Value December 31, 2018 | | $ | 927.60 | | | $ | 1,024.25 | |
| | |
Expenses Paid During Period* | | $ | 0.92 | | | $ | 0.97 | |
| * | | Expenses are equal to the Fund’s annualized expense ratio of 0.19%** (for the period July 1, 2018-December 31, 2018), multiplied by the average account value over the period, multiplied by 184/365 (to reflect theone-half year period). |
| ** | | May differ from expense ratio disclosed in the financial highlights, which is calculated based on the entire fiscal year’s data. |
Elfun Trusts
Performance Summary — December 31, 2018 (Unaudited)
Top Ten Largest Holdings
as of December 31, 2018 (as a % of Fair Value)(a)(b)
| | | | |
Visa Inc., Class A | | | 5.22 | % |
| |
JPMorgan Chase & Co. | | | 4.83 | % |
| |
Mircosoft Corp. | | | 4.61 | % |
| |
PepsiCo Inc. | | | 4.37 | % |
| |
The Walt Disnet Co. | | | 4.21 | % |
| |
American Tower Corp. | | | 3.91 | % |
| |
CME Group Inc. | | | 3.88 | % |
| |
Alphabet Inc., Class C | | | 3.54 | % |
| |
Charter Communications Inc., Class A | | | 3.41 | % |
| |
Apple Inc. | | | 3.38 | % |
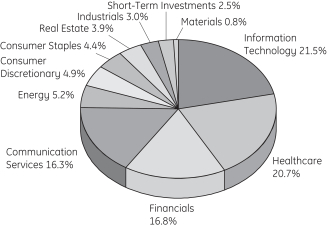
Sector Allocation as of December 31, 2018
Portfolio composition as a % of Fair Value of $2,425,342 (in thousands) as of December 31, 2018(a)(b)
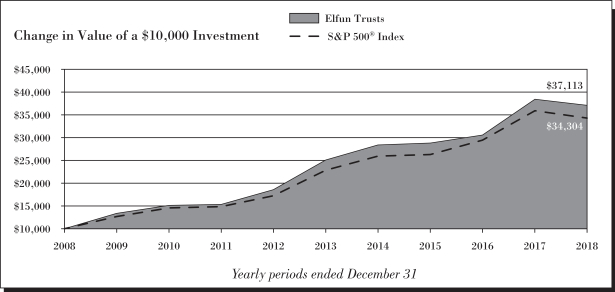
Average Annual Total Return for the periods ended December 31, 2018
(Inception date: 5/27/35)
| | | | | | | | | | | | | | | | |
| | | One Year | | | Five Year | | | Ten Year | | | Ending Value
of a $10,000
Investment | |
Elfun Trusts | | | -3.39 | % | | | 8.17 | % | | | 14.01 | % | | $ | 37,113 | |
| | | | |
S&P 500® Index | | | -4.38 | % | | | 8.50 | % | | | 13.12 | % | | $ | 34,304 | |
| (a) | Fair Value basis is inclusive of short-term investment in money market funds. |
| (b) | The securities information regarding holdings, allocations and other characteristics is presented to illustrate examples of securities that the Fund has bought and the diversity of areas in which the Fund may invest as of a particular date. It may not be representative of the Fund’s current or future investments and should not be construed as a recommendation to purchase or sell a particular security. |
Elfun Trusts
Performance Summary, continued — December 31, 2018 (Unaudited)
See Notes to Performance beginning on page 1 for further information.
Past performance does not predict future performance. The performance shown in the graphs and tables does not reflect the deduction of taxes that a shareholder would pay on Fund distributions or the redemption of Fund shares.
Elfun Trusts
Schedule of Investments — December 31, 2018
| | | | | | | | |
| | | Number
of Shares | | | Fair
Value
$ | |
| | | | | | | | |
|
| Common Stock - 97.4%† | |
Application Software - 2.7% | |
Intuit Inc. | | | 70,000 | | | | 13,779,500 | |
salesforce.com Inc. (a) | | | 380,000 | | | | 52,048,600 | |
| | | | | | | | |
| | | | 65,828,100 | |
| | | | | |
|
Biotechnology - 6.4% | |
Alexion Pharmaceuticals Inc. (a) | | | 640,000 | | | | 62,310,400 | |
Biogen Inc. (a) | | | 45,000 | | | | 13,541,400 | |
Gilead Sciences Inc. | | | 490,000 | | | | 30,649,500 | |
Vertex Pharmaceuticals Inc. (a) | | | 290,000 | | | | 48,055,900 | |
| | | | | | | | |
| | | | 154,557,200 | |
| | | | | |
|
Cable & Satellite - 5.7% | |
Charter Communications Inc., Class A (a) | | | 290,000 | | | | 82,641,300 | |
Liberty Global PLC, Class C (a) | | | 2,300,000 | | | | 47,472,000 | |
Sirius XM Holdings Inc. | | | 1,600,000 | | | | 9,136,000 | |
| | | | | | | | |
| | | | 139,249,300 | |
| | | | | |
|
Data Processing & Outsourced Services - 5.9% | |
Mastercard Inc., Class A | | | 90,000 | | | | 16,978,500 | |
Visa Inc., Class A | | | 960,000 | | | | 126,662,400 | |
| | | | | | | | |
| | | | 143,640,900 | |
| | | | | |
|
Diversified Banks - 4.8% | |
JPMorgan Chase & Co. | | | 1,200,000 | | | | 117,144,000 | |
| | | | | | | | |
|
Electronic Components - 1.1% | |
Corning Inc. | | | 875,000 | | | | 26,433,750 | |
| | | | | | | | |
|
Financial Exchanges & Data - 6.5% | |
CME Group Inc. | | | 500,000 | | | | 94,060,000 | |
S&P Global Inc. | | | 375,000 | | | | 63,727,500 | |
| | | | | | | | |
| | | | 157,787,500 | |
| | | | | |
|
Healthcare Equipment - 2.9% | |
Boston Scientific Corp. (a) | | | 870,000 | | | | 30,745,800 | |
Medtronic PLC | | | 445,000 | | | | 40,477,200 | |
| | | | | | | | |
| | | | 71,223,000 | |
| | | | | |
|
Healthcare Supplies - 2.8% | |
The Cooper Companies Inc. | | | 270,000 | | | | 68,715,000 | |
| | | | | | | | |
|
Integrated Oil & Gas - 2.2% | |
Chevron Corp. | | | 490,000 | | | | 53,307,100 | |
| | | | | | | | |
|
Interactive Media & Services - 6.3% | |
Alphabet Inc., Class A (a) | | | 38,000 | | | | 39,708,480 | |
Alphabet Inc., Class C (a) | | | 83,000 | | | | 85,955,630 | |
| | | | | | | | |
| | | Number
of Shares | | | Fair
Value
$ | |
Facebook Inc., Class A (a) | | | 210,000 | | | | 27,528,900 | |
| | | | | | | | |
| | | | 153,193,010 | |
| | | | | |
|
Internet & Direct Marketing Retail - 4.9% | |
Alibaba Group Holding Ltd. ADR (a) | | | 170,000 | | | | 23,301,900 | |
Amazon.com Inc. (a) | | | 54,000 | | | | 81,106,380 | |
Booking Holdings Inc. (a) | | | 8,000 | | | | 13,779,360 | |
| | | | | | | | |
| | | | 118,187,640 | |
| | | | | |
|
Investment Banking & Brokerage - 3.1% | |
The Charles Schwab Corp. | | | 1,800,000 | | | | 74,754,000 | |
| | | | | | | | |
|
Managed Healthcare - 1.0% | |
UnitedHealth Group Inc. | | | 100,000 | | | | 24,912,000 | |
| | | | | | | | |
|
Movies & Entertainment - 4.2% | |
The Walt Disney Co. | | | 930,000 | | | | 101,974,500 | |
| | | | | | | | |
|
Oil & Gas Equipment & Services - 2.5% | |
Schlumberger Ltd. | | | 1,670,000 | | | | 60,253,600 | |
| | | | | | | | |
|
Oil & Gas Exploration & Production - 0.6% | |
Diamondback Energy Inc. | | | 150,000 | | | | 13,905,000 | |
| | | | | | | | |
|
Pharmaceuticals - 7.5% | |
Allergan PLC | | | 480,000 | | | | 64,156,800 | |
Johnson & Johnson | | | 480,000 | | | | 61,944,000 | |
Merck & Company Inc. | | | 310,000 | | | | 23,687,100 | |
Pfizer Inc. | | | 750,000 | | | | 32,737,500 | |
| | | | | | | | |
| | | | 182,525,400 | |
| | | | | |
|
Regional Banks - 2.4% | |
First Republic Bank | | | 675,000 | | | | 58,657,500 | |
| | | | | | | | |
|
Semiconductor Equipment - 2.6% | |
Applied Materials Inc. | | | 1,900,000 | | | | 62,206,000 | |
| | | | | | | | |
|
Soft Drinks - 4.4% | |
PepsiCo Inc. | | | 960,000 | | | | 106,060,800 | |
| | | | | | | | |
|
Specialized REITs - 3.9% | |
American Tower Corp. | | | 600,000 | | | | 94,914,000 | |
| | | | | | | | |
|
Specialty Chemicals - 0.8% | |
Albemarle Corp. | | | 250,000 | | | | 19,267,500 | |
| | | | | | | | |
|
Systems Software - 5.8% | |
Microsoft Corp. | | | 1,100,000 | | | | 111,727,000 | |
ServiceNow Inc. (a) | | | 165,000 | | | | 29,378,250 | |
| | | | | | | | |
| | | | 141,105,250 | |
| | | | | |
See Notes to Schedules of Investments and Notes to Financial Statements.
Elfun Trusts
Schedule of Investments, continued — December 31, 2018
| | | | | | | | |
| | | Number
of Shares | | | Fair
Value
$ | |
| | | | | | | | |
Technology Hardware, Storage & Peripherals - 3.4% | |
Apple Inc. | | | 520,000 | | | | 82,024,800 | |
| | | | | | | | |
|
Trading Companies & Distributors - 3.0% | |
United Rentals Inc. (a) | | | 710,000 | | | | 72,796,300 | |
| | | | | | | | |
| |
Total Common Stock
(Cost $1,595,066,765) | | | | 2,364,623,150 | |
| | | | | | | | |
|
| Short-Term Investments - 2.5% | |
State Street Institutional Treasury Money Market Fund - Premier Class 2.24% (d)(n) | | | 30,743,339 | | | | 30,743,339 | |
| | | | | | | | |
| | | Number
of Shares | | | Fair
Value
$ | |
State Street Institutional U.S. Government Money Market Fund - Class G Shares 2.31% (n)(d) | | | 29,975,892 | | | | 29,975,892 | |
| | | | | | | | |
| |
Total Short-Term Investments
(Cost $60,719,231) | | | | 60,719,231 | |
| | | | | | | | |
| |
Total Investments
(Cost $1,655,785,996) | | | | 2,425,342,381 | |
| |
| Other Assets and Liabilities, net - 0.1% | | | | 2,325,102 | |
| | | | | | | | |
| |
| NET ASSETS - 100.0% | | | | 2,427,667,483 | |
| | | | | | | | |
The following table presents the Fund’s investments measured at fair value on a recurring basis at December 31, 2018:
| | | | | | | | | | | | | | | | | | |
| Fund | | Investments | | Level 1 | | | Level 2 | | | Level 3 | | | Total | |
| | | | | |
| Elfun Trusts | | Investments in Securities | | | | | | | | | | | | | | | | |
| | | | | |
| | Common Stock | | $ | 2,364,623,150 | | | $ | — | | | $ | — | | | $ | 2,364,623,150 | |
| | | | | |
| | Short-Term Investments | | | 60,719,231 | | | | — | | | | — | | | | 60,719,231 | |
| | | | | | | | | | | | | | | | | | |
| | | | | |
| | Total Investments in Securities | | $ | 2,425,342,381 | | | $ | — | | | $ | — | | | $ | 2,425,342,381 | |
| | | | | | | | | | | | | | | | | | |
Affiliate Table
| | | | | | | | | | | | | | | | | | | | | | | | | | | | | | | | | | | | |
| | | Number of
Shares Held
at 12/31/17 | | | Value At
12/31/17 | | | Cost of
Purchases | | | Proceeds
from
Shares
Sold | | | Realized
Gain
(Loss) | | | Change in
Unrealized
Appreciation/
Depreciation | | | Number
of Shares
Held at
12/31/18 | | | Value at
12/31/18 | | | Dividend
Income | |
State Street Institutional Treasury Money Market Fund - Premier Class | | | — | | | $ | — | | | $ | 143,137,490 | | | $ | 112,394,151 | | | $ | — | | | $ | — | | | | 30,743,339 | | | $ | 30,743,339 | | | $ | 878,205 | |
State Street Institutional U.S. Government Money Market Fund - Class G Shares | | | 78,219,855 | | | | 78,219,855 | | | | 182,320,451 | | | | 230,564,414 | | | | — | | | | — | | | | 29,975,892 | | | | 29,975,892 | | | | 1,009,878 | |
| | | | | | | | | | | | | | | | | | | | | | | | | | | | | | | | | | | | |
| | | | | | | | | |
TOTAL | | | | | | $ | 78,219,855 | | | $ | 325,457,941 | | | $ | 342,958,565 | | | $ | — | | | $ | — | | | | | | | $ | 60,719,231 | | | $ | 1,888,083 | |
| | | | | | | | | | | | | | | | | | | | | | | | | | | | | | | | | | | | |
See Notes to Schedules of Investments and Notes to Financial Statements.
Elfun Diversified Fund
Management Discussion of Fund Performance — December 31, 2018 (Unaudited)
The Elfun Diversified Fund (the “Fund”) seeks the highest total return consistent with prudent investment management and the preservation of capital (total return includes both income and capital appreciation). The Fund’s benchmarks are the S&P 500® Index, MSCI® All Country Worldex-U.S. Index and the Bloomberg Barclays U.S. Aggregate Bond Index (the “Indices”).
For the12-month period ended December 31, 2018 (the “Reporting Period”), the total return for the Fund was-5.51% and the returns for the S&P 500® Index, the MSCI® All Country Worldex-U.S. Index and the Bloomberg Barclays U.S. Aggregate Bond Index were-4.38%,-14.20% and 0.01%, respectively. The Fund and Indices’ returns reflect the reinvestment of dividends and other income. The Fund’s performance reflects the expenses of managing the Fund, including brokerage and advisory expenses. The Indices are unmanaged and index returns do not reflect fees and expenses of any kind, which would have a negative impact on returns.
The biggest drivers of the Fund’s performance were its positions in the MSCI® All Country Worldex-U.S. Index and the S&P 500® Index both of which posted negative returns for the year. Additionally, for a majority of the year, the Fund maintained a tactical position in high yield bonds that also produced negative absolute returns.
The Fund started the year with a modest overweight to equities, split roughly evenly between the U.S. and international, and a modest underweight to fixed income. As the year progressed, the Fund reduced exposure to both U.S. and international equities and subsequently purchased bonds. Allocation changes were made during the 2nd and 3rd calendar quarter, at times when the U.S.10-year yield was approximately 3.00%.
International equities struggled throughout the year as economic fundamentals diverged with the U.S. Slowing growth, rising trade tensions, increased political risk associated with Brexit and the Italian budget, along with, a stronger U.S. dollar created various headwinds for international equities.
In the U.S., dynamics began to shift during early October when Federal Reserve Chairman Jerome Powell indicated the central bank is “a long way” from getting rates to neutral. Concerns started to emerge about the prospect of future growth and the perceived risk of a policy mistake by the Federal Reserve. The S&P 500® Index declined and treasuries rallied which detracted from the Fund’s relative performance given the modest overweight to equities and underweight to bonds.
The Fund used equity and treasury futures, interest rate swaps and other derivatives in order to actively manage equity exposure and duration during the Reporting Period. The Fund’s use of these derivatives contributed to Fund liquidity and exposure management versus utilizing cash instruments only.
The views expressed above reflect those of the Fund’s portfolio manager only through the Reporting Period, and do not necessarily represent the views of the Adviser as a whole. Any such views are subject to change at any time based upon market or other conditions and the Adviser disclaims any responsibility to update such views. These views may not be relied on as investment advice and, because investment decisions for a fund are based on numerous factors, may not be relied on as an indication of trading intent on behalf of any fund.
| | | | |
| Elfun Diversified Fund | | | 15 | |
Elfun Diversified Fund
Understanding Your Fund’s Expenses — December 31, 2018 (Unaudited)
As a shareholder of the Fund you incur ongoing costs. Ongoing costs include portfolio management fees, professional fees, administrative fees and other Fund expenses. The following example is intended to help you understand your ongoing costs (in dollars) of investing in the Fund and to compare these costs with the ongoing costs of investing in other mutual funds.
To illustrate these ongoing costs, we have provided an example and calculated the expenses paid by investors in units of the Fund during the period. The information in the following table is based on an investment of $1,000, which is invested at the beginning of the period and held for the entiresix-month period ended December 31, 2018.
Actual Expenses
The first section of the table provides information about actual account values and actual expenses. You may use the information in this section, together with the amount you invested, to estimate the expenses that you paid over the period. To do so, simply divide your account value by $1,000 (for example, an $8,600 account value divided by $1,000 = 8.6), then multiply the result by the number given under the heading “Expenses paid during the period” to estimate the expenses you paid on your account during the period.
Hypothetical Example for Comparison Purposes
The second section of the table provides information about hypothetical account values and hypothetical expenses based on the Fund’s actual expense ratio and an assumed rate of return of 5% per year before expenses, which is not the Fund’s actual return. The hypothetical account values and expenses may not be used to estimate the actual ending account balance or expenses you paid for the period. You may use this information to compare the ongoing costs of investing in the Fund and other funds. To do so, compare this 5% hypothetical example with the 5% hypothetical examples that appear in the shareholders reports of other funds.
Please note that the expenses shown in the table are meant to highlight and help you compare ongoing costs only and do not reflect transaction costs, such as sales charges or redemption fees, if any. Therefore, the second section of the table is useful in comparing ongoing costs only, and will not help you determine the relative total costs of owning different funds.
| | | | | | | | |
| | | Actual
Fund Return | | | Hypothetical
5% Return
(2.5% for
the period) | |
Actual Fund Return | | | | | | | | |
Beginning Account Value July 1, 2018 | | $ | 1,000.00 | | | $ | 1,000.00 | |
Ending Account Value December 31, 2018 | | $ | 951.50 | | | $ | 1,023.84 | |
Expenses Paid During Period* | | $ | 1.33 | | | $ | 1.38 | |
| * | Expenses are equal to the Fund’s annualized expense ratio of 0.27%** (for the period July 1, 2018-December 31, 2018), multiplied by the average account value over the period, multiplied by 184/365 (to reflect theone-half year period). |
| ** | May differ from expense ratio disclosed in the financial highlights, which is calculated based on the entire fiscal year’s data. |
| | |
| 16 | | Elfun Diversified Fund |
Elfun Diversified Fund
Performance Summary — December 31, 2018 (Unaudited)
Top Ten Largest Equity Holdings
as of December 31, 2018 (as a % of Fair Value)(a)(b)
| | | | |
Dreyfus Treasury Cash Management - Institutional Shares | | | 1.37 | % |
| |
Microsoft Corp. | | | 1.23 | % |
| |
Apple Inc. | | | 1.14 | % |
| |
Amazon.com Inc. | | | 0.97 | % |
| |
Berkshire Hathaway Inc., Class B | | | 0.63 | % |
| |
Johnson & Johnson | | | 0.55 | % |
| |
JPMorgan Chase & Co. | | | 0.52 | % |
| |
Alphabet Inc., Class C | | | 0.50 | % |
| |
Facebook Inc., Class A | | | 0.50 | % |
| |
Alphabet Inc., Class A | | | 0.49 | % |
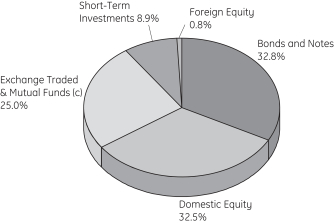
Sector Allocation
Portfolio composition as a % of Fair Value of $192,174 (in thousands) as of December 31, 2018(a)(b)
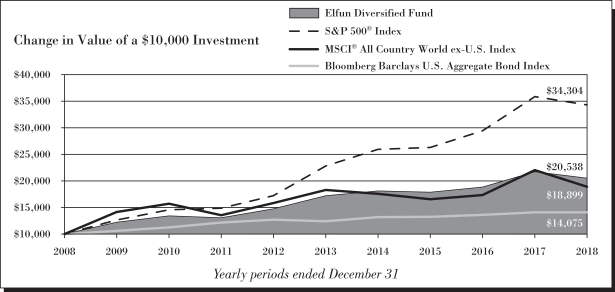
Average Annual Total Return for the Periods Ended December 31, 2018
(Inception date: 01/01/88)
| | | | | | | | | | | | | | | | |
| | | One Year | | | Five Year | | | Ten Year | | | Ending Value
of a $10,000
Investment | |
Elfun Diversified Fund | | | -5.51 | % | | | 3.58 | % | | | 7.46 | % | | $ | 20,538 | |
| | | | |
S&P 500® Index | | | -4.38 | % | | | 8.50 | % | | | 13.12 | % | | $ | 34,304 | |
| | | | |
MSCI® All Country World Indexex-U.S. | | | -14.20 | % | | | 0.68 | % | | | 6.57 | % | | $ | 18,899 | |
| | | | |
Bloomberg Barclays U.S. Aggregate Bond Index | | | 0.01 | % | | | 2.52 | % | | | 3.48 | % | | $ | 14,075 | |
| (a) | Fair Value basis is inclusive of short-term investment in money market funds. |
| (b) | The securities information regarding holdings, allocations and other characteristics is presented to illustrate examples of securities that the Fund has bought and the diversity of areas in which the Fund may invest as of a particular date. It may not be representative of the Fund’s current or future investments and should not be construed as a recommendation to purchase or sell a particular security. |
| (c) | Includes investment in State Street Global Equityex-U.S. Index Portfolio. |
| | | | |
| Elfun Diversified Fund | | | 17 | |
Elfun Diversified Fund
Performance Summary, continued — December 31, 2018 (Unaudited)
See Notes to Performance beginning on page 1 for further information.
Past performance does not predict future performance. The performance shown in the graphs and tables does not reflect the deduction of taxes that a shareholder would pay on Fund distributions or the redemption of Fund shares.
| | |
| 18 | | Elfun Diversified Fund |
Elfun Diversified Fund
Schedule of Investments — December 31, 2018
| | | | | | | | |
| | | Number
of Shares | | | Fair
Value
$ | |
| | | | | | | | |
| | |
| Domestic Equity - 34.3%† | | | | | | | | |
Common Stock - 34.3% | | | | | | | | |
Advertising - 0.0%* | | | | | | | | |
Omnicom Group Inc. (h) | | | 641 | | | | 46,947 | |
The Interpublic Group of Companies Inc. | | | 1,166 | | | | 24,054 | |
| | | | | | | | |
| | | | | | | 71,001 | |
| | | | | | | | |
|
Aerospace & Defense - 0.9% | |
Arconic Inc. | | | 1,319 | | | | 22,238 | |
General Dynamics Corp. (h) | | | 847 | | | | 133,157 | |
Harris Corp. (h) | | | 349 | | | | 46,993 | |
Huntington Ingalls Industries Inc. | | | 145 | | | | 27,595 | |
L3 Technologies Inc. (h) | | | 228 | | | | 39,594 | |
Lockheed Martin Corp. (h) | | | 758 | | | | 198,475 | |
Northrop Grumman Corp. (h) | | | 529 | | | | 129,552 | |
Raytheon Co. (h) | | | 868 | | | | 133,108 | |
Textron Inc. (h) | | | 798 | | | | 36,700 | |
The Boeing Co. (h) | | | 1,613 | | | | 520,192 | |
TransDigm Group Inc. (a)(h) | | | 145 | | | | 49,309 | |
United Technologies Corp. (h) | | | 2,433 | | | | 259,066 | |
| | | | | | | | |
| | | | | | | 1,595,979 | |
| | | | | | | | |
|
Agricultural & Farm Machinery - 0.1% | |
Deere & Co. (h) | | | 976 | | | | 145,590 | |
| | | | | | | | |
|
Agricultural Products - 0.0%* | |
Archer-Daniels-Midland Co. (h) | | | 1,775 | | | | 72,722 | |
| | | | | | | | |
|
Air Freight & Logistics - 0.2% | |
CH Robinson Worldwide Inc. | | | 443 | | | | 37,252 | |
Expeditors International of Washington Inc. | | | 494 | | | | 33,636 | |
FedEx Corp. (h) | | | 743 | | | | 119,868 | |
United Parcel Service Inc., Class B (h) | | | 2,122 | | | | 206,959 | |
| | | | | | | | |
| | | | | | | 397,715 | |
| | | | | | | | |
| | |
Airlines - 0.2% | | | | | | | | |
Alaska Air Group Inc. | | | 415 | | | | 25,253 | |
American Airlines Group Inc. (h) | | | 1,194 | | | | 38,339 | |
Delta Air Lines Inc. (h) | | | 1,900 | | | | 94,810 | |
Southwest Airlines Co. (h) | | | 1,548 | | | | 71,951 | |
United Continental Holdings Inc. (a)(h) | | | 736 | | | | 61,625 | |
| | | | | | | | |
| | | | | | | 291,978 | |
| | | | | | | | |
|
Alternative Carriers - 0.0%* | |
CenturyLink Inc. (h) | | | 3,074 | | | | 46,571 | |
| | | | | | | | |
| | | | | | | | |
| | | Number
of Shares | | | Fair
Value
$ | |
Apparel Retail - 0.2% | | | | | | | | |
Foot Locker Inc. | | | 400 | | | | 21,280 | |
L Brands Inc. | | | 787 | | | | 20,202 | |
Ross Stores Inc. (h) | | | 1,135 | | | | 94,432 | |
The Gap Inc. | | | 530 | | | | 13,653 | |
The TJX Companies Inc. (h) | | | 3,836 | | | | 171,623 | |
| | | | | | | | |
| | | | | | | 321,190 | |
| | | | | | | | |
|
Apparel, Accessories & Luxury Goods - 0.1% | |
Hanesbrands Inc. | | | 1,196 | | | | 14,986 | |
Michael Kors Holdings Ltd. (a) | | | 477 | | | | 18,088 | |
PVH Corp. | | | 256 | | | | 23,795 | |
Ralph Lauren Corp. | | | 158 | | | | 16,347 | |
Tapestry Inc. | | | 936 | | | | 31,590 | |
Under Armour Inc., Class A (a) | | | 679 | | | | 11,998 | |
Under Armour Inc., Class C (a) | | | 682 | | | | 11,028 | |
VF Corp. (h) | | | 972 | | | | 69,342 | |
| | | | | | | | |
| | | | | | | 197,174 | |
| | | | | | | | |
|
Application Software - 0.6% | |
Adobe Inc. (a)(h) | | | 1,473 | | | | 333,252 | |
ANSYS Inc. (a) | | | 260 | | | | 37,164 | |
Autodesk Inc. (a)(h) | | | 650 | | | | 83,596 | |
Cadence Design Systems Inc. (a) | | | 900 | | | | 39,132 | |
Citrix Systems Inc. | | | 406 | | | | 41,599 | |
Intuit Inc. (h) | | | 769 | | | | 151,378 | |
salesforce.com Inc. (a)(h) | | | 2,308 | | | | 316,127 | |
Synopsys Inc. (a) | | | 410 | | | | 34,538 | |
| | | | | | | | |
| | | | | | | 1,036,786 | |
| | | | | | | | |
|
Asset Management & Custody Banks - 0.3% | |
Affiliated Managers Group Inc. | | | 162 | | | | 15,785 | |
Ameriprise Financial Inc. (h) | | | 459 | | | | 47,906 | |
BlackRock Inc. (h) | | | 374 | | | | 146,915 | |
Franklin Resources Inc. | | | 992 | | | | 29,423 | |
Invesco Ltd. | | | 1,409 | | | | 23,587 | |
Northern Trust Corp. (h) | | | 671 | | | | 56,089 | |
State Street Corp. (h)(e) | | | 1,195 | | | | 75,369 | |
T Rowe Price Group Inc. (h) | | | 719 | | | | 66,378 | |
The Bank of New York Mellon Corp. (h) | | | 2,795 | | | | 131,560 | |
| | | | | | | | |
| | | | | | | 593,012 | |
| | | | | | | | |
|
Auto Parts & Equipment - 0.0%* | |
BorgWarner Inc. | | | 639 | | | | 22,199 | |
| | | | | | | | |
|
Automobile Manufacturers - 0.1% | |
Ford Motor Co. (h) | | | 11,815 | | | | 90,385 | |
General Motors Co. (h) | | | 3,933 | | | | 131,559 | |
| | | | | | | | |
| | | | | | | 221,944 | |
| | | | | | | | |
See Notes to Schedules of Investments and Notes to Financial Statements.
| | | | |
| Elfun Diversified Fund | | | 19 | |
Elfun Diversified Fund
Schedule of Investments, continued — December 31, 2018
| | | | | | | | |
| | | Number
of Shares | | | Fair
Value
$ | |
| | | | | | | | |
Automotive Retail - 0.1% | | | | | | | | |
Advance Auto Parts Inc. | | | 222 | | | | 34,956 | |
AutoZone Inc. (a)(h) | | | 77 | | | | 64,552 | |
CarMax Inc. (a) | | | 503 | | | | 31,553 | |
O’Reilly Automotive Inc. (a)(h) | | | 239 | | | | 82,295 | |
| | | | | | | | |
| | | | | | | 213,356 | |
| | | | | | | | |
| | |
Biotechnology - 0.9% | | | | | | | | |
AbbVie Inc. (h) | | | 4,561 | | | | 420,479 | |
Alexion Pharmaceuticals Inc. (a)(h) | | | 668 | | | | 65,036 | |
Amgen Inc. (h) | | | 1,949 | | | | 379,412 | |
Biogen Inc. (a)(h) | | | 615 | | | | 185,066 | |
Celgene Corp. (a)(h) | | | 2,144 | | | | 137,409 | |
Gilead Sciences Inc. (h) | | | 3,976 | | | | 248,699 | |
Incyte Corp. (a) | | | 580 | | | | 36,882 | |
Regeneron Pharmaceuticals Inc. (a)(h) | | | 229 | | | | 85,531 | |
Vertex Pharmaceuticals Inc. (a)(h) | | | 776 | | | | 128,591 | |
| | | | | | | | |
| | | | | | | 1,687,105 | |
| | | | | | | | |
| | |
Brewers - 0.0%* | | | | | | | | |
Molson Coors Brewing Co., Class B | | | 581 | | | | 32,629 | |
| | | | | | | | |
| | |
Broadcasting - 0.1% | | | | | | | | |
CBS Corp., Class B (h) | | | 993 | | | | 43,414 | |
Discovery Inc., Class A (a) | | | 561 | | | | 13,879 | |
Discovery Inc., Class C (a) | | | 1,197 | | | | 27,627 | |
| | | | | | | | |
| | | | | | | 84,920 | |
| | | | | | | | |
| | |
Building Products - 0.1% | | | | | | | | |
AO Smith Corp. (h) | | | 500 | | | | 21,350 | |
Fortune Brands Home & Security Inc. | | | 463 | | | | 17,589 | |
Johnson Controls International PLC (h) | | | 2,780 | | | | 82,427 | |
Masco Corp. | | | 873 | | | | 25,527 | |
| | | | | | | | |
| | | | | | | 146,893 | |
| | | | | | | | |
| | |
Cable & Satellite - 0.4% | | | | | | | | |
Charter Communications Inc., Class A (a)(h) | | | 544 | | | | 155,024 | |
Comcast Corp., Class A (h) | | | 13,796 | | | | 469,754 | |
DISH Network Corp., Class A (a) | | | 800 | | | | 19,976 | |
| | | | | | | | |
| | | | | | | 644,754 | |
| | | | | | | | |
|
Casinos & Gaming - 0.0%* | |
MGM Resorts International (h) | | | 1,420 | | | | 34,449 | |
| | | | | | | | |
| | | Number
of Shares | | | Fair
Value
$ | |
Wynn Resorts Ltd. | | | 324 | | | | 32,047 | |
| | | | | | | | |
| | | | | | | 66,496 | |
| | | | | | | | |
|
Commodity Chemicals - 0.0%* | |
LyondellBasell Industries N.V., Class A (h) | | | 964 | | | | 80,166 | |
| | | | | | | | |
|
Communications Equipment - 0.4% | |
Arista Networks Inc. (a) | | | 160 | | | | 33,712 | |
Cisco Systems Inc. (h) | | | 13,930 | | | | 603,587 | |
F5 Networks Inc. (a)(h) | | | 168 | | | | 27,221 | |
Juniper Networks Inc. | | | 1,045 | | | | 28,121 | |
Motorola Solutions Inc. (h) | | | 513 | | | | 59,015 | |
| | | | | | | | |
| | | | | | | 751,656 | |
| | | | | | | | |
|
Computer & Electronics Retail - 0.0%* | |
Best Buy Company Inc. (h) | | | 718 | | | | 38,025 | |
| | | | | | | | |
|
Construction & Engineering - 0.0%* | |
Fluor Corp. | | | 514 | | | | 16,551 | |
Jacobs Engineering Group Inc. | | | 356 | | | | 20,811 | |
Quanta Services Inc. | | | 558 | | | | 16,796 | |
| | | | | | | | |
| | | | | | | 54,158 | |
| | | | | | | | |
|
Construction Machinery & Heavy Trucks - 0.2% | |
Caterpillar Inc. (h) | | | 1,821 | | | | 231,394 | |
Cummins Inc. (h) | | | 439 | | | | 58,668 | |
PACCAR Inc. (h) | | | 1,125 | | | | 64,283 | |
| | | | | | | | |
| | | | | | | 354,345 | |
| | | | | | | | |
|
Construction Materials - 0.0%* | |
Martin Marietta Materials Inc. | | | 211 | | | | 36,265 | |
Vulcan Materials Co. (h) | | | 378 | | | | 37,346 | |
| | | | | | | | |
| | | | | | | 73,611 | |
| | | | | | | | |
| | |
Consumer Finance - 0.2% | | | | | | | | |
American Express Co. (h) | | | 2,160 | | | | 205,891 | |
Capital One Financial Corp. (h) | | | 1,451 | | | | 109,681 | |
Discover Financial Services (h) | | | 1,027 | | | | 60,573 | |
Synchrony Financial (h) | | | 2,016 | | | | 47,295 | |
| | | | | | | | |
| | | | | | | 423,440 | |
| | | | | | | | |
| | |
Copper - 0.0%* | | | | | | | | |
Freeport-McMoRan Inc. (h) | | | 4,627 | | | | 47,704 | |
| | | | | | | | |
|
Data Processing & Outsourced Services - 1.2% | |
Alliance Data Systems Corp. | | | 158 | | | | 23,713 | |
Automatic Data Processing Inc. (h) | | | 1,336 | | | | 175,176 | |
Broadridge Financial Solutions Inc. | | | 390 | | | | 37,538 | |
See Notes to Schedules of Investments and Notes to Financial Statements.
| | |
| 20 | | Elfun Diversified Fund |
Elfun Diversified Fund
Schedule of Investments, continued — December 31, 2018
| | | | | | | | |
| | | Number
of Shares | | | Fair
Value
$ | |
| | | | | | | | |
Fidelity National Information Services Inc. (h) | | | 992 | | | | 101,730 | |
Fiserv Inc. (a)(h) | | | 1,214 | | | | 89,217 | |
FleetCor Technologies Inc. (a) | | | 260 | | | | 48,287 | |
Global Payments Inc. (h) | | | 508 | | | | 52,390 | |
Jack Henry & Associates Inc. | | | 260 | | | | 32,895 | |
Mastercard Inc., Class A (h) | | | 2,776 | | | | 523,692 | |
Paychex Inc. (h) | | | 1,009 | | | | 65,736 | |
PayPal Holdings Inc. (a)(h) | | | 3,557 | | | | 299,108 | |
The Western Union Co. | | | 1,491 | | | | 25,437 | |
Total System Services Inc. | | | 531 | | | | 43,165 | |
Visa Inc., Class A (h) | | | 5,368 | | | | 708,254 | |
| | | | | | | | |
| | | | | | | 2,226,338 | |
| | | | | | | | |
| | |
Department Stores - 0.0%* | | | | | | | | |
Kohl’s Corp. | | | 552 | | | | 36,620 | |
Macy’s Inc. | | | 919 | | | | 27,368 | |
Nordstrom Inc. | | | 309 | | | | 14,402 | |
| | | | | | | | |
| | | | | | | 78,390 | |
| | | | | | | | |
| | |
Distillers & Vintners - 0.1% | | | | | | | | |
Brown-Forman Corp., Class B (h) | | | 462 | | | | 21,982 | |
Constellation Brands Inc., Class A (h) | | | 504 | | | | 81,053 | |
| | | | | | | | |
| | | | | | | 103,035 | |
| | | | | | | | |
| | |
Distributors - 0.0%* | | | | | | | | |
Genuine Parts Co. | | | 412 | | | | 39,560 | |
LKQ Corp. (a) | | | 1,036 | | | | 24,585 | |
| | | | | | | | |
| | | | | | | 64,145 | |
| | | | | | | | |
| | |
Diversified Banks - 1.6% | | | | | | | | |
Bank of America Corp. (h) | | | 28,052 | | | | 691,201 | |
Citigroup Inc. (h) | | | 7,585 | | | | 394,875 | |
JPMorgan Chase & Co. (h) | | | 10,178 | | | | 993,577 | |
U.S. Bancorp (h) | | | 4,691 | | | | 214,379 | |
Wells Fargo & Co. (h) | | | 13,215 | | | | 608,947 | |
| | | | | | | | |
| | | | | | | 2,902,979 | |
| | | | | | | | |
|
Diversified Chemicals - 0.2% | |
DowDuPont Inc. (h) | | | 6,946 | | | | 371,472 | |
Eastman Chemical Co. (h) | | | 405 | | | | 29,610 | |
| | | | | | | | |
| | | | | | | 401,082 | |
| | | | | | | | |
|
Diversified Support Services - 0.0%* | |
Cintas Corp. (h) | | | 252 | | | | 42,333 | |
Copart Inc. (a) | | | 560 | | | | 26,757 | |
| | | | | | | | |
| | | | | | | 69,090 | |
| | | | | | | | |
| | |
Drug Retail - 0.1% | | | | | | | | |
Walgreens Boots Alliance Inc. (h) | | | 2,571 | | | | 175,676 | |
| | | | | | | | |
| | | | | | | | |
| | | Number
of Shares | | | Fair
Value
$ | |
Electric Utilities - 0.7% | | | | | | | | |
Alliant Energy Corp. | | | 690 | | | | 29,153 | |
American Electric Power Company Inc. (h) | | | 1,486 | | | | 111,064 | |
Duke Energy Corp. (h) | | | 2,168 | | | | 187,098 | |
Edison International (h) | | | 1,043 | | | | 59,211 | |
Entergy Corp. | | | 511 | | | | 43,982 | |
Evergy Inc. | | | 769 | | | | 43,656 | |
Eversource Energy (h) | | | 992 | | | | 64,520 | |
Exelon Corp. (h) | | | 2,910 | | | | 131,241 | |
FirstEnergy Corp. (h) | | | 1,562 | | | | 58,653 | |
NextEra Energy Inc. (h) | | | 1,443 | | | | 250,822 | |
PG&E Corp. (a)(h) | | | 1,638 | | | | 38,903 | |
Pinnacle West Capital Corp. | | | 331 | | | | 28,201 | |
PPL Corp. (h) | | | 2,060 | | | | 58,360 | |
The Southern Co. (h) | | | 3,060 | | | | 134,395 | |
Xcel Energy Inc. (h) | | | 1,486 | | | | 73,215 | |
| | | | | | | | |
| | | | | | | 1,312,474 | |
| | | | | | | | |
|
Electrical Components & Equipment - 0.2% | |
AMETEK Inc. (h) | | | 755 | | | | 51,114 | |
Eaton Corporation PLC (h) | | | 1,308 | | | | 89,807 | |
Emerson Electric Co. (h) | | | 1,904 | | | | 113,764 | |
Rockwell Automation Inc. (h) | | | 364 | | | | 54,775 | |
| | | | | | | | |
| | | | | | | 309,460 | |
| | | | | | | | |
|
Electronic Components - 0.1% | |
Amphenol Corp., Class A (h) | | | 899 | | | | 72,837 | |
Corning Inc. (h) | | | 2,423 | | | | 73,199 | |
| | | | | | | | |
| | | | | | | 146,036 | |
| | | | | | | | |
|
Electronic Equipment & Instruments - 0.0%* | |
FLIR Systems Inc. | | | 373 | | | | 16,240 | |
Keysight Technologies Inc. (a) | | | 600 | | | | 37,248 | |
| | | | | | | | |
| | | | | | | 53,488 | |
| | | | | | | | |
|
Electronic Manufacturing Services - 0.0%* | |
IPG Photonics Corp. (a) | | | 100 | | | | 11,329 | |
| | | | | | | | |
|
Environmental & Facilities Services - 0.1% | |
Republic Services Inc. | | | 634 | | | | 45,705 | |
Rollins Inc. | | | 450 | | | | 16,245 | |
Waste Management Inc. (h) | | | 1,192 | | | | 106,076 | |
| | | | | | | | |
| | | | | | | 168,026 | |
| | | | | | | | |
|
Fertilizers & Agricultural Chemicals - 0.1% | |
CF Industries Holdings Inc. | | | 701 | | | | 30,501 | |
FMC Corp. | | | 424 | | | | 31,359 | |
The Mosaic Co. | | | 1,064 | | | | 31,079 | |
| | | | | | | | |
| | | | | | | 92,939 | |
| | | | | | | | |
See Notes to Schedules of Investments and Notes to Financial Statements.
| | | | |
| Elfun Diversified Fund | | | 21 | |
Elfun Diversified Fund
Schedule of Investments, continued — December 31, 2018
| | | | | | | | |
| | | Number
of Shares | | | Fair
Value
$ | |
| | | | | | | | |
Financial Exchanges & Data - 0.3% | |
Cboe Global Markets Inc. | | | 320 | | | | 31,306 | |
CME Group Inc. (h) | | | 1,063 | | | | 199,972 | |
Intercontinental Exchange Inc. (h) | | | 1,740 | | | | 131,074 | |
Moody’s Corp. (h) | | | 484 | | | | 67,779 | |
MSCI Inc. | | | 250 | | | | 36,857 | |
Nasdaq Inc. | | | 351 | | | | 28,631 | |
S&P Global Inc. (h) | | | 765 | | | | 130,004 | |
| | | | | | | | |
| | | | | | | 625,623 | |
| | | | | | | | |
|
Food Distributors - 0.1% | |
Sysco Corp. (h) | | | 1,428 | | | | 89,479 | |
| | | | | | | | |
| | |
Food Retail - 0.0%* | | | | | | | | |
The Kroger Co. (h) | | | 2,367 | | | | 65,093 | |
| | | | | | | | |
| | |
Footwear - 0.2% | | | | | | | | |
NIKE Inc., Class B (h) | | | 3,925 | | | | 291,000 | |
| | | | | | | | |
|
General Merchandise Stores - 0.1% | |
Dollar General Corp. (h) | | | 839 | | | | 90,679 | |
Dollar Tree Inc. (a)(h) | | | 702 | | | | 63,405 | |
Target Corp. (h) | | | 1,595 | | | | 105,413 | |
| | | | | | | | |
| | | | | | | 259,497 | |
| | | | | | | | |
| | |
Gold - 0.0%* | | | | | | | | |
Newmont Mining Corp. (h) | | | 1,700 | | | | 58,905 | |
| | | | | | | | |
|
Health Care REITs - 0.1% | |
HCP Inc. | | | 1,527 | | | | 42,649 | |
Ventas Inc. (h) | | | 1,118 | | | | 65,503 | |
Welltower Inc. (h) | | | 1,109 | | | | 76,976 | |
| | | | | | | | |
| | | | | | | 185,128 | |
| | | | | | | | |
|
Healthcare Distributors - 0.1% | |
AmerisourceBergen Corp. | | | 458 | | | | 34,075 | |
Cardinal Health Inc. (h) | | | 962 | | | | 42,905 | |
Henry Schein Inc. (a) | | | 464 | | | | 36,434 | |
McKesson Corp. (h) | | | 575 | | | | 63,520 | |
| | | | | | | | |
| | | | | | | 176,934 | |
| | | | | | | | |
|
Healthcare Equipment - 0.9% | |
Abbott Laboratories (h) | | | 5,277 | | | | 381,685 | |
ABIOMED Inc. (a) | | | 140 | | | | 45,506 | |
Baxter International Inc. (h) | | | 1,488 | | | | 97,940 | |
Becton Dickinson and Co. (h) | | | 817 | | | | 184,086 | |
Boston Scientific Corp. (a)(h) | | | 4,199 | | | | 148,393 | |
Danaher Corp. (h) | | | 1,879 | | | | 193,763 | |
Edwards Lifesciences Corp. (a)(h) | | | 630 | | | | 96,497 | |
Hologic Inc. (a) | | | 765 | | | | 31,442 | |
| | | | | | | | |
| | | Number
of Shares | | | Fair
Value
$ | |
IDEXX Laboratories Inc. (a)(h) | | | 271 | | | | 50,411 | |
Intuitive Surgical Inc. (a)(h) | | | 347 | | | | 166,185 | |
ResMed Inc. | | | 440 | | | | 50,103 | |
Stryker Corp. (h) | | | 944 | | | | 147,972 | |
Varian Medical Systems Inc. (a) | | | 257 | | | | 29,121 | |
Zimmer Biomet Holdings Inc. (h) | | | 650 | | | | 67,418 | |
| | | | | | | | |
| | | | | | | 1,690,522 | |
| | | | | | | | |
|
Healthcare Facilities - 0.1% | |
HCA Healthcare Inc. (h) | | | 813 | | | | 101,178 | |
Universal Health Services Inc., Class B | | | 242 | | | | 28,207 | |
| | | | | | | | |
| | | | | | | 129,385 | |
| | | | | | | | |
|
Healthcare Services - 0.3% | |
Cigna Corp. | | | 1,154 | | | | 219,260 | |
CVS Health Corp. (h) | | | 3,948 | | | | 258,673 | |
DaVita Inc. (a) | | | 419 | | | | 21,562 | |
Laboratory Corporation of America Holdings (a)(h) | | | 297 | | | | 37,529 | |
Quest Diagnostics Inc. | | | 390 | | | | 32,475 | |
| | | | | | | | |
| | | | | | | 569,499 | |
| | | | | | | | |
|
Healthcare Supplies - 0.1% | |
Align Technology Inc. (a)(h) | | | 230 | | | | 48,169 | |
DENTSPLY SIRONA Inc. | | | 753 | | | | 28,019 | |
The Cooper Companies Inc. | | | 140 | | | | 35,630 | |
| | | | | | | | |
| | | | | | | 111,818 | |
| | | | | | | | |
|
Healthcare Technology - 0.0%* | |
Cerner Corp. (a)(h) | | | 1,026 | | | | 53,803 | |
| | | | | | | | |
| | |
Home Building - 0.1% | | | | | | | | |
D.R. Horton Inc. | | | 953 | | | | 33,031 | |
Lennar Corp., Class A | | | 856 | | | | 33,512 | |
PulteGroup Inc. | | | 899 | | | | 23,365 | |
| | | | | | | | |
| | | | | | | 89,908 | |
| | | | | | | | |
|
Home Furnishings - 0.0%* | |
Leggett & Platt Inc. | | | 494 | | | | 17,705 | |
Mohawk Industries Inc. (a) | | | 212 | | | | 24,796 | |
| | | | | | | | |
| | | | | | | 42,501 | |
| | | | | | | | |
|
Home Improvement Retail - 0.5% | |
Lowe’s Companies Inc. (h) | | | 2,485 | | | | 229,514 | |
The Home Depot Inc. (h) | | | 3,485 | | | | 598,793 | |
| | | | | | | | |
| | | | | | | 828,307 | |
| | | | | | | | |
|
Hotel & Resort REITs - 0.0%* | |
Host Hotels & Resorts Inc. | | | 2,433 | | | | 40,558 | |
| | | | | | | | |
See Notes to Schedules of Investments and Notes to Financial Statements.
| | |
| 22 | | Elfun Diversified Fund |
Elfun Diversified Fund
Schedule of Investments, continued — December 31, 2018
| | | | | | | | |
| | | Number
of Shares | | | Fair
Value
$ | |
| | | | | | | | |
Hotels, Resorts & Cruise Lines - 0.2% | |
Carnival Corp. (h) | | | 1,199 | | | | 59,111 | |
Hilton Worldwide Holdings Inc. (h) | | | 860 | | | | 61,748 | |
Marriott International Inc., Class A (h) | | | 869 | | | | 94,338 | |
Norwegian Cruise Line Holdings Ltd. (a) | | | 730 | | | | 30,945 | |
Royal Caribbean Cruises Ltd. (h) | | | 506 | | | | 49,482 | |
| | | | | | | | |
| | | | | | | 295,624 | |
| | | | | | | | |
|
Household Appliances - 0.0%* | |
Whirlpool Corp. | | | 194 | | | | 20,733 | |
| | | | | | | | |
| | |
Household Products - 0.6% | | | | | | | | |
Church & Dwight Company Inc. | | | 755 | | | | 49,649 | |
Colgate-Palmolive Co. (h) | | | 2,643 | | | | 157,311 | |
Kimberly-Clark Corp. (h) | | | 1,051 | | | | 119,751 | |
The Clorox Co. | | | 376 | | | | 57,957 | |
The Procter & Gamble Co. (h) | | | 7,518 | | | | 691,054 | |
| | | | | | | | |
| | | | | | | 1,075,722 | |
| | | | | | | | |
|
Housewares & Specialties - 0.0%* | |
Newell Brands Inc. | | | 1,212 | | | | 22,531 | |
| | | | | | | | |
|
Human Resource & Employment Services - 0.0%* | |
Robert Half International Inc. | | | 366 | | | | 20,935 | |
| | | | | | | | |
|
Hypermarkets & Super Centers - 0.4% | |
Costco Wholesale Corp. (h) | | | 1,345 | | | | 273,990 | |
Walmart Inc. (h) | | | 4,322 | | | | 402,594 | |
| | | | | | | | |
| | | | | | | 676,584 | |
| | | | | | | | |
|
Independent Power Producers & Energy Traders - 0.0%* | |
AES Corp. | | | 1,955 | | | | 28,269 | |
NRG Energy Inc. | | | 855 | | | | 33,858 | |
| | | | | | | | |
| | | | | | | 62,127 | |
| | | | | | | | |
|
Industrial Conglomerates - 0.5% | |
3M Co. (h) | | | 1,765 | | | | 336,303 | |
General Electric Co. (h) | | | 26,673 | | | | 201,915 | |
Honeywell International Inc. (h) | | | 2,232 | | | | 294,892 | |
Roper Technologies Inc. (h) | | | 325 | | | | 86,619 | |
| | | | | | | | |
| | | | | | | 919,729 | |
| | | | | | | | |
|
Industrial Gases - 0.1% | |
Air Products & Chemicals Inc. (h) | | | 663 | | | | 106,113 | |
| | | | | | | | |
|
Industrial Machinery - 0.3% | |
Dover Corp. | | | 423 | | | | 30,012 | |
Flowserve Corp. | | | 322 | | | | 12,242 | |
| | | | | | | | |
| | | Number
of Shares | | | Fair
Value
$ | |
Fortive Corp. (h) | | | 978 | | | | 66,172 | |
Illinois Tool Works Inc. (h) | | | 927 | | | | 117,442 | |
Ingersoll-Rand PLC (h) | | | 734 | | | | 66,963 | |
Parker-Hannifin Corp. (h) | | | 423 | | | | 63,086 | |
Snap-on Inc. | | | 182 | | | | 26,443 | |
Stanley Black & Decker Inc. (h) | | | 454 | | | | 54,362 | |
Xylem Inc. | | | 563 | | | | 37,563 | |
| | | | | | | | |
| | | | | | | 474,285 | |
| | | | | | | | |
|
Industrial REITs - 0.1% | |
Duke Realty Corp. | | | 1,080 | | | | 27,972 | |
Prologis Inc. REIT (h) | | | 1,902 | | | | 111,685 | |
| | | | | | | | |
| | | | | | | 139,657 | |
| | | | | | | | |
|
Insurance Brokers - 0.1% | |
Arthur J Gallagher & Co. | | | 567 | | | | 41,788 | |
Marsh & McLennan Companies Inc. (h) | | | 1,524 | | | | 121,539 | |
| | | | | | | | |
| | | | | | | 163,327 | |
| | | | | | | | |
|
Integrated Oil & Gas - 0.9% | |
Chevron Corp. (h) | | | 5,840 | | | | 635,333 | |
Exxon Mobil Corp. (h) | | | 12,819 | | | | 874,128 | |
Occidental Petroleum Corp. (h) | | | 2,332 | | | | 143,138 | |
| | | | | | | | |
| | | | | | | 1,652,599 | |
| | | | | | | | |
|
Integrated Telecommunication Services - 0.7% | |
AT&T Inc. (h) | | | 22,134 | | | | 631,704 | |
Verizon Communications Inc. (h) | | | 12,477 | | | | 701,457 | |
| | | | | | | | |
| | | | | | | 1,333,161 | |
| | | | | | | | |
|
Interactive Home Entertainment - 0.1% | |
Activision Blizzard Inc. (h) | | | 2,325 | | | | 108,275 | |
Electronic Arts Inc. (a)(h) | | | 917 | | | | 72,361 | |
Take-Two Interactive Software Inc. (a) | | | 330 | | | | 33,970 | |
| | | | | | | | |
| | | | | | | 214,606 | |
| | | | | | | | |
|
Interactive Media & Services - 1.6% | |
Alphabet Inc., Class A (a)(h) | | | 905 | | | | 945,689 | |
Alphabet Inc., Class C (a)(h) | | | 932 | | | | 965,189 | |
Facebook Inc., Class A (a)(h) | | | 7,302 | | | | 957,219 | |
TripAdvisor Inc. (a) | | | 302 | | | | 16,290 | |
Twitter Inc. (a) | | | 2,110 | | | | 60,641 | |
| | | | | | | | |
| | | | | | | 2,945,028 | |
| | | | | | | | |
|
Internet & Direct Marketing Retail - 1.2% | |
Amazon.com Inc. (a)(h) | | | 1,243 | | | | 1,866,949 | |
Booking Holdings Inc. (a)(h) | | | 146 | | | | 251,473 | |
eBay Inc. (a)(h) | | | 2,750 | | | | 77,192 | |
See Notes to Schedules of Investments and Notes to Financial Statements.
| | | | |
| Elfun Diversified Fund | | | 23 | |
Elfun Diversified Fund
Schedule of Investments, continued — December 31, 2018
| | | | | | | | |
| | | Number
of Shares | | | Fair
Value
$ | |
| | | | | | | | |
Expedia Group Inc. | | | 344 | | | | 38,752 | |
| | | | | | | | |
| | | | | | | 2,234,366 | |
| | | | | | | | |
|
Internet Services & Infrastructure - 0.1% | |
Akamai Technologies Inc. (a) | | | 540 | | | | 32,983 | |
VeriSign Inc. (a) | | | 346 | | | | 51,309 | |
| | | | | | | | |
| | | | | | | 84,292 | |
| | | | | | | | |
|
Investment Banking & Brokerage - 0.3% | |
E*TRADE Financial Corp. (h) | | | 750 | | | | 32,910 | |
Morgan Stanley (h) | | | 4,046 | | | | 160,424 | |
Raymond James Financial Inc. | | | 400 | | | | 29,764 | |
The Charles Schwab Corp. (h) | | | 3,666 | | | | 152,249 | |
The Goldman Sachs Group Inc. (h) | | | 1,075 | | | | 179,579 | |
| | | | | | | | |
| | | | | | | 554,926 | |
| | | | | | | | |
|
IT Consulting & Other Services - 0.3% | |
Cognizant Technology Solutions Corp., Class A (h) | | | 1,761 | | | | 111,788 | |
DXC Technology Co. (h) | | | 834 | | | | 44,344 | |
Gartner Inc. (a) | | | 300 | | | | 38,352 | |
International Business Machines Corp. (h) | | | 2,745 | | | | 312,024 | |
| | | | | | | | |
| | | | | | | 506,508 | |
| | | | | | | | |
Leisure Products - 0.0%* | |
Hasbro Inc. | | | 344 | | | | 27,950 | |
Mattel Inc. (a) | | | 1,263 | | | | 12,617 | |
| | | | | | | | |
| | | | | | �� | 40,567 | |
| | | | | | | | |
|
Life & Health Insurance - 0.3% | |
Aflac Inc. (h) | | | 2,314 | | | | 105,426 | |
Brighthouse Financial Inc. (a) | | | 341 | | | | 10,394 | |
Lincoln National Corp. | | | 684 | | | | 35,096 | |
MetLife Inc. (h) | | | 3,020 | | | | 124,001 | |
Principal Financial Group Inc. | | | 888 | | | | 39,223 | |
Prudential Financial Inc. (h) | | | 1,262 | | | | 102,916 | |
Torchmark Corp. | | | 285 | | | | 21,241 | |
Unum Group | | | 757 | | | | 22,241 | |
| | | | | | | | |
| | | | | | | 460,538 | |
| | | | | | | | |
|
Life Sciences Tools & Services - 0.4% | |
Agilent Technologies Inc. (h) | | | 1,008 | | | | 68,000 | |
Illumina Inc. (a)(h) | | | 447 | | | | 134,069 | |
IQVIA Holdings Inc. (a) | | | 500 | | | | 58,085 | |
Mettler-Toledo International Inc. (a) | | | 73 | | | | 41,287 | |
PerkinElmer Inc. | | | 325 | | | | 25,529 | |
Thermo Fisher Scientific Inc. (h) | | | 1,235 | | | | 276,380 | |
Waters Corp. (a) | | | 223 | | | | 42,069 | |
| | | | | | | | |
| | | | | | | 645,419 | |
| | | | | | | | |
| | | | | | | | |
| | | Number
of Shares | | | Fair
Value
$ | |
Managed Healthcare - 0.6% | |
Anthem Inc. (h) | | | 794 | | | | 208,528 | |
Centene Corp. (a)(h) | | | 614 | | | | 70,794 | |
Humana Inc. (h) | | | 418 | | | | 119,749 | |
UnitedHealth Group Inc. (h) | | | 2,908 | | | | 724,441 | |
WellCare Health Plans Inc. (a) | | | 160 | | | | 37,774 | |
| | | | | | | | |
| | | | | | | 1,161,286 | |
| | | | | | | | |
|
Metal & Glass Containers - 0.0%* | |
Ball Corp. | | | 992 | | | | 45,612 | |
| | | | | | | | |
|
Motorcycle Manufacturers - 0.0%* | |
Harley-Davidson Inc. | | | 553 | | | | 18,868 | |
| | | | | | | | |
|
Movies & Entertainment - 0.6% | |
Netflix Inc. (a)(h) | | | 1,310 | | | | 350,635 | |
The Walt Disney Co. (h) | | | 4,488 | | | | 492,109 | |
Twenty-First Century Fox Inc., Class A (h) | | | 3,191 | | | | 153,551 | |
Twenty-First Century Fox Inc., Class B | | | 1,549 | | | | 74,011 | |
Viacom Inc., Class B | | | 1,083 | | | | 27,833 | |
| | | | | | | | |
| | | | | | | 1,098,139 | |
| | | | | | | | |
|
Multi-Line Insurance - 0.1% | |
American International Group Inc. (h) | | | 2,694 | | | | 106,170 | |
Assurant Inc. | | | 144 | | | | 12,879 | |
Loews Corp. | | | 911 | | | | 41,469 | |
The Hartford Financial Services Group Inc. (h) | | | 1,035 | | | | 46,006 | |
| | | | | | | | |
| | | | | | | 206,524 | |
| | | | | | | | |
|
Multi-Sector Holdings - 0.7% | |
Berkshire Hathaway Inc., Class B (a)(h) | | | 5,906 | | | | 1,205,887 | |
Jefferies Financial Group Inc. | | | 997 | | | | 17,308 | |
| | | | | | | | |
| | | | | | | 1,223,195 | |
| | | | | | | | |
|
Multi-Utilities - 0.4% | |
Ameren Corp. | | | 693 | | | | 45,204 | |
CenterPoint Energy Inc. | | | 1,491 | | | | 42,091 | |
CMS Energy Corp. | | | 812 | | | | 40,316 | |
Consolidated Edison Inc. (h) | | | 985 | | | | 75,313 | |
Dominion Energy Inc. (h) | | | 1,985 | | | | 141,848 | |
DTE Energy Co. (h) | | | 533 | | | | 58,790 | |
NiSource Inc. | | | 1,192 | | | | 30,217 | |
Public Service Enterprise Group Inc. (h) | | | 1,508 | | | | 78,491 | |
SCANA Corp. | | | 378 | | | | 18,061 | |
Sempra Energy (h) | | | 804 | | | | 86,985 | |
See Notes to Schedules of Investments and Notes to Financial Statements.
| | |
| 24 | | Elfun Diversified Fund |
Elfun Diversified Fund
Schedule of Investments, continued — December 31, 2018
| | | | | | | | |
| | | Number
of Shares | | | Fair
Value
$ | |
| | | | | | | | |
WEC Energy Group Inc. (h) | | | 996 | | | | 68,983 | |
| | | | | | | | |
| | | | | | | 686,299 | |
| | | | | | | | |
|
Office REITs - 0.1% | |
Alexandria Real Estate Equities Inc. | | | 330 | | | | 38,029 | |
Boston Properties Inc. (h) | | | 488 | | | | 54,924 | |
SL Green Realty Corp. | | | 275 | | | | 21,747 | |
Vornado Realty Trust | | | 490 | | | | 30,395 | |
| | | | | | | | |
| | | | | | | 145,095 | |
| | | | | | | | |
|
Oil & Gas Drilling - 0.0%* | |
Helmerich & Payne Inc. | | | 280 | | | | 13,423 | |
| | | | | | | | |
|
Oil & Gas Equipment & Services - 0.2% | |
Baker Hughes a GE Co. (h) | | | 1,682 | | | | 36,163 | |
Halliburton Co. (h) | | | 2,563 | | | | 68,125 | |
National Oilwell Varco Inc. (h) | | | 1,105 | | | | 28,398 | |
Schlumberger Ltd. (h) | | | 4,239 | | | | 152,943 | |
| | | | | | | | |
| | | | | | | 285,629 | |
| | | | | | | | |
|
Oil & Gas Exploration & Production - 0.5% | |
Anadarko Petroleum Corp. (h) | | | 1,534 | | | | 67,251 | |
Apache Corp. (h) | | | 1,121 | | | | 29,426 | |
Cabot Oil & Gas Corp. | | | 1,468 | | | | 32,810 | |
Cimarex Energy Co. | | | 308 | | | | 18,988 | |
Concho Resources Inc. (a)(h) | | | 630 | | | | 64,758 | |
ConocoPhillips (h) | | | 3,556 | | | | 221,717 | |
Devon Energy Corp. (h) | | | 1,334 | | | | 30,068 | |
Diamondback Energy Inc. | | | 430 | | | | 39,861 | |
EOG Resources Inc. (h) | | | 1,768 | | | | 154,187 | |
Hess Corp. (h) | | | 735 | | | | 29,767 | |
Marathon Oil Corp. (h) | | | 2,499 | | | | 35,836 | |
Newfield Exploration Co. (a) | | | 729 | | | | 10,687 | |
Noble Energy Inc. (h) | | | 1,583 | | | | 29,697 | |
Pioneer Natural Resources Co. (h) | | | 507 | | | | 66,681 | |
| | | | | | | | |
| | | | | | | 831,734 | |
| | | | | | | | |
|
Oil & Gas Refining & Marketing - 0.2% | |
HollyFrontier Corp. | | | 460 | | | | 23,515 | |
Marathon Petroleum Corp. (h) | | | 2,089 | | | | 123,272 | |
Phillips 66 (h) | | | 1,295 | | | | 111,565 | |
Valero Energy Corp. (h) | | | 1,296 | | | | 97,161 | |
| | | | | | | | |
| | | | | | | 355,513 | |
| | | | | | | | |
|
Oil & Gas Storage & Transportation - 0.1% | |
Kinder Morgan Inc. (h) | | | 5,671 | | | | 87,220 | |
ONEOK Inc. (h) | | | 1,224 | | | | 66,035 | |
The Williams Companies Inc. (h) | | | 3,613 | | | | 79,666 | |
| | | | | | | | |
| | | | | | | 232,921 | |
| | | | | | | | |
| | | | | | | | |
| | | Number
of Shares | | | Fair
Value
$ | |
Packaged Foods & Meats - 0.4% | |
Campbell Soup Co. | | | 560 | | | | 18,474 | |
Conagra Brands Inc. | | | 1,526 | | | | 32,595 | |
General Mills Inc. (h) | | | 1,764 | | | | 68,690 | |
Hormel Foods Corp. | | | 817 | | | | 34,870 | |
Kellogg Co. | | | 713 | | | | 40,648 | |
Lamb Weston Holdings Inc. | | | 400 | | | | 29,424 | |
McCormick & Company Inc. | | | 373 | | | | 51,937 | |
Mondelez International Inc., Class A (h) | | | 4,474 | | | | 179,094 | |
The Hershey Co. | | | 393 | | | | 42,122 | |
The JM Smucker Co. | | | 324 | | | | 30,291 | |
The Kraft Heinz Co. (h) | | | 1,863 | | | | 80,184 | |
Tyson Foods Inc., Class A (h) | | | 863 | | | | 46,084 | |
| | | | | | | | |
| | | | | | | 654,413 | |
| | | | | | | | |
|
Paper Packaging - 0.1% | |
Avery Dennison Corp. | | | 279 | | | | 25,062 | |
International Paper Co. (h) | | | 1,299 | | | | 52,428 | |
Packaging Corporation of America | | | 300 | | | | 25,038 | |
Sealed Air Corp. | | | 464 | | | | 16,166 | |
WestRock Co. | | | 843 | | | | 31,832 | |
| | | | | | | | |
| | | | | | | 150,526 | |
| | | | | | | | |
| | |
Personal Products - 0.1% | | | | | | | | |
Coty Inc., Class A | | | 1,737 | | | | 11,395 | |
The Estee Lauder Companies Inc., Class A (h) | | | 671 | | | | 87,297 | |
| | | | | | | | |
| | | | | | | 98,692 | |
| | | | | | | | |
| | |
Pharmaceuticals - 1.8% | | | | | | | | |
Allergan PLC (h) | | | 972 | | | | 129,918 | |
Bristol-Myers Squibb Co. (h) | | | 5,003 | | | | 260,056 | |
Eli Lilly & Co. (h) | | | 2,931 | | | | 339,175 | |
Johnson & Johnson (h) | | | 8,127 | | | | 1,048,789 | |
Merck & Company Inc. (h) | | | 8,033 | | | | 613,802 | |
Mylan N.V. (a)(h) | | | 1,630 | | | | 44,662 | |
Nektar Therapeutics (a) | | | 550 | | | | 18,079 | |
Pfizer Inc. (h) | | | 17,713 | | | | 773,172 | |
Zoetis Inc. (h) | | | 1,454 | | | | 124,375 | |
| | | | | | | | |
| | | | | | | 3,352,028 | |
| | | | | | | | |
|
Property & Casualty Insurance - 0.2% | |
Cincinnati Financial Corp. | | | 426 | | | | 32,981 | |
The Allstate Corp. (h) | | | 1,040 | | | | 85,935 | |
The Progressive Corp. (h) | | | 1,763 | | | | 106,362 | |
The Travelers Companies Inc. (h) | | | 809 | | | | 96,878 | |
| | | | | | | | |
| | | | | | | 322,156 | |
| | | | | | | | |
|
Publishing - 0.0%* | |
News Corp., Class A | | | 1,411 | | | | 16,015 | |
See Notes to Schedules of Investments and Notes to Financial Statements.
| | | | |
| Elfun Diversified Fund | | | 25 | |
Elfun Diversified Fund
Schedule of Investments, continued — December 31, 2018
| | | | | | | | |
| | | Number
of Shares | | | Fair
Value
$ | |
| | | | | | | | |
News Corp., Class B | | | 442 | | | | 5,105 | |
| | | | | | | | |
| | | | | | | 21,120 | |
| | | | | | | | |
|
Railroads - 0.3% | |
CSX Corp. (h) | | | 2,489 | | | | 154,642 | |
Kansas City Southern | | | 276 | | | | 26,344 | |
Norfolk Southern Corp. (h) | | | 851 | | | | 127,259 | |
Union Pacific Corp. (h) | | | 2,223 | | | | 307,285 | |
| | | | | | | | |
| | | | | | | 615,530 | |
| | | | | | | | |
|
Real Estate Services - 0.0%* | |
CBRE Group Inc., Class A (a) | | | 1,009 | | | | 40,400 | |
| | | | | | | | |
|
Regional Banks - 0.4% | |
BB&T Corp. (h) | | | 2,337 | | | | 101,239 | |
Citizens Financial Group Inc. (h) | | | 1,401 | | | | 41,652 | |
Comerica Inc. (h) | | | 466 | | | | 32,010 | |
Fifth Third Bancorp (h) | | | 1,941 | | | | 45,672 | |
Huntington Bancshares Inc. (h) | | | 3,607 | | | | 42,995 | |
KeyCorp (h) | | | 3,402 | | | | 50,282 | |
M&T Bank Corp. (h) | | | 423 | | | | 60,544 | |
People’s United Financial Inc. | | | 1,150 | | | | 16,594 | |
Regions Financial Corp. (h) | | | 2,997 | | | | 40,100 | |
SunTrust Banks Inc. (h) | | | 1,383 | | | | 69,759 | |
SVB Financial Group (a)(h) | | | 170 | | | | 32,286 | |
The PNC Financial Services Group Inc. (h) | | | 1,417 | | | | 165,661 | |
Zions Bancorp NA | | | 652 | | | | 26,562 | |
| | | | | | | | |
| | | | | | | 725,356 | |
| | | | | | | | |
|
Research & Consulting Services - 0.1% | |
Equifax Inc. | | | 332 | | | | 30,919 | |
Nielsen Holdings PLC | | | 1,101 | | | | 25,686 | |
Verisk Analytics Inc. (a)(h) | | | 514 | | | | 56,047 | |
| | | | | | | | |
| | | | | | | 112,652 | |
| | | | | | | | |
|
Residential REITs - 0.2% | |
Apartment Investment & Management Co., Class A | | | 419 | | | | 18,386 | |
AvalonBay Communities Inc. (h) | | | 437 | | | | 76,060 | |
Equity Residential (h) | | | 1,071 | | | | 70,697 | |
Essex Property Trust Inc. | | | 191 | | | | 46,835 | |
Mid-America Apartment Communities Inc. | | | 322 | | | | 30,815 | |
UDR Inc. | | | 817 | | | | 32,369 | |
| | | | | | | | |
| | | | | | | 275,162 | |
| | | | | | | | |
|
Restaurants - 0.5% | |
Chipotle Mexican Grill Inc. (a) | | | 67 | | | | 28,930 | |
Darden Restaurants Inc. | | | 388 | | | | 38,746 | |
McDonald’s Corp. (h) | | | 2,338 | | | | 415,158 | |
Starbucks Corp. (h) | | | 3,725 | | | | 239,890 | |
| | | | | | | | |
| | | Number
of Shares | | | Fair
Value
$ | |
Yum! Brands Inc. (h) | | | 948 | | | | 87,140 | |
| | | | | | | | |
| | | | | | | 809,864 | |
| | | | | | | | |
|
Retail REITs - 0.2% | |
Federal Realty Investment Trust | | | 205 | | | | 24,198 | |
Kimco Realty Corp. | | | 1,110 | | | | 16,261 | |
Realty Income Corp. | | | 845 | | | | 53,269 | |
Regency Centers Corp. | | | 500 | | | | 29,340 | |
Simon Property Group Inc. (h) | | | 941 | | | | 158,079 | |
The Macerich Co. | | | 346 | | | | 14,975 | |
| | | | | | | | |
| | | | | | | 296,122 | |
| | | | | | | | |
|
Semiconductor Equipment - 0.1% | |
Applied Materials Inc. (h) | | | 2,962 | | | | 96,976 | |
KLA-Tencor Corp. (h) | | | 448 | | | | 40,091 | |
Lam Research Corp. (h) | | | 468 | | | | 63,728 | |
| | | | | | | | |
| | | | | | | 200,795 | |
| | | | | | | | |
|
Semiconductors - 1.2% | |
Advanced Micro Devices Inc. (a) | | | 2,570 | | | | 47,442 | |
Analog Devices Inc. (h) | | | 1,114 | | | | 95,615 | |
Broadcom Inc. (h) | | | 1,323 | | | | 336,412 | |
Intel Corp. (h) | | | 14,053 | | | | 659,507 | |
Maxim Integrated Products Inc. | | | 800 | | | | 40,680 | |
Microchip Technology Inc. (h) | | | 688 | | | | 49,481 | |
Micron Technology Inc. (a)(h) | | | 3,522 | | | | 111,753 | |
NVIDIA Corp. (h) | | | 1,821 | | | | 243,104 | |
Qorvo Inc. (a) | | | 392 | | | | 23,806 | |
QUALCOMM Inc. (h) | | | 3,715 | | | | 211,421 | |
Skyworks Solutions Inc. (h) | | | 576 | | | | 38,604 | |
Texas Instruments Inc. (h) | | | 2,982 | | | | 281,799 | |
Xilinx Inc. (h) | | | 743 | | | | 63,281 | |
| | | | | | | | |
| | | | | | | 2,202,905 | |
| | | | | | | | |
|
Soft Drinks - 0.6% | |
Monster Beverage Corp. (a)(h) | | | 1,177 | | | | 57,932 | |
PepsiCo Inc. (h) | | | 4,267 | | | | 471,418 | |
The Coca-Cola Co. (h) | | | 11,557 | | | | 547,224 | |
| | | | | | | | |
| | | | | | | 1,076,574 | |
| | | | | | | | |
|
Specialized Consumer Services - 0.0%* | |
H&R Block Inc. | | | 525 | | | | 13,319 | |
| | | | | | | | |
|
Specialized REITs - 0.4% | |
American Tower Corp. (h) | | | 1,345 | | | | 212,766 | |
Crown Castle International Corp. (h) | | | 1,258 | | | | 136,656 | |
Digital Realty Trust Inc. (h) | | | 613 | | | | 65,315 | |
Equinix Inc. (h) | | | 244 | | | | 86,025 | |
Extra Space Storage Inc. | | | 393 | | | | 35,559 | |
Iron Mountain Inc. | | | 905 | | | | 29,331 | |
Public Storage (h) | | | 451 | | | | 91,287 | |
See Notes to Schedules of Investments and Notes to Financial Statements.
| | |
| 26 | | Elfun Diversified Fund |
Elfun Diversified Fund
Schedule of Investments, continued — December 31, 2018
| | | | | | | | |
| | | Number
of Shares | | | Fair
Value
$ | |
| | | | | | | | |
SBA Communications Corp. (a)(h) | | | 340 | | | | 55,043 | |
Weyerhaeuser Co. (h) | | | 2,183 | | | | 47,720 | |
| | | | | | | | |
| | | | | | | 759,702 | |
| | | | | | | | |
|
Specialty Chemicals - 0.2% | |
Albemarle Corp. | | | 370 | | | | 28,516 | |
Ecolab Inc. (h) | | | 769 | | | | 113,312 | |
International Flavors & Fragrances Inc. | | | 330 | | | | 44,309 | |
PPG Industries Inc. (h) | | | 725 | | | | 74,117 | |
The Sherwin-Williams Co. (h) | | | 248 | | | | 97,578 | |
| | | | | | | | |
| | | | | | | 357,832 | |
| | | | | | | | |
|
Specialty Stores - 0.1% | |
Tiffany & Co. | | | 331 | | | | 26,649 | |
Tractor Supply Co. | | | 385 | | | | 32,124 | |
Ulta Salon Cosmetics & Fragrance Inc. (a) | | | 177 | | | | 43,337 | |
| | | | | | | | |
| | | | | | | 102,110 | |
| | | | | | | | |
|
Steel - 0.0%* | |
Nucor Corp. (h) | | | 936 | | | | 48,494 | |
| | | | | | | | |
|
Systems Software - 1.6% | |
Fortinet Inc. (a) | | | 400 | | | | 28,172 | |
Microsoft Corp. (h) | | | 23,268 | | | | 2,363,331 | |
Oracle Corp. (h) | | | 8,509 | | | | 384,181 | |
Red Hat Inc. (a)(h) | | | 523 | | | | 91,860 | |
Symantec Corp. | | | 2,023 | | | | 38,224 | |
| | | | | | | | |
| | | | | | | 2,905,768 | |
| | | | | | | | |
|
Technology Hardware, Storage & Peripherals - 1.3% | |
Apple Inc. (h) | | | 13,919 | | | | 2,195,583 | |
Hewlett Packard Enterprise Co. (h) | | | 4,363 | | | | 57,635 | |
HP Inc. (h) | | | 4,779 | | | | 97,778 | |
NetApp Inc. (h) | | | 767 | | | | 45,767 | |
Western Digital Corp. (h) | | | 844 | | | | 31,203 | |
Xerox Corp. | | | 496 | | | | 9,801 | |
| | | | | | | | |
| | | | | | | 2,437,767 | |
| | | | | | | | |
|
Tires & Rubber - 0.0%* | |
The Goodyear Tire & Rubber Co. | | | 844 | | | | 17,226 | |
| | | | | | | | |
|
Tobacco - 0.3% | |
Altria Group Inc. (h) | | | 5,663 | | | | 279,696 | |
Philip Morris International Inc. (h) | | | 4,683 | | | | 312,637 | |
| | | | | | | | |
| | | | | | | 592,333 | |
| | | | | | | | |
| | | | | | | | |
| | | Number
of Shares | | | Fair
Value
$ | |
Trading Companies & Distributors - 0.1% | |
Fastenal Co. | | | 828 | | | | 43,296 | |
United Rentals Inc. (a) | | | 282 | | | | 28,913 | |
WW Grainger Inc. | | | 132 | | | | 37,272 | |
| | | | | | | | |
| | | | | | | 109,481 | |
| | | | | | | | |
|
Trucking - 0.0%* | |
JB Hunt Transport Services Inc. | | | 297 | | | | 27,633 | |
| | | | | | | | |
|
Water Utilities - 0.0%* | |
American Water Works Company Inc. | | | 523 | | | | 47,473 | |
| | | | | | | | |
| | |
Total Common Stock
(Cost $57,747,648) | | | | | | | 62,462,614 | |
| | | | | | | | |
| | |
| Preferred Stock - 0.0%* | | | | | | | | |
Diversified Banks - 0.0%* | | | | | | | | |
Wells Fargo & Co.
3.09% + 3 month USD LIBOR (i) | | | 1,469 | | | | 36,093 | |
| | | | | | | | |
| | |
Total Preferred Stock
(Cost $36,725) | | | | | | | 36,093 | |
| | | | | | | | |
| | |
Total Domestic Equity
(Cost $57,784,373) | | | | | | | 62,498,707 | |
| | | | | | | | |
|
| Foreign Equity - 0.9% | |
Common Stock - 0.9% | |
Auto Parts & Equipment - 0.0%* | |
Aptiv PLC (h) | | | 780 | | | | 48,025 | |
| | | | | | | | |
|
Building Products - 0.0%* | |
Allegion PLC | | | 274 | | | | 21,841 | |
| | | | | | | | |
|
Consumer Electronics - 0.0%* | |
Garmin Ltd. | | | 415 | | | | 26,278 | |
| | | | | | | | |
|
Electronic Manufacturing Services - 0.1% | |
TE Connectivity Ltd. (h) | | | 1,042 | | | | 78,806 | |
| | | | | | | | |
|
Healthcare Equipment - 0.2% | |
Medtronic PLC (h) | | | 4,071 | | | | 370,298 | |
| | | | | | | | |
|
Industrial Gases - 0.2% | |
Linde PLC | | | 1,650 | | | | 257,466 | |
| | | | | | | | |
|
Industrial Machinery - 0.0%* | |
Pentair PLC | | | 518 | | | | 19,570 | |
| | | | | | | | |
|
Insurance Brokers - 0.1% | |
Aon PLC | | | 732 | | | | 106,404 | |
See Notes to Schedules of Investments and Notes to Financial Statements.
| | | | |
| Elfun Diversified Fund | | | 27 | |
Elfun Diversified Fund
Schedule of Investments, continued — December 31, 2018
| | | | | | | | |
| | | Principal
Amount ($)
or Number
of Shares | | | Fair
Value
$ | |
| | | | | | | | |
Willis Towers Watson PLC (h) | | | 385 | | | | 58,466 | |
| | | | | | | | |
| | | | | | | 164,870 | |
| | | | | | | | |
|
IT Consulting & Other Services - 0.2% | |
Accenture PLC, Class A (h) | | | 1,925 | | | | 271,444 | |
| | | | | | | | |
|
Oil & Gas Equipment & Services - 0.0%* | |
TechnipFMC PLC | | | 1,406 | | | | 27,529 | |
| | | | | | | | |
|
Pharmaceuticals - 0.0%* | |
Perrigo Company PLC | | | 446 | | | | 17,283 | |
| | | | | | | | |
|
Property & Casualty Insurance - 0.1% | |
Chubb Ltd. (h) | | | 1,413 | | | | 182,531 | |
| | | | | | | | |
|
Reinsurance - 0.0%* | |
Everest Re Group Ltd. | | | 109 | | | | 23,736 | |
| | | | | | | | |
|
Research & Consulting Services - 0.0%* | |
IHS Markit Ltd. (a)(h) | | | 1,020 | | | | 48,929 | |
| | | | | | | | |
|
Technology Hardware, Storage & Peripherals - 0.0%* | |
Seagate Technology PLC (h) | | | 748 | | | | 28,865 | |
| | | | | | | | |
| | |
Total Foreign Equity
(Cost $1,504,447) | | | | | | | 1,587,471 | |
| | | | | | | | |
|
| Bonds and Notes - 34.6% | |
U.S. Treasuries - 10.4% | |
U.S. Treasury Bonds | | | | | | | | |
2.25% 08/15/46 | | | 481,000 | | | | 411,025 | |
3.75% 11/15/43 | | | 97,000 | | | | 109,538 | |
4.50% 02/15/36 | | | 394,500 | | | | 486,279 | |
U.S. Treasury Notes | | | | | | | | |
1.38% 12/15/19 | | | 2,850,700 | | | | 2,816,927 | |
1.50% 11/30/19 - 08/15/20 | | | 3,805,100 | | | | 3,760,116 | |
2.25% 03/31/20 | | | 3,463,200 | | | | 3,449,339 | |
2.75% 11/15/23 | | | 2,144,600 | | | | 2,168,396 | |
2.88% 07/31/25 - 08/15/28 | | | 5,557,600 | | | | 5,656,035 | |
| | | | | | | | |
| | | | | | | 18,857,655 | |
| | | | | | | | |
|
Agency Mortgage Backed - 7.0% | |
Federal Home Loan Mortgage Corp. | | | | | | | | |
4.05% 09/25/28 (i) | | | 295,000 | | | | 310,684 | |
4.50% 06/01/33 - 02/01/35 | | | 2,378 | | | | 2,488 | |
5.00% 07/01/35 | | | 16,557 | | | | 17,610 | |
5.50% 05/01/20 - 04/01/39 | | | 31,231 | | | | 33,625 | |
6.00% 05/01/20 - 11/01/37 | | | 82,614 | | | | 90,211 | |
6.50% 11/01/28 - 06/01/29 | | | 1,082 | | | | 1,183 | |
7.00% 06/01/29 - 08/01/36 | | | 16,106 | | | | 17,901 | |
7.50% 09/01/33 | | | 1,123 | | | | 1,200 | |
| | | | | | | | |
| | |
Principal
Amount ($) | | | Fair
Value
$ | |
8.00% 07/01/26 - 11/01/30 | | | 1,864 | | | | 2,036 | |
8.50% 04/01/30 | | | 4,822 | | | | 5,896 | |
Federal National Mortgage Assoc. | | | | | | | | |
3.50% 08/01/45 | | | 81,812 | | | | 82,071 | |
4.00% 05/01/19 - 03/01/41 | | | 214,033 | | | | 220,311 | |
4.50% 05/01/19 - 02/01/40 | | | 128,922 | | | | 134,911 | |
5.00% 07/01/20 - 05/01/39 | | | 58,938 | | | | 62,623 | |
5.50% 06/01/20 - 01/01/39 | | | 124,619 | | | | 133,989 | |
6.00% 02/01/20 - 05/01/41 | | | 375,783 | | | | 414,854 | |
6.50% 10/01/28 - 08/01/36 | | | 12,736 | | | | 13,757 | |
7.00% 05/01/33 - 12/01/33 | | | 560 | | | | 591 | |
7.50% 12/01/26 - 12/01/33 | | | 4,708 | | | | 5,184 | |
8.00% 06/01/24 - 12/01/30 | | | 5,862 | | | | 6,025 | |
9.00% 12/01/22 | | | 310 | | | | 326 | |
Federal National Mortgage Assoc. 1.60% + 12 month USD LIBOR | | | | | | | | |
3.97% 04/01/37 (i) | | | 481 | | | | 492 | |
Federal National Mortgage Assoc. TBA | | | | | | | | |
2.50% TBA (c) | | | 1,299,000 | | | | 1,268,962 | |
3.00% TBA (c) | | | 2,273,934 | | | | 2,223,427 | |
3.50% TBA (c) | | | 1,250,000 | | | | 1,249,607 | |
4.00% TBA (c) | | | 1,667,000 | | | | 1,699,323 | |
4.50% TBA (c) | | | 1,171,000 | | | | 1,212,219 | |
Government National Mortgage Assoc. | | | | | | | | |
4.00% 01/20/41 - 04/20/43 | | | 325,786 | | | | 336,644 | |
4.50% 08/15/33 - 03/20/41 | | | 143,244 | | | | 149,960 | |
5.00% 08/15/33 | | | 7,013 | | | | 7,323 | |
6.00% 07/15/33 - 04/15/34 | | | 7,291 | | | | 8,164 | |
6.50% 04/15/28 - 07/15/36 | | | 12,402 | | | | 13,635 | |
7.00% 04/15/28 - 10/15/36 | | | 4,042 | | | | 4,431 | |
7.50% 07/15/23 - 04/15/28 | | | 6,965 | | | | 7,231 | |
8.00% 05/15/30 | | | 179 | | | | 190 | |
9.00% 12/15/21 | | | 149 | | | | 155 | |
3.00% TBA (c) | | | 651,000 | | | | 640,911 | |
3.50% TBA (c) | | | 2,419,000 | | | | 2,435,691 | |
| | | | | | | | |
| | | | | | | 12,815,841 | |
| | | | | | | | |
|
Agency Collateralized Mortgage Obligations - 0.1% | |
Federal Home Loan Mortgage Corp. | | | | | | | | |
0.08% 09/25/43 (g)(i) | | | 139,109 | | | | 359 | |
4.06% 10/25/28 (i) | | | 146,000 | | | | 153,805 | |
Federal Home Loan Mortgage Corp. REMIC | | | | | | | | |
3.50% 11/15/24 -
11/15/30 (g) | | | 62,364 | | | | 4,729 | |
5.50% 06/15/33 (g) | | | 5,733 | | | | 1,130 | |
7.50% 07/15/27 (g) | | | 5,435 | | | | 1,073 | |
See Notes to Schedules of Investments and Notes to Financial Statements.
| | |
| 28 | | Elfun Diversified Fund |
Elfun Diversified Fund
Schedule of Investments, continued — December 31, 2018
| | | | | | | | |
| | | Principal
Amount ($) | | | Fair
Value
$ | |
| | | | | | | | |
Federal Home Loan Mortgage Corp. REMIC 6.60% - 1 month USD LIBOR | | | | | | | | |
4.14% 08/15/25 (g)(i) | | | 28,069 | | | | 1,447 | |
Federal Home Loan Mortgage Corp. STRIPS | | | | | | | | |
1.47% 08/01/27 (d)(f) | | | 218 | | | | 192 | |
8.00% 02/01/23 -
07/01/24 (g) | | | 750 | | | | 105 | |
Federal National Mortgage Assoc. REMIC | | | | | | | | |
0.51% 12/25/22 (d)(f) | | | 72 | | | | 70 | |
1.10% 12/25/42 (g)(i) | | | 29,756 | | | | 2,168 | |
5.00% 09/25/40 (g) | | | 27,546 | | | | 2,980 | |
Federal National Mortgage Assoc. REMIC 6.00% - 1 month USD LIBOR | | | | | | | | |
3.49% 07/25/38 (g)(i) | | | 9,264 | | | | 1,209 | |
Federal National Mortgage Assoc. REMIC 6.20% - 1 month USD LIBOR | | | | | | | | |
3.69% 06/25/48 (g)(i) | | | 505,353 | | | | 82,721 | |
Federal National Mortgage Assoc. STRIPS | | | | | | | | |
4.50% 08/25/35 -
01/25/36 (g) | | | 13,852 | | | | 1,719 | |
5.00% 03/25/38 -
05/25/38 (g) | �� | | 7,881 | | | | 1,685 | |
5.50% 12/25/33 (g) | | | 2,721 | | | | 598 | |
6.00% 01/25/35 (g) | | | 7,164 | | | | 1,668 | |
7.50% 11/25/23 (g) | | | 5,866 | | | | 710 | |
8.00% 08/25/23 -
07/25/24 (g) | | | 1,520 | | | | 214 | |
8.50% 07/25/22 (g) | | | 105 | | | | 9 | |
8.50% 07/25/22 (g)** | | | 3 | | | | — | |
9.00% 05/25/22 (g) | | | 120 | | | | 9 | |
Government National Mortgage Assoc. REMIC | | | | | | | | |
4.50% 08/16/39 (g) | | | 18,005 | | | | 1,303 | |
5.00% 09/20/38 (g) | | | 3,646 | | | | 109 | |
Government National Mortgage Assoc. REMIC 6.80% - 1 month USD LIBOR | | | | | | | | |
4.34% 01/16/40 (g)(i) | | | 52,899 | | | | 8,827 | |
| | | | | | | | |
| | | | | | | 268,839 | |
| | | | | | | | |
|
Asset Backed - 0.9% | |
American Express Credit Account Master Trust2017-6 | | | | | | | | |
2.04% 05/15/23 | | | 357,738 | | | | 352,416 | |
American Express Credit Account Master Trust2018-1 | | | | | | | | |
2.67% 10/17/22 | | | 150,000 | | | | 149,449 | |
American Express Credit Account Master Trust2018-8 | | | | | | | | |
3.18% 04/15/24 | | | 326,000 | | | | 328,384 | |
| | | | | | | | |
| | | Principal
Amount ($) | | | Fair
Value
$ | |
BA Credit Card Trust2018-A1 | | | | | | | | |
2.70% 07/17/23 | | | 131,000 | | | | 130,461 | |
BMW Floorplan Master Owner Trust2018-1 | | | | | | | | |
3.15% 05/15/23 (b) | | | 100,000 | | | | 100,144 | |
Citibank Credit Card Issuance Trust2016-A1 | | | | | | | | |
1.75% 11/19/21 | | | 446,000 | | | | 441,363 | |
Securitized Term Auto Receivables Trust2018-1A | | | | | | | | |
3.30% 11/25/22 (b) | | | 100,000 | | | | 100,059 | |
| | | | | | | | |
| | | | | | | 1,602,276 | |
| | | | | | | | |
|
Corporate Notes - 14.8% | |
1011778 BC ULC/New Red Finance Inc. | | | | | | | | |
4.25% 05/15/24 (b) | | | 23,000 | | | | 21,122 | |
21st Century Fox America Inc. | | | | | | | | |
3.38% 11/15/26 | | | 4,000 | | | | 3,945 | |
4.50% 02/15/21 | | | 19,000 | | | | 19,490 | |
4.75% 11/15/46 | | | 6,000 | | | | 6,405 | |
6.65% 11/15/37 | | | 39,000 | | | | 50,166 | |
Abbott Laboratories | | | | | | | | |
2.90% 11/30/21 | | | 88,000 | | | | 87,170 | |
3.75% 11/30/26 | | | 27,000 | | | | 26,683 | |
4.90% 11/30/46 | | | 29,000 | | | | 30,486 | |
AbbVie Inc. | | | | | | | | |
3.20% 05/14/26 | | | 47,000 | | | | 43,533 | |
4.45% 05/14/46 | | | 43,000 | | | | 37,796 | |
4.70% 05/14/45 | | | 10,000 | | | | 9,142 | |
4.88% 11/14/48 | | | 11,000 | | | | 10,266 | |
Acadia Healthcare Company Inc. | | | | | | | | |
6.50% 03/01/24 | | | 52,000 | | | | 50,057 | |
Activision Blizzard Inc. | | | | | | | | |
2.30% 09/15/21 | | | 115,000 | | | | 111,924 | |
AES Corp. | | | | | | | | |
4.88% 05/15/23 | | | 75,000 | | | | 73,344 | |
Aetna Inc. | | | | | | | | |
3.50% 11/15/24 | | | 43,000 | | | | 41,521 | |
Aflac Inc. | | | | | | | | |
4.00% 10/15/46 | | | 8,000 | | | | 7,351 | |
Alexandria Real Estate Equities Inc. | | | | | | | | |
4.70% 07/01/30 | | | 18,000 | | | | 18,227 | |
Alimentation Couche-Tard Inc. | | | | | | | | |
2.70% 07/26/22 (b) | | | 49,000 | | | | 47,371 | |
4.50% 07/26/47 (b) | | | 10,000 | | | | 9,099 | |
Allergan Finance LLC | | | | | | | | |
3.25% 10/01/22 | | | 38,000 | | | | 37,014 | |
4.63% 10/01/42 | | | 5,000 | | | | 4,584 | |
See Notes to Schedules of Investments and Notes to Financial Statements.
| | | | |
| Elfun Diversified Fund | | | 29 | |
Elfun Diversified Fund
Schedule of Investments, continued — December 31, 2018
| | | | | | | | |
| | | Principal
Amount ($) | | | Fair
Value
$ | |
| | | | | | | | |
Allergan Funding SCS | | | | | | | | |
3.00% 03/12/20 | | | 57,000 | | | | 56,779 | |
3.45% 03/15/22 | | | 26,000 | | | | 25,590 | |
Allergan Sales LLC | | | | | | | | |
5.00% 12/15/21 (b) | | | 74,000 | | | | 76,174 | |
Altria Group Inc. | | | | | | | | |
2.95% 05/02/23 | | | 23,000 | | | | 21,868 | |
3.88% 09/16/46 | | | 8,000 | | | | 6,100 | |
4.50% 05/02/43 | | | 17,000 | | | | 14,147 | |
Amazon.com Inc. | | | | | | | | |
2.80% 08/22/24 | | | 32,000 | | | | 31,101 | |
3.15% 08/22/27 | | | 20,000 | | | | 19,295 | |
3.88% 08/22/37 | | | 13,000 | | | | 12,645 | |
4.05% 08/22/47 | | | 13,000 | | | | 12,740 | |
4.25% 08/22/57 | | | 18,000 | | | | 17,761 | |
Ameren Corp. | | | | | | | | |
3.65% 02/15/26 | | | 22,000 | | | | 21,642 | |
American Axle & Manufacturing Inc. | | | | | | | | |
6.25% 04/01/25 | | | 37,000 | | | | 33,662 | |
American Campus Communities Operating Partnership LP | | | | | | | | |
3.35% 10/01/20 | | | 36,000 | | | | 35,873 | |
4.13% 07/01/24 | | | 20,000 | | | | 20,059 | |
American Express Co. | | | | | | | | |
3.00% 10/30/24 | | | 55,000 | | | | 52,621 | |
American International Group Inc. | | | | | | | | |
4.50% 07/16/44 | | | 44,000 | | | | 39,112 | |
6.40% 12/15/20 | | | 19,000 | | | | 20,050 | |
American International Group Inc. (5.75% fixed rate until 04/01/28; 2.87% + 3 month USD LIBOR thereafter) | | | | | | | | |
5.75% 04/01/48 (i) | | | 21,000 | | | | 18,377 | |
American Tower Corp. (REIT) | | | | | | | | |
3.38% 10/15/26 | | | 11,000 | | | | 10,248 | |
3.40% 02/15/19 | | | 134,000 | | | | 133,926 | |
American Water Capital Corp. | | | | | | | | |
2.95% 09/01/27 | | | 37,000 | | | | 34,870 | |
Amgen Inc. | | | | | | | | |
2.20% 05/22/19 | | | 64,000 | | | | 63,767 | |
2.65% 05/11/22 | | | 52,000 | | | | 50,837 | |
3.20% 11/02/27 | | | 32,000 | | | | 30,078 | |
4.56% 06/15/48 | | | 29,000 | | | | 27,816 | |
AMN Healthcare Inc. | | | | | | | | |
5.13% 10/01/24 (b) | | | 64,000 | | | | 61,302 | |
Anadarko Petroleum Corp. | | | | | | | | |
4.85% 03/15/21 | | | 4,000 | | | | 4,085 | |
6.20% 03/15/40 | | | 12,000 | | | | 12,535 | |
| | | | | | | | |
| | | Principal
Amount ($) | | | Fair
Value
$ | |
Andeavor Logistics LP/Tesoro Logistics Finance Corp. | | | | | | | | |
5.20% 12/01/47 | | | 14,000 | | | | 12,588 | |
5.25% 01/15/25 | | | 186,000 | | | | 185,762 | |
5.50% 10/15/19 | | | 71,000 | | | | 71,651 | |
6.25% 10/15/22 | | | 51,000 | | | | 51,986 | |
Anheuser-Busch Companies LLC/Anheuser-Busch InBev Worldwide Inc. | | | | | | | | |
4.70% 02/01/36 (b) | | | 17,000 | | | | 15,685 | |
4.90% 02/01/46 (b) | | | 66,000 | | | | 61,068 | |
Anheuser-Busch InBev Finance Inc. | | | | | | | | |
2.65% 02/01/21 | | | 28,000 | | | | 27,522 | |
Anheuser-Busch InBev Worldwide Inc. | | | | | | | | |
2.50% 07/15/22 | | | 101,000 | | | | 96,406 | |
4.00% 04/13/28 | | | 15,000 | | | | 14,349 | |
4.38% 04/15/38 | | | 77,000 | | | | 68,912 | |
4.60% 04/15/48 | | | 32,000 | | | | 28,636 | |
4.75% 04/15/58 | | | 18,000 | | | | 15,654 | |
Anthem Inc. | | | | | | | | |
3.30% 01/15/23 | | | 35,000 | | | | 34,438 | |
Apache Corp. | | | | | | | | |
4.38% 10/15/28 | | | 15,000 | | | | 14,001 | |
5.10% 09/01/40 | | | 18,000 | | | | 16,258 | |
Apple Inc. | | | | | | | | |
2.50% 02/09/22 | | | 47,000 | | | | 46,334 | |
2.85% 05/11/24 | | | 43,000 | | | | 41,916 | |
3.35% 02/09/27 | | | 27,000 | | | | 26,375 | |
3.45% 02/09/45 | | | 57,000 | | | | 50,500 | |
3.85% 08/04/46 | | | 51,000 | | | | 47,973 | |
4.25% 02/09/47 | | | 22,000 | | | | 22,019 | |
4.65% 02/23/46 | | | 8,000 | | | | 8,458 | |
Applied Materials Inc. | | | | | | | | |
4.35% 04/01/47 | | | 31,000 | | | | 30,320 | |
Aptiv PLC | | | | | | | | |
4.40% 10/01/46 | | | 19,000 | | | | 16,830 | |
Aramark Services Inc. | | | | | | | | |
5.00% 02/01/28 (b) | | | 31,000 | | | | 28,992 | |
Archer-Daniels-Midland Co. | | | | | | | | |
2.50% 08/11/26 | | | 32,000 | | | | 29,208 | |
Arconic Inc. | | | | | | | | |
5.13% 10/01/24 | | | 41,000 | | | | 39,481 | |
6.15% 08/15/20 | | | 20,000 | | | | 20,405 | |
Ascension Health | | | | | | | | |
4.85% 11/15/53 | | | 13,000 | | | | 14,081 | |
Ashland LLC | | | | | | | | |
4.75% 08/15/22 | | | 23,000 | | | | 22,608 | |
AstraZeneca PLC | | | | | | | | |
2.38% 11/16/20 | | | 16,000 | | | | 15,732 | |
3.38% 11/16/25 | | | 32,000 | | | | 30,993 | |
See Notes to Schedules of Investments and Notes to Financial Statements.
| | |
| 30 | | Elfun Diversified Fund |
Elfun Diversified Fund
Schedule of Investments, continued — December 31, 2018
| | | | | | | | |
| | | Principal
Amount ($) | | | Fair
Value
$ | |
| | | | | | | | |
3.50% 08/17/23 | | | 30,000 | | | | 29,714 | |
4.00% 01/17/29 | | | 20,000 | | | | 19,866 | |
4.38% 08/17/48 | | | 22,000 | | | | 20,870 | |
AT&T Inc. | | | | | | | | |
3.00% 06/30/22 | | | 53,000 | | | | 51,733 | |
3.80% 03/15/22 | | | 55,000 | | | | 55,233 | |
4.10% 02/15/28 | | | 51,000 | | | | 49,031 | |
4.45% 04/01/24 | | | 32,000 | | | | 32,469 | |
4.50% 05/15/35 | | | 43,000 | | | | 38,978 | |
4.55% 03/09/49 | | | 21,000 | | | | 18,091 | |
4.75% 05/15/46 | | | 17,000 | | | | 15,111 | |
4.80% 06/15/44 | | | 29,000 | | | | 26,013 | |
5.00% 03/01/21 | | | 41,000 | | | | 42,397 | |
5.15% 11/15/46 | | | 7,000 | | | | 6,518 | |
5.25% 03/01/37 | | | 29,000 | | | | 28,434 | |
5.45% 03/01/47 | | | 52,000 | | | | 50,705 | |
Athene Holding Ltd. | | | | | | | | |
4.13% 01/12/28 | | | 35,000 | | | | 31,777 | |
Avangrid Inc. | | | | | | | | |
3.15% 12/01/24 | | | 57,000 | | | | 54,979 | |
Bank of America Corp. | | | | | | | | |
2.65% 04/01/19 | | | 63,000 | | | | 62,926 | |
3.25% 10/21/27 | | | 63,000 | | | | 58,320 | |
3.95% 04/21/25 | | | 41,000 | | | | 39,734 | |
4.25% 10/22/26 | | | 61,000 | | | | 59,340 | |
Bank of America Corp.
(2.37% fixed rate until 07/21/20; 0.66% + 3 month USD LIBOR thereafter) | | | | | | | | |
2.37% 07/21/21 (i) | | | 42,000 | | | | 41,287 | |
Bank of America Corp.
(3.12% fixed rate until 01/20/22; 1.16% + 3 month USD LIBOR thereafter) | | | | | | | | |
3.12% 01/20/23 (i) | | | 170,000 | | | | 167,045 | |
Bank of America Corp.
(3.37% fixed rate until 01/23/25; 0.81% + 3 month USD LIBOR thereafter) | | | | | | | | |
3.37% 01/23/26 (i) | | | 125,000 | | | | 119,486 | |
Bank of America Corp.
(3.42% fixed rate until 12/20/27; 1.04% + 3 month USD LIBOR thereafter) | | | | | | | | |
3.42% 12/20/28 (i) | | | 75,000 | | | | 69,846 | |
Bank of America Corp.
(3.95% fixed rate until 01/23/48; 1.19% + 3 month USD LIBOR thereafter) | | | | | | | | |
3.95% 01/23/49 (i) | | | 41,000 | | | | 36,495 | |
| | | | | | | | |
| | | Principal
Amount ($) | | | Fair
Value
$ | |
Bank of America Corp.
(4.24% fixed rate until 04/24/37; 1.81% + 3 month USD LIBOR thereafter) | | | | | | | | |
4.24% 04/24/38 (i) | | | 51,000 | | | | 48,353 | |
Bank of America Corp.
(4.27% fixed rate until 07/23/28; 1.31% + 3 month USD LIBOR thereafter) | | | | | | | | |
4.27% 07/23/29 (i) | | | 21,000 | | | | 20,891 | |
Bank of America Corp.
(4.44% fixed rate until 01/20/47; 1.99% + 3 month USD LIBOR thereafter) | | | | | | | | |
4.44% 01/20/48 (i) | | | 31,000 | | | | 29,944 | |
Bank of Montreal
(4.34% fixed rate until 10/05/23; 1.28% + USD 5 year Swap Rate thereafter) | | | | | | | | |
4.34% 10/05/28 (i) | | | 61,000 | | | | 60,730 | |
Barrick North America Finance LLC | | | | | | | | |
5.70% 05/30/41 | | | 6,000 | | | | 6,334 | |
BAT Capital Corp. | | | | | | | | |
2.30% 08/14/20 | | | 111,000 | | | | 108,387 | |
2.76% 08/15/22 | | | 34,000 | | | | 32,096 | |
3.56% 08/15/27 | | | 82,000 | | | | 72,680 | |
4.39% 08/15/37 | | | 11,000 | | | | 9,040 | |
4.54% 08/15/47 | | | 26,000 | | | | 20,806 | |
Bausch Health Companies Inc. | | | | | | | | |
7.00% 03/15/24 (b) | | | 125,000 | | | | 126,615 | |
Baxalta Inc. | | | | | | | | |
2.88% 06/23/20 | | | 13,000 | | | | 12,858 | |
Bayer US Finance II LLC | | | | | | | | |
3.50% 06/25/21 (b) | | | 200,000 | | | | 198,850 | |
4.70% 07/15/64 (b) | | | 8,000 | | | | 6,648 | |
Becton Dickinson and Co. | | | | | | | | |
2.89% 06/06/22 | | | 37,000 | | | | 35,820 | |
3.70% 06/06/27 | | | 56,000 | | | | 53,039 | |
3.73% 12/15/24 | | | 3,000 | | | | 2,901 | |
4.67% 06/06/47 | | | 6,000 | | | | 5,646 | |
4.69% 12/15/44 | | | 7,000 | | | | 6,587 | |
Berkshire Hathaway Energy Co. | | | | | | | | |
2.40% 02/01/20 | | | 48,000 | | | | 47,680 | |
3.25% 04/15/28 | | | 22,000 | | | | 20,940 | |
3.80% 07/15/48 | | | 16,000 | | | | 14,310 | |
Berkshire Hathaway Inc. | | | | | | | | |
4.50% 02/11/43 | | | 8,000 | | | | 8,308 | |
Berry Global Inc. | | | | | | | | |
5.13% 07/15/23 | | | 60,000 | | | | 59,413 | |
BHP Billiton Finance USA Ltd. | | | | | | | | |
5.00% 09/30/43 | | | 7,000 | | | | 7,647 | |
See Notes to Schedules of Investments and Notes to Financial Statements.
| | | | |
| Elfun Diversified Fund | | | 31 | |
Elfun Diversified Fund
Schedule of Investments, continued — December 31, 2018
| | | | | | | | |
| | | Principal
Amount ($) | | | Fair
Value
$ | |
| | | | | | | | |
Biogen Inc. | | | | | | | | |
2.90% 09/15/20 | | | 16,000 | | | | 15,898 | |
BNP Paribas S.A. | | | | | | | | |
5.00% 01/15/21 | | | 19,000 | | | | 19,625 | |
Boston Scientific Corp. | | | | | | | | |
4.00% 03/01/28 | | | 39,000 | | | | 37,948 | |
BP Capital Markets America Inc. | | | | | | | | |
3.02% 01/16/27 | | | 95,000 | | | | 89,176 | |
3.22% 11/28/23 | | | 37,000 | | | | 36,509 | |
Brighthouse Financial Inc. | | | | | | | | |
3.70% 06/22/27 | | | 5,000 | | | | 4,224 | |
4.70% 06/22/47 | | | 3,000 | | | | 2,229 | |
Brixmor Operating Partnership LP | | | | | | | | |
3.90% 03/15/27 | | | 18,000 | | | | 17,062 | |
Broadcom Corp./Broadcom Cayman Finance Ltd. | | | | | | | | |
2.20% 01/15/21 | | | 16,000 | | | | 15,636 | |
2.65% 01/15/23 | | | 9,000 | | | | 8,341 | |
3.13% 01/15/25 | | | 12,000 | | | | 10,769 | |
3.88% 01/15/27 | | | 29,000 | | | | 26,003 | |
Brown-Forman Corp. | | | | | | | | |
4.00% 04/15/38 | | | 7,000 | | | | 6,847 | |
Buckeye Partners LP | | | | | | | | |
5.60% 10/15/44 | | | 7,000 | | | | 6,030 | |
Bunge Limited Finance Corp. | | | | | | | | |
3.75% 09/25/27 | | | 15,000 | | | | 13,336 | |
Burlington Northern Santa Fe LLC | | | | | | | | |
3.75% 04/01/24 | | | 68,000 | | | | 69,727 | |
4.15% 12/15/48 | | | 33,000 | | | | 32,209 | |
Campbell Soup Co. | | | | | | | | |
3.30% 03/15/21 | | | 60,000 | | | | 59,665 | |
Canadian Natural Resources Ltd. | | | | | | | | |
3.85% 06/01/27 | | | 5,000 | | | | 4,731 | |
4.95% 06/01/47 | | | 8,000 | | | | 7,698 | |
Capital One Financial Corp. | | | | | | | | |
3.75% 07/28/26 | | | 17,000 | | | | 15,538 | |
4.20% 10/29/25 | | | 26,000 | | | | 24,994 | |
Cardinal Health Inc. | | | | | | | | |
2.62% 06/15/22 | | | 14,000 | | | | 13,503 | |
3.08% 06/15/24 | | | 12,000 | | | | 11,335 | |
Caterpillar Financial Services Corp. | | | | | | | | |
2.55% 11/29/22 | | | 50,000 | | | | 48,547 | |
Caterpillar Inc. | | | | | | | | |
3.80% 08/15/42 | | | 8,000 | | | | 7,453 | |
Catholic Health Initiatives | | | | | | | | |
4.35% 11/01/42 | | | 24,000 | | | | 21,293 | |
CBL & Associates LP | | | | | | | | |
4.60% 10/15/24 | | | 77,000 | | | | 56,746 | |
| | | | | | | | |
| | | Principal
Amount ($) | | | Fair
Value
$ | |
CBS Corp. | | | | | | | | |
2.50% 02/15/23 | | | 30,000 | | | | 28,241 | |
2.90% 01/15/27 | | | 17,000 | | | | 15,029 | |
CCO Holdings LLC/CCO Holdings Capital Corp. | | | | | | | | |
5.00% 02/01/28 (b) | | | 90,000 | | | | 82,792 | |
Celgene Corp. | | | | | | | | |
3.45% 11/15/27 | | | 4,000 | | | | 3,641 | |
4.35% 11/15/47 | | | 5,000 | | | | 4,234 | |
4.55% 02/20/48 | | | 34,000 | | | | 29,549 | |
Cenovus Energy Inc. | | | | | | | | |
4.25% 04/15/27 | | | 17,000 | | | | 15,480 | |
4.45% 09/15/42 | | | 9,000 | | | | 6,908 | |
5.40% 06/15/47 | | | 7,000 | | | | 6,033 | |
CenterPoint Energy Inc. | | | | | | | | |
2.50% 09/01/22 | | | 74,000 | | | | 70,723 | |
3.60% 11/01/21 | | | 33,000 | | | | 32,976 | |
CenturyLink Inc. | | | | | | | | |
5.63% 04/01/25 | | | 23,000 | | | | 20,266 | |
5.80% 03/15/22 | | | 34,000 | | | | 32,653 | |
CF Industries Inc. | | | | | | | | |
7.13% 05/01/20 | | | 36,000 | | | | 37,041 | |
Charter Communications Operating LLC/Charter Communications Operating Capital | | | | | | | | |
3.58% 07/23/20 | | | 32,000 | | | | 31,960 | |
4.91% 07/23/25 | | | 42,000 | | | | 41,690 | |
5.38% 05/01/47 | | | 23,000 | | | | 20,683 | |
5.75% 04/01/48 | | | 12,000 | | | | 11,227 | |
6.38% 10/23/35 | | | 5,000 | | | | 5,121 | |
6.48% 10/23/45 | | | 9,000 | | | | 9,143 | |
Chevron Corp. | | | | | | | | |
2.42% 11/17/20 | | | 19,000 | | | | 18,826 | |
3.19% 06/24/23 | | | 28,000 | | | | 27,953 | |
Church & Dwight Company Inc. | | | | | | | | |
2.45% 08/01/22 | | | 13,000 | | | | 12,552 | |
Cigna Corp. | | | | | | | | |
4.13% 11/15/25 (b) | | | 51,000 | | | | 50,891 | |
4.38% 10/15/28 (b) | | | 20,000 | | | | 20,095 | |
4.80% 08/15/38 (b) | | | 14,000 | | | | 13,771 | |
4.90% 12/15/48 (b) | | | 16,000 | | | | 15,645 | |
Cigna Corp. | | | | | | | | |
3.20% 09/17/20 (b) | | | 56,000 | | | | 55,787 | |
3.40% 09/17/21 (b) | | | 28,000 | | | | 27,943 | |
3.75% 07/15/23 (b) | | | 31,000 | | | | 30,924 | |
Cigna Holding Co. | | | | | | | | |
3.25% 04/15/25 | | | 34,000 | | | | 32,350 | |
3.88% 10/15/47 | | | 19,000 | | | | 15,928 | |
Cimarex Energy Co. | | | | | | | | |
3.90% 05/15/27 | | | 5,000 | | | | 4,660 | |
Cinemark USA Inc. | | | | | | | | |
4.88% 06/01/23 | | | 42,000 | | | | 40,320 | |
See Notes to Schedules of Investments and Notes to Financial Statements.
| | |
| 32 | | Elfun Diversified Fund |
Elfun Diversified Fund
Schedule of Investments, continued — December 31, 2018
| | | | | | | | |
| | | Principal
Amount ($) | | | Fair
Value
$ | |
| | | | | | | | |
Cisco Systems Inc. | | | | | | | | |
5.90% 02/15/39 | | | 20,000 | | | | 24,713 | |
Citigroup Inc. | | | | | | | | |
2.70% 10/27/22 | | | 36,000 | | | | 34,694 | |
2.75% 04/25/22 | | | 109,000 | | | | 105,841 | |
2.90% 12/08/21 | | | 44,000 | | | | 43,211 | |
4.40% 06/10/25 | | | 16,000 | | | | 15,720 | |
4.45% 09/29/27 | | | 37,000 | | | | 35,665 | |
4.65% 07/23/48 | | | 53,000 | | | | 51,823 | |
4.75% 05/18/46 | | | 22,000 | | | | 20,400 | |
Citigroup Inc.
(2.88% fixed rate until 07/24/22; 0.95% + 3 month USD LIBOR thereafter) | | | | | | | | |
2.88% 07/24/23 (i) | | | 147,000 | | | | 142,115 | |
Citigroup Inc.
(3.88% fixed rate until 01/24/38; 1.17% + 3 month USD LIBOR thereafter) | | | | | | | | |
3.88% 01/24/39 (i) | | | 17,000 | | | | 15,200 | |
Citigroup Inc.
(4.28% fixed rate until 04/24/47; 1.84% + 3 month USD LIBOR thereafter) | | | | | | | | |
4.28% 04/24/48 (i) | | | 30,000 | | | | 27,989 | |
CME Group Inc. | | | | | | | | |
3.75% 06/15/28 | | | 25,000 | | | | 25,323 | |
CMS Energy Corp. | | | | | | | | |
4.88% 03/01/44 | | | 45,000 | | | | 47,340 | |
CNA Financial Corp. | | | | | | | | |
3.45% 08/15/27 | | | 17,000 | | | | 15,812 | |
5.88% 08/15/20 | | | 56,000 | | | | 58,074 | |
CNH Industrial Capital LLC | | | | | | | | |
3.38% 07/15/19 | | | 29,000 | | | | 28,922 | |
4.38% 11/06/20 | | | 23,000 | | | | 23,127 | |
4.88% 04/01/21 | | | 28,000 | | | | 28,232 | |
CNH Industrial N.V. | | | | | | | | |
4.50% 08/15/23 | | | 43,000 | | | | 43,283 | |
Columbia Pipeline Group Inc. | | | | | | | | |
3.30% 06/01/20 | | | 26,000 | | | | 25,917 | |
Comcast Corp. | | | | | | | | |
3.38% 08/15/25 | | | 14,000 | | | | 13,642 | |
3.97% 11/01/47 | | | 80,000 | | | | 71,831 | |
4.15% 10/15/28 | | | 85,000 | | | | 86,277 | |
4.20% 08/15/34 | | | 29,000 | | | | 28,002 | |
4.25% 10/15/30 | | | 31,000 | | | | 31,336 | |
4.60% 08/15/45 | | | 20,000 | | | | 19,741 | |
4.70% 10/15/48 | | | 18,000 | | | | 18,214 | |
Conagra Brands Inc. | | | | | | | | |
3.80% 10/22/21 | | | 58,000 | | | | 58,001 | |
4.30% 05/01/24 | | | 72,000 | | | | 71,628 | |
5.30% 11/01/38 | | | 17,000 | | | | 16,101 | |
5.40% 11/01/48 | | | 29,000 | | | | 26,741 | |
| | | | | | | | |
| | | Principal
Amount ($) | | | Fair
Value
$ | |
Conagra Brands Inc.
0.75% + 3 month USD LIBOR | | | | | | | | |
3.22% 10/22/20 (i) | | | 43,000 | | | | 42,779 | |
Concho Resources Inc. | | | | | | | | |
3.75% 10/01/27 | | | 5,000 | | | | 4,713 | |
4.30% 08/15/28 | | | 45,000 | | | | 44,025 | |
4.88% 10/01/47 | | | 10,000 | | | | 9,542 | |
ConocoPhillips Co. | | | | | | | | |
4.30% 11/15/44 | | | 33,000 | | | | 32,547 | |
Consolidated Edison Company of New York Inc. | | | | | | | | |
2.90% 12/01/26 | | | 40,000 | | | | 37,581 | |
3.88% 06/15/47 | | | 20,000 | | | | 18,331 | |
Constellation Brands Inc. | | | | | | | | |
2.70% 05/09/22 | | | 35,000 | | | | 33,796 | |
4.50% 05/09/47 | | | 7,000 | | | | 6,272 | |
Continental Resources Inc. | | | | | | | | |
4.50% 04/15/23 | | | 26,000 | | | | 25,523 | |
Corning Inc. | | | | | | | | |
4.38% 11/15/57 | | | 17,000 | | | | 14,267 | |
Corporation Andina de Fomento | | | | | | | | |
2.20% 07/18/20 | | | 44,000 | | | | 43,331 | |
4.38% 06/15/22 | | | 121,000 | | | | 125,426 | |
Crane Co. | | | | | | | | |
4.20% 03/15/48 | | | 8,000 | | | | 7,407 | |
CSX Corp. | | | | | | | | |
4.50% 08/01/54 | | | 23,000 | | | | 21,778 | |
CVS Health Corp. | | | | | | | | |
3.13% 03/09/20 | | | 156,000 | | | | 155,694 | |
3.35% 03/09/21 | | | 101,000 | | | | 100,695 | |
3.70% 03/09/23 | | | 41,000 | | | | 40,597 | |
3.88% 07/20/25 | | | 20,000 | | | | 19,504 | |
4.10% 03/25/25 | | | 41,000 | | | | 40,581 | |
4.30% 03/25/28 | | | 21,000 | | | | 20,552 | |
4.78% 03/25/38 | | | 40,000 | | | | 38,444 | |
5.00% 12/01/24 | | | 39,000 | | | | 40,611 | |
5.05% 03/25/48 | | | 40,000 | | | | 39,025 | |
D.R. Horton Inc. | | | | | | | | |
2.55% 12/01/20 | | | 47,000 | | | | 45,802 | |
Dana Financing Luxembourg Sarl | | | | | | | | |
6.50% 06/01/26 (b) | | | 56,000 | | | | 53,782 | |
Dell International LLC/EMC Corp. | | | | | | | | |
3.48% 06/01/19 (b) | | | 64,000 | | | | 63,848 | |
5.45% 06/15/23 (b) | | | 28,000 | | | | 28,532 | |
6.02% 06/15/26 (b) | | | 11,000 | | | | 11,052 | |
8.10% 07/15/36 (b) | | | 4,000 | | | | 4,327 | |
8.35% 07/15/46 (b) | | | 7,000 | | | | 7,584 | |
Deutsche Bank AG | | | | | | | | |
2.70% 07/13/20 | | | 43,000 | | | | 41,705 | |
See Notes to Schedules of Investments and Notes to Financial Statements.
| | | | |
| Elfun Diversified Fund | | | 33 | |
Elfun Diversified Fund
Schedule of Investments, continued — December 31, 2018
| | | | | | | | |
| | | Principal
Amount ($) | | | Fair
Value
$ | |
| | | | | | | | |
Deutsche Telekom International Finance BV | | | | | | | | |
2.49% 09/19/23 (b) | | | 150,000 | | | | 141,618 | |
Devon Energy Corp. | | | | | | | | |
4.00% 07/15/21 | | | 64,000 | | | | 64,140 | |
5.00% 06/15/45 | | | 10,000 | | | | 8,844 | |
Dexia Credit Local S.A. | | | | | | | | |
2.25% 01/30/19 (b) | | | 250,000 | | | | 249,930 | |
Diageo Investment Corp. | | | | | | | | |
2.88% 05/11/22 | | | 36,000 | | | | 35,591 | |
Diamondback Energy Inc. | | | | | | | | |
4.75% 11/01/24 (b) | | | 65,000 | | | | 62,744 | |
Discovery Communications LLC | | | | | | | | |
2.20% 09/20/19 | | | 45,000 | | | | 44,599 | |
3.95% 03/20/28 | | | 34,000 | | | | 31,513 | |
5.00% 09/20/37 | | | 12,000 | | | | 11,084 | |
5.20% 09/20/47 | | | 8,000 | | | | 7,368 | |
DISH DBS Corp. | | | | | | | | |
5.88% 07/15/22 | | | 32,000 | | | | 29,311 | |
Dollar Tree Inc. | | | | | | | | |
3.70% 05/15/23 | | | 41,000 | | | | 40,182 | |
4.00% 05/15/25 | | | 41,000 | | | | 39,407 | |
Dominion Energy Inc. | | | | | | | | |
2.58% 07/01/20 | | | 30,000 | | | | 29,549 | |
DowDuPont Inc. | | | | | | | | |
3.77% 11/15/20 | | | 109,000 | | | | 110,006 | |
5.32% 11/15/38 | | | 27,000 | | | | 27,842 | |
5.42% 11/15/48 | | | 27,000 | | | | 28,118 | |
DTE Energy Co. | | | | | | | | |
2.85% 10/01/26 | | | 50,000 | | | | 46,015 | |
3.85% 12/01/23 | | | 22,000 | | | | 22,112 | |
Duke Energy Carolinas LLC | | | | | | | | |
3.95% 03/15/48 | | | 22,000 | | | | 21,046 | |
Duke Energy Corp. | | | | | | | | |
1.80% 09/01/21 | | | 46,000 | | | | 43,959 | |
3.55% 09/15/21 | | | 28,000 | | | | 28,076 | |
3.75% 09/01/46 | | | 6,000 | | | | 5,216 | |
Duke Energy Progress LLC | | | | | | | | |
4.15% 12/01/44 | | | 26,000 | | | | 25,361 | |
Duke Realty LP | | | | | | | | |
3.25% 06/30/26 | | | 24,000 | | | | 22,802 | |
3.38% 12/15/27 | | | 15,000 | | | | 14,236 | |
Duquesne Light Holdings Inc. | | | | | | | | |
3.62% 08/01/27 (b) | | | 39,000 | | | | 36,705 | |
Eastman Chemical Co. | | | | | | | | |
3.50% 12/01/21 | | | 34,000 | | | | 34,162 | |
3.60% 08/15/22 | | | 9,000 | | | | 8,992 | |
4.50% 01/15/21 | | | 60,000 | | | | 60,854 | |
Eaton Corp. | | | | | | | | |
3.10% 09/15/27 | | | 29,000 | | | | 27,361 | |
Ecolab Inc. | | | | | | | | |
3.25% 12/01/27 | | | 16,000 | | | | 15,377 | |
3.95% 12/01/47 | | | 13,000 | | | | 12,208 | |
| | | | | | | | |
| | | Principal
Amount ($) | | | Fair
Value
$ | |
Ecopetrol S.A. | | | | | | | | |
5.88% 05/28/45 | | | 28,000 | | | | 26,425 | |
Edison International | | | | | | | | |
4.13% 03/15/28 | | | 25,000 | | | | 23,706 | |
EI du Pont de Nemours & Co. 0.53% + 3 month USD LIBOR | | | | | | | | |
3.07% 05/01/20 (i) | | | 39,000 | | | | 39,037 | |
Electricite de France S.A. | | | | | | | | |
2.15% 01/22/19 (b) | | | 100,000 | | | | 99,931 | |
Eli Lilly & Co. | | | | | | | | |
3.70% 03/01/45 | | | 6,000 | | | | 5,646 | |
EMC Corp. | | | | | | | | |
2.65% 06/01/20 | | | 100,000 | | | | 96,032 | |
Emera US Finance LP | | | | | | | | |
4.75% 06/15/46 | | | 8,000 | | | | 7,691 | |
Enbridge Energy Partners LP | | | | | | | | |
5.50% 09/15/40 | | | 8,000 | | | | 8,219 | |
Encana Corp. | | | | | | | | |
3.90% 11/15/21 | | | 41,000 | | | | 40,989 | |
Energy Transfer LP | | | | | | | | |
4.25% 03/15/23 | | | 27,000 | | | | 26,038 | |
5.88% 01/15/24 | | | 252,000 | | | | 256,808 | |
7.50% 10/15/20 | | | 47,000 | | | | 49,115 | |
Energy Transfer Operating LP | | | | | | | | |
4.95% 06/15/28 | | | 12,000 | | | | 11,771 | |
Energy Transfer Operating LP | | | | | | | | |
5.80% 06/15/38 | | | 23,000 | | | | 22,266 | |
6.13% 12/15/45 | | | 9,000 | | | | 8,726 | |
6.50% 02/01/42 | | | 24,000 | | | | 24,202 | |
Energy Transfer Partners LP/Regency Energy Finance Corp. | | | | | | | | |
4.50% 11/01/23 | | | 25,000 | | | | 24,938 | |
EnLink Midstream Partners LP | | | | | | | | |
4.15% 06/01/25 | | | 44,000 | | | | 39,601 | |
Entergy Louisiana LLC | | | | | | | | |
3.05% 06/01/31 | | | 23,000 | | | | 20,752 | |
4.00% 03/15/33 | | | 16,000 | | | | 16,122 | |
Enterprise Products Operating LLC | | | | | | | | |
4.25% 02/15/48 | | | 56,000 | | | | 50,103 | |
Enterprise Products Operating LLC (5.25% fixed rate until 08/16/27; 3.03% + 3 month USD LIBOR thereafter) | | | | | | | | |
5.25% 08/16/77 (i) | | | 13,000 | | | | 10,835 | |
EOG Resources Inc. | | | | | | | | |
4.10% 02/01/21 | | | 52,000 | | | | 52,697 | |
4.15% 01/15/26 | | | 31,000 | | | | 31,618 | |
EPR Properties | | | | | | | | |
4.95% 04/15/28 | | | 24,000 | | | | 23,760 | |
See Notes to Schedules of Investments and Notes to Financial Statements.
| | |
| 34 | | Elfun Diversified Fund |
Elfun Diversified Fund
Schedule of Investments, continued — December 31, 2018
| | | | | | | | |
| | | Principal
Amount ($) | | | Fair
Value
$ | |
| | | | | | | | |
EQM Midstream Partners LP | | | | | | | | |
4.75% 07/15/23 | | | 9,000 | | | | 8,953 | |
5.50% 07/15/28 | | | 9,000 | | | | 8,840 | |
EQT Corp. | | | | | | | | |
3.90% 10/01/27 | | | 17,000 | | | | 14,701 | |
ERP Operating LP | | | | | | | | |
4.50% 07/01/44 | | | 15,000 | | | | 15,094 | |
Exelon Corp. | | | | | | | | |
3.50% 06/01/22 | | | 29,000 | | | | 28,339 | |
4.45% 04/15/46 | | | 39,000 | | | | 37,144 | |
Express Scripts Holding Co. | | | | | | | | |
3.40% 03/01/27 | | | 21,000 | | | | 19,485 | |
Exxon Mobil Corp. | | | | | | | | |
2.22% 03/01/21 | | | 25,000 | | | | 24,683 | |
FedEx Corp. | | | | | | | | |
4.10% 02/01/45 | | | 45,000 | | | | 38,659 | |
FirstEnergy Corp. | | | | | | | | |
3.90% 07/15/27 | | | 8,000 | | | | 7,749 | |
4.85% 07/15/47 | | | 15,000 | | | | 14,945 | |
Florida Power & Light Co. | | | | | | | | |
4.13% 02/01/42 | | | 23,000 | | | | 23,142 | |
Ford Motor Co. | | | | | | | | |
4.35% 12/08/26 | | | 59,000 | | | | 52,655 | |
Frontier Communications Corp. | | | | | | | | |
7.13% 03/15/19 | | | 46,000 | | | | 44,524 | |
General Dynamics Corp. | | | | | | | | |
2.13% 08/15/26 | | | 37,000 | | | | 33,385 | |
2.88% 05/11/20 | | | 55,000 | | | | 55,038 | |
3.00% 05/11/21 | | | 76,000 | | | | 76,077 | |
3.50% 05/15/25 | | | 45,000 | | | | 45,074 | |
General Mills Inc. | | | | | | | | |
3.20% 04/16/21 | | | 25,000 | | | | 24,861 | |
3.70% 10/17/23 | | | 39,000 | | | | 38,819 | |
4.55% 04/17/38 | | | 30,000 | | | | 27,458 | |
4.70% 04/17/48 | | | 23,000 | | | | 20,933 | |
General Motors Co. | | | | | | | | |
5.20% 04/01/45 | | | 7,000 | | | | 5,804 | |
5.40% 04/01/48 | | | 14,000 | | | | 12,278 | |
General Motors Financial Company Inc. | | | | | | | | |
2.35% 10/04/19 | | | 55,000 | | | | 54,397 | |
3.15% 01/15/20 | | | 56,000 | | | | 55,642 | |
3.20% 07/13/20 | | | 101,000 | | | | 99,964 | |
3.45% 01/14/22 | | | 68,000 | | | | 65,808 | |
3.55% 04/09/21 | | | 74,000 | | | | 73,081 | |
5.25% 03/01/26 | | | 60,000 | | | | 58,892 | |
Georgia-Pacific LLC | | | | | | | | |
3.60% 03/01/25(b) | | | 9,000 | | | | 8,998 | |
Gilead Sciences Inc. | | | | | | | | |
2.95% 03/01/27 | | | 7,000 | | | | 6,507 | |
3.50% 02/01/25 | | | 20,000 | | | | 19,537 | |
3.65% 03/01/26 | | | 20,000 | | | | 19,629 | |
| | | | | | | | |
| | | Principal
Amount ($) | | | Fair
Value
$ | |
4.15% 03/01/47 | | | 42,000 | | | | 38,564 | |
4.80% 04/01/44 | | | 14,000 | | | | 13,978 | |
GlaxoSmithKline Capital Inc. | | | | | | | | |
3.38% 05/15/23 | | | 45,000 | | | | 45,225 | |
3.63% 05/15/25 | | | 45,000 | | | | 45,257 | |
GlaxoSmithKline Capital PLC | | | | | | | | |
3.13% 05/14/21 | | | 38,000 | | | | 38,049 | |
Glencore Finance Canada Ltd. | | | | | | | | |
4.95% 11/15/21(b) | | | 22,000 | | | | 22,552 | |
Glencore Funding LLC | | | | | | | | |
2.50% 01/15/19(b) | | | 99,000 | | | | 98,969 | |
Gray Escrow Inc. | | | | | | | | |
7.00% 05/15/27(b) | | | 23,000 | | | | 22,392 | |
H&E Equipment Services Inc. | | | | | | | | |
5.63% 09/01/25 | | | 68,000 | | | | 62,310 | |
Halliburton Co. | | | | | | | | |
3.80% 11/15/25 | | | 28,000 | | | | 27,150 | |
5.00% 11/15/45 | | | 16,000 | | | | 15,701 | |
HCA Inc. | | | | | | | | |
4.75% 05/01/23 | | | 122,000 | | | | 120,148 | |
HD Supply Inc. | | | | | | | | |
5.38% 10/15/26(b) | | | 23,000 | | | | 22,310 | |
Hess Corp. | | | | | | | | |
5.60% 02/15/41 | | | 7,000 | | | | 6,161 | |
5.80% 04/01/47 | | | 6,000 | | | | 5,393 | |
Hewlett Packard Enterprise Co. | | | | | | | | |
6.35% 10/15/45 | | | 7,000 | | | | 6,551 | |
Highwoods Realty LP | | | | | | | | |
4.13% 03/15/28 | | | 21,000 | | | | 20,606 | |
Hilcorp Energy I LP/Hilcorp Finance Co. | | | | | | | | |
5.75% 10/01/25 (b) | | | 70,000 | | | | 62,375 | |
6.25% 11/01/28 (b) | | | 20,000 | | | | 17,585 | |
HSBC Holdings PLC (6.50% fixed rate until 03/23/28; 3.61% + USD 5 yearMid-Market Swap Rate thereafter) | | | | | | | | |
6.50% 12/31/99 (i) | | | 50,000 | | | | 45,815 | |
Hughes Satellite Systems Corp. | | | | | | | | |
6.63% 08/01/26 | | | 23,000 | | | | 21,130 | |
Hyundai Capital America
3.10% 04/05/22 (b) | | | 18,000 | | | | 17,586 | |
Icahn Enterprises LP/Icahn Enterprises Finance Corp.
6.00% 08/01/20 | | | 79,000 | | | | 78,876 | |
Ingersoll-Rand Luxembourg Finance S.A.
3.55% 11/01/24 | | | 41,000 | | | | 40,610 | |
Intel Corp. | | | | | | | | |
2.60% 05/19/26 | | | 58,000 | | | | 54,457 | |
2.88% 05/11/24 | | | 29,000 | | | | 28,284 | |
See Notes to Schedules of Investments and Notes to Financial Statements.
| | | | |
| Elfun Diversified Fund | | | 35 | |
Elfun Diversified Fund
Schedule of Investments, continued — December 31, 2018
| | | | | | | | |
| | | Principal
Amount ($) | | | Fair
Value
$ | |
| | | | | | | | |
International Paper Co.
4.40% 08/15/47 | | | 31,000 | | | | 26,269 | |
Interstate Power & Light Co.
3.40% 08/15/25 | | | 135,000 | | | | 130,823 | |
j2 Cloud Services LLC/j2 GlobalCo-Obligor Inc.
6.00% 07/15/25 (b) | | | 32,000 | | | | 31,347 | |
Jabil Inc.
3.95% 01/12/28 | | | 35,000 | | | | 31,072 | |
JBS USA LUX S.A./JBS USA Finance Inc.
6.75% 02/15/28 (b) | | | 44,000 | | | | 42,982 | |
Jefferies Group LLC | | | | | | | | |
5.13% 01/20/23 | | | 57,000 | | | | 58,523 | |
6.50% 01/20/43 | | | 26,000 | | | | 25,433 | |
Johnson & Johnson
3.63% 03/03/37 | | | 21,000 | | | | 20,187 | |
Johnson Controls International PLC
4.50% 02/15/47 | | | 8,000 | | | | 7,370 | |
JPMorgan Chase & Co. | | | | | | | | |
2.30% 08/15/21 | | | 92,000 | | | | 89,595 | |
2.55% 10/29/20 | | | 92,000 | | | | 90,928 | |
3.13% 01/23/25 | | | 46,000 | | | | 43,850 | |
3.30% 04/01/26 | | | 61,000 | | | | 58,045 | |
3.63% 12/01/27 | | | 20,000 | | | | 18,654 | |
JPMorgan Chase & Co.
(3.51% fixed rate until 01/23/28; 0.95% + 3 month USD LIBOR thereafter)
3.51% 01/23/29 (i) | | | 38,000 | | | | 35,814 | |
JPMorgan Chase & Co.
(3.88% fixed rate until 07/24/37; 1.36% + 3 month USD LIBOR thereafter)
3.88% 07/24/38 (i) | | | 55,000 | | | | 49,784 | |
JPMorgan Chase & Co.
(3.90% fixed rate until 01/23/48; 1.22% + 3 month USD LIBOR thereafter)
3.90% 01/23/49 (i) | | | 16,000 | | | | 14,052 | |
JPMorgan Chase & Co.
(4.01% fixed rate until 04/23/28; 1.12% + 3 month USD LIBOR thereafter)
4.01% 04/23/29 (i) | | | 37,000 | | | | 36,300 | |
JPMorgan Chase & Co.
(4.03% fixed rate until 07/24/47; 1.46% + 3 month USD LIBOR thereafter)
4.03% 07/24/48 (i) | | | 23,000 | | | | 20,621 | |
| | | | | | | | |
| | | Principal
Amount ($) | | | Fair
Value
$ | |
JPMorgan Chase & Co.
(4.63% fixed rate until 11/01/22; 2.58% + 3 month USD LIBOR thereafter)
4.63% 12/31/99 (i) | | | 40,000 | | | | 34,238 | |
JPMorgan Chase & Co.
(6.10% fixed rate until 10/01/24; 3.33% + 3 month USD LIBOR thereafter)
6.10% 10/29/49 (i) | | | 97,000 | | | | 96,284 | |
JPMorgan Chase & Co.
3.47% + 3 month USD LIBOR
5.99% 12/29/49 (i) | | | 32,000 | | | | 31,602 | |
Keurig Dr Pepper Inc. | | | | | | | | |
3.55% 05/25/21 (b) | | | 162,000 | | | | 161,780 | |
4.06% 05/25/23 (b) | | | 45,000 | | | | 44,865 | |
4.50% 11/15/45 | | | 17,000 | | | | 14,936 | |
4.60% 05/25/28 (b) | | | 45,000 | | | | 44,847 | |
Kimberly-Clark Corp.
3.95% 11/01/28 | | | 68,000 | | | | 69,937 | |
Kinder Morgan Energy Partners LP | | | | | | | | |
3.50% 03/01/21 | | | 78,000 | | | | 77,739 | |
4.70% 11/01/42 | | | 7,000 | | | | 6,206 | |
5.30% 09/15/20 | | | 26,000 | | | | 26,725 | |
6.38% 03/01/41 | | | 14,000 | | | | 14,917 | |
Kinder Morgan Inc. | | | | | | | | |
3.05% 12/01/19 | | | 16,000 | | | | 15,906 | |
4.30% 03/01/28 | | | 30,000 | | | | 29,389 | |
5.05% 02/15/46 | | | 14,000 | | | | 13,017 | |
5.55% 06/01/45 | | | 19,000 | | | | 18,929 | |
Kraft Heinz Foods Co.
4.38% 06/01/46 | | | 26,000 | | | | 21,512 | |
Kreditanstalt fuer Wiederaufbau
2.00% 10/04/22 | | | 46,000 | | | | 44,945 | |
L Brands Inc.
5.25% 02/01/28 | | | 66,000 | | | | 56,413 | |
L3 Technologies Inc.
3.85% 12/15/26 | | | 34,000 | | | | 32,883 | |
Lamb Weston Holdings Inc.
4.63% 11/01/24 (b) | | | 85,000 | | | | 82,849 | |
Lee Enterprises Inc.
9.50% 03/15/22 (b) | | | 46,000 | | | | 46,850 | |
Lennar Corp.
4.75% 05/30/25 - 11/29/27 | | | 108,000 | | | | 99,390 | |
Lincoln National Corp. | | | | | | | | |
3.63% 12/12/26 | | | 44,000 | | | | 42,411 | |
3.80% 03/01/28 | | | 25,000 | | | | 24,084 | |
4.35% 03/01/48 | | | 20,000 | | | | 18,180 | |
Lockheed Martin Corp. | | | | | | | | |
3.55% 01/15/26 | | | 23,000 | | | | 22,795 | |
See Notes to Schedules of Investments and Notes to Financial Statements.
| | |
| 36 | | Elfun Diversified Fund |
Elfun Diversified Fund
Schedule of Investments, continued — December 31, 2018
| | | | | | | | |
| | | Principal
Amount ($) | | | Fair
Value
$ | |
| | | | | | | | |
3.80% 03/01/45 | | | 8,000 | | | | 7,327 | |
Lowe’s Companies Inc.
3.70% 04/15/46 | | | 7,000 | | | | 5,716 | |
LYB International Finance BV
4.88% 03/15/44 | | | 7,000 | | | | 6,369 | |
LYB International Finance II BV
3.50% 03/02/27 | | | 9,000 | | | | 8,217 | |
Macy’s Retail Holdings Inc.
4.30% 02/15/43 | | | 7,000 | | | | 5,169 | |
Marathon Oil Corp. | | | | | | | | |
2.70% 06/01/20 | | | 56,000 | | | | 55,083 | |
3.85% 06/01/25 | | | 16,000 | | | | 15,002 | |
Marsh & McLennan Companies Inc.
3.50% 03/10/25 | | | 34,000 | | | | 33,246 | |
Masco Corp.
3.50% 11/15/27 | | | 7,000 | | | | 6,445 | |
McDonald’s Corp. | | | | | | | | |
3.70% 01/30/26 | | | 35,000 | | | | 34,382 | |
3.80% 04/01/28 | | | 34,000 | | | | 33,330 | |
4.88% 12/09/45 | | | 14,000 | | | | 14,111 | |
McKesson Corp.
3.65% 11/30/20 | | | 136,000 | | | | 136,556 | |
Medtronic Inc. | | | | | | | | |
2.50% 03/15/20 | | | 58,000 | | | | 57,750 | |
4.63% 03/15/45 | | | 45,000 | | | | 47,316 | |
Memorial Sloan-Kettering Cancer Center
4.13% 07/01/52 | | | 24,000 | | | | 23,811 | |
Merck & Company Inc.
2.75% 02/10/25 | | | 67,000 | | | | 64,832 | |
MetLife Inc. | | | | | | | | |
4.05% 03/01/45 | | | 8,000 | | | | 7,389 | |
4.72% 12/15/44 | | | 24,000 | | | | 24,493 | |
MGM Resorts International
4.63% 09/01/26 | | | 37,000 | | | | 33,253 | |
Microsoft Corp. | | | | | | | | |
2.40% 08/08/26 | | | 39,000 | | | | 36,379 | |
3.45% 08/08/36 | | | 16,000 | | | | 15,192 | |
3.50% 02/12/35 | | | 22,000 | | | | 21,126 | |
3.70% 08/08/46 | | | 73,000 | | | | 70,086 | |
4.00% 02/12/55 | | | 31,000 | | | | 30,527 | |
4.10% 02/06/37 | | | 6,000 | | | | 6,164 | |
4.50% 02/06/57 | | | 7,000 | | | | 7,535 | |
Mizuho Financial Group Inc.
2.63% 04/12/21 (b) | | | 200,000 | | | | 196,420 | |
Molina Healthcare Inc.
4.88% 06/15/25 (b) | | | 53,000 | | | | 48,407 | |
Molson Coors Brewing Co. | | | | | | | | |
2.10% 07/15/21 | | | 60,000 | | | | 57,805 | |
4.20% 07/15/46 | | | 9,000 | | | | 7,479 | |
| | | | | | | | |
| | | Principal
Amount ($) | | | Fair
Value
$ | |
Morgan Stanley | | | | | | | | |
2.45% 02/01/19 | | | 138,000 | | | | 137,920 | |
2.63% 11/17/21 | | | 78,000 | | | | 76,069 | |
2.65% 01/27/20 | | | 44,000 | | | | 43,691 | |
2.75% 05/19/22 | | | 109,000 | | | | 105,944 | |
3.63% 01/20/27 | | | 5,000 | | | | 4,754 | |
3.70% 10/23/24 | | | 17,000 | | | | 16,735 | |
3.95% 04/23/27 | | | 131,000 | | | | 123,363 | |
4.10% 05/22/23 | | | 206,000 | | | | 206,466 | |
4.38% 01/22/47 | | | 38,000 | | | | 35,992 | |
Morgan Stanley
(3.97% fixed rate until 07/22/37; 1.46% + 3 month USD LIBOR thereafter)
3.97% 07/22/38 (i) | | | 18,000 | | | | 16,413 | |
MPLX LP | | | | | | | | |
3.38% 03/15/23 | | | 21,000 | | | | 20,397 | |
4.50% 04/15/38 | | | 22,000 | | | | 19,321 | |
4.70% 04/15/48 | | | 19,000 | | | | 16,409 | |
5.50% 02/15/49 | | | 34,000 | | | | 32,952 | |
Murphy Oil Corp.
5.75% 08/15/25 | | | 169,000 | | | | 158,465 | |
Mylan Inc. | | | | | | | | |
4.55% 04/15/28 (b) | | | 13,000 | | | | 12,120 | |
5.20% 04/15/48 (b) | | | 17,000 | | | | 14,472 | |
Mylan N.V. | | | | | | | | |
3.15% 06/15/21 | | | 20,000 | | | | 19,603 | |
3.95% 06/15/26 | | | 13,000 | | | | 11,731 | |
National Retail Properties Inc.
4.00% 11/15/25 | | | 34,000 | | | | 33,684 | |
Navient Corp. | | | | | | | | |
6.75% 06/15/26 | | | 40,000 | | | | 33,203 | |
8.00% 03/25/20 | | | 39,000 | | | | 39,665 | |
Newell Brands Inc. | | | | | | | | |
3.85% 04/01/23 | | | 5,000 | | | | 4,935 | |
4.20% 04/01/26 | | | 5,000 | | | | 4,861 | |
Newfield Exploration Co. | | | | | | | | |
5.38% 01/01/26 | | | 65,000 | | | | 64,338 | |
5.75% 01/30/22 | | | 73,000 | | | | 74,095 | |
Newmark Group Inc.
6.13% 11/15/23 (b) | | | 15,000 | | | | 14,406 | |
Newmont Mining Corp.
4.88% 03/15/42 | | | 27,000 | | | | 25,528 | |
Nexen Energy ULC
6.40% 05/15/37 | | | 8,000 | | | | 9,795 | |
NGPL PipeCo LLC
4.88% 08/15/27 (b) | | | 53,000 | | | | 50,285 | |
Noble Energy Inc. | | | | | | | | |
3.90% 11/15/24 | | | 25,000 | | | | 24,117 | |
5.05% 11/15/44 | | | 8,000 | | | | 6,966 | |
Nordstrom Inc.
5.00% 01/15/44 | | | 2,000 | | | | 1,719 | |
See Notes to Schedules of Investments and Notes to Financial Statements.
| | | | |
| Elfun Diversified Fund | | | 37 | |
Elfun Diversified Fund
Schedule of Investments, continued — December 31, 2018
| | | | | | | | |
| | | Principal
Amount ($) | | | Fair
Value
$ | |
| | | | | | | | |
Norfolk Southern Corp.
3.95% 10/01/42 | | | 24,000 | | | | 21,974 | |
Northern States Power Co.
2.20% 08/15/20 | | | 94,000 | | | | 92,708 | |
Northrop Grumman Corp. | | | | | | | | |
2.08% 10/15/20 | | | 16,000 | | | | 15,699 | |
2.55% 10/15/22 | | | 14,000 | | | | 13,559 | |
3.25% 01/15/28 | | | 23,000 | | | | 21,489 | |
3.85% 04/15/45 | | | 5,000 | | | | 4,412 | |
4.03% 10/15/47 | | | 17,000 | | | | 15,447 | |
Novartis Capital Corp.
3.00% 11/20/25 | | | 6,000 | | | | 5,816 | |
Nucor Corp. | | | | | | | | |
3.95% 05/01/28 | | | 41,000 | | | | 40,582 | |
4.13% 09/15/22 | | | 18,000 | | | | 18,530 | |
Nutrien Ltd. | | | | | | | | |
4.00% 12/15/26 | | | 15,000 | | | | 14,514 | |
4.90% 06/01/43 | | | 16,000 | | | | 15,346 | |
Occidental Petroleum Corp. | | | | | | | | |
4.10% 02/15/47 | | | 13,000 | | | | 12,229 | |
4.20% 03/15/48 | | | 14,000 | | | | 13,369 | |
Olin Corp.
5.00% 02/01/30 | | | 65,000 | | | | 56,855 | |
Omnicom Group Inc./Omnicom Capital Inc.
3.63% 05/01/22 | | | 23,000 | | | | 22,691 | |
Oncor Electric Delivery Company LLC
3.80% 09/30/47 | | | 8,000 | | | | 7,539 | |
Oracle Corp. | | | | | | | | |
2.40% 09/15/23 | | | 20,000 | | | | 19,199 | |
3.25% 11/15/27 | | | 32,000 | | | | 30,862 | |
3.80% 11/15/37 | | | 10,000 | | | | 9,343 | |
4.00% 07/15/46 - 11/15/47 | | | 57,000 | | | | 53,099 | |
Oshkosh Corp.
5.38% 03/01/25 | | | 28,000 | | | | 28,154 | |
Owens Corning
4.40% 01/30/48 | | | 12,000 | | | | 9,188 | |
Owens-Brockway Glass Container Inc.
6.38% 08/15/25 (b) | | | 50,000 | | | | 49,561 | |
Pacific Gas & Electric Co.
3.40% 08/15/24 | | | 124,000 | | | | 108,037 | |
PacifiCorp
6.25% 10/15/37 | | | 45,000 | | | | 55,900 | |
Packaging Corporation of America
3.40% 12/15/27 | | | 34,000 | | | | 31,789 | |
Parker-Hannifin Corp.
3.25% 03/01/27 | | | 69,000 | | | | 66,103 | |
Party City Holdings Inc.
6.63% 08/01/26 (b) | | | 50,000 | | | | 45,472 | |
| | | | | | | | |
| | | Principal
Amount ($) | | | Fair
Value
$ | |
Penske Automotive Group Inc.
5.38% 12/01/24 | | | 50,000 | | | | 46,820 | |
PepsiCo Inc.
3.45% 10/06/46 | | | 9,000 | | | | 8,055 | |
Petroleos Mexicanos | | | | | | | | |
4.50% 01/23/26 | | | 45,000 | | | | 38,944 | |
5.35% 02/12/28 | | | 15,000 | | | | 13,124 | |
5.38% 03/13/22 | | | 50,000 | | | | 49,174 | |
5.63% 01/23/46 | | | 19,000 | | | | 14,394 | |
6.35% 02/12/48 | | | 15,000 | | | | 11,983 | |
6.38% 01/23/45 | | | 25,000 | | | | 20,215 | |
6.50% 03/13/27 | | | 40,000 | | | | 37,692 | |
6.75% 09/21/47 | | | 40,000 | | | | 33,146 | |
Pfizer Inc. | | | | | | | | |
3.00% 12/15/26 | | | 39,000 | | | | 37,643 | |
3.20% 09/15/23 | | | 31,000 | | | | 31,080 | |
3.60% 09/15/28 | | | 51,000 | | | | 51,189 | |
4.13% 12/15/46 | | | 13,000 | | | | 13,048 | |
4.40% 05/15/44 | | | 8,000 | | | | 8,325 | |
Philip Morris International Inc.
4.13% 03/04/43 | | | 26,000 | | | | 23,099 | |
Phillips 66
3.90% 03/15/28 | | | 39,000 | | | | 37,527 | |
Phillips 66 Partners LP | | | | | | | | |
3.75% 03/01/28 | | | 32,000 | | | | 29,559 | |
4.68% 02/15/45 | | | 19,000 | | | | 16,903 | |
Pilgrim’s Pride Corp.
5.88% 09/30/27 (b) | | | 77,000 | | | | 70,195 | |
Pioneer Natural Resources Co.
3.95% 07/15/22 | | | 45,000 | | | | 45,109 | |
Plains All American Pipeline LP/PAA Finance Corp. | | | | | | | | |
4.70% 06/15/44 | | | 10,000 | | | | 8,343 | |
5.75% 01/15/20 | | | 35,000 | | | | 35,701 | |
PPL Capital Funding Inc.
3.10% 05/15/26 | | | 45,000 | | | | 42,192 | |
Precision Castparts Corp.
4.38% 06/15/45 | | | 22,000 | | | | 21,978 | |
Prudential Financial Inc.
(5.70% fixed rate until 09/15/28; 2.67% + 3 month USD LIBOR thereafter)
5.70% 09/15/48 (i) | | | 45,000 | | | | 41,417 | |
Public Service Company of Colorado
3.70% 06/15/28 | | | 47,000 | | | | 47,476 | |
Public Service Electric & Gas Co.
2.38% 05/15/23 | | | 60,000 | | | | 57,965 | |
PulteGroup Inc.
5.50% 03/01/26 | | | 60,000 | | | | 57,900 | |
QUALCOMM Inc. | | | | | | | | |
2.90% 05/20/24 | | | 14,000 | | | | 13,325 | |
See Notes to Schedules of Investments and Notes to Financial Statements.
| | |
| 38 | | Elfun Diversified Fund |
Elfun Diversified Fund
Schedule of Investments, continued — December 31, 2018
| | | | | | | | |
| | | Principal
Amount ($) | | | Fair
Value
$ | |
| | | | | | | | |
3.00% 05/20/22 | | | 11,000 | | | | 10,837 | |
3.25% 05/20/27 | | | 4,000 | | | | 3,722 | |
4.30% 05/20/47 | | | 7,000 | | | | 6,231 | |
Quicken Loans Inc.
5.25% 01/15/28 (b) | | | 46,000 | | | | 41,284 | |
Range Resources Corp.
5.00% 08/15/22 | | | 65,000 | | | | 58,196 | |
Realty Income Corp.
3.00% 01/15/27 | | | 15,000 | | | | 13,924 | |
Republic Services Inc.
3.38% 11/15/27 | | | 8,000 | | | | 7,671 | |
Reynolds American Inc.
4.45% 06/12/25 | | | 5,000 | | | | 4,809 | |
Rio Tinto Finance USA PLC
4.13% 08/21/42 | | | 13,000 | | | | 12,529 | |
Rockwell Collins Inc. | | | | | | | | |
3.50% 03/15/27 | | | 38,000 | | | | 35,768 | |
Rogers Communications Inc. | | | | | | | | |
5.00% 03/15/44 | | | 7,000 | | | | 7,274 | |
RPM International Inc. | | | | | | | | |
3.75% 03/15/27 | | | 22,000 | | | | 20,930 | |
Ryder System Inc. | | | | | | | | |
2.45% 09/03/19 | | | 110,000 | | | | 109,365 | |
Sabine Pass Liquefaction LLC | | | | | | | | |
4.20% 03/15/28 | | | 31,000 | | | | 29,496 | |
5.00% 03/15/27 | | | 8,000 | | | | 8,052 | |
salesforce.com Inc. | | | | | | | | |
3.25% 04/11/23 | | | 41,000 | | | | 41,164 | |
3.70% 04/11/28 | | | 58,000 | | | | 58,255 | |
Santander Holdings USA Inc. | | | | | | | | |
2.65% 04/17/20 | | | 78,000 | | | | 77,005 | |
3.70% 03/28/22 | | | 71,000 | | | | 69,725 | |
4.40% 07/13/27 | | | 21,000 | | | | 19,824 | |
Schlumberger Holdings Corp. | | | | | | | | |
3.00% 12/21/20 (b) | | | 32,000 | | | | 31,731 | |
3.63% 12/21/22 (b) | | | 97,000 | | | | 96,557 | |
4.00% 12/21/25 (b) | | | 49,000 | | | | 48,315 | |
Sempra Energy | | | | | | | | |
3.80% 02/01/38 | | | 12,000 | | | | 10,330 | |
4.00% 02/01/48 | | | 14,000 | | | | 11,816 | |
Shell International Finance BV | | | | | | | | |
2.38% 08/21/22 | | | 47,000 | | | | 45,664 | |
3.75% 09/12/46 | | | 13,000 | | | | 12,044 | |
4.13% 05/11/35 | | | 17,000 | | | | 16,928 | |
Shire Acquisitions Investments Ireland DAC | | | | | | | | |
2.40% 09/23/21 | | | 36,000 | | | | 34,784 | |
2.88% 09/23/23 | | | 36,000 | | | | 34,017 | |
3.20% 09/23/26 | | | 8,000 | | | | 7,292 | |
Simon Property Group LP | | | | | | | | |
3.38% 06/15/27 | | | 33,000 | | | | 31,640 | |
| | | | | | | | |
| | | Principal
Amount ($) | | | Fair
Value
$ | |
Sinclair Television Group Inc. | | | | | | | | |
5.38% 04/01/21 | | | 60,000 | | | | 59,804 | |
Sirius XM Radio Inc. | | | | | | | | |
5.00% 08/01/27 (b) | | | 23,000 | | | | 21,006 | |
Smithfield Foods Inc. | | | | | | | | |
2.70% 01/31/20 (b) | | | 16,000 | | | | 15,801 | |
4.25% 02/01/27 (b) | | | 22,000 | | | | 20,103 | |
South Carolina Electric & Gas Co. | | | | | | | | |
4.10% 06/15/46 | | | 14,000 | | | | 13,285 | |
Southern California Edison Co. | | | | | | | | |
2.40% 02/01/22 | | | 34,000 | | | | 32,750 | |
Southern Company Gas Capital Corp. | | | | | | | | |
4.40% 05/30/47 | | | 6,000 | | | | 5,586 | |
Southern Copper Corp. | | | | | | | | |
5.88% 04/23/45 | | | 12,000 | | | | 12,200 | |
Southwestern Electric Power Co. | | | | | | | | |
2.75% 10/01/26 | | | 34,000 | | | | 31,310 | |
Spectra Energy Partners LP | | | | | | | | |
3.38% 10/15/26 | | | 7,000 | | | | 6,558 | |
4.50% 03/15/45 | | | 6,000 | | | | 5,488 | |
Sprint Corp. | | | | | | | | |
7.63% 02/15/25 | | | 116,000 | | | | 117,094 | |
Standard Industries Inc. | | | | | | | | |
5.38% 11/15/24 (b) | | | 118,000 | | | | 111,098 | |
Starbucks Corp. | | | | | | | | |
4.00% 11/15/28 | | | 26,000 | | | | 25,718 | |
Steel Dynamics Inc. | | | | | | | | |
5.13% 10/01/21 | | | 23,000 | | | | 23,131 | |
Sumitomo Mitsui Financial Group Inc. | | | | | | | | |
2.78% 07/12/22 | | | 61,000 | | | | 59,421 | |
Suncor Energy Inc. | | | | | | | | |
4.00% 11/15/47 | | | 7,000 | | | | 6,207 | |
Sunoco Logistics Partners Operations LP | | | | | | | | |
5.30% 04/01/44 | | | 25,000 | | | | 22,073 | |
Sysco Corp. | | | | | | | | |
3.25% 07/15/27 | | | 28,000 | | | | 26,198 | |
T-Mobile USA Inc. | | | | | | | | |
4.50% 02/01/26 | | | 112,000 | | | | 103,449 | |
Takeda Pharmaceutical Company Ltd. | | | | | | | | |
4.00% 11/26/21 (b) | | | 200,000 | | | | 202,510 | |
Tampa Electric Co. | | | | | | | | |
4.35% 05/15/44 | | | 35,000 | | | | 34,763 | |
Target Corp. | | | | | | | | |
2.50% 04/15/26 | | | 31,000 | | | | 28,930 | |
Teck Resources Ltd. | | | | | | | | |
5.40% 02/01/43 | | | 64,000 | | | | 55,635 | |
See Notes to Schedules of Investments and Notes to Financial Statements.
| | | | |
| Elfun Diversified Fund | | | 39 | |
Elfun Diversified Fund
Schedule of Investments, continued — December 31, 2018
| | | | | | | | |
| | | Principal
Amount ($) | | | Fair
Value
$ | |
| | | | | | | | |
6.00% 08/15/40 | | | 34,000 | | | | 31,370 | |
Telecom Italia S.p.A. | | | | | | | | |
5.30% 05/30/24 (b) | | | 200,000 | | | | 189,670 | |
Telefonica Emisiones SA | | | | | | | | |
4.10% 03/08/27 | | | 150,000 | | | | 144,916 | |
Tenet Healthcare Corp. | | | | | | | | |
4.75% 06/01/20 | | | 68,000 | | | | 67,948 | |
6.00% 10/01/20 | | | 74,000 | | | | 74,613 | |
Teva Pharmaceutical Finance Netherlands III BV | | | | | | | | |
1.70% 07/19/19 | | | 122,000 | | | | 120,027 | |
2.20% 07/21/21 | | | 18,000 | | | | 16,519 | |
2.80% 07/21/23 | | | 133,000 | | | | 114,490 | |
Texas Instruments Inc. | | | | | | | | |
4.15% 05/15/48 | | | 18,000 | | | | 17,970 | |
The Allstate Corp. | | | | | | | | |
4.20% 12/15/46 | | | 12,000 | | | | 11,659 | |
The Allstate Corp.
(5.75% fixed rate until 08/15/23; 2.94% + 3 month USD LIBOR thereafter) | | | | | | | | |
5.75% 08/15/53 (i) | | | 51,000 | | | | 49,427 | |
The Bank of New York Mellon Corp.
(2.66% fixed rate until 05/16/22; 0.63% + 3 month USD LIBOR thereafter) | | | | | | | | |
2.66% 05/16/23 (i) | | | 35,000 | | | | 34,117 | |
The Bank of New York Mellon Corp.
(4.63% fixed rate until 09/20/26; 3.13% + 3 month USD LIBOR thereafter) | | | | | | | | |
4.63% 12/29/49 (i) | | | 86,000 | | | | 77,106 | |
The Bank of Nova Scotia (4.65% fixed rate until 10/12/22; 2.65% + 3 month USD LIBOR thereafter) | | | | | | | | |
4.65% 12/31/99 (i) | | | 49,000 | | | | 43,366 | |
The Boeing Co. | | | | | | | | |
3.25% 03/01/28 | | | 36,000 | | | | 35,260 | |
3.55% 03/01/38 | | | 36,000 | | | | 33,579 | |
The Chemours Co. | | | | | | | | |
5.38% 05/15/27 | | | 23,000 | | | | 20,723 | |
The Dow Chemical Co. | | | | | | | | |
4.25% 10/01/34 | | | 27,000 | | | | 24,456 | |
5.55% 11/30/48 (b) | | | 27,000 | | | | 27,447 | |
The George Washington University | | | | | | | | |
4.13% 09/15/48 | | | 25,000 | | | | 24,992 | |
The Goldman Sachs Group Inc. | | | | | | | | |
3.85% 01/26/27 | | | 52,000 | | | | 48,999 | |
4.25% 10/21/25 | | | 20,000 | | | | 19,118 | |
4.80% 07/08/44 | | | 11,000 | | | | 10,470 | |
| | | | | | | | |
| | | Principal
Amount ($) | | | Fair
Value
$ | |
5.15% 05/22/45 | | | 36,000 | | | | 33,922 | |
The Goldman Sachs Group Inc. (2.91% fixed rate until 06/05/22; 1.05% + 3 month USD LIBOR thereafter) | | | | | | | | |
2.91% 06/05/23 (i) | | | 185,000 | | | | 176,875 | |
The Goldman Sachs Group Inc. (3.81% fixed rate until 04/23/28; 1.16% + 3 month USD LIBOR thereafter) | | | | | | | | |
3.81% 04/23/29 (i) | | | 37,000 | | | | 34,460 | |
The Goldman Sachs Group Inc. (4.02% fixed rate until 10/31/37; 1.37% + 3 month USD LIBOR thereafter) | | | | | | | | |
4.02% 10/31/38 (i) | | | 22,000 | | | | 19,329 | |
The Goldman Sachs Group Inc. (4.22% fixed rate until 05/01/28; 1.30% + 3 month USD LIBOR thereafter) | | | | | | | | |
4.22% 05/01/29 (i) | | | 32,000 | | | | 30,830 | |
The Hartford Financial Services Group Inc. 2.13% + 3 month USD LIBOR | | | | | | | | |
4.74% 02/12/47 (b)(i) | | | 30,000 | | | | 24,002 | |
The Home Depot Inc. | | | | | | | | |
3.35% 09/15/25 | | | 44,000 | | | | 43,468 | |
3.50% 09/15/56 | | | 14,000 | | | | 11,759 | |
3.90% 12/06/28 - 06/15/47 | | | 54,000 | | | | 54,242 | |
4.50% 12/06/48 | | | 34,000 | | | | 35,124 | |
The Interpublic Group of Companies Inc. | | | | | | | | |
3.75% 10/01/21 | | | 56,000 | | | | 56,347 | |
The Kroger Co. | | | | | | | | |
2.95% 11/01/21 | | | 57,000 | | | | 56,077 | |
4.65% 01/15/48 | | | 11,000 | | | | 9,920 | |
The Mosaic Co. | | | | | | | | |
5.63% 11/15/43 | | | 6,000 | | | | 6,061 | |
The Sherwin-Williams Co. | | | | | | | | |
2.25% 05/15/20 | | | 39,000 | | | | 38,389 | |
2.75% 06/01/22 | | | 13,000 | | | | 12,565 | |
3.45% 06/01/27 | | | 10,000 | | | | 9,309 | |
4.50% 06/01/47 | | | 21,000 | | | | 18,935 | |
The Southern Co. | | | | | | | | |
1.85% 07/01/19 | | | 138,000 | | | | 136,980 | |
3.25% 07/01/26 | | | 15,000 | | | | 14,027 | |
4.40% 07/01/46 | | | 4,000 | | | | 3,686 | |
The Toronto-Dominion Bank (3.63% fixed rate until 09/15/26; 2.21% + USD 5 year Swap Rate thereafter) | | | | | | | | |
3.63% 09/15/31 (i) | | | 82,000 | | | | 77,438 | |
See Notes to Schedules of Investments and Notes to Financial Statements.
| | |
| 40 | | Elfun Diversified Fund |
Elfun Diversified Fund
Schedule of Investments, continued — December 31, 2018
| | | | | | | | |
| | | Principal
Amount ($) | | | Fair
Value
$ | |
| | | | | | | | |
The Walt Disney Co. | | | | | | | | |
4.13% 06/01/44 | | | 10,000 | | | | 9,897 | |
The Williams Companies Inc. | | | | | | | | |
3.75% 06/15/27 | | | 6,000 | | | | 5,641 | |
3.90% 01/15/25 | | | 20,000 | | | | 19,410 | |
4.85% 03/01/48 | | | 19,000 | | | | 17,265 | |
4.90% 01/15/45 | | | 7,000 | | | | 6,346 | |
5.40% 03/04/44 | | | 7,000 | | | | 6,708 | |
Time Warner Cable LLC | | | | | | | | |
4.50% 09/15/42 | | | 7,000 | | | | 5,564 | |
6.55% 05/01/37 | | | 18,000 | | | | 18,196 | |
TransCanada PipeLines Ltd. | | | | | | | | |
4.25% 05/15/28 | | | 61,000 | | | | 60,375 | |
4.88% 01/15/26 | | | 11,000 | | | | 11,379 | |
Transcontinental Gas Pipe Line Company LLC | | | | | | | | |
4.00% 03/15/28 | | | 28,000 | | | | 27,049 | |
Tyco Electronics Group S.A. | | | | | | | | |
2.35% 08/01/19 | | | 84,000 | | | | 83,567 | |
3.13% 08/15/27 | | | 32,000 | | | | 29,711 | |
Tyson Foods Inc. | | | | | | | | |
2.65% 08/15/19 | | | 16,000 | | | | 15,917 | |
4.55% 06/02/47 | | | 6,000 | | | | 5,277 | |
U.S. Bancorp | | | | | | | | |
3.15% 04/27/27 | | | 42,000 | | | | 40,314 | |
U.S. Bancorp
(5.13% fixed rate until 01/15/21; 3.49% + 3 month USD LIBOR thereafter) | | | | | | | | |
5.13% 12/29/49 (i) | | | 94,000 | | | | 93,280 | |
Union Pacific Corp. | | | | | | | | |
3.20% 06/08/21 | | | 54,000 | | | | 54,196 | |
3.50% 06/08/23 | | | 47,000 | | | | 47,123 | |
3.60% 09/15/37 | | | 9,000 | | | | 8,051 | |
4.10% 09/15/67 | | | 15,000 | | | | 12,612 | |
United Technologies Corp. | | | | | | | | |
3.65% 08/16/23 | | | 51,000 | | | | 50,807 | |
3.75% 11/01/46 (h) | | | 20,000 | | | | 17,108 | |
3.95% 08/16/25 | | | 20,000 | | | | 19,862 | |
4.13% 11/16/28 | | | 8,000 | | | | 7,927 | |
4.15% 05/15/45 | | | 23,000 | | | | 20,580 | |
4.45% 11/16/38 | | | 18,000 | | | | 17,366 | |
4.50% 06/01/42 | | | 14,000 | | | | 13,305 | |
UnitedHealth Group Inc. | | | | | | | | |
4.45% 12/15/48 | | | 30,000 | | | | 30,901 | |
4.75% 07/15/45 | | | 31,000 | | | | 32,784 | |
Vale Overseas Ltd. | | | | | | | | |
4.38% 01/11/22 | | | 4,000 | | | | 4,073 | |
6.25% 08/10/26 | | | 21,000 | | | | 22,743 | |
6.88% 11/10/39 | | | 9,000 | | | | 10,398 | |
Vale S.A. | | | | | | | | |
5.63% 09/11/42 | | | 8,000 | | | | 8,082 | |
| | | | | | | | |
| | | Principal
Amount ($) | | | Fair
Value
$ | |
Valero Energy Partners LP | | | | | | | | |
4.38% 12/15/26 | | | 52,000 | | | | 51,095 | |
Ventas Realty LP | | | | | | | | |
3.25% 10/15/26 | | | 39,000 | | | | 36,275 | |
Verizon Communications Inc. | | | | | | | | |
3.38% 02/15/25 | | | 45,000 | | | | 43,651 | |
4.33% 09/21/28 | | | 40,000 | | | | 40,146 | |
4.40% 11/01/34 | | | 28,000 | | | | 27,026 | |
4.67% 03/15/55 | | | 20,000 | | | | 18,411 | |
4.86% 08/21/46 | | | 121,000 | | | | 119,057 | |
5.01% 04/15/49 | | | 10,000 | | | | 9,963 | |
5.25% 03/16/37 | | | 18,000 | | | | 18,845 | |
Viacom Inc. | | | | | | | | |
3.45% 10/04/26 | | | 15,000 | | | | 13,873 | |
5.25% 04/01/44 | | | 7,000 | | | | 6,296 | |
Virginia Electric & Power Co. | | | | | | | | |
4.00% 11/15/46 | | | 43,000 | | | | 40,729 | |
Visa Inc. | | | | | | | | |
3.15% 12/14/25 | | | 31,000 | | | | 30,448 | |
4.30% 12/14/45 | | | 16,000 | | | | 16,569 | |
Vodafone Group PLC | | | | | | | | |
4.38% 05/30/28 | | | 48,000 | | | | 46,528 | |
5.25% 05/30/48 | | | 13,000 | | | | 12,181 | |
Vornado Realty LP | | | | | | | | |
3.50% 01/15/25 | | | 20,000 | | | | 19,257 | |
Vulcan Materials Co. | | | | | | | | |
3.90% 04/01/27 | | | 10,000 | | | | 9,487 | |
Wabtec Corp. | | | | | | | | |
3.45% 11/15/26 | | | 33,000 | | | | 29,461 | |
Walgreens Boots Alliance Inc. | | | | | | | | |
4.65% 06/01/46 | | | 7,000 | | | | 6,319 | |
Walmart Inc. | | | | | | | | |
3.63% 12/15/47 | | | 16,000 | | | | 14,809 | |
3.70% 06/26/28 | | | 45,000 | | | | 45,643 | |
3.95% 06/28/38 | | | 16,000 | | | | 15,899 | |
4.05% 06/29/48 | | | 18,000 | | | | 17,884 | |
Warner Media LLC | | | | | | | | |
5.35% 12/15/43 | | | 37,000 | | | | 35,498 | |
WEC Energy Group Inc. | | | | | | | | |
3.55% 06/15/25 | | | 59,000 | | | | 57,353 | |
WellCare Health Plans Inc. | | | | | | | | |
5.25% 04/01/25 | | | 44,000 | | | | 42,358 | |
Wells Fargo & Co. | | | | | | | | |
2.63% 07/22/22 | | | 82,000 | | | | 79,083 | |
3.90% 05/01/45 | | | 5,000 | | | | 4,589 | |
4.75% 12/07/46 | | | 78,000 | | | | 75,279 | |
Wells Fargo & Co.
(5.88% fixed rate until 06/15/25; 3.99% + 3 month USD LIBOR thereafter) | | | | | | | | |
5.88% 12/29/49 (i) | | | 52,000 | | | | 51,445 | |
See Notes to Schedules of Investments and Notes to Financial Statements.
| | | | |
| Elfun Diversified Fund | | | 41 | |
Elfun Diversified Fund
Schedule of Investments, continued — December 31, 2018
| | | | | | | | |
| | | Principal
Amount ($) | | | Fair
Value
$ | |
| | | | | | | | |
Wells Fargo & Co.
(5.90% fixed rate until 06/15/24; 3.11% + 3 month USD LIBOR thereafter) | | | | | | | | |
5.90% 12/29/49 (i) | | | 50,000 | | | | 47,605 | |
Wells Fargo & Co.
3.77% + 3 month USD LIBOR | | | | | | | | |
6.56% 03/29/49 (i) | | | 44,000 | | | | 43,742 | |
Wells Fargo Bank NA | | | | | | | | |
2.60% 01/15/21 | | | 250,000 | | | | 246,750 | |
Western Gas Partners LP | | | | | | | | |
4.00% 07/01/22 | | | 67,000 | | | | 66,110 | |
5.38% 06/01/21 | | | 7,000 | | | | 7,212 | |
Westlake Chemical Corp. | | | | | | | | |
3.60% 08/15/26 | | | 20,000 | | | | 18,388 | |
4.38% 11/15/47 | | | 5,000 | | | | 4,150 | |
5.00% 08/15/46 | | | 7,000 | | | | 6,398 | |
Willis North America Inc. | | | | | | | | |
3.60% 05/15/24 | | | 35,000 | | | | 34,086 | |
WPP Finance 2010 | | | | | | | | |
3.75% 09/19/24 | | | 34,000 | | | | 31,696 | |
WRKCo Inc. | | | | | | | | |
3.00% 09/15/24 (b) | | | 23,000 | | | | 21,622 | |
Xilinx Inc. | | | | | | | | |
2.95% 06/01/24 | | | 20,000 | | | | 19,095 | |
XPO Logistics Inc. | | | | | | | | |
6.50% 06/15/22 (b) | | | 28,000 | | | | 27,728 | |
Yamana Gold Inc. | | | | | | | | |
4.63% 12/15/27 | | | 23,000 | | | | 21,263 | |
Zoetis Inc. | | | | | | | | |
3.00% 09/12/27 | | | 11,000 | | | | 10,158 | |
3.90% 08/20/28 | | | 30,000 | | | | 29,645 | |
| | | | | | | | |
| | | | | | | 26,884,777 | |
| | | | | | | | |
|
Non-Agency Collateralized Mortgage Obligations - 1.0% | |
BANK 2018-BNK11 | | | | | | | | |
4.36% 03/15/61 (i) | | | 35,000 | | | | 35,455 | |
BXP Trust2017-GM | | | | | | | | |
3.38% 06/13/39 (b) | | | 171,000 | | | | 167,213 | |
Citigroup Commercial Mortgage Trust 2015-GC33 | | | | | | | | |
3.78% 09/10/58 | | | 100,000 | | | | 101,294 | |
Citigroup Commercial Mortgage Trust2016-P5 | | | | | | | | |
2.94% 10/10/49 | | | 90,682 | | | | 86,667 | |
Citigroup Commercial Mortgage Trust2016-P6 | | | | | | | | |
3.72% 12/10/49 (i) | | | 119,583 | | | | 120,502 | |
4.03% 12/10/49 (i) | | | 78,331 | | | | 78,848 | |
Citigroup Commercial Mortgage Trust2018-C5 | | | | | | | | |
4.51% 06/10/51 | | | 64,000 | | | | 65,407 | |
| | | | | | | | |
| | | Principal
Amount ($) | | | Fair
Value
$ | |
COMM 2014-CR14 Mortgage Trust | | | | | | | | |
4.53% 02/10/47 (i) | | | 55,000 | | | | 56,844 | |
GS Mortgage Securities Trust2016-GS3 | | | | | | | | |
2.85% 10/10/49 | | | 72,000 | | | | 68,294 | |
GS Mortgage Securities Trust2017-GS5 | | | | | | | | |
3.67% 03/10/50 | | | 240,062 | | | | 239,807 | |
GS Mortgage Securities Trust2017-GS8 | | | | | | | | |
3.47% 11/10/50 | | | 184,426 | | | | 181,382 | |
GS Mortgage Securities Trust2018-GS9 | | | | | | | | |
4.14% 03/10/51 (i) | | | 73,000 | | | | 74,048 | |
JPMBB Commercial Mortgage Securities Trust2013-C12 | | | | | | | | |
4.03% 07/15/45 (i) | | | 25,000 | | | | 25,321 | |
LB-UBS Commercial Mortgage Trust2004-C8 | | | | | | | | |
0.32% 12/15/39 (b)(g)(i) | | | 12,890 | | | | 12 | |
LB-UBS Commercial Mortgage Trust2007-C6 | | | | | | | | |
6.11% 07/15/40 (i) | | | 1,236 | | | | 1,243 | |
6.11% 07/15/40 (b) | | | 2,836 | | | | 2,852 | |
Morgan Stanley Bank of America Merrill Lynch Trust2015-C21 | | | | | | | | |
0.94% 03/15/48 (g)(i) | | | 844,119 | | | | 37,040 | |
Morgan Stanley Capital I Trust 2006-IQ11 | | | | | | | | |
6.25% 10/15/42 (i) | | | 40,000 | | | | 40,810 | |
Morgan Stanley Capital I Trust2006-T21 | | | | | | | | |
5.24% 10/12/52 (i) | | | 4,358 | | | | 4,396 | |
UBS Commercial Mortgage Trust2018-C12 | | | | | | | | |
4.79% 08/15/51 (i) | | | 54,000 | | | | 55,722 | |
Wells Fargo Commercial Mortgage Trust2015-C26 | | | | | | | | |
1.23% 02/15/48 (g)(i) | | | 911,500 | | | | 52,197 | |
Wells Fargo Commercial Mortgage Trust2018-AUS | | | | | | | | |
4.06% 07/17/36 (b)(i) | | | 100,000 | | | | 101,572 | |
WFRBS Commercial Mortgage Trust2013-C17 | | | | | | | | |
4.26% 12/15/46 | | | 55,000 | | | | 56,139 | |
WFRBS Commercial Mortgage Trust 2014-LC14 | | | | | | | | |
4.35% 03/15/47 (i) | | | 123,000 | | | | 125,147 | |
| | | | | | | | |
| | | | | | | 1,778,212 | |
| | | | | | | | |
See Notes to Schedules of Investments and Notes to Financial Statements.
| | |
| 42 | | Elfun Diversified Fund |
Elfun Diversified Fund
Schedule of Investments, continued — December 31, 2018
| | | | | | | | |
| | | Principal
Amount ($) | | | Fair
Value
$ | |
| | | | | | | | |
Sovereign Bonds - 0.2% | |
Government of Colombia | | | | | | | | |
2.63% 03/15/23 | | | 200,000 | | | | 188,894 | |
Government of Mexico | | | | | | | | |
4.00% 10/02/23 | | | 24,000 | | | | 23,900 | |
4.75% 03/08/44 | | | 56,000 | | | | 50,834 | |
Government of Peru | | | | | | | | |
5.63% 11/18/50 | | | 26,000 | | | | 30,507 | |
Government of Uruguay | | | | | | | | |
5.10% 06/18/50 | | | 29,803 | | | | 29,293 | |
| | | | | | | | |
| | | | | | | 323,428 | |
| | | | | | | | |
|
Municipal Bonds and Notes - 0.2% | |
American Municipal Power Inc. | | | | | | | | |
6.27% 02/15/50 | | | 25,000 | | | | 31,025 | |
Metropolitan St. Louis Sewer District | | | | | | | | |
5.00% 05/01/47 | | | 100,000 | | | | 113,141 | |
New Jersey Transportation Trust Fund Authority | | | | | | | | |
6.88% 12/15/39 | | | 15,000 | | | | 15,204 | |
Port Authority of New York & New Jersey | | | | | | | | |
4.46% 10/01/62 | | | 95,000 | | | | 96,654 | |
State of California | | | | | | | | |
4.60% 04/01/38 | | | 50,000 | | | | 51,567 | |
5.70% 11/01/21 | | | 55,000 | | | | 59,155 | |
State of Illinois | | | | | | | | |
5.10% 06/01/33 | | | 25,000 | | | | 23,836 | |
The University of Texas System | | | | | | | | |
3.35% 08/15/47 | | | 25,000 | | | | 22,637 | |
| | | | | | | | |
| | | | | | | 413,219 | |
| | | | | | | | |
| |
Total Bonds and Notes
(Cost $63,420,938) | | | | 62,944,247 | |
| | | | | | | | |
| | | | | | | | |
| | | Number
of Shares | | | Fair
Value
$ | |
| Exchange Traded & Mutual Funds - 26.4% | |
State Street Global Equityex-U.S. Index Portfolio
(Cost $51,065,276) (n) | | | 5,315,594 | | | | 47,946,658 | |
| | | | | | | | |
| |
Total Investments in Securities
(Cost $173,775,034) | | | | 174,977,083 | |
| | | | | | | | |
|
| Short-Term Investments - 9.4% | |
Dreyfus Treasury Cash Management - Institutional Shares 2.26% (d) | | | 2,640,920 | | | | 2,640,920 | |
State Street Institutional Treasury Money Market Fund - Premier Class 2.24% (d)(n) | | | 5,935,188 | | | | 5,935,188 | |
State Street Institutional Treasury Plus Fund - Premier Class 2.31% (d)(n) | | | 2,640,921 | | | | 2,640,921 | |
State Street Institutional U.S. Government Money Market Fund - Class G Shares 2.31% (d)(n) | | | 5,945,053 | | | | 5,945,053 | |
U.S. Treasury Bills 2.54% (d) | | | 35,000 | | | | 34,599 | |
| | | | | | | | |
| |
Total Short-Term Investments
(Cost $17,196,673) | | | | 17,196,681 | |
| | | | | | | | |
| | |
Total Investments
(Cost $190,971,707) | | | | | | | 192,173,764 | |
| |
| Liabilities in Excess of Other Assets,net - (5.6)% | | | | (10,230,541 | ) |
| | | | | | | | |
| | |
| NET ASSETS - 100.0% | | | | | | | 181,943,223 | |
| | | | | | | | |
Other Information:
Centrally Cleared Credit Default Swaps - Sell Protection
| | | | | | | | | | | | | | | | | | | | | | | | | | |
Reference
Entity | | Counterparty | | Notional
Amount
(000s omitted) | | | Contract
Annual
Fixed Rate/
Payment
Frequency | | | Termination
Date | | | Market
Value | | | Unamortized
Upfront
Payments
Received | | | Unrealized
Depreciation | |
Markit CDX North America High Yield Index | | Intercontinental Exchange | | $ | 723 | | |
| 5.00%/
Quarterly |
| | | 12/20/23 | | | $ | 14,681 | | | $ | 39,754 | | | $ | (25,073 | ) |
| | | | | | | | | | | | | | | | | | | | | | | | | | |
See Notes to Schedules of Investments and Notes to Financial Statements.
| | | | |
| Elfun Diversified Fund | | | 43 | |
Elfun Diversified Fund
Schedule of Investments, continued — December 31, 2018
Centrally Cleared Interest Rate Swaps
| | | | | | | | | | | | | | | | | | | | | | | | | | | | |
| Counterparty | | Notional
Amount
(000s omitted) | | | Fund Pays/
Receives
Fixed
Rate/
Payment
Frequency | | Floating
Rate | | Contract
Annual
Fixed
Rate | | | Termination
Date | | | Market
Value | | | Unamortized
Upfront
Payments
Received | | | Unrealized
Depreciation | |
| | | | | | | | | | | | | | | | | | | | | | | | | | | | |
CME Group, Inc. | | $ | 2,750 | | | Receives/
Quarterly | | 3 Month U.S. Dollar LIBOR | | | 3.05% | | | | 11/19/21 | | | $ | (35,428 | ) | | $ | — | | | $ | (35,428 | ) |
CME Group, Inc. | | | 2,751 | | | Receives/
Quarterly | | 3 Month U.S. Dollar LIBOR | | | 3.06% | | | | 11/19/21 | | | | (35,780 | ) | | | — | | | | (35,780 | ) |
| | | | | | | | | | | | | | | | | | | | | | | | | | | | |
| | | | | | | | | | | | | | | | | | | | | | | | | | $ | (71,208 | ) |
| | | | | | | | | | | | | | | | | | | | | | | | | | | | |
The Fund had the following long futures contracts open at December 31, 2018:
| | | | | | | | | | | | | | | | | | | | |
| Description | | Expiration
date | | | Number
of
Contracts | | | Notional
Amount | | | Value | | | Unrealized
Appreciation
(Depreciation) | |
| | | | | | | | | | | | | | | | | | | | |
S&P 500 Emini Index Futures | | | March 2019 | | | | 3 | | | $ | 390,852 | | | $ | 375,780 | | | $ | (15,072 | ) |
Ultra Long-Term U.S. Treasury Bond Futures | | | March 2019 | | | | 15 | | | | 2,307,928 | | | | 2,409,844 | | | | 101,916 | |
U.S. Long Bond Futures | | | March 2019 | | | | 6 | | | | 859,511 | | | | 876,000 | | | | 16,489 | |
2 Yr. U.S. Treasury Notes Futures | | | March 2019 | | | | 52 | | | | 10,968,900 | | | | 11,040,250 | | | | 71,350 | |
5 Yr. U.S. Treasury Notes Futures | | | March 2019 | | | | 23 | | | | 2,599,886 | | | | 2,637,813 | | | | 37,927 | |
10 Yr. U.S. Treasury Notes Futures | | | March 2019 | | | | 11 | | | | 1,314,841 | | | | 1,342,172 | | | | 27,331 | |
| | | | | | | | | | | | | | | | | | | | |
| | | $ | 239,941 | |
| | | | | | | | | | | | | | | | | | | | |
The Fund had the following short futures contracts open at December 31, 2018:
| | | | | | | | | | | | | | | | | | | | |
| Description | | Expiration
date | | | Number
of
Contracts | | | Notional
Amount | | | Value | | | Unrealized
Depreciation | |
| | | | | | | | | | | | | | | | | | | | |
10 Yr. U.S. Treasury Ultra Futures | | | March 2019 | | | | 14 | | | $ | (1,764,522 | ) | | $ | (1,821,094 | ) | | $ | (56,572 | ) |
During the period ended December 31, 2018 average notional values related to derivative contracts were as follows:
| | | | | | | | | | | | | | | | | | | | | | | | |
| | | Purchased Call Options | | | Written Call Options | | | Long Futures Contracts | | | Short Futures Contracts | | | Credit Default Swap Contracts | | | Interest Rate Swap Contracts | |
| | | | | | | | | | | | | | | | | | | | | | | | |
Average Notional Value | | $ | 7,696 | | | $ | 3,583 | | | $ | 18,777,832 | | | $ | 5,045,380 | | | $ | 1,049,928 | | | $ | 5,654,941 | |
See Notes to Schedules of Investments and Notes to Financial Statements.
| | |
| 44 | | Elfun Diversified Fund |
Elfun Diversified Fund
Schedule of Investments, continued — December 31, 2018
The following table presents the Fund’s investments measured at fair value on a recurring basis at December 31, 2018:
| | | | | | | | | | | | | | | | | | |
| Fund | | Investments | | Level 1 | | | Level 2 | | | Level 3 | | | Total | |
| | | | | | | | | | | | | | | | | | |
| | | | | |
| Elfun Diversified Fund | | Investments in Securities | | | | | | | | | | | | | | | | |
| | | | | |
| | Domestic Equity | | $ | 62,498,707 | | | $ | — | | | $ | — | | | $ | 62,498,707 | |
| | | | | |
| | Foreign Equity | | | 1,587,471 | | | | — | | | | — | | | | 1,587,471 | |
| | | | | |
| | U.S. Treasuries | | | — | | | | 18,857,655 | | | | — | | | | 18,857,655 | |
| | | | | |
| | Agency Mortgage Backed | | | — | | | | 12,815,841 | | | | — | | | | 12,815,841 | |
| | | | | |
| | Agency Collateralized Mortgage Obligations | | | — | | | | 268,839 | | | | — | | | | 268,839 | |
| | | | | |
| | Asset Backed | | | — | | | | 1,602,276 | | | | — | | | | 1,602,276 | |
| | | | | |
| | Corporate Notes | | | — | | | | 26,884,777 | | | | — | | | | 26,884,777 | |
| | | | | |
| | Non-Agency Collateralized Mortgage Obligations | | | — | | | | 1,778,212 | | | | — | | | | 1,778,212 | |
| | | | | |
| | Sovereign Bonds | | | — | | | | 323,428 | | | | — | | | | 323,428 | |
| | | | | |
| | Municipal Bonds and Notes | | | — | | | | 413,219 | | | | — | | | | 413,219 | |
| | | | | |
| | Exchange Traded & Mutual Funds | | | 47,946,658 | | | | — | | | | — | | | | 47,946,658 | |
| | | | | |
| | Short-Term Investments | | | 17,162,082 | | | | 34,599 | | | | — | | | | 17,196,681 | |
| | | | | | | | | | | | | | | | | | |
| | | | | |
| | Total Investments in Securities | | $ | 129,194,918 | | | $ | 62,978,846 | | | $ | — | | | $ | 192,173,764 | |
| | | | | | | | | | | | | | | | | | |
| | | | | |
| | Other Financial Instruments | | | | | | | | | | | | | | | | |
| | | | | |
| | Credit Default Swap Contracts - Unrealized Depreciation | | $ | — | | | $ | (25,073 | ) | | $ | — | | | $ | (25,073 | ) |
| | | | | |
| | Interest Rate Swap Contracts - Unrealized Depreciation | | | — | | | | (71,208 | ) | | | — | | | | (71,208 | ) |
| | | | | |
| | Long Futures Contracts - Unrealized Appreciation | | | 255,013 | | | | — | | | | — | | | | 255,013 | |
| | | | | |
| | Long Futures Contracts - Unrealized Depreciation | | | (15,072 | ) | | | — | | | | — | | | | (15,072 | ) |
| | | | | |
| | Short Futures Contracts - Unrealized Depreciation | | | (56,572 | ) | | | — | | | | — | | | | (56,572 | ) |
| | | | | | | | | | | | | | | | | | |
| | | | | |
| | Total Other Financial Instruments | | $ | 183,369 | | | $ | (96,281 | ) | | $ | — | | | $ | 87,088 | |
| | | | | | | | | | | | | | | | | | |
The Fund was invested in the following countries/territories at December 31, 2018 (unaudited):
| | | | |
| Country/Territory | | Percentage
(based on
Fair Value) | |
United States | | | 96.98% | |
United Kingdom | | | 0.47% | |
Canada | | | 0.42% | |
Ireland | | | 0.40% | |
Netherlands | | | 0.29% | |
Japan | | | 0.24% | |
France | | | 0.19% | |
Mexico | | | 0.15% | |
Luxembourg | | | 0.15% | |
Switzerland | | | 0.15% | |
Colombia | | | 0.11% | |
Italy | | | 0.10% | |
Supranational | | | 0.09% | |
| | | | |
| Country/Territory | | Percentage
(based on
Fair Value) | |
Spain | | | 0.08% | |
Germany | | | 0.05% | |
Bermuda | | | 0.03% | |
Mult | | | 0.02% | |
Peru | | | 0.02% | |
Uruguay | | | 0.02% | |
Cayman Islands | | | 0.01% | |
Brazil | | | 0.01% | |
Jersey | | | 0.01% | |
China | | | 0.01% | |
Australia | | | 0.00% | |
| | | | |
| | | 100.00% | |
| | | | |
See Notes to Schedules of Investments and Notes to Financial Statements.
| | | | |
| Elfun Diversified Fund | | | 45 | |
Elfun Diversified Fund
Schedule of Investments, continued — December 31, 2018
The Fund’s % share of investment in the various categories, based on Fair Value, is as follows at December 31, 2018 (unaudited):
| | | | | | | | | | | | |
| Industry | | Domestic | | | Foreign | | | Total | |
| | | | | | | | | | | | |
Exchange Traded Funds | | | 24.95% | | | | 0.00% | | | | 24.95% | |
Pharmaceuticals | | | 1.75% | | | | 0.00% | | | | 1.75% | |
Interactive Media & Services | | | 1.53% | | | | 0.00% | | | | 1.53% | |
Diversified Banks | | | 1.53% | | | | 0.00% | | | | 1.53% | |
Systems Software | | | 1.51% | | | | 0.00% | | | | 1.51% | |
Technology Hardware, Storage & Peripherals | | | 1.27% | | | | 0.01% | | | | 1.28% | |
Internet & Direct Marketing Retail | | | 1.16% | | | | 0.00% | | | | 1.16% | |
Data Processing & Outsourced Services | | | 1.16% | | | | 0.00% | | | | 1.16% | |
Semiconductors | | | 1.15% | | | | 0.00% | | | | 1.15% | |
Healthcare Equipment | | | 0.91% | | | | 0.16% | | | | 1.07% | |
Biotechnology | | �� | 0.88% | | | | 0.00% | | | | 0.88% | |
Integrated Oil & Gas | | | 0.86% | | | | 0.00% | | | | 0.86% | |
Aerospace & Defense | | | 0.83% | | | | 0.00% | | | | 0.83% | |
Integrated Telecommunication Services | | | 0.69% | | | | 0.00% | | | | 0.69% | |
Electric Utilities | | | 0.68% | | | | 0.00% | | | | 0.68% | |
Multi-Sector Holdings | | | 0.64% | | | | 0.00% | | | | 0.64% | |
Managed Healthcare | | | 0.60% | | | | 0.00% | | | | 0.60% | |
Movies & Entertainment | | | 0.57% | | | | 0.00% | | | | 0.57% | |
Soft Drinks | | | 0.56% | | | | 0.00% | | | | 0.56% | |
Household Products | | | 0.56% | | | | 0.00% | | | | 0.56% | |
Application Software | | | 0.54% | | | | 0.00% | | | | 0.54% | |
Industrial Conglomerates | | | 0.48% | | | | 0.00% | | | | 0.48% | |
Oil & Gas Exploration & Production | | | 0.43% | | | | 0.00% | | | | 0.43% | |
Home Improvement Retail | | | 0.43% | | | | 0.00% | | | | 0.43% | |
Restaurants | | | 0.42% | | | | 0.00% | | | | 0.42% | |
IT Consulting & Other Services | | | 0.26% | | | | 0.15% | | | | 0.41% | |
Specialized REITs | | | 0.40% | | | | 0.00% | | | | 0.40% | |
Communications Equipment | | | 0.39% | | | | 0.00% | | | | 0.39% | |
Regional Banks | | | 0.38% | | | | 0.00% | | | | 0.38% | |
Multi-Utilities | | | 0.36% | | | | 0.00% | | | | 0.36% | |
Hypermarkets & Super Centers | | | 0.35% | | | | 0.00% | | | | 0.35% | |
Packaged Foods & Meats | | | 0.34% | | | | 0.00% | | | | 0.34% | |
Life Sciences Tools & Services | | | 0.34% | | | | 0.00% | | | | 0.34% | |
Cable & Satellite | | | 0.34% | | | | 0.00% | | | | 0.34% | |
Financial Exchanges & Data | | | 0.33% | | | | 0.00% | | | | 0.33% | |
Railroads | | | 0.32% | | | | 0.00% | | | | 0.32% | |
Asset Management & Custody Banks | | | 0.31% | | | | 0.00% | | | | 0.31% | |
Tobacco | | | 0.31% | | | | 0.00% | | | | 0.31% | |
Healthcare Services | | | 0.30% | | | | 0.00% | | | | 0.30% | |
Investment Banking & Brokerage | | | 0.29% | | | | 0.00% | | | | 0.29% | |
Property & Casualty Insurance | | | 0.17% | | | | 0.09% | | | | 0.26% | |
Industrial Machinery | | | 0.24% | | | | 0.02% | | | | 0.26% | |
Life & Health Insurance | | | 0.24% | | | | 0.00% | | | | 0.24% | |
Consumer Finance | | | 0.22% | | | | 0.00% | | | | 0.22% | |
Diversified Chemicals | | | 0.21% | | | | 0.00% | | | | 0.21% | |
Air Freight & Logistics | | | 0.21% | | | | 0.00% | | | | 0.21% | |
Industrial Gases | | | 0.06% | | | | 0.13% | | | | 0.19% | |
Specialty Chemicals | | | 0.19% | | | | 0.00% | | | | 0.19% | |
Oil & Gas Refining & Marketing | | | 0.19% | | | | 0.00% | | | | 0.19% | |
Construction Machinery & Heavy Trucks | | | 0.18% | | | | 0.00% | | | | 0.18% | |
Insurance Brokers | | | 0.08% | | | | 0.09% | | | | 0.17% | |
Apparel Retail | | | 0.17% | | | | 0.00% | | | | 0.17% | |
See Notes to Schedules of Investments and Notes to Financial Statements.
| | |
| 46 | | Elfun Diversified Fund |
Elfun Diversified Fund
Schedule of Investments, continued — December 31, 2018
| | | | | | | | | | | | |
| Industry | | Domestic | | | Foreign | | | Total | |
| | | | | | | | | | | | |
Oil & Gas Equipment & Services | | | 0.15% | | | | 0.01% | | | | 0.16% | |
Electrical Components & Equipment | | | 0.16% | | | | 0.00% | | | | 0.16% | |
Retail REITs | | | 0.15% | | | | 0.00% | | | | 0.15% | |
Hotels, Resorts & Cruise Lines | | | 0.15% | | | | 0.00% | | | | 0.15% | |
Airlines | | | 0.15% | | | | 0.00% | | | | 0.15% | |
Footwear | | | 0.15% | | | | 0.00% | | | | 0.15% | |
Residential REITs | | | 0.14% | | | | 0.00% | | | | 0.14% | |
General Merchandise Stores | | | 0.14% | | | | 0.00% | | | | 0.14% | |
Oil & Gas Storage & Transportation | | | 0.12% | | | | 0.00% | | | | 0.12% | |
Automobile Manufacturers | | | 0.12% | | | | 0.00% | | | | 0.12% | |
Interactive Home Entertainment | | | 0.11% | | | | 0.00% | | | | 0.11% | |
Automotive Retail | | | 0.11% | | | | 0.00% | | | | 0.11% | |
Multi-Line Insurance | | | 0.11% | | | | 0.00% | | | | 0.11% | |
Semiconductor Equipment | | | 0.10% | | | | 0.00% | | | | 0.10% | |
Apparel, Accessories & Luxury Goods | | | 0.10% | | | | 0.00% | | | | 0.10% | |
Health Care REITs | | | 0.10% | | | | 0.00% | | | | 0.10% | |
Healthcare Distributors | | | 0.09% | | | | 0.00% | | | | 0.09% | |
Drug Retail | | | 0.09% | | | | 0.00% | | | | 0.09% | |
Building Products | | | 0.07% | | | | 0.02% | | | | 0.09% | |
Environmental & Facilities Services | | | 0.09% | | | | 0.00% | | | | 0.09% | |
Research & Consulting Services | | | 0.06% | | | | 0.02% | | | | 0.08% | |
Paper Packaging | | | 0.08% | | | | 0.00% | | | | 0.08% | |
Electronic Components | | | 0.08% | | | | 0.00% | | | | 0.08% | |
Agricultural & Farm Machinery | | | 0.08% | | | | 0.00% | | | | 0.08% | |
Office REITs | | | 0.08% | | | | 0.00% | | | | 0.08% | |
Industrial REITs | | | 0.07% | | | | 0.00% | | | | 0.07% | |
Healthcare Facilities | | | 0.07% | | | | 0.00% | | | | 0.07% | |
Healthcare Supplies | | | 0.06% | | | | 0.00% | | | | 0.06% | |
Trading Companies & Distributors | | | 0.06% | | | | 0.00% | | | | 0.06% | |
Distillers & Vintners | | | 0.05% | | | | 0.00% | | | | 0.05% | |
Specialty Stores | | | 0.05% | | | | 0.00% | | | | 0.05% | |
Personal Products | | | 0.05% | | | | 0.00% | | | | 0.05% | |
Fertilizers & Agricultural Chemicals | | | 0.05% | | | | 0.00% | | | | 0.05% | |
Electronic Manufacturing Services | | | 0.01% | | | | 0.04% | | | | 0.05% | |
Home Building | | | 0.05% | | | | 0.00% | | | | 0.05% | |
Food Distributors | | | 0.05% | | | | 0.00% | | | | 0.05% | |
Broadcasting | | | 0.04% | | | | 0.00% | | | | 0.04% | |
Internet Services & Infrastructure | | | 0.04% | | | | 0.00% | | | | 0.04% | |
Commodity Chemicals | | | 0.04% | | | | 0.00% | | | | 0.04% | |
Department Stores | | | 0.04% | | | | 0.00% | | | | 0.04% | |
Construction Materials | | | 0.04% | | | | 0.00% | | | | 0.04% | |
Agricultural Products | | | 0.04% | | | | 0.00% | | | | 0.04% | |
Advertising | | | 0.04% | | | | 0.00% | | | | 0.04% | |
Auto Parts & Equipment | | | 0.01% | | | | 0.03% | | | | 0.04% | |
Diversified Support Services | | | 0.04% | | | | 0.00% | | | | 0.04% | |
Casinos & Gaming | | | 0.03% | | | | 0.00% | | | | 0.03% | |
Food Retail | | | 0.03% | | | | 0.00% | | | | 0.03% | |
Distributors | | | 0.03% | | | | 0.00% | | | | 0.03% | |
Independent Power Producers & Energy Traders | | | 0.03% | | | | 0.00% | | | | 0.03% | |
Gold | | | 0.03% | | | | 0.00% | | | | 0.03% | |
Construction & Engineering | | | 0.03% | | | | 0.00% | | | | 0.03% | |
Healthcare Technology | | | 0.03% | | | | 0.00% | | | | 0.03% | |
Electronic Equipment & Instruments | | | 0.03% | | | | 0.00% | | | | 0.03% | |
Steel | | | 0.03% | | | | 0.00% | | | | 0.03% | |
See Notes to Schedules of Investments and Notes to Financial Statements.
| | | | |
| Elfun Diversified Fund | | | 47 | |
Elfun Diversified Fund
Schedule of Investments, continued — December 31, 2018
| | | | | | | | | | | | |
| Industry | | Domestic | | | Foreign | | | Total | |
| | | | | | | | | | | | |
Copper | | | 0.02% | | | | 0.00% | | | | 0.02% | |
Water Utilities | | | 0.02% | | | | 0.00% | | | | 0.02% | |
Alternative Carriers | | | 0.02% | | | | 0.00% | | | | 0.02% | |
Metal & Glass Containers | | | 0.02% | | | | 0.00% | | | | 0.02% | |
Home Furnishings | | | 0.02% | | | | 0.00% | | | | 0.02% | |
Leisure Products | | | 0.02% | | | | 0.00% | | | | 0.02% | |
Hotel & Resort REITs | | | 0.02% | | | | 0.00% | | | | 0.02% | |
Real Estate Services | | | 0.02% | | | | 0.00% | | | | 0.02% | |
Computer & Electronics Retail | | | 0.02% | | | | 0.00% | | | | 0.02% | |
Brewers | | | 0.02% | | | | 0.00% | | | | 0.02% | |
Trucking | | | 0.01% | | | | 0.00% | | | | 0.01% | |
Consumer Electronics | | | 0.00% | | | | 0.01% | | | | 0.01% | |
Reinsurance | | | 0.00% | | | | 0.01% | | | | 0.01% | |
Housewares & Specialties | | | 0.01% | | | | 0.00% | | | | 0.01% | |
Publishing | | | 0.01% | | | | 0.00% | | | | 0.01% | |
Human Resource & Employment Services | | | 0.01% | | | | 0.00% | | | | 0.01% | |
Household Appliances | | | 0.01% | | | | 0.00% | | | | 0.01% | |
Motorcycle Manufacturers | | | 0.01% | | | | 0.00% | | | | 0.01% | |
Tires & Rubber | | | 0.01% | | | | 0.00% | | | | 0.01% | |
Oil & Gas Drilling | | | 0.01% | | | | 0.00% | | | | 0.01% | |
Specialized Consumer Services | | | 0.01% | | | | 0.00% | | | | 0.01% | |
| | | | | | | | | | | | |
| | | |
| | | | | | | | | | | 58.30% | |
| | | | | | | | | | | | |
| | | | |
| Sector | | Percentage
(based on
Fair Value) | |
| | | | |
Corporate Notes | | | 13.99% | |
U.S. Treasuries | | | 9.81% | |
Agency Mortgage Backed | | | 6.67% | |
Non-Agency Collateralized Mortgage Obligations | | | 0.93% | |
Asset Backed | | | 0.83% | |
Municipal Bonds and Notes | | | 0.21% | |
Sovereign Bonds | | | 0.17% | |
Agency Collateralized Mortgage Obligations | | | 0.14% | |
| | | | |
| | | 32.75% | |
| | | | |
| | | | |
| Sector | | Percentage
(based on
Fair Value) | |
| | | | |
Short-Term Investments | | | | |
Short-Term Investments | | | 8.95% | |
| | | | |
| | | 8.95% | |
| | | | |
| |
| | | 100.00% | |
| | | | |
See Notes to Schedules of Investments and Notes to Financial Statements.
| | |
| 48 | | Elfun Diversified Fund |
Elfun Diversified Fund
Schedule of Investments, continued — December 31, 2018
Affiliate Table
| | | | | | | | | | | | | | | | | | | | | | | | | | | | | | | | | | | | |
| | | Number
of Shares
Held at
12/31/17 | | | Value at
12/31/17 | | | Cost of
Purchases | | | Proceeds
from
Shares
Sold | | | Realized
Gain
(Loss) | | | Change in
Unrealized
Appreciation/
Depreciation | | | Number
of Shares
Held at
12/31/18 | | | Value at
12/31/18 | | | Dividend
Income | |
SPDR Bloomberg Barclays High Yield Bond ETF | | | 173,223 | | | $ | 6,360,749 | | | $ | — | | | $ | 5,956,476 | | | $ | (209,162 | ) | | $ | (195,111 | ) | | | — | | | $ | — | | | $ | 313,526 | |
State Street Corp. | | | 1,259 | | | | 122,891 | | | | — | | | | 6,519 | | | | 1,539 | | | | (42,542 | ) | | | 1,195 | | | | 75,369 | | | | 2,154 | |
State Street Global Equityex-U.S. Index Portfolio | | | 5,392,983 | | | | 58,298,151 | | | | 1,405,731 | | | | 2,660,000 | | | | 251,055 | | | | (9,348,279 | ) | | | 5,315,594 | | | | 47,946,658 | | | | 1,405,731 | |
State Street Institutional Treasury Money Market Fund - Premier Class | | | 1,588,325 | | | | 1,588,325 | | | | 15,077,928 | | | | 10,731,065 | | | | — | | | | — | | | | 5,935,188 | | | | 5,935,188 | | | | 40,367 | |
State Street Institutional Treasury Plus Fund - Premier Class | | | 2,107,995 | | | | 2,107,995 | | | | 3,811,278 | | | | 3,278,352 | | | | — | | | | — | | | | 2,640,921 | | | | 2,640,921 | | | | 19,007 | |
State Street Institutional U.S. Government Money Market Fund - Class G Shares | | | 1,759,353 | | | | 1,759,353 | | | | 22,188,212 | | | | 18,002,512 | | | | — | | | | — | | | | 5,945,053 | | | | 5,945,053 | | | | 46,430 | |
| | | | | | | | | | | | | | | | | | | | | | | | | | | | | | | | | | | | |
| | | | | | | | | |
TOTAL | | | | | | $ | 70,237,464 | | | $ | 42,483,149 | | | $ | 40,634,924 | | | $ | 43,432 | | | $ | (9,585,932 | ) | | | | | | $ | 62,543,189 | | | $ | 1,827,215 | |
| | | | | | | | | | | | | | | | | | | | | | | | | | | | | | | | | | | | |
See Notes to Schedules of Investments and Notes to Financial Statements.
| | | | |
| Elfun Diversified Fund | | | 49 | |
Elfun Tax-Exempt Income Fund
Management Discussion of Fund Performance — December 31, 2018 (Unaudited)
The ElfunTax-Exempt Income Fund (the “Fund”) seeks to provide as high a level of current interest income exempt from federal income taxation as is available from a concentration of investments in municipal bonds consistent with prudent investment management and the preservation of capital. The Fund’s benchmark is the Bloomberg Barclays U.S. Municipal Bond Index (the “Index”).
For the12-month period ended December 31, 2018 (the “Reporting Period”), the total return for the Fund was 0.90% and the Index was 1.28%. The Fund and Index returns reflect the reinvestment of dividends and other income. The Fund’s performance reflects the expenses of managing the Fund, including brokerage and advisory expenses. The Index is unmanaged and Index returns do not reflect fees and expenses of any kind, which would have a negative impact on returns.
The Fund’s performance was driven by its defensive posture which included less credit risk and a shorter duration than the Index throughout the year. The Fund was also positioned for a narrowing between short and long-term yields with a significant overweight in thefront-end of the curve and an overweight in thelong-end. Although these factors were constructive for the majority of the year, a robust rally in the fourth quarter to close out the Reporting Period and curve steepening diminished the Fund’s performance relative to the Index. However, the Fund did perform better than Morningstar’s peer group category of 168 U.S. Long-Term Municipal Bond funds which returned an average of 0.29% after expenses during the Reporting Period.
The Fund was generally well-positioned for thetax-exempt market conditions that occurred during the Reporting Period: a rising rate environment; pressure from secondary market selling; and net fund outflows from the asset class. Althoughtax-exempt rates rose during most of the Reporting Period, there was a strong and sustained rally in the fourth quarter to end the year as the Federal Reserve indicated a more gradual approach to rate hikes in calendar year 2019 and beyond. Additionally, throughout calendar year 2018, thetax-exempt market faced sustained pressure from secondary market selling primarily by banks and insurers as they readjusted their portfolios due to changes caused by the recently enacted Tax Reform and Job Act. The pressure from this secondary market selling was further exacerbated by Fund outflows.
The Fund did not invest in derivatives during the Reporting Period.
The views expressed above reflect those of the Fund’s portfolio manager only through the Reporting Period, and do not necessarily represent the views of the Adviser as a whole. Any such views are subject to change at any time based upon market or other conditions and the Adviser disclaims any responsibility to update such views. These views may not be relied on as investment advice and, because investment decisions for a fund are based on numerous factors, may not be relied on as an indication of trading intent on behalf of any fund.
| | |
| 50 | | Elfun Tax-Exempt Income Fund |
ElfunTax-Exempt Income Fund
Understanding Your Fund’s Expenses (Unaudited)
As a shareholder of the Fund you incur ongoing costs. Ongoing costs include portfolio management fees, professional fees, administrative fees and other Fund expenses. The following example is intended to help you understand your ongoing costs (in dollars) of investing in the Fund and to compare these costs with the ongoing costs of investing in other mutual funds.
To illustrate these ongoing costs, we have provided an example and calculated the expenses paid by investors in units of the Fund during the period. The information in the following table is based on an investment of $1,000, which is invested at the beginning of the period and held for the entiresix-month period ended December 31, 2018.
Actual Expenses
The first section of the table provides information about actual account values and actual expenses. You may use the information in this section, together with the amount you invested, to estimate the expenses that you paid over the period. To do so, simply divide your account value by $1,000 (for example, an $8,600 account value divided by $1,000 = 8.6), then multiply the result by the number given under the heading “Expenses paid during the period” to estimate the expenses you paid on your account during the period.
Hypothetical Example for Comparison Purposes
The second section of the table provides information about hypothetical account values and hypothetical expenses based on the Fund’s actual expense ratio and an assumed rate of return of 5% per year before expenses, which is not the Fund’s actual return. The hypothetical account values and expenses may not be used to estimate the actual ending account balance or expenses you paid for the period. You may use this information to compare the ongoing costs of investing in the Fund and other funds. To do so, compare this 5% hypothetical example with the 5% hypothetical examples that appear in the shareholders reports of other funds.
Please note that the expenses shown in the table are meant to highlight and help you compare ongoing costs only and do not reflect transaction costs, such as sales charges or redemption fees, if any. Therefore, the second section of the table is useful in comparing ongoing costs only, and will not help you determine the relative total costs of owning different funds.
| | | | | | | | |
| | | Actual
Fund Return | | | Hypothetical
5% Return
(2.5% for
the period) | |
Actual Fund Return | | | | | | | | |
Beginning Account Value July 1, 2018 | | $ | 1,000.00 | | | $ | 1,000.00 | |
Ending Account Value December 31, 2018 | | $ | 1,011.50 | | | $ | 1,024.15 | |
Expenses Paid During Period* | | $ | 1.06 | | | $ | 1.07 | |
| * | Expenses are equal to the Fund’s annualized expense ratio of 0.21%** (for the period July 1, 2018-December 31, 2018), multiplied by the average account value over the period, multiplied by 184/365 (to reflect theone-half year period). |
| ** | May differ from expense ratio disclosed in the financial highlights, which is calculated based on the entire fiscal year’s data. |
| | | | |
| Elfun Tax-Exempt Income Fund | | | 51 | |
ElfunTax-Exempt Income Fund
Performance Summary — December 31, 2018 (Unaudited)
Quality Ratings
as of December 31, 2018 as a % of Fair Value(a)(b)
| | | | |
Moody’s / S&P /Rating* | | Percentage of
Fair Value | |
Aaa / AAA | | | 11.1 | % |
| |
Aa / AA | | | 49.4 | % |
| |
A / A | | | 29.2 | % |
| |
Baa / BBB | | | 5.4 | % |
| |
Ba / BB and lower | | | 0.0 | % |
| |
NR / Other | | | 4.9 | % |
| | | | |
| |
| | | 100.0 | % |
| | | | |
Sector Allocation
Portfolio composition as a % of Investments of $1,363,575 (in thousands) on December 31, 2018(a)(b)
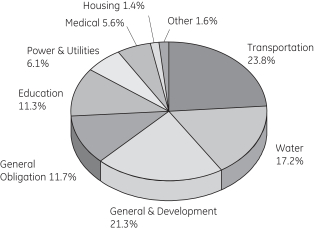
Average Annual Total Return for the periods ended December 31, 2018
Investment Class Shares (Inception date: 01/01/80)
| | | | | | | | | | | | | | | | |
| | | One Year | | | Five Year | | | Ten Year | | | Ending Value
of a $10,000
Investment | |
ElfunTax-Exempt Income Fund | | | 0.90 | % | | | 3.76 | % | | | 4.72 | % | | $ | 15,867 | |
| | | | |
Bloomberg Barclays U.S. Municipal Bond Index | | | 1.28 | % | | | 3.82 | % | | | 4.85 | % | | $ | 16,060 | |
| (a) | Fair Value basis is inclusive of short-term investment in State Street Institutional U.S. Government Money Market Fund - Class G Shares. |
| (b) | The securities information regarding holdings, allocations and other characteristics is presented to illustrate examples of securities that the Fund has bought and the diversity of areas in which the Fund may invest as of a particular date. It may not be representative of the Fund’s current or future investments and should not be construed as a recommendation to purchase or sell a particular security. |
| * | Moody’s Investors Services, Inc. (“Moody’s”) and S&P Global Ratings (“S&P”) are nationally recognized statistical rating organizations. The quality ratings represent the lower of Moody’s or S&P credit ratings. When a rating from only one of the rating agencies is available, that rating is used. Securities not rated by Moody’s or S&P are categorized as not rated. Credit quality measures a bond issuer’s ability to repay interest and principal in a timely manner. Credit quality ratings assigned by a rating agency are subject to change periodically and are not absolute standards of quality. In formulating investment decisions for the Fund, SSGA Funds Management, Inc. develops its own analysis of the credit quality and risks associated with individual debt instruments, rather than relying exclusively on rating agency ratings. |
| | |
| 52 | | Elfun Tax-Exempt Income Fund |
ElfunTax-Exempt Income Fund
Performance Summary, continued — December 31, 2018
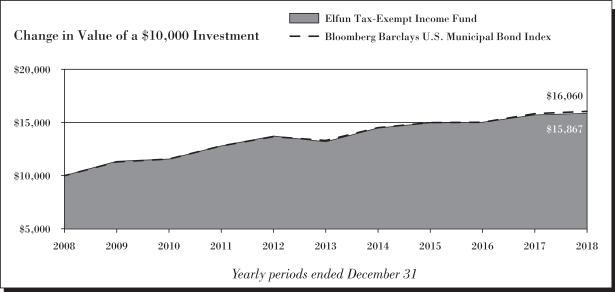
See Notes to Performance beginning on page 1 for further information.
Past performance does not predict future performance. The performance shown in the graphs and tables does not reflect the deduction of taxes that a shareholder would pay on Fund distributions or the redemption of Fund shares.
| | | | |
| Elfun Tax-Exempt Income Fund | | | 53 | |
ElfunTax-Exempt Income Fund
Schedule of Investments — December 31, 2018
| | | | | | | | |
| | | Principal
Amount ($) | | | Fair
Value
$ | |
| | | | | | | | |
|
| Municipal Bonds and Notes - 98.1%† | |
Alaska - 0.2% | | | | | | | | |
Alaska Housing Finance Corp. | | | | | | | | |
5.00% 12/01/27 (l) | | | 2,115,000 | | | | 2,324,639 | |
5.00% 12/01/27 | | | 385,000 | | | | 417,721 | |
| | | | | | | | |
| | | | | | | 2,742,360 | |
| | | | | | | | |
|
Arizona - 2.1% | |
Maricopa County Industrial Development Authority | | | | | | | | |
4.00% 01/01/41 | | | 3,000,000 | | | | 3,070,620 | |
Phoenix Civic Improvement Corp. (NPFG Insured) | | | | | | | | |
5.50%07/01/23 - 07/01/24 (m) | | | 7,260,000 | | | | 8,450,184 | |
Salt River Project Agricultural Improvement & Power District | | | | | | | | |
5.00% 12/01/21 - 01/01/38 | | | 9,500,000 | | | | 10,260,145 | |
University Medical Center Corp. | | | | | | | | |
6.50% 07/01/39 (l) | | | 1,000,000 | | | | 1,023,030 | |
University of Arizona | | | | | | | | |
5.00% 06/01/46 | | | 5,000,000 | | | | 5,607,000 | |
| | | | | | | | |
| | | | | | | 28,410,979 | |
| | | | | | | | |
|
Arkansas - 0.3% | |
University of Arkansas | | | | | | | | |
5.00% 11/01/46 - 11/01/47 | | | 3,580,000 | | | | 4,045,570 | |
| | | | | | | | |
| | | | | | | 4,045,570 | |
| | | | | | | | |
|
California - 10.6% | |
California Educational Facilities Authority | | | | | | | | |
6.13% 10/01/36 (l) | | | 1,500,000 | | | | 1,678,289 | |
California Health Facilities Financing Authority | | | | | | | | |
4.00% 11/15/41 | | | 1,000,000 | | | | 1,014,130 | |
5.50% 08/15/26 (l) | | | 5,000,000 | | | | 5,308,250 | |
6.00% 07/01/39 (l) | | | 5,000,000 | | | | 5,109,900 | |
California State Department of Water Resources | | | | | | | | |
5.00% 05/01/21 - 12/01/29 | | | 14,700,000 | | | | 16,605,372 | |
5.00% 12/01/21 (k) | | | 5,000 | | | | 5,467 | |
5.00% 12/01/29 (l) | | | 30,000 | | | | 35,194 | |
California State Public Works Board | | | | | | | | |
5.00% 10/01/28 | | | 1,500,000 | | | | 1,622,055 | |
5.13% 10/01/31 | | | 2,000,000 | | | | 2,166,040 | |
5.25% 09/01/29 | | | 10,160,000 | | | | 11,424,615 | |
| | | | | | | | |
| | | Principal
Amount ($) | | | Fair
Value
$ | |
6.00% 04/01/26 (l)(h) | | | 8,475,000 | | | | 8,568,903 | |
California State University | | | | | | | | |
4.00% 11/01/45 | | | 5,900,000 | | | | 6,039,122 | |
City of Los Angeles Wastewater System Revenue | | | | | | | | |
5.00% 06/01/43 | | | 10,000,000 | | | | 11,593,500 | |
Los Angeles Department of Water & Power Power System Revenue
Series 2018 D, | | | | | | | | |
5.00% 07/01/48 | | | 5,500,000 | | | | 6,314,770 | |
Los Angeles Harbor Department | | | | | | | | |
5.00% 08/01/26 | | | 8,000,000 | | | | 8,146,400 | |
Marin Healthcare District | | | | | | | | |
4.00% 08/01/47 | | | 2,500,000 | | | | 2,565,750 | |
San Diego Community College District | | | | | | | | |
5.00% 08/01/41 (l) | | | 10,000,000 | | | | 10,855,100 | |
San Francisco City & County AirportCommission-San Francisco International Airport | | | | | | | | |
5.00% 05/01/48 | | | 7,500,000 | | | | 8,509,725 | |
State of California | | | | | | | | |
5.00% 02/01/31 - 08/01/46 | | | 19,220,000 | | | | 20,949,620 | |
5.25% 04/01/35 - 11/01/40 | | | 12,750,000 | | | | 13,526,135 | |
University of California | | | | | | | | |
5.00% 05/15/38 | | | 4,000,000 | | | | 4,398,960 | |
| | | | | | | | |
| | | | | | | 146,437,297 | |
| | | | | | | | |
|
Colorado - 2.2% | |
Colorado Health Facilities Authority | | | | | | | | |
5.00% 06/01/47 | | | 1,750,000 | | | | 1,868,738 | |
Metro Wastewater Reclamation District | | | | | | | | |
5.00% 04/01/27 | | | 1,730,000 | | | | 1,888,209 | |
Regional Transportation District | | | | | | | | |
4.25% 11/01/36 | | | 3,405,000 | | | | 3,907,782 | |
5.00% 11/01/27 - 11/01/34 | | | 16,760,000 | | | | 19,683,289 | |
5.38% 06/01/31 | | | 2,500,000 | | | | 2,609,650 | |
| | | | | | | | |
| | | | | | | 29,957,668 | |
| | | | | | | | |
|
Connecticut - 4.9% | |
Connecticut State Health & Educational Facility Authority | | | | | | | | |
5.00% 07/01/40 (l) | | | 6,775,000 | | | | 7,093,289 | |
5.00% 07/01/46 | | | 6,500,000 | | | | 7,102,030 | |
See Notes to Schedules of Investments and Notes to Financial Statements.
| | |
| 54 | | Elfun Tax-Exempt Income Fund |
ElfunTax-Exempt Income Fund
Schedule of Investments, continued — December 31, 2018
| | | | | | | | |
| | | Principal
Amount ($) | | | Fair
Value
$ | |
| | | | | | | | |
South Central Connecticut Regional Water Authority | | | | | | | | |
5.00% 08/01/27 - 08/01/28 | | | 2,195,000 | | | | 2,449,022 | |
State of Connecticut | | | | | | | | |
5.00% 01/01/22 - 05/01/37 | | | 17,600,000 | | | | 19,435,506 | |
State of Connecticut Special Tax Revenue | | | | | | | | |
4.00% 09/01/36 | | | 5,000,000 | | | | 5,125,950 | |
5.00% 10/01/27 - 10/01/36 | | | 23,325,000 | | | | 25,645,418 | |
Town of Fairfield | | | | | | | | |
5.00% 08/01/21 | | | 1,000,000 | | | | 1,081,290 | |
| | | | | | | | |
| | | | | | | 67,932,505 | |
| | | | | | | | |
|
Delaware - 1.1% | |
Delaware State Health Facilities Authority | | | | | | | | |
5.00% 10/01/40 | | | 6,300,000 | | | | 6,592,320 | |
Delaware Transportation Authority | | | | | | | | |
5.00% 06/01/45 | | | 6,680,000 | | | | 7,347,399 | |
State of Delaware | | | | | | | | |
5.00% 07/01/28 (l) | | | 825,000 | | | | 863,758 | |
5.00% 07/01/28 | | | 175,000 | | | | 182,956 | |
| | | | | | | | |
| | | | | | | 14,986,433 | |
| | | | | | | | |
|
District of Columbia - 1.4% | |
District of Columbia | | | | | | | | |
5.00% 06/01/38 - 04/01/42 | | | 9,250,000 | | | | 10,297,357 | |
Washington Metropolitan Area Transit Authority | | | | | | | | |
5.00% 07/01/34 - 07/01/43 | | | 8,375,000 | | | | 9,573,099 | |
| | | | | | | | |
| | | | | | | 19,870,456 | |
| | | | | | | | |
|
Florida - 0.7% | |
Brevard County Health Facilities Authority | | | | | | | | |
7.00% 04/01/39 (h)(l) | | | 1,000,000 | | | | 1,012,700 | |
City of Tampa Water & Wastewater System Revenue | | | | | | | | |
5.00% 10/01/27 | | | 8,560,000 | | | | 9,244,629 | |
| | | | | | | | |
| | | | | | | 10,257,329 | |
| | | | | | | | |
|
Georgia - 8.3% | |
Athens-Clarke County Unified Government Water & Sewerage Revenue | | | | | | | | |
5.50% 01/01/38 (l) | | | 7,000,000 | | | | 7,000,000 | |
Atlanta Development Authority | | | | | | | | |
5.25% 07/01/40 | | | 8,925,000 | | | | 10,085,161 | |
| | | | | | | | |
| | | Principal
Amount ($) | | | Fair
Value
$ | |
City of Atlanta Department of Aviation | | | | | | | | |
5.00% 01/01/25 - 01/01/34 | | | 18,500,000 | | | | 20,003,205 | |
City of Atlanta Water & Wastewater Revenue | | | | | | | | |
5.00% 11/01/41 | | | 5,000,000 | | | | 5,707,800 | |
5.25% 11/01/30 | | | 5,690,000 | | | | 6,474,992 | |
6.25% 11/01/39 (l) | | | 10,000,000 | | | | 10,367,900 | |
City of Atlanta Water & Wastewater Revenue (AGMC Insured) | | | | | | | | |
5.75%
11/01/27 - 11/01/30 (m) | | | 9,500,000 | | | | 12,260,870 | |
DeKalb Newton & Gwinnett Counties Joint Development Authority | | | | | | | | |
6.00% 07/01/34 (l) | | | 8,500,000 | | | | 8,675,355 | |
Gwinnett County Development Authority | | | | | | | | |
5.00% 07/01/37 - 07/01/40 | | | 9,325,000 | | | | 10,518,639 | |
Municipal Electric Authority of Georgia | | | | | | | | |
5.00% 01/01/35 | | | 5,500,000 | | | | 5,927,185 | |
Richmond County Hospital Authority | | | | | | | | |
4.00% 01/01/36 | | | 2,855,000 | | | | 2,890,059 | |
State of Georgia | | | | | | | | |
4.00% 07/01/36 | | | 10,000,000 | | | | 10,667,500 | |
4.50% 01/01/29 (h)(l) | | | 3,000,000 | | | | 3,005,760 | |
| | | | | | | | |
| | | | | | | 113,584,426 | |
| | | | | | | | |
|
Hawaii - 1.9% | |
City & County of Honolulu | | | | | | | | |
5.00% 04/01/33 (l) | | | 10,000,000 | | | | 10,081,000 | |
State of Hawaii Airports System Revenue | | | | | | | | |
5.25% 07/01/24 | | | 15,800,000 | | | | 16,538,018 | |
| | | | | | | | |
| | | | | | | 26,619,018 | |
| | | | | | | | |
| | |
Illinois - 3.2% | | | | | | | | |
City of Chicago O’Hare International Airport Revenue | | | | | | | | |
5.00% 01/01/48 | | | 6,000,000 | | | | 6,667,920 | |
City of Chicago O’Hare International Airport Revenue | | | | | | | | |
5.00% 01/01/46 | | | 1,000,000 | | | | 1,084,420 | |
5.25% 01/01/42 | | | 8,000,000 | | | | 8,980,800 | |
5.63% 01/01/35 (l) | | | 4,035,000 | | | | 4,336,011 | |
5.63% 01/01/35 | | | 965,000 | | | | 1,021,568 | |
5.75% 01/01/39 (l) | | | 9,655,000 | | | | 10,398,821 | |
See Notes to Schedules of Investments and Notes to Financial Statements.
| | | | |
| Elfun Tax-Exempt Income Fund | | | 55 | |
ElfunTax-Exempt Income Fund
Schedule of Investments, continued — December 31, 2018
| | | | | | | | |
| | | Principal
Amount ($) | | | Fair
Value
$ | |
| | | | | | | | |
5.75% 01/01/39 | | | 1,845,000 | | | | 1,955,405 | |
Metropolitan Pier & Exposition Authority (NPFG Insured) | | | | | | | | |
5.65% 06/15/22 (k)(m) | | | 785,000 | | | | 879,941 | |
5.65% 06/15/22 (m) | | | 3,520,000 | | | | 3,837,997 | |
Southwestern Illinois Development Authority (NPFG Insured) | | | | | | | | |
5.00% 10/01/21 (k)(m) | | | 195,000 | | | | 210,867 | |
5.00% 10/01/21 (m) | | | 3,805,000 | | | | 4,090,261 | |
| | | | | | | | |
| | | | | | | 43,464,011 | |
| | | | | | | | |
|
Indiana - 0.7% | |
Indiana Municipal Power Agency | | | | | | | | |
5.50% 01/01/27 (l) | | | 2,500,000 | | | | 2,500,000 | |
Indianapolis Local Public Improvement Bond Bank | | | | | | | | |
5.75% 01/01/38 (l) | | | 1,370,000 | | | | 1,370,000 | |
5.75% 01/01/38 | | | 5,630,000 | | | | 5,630,000 | |
| | | | | | | | |
| | | | | | | 9,500,000 | |
| | | | | | | | |
|
Kentucky - 2.8% | |
Kentucky State Property & Building Commission | | | | | | | | |
5.00% 02/01/33 - 04/01/37 | | | 11,705,000 | | | | 12,938,475 | |
Kentucky State Property & Building Commission (AGC Insured) | | | | | | | | |
5.25% 02/01/27 (l)(m) | | | 10,665,000 | | | | 10,694,106 | |
Louisville & Jefferson County Metropolitan Sewer District | | | | | | | | |
5.00% 05/15/30 | | | 14,340,000 | | | | 15,428,406 | |
| | | | | | | | |
| | | | | | | 39,060,987 | |
| | | | | | | | |
|
Louisiana - 1.1% | |
City of New Orleans Sewerage Service Revenue | | | | | | | | |
5.00% 06/01/44 - 06/01/45 | | | 3,900,000 | | | | 4,160,871 | |
Louisiana Public Facilities Authority | | | | | | | | |
5.00% 05/15/47 (l) | | | 10,000 | | | | 11,805 | |
State of Louisiana | | | | | | | | |
5.00% 09/01/19 (k) | | | 10,050,000 | | | | 10,265,572 | |
| | | | | | | | |
| | | | | | | 14,438,248 | |
| | | | | | | | |
|
Maine - 0.3% | |
Maine Health & Higher Educational Facilities Authority | | | | | | | | |
5.25% 07/01/21 (l) | | | 315,000 | | | | 330,272 | |
| | | | | | | | |
| | | Principal
Amount ($) | | | Fair
Value
$ | |
5.25% 07/01/21 | | | 1,475,000 | | | | 1,545,239 | |
Maine Turnpike Authority | | | | | | | | |
5.00% 07/01/42 | | | 1,000,000 | | | | 1,078,290 | |
6.00% 07/01/34 (l) | | | 1,250,000 | | | | 1,276,413 | |
| | | | | | | | |
| | | | | | | 4,230,214 | |
| | | | | | | | |
|
Maryland - 3.1% | |
City of Baltimore | | | | | | | | |
5.00% 07/01/38 - 07/01/46 | | | 23,375,000 | | | | 26,081,791 | |
County of Prince George’s | | | | | | | | |
5.00% 09/15/24 | | | 3,450,000 | | | | 3,724,413 | |
5.00% 09/15/25 (l) | | | 5,340,000 | | | | 5,782,366 | |
Maryland Economic Development Corp. | | | | | | | | |
5.75% 06/01/35 (l) | | | 3,000,000 | | | | 3,164,760 | |
Maryland Health & Higher Educational Facilities Authority | | | | | | | | |
5.00% 07/01/34 (l) | | | 1,945,000 | | | | 1,975,789 | |
5.00% 07/01/34 - 08/15/41 | | | 1,355,000 | | | | 1,432,576 | |
| | | | | | | | |
| | | | | | | 42,161,695 | |
| | | | | | | | |
|
Massachusetts - 4.4% | |
Commonwealth of Massachusetts | | | | | | | | |
4.00% 05/01/44 | | | 3,045,000 | | | | 3,104,316 | |
5.00% 03/01/46 | | | 10,000,000 | | | | 10,984,400 | |
5.25% 09/01/43 | | | 7,525,000 | | | | 8,845,863 | |
Massachusetts Department of Transportation | | | | | | | | |
5.00% 01/01/37 | | | 10,000,000 | | | | 10,273,900 | |
Massachusetts Development Finance Agency | | | | | | | | |
5.75% 07/01/39 (l) | | | 3,325,000 | | | | 3,391,201 | |
5.75% 07/01/39 | | | 1,675,000 | | | | 1,700,745 | |
Massachusetts Health & Educational Facilities Authority | | | | | | | | |
5.00% 07/01/34 (l) | | | 7,500,000 | | | | 7,619,850 | |
Massachusetts School Building Authority | | | | | | | | |
5.00% 08/15/28 | | | 5,000,000 | | | | 5,482,200 | |
Massachusetts Water Resources Authority | | | | | | | | |
5.00% 08/01/32 | | | 4,140,000 | | | | 4,602,024 | |
5.00% 08/01/41 (l) | | | 3,000,000 | | | | 3,229,680 | |
6.50% 07/15/19 (k) | | | 945,000 | | | | 968,975 | |
| | | | | | | | |
| | | | | | | 60,203,154 | |
| | | | | | | | |
|
Michigan - 1.0% | |
Lansing Board of Water & Light | | | | | | | | |
5.00% 07/01/37 | | | 3,500,000 | | | | 3,721,690 | |
See Notes to Schedules of Investments and Notes to Financial Statements.
| | |
| 56 | | Elfun Tax-Exempt Income Fund |
ElfunTax-Exempt Income Fund
Schedule of Investments, continued — December 31, 2018
| | | | | | | | |
| | | Principal
Amount ($) | | | Fair
Value
$ | |
| | | | | | | | |
Michigan Finance Authority | | | | | | | | |
5.00% 12/01/47 | | | 4,000,000 | | | | 4,270,200 | |
State of Michigan | | | | | | | | |
5.00% 03/15/27 | | | 4,415,000 | | | | 5,275,572 | |
University of Michigan Revenue | | | | | | | | |
5.00% 04/01/46 | | | 1,000,000 | | | | 1,123,080 | |
| | | | | | | | |
| | | | | | | 14,390,542 | |
| | | | | | | | |
|
Minnesota - 0.9% | |
City of Minneapolis | | | | | | | | |
4.00% 11/15/48 | | | 1,000,000 | | | | 993,060 | |
City of Rochester | | | | | | | | |
4.00% 11/15/48 | | | 5,330,000 | | | | 5,459,679 | |
Housing & Redevelopment Authority of The City of Saint Paul Minnesota | | | | | | | | |
4.00% 11/15/43 | | | 1,000,000 | | | | 1,004,420 | |
University of Minnesota | | | | | | | | |
5.00% 09/01/39 | | | 4,350,000 | | | | 4,987,623 | |
| | | | | | | | |
| | | | | | | 12,444,782 | |
| | | | | | | | |
|
Missouri - 1.7% | |
Bi-State Development Agency of the Missouri-Illinois Metropolitan District | | | | | | | | |
5.00% 10/01/44 | | | 8,010,000 | | | | 8,766,304 | |
Health & Educational Facilities Authority of the State of Missouri | | | | | | | | |
4.00% 11/15/48 | | | 2,200,000 | | | | 2,237,796 | |
Kansas City Sanitary Sewer System Revenue | | | | | | | | |
4.00% 01/01/40 | | | 1,725,000 | | | | 1,786,376 | |
Metropolitan St. Louis Sewer District | | | | | | | | |
5.00% 05/01/45 - 05/01/46 | | | 3,000,000 | | | | 3,353,490 | |
Missouri Highway & Transportation Commission | | | | | | | | |
5.00% 05/01/21 | | | 4,610,000 | | | | 4,801,960 | |
Missouri Joint Municipal Electric Utility Commission | | | | | | | | |
5.00% 01/01/34 | | | 1,950,000 | | | | 2,155,355 | |
Missouri State Environmental Improvement & Energy Resources Authority | | | | | | | | |
5.00% 01/01/24 | | | 525,000 | | | | 526,302 | |
| | | | | | | | |
| | | | | | | 23,627,583 | |
| | | | | | | | |
|
New Jersey - 7.3% | |
New Jersey Economic Development Authority | | | | | | | | |
5.00% 06/15/41 - 06/15/43 | | | 11,750,000 | | | | 12,368,625 | |
| | | | | | | | |
| | | Principal
Amount ($) | | | Fair
Value
$ | |
5.25% 06/15/40 | | | 4,000,000 | | | | 4,258,320 | |
5.50% 12/15/29 (l) | | | 3,345,000 | | | | 3,401,230 | |
5.50% 12/15/29 | | | 1,655,000 | | | | 1,678,319 | |
New Jersey Educational Facilities Authority | | | | | | | | |
5.50%
09/01/30 - 09/01/33 | | | 14,700,000 | | | | 16,410,188 | |
New Jersey Health Care Facilities Financing Authority (AGMC Insured) | | | | | | | | |
4.13% 07/01/38 (m) | | | 6,215,000 | | | | 6,294,552 | |
New Jersey Higher Education Student Assistance Authority | | | | | | | | |
5.63% 06/01/30 | | | 7,500,000 | | | | 7,610,250 | |
New Jersey State Turnpike Authority | | | | | | | | |
5.00%
01/01/33 - 01/01/45 | | | 25,870,000 | | | | 29,219,869 | |
5.00% 01/01/38 (l) | | | 4,000,000 | | | | 4,421,600 | |
New Jersey Transportation Trust Fund Authority | | | | | | | | |
5.00%
12/15/34 - 06/15/45 | | | 7,250,000 | | | | 7,785,205 | |
5.25% 06/15/36 | | | 7,350,000 | | | | 7,684,572 | |
| | | | | | | | |
| | | | | | | 101,132,730 | |
| | | | | | | | |
|
New Mexico - 0.1% | |
New Mexico Finance Authority | | | | | | | | |
5.00% 06/15/23 | | | 1,750,000 | | | | 1,826,178 | |
| | | | | | | | |
|
New York - 11.0% | |
City of New York | | | | | | | | |
5.00%
08/01/26 - 04/01/43 | | | 7,500,000 | | | | 8,613,615 | |
Hudson Yards Infrastructure Corp. | | | | | | | | |
5.00%
02/15/39 - 02/15/45 | | | 11,000,000 | | | | 12,388,470 | |
Long Island Power Authority | | | | | | | | |
6.00% 05/01/33 (l) | | | 7,500,000 | | | | 7,605,975 | |
Metropolitan Transportation Authority | | | | | | | | |
5.00%
11/15/29 - 11/15/37 | | | 7,960,000 | | | | 8,801,751 | |
New York City Transitional Finance Authority Building Aid Revenue | | | | | | | | |
5.00% 07/15/36 | | | 6,000,000 | | | | 6,945,360 | |
See Notes to Schedules of Investments and Notes to Financial Statements.
| | | | |
| Elfun Tax-Exempt Income Fund | | | 57 | |
ElfunTax-Exempt Income Fund
Schedule of Investments, continued — December 31, 2018
| | | | | | | | |
| | | Principal
Amount ($) | | | Fair
Value
$ | |
| | | | | | | | |
New York City Transitional Finance Authority Future Tax Secured Revenue | | | | | | | | |
5.00%
11/01/21 - 02/01/43 | | | 32,500,000 | | | | 35,366,200 | |
New York Liberty Development Corp. | | | | | | | | |
5.00% 11/15/44 | | | 5,000,000 | | | | 5,316,450 | |
5.13% 01/15/44 | | | 10,000,000 | | | | 10,279,500 | |
New York State Dormitory Authority | | | | | | | | |
4.00%
08/01/38 - 07/01/41 | | | 6,655,000 | | | | 6,848,159 | |
5.00% 03/15/45 - 07/01/46 | | | 16,500,000 | | | | 18,781,500 | |
5.50% 05/01/37 (l) | | | 2,500,000 | | | | 2,531,675 | |
6.00% 07/01/40 (l) | | | 2,000,000 | | | | 2,124,220 | |
New York State Thruway Authority | | | | | | | | |
5.00% 05/01/19 | | | 6,000,000 | | | | 6,063,840 | |
New York State Urban Development Corp. | | | | | | | | |
5.50% 01/01/19 | | | 9,000,000 | | | | 9,000,000 | |
Port Authority of New York & New Jersey | | | | | | | | |
5.00% 11/15/47 - 09/01/48 | | | 6,500,000 | | | | 7,399,885 | |
Westchester County Healthcare Corp. | | | | | | | | |
6.13% 11/01/37 (l) | | | 2,220,000 | | | | 2,390,985 | |
6.13% 11/01/37 | | | 280,000 | | | | 297,962 | |
| | | | | | | | |
| | | | | | | 150,755,547 | |
| | | | | | | | |
| | |
North Carolina - 1.2% | | | | | | | | |
City of Charlotte | | | | | | | | |
5.00% 06/01/23 | | | 4,320,000 | | | | 4,507,359 | |
North Carolina Capital Facilities Finance Agency | | | | | | | | |
4.00% 10/01/44 | | | 2,000,000 | | | | 2,085,180 | |
North Carolina Medical Care Commission | | | | | | | | |
4.00% 06/01/42 | | | 1,500,000 | | | | 1,550,535 | |
State of North Carolina | | | | | | | | |
4.75% 05/01/30 (l) | | | 4,130,000 | | | | 4,289,583 | |
The University of North Carolina at Charlotte | | | | | | | | |
5.00% 10/01/47 | | | 3,545,000 | | | | 3,996,491 | |
| | | | | | | | |
| | | | | | | 16,429,148 | |
| | | | | | | | |
| | |
Ohio - 5.2% | | | | | | | | |
City of Cincinnati Water System Revenue | | | | | | | | |
5.00% 12/01/36 (l) | | | 2,500,000 | | | | 2,722,900 | |
| | | | | | | | |
| | | Principal
Amount
($) | | | Fair
Value
$ | |
City of Columbus | | | | | | | | |
5.00%
07/01/26 - 08/15/30 (l) | | | 18,055,000 | | | | 20,406,894 | |
County of Franklin | | | | | | | | |
5.00% 12/01/47 | | | 1,125,000 | | | | 1,252,282 | |
Cuyahoga Community College District | | | | | | | | |
5.00% 08/01/26 (l) | | | 1,800,000 | | | | 1,861,974 | |
Northeast Ohio Regional Sewer District | | | | | | | | |
4.00% 11/15/43 | | | 7,550,000 | | | | 7,861,286 | |
5.00% 11/15/38 (l) | | | 12,000,000 | | | | 13,476,480 | |
Ohio State Turnpike Commission | | | | | | | | |
5.25% 02/15/39 | | | 18,250,000 | | | | 20,103,470 | |
University of Cincinnati | | | | | | | | |
5.00% 06/01/45 | | | 3,500,000 | | | | 3,939,285 | |
| | | | | | | | |
| | | | | | | 71,624,571 | |
| | | | | | | | |
| | |
Oklahoma - 0.8% | | | | | | | | |
Oklahoma Capital Improvement Authority | | | | | | | | |
5.00%
07/01/28 - 07/01/29 | | | 5,000,000 | | | | 5,656,650 | |
Oklahoma Turnpike Authority | | | | | | | | |
5.00%
01/01/28 - 01/01/47 | | | 5,000,000 | | | | 5,388,055 | |
| | | | | | | | |
| | | | | | | 11,044,705 | |
| | | | | | | | |
| | |
Oregon - 0.9% | | | | | | | | |
Eugene Water Revenue | | | | | | | | |
4.00% 08/01/45 | | | 1,000,000 | | | | 1,026,970 | |
Salem-Keizer School District No 24J | | | | | | | | |
5.00% 06/15/37 | | | 10,000,000 | | | | 11,670,800 | |
| | | | | | | | |
| | | | | | | 12,697,770 | |
| | | | | | | | |
| | |
Pennsylvania - 5.8% | | | | | | | | |
City of Philadelphia | | | | | | | | |
5.00% 08/01/36 | | | 5,000,000 | | | | 5,524,150 | |
City of Philadelphia Water & Wastewater Revenue | | | | | | | | |
5.00%
01/01/36 - 10/01/47 | | | 23,000,000 | | | | 25,179,480 | |
Delaware River Port Authority, Revenue, Series 2018 A, | | | | | | | | |
5.00%
01/01/29 - 01/01/40 | | | 8,600,000 | | | | 9,703,606 | |
Pennsylvania Economic Development Financing Authority | | | | | | | | |
4.00% 11/15/42 | | | 5,000,000 | | | | 5,003,500 | |
See Notes to Schedules of Investments and Notes to Financial Statements.
| | |
| 58 | | Elfun Tax-Exempt Income Fund |
ElfunTax-Exempt Income Fund
Schedule of Investments, continued — December 31, 2018
| | | | | | | | |
| | | Principal
Amount ($) | | | Fair
Value
$ | |
| | | | | | | | |
Pennsylvania State University | | | | | | | | |
5.00% 09/01/41 | | | 1,200,000 | | | | 1,364,016 | |
Pennsylvania Turnpike Commission | | | | | | | | |
5.00% 06/01/29 (l) | | | 10,000,000 | | | | 10,132,821 | |
5.25% 06/01/39 (l) | | | 9,500,000 | | | | 9,636,230 | |
6.00% 12/01/34 (l) | | | 12,000,000 | | | | 12,930,600 | |
| | | | | | | | |
| | | | | | | 79,474,403 | |
| | | | | | | | |
| | |
Rhode Island - 0.6% | | | | | | | | |
Rhode Island Health & Educational Building Corp. | | | | | | | | |
5.00% 09/01/43 | | | 5,000,000 | | | | 5,507,250 | |
Rhode Island Infrastructure Bank Water Pollution Control Revenue | | | | | | | | |
5.00% 10/01/28 | | | 2,200,000 | | | | 2,569,050 | |
| | | | | | | | |
| | | | | | | 8,076,300 | |
| | | | | | | | |
| | |
South Carolina - 1.6% | | | | | | | | |
Piedmont Municipal Power Agency | | | | | | | | |
5.00% 01/01/25 | | | 2,315,000 | | | | 2,489,991 | |
Piedmont Municipal Power Agency (AGC Insured) | | | | | | | | |
5.75% 01/01/34 (m) | | | 5,500,000 | | | | 5,951,880 | |
South Carolina State Public Service Authority | | | | | | | | |
5.00% 12/01/37 - 12/01/38 | | | 12,000,000 | | | | 12,930,180 | |
5.50% 01/01/38 (l) | | | 1,190,000 | | | | 1,190,000 | |
| | | | | | | | |
| | | | | | | 22,562,051 | |
| | | | | | | | |
| | |
Tennessee - 0.6% | | | | | | | | |
City of Memphis | | | | | | | | |
4.00% 06/01/46 | | | 5,000,000 | | | | 5,112,600 | |
County of Shelby | | | | | | | | |
5.00% 03/01/21 | | | 3,500,000 | | | | 3,625,580 | |
| | | | | | | | |
| | | | | | | 8,738,180 | |
| | | | | | | | |
| | |
Texas - 7.4% | | | | | | | | |
City of Austin Airport System Revenue | | | | | | | | |
5.00% 11/15/46 (h) | | | 3,000,000 | | | | 3,330,960 | |
City of Austin Water & Wastewater System Revenue | | | | | | | | |
5.00% 11/15/42 | | | 13,595,000 | | | | 14,719,714 | |
City of Dallas Waterworks & Sewer System Revenue | | | | | | | | |
5.00% 10/01/46 | | | 3,550,000 | | | | 4,022,292 | |
City of Houston Utility System Revenue | | | | | | | | |
5.00% 05/15/28 - 11/15/33 | | | 10,470,000 | | | | 11,423,633 | |
| | | | | | | | |
| | | Principal
Amount ($) | | | Fair
Value
$ | |
5.25%
11/15/30 - 11/15/31 (l) | | | 12,000,000 | | | | 12,744,960 | |
County of Harris | | | | | | | | |
5.00% 08/15/41 | | | 3,000,000 | | | | 3,370,980 | |
Dallas/Fort Worth International Airport | | | | | | | | |
5.25% 11/01/29 | | | 5,000,000 | | | | 5,597,350 | |
Harris County-Houston Sports Authority | | | | | | | | |
5.00% 11/15/30 | | | 2,000,000 | | | | 2,234,160 | |
North Texas Tollway Authority | | | | | | | | |
5.00% 09/01/31 (l) | | | 3,500,000 | | | | 3,776,360 | |
5.00% 01/01/39 - 01/01/48 | | | 5,000,000 | | | | 5,519,490 | |
6.00% 01/01/38 (l) | | | 5,000,000 | | | | 5,399,350 | |
North Texas Tollway Authority (AGMC Insured) | | | | | | | | |
4.00% 01/01/34 (m) | | | 5,000,000 | | | | 5,208,450 | |
Texas Transportation Commission State Highway Fund | | | | | | | | |
5.00% 04/01/23 | | | 10,750,000 | | | | 12,060,425 | |
The University of Texas System | | | | | | | | |
5.00% 08/15/26 | | | 10,000,000 | | | | 11,922,500 | |
| | | | | | | | |
| | | | | | | 101,330,624 | |
| | | | | | | | |
| | |
Utah - 0.9% | | | | | | | | |
Utah State Board of Regents | | | | | | | | |
5.00% 11/01/30 | | | 4,000,000 | | | | 4,203,880 | |
Utah Transit Authority | | | | | | | | |
5.00% 06/15/42 (l) | | | 3,045,000 | | | | 3,360,888 | |
5.00% 06/15/42 | | | 4,455,000 | | | | 4,761,504 | |
| | | | | | | | |
| | | | | | | 12,326,272 | |
| | | | | | | | |
| | |
Virginia - 1.8% | | | | | | | | |
County of Fairfax | | | | | | | | |
4.00% 10/01/35 | | | 6,645,000 | | | | 7,216,935 | |
County of Henrico Water & Sewer Revenue | | | | | | | | |
5.00% 05/01/46 | | | 2,530,000 | | | | 2,857,003 | |
University of Virginia | | | | | | | | |
5.00% 04/01/47 | | | 6,000,000 | | | | 6,851,640 | |
Virginia Resources Authority | | | | | | | | |
4.00% 11/01/41 | | | 5,585,000 | | | | 5,836,883 | |
5.00% 11/01/46 | | | 1,720,000 | | | | 1,953,198 | |
| | | | | | | | |
| | | | | | | 24,715,659 | |
| | | | | | | | |
| |
Total Municipal Bonds and Notes
(Cost $1,329,038,434) | | | | 1,351,099,395 | |
| | | | | | | | |
See Notes to Schedules of Investments and Notes to Financial Statements.
| | | | |
| Elfun Tax-Exempt Income Fund | | | 59 | |
ElfunTax-Exempt Income Fund
Schedule of Investments, continued — December 31, 2018
| | | | | | | | |
| | | Number
of Shares | | | Fair
Value
$ | |
| | | | | | | | |
|
| Short-Term Investments - 0.9% | |
State Street Institutional U.S. Government Money Market Fund - Class G Shares 2.31%
(Cost $12,476,076) (d)(n) | | | 12,476,076 | | | | 12,476,076 | |
| | | | | | | | |
| |
Total Investments
(Cost $1,341,514,510) | | | | 1,363,575,471 | |
| |
Other Assets and Liabilities,
net - 1.0% | | | | 13,404,569 | |
| | | | | | | | |
| |
| NET ASSETS - 100.0% | | | | 1,376,980,040 | |
| | | | | | | | |
The following table presents the Fund’s investments measured at fair value on a recurring basis at December 31, 2018:
| | | | | | | | | | | | | | | | | | |
| Fund | | Investments | | Level 1 | | | Level 2 | | | Level 3 | | | Total | |
| | | | | | | | | | | | | | | | | | |
| | | | | |
| ElfunTax-Exempt Income Fund | | Investments in Securities | | | | | | | | | | | | | | | | |
| | | | | |
| | Municipal Bonds and Notes | | $ | — | | | $ | 1,351,099,395 | | | $ | — | | | $ | 1,351,099,395 | |
| | | | | |
| | Short-Term Investments | | | 12,476,076 | | | | — | | | | — | | | | 12,476,076 | |
| | | | | | | | | | | | | | | | | | |
| | | | | |
| | Total Investments in Securities | | $ | 12,476,076 | | | $ | 1,351,099,395 | | | $ | — | | | $ | 1,363,575,471 | |
| | | | | | | | �� | | | | | | | | | | |
Affiliate Table
| | | | | | | | | | | | | | | | | | | | | | | | | | | | | | | | | | | | |
| | | Number
of Shares
Held at
12/31/17 | | | Value At
12/31/17 | | | Cost of
Purchases | | | Proceeds
from
Shares
Sold | | | Realized
Gain
(Loss) | | | Change in
Unrealized
Appreciation/
Depreciation | | | Number
of Shares
Held at
12/31/18 | | | Value at
12/31/18 | | | Dividend
Income | |
State Street Institutional U.S. Government Money Market Fund - Class G Shares | | | 6,243,370 | | | $ | 6,243,370 | | | $ | 267,257,800 | | | $ | 261,025,094 | | | $ | — | | | $ | — | | | | 12,476,076 | | | $ | 12,476,076 | | | $ | 216,085 | |
See Notes to Schedules of Investments and Notes to Financial Statements.
| | |
| 60 | | Elfun Tax-Exempt Income Fund |
Elfun Income Fund
Management Discussion of Fund Performance — December 31, 2018 (Unaudited)
The Elfun Income Fund (the “Fund”) seeks to provide a high level of income consistent with prudent investment management and the preservation of capital. The Fund’s benchmark is the Bloomberg Barclays U.S. Aggregate Bond Index (the “Index”).
For the 12-month period ended December 31, 2018 (the “Reporting Period”), the total return for the Fund was -0.80% and the Index was 0.01%. The Fund and Index returns reflect the reinvestment of dividends and other income. The Fund’s performance reflects the expenses of managing the Fund, including brokerage and advisory expenses. The Index is unmanaged and Index returns do not reflect fees and expenses of any kind, which would have a negative impact on returns.
The primary drivers of underperformance relative to the Index were the Fund’s over-weights to both high yield and investment grade corporates. The Fund’s underweight to mortgage backed securities offset some underperformance versus the Index.
We expected the credit and economics cycles to continue, which they have. However, trade tensions between the U.S. & China, BREXIT, equity and commodity volatility weighed heavily on the credit markets causing high yield and investment grade corporate spreads to widen 183bps (108bps in December alone) and 47bps, respectively, negatively impacting the Fund’s performance.
The Fund had a large underweight in its mortgage backed securities position anticipating volatility in that asset class as the Federal Reserve would begin reducing its balance sheet exposure. Mortgage spreads did widen in the fourth quarter and the Fund pared its position still maintaining an underweight. This activity provided positive excess returns.
The Fund used treasury futures, interest rate swaps and other derivatives in order to actively manage duration during the Reporting Period. The Fund’s use of these derivatives contributed to Fund liquidity and key rate exposure management versus utilizing cash instruments only.
The views expressed above reflect those of the Fund’s portfolio manager only through the Reporting Period, and do not necessarily represent the views of the Adviser as a whole. Any such views are subject to change at any time based upon market or other conditions and the Adviser disclaims any responsibility to update such views. These views may not be relied on as investment advice and, because investment decisions for a fund are based on numerous factors, may not be relied on as an indication of trading intent on behalf of any fund.
Elfun Income Fund
Understanding Your Fund’s Expenses (Unaudited)
As a shareholder of the Fund you incur ongoing costs. Ongoing costs include portfolio management fees, professional fees, administrative fees and other Fund expenses. The following example is intended to help you understand your ongoing costs (in dollars) of investing in the Fund and to compare these costs with the ongoing costs of investing in other mutual funds.
To illustrate these ongoing costs, we have provided an example and calculated the expenses paid by investors in units of the Fund during the period. The information in the following table is based on an investment of $1,000, which is invested at the beginning of the period and held for the entiresix-month period ended December 31, 2018.
Actual Expenses
The first section of the table provides information about actual account values and actual expenses. You may use the information in this section, together with the amount you invested, to estimate the expenses that you paid over the period. To do so, simply divide your account value by $1,000 (for example, an $8,600 account value divided by $1,000 = 8.6), then multiply the result by the number given under the heading “Expenses paid during the period” to estimate the expenses you paid on your account during the period.
Hypothetical Example for Comparison Purposes
The second section of the table provides information about hypothetical account values and hypothetical expenses based on the Fund’s actual expense ratio and an assumed rate of return of 5% per year before expenses, which is not the Fund’s actual return. The hypothetical account values and expenses may not be used to estimate the actual ending account balance or expenses you paid for the period. You may use this information to compare the ongoing costs of investing in the Fund and other funds. To do so, compare this 5% hypothetical example with the 5% hypothetical examples that appear in the shareholders reports of other funds.
Please note that the expenses shown in the table are meant to highlight and help you compare ongoing costs only and do not reflect transaction costs, such as sales charges or redemption fees, if any. Therefore, the second section of the table is useful in comparing ongoing costs only, and will not help you determine the relative total costs of owning different funds.
| | | | | | | | |
| | | Actual
Fund Return | | | Hypothetical
5% Return
(2.5% for
the period) | |
Actual Fund Return | | | | | | | | |
Beginning Account Value July 1, 2018 | | $ | 1,000.00 | | | $ | 1,000.00 | |
Ending Account Value December 31, 2018 | | $ | 1,012.80 | | | $ | 1,023.54 | |
Expenses Paid During Period* | | $ | 1.67 | | | $ | 1.68 | |
| * | | Expenses are equal to the Fund’s annualized expense ratio of 0.33%** (for the period July 1, 2018-December 31, 2018), multiplied by the average account value over the period, multiplied by 184/365 (to reflect theone-half year period). |
| ** | | May differ from expense ratio disclosed in the financial highlights, which is calculated based on the entire fiscal year’s data. |
Elfun Income Fund
Performance Summary — December 31, 2018 (Unaudited)
Quality Ratings
as of December 31, 2018 as a % of Fair Value(a)(b)
| | | | |
Moody’s / S&P /Rating* | | Percentage
of Fair
Value | |
Aaa / AAA | | | 20.0 | % |
| |
Aa / AA | | | 43.0 | % |
| |
A / A | | | 7.6 | % |
| |
Baa / BBB | | | 20.0 | % |
| |
Ba / BB and lower | | | 9.1 | % |
| |
NR / Other | | | 0.3 | % |
| | | | |
| | | 100.0 | % |
| | | | |
Sector Allocation
Portfolio composition as a % of Fair Value of $264,633 (in thousands) as of December 31, 2018(a)(b)
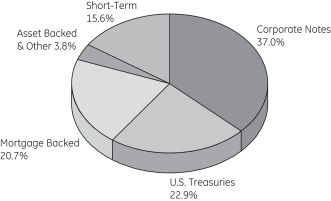
Average Annual Total Return for the periods ended December 31, 2018
(Inception date: 12/31/84)
| | | | | | | | | | | | | | | | |
| �� | | One Year | | | Five Year | | | Ten Year | | | Ending Value
of a $10,000
Investment | |
Elfun Income Fund | | | -0.80 | % | | | 2.49 | % | | | 4.11 | % | | $ | 14,966 | |
| | | | |
Bloomberg Barclays U.S. Aggregate Bond Index | | | 0.01 | % | | | 2.52 | % | | | 3.48 | % | | $ | 14,075 | |
| (a) | Fair Value basis is inclusive of short-term investment in State Street Institutional U.S. Government Money Market Fund Class G Shares. |
| (b) | The securities information regarding holdings, allocations and other characteristics is presented to illustrate examples of securities that the Fund has bought and the diversity of areas in which the Fund may invest as of a particular date. It may not be representative of the Fund’s current or future investments and should not be construed as a recommendation to purchase or sell a particular security. |
| * | Moody’s Investors Services, Inc. (“Moody’s”) and S&P Global Ratings (“S&P”) are nationally recognized statistical rating organizations. The quality ratings represent the lower of Moody’s or S&P credit ratings. When a rating from only one of the rating agencies is available, that rating is used. Securities not rated by Moody’s or S&P are categorized as not rated. Credit quality measures a bond issuer’s ability to repay interest and principal in a timely manner. Credit quality ratings assigned by a rating agency are subject to change periodically and are not absolute standards of quality. In formulating investment decisions for the Fund, SSGA Funds Management, Inc. develops its own analysis of the credit quality and risks associated with individual debt instruments, rather than relying exclusively on rating agency ratings. |
Elfun Income Fund
Performance Summary, continued — December 31, 2018 (Unaudited)
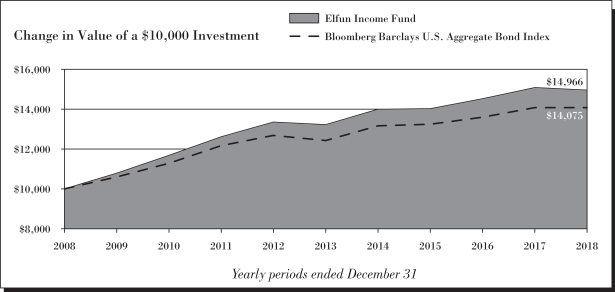
See Notes to Performance beginning on page 1 for further information.
Past performance does not predict future performance. The performance shown in the graphs and tables does not reflect the deduction of taxes that a shareholder would pay on Fund distributions or the redemption of Fund shares.
Elfun Income Fund
Schedule of Investments — December 31, 2018
| | | | | | | | |
| | | Principal
Amount ($) | | | Fair
Value
$ | |
| | | | | | | | |
|
| Bonds and Notes - 97.3%† | |
U.S. Treasuries - 26.4% | |
U.S. Treasury Bonds | | | | | | | | |
2.25% 08/15/46 (h) | | | 1,602,000 | | | | 1,368,942 | |
2.75% 11/15/42 (h) | | | 606,000 | | | | 579,359 | |
3.13% 05/15/48 (h) | | | 1,058,600 | | | | 1,078,721 | |
3.75% 11/15/43 (h) | | | 358,000 | | | | 404,275 | |
4.50% 02/15/36 (h) | | | 2,046,200 | | | | 2,522,241 | |
U.S. Treasury Notes | | | | | | | | |
1.38% 12/15/19 (h) | | | 8,355,800 | | | | 8,256,807 | |
1.50%11/30/19 - 08/15/20 (h) | | | 11,392,800 | | | | 11,253,096 | |
2.25% 03/31/20 (h) | | | 10,914,700 | | | | 10,871,016 | |
2.75% 11/15/23 | | | 9,699,800 | | | | 9,807,426 | |
2.88% 11/30/25 | | | 9,607,400 | | | | 9,780,357 | |
2.88% 08/15/28 (h) | | | 4,584,100 | | | | 4,655,030 | |
| | | | | | | | |
| | | | | | | 60,577,270 | |
| | | | | | | | |
|
Agency Mortgage Backed - 20.1% | |
Federal Home Loan Mortgage Corp. | | | | | | | | |
4.05% 09/25/28 (i) | | | 1,045,000 | | | | 1,100,557 | |
4.50% 06/01/33 - 02/01/35 (h) | | | 13,474 | | | | 14,100 | |
5.00% 07/01/35 (h) | | | 111,528 | | | | 118,630 | |
5.50% 05/01/20 - 04/01/39 (h) | | | 197,778 | | | | 212,746 | |
6.00% 07/01/19 | | | 421 | | | | 421 | |
6.00% 05/01/20 - 11/01/37 (h) | | | 407,885 | | | | 447,336 | |
6.50% 07/01/29 (h) | | | 1,796 | | | | 1,822 | |
7.00% 01/01/27 - 08/01/36 (h) | | | 88,952 | | | | 98,071 | |
7.50% 11/01/29 - 09/01/33 (h) | | | 7,396 | | | | 7,936 | |
8.00% 11/01/30 (h) | | | 3,699 | | | | 4,025 | |
Federal National Mortgage Assoc. | | | | | | | | |
3.50% 08/01/45 (h) | | | 112,717 | | | | 113,074 | |
4.00% 05/01/19 - 03/01/41 (h) | | | 1,138,340 | | | | 1,171,718 | |
4.50% 05/01/19 - 02/01/40 (h) | | | 921,825 | | | | 964,948 | |
5.00% 07/01/20 - 05/01/39 (h) | | | 299,032 | | | | 317,682 | |
5.50% 06/01/20 - 01/01/39 (h) | | | 750,558 | | | | 806,830 | |
6.00% 09/01/19 - 05/01/41 (h) | | | 1,553,445 | | | | 1,711,920 | |
6.50% 05/01/21 - 08/01/36 (h) | | | 91,654 | | | | 98,863 | |
7.00% 10/01/32 - 02/01/34 (h) | | | 9,295 | | | | 9,867 | |
7.50% 12/01/26 - 12/01/33 (h) | | | 45,899 | | | | 50,306 | |
8.00% 06/01/24 - 10/01/31 (h) | | | 13,552 | | | | 14,614 | |
8.50% 04/01/30 (h) | | | 2,662 | | | | 3,117 | |
9.00% 12/01/22 (h) | | | 1,241 | | | | 1,304 | |
Federal National Mortgage Assoc. 1.60% + 12 month USD LIBOR | | | | | | | | |
3.97% 04/01/37(h)(i) | | | 2,508 | | | | 2,567 | |
Federal National Mortgage Assoc. TBA | | | | | | | | |
2.50% TBA (c) | | | 4,847,000 | | | | 4,734,918 | |
| | | | | | | | |
| | | Principal
Amount ($) | | | Fair
Value
$ | |
3.00% TBA (c) | | | 7,909,840 | | | | 7,737,054 | |
3.50% TBA (c) | | | 4,743,000 | | | | 4,741,511 | |
4.00% TBA (c) | | | 5,573,000 | | | | 5,681,060 | |
4.50% TBA (c) | | | 1,518,000 | | | | 1,571,434 | |
Government National Mortgage Assoc. | | | | | | | | |
4.00%
01/20/41 - 04/20/43 (h) | | | 1,756,667 | | | | 1,815,210 | |
4.50%
08/15/33 - 03/20/41 (h) | | | 828,993 | | | | 867,647 | |
5.00% 08/15/33 (h) | | | 43,907 | | | | 45,851 | |
6.00%
04/15/27 - 09/15/36 (h) | | | 213,974 | | | | 237,747 | |
6.50%
04/15/19 - 09/15/36 (h) | | | 78,979 | | | | 85,377 | |
7.00%
11/15/27 - 10/15/36 (h) | | | 45,011 | | | | 49,540 | |
7.50%
03/15/23 - 11/15/31 (h) | | | 20,958 | | | | 21,650 | |
8.00%
09/15/27 - 06/15/30 (h) | | | 26,445 | | | | 27,818 | |
9.00% 12/15/21 (h) | | | 622 | | | | 649 | |
3.00% TBA (c) | | | 2,272,000 | | | | 2,236,789 | |
3.50% TBA (c) | | | 9,061,000 | | | | 9,123,521 | |
| | | | | | | | |
| | | | | | | 46,250,230 | |
| | | | | | | | |
|
Agency Collateralized Mortgage Obligations - 0.8% | |
Federal Home Loan Mortgage Corp. | | | | | | | | |
0.08% 09/25/43 (g)(h)(i) | | | 950,221 | | | | 2,450 | |
3.86% 11/25/28 (i) | | | 448,000 | | | | 465,190 | |
4.06% 10/25/28 (i) | | | 763,000 | | | | 803,788 | |
Federal Home Loan Mortgage Corp. REMIC | | | | | | | | |
3.50%11/15/24 - 11/15/30 (g)(h) | | | 329,283 | | | | 24,982 | |
5.50% 06/15/33 (g)(h) | | | 40,769 | | | | 8,033 | |
Federal Home Loan Mortgage Corp. REMIC 6.60% - 1 month USD LIBOR | | | | | | | | |
4.14% 08/15/25(g)(h)(i) | | | 132,414 | | | | 6,827 | |
Federal Home Loan Mortgage Corp. STRIPS | | | | | | | | |
0.00% 08/01/27 (a)(d)(h) | | | 788 | | | | 692 | |
8.00% 02/01/23 - 07/01/24 (g)(h) | | | 2,487 | | | | 348 | |
Federal National Mortgage Assoc. REMIC | | | | | | | | |
0.00% 12/25/22 (a)(d)(h) | | | 420 | | | | 411 | |
1.10% 12/25/42 (g)(h)(i) | | | 208,291 | | | | 15,175 | |
5.00%02/25/40 - 09/25/40 (g)(h) | | | 154,843 | | | | 18,150 | |
See Notes to Schedules of Investments and Notes to Financial Statements.
Elfun Income Fund
Schedule of Investments, continued — December 31, 2018
| | | | | | | | |
| | | Principal
Amount ($) | | | Fair
Value
$ | |
| | | | | | | | |
1,008.00% 05/25/22 (g)(h) | | | 2 | | | | 22 | |
Federal National Mortgage Assoc. REMIC 6.00% - 1 month USD LIBOR | | | | | | | | |
3.49% 07/25/38(g)(h)(i) | | | 44,225 | | | | 5,771 | |
Federal National Mortgage Assoc. REMIC 6.20% - 1 month USD LIBOR | | | | | | | | |
3.69% 06/25/48(g)(i) | | | 1,953,003 | | | | 319,685 | |
Federal National Mortgage Assoc. STRIPS | | | | | | | | |
0.00% 12/25/34 (a)(d)(h) | | | 41,875 | | | | 34,972 | |
4.50%
08/25/35 - 01/25/36 (g)(h) | | | 84,691 | | | | 10,514 | |
5.00%
03/25/38 - 05/25/38 (g)(h) | | | 46,695 | | | | 9,988 | |
5.50% 12/25/33 (g)(h) | | | 13,112 | | | | 2,883 | |
6.00% 01/25/35 (g)(h) | | | 47,681 | | | | 11,075 | |
7.50% 11/25/23 (g)(h) | | | 6,018 | | | | 729 | |
8.00%
08/25/23 - 07/25/24 (g)(h) | | | 4,917 | | | | 697 | |
8.50% 07/25/22 (g)(h) | | | 807 | | | | 69 | |
8.50% 07/25/22 (g) | | | 20 | | | | 2 | |
9.00% 05/25/22 (g)(h) | | | 698 | | | | 54 | |
Government National Mortgage Assoc. REMIC | | | | | | | | |
4.50% 05/20/38 - 08/16/39 (g)(h) | | | 95,807 | | | | 6,691 | |
5.00% 09/20/38 (g)(h) | | | 25,077 | | | | 750 | |
Government National Mortgage Assoc. REMIC 6.80% - 1 month USD LIBOR | | | | | | | | |
4.34% 01/16/40(g)(h)(i) | | | 228,208 | | | | 38,082 | |
| | | | | | | | |
| | | | | | | 1,788,030 | |
| | | | | | | | |
|
Asset Backed - 2.8% | |
American Express Credit Account Master Trust2017-6 | | | | | | | | |
2.04% 05/15/23(h) | | | 1,488,065 | | | | 1,465,926 | |
American Express Credit Account Master Trust2018-1 | | | | | | | | |
2.67% 10/17/22 | | | 603,000 | | | | 600,786 | |
American Express Credit Account Master Trust2018-8 | | | | | | | | |
3.18% 04/15/24 | | | 1,264,000 | | | | 1,273,243 | |
BA Credit Card Trust2018-A1 | | | | | | | | |
2.70% 07/17/23(h) | | | 528,000 | | | | 525,827 | |
BMW Floorplan Master Owner Trust2018-1 | | | | | | | | |
3.15% 05/15/23(b) | | | 333,000 | | | | 333,481 | |
| | | | | | | | |
| | | Principal
Amount ($) | | | Fair
Value
$ | |
Chase Funding Trust2004-1 | | | | | | | | |
4.99% 11/25/33(h)(j) | | | 172,808 | | | | 172,808 | |
Citibank Credit Card Issuance Trust2016-A1 | | | | | | | | |
1.75% 11/19/21(h) | | | 1,869,000 | | | | 1,849,569 | |
Securitized Term Auto Receivables Trust2018-1A | | | | | | | | |
3.30% 11/25/22(b) | | | 135,000 | | | | 135,079 | |
| | | | | | | | |
| | | | | | | 6,356,719 | |
| | | | | | | | |
|
Corporate Notes - 42.7% | |
1011778 BC ULC/New Red Finance Inc. | | | | | | | | |
4.25% 05/15/24(b)(h) | | | 95,000 | | | | 87,241 | |
21st Century Fox America Inc. | | | | | | | | |
3.38% 11/15/26 (h) | | | 24,000 | | | | 23,673 | |
4.50% 02/15/21 (h) | | | 79,000 | | | | 81,039 | |
4.75% 11/15/46 (h) | | | 17,000 | | | | 18,148 | |
6.65% 11/15/37 (h) | | | 108,000 | | | | 138,920 | |
Abbott Laboratories | | | | | | | | |
2.90% 11/30/21 (h) | | | 319,000 | | | | 315,992 | |
3.75% 11/30/26 (h) | | | 36,000 | | | | 35,577 | |
4.90% 11/30/46 (h) | | | 110,000 | | | | 115,636 | |
AbbVie Inc. | | | | | | | | |
3.20% 05/14/26 (h) | | | 120,000 | | | | 111,149 | |
4.45% 05/14/46 (h) | | | 109,000 | | | | 95,809 | |
4.70% 05/14/45 (h) | | | 47,000 | | | | 42,967 | |
4.88% 11/14/48 (h) | | | 39,000 | | | | 36,397 | |
Acadia Healthcare Company Inc. | | | | | | | | |
6.50% 03/01/24(h) | | | 243,000 | | | | 233,921 | |
Activision Blizzard Inc. | | | | | | | | |
2.30% 09/15/21(h) | | | 452,000 | | | | 439,909 | |
AES Corp. | | | | | | | | |
4.88% 05/15/23(h) | | | 260,000 | | | | 254,259 | |
Aetna Inc. | | | | | | | | |
3.50% 11/15/24(h) | | | 118,000 | | | | 113,941 | |
Aflac Inc. | | | | | | | | |
4.00% 10/15/46(h) | | | 44,000 | | | | 40,429 | |
Alexandria Real Estate Equities Inc. | | | | | | | | |
4.70% 07/01/30(h) | | | 56,000 | | | | 56,707 | |
Alibaba Group Holding Ltd. | | | | | | | | |
4.00% 12/06/37 (h) | | | 200,000 | | | | 179,514 | |
4.40% 12/06/57 (h) | | | 200,000 | | | | 179,318 | |
Alimentation Couche-Tard Inc. | | | | | | | | |
2.70% 07/26/22 (b)(h) | | | 175,000 | | | | 169,183 | |
4.50% 07/26/47 (b)(h) | | | 47,000 | | | | 42,764 | |
Allergan Finance LLC | | | | | | | | |
3.25% 10/01/22 (h) | | | 125,000 | | | | 121,757 | |
4.63% 10/01/42 (h) | | | 19,000 | | | | 17,421 | |
See Notes to Schedules of Investments and Notes to Financial Statements.
Elfun Income Fund
Schedule of Investments, continued — December 31, 2018
| | | | | | | | |
| | | Principal
Amount ($) | | | Fair
Value
$ | |
| | | | | | | | |
Allergan Funding SCS | | | | | | | | |
3.00% 03/12/20 (h) | | | 246,000 | | | | 245,048 | |
3.45% 03/15/22 (h) | | | 106,000 | | | | 104,329 | |
Allergan Sales LLC | | | | | | | | |
5.00% 12/15/21(b)(h) | | | 292,000 | | | | 300,579 | |
Altria Group Inc. | | | | | | | | |
2.95% 05/02/23 (h) | | | 90,000 | | | | 85,572 | |
3.88% 09/16/46 (h) | | | 8,000 | | | | 6,100 | |
4.50% 05/02/43 (h) | | | 59,000 | | | | 49,098 | |
Amazon.com Inc. | | | | | | | | |
2.80% 08/22/24 (h) | | | 69,000 | | | | 67,061 | |
3.15% 08/22/27 (h) | | | 62,000 | | | | 59,813 | |
3.88% 08/22/37 (h) | | | 48,000 | | | | 46,691 | |
4.05% 08/22/47 (h) | | | 52,000 | | | | 50,961 | |
4.25% 08/22/57 (h) | | | 65,000 | | | | 64,137 | |
Ameren Corp. | | | | | | | | |
3.65% 02/15/26(h) | | | 77,000 | | | | 75,746 | |
America Movil SAB de C.V. | | | | | | | | |
3.13% 07/16/22 (h) | | | 205,000 | | | | 200,925 | |
5.00% 03/30/20 (h) | | | 317,000 | | | | 322,522 | |
American Axle & Manufacturing Inc. | | | | | | | | |
6.25% 04/01/25(h) | | | 176,000 | | | | 160,121 | |
American Campus Communities Operating Partnership LP | | | | | | | | |
3.35% 10/01/20 (h) | | | 157,000 | | | | 156,444 | |
4.13% 07/01/24 (h) | | | 62,000 | | | | 62,183 | |
American Express Co. | | | | | | | | |
3.00% 10/30/24(h) | | | 170,000 | | | | 162,647 | |
American International Group Inc. | | | | | | | | |
4.50% 07/16/44 (h) | | | 141,000 | | | | 125,336 | |
6.40% 12/15/20 (h) | | | 79,000 | | | | 83,366 | |
American International Group Inc. (5.75% fixed rate until 04/01/28; 2.87% + 3 month USD LIBOR thereafter) | | | | | | | | |
5.75% 04/01/48(h)(i) | | | 79,000 | | | | 69,132 | |
American Tower Corp. (REIT) | | | | | | | | |
3.38% 10/15/26 (h) | | | 49,000 | | | | 45,652 | |
3.40% 02/15/19 (h) | | | 385,000 | | | | 384,788 | |
American Water Capital Corp. | | | | | | | | |
2.95% 09/01/27(h) | | | 111,000 | | | | 104,610 | |
Amgen Inc. | | | | | | | | |
2.20% 05/22/19 (h) | | | 334,000 | | | | 332,784 | |
2.65% 05/11/22 (h) | | | 190,000 | | | | 185,752 | |
3.20% 11/02/27 (h) | | | 80,000 | | | | 75,196 | |
4.56% 06/15/48 (h) | | | 102,000 | | | | 97,836 | |
AMN Healthcare Inc. | | | | | | | | |
5.13% 10/01/24(b)(h) | | | 289,000 | | | | 276,816 | |
| | | | | | | | |
| | | Principal
Amount ($) | | | Fair
Value
$ | |
Anadarko Petroleum Corp. | | | | | | | | |
4.85% 03/15/21 (h) | | | 13,000 | | | | 13,276 | |
6.20% 03/15/40 (h) | | | 51,000 | | | | 53,276 | |
Andeavor Logistics LP/Tesoro Logistics Finance Corp. | | | | | | | | |
5.20% 12/01/47 (h) | | | 49,000 | | | | 44,057 | |
5.25% 01/15/25 (h) | | | 734,000 | | | | 733,060 | |
5.50% 10/15/19 (h) | | | 293,000 | | | | 295,687 | |
6.25% 10/15/22 (h) | | | 199,000 | | | | 202,849 | |
Anheuser-Busch Companies LLC/Anheuser-Busch InBev Worldwide Inc. | | | | | | | | |
4.70% 02/01/36 (b)(h) | | | 51,000 | | | | 47,056 | |
4.90% 02/01/46 (b)(h) | | | 116,000 | | | | 107,332 | |
Anheuser-Busch InBev Finance Inc. | | | | | | | | |
2.65% 02/01/21(h) | | | 58,000 | | | | 57,010 | |
Anheuser-Busch InBev Worldwide Inc. | | | | | | | | |
2.50% 07/15/22 (h) | | | 184,000 | | | | 175,630 | |
4.00% 04/13/28 (h) | | | 41,000 | | | | 39,220 | |
4.38% 04/15/38 (h) | | | 181,000 | | | | 161,988 | |
4.60% 04/15/48 (h) | | | 62,000 | | | | 55,483 | |
4.75% 04/15/58 (h) | | | 58,000 | | | | 50,439 | |
Anthem Inc. | | | | | | | | |
3.30% 01/15/23(h) | | | 100,000 | | | | 98,394 | |
ANZ New Zealand International Ltd. | | | | | | | | |
3.45% 01/21/28(b)(h) | | | 200,000 | | | | 191,882 | |
Apache Corp. | | | | | | | | |
4.38% 10/15/28 (h) | | | 47,000 | | | | 43,871 | |
5.10% 09/01/40 (h) | | | 68,000 | | | | 61,418 | |
Apple Inc. | | | | | | | | |
2.50% 02/09/22 (h) | | | 91,000 | | | | 89,710 | |
2.85% 05/11/24 (h) | | | 117,000 | | | | 114,052 | |
3.35% 02/09/27 (h) | | | 63,000 | | | | 61,541 | |
3.45% 02/09/45 (h) | | | 177,000 | | | | 156,817 | |
3.85% 08/04/46 (h) | | | 187,000 | | | | 175,902 | |
4.25% 02/09/47 (h) | | | 24,000 | | | | 24,021 | |
Applied Materials Inc. | | | | | | | | |
4.35% 04/01/47(h) | | | 75,000 | | | | 73,354 | |
Aptiv PLC | | | | | | | | |
4.40% 10/01/46(h) | | | 81,000 | | | | 71,751 | |
Aramark Services Inc. | | | | | | | | |
5.00% 02/01/28(b)(h) | | | 147,000 | | | | 137,479 | |
Archer-Daniels-Midland Co. | | | | | | | | |
2.50% 08/11/26(h) | | | 82,000 | | | | 74,845 | |
Arconic Inc. | | | | | | | | |
5.13% 10/01/24 (h) | | | 194,000 | | | | 186,810 | |
6.15% 08/15/20 (h) | | | 90,000 | | | | 91,822 | |
Ascension Health | | | | | | | | |
4.85% 11/15/53(h) | | | 84,000 | | | | 90,984 | |
See Notes to Schedules of Investments and Notes to Financial Statements.
Elfun Income Fund
Schedule of Investments, continued — December 31, 2018
| | | | | | | | |
| | | Principal
Amount ($) | | | Fair
Value
$ | |
| | | | | | | | |
Ashland LLC | | | | | | | | |
4.75% 08/15/22(h) | | | 95,000 | | | | 93,379 | |
AstraZeneca PLC | | | | | | | | |
2.38% 11/16/20 (h) | | | 67,000 | | | | 65,876 | |
3.38% 11/16/25 (h) | | | 96,000 | | | | 92,979 | |
3.50% 08/17/23 (h) | | | 93,000 | | | | 92,113 | |
4.00% 01/17/29 (h) | | | 62,000 | | | | 61,583 | |
4.38% 08/17/48 (h) | | | 77,000 | | | | 73,046 | |
AT&T Inc. | | | | | | | | |
3.00% 06/30/22 (h) | | | 106,000 | | | | 103,466 | |
3.80% 03/15/22 (h) | | | 215,000 | | | | 215,909 | |
4.10% 02/15/28 | | | 148,000 | | | | 142,286 | |
4.45% 04/01/24 (h) | | | 87,000 | | | | 88,275 | |
4.50% 05/15/35 (h) | | | 133,000 | | | | 120,559 | |
4.55% 03/09/49 (h) | | | 70,000 | | | | 60,304 | |
4.75% 05/15/46 (h) | | | 50,000 | | | | 44,445 | |
4.80% 06/15/44 (h) | | | 104,000 | | | | 93,287 | |
5.00% 03/01/21 (h) | | | 152,000 | | | | 157,179 | |
5.15% 11/15/46 | | | 23,000 | | | | 21,415 | |
5.25% 03/01/37 (h) | | | 90,000 | | | | 88,243 | |
5.45% 03/01/47 (h) | | | 176,000 | | | | 171,616 | |
Athene Holding Ltd. | | | | | | | | |
4.13% 01/12/28(h) | | | 102,000 | | | | 92,606 | |
Avangrid Inc. | | | | | | | | |
3.15% 12/01/24(h) | | | 172,000 | | | | 165,903 | |
Baidu Inc. | | | | | | | | |
2.88% 07/06/22(h) | | | 255,000 | | | | 248,227 | |
Bank of America Corp. | | | | | | | | |
2.65% 04/01/19 (h) | | | 255,000 | | | | 254,699 | |
3.25% 10/21/27 (h) | | | 3,000 | | | | 2,777 | |
3.95% 04/21/25 (h) | | | 117,000 | | | | 113,388 | |
4.25% 10/22/26 (h) | | | 205,000 | | | | 199,420 | |
Bank of America Corp. (2.37% fixed rate until 07/21/20; 0.66% + 3 month USD LIBOR thereafter) | | | | | | | | |
2.37% 07/21/21(h)(i) | | | 176,000 | | | | 173,011 | |
Bank of America Corp. (3.12% fixed rate until 01/20/22; 1.16% + 3 month USD LIBOR thereafter) | | | | | | | | |
3.12% 01/20/23(h)(i) | | | 117,000 | | | | 114,967 | |
Bank of America Corp. (3.37% fixed rate until 01/23/25; 0.81% + 3 month USD LIBOR thereafter) | | | | | | | | |
3.37% 01/23/26(h)(i) | | | 209,000 | | | | 199,781 | |
Bank of America Corp. (3.42% fixed rate until 12/20/27; 1.04% + 3 month USD LIBOR thereafter) | | | | | | | | |
3.42% 12/20/28(h)(i) | | | 150,000 | | | | 139,692 | |
| | | | | | | | |
| | | Principal
Amount ($) | | | Fair
Value
$ | |
Bank of America Corp. (3.95% fixed rate until 01/23/48; 1.19% + 3 month USD LIBOR thereafter) | | | | | | | | |
3.95% 01/23/49(h)(i) | | | 141,000 | | | | 125,508 | |
Bank of America Corp. (4.24% fixed rate until 04/24/37; 1.81% + 3 month USD LIBOR thereafter) | | | | | | | | |
4.24% 04/24/38(h)(i) | | | 119,000 | | | | 112,824 | |
Bank of America Corp. (4.27% fixed rate until 07/23/28; 1.31% + 3 month USD LIBOR thereafter) | | | | | | | | |
4.27% 07/23/29(h)(i) | | | 52,000 | | | | 51,730 | |
Bank of America Corp. (4.44% fixed rate until 01/20/47; 1.99% + 3 month USD LIBOR thereafter) | | | | | | | | |
4.44% 01/20/48(h)(i) | | | 64,000 | | | | 61,819 | |
Bank of Montreal (4.34% fixed rate until 10/05/23; 1.28% + USD 5 year Swap Rate thereafter) | | | | | | | | |
4.34% 10/05/28(h)(i) | | | 229,000 | | | | 227,986 | |
Barclays PLC | | | | | | | | |
4.84% 05/09/28(h) | | | 200,000 | | | | 183,232 | |
Barclays PLC
(4.97% fixed rate until 05/16/28; 1.90% + 3 month USD LIBOR thereafter) | | | | | | | | |
4.97% 05/16/29(h)(i) | | | 200,000 | | | | 192,388 | |
Barrick North America Finance LLC | | | | | | | | |
5.70% 05/30/41(h) | | | 24,000 | | | | 25,336 | |
BAT Capital Corp. | | | | | | | | |
2.30% 08/14/20 | | | 420,000 | | | | 410,113 | |
2.76% 08/15/22 | | | 134,000 | | | | 126,495 | |
3.56% 08/15/27 | | | 220,000 | | | | 194,995 | |
4.39% 08/15/37 | | | 42,000 | | | | 34,516 | |
4.54% 08/15/47 | | | 60,000 | | | | 48,014 | |
Bausch Health Companies Inc. | | | | | | | | |
7.00% 03/15/24(b)(h) | | | 439,000 | | | | 444,672 | |
Baxalta Inc. | | | | | | | | |
2.88% 06/23/20(h) | | | 50,000 | | | | 49,455 | |
Bayer US Finance II LLC | | | | | | | | |
3.50% 06/25/21 (b)(h) | | | 416,000 | | | | 413,608 | |
3.88% 12/15/23 (b)(h) | | | 216,000 | | | | 211,997 | |
4.70% 07/15/64 (b)(h) | | | 33,000 | | | | 27,425 | |
Becton Dickinson and Co. | | | | | | | | |
2.89% 06/06/22 (h) | | | 135,000 | | | | 130,696 | |
3.70% 06/06/27 (h) | | | 138,000 | | | | 130,703 | |
See Notes to Schedules of Investments and Notes to Financial Statements.
Elfun Income Fund
Schedule of Investments, continued — December 31, 2018
| | | | | | | | |
| | | Principal
Amount ($) | | | Fair
Value
$ | |
| | | | | | | | |
3.73% 12/15/24 (h) | | | 3,000 | | | | 2,901 | |
4.67% 06/06/47 (h) | | | 17,000 | | | | 15,997 | |
4.69% 12/15/44 (h) | | | 19,000 | | | | 17,880 | |
Berkshire Hathaway Energy Co. | | | | | | | | |
2.40% 02/01/20 (h) | | | 197,000 | | | | 195,686 | |
3.25% 04/15/28 (h) | | | 65,000 | | | | 61,870 | |
3.80% 07/15/48 (h) | | | 56,000 | | | | 50,084 | |
6.13% 04/01/36 (h) | | | 38,000 | | | | 45,322 | |
Berkshire Hathaway Inc. | | | | | | | | |
4.50% 02/11/43(h) | | | 3,000 | | | | 3,116 | |
Berry Global Inc. | | | | | | | | |
5.13% 07/15/23(h) | | | 260,000 | | | | 257,455 | |
BHP Billiton Finance USA Ltd. | | | | | | | | |
5.00% 09/30/43(h) | | | 39,000 | | | | 42,605 | |
Biogen Inc. | | | | | | | | |
2.90% 09/15/20(h) | | | 63,000 | | | | 62,597 | |
BNP Paribas S.A. | | | | | | | | |
5.00% 01/15/21(h) | | | 75,000 | | | | 77,468 | |
BNP Paribas S.A. (5.13% fixed rate until 11/15/27; 2.84% + USD 5 year Swap Rate thereafter) | | | | | | | | |
5.13% 12/31/99(b)(h)(i) | | | 200,000 | | | | 173,320 | |
Boston Scientific Corp. | | | | | | | | |
4.00% 03/01/28(h) | | | 107,000 | | | | 104,114 | |
BP Capital Markets America Inc. | | | | | | | | |
3.02% 01/16/27 | | | 358,000 | | | | 336,055 | |
3.22% 11/28/23 | | | 94,000 | | | | 92,753 | |
Brighthouse Financial Inc. | | | | | | | | |
3.70% 06/22/27 (h) | | | 14,000 | | | | 11,827 | |
4.70% 06/22/47 (h) | | | 6,000 | | | | 4,458 | |
Brixmor Operating Partnership LP | | | | | | | | |
3.90% 03/15/27(h) | | | 62,000 | | | | 58,769 | |
Broadcom Corp./Broadcom Cayman Finance Ltd. | | | | | | | | |
2.20% 01/15/21 (h) | | | 71,000 | | | | 69,386 | |
2.65% 01/15/23 (h) | | | 32,000 | | | | 29,658 | |
3.13% 01/15/25 (h) | | | 38,000 | | | | 34,100 | |
3.88% 01/15/27 (h) | | | 57,000 | | | | 51,108 | |
Brown-Forman Corp. | | | | | | | | |
4.00% 04/15/38(h) | | | 30,000 | | | | 29,346 | |
Buckeye Partners LP | | | | | | | | |
5.60% 10/15/44(h) | | | 24,000 | | | | 20,674 | |
Bunge Limited Finance Corp. | | | | | | | | |
3.75% 09/25/27(h) | | | 49,000 | | | | 43,563 | |
Burlington Northern Santa Fe LLC | | | | | | | | |
3.75% 04/01/24 | | | 226,000 | | | | 231,738 | |
4.15% 12/15/48 (h) | | | 114,000 | | | | 111,267 | |
| | | | | | | | |
| | | Principal
Amount ($) | | | Fair
Value
$ | |
Campbell Soup Co. | | | | | | | | |
3.30% 03/15/21(h) | | | 231,000 | | | | 229,711 | |
Canadian Natural Resources Ltd. | | | | | | | | |
3.85% 06/01/27 (h) | | | 32,000 | | | | 30,276 | |
4.95% 06/01/47 (h) | | | 31,000 | | | | 29,828 | |
Capital One Financial Corp. | | | | | | | | |
3.75% 07/28/26 (h) | | | 48,000 | | | | 43,872 | |
4.20% 10/29/25 (h) | | | 54,000 | | | | 51,911 | |
Cardinal Health Inc. | | | | | | | | |
2.62% 06/15/22 (h) | | | 70,000 | | | | 67,516 | |
3.08% 06/15/24 (h) | | | 51,000 | | | | 48,175 | |
Caterpillar Financial Services Corp. | | | | | | | | |
2.55% 11/29/22(h) | | | 150,000 | | | | 145,639 | |
Caterpillar Inc. | | | | | | | | |
3.80% 08/15/42(h) | | | 42,000 | | | | 39,130 | |
Catholic Health Initiatives | | | | | | | | |
4.35% 11/01/42(h) | | | 130,000 | | | | 115,335 | |
CBL & Associates LP | | | | | | | | |
4.60% 10/15/24(h) | | | 335,000 | | | | 246,882 | |
CBS Corp. | | | | | | | | |
2.50% 02/15/23 (h) | | | 97,000 | | | | 91,311 | |
2.90% 01/15/27 (h) | | | 62,000 | | | | 54,810 | |
CCO Holdings LLC/CCO Holdings Capital Corp. | | | | | | | | |
5.00% 02/01/28(h)(b) | | | 289,000 | | | | 265,854 | |
Celgene Corp. | | | | | | | | |
3.45% 11/15/27 (h) | | | 3,000 | | | | 2,731 | |
4.35% 11/15/47 (h) | | | 4,000 | | | | 3,387 | |
4.55% 02/20/48 (h) | | | 113,000 | | | | 98,207 | |
5.00% 08/15/45 (h) | | | 42,000 | | | | 38,777 | |
Cenovus Energy Inc. | | | | | | | | |
4.25% 04/15/27 (h) | | | 55,000 | | | | 50,082 | |
4.45% 09/15/42 (h) | | | 36,000 | | | | 27,633 | |
5.40% 06/15/47 (h) | | | 19,000 | | | | 16,375 | |
CenterPoint Energy Inc. | | | | | | | | |
2.50% 09/01/22 (h) | | | 274,000 | | | | 261,865 | |
3.60% 11/01/21 | | | 121,000 | | | | 120,913 | |
CenturyLink Inc. | | | | | | | | |
5.63% 04/01/25 (h) | | | 95,000 | | | | 83,706 | |
5.80% 03/15/22 (h) | | | 87,000 | | | | 83,554 | |
CF Industries Inc. | | | | | | | | |
7.13% 05/01/20(h) | | | 179,000 | | | | 184,175 | |
Charter Communications Operating LLC/Charter Communications Operating Capital | | | | | | | | |
3.58% 07/23/20 (h) | | | 107,000 | | | | 106,865 | |
4.91% 07/23/25 (h) | | | 41,000 | | | | 40,697 | |
5.38% 05/01/47 (h) | | | 73,000 | | | | 65,647 | |
5.75% 04/01/48 (h) | | | 49,000 | | | | 45,845 | |
See Notes to Schedules of Investments and Notes to Financial Statements.
Elfun Income Fund
Schedule of Investments, continued — December 31, 2018
| | | | | | | | |
| | | Principal
Amount ($) | | | Fair
Value
$ | |
| | | | | | | | |
6.38% 10/23/35 (h) | | | 19,000 | | | | 19,460 | |
6.48% 10/23/45 (h) | | | 46,000 | | | | 46,732 | |
Chevron Corp. | | | | | | | | |
2.42% 11/17/20 (h) | | | 79,000 | | | | 78,277 | |
3.19% 06/24/23 (h) | | | 87,000 | | | | 86,854 | |
Church & Dwight Company Inc. | | | | | | | | |
2.45% 08/01/22(h) | | | 63,000 | | | | 60,827 | |
Cigna Corp. | | | | | | | | |
4.13% 11/15/25 (b)(h) | | | 155,000 | | | | 154,670 | |
4.38% 10/15/28 (b)(h) | | | 62,000 | | | | 62,293 | |
4.80% 08/15/38 (b)(h) | | | 48,000 | | | | 47,216 | |
4.90% 12/15/48 (b)(h) | | | 58,000 | | | | 56,715 | |
Cigna Corp. | | | | | | | | |
3.20% 09/17/20 (b)(h) | | | 214,000 | | | | 213,187 | |
3.40% 09/17/21 (b)(h) | | | 107,000 | | | | 106,782 | |
3.75% 07/15/23 (b)(h) | | | 93,000 | | | | 92,772 | |
Cigna Holding Co. | | | | | | | | |
3.25% 04/15/25 (h) | | | 96,000 | | | | 91,341 | |
3.88% 10/15/47 (h) | | | 71,000 | | | | 59,521 | |
Cimarex Energy Co. | | | | | | | | |
3.90% 05/15/27(h) | | | 15,000 | | | | 13,980 | |
Cinemark USA Inc. | | | | | | | | |
4.88% 06/01/23(h) | | | 180,000 | | | | 172,800 | |
Cisco Systems Inc. | | | | | | | | |
5.90% 02/15/39(h) | | | 70,000 | | | | 86,495 | |
Citibank NA | | | | | | | | |
2.85% 02/12/21 (h) | | | 255,000 | | | | 252,769 | |
3.05% 05/01/20 | | | 261,000 | | | | 260,441 | |
Citigroup Inc. | | | | | | | | |
2.70% 10/27/22 (h) | | | 112,000 | | | | 107,936 | |
2.75% 04/25/22 | | | 405,000 | | | | 393,263 | |
2.90% 12/08/21 (h) | | | 176,000 | | | | 172,843 | |
4.40% 06/10/25 (h) | | | 48,000 | | | | 47,159 | |
4.45% 09/29/27 (h) | | | 35,000 | | | | 33,737 | |
4.65%
07/30/45 -07/23/48 (h) | | | 216,000 | | | | 211,070 | |
4.75% 05/18/46 (h) | | | 69,000 | | | | 63,980 | |
Citigroup Inc. (2.88% fixed rate until 07/24/22; 0.95% + 3 month USD LIBOR thereafter) | | | | | | | | |
2.88% 07/24/23(h)(i) | | | 78,000 | | | | 75,408 | |
Citigroup Inc. (3.88% fixed rate until 01/24/38; 1.17% + 3 month USD LIBOR thereafter) | | | | | | | | |
3.88% 01/24/39(h)(i) | | | 52,000 | | | | 46,495 | |
Citigroup Inc. (4.28% fixed rate until 04/24/47; 1.84% + 3 month USD LIBOR thereafter) | | | | | | | | |
4.28% 04/24/48(h)(i) | | | 36,000 | | | | 33,587 | |
| | | | | | | | |
| | | Principal
Amount ($) | | | Fair
Value
$ | |
CME Group Inc. | | | | | | | | |
3.75% 06/15/28(h) | | | 68,000 | | | | 68,879 | |
CMS Energy Corp. | | | | | | | | |
4.88% 03/01/44(h) | | | 190,000 | | | | 199,880 | |
CNA Financial Corp. | | | | | | | | |
3.45% 08/15/27 (h) | | | 56,000 | | | | 52,086 | |
5.88% 08/15/20 (h) | | | 262,000 | | | | 271,704 | |
CNH Industrial Capital LLC | | | | | | | | |
3.38% 07/15/19 (h) | | | 119,000 | | | | 118,679 | |
4.38% 11/06/20 (h) | | | 93,000 | | | | 93,515 | |
4.88% 04/01/21 (h) | | | 117,000 | | | | 117,968 | |
CNH Industrial N.V. | | | | | | | | |
4.50% 08/15/23(h) | | | 154,000 | | | | 155,015 | |
CNOOC Nexen Finance 2014 ULC | | | | | | | | |
4.25% 04/30/24(h) | | | 423,000 | | | | 430,102 | |
Columbia Pipeline Group Inc. | | | | | | | | |
3.30% 06/01/20(h) | | | 110,000 | | | | 109,647 | |
Comcast Corp. | | | | | | | | |
3.38% 08/15/25 (h) | | | 6,000 | | | | 5,846 | |
3.97% 11/01/47 (h) | | | 258,000 | | | | 231,656 | |
4.15% 10/15/28 (h) | | | 286,000 | | | | 290,296 | |
4.20% 08/15/34 (h) | | | 87,000 | | | | 84,005 | |
4.25% 10/15/30 (h) | | | 103,000 | | | | 104,117 | |
4.60% 08/15/45 (h) | | | 75,000 | | | | 74,029 | |
4.70% 10/15/48 (h) | | | 61,000 | | | | 61,725 | |
Commonwealth Bank of Australia | | | | | | | | |
4.32% 01/10/48(b)(h) | | | 203,000 | | | | 176,927 | |
Conagra Brands Inc. | | | | | | | | |
3.80% 10/22/21 (h) | | | 225,000 | | | | 225,004 | |
4.30% 05/01/24 (h) | | | 241,000 | | | | 239,756 | |
5.30% 11/01/38 (h) | | | 57,000 | | | | 53,985 | |
5.40% 11/01/48 (h) | | | 95,000 | | | | 87,601 | |
Conagra Brands Inc. 0.75% + 3 month USD LIBOR | | | | | | | | |
3.22% 10/22/20(h)(i) | | | 160,000 | | | | 159,179 | |
Concho Resources Inc. | | | | | | | | |
3.75% 10/01/27 (h) | | | 27,000 | | | | 25,448 | |
4.30% 08/15/28 (h) | | | 131,000 | | | | 128,163 | |
4.88% 10/01/47 (h) | | | 46,000 | | | | 43,893 | |
ConocoPhillips Co. | | | | | | | | |
4.30% 11/15/44(h) | | | 109,000 | | | | 107,505 | |
Consolidated Edison Company of New York Inc. | | | | | | | | |
2.90% 12/01/26 (h) | | | 132,000 | | | | 124,017 | |
3.88% 06/15/47 (h) | | | 68,000 | | | | 62,325 | |
Constellation Brands Inc. | | | | | | | | |
2.70% 05/09/22 (h) | | | 135,000 | | | | 130,357 | |
4.50% 05/09/47 (h) | | | 32,000 | | | | 28,671 | |
Continental Resources Inc. | | | | | | | | |
4.50% 04/15/23(h) | | | 97,000 | | | | 95,220 | |
See Notes to Schedules of Investments and Notes to Financial Statements.
Elfun Income Fund
Schedule of Investments, continued — December 31, 2018
| | | | | | | | |
| | | Principal
Amount ($) | | | Fair
Value
$ | |
| | | | | | | | |
Corning Inc. | | | | | | | | |
4.38% 11/15/57(h) | | | 62,000 | | | | 52,034 | |
Corporation Andina de Fomento | | | | | | | | |
2.20% 07/18/20 (h) | | | 190,000 | | | | 187,110 | |
4.38% 06/15/22 (h) | | | 281,000 | | | | 291,279 | |
Crane Co. | | | | | | | | |
4.20% 03/15/48(h) | | | 44,000 | | | | 40,741 | |
Credit Suisse Group Funding Guernsey Ltd. | | | | | | | | |
3.13% 12/10/20 (h) | | | 250,000 | | | | 247,770 | |
3.80% 06/09/23 (h) | | | 470,000 | | | | 461,610 | |
CSX Corp. | | | | | | | | |
4.50% 08/01/54(h) | | | 78,000 | | | | 73,856 | |
CVS Health Corp. | | | | | | | | |
2.25% 08/12/19 (h) | | | 205,000 | | | | 203,891 | |
3.13% 03/09/20 (h) | | | 615,000 | | | | 613,795 | |
3.35% 03/09/21 (h) | | | 400,000 | | | | 398,792 | |
3.70% 03/09/23 (h) | | | 116,000 | | | | 114,861 | |
3.88% 07/20/25 (h) | | | 59,000 | | | | 57,537 | |
4.10% 03/25/25 (h) | | | 130,000 | | | | 128,673 | |
4.30% 03/25/28 (h) | | | 51,000 | | | | 49,912 | |
4.78% 03/25/38 (h) | | | 63,000 | | | | 60,550 | |
5.00% 12/01/24 (h) | | | 126,000 | | | | 131,205 | |
5.05% 03/25/48 (h) | | | 85,000 | | | | 82,929 | |
5.13% 07/20/45 (h) | | | 35,000 | | | | 34,129 | |
D.R. Horton Inc. | | | | | | | | |
2.55% 12/01/20(h) | | | 193,000 | | | | 188,078 | |
Dana Financing Luxembourg Sarl | | | | | | | | |
6.50% 06/01/26(b)(h) | | | 250,000 | | | | 240,100 | |
Dell International LLC/EMC Corp. | | | | | | | | |
3.48% 06/01/19 (b)(h) | | | 218,000 | | | | 217,481 | |
5.45% 06/15/23 (b)(h) | | | 84,000 | | | | 85,597 | |
6.02% 06/15/26 (b)(h) | | | 48,000 | | | | 48,228 | |
8.10% 07/15/36 (b)(h) | | | 13,000 | | | | 14,064 | |
8.35% 07/15/46 (b)(h) | | | 27,000 | | | | 29,251 | |
Deutsche Bank AG | | | | | | | | |
2.70% 07/13/20 (h) | | | 155,000 | | | | 150,333 | |
3.30% 11/16/22 (h) | | | 205,000 | | | | 189,982 | |
Deutsche Bank AG (4.88% fixed rate until 12/01/27; 2.55% + USD 5 yearMid-Market Swap Rate thereafter) | | | | | | | | |
4.88% 12/01/32(h)(i) | | | 202,000 | | | | 158,277 | |
Devon Energy Corp. | | | | | | | | |
4.00% 07/15/21 (h) | | | 251,000 | | | | 251,550 | |
5.00% 06/15/45 (h) | | | 51,000 | | | | 45,106 | |
Dexia Credit Local S.A. | | | | | | | | |
2.25% 01/30/19(b)(h) | | | 343,000 | | | | 342,904 | |
| | | | | | | | |
| | | Principal
Amount ($) | | | Fair
Value
$ | |
Diageo Investment Corp. | | | | | | | | |
2.88% 05/11/22(h) | | | 146,000 | | | | 144,340 | |
Diamondback Energy Inc. | | | | | | | | |
4.75% 11/01/24(b)(h) | | | 235,000 | | | | 226,843 | |
Discover Bank | | | | | | | | |
3.10% 06/04/20(h) | | | 291,000 | | | | 288,946 | |
Discovery Communications LLC | | | | | | | | |
2.20% 09/20/19 (h) | | | 178,000 | | | | 176,414 | |
3.95% 03/20/28 (h) | | | 98,000 | | | | 90,831 | |
5.00% 09/20/37 (h) | | | 39,000 | | | | 36,022 | |
5.20% 09/20/47 (h) | | | 24,000 | | | | 22,105 | |
DISH DBS Corp. | | | | | | | | |
5.88% 07/15/22(h) | | | 143,000 | | | | 130,982 | |
Dollar Tree Inc. | | | | | | | | |
3.70% 05/15/23 (h) | | | 116,000 | | | | 113,686 | |
4.00% 05/15/25 (h) | | | 113,000 | | | | 108,609 | |
Dominion Energy Inc. | | | | | | | | |
2.58% 07/01/20(h) | | | 124,000 | | | | 122,135 | |
DowDuPont Inc. | | | | | | | | |
3.77% 11/15/20 (h) | | | 405,000 | | | | 408,738 | |
5.32% 11/15/38 (h) | | | 90,000 | | | | 92,807 | |
5.42% 11/15/48 (h) | | | 90,000 | | | | 93,727 | |
DTE Energy Co. | | | | | | | | |
2.85% 10/01/26 (h) | | | 68,000 | | | | 62,580 | |
3.85% 12/01/23 (h) | | | 69,000 | | | | 69,352 | |
Duke Energy Carolinas LLC | | | | | | | | |
3.95% 03/15/48(h) | | | 76,000 | | | | 72,703 | |
Duke Energy Corp. | | | | | | | | |
1.80% 09/01/21 | | | 172,000 | | | | 164,368 | |
3.55% 09/15/21 | | | 104,000 | | | | 104,281 | |
3.75% 09/01/46 (h) | | | 26,000 | | | | 22,600 | |
Duke Energy Progress LLC | | | | | | | | |
4.15% 12/01/44(h) | | | 79,000 | | | | 77,059 | |
Duke Realty LP | | | | | | | | |
3.25% 06/30/26 (h) | | | 75,000 | | | | 71,257 | |
3.38% 12/15/27 (h) | | | 56,000 | | | | 53,149 | |
Duquesne Light Holdings Inc. | | | | | | | | |
3.62% 08/01/27(b)(h) | | | 140,000 | | | | 131,762 | |
Eastman Chemical Co. | | | | | | | | |
3.50% 12/01/21 (h) | | | 127,000 | | | | 127,605 | |
3.60% 08/15/22 (h) | | | 55,000 | | | | 54,953 | |
4.50% 01/15/21 (h) | | | 225,000 | | | | 228,204 | |
Eaton Corp. | | | | | | | | |
3.10% 09/15/27(h) | | | 83,000 | | | | 78,310 | |
Ecolab Inc. | | | | | | | | |
3.25% 12/01/27 (h) | | | 51,000 | | | | 49,013 | |
3.95% 12/01/47 (h) | | | 50,000 | | | | 46,952 | |
Ecopetrol S.A. | | | | | | | | |
5.88% 05/28/45(h) | | | 114,000 | | | | 107,587 | |
Edison International | | | | | | | | |
4.13% 03/15/28(h) | | | 85,000 | | | | 80,600 | |
See Notes to Schedules of Investments and Notes to Financial Statements.
Elfun Income Fund
Schedule of Investments, continued — December 31, 2018
| | | | | | | | |
| | | Principal
Amount ($) | | | Fair
Value
$ | |
| | | | | | | | |
EI du Pont de Nemours & Co. 0.53% + 3 month USD LIBOR | | | | | | | | |
3.07% 05/01/20(h)(i) | | | 172,000 | | | | 172,162 | |
Electricite de France S.A. | | | | | | | | |
2.15% 01/22/19(h)(b) | | | 224,000 | | | | 223,845 | |
Eli Lilly & Co. | | | | | | | | |
3.70% 03/01/45(h) | | | 21,000 | | | | 19,761 | |
EMC Corp. | | | | | | | | |
2.65% 06/01/20(h) | | | 447,000 | | | | 429,263 | |
Emera US Finance LP | | | | | | | | |
4.75% 06/15/46(h) | | | 29,000 | | | | 27,879 | |
Enbridge Energy Partners LP | | | | | | | | |
5.50% 09/15/40(h) | | | 18,000 | | | | 18,494 | |
Encana Corp. | | | | | | | | |
3.90% 11/15/21(h) | | | 168,000 | | | | 167,955 | |
Endo Dac/Endo Finance LLC/Endo Finco Inc. | | | | | | | | |
5.88% 10/15/24 (b)(h) | | | 264,000 | | | | 248,635 | |
Enel Finance International N.V. | | | | | | | | |
3.63% 05/25/27(b)(h) | | | 273,000 | | | | 239,850 | |
Energy Transfer LP | | | | | | | | |
4.25% 03/15/23 (h) | | | 101,000 | | | | 97,402 | |
5.88% 01/15/24 (h) | | | 1,032,000 | | | | 1,051,691 | |
7.50% 10/15/20 (h) | | | 177,000 | | | | 184,965 | |
Energy Transfer Operating LP | | | | | | | | |
4.95% 06/15/28(h) | | | 44,000 | | | | 43,162 | |
Energy Transfer Operating LP | | | | | | | | |
5.80% 06/15/38 (h) | | | 69,000 | | | | 66,798 | |
6.13% 12/15/45 (h) | | | 36,000 | | | | 34,905 | |
6.50% 02/01/42 (h) | | | 108,000 | | | | 108,908 | |
Energy Transfer Partners LP/Regency Energy Finance Corp. | | | | | | | | |
4.50% 11/01/23(h) | | | 76,000 | | | | 75,812 | |
EnLink Midstream Partners LP | | | | | | | | |
4.15% 06/01/25(h) | | | 191,000 | | | | 171,906 | |
Entergy Louisiana LLC | | | | | | | | |
3.05% 06/01/31 (h) | | | 85,000 | | | | 76,694 | |
4.00% 03/15/33 (h) | | | 46,000 | | | | 46,350 | |
Enterprise Products Operating LLC | | | | | | | | |
4.25% 02/15/48(h) | | | 186,000 | | | | 166,412 | |
Enterprise Products Operating LLC (5.25% fixed rate until 08/16/27; 3.03% + 3 month USD LIBOR thereafter) | | | | | | | | |
5.25% 08/16/77(h)(i) | | | 57,000 | | | | 47,507 | |
EOG Resources Inc. | | | | | | | | |
4.10% 02/01/21 (h) | | | 202,000 | | | | 204,709 | |
4.15% 01/15/26 (h) | | | 87,000 | | | | 88,734 | |
| | | | | | | | |
| | | Principal
Amount ($) | | | Fair
Value
$ | |
EPR Properties | | | | | | | | |
4.95% 04/15/28(h) | | | 77,000 | | | | 76,229 | |
EQM Midstream Partners LP | | | | | | | | |
4.75% 07/15/23 (h) | | | 30,000 | | | | 29,842 | |
5.50% 07/15/28 (h) | | | 30,000 | | | | 29,466 | |
EQT Corp. | | | | | | | | |
3.90% 10/01/27(h) | | | 53,000 | | | | 45,832 | |
ERP Operating LP | | | | | | | | |
4.50% 07/01/44(h) | | | 48,000 | | | | 48,301 | |
Exelon Corp. | | | | | | | | |
3.50% 06/01/22 (h) | | | 111,000 | | | | 108,468 | |
4.45% 04/15/46 (h) | | | 132,000 | | | | 125,719 | |
Express Scripts Holding Co. | | | | | | | | |
3.40% 03/01/27(h) | | | 95,000 | | | | 88,145 | |
Exxon Mobil Corp. | | | | | | | | |
2.22% 03/01/21(h) | | | 38,000 | | | | 37,519 | |
FedEx Corp. | | | | | | | | |
4.10% 02/01/45(h) | | | 157,000 | | | | 134,877 | |
FirstEnergy Corp. | | | | | | | | |
3.90% 07/15/27 (h) | | | 39,000 | | | | 37,779 | |
4.85% 07/15/47 (h) | | | 59,000 | | | | 58,785 | |
Florida Power & Light Co. | | | | | | | | |
4.13% 02/01/42(h) | | | 90,000 | | | | 90,554 | |
Ford Motor Co. | | | | | | | | |
4.35% 12/08/26(h) | | | 94,000 | | | | 83,890 | |
Ford Motor Credit Company LLC | | | | | | | | |
3.10% 05/04/23 (h) | | | 237,000 | | | | 214,587 | |
3.22% 01/09/22 (h) | | | 215,000 | | | | 201,679 | |
3.34% 03/28/22 (h) | | | 200,000 | | | | 188,754 | |
Frontier Communications Corp. | | | | | | | | |
7.13% 03/15/19(h) | | | 172,000 | | | | 166,481 | |
General Dynamics Corp. | | | | | | | | |
2.13% 08/15/26 (h) | | | 125,000 | | | | 112,789 | |
2.88% 05/11/20 (h) | | | 211,000 | | | | 211,146 | |
3.00% 05/11/21 (h) | | | 296,000 | | | | 296,299 | |
3.50% 05/15/25 (h) | | | 126,000 | | | | 126,208 | |
General Mills Inc. | | | | | | | | |
3.20% 04/16/21 (h) | | | 200,000 | | | | 198,888 | |
3.70% 10/17/23 (h) | | | 113,000 | | | | 112,477 | |
4.55% 04/17/38 (h) | | | 51,000 | | | | 46,679 | |
4.70% 04/17/48 (h) | | | 51,000 | | | | 46,418 | |
General Motors Co. | | | | | | | | |
5.20% 04/01/45 (h) | | | 22,000 | | | | 18,242 | |
5.40% 04/01/48 (h) | | | 46,000 | | | | 40,342 | |
General Motors Financial Company Inc. | | | | | | | | |
2.35% 10/04/19 (h) | | | 212,000 | | | | 209,674 | |
3.15% 01/15/20 (h) | | | 206,000 | | | | 204,684 | |
3.20% 07/13/20 (h) | | | 154,000 | | | | 152,420 | |
3.45% 01/14/22 | | | 253,000 | | | | 244,846 | |
3.55% 04/09/21 (h) | | | 285,000 | | | | 281,460 | |
See Notes to Schedules of Investments and Notes to Financial Statements.
Elfun Income Fund
Schedule of Investments, continued — December 31, 2018
| | | | | | | | |
| | | Principal
Amount ($) | | | Fair
Value
$ | |
| | | | | | | | |
5.25% 03/01/26 (h) | | | 95,000 | | | | 93,245 | |
Gilead Sciences Inc. | | | | | | | | |
2.55% 09/01/20 (h) | | | 75,000 | | | | 74,383 | |
2.95% 03/01/27 (h) | | | 26,000 | | | | 24,170 | |
3.50% 02/01/25 (h) | | | 60,000 | | | | 58,612 | |
3.65% 03/01/26 (h) | | | 62,000 | | | | 60,851 | |
4.15% 03/01/47 (h) | | | 107,000 | | | | 98,245 | |
4.80% 04/01/44 (h) | | | 48,000 | | | | 47,924 | |
GlaxoSmithKline Capital Inc. | | | | | | | | |
3.38% 05/15/23 (h) | | | 132,000 | | | | 132,660 | |
3.63% 05/15/25 (h) | | | 126,000 | | | | 126,719 | |
GlaxoSmithKline Capital PLC | | | | | | | | |
3.13% 05/14/21(h) | | | 148,000 | | | | 148,192 | |
Glencore Finance Canada Ltd. | | | | | | | | |
4.95% 11/15/21(h)(b) | | | 86,000 | | | | 88,159 | |
Glencore Funding LLC | | | | | | | | |
2.50% 01/15/19(h)(b) | | | 404,000 | | | | 403,875 | |
Gray Escrow Inc. | | | | | | | | |
7.00% 05/15/27(h)(b) | | | 93,000 | | | | 90,541 | |
Grupo Televisa SAB | | | | | | | | |
5.00% 05/13/45(h) | | | 204,000 | | | | 178,314 | |
H&E Equipment Services Inc. | | | | | | | | |
5.63% 09/01/25(h) | | | 363,000 | | | | 332,624 | |
Halliburton Co. | | | | | | | | |
3.80% 11/15/25 (h) | | | 87,000 | | | | 84,360 | |
5.00% 11/15/45 (h) | | | 63,000 | | | | 61,823 | |
HCA Inc. | | | | | | | | |
4.75% 05/01/23 (h) | | | 521,000 | | | | 513,091 | |
5.88% 02/15/26 | | | 97,000 | | | | 97,343 | |
HD Supply Inc. | | | | | | | | |
5.38% 10/15/26(h)(b) | | | 95,000 | | | | 92,150 | |
Hess Corp. | | | | | | | | |
5.60% 02/15/41 (h) | | | 34,000 | | | | 29,925 | |
5.80% 04/01/47 (h) | | | 22,000 | | | | 19,773 | |
Hewlett Packard Enterprise Co. | | | | | | | | |
6.35% 10/15/45(h) | | | 35,000 | | | | 32,753 | |
Highwoods Realty LP | | | | | | | | |
4.13% 03/15/28(h) | | | 75,000 | | | | 73,594 | |
Hilcorp Energy I LP/Hilcorp Finance Co. | | | | | | | | |
5.75% 10/01/25 (b)(h) | | | 291,000 | | | | 259,301 | |
6.25% 11/01/28 (b)(h) | | | 75,000 | | | | 65,944 | |
HSBC Holdings PLC | | | | | | | | |
4.25% 03/14/24(h) | | | 222,000 | | | | 221,629 | |
HSBC Holdings PLC (3.95% fixed rate until 05/18/23; 0.99% + 3 month USD LIBOR thereafter) | | | | | | | | |
3.95% 05/18/24(h)(i) | | | 216,000 | | | | 214,745 | |
| | | | | | | | |
| | | Principal
Amount ($) | | | Fair
Value
$ | |
HSBC Holdings PLC (4.29% fixed rate until 09/12/25; 1.35% + 3 month USD LIBOR thereafter) | | | | | | | | |
4.29% 09/12/26 (h)(i) | | | 220,000 | | | | 216,152 | |
HSBC Holdings PLC (6.00% fixed rate until 05/22/27; 3.75% + USD 5 yearMid-Market Swap Rate thereafter) | | | | | | | | |
6.00% 12/31/99 (h)(i) | | | 465,000 | | | | 424,108 | |
HSBC Holdings PLC (6.50% fixed rate until 03/23/28; 3.61% + USD 5 yearMid-Market Swap Rate thereafter) | | | | | | | | |
6.50% 12/31/99 (h)(i) | | | 205,000 | | | | 187,841 | |
Hughes Satellite Systems Corp. | | | | | | | | |
6.63% 08/01/26(h) | | | 95,000 | | | | 87,275 | |
Hyundai Capital America | | | | | | | | |
3.10% 04/05/22 (h)(b) | | | 86,000 | | | | 84,023 | |
Icahn Enterprises LP/Icahn Enterprises Finance Corp. | | | | | | | | |
6.00% 08/01/20 (h) | | | 268,000 | | | | 267,579 | |
ING Bank N.V. | | | | | | | | |
2.70% 08/17/20 (h)(b) | | | 200,000 | | | | 197,820 | |
Ingersoll-Rand Luxembourg Finance S.A. | | | | | | | | |
3.55% 11/01/24 (h) | | | 105,000 | | | | 104,000 | |
Intel Corp. | | | | | | | | |
2.60% 05/19/26 (h) | | | 55,000 | | | | 51,641 | |
2.88% 05/11/24 (h) | | | 41,000 | | | | 39,987 | |
International Business Machines Corp. | | | | | | | | |
3.30% 01/27/27 (h) | | | 132,000 | | | | 126,878 | |
International Paper Co. | | | | | | | | |
4.40% 08/15/47 (h) | | | 97,000 | | | | 82,197 | |
Interstate Power & Light Co. | | | | | | | | |
3.40% 08/15/25 (h) | | | 307,000 | | | | 297,501 | |
j2 Cloud Services LLC/j2 GlobalCo-Obligor Inc. | | | | | | | | |
6.00% 07/15/25 (b)(h) | | | 159,000 | | | | 155,753 | |
Jabil Inc. | | | | | | | | |
3.95% 01/12/28 (h) | | | 105,000 | | | | 93,217 | |
JBS USA LUX S.A./JBS USA Finance Inc. | | | | | | | | |
6.75% 02/15/28 (b)(h) | | | 193,000 | | | | 188,536 | |
Jefferies Group LLC | | | | | | | | |
5.13% 01/20/23 (h) | | | 78,000 | | | | 80,084 | |
6.50% 01/20/43 (h) | | | 74,000 | | | | 72,387 | |
Johnson & Johnson | | | | | | | | |
3.63% 03/03/37 (h) | | | 65,000 | | | | 62,483 | |
See Notes to Schedules of Investments and Notes to Financial Statements.
Elfun Income Fund
Schedule of Investments, continued — December 31, 2018
| | | | | | | | |
| | | Principal
Amount ($) | | | Fair
Value
$ | |
| | | | | | | | |
Johnson Controls International PLC | | | | | | | | |
4.50% 02/15/47 (h) | | | 40,000 | | | | 36,850 | |
JPMorgan Chase & Co. | | | | | | | | |
2.30% 08/15/21 (h) | | | 196,000 | | | | 190,877 | |
2.55% 10/29/20 (h) | | | 197,000 | | | | 194,705 | |
3.13% 01/23/25 | | | 153,000 | | | | 145,849 | |
3.30% 04/01/26 (h) | | | 102,000 | | | | 97,058 | |
3.63% 12/01/27 (h) | | | 59,000 | | | | 55,028 | |
JPMorgan Chase & Co. (3.51% fixed rate until 01/23/28; 0.95% + 3 month USD LIBOR thereafter) | | | | | | | | |
3.51% 01/23/29 (h)(i) | | | 66,000 | | | | 62,204 | |
JPMorgan Chase & Co. (3.88% fixed rate until 07/24/37; 1.36% + 3 month USD LIBOR thereafter) | | | | | | | | |
3.88% 07/24/38 (h)(i) | | | 121,000 | | | | 109,526 | |
JPMorgan Chase & Co. (3.90% fixed rate until 01/23/48; 1.22% + 3 month USD LIBOR thereafter) | | | | | | | | |
3.90% 01/23/49 (h)(i) | | | 41,000 | | | | 36,007 | |
JPMorgan Chase & Co. (4.01% fixed rate until 04/23/28; 1.12% + 3 month USD LIBOR thereafter) | | | | | | | | |
4.01% 04/23/29 (h)(i) | | | 80,000 | | | | 78,486 | |
JPMorgan Chase & Co. (4.03% fixed rate until 07/24/47; 1.46% + 3 month USD LIBOR thereafter) | | | | | | | | |
4.03% 07/24/48 (h)(i) | | | 73,000 | | | | 65,450 | |
JPMorgan Chase & Co. (4.63% fixed rate until 11/01/22; 2.58% + 3 month USD LIBOR thereafter) | | | | | | | | |
4.63% 12/31/99 (h)(i) | | | 114,000 | | | | 97,577 | |
JPMorgan Chase & Co. (6.10% fixed rate until 10/01/24; 3.33% + 3 month USD LIBOR thereafter) | | | | | | | | |
6.10% 10/29/49 (h)(i) | | | 233,000 | | | | 231,280 | |
JPMorgan Chase & Co. 3.47% + 3 month USD LIBOR | | | | | | | | |
5.99% 12/29/49 (h)(i) | | | 104,000 | | | | 102,705 | |
Keurig Dr Pepper Inc. | | | | | | | | |
3.55% 05/25/21 (b)(h) | | | 633,000 | | | | 632,139 | |
4.06% 05/25/23 (b)(h) | | | 132,000 | | | | 131,603 | |
4.50% 11/15/45 (h) | | | 57,000 | | | | 50,080 | |
4.60% 05/25/28 (b)(h) | | | 126,000 | | | | 125,573 | |
| | | | | | | | |
| | | Principal
Amount ($) | | | Fair
Value
$ | |
Kimberly-Clark Corp. | | | | | | | | |
3.95% 11/01/28 (h) | | | 227,000 | | | | 233,465 | |
Kinder Morgan Energy Partners LP | | | | | | | | |
3.50% 03/01/21 (h) | | | 298,000 | | | | 297,002 | |
4.70% 11/01/42 (h) | | | 23,000 | | | | 20,390 | |
5.30% 09/15/20 (h) | | | 101,000 | | | | 103,817 | |
6.38% 03/01/41 (h) | | | 47,000 | | | | 50,078 | |
Kinder Morgan Inc. | | | | | | | | |
3.05% 12/01/19 (h) | | | 67,000 | | | | 66,608 | |
4.30% 03/01/28 (h) | | | 74,000 | | | | 72,493 | |
5.05% 02/15/46 (h) | | | 47,000 | | | | 43,698 | |
5.55% 06/01/45 (h) | | | 54,000 | | | | 53,799 | |
Kraft Heinz Foods Co. | | | | | | | | |
4.38% 06/01/46 (h) | | | 89,000 | | | | 73,639 | |
L Brands Inc. | | | | | | | | |
5.25% 02/01/28 (h) | | | 288,000 | | | | 246,165 | |
L3 Technologies Inc. | | | | | | | | |
3.85% 12/15/26 (h) | | | 116,000 | | | | 112,191 | |
Lamb Weston Holdings Inc. | | | | | | | | |
4.63% 11/01/24 (h)(b) | | | 292,000 | | | | 284,609 | |
Lee Enterprises Inc. | | | | | | | | |
9.50% 03/15/22 (h)(b) | | | 203,000 | | | | 206,749 | |
Lennar Corp. | | | | | | | | |
4.75%
05/30/25 - 11/29/27 (h) | | | 452,000 | | | | 416,341 | |
Lincoln National Corp. | | | | | | | | |
3.63% 12/12/26 (h) | | | 59,000 | | | | 56,869 | |
3.80% 03/01/28 (h) | | | 70,000 | | | | 67,435 | |
4.35% 03/01/48 (h) | | | 70,000 | | | | 63,630 | |
Lloyds Banking Group PLC (2.91% fixed rate until 11/07/22; 0.81% + 3 month USD LIBOR thereafter) | | | | | | | | |
2.91% 11/07/23(h)(i) | | | 203,000 | | | | 191,959 | |
Lockheed Martin Corp. | | | | | | | | |
3.55% 01/15/26(h) | | | 65,000 | | | | 64,421 | |
Lowe’s Companies Inc. | | | | | | | | |
3.70% 04/15/46(h) | | | 30,000 | | | | 24,496 | |
LYB International Finance BV | | | | | | | | |
4.88% 03/15/44(h) | | | 35,000 | | | | 31,844 | |
LYB International Finance II BV | | | | | | | | |
3.50% 03/02/27(h) | | | 41,000 | | | | 37,433 | |
Macy’s Retail Holdings Inc. | | | | | | | | |
4.30% 02/15/43(h) | | | 29,000 | | | | 21,416 | |
Marathon Oil Corp. | | | | | | | | |
2.70% 06/01/20 (h) | | | 231,000 | | | | 227,216 | |
3.85% 06/01/25 (h) | | | 48,000 | | | | 45,005 | |
Marsh & McLennan Companies Inc. | | | | | | | | |
3.50% 03/10/25(h) | | | 93,000 | | | | 90,937 | |
See Notes to Schedules of Investments and Notes to Financial Statements.
Elfun Income Fund
Schedule of Investments, continued — December 31, 2018
| | | | | | | | |
| | | Principal
Amount ($) | | | Fair
Value
$ | |
| | | | | | | | |
Masco Corp. | | | | | | | | |
3.50% 11/15/27(h) | | | 38,000 | | | | 34,985 | |
McDonald’s Corp. | | | | | | | | |
3.70% 01/30/26 (h) | | | 23,000 | | | | 22,594 | |
3.80% 04/01/28 (h) | | | 108,000 | | | | 105,870 | |
4.88% 12/09/45 (h) | | | 47,000 | | | | 47,373 | |
McKesson Corp. | | | | | | | | |
3.65% 11/30/20 | | | 505,000 | | | | 507,065 | |
Medtronic Inc. | | | | | | | | |
2.50% 03/15/20 (h) | | | 223,000 | | | | 222,039 | |
4.63% 03/15/45 (h) | | | 114,000 | | | | 119,866 | |
Memorial Sloan-Kettering Cancer Center | | | | | | | | |
4.13% 07/01/52(h) | | | 118,000 | | | | 117,070 | |
Merck & Company Inc. | | | | | | | | |
2.75% 02/10/25(h) | | | 90,000 | | | | 87,088 | |
MetLife Inc. | | | | | | | | |
4.05% 03/01/45 (h) | | | 26,000 | | | | 24,014 | |
4.72% 12/15/44 (h) | | | 78,000 | | | | 79,602 | |
MGM Resorts International | | | | | | | | |
4.63% 09/01/26(h) | | | 167,000 | | | | 150,090 | |
Microsoft Corp. | | | | | | | | |
2.40% 08/08/26 (h) | | | 112,000 | | | | 104,474 | |
3.45% 08/08/36 (h) | | | 57,000 | | | | 54,120 | |
3.50% 02/12/35 (h) | | | 65,000 | | | | 62,419 | |
3.70% 08/08/46 (h) | | | 246,000 | | | | 236,180 | |
4.00% 02/12/55 (h) | | | 87,000 | | | | 85,673 | |
4.10% 02/06/37 (h) | | | 33,000 | | | | 33,903 | |
4.50% 02/06/57 (h) | | | 34,000 | | | | 36,599 | |
Mizuho Financial Group Inc. | | | | | | | | |
2.63% 04/12/21(b)(h) | | | 442,000 | | | | 434,088 | |
Mizuho Financial Group Inc. (3.92% fixed rate until 09/11/23; 1.00% + 3 month USD LIBOR thereafter) | | | | | | | | |
3.92% 09/11/24 (h)(i) | | | 220,000 | | | | 222,380 | |
Molina Healthcare Inc. | | | | | | | | |
4.88% 06/15/25 (b)(h) | | | 227,000 | | | | 207,328 | |
Molson Coors Brewing Co. | | | | | | | | |
2.10% 07/15/21 (h) | | | 214,000 | | | | 206,172 | |
4.20% 07/15/46 (h) | | | 48,000 | | | | 39,888 | |
Morgan Stanley | | | | | | | | |
2.45% 02/01/19 (h) | | | 560,000 | | | | 559,675 | |
2.63% 11/17/21 (h) | | | 203,000 | | | | 197,976 | |
2.65% 01/27/20 (h) | | | 188,000 | | | | 186,678 | |
2.75% 05/19/22 (h) | | | 406,000 | | | | 394,616 | |
3.70% 10/23/24 (h) | | | 45,000 | | | | 44,298 | |
3.95% 04/23/27 (h) | | | 240,000 | | | | 226,008 | |
4.10% 05/22/23 (h) | | | 170,000 | | | | 170,384 | |
4.38% 01/22/47 (h) | | | 105,000 | | | | 99,451 | |
| | | | | | | | |
| | | Principal
Amount ($) | | | Fair
Value
$ | |
Morgan Stanley (3.97% fixed rate until 07/22/37; 1.46% + 3 month USD LIBOR thereafter) | | | | | | | | |
3.97% 07/22/38 (h)(i) | | | 54,000 | | | | 49,239 | |
MPLX LP | | | | | | | | |
3.38% 03/15/23 (h) | | | 62,000 | | | | 60,221 | |
4.50% 04/15/38 (h) | | | 61,000 | | | | 53,571 | |
4.70% 04/15/48 (h) | | | 62,000 | | | | 53,544 | |
5.50% 02/15/49 (h) | | | 114,000 | | | | 110,488 | |
MUFG Bank Ltd. | | | | | | | | |
2.30% 03/10/19 (b)(h) | | | 600,000 | | | | 599,166 | |
MUFG Bank Ltd. | | | | | | | | |
2.30% 03/05/20 (b)(h) | | | 216,000 | | | | 213,736 | |
Murphy Oil Corp. | | | | | | | | |
5.75% 08/15/25 (h) | | | 651,000 | | | | 610,417 | |
Mylan Inc. | | | | | | | | |
4.55% 04/15/28 (b)(h) | | | 33,000 | | | | 30,765 | |
5.20% 04/15/48 (b)(h) | | | 59,000 | | | | 50,226 | |
Mylan N.V. | | | | | | | | |
3.15% 06/15/21 (h) | | | 90,000 | | | | 88,213 | |
3.95% 06/15/26 (h) | | | 50,000 | | | | 45,119 | |
National Retail Properties Inc. | | | | | | | | |
4.00% 11/15/25 (h) | | | 103,000 | | | | 102,043 | |
Navient Corp. | | | | | | | | |
6.75% 06/15/26 (h) | | | 180,000 | | | | 149,414 | |
8.00% 03/25/20 (h) | | | 167,000 | | | | 169,846 | |
Newell Brands Inc. | | | | | | | | |
3.85% 04/01/23 (h) | | | 43,000 | | | | 42,439 | |
4.20% 04/01/26 (h) | | | 42,000 | | | | 40,833 | |
Newfield Exploration Co. | | | | | | | | |
5.38% 01/01/26 (h) | | | 289,000 | | | | 286,058 | |
5.75% 01/30/22 (h) | | | 266,000 | | | | 269,990 | |
Newmark Group Inc. | | | | | | | | |
6.13% 11/15/23 (b)(h) | | | 70,000 | | | | 67,228 | |
Newmont Mining Corp. | | | | | | | | |
4.88% 03/15/42 (h) | | | 85,000 | | | | 80,366 | |
Nexen Energy ULC | | | | | | | | |
6.40% 05/15/37 (h) | | | 59,000 | | | | 72,240 | |
NGPL PipeCo LLC | | | | | | | | |
4.88% 08/15/27 (b)(h) | | | 51,000 | | | | 48,388 | |
Noble Energy Inc. | | | | | | | | |
3.90% 11/15/24 (h) | | | 65,000 | | | | 62,705 | |
5.05% 11/15/44 (h) | | | 26,000 | | | | 22,640 | |
Nordstrom Inc. | | | | | | | | |
5.00% 01/15/44 (h) | | | 4,000 | | | | 3,438 | |
Norfolk Southern Corp. | | | | | | | | |
3.95% 10/01/42 (h) | | | 83,000 | | | | 75,993 | |
Northern States Power Co. | | | | | | | | |
2.20% 08/15/20 (h) | | | 355,000 | | | | 350,122 | |
Northrop Grumman Corp. | | | | | | | | |
2.08% 10/15/20 (h) | | | 67,000 | | | | 65,738 | |
See Notes to Schedules of Investments and Notes to Financial Statements.
Elfun Income Fund
Schedule of Investments, continued — December 31, 2018
| | | | | | | | |
| | | Principal
Amount ($) | | | Fair
Value
$ | |
| | | | | | | | |
2.55% 10/15/22 (h) | | | 53,000 | | | | 51,330 | |
3.25% 01/15/28 (h) | | | 65,000 | | | | 60,730 | |
3.85% 04/15/45 (h) | | | 24,000 | | | | 21,180 | |
4.03% 10/15/47 (h) | | | 62,000 | | | | 56,338 | |
Novartis Capital Corp. | | | | | | | | |
3.00% 11/20/25 (h) | | | 16,000 | | | | 15,509 | |
Nucor Corp. | | | | | | | | |
3.95% 05/01/28 (h) | | | 121,000 | | | | 119,767 | |
4.13% 09/15/22 (h) | | | 77,000 | | | | 79,268 | |
Nutrien Ltd. | | | | | | | | |
4.00% 12/15/26 (h) | | | 58,000 | | | | 56,119 | |
4.90% 06/01/43 (h) | | | 79,000 | | | | 75,769 | |
NXP BV/NXP Funding LLC | | | | | | | | |
4.13% 06/01/21 (b) | | | 262,000 | | | | 259,296 | |
Occidental Petroleum Corp. | | | | | | | | |
4.10% 02/15/47 (h) | | | 33,000 | | | | 31,043 | |
4.20% 03/15/48 (h) | | | 53,000 | | | | 50,612 | |
Olin Corp. | | | | | | | | |
5.00% 02/01/30 (h) | | | 289,000 | | | | 252,788 | |
Omnicom Group Inc./Omnicom Capital Inc. | | | | | | | | |
3.63% 05/01/22 (h) | | | 118,000 | | | | 116,415 | |
Oncor Electric Delivery Company LLC | | | | | | | | |
3.80% 09/30/47 (h) | | | 28,000 | | | | 26,386 | |
Oracle Corp. | | | | | | | | |
2.40% 09/15/23 (h) | | | 61,000 | | | | 58,558 | |
3.25% 11/15/27 (h) | | | 93,000 | | | | 89,694 | |
3.80% 11/15/37 (h) | | | 37,000 | | | | 34,567 | |
4.00%
07/15/46 - 11/15/47 (h) | | | 175,000 | | | | 163,064 | |
4.13% 05/15/45 (h) | | | 46,000 | | | | 43,606 | |
Oshkosh Corp. | | | | | | | | |
5.38% 03/01/25 (h) | | | 95,000 | | | | 95,523 | |
Owens Corning | | | | | | | | |
4.40% 01/30/48 (h) | | | 53,000 | | | | 40,582 | |
Owens-Brockway Glass Container Inc. | | | | | | | | |
6.38% 08/15/25 (b)(h) | | | 100,000 | | | | 99,121 | |
Pacific Gas & Electric Co. | | | | | | | | |
3.40% 08/15/24 (h) | | | 456,000 | | | | 397,299 | |
PacifiCorp | | | | | | | | |
6.25% 10/15/37 (h) | | | 4,000 | | | | 4,969 | |
Packaging Corporation of America | | | | | | | | |
3.40% 12/15/27 (h) | | | 41,000 | | | | 38,333 | |
Parker-Hannifin Corp. | | | | | | | | |
3.25% 03/01/27 (h) | | | 165,000 | | | | 158,072 | |
Party City Holdings Inc. | | | | | | | | |
6.63% 08/01/26 (b)(h) | | | 220,000 | | | | 200,077 | |
Penske Automotive Group Inc. | | | | | | | | |
5.38% 12/01/24 (h) | | | 243,000 | | | | 227,543 | |
| | | | | | | | |
| | | Principal
Amount ($) | | | Fair
Value
$ | |
PepsiCo Inc. | | | | | | | | |
3.45% 10/06/46 (h) | | | 50,000 | | | | 44,748 | |
Perrigo Finance Unlimited Co. | | | | | | | | |
3.90% 12/15/24 (h) | | | 223,000 | | | | 213,884 | |
Petroleos Mexicanos | | | | | | | | |
4.50% 01/23/26 (h) | | | 58,000 | | | | 50,194 | |
5.35% 02/12/28 | | | 48,000 | | | | 41,998 | |
5.63% 01/23/46 (h) | | | 61,000 | | | | 46,213 | |
6.35% 02/12/48 | | | 60,000 | | | | 47,932 | |
6.38% 01/23/45 (h) | | | 79,000 | | | | 63,879 | |
6.50% 03/13/27 (h) | | | 110,000 | | | | 103,654 | |
6.75% 09/21/47 (h) | | | 141,000 | | | | 116,838 | |
Pfizer Inc. | | | | | | | | |
3.00% 12/15/26 (h) | | | 54,000 | | | | 52,121 | |
3.20% 09/15/23 (h) | | | 93,000 | | | | 93,239 | |
3.60% 09/15/28 (h) | | | 155,000 | | | | 155,575 | |
4.13% 12/15/46 (h) | | | 59,000 | | | | 59,220 | |
4.40% 05/15/44 (h) | | | 34,000 | | | | 35,380 | |
Philip Morris International Inc. | | | | | | | | |
4.13% 03/04/43 (h) | | | 108,000 | | | | 95,952 | |
Phillips 66 | | | | | | | | |
3.90% 03/15/28 (h) | | | 114,000 | | | | 109,693 | |
Phillips 66 Partners LP | | | | | | | | |
3.75% 03/01/28 (h) | | | 51,000 | | | | 47,110 | |
4.68% 02/15/45 (h) | | | 68,000 | | | | 60,496 | |
Pilgrim’s Pride Corp. | | | | | | | | |
5.88% 09/30/27 (b)(h) | | | 335,000 | | | | 305,393 | |
Pioneer Natural Resources Co. | | | | | | | | |
3.95% 07/15/22 | | | 166,000 | | | | 166,402 | |
Plains All American Pipeline LP/PAA Finance Corp. | | | | | | | | |
4.70% 06/15/44 (h) | | | 48,000 | | | | 40,044 | |
5.75% 01/15/20 (h) | | | 143,000 | | | | 145,863 | |
PPL Capital Funding Inc. | | | | | | | | |
3.10% 05/15/26 (h) | | | 135,000 | | | | 126,577 | |
Precision Castparts Corp. | | | | | | | | |
4.38% 06/15/45 (h) | | | 105,000 | | | | 104,897 | |
Prudential Financial Inc. (5.70% fixed rate until 09/15/28; 2.67% + 3 month USD LIBOR thereafter) | | | | | | | | |
5.70% 09/15/48(h)(i) | | | 153,000 | | | | 140,817 | |
Public Service Company of Colorado | | | | | | | | |
3.70% 06/15/28(h) | | | 142,000 | | | | 143,438 | |
Public Service Electric & Gas Co. | | | | | | | | |
2.38% 05/15/23(h) | | | 231,000 | | | | 223,164 | |
PulteGroup Inc. | | | | | | | | |
5.50% 03/01/26(h) | | | 200,000 | | | | 193,000 | |
QUALCOMM Inc. | | | | | | | | |
2.90% 05/20/24 (h) | | | 7,000 | | | | 6,663 | |
3.00% 05/20/22 (h) | | | 50,000 | | | | 49,257 | |
See Notes to Schedules of Investments and Notes to Financial Statements.
Elfun Income Fund
Schedule of Investments, continued — December 31, 2018
| | | | | | | | |
| | | Principal
Amount ($) | | | Fair
Value
$ | |
| | | | | | | | |
3.25% 05/20/27 (h) | | | 6,000 | | | | 5,582 | |
4.30% 05/20/47 (h) | | | 26,000 | | | | 23,144 | |
Quicken Loans Inc. | | | | | | | | |
5.25% 01/15/28 (b)(h) | | | 190,000 | | | | 170,519 | |
Range Resources Corp. | | | | | | | | |
5.00% 08/15/22 (h) | | | 289,000 | | | | 258,747 | |
Realty Income Corp. | | | | | | | | |
3.00% 01/15/27 (h) | | | 52,000 | | | | 48,271 | |
Republic Services Inc. | | | | | | | | |
3.38% 11/15/27 (h) | | | 38,000 | | | | 36,439 | |
Reynolds American Inc. | | | | | | | | |
4.45% 06/12/25 (h) | | | 4,000 | | | | 3,847 | |
Rio Tinto Finance USA PLC | | | | | | | | |
4.13% 08/21/42 (h) | | | 54,000 | | | | 52,044 | |
Rockwell Collins Inc. | | | | | | | | |
3.50% 03/15/27 (h) | | | 87,000 | | | | 81,889 | |
Rogers Communications Inc. | | | | | | | | |
5.00% 03/15/44 (h) | | | 41,000 | | | | 42,606 | |
Royal Bank of Scotland Group PLC (4.52% fixed rate until 06/25/23; 1.55% + 3 month USD LIBOR thereafter) | | | | | | | | |
4.52% 06/25/24 (h)(i) | | | 201,000 | | | | 196,946 | |
RPM International Inc. | | | | | | | | |
3.75% 03/15/27 (h) | | | 68,000 | | | | 64,694 | |
Ryder System Inc. | | | | | | | | |
2.45% 09/03/19 (h) | | | 410,000 | | | | 407,634 | |
Sabine Pass Liquefaction LLC | | | | | | | | |
4.20% 03/15/28 (h) | | | 77,000 | | | | 73,263 | |
5.00% 03/15/27 (h) | | | 39,000 | | | | 39,256 | |
salesforce.com Inc. | | | | | | | | |
3.25% 04/11/23 (h) | | | 116,000 | | | | 116,463 | |
3.70% 04/11/28 (h) | | | 160,000 | | | | 160,702 | |
Santander Holdings USA Inc. | | | | | | | | |
2.65% 04/17/20 (h) | | | 316,000 | | | | 311,971 | |
3.70% 03/28/22 (h) | | | 283,000 | | | | 277,917 | |
4.40% 07/13/27 (h) | | | 68,000 | | | | 64,191 | |
Santander UK Group Holdings PLC | | | | | | | | |
4.75% 09/15/25 (b)(h) | | | 200,000 | | | | 188,550 | |
Schlumberger Holdings Corp. | | | | | | | | |
3.00% 12/21/20 (b)(h) | | | 128,000 | | | | 126,924 | |
3.63% 12/21/22 (b) | | | 360,000 | | | | 358,355 | |
4.00% 12/21/25 (b) | | | 136,000 | | | | 134,100 | |
Sempra Energy | | | | | | | | |
3.80% 02/01/38 (h) | | | 44,000 | | | | 37,877 | |
4.00% 02/01/48 (h) | | | 54,000 | | | | 45,578 | |
Shell International Finance BV | | | | | | | | |
2.38% 08/21/22 | | | 177,000 | | | | 171,968 | |
3.75% 09/12/46 (h) | | | 41,000 | | | | 37,985 | |
4.13% 05/11/35 (h) | | | 50,000 | | | | 49,788 | |
| | | | | | | | |
| | | Principal
Amount ($) | | | Fair
Value
$ | |
Shire Acquisitions Investments Ireland DAC | | | | | | | | |
2.88% 09/23/23 (h) | | | 23,000 | | | | 21,733 | |
3.20% 09/23/26 (h) | | | 44,000 | | | | 40,108 | |
Siemens Financieringsmaatschappij N.V. | | | | | | | | |
2.00% 09/15/23 (b) | | | 260,000 | | | | 243,636 | |
Simon Property Group LP | | | | | | | | |
3.38% 06/15/27 (h) | | | 93,000 | | | | 89,167 | |
Sinclair Television Group Inc. | | | | | | | | |
5.38% 04/01/21 (h) | | | 259,000 | | | | 258,156 | |
Sirius XM Radio Inc. | | | | | | | | |
5.00% 08/01/27 (b)(h) | | | 95,000 | | | | 86,763 | |
SM Energy Co. | | | | | | | | |
5.63% 06/01/25 | | | 97,000 | | | | 84,390 | |
Smithfield Foods Inc. | | | | | | | | |
2.70% 01/31/20 (b)(h) | | | 81,000 | | | | 79,991 | |
4.25% 02/01/27 (b)(h) | | | 94,000 | | | | 85,894 | |
South Carolina Electric & Gas Co. | | | | | | | | |
4.10% 06/15/46 (h) | | | 49,000 | | | | 46,497 | |
Southern California Edison Co. | | | | | | | | |
2.40% 02/01/22 (h) | | | 150,000 | | | | 144,486 | |
Southern Company Gas Capital Corp. | | | | | | | | |
4.40% 05/30/47 (h) | | | 19,000 | | | | 17,690 | |
Southern Copper Corp. | | | | | | | | |
5.88% 04/23/45 (h) | | | 64,000 | | | | 65,068 | |
Southwestern Electric Power Co. | | | | | | | | |
2.75% 10/01/26 (h) | | | 107,000 | | | | 98,534 | |
Spectra Energy Partners LP | | | | | | | | |
3.38% 10/15/26 (h) | | | 34,000 | | | | 31,855 | |
4.50% 03/15/45 (h) | | | 23,000 | | | | 21,037 | |
Sprint Corp. | | | | | | | | |
7.63% 02/15/25 (h) | | | 378,000 | | | | 381,565 | |
Standard Industries Inc. | | | | | | | | |
5.38% 11/15/24 (h)(b) | | | 516,000 | | | | 485,819 | |
Starbucks Corp. | | | | | | | | |
4.00% 11/15/28 (h) | | | 72,000 | | | | 71,220 | |
Steel Dynamics Inc. | | | | | | | | |
5.13% 10/01/21 (h) | | | 95,000 | | | | 95,542 | |
Sumitomo Mitsui Financial Group Inc. | | | | | | | | |
2.78% 07/12/22(h) | | | 229,000 | | | | 223,071 | |
Suncor Energy Inc. | | | | | | | | |
4.00% 11/15/47(h) | | | 30,000 | | | | 26,601 | |
Sunoco Logistics Partners Operations LP | | | | | | | | |
5.30% 04/01/44(h) | | | 85,000 | | | | 75,047 | |
Syngenta Finance N.V. | | | | | | | | |
3.70% 04/24/20 (h)(b) | | | 225,000 | | | | 225,094 | |
See Notes to Schedules of Investments and Notes to Financial Statements.
Elfun Income Fund
Schedule of Investments, continued — December 31, 2018
| | | | | | | | |
| | | Principal
Amount ($) | | | Fair
Value
$ | |
| | | | | | | | |
3.93% 04/23/21 (b)(h) | | | 330,000 | | | | 324,895 | |
4.44% 04/24/23 (b)(h) | | | 200,000 | | | | 192,370 | |
5.18% 04/24/28 (b)(h) | | | 200,000 | | | | 184,304 | |
Sysco Corp. | | | | | | | | |
3.25% 07/15/27(h) | | | 79,000 | | | | 73,915 | |
T-Mobile USA Inc. | | | | | | | | |
4.50% 02/01/26(h) | | | 366,000 | | | | 338,056 | |
Takeda Pharmaceutical Company Ltd. | | | | | | | | |
3.80% 11/26/20 (b) | | | 209,000 | | | | 210,509 | |
4.00% 11/26/21 (b) | | | 310,000 | | | | 313,890 | |
Tampa Electric Co. | | | | | | | | |
4.35% 05/15/44(h) | | | 140,000 | | | | 139,051 | |
Target Corp. | | | | | | | | |
2.50% 04/15/26(h) | | | 95,000 | | | | 88,658 | |
Teck Resources Ltd. | | | | | | | | |
5.40% 02/01/43 (h) | | | 244,000 | | | | 212,107 | |
6.00% 08/15/40 (h) | | | 142,000 | | | | 131,016 | |
Telecom Italia S.p.A. | | | | | | | | |
5.30% 05/30/24(h)(b) | | | 477,000 | | | | 452,363 | |
Telefonica Emisiones SA | | | | | | | | |
4.10% 03/08/27(h) | | | 300,000 | | | | 289,833 | |
Tenet Healthcare Corp. | | | | | | | | |
4.63% 07/15/24 | | | 95,000 | | | | 88,492 | |
4.75% 06/01/20 (h) | | | 330,000 | | | | 329,746 | |
6.00% 10/01/20 (h) | | | 320,000 | | | | 322,653 | |
Teva Pharmaceutical Finance Netherlands III BV | | | | | | | | |
1.70% 07/19/19 (h) | | | 517,000 | | | | 508,640 | |
2.20% 07/21/21 (h) | | | 80,000 | | | | 73,416 | |
2.80% 07/21/23 (h) | | | 480,000 | | | | 413,198 | |
Texas Instruments Inc. | | | | | | | | |
4.15% 05/15/48(h) | | | 62,000 | | | | 61,898 | |
The Allstate Corp. | | | | | | | | |
4.20% 12/15/46(h) | | | 51,000 | | | | 49,553 | |
The Allstate Corp. (5.75% fixed rate until 08/15/23; 2.94% + 3 month USD LIBOR thereafter) | | | | | | | | |
5.75% 08/15/53(h)(i) | | | 205,000 | | | | 198,676 | |
The Bank of New York Mellon Corp. (2.66% fixed rate until 05/16/22; 0.63% + 3 month USD LIBOR thereafter) | | | | | | | | |
2.66% 05/16/23(h)(i) | | | 97,000 | | | | 94,554 | |
The Bank of New York Mellon Corp. (4.63% fixed rate until 09/20/26; 3.13% + 3 month USD LIBOR thereafter) | | | | | | | | |
4.63% 12/29/49(h)(i) | | | 115,000 | | | | 103,107 | |
| | | | | | | | |
| | | Principal
Amount ($) | | | Fair
Value
$ | |
The Bank of Nova Scotia (4.65% fixed rate until 10/12/22; 2.65% + 3 month USD LIBOR thereafter) | | | | | | | | |
4.65% 12/31/99(h)(i) | | | 146,000 | | | | 129,213 | |
The Boeing Co. | | | | | | | | |
3.25% 03/01/28 (h) | | | 97,000 | | | | 95,006 | |
3.55% 03/01/38 (h) | | | 105,000 | | | | 97,938 | |
The Chemours Co. | | | | | | | | |
5.38% 05/15/27(h) | | | 95,000 | | | | 85,593 | |
The Dow Chemical Co. | | | | | | | | |
4.25% 10/01/34 (h) | | | 89,000 | | | | 80,614 | |
5.55% 11/30/48 (b) | | | 90,000 | | | | 91,490 | |
The George Washington University | | | | | | | | |
4.13% 09/15/48 | | | 100,000 | | | | 99,966 | |
The Goldman Sachs Group Inc. | | | | | | | | |
3.85% 01/26/27 (h) | | | 53,000 | | | | 49,941 | |
4.25% 10/21/25 (h) | | | 9,000 | | | | 8,603 | |
4.80% 07/08/44 (h) | | | 74,000 | | | | 70,432 | |
5.15% 05/22/45 (h) | | | 67,000 | | | | 63,133 | |
The Goldman Sachs Group Inc. (2.91% fixed rate until 06/05/22; 1.05% + 3 month USD LIBOR thereafter) | | | | | | | | |
2.91% 06/05/23(h)(i) | | | 185,000 | | | | 176,875 | |
The Goldman Sachs Group Inc. (3.81% fixed rate until 04/23/28; 1.16% + 3 month USD LIBOR thereafter) | | | | | | | | |
3.81% 04/23/29(h)(i) | | | 66,000 | | | | 61,470 | |
The Goldman Sachs Group Inc. (4.02% fixed rate until 10/31/37; 1.37% + 3 month USD LIBOR thereafter) | | | | | | | | |
4.02% 10/31/38(h)(i) | | | 75,000 | | | | 65,893 | |
The Goldman Sachs Group Inc. (4.22% fixed rate until 05/01/28; 1.30% + 3 month USD LIBOR thereafter) | | | | | | | | |
4.22% 05/01/29(h)(i) | | | 93,000 | | | | 89,601 | |
The Hartford Financial Services Group Inc. 2.13% + 3 month USD LIBOR | | | | | | | | |
4.74% 02/12/67(b)(h)(i) | | | 120,000 | | | | 96,007 | |
The Home Depot Inc. | | | | | | | | |
3.35% 09/15/25 (h) | | | 51,000 | | | | 50,383 | |
3.50% 09/15/56 (h) | | | 82,000 | | | | 68,875 | |
3.90% 12/06/28 | | | 136,000 | | | | 139,131 | |
3.90% 06/15/47 (h) | | | 62,000 | | | | 58,652 | |
4.50% 12/06/48 | | | 114,000 | | | | 117,768 | |
See Notes to Schedules of Investments and Notes to Financial Statements.
Elfun Income Fund
Schedule of Investments, continued — December 31, 2018
| | | | | | | | |
| | | Principal
Amount ($) | | | Fair
Value
$ | |
| | | | | | | | |
The Interpublic Group of Companies Inc. | | | | | | | | |
3.75% 10/01/21(h) | | | 214,000 | | | | 215,327 | |
The Korea Development Bank | | | | | | | | |
3.38% 09/16/25(h) | | | 205,000 | | | | 201,699 | |
The Kroger Co. | | | | | | | | |
2.95% 11/01/21 (h) | | | 225,000 | | | | 221,357 | |
4.65% 01/15/48 (h) | | | 50,000 | | | | 45,091 | |
The Mosaic Co. | | | | | | | | |
5.63% 11/15/43(h) | | | 24,000 | | | | 24,244 | |
The Sherwin-Williams Co. | | | | | | | | |
2.25% 05/15/20 (h) | | | 146,000 | | | | 143,712 | |
2.75% 06/01/22 (h) | | | 55,000 | | | | 53,161 | |
3.45% 06/01/27 (h) | | | 4,000 | | | | 3,724 | |
4.50% 06/01/47 (h) | | | 17,000 | | | | 15,328 | |
The Southern Co. | | | | | | | | |
1.85% 07/01/19 (h) | | | 534,000 | | | | 530,054 | |
3.25% 07/01/26 (h) | | | 55,000 | | | | 51,432 | |
4.40% 07/01/46 (h) | | | 27,000 | | | | 24,881 | |
The Toronto-Dominion Bank (3.63% fixed rate until 09/15/26; 2.21% + USD 5 year Swap Rate thereafter) | | | | | | | | |
3.63% 09/15/31(h)(i) | | | 161,000 | | | | 152,042 | |
The Walt Disney Co. | | | | | | | | |
4.13% 06/01/44(h) | | | 33,000 | | | | 32,661 | |
The Williams Companies Inc. | | | | | | | | |
3.75% 06/15/27 (h) | | | 33,000 | | | | 31,027 | |
3.90% 01/15/25 (h) | | | 57,000 | | | | 55,318 | |
4.85% 03/01/48 (h) | | | 66,000 | | | | 59,974 | |
4.90% 01/15/45 (h) | | | 36,000 | | | | 32,638 | |
5.40% 03/04/44 (h) | | | 24,000 | | | | 22,998 | |
Time Warner Cable LLC | | | | | | | | |
4.50% 09/15/42 (h) | | | 22,000 | | | | 17,486 | |
6.55% 05/01/37 (h) | | | 59,000 | | | | 59,644 | |
TransCanada PipeLines Ltd. | | | | | | | | |
4.25% 05/15/28 (h) | | | 205,000 | | | | 202,901 | |
4.88% 01/15/26 (h) | | | 34,000 | | | | 35,170 | |
Transcontinental Gas Pipe Line Company LLC | | | | | | | | |
4.00% 03/15/28(h) | | | 93,000 | | | | 89,843 | |
Tyco Electronics Group S.A. | | | | | | | | |
2.35% 08/01/19 (h) | | | 308,000 | | | | 306,411 | |
3.13% 08/15/27 (h) | | | 90,000 | | | | 83,562 | |
Tyson Foods Inc. | | | | | | | | |
2.65% 08/15/19 (h) | | | 63,000 | | | | 62,674 | |
4.55% 06/02/47 (h) | | | 26,000 | | | | 22,867 | |
U.S. Bancorp | | | | | | | | |
3.15% 04/27/27 | | | 141,000 | | | | 135,339 | |
U.S. Bancorp (5.13% fixed rate until 01/15/21; 3.49% + 3 month USD LIBOR thereafter) | | | | | | | | |
5.13% 12/29/49(h)(i) | | | 317,000 | | | | 314,572 | |
| | | | | | | | |
| | | Principal
Amount ($) | | | Fair
Value
$ | |
UBS Group Funding Switzerland AG (2.86% fixed rate until 08/15/22; 0.95% + 3 month USD LIBOR thereafter) | | | | | | | | |
2.86% 08/15/23(b)(h)(i) | | | 284,000 | | | | 272,481 | |
Union Pacific Corp. | | | | | | | | |
3.20% 06/08/21 (h) | | | 212,000 | | | | 212,770 | |
3.50% 06/08/23 (h) | | | 143,000 | | | | 143,373 | |
3.60% 09/15/37 (h) | | | 25,000 | | | | 22,363 | |
4.10% 09/15/67 (h) | | | 50,000 | | | | 42,038 | |
United Rentals North America Inc. | | | | | | | | |
4.88% 01/15/28 | | | 97,000 | | | | 85,150 | |
United Technologies Corp. | | | | | | | | |
3.65% 08/16/23 (h) | | | 154,000 | | | | 153,418 | |
3.75% 11/01/46 (h) | | | 68,000 | | | | 58,168 | |
3.95% 08/16/25 (h) | | | 61,000 | | | | 60,579 | |
4.13% 11/16/28 (h) | | | 18,000 | | | | 17,836 | |
4.15% 05/15/45 (h) | | | 78,000 | | | | 69,794 | |
4.45% 11/16/38 (h) | | | 63,000 | | | | 60,779 | |
4.50% 06/01/42 (h) | | | 56,000 | | | | 53,221 | |
UnitedHealth Group Inc. | | | | | | | | |
4.45% 12/15/48 | | | 89,000 | | | | 91,674 | |
4.75% 07/15/45 (h) | | | 17,000 | | | | 17,978 | |
Vale Overseas Ltd. | | | | | | | | |
4.38% 01/11/22 (h) | | | 13,000 | | | | 13,238 | |
6.25% 08/10/26 (h) | | | 42,000 | | | | 45,486 | |
6.88% 11/10/39 (h) | | | 47,000 | | | | 54,300 | |
Vale S.A. | | | | | | | | |
5.63% 09/11/42(h) | | | 29,000 | | | | 29,296 | |
Valero Energy Partners LP | | | | | | | | |
4.38% 12/15/26(h) | | | 169,000 | | | | 166,059 | |
Ventas Realty LP | | | | | | | | |
3.25% 10/15/26(h) | | | 104,000 | | | | 96,734 | |
Verizon Communications Inc. | | | | | | | | |
3.38% 02/15/25 (h) | | | 45,000 | | | | 43,651 | |
4.33% 09/21/28 (h) | | | 112,000 | | | | 112,410 | |
4.40% 11/01/34 (h) | | | 87,000 | | | | 83,974 | |
4.67% 03/15/55 (h) | | | 74,000 | | | | 68,121 | |
4.86% 08/21/46 (h) | | | 363,000 | | | | 357,170 | |
5.01% 04/15/49 (h) | | | 47,000 | | | | 46,828 | |
5.25% 03/16/37 (h) | | | 59,000 | | | | 61,769 | |
Viacom Inc. | | | | | | | | |
3.45% 10/04/26 (h) | | | 66,000 | | | | 61,042 | |
4.38% 03/15/43 | | | 68,000 | | | | 54,951 | |
5.25% 04/01/44 (h) | | | 20,000 | | | | 17,989 | |
Virgin Media Finance PLC | | | | | | | | |
5.75% 01/15/25(b)(h) | | | 234,000 | | | | 220,140 | |
Virginia Electric & Power Co. | | | | | | | | |
4.00% 11/15/46(h) | | | 143,000 | | | | 135,448 | |
Visa Inc. | | | | | | | | |
3.15% 12/14/25 (h) | | | 39,000 | | | | 38,306 | |
See Notes to Schedules of Investments and Notes to Financial Statements.
Elfun Income Fund
Schedule of Investments, continued — December 31, 2018
| | | | | | | | |
| | | Principal
Amount ($) | | | Fair
Value
$ | |
| | | | | | | | |
4.30% 12/14/45 (h) | | | 62,000 | | | | 64,205 | |
Vodafone Group PLC | | | | | | | | |
4.38% 05/30/28 (h) | | | 139,000 | | | | 134,738 | |
5.25% 05/30/48 (h) | | | 48,000 | | | | 44,976 | |
Volkswagen Group of America Finance LLC | | | | | | | | |
4.00% 11/12/21(b)(h) | | | 400,000 | | | | 399,512 | |
Vornado Realty LP | | | | | | | | |
3.50% 01/15/25(h) | | | 59,000 | | | | 56,808 | |
Vulcan Materials Co. | | | | | | | | |
3.90% 04/01/27(h) | | | 41,000 | | | | 38,898 | |
Wabtec Corp. | | | | | | | | |
3.45% 11/15/26(h) | | | 38,000 | | | | 33,925 | |
Walgreens Boots Alliance Inc. | | | | | | | | |
4.65% 06/01/46(h) | | | 36,000 | | | | 32,499 | |
Walmart Inc. | | | | | | | | |
3.63% 12/15/47 (h) | | | 60,000 | | | | 55,533 | |
3.70% 06/26/28 (h) | | | 132,000 | | | | 133,885 | |
3.95% 06/28/38 (h) | | | 51,000 | | | | 50,678 | |
4.05% 06/29/48 (h) | | | 63,000 | | | | 62,592 | |
Warner Media LLC | | | | | | | | |
5.35% 12/15/43(h) | | | 64,000 | | | | 61,402 | |
WEC Energy Group Inc. | | | | | | | | |
3.55% 06/15/25(h) | | | 98,000 | | | | 95,265 | |
WellCare Health Plans Inc. | | | | | | | | |
5.25% 04/01/25(h) | | | 212,000 | | | | 204,090 | |
Wells Fargo & Co. | | | | | | | | |
2.63% 07/22/22 (h) | | | 299,000 | | | | 288,365 | |
3.90% 05/01/45 (h) | | | 7,000 | | | | 6,424 | |
4.75% 12/07/46 (h) | | | 186,000 | | | | 179,512 | |
Wells Fargo & Co. (5.88% fixed rate until 06/15/25; 3.99% + 3 month USD LIBOR thereafter) | | | | | | | | |
5.88% 12/29/49(h)(i) | | | 138,000 | | | | 136,526 | |
Wells Fargo & Co. (5.90% fixed rate until 06/15/24; 3.11% + 3 month USD LIBOR thereafter) | | | | | | | | |
5.90% 12/29/49(h)(i) | | | 143,000 | | | | 136,150 | |
Wells Fargo & Co. 3.77% + 3 month USD LIBOR | | | | | | | | |
6.56% 03/29/49(h)(i) | | | 190,000 | | | | 188,887 | |
Wells Fargo Bank NA | | | | | | | | |
2.60% 01/15/21(h) | | | 989,000 | | | | 976,143 | |
Western Gas Partners LP | | | | | | | | |
4.00% 07/01/22 (h) | | | 245,000 | | | | 241,746 | |
5.38% 06/01/21 (h) | | | 42,000 | | | | 43,270 | |
Westlake Chemical Corp. | | | | | | | | |
3.60% 08/15/26 (h) | | | 27,000 | | | | 24,823 | |
4.38% 11/15/47 (h) | | | 15,000 | | | | 12,451 | |
5.00% 08/15/46 (h) | | | 36,000 | | | | 32,903 | |
| | | | | | | | |
| | | Principal
Amount ($) | | | Fair
Value
$ | |
Willis North America Inc. | | | | | | | | |
3.60% 05/15/24(h) | | | 101,000 | | | | 98,363 | |
WPP Finance 2010 | | | | | | | | |
3.75% 09/19/24(h) | | | 66,000 | | | | 61,528 | |
WRKCo Inc. | | | | | | | | |
3.00% 09/15/24(b)(h) | | | 72,000 | | | | 67,685 | |
Xilinx Inc. | | | | | | | | |
2.95% 06/01/24(h) | | | 67,000 | | | | 63,968 | |
XPO Logistics Inc. | | | | | | | | |
6.50% 06/15/22(b)(h) | | | 121,000 | | | | 119,823 | |
Yamana Gold Inc. | | | | | | | | |
4.63% 12/15/27(h) | | | 89,000 | | | | 82,279 | |
Zoetis Inc. | | | | | | | | |
3.00% 09/12/27 (h) | | | 40,000 | | | | 36,938 | |
3.90% 08/20/28 (h) | | | 93,000 | | | | 91,899 | |
| | | | | | | | |
| | | | | | | 98,037,452 | |
| | | | | | | | |
|
Non-Agency Collateralized Mortgage Obligations - 3.0% | |
BANK 2018-BNK11 | | | | | | | | |
4.36% 03/15/61(i) | | | 139,000 | | | | 140,808 | |
BXP Trust2017-GM | | | | | | | | |
3.38% 06/13/39(h)(b) | | | 714,000 | | | | 698,189 | |
Citigroup Commercial Mortgage Trust2016-P5 | | | | | | | | |
2.94% 10/10/49(h) | | | 399,397 | | | | 381,712 | |
Citigroup Commercial Mortgage Trust2016-P6 | | | | | | | | |
3.72% 12/10/49 (h)(i) | | | 560,118 | | | | 564,425 | |
4.03% 12/10/49 (h)(i) | | | 336,823 | | | | 339,045 | |
Citigroup Commercial Mortgage Trust2018-C5 | | | | | | | | |
4.51% 06/10/51 | | | 250,000 | | | | 255,497 | |
COMM 2013-LC13 Mortgage Trust | | | | | | | | |
4.56% 08/10/46(b)(h)(i) | | | 170,000 | | | | 175,653 | |
COMM 2014-CR14 Mortgage Trust | | | | | | | | |
4.53% 02/10/47(h)(i) | | | 240,000 | | | | 248,046 | |
GS Mortgage Securities Trust 2012-GCJ9 | | | | | | | | |
1.96% 11/10/45(g)(h)(i) | | | 727,520 | | | | 46,145 | |
GS Mortgage Securities Trust2016-GS3 | | | | | | | | |
2.85% 10/10/49(h) | | | 333,000 | | | | 315,860 | |
GS Mortgage Securities Trust2017-GS5 | | | | | | | | |
3.67% 03/10/50(h) | | | 406,216 | | | | 405,784 | |
GS Mortgage Securities Trust2017-GS8 | | | | | | | | |
3.47% 11/10/50(h) | | | 767,075 | | | | 754,413 | |
GS Mortgage Securities Trust2018-GS9 | | | | | | | | |
4.14% 03/10/51(i) | | | 291,000 | | | | 295,180 | |
See Notes to Schedules of Investments and Notes to Financial Statements.
Elfun Income Fund
Schedule of Investments, continued — December 31, 2018
| | | | | | | | |
| | |
Principal
Amount ($) | | | Fair
Value
$ | |
| | | | | | | | |
Impac CMB Trust2004-5 0.72% + 1 month USD LIBOR | | | | | | | | |
3.23% 10/25/34(h)(i) | | | 63,800 | | | | 61,991 | |
JP Morgan Chase Commercial Mortgage Securities Corp.2012-LC9 | | | | | | | | |
1.53% 12/15/47(g)(h)(i) | | | 781,896 | | | | 34,732 | |
JPMBB Commercial Mortgage Securities Trust2013-C12 | | | | | | | | |
4.03% 07/15/45(h)(i) | | | 125,000 | | | | 126,605 | |
LB-UBS Commercial Mortgage Trust2004-C8 | | | | | | | | |
0.32% 12/15/39(b)(g)(h)(i) | | | 81,835 | | | | 78 | |
LB-UBS Commercial Mortgage Trust2007-C6 | | | | | | | | |
6.11% 07/15/40 (h)(i) | | | 5,745 | | | | 5,777 | |
6.11% 07/15/40 (b)(h) | | | 12,290 | | | | 12,357 | |
Morgan Stanley Bank of America Merrill Lynch Trust2015-C21 | | | | | | | | |
0.94% 03/15/48(g)(h)(i) | | | 3,634,106 | | | | 159,465 | |
Morgan Stanley Capital I Trust 2006-IQ11 | | | | | | | | |
6.25% 10/15/42(h)(i) | | | 250,000 | | | | 255,062 | |
Morgan Stanley Capital I Trust2006-T21 | | | | | | | | |
5.24% 10/12/52(h)(i) | | | 25,355 | | | | 25,574 | |
UBS Commercial Mortgage Trust2018-C12 | | | | | | | | |
4.79% 08/15/51(i) | | | 213,000 | | | | 219,792 | |
Wells Fargo Commercial Mortgage Trust2015-C26 | | | | | | | | |
1.23% 02/15/48(g)(h)(i) | | | 2,932,109 | | | | 167,908 | |
Wells Fargo Commercial Mortgage Trust2018-AUS | | | | | | | | |
4.06% 07/17/36(b)(i) | | | 343,000 | | | | 348,392 | |
WFRBS Commercial Mortgage Trust2013-C17 | | | | | | | | |
4.26% 12/15/46(h) | | | 235,000 | | | | 239,865 | |
WFRBS Commercial Mortgage Trust 2014-LC14 | | | | | | | | |
4.35% 03/15/47(h)(i) | | | 533,000 | | | | 542,303 | |
| | | | | | | | |
| | | | | | | 6,820,658 | |
| | | | | | | | |
|
Sovereign Bonds - 0.6% | |
Government of Chile | | | | | | | | |
3.86% 06/21/47(h) | | | 200,000 | | | | 186,750 | |
Government of Colombia | | | | | | | | |
5.00% 06/15/45(h) | | | 200,000 | | | | 190,704 | |
Government of Mexico | | | | | | | | |
4.00% 10/02/23 | | | 86,000 | | | | 85,644 | |
| | | | | | | | |
| | | Principal
Amount ($)
or Number of
Shares | | | Fair
Value
$ | |
4.75% 03/08/44 (h) | | | 200,000 | | | | 181,550 | |
Government of Oman | | | | | | | | |
4.13% 01/17/23(b)(h) | | | 220,000 | | | | 201,874 | |
Government of Panama | | | | | | | | |
4.00% 09/22/24(h) | | | 200,000 | | | | 201,530 | |
Government of Peru | | | | | | | | |
5.63% 11/18/50(h) | | | 105,000 | | | | 123,202 | |
Government of Philippines | | | | | | | | |
3.95% 01/20/40 | | | 200,000 | | | | 195,322 | |
Government of Uruguay | | | | | | | | |
5.10% 06/18/50 | | | 105,744 | | | | 103,934 | |
| | | | | | | | |
| | | | | | | 1,470,510 | |
| | | | | | | | |
|
Municipal Bonds and Notes - 0.9% | |
American Municipal Power Inc. | | | | | | | | |
6.27% 02/15/50(h) | | | 135,000 | | | | 167,535 | |
Metropolitan St. Louis Sewer District | | | | | | | | |
5.00% 05/01/47 | | | 400,000 | | | | 452,564 | |
New Jersey Transportation Trust Fund Authority | | | | | | | | |
6.88% 12/15/39(h) | | | 165,000 | | | | 167,241 | |
Port Authority of New York & New Jersey | | | | | | | | |
4.46% 10/01/62(h) | | | 470,000 | | | | 478,182 | |
State of California | | | | | | | | |
4.60% 04/01/38 | | | 200,000 | | | | 206,270 | |
5.70% 11/01/21 (h) | | | 280,000 | | | | 301,154 | |
State of Illinois | | | | | | | | |
5.10% 06/01/33(h) | | | 95,000 | | | | 90,576 | |
The University of Texas System | | | | | | | | |
3.35% 08/15/47(h) | | | 115,000 | | | | 104,129 | |
| | | | | | | | |
| | | | | | | 1,967,651 | |
| | | | | | | | |
| |
Total Bonds and Notes
(Cost $224,976,624) | | | | 223,268,520 | |
| | | | | | | | |
| | |
| Domestic Equity - 0.1% | | | | | | | | |
Preferred Stock - 0.1% | | | | | | | | |
Wells Fargo & Co. 3.09% +
3 month USD LIBOR
(Cost $186,475) (h)(i) | | | 7,459 | | | | 183,268 | |
| | | | | | | | |
| |
Total Investments in Securities
(Cost $225,163,099) | | | | 223,451,788 | |
| | | | | | | | |
See Notes to Schedules of Investments and Notes to Financial Statements.
Elfun Income Fund
Schedule of Investments, continued — December 31, 2018
| | | | | | | | |
| | | Number of
Shares | | | Fair
Value
$ | |
| | | | | | | | |
|
| Short-Term Investments - 17.9% | |
State Street Institutional U.S. Government Money Market Fund - Class G Shares 2.31%
(Cost $41,181,071) (d)(h)(n) | | | 41,181,071 | | | | 41,181,071 | |
| | | | | | | | |
| |
Total Investments
(Cost $266,344,170) | | | | 264,632,859 | |
| |
Liabilities in Excess of Other Assets,
net - (15.3)% | | | | (35,155,839 | ) |
| | | | | | | | |
| | |
| NET ASSETS - 100.0% | | | | | | | 229,477,020 | |
| | | | | | | | |
Other Information:
Centrally Cleared Credit Default Swaps - Sell Protection
| | | | | | | | | | | | | | | | | | | | | | | | | | |
Reference
Entity | | Counterparty | | Notional
Amount
(000s omitted) | | | Contract
Annual
Fixed Rate/
Payment
Frequency | | | Termination
Date | | | Market
Value | | | Unamortized
Upfront
Payments
Received | | | Unrealized
Depreciation | |
| | | | | | | | | | | | | | | | | | | | | | | | | | |
Markit CDX North America High Yield Index | | Intercontinental Exchange | | $ | 2,569 | | |
| 5.00%/
Quarterly |
| | | 12/20/23 | | | $ | 52,147 | | | $ | 141,210 | | | $ | (89,063 | ) |
| | | | | | | | | | | | | | | | | | | | | | | | | | |
Centrally Cleared Interest Rate Swaps
| | | | | | | | | | | | | | | | | | | | | | | | | | | | | | | | |
| Counterparty | | Notional
Amount
(000s
omitted) | | | Fund
Pays/
Receives
Fixed
Rate/
Payment
Frequency | | | Floating
Rate | | | Contract
Annual
Fixed
Rate | | | Termination
Date | | | Market
Value | | | Unamortized
Upfront
Payments
Received | | | Unrealized
Depreciation | |
| | | | | | | | | | | | | | | | | | | | | | | | | | | | | | | | |
CME Group, Inc. | | $ | 10,655 | | |
| Receives/
Quarterly |
| |
| 3 Month U.S.
Dollar LIBOR |
| | | 3.05% | | | | 11/19/21 | | | $ | (137,272 | ) | | $ | — | | | $ | (137,272 | ) |
CME Group, Inc. | | | 10,657 | | |
| Receives/
Quarterly |
| |
| 3 Month U.S.
Dollar LIBOR |
| | | 3.06% | | | | 11/19/21 | | | | (138,634 | ) | | | — | | | | (138,634 | ) |
| | | | | | | | | | | | | | | | | | | | | | | | | | | | | | | | |
| | | | | | | | | | | | | | | | | | | | | | | | | | | | | | $ | (275,906 | ) |
| | | | | | | | | | | | | | | | | | | | | | | | | | | | | | | | |
The Fund had the following long futures contracts open at December 31, 2018:
| | | | | | | | | | | | | | | | | | | | |
| Description | | Expiration
date | | | Number
of
Contracts | | | Notional
Amount | | | Value | | | Unrealized
Appreciation | |
| | | | | | | | | | | | | | | | | | | | |
Ultra Long-Term U.S. Treasury Bond Futures | | | March 2019 | | | | 59 | | | $ | 9,134,530 | | | $ | 9,478,599 | | | $ | 344,069 | |
2 Yr. U.S. Treasury Notes Futures | | | March 2019 | | | | 214 | | | | 45,142,911 | | | | 45,434,875 | | | | 291,964 | |
5 Yr. U.S. Treasury Notes Futures | | | March 2019 | | | | 68 | | | | 7,699,153 | | | | 7,798,750 | | | | 99,597 | |
10 Yr. U.S. Treasury Notes Futures | | | March 2019 | | | | 120 | | | | 14,343,068 | | | | 14,641,875 | | | | 298,806 | |
| | | | | | | | | | | | | | | | | | | | |
| | | $ | 1,034,436 | |
| | | | | | | | | | | | | | | | | | | | |
See Notes to Schedules of Investments and Notes to Financial Statements.
Elfun Income Fund
Schedule of Investments, continued — December 31, 2018
The Fund had the following short futures contracts open at December 31, 2018:
| | | | | | | | | | | | | | | | | | | | |
| Description | | Expiration
date | | | Number
of
Contracts | | | Notional
Amount | | | Value | | | Unrealized
Depreciation | |
| | | | | | | | | | | | | | | | | | | | |
U.S. Long Bond Futures | | | March 2019 | | | | 24 | | | $ | (3,341,196 | ) | | $ | (3,504,000 | ) | | $ | (162,804 | ) |
10 Yr. U.S. Treasury Ultra Futures | | | March 2019 | | | | 65 | | | | (8,205,706 | ) | | | (8,455,078 | ) | | | (249,372 | ) |
| | | | | | | | | | | | | | | | | | | | |
| | | $ | (412,176 | ) |
| | | | | | | | | | | | | | | | | | | | |
During the period ended December 31, 2018 average notional values related to derivative contracts were as follows:
| | | | | | | | | | | | | | | | | | | | | | | | |
| | | Purchased Call Options | | | Written Call Options | | | Long Futures Contracts | | | Short Futures Contracts | | | Credit Default Swap Contracts | | | Interest Rate Swap Contracts | |
| | | | | | | | | | | | | | | | | | | | | | | | |
Average Notional Value | | $ | 30,413 | | | $ | 14,250 | | | $ | 77,580,399 | | | $ | 25,610,545 | | | $ | 4,573,395 | | | $ | 21,459,199 | |
TBA - To Be Announced
The following table presents the Fund’s investments measured at fair value on a recurring basis at December 31, 2018:
| | | | | | | | | | | | | | | | | | |
| Fund | | Investments | | Level 1 | | | Level 2 | | | Level 3 | | | Total | |
| | | | | | | | | | | | | | | | | | |
| | | | | |
| Elfun Income Fund | | Investments in Securities | | | | | | | | | | | | | | | | |
| | | | | |
| | U.S. Treasuries | | $ | — | | | $ | 60,577,270 | | | $ | — | | | $ | 60,577,270 | |
| | | | | |
| | Agency Mortgage Backed | | | — | | | | 46,250,230 | | | | — | | | | 46,250,230 | |
| | | | | |
| | Agency Collateralized Mortgage Obligations | | | — | | | | 1,788,030 | | | | — | | | | 1,788,030 | |
| | | | | |
| | Asset Backed | | | — | | | | 6,356,719 | | | | — | | | | 6,356,719 | |
| | | | | |
| | Corporate Notes | | | — | | | | 98,037,452 | | | | — | | | | 98,037,452 | |
| | | | | |
| | Non-Agency Collateralized Mortgage Obligations | | | — | | | | 6,820,658 | | | | — | | | | 6,820,658 | |
| | | | | |
| | Sovereign Bonds | | | — | | | | 1,470,510 | | | | — | | | | 1,470,510 | |
| | | | | |
| | Municipal Bonds and Notes | | | — | | | | 1,967,651 | | | | — | | | | 1,967,651 | |
| | | | | |
| | Preferred Stock | | | 183,268 | | | | — | | | | — | | | | 183,268 | |
| | | | | |
| | Short-Term Investments | | | 41,181,071 | | | | — | | | | — | | | | 41,181,071 | |
| | | | | | | | | | | | | | | | | | |
| | | | | |
| | Total Investments in Securities | | $ | 41,364,339 | | | $ | 223,268,520 | | | $ | — | | | $ | 264,632,859 | |
| | | | | | | | | | | | | | | | | | |
| | | | | |
| | Other Financial Instruments | | | | | | | | | | | | | | | | |
| | | | | |
| | Credit Default Swap Contracts - Unrealized Depreciation | | $ | — | | | $ | (89,063 | ) | | $ | — | | | $ | (89,063 | ) |
| | | | | |
| | Interest Rate Swap Contracts - Unrealized Depreciation | | | — | | | | (275,906 | ) | | | — | | | | (275,906 | ) |
| | | | | |
| | Long Futures Contracts - Unrealized Appreciation | | | 1,034,436 | | | | — | | | | — | | | | 1,034,436 | |
| | | | | |
| | Short Futures Contracts - Unrealized Depreciation | | | (412,176 | ) | | | — | | | | — | | | | (412,176 | ) |
| | | | | | | | | | | | | | | | | | |
| | | | | |
| | Total Other Financial Instruments | | $ | 622,260 | | | $ | (364,969 | ) | | $ | — | | | $ | 257,291 | |
| | | | | | | | | | | | | | | | | | |
See Notes to Schedules of Investments and Notes to Financial Statements.
Elfun Income Fund
Schedule of Investments, continued — December 31, 2018
Affiliate Table
| | | | | | | | | | | | | | | | | | | | | | | | | | | | | | | | | | | | |
| | | Number of
Shares
Held at
12/31/17 | | | Value
At
12/31/17 | | | Cost of
Purchases | | | Proceeds
from
Shares
Sold | | | Realized
Gain
(Loss) | | | Change in
Unrealized
Appreciation/
Depreciation | | | Number of
Shares
Held at
12/31/18 | | | Value
at
12/31/18 | | | Dividend
Income | |
State Street Institutional U.S. Government Money Market Fund - Class G Shares | | | 8,419,038 | | | $ | 8,419,038 | | | $ | 116,257,411 | | | $ | 83,495,378 | | | $ | — | | | $ | — | | | | 41,181,071 | | | $ | 41,181,071 | | | $ | 280,917 | |
See Notes to Schedules of Investments and Notes to Financial Statements.
Elfun Government Money Market Fund
Management Discussion of Fund Performance — December 31, 2018 (Unaudited)
The Elfun Government Money Market Fund (the “Fund”) seeks a high level of current income consistent with prudent investment management and the preservation of capital. The Fund’s benchmark is the Daily-Linked90- DayT-Bill (the “Index”).
For the12-month period ended December 31, 2018 (the “Reporting Period”), the total return for the Fund was 1.55%, and the Index was 1.99%. The Fund and Index returns reflect the reinvestment of dividends and other income. The Fund’s performance reflects the expenses of managing the Fund, including brokerage and advisory expenses. The Index is unmanaged and Index returns do not reflect fees and expenses of any kind, which would have a negative impact on returns.
Security selection, yield curve and market effect were primary drivers of Fund performance during the Reporting Period relative to the Index. The year saw four central bank rate hikes and significant volatility in money market rates. The Fund took these rate hikes in stride with no negative consequence. The U.S. tax deal in December of 2017 brought on a wave of Treasury Bill issuance in 2018. This issuance coupled with U.S. corporate off shore profits being repatriated cause a significant widening in the yield difference between LIBOR and Overnight Index Swaps (OIS). This spread, also referred to as “LOIS”, widened by approximately 45 basis points in the first quarter only to slowly contract as the year went on. The Fund was not impacted by this widening in spread due to the Fund not owning U.S. corporate debt. The year also saw the debut of the Secured Overnight Financing Rate (“SOFR”). This rate will ultimately replace LIBOR as a short term benchmark rate. The SOFR rate is made up of approximately $800 billion of overnight repurchase trades backed by U.S. Treasury collateral. The Fund did purchase some floating rate notes whose rate resets off this Index.
The views expressed above reflect those of the Fund’s portfolio manager only through the Reporting Period, and do not necessarily represent the views of the Adviser as a whole. Any such views are subject to change at any time based upon market or other conditions and the Adviser disclaims any responsibility to update such views. These views may not be relied on as investment advice and, because investment decisions for a fund are based on numerous factors, may not be relied on as an indication of trading intent on behalf of any fund.
| | | | |
| Elfun Government Money Market Fund | | | 85 | |
Elfun Government Money Market Fund
Understanding Your Fund’s Expenses (Unaudited)
As a shareholder of the Fund you incur ongoing costs. Ongoing costs include portfolio management fees, professional fees, administrative fees and other Fund expenses. The following example is intended to help you understand your ongoing costs (in dollars) of investing in the Fund and to compare these costs with the ongoing costs of investing in other mutual funds.
To illustrate these ongoing costs, we have provided an example and calculated the expenses paid by investors in units of the Fund during the period. The information in the following table is based on an investment of $1,000, which is invested at the beginning of the period and held for the entiresix-month period ended December 31, 2018.
Actual Expenses
The first section of the table provides information about actual account values and actual expenses. You may use the information in this section, together with the amount you invested, to estimate the expenses that you paid over the period. To do so, simply divide your account value by $1,000 (for example, an $8,600 account value divided by $1,000 = 8.6), then multiply the result by the number given under the heading “Expenses paid during the period” to estimate the expenses you paid on your account during the period.
Hypothetical Example for Comparison Purposes
The second section of the table provides information about hypothetical account values and hypothetical expenses based on the Fund’s actual expense ratio and an assumed rate of return of 5% per year before expenses, which is not the Fund’s actual return. The hypothetical account values and expenses may not be used to estimate the actual ending account balance or expenses you paid for the period. You may use this information to compare the ongoing costs of investing in the Fund and other funds. To do so, compare this 5% hypothetical example with the 5% hypothetical examples that appear in the shareholders reports of other funds.
Please note that the expenses shown in the table are meant to highlight and help you compare ongoing costs only and do not reflect transaction costs, such as sales charges or redemption fees, if any. Therefore, the second section of the table is useful in comparing ongoing costs only, and will not help you determine the relative total costs of owning different funds.
| | | | | | | | |
| | | Actual
Fund Return | | | Hypothetical
5% Return
(2.5% for
the period) | |
Actual Fund Return | | | | | | | | |
Beginning Account Value July 1, 2018 | | $ | 1,000.00 | | | $ | 1,000.00 | |
Ending Account Value December 31, 2018 | | $ | 1,009.10 | | | $ | 1,023.64 | |
Expenses Paid During Period* | | $ | 1.57 | | | $ | 1.58 | |
| * | | Expenses are equal to the Fund’s annualized expense ratio of 0.31%** (for the period July 1, 2018-December 31, 2018), multiplied by the average account value over the period, multiplied by 184/365 (to reflect theone-half year period). |
| ** | | May differ from expense ratio disclosed in the financial highlights, which is calculated based on the entire fiscal year’s data. |
| | |
| 86 | | Elfun Government Money Market Fund |
Elfun Government Money Market Fund
Performance Summary — December 31, 2018 (Unaudited)
Sector Allocation
Portfolio composition as a % of Investments of $104,813 (in thousands) on December 31, 2018 (a)
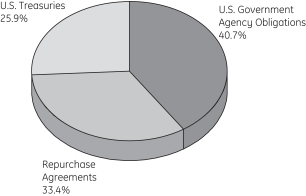
Average Annual Total Return for the periods ended December 31, 2018
(Inception date: 6/13/90)
| | | | | | | | | | | | | | | | |
| | | One Year | | | Five Year | | | Ten Year | | | Ending Value
of a $10,000
Investment | |
Elfun Government Money Market Fund | | | 1.55 | % | | | 0.46 | % | | | 0.30 | % | | $ | 10,304 | |
| | | | |
90 Day U.S.Treasury-Bill | | | 1.99 | % | | | 0.67 | % | | | 0.38 | % | | $ | 10,347 | |
| (a) | The securities information regarding holdings, allocations and other characteristics is presented to illustrate examples of securities that the Fund has bought and the diversity of areas in which the Fund may invest as of a particular date. It may not be representative of the Fund’s current or future investments and should not be construed as a recommendation to purchase or sell a particular security. |
| | | | |
| Elfun Government Money Market Fund | | | 87 | |
Elfun Government Money Market Fund
Performance Summary, continued — December 31, 2018 (Unaudited)
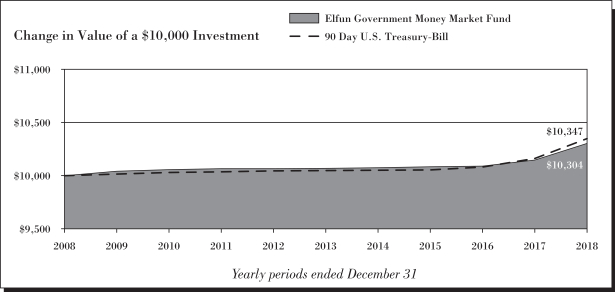
See Notes to Performance beginning on page 1 for further information.
Past performance does not predict future performance. The performance shown in the graphs and tables does not reflect the deduction of taxes that a shareholder would pay on Fund distributions or the redemption of Fund shares.
An investment in the Elfun Government Money Market Fund is not insured or guaranteed by the Federal Deposit Insurance Corporation or by any other Government agency. Although the Fund seeks to preserve the value of your investment at $1.00 per unit, it is possible to lose money by investing in the Fund.
| | |
| 88 | | Elfun Government Money Market Fund |
Elfun Government Money Market Fund
Schedule of Investments — December 31, 2018
| | | | | | | | |
| | | Principal
Amount ($) | | | Amortized
Cost
$ | |
| | | | | | | | |
|
| Short-Term Investments - 100.5%† | |
U.S. Treasuries - 26.0% | |
U.S. Treasury Bills
2.22% 01/03/19 (d) | | | 1,000,000 | | | | 999,879 | |
2.25% 01/10/19 (d) | | | 1,750,000 | | | | 1,749,036 | |
2.26% 01/10/19 (d) | | | 3,000,000 | | | | 2,998,335 | |
2.28% 01/02/19 (d) | | | 1,000,000 | | | | 999,938 | |
2.30% 01/17/19 (d) | | | 1,200,000 | | | | 1,198,799 | |
2.31% 01/17/19 (d) | | | 800,000 | | | | 799,193 | |
2.32% 01/08/19 (d) | | | 3,000,000 | | | | 2,998,667 | |
2.34% 01/15/19 (d) | | | 1,000,000 | | | | 999,106 | |
2.35% 01/31/19 (d) | | | 1,800,000 | | | | 1,796,542 | |
2.36% 01/31/19 (d) | | | 200,000 | | | | 199,615 | |
2.37% 02/07/19 (d) | | | 1,000,000 | | | | 997,616 | |
2.39%
01/29/19 - 02/21/19 (d) | | | 3,750,000 | | | | 3,739,125 | |
2.41%
02/28/19 - 03/07/19 (d) | | | 1,750,000 | | | | 1,742,991 | |
2.42% 03/14/19 (d) | | | 1,500,000 | | | | 1,492,875 | |
2.48% 04/18/19 (d) | | | 1,000,000 | | | | 992,822 | |
2.49% 05/02/19 (d) | | | 700,000 | | | | 694,283 | |
2.55% 06/13/19 (d) | | | 500,000 | | | | 494,386 | |
2.57% 07/05/19 (d) | | | 1,000,000 | | | | 987,266 | |
U.S. Treasury Notes
0.88% 04/15/19 | | | 400,000 | | | | 398,214 | |
U.S. Treasury Notes 3 month Treasury Money Market Yield + 0.07% 2.55% 04/30/19(i) | | | 830,000 | | | | 830,350 | |
| | | | | | | | |
| | | | | | | 27,109,038 | |
| | | | | | | | |
|
U.S. Government Agency Obligations - 40.9% | |
Fannie Mae Discount Notes
2.24% 01/02/19 (d) | | | 500,000 | | | | 499,970 | |
2.28% 01/09/19 (d) | | | 300,000 | | | | 299,851 | |
2.43% 02/27/19 (d) | | | 900,000 | | | | 896,604 | |
Federal Farm Credit Banks 1 month USD LIBOR - 0.03% 2.48% 06/24/19(i) | | | 1,250,000 | | | | 1,250,656 | |
Federal Farm Credit Banks
1 month USD LIBOR - 0.09% 2.42% 07/25/19(i) | | | 550,000 | | | | 550,000 | |
Federal Farm Credit Banks 1 month USD LIBOR - 0.10% 2.38% 09/20/19(i) | | | 500,000 | | | | 499,982 | |
Federal Farm Credit Banks
1 month USD LIBOR - 0.11% 2.35% 01/15/19(i) | | | 200,000 | | | | 200,000 | |
Federal Farm Credit Banks 1 month USD LIBOR - 0.14% 2.38% 07/02/19(i) | | | 350,000 | | | | 349,991 | |
Federal Farm Credit Banks
1 month USD LIBOR - 0.15% 2.31% 07/18/19 (i) | | | 250,000 | | | | 249,986 | |
| | | | | | | | |
| | | Principal
Amount ($) | | | Amortized
Cost
$ | |
2.37% 01/29/19 (i) | | | 400,000 | | | | 400,000 | |
Federal Home Loan Bank Discount Notes 2.25% 01/24/11 (d) | | | 750,000 | | | | 748,946 | |
2.26%
01/03/11 - 01/02/19 (d) | | | 1,500,000 | | | | 1,499,876 | |
2.29% 01/11/19 (d) | | | 500,000 | | | | 499,688 | |
2.30%
01/15/19 - 01/17/19 (d) | | | 1,150,000 | | | | 1,148,906 | |
2.34%
02/12/19 - 02/13/19 (d) | | | 950,000 | | | | 947,430 | |
2.35%
02/11/11 - 02/19/19 (d) | | | 950,000 | | | | 947,281 | |
2.39% 01/23/19 (d) | | | 1,000,000 | | | | 998,567 | |
2.41% 02/13/19 (d) | | | 2,500,000 | | | | 2,492,932 | |
2.42% 02/20/19 (d) | | | 1,000,000 | | | | 996,703 | |
2.43% 02/27/19 (d) | | | 1,000,000 | | | | 996,224 | |
2.45%
03/15/19 - 03/20/19 (d) | | | 2,500,000 | | | | 2,487,491 | |
2.47% 03/29/19 (d) | | | 1,500,000 | | | | 1,491,209 | |
Federal Home Loan Banks 1 month USD LIBOR - 0.08% 2.39% 03/20/19(i) | | | 1,500,000 | | | | 1,499,929 | |
Federal Home Loan Banks 1 month USD LIBOR - 0.09% 2.29% 04/05/19 (i) | | | 2,000,000 | | | | 2,000,000 | |
2.42% 06/24/19 (i) | | | 450,000 | | | | 450,000 | |
Federal Home Loan Banks 1 month USD LIBOR - 0.10% 2.41% 03/25/19(i) | | | 450,000 | | | | 450,000 | |
Federal Home Loan Banks
1 month USD LIBOR - 0.13% 2.33% 07/16/19 (i) | | | 650,000 | | | | 650,000 | |
2.38%01/24/19 - 07/26/19 (i) | | | 2,500,000 | | | | 2,500,000 | |
2.39% 03/01/19 (i) | | | 750,000 | | | | 750,000 | |
2.40% 03/01/19 (i) | | | 600,000 | | | | 600,000 | |
Federal Home Loan Banks 1 month USD LIBOR - 0.14% 2.38% 02/01/19 (i) | | | 2,000,000 | | | | 1,999,987 | |
Federal Home Loan Banks 3 month USD LIBOR - 0.32% 2.09% 04/10/19(i) | | | 1,300,000 | | | | 1,300,000 | |
Federal Home Loan Banks 3 month USD LIBOR - 0.33% 2.08% 01/04/19 (i) | | | 1,000,000 | | | | 1,000,000 | |
Federal Home Loan Mortgage Corp. 1 month USD LIBOR - 0.00% 2.53% 09/20/19 (j) | | | 500,000 | | | | 500,000 | |
Federal Home Loan Mortgage Corp. 1 month USD LIBOR - 0.10% 2.36% 03/18/19 (i) | | | 400,000 | | | | 400,000 | |
2.37% 06/19/19 (i) | | | 900,000 | | | | 900,000 | |
See Notes to Schedules of Investments and Notes to Financial Statements.
| | | | |
| Elfun Government Money Market Fund | | | 89 | |
Elfun Government Money Market Fund
Schedule of Investments, continued — December 31, 2018
| | | | | | | | |
| | | Principal
Amount ($) | | | Amortized
Cost
$ | |
| | | | | | | | |
Federal Home Loan Mortgage Corp. 1 month USD LIBOR - 0.15% 2.24% 02/08/19 (i) | | | 500,000 | | | | 500,000 | |
Federal Home Loan Mortgage Corp. 3 month USD LIBOR - 0.33% 2.08% 04/09/19(i) | | | 1,300,000 | | | | 1,300,000 | |
Federal Home Loan Mortgage Corp. 3 month USD LIBOR - 0.34% 2.07% 01/09/19(i) | | | 1,200,000 | | | | 1,200,000 | |
Federal Home Loan Mortgage Corp. SOFR + 0.03% 2.49% 06/19/19(i) | | | 1,000,000 | | | | 1,000,000 | |
Federal National Mortgage Assoc. 1 month USD LIBOR + 0.00% 2.39% 03/08/19(i) | | | 600,000 | | | | 600,082 | |
Federal National Mortgage Assoc. SOFR + 0.04% 2.50% 04/30/19(i) | | | 600,000 | | | | 600,000 | |
Federal National Mortgage Assoc. SOFR + 0.08% 2.54% 01/30/19(i) | | | 1,000,000 | | | | 1,000,000 | |
Freddie Mac Discount Notes 2.44% 03/20/19(d) | | | 1,000,000 | | | | 994,822 | |
| | | | | | | | |
| | | | | | | 42,647,113 | |
| | | | | | | | |
|
Repurchase Agreements - 33.6% | |
BNP Paribas S.A. U.S. Treasury Repo 2.95% dated 12/31/18, to be repurchased at $12,000,983 on 01/02/19 collateralized by $3,669,355 U.S. Treasury Bonds, 4.75% to 8.75%, maturing on 05/15/20 to 02/15/37, collateralized by $8,570,693 U.S. Treasury Notes, 1.50% to 2.88%, maturing from 08/15/20 to 07/31/25. 01/02/19 | | | 12,000,000 | | | | 12,000,000 | |
| | | | | | | | |
| | | Principal
Amount ($) | | | Amortized
Cost
$ | |
Citigroup Global Markets, Inc. U.S. Treasury Repo 2.95% dated 12/31/18, to be repurchased at $9,000,738 on 01/02/19 collateralized by $9,180,053 U.S. Treasury Notes, 0.88% to 1.38%, maturing on 09/15/19 to 09/30/23. 01/02/19 | | | 9,000,000 | | | | 9,000,000 | |
Merrill Lynch, Pierce, Fenner & Smith, Inc. U.S. Treasury Repo 2.95% dated 12/31/18, to be repurchased at $14,058,152 on 01/02/19 collateralized by $14,338,238 U.S. Treasury Bonds, 3.38% to 8.75% maturing from 08/15/20 to 05/15/44. 01/02/19 | | | 14,057,000 | | | | 14,057,000 | |
| | | | | | | | |
| | | | | | | 35,057,000 | |
| | | | | | | | |
| |
Total Short-Term Investments
(Cost $104,813,151) | | | | 104,813,151 | |
| |
| Liabilities in Excess of Other Assets, net - (0.5)% | | | | (538,136 | ) |
| | | | | | | | |
| |
| NET ASSETS - 100.0% | | | | 104,275,015 | |
| | | | | | | | |
The following table presents the Fund’s investments measured at fair value on a recurring basis at December 31, 2018:
| | | | | | | | | | | | | | | | | | |
| Fund | | Investments | | Level 1 | | | Level 2 | | | Level 3 | | | Total | |
| | | | | | | | | | | | | | | | | | |
| | | | | |
| Elfun Government Money Market Fund | | Investments in Securities | | | | | | | | | | | | | | | | |
| | | | | |
| | U.S. Treasuries | | $ | — | | | $ | 27,109,038 | | | $ | — | | | $ | 27,109,038 | |
| | | | | |
| | U.S. Government Agency Obligations | | | — | | | | 42,647,113 | | | | — | | | | 42,647,113 | |
| | | | | |
| | Repurchase Agreements | | | — | | | | 35,057,000 | | | | — | | | | 35,057,000 | |
| | | | | | | | | | | | | | | | | | |
| | | | | |
| | Total Investments in Securities | | $ | — | | | $ | 104,813,151 | | | $ | — | | | $ | 104,813,151 | |
| | | | | | | | | | | | | | | | | | |
See Notes to Schedules of Investments and Notes to Financial Statements.
| | |
| 90 | | Elfun Government Money Market Fund |
Elfun Funds
Notes to Schedules of Investments — December 31, 2018
The views expressed in this document reflect our judgment as of the publication date and are subject to change at any time without notice. The securities cited may not be representative of the Funds’ future investments and should not be construed as a recommendation to purchase or sell a particular security. See each Fund’s summary prospectus and the Funds’ statutory prospectus for complete descriptions of investment objectives, policies, risks and permissible investments.
| (a) | Non-income producing security. |
| (b) | Pursuant to Rule 144A of the Securities Act of 1933, as amended, these securities may be resold in transactions exempt from registration, normally to qualified institutional buyers. At December 31, 2018, these securities amounted to $4,291,178 or 2.36% and $18,414,134 or 8.02% of the net assets of the Elfun Diversified Fund and Elfun Income Fund, respectively. These securities have been determined to be liquid using procedures established by each Fund’s Board of Trustees. |
| (c) | Settlement is on a delayed delivery or when-issued basis with final maturity to be announced (“TBA”) in the future. |
| (d) | Coupon amount represents effective yield. |
| (e) | State Street Corporation is the parent company of State Street Bank & Trust Co., the Funds’sub-administrator, custodian and accounting agent. |
| (f) | Principal only security. These securities represent the right to receive the monthly principal payments on an underlying pool of mortgages. No payments of interest on the pool are passed through to the “principal only” holder. |
| (g) | Interest only security. These securities represent the right to receive the monthly interest payments on an underlying pool of mortgages. Payments of principal on the pool reduce the value of the “interest only” holding. |
| (h) | At December 31, 2018, all or a portion of this security was pledged to cover collateral requirements for futures, options, swaps and/or TBAs. |
| (i) | Variable Rate Security - Interest rate shown is rate in effect at December 31, 2018. For securities based on a published reference rate and spread, the reference rate and spread are indicated in the description above. |
| (k) | Escrowed to maturity Bonds are collateralized by U.S. Treasury securities which are held in escrow by a trustee and are used to pay principal and interest on such bonds. |
| (l) | Pre-refunded bonds are collateralized by U.S. Treasury securities, which are held in escrow by a trustee and are used to pay principal and interest on thetax-exempt issue to retire the bonds at the earliest refunding date. |
| (m) | The security is insured by AGC, AGMC, AMBAC, FGIC or NPFG. The ElfunTax-Exempt Income Fund had no insurance concentrations of 5% or greater as of December 31, 2018 (as a percentage of net assets). |
| (n) | Sponsored by SSGA Funds Management, Inc., the Funds’ investment advisor and administrator, and an affiliate of State Street Bank & Trust Co., the Funds’sub-administrator, custodian and accounting agent. |
| † | Percentages are based on net assets as of December 31, 2018. |
Abbreviations:
ADR - American Depositary Receipt
AGC - Assured Guaranty Corporation
AGMC - Assured Guaranty Municipal Company
AMBAC - AMBAC Indemnity Corporation
FGIC - Financial Guaranty Insurance Corporation
LIBOR - London Interbank Offered Rate
NPFG - National Public Finance Guaranty Corporation
REIT - Real Estate Investment Trust
REMIC - Real Estate Mortgage Investment Conduit
SOFR - Secured Overnight Financing Rate
SPDR - Standard and Poor’s Depositary Receipt
STRIPS - Separate Trading of Registered Interest and Principal of Security
TBA - To Be Announced
| | | | |
| Notes to Schedules of Investments | | | 91 | |
Elfun International Equity Fund
Financial Highlights
Selected data based on a share outstanding throughout the fiscal years indicated
| | | | | | | | | | | | | | | | | | | | |
| | | 12/31/18 | | | 12/31/17 | | | 12/31/16 | | | 12/31/15* | | | 12/31/14* | |
| Inception date | | | | | | | 1/1/88 | |
| | | | | |
Net asset value, beginning of period | | $ | 22.68 | | | $ | 18.73 | | | $ | 19.31 | | | $ | 19.70 | | | $ | 21.93 | |
| | | | | | | | | | | | | | | | | | | | |
|
Income/(loss) from investment operations: | |
Net investment income | | | 0.45 | (a) | | | 0.34 | (a) | | | 0.41 | | | | 0.34 | | | | 0.58 | |
Net realized and unrealized gains/(losses) on investments | | | (4.16 | ) | | | 3.96 | | | | (0.58 | ) | | | (0.37 | ) | | | (2.24 | ) |
| | | | | | | | | | | | | | | | | | | | |
Total income/(loss) from investment operations | | | (3.71 | ) | | | 4.30 | | | | (0.17 | ) | | | (0.03 | ) | | | (1.66 | ) |
| | | | | | | | | | | | | | | | | | | | |
|
Less distributions from: | |
Net investment income | | | 0.46 | | | | 0.35 | | | | 0.41 | | | | 0.36 | | | | 0.57 | |
| | | | | | | | | | | | | | | | | | | | |
Total distributions | | | 0.46 | | | | 0.35 | | | | 0.41 | | | | 0.36 | | | | 0.57 | |
| | | | | | | | | | | | | | | | | | | | |
Net asset value, end of period | | $ | 18.51 | | | $ | 22.68 | | | $ | 18.73 | | | $ | 19.31 | | | $ | 19.70 | |
| | | | | | | | | | | | | | | | | | | | |
Total Return(b) | | | (16.33 | )% | | | 22.99 | % | | | (0.86 | )% | | | (0.18 | )% | | | (7.62 | )% |
|
Ratios/Supplemental Data: | |
Net assets, end of period (in thousands) | | $ | 183,982 | | | $ | 237,769 | | | $ | 208,044 | | | $ | 234,448 | | | $ | 254,310 | |
|
Ratios to average net assets: | |
Net expenses | | | 0.36 | % | | | 0.36 | % | | | 0.37 | %(c)(e) | | | 0.35 | % | | | 0.33 | %(c)(d) |
Gross expenses | | | 0.36 | % | | | 0.36 | % | | | 0.43 | %(c)(e) | | | 0.35 | % | | | 0.33 | % |
Net investment income | | | 2.06 | % | | | 1.64 | % | | | 2.11 | % | | | 1.59 | % | | | 2.54 | % |
Portfolio turnover rate | | | 27 | % | | | 30 | % | | | 33 | % | | | 24 | % | | | 36 | % |
Notes to Financial Highlights
| (a) | | Per share values have been calculated using the average shares method. |
| (b) | | Total returns are historical and assume changes in share price, reinvestment of dividends and capital gains distributions and assume no sales charge. Past performance does not guarantee future results. |
| (c) | | Reflects a voluntary reimbursement of other operating expenses by GE Asset Management, Inc., the Fund’s investment adviser and administrator prior to July 1, 2016. |
| (d) | | Includes contractual management fee waiver related to the Fund’s investments in the GE Institutional Money Market Fund (the “Money Market Fund”). The fee waiver agreement was terminated effective June 30, 2014 with the closure of the Money Market Fund. |
| (e) | | The net and gross expense ratios include the refunded custody expense. Without the effect of the refunded custody expense, the net and gross ratio would have been 0.40% and 0.47%, respectively. |
| * | | Beginning with the year ended December 31, 2016, the Funds were audited by Ernst & Young LLP. The previous years were audited by another independent registered public accounting firm. |
The accompanying Notes are an integral part of these financial statements.
Elfun Trusts
Financial Highlights
Selected data based on a share outstanding throughout the fiscal years indicated
| | | | | | | | | | | | | | | | | | | | |
| | | 12/31/18 | | | 12/31/17 | | | 12/31/16 | | | 12/31/15* | | | 12/31/14* | |
| Inception date | | | | | | | 5/27/35 | |
| | | | | |
Net asset value, beginning of period | | $ | 60.36 | | | $ | 53.23 | | | $ | 54.59 | | | $ | 58.02 | | | $ | 56.07 | |
| | | | | | | | | | | | | | | | | | | | |
|
Income/(loss) from investment operations: | |
Net investment income | | | 0.74 | (a) | | | 0.76 | (a) | | | 0.81 | | | | 0.80 | | | | 0.75 | |
Net realized and unrealized gains/(losses) on investments | | | (2.85 | ) | | | 12.88 | | | | 2.54 | | | | 0.25 | | | | 6.67 | |
| | | | | | | | | | | | | | | | | | | | |
Total income/(loss) from investment operations | | | (2.11 | ) | | | 13.65 | | | | 3.35 | | | | 1.05 | | | | 7.42 | |
| | | | | | | | | | | | | | | | | | | | |
|
Less distributions from: | |
Net investment income | | | 0.76 | | | | 0.78 | | | | 0.79 | | | | 0.80 | | | | 0.75 | |
Net realized gains | | | 7.35 | | | | 5.74 | | | | 3.92 | | | | 3.68 | | | | 4.72 | |
| | | | | | | | | | | | | | | | | | | | |
Total distributions | | | 8.11 | | | | 6.52 | | | | 4.71 | | | | 4.48 | | | | 5.47 | |
| | | | | | | | | | | | | | | | | | | | |
Net asset value, end of period | | $ | 50.14 | | | $ | 60.36 | | | $ | 53.23 | | | $ | 54.59 | | | $ | 58.02 | |
| | | | | | | | | | | | | | | | | | | | |
Total Return(b) | | | (3.39 | )% | | | 25.61 | % | | | 6.08 | % | | | 1.70 | % | | | 13.13 | % |
| | | | | |
Ratios/Supplemental Data: | | | | | | | | | | | | | | | | | | | | |
Net assets, end of period (in thousands) | | $ | 2,427,667 | | | $ | 2,737,919 | | | $ | 2,331,966 | | | $ | 2,364,319 | | | $ | 2,476,637 | |
| | | | | |
Ratios to average net assets: | | | | | | | | | | | | | | | | | | | | |
Net expenses | | | 0.19 | % | | | 0.18 | % | | | 0.18 | % | | | 0.16 | % | | | 0.18 | %(c) |
Gross expenses | | | 0.19 | % | | | 0.18 | % | | | 0.18 | % | | | 0.16 | % | | | 0.18 | % |
Net investment income | | | 1.17 | % | | | 1.25 | % | | | 1.43 | % | | | 1.32 | % | | | 1.26 | % |
Portfolio turnover rate | | | 18 | % | | | 16 | % | | | 15 | % | | | 11 | % | | | 13 | % |
Notes to Financial Highlights
| (a) | | Per share values have been calculated using the average shares method. |
| (b) | | Total returns are historical and assume changes in share price, reinvestment of dividends and capital gains distributions and do not include the effect of insurance contract charges. Past performance does not guarantee future results. |
| (c) | | Includes contractual management fee waiver related to the Fund’s investments in the GE Institutional Money Market Fund (the “Money Market Fund”). The fee waiver agreement was terminated effective June 30, 2014 with the closure of the Money Market Fund. |
| * | | Beginning with the year ended December 31, 2016, the Funds were audited by Ernst & Young LLP. The previous years were audited by another independent registered public accounting firm. |
The accompanying Notes are an integral part of these financial statements.
Elfun Diversified Fund
Financial Highlights
Selected data based on a share outstanding throughout the fiscal years indicated
| | | | | | | | | | | | | | | | | | | | |
| | | 12/31/18 | | | 12/31/17 | | | 12/31/16 | | | 12/31/15* | | | 12/31/14* | |
| Inception date | | | | | | | 1/1/88 | |
| | | | | |
Net asset value, beginning of period | | $ | 18.60 | | | $ | 17.91 | | | $ | 17.50 | | | $ | 18.78 | | | $ | 19.84 | |
| | | | | | | | | | | | | | | | | | | | |
|
Income/(loss) from investment operations: | |
Net investment income | | | 0.42 | (a) | | | 0.43 | (a) | | | 0.38 | | | | 0.34 | | | | 0.37 | |
Net realized and unrealized gains/(losses) on investments | | | (1.45 | ) | | | 2.32 | | | | 0.58 | | | | (0.57 | ) | | | 0.62 | |
| | | | | | | | | | | | | | | | | | | | |
Total income/(loss) from investment operations | | | (1.03 | ) | | | 2.75 | | | | 0.96 | | | | (0.23 | ) | | | 0.99 | |
| | | | | | | | | | | | | | | | | | | | |
|
Less distributions from: | |
Net investment income | | | 0.43 | | | | 0.46 | | | | 0.36 | | | | 0.34 | | | | 0.37 | |
Net realized gains | | | 0.12 | | | | 1.60 | | | | 0.19 | | | | 0.71 | | | | 1.65 | |
Return of capital | | | — | | | | — | | | | — | | | | — | | | | 0.03 | |
| | | | | | | | | | | | | | | | | | | | |
Total distributions | | | 0.55 | | | | 2.06 | | | | 0.55 | | | | 1.05 | | | | 2.05 | |
| | | | | | | | | | | | | | | | | | | | |
Net asset value, end of period | | $ | 17.02 | | | $ | 18.60 | | | $ | 17.91 | | | $ | 17.50 | | | $ | 18.78 | |
| | | | | | | | | | | | | | | | | | | | |
Total Return(b) | | | (5.51 | )% | | | 15.40 | % | | | 5.48 | % | | | (1.25 | )% | | | 4.95 | % |
| | | | | |
Ratios/Supplemental Data: | | | | | | | | | | | | | | | | | | | | |
Net assets, end of period (in thousands) | | $ | 181,943 | | | $ | 209,939 | | | $ | 198,938 | | | $ | 209,688 | | | $ | 230,123 | |
| | | | | |
Ratios to average net assets: | | | | | | | | | | | | | | | | | | | | |
Net expenses | | | 0.33 | % | | | 0.40 | % | | | 0.39 | %(b)(c) | | | 0.37 | % | | | 0.39 | %(c)(d) |
Gross expenses | | | 0.33 | % | | | 0.40 | % | | | 0.39 | %(c) | | | 0.37 | % | | | 0.39 | % |
Net investment income | | | 2.26 | % | | | 2.23 | % | | | 1.98 | % | | | 1.69 | % | | | 1.79 | % |
Portfolio turnover rate | | | 72 | % | | | 186 | % | | | 116 | % | | | 123 | % | | | 176 | % |
Notes to Financial Highlights
| (a) | | Per share values have been calculated using the average shares method. |
| (b) | | Total returns are historical and assume changes in share price, reinvestment of dividends and capital gains distributions and assume no sales charge. Past performance does not guarantee future results. |
| (c) | | The net and gross expense ratios include the refunded custody expense. Without the effect of the refunded custody expense, the ratios would have been 0.45%. |
| (d) | | Includes contractual management fee waiver related to the Fund’s investments in the GE Institutional Money Market Fund (the “Money Market Fund”). The fee waiver agreement was terminated effective June 30, 2014 with the closure of the Money Market Fund. |
| * | | Beginning with the year ended December 31, 2016, the Fund was audited by Ernst & Young LLP. The previous years were audited by another independent registered public accounting firm. |
The accompanying Notes are an integral part of these financial statements.
ElfunTax-Exempt Income Fund
Financial Highlights
Selected data based on a share outstanding throughout the fiscal years indicated
| | | | | | | | | | | | | | | | | | | | |
| | | 12/31/18 | | | 12/31/17 | | | 12/31/16 | | | 12/31/15* | | | 12/31/14* | |
| Inception date | | | | | | | 1/1/80 | |
| | | | | |
Net asset value, beginning of period | | $ | 11.55 | | | $ | 11.48 | | | $ | 11.88 | | | $ | 11.97 | | | $ | 11.34 | |
| | | | | | | | | | | | | | | | | | | | |
|
Income/(loss) from investment operations: | |
Net investment income | | | 0.46 | (a) | | | 0.46 | (a) | | | 0.46 | | | | 0.46 | | | | 0.47 | |
Net realized and unrealized gains/(losses) on investments | | | (0.36 | ) | | | 0.07 | | | | (0.40 | ) | | | (0.09 | ) | | | 0.63 | |
| | | | | | | | | | | | | | | | | | | | |
Total income from investment operations | | | 0.10 | | | | 0.53 | | | | 0.06 | | | | 0.37 | | | | 1.10 | |
| | | | | | | | | | | | | | | | | | | | |
|
Less distributions from: | |
Net investment income | | | 0.46 | | | | 0.46 | | | | 0.46 | | | | 0.46 | | | | 0.47 | |
| | | | | | | | | | | | | | | | | | | | |
Total distributions | | | 0.46 | | | | 0.46 | | | | 0.46 | | | | 0.46 | | | | 0.47 | |
| | | | | | | | | | | | | | | | | | | | |
Net asset value, end of period | | $ | 11.19 | | | $ | 11.55 | | | $ | 11.48 | | | $ | 11.88 | | | $ | 11.97 | |
| | | | | | | | | | | | | | | | | | | | |
Total Return(b) | | | 0.90 | % | | | 4.71 | % | | | 0.42 | % | | | 3.21 | % | | | 9.85 | % |
|
Ratios/Supplemental Data: | |
Net assets, end of period (in thousands) | | $ | 1,376,980 | | | $ | 1,471,350 | | | $ | 1,495,248 | | | $ | 1,588,272 | | | $ | 1,624,266 | |
|
Ratios to average net assets: | |
Net expenses | | | 0.21 | % | | | 0.20 | % | | | 0.20 | % | | | 0.18 | % | | | 0.21 | % |
Gross expenses | | | 0.21 | % | | | 0.20 | % | | | 0.20 | % | | | 0.18 | % | | | 0.21 | % |
Net investment income | | | 4.06 | % | | | 4.00 | % | | | 3.84 | % | | | 3.92 | % | | | 4.01 | % |
Portfolio turnover rate | | | 18 | % | | | 26 | % | | | 31 | % | | | 22 | % | | | 34 | % |
Notes to Financial Highlights
| (a) | | Per share values have been calculated using the average shares method. |
| (b) | | Total returns are historical and assume changes in share price, reinvestment of dividends and capital gains distributions and assume no sales charge. Past performance does not guarantee future results. |
| * | | Beginning with the year ended December 31, 2016, the Funds were audited by Ernst & Young LLP. The previous years were audited by another independent registered public accounting firm. |
The accompanying Notes are an integral part of these financial statements.
Elfun Income Fund
Financial Highlights
Selected data based on a share outstanding throughout the fiscal years indicated
| | | | | | | | | | | | | | | | | | | | |
| | | 12/31/18 | | | 12/31/17 | | | 12/31/16 | | | 12/31/15* | | | 12/31/14* | |
| Inception date | | | | | | | 12/31/84 | |
| | | | | |
Net asset value, beginning of period | | $ | 11.44 | | | $ | 11.28 | | | $ | 11.26 | | | $ | 11.57 | | | $ | 11.22 | |
| | | | | | | | | | | | | | | | | | | | |
|
Income/(loss) from investment operations: | |
Net investment income | | | 0.32 | (a) | | | 0.29 | (a) | | | 0.30 | | | | 0.32 | | | | 0.29 | |
Net realized and unrealized gains/(losses) on investments | | | (0.41 | ) | | | 0.15 | | | | 0.09 | | | | (0.29 | ) | | | 0.35 | |
| | | | | | | | | | | | | | | | | | | | |
Total income/(loss) from investment operations | | | (0.09 | ) | | | 0.44 | | | | 0.39 | | | | 0.03 | | | | 0.64 | |
| | | | | | | | | | | | | | | | | | | | |
|
Less distributions from: | |
Net investment income | | | 0.33 | | | | 0.28 | | | | 0.28 | | | | 0.32 | | | | 0.29 | |
Net realized gains | | | — | | | | — | | | | 0.09 | | | | 0.02 | | | | 0.00 | (b) |
| | | | | | | | | | | | | | | | | | | | |
Total distributions | | | 0.33 | | | | 0.28 | | | | 0.37 | | | | 0.34 | | | | 0.29 | |
| | | | | | | | | | | | | | | | | | | | |
Net asset value, end of period | | $ | 11.02 | | | $ | 11.44 | | | $ | 11.28 | | | $ | 11.26 | | | $ | 11.57 | |
| | | | | | | | | | | | | | | | | | | | |
Total Return(c) | | | (0.80 | )% | | | 3.90 | % | | | 3.52 | % | | | 0.22 | % | | | 5.75 | % |
|
Ratios/Supplemental Data: | |
Net assets, end of period (in thousands) | | $ | 229,477 | | | $ | 261,189 | | | $ | 276,142 | | | $ | 289,872 | | | $ | 312,756 | |
|
Ratios to average net assets: | |
Net expenses | | | 0.34 | % | | | 0.33 | % | | | 0.31 | % | | | 0.28 | % | | | 0.29 | %(d) |
Gross expenses | | | 0.34 | % | | | 0.33 | % | | | 0.31 | % | | | 0.28 | % | | | 0.29 | % |
Net investment income | | | 2.88 | % | | | 2.54 | % | | | 2.63 | % | | | 2.71 | % | | | 2.50 | % |
Portfolio turnover rate | | | 207 | % | | | 299 | % | | | 238 | % | | | 278 | % | | | 326 | % |
Notes to Financial Highlights
| (a) | | Per share values have been calculated using the average shares method. |
| (b) | | Rounds to less than $0.005. |
| (c) | | Total returns are historical and assume changes in share price, reinvestment of dividends and capital gains distributions and do not include the effect of insurance contract charges. Past performance does not guarantee future results. |
| (d) | | Includes contractual management fee waiver related to the Fund’s investments in the GE Institutional Money Market Fund (the “Money Market Fund”). The fee waiver agreement was terminated effective June 30, 2014 with the closure of the Money Market Fund. |
| * | | Beginning with the year ended December 31, 2016, the Funds were audited by Ernst & Young LLP. The previous years were audited by another independent registered public accounting firm. |
The accompanying Notes are an integral part of these financial statements.
Elfun Government Money Market Fund
Financial Highlights
Selected data based on a share outstanding throughout the fiscal years indicated
| | | | | | | | | | | | | | | | | | | | |
| | | 12/31/18 | | | 12/31/17 | | | 12/31/16 | | | 12/31/15* | | | 12/31/14* | |
| Inception date | | | | | | | | | | | | | | | | | | | 6/13/90 | |
| | | | | |
Net asset value, beginning of period | | $ | 1.00 | | | $ | 1.00 | | | $ | 1.00 | | | $ | 1.00 | | | $ | 1.00 | |
| | | | | | | | | | | | | | | | | | | | |
|
Income/(loss) from investment operations: | |
Net investment income | | | 0.02 | (a) | | | 0.01 | (a) | | | 0.00 | (b) | | | — | | | | — | |
| | | | | | | | | | | | | | | | | | | | |
Total income from investment operations | | | 0.02 | | | | 0.01 | | | | 0.00 | (b) | | | — | | | | — | |
| | | | | | | | | | | | | | | | | | | | |
|
Less distributions from: | |
Net investment income | | | 0.02 | | | | 0.01 | | | | 0.00 | (b) | | | 0.00 | (b) | | | 0.00 | (b) |
Net realized gains | | | — | | | | 0.00 | (b) | | | — | | | | — | | | | — | |
| | | | | | | | | | | | | | | | | | | | |
Total distributions | | | 0.02 | | | | 0.01 | | | | 0.00 | (b) | | | 0.00 | (b) | | | 0.00 | (b) |
| | | | | | | | | | | | | | | | | | | | |
Net asset value, end of period | | $ | 1.00 | | | $ | 1.00 | | | $ | 1.00 | | | $ | 1.00 | | | $ | 1.00 | |
| | | | | | | | | | | | | | | | | | | | |
Total Return(c) | | | 1.55 | % | | | 0.58 | % | | | 0.06 | % | | | 0.08 | % | | | 0.05 | % |
|
Ratios/Supplemental Data: | |
Net assets, end of period (in thousands) | | $ | 104,275 | | | $ | 109,828 | | | $ | 111,339 | | | $ | 129,039 | | | $ | 139,218 | |
|
Ratios to average net assets: | |
Net expenses | | | 0.32 | % | | | 0.34 | % | | | 0.49 | %(e) | | | 0.09 | %(d) | | | 0.05 | %(d) |
Gross expenses | | | 0.32 | % | | | 0.34 | % | | | 0.49 | %(e) | | | 0.25 | % | | | 0.36 | % |
Net investment income (loss) | | | 1.53 | % | | | 0.56 | % | | | (0.11 | )%(e) | | | — | % | | | — | % |
Notes to Financial Highlights
| (a) | | Per share values have been calculated using the average shares method. |
| (b) | | Rounds to less than $0.005. |
| (c) | | Total returns are historical and assume changes in share price, reinvestment of dividends and capital gains distributions and assume no sales charge. Past performance does not guarantee future results. |
| (d) | | Reflects a voluntary waiver of management fees and/or subsidy of certain expenses by GEAM, the adviser and administrator of the Fund prior to July 1, 2016. |
| (e) | | Ratio includes income tax expense. Without this expense, the net and gross expense ratios would have been 0.33% and the net investment income ratio would have been 0.05%. |
| * | | Beginning with the year ended December 31, 2016, the Fund was audited by Ernst & Young LLP. The previous years were audited by another independent registered public accounting firm. |
The accompanying Notes are an integral part of these financial statements.
Elfun Funds
Statements of Assets and Liabilities — December 31, 2018
| | | | | | | | |
| | |
Elfun
International
Equity Fund | | | Elfun
Trusts | |
| | | | | | | | |
Assets | | | | | | | | |
Investments in securities, at fair value (cost $173,067,843; $1,595,066,765; $122,616,787; $1,329,038,434; $225,163,099 and $0, respectively) | | $ | 178,104,321 | | | $ | 2,364,623,150 | |
Investments in affiliated securities, at fair value (cost $0; $0; $51,158,247; $0; $0 and $0, respectively) | | | — | | | | — | |
Short-term investments, at fair value (cost $0; $0; $2,675,511; $0 ; $0 and $69,756,151, respectively) | | | — | | | | — | |
Short-term affiliated investments, at cost and fair value | | | 6,135,132 | | | | 60,719,231 | |
Repurchase agreements | | | — | | | | — | |
Cash | | | 3,408 | | | | — | |
Cash collateral on deposit with broker for swap contracts | | | — | | | | — | |
Receivable for investments sold | | | 65 | | | | — | |
Income receivables | | | 530,873 | | | | 4,345,300 | |
Receivable for fund shares sold | | | 4,315 | | | | 218,022 | |
Income receivable from affiliated investments | | | 12,409 | | | | 221,062 | |
Receivable for accumulated variation margin on futures contracts | | | — | | | | — | |
Receivable for accumulated variation margin on swap contracts | | | — | | | | — | |
| | | | | | | | |
| | |
Total assets | | | 184,790,523 | | | | 2,430,126,765 | |
| | | | | | | | |
| | |
Liabilities | | | | | | | | |
Distribution payable to shareholders | | | — | | | | — | |
Due to custodian | | | — | | | | — | |
Net cash collateral on futures contracts due to broker | | | — | | | | — | |
Payable for investments purchased | | | — | | | | — | |
Payable for fund shares redeemed | | | 680,656 | | | | 1,937,343 | |
Payable for accumulated variation margin on swap contracts | | | — | | | | — | |
Payable to the Adviser | | | 33,719 | | | | 303,397 | |
Payable for custody, fund accounting andsub-administration fees | | | 9,960 | | | | 1,208 | |
Accrued other expenses | | | 60,178 | | | | 217,334 | |
Accrued foreign capital gains tax | | | 24,041 | | | | — | |
| | | | | | | | |
| | |
Total liabilities | | | 808,554 | | | | 2,459,282 | |
| | | | | | | | |
| | | | | | | | |
| | |
Net Assets | | $ | 183,981,969 | | | $ | 2,427,667,483 | |
| | | | | | | | |
| | |
Net Assets Consist of: | | | | | | | | |
Capital paid in | | $ | 186,805,975 | | | $ | 1,657,387,715 | |
Total distributable earnings (loss) | | $ | (2,824,006 | ) | | $ | 770,279,768 | |
| | | | | | | | |
| | |
Net Assets | | $ | 183,981,969 | | | $ | 2,427,667,483 | |
| | | | | | | | |
| | | | | | | | |
Shares outstanding (Par value $10; $10; $10; $10; $10; and $1, respectively; unlimited shares authorized) | | | 9,938,679 | | | | 48,418,772 | |
Net asset value, offering and redemption price per share | | $ | 18.51 | | | $ | 50.14 | |
The accompanying Notes are an integral part of these financial statements.
| | |
| 98 | | Statements of Assets and Liabilities |
| | | | | | | | | | | | | | |
Elfun
Diversified
Fund | | | Elfun
Tax-Exempt
Income Fund | | | Elfun
Income Fund | | | Elfun
Government
Money
Market Fund | |
| | | | | | | | | | | | | | |
| | | | | | | | | | | | | | |
$ | 126,955,056 | | | $ | 1,351,099,395 | | | $ | 223,451,788 | | | $ | — | |
| | 48,022,027 | | | | — | | | | — | | | | — | |
| | 2,675,519 | | | | — | | | | — | | | | 69,756,151 | |
| | 14,521,162 | | | | 12,476,076 | | | | 41,181,071 | | | | — | |
| | — | | | | — | | | | — | | | | 35,057,000 | |
| | — | | | | — | | | | — | | | | 72 | |
| | 54,338 | | | | — | | | | 208,525 | | | | — | |
| | 2,582,472 | | | | — | | | | 18,197,063 | | | | — | |
| | 522,994 | | | | 18,323,271 | | | | 1,515,302 | | | | — | |
| | 917 | | | | 189,898 | | | | 67,805 | | | | 688,267 | |
| | 29,897 | | | | 13,063 | | | | 74,770 | | | | 56,769 | |
| | 183,601 | | | | — | | | | 623,416 | | | | — | |
| | 15,886 | | | | — | | | | 85,811 | | | | — | |
| | | | | | | | | | | | | | |
| | | |
| | 195,563,869 | | | | 1,382,101,703 | | | | 285,405,551 | | | | 105,558,259 | |
| | | | | | | | | | | | | | |
| | | |
| | | | | | | | | | | | | | |
| | — | | | | 1,437,618 | | | | 145,579 | | | | 12,531 | |
| | 26,339 | | | | — | | | | 21,952 | | | | — | |
| | 157,782 | | | | — | | | | 810,211 | | | | — | |
| | 13,111,935 | | | | — | | | | 54,350,813 | | | | 987,266 | |
| | 101,428 | | | | 3,354,610 | | | | 62,367 | | | | 192,118 | |
| | 73,424 | | | | — | | | | 313,874 | | | | — | |
| | 26,782 | | | | 186,965 | | | | 32,995 | | | | 8,238 | |
| | 43,815 | | | | 4,038 | | | | 112,498 | | | | 16,790 | |
| | 79,141 | | | | 138,432 | | | | 78,242 | | | | 66,301 | |
| | — | | | | — | | | | — | | | | — | |
| | | | | | | | | | | | | | |
| | | |
| | 13,620,646 | | | | 5,121,663 | | | | 55,928,531 | | | | 1,283,244 | |
| | | | | | | | | | | | | | |
| | | | | | | | | | | | | | |
| | | |
| $ | 181,943,223 | | | $ | 1,376,980,040 | | | $ | 229,477,020 | | | $ | 104,275,015 | |
| | | | | | | | | | | | | | |
| | | |
| | | | | | | | | | | | | | |
| $ | 180,732,135 | | | $ | 1,373,430,438 | | | $ | 237,706,730 | | | $ | 104,275,018 | |
| $ | 1,211,088 | | | $ | 3,549,602 | | | $ | (8,229,710 | ) | | $ | (3 | ) |
| | | | | | | | | | | | | | |
| | | |
| $ | 181,943,223 | | | $ | 1,376,980,040 | | | $ | 229,477,020 | | | $ | 104,275,015 | |
| | | | | | | | | | | | | | |
| | | | | | | | | | | | | | |
| | 10,693,058 | | | | 123,016,883 | | | | 20,816,924 | | | | 104,275,018 | |
| $ | 17.02 | | | $ | 11.19 | | | $ | 11.02 | | | $ | 1.00 | |
The accompanying Notes are an integral part of these financial statements.
| | | | |
| Statements of Assets and Liabilities | | | 99 | |
Elfun Funds
Statements of Operations — For the year ended December 31, 2018
| | | | | | | | |
| | |
Elfun
International
Equity Fund | | | Elfun
Trusts | |
| | | | | | | | |
Investment Income | |
Income | |
Dividend | | $ | 5,895,653 | | | $ | 36,024,630 | |
Interest | | | 12 | | | | — | |
Income from affiliated investments | | | 126,163 | | | | 1,888,083 | |
Less: Foreign taxes withheld | | | (608,986 | ) | | | — | |
| | | | | | | | |
Total income | | | 5,412,842 | | | | 37,912,713 | |
| | | | | | | | |
|
Expenses | |
Advisory and administration fees | | | 469,385 | | | | 3,909,006 | |
Blue Sky fees | | | 26,916 | | | | 30,501 | |
Transfer agent fees | | | 123,201 | | | | 503,355 | |
Trustees’ fees | | | 16,335 | | | | 52,853 | |
Custody, fund accounting andsub-administration fees | | | 90,629 | | | | 434,441 | |
Professional fees | | | 43,342 | | | | 47,321 | |
Other expenses | | | 34,082 | | | | 232,711 | |
| | | | | | | | |
Total expenses | | | 803,890 | | | | 5,210,188 | |
| | | | | | | | |
Net investment income | | $ | 4,608,952 | | | $ | 32,702,525 | |
| | | | | | | | |
|
Net Realized and Unrealized Gain (Loss) on Investments | |
Realized gain (loss) on: | |
Unaffiliated investments | | $ | 2,976,771 | | | $ | 313,947,889 | |
Affiliated investments | | | — | | | | — | |
Futures | | | 143,362 | | | | — | |
Written options | | | — | | | | — | |
Swap contracts | | | — | | | | — | |
Foreign currency transactions | | | (125,438 | ) | | | — | |
Increase (decrease) in unrealized appreciation/depreciation on: | |
Unaffiliated investments | | | (44,624,409 | ) | | | (427,642,446 | ) |
Affiliated investments | | | — | | | | — | |
Futures | | | (28,153 | ) | | | — | |
Swap contracts | | | — | | | | — | |
Foreign currency translations | | | (8,386 | ) | | | — | |
| | | | | | | | |
| | |
Net realized and unrealized gain (loss) on investments | | | (41,666,253 | ) | | | (113,694,557 | ) |
| | | | | | | | |
| | |
Net Increase (Decrease) in Net Assets Resulting from Operations | | $ | (37,057,301 | ) | | $ | (80,992,032 | ) |
| | | | | | | | |
The accompanying Notes are an integral part of these financial statements.
| | |
| 100 | | Statements of Operations |
| | | | | | | | | | | | | | |
Elfun
Diversified
Fund | | | Elfun
Tax-Exempt
Income Fund | | | Elfun
Income Fund | | | Elfun
Government
Money
Market Fund | |
| | | | | | | | | | | | | | |
| | | | | | | | | | | | | | |
| | | | | | | | | | | | | | |
| $ | 1,522,516 | | | $ | — | | | $ | 10,081 | | | $ | — | |
| | 1,877,245 | | | | 60,170,963 | | | | 7,472,910 | | | | 1,884,946 | |
| | 1,827,215 | | | | 216,085 | | | | 280,917 | | | | — | |
| | (158 | ) | | | — | | | | — | | | | — | |
| | | | | | | | | | | | | | |
| | 5,226,818 | | | | 60,387,048 | | | | 7,763,908 | | | | 1,884,946 | |
| | | | | | | | | | | | | | |
| | | |
| | | | | | | | | | | | | | |
| | 343,427 | | | | 2,261,281 | | | | 408,992 | | | | 101,912 | |
| | 28,326 | | | | 27,866 | | | | 28,614 | | | | 25,216 | |
| | 100,744 | | | | 219,883 | | | | 118,933 | | | | 73,481 | |
| | 15,952 | | | | 33,781 | | | | 16,564 | | | | 14,469 | |
| | 58,981 | | | | 231,775 | | | | 168,438 | | | | 60,664 | |
| | 56,873 | | | | 42,278 | | | | 49,185 | | | | 38,117 | |
| | 64,727 | | | | 122,623 | | | | 34,046 | | | | 14,115 | |
| | | | | | | | | | | | | | |
| | 669,030 | | | | 2,939,487 | | | | 824,772 | | | | 327,974 | |
| | | | | | | | | | | | | | |
| $ | 4,557,788 | | | $ | 57,447,561 | | | $ | 6,939,136 | | | $ | 1,556,972 | |
| | | | | | | | | | | | | | |
| | | |
| | | | | | | | | | | | | | |
| | | | | | | | | | | | | | |
| $ | 1,235,746 | | | $ | (2,154,716 | ) | | $ | (5,183,282 | ) | | $ | (3 | ) |
| | 43,432 | | | | — | | | | — | | | | — | |
| | (274,288 | ) | | | — | | | | (711,298 | ) | | | — | |
| | 35,977 | | | | — | | | | 141,747 | | | | — | |
| | 72,317 | | | | — | | | | 326,160 | | | | — | |
| | (387 | ) | | | — | | | | — | | | | — | |
| | | | | | | | | | | | | | |
| | (6,966,542 | ) | | | (43,488,260 | ) | | | (4,037,541 | ) | | | — | |
| | (9,585,934 | ) | | | — | | | | — | | | | — | |
| | 168,762 | | | | — | | | | 569,712 | | | | — | |
| | (78,188 | ) | | | — | | | | (289,623 | ) | | | — | |
| | (86 | ) | | | — | | | | — | | | | — | |
| | | | | | | | | | | | | | |
| | | |
| | (15,349,191 | ) | | | (45,642,976 | ) | | | (9,184,125 | ) | | | (3 | ) |
| | | | | | | | | | | | | | |
| | | |
| $ | (10,791,403 | ) | | $ | 11,804,585 | | | $ | (2,244,989 | ) | | $ | 1,556,969 | |
| | | | | | | | | | | | | | |
The accompanying Notes are an integral part of these financial statements.
| | | | |
| Statements of Operations | | | 101 | |
Elfun Funds
Statements of Changes in Net Assets
| | | | | | | | | | | | | | | | |
| | | Elfun International Equity Fund | | | Elfun Trusts | |
| | | Year Ended December 31,
2018 | | | Year Ended December 31,
2017 | | | Year Ended December 31,
2018 | | | Year Ended December 31,
2017 | |
Increase (Decrease) in Net Assets | |
|
Operations: | |
Net investment income | | $ | 4,608,952 | | | $ | 3,662,791 | | | $ | 32,702,525 | | | $ | 32,563,837 | |
Net realized gain (loss) on investments, futures, swap contracts, options contracts, and foreign currency related transactions | | | 2,994,695 | | | | (1,119,223 | ) | | | 313,947,889 | | | | 239,503,606 | |
Net increase (decrease) in unrealized appreciation/depreciation on investments, futures, swap contracts and foreign currency translations | | | (44,660,948 | ) | | | 43,347,073 | | | | (427,642,446 | ) | | | 313,411,667 | |
| | | | | | | | | | | | | | | | |
Net increase (decrease) from operations | | | (37,057,301 | ) | | | 45,890,641 | | | | (80,992,032 | ) | | | 585,479,110 | |
| | | | | | | | | | | | | | | | |
|
Distributions to shareholders: | |
Total distributions | | | (4,494,291 | ) | | | (3,655,776 | ) | | | (346,605,889 | ) | | | (272,201,212 | ) |
| | | | | | | | | | | | | | | | |
Increase (decrease) in assets from operations and distributions | | | (41,551,592 | ) | | | 42,234,865 | | | | (427,597,921 | ) | | | 313,277,898 | |
| | | | | | | | | | | | | | | | |
|
Share transactions: | |
Proceeds from sale of shares | | | 3,187,752 | | | | 4,172,093 | | | | 53,658,651 | | | | 50,712,147 | |
Value of distributions reinvested | | | 3,868,438 | | | | 3,163,834 | | | | 278,812,837 | | | | 217,798,384 | |
Cost of shares redeemed | | | (19,291,445 | ) | | | (19,846,304 | ) | | | (215,125,396 | ) | | | (175,834,878 | ) |
| | | | | | | | | | | | | | | | |
Net increase (decrease) from share transactions | | | (12,235,255 | ) | | | (12,510,377 | ) | | | 117,346,092 | | | | 92,675,653 | |
| | | | | | | | | | | | | | | | |
| | | | |
Total increase (decrease) in net assets | | | (53,786,847 | ) | | | 29,724,488 | | | | (310,251,829 | ) | | | 405,953,551 | |
|
Net Assets | |
Beginning of year | | | 237,768,816 | | | | 208,044,328 | | | | 2,737,919,312 | | | | 2,331,965,761 | |
| | | | | | | | | | | | | | | | |
| | | | |
End of year | | $ | 183,981,969 | | | $ | 237,768,816 | | | $ | 2,427,667,483 | | | $ | 2,737,919,312 | |
| | | | | | | | | | | | | | | | |
|
Changes in Fund Shares | |
Shares sold | | | 142,810 | | | | 196,928 | | | | 886,867 | | | | 842,367 | |
Issued for distributions reinvested | | | 211,506 | | | | 140,117 | | | | 5,602,033 | | | | 3,601,757 | |
Shares redeemed | | | (899,037 | ) | | | (961,741 | ) | | | (3,429,325 | ) | | | (2,890,514 | ) |
| | | | | | | | | | | | | | | | |
Net increase (decrease) in fund shares | | | (544,721 | ) | | | (624,696 | ) | | | 3,059,575 | | | | 1,553,610 | |
| | | | | | | | | | | | | | | | |
For the year ended December 31, 2017, the source of distributions paid to shareholders was (See Note 11 in the Notes to Financial Statements): | |
| | | | |
Net investment income | | | | | | $ | (3,655,776 | ) | | | | | | $ | (32,575,926 | ) |
Net realized gains | | | | | | | — | | | | | | | | (239,625,286 | ) |
| | | | | | | | | | | | | | | | |
Total distributions | | | | | | | (3,655,776 | ) | | | | | | | (272,201,212 | ) |
| | | | | | | | | | | | | | | | |
Undistributed net investment income as of December 31, 2017: | | | | | | $ | 9,676 | | | | | | | $ | — | |
The accompanying Notes are an integral part of these financial statements.
| | |
| 102 | | Statements of Changes in Net Assets |
| | | | | | | | | | | | | | |
| Elfun Diversified Fund | | | ElfunTax-Exempt Income Fund | |
Year Ended December 31,
2018 | | | Year Ended December 31,
2017 | | | Year Ended December 31,
2018 | | | Year Ended December 31,
2017 | |
| | | | | | | | | | | | | | |
| | | |
| | | | | | | | | | | | | | |
| $ | 4,557,788 | | | $ | 4,574,028 | | | $ | 57,447,561 | | | $ | 59,636,606 | |
|
1,112,797 |
| | | 18,476,598 | | | | (2,154,716 | ) | | | (2,447,208 | ) |
| (16,461,988 | ) | | | 6,456,534 | | | | (43,488,260 | ) | | | 12,274,701 | |
| | | | | | | | | | | | | | |
| | (10,791,403 | ) | | | 29,507,160 | | | | 11,804,585 | | | | 69,464,099 | |
| | | | | | | | | | | | | | |
| | | |
| | | | | | | | | | | | | | |
| | (5,726,511 | ) | | | (21,137,965 | ) | | | (57,447,575 | ) | | | (59,636,585 | ) |
| | | | | | | | | | | | | | |
| | (16,517,914 | ) | | | 8,369,195 | | | | (45,642,990 | ) | | | 9,827,514 | |
| | | | | | | | | | | | | | |
| | | |
| | | | | | | | | | | | | | |
| | 5,751,778 | | | | 5,048,518 | | | | 52,101,473 | | | | 35,753,804 | |
| | 4,986,474 | | | | 18,727,487 | | | | 39,620,528 | | | | 41,248,494 | |
| | (22,216,449 | ) | | | (21,143,587 | ) | | | (140,449,316 | ) | | | (110,727,469 | ) |
| | | | | | | | | | | | | | |
| | (11,478,197 | ) | | | 2,632,418 | | | | (48,727,315 | ) | | | (33,725,171 | ) |
| | | | | | | | | | | | | | |
| | | |
| | (27,996,111 | ) | | | 11,001,613 | | | | (94,370,305 | ) | | | (23,897,657 | ) |
| | | |
| | | | | | | | | | | | | | |
| | 209,939,334 | | | | 198,937,721 | | | | 1,471,350,345 | | | | 1,495,248,002 | |
| | | | | | | | | | | | | | |
| | | |
| $ | 181,943,223 | | | $ | 209,939,334 | | | $ | 1,376,980,040 | | | $ | 1,471,350,345 | |
| | | | | | | | | | | | | | |
| | | |
| | | | | | | | | | | | | | |
| | 312,332 | | | | 264,253 | | | | 4,614,192 | | | | 3,093,499 | |
| | 294,883 | | | | 1,010,111 | | | | 3,522,242 | | | | 3,565,302 | |
| | (1,199,520 | ) | | | (1,098,217 | ) | | | (12,474,273 | ) | | | (9,567,674 | ) |
| | | | | | | | | | | | | | |
| | (592,305 | ) | | | 176,147 | | | | (4,337,839 | ) | | | (2,908,873 | ) |
| | | | | | | | | | | | | | |
| | | |
| | | | | | | | | | | | | | |
| | | |
| | | | $ | (4,765,419 | ) | | | | | | $ | (59,636,585 | ) |
| | | | | (16,372,546 | ) | | | | | | | — | |
| | | | | | | | | | | | | | |
| | | | | (21,137,965 | ) | | | | | | | (59,636,585 | ) |
| | | | | | | | | | | | | | |
| | | | $ | — | | | | | | | $ | 62,826 | |
The accompanying Notes are an integral part of these financial statements.
| | | | |
| Statements of Changes in Net Assets | | | 103 | |
Elfun Funds
Statements of Changes in Net Assets
| | | | | | | | | | | | | | | | |
| | | Elfun Income Fund | | | Elfun Government Money
Market Fund | |
| | | Year Ended December 31,
2018 | | | Year Ended December 31,
2017 | | | Year Ended December 31,
2018 | | | Year Ended December 31,
2017 | |
| | | | | | | | | | | | | | | | |
Increase (Decrease) in Net Assets | |
|
Operations: | |
Net investment income | | $ | 6,939,136 | | | $ | 6,878,857 | | | $ | 1,556,972 | | | $ | 604,201 | |
Net realized gain (loss) on investments, futures, swap contracts, options contracts, and foreign currency related transactions | | | (5,426,673 | ) | | | 490,317 | | | | (3 | ) | | | — | |
Net increase (decrease) in unrealized appreciation/depreciation on investments, futures and swap contracts | | | (3,757,452 | ) | | | 3,041,432 | | | | — | | | | — | |
| | | | | | | | | | | | | | | | |
Net increase (decrease) from operations | | | (2,244,989 | ) | | | 10,410,606 | | | | 1,556,969 | | | | 604,201 | |
| | | | | | | | | | | | | | | | |
|
Distributions to shareholders: | |
Total distributions | | | (7,065,178 | ) | | | (6,577,379 | ) | | | (1,556,972 | ) | | | (614,831 | ) |
| | | | | | | | | | | | | | | | |
Increase (decrease) in assets from operations and distributions | | | (9,310,167 | ) | | | 3,833,227 | | | | (3 | ) | | | (10,630 | ) |
| | | | | | | | | | | | | | | | |
|
Share transactions: | |
Proceeds from sale of shares | | | 10,263,456 | | | | 10,184,726 | | | | 49,255,283 | | | | 45,174,015 | |
Value of distributions reinvested | | | 5,368,470 | | | | 5,003,427 | | | | 1,430,523 | | | | 562,402 | |
Cost of shares redeemed | | | (38,033,816 | ) | | | (33,974,499 | ) | | | (56,238,963 | ) | | | (47,236,144 | ) |
| | | | | | | | | | | | | | | | |
Net increase (decrease) from share transactions | | | (22,401,890 | ) | | | (18,786,346 | ) | | | (5,553,157 | ) | | | (1,499,727 | ) |
| | | | | | | | | | | | | | | | |
| | | | |
Total increase (decrease) in net assets | | | (31,712,057 | ) | | | (14,953,119 | ) | | | (5,553,160 | ) | | | (1,510,357 | ) |
|
Net Assets | |
Beginning of year | | | 261,189,077 | | | | 276,142,196 | | | | 109,828,175 | | | | 111,338,532 | |
| | | | | | | | | | | | | | | | |
| | | | |
End of year | | $ | 229,477,020 | | | $ | 261,189,077 | | | $ | 104,275,015 | | | $ | 109,828,175 | |
| | | | | | | | | | | | | | | | |
|
Changes in Fund Shares | |
Shares sold | | | 925,381 | | | | 893,694 | | | | 49,255,283 | | | | 45,174,014 | |
Issued for distributions reinvested | | | 485,128 | | | | 437,971 | | | | 1,430,523 | | | | 562,402 | |
Shares redeemed | | | (3,427,061 | ) | | | (2,976,318 | ) | | | (56,238,963 | ) | | | (47,236,144 | ) |
| | | | | | | | | | | | | | | | |
Net decrease in fund shares | | | (2,016,552 | ) | | | (1,644,653 | ) | | | (5,553,157 | ) | | | (1,499,728 | ) |
| | | | | | | | | | | | | | | | |
|
| For the year ended December 31, 2017, the source of distributions paid to shareholders was (See Note 11 in the Notes to Financial Statements): | |
| | | | |
Net investment income | | | | | | $ | (6,577,379 | ) | | | | | | $ | (604,201 | ) |
Net realized gains | | | | | | | — | | | | | | | | (10,630 | ) |
| | | | | | | | | | | | | | | | |
Total distributions | | | | | | | (6,577,379 | ) | | | | | | | (614,831 | ) |
| | | | | | | | | | | | | | | | |
Undistributed net investment income as of December 31, 2017: | | | | | | $ | 347,347 | | | | | | | $ | — | |
The accompanying Notes are an integral part of these financial statements.
| | |
| 104 | | Statements of Changes in Net Assets |
Elfun Funds
Notes to Financial Statements — December 31, 2018
| 1. | | Organization of the Funds |
The Elfun International Equity Fund, Elfun Trusts, Elfun Diversified Fund, ElfunTax-Exempt Income Fund, Elfun Income Fund and Elfun Government Money Market Fund (each, a “Fund” and collectively, the “Funds”) are each registered under the Investment Company Act of 1940, as amended (the “1940 Act”), asopen-end management investment companies. Each Fund is a diversified investment company within the meaning of the 1940 Act.
Under each Fund’s organizational documents, its officers and trustees are indemnified against certain liabilities arising out of the performance of their duties to the Fund. Additionally, in the normal course of business, the Funds enter into contracts with service providers that contain general indemnification clauses. Each Fund’s maximum exposure under these arrangements is unknown as this would involve future claims that may be made against the Fund that have not yet occurred
| 2. | | Summary of Significant Accounting Policies |
The following is a summary of significant accounting policies followed by the Funds in the preparation of their financial statements:
The preparation of financial statements in accordance with U.S. generally accepted accounting principles (“U.S. GAAP”) requires management to make estimates and assumptions that affect the reported amounts and disclosures in the financial statements. Actual results could differ from those estimates. Each Fund is an investment company under U.S. GAAP and follows the accounting and reporting guidance applicable to investment companies.
Security Valuation Each Fund’s investments are valued at fair value each day that the New York Stock Exchange (“NYSE”) is open and, for financial reporting purposes, as of the report date should the reporting period end on a day that the NYSE is not open. Fair value is generally defined as the price a fund would receive to sell an asset or pay to transfer a liability in an orderly transaction between market participants at the measurement date. By its nature, a fair value price is a good faith estimate of the valuation in a current sale and may not reflect an actual market price. The investments of each Fund are valued pursuant to the policy and procedures developed by the Oversight Committee (the “Committee”) and approved by the Board of Trustees of each Fund (each, a “Board”). The Committee provides oversight of the valuation of investments for the Funds. Each Board has responsibility for overseeing the determination of the fair value of investments.
Valuation techniques used to value each Fund’s investments by major category are as follows:
| | • | | Equity investments (including preferred stocks and registered investment companies that are exchange traded funds) traded on a recognized securities exchange for which market quotations are readily available are valued at the last sale price or official closing price, as applicable, on the primary market or exchange on which they trade. Equity investments traded on a recognized exchange for which there were no sales on that day are valued at the last published sale price or at fair value. |
| | • | | Investments in registered investment companies (including money market funds) or other unitized pooled investment vehicles that are not traded on an exchange are valued at that day’s published net asset value (“NAV”) per share or unit. |
| | • | | Government and municipal fixed income securities are generally valued using quotations from independent pricing services or brokers. Certain government inflation-indexed securities may require a calculated fair valuation as the cumulative inflation is contained within the price provided by the pricing service or broker. For these securities, the inflation component of the price is “cleaned” from the pricing service or broker price utilizing the published inflation factors in order to ensure proper accrual of income. |
| | • | | Debt obligations (including short term investments) are valued using quotations from independent pricing services or brokers or are generally valued at the last reported evaluated prices. |
| | • | | Exchange-traded futures contracts are valued at the closing settlement price on the primary market on which they are traded most extensively. Exchange-traded futures contracts traded on a recognized exchange for which there were no sales on that day are valued at the last reported sale price obtained from independent pricing services or brokers or at fair value. |
| | • | | Options on futures are priced at their last sale price on the principal market on which they are traded on the valuation date. If there were no sales on that day, options on futures are valued at either the last reported sale or official closing price on their primary exchange determined in accordance with the valuation policy and procedures approved by the Boards. |
| | | | |
| Notes to Financial Statements | | | 105 | |
Elfun Funds
Notes to Financial Statements, continued — December 31, 2018
| | • | | Swap agreements are valued daily based upon prices supplied by Board approved pricing vendors or through brokers. Depending on the product and terms of the transaction, the value of agreements is determined using a series of techniques including valuation models that incorporate a number of market data factors, such as discounted cash flows, yields, curves, trades and values of the underlying reference instruments. In the event SSGA Funds Management, Inc. (the “Adviser” or “SSGA FM”) is unable to obtain an independent, third–party valuation the agreements will be fair valued. |
In the event prices or quotations are not readily available or that the application of these valuation methods results in a price for an investment that is deemed to be not representative of the fair value of such investment, fair value will be determined in good faith by the Committee, in accordance with the valuation policy and procedures approved by the Boards.
A “significant event” is an event that the Board believes, with a reasonably high degree of certainty, has caused the closing market prices of a Fund’s portfolio securities to no longer reflect their value at the time of the Fund’s net asset value calculation. Fair value may be determined using an independent fair value service under valuation procedures approved by the Boards. The independent fair value service takes into account multiple factors including, but not limited to, movements in the U.S. securities markets, certain depositary receipts, futures contracts and foreign currency exchange rates that have occurred subsequent to the close of foreign securities exchanges. The use of the independent fair value service or alternative fair valuation methods would result in the investments being classified within Level 2 of the fair value hierarchy.
The Funds value their assets and liabilities at fair value using a fair value hierarchy consisting of three broad levels that prioritize the inputs to valuation techniques giving the highest priority to readily available unadjusted quoted prices in active markets for identical assets or liabilities (Level 1 measurements) and the lowest priority to unobservable inputs (Level 3 measurements) when market prices are not readily available or reliable. The categorization of a value determined for an investment within the hierarchy is based upon the pricing transparency of the investment and is not necessarily an indication of the risk associated with investing in it.
The three levels of the fair value hierarchy are as follows:
| | • | | Level 1 — Unadjusted quoted prices in active markets for an identical asset or liability; |
| | • | | Level 2 — Inputs other than quoted prices included within Level 1 that are observable for the asset or liability either directly or indirectly, including quoted prices for similar assets or liabilities in active markets, quoted prices for identical or similar assets or liabilities in markets that are not considered to be active, inputs other than quoted prices that are observable for the asset or liability (such as exchange rates, financing terms, interest rates, yield curves, volatilities, prepayment speeds, loss severities, credit risks and default rates) or other market-corroborated inputs; and |
| | • | | Level 3 — Unobservable inputs for the asset or liability, including the Committee’s assumptions used in determining the fair value of investments. |
The value of each Fund’s investments according to the fair value hierarchy as of December 31, 2018 is disclosed in each Fund’s Schedule of Investments.
Investment Transactions and Income Recognition Investment transactions are accounted for on trade date for financial reporting purposes. Realized gains and losses from the sale or disposition of investments and foreign exchange transactions, if any, are determined using the identified cost method.
Dividend income and capital gain distributions, if any, are recognized on theex-dividend date, net of any foreign taxes withheld at source, if any.
Interest income is recorded daily on an accrual basis. All premiums and discounts are amortized/accreted for financial reporting purposes.
Non-cash dividends received in the form of stock are recorded as dividend income at fair value.
Expenses Fund specific expenses are charged to the Fund that incurs such expenses. Such expenses may include custodial fees, legal and accounting fees, printing costs and registration fees. Expenses that are not Fund specific are allocated pro rata across the Funds.
| | |
| 106 | | Notes to Financial Statements |
Elfun Funds
Notes to Financial Statements, continued — December 31, 2018
Foreign Currency Translation The accounting records of the Funds are maintained in U.S. dollars. Foreign currencies as well as investment securities and other assets and liabilities denominated in a foreign currency are translated to U.S. dollars using exchange rates at period end. Purchases and sales of securities, income receipts and expense payments denominated in foreign currencies are translated into U.S. dollars at the prevailing exchange rate on the respective dates of the transactions.
The effects of exchange rate fluctuations on investments are included with the net realized and unrealized gain (loss) on investment securities. Other foreign currency transactions resulting in realized and unrealized gain (loss) are disclosed separately.
Foreign Taxes The Funds may be subject to foreign taxes (a portion of which may be reclaimable) on income, stock dividends, realized and unrealized capital gains on investments or certain foreign currency transactions. Foreign taxes are recorded in accordance with SSGA FM’s understanding of the applicable foreign tax regulations and rates that exist in the foreign jurisdictions in which the Funds invest. These foreign taxes, if any, are paid by the Funds and are reflected in the Statements of Operations, if applicable. Foreign taxes payable or deferred as of December 31, 2018, if any, are disclosed in the Funds’ Statements of Assets and Liabilities.
| 3. | | Securities and Other Investments |
Delayed Delivery Transactions and When-Issued Securities During the period, the Elfun Diversified Fund and Elfun Income Fund transacted in securities on a delayed delivery or when-issued basis. Payment and delivery may take place after the customary settlement period for that security. The price of the underlying securities and the date when the securities will be delivered and paid for are fixed at the time the transaction is negotiated. The securities purchased on a delayed delivery or when-issued basis are identified as such in the applicable Fund’s Schedule of Investments. A Fund may receive compensation for interest forgone in the purchase of a delayed delivery or when-issued security. With respect to such purchase commitments, a Fund identifies securities as segregated in its records with a value at least equal to the amount of the commitment. Losses may arise due to changes in the value of the underlying securities or if the counterparty does not perform under the contract’s terms, or if the issuer does not issue the securities due to political, economic or other factors.
To-Be-Announced Transactions Certain Funds may seek to obtain exposure to U.S. agency mortgage pass-through securities through the use of“to-be-announced” or “TBA transactions.” “TBA” refers to a commonly used mechanism for the forward settlement of U.S. agency mortgage pass-through securities. In a TBA transaction, the buyer and seller decide on general trade parameters, such as agency, settlement date, coupon, and price.
A Fund may use TBA transactions to “roll over” such agreements prior to the settlement date. This type of TBA transaction is sometimes known as a “TBA roll.” In a TBA roll, a Fund generally will sell the obligation to purchase the pools stipulated in the TBA agreement prior to the settlement date and will enter into a new TBA agreement for future delivery of pools of mortgage pass-through securities. A Fund may also enter into TBA agreements and settle such transactions on the stipulated settlement date by accepting actual receipt or delivery of the pools of mortgage pass-through securities.
Default by or bankruptcy of a counterparty to a TBA transaction would expose a Fund to possible loss because of adverse market action, expenses or delays in connection with the purchase or sale of the pools of mortgage pass-through securities specified in the TBA transaction. To minimize this risk, a Fund will enter into TBA transactions only with established counterparties. A Fund’s use of “TBA rolls” may impact portfolio turnover, transaction costs and capital gain distributions to shareholders.
Repurchase Agreements Certain Funds may enter into repurchase agreements under the terms of a Master Repurchase Agreement. A repurchase agreement customarily obligates the seller at the time it sells securities to a Fund to repurchase the securities at a mutually agreed upon price and time. During the term of a repurchase agreement, the value of the underlying securities held as collateral on behalf of a Fund including accrued interest, is required to exceed the value of the repurchase agreement, including accrued interest.
The applicable Fund monitors, on a daily basis, the value of the collateral to ensure it is at least equal to the Fund’s the principal amount of the repurchase agreement (including accrued interest). The underlying securities are ordinarily United States Government or Government Agency securities, but may consist of other securities. The use of repurchase agreements involves certain risks including counterparty risks. In the event of a default by the counterparty, realization of the collateral proceeds could be delayed, during which the value of the collateral may decline.
| | | | |
| Notes to Financial Statements | | | 107 | |
Elfun Funds
Notes to Financial Statements, continued — December 31, 2018
As of December 31, 2018, the Elfun Government Money Market Fund had invested in repurchase agreements with the gross values of $35,057,000 and associated collateral equal to $35,758,339.
| 4. | | Derivative Financial Instruments |
Futures Contracts Certain Funds may enter into futures contracts to meet the Funds’ objectives. A futures contract is a standardized, exchange-traded agreement to buy or sell a financial instrument at a set price on a future date. Upon entering into a futures contract, a Fund is required to deposit with the broker, cash or securities in an amount equal to the minimum initial margin requirements of the clearing house. Subsequent payments are made or received by a Fund equal to the daily change in the contract value and are recorded as variation margin receivable or payable with a corresponding offset to unrealized gains or losses. A Fund recognizes a realized gain or loss when the contract is closed.
Losses may arise if the value of a futures contract decreases due to unfavorable changes in the market rates or values of the underlying instrument during the term of the contract or if the counterparty does not perform under the contract. The use of futures contracts also involves the risk that the movements in the price of the futures contracts do not correlate the movement of the assets underlying such contracts.
During the fiscal year ended December 31, 2018, the following Funds entered into futures contracts for strategies listed below:
| | |
| Funds | | Strategies |
Elfun International Equity Fund | | Equitization of Cash |
Elfun Diversified Fund | | Manage exposure to interest rates and Equitization of Cash |
Elfun Income Fund | | Manage exposure to interest rates |
Credit Default Swaps During the fiscal year ended December 31, 2018, the Elfun Diversified Fund and Elfun Income Fund engaged in credit default swaps to manage credit risk. When a Fund is the buyer in a credit default swap contract, a Fund is entitled to receive the par (or other agreed upon) value (full notional value) of a referenced debt obligation (or basket of debt obligations) from the counterparty (or central clearing party (“CCP”) in the case of a centrally cleared swap) to the contract if a credit event by a third party, such as a U.S. or foreign corporate issuer or sovereign issuer, on the debt obligation occurs. In return, a Fund pays the counterparty a periodic stream of payments over the term of the contract provided that no credit event has occurred. If no credit event occurs, a Fund loses its investment and recovers nothing. However, if a credit event occurs, a Fund receives full notional value for a referenced debt obligation that may have little or no value. When a Fund is the seller of a credit default swap, it receives a fixed rate of income throughout the term of the contract, provided there is no credit event. If a credit event occurs, a Fund is obligated to pay the notional amount of the swap and in certain instances take delivery of securities of the reference entity upon the occurrence of a credit event, as defined under the terms of that particular swap agreement. Credit events are contract specific but may include bankruptcy, failure to pay, restructuring, obligation acceleration and repudiation/moratorium. If a Fund is a seller of protection and a credit event occurs, the maximum potential amount of future payments that a Fund could be required to make would be an amount equal to the notional amount of the agreement. This potential amount would be partially offset by any recovery value of the respective referenced obligation, or net amount received from the settlement of a buy protection credit default swap agreement entered into by a Fund for the same referenced obligation.
As the seller, a Fund may create economic leverage to its portfolio because, in addition to its total net assets, a Fund is subject to investment exposure on the notional amount of the swap. The interest fee paid or received on the swap, which is based on a specified interest rate on a fixed notional amount, is accrued daily as a component of unrealized appreciation (depreciation) and is recorded as realized gain upon receipt or realized loss upon payment. A Fund also records an increase or decrease to unrealized appreciation (depreciation) in an amount equal to the daily valuation. For centrally cleared swaps, the daily change in valuation is recorded as a receivable or payable for variation margin and settled in cash with the CCP daily. All upfront payments, if any, are amortized over the life of the swap as realized gains or losses. Those upfront payments that are paid or received, typically fornon-centrally cleared swaps, are recorded as other assets or other liabilities, respectively, net of amortization. For financial reporting purposes, unamortized upfront payments, if any, are netted with unrealized appreciation or depreciation on swaps to determine the market value of swaps. A Fund segregates assets in the form of cash or liquid securities in an amount equal to the notional amount of the credit default swaps of which it is the seller. A Fund segregates assets in the form of cash or liquid securities in an amount equal to any unrealized depreciation of the credit default swaps of which it is the buyer, marked to market on a daily basis. Credit default swaps involve greater risks than if a Fund had invested
| | |
| 108 | | Notes to Financial Statements |
Elfun Funds
Notes to Financial Statements, continued — December 31, 2018
in the referenced debt obligation directly. If a Fund is a buyer of a credit default swap and no credit event occurs, a Fund will not earn any return on its investment. If a Fund is a seller of a credit default swap, a Fund’s risk of loss may be the entire notional amount of the swap. Swaps may also subject a Fund to the risk that the counterparty to the transaction may not fulfill its obligation. In the case of centrally cleared swaps, counterparty risk is minimal due to protections provided by the CCP.
Interest Rate Swaps Interest rate swaps involve the exchange by a Fund with another party of their respective commitments to pay or receive interest, such as an exchange of fixed rate payments for floating rate payments.
During the fiscal year ended December 31, 2018, the Elfun Diversified Fund and Elfun Income Fund entered into interest rate swaps in order to manage exposure to interest rates.
Options on Exchanged-Traded Futures Contracts Certain Funds may purchase and write options, including options on exchanged-traded futures contracts, subject to certain limitations. Writing puts and buying calls tend to increase a Fund’s exposure to the underlying instrument while buying puts and writing calls tend to decrease a Fund’s exposure to the underlying instrument. A Fund will not enter into a transaction involving options for speculative purposes. A Fund’s risks in using these contracts include changes in the value of the underlying instruments,non-performance of the counterparties under the contracts’ terms and changes in the liquidity of the secondary market for the contracts.
When a Fund writes an option, the amount of the premium received is recorded as a liability and is subsequently adjusted to the current fair value of the option written. Premiums received from writing options that expire unexercised are treated by a Fund on the expiration date as realized gains from investments. The difference between the premium and the amount paid on effecting a closing purchase transaction, including brokerage commissions, is also treated as a realized gain, or if the premium is less than the amount paid for the closing purchase, as a realized loss. When an option is exercised, the proceeds from the sale of the underlying instrument or the cost basis of the securities purchased is adjusted by the original premium received or paid. In return for a premium paid, call and put options on futures contracts give the holder the right, but not the obligation, to purchase or sell, respectively, a position in a particular futures contract at a specified exercise price.
During the fiscal year ended December 31, 2018, the Elfun Diversified Fund and the Elfun Income Fund purchased and wrote options in order to manage exposure to interest rates.
The following tables summarize the value of the Funds’ derivative instruments as of December 31, 2018 and the related location in the accompanying Statements of Assets and Liabilities and Statements of Operations, presented by primary underlying risk exposure:
Asset Derivatives
| | | | | | | | | | | | | | | | | | | | | | | | |
| | | Interest
Rate
Contracts
Risk | | | Foreign
Exchange
Contracts
Risk | | | Credit
Contracts
Risk | | | Equity
Contracts
Risk | | | Commodity
Contracts
Risk | | | Total | |
Elfun Diversified Fund | | | | | | | | | | | | | | | | | | | | | | | | |
Futures Contracts | | $ | 183,601 | | | $ | — | | | $ | — | | | $ | — | | | $ | — | | | $ | 183,601 | |
Swap Contracts | | $ | — | | | $ | — | | | $ | 15,886 | | | $ | — | | | $ | — | | | $ | 15,886 | |
Elfun Income Fund | | | | | | | | | | | | | | | | | | | | | | | | |
Futures Contracts | | $ | 623,416 | | | $ | — | | | $ | — | | | $ | — | | | $ | — | | | $ | 623,416 | |
Swap Contracts | | $ | — | | | $ | — | | | $ | 85,811 | | | $ | — | | | $ | — | | | $ | 85,811 | |
Liability Derivatives
| | | | | | | | | | | | | | | | | | | | | | | | |
| | | Interest
Rate
Contracts
Risk | | | Foreign
Exchange
Contracts
Risk | | | Credit
Contracts
Risk | | | Equity
Contracts
Risk | | | Commodity
Contracts
Risk | | | Total | |
Elfun Diversified Fund | | | | | | | | | | | | | | | | | | | | | | | | |
Swap Contracts | | $ | (73,424 | ) | | $ | — | | | $ | — | | | $ | — | | | $ | — | | | $ | (73,424 | ) |
Elfun Income Fund | | | | | | | | | | | | | | | | | | | | | | | | |
Swap Contracts | | $ | (313,874 | ) | | $ | — | | | $ | — | | | $ | — | | | $ | — | | | $ | (313,874 | ) |
| | | | |
| Notes to Financial Statements | | | 109 | |
Elfun Funds
Notes to Financial Statements, continued — December 31, 2018
Realized Gain/Loss
| | | | | | | | | | | | | | | | | | | | | | | | |
| | | Interest
Rate
Contracts
Risk | | | Foreign
Exchange
Contracts
Risk | | | Credit
Contracts
Risk | | | Equity
Contracts
Risk | | | Commodity
Contracts
Risk | | | Total | |
Elfun International Equity Fund | | | | | | | | | | | | | | | | | | | | | |
Futures Contracts | | $ | — | | | $ | — | | | $ | — | | | $ | 143,362 | | | $ | — | | | $ | 143,362 | |
Elfun Diversified Fund | | | | | | | | | | | | | | | | | | | | | | | | |
Futures Contracts | | $ | (264,444 | ) | | $ | — | | | $ | — | | | $ | (9,844 | ) | | $ | — | | | $ | (274,288 | ) |
Swap Contracts | | | 86,897 | | | | — | | | | (14,580 | ) | | | — | | | | — | | | | 72,317 | |
Purchased Option Contracts(b) | | | (79,230 | ) | | | — | | | | — | | | | — | | | | — | | | | (79,230 | ) |
Written Option Contracts | | | 35,977 | | | | — | | | | — | | | | — | | | | — | | | | 35,977 | |
Elfun Income Fund | | | | | | | | | | | | | | | | | | | | | | | | |
Futures Contracts | | $ | (711,298 | ) | | $ | — | | | $ | — | | | $ | — | | | $ | — | | | $ | (711,298 | ) |
Swap Contracts | | | 352,637 | | | | — | | | | (26,475 | ) | | | — | | | | — | | | �� | 326,160 | |
Purchased Option Contracts(b) | | | (315,816 | ) | | | — | | | | — | | | | — | | | | — | | | | (315,816 | ) |
Written Option Contracts | | | 141,747 | | | | — | | | | — | | | | — | | | | — | | | | 141,747 | |
| | (b) | Purchased options are included in net realized gain (loss) from investments. |
Net Change in Unrealized Appreciation (Depreciation)
| | | | | | | | | | | | | | | | | | | | | | | | |
| | | Interest
Rate
Contracts
Risk | | | Foreign
Exchange
Contracts
Risk | | | Credit
Contracts
Risk | | | Equity
Contracts
Risk | | | Commodity
Contracts
Risk | | | Total | |
Elfun International Equity Fund | | | | | | | | | | | | | | | | | | | | | |
Futures Contracts | | $ | — | | | $ | — | | | $ | — | | | $ | (28,153 | ) | | $ | — | | | $ | (28,153 | ) |
Elfun Diversified Fund | | | | | | | | | | | | | | | | | | | | | | | | |
Futures Contracts | | $ | 187,182 | | | $ | — | | | $ | — | | | $ | (18,420 | ) | | $ | — | | | $ | 168,762 | |
Swap Contracts | | | (57,175 | ) | | | — | | | | (21,013 | ) | | | — | | | | — | | | | (78,188 | ) |
Elfun Income Fund | | | | | | | | | | | | | | | | | | | | | | | | |
Futures Contracts | | $ | 569,712 | | | $ | — | | | $ | — | | | $ | — | | | $ | — | | | $ | 569,712 | |
Swap Contracts | | | (217,507 | ) | | | — | | | | (72,116 | ) | | | — | | | | — | | | | (289,623 | ) |
| 5. | | Fees and Transactions with Affiliates |
Advisory Fee SSGA FM, a registered investment adviser, was retained by each Board to act as investment adviser and administrator of each Fund. SSGA FM’s compensation for investment advisory and administrative services (“Management Fee”) is paid monthly based on the average daily net assets of each Fund. The Management Fee is stated in the following schedule:
| | | | |
| Fund | | Management
Fee | |
Elfun International Equity Fund | | | 0.21 | % |
Elfun Trusts | | | 0.14 | % |
Elfun Diversified Fund | | | 0.17 | % |
ElfunTax-Exempt Income Fund | | | 0.16 | % |
Elfun Income Fund | | | 0.17 | % |
Elfun Government Money Market Fund | | | 0.10 | % |
SSGA FM may voluntarily reduce all or a portion of its fees and/or reimburse expenses of the Elfun Government Money Market Fund, to the extent necessary to avoid a negative yield (the “Voluntary Reduction”), or a yield below a specified level, which may vary from time to time in SSGA FM’s sole discretion. The Elfun Government Money Market Fund has agreed, subject to certain limitations, to reimburse the Adviser for the full dollar amount of any Voluntary Reduction for up to three years from the date reduced, provided that the total operating expense ratio for the Elfun Government Money Market Fund, after giving effect to the recoupment, would not exceed 0.60% for the fiscal year in which the recoupment is made. SSGA FM may, in its sole
| | |
| 110 | | Notes to Financial Statements |
Elfun Funds
Notes to Financial Statements, continued — December 31, 2018
discretion, irrevocably waive receipt of any or all reimbursement amounts due from the Elfun Government Money Market Fund. Any future reimbursement by the Elfun Government Money Market Fund of the Voluntary Reduction would increase the expenses and reduce the yield of the Elfun Government Money Market Fund. There is no guarantee that the Voluntary Reduction will be in effect at any given time or that the Elfun Government Money Market Fund will be able to avoid a negative yield. SSGA FM did not waive any fees or reimburse any expenses during the fiscal year ended December 31, 2018. SSGA FM did not recoup any previously waived fees or reimbursed expenses during the fiscal year ended December 31, 2018 or during any prior periods. There are no amounts subject to recoupment by SSGA FM as of December 31, 2018.
Custody, Fund Accounting andSub-Administration Fees State Street Bank and Trust Company (“State Street”) serves as the custodian, fund accountant andsub-administrator to the Funds. Amounts paid by the Funds to State Street for performing such services are included custody, fund accounting andsub-administration fees on the Statements of Operations.
Due to Custodian In certain circumstances, the Funds may have cash overdraft with the custodian. The Due to Custodian amount, if any, reflects cash overdrawn with State Street as custodian who is an affiliate of the Funds.
Other Transactions with Affiliates The Funds may invest in affiliated entities, including securities issued by State Street, affiliated funds, or entities deemed to be affiliates as a result of the Funds owning more than five percent of the entity’s voting securities or outstanding shares. Amounts relating to these transactions during the fiscal year ended December 31, 2018 are disclosed in the Schedules of Investments.
The fees and expenses of each Fund’s trustees who are not “interested persons” of the Fund, as defined in the 1940 Act (“Independent Trustees”) are paid directly by the Funds. The Independent Trustees are reimbursed for travel and otherout-of-pocket expenses in connection with meeting attendance and industry seminars.
| 7. | | Investment Transactions |
Purchases and Sales of Securities The cost of purchases and the proceeds from sales of investments, other than short-term securities, for the fiscal year ended December 31, 2018, were as follows:
| | | | | | | | | | | | | | | | |
| | | U.S. Government
Obligations | | | Other Securities | |
| Fund | | Purchases | | | Sales | | | Purchases | | | Sales | |
Elfun International Equity Fund | | $ | — | | | $ | — | | | $ | 53,756,389 | | | $ | 60,345,908 | |
Elfun Trusts | | | — | | | | — | | | | 487,287,466 | | | | 664,468,888 | |
Elfun Diversified Fund | | | 116,030,270 | | | | 116,021,252 | | | | 23,102,659 | | | | 35,455,137 | |
ElfunTax-Exempt Income Fund | | | — | | | | — | | | | 257,309,659 | | | | 309,466,717 | |
Elfun Income Fund | | | 401,703,755 | | | | 426,969,761 | | | | 79,989,644 | | | | 77,235,702 | |
| 8. | | Income Tax Information |
The Funds have qualified and intend to continue to qualify as regulated investment companies under Subchapter M of the Internal Revenue Code of 1986, as amended. Each Fund will not be subject to the federal income taxes to the extent it distributes its taxable income, including any net realized capital gains, for each fiscal year. Therefore, no provision for federal income tax is required.
The Funds file federal and various state and local tax returns as required. No income tax returns are currently under examination. Generally, the federal returns are subject to examination by the Internal Revenue Service for a period of three years from date of filing, while the state returns may remain open for an additional year depending upon jurisdiction. SSGA FM has analyzed the Funds’ tax positions and does not believe there are any uncertain tax positions that would require recognition of a tax liability.
Distributions to shareholders are recorded onex-dividend date. Income dividends and gain distributions are determined in accordance with income tax rules and regulations, which may differ from generally accepted accounting principles. Certain capital accounts in the financial statements have been adjusted for permanentbook-tax differences. These adjustments have no
| | | | |
| Notes to Financial Statements | | | 111 | |
Elfun Funds
Notes to Financial Statements, continued — December 31, 2018
impact on net asset values or results of operations. Temporarybook-tax differences will reverse in the future. These book tax differences are primarily due to differing treatments for character of distributions, foreign currency gains and losses, corporate actions, paydown losses, futures contracts, swap contracts, straddle loss deferrals, capital gain taxes, expiring limited capital loss carryforwards, return of capital adjustments, and wash sale loss deferrals.
The tax character of distributions paid during the fiscal year ended December 31, 2018, were as follows:
| | | | | | | | | | | | | | | | | | | | |
| Fund | | Exempt
Income | | | Ordinary
Income | | | Long-Term
Capital Gains | | | Return of
Capital | | | Total | |
| | | | | | | | | | | | | | | | | | | | |
Elfun International Equity Fund | | $ | — | | | $ | 4,494,291 | | | $ | — | | | $ | — | | | $ | 4,494,291 | |
Elfun Trusts | | | — | | | | 39,509,239 | | | | 307,096,650 | | | | — | | | | 346,605,889 | |
Elfun Diversified Fund | | | — | | | | 4,584,578 | | | | 1,141,933 | | | | — | | | | 5,726,511 | |
ElfunTax-Exempt Income Fund | | | 56,871,069 | | | | 576,506 | | | | — | | | | — | | | | 57,447,575 | |
Elfun Income Fund | | | — | | | | 7,065,178 | | | | — | | | | — | | | | 7,065,178 | |
Elfun Government Money Market Fund | | | — | | | | 1,556,972 | | | | — | | | | — | | | | 1,556,972 | |
The tax character of distributions paid during the fiscal year ended December 31, 2017, were as follows:
| | | | | | | | | | | | | | | | | | | | |
| Fund | | Exempt
Income | | | Ordinary
Income | | | Long-Term
Capital Gains | | | Return of
Capital | | | Total | |
| | | | | | | | | | | | | | | | | | | | |
Elfun International Equity Fund | | $ | — | | | $ | 3,655,776 | | | $ | — | | | $ | — | | | $ | 3,655,776 | |
Elfun Trusts | | | — | | | | 37,831,065 | | | | 234,370,147 | | | | — | | | | 272,201,212 | |
Elfun Diversified Fund | | | — | | | | 9,605,789 | | | | 11,532,176 | | | | — | | | | 21,137,965 | |
ElfunTax-Exempt Income Fund | | | 59,020,190 | | | | 616,395 | | | | — | | | | — | | | | 59,636,585 | |
Elfun Income Fund | | | — | | | | 6,577,379 | | | | — | | | | — | | | | 6,577,379 | |
Elfun Government Money Market Fund | | | — | | | | 614,831 | | | | — | | | | — | | | | 614,831 | |
At December 31, 2018, the components of distributable earnings on a tax basis were as follows:
| | | | | | | | | | | | | | | | | | | | | | | | | | | | |
| | | Undistributed
Ordinary
Income | | | Tax Exempt
Income | | | Capital Loss
Carryforwards | | | Undistributed
long term
gain | | | Net
Unrealized
Gains (Losses) | | | Qualified
Late-Year
Losses | | | Total | |
| | | | | | | | | | | | | | | | | | | | | | | | | | | | |
Elfun International Equity Fund | | $ | — | | | $ | — | | | $ | (6,473,390 | ) | | $ | — | | | $ | 3,649,384 | | | $ | — | | | $ | (2,824,006 | ) |
Elfun Trusts | | | 292,403 | | | | — | | | | — | | | | 3,500 | | | | 769,983,865 | | | | — | | | | 770,279,768 | |
Elfun Diversified Fund | | | 116,687 | | | | — | | | | — | | | | 132,129 | | | | 1,110,460 | | | | — | | | | 1,359,276 | |
ElfunTax-Exempt Income Fund | | | — | | | | 62,812 | | | | (18,541,140 | ) | | | — | | | | 22,027,940 | | | | — | | | | 3,549,612 | |
Elfun Income Fund | | | 192,243 | | | | — | | | | (5,748,567 | ) | | | — | | | | (2,673,386 | ) | | | — | | | | (8,229,710 | ) |
Elfun Government Money Market Fund | | | — | | | | — | | | | (3 | ) | | | — | | | | — | | | | — | | | | (3 | ) |
As of December 31, 2018, the Funds had capital loss carryforwards available to offset future realized capital gains through the indicated expiration dates as follows:
| | | | | | | | |
| Fund | | Non-Expiring Short Term | | | Non-Expiring Long Term | |
| | | | | | | | |
Elfun International Equity Fund | | $ | 2,938,410 | | | $ | 3,534,980 | |
ElfunTax-Exempt Income Fund | | | 17,433,355 | | | | 1,107,785 | |
Elfun Income Fund | | | 1,523,441 | | | | 4,225,126 | |
Elfun Government Money Market Fund | | | 3 | | | | — | |
| | |
| 112 | | Notes to Financial Statements |
Elfun Funds
Notes to Financial Statements, continued — December 31, 2018
As of December 31, 2018, gross unrealized appreciation and gross unrealized depreciation of investments and other financial instruments based on cost for federal income tax purposes were as follows:
| | | | | | | | | | | | | | | | |
| | | Tax
Cost | | | Gross
Unrealized
Appreciation | | | Gross
Unrealized
Depreciation | | | Net
Unrealized
Appreciation
(Depreciation) | |
| | | | | | | | | | | | | | | | |
Elfun International Equity Fund | | $ | 180,580,917 | | | $ | 21,719,113 | | | $ | 18,060,577 | | | $ | 3,658,536 | |
Elfun Trusts | | | 1,655,358,516 | | | | 917,309,918 | | | | 147,326,053 | | | | 769,983,865 | |
Elfun Diversified Fund | | | 191,152,480 | | | | 10,644,631 | | | | 9,540,577 | | | | 1,104,054 | |
ElfunTax-Exempt Income Fund | | | 1,341,547,530 | | | | 32,177,664 | | | | 10,149,723 | | | | 22,027,941 | |
Elfun Income Fund | | | 267,060,455 | | | | 3,104,376 | | | | 5,274,681 | | | | (2,170,305 | ) |
Elfun Government Money Market Fund | | | 104,813,151 | | | | — | | | | — | | | | — | |
The Funds (excluding the Elfun Governemnt Money Market Fund) and other affiliated funds (each, a “Participant” and collectively, the “Participants”) participate in a $500 million revolving credit facility provided by a syndication of banks under which the Participants may borrow to fund shareholder redemptions. This agreement expires October 10, 2019 unless extended or renewed.
The Participants are charged an annual commitment fee which is calculated based on the unused portion of the shared credit line. Commitment fees are allocated among each of the Participants based on relative net assets. Commitment fees are ordinary fund operation expenses. A Participant incurs and pays the interest expense related to its borrowing. Interest is calculated at a rate per annum equal to the sum of 1% plus the greater of the New York Fed Bank Rate and1-month LIBOR rate.
The Funds had no outstanding loans as of December 31, 2018.
Concentration Risk As a result of a Fund’s ability to invest a large percentage of its assets in obligations of issuers within the same country, state, region, currency or economic sector, an adverse economic, business or political development may affect the value of a Fund’s investments more than if a Fund was more broadly diversified.
Interest Rate Risk Is the risk that fixed income securities will decline in value because of changes in interest rates. Bond prices generally rise when interest rates decline and generally decline when interest rates rise. Although governmental financial regulators, including the U.S. Federal Reserve, have taken steps to maintain historically low interest rates, the U.S. Federal Reserve has recently begun to raise interest rates and may continue to do so. Thus, a Fund currently faces a heightened level of interest rate risk.
Foreign and Emerging Markets Risk Investing in foreign markets involves risks and considerations not typically associated with investing in the U.S. Foreign securities may be subject to risk of loss because of government regulation, economic, political and social instability in the countries in which a Fund invests. Foreign markets may be less liquid than investments in the U.S. and may be subject to the risks of currency fluctuations. To the extent that a Fund invests in securities of issuers located in emerging markets, these risks may be even more pronounced.
Market and Credit Risk In the normal course of business, a Fund trades financial instruments and enters into financial transactions where risk of potential loss exists due to changes in the general economic conditions and fluctuations of the market (market risk). Additionally, a Fund may also be exposed to credit risk in the event that an issuer or guarantor fails to perform or that an institution or entity with which a Fund has unsettled or open transactions defaults.
| 11. | | New and Recent Accounting Pronouncements |
In August 2018, the U.S. Securities and Exchange Commission (the “SEC”) released its Final Rule on Disclosure Update and Simplification (the “Final Rule”) which is intended to simplify an issuer’s disclosure compliance efforts by removing redundant or outdated disclosure requirements without significantly altering the mix of information provided to investors. The
| | | | |
| Notes to Financial Statements | | | 113 | |
Elfun Funds
Notes to Financial Statements, continued — December 31, 2018
Funds have adopted the Final Rule for the current period with the most notable impacts being that the Funds are no longer required to present components of distributable earnings on the Statements of Assets and Liabilities or the sources of distributions to shareholders and the amount of undistributed net investment income on the Statements of Changes in Net Assets.
In March 2017, the Financial Accounting Standards Board issued Accounting Standards Update (“ASU”)No. 2017-08, Receivables — Nonrefundable Fees and Other Costs (Subtopic310-20): Premium Amortization on Purchased Callable Debt Securities. The amendments in the ASU shorten the amortization period for certain callable debt securities, held at a premium, to be amortized to the earliest call date. The ASU does not require an accounting change for securities held at a discount; which continues to be amortized to maturity. The ASU is effective for fiscal years and interim periods within those fiscal years beginning after December 15, 2018. Management is currently evaluating the impact, if any, of applying this provision.
Management has evaluated the impact of all subsequent events on the Funds through the date on which the financial statements were available to be issued and has determined that there were no subsequent events requiring adjustment or disclosure in the financial statements.
| | |
| 114 | | Notes to Financial Statements |
Elfun Funds
Report of Independent Registered Public Accounting Firm
To the Shareholders and Board of Trustees of Elfun International Equity Fund, Elfun Trusts, Elfun Diversified Fund, Elfun Tax-Exempt Income Fund, Elfun Income Fund, and Elfun Government Money Market Fund
Opinion on the Financial Statements
We have audited the accompanying statements of assets and liabilities of Elfun International Equity Fund, Elfun Trusts, Elfun Diversified Fund, Elfun Tax-Exempt Income Fund, Elfun Income Fund and Elfun Government Money Market Fund (collectively referred to as the “Funds”), including the schedules of investments, as of December 31, 2018, and the related statements of operations for the year then ended, the statements of changes in net assets for each of the two years in the period then ended, the financial highlights for each of the three years in the period then ended and the related notes (collectively referred to as the “financial statements”). The financial highlights for the two years in the period then ended December 31, 2015 were audited by another independent registered public accounting firm whose report, dated February 24, 2016, expressed an unqualified opinion on those financial highlights. In our opinion, the financial statements present fairly, in all material respects, the financial position of the Funds at December 31, 2018, the results of their operations for the year then ended, the changes in their net assets for each of the two years in the period then ended and their financial highlights for each of the three years in the period then ended, in conformity with U.S. generally accepted accounting principles.
Basis for Opinion
These financial statements are the responsibility of the Funds’ management. Our responsibility is to express an opinion on the Funds’ financial statements based on our audits. We are a public accounting firm registered with the Public Company Accounting Oversight Board (United States) (“PCAOB”) and are required to be independent with respect to the Funds in accordance with the U.S. federal securities laws and the applicable rules and regulations of the Securities and Exchange Commission and the PCAOB.
We conducted our audits in accordance with the standards of the PCAOB. Those standards require that we plan and perform the audit to obtain reasonable assurance about whether the financial statements are free of material misstatement, whether due to error or fraud. The Funds are not required to have, nor were we engaged to perform, an audit of the Funds’ internal control over financial reporting. As part of our audits we are required to obtain an understanding of internal control over financial reporting, but not for the purpose of expressing an opinion on the effectiveness of the Funds’ internal control over financial reporting. Accordingly, we express no such opinion.
Our audits included performing procedures to assess the risks of material misstatement of the financial statements, whether due to error or fraud, and performing procedures that respond to those risks. Such procedures included examining, on a test basis, evidence regarding the amounts and disclosures in the financial statements. Our procedures included confirmation of securities owned as of December 31, 2018, by correspondence with the custodian, brokers and others or by other appropriate auditing procedures where replies from brokers and others were not received. Our audits also included evaluating the accounting principles used and significant estimates made by management, as well as evaluating the overall presentation of the financial statements. We believe that our audits provide a reasonable basis for our opinion.

We have served as the auditor of one or more State Street Global Advisors investment companies since 2000.
Boston, Massachusetts
February 27, 2019
| | | | |
| Report of Independent Registered Public Accounting Firm | | | 115 | |
Elfun Funds
Tax Information — December 31, 2018 (Unaudited)
Tax Information
For federal income tax purposes, the following information is furnished with respect to the distributions of the Funds for their fiscal year ended December 31, 2018.
Dividends Received Deduction
The Funds report the maximum amount allowable of their net taxable income as eligible for the corporate dividends received deduction.
Qualified Dividend Income
A portion of dividends distributed by the Funds during the fiscal year ended December 31, 2018 is considered qualified dividend income and is eligible for reduced tax rates. These lower rates range from 5% to 20% depending on the individual’s tax bracket. The Funds report the maximum amount allowable of their net taxable income as qualified dividend income as provided in the Jobs and Growth Tax Relief Reconciliation Act of 2003.
Long Term Capital Gains Distributions
Long term capital gains dividends were paid from the following Funds during the year ended December 31, 2018:
| | | | |
| | | Amount | |
Elfun Trusts | | $ | 307,096,650 | |
Elfun Diversified Fund | | | 1,141,933 | |
Foreign Tax Credit
The Fund has made an election under Internal Revenue Code Section 853 to pass through foreign taxes paid by the Fund to its shareholders. For the year ended December 31, 2018, the total amount of foreign taxes that will be passed through are:
| | | | |
| | | Amount | |
Elfun International Equity Fund | | $ | 608,986 | |
The amount of foreign source income earned on the Fund during the year ended December 31, 2018 was as follows:
| | | | |
| | | Amount | |
Elfun International Equity Fund | | $ | 5,727,124 | |
Tax-Exempt Income
For the fiscal year ended December 31, 2018, the following Fund hereby designates as exempt-interest dividends the amounts set forth, or the amount ultimately treated as exempt-interest dividends:
| | | | |
| | | Gross Amount | |
Elfun Tax-Exempt Income Fund | | $ | 56,871,069 | |
Elfun Funds
Special Meeting of Shareholders — Voting Results (Unaudited)
A special meeting of shareholders of the Elfun Government Money Market Fund (the “Money Market Fund”), ElfunTax-Exempt Income Fund (the“Tax-Exempt Fund”), Elfun Income Fund (the “Income Fund”), Elfun Diversified Fund (the “Diversified Fund”), Elfun International Equity Fund (the “International Fund”) and Elfun Trusts (each, a “Fund” and collectively, the “Funds”) was held on December 18, 2018 to elect the following six nominees as Trustees of Elfun Diversified Fund, Elfun Government Money Market Fund, Elfun Income Fund, Elfun International Equity Fund, ElfunTax-Exempt Income Fund and Elfun Trusts: John R. Costantino, Michael F. Holland, Michael A. Jessee, Ellen M. Needham, Donna M. Rapaccioli, and Richard D. Shirk. At the meeting the following votes were recorded:
| | | | | | | | |
| Money Market Fund | |
| Nominee | | Shares For | | | Shares Withheld | |
John R. Costantino | | | 47,149,525.853 | | | | 17,055,612.338 | |
Michael F. Holland | | | 47,006,646.265 | | | | 17,198,491.926 | |
Michael A. Jessee | | | 46,923,066.949 | | | | 17,282,071.242 | |
Ellen M. Needham | | | 47,114,146.645 | | | | 17,090,991.546 | |
Donna M. Rapaccioli | | | 47,370,538.247 | | | | 16,834,599.944 | |
Richard D. Shirk | | | 47,125,139.270 | | | | 17,079,998.921 | |
|
| Tax-Exempt Fund | |
| Nominee | | Shares For | | | Shares Withheld | |
John R. Costantino | | | 66,391,989.123 | | | | 7,220,765.650 | |
Michael F. Holland | | | 66,278,607.963 | | | | 7,334,146.810 | |
Michael A. Jessee | | | 66,400,117.922 | | | | 7,212,636.851 | |
Ellen M. Needham | | | 66,358,656.197 | | | | 7,254,098.576 | |
Donna M. Rapaccioli | | | 66,442,714.470 | | | | 7,170,040.303 | |
Richard D. Shirk | | | 66,392,779.147 | | | | 7,219,975.626 | |
|
| Income Fund | |
| Nominee | | Shares For | | | Shares Withheld | |
John R. Costantino | | | 15,567,769.268 | | | | 311,142.089 | |
Michael F. Holland | | | 15,473,849.329 | | | | 405,062.028 | |
Michael A. Jessee | | | 15,532,330.843 | | | | 346,580.514 | |
Ellen M. Needham | | | 15,598,124.981 | | | | 280,786.376 | |
Donna M. Rapaccioli | | | 15,595,583.685 | | | | 283,327.672 | |
Richard D. Shirk | | | 15,522,164.856 | | | | 356,746.501 | |
|
| Diversified Fund | |
| Nominee | | Shares For | | | Shares Withheld | |
John R. Costantino | | | 6,668,735.526 | | | | 428,268.434 | |
Michael F. Holland | | | 6,667,207.742 | | | | 429,796.218 | |
Michael A. Jessee | | | 6,669,141.105 | | | | 427,862.855 | |
Ellen M. Needham | | | 6,670,834.436 | | | | 426,169.524 | |
Donna M. Rapaccioli | | | 6,672,850.897 | | | | 424,153.063 | |
Richard D. Shirk | | | 6,671,748.161 | | | | 425,255.799 | |
|
| International Fund | |
| Nominee | | Shares For | | | Shares Withheld | |
John R. Costantino | | | 4,521,868.575 | | | | 2,147,261.528 | |
Michael F. Holland | | | 4,503,770.701 | | | | 2,165,359.402 | |
Michael A. Jessee | | | 4,507,921.371 | | | | 2,161,208.732 | |
Ellen M. Needham | | | 4,511,271.008 | | | | 2,157,859.095 | |
Donna M. Rapaccioli | | | 4,534,723.662 | | | | 2,134,406.441 | |
Richard D. Shirk | | | 4,523,025.199 | | | | 2,146,104.904 | |
| | | | |
| Special Meeting of Shareholders — Voting Results | | | 117 | |
Elfun Funds
Special Meeting of Shareholders — Voting Results (Unaudited), continued
| | | | | | | | |
| Elfun Trusts | |
| Nominee | | Shares For | | | Shares Withheld | |
John R. Costantino | | | 21,250,737.196 | | | | 424,934.592 | |
Michael F. Holland | | | 21,024,696.644 | | | | 650,975.144 | |
Michael A. Jessee | | | 21,285,604.305 | | | | 390,067.483 | |
Ellen M. Needham | | | 21,357,309.327 | | | | 318,362.461 | |
Donna M. Rapaccioli | | | 21,323,470.816 | | | | 352,200.972 | |
Richard D. Shirk | | | 21,306,733.110 | | | | 368,938.678 | |
The other Trustees whose term of office continued after the meeting are as follows: Jeanne M. La Porta, Patrick J. Riley and Rina K. Spence.
| | |
| 118 | | Special Meeting of Shareholders — Voting Results |
Elfun Funds
Other Information (Unaudited)
Trustees and Officers
| | | | | | | | | | | | |
| | | | | | |
Name,
Address, and Year of Birth | | Position(s) Held
with Fund | | Term of
Office and
Length of
Time Served | | Principal Occupation
During Past Five Years and
Relevant Experience | | Number of
Funds
in Fund
Complex
Overseen
by Trustee† | | | Other Directorships
Held by Trustee
During Past Five Years |
INDEPENDENT TRUSTEES |
Michael F. Holland c/o SSGA Funds Management, Inc. One Iron Street Boston, MA 02210 YOB: 1944 | | Trustee and Co-Chairperson of the Board | | Term: Indefinite Elected: 12/18 | | Chairman, Holland & Company L.L.C. (investment adviser) (1995 – present). | | | 67 | | | Director, the Holland Series Fund, Inc.; Director, The China Fund, Inc.; Director, The Taiwan Fund, Inc. (2007 – 2017); Director, Reaves Utility Income Fund, Inc.; and Director, Blackstone/GSO Loans (and Real Estate) Funds. |
| | | | | | | | | | | | | |
Patrick J. Riley c/o SSGA Funds Management, Inc. One Iron Street Boston, MA 02210 YOB: 1948 | | Trustee and Co-Chairperson of the Board | | Term: Indefinite Appointed: 4/16 | | 2002 to May 2010, Associate Justice of the Superior Court, Commonwealth of Massachusetts; 1985 to 2002, Partner, Riley, Burke & Donahue, L.L.P. (law firm); 1998 to Present, Independent Director, State Street Global Advisers Ireland, Ltd. (investment company); 1998 to Present, Independent Director, SSGA Liquidity plc (formerly, SSGA Cash Management Fund plc); January 2009 to Present, Independent Director, SSGA Fixed Income plc; and January 2009 to Present, Independent Director, SSGA Qualified Funds PLC. | | | 67 | | | Board Director and Chairman, SPDR Europe 1PLC Board (2011 – Present); Board Director and Chairman, SPDR Europe II, PLC (2013 – Present). |
| | | | | | | | | | | | | |
John R. Costantino c/o SSGA Funds Management, Inc. One Iron Street Boston, MA 02210 YOB: 1946 | | Trustee and Co-Chairperson of the Qualified Legal and Compliance Committee | | Term: Indefinite Elected: 12/18 | | Managing General Partner, NGN Capital LLC (2006 – present); and Managing Director, Vice President of Walden Capital Management (1996 – present). | | | 67 | | | Director of Kleinfeld Bridal Corp. (March 2016 – present);Trustee of Neuroscience Research Institute (1986 – present); Trustee of Fordham University (1989 – 1995 and 2001 – 2007) and Trustee Emeritus (2007 – present); Trustee of GE Funds (1993 – February 2011); Director of Artes Medical (2006 – 2008); and Trustee of Gregorian University Foundation (1992 – 2007). |
| | | | | | | | | | | | | |
Donna M. Rapaccioli c/o SSGA Funds Management, Inc. One Iron Street Boston, MA 02210 YOB: 1962 | | Trustee and Co-Chairperson of the Audit Committee | | Term: Indefinite Elected: 12/18 | | Dean of the Gabelli School of Business (2007 – present) and Accounting Professor (1987 – present) at Fordham University. | | | 67 | | | Director- Graduate Management Admissions Council (2015 – present); Trustee of Emmanuel College (2010 – present). |
Elfun Funds
Other Information (Unaudited), continued
| | | | | | | | | | | | |
| | | | | | |
Name,
Address, and Year of Birth | | Position(s) Held
with Fund | | Term of
Office and
Length of
Time Served | | Principal Occupation
During Past Five Years and
Relevant Experience | | Number of
Funds
in Fund
Complex
Overseen
by Trustee† | | | Other Directorships
Held by Trustee
During Past Five Years |
INDEPENDENT TRUSTEES (continued) |
Richard D. Shirk c/o SSGA Funds Management, Inc. One Iron Street Boston, MA 02210 YOB: 1945 | | Trustee andCo-Chairperson of the Qualified Legal and Compliance Committee | | Term: Indefinite Elected: 12/18 | | March 2001 to April 2002, Chairman (1996 to March 2001, President and Chief Executive Officer), Cerulean Companies, Inc. (holding company) (Retired); 1992 to March 2001, President and Chief Executive Officer, Blue Cross Blue Shield of Georgia (health insurer, managed healthcare). | | | 67 | | | 1998 to December 2008, Chairman, Board Member and December 2008 to Present, Investment Committee Member, Healthcare Georgia Foundation (private foundation); September 2002 to 2012, Lead Director and Board Member, Amerigroup Corp. (managed health care); 1999 to 2013, Board Member and (since 2001) Investment Committee Member, Woodruff Arts Center; and 2003 to 2009, Trustee, Gettysburg College; Board member, Aerocare Holdings, Regenesis Biomedical Inc. |
| | | | | | | | | | | | | |
Rina K. Spence c/o SSGA Funds Management, Inc. One Iron Street Boston, MA 02210 YOB: 1948 | | Trustee andCo-Chairperson of the Audit Committee, Chairperson of the Nominating Committee and Chairperson of the Governance Committee | | Term: Indefinite Elected: 6/16 | | President of SpenceCare International LLC (international healthcare consulting) (1999 – present); Chief Executive Officer, IEmily.com (health internet company) (2000 – 2001); Chief Executive Officer of Consensus Pharmaceutical, Inc. (1998 – 1999); Founder, President and Chief Executive Officer of Spence Center for Women’s Health (1994 – 1998); President and CEO, Emerson Hospital (1984 – 1994); Honorary Consul for Monaco in Boston (2015 – present). | | | 67 | | | None |
| | | | | | | | | | | | | |
Michael A. Jessee c/o SSGA Funds Management, Inc. One Iron Street Boston, MA 02210 YOB: 1946 | | Trustee andCo-Chairperson of the Valuation Committee | | Term: Indefinite Elected: 12/18 | | Retired; formerly, President and Chief Executive Officer of the Federal Home Loan Bank of Boston (1989 – 2009); Trustee, Randolph-Macon College (2004 – 2016). | | | 67 | | | None |
Elfun Funds
Other Information (Unaudited), continued
| | | | | | | | | | | | |
| | | | | | |
Name,
Address, and Year of Birth | | Position(s) Held
with Fund | | Term of
Office and
Length of
Time Served | | Principal Occupation
During Past Five Years and
Relevant Experience | | Number of
Funds
in Fund
Complex
Overseen
by Trustee† | | | Other Directorships
Held by Trustee
During Past Five Years |
INTERESTED TRUSTEES(1) |
Ellen M. Needham(2) SSGA Funds Management, Inc. One Iron Street Boston, MA 02210 YOB: 1967 | | Trustee and President | | Time Indefinite Elected: 12/18 | | President and Director, SSGA FM (2001 – present)*; Senior Managing Director, State Street Global Advisors (1992 – present)*; Director, State Street Global Advisors Funds Distributors, LLC (May 2017 – present).* | | | 67 | | | None |
| | | | | | | | | | | | | |
Jeanne M. La Porta(3) SSGA Funds Management, Inc. 1600 Summer St. Stamford, CT 06905 YOB: 1965 | | Trustee | | Time Indefinite Appointed: 3/14 | | Senior Managing Director at State Street Global Advisors (July 2016 – present); Director of State Street Global Advisors Funds Distributors, LLC (May 2017 – present); President of GE Retirement Savings Plan Funds (July 2016 – present); Senior Vice President and Commercial Operations Leader at GE Asset Management Incorporated (“GEAM”) (March 2014 – July 2016); President of State Street Institutional Funds and State Street Variable Insurance Series Funds, Inc. (April 2014 – present); President and Trustee. | | | 18 | | | None |
| (1) | | The individuals listed below are Trustees who are “interested persons,” as defined in the 1940 Act, of the Funds (“Interested Trustees”). |
| (2) | | Ms. Needham is an Interested Trustee because of her employment by SSGA Funds Management, Inc., an affiliate of the Funds. |
| (3) | | Ms. La Porta is an Interested Trustee because of her employment by SSGA Funds Management, Inc., an affiliate of the Funds. |
| * | | Served in various capacities and/or with various affiliated entities during noted time period |
| † | | For the purpose of determining the number of portfolios overseen by the Trustees, “Fund Complex” comprises registered investment companies for which SSGA FM serves as investment adviser. |
The following lists the principal officers for the Funds, as well as their mailing addresses and ages, positions with the Funds and length of time served, and present and principal occupations:
| | | | | | |
| | | | |
Name,
Address,
and Year
of Birth | | Position(s) Held with Fund | | Term of Office and
Length of Time Served | | Principal Occupation
During Past Five Years |
OFFICERS: |
Ellen M. Needham(3) SSGA Funds Management, Inc. One Iron Street Boston, MA 02210 YOB: 1967 | | President, Trustee | | Term: Indefinite Elected: 7/16 | | President and Director, SSGA FM (2001 – present)*; Senior Managing Director, State Street Global Advisors (1992 – present)*; Director, State Street Global Advisors Funds Distributors, LLC (May 2017 – present).* |
| | | | | | | |
Brian Harris SSGA Funds Management, Inc. One Iron Street Boston, MA 02210 YOB: 1973 | | Chief Compliance Officer,Anti-Money Laundering Officer and Code of Ethics Compliance Officer | | Term: Indefinite Elected: 7/16 | | Managing Director, State Street Global Advisors and SSGA Funds Management, Inc. (2013 – Present); Senior Vice President and Global Head of Investment Compliance, BofA Global Capital Management (September 2010 – May 2013). |
Elfun Funds
Other Information (Unaudited), continued
| | | | | | |
| | | | |
Name,
Address,
and Year
of Birth | | Position(s) Held with Fund | | Term of Office and
Length of Time Served | | Principal Occupation
During Past Five Years |
OFFICERS (continued): |
Joshua A. Weinberg SSGA Funds Management, Inc. One Iron Street Boston, MA 02210 YOB: 1978 | | Chief Legal Officer | | Term: Indefinite Elected: 7/16 | | Managing Director and Managing Counsel, State Street Global Advisors (2011 – present)*; Clerk, SSGA Funds Management, Inc. (2013 – present); Associate, Financial Services Group, Dechert LLP (2005 – 2011). |
| | | | | | | |
Bruce S. Rosenberg SSGA Funds Management, Inc. One Iron Street Boston, MA 02210 YOB: 1961 | | Treasurer | | Term: Indefinite Elected: 7/16 | | Managing Director, State Street Global Advisors and SSGA Funds Management, Inc. (July 2015 – present); Director, Credit Suisse (April 2008 – July 2015). |
| | | | | | | |
Ann M. Carpenter SSGA Funds Management, Inc. One Iron Street Boston, MA 02210 YOB: 1966 | | Vice President and Deputy Treasurer | | Term: Indefinite Elected: 7/16 | | Chief Operating Officer, SSGA Funds Management, Inc. (April 2005 – present)*; Managing Director, State Street Global Advisors. (2005 – present).* |
| | | | | | | |
Chad C. Hallett SSGA Funds Management, Inc. One Iron Street Boston, MA 02210 YOB: 1969 | | Deputy Treasurer | | Term: Indefinite Elected: 7/16 | | Vice President, State Street Global Advisors and SSGA Funds Management, Inc. (November 2014 – present); Vice President, State Street Bank and Trust Company (2001 – November 2014).* |
| | | | | | | |
Arthur A. Jensen SSGA Funds Management, Inc. 1600 Summer Street Stamford, CT 06905 YOB: 1966 | | Deputy Treasurer | | Term: Indefinite Elected: 7/16 | | Vice President, State Street Global Advisors and SSGA Funds Management, Inc. (July 2016 – present); Deputy Treasurer of Elfun Funds (July 2016 – present); Treasurer of State Street Institutional Funds, State Street Variable Insurance Series Funds, Inc. and GE Retirement Savings Plan Funds (June 2011 – present); Treasurer of Elfun Funds (June 2011– July 2016); Mutual Funds Controller of GE Asset Management Incorporated (April 2011 – July 2016). |
| | | | | | | |
Darlene Anderson-Vasquez SSGA Funds Management, Inc. One Iron Street Boston, MA 02210 YOB: 1968 | | Deputy Treasurer | | Term: Indefinite Elected: 11/16 | | Managing Director, State Street Global Advisors and SSGA Funds Management, Inc. (May 2016 – present); Senior Vice President, John Hancock Investments (September 2007 – May 2016). |
| | | | | | | |
Sujata Upreti SSGA Funds Management, Inc. One Iron Street Boston, MA 02210 YOB: 1974 | | Assistant Treasurer | | Term: Indefinite Elected: 3/16 | | Vice President, State Street Global Advisors and SSGA Funds Management, Inc. (May 2015 – present); Assistant Director, Cambridge Associates, LLC (July 2014 – January 2015); Vice President, Bank of New York Mellon (July 2012 – August 2013); Manager, PricewaterhouseCoopers, LLP (September 2003 – July 2012). |
| | | | | | | |
Daniel Foley SSGA Funds Management, Inc. One Iron Street Boston, MA 02210 YOB: 1972 | | Assistant Treasurer | | Term: Indefinite Elected: 3/16 | | Vice President, State Street Global Advisors and SSGA Funds Management, Inc. (April 2007 – present).* |
Elfun Funds
Other Information (Unaudited), continued
| | | | | | |
| | | | |
Name,
Address,
and Year
of Birth | | Position(s) Held with Fund | | Term of Office and
Length of Time Served | | Principal Occupation
During Past Five Years |
OFFICERS (continued): |
Daniel G. Plourde SSGA Funds Management, Inc. One Iron Street Boston, MA 02210 YOB: 1980 | | Assistant Treasurer | | Term: Indefinite Elected: 5/17 | | Vice President, State Street Global Advisors and SSGA Funds Management, Inc. (May 2015 – present); Officer, State Street Bank and Trust Company (March 2009 – May 2015). |
| | | | | | | |
Jesse D. Hallee State Street Bank and Trust Company 100 Summer Street, 7th Floor Boston, MA 02111-2900 YOB: 1976 | | Secretary | | Term: Indefinite Elected: 9/16 | | Vice President and Managing Counsel, State Street Bank and Trust Company (2013 – present); Vice President and Counsel, Brown Brothers Harriman & Co. (2007 – 2013). |
| | | | | | | |
Khimmara Greer State Street Bank and Trust Company 100 Summer Street, 7th Floor Boston, MA02111-2900 YOB: 1983 | | Assistant Secretary | | Term: Indefinite Elected: 11/16 | | Vice President and Counsel, State Street Bank and Trust Company (2015 – present); Regulatory Advisor, JPMorgan (2014 – 2015); Claims Case Manager, Liberty Mutual Insurance (2012 – 2014); Contract Attorney, Various Law Firms (2011 – 2012). |
| * | | Served in various capacities and/or with various affiliated entities during noted time period. |
Elfun Funds
Other Information (Unaudited)
Proxy Voting Policies and Procedures and Record
The Funds have adopted the proxy voting policies of SSGA FM. A description of the policies and procedures that the Funds have adopted to determine how to vote proxies relating to portfolio securities is available (i) without charge, upon request, by calling1-800-242-0134, (ii) on the Funds’ website at http://www.ssga.com/geam, and (iii) on the SEC’s website at www.sec.gov. Information regarding how the Funds voted proxies, if any, during the most recent12-month period ended June 30 is available by August 31 of each year without charge (1) by calling1-800-242-0134 (toll free), and (2) on the website of the SEC at www.sec.gov.
Quarterly Portfolio Schedule
The Funds file their complete schedules of investments with the SEC for the first and third quarters of each fiscal year on FormN-Q. For the second and fourth quarters, the complete schedules of investments are available in the Funds’ semi-annual and annual financial statements. The Funds’ FormsN-Q are available (i) without charge, upon request, by calling1-800-242-013, (ii) on the Funds’ website at http://www.ssga.com/geam, and (iii) on the SEC’s website at www.sec.gov.
Elfun Funds
Shareholder Services
Online Service
Your Elfun Mutual Fund accounts can now be accessed on the Internet atwww.ssga.com/geam
Here are some of the online services:
| • | | View account balance and transaction history |
| • | | View and order tax forms |
| • | | View quarterly statements |
| • | | Re-order money market checks |
Telephone Service
Our Shareholder Service Associates are available Monday to Friday from 9:00 AM to 8:00 PM Eastern Standard Time. Call toll-free, 1-800-242-0134, for assistance.
Automated Voice Response System
You can also access your account anytime during the day, 7 days a week by dialing 1-800-242-0134. Simply follow the menu to obtain information or make certain transactions.
Contact Us By Mail
If you’d like to write to us, address your inquiries regarding your account(s) to:
Elfun Mutual Funds
c/o U.S. Bancorp Fund Services, LLC
P.O. Box 701
Milwaukee, WI 53201-0701
Trustees
Michael F. Holland,Co-Chairperson
Patrick J. Riley,Co-Chairperson
John R. Costantino
Donna M. Rapaccioli
Richard D. Shirk
Rina K. Spence
Michael A. Jessee
Ellen M. Needham
Jeanne M. La Porta
Officers
Ellen M. Needham, President
Brian Harris, Chief Compliance Officer, Anti-Money Laundering Officer and Code of Ethics Compliance Officer
Joshua A. Weinberg, Chief Legal Officer
Bruce S. Rosenberg, Treasurer
Ann M. Carpenter, Vice President and Deputy Treasurer
Chad C. Hallett, Deputy Treasurer
Arthur A. Jensen, Deputy Treasurer
Darlene Anderson-Vasquez, Deputy Treasurer
Sujata Upreti, Assistant Treasurer
Daniel Foley, Assistant Treasurer
Daniel G. Plourde, Assistant Treasurer
Jesse Hallee, Secretary
Khimmara Greer, Assistant Secretary
Investment Adviser and Administrator
SSGA Funds Management, Inc.
One Iron Street
Boston, Massachusetts 02210
Custodian andSub-Administrator
State Street Bank and Trust Company
One Lincoln Street
Boston, Massachusetts 02111
Distributor
State Street Global Advisors Funds Distributors, LLC
One Iron Street
Boston, Massachusetts 02210
Independent Registered Public Accounting Firm
Ernst & Young LLP
200 Clarendon Street
Boston, Massachusetts 02116
Item 2. Code of Ethics.
As of the end of the period covered by this report, the Elfun Trusts (the “Fund,” “Fund Entity” or “Registrant”) has adopted a code of ethics, as defined in Item 2(b) of FormN-CSR, that applies to the Registrant’s principal executive officer, principal financial officer, principal accounting officer or controller, or persons performing similar functions, regardless of whether these individuals are employed by the Registrant or a third party (the “Code”). That Code comprises written standards that are reasonably designed to deter wrongdoing and to promote: (1) honest and ethical conduct, including the ethical handling of actual or apparent conflicts of interest between personal and professional relationships; (2) full, fair, accurate, timely and understandable disclosure in reports and documents that the Registrant files with, or submits to, the U.S. Securities Exchange Commission (the “SEC”) and in other public communications made by the Registrant; (3) compliance with applicable laws and governmental rules and regulations; (4) the prompt internal reporting to an appropriate person or persons identified in the Code of violations of the Code; and (5) accountability for adherence to the Code. The Code is combined with other mutual funds advised by SSGA Funds Management, Inc. (“SSGA FM” or the “Adviser”). The Registrant has not made any amendments to the Code that relates to any element of the code of ethics definition set forth in Item 2(b) of FormN-CSR during the covered period. The Registrant has not granted any waivers from any provisions of the Code during the covered period. A copy of the Code is filed as Exhibit 13(a)(1) to this FormN-CSR.
Item 3. Audit Committee Financial Expert.
The Fund’s Board of Trustees (the “Board”) has determined that the Fund has the following “audit committee financial experts” as defined in Item 3(b) of FormN-CSR serving on its Audit Committee: Messrs. Michael F. Holland, Richard D. Shirk and John R. Costantino and Ms. Donna M. Rapaccioli. Each of the audit committee financial experts is “independent” as that term is defined in Item 3(a)(2) of FormN-CSR.
An “audit committee financial expert” is not an “expert” for any purpose, including for purposes of Section 11 of the Securities Act of 1933, as amended, as a result of being designated as an “audit committee financial expert.” Further, the designation of a person as an “audit committee financial expert” does not mean that the person has any greater duties, obligations, or liability than those imposed on the person without the “audit committee financial expert” designation. Similarly, the designation of a person as an “audit committee financial expert” does not affect the duties, obligations, or liability of any other member of the Audit Committee or the Board.
Item 4. Principal Accountant Fees and Services.
For the fiscal years ended December 31, 2018 and December 31, 2017, the aggregate audit fees billed for professional services rendered by Ernst & Young LLP (“E&Y”), the Registrant’s principal accountant, for the audit of the Registrant’s annual financial statements or services normally provided by E&Y in connection with the Registrant’s statutory and regulatory filings and engagements were $24,400 and $24,400, respectively.
For the fiscal years ended December 31, 2018 and December 31, 2017, there were no fees billed by E&Y for assurance and related services that were reasonably related to the performance of the audit of the Registrant’s financial statements that were not reported under paragraph (a) of this Item.
The aggregate tax fees billed for professional services rendered by E&Y for tax compliance, tax advice, and tax planning in the form of preparation of excise filings and income tax returns for the fiscal years ended December 31, 2018 and December 31, 2017 were $10,170 and $10,165, respectively.
For the fiscal years ended December 31, 2018 and December 31, 2017, there were no fees billed for professional services rendered by E&Y for products and services provided by E&Y to the Registrant, other than the services reported in paragraphs (a) through (c).
For the fiscal years ended December 31, 2018 and December 31, 2017, the aggregate fees for professional services rendered by E&Y for products and services provided by E&Y to the Adviser and any entity controlling, controlled by, or under common control with the Adviser that provides ongoing services to the Registrant that (i) relate directly to the operations and financial reporting of the Registrant and (ii) werepre-approved by the Registrant’s audit committee were approximately $6,581,832 and $7,777,372, respectively.
| (e)(1) | Audit CommitteePre-Approval Policies and Procedures |
The Fund’s Audit Committee Charter states the following with respect topre-approval procedures:
The Audit Committee shall have the following duties and powers:
| | • | | Topre-approve engagements by a Fund Entity’s independent auditor fornon-audit services to be rendered to the Fund’s investment adviser (not including any subadviser whose role is primarily portfolio management and is subcontracted with or overseen by another investment adviser), and any entity controlling, controlled by, or under common control with the investment adviser that provides ongoing services to the Fund, if the engagement relates directly to the operations and financial reporting of the Fund; |
| | • | | To establish, if deemed necessary or appropriate as an alternative to Audit Committeepre-approval of services to be provided by the independent auditor as required by paragraph (b) above, policies and procedures to permit such services to bepre-approved by other means, such as by action of a designated member or members of the Audit Committee, subject to the requirement that the decision of any member to whom authority is delegated topre-approve an activity shall be presented to the full Audit Committee at its next scheduled meeting; |
AlternatePre-Approval Procedure:
| | • | | The Chairperson, or aCo-Chairperson, of the Audit Committee is authorized topre-approve any engagement involving the Fund Entity’s independent auditors to the same extent as the Audit Committee. Anypre-approval decision by the Chairperson, or aCo-Chairperson, under the foregoing authority shall be presented to the Audit Committee at its next scheduled meeting. |
| (e)(2) | Percentages of Services |
None of the services described in paragraphs (b) through (d) of this Item were performed in reliance on paragraph (c)(7)(i)(C) of Rule2-01 of RegulationS-X during the period of time for which such rule was effective.
| (g) | Total Fees Paid By Adviser and Certain Affiliates |
For the fiscal years ended December 31, 2018 and December 31, 2017, the aggregatenon-audit fees billed by E&Y for services rendered to the Registrant and the Adviser and any entity controlling, controlled by, or under common control with the Adviser that provided ongoing services to the Registrant were approximately $36,297,003 and $40,983,185, respectively. The figure for the fiscal year ended December 31, 2017 was previously reported as $28,718,894 and has been restated to include certain other audit fees totaling $12,264,291, in the aggregate, primarily relating to statutory and financial statement audits, the requirement to opine on the design and operating effectiveness of internal control over financial reporting and accounting consultations.
| (h) | E&Y notified the Fund’s Audit Committee of allnon-audit services that were rendered by E&Y to the Adviser and any entity controlling, controlled by, or under common control with the Adviser that provides services to the Fund, which services were not required to bepre-approved pursuant to paragraph (c)(7)(ii) of Rule2-01 of RegulationS-X, allowing the Fund’s Audit Committee to consider whether such services were compatible with maintaining E&Y’s independence. |
Item 5. Audit Committee of Listed Registrants.
Not applicable to the Registrant.
Item 6. Investments.
| (a) | Schedules of Investments are included as part of the report to shareholders filed under Item 1 of this FormN-CSR. |
| (b) | Not applicable to the Registrant. |
Item 7. Disclosure of Proxy Voting Policies and Procedures forClosed-End Management Investment Companies.
Not applicable to the Registrant.
Item 8. Portfolio Managers ofClosed-End Management Investment Companies.
Not applicable to the Registrant.
Item 9. Purchases of Equity Securities byClosed-End Management Investment Company and Affiliated Purchasers.
Not applicable to the Registrant.
Item 10. Submission of Matters to a Vote of Security Holders.
There were no material changes to the procedures by which shareholders may recommend nominees to the Registrant’s Board.
Item 11. Controls and Procedures.
(a) The Registrant’s principal executive officer and principal financial officer have concluded that the Registrant’s disclosure controls and procedures (as defined in Rule30a-3(c) under the Investment Company Act of 1940, as amended (the “1940 Act”)) are effective to provide reasonable assurance that information required to be disclosed by the Registrant on FormN-CSR is recorded, processed, summarized and reported as of a date within 90 days of the filing date of this report, based on their evaluation of these controls and procedures required by Rule30a-3(b) under the 1940 Act and Rules13a-15(b) or15d-15(b) under the Securities Exchange Act of 1934, as amended.
(b) There were no changes in the Registrant’s internal control over financial reporting (as defined in Rule30a-3(d) under the 1940 Act) that occurred during the Registrant’s last fiscal quarter of the period covered by this FormN-CSR filing that have materially affected, or are reasonably likely to materially affect, the Registrant’s internal control over financial reporting.
Item 12. Disclosure of Securities Lending Activities forClosed-End Management Investment Companies.
(a) Not applicable to the Registrant.
(b) Not applicable to the Registrant.
Item 13. Exhibits.
(a)(1) Code of Ethics pursuant to Item 2 of FormN-CSR is attached hereto.
(a)(2) Certifications of principal executive officer and principal financial and accounting officer of the Registrant as required by Rule30a-2(a) under the 1940 Act are attached hereto.
(a)(3) Not applicable to the Registrant.
(a)(4) Not applicable.
(b) Certifications of principal executive officer and principal financial and accounting officer of the Registrant as required by Rule30a-2(b) under the 1940 Act and Section 906 of the Sarbanes-Oxley Act of 2002 are attached hereto.
SIGNATURES
Pursuant to the requirements of the Securities Exchange Act of 1934 and the Investment Company Act of 1940, the Registrant has duly caused this report to be signed on its behalf by the undersigned, thereunto duly authorized.
| | |
| Registrant: | | ELFUN TRUSTS |
| |
| By: | | /s/ Ellen M. Needham |
| | Ellen M. Needham |
| | President |
| |
| Date: | | March 7, 2019 |
Pursuant to the requirements of the Securities Exchange Act of 1934 and the Investment Company Act of 1940, this report has been signed below by the following persons on behalf of the Registrant and in the capacities and on the dates indicated.
| | |
| By: | | /s/ Ellen M. Needham |
| | Ellen M. Needham |
| | President (Principal Executive Officer) |
| |
| Date: | | March 7, 2019 |
| |
| By: | | /s/ Bruce S. Rosenberg |
| | Bruce S. Rosenberg |
| | Treasurer (Principal Financial and Accounting Officer) |
| |
| Date: | | March 7, 2019 |