IKON
Second Quarter, Fiscal 2005
Preliminary Earnings Release
April 28, 2005
Matthew J. Espe, Chairman & CEO
Robert F. Woods, Sr. Vice President & CFO
Dan Murphy, VP of Investor Relations
Investment
Considerations
The following presentation includes information about IKON’s financial and business
goals and strategies which constitutes forward-looking statements within the meaning of
the federal securities laws. These forward-looking statements include, but are not limited
to, statements relating to: our press release issued on April 21, 2005 and our Form 8-K
filed with the SEC on April 28, 2005; expected third and fourth quarters and full year Fiscal
2005 results; growth in targeted revenue streams; estimated remaining charges relating to
our restructuring actions announced on March 1, 2005; a proposed sale of certain
operations in France; the run-off of our retained U.S. lease portfolio; our ability to repay
debt; and our ability to execute strategic initiatives, long-term growth objectives and
operational efficiency. Such forward-looking statements reflect the current views of IKON
with respect to future events and are subject to certain risks, uncertainties and
assumptions that could affect IKON’s current plans, anticipated actions, and future results
as described in IKON’s filings with the Securities and Exchange Commission.
In this presentation, we will comment on certain non-GAAP financial measures. A
reconciliation of these non-GAAP financial measures to GAAP can be found within the
Investor Relations section of www.IKON.com.
2

Important Notice
On April 21, 2005, IKON announced that it is conducting a review of
its billing controls and reserve practices for trade accounts
receivable. This review is not yet complete. In addition, IKON filed
a Form 8-K today to report that, based on preliminary data
currently available, the Audit Committee of its Board of Directors
concluded on April 26, 2005 that the Company will be required to
restate its previously issued results for one or more periods. A
summary of these announcements is included on slide 5 of this
presentation.
Certain numbers presented on the following charts are based on
preliminary data and may change as a result of the completion of
this review. The specific changes will not be known until the
review is completed.
3
IKON 2Q Earnings Call
Matthew J. Espe, Chairman and CEO
Billing and Trade A/R Review
2nd Quarter Overview
Strategic Update
Revenue Trends
Fiscal 2005 Expectations
4

Review of Billing Controls and
A/R Reserve Practices
Announced on April 21, 2005
Conducted an analysis of aged trade accounts receivable
Also performing Sarbanes-Oxley work
Identified deficiencies in processes and timeliness by which we issue and
adjust certain invoices
Causes appear to be:
Centralization of billing centers
Migration to a new billing platform
Based on preliminary data, the estimated overstatement of A/R is $45 million,
but may change.
Limited to components of U.S. trade A/R totaling $372 million as of March 31,
2005
Likely represents a cumulative effect over multiple periods
Identity of and impact on prior periods to be determined consistent with
Audit Committee’s conclusion on April 26, 2005
Charge or reduction in revenue is non-cash
Work plan completed; work underway
Goal is May 10, 2005 10-Q filing date, but we anticipate delaying that filing
We are moving with all required speed, but emphasis is on getting the work
done right.
5
2Q 2005 Recap
Diluted Earnings Per
Share
EPS from continuing
operations of $.08
EPS includes charges for
actions announced
3/1/2005, and other
actions
EPS from continuing
operations, excluding the
above charges, is
estimated at $.15
Loss from discontinued
operations of $.06
Revenue down 6%;
Targeted revenue up 1%
Net Sales up 2% y/y
Services down 2% y/y
Finance down 72% y/y
Strong cash flow from
operations - $95 million
$333 million of
unrestricted cash at end
of 2Q05
Purchased $45 million of
convertible debt
Purchased $12 million of
shares
Paid $6 million in
dividends
Note: See slide 8 for details on targeted revenue
Note: Numbers above reflect no impact
from the review announced on 4/21/2005
Note: Numbers above reflect no impact
from the review announced on 4/21/2005
Earnings Per Share
Total Revenue
Cash Performance
Note: Numbers above will not be impacted
by the review announced on 4/21/2005
6
Operational Platform
New SVP Operations
Improving OI
Reduced headcount
Exited unprofitable
businesses
Closed unprofitable
locations
Identified and
Addressing Billing
and Trade Accounts
Receivable Issue
Enterprise Services
On-site revenue up 6%
33 net new contracts
$12 million in incremental
annualized revenue
Off-site structured to
improve results – down
year to year
Professional Services
revenue up 7% - margins
improving
Europe
Revenue up 5%
Good momentum
Integrated Selling Model
Model 100% launched
across North America
276 new integrated
account execs
New VP of middle
markets
National Accounts
13 new contract wins
Anheuser-Busch
Color Growth
Revenue up 8%
Launch of IKON CPP500
2005 Strategic Priorities
Operational
Leverage
Core
Growth
Related
Expansion
7
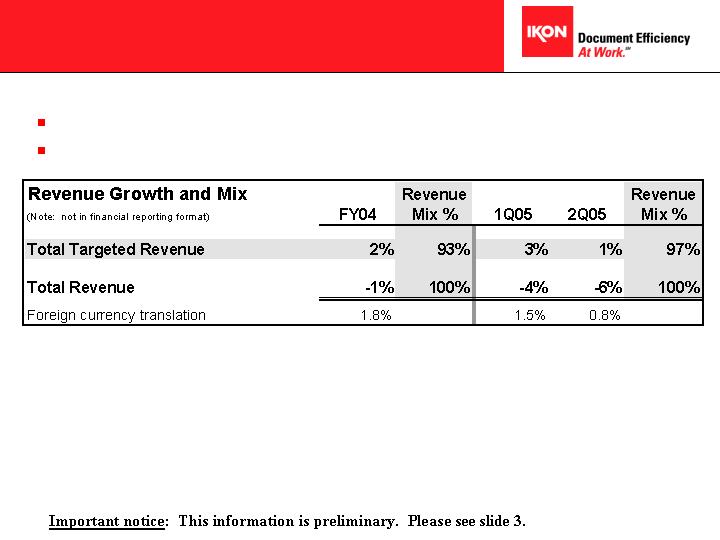
Revenue Trends
Revenues of $1.1 billion, down 6% yr-yr
Targeted revenues up 1% – represent 97% of mix
* Excludes North American leasing and de-emphasized Technology Hardware
*
8
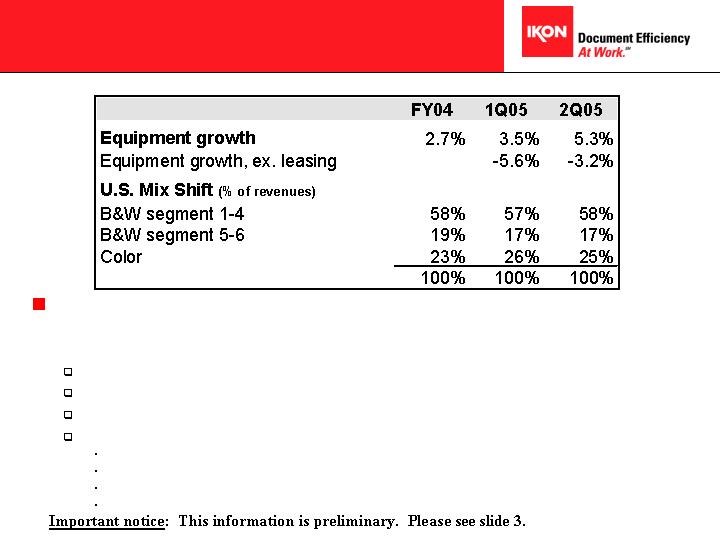
Equipment Revenue Trends
5.3% y/y growth from 2Q FY04, -3.2%
excluding leasing
10% sequential equipment growth
8% y/y growth in color worldwide
Strong y/y performance in Europe offset by weakness in N. America
U.S. equipment y/y trends:
5% decline in office black & white
10% decline in production black & white
Placements up 2%
Total ASPs down 5% (including mix impact)
9
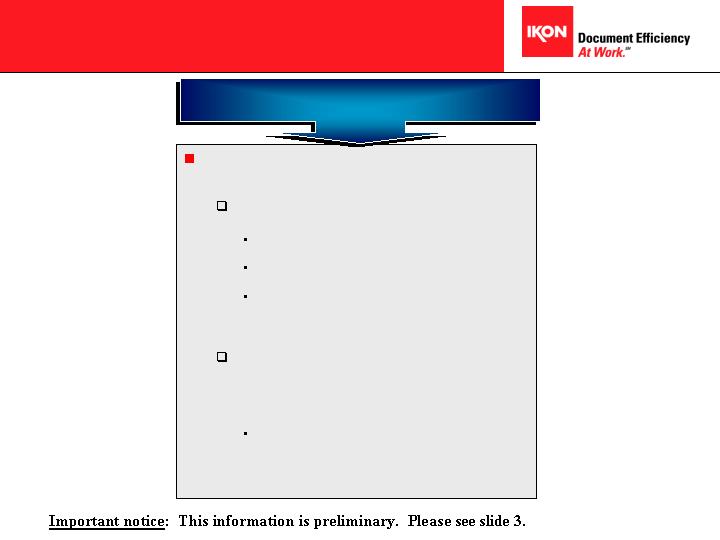
Services
Revenue down 2% y/y
Total Copy Volume Up
Color Volume Up
Production B&W Up
Office B&W Down
Billing and Trade Accounts
Receivable issue primarily impacts
Services
Update on Services Revenue pending
completion of our review
Total Revenue
10
Financial Review
Financial Results
Restructuring Actions
Balance Sheet and Cash Performance
Robert F. Woods, Sr. Vice President & CFO
11
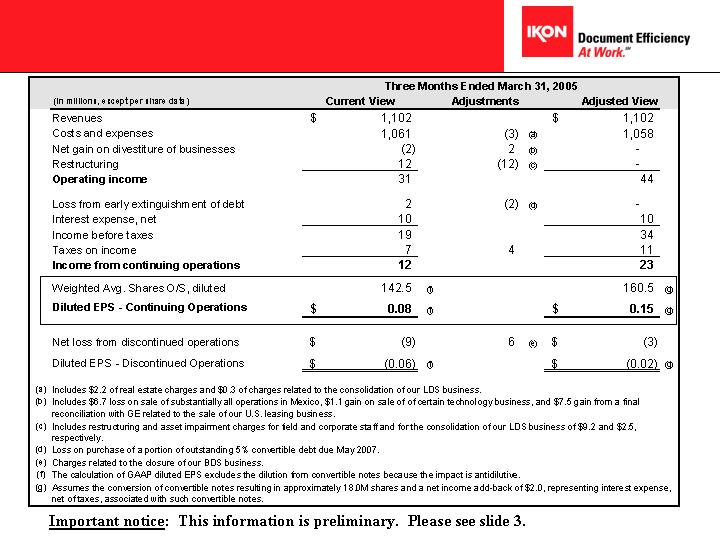
2nd Qtr. FY05 P&L
(condensed)
12
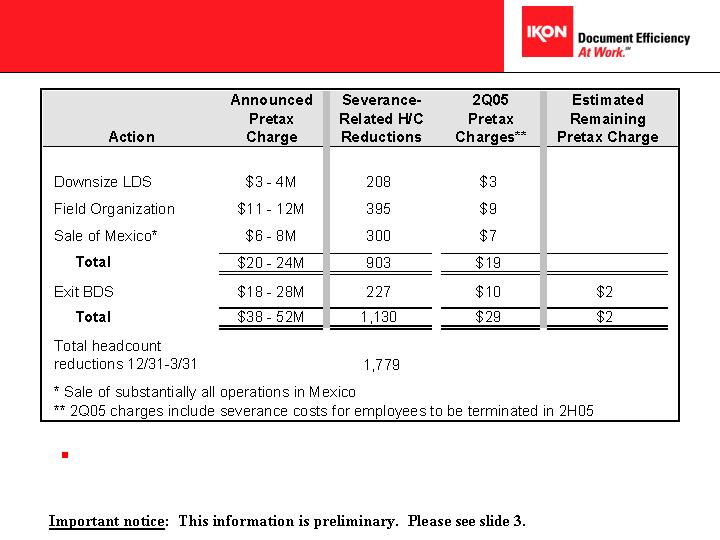
2Q05 Actions
2Q05 Headcount reduction of 1,779 vs. 1,500 estimated from actions
13

Gross Profit
Yr-Yr
Total GP % impacted by leasing transition
Net Sales margins decline due to lower supplies margins
Services margins down 0.4 points
14

Selling & Administrative
Yr-Yr
Year-to-year improvement of $27.2 million primarily driven by impact of:
Leasing: ($18.5 million)
Headcount reductions, net of ISM investment: ($6.5 million)
Foreign currency: $2.3 million
Real estate charges: $2.2 million
Total expense to revenue ratio improves 50 basis points
% of
% of
% of
2Q FY04
revenue
1Q FY05
revenue
2Q FY05
revenue
Total S&A
378.3
$
32.3%
352.8
$
32.5%
351.1
$
31.8%
15
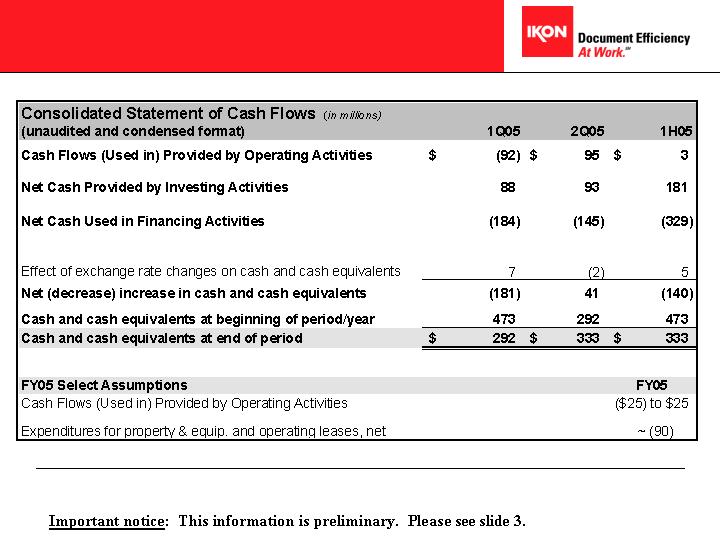
Cash Flow
16
Balance Sheet
* Pending our review, to be split between taxes and equity
IKON Consolidated Balance Sheet
Unaudited, Condensed Format, Non-GAAP
(in millions)
Assets
4Q FY04
1Q FY05
2Q FY05
Cash and cash equivalents
473
$
292
$
333
$
Restricted cash
27
27
24
Accounts receivable, less allowances
773
787
710
Less: impact of announced estimated accounts receivable reduction
TBD
TBD
(45)
Adjusted accounts receivable
773
787
665
Finance receivables, less allowances
1,211
1,117
996
Inventories
233
290
217
Prepaids, Other Current Assets, Deferred Taxes
121
112
105
PP&E, net, including equipment on operating leases
243
248
244
Goodwill, net and Other Assets and Unsold Residual
1,457
1,495
1,455
Assets held for sale
-
-
30
Total Assets
4,538
$
4,368
$
4,069
$
Liabilities and Shareholders' Equity
Corporate debt & Notes Payable
805
$
748
$
699
$
Debt supporting finance contracts and unsold residual value
863
787
680
Trade accounts payable, Accrued Expenses, Def'd Revenues
754
698
617
Deferred taxes
187
151
129
Other long-term liabilities
203
219
228
Liabilities held for sale
-
-
26
Total Liabilities
2,812
2,603
2,379
Total Shareholders' Equity
1,726
1,765
1,735
Less: impact of announced estimated accounts receivable reduction*
TBD
TBD
(45)
Adjusted Shareholders' Equity
1,726
1,765
1,690
Total Liabilities and Shareholders' Equity
4,538
$
4,368
$
4,069
$
Ratios:
Total debt
1,668
$
1,535
$
1,378
$
Debt to capital
49%
47%
45%
17
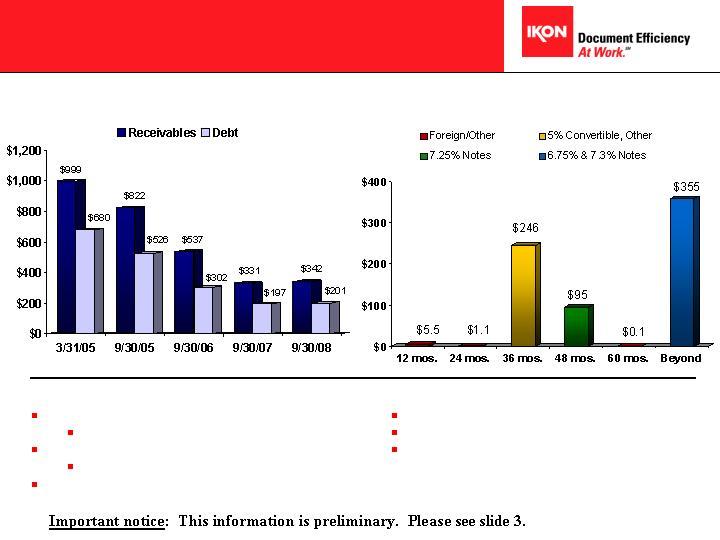
Debt Structure
Corporate Debt Maturities
(as of 3/31/05) (in millions)
Actual Projected -------------------------------------
Lease-Supported Receivables vs. Debt
(as of 3/31/05) (in millions)
As of 3/31/05:
$999 million total receivables
$702 million in U.S. portfolio receivables
$680 million total debt
$495 million in U.S. portfolio debt
$181 million in projected tax payments on retained portfolio
51% of corporate debt matures 2025/2027
Purchased $45 million in convertible notes in 2Q05
Remaining $245 million convertible converts at $15.03
or matures May 2007; callable in May 2005
18
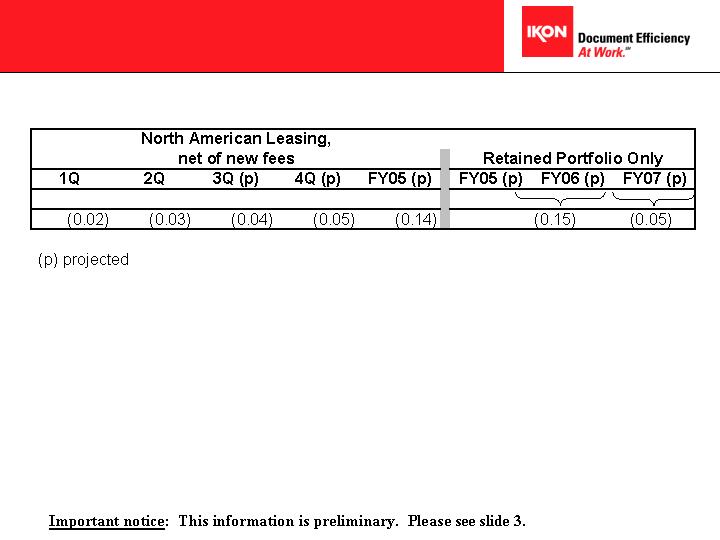
Leasing Headwind
19
2Q05 Summary
ITEM
Targeted Revenue Growth
Sequential Equipment Growth
Strong Cash From Operations
100 bp Reduction in E/R
Exit BDS
Downsize LDS
Realigned Field Structure
Reduced Corporate Staff
Sale of Mexico
Real Estate Closures
Other Actions:
GE Balance Sheet Settlement (US)
Sale of TS Businesses
Debt Purchase
Billing and Accounts Receivable
RESULT
Achieved 1%
Achieved 10%
Generated $95 million
On Target
Done; 2 Locations To Go
Done; 1 Location To Go
Done
Done
Done
On-Going
Done
Done
Done
Identified and Addressing Issue
20
* Excluding any non-recurring charges and the impact of the pending billing and trade A/R review.
** See slide 8 for an explanation of targeted revenues.
FISCAL 2005 CONTINUING OPERATIONS*
Earnings (per diluted share)
Revenue Assumptions:
Total Revenue
Targeted Revenue**
THIRD QUARTER CONTINUING OPERATIONS*
Earnings (per diluted share) ��
Fiscal 2005 Expectations
EXPECTATIONS
$.63 to $.68
Expected to be at low end of range
(3%) to (4%)
0% to 1%
$.16 to $.18
21