UNITED STATES
SECURITIES AND EXCHANGE COMMISSION
Washington, D.C. 20549
FORM N-CSR
CERTIFIED SHAREHOLDER REPORT
OF
REGISTERED MANAGEMENT INVESTMENT COMPANIES
Investment Company Act file number: 811-1530
Name of Registrant: Vanguard Explorer Fund
Address of Registrant: | P.O. Box 2600 |
| Valley Forge, PA 19482 |
|
|
Name and address of agent for service: | Heidi Stam, Esquire |
| P.O. Box 876 |
| Valley Forge, PA 19482 |
|
|
Registrant’s telephone number, including area code: (610) 669-1000
Date of fiscal year end: October 31
Date of reporting period: November 1, 2007–April 30, 2008
Item 1: Reports to Shareholders |
> | For the fiscal half-year, Vanguard Explorer Fund posted returns just shy of –14.0%, declining more than its benchmark index but less than its peer-group average. |
> | Small-company stocks faced stiff headwinds as risk-averse investors favored mid- and large-capitalization companies. |
> | Only one sector produced a positive six-month return for the fund: Energy stocks benefited from soaring prices and robust demand. |
See page 28 for a Notice to Shareholders concerning the fund’s investment advisors. |
Contents |
|
|
|
Your Fund’s Total Returns | 1 |
Chairman’s Letter | 2 |
Advisors’ Report | 6 |
Fund Profile | 11 |
Performance Summary | 12 |
Financial Statements | 13 |
About Your Fund’s Expenses | 26 |
Trustees Approve Advisory Arrangements | 31 |
Glossary | 33 |
Please note: The opinions expressed in this report are just that—informed opinions. They should not be considered promises or advice. Also, please keep in mind that the information and opinions cover the period through the date on the cover of this report. Of course, the risks of investing in your fund are spelled out in the prospectus.
Your Fund’s Total Returns
Six Months Ended April 30, 2008 |
|
|
| Ticker | Total |
| Symbol | Returns |
Vanguard Explorer Fund |
|
|
Investor Shares | VEXPX | –13.7% |
Admiral™ Shares1 | VEXRX | –13.6 |
Russell 2500 Growth Index |
| –11.4 |
Average Small-Cap Growth Fund2 |
| –16.6 |
Your Fund’s Performance at a Glance |
|
|
|
|
October 31, 2007–April 30, 2008 |
|
|
|
|
|
|
| Distributions Per Share | |
| Starting | Ending | Income | Capital |
| Share Price | Share Price | Dividends | Gains |
Vanguard Explorer Fund |
|
|
|
|
Investor Shares | $83.93 | $65.72 | $0.310 | $6.786 |
Admiral Shares | 78.25 | 61.21 | 0.427 | 6.316 |
1 A lower-cost class of shares available to many longtime shareholders and to those with significant investments in the fund.
2 Derived from data provided by Lipper Inc.
1

Chairman’s Letter
Dear Shareholder,
Vanguard Explorer Fund faced significant headwinds during the six months ended April 30, 2008. A year ago, when markets were rising, many investors preferred small-capitalization growth-oriented stocks. But in recent months, with equities in retreat and credit markets in turmoil, anxious investors have favored high-quality bonds and the relative safety of large-cap stocks.
Against this backdrop, the Explorer Fund returned –13.7% for Investor Shares and –13.6% for Admiral Shares, trailing its small-cap growth benchmark, notably in performance among information technology and industrials holdings. However, your fund outperformed its peer-group average by almost 3 percentage points, underscoring the benefits of Explorer’s diversified, multiadvisor structure and low costs.
Please note that the fund remained closed to most new investors. Shareholders with existing accounts may invest up to $25,000 per year. (The fund closure and investment limits do not apply to members of Vanguard Flagship Services™.)
2
Economic anxiety weighed on U.S. and foreign stocks
For the fiscal half-year, the broad U.S. stock market returned –9.9% amid looming fears of an economic recession. The housing slump continued, putting additional pressure on lenders and borrowers. Home prices dropped 7.7% during the first quarter of 2008—the biggest quarterly decline in 12 years.
International stocks outperformed their U.S. counterparts, but just about all segments of the global equity markets recorded negative returns.
A mixed picture in bonds as the credit crunch spread
Bonds fared better than stocks during the period, though the fixed income markets were hardly an oasis of calm. The broad taxable bond market returned 4.1%. Much of the return came from U.S. Treasury bonds. Beyond Treasuries, fixed income returns were modest as the credit crisis reverberated across the lending markets.
The Federal Reserve Board responded to weakness in the credit markets—and the broad economy—with five cuts to its target for the federal funds rate. At the end of April, the Fed lowered the target to 2.0%—the lowest level since December 2004.
Market Barometer |
|
|
|
|
|
| Total Returns |
|
| Periods Ended April 30, 2008 | |
| Six Months | One Year | Five Years1 |
Stocks |
|
|
|
Russell 1000 Index (Large-caps) | –9.5% | –4.6% | 11.2% |
Russell 2000 Index (Small-caps) | –12.9 | –11.0 | 13.8 |
Dow Jones Wilshire 5000 Index (Entire market) | –9.9 | –4.7 | 11.8 |
MSCI All Country World Index ex USA (International) | –9.1 | 4.1 | 23.2 |
|
|
|
|
Bonds |
|
|
|
Lehman U.S. Aggregate Bond Index (Broad taxable market) | 4.1% | 6.9% | 4.4% |
Lehman Municipal Bond Index | 1.5 | 2.8 | 4.0 |
Citigroup 3-Month Treasury Bill Index | 1.5 | 3.9 | 3.0 |
|
|
|
|
CPI |
|
|
|
Consumer Price Index | 2.8% | 3.9% | 3.2% |
1 Annualized.
3
Unrewarding, but not unexpected, half-year performance
Both the Explorer Fund and its benchmark index have had sizable positions in the information technology and industrials sectors, averaging almost 40% of assets—making the fund’s fortunes heavily dependent on the success of these two groups.
Tech stocks, which generally trailed the market in recent periods, trimmed almost 6 percentage points from the fund’s semiannual return. As businesses and consumers scrutinized their budgets amid a slowing economy, the fund’s holdings in companies that provide communications equipment, information technology services, and semiconductors were hit especially hard. And the fund’s tech portfolio delivered weaker performance than that of the benchmark, reflecting some miscues and missed opportunities.
A similar scenario unfolded among the fund’s industrials holdings. The slower-growth environment dealt a blow to purveyors of goods and services ranging from construction and engineering to airlines to commercial and consulting services. Here again, Explorer lagged its benchmark. This result, combined with the technology returns, explained most of the fund’s performance shortfall.
In contrast, the picture was much brighter among Explorer’s energy holdings, the only sector that delivered a gain. In the small telecommunication services sector, favorable stock selection bolstered returns, at least on a relative basis. And, while the distress among financials companies made headlines elsewhere, the performance of the fund’s holdings in this sector was unremarkable.
As with any actively managed portfolio, your fund can be expected to experience periods of over- and underperformance when compared with its benchmark index. However, Explorer benefits from the skills of a diverse set of investment advisors with different, yet complementary, strategies that we believe can generate competitive long-term performance at a very modest cost. (Please note that in
Annualized Expense Ratios1 |
|
|
|
Your Fund Compared With Its Peer Group |
|
|
|
|
|
| Average |
| Investor | Admiral | Small-Cap |
| Shares | Shares | Growth Fund |
Explorer Fund | 0.42% | 0.24% | 1.61% |
1 Fund expense ratios reflect the six months ended April 30, 2008. Peer-group expense ratio is derived from data provided by Lipper Inc. and captures information through year-end 2007.
4
February, Vanguard Quantitative Equity Group added to its portion of the fund by assuming responsibility for the assets of Explorer Fund previously managed by Grantham, Mayo, Van Otterloo & Co.)
For more information on the fund’s positioning and performance during the half-year, please see the Advisors’ Report, which begins on page 6.
Balance and a long-term focus are keys to sound investing
The past six months have presented many challenges, and opportunities, for professional and individual investors alike. But we remind shareholders that it can be counterproductive to let short-term market “weather reports” distract you from your long-term focus. At Vanguard, we believe that the key to investment success is to determine a diversified mix of stock, bond, and money market funds that is consistent with your long-term goals, time horizon, and risk tolerance, and then stick with it.
By offering exceptionally broad diversification—across small-cap growth-oriented stocks and active investment strategies—the Explorer Fund can play a useful role as part of such a balanced portfolio. And its historically low costs provide an advantage that compounds over time.
As I close this report to you, it’s my pleasure to introduce the fund’s new president, F. William McNabb III. Bill is a man of great character and integrity who is intimately familiar with all aspects of Vanguard—from how we serve our clients to how we invest for them.
Bill and I have worked together very closely for more than two decades. I’m thrilled that the fund’s board elected him president, effective March 1, and designated him to succeed me as chief executive officer, a role he will assume within a year, after an orderly transition. Bill and the rest of our team will serve you and our other clients extremely well in the years ahead.
Thank you for entrusting your assets to Vanguard.
Sincerely,

John J. Brennan
Chairman and Chief Executive Officer
May 16, 2008
New advisor added to Explorer management team |
Vanguard Explorer Fund’s board of trustees has decided to add Century Capital Management, LLC, to the fund’s team of investment advisors. For important information about Century Capital and the board’s decision, see page 28.
5
Advisors’ Report
For the fiscal half-year ended April 30, 2008, Vanguard Explorer Fund returned –13.7% for Investor Shares (–13.6% for the lower-cost Admiral Shares), reflecting the combined efforts of your fund’s six independent advisors. The use of multiple advisors provides exposure to distinct, yet complementary, investment approaches, enhancing the fund’s diversification.
The table on page 10 lists the advisors, the amount and percentage of fund assets each manages, and brief descriptions of their investment strategies. The advisors have also provided comments on their assessment of the investment environment during the past six months and the notable successes and shortfalls in their portfolios. These comments were prepared on May 12, 2008.
Vanguard Quantitative Equity Group
Portfolio Manager:
James D. Troyer, CFA, Principal
Investment environment: In a bleak equity environment overall, mid-capitalization growth stocks outperformed their value counterparts, while small-cap growth stocks generally underperformed during the period. Of our model’s three parts, the valuation component added the most value to our portfolio. The market sentiment and earnings quality components were neutral during the six months.
Successes: Retailing and materials were our best-performing industries. First Solar and AK Steel Holding were again among our best-performing stocks.
Shortfalls: Footwear maker Crocs and UAL (United Airlines) were our most disappointing stock selections; capital goods was our worst-performing industry.
Granahan Investment Management, Inc.
Portfolio Manager:
Jack Granahan, Managing Partner
Investment environment: Investors continued to focus on credit risk, liquidity, and evaluating the effectiveness of government intervention. It was increasingly important for companies to have significant foreign market exposure as many sectors in the U.S. economy slowed and the U.S. dollar remained weak. Going forward, positive factors include generally good corporate balance sheets plus what appears to be conservative earnings guidance from most U.S. companies. Uncertainties include possible slowing in some foreign markets and higher interest rates domestically.
Successes: Although successes were not abundant, we had some significant gainers in health care, including Rigel Pharmaceuticals, Axcan Pharma, and Edwards Lifesciences. Rigel benefited from success in Phase II trials for its rheumatoid arthritis drug. Axcan was acquired at a premium, and Edwards rose on success with its minimally invasive heart valve innovation. Among consumer discretionary stocks, winners included discount retailer Ross Stores—which typically performs well in challenging consumer environments when more
6
brand-name inventory is available to discount—as well as Rent-A-Center and Aaron Rents.
Shortfalls: After a strong 2007, our technology holdings were among the worst hit over the past six months. Although reported earnings were generally strong, the outlook dimmed as enterprise customers began to reduce spending plans. Casualties included Riverbed Technology and Blue Coat Systems; both are involved with WAN (wide area network) optimization software, a product area that offers excellent longer-term growth potential. Another technology stock, VeriFone Holdings, was penalized by investors for poor internal implementation of a new operating system.
Wellington Management Company, LLP
Portfolio Manager:
Kenneth L. Abrams, Senior Vice President and Partner
Investment environment: Investors sought to shed risk and equity markets remained volatile amid continued turmoil in the U.S. bond and housing markets coupled with fears of a recession. During the semiannual period, the Federal Reserve Board stepped in to sponsor the acquisition of investment bank Bear Stearns, lower the target federal funds rate by 200 basis points, and introduce multiple programs to ease the extended credit crunch.
Successes: We benefited from favorable security selection in health care, as two of our holdings were acquired: Millennium Pharmaceuticals and The TriZetto Group.
Shortfalls: Detractors included energy and industrials holdings. Shares of Uranium One, a Canadian uranium and gold mining company, declined as mine-development delays and higher-than-expected acquisition expenses led to disappointing earnings. AirTran Holdings shares retreated as rising fuel costs led to first-quarter losses for this discount airline.
Kalmar Investment Advisers
Portfolio Manager:
Ford B. Draper, Jr., President and Chief Investment Officer
Investment environment: The U.S. stock market took a beating in the first three months of 2008, its worst quarter in almost six years. Global equities also struggled, but markets around the world rallied somewhat in April. Equity market volatility continued to rise. Seriously late to the game, the Federal Reserve Board was forced into unprecedented actions to support credit markets. Large-capitalization stocks continued to outperform small-caps. In a shift from recent trends, however, small-cap value stocks generally outperformed small-cap growth stocks. And smaller companies with the fastest expected growth conspicuously declined the most as investor confidence weakened.
7
Successes: Our energy and health care holdings helped returns the most. We were overweighted in energy—the best-performing sector in the market—and our individual holdings more than doubled the return of the energy stocks in the index. Our exploration and production companies grew their oil and gas reserves powerfully, and our oil service companies (including Tidewater) performed well. In health care, our holdings declined notably less than the index group on the strength of fine business execution and two strategic takeovers.
Shortfalls: Unlike in the prior six months, our consumer discretionary holdings detracted the most from returns. This was partially the result of difficulties facing consumers generally; it also reflected earnings disappointments and company execution problems among a few holdings. Our positions in the materials group also lagged the index sector, primarily because of temporary weakness in two of our larger positions.
AXA Rosenberg Investment Management LLC
Portfolio Manager:
William E. Ricks, Ph.D., Americas Chief Executive and Chief Investment Officer
Investment environment: U.S. and global equity markets retreated dramatically over the period. The Fed’s multiple rate cuts appeared to be no match for continued distressing news related to the credit crisis, slowing economic activity, and earnings uncertainty. Volatility was a fixture within equity markets in a way that has not been seen for years. It was a challenging environment for our process, but investors’ increasing focus on earnings quality served us well.
Successes: Maintaining a consistent underweighting in companies with greater levels of operating leverage was among our most successful decisions. Our overweightings of energy and materials stocks, and our underweighting of consumer discretionary holdings, were all well-timed. Among our best individual positions were Helmerich & Payne, an oil and gas drilling contractor, and Owens-Illinois, a glass container manufacturer.
Shortfalls: Stock selection within both industrials and information technology left much to be desired. Our overweighted stake in Sigma Designs—a provider of
8
semiconductor and software solutions for multimedia entertainment—and an underweighting of First Solar topped our “worst positions” list.
Chartwell Investment Partners, L.P.
Portfolio Managers:
Edward N. Antoian, CFA, CPA, Managing Partner
John A. Heffern, Managing Partner
Investment environment: Several recurring themes weighed on the market over the past six months: concerns about credit quality, consumer confidence, housing weakness, manufacturing activity, commodity prices, the weak U.S. dollar, and billions in losses and write-offs among the world’s largest financial institutions. The period ended strongly, with encouraging earnings from nonfinancial companies and further government attention to the stress within the financial system. The cloud of uncertainty remains, however, even though it seems less ominous.
Successes: Health care and business services were our top-performing segments during the period. Adams Respiratory Therapeutics was acquired for a substantial premium, and FTI Consulting’s outsourced services were in great demand.
Shortfalls: Our underweighted position in basic industry hurt performance, as did stock selection among companies sensitive to capital spending. BE Aerospace underperformed, despite reporting strong earnings and a positive outlook, as Boeing announced another delay of its 787 Dreamliner and airlines cut spending because of increased fuel prices.
9
Vanguard Explorer Fund Investment Advisors |
| ||
|
|
|
|
| Fund Assets Managed |
| |
Investment Advisor | % | $ Million | Investment Strategy |
Vanguard Quantitative | 25 | 2,576 | Employs a quantitative fundamental management |
Equity Group |
|
| approach, using models that assess valuation, market |
|
|
| sentiment, and earnings quality of companies as |
|
|
| compared with their peers. |
Granahan Investment | 21 | 2,339 | Bases its investment process on the beliefs that |
Management, Inc. |
|
| earnings drive stock prices and that small, dynamic |
|
|
| companies with exceptional growth prospects have |
|
|
| the greatest long-term potential. A bottom-up, funda- |
|
|
| mental approach places companies in one of three |
|
|
| life-cycle categories: pioneer, core growth, and special |
|
|
| situation. In each, the process looks for companies |
|
|
| with strong earnings growth and leadership in |
|
|
| their markets. |
Wellington Management | 14 | 1,446 | Conducts research and analysis of individual companies |
Company, LLP |
|
| to select stocks believed to have exceptional growth |
|
|
| potential relative to their market valuations. Each |
|
|
| stock is considered individually before purchase, and |
|
|
| company developments are continually monitored for |
|
|
| comparison with expectations for growth. |
Kalmar Investment Advisers | 14 | 1,434 | Employs a “growth with value” strategy using |
|
|
| creative, bottom-up research to uncover vigorously |
|
|
| growing, high-quality businesses. The process also |
|
|
| seeks out stocks that are inefficiently valued or that |
|
|
| offer value through longer-term company ownership. |
|
|
| The strategy has a dual objective of superior returns |
|
|
| with lower risk. |
AXA Rosenberg Investment | 13 | 1,374 | Employs an investment philosophy grounded in |
Management LLC |
|
| fundamental analysis using a two-part quantitative |
|
|
| model: a valuation model, which compares a stock’s |
|
|
| price to its fair value, and an earnings forecast model, |
|
|
| which identifies companies likely to have |
|
|
| superior earnings. |
Chartwell Investment Partners, L.P. | 9 | 945 | Uses a bottom-up, fundamental, research-driven |
|
|
| stock-selection strategy focusing on companies |
|
|
| with sustainable growth, strong management teams, |
|
|
| competitive positions, and outstanding product and |
|
|
| service offerings. These companies should continually |
|
|
| demonstrate growth in earnings per share. |
Cash Investments1 | 4 | 391 | — |
1 These short-term reserves are invested by Vanguard in equity index products to simulate investment in stocks. Each advisor also may maintain a modest cash position.
10
Fund Profile
As of April 30, 2008
Portfolio Characteristics |
|
| |
|
| Comparative | Broad |
| Fund | Index1 | Index2 |
Number of Stocks | 1,230 | 1,593 | 4,783 |
Median Market Cap | $2.7B | $2.9B | $34.8B |
Price/Earnings Ratio | 22.4x | 24.5x | 18.1x |
Price/Book Ratio | 2.7x | 3.2x | 2.5x |
Yield3 |
| 0.7% | 1.9% |
Investor Shares | 0.3% |
|
|
Admiral Shares | 0.5% |
|
|
Return on Equity | 14.7% | 16.2% | 19.6% |
Earnings Growth Rate | 24.2% | 22.0% | 20.5% |
Foreign Holdings | 4.4% | 0.0% | 0.0% |
Turnover Rate | 113%4 | — | — |
Expense Ratio |
| — | — |
Investor Shares | 0.42%4 |
|
|
Admiral Shares | 0.24%4 |
|
|
Short-Term Reserves | 2.2% | — | — |
Sector Diversification (% of equity exposure) | |||
|
| Comparative | Broad |
| Fund | Index1 | Index2 |
Consumer Discretionary | 13.3% | 16.4% | 9.3% |
Consumer Staples | 2.8 | 2.3 | 9.1 |
Energy | 11.1 | 9.1 | 13.5 |
Financials | 6.9 | 8.5 | 17.8 |
Health Care | 17.5 | 16.6 | 11.3 |
Industrials | 17.9 | 18.8 | 11.9 |
Information Technology | 22.1 | 19.2 | 16.0 |
Materials | 6.0 | 6.8 | 4.1 |
Telecommunication Services | 1.3 | 1.1 | 3.1 |
Utilities | 1.1 | 1.2 | 3.9 |
Volatility Measures5 |
| |
| Fund Versus | Fund Versus |
| Comparative Index1 | Broad Index2 |
R-Squared | 0.99 | 0.88 |
Beta | 1.00 | 1.35 |
Ten Largest Holdings6 (% of total net assets) | ||
|
|
|
Cephalon, Inc. | biotechnology | 0.8% |
Microsemi Corp. | semiconductors | 0.7 |
AptarGroup Inc. | metal and glass containers | 0.7 |
GameStop Corp. Class A | computer and electronics retail | 0.6 |
Service Corp. International | specialized consumer services | 0.6 |
Ciena Corp. | communications equipment | 0.5 |
DeVry, Inc. | education services | 0.5 |
The Dun & Bradstreet Corp. | diversified commercial and professional services | 0.5 |
Ultra Petroleum Corp. | oil and gas exploration and production | 0.5 |
Mettler-Toledo International Inc. | electronic equipment manufacturers | 0.5 |
Top Ten |
| 5.9% |
Investment Focus

1 Russell 2500 Growth Index.
2 Dow Jones Wilshire 5000 Index.
3 30-day SEC yield for the fund; annualized dividend yield for the indexes. See the Glossary on pages 33–34.
4 Annualized.
5 For an explanation of R-squared, beta, and other terms used here, see the Glossary on pages 33–34.
6 The holding listed exclude any temporary cash investments and equity index products.
11
Performance Summary
All of the returns in this report represent past performance, which is not a guarantee of future results that may be achieved by the fund. (Current performance may be lower or higher than the performance data cited. For performance data current to the most recent month-end, visit our website at www.vanguard.com/performance.) Note, too, that both investment returns and principal value can fluctuate widely, so an investor’s shares, when sold, could be worth more or less than their original cost. The returns shown do not reflect taxes that a shareholder would pay on fund distributions or on the sale of fund shares.
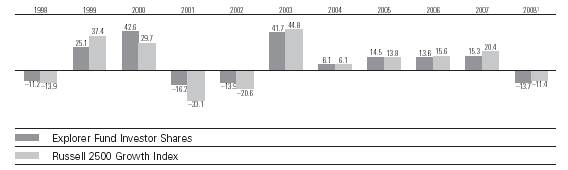
Fiscal-Year Total Returns (%): October 31, 1997–April 30, 2008
Average Annual Total Returns: Periods Ended March 31, 2008
This table presents average annual total returns through the latest calendar quarter—rather than through the end of the fiscal period. Securities and Exchange Commission rules require that we provide this information.
| Inception Date | One Year | Five Years | Ten Years |
Investor Shares2 | 12/11/1967 | –11.15% | 13.65% | 6.86% |
Admiral Shares | 11/12/2001 | –11.00 | 13.83 | 7.103 |
1 Six months ended April 30, 2008.
2 Total returns do not include the account service fee that may be applicable to certain accounts with balances below $10,000.
3 Return since inception.
Note: See Financial Highlights tables on pages 19–20 for dividend and capital gains information.
12
Financial Statements (unaudited)
Statement of Net Assets—Investments Summary
As of April 30, 2008
This Statement summarizes the fund’s holdings by asset type (common stocks, bonds, etc.) and by industry sector. Details are reported for each of the fund’s 50 largest individual holdings and for investments that, in total for any issuer, represent more than 1% of the fund’s net assets. The total value of smaller holdings is reported as a single amount within each category.
The fund provides a complete list of its holdings four times in each fiscal year, at the quarter-ends. For the second and fourth fiscal quarters, the complete listing of the fund’s holdings is available electronically on Vanguard.com and on the Securities and Exchange Commission’s website (www.sec.gov), or you can have it mailed to you without charge by calling 800-662-7447. For the first and third fiscal quarters, the fund files the lists with the SEC on Form N-Q. Shareholders can look up the fund’s Forms N-Q on the SEC’s website. Forms N-Q may also be reviewed and copied at the SEC’s Public Reference Room (see the back cover of this report for further information).
|
|
| Market | Percentage |
|
|
| Value• | of Net |
|
| Shares | ($000) | Assets |
Common Stocks |
|
|
| |
Consumer Discretionary |
|
|
| |
* | GameStop Corp. Class A | 1,239,696 | 68,233 | 0.6% |
| Service Corp. International | 5,238,256 | 58,197 | 0.6% |
| DeVry, Inc. | 992,610 | 56,579 | 0.6% |
| Penske Automotive Group Inc. | 2,218,800 | 46,439 | 0.5% |
| Ross Stores, Inc. | 1,377,797 | 46,142 | 0.4% |
* | O’Reilly Automotive, Inc. | 1,412,491 | 40,779 | 0.4% |
* | WMS Industries, Inc. | 982,546 | 35,558 | 0.3% |
† | Other—Consumer Discretionary |
| 961,194 | 9.1% |
|
|
| 1,313,121 | 12.5% |
|
|
|
|
|
† Consumer Staples |
| 273,319 | 2.6% | |
|
|
|
|
|
Energy |
|
|
| |
* | Ultra Petroleum Corp. | 656,350 | 54,523 | 0.5% |
| Tidewater Inc. | 773,790 | 50,467 | 0.5% |
* | Atwood Oceanics, Inc. | 494,434 | 49,785 | 0.5% |
| St. Mary Land & Exploration Co. | 1,103,910 | 48,263 | 0.5% |
* | Superior Energy Services, Inc. | 951,901 | 42,245 | 0.4% |
* | Comstock Resources, Inc. | 923,353 | 42,003 | 0.4% |
* | Helix Energy Solutions Group, Inc. | 1,093,393 | 37,777 | 0.4% |
| Rowan Cos., Inc. | 930,900 | 36,296 | 0.3% |
| CARBO Ceramics Inc. | 760,900 | 36,166 | 0.3% |
| XTO Energy, Inc. | 550,925 | 34,080 | 0.3% |
† | Other—Energy |
| 679,697 | 6.5% |
|
|
| 1,111,302 | 10.6% |
Financials |
|
|
| |
| Cash America International Inc. | 1,086,900 | 44,335 | 0.4% |
1 | Advanta Corp. Class A | 1,000,000 | 7,590 | 0.1% |
† | Other—Financials |
| 592,288 | 5.6% |
|
|
| 644,213 | 6.1% |
13
|
|
| Market | Percentage |
|
|
| Value• | of Net |
|
| Shares | ($000) | Assets |
Health Care |
|
|
| |
* | Cephalon, Inc. | 1,272,944 | 79,444 | 0.8% |
* | Millennium Pharmaceuticals, Inc. | 2,123,900 | 52,821 | 0.5% |
* | Covance, Inc. | 599,477 | 50,230 | 0.5% |
* | Henry Schein, Inc. | 870,542 | 48,202 | 0.5% |
| DENTSPLY International Inc. | 1,144,539 | 44,488 | 0.4% |
| Pharmaceutical Product Development, Inc. | 962,156 | 39,853 | 0.3% |
† | Other—Health Care |
| 1,440,577 | 13.7% |
|
|
| 1,755,615 | 16.7% |
Industrials |
|
|
| |
| The Dun & Bradstreet Corp. | 651,700 | 54,938 | 0.5% |
| Chicago Bridge & Iron Co. N.V. | 1,228,732 | 48,953 | 0.5% |
| Kennametal, Inc. | 1,256,898 | 43,702 | 0.4% |
* | Stericycle, Inc. | 735,650 | 39,269 | 0.4% |
| MSC Industrial Direct Co., Inc. Class A | 776,640 | 37,869 | 0.4% |
* | RBC Bearings Inc. | 920,628 | 36,798 | 0.4% |
| The Manitowoc Co., Inc. | 933,780 | 35,316 | 0.3% |
* | The Advisory Board Co. | 750,715 | 34,998 | 0.3% |
* | Covanta Holding Corp. | 1,307,300 | 34,813 | 0.3% |
* | Corrections Corp. of America | 1,340,421 | 34,181 | 0.3% |
† | Other—Industrials |
| 1,385,866 | 13.2% |
|
|
| 1,786,703 | 17.0% |
Information Technology |
|
|
| |
* | Microsemi Corp. | 3,067,262 | 75,148 | 0.7% |
* | Ciena Corp. | 1,705,285 | 57,656 | 0.6% |
* | Mettler-Toledo International Inc. | 563,615 | 53,690 | 0.5% |
* | Red Hat, Inc. | 2,424,213 | 49,866 | 0.5% |
* | Cadence Design Systems, Inc. | 3,812,969 | 42,438 | 0.4% |
| Intersil Corp. | 1,412,640 | 37,746 | 0.4% |
* | BMC Software, Inc. | 1,028,910 | 35,765 | 0.3% |
| Syntel, Inc. | 1,064,896 | 35,259 | 0.3% |
| FactSet Research Systems Inc. | 586,937 | 35,234 | 0.3% |
* | MICROS Systems, Inc. | 955,412 | 34,060 | 0.3% |
*◊ | TiVo Inc. | 2,935,400 | 24,158 | 0.2% |
† | Other—Information Technology |
| 1,729,000 | 16.5% |
|
|
| 2,210,020 | 21.0% |
Materials |
|
|
| |
| AptarGroup Inc. | 1,672,000 | 73,819 | 0.7% |
| AK Steel Holding Corp. | 821,312 | 51,562 | 0.5% |
| Albemarle Corp. | 1,001,170 | 37,454 | 0.4% |
* | Terra Industries, Inc. | 961,168 | 36,390 | 0.3% |
| FMC Corp. | 545,932 | 34,274 | 0.3% |
† | Other—Materials |
| 363,612 | 3.5% |
|
|
| 597,111 | 5.7% |
|
|
|
|
|
† Telecommunication Services |
| 124,491 | 1.2% | |
|
|
|
|
|
† Utilities |
| 95,659 | 0.9% | |
|
|
|
|
|
Exchange-Traded Funds |
|
|
| |
2^ | Vanguard Small-Cap ETF | 1,165,083 | 75,917 | 0.7% |
2 | Vanguard Small-Cap Growth ETF | 713,200 | 47,749 | 0.5% |
|
|
| 123,666 | 1.2% |
Total Common Stocks (Cost $9,440,700) |
| 10,035,220 | 95.5%3 | |
14
|
|
| Market | Percentage |
|
|
| Value• | of Net |
|
| Shares | ($000) | Assets |
Temporary Cash Investments |
|
|
| |
Money Market Fund |
|
|
| |
4 | Vanguard Market Liquidity Fund, 2.304% | 446,189,699 | 446,190 | 4.3% |
4 | Vanguard Market Liquidity Fund, 2.304%—Note G | 179,089,300 | 179,089 | 1.7% |
|
|
| 625,279 | 6.0% |
|
| Face |
|
|
|
| Amount |
|
|
|
| ($000) |
|
|
Repurchase Agreement |
|
|
| |
| JP Morgan Securities Inc. 1.960%, 5/1/08 |
|
|
|
| (Dated 4/30/08, Repurchase Value $36,402,000, |
|
|
|
| Collateralized by Federal National Mortgage Assn., |
|
|
|
| 4.500%–6.000%, 3/1/23–1/1/38) | 36,400 | 36,400 | 0.3% |
|
|
|
|
|
† 5 | U.S. Agency Obligations |
| 31,893 | 0.3% |
|
|
|
|
|
|
|
|
|
|
Total Temporary Cash Investments (Cost $693,568) |
| 693,572 | 6.6%3 | |
Total Investments (Cost $10,134,268) |
| 10,728,792 | 102.1% | |
Liability for Covered Call Options Written |
|
|
| |
|
|
|
|
|
|
|
|
|
|
|
| Written |
|
|
|
| Contracts |
|
|
| TiVo Inc., Expires 5/17/08, Strike Price $12.50 | 2,657 | (14) | 0.0% |
| TiVo Inc., Expires 5/17/08, Strike Price $10.00 | 1,960 | (19) | 0.0% |
| TiVo Inc., Expires 6/21/08, Strike Price $10.00 | 2,792 | (84) | 0.0% |
Total Covered Call Options Written (Premium Received $311) |
| (117) | 0.0% | |
Other Assets and Liabilities |
|
|
| |
Other Assets—Note C |
| 88,865 | 0.9% | |
Other Liabilities—Note G |
| (312,376) | (3.0%) | |
|
|
| (223,511) | (2.1%) |
Net Assets |
| 10,505,164 | 100.0% | |
15
At April 30, 2008, net assets consisted of:6 |
|
| Amount |
| ($000) |
Paid-in Capital | 10,252,667 |
Overdistributed Net Investment Income | (9,419) |
Accumulated Net Realized Losses | (353,154) |
Unrealized Appreciation (Depreciation) |
|
Investment Securities | 594,524 |
Futures Contracts | 20,411 |
Covered Call Options Written | 194 |
Foreign Currencies | (59) |
Net Assets | 10,505,164 |
|
|
Investor Shares—Net Assets |
|
Applicable to 113,536,780 outstanding $.001 par value shares of |
|
beneficial interest (unlimited authorization) | 7,461,841 |
Net Asset Value Per Share—Investor Shares | $65.72 |
|
|
Admiral Shares—Net Assets |
|
Applicable to 49,722,041 outstanding $.001 par value shares of |
|
beneficial interest (unlimited authorization) | 3,043,323 |
Net Asset Value Per Share—Admiral Shares | $61.21 |
• | See Note A in Notes to Financial Statements. |
* | Non-income-producing security. |
^ | Part of security position is on loan to broker-dealers. See Note G in Notes to Financial Statements. |
? Securities with a value of $6,098,000 have been segregated for covered call options written.
† Represents the aggregate value, by category, of securities that are not among the 50 largest holdings and, in total for any issuer, represent 1% or less of net assets.
1 Considered an affiliated company of the fund as the fund owns more than 5% of the outstanding voting securities of such company. See Note I in Notes to Financial Statements.
2 Considered an affiliated company of the fund as the issuer is another member of The Vanguard Group.
3 The fund invests a portion of its cash reserves in equity markets through the use of index futures contracts. After giving effect to futures investments, the fund’s effective common stock and temporary cash investment positions represent 98.2% and 3.9%, respectively, of net assets. See Note E in Notes to Financial Statements.
4 Affiliated money market fund available only to Vanguard funds and certain trusts and accounts managed by Vanguard. Rate shown is the 7-day yield.
5 Securities with a value of $31,893,000 have been segregated as initial margin for open futures contracts.
6 See Note E in Notes to Financial Statements for the tax-basis components of net assets.
16
Statement of Operations
| Six Months Ended |
| April 30, 2008 |
| ($000) |
Investment Income |
|
Income |
|
Dividends1,2 | 29,756 |
Interest2 | 12,367 |
Security Lending | 2,593 |
Total Income | 44,716 |
Expenses |
|
Investment Advisory Fees—Note B |
|
Basic Fee | 9,175 |
Performance Adjustment | (1,875) |
The Vanguard Group—Note C |
|
Management and Administrative—Investor Shares | 9,945 |
Management and Administrative—Admiral Shares | 1,122 |
Marketing and Distribution—Investor Shares | 837 |
Marketing and Distribution—Admiral Shares | 450 |
Custodian Fees | 36 |
Shareholders’ Reports—Investor Shares | 82 |
Shareholders’ Reports—Admiral Shares | 62 |
Trustees’ Fees and Expenses | 8 |
Total Expenses | 19,842 |
Expenses Paid Indirectly—Note D | (347) |
Net Expenses | 19,495 |
Net Investment Income | 25,221 |
Realized Net Gain (Loss) |
|
Investment Securities Sold2 | (253,696) |
Futures Contracts | (61,151) |
Covered Call Options Written | 68 |
Foreign Currencies | (149) |
Realized Net Gain (Loss) | (314,928) |
Change in Unrealized Appreciation (Depreciation) |
|
Investment Securities | (1,430,191) |
Futures Contracts | 4,985 |
Covered Call Options Written | 194 |
Foreign Currencies | (72) |
Change in Unrealized Appreciation (Depreciation) | (1,425,084) |
Net Increase (Decrease) in Net Assets Resulting from Operations | (1,714,791) |
1 Dividends are net of foreign withholding taxes of $271,000.
2 Dividend income, interest income, and realized net gain (loss) from affiliated companies of the fund were $1,599,000, $10,839,000, and $184,000, respectively.
17
Statement of Changes in Net Assets
| Six Months Ended | Year Ended |
| April 30, | October 31, |
| 2008 | 2007 |
| ($000) | ($000) |
Increase (Decrease) in Net Assets |
|
|
Operations |
|
|
Net Investment Income | 25,221 | 59,448 |
Realized Net Gain (Loss) | (314,928) | 1,101,439 |
Change in Unrealized Appreciation (Depreciation) | (1,425,084) | 583,721 |
Net Increase (Decrease) in Net Assets Resulting from Operations | (1,714,791) | 1,744,608 |
Distributions |
|
|
Net Investment Income |
|
|
Investor Shares | (32,844) | (33,478) |
Admiral Shares | (19,834) | (18,985) |
Realized Capital Gain1 |
|
|
Investor Shares | (718,954) | (776,690) |
Admiral Shares | (293,372) | (300,195) |
Total Distributions | (1,065,004) | (1,129,348) |
Capital Share Transactions—Note H |
|
|
Investor Shares | 492,649 | (19,018) |
Admiral Shares | 203,285 | 211,543 |
Net Increase (Decrease) from Capital Share Transactions | 695,934 | 192,525 |
Total Increase (Decrease) | (2,083,861) | 807,785 |
Net Assets |
|
|
Beginning of Period | 12,589,025 | 11,781,240 |
End of Period2 | 10,505,164 | 12,589,025 |
1 Includes fiscal 2008 and 2007 short-term gain distributions totaling $233,465,000 and $122,716,000, respectively. Short-term gain distributions are treated as ordinary income dividends for tax purposes.
2 Net Assets—End of Period includes undistributed (overdistributed) net investment income of ($9,419,000) and $18,187,000.
18
Financial Highlights
Investor Shares |
|
|
|
|
|
|
| Six Months |
|
|
|
|
|
| Ended |
|
|
|
|
|
For a Share Outstanding | April 30, | Year Ended October 31, | ||||
Throughout Each Period | 2008 | 2007 | 2006 | 2005 | 2004 | 2003 |
Net Asset Value, Beginning of Period | $83.93 | $80.26 | $76.67 | $67.01 | $63.17 | $44.60 |
Investment Operations |
|
|
|
|
|
|
Net Investment Income (Loss) | .156 | .362 | .302 | .111 | (.05) | (.012) |
Net Realized and Unrealized Gain (Loss) |
|
|
|
|
|
|
on Investments | (11.270) | 11.052 | 9.724 | 9.622 | 3.89 | 18.587 |
Total from Investment Operations | (11.114) | 11.414 | 10.026 | 9.733 | 3.84 | 18.575 |
Distributions |
|
|
|
|
|
|
Dividends from Net Investment Income | (.310) | (.320) | (.230) | — | — | (.005) |
Distributions from Realized Capital Gains | (6.786) | (7.424) | (6.206) | (.073) | — | — |
Total Distributions | (7.096) | (7.744) | (6.436) | (.073) | — | (.005) |
Net Asset Value, End of Period | $65.72 | $83.93 | $80.26 | $76.67 | $67.01 | $63.17 |
|
|
|
|
|
|
|
Total Return1 | –13.66% | 15.31% | 13.59% | 14.53% | 6.08% | 41.65% |
|
|
|
|
|
|
|
Ratios/Supplemental Data |
|
|
|
|
|
|
Net Assets, End of Period (Millions) | $7,462 | $8,937 | $8,517 | $7,836 | $7,302 | $5,662 |
Ratio of Total Expenses to |
|
|
|
|
|
|
Average Net Assets2 | 0.42%* | 0.41% | 0.46% | 0.51% | 0.57% | 0.72% |
Ratio of Net Investment Income (Loss) |
|
|
|
|
|
|
to Average Net Assets | 0.41%* | 0.44% | 0.36% | 0.16% | (0.11%) | (0.08%) |
Portfolio Turnover Rate | 113%* | 90% | 96% | 80% | 82% | 77% |
1 Total returns do not include the account service fee that may be applicable to certain accounts with balances below $10,000.
2 Includes performance-based investment advisory fee increases (decreases) of (0.03%), (0.04%), (0.03%), (0.01%), 0.02%, and 0.07%.
* | Annualized. |
19
Admiral Shares |
|
|
|
|
|
|
| Six Months |
|
|
|
|
|
| Ended |
|
|
|
|
|
For a Share Outstanding | April 30, | Year Ended October 31, | ||||
Throughout Each Period | 2008 | 2007 | 2006 | 2005 | 2004 | 2003 |
Net Asset Value, Beginning of Period | $78.25 | $74.82 | $71.47 | $62.37 | $58.71 | $41.43 |
Investment Operations |
|
|
|
|
|
|
Net Investment Income | .202 | .478 | .422 | .215 | .04 | .064 |
Net Realized and Unrealized Gain (Loss) |
|
|
|
|
|
|
on Investments | (10.499) | 10.299 | 9.050 | 8.953 | 3.62 | 17.259 |
Total from Investment Operations | (10.297) | 10.777 | 9.472 | 9.168 | 3.66 | 17.323 |
Distributions |
|
|
|
|
|
|
Dividends from Net Investment Income | (.427) | (.437) | (.346) | — | — | (.043) |
Distributions from Realized Capital Gains | (6.316) | (6.910) | (5.776) | (.068) | — | — |
Total Distributions | (6.743) | (7.347) | (6.122) | (.068) | — | (.043) |
Net Asset Value, End of Period | $61.21 | $78.25 | $74.82 | $71.47 | $62.37 | $58.71 |
|
|
|
|
|
|
|
Total Return | –13.58% | 15.53% | 13.79% | 14.70% | 6.23% | 41.85% |
|
|
|
|
|
|
|
Ratios/Supplemental Data |
|
|
|
|
|
|
Net Assets, End of Period (Millions) | $3,043 | $3,652 | $3,264 | $2,402 | $1,161 | $721 |
Ratio of Total Expenses to |
|
|
|
|
|
|
Average Net Assets1 | 0.24%* | 0.23% | 0.28% | 0.34% | 0.43% | 0.57% |
Ratio of Net Investment Income to |
|
|
|
|
|
|
Average Net Assets | 0.59%* | 0.62% | 0.54% | 0.33% | 0.04% | 0.05% |
Portfolio Turnover Rate | 113%* | 90% | 96% | 80% | 82% | 77% |
1 Includes performance-based investment advisory fee increases (decreases) of (0.03%), (0.04%), (0.03%), (0.01%), 0.02%, and 0.07%.
* | Annualized. |
See accompanying Notes, which are an integral part of the Financial Statements.
20
Notes to Financial Statements
Vanguard Explorer Fund is registered under the Investment Company Act of 1940 as an open-end investment company, or mutual fund. The fund offers two classes of shares, Investor Shares and Admiral Shares. Investor Shares are available to any investor who meets the fund’s minimum purchase requirements. Admiral Shares are designed for investors who meet certain administrative, service, tenure, and account-size criteria.
A. The following significant accounting policies conform to generally accepted accounting principles for U.S. mutual funds. The fund consistently follows such policies in preparing its financial statements.
1. Security Valuation: Securities are valued as of the close of trading on the New York Stock Exchange (generally 4 p.m., Eastern time) on the valuation date. Equity securities are valued at the latest quoted sales prices or official closing prices taken from the primary market in which each security trades; such securities not traded on the valuation date are valued at the mean of the latest quoted bid and asked prices. Securities for which market quotations are not readily available, or whose values have been affected by events occurring before the fund’s pricing time but after the close of the securities’ primary markets, are valued at their fair values calculated according to procedures adopted by the board of trustees. These procedures include obtaining quotations from an independent pricing service, monitoring news to identify significant market- or security-specific events, and evaluating changes in the values of foreign market proxies (for example, ADRs, futures contracts, or exchange-traded funds) between the time the foreign markets close and the fund’s pricing time. When fair-value pricing is employed, the prices of securities used by a fund to calculate its net asset value may differ from quoted or published prices for the same securities. Investments in Vanguard Market Liquidity Fund are valued at that fund’s net asset value. Temporary cash investments acquired over 60 days to maturity are valued using the latest bid prices or using valuations based on a matrix system (which considers such factors as security prices, yields, maturities, and ratings), both as furnished by independent pricing services. Other temporary cash investments are valued at amortized cost, which approximates market value.
2. Foreign Currency: Securities and other assets and liabilities denominated in foreign currencies are translated into U.S. dollars using exchange rates obtained from an independent third party as of the fund’s pricing time on the valuation date. Realized gains (losses) and unrealized appreciation (depreciation) on investment securities include the effects of changes in exchange rates since the securities were purchased, combined with the effects of changes in security prices. Fluctuations in the value of other assets and liabilities resulting from changes in exchange rates are recorded as unrealized foreign currency gains (losses) until the assets or liabilities are settled in cash, at which time they are recorded as realized foreign currency gains (losses).
3. Covered Call Options Written: The fund may write covered call options on security holdings that are considered to be attractive long-term investments but are believed to be overvalued in the short-term. When the fund writes options, the premium received by the fund is recorded as an asset with an equal liability which is marked-to-market to reflect the current market value of the options written. Fluctuations in the value of the options are recorded as unrealized appreciation (depreciation) until expired, closed, or exercised, at which time realized gains (losses) are recognized. Options are valued at their latest quoted sales prices. Options not traded on the valuation date are valued at the latest quoted asked prices.
4. Futures Contracts: The fund uses index futures contracts to a limited extent, with the objective of maintaining full exposure to the stock market while maintaining liquidity. The fund may purchase or sell futures contracts to achieve a desired level of investment, whether to accommodate portfolio turnover
21
or cash flows from capital share transactions. The primary risks associated with the use of futures contracts are imperfect correlation between changes in market values of stocks held by the fund and the prices of futures contracts, and the possibility of an illiquid market.
Futures contracts are valued at their quoted daily settlement prices. The aggregate principal amounts of the contracts are not recorded in the Statement of Net Assets. Fluctuations in the value of the contracts are recorded in the Statement of Net Assets as an asset (liability) and in the Statement of Operations as unrealized appreciation (depreciation) until the contracts are closed, when they are recorded as realized futures gains (losses).
5. Repurchase Agreements: The fund may invest in repurchase agreements. Securities pledged as collateral for repurchase agreements are held by a custodian bank until the agreements mature. Each agreement requires that the market value of the collateral be sufficient to cover payments of interest and principal; however, in the event of default or bankruptcy by the other party to the agreement, retention of the collateral may be subject to legal proceedings.
6. Federal Income Taxes: The fund intends to continue to qualify as a regulated investment company and distribute all of its taxable income. Management has analyzed the fund’s tax positions taken on federal income tax returns for all open tax years (tax years ended October 31, 2004–2007) and for the period ended April 30, 2008, and has concluded that no provision for federal income tax is required in the fund’s financial statements.
7. Distributions: Distributions to shareholders are recorded on the ex-dividend date.
8. Security Lending: The fund may lend its securities to qualified institutional borrowers to earn additional income. Security loans are required to be secured at all times by collateral at least equal to the market value of securities loaned. The fund invests cash collateral received in Vanguard Market Liquidity Fund, and records a liability for the return of the collateral, during the period the securities are on loan. Security lending income represents the income earned on investing cash collateral, less expenses associated with the loan.
9. Other: Dividend income is recorded on the ex-dividend date. Interest income includes income distributions received from Vanguard Market Liquidity Fund and is accrued daily. Security transactions are accounted for on the date securities are bought or sold. Costs used to determine realized gains (losses) on the sale of investment securities are those of the specific securities sold.
Each class of shares has equal rights as to assets and earnings, except that each class separately bears certain class-specific expenses related to maintenance of shareholder accounts (included in Management and Administrative expenses) and shareholder reporting. Marketing and distribution expenses are allocated to each class of shares based on a method approved by the board of trustees. Income, other non-class-specific expenses, and gains and losses on investments are allocated to each class of shares based on its relative net assets.
B. AXA Rosenberg Investment Management LLC, Chartwell Investment Partners, L.P., Granahan Investment Management, Inc., Kalmar Investment Advisers, and Wellington Management Company, LLP, each provide investment advisory services to a portion of the fund for fees calculated at an annual percentage rate of average net assets managed by the advisor. The basic fees of Chartwell Investment Partners, Granahan Investment Management, Inc., Kalmar Investment Advisers, and Wellington Management Company are subject to quarterly adjustments based on performance for the preceding
22
three years relative to the Russell 2500 Growth Index. In accordance with the advisory contract entered into with AXA Rosenberg Investment Management LLC in June 2007, beginning May 1, 2008, the investment advisory fee will be subject to quarterly adjustments based on performance since July 31, 2007, relative to the Russell 2500 Growth Index. In February 2008, The Vanguard Group assumed responsibility for the portion of the fund previously managed by Grantham, Mayo, Van Otterloo & Co. LLC. The basic fee paid to Grantham, Mayo, Van Otterloo & Co. LLC was subject to quarterly adjustments based on performance for the preceding three years relative to the Russell 2500 Growth Index.
The Vanguard Group provides investment advisory services to a portion of the fund on an at-cost basis; the fund paid Vanguard advisory fees of $274,000 for the six months ended April 30, 2008.
For the six months ended April 30, 2008, the aggregate investment advisory fee represented an effective annual basic rate of 0.17% of the fund’s average net assets before a decrease of $1,875,000 (0.03%) based on performance.
In June 2008, the board of trustees announced the addition of a seventh advisor, Century Capital Management, LLC, to manage a portion of the fund’s assets.
C. The Vanguard Group furnishes at cost corporate management, administrative, marketing, and distribution services. The costs of such services are allocated to the fund under methods approved by the board of trustees. The fund has committed to provide up to 0.40% of its net assets in capital contributions to Vanguard. At April 30, 2008, the fund had contributed capital of $862,000 to Vanguard (included in Other Assets), representing 0.01% of the fund’s net assets and 0.86% of Vanguard’s capitalization. The fund’s trustees and officers are also directors and officers of Vanguard.
D. The fund has asked its investment advisors to direct certain security trades, subject to obtaining the best price and execution, to brokers who have agreed to rebate to the fund part of the commissions generated. Such rebates are used solely to reduce the fund’s management and administrative expenses. The fund’s custodian bank has also agreed to reduce its fees when the fund maintains cash on deposit in the non-interest-bearing custody account. For the six months ended April 30, 2008, these arrangements reduced the fund’s management and administrative expenses by $328,000 and custodian fees by $19,000.
E. Distributions are determined on a tax basis and may differ from net investment income and realized capital gains for financial-reporting purposes. Differences may be permanent or temporary. Permanent differences are reclassified among capital accounts in the financial statements to reflect their tax character. Temporary differences arise when certain items of income, expense, gain, or loss are recognized in different periods for financial statement and tax purposes; these differences will reverse at some time in the future. Differences in classification may also result from the treatment of short-term gains as ordinary income for tax purposes. The fund’s tax-basis capital gains and losses are determined only at the end of each fiscal year.
During the six months ended April 30, 2008, the fund realized net foreign currency losses of $149,000, which decreased distributable net income for tax purposes; accordingly, such losses have been reclassified from accumulated net realized losses to overdistributed net investment income. Certain of the fund’s investments are in securities considered to be “passive foreign investment companies,” for which any unrealized appreciation and/or realized gains are required to be included in distributable
23
net income for tax purposes. Unrealized appreciation through October 31, 2007, on passive foreign investment company holdings at April 30, 2008, was $7,646,000, all of which has been distributed and is reflected in the balance of overdistributed net investment income.
At April 30, 2008, the cost of investment securities for tax purposes was $10,141,914,000. Net unrealized appreciation of investment securities for tax purposes was $586,878,000, consisting of unrealized gains of $1,480,718,000 on securities that had risen in value since their purchase and $893,840,000 in unrealized losses on securities that had fallen in value since their purchase.
At April 30, 2008, the aggregate settlement value of open futures contracts expiring in June 2008 and the related unrealized appreciation (depreciation) were:
|
|
| ($000) |
|
| Aggregate | Unrealized |
| Number of | Settlement | Appreciation |
Futures Contracts | Long Contracts | Value | (Depreciation) |
Russell 2000 Index | 665 | 238,569 | 18,048 |
E-mini S&P MidCap Index | 304 | 25,539 | 1,247 |
E-mini Russell 2000 Index | 183 | 13,130 | 100 |
E-mini NASDAQ 100 Index | 255 | 9,809 | 1,016 |
Unrealized appreciation (depreciation) on open futures contracts is required to be treated as realized gain (loss) for tax purposes.
F. During the six months ended April 30, 2008, the fund purchased $5,883,175,000 of investment securities and sold $6,150,167,000 of investment securities, other than temporary cash investments.
The following table summarizes the fund’s covered call options written during the six months ended April 30, 2008:
| Number of | Premiums |
| Contracts | Received |
Covered Call Options | Written | ($000) |
Balance at October 31, 2007 | — | — |
Options written | 7,909 | 379 |
Options expired | (500) | (68) |
Options closed | — | — |
Options exercised | — | — |
Options open at April 30, 2008 | 7,409 | 311 |
24
G. The market value of securities on loan to broker-dealers at April 30, 2008, was $168,757,000, for which the fund received cash collateral of $179,089,000.
H. Capital share transactions for each class of shares were:
| Six Months Ended | Year Ended | ||
| April 30, 2008 | October 31, 2007 | ||
| Amount | Shares | Amount | Shares |
| ($000) | (000) | ($000) | (000) |
Investor Shares |
|
|
|
|
Issued | 546,171 | 8,008 | 1,002,407 | 12,663 |
Issued in Lieu of Cash Distributions | 742,164 | 10,728 | 798,597 | 10,589 |
Redeemed | (795,686) | (11,679) | (1,820,022) | (22,892) |
Net Increase (Decrease)—Investor Shares | 492,649 | 7,057 | (19,018) | 360 |
Admiral Shares |
|
|
|
|
Issued | 267,906 | 4,155 | 762,605 | 10,288 |
Issued in Lieu of Cash Distributions | 293,573 | 4,559 | 309,959 | 4,415 |
Redeemed | (358,194) | (5,661) | (861,021) | (11,658) |
Net Increase (Decrease)—Admiral Shares | 203,285 | 3,053 | 211,543 | 3,045 |
I. Certain of the fund’s investments are in companies that are considered to be affiliated companies of the fund because the fund owns more than 5% of the outstanding voting securities of the company. Transactions during the period in securities of these companies were as follows:
|
| Current Period Transactions |
| ||
| October 31, 2007 |
| Proceeds from |
| April 30, 2008 |
| Market | Purchases | Securities | Dividend | Market |
| Value | at Cost | Sold | Income | Value |
| ($000) | ($000) | ($000) | ($000) | ($000) |
Advanta Corp. Class A | NA1 | 7,825 | — | 177 | 7,590 |
The Advisory Board Co. | 60,415 | 11,642 | 20,473 | — | NA2 |
| 60,415 |
|
| 177 | 7,590 |
1 At October 31, 2007, the issuer was not an affiliated company of the fund.
2 At April 30, 2008, the security was still held but the issuer was no longer an affiliated company of the fund.
25
About Your Fund’s Expenses
As a shareholder of the fund, you incur ongoing costs, which include costs for portfolio management, administrative services, and shareholder reports (like this one), among others. Operating expenses, which are deducted from a fund’s gross income, directly reduce the investment return of the fund.
A fund’s expenses are expressed as a percentage of its average net assets. This figure is known as the expense ratio. The following examples are intended to help you understand the ongoing costs (in dollars) of investing in your fund and to compare these costs with those of other mutual funds. The examples are based on an investment of $1,000 made at the beginning of the period shown and held for the entire period.
The table below illustrates your fund’s costs in two ways:
• Based on actual fund return. This section helps you to estimate the actual expenses that you paid over the period. The “Ending Account Value” shown is derived from the fund’s actual return, and the third column shows the dollar amount that would have been paid by an investor who started with $1,000 in the fund. You may use the information here, together with the amount you invested, to estimate the expenses that you paid over the period.
To do so, simply divide your account value by $1,000 (for example, an $8,600 account value divided by $1,000 = 8.6), then multiply the result by the number given for your fund under the heading “Expenses Paid During Period.”
• Based on hypothetical 5% yearly return. This section is intended to help you compare your fund’s costs with those of other mutual funds. It assumes that the fund had a yearly return of 5% before expenses, but that the expense ratio is unchanged. In this case—because the return used is not the fund’s actual return—the results do not apply to your investment. The example is useful in making comparisons because the Securities and Exchange Commission requires all mutual funds to calculate expenses based on a 5% return. You can assess your fund’s costs by comparing this hypothetical example with the hypothetical examples that appear in shareholder reports of other funds.
Six Months Ended April 30, 2008 |
|
|
|
| Beginning | Ending | Expenses |
| Account Value | Account Value | Paid During |
Explorer Fund | 10/31/2007 | 4/30/2008 | Period1 |
Based on Actual Fund Return |
|
|
|
Investor Shares | $1,000.00 | $863.35 | $1.95 |
Admiral Shares | 1,000.00 | 864.15 | 1.11 |
Based on Hypothetical 5% Yearly Return |
|
|
|
Investor Shares | $1,000.00 | $1,022.77 | $2.11 |
Admiral Shares | 1,000.00 | 1,023.67 | 1.21 |
1 The calculations are based on expenses incurred in the most recent six-month period. The fund’s annualized six-month expense ratios for that period are 0.42% for Investor Shares and 0.24% for Admiral Shares. The dollar amounts shown as “Expenses Paid” are equal to the annualized expense ratio multiplied by the average account value over the period, multiplied by the number of days in the most recent six-month period, then divided by the number of days in the most recent 12-month period.
26
Note that the expenses shown in the table on page 26 are meant to highlight and help you compare ongoing costs only and do not reflect transaction costs incurred by the fund for buying and selling securities. Further, the expenses do not include the account service fee described in the prospectus. If such a fee were applied to your account, your costs would be higher. Your fund does not charge transaction fees, such as purchase or redemption fees, nor does it carry a “sales load.”
The calculations assume no shares were bought or sold during the period. Your actual costs may have been higher or lower, depending on the amount of your investment and the timing of any purchases or redemptions.
You can find more information about the fund’s expenses, including annual expense ratios, in the Financial Statements section of this report. For additional information on operating expenses and other shareholder costs, please refer to your fund’s current prospectus.
27
Notice to Shareholders
Explorer Fund Adds an Investment Advisor
The board of trustees of Vanguard Explorer Fund has announced the addition of Century Capital Management, LLC (Century Capital), to the fund’s investment advisory team. This addition will allow the fund to retain its character as a diversified small-cap growth equity offering and ensure additional long-term investment capacity for the fund. The board of trustees concluded that Century Capital’s quality management team and investment approach would complement the fund’s existing advisors. The fund will now have a team of seven accomplished advisory firms providing an attractive combination of investment approaches that should benefit fund shareholders over the long term.
Century Capital is a Boston-based investment management boutique owned by the investment professionals within the firm. The firm traces its origins to 1928 and the founding of Century Shares Trust. The six-member group of investment professionals at the firm forms a young but solid team with an average of 14 years’ experience in investment management. The vast majority of their time is spent on small- and small/mid-cap products.
The addition of Century Capital is not expected to result in a material change in the fund’s expense ratios, which are estimated to be 0.42% for Investor Shares and 0.24% for Admiral Shares. The expense ratio of the average small-cap growth fund is 1.61% (derived from data provided by Lipper Inc.).
Additional Information
Vanguard Explorer Fund has entered into a new investment advisory agreement with Century Capital in addition to the fund’s current agreements with Granahan Investment Management, Inc., Wellington Management Company, LLP, Kalmar Investment Advisers, AXA Rosenberg Investment Management LLC, and Chartwell Investment Partners, L.P. Vanguard’s Quantitative Equity Group also manages a portion of the fund’s assets on an at-cost basis. This addition to the advisor lineup will not affect the fund’s investment objective, policies, or strategies. The fee schedules for the other advisors have not changed.
Under the terms of the fund’s agreement with Century Capital, the fund will pay Century Capital a fee at the end of each fiscal quarter. The fee will be calculated as a percentage of the Century Capital subportfolio’s average daily net assets during the quarter. The quarterly payment to Century Capital may be increased or decreased by applying a performance adjustment. The adjustment is based on the performance of the portion of the fund managed by Century Capital over a trailing 36-month period, as compared with the return of a 50/50 split of the Russell 2500 and 2500 Growth Indexes over the same period.
For the fiscal year ended October 31, 2007, the Explorer Fund incurred aggregate investment advisory fees of $21,326,000, or 0.17% of the fund’s net assets, before a decrease of $5,033,000, or 0.04%, based on performance. The investment advisory fee paid to the advisors was $16,293,000 (representing an effective annual rate of 0.13%). Of these aggregate fees, the investment advisory fee paid to Vanguard for this same period was $884,000 (representing an effective annual rate of less than 0.01%). The addition of Century Capital is not expected to materially increase the fund’s total annual investment advisory fees for the current fiscal year.
The Explorer Fund receives corporate, management, administrative, distribution, and certain investment advisory services on an at-cost basis from The Vanguard Group, Inc., P.O. Box 1110, Valley Forge, PA 19482.
29
Board approval of the investment advisory agreement with Century Capital Management, LLC
The Explorer Fund’s board of trustees retained Century Capital under the terms of a new investment advisory agreement. Each of the fund’s seven investment advisors is responsible for managing the investment and reinvestment of its portion of the fund’s assets and for continuously reviewing, supervising, and administering the fund’s investment program. Each advisor is subject to supervision and oversight by Vanguard’s Portfolio Review Department and by the officers and trustees of the fund. The board of trustees designates the proportion of fund assets to be managed by each advisor and may change these proportions at any time.
The trustees’ decision to add Century Capital to the fund’s multimanager structure was based upon the board’s most recent evaluation of the fund’s investment staff, portfolio management process, short-and long-term performance results, current external advisory arrangements, and at-cost internalized management arrangement. In considering whether to approve the agreement, the board engaged in arm’s-length discussions with Century Capital and considered the following factors among others:
• The board considered the benefits to shareholders of adding Century Capital as a new advisor based on the nature, extent, and quality of services to be provided by the firm. The board noted that adding Century Capital as an advisor would allow the fund to retain its character as a diversified small-and mid-cap growth offering. The board concluded that Century Capital’s quality management team and fundamental investment approach make it an attractive candidate to complement the fund’s existing advisors and ensure additional, long-term investment capacity for the fund.
• The board analyzed the performance of other funds and accounts managed by Century Capital. The board noted that the firm’s other U.S. small/mid-cap product (Century Small Cap Select Fund) has strong investment returns and has posted competitive results by outperforming relevant benchmarks and competitors over the long term.
��� The board considered the advisory fee schedule and estimated expense ratio of the fund and compared them with the average advisory fee and expense ratio of the fund’s peer group. The board concluded that the addition of Century Capital would not result in a material change in the fund’s investment advisory fees, and therefore the fund’s expense ratio would remain at a substantial discount to the fund’s peers.
• The board considered the extent to which economies of scale would be realized as the fund grows, including a consideration of appropriate breakpoints in Century Capital’s advisory fee schedule. By including asset-based breakpoints in the fee schedule, the fund’s trustees ensure that, if the portion of the fund managed by Century Capital continues to grow, investors will capture economies of scale in the form of a lower advisory fee rate.
• Based on its informed business judgment, the board concluded that the course of action in the best interests of the fund and its shareholders was to approve the agreement to hire Century Capital.
The new agreement will continue for two years from its effective date and is renewable after that for successive one-year periods. The agreement will be reviewed annually by the fund’s board of trustees, a majority of whom are not “interested persons” of either the fund or its advisors as defined in federal securities laws. The board also considers annually whether the fund and its shareholders continue to benefit from receiving investment advisory services from Vanguard on an at-cost basis. The board may, at any time, reallocate the fund’s assets among the seven advisors, or allocate assets of the fund to other investment advisors, without terminating or revising the fund’s current agreements.
29
Background information on Century Capital Management
Century Capital Management, LLC, located at 100 Federal Street, Boston, MA 02110, is an independent investment advisory firm that provides services to institutions and individuals. Independent research is a core tenet of the firm’s investment philosophy. Century Capital employs a fundamental, bottom-up investment approach that attempts to identify reasonably priced companies that will grow faster than the overall market. As of April 30, 2008, Century Capital managed approximately $2.3 billion in assets. The manager primarily responsible for overseeing Century Capital’s portion of the Explorer Fund is:
Alexander L. Thorndike, Chief Investment Officer and Managing Partner at Century Capital. He has worked in investment management since 1988, has managed investment portfolios for Century Capital since 1999, and has managed the Century Capital portion of the fund since June 2008. Education: A.B., Harvard University; M.B.A., J.L. Kellogg Graduate School of Management at Northwestern University.
30
Trustees Approve Advisory Arrangements
The board of trustees of Vanguard Explorer Fund has renewed the fund’s investment advisory arrangements with Granahan Investment Management, Inc.; Wellington Management Company, LLP; Kalmar Investment Advisers; AXA Rosenberg Investment Management LLC; Chartwell Investment Partners, L.P.; and The Vanguard Group, Inc. The board determined that the retention of the advisors was in the best interests of the fund and its shareholders.
The board based its decision upon an evaluation of each advisor’s investment staff, portfolio management process, and performance. The trustees considered the factors discussed below, among others. However, no single factor determined whether the board approved the arrangements. Rather, it was the totality of the circumstances that drove the board’s decision.
Nature, extent, and quality of services
The board considered the quality of the fund’s investment management over both the short and long term, and took into account the organizational depth and stability of each advisor. The board noted the following:
Granahan Investment Management. Granahan, founded in 1985, specializes in small-cap growth equity investing. The firm uses fundamental research to select a portfolio of 125–175 stocks with sustainable growth characteristics. The advisor achieves portfolio diversification through dedicated allocations to three categories of growth companies: core growth (40%–70% of sub-portfolio assets), companies with strong market position, based on proprietary products or services; pioneers (15%–30%), companies with unique technology or innovations; and special value (15%–30%), companies with growth potential overlooked by the market. The firm has advised a portion of the fund since 1990.
Wellington Management Company. Founded in 1928, Wellington Management is among the nation’s oldest and most respected institutional managers. The firm has advised Vanguard Explorer Fund since the fund’s inception in 1967. Using a bottom-up, fundamentally driven approach, Wellington Management invests opportunistically in a diversified portfolio of high-quality stocks. The advisor attempts to identify companies that are early in their growth cycle. The research-intensive approach is supported by the team’s deep and tenured analytical staff, which may also leverage Wellington Management’s deep industry research capabilities.
Kalmar Investment Advisers. Kalmar Investment Advisers, together with its parent company, Kalmar Investments Inc., specializes in smaller-cap growth equity investing. Kalmar Investment Advisers is a research-driven firm that is entirely focused on the management of “growth with value” portfolios of smaller-cap stocks. Kalmar believes that there is a high-reward and low-risk anomaly offered by the equity market in the stocks of solid, well-managed, rapidly growing smaller companies. Through independent fundamental research, Kalmar attempts to discover such companies, buy them at undervalued levels, and own them for the longer term. The firm has advised a portion of the fund since 2005.
AXA Rosenberg Investment Management. AXA Rosenberg, founded in 1985, is an independently operated subsidiary of the AXA Group. AXA Rosenberg employs an investment philosophy grounded in fundamental analysis using a two-part quantitative model: a valuation model and an earnings-forecast model. The valuation model compares the current price of a company’s stock with its fair value calculated through an independent asset appraisal. The earnings-forecast model uses a mix of fundamental indicators and market data to identify companies that appear likely to have superior year-ahead earnings. The two models are combined to develop an individual predicted return for each company. A portfolio optimized against the Russell 2500 Growth Index is the result. AXA Rosenberg has managed a portion of the fund since 2007.
31
Chartwell Investment Partners. Founded in 1997, Chartwell has expertise in small-cap equity management. The firm employs a fundamental, bottom-up strategy seeking companies with superior growth potential at lower relative valuations. Chartwell has managed assets of the fund since 1997.
The Vanguard Group. Vanguard has been managing investments for more than two decades.
George U. Sauter, Vanguard managing director and chief investment officer, has been in the investment management business since 1985, and has led the Quantitative Equity Group since 1987. James D. Troyer, the principal responsible for the day-to-day management of the fund, has been with Vanguard since 1989. The Quantitative Equity Group adheres to a sound, disciplined investment management process; the team has considerable experience, stability, and depth. Vanguard has managed a portion of the fund since 1997.
The board concluded that each advisor’s experience, stability, depth, and performance, among other factors, warranted continuation of the advisory arrangements.
Investment performance
The board considered the short- and long-term performance of the fund, including any periods of outperformance or underperformance of a relevant benchmark and peer group. The board concluded that each advisor has carried out the fund’s investment strategy in disciplined fashion, and that performance results have allowed the fund to remain competitive versus its benchmark and its average peer fund. Information about the fund’s most recent performance can be found in the Performance Summary section of this report.
Cost
The board concluded that the fund’s expense ratio was far below the average expense ratio charged by funds in its peer group. The board noted that the fund’s advisory fee rate was also well below the peer-group average. Information about the fund’s expense ratio appears in the About Your Fund’s Expenses section of this report as well as in the Financial Statements section, which also includes information about the advisory fee rate.
The board did not consider profitability of Granahan, Wellington Management, Kalmar, AXA Rosenberg, and Chartwell in determining whether to approve the advisory fees, because the firms are independent of Vanguard and the advisory fees are the result of arm’s-length negotiations. The board does not conduct a profitability analysis of Vanguard because of Vanguard’s unique “at-cost” structure. Unlike most other mutual fund management companies, Vanguard is owned by the funds it oversees, and produces “profits” only in the form of reduced expenses for fund shareholders.
The benefit of economies of scale
The board concluded that the fund’s shareholders benefit from economies of scale because of breakpoints in the advisory fee schedules for Granahan, Wellington Management, Kalmar, AXA Rosenberg, and Chartwell. The breakpoints reduce the effective rate of the fees as the fund’s assets managed by each firm increase.
The board also concluded that the fund’s low-cost arrangement with Vanguard ensures that the fund will realize economies of scale as it grows, with the cost to shareholders declining as the fund’s assets managed by Vanguard increase.
The board will consider whether to renew the advisory arrangements again after a one-year period.
32
Glossary
Beta. A measure of the magnitude of a fund’s past share-price fluctuations in relation to the ups and downs of a given market index. The index is assigned a beta of 1.00. Compared with a given index, a fund with a beta of 1.20 typically would have seen its share price rise or fall by 12% when the index rose or fell by 10%. For this report, beta is based on returns over the past 36 months for both the fund and the index. Note that a fund’s beta should be reviewed in conjunction with its R-squared (see definition below). The lower the R-squared, the less correlation there is between the fund and the index, and the less reliable beta is as an indicator of volatility.
Earnings Growth Rate. The average annual rate of growth in earnings over the past five years for the stocks now in a fund.
Equity Exposure. A measure that reflects a fund’s investments in stocks and stock futures. Any holdings in short-term reserves are excluded.
Expense Ratio. The percentage of a fund’s average net assets used to pay its annual administrative and advisory expenses. These expenses directly reduce returns to investors.
Foreign Holdings. The percentage of a fund represented by stocks or depositary receipts
of companies based outside the United States.
Inception Date. The date on which the assets of a fund (or one of its share classes) are first invested in accordance with the fund’s investment objective. For funds with a subscription period, the inception date is the day after that period ends. Investment performance is measured from the inception date.
Median Market Cap. An indicator of the size of companies in which a fund invests; the midpoint of market capitalization (market price x shares outstanding) of a fund’s stocks, weighted by the proportion of the fund’s assets invested in each stock. Stocks representing half of the fund’s assets have market capitalizations above the median, and the rest are below it.
Price/Book Ratio. The share price of a stock divided by its net worth, or book value, per share. For a fund, the weighted average price/book ratio of the stocks it holds.
Price/Earnings Ratio. The ratio of a stock’s current price to its per-share earnings over the past year. For a fund, the weighted average P/E of the stocks it holds. P/E is an indicator of market expectations about corporate prospects; the higher the P/E, the greater the expectations for a company’s future growth.
R-Squared. A measure of how much of a fund’s past returns can be explained by the returns from the market in general, as measured by a given index. If a fund’s total returns were precisely synchronized with an index’s returns, its R-squared would be 1.00. If the fund’s returns bore no relationship to the index’s returns, its R-squared would be 0. For this report, R-squared is based on returns over the past 36 months for both the fund and the index.
Return on Equity. The annual average rate of return generated by a company during the past five years for each dollar of shareholder’s equity (net income divided by shareholder’s equity). For a fund, the weighted average return on equity for the companies whose stocks it holds.
Short-Term Reserves. The percentage of a fund invested in highly liquid, short-term securities that can be readily converted to cash.
33
Turnover Rate. An indication of the fund’s trading activity. Funds with high turnover rates incur higher transaction costs and may be more likely to distribute capital gains (which may be taxable to investors). The turnover rate excludes in-kind transactions, which have minimal impact on costs.
Yield. A fund’s 30-day SEC yield is derived using a formula specified by the U.S. Securities and Exchange Commission. Under the formula, data related to the fund’s security holdings in the previous 30 days are used to calculate the fund’s hypothetical net income for that period, which is then annualized and divided by the fund’s estimated average net assets over the calculation period. For the purposes of this calculation, a security’s income is based on its current market yield to maturity (in the case of bonds) or its projected dividend yield (for stocks). Because the SEC yield represents hypothetical annualized income, it will differ—at times significantly—from the fund’s actual experience. As a result, the fund’s income distributions may be higher or lower than implied by the SEC yield.
34
This page intentionally left blank.
The People Who Govern Your Fund
The trustees of your mutual fund are there to see that the fund is operated and managed in your best interests since, as a shareholder, you are a part owner of the fund. Your fund’s trustees also serve on the board of directors of The Vanguard Group, Inc., which is owned by the Vanguard funds and provides services to them on an at-cost basis.
A majority of Vanguard’s board members are independent, meaning that they have no affiliation with Vanguard or the funds they oversee, apart from the sizable personal investments they have made as private individuals.
Our independent board members bring distinguished backgrounds in business, academia, and public service to their task of working with Vanguard officers to establish the policies and oversee the activities of the funds. Among board members’ responsibilities are selecting investment advisors for the funds; monitoring fund operations, performance, and costs; reviewing contracts; nominating and selecting new trustees/directors; and electing Vanguard officers.
Each trustee serves a fund until its termination; or until the trustee’s retirement, resignation, or death; or otherwise as specified in the fund’s organizational documents. Any trustee may be removed at a shareholders’ meeting by a vote representing two-thirds of the net asset value of all shares of the fund together with shares of other Vanguard funds organized within the same trust. The table on these two pages shows information for each trustee and executive officer of the fund. The mailing address of the trustees and officers is P.O. Box 876, Valley Forge, PA 19482.
Chairman of the Board, Chief Executive Officer, and Trustee | |
|
|
John J. Brennan1 |
|
Born 1954 | Principal Occupation(s) During the Past Five Years: Chairman of the Board, Chief Executive |
Trustee since May 1987; | Officer, and Director/Trustee of The Vanguard Group, Inc., and of each of the investment |
Chairman of the Board and | companies served by The Vanguard Group; Director of Vanguard Marketing Corporation. |
Chief Executive Officer |
|
155 Vanguard Funds Overseen |
|
|
|
Independent Trustees |
|
|
|
Charles D. Ellis |
|
Born 1937 | Principal Occupation(s) During the Past Five Years: Applecore Partners (pro bono ventures |
Trustee since January 2001 | in education); Senior Advisor to Greenwich Associates (international business strategy |
155 Vanguard Funds Overseen | consulting); Successor Trustee of Yale University; Overseer of the Stern School of Business |
| at New York University; Trustee of the Whitehead Institute for Biomedical Research. |
|
|
Emerson U. Fullwood |
|
Born 1948 | Principal Occupation(s) During the Past Five Years: Executive Chief Staff and Marketing |
Trustee since January 2008 | Officer for North America since 2004 and Corporate Vice President of Xerox Corporation |
155 Vanguard Funds Overseen | (photocopiers and printers); Director of SPX Corporation (multi-industry manufacturing), |
| of the United Way of Rochester, and of the Boy Scouts of America. |
|
|
Rajiv L. Gupta |
|
Born 1945 | Principal Occupation(s) During the Past Five Years: Chairman, President, and |
Trustee since December 20012 | Chief Executive Officer of Rohm and Haas Co. (chemicals); Board Member of |
155 Vanguard Funds Overseen | the American Chemistry Council; Director of Tyco International, Ltd. (diversified |
| manufacturing and services) since 2005. |
|
|
Amy Gutmann |
|
Born 1949 | Principal Occupation(s) During the Past Five Years: President of the University of |
Trustee since June 2006 | Pennsylvania since 2004; Professor in the School of Arts and Sciences, Annenberg School |
155 Vanguard Funds Overseen | for Communication, and Graduate School of Education of the University of Pennsylvania |
| since 2004; Provost (2001–2004) and Laurance S. Rockefeller Professor of Politics and |
| the University Center for Human Values (1990–2004), Princeton University; Director of |
| Carnegie Corporation of New York since 2005 and of Schuylkill River Development |
| Corporation and Greater Philadelphia Chamber of Commerce since 2004; Trustee of |
| the National Constitution Center since 2007. |
JoAnn Heffernan Heisen |
|
Born 1950 | Principal Occupation(s) During the Past Five Years: Corporate Vice President and |
Trustee since July 1998 | Chief Global Diversity Officer since 2006, Vice President and Chief Information |
155 Vanguard Funds Overseen | Officer (1997–2005), and Member of the Executive Committee of Johnson & |
| Johnson (pharmaceuticals/consumer products); Director of the University Medical |
| Center at Princeton and Women’s Research and Education Institute. |
|
|
André F. Perold |
|
Born 1952 | Principal Occupation(s) During the Past Five Years: George Gund Professor of Finance |
Trustee since December 2004 | and Banking, Harvard Business School; Senior Associate Dean and Director of Faculty |
155 Vanguard Funds Overseen | Recruiting, Harvard Business School; Director and Chairman of UNX, Inc. (equities |
| trading firm); Chair of the Investment Committee of HighVista Strategies LLC (private |
| investment firm) since 2005. |
|
|
Alfred M. Rankin, Jr. |
|
Born 1941 | Principal Occupation(s) During the Past Five Years: Chairman, President, Chief Executive |
Trustee since January 1993 | Officer, and Director of NACCO Industries, Inc. (forklift trucks/housewares/lignite); Director |
155 Vanguard Funds Overseen | of Goodrich Corporation (industrial products/aircraft systems and services). |
|
|
|
|
J. Lawrence Wilson |
|
Born 1936 | Principal Occupation(s) During the Past Five Years: Retired Chairman and Chief Executive |
Trustee since April 1985 | Officer of Rohm and Haas Co. (chemicals); Director of Cummins Inc. (diesel engines) and |
155 Vanguard Funds Overseen | AmerisourceBergen Corp. (pharmaceutical distribution); Trustee of Vanderbilt University |
| and of Culver Educational Foundation. |
|
|
|
|
Executive Officers1 |
|
|
|
Thomas J. Higgins |
|
Born 1957 | Principal Occupation(s) During the Past Five Years: Principal of The Vanguard Group, Inc.; |
Treasurer since July 1998 | Treasurer of each of the investment companies served by The Vanguard Group. |
155 Vanguard Funds Overseen |
|
|
|
|
|
F. William McNabb III |
|
Born 1957 | Principal Occupation(s) During the Past Five Years: President of The Vanguard Group, Inc., |
President since March 2008 | and of each of the investment companies served by The Vanguard Group since 2008; |
155 Vanguard Funds Overseen | Director of Vanguard Marketing Corporation; Managing Director of The Vanguard Group |
| (1995–2008). |
|
|
Heidi Stam |
|
Born 1956 | Principal Occupation(s) During the Past Five Years: Managing Director of The Vanguard |
Secretary since July 2005 | Group, Inc., since 2006; General Counsel of The Vanguard Group since 2005; Secretary of |
155 Vanguard Funds Overseen | The Vanguard Group, and of each of the investment companies served by The Vanguard |
| Group, since 2005; Director and Senior Vice President of Vanguard Marketing Corporation |
| since 2005; Principal of The Vanguard Group (1997–2006). |
Vanguard Senior Management Team |
|
| |
|
|
|
|
R. Gregory Barton | Kathleen C. Gubanich | Michael S. Miller | Glenn W. Reed |
Mortimer J. Buckley | Paul A. Heller | Ralph K. Packard | George U. Sauter |
Founder |
|
John C. Bogle |
Chairman and Chief Executive Officer, 1974–1996 |
1 Officers of the funds are “interested persons” as defined in the Investment Company Act of 1940.
2 December 2002 for Vanguard Equity Income Fund, Vanguard Growth Equity Fund, the Vanguard Municipal Bond Funds, and the Vanguard State Tax-Exempt Funds.
More information about the trustees is in the Statement of Additional Information, available from The Vanguard Group.
|
|
| P.O. Box 2600 |
| Valley Forge, PA 19482-2600 |

Connect with Vanguard® > www.vanguard.com
Fund Information > 800-662-7447 | Vanguard, Vanguard.com, Admiral, Explorer, Connect |
| with Vanguard, Vanguard Flagship Services, and the ship |
Direct Investor Account Services > 800-662-2739 | logo are trademarks of The Vanguard Group, Inc. |
|
|
Institutional Investor Services > 800-523-1036 | CFA® is a trademark owned by CFA Institute. |
|
|
Text Telephone for People | All other marks are the exclusive property of their |
With Hearing Impairment > 800-952-3335 | respective owners. |
|
|
| All comparative mutual fund data are from Lipper Inc. |
| or Morningstar, Inc., unless otherwise noted. |
This material may be used in conjunction |
|
with the offering of shares of any Vanguard | You can obtain a free copy of Vanguard’s proxy voting |
fund only if preceded or accompanied by | guidelines by visiting our website, www.vanguard.com, |
the fund’s current prospectus. | and searching for “proxy voting guidelines,” or by |
| calling Vanguard at 800-662-2739. The guidelines are |
| also available from the SEC’s website, www.sec.gov. |
| In addition, you may obtain a free report on how your |
| fund voted the proxies for securities it owned during |
| the 12 months ended June 30. To get the report, visit |
| either www.vanguard.com or www.sec.gov. |
|
|
|
|
| You can review and copy information about your fund |
| at the SEC’s Public Reference Room in Washington, D.C. |
| To find out more about this public service, call the SEC |
| at 202-551-8090. Information about your fund is also |
| available on the SEC’s website, and you can receive |
| copies of this information, for a fee, by sending a |
| request in either of two ways: via e-mail addressed to |
| publicinfo@sec.gov or via regular mail addressed to the |
| Public Reference Section, Securities and Exchange |
|
|
|
|
|
|
| © 2008 The Vanguard Group, Inc. |
| All rights reserved. |
| Vanguard Marketing Corporation, Distributor. |
|
|
| Q242 062008 |
Vanguard® Explorer™ Fund |
Schedule of Investments |
April 30, 2008 |
|
|
|
| Market |
|
|
|
| Value |
|
|
| Shares | ($000) |
Common Stocks (95.5%)1 |
|
| ||
Consumer Discretionary (12.5%) |
|
| ||
|
| Auto Components (1.2%) |
|
|
|
| Autoliv, Inc. | 483,280 | 29,596 |
* |
| The Goodyear Tire & Rubber Co. | 818,278 | 21,913 |
* |
| TRW Automotive Holdings Corp. | 808,720 | 20,671 |
* |
| Tenneco Automotive, Inc. | 729,800 | 18,668 |
|
| WABCO Holdings Inc. | 390,244 | 18,638 |
* |
| Lear Corp. | 174,200 | 4,977 |
|
| BorgWarner, Inc. | 100,100 | 4,920 |
* |
| Aftermarket Technology Corp. | 164,608 | 3,771 |
* |
| Exide Technologies | 162,499 | 2,371 |
|
| Strattec Security Corp. | 17,530 | 645 |
* |
| Hawk Corp. Class A | 29,800 | 510 |
* |
| Amerigon Inc. | 19,000 | 279 |
|
| Standard Motor Products, Inc. | 19,494 | 119 |
|
| Automobiles (0.0%) |
|
|
|
| Thor Industries, Inc. | 79,900 | 2,423 |
|
| Distributors (0.3%) |
|
|
* |
| LKQ Corp. | 1,226,070 | 26,679 |
* |
| KSW, Inc. | 39,800 | 226 |
* |
| Aristotle Corp | 2,932 | 27 |
|
| Diversified Consumer Services (1.7%) |
|
|
|
| Service Corp. International | 5,238,256 | 58,197 |
|
| DeVry, Inc. | 992,610 | 56,579 |
* |
| Capella Education Co. | 313,219 | 20,199 |
* |
| ITT Educational Services, Inc. | 193,300 | 14,818 |
|
| Matthews International Corp. | 227,100 | 11,228 |
* |
| INVESTools Inc. | 600,500 | 6,960 |
* |
| Pre-Paid Legal Services, Inc. | 122,408 | 5,354 |
|
| Sotheby’s | 89,022 | 2,466 |
|
| Strayer Education, Inc. | 8,400 | 1,560 |
* |
| Bright Horizons Family Solutions, Inc. | 20,400 | 967 |
* |
| Hillenbrand Inc. | 13,500 | 257 |
* |
| Nobel Learning Communities, Inc. | 580 | 8 |
|
| Hotels, Restaurants & Leisure (2.0%) |
|
|
* |
| WMS Industries, Inc. | 982,546 | 35,558 |
* |
| Penn National Gaming, Inc. | 601,307 | 25,688 |
|
| Darden Restaurants Inc. | 551,868 | 19,635 |
* |
| Papa John’s International, Inc. | 612,000 | 16,524 |
* | ^ | Life Time Fitness, Inc. | 405,005 | 14,722 |
* |
| Jack in the Box Inc. | 361,500 | 9,670 |
* |
| Bally Technologies Inc. | 282,234 | 9,508 |
* |
| Melco PBL Entertainment (MACAU) Ltd. | 618,335 | 8,162 |
* |
| Texas Roadhouse, Inc. | 663,038 | 7,824 |
|
| Burger King Holdings Inc. | 234,600 | 6,545 |
|
| CBRL Group, Inc. | 175,742 | 6,492 |
* |
| Chipotle Mexican Grill, Inc. Class B | 74,780 | 6,354 |
* |
| Red Robin Gourmet Burgers, Inc. | 154,500 | 6,347 |
* |
| Gaylord Entertainment Co. | 208,325 | 6,171 |
|
| Choice Hotels International, Inc. | 130,700 | 4,508 |
* |
| Sonic Corp. | 191,200 | 4,204 |
* |
| Denny’s Corp. | 1,314,100 | 4,139 |
* |
| Town Sports International Holdings, Inc. | 388,502 | 2,883 |
* | ^ | Chipotle Mexican Grill, Inc. | 22,800 | 2,237 |
|
| Dover Downs Gaming & Entertainment, Inc. | 246,850 | 1,995 |
* |
| Buffalo Wild Wings Inc. | 60,000 | 1,845 |
* |
| Einstein Noah Restaurant Group Inc. | 127,800 | 1,438 |
| ^ | Triarc Cos., Inc. Class B | 184,130 | 1,307 |
|
| International Speedway Corp. | 23,213 | 985 |
|
| Dover Motorsports, Inc. | 76,310 | 467 |
* |
| Red Lion Hotels Corp. | 48,360 | 459 |
* |
| Rubio’s Restaurants, Inc. | 58,170 | 349 |
|
| Wendy’s International, Inc. | 11,400 | 331 |
* |
| Morton’s Restaurant Group Inc. | 33,785 | 270 |
|
| Churchill Downs, Inc. | 4,988 | 255 |
* |
| Carrols Restaurant Group Inc. | 29,480 | 237 |
* |
| Nathan’s Famous Inc | 8,738 | 116 |
* |
| Premier Exhibitions Inc. | 17,100 | 99 |
* |
| Silverleaf Resorts, Inc. | 8,320 | 18 |
|
| Household Durables (0.2%) |
|
|
|
| Newell Rubbermaid, Inc. | 450,000 | 9,239 |
* |
| NVR, Inc. | 9,050 | 5,552 |
|
| Tupperware Brands Corp. | 68,000 | 2,679 |
* |
| Universal Electronics, Inc. | 88,483 | 2,274 |
|
| Blyth, Inc. | 125,013 | 2,105 |
| ^ | Tempur-Pedic International Inc. | 152,800 | 1,698 |
|
| American Greetings Corp. Class A | 11,169 | 200 |
* |
| Loud Technologies Inc. | 14,172 | 84 |
* |
| Q.E.P. Co. Inc. | 5,417 | 40 |
|
| Internet & Catalog Retail (0.2%) |
|
|
* | ^ | Priceline.com, Inc. | 77,000 | 9,828 |
| ^ | Systemax Inc. | 298,091 | 4,769 |
* |
| Hollywood Media Corp. | 1,561,823 | 4,061 |
* |
| GSI Commerce, Inc. | 153,400 | 2,135 |
* |
| PC Mall, Inc. | 88,500 | 1,164 |
* |
| PetMed Express, Inc. | 32,000 | 359 |
* |
| 1-800-FLOWERS.COM, Inc. | 25,448 | 224 |
* |
| Gaiam, Inc. | 9,598 | 169 |
|
| Leisure Equipment & Products (0.1%) |
|
|
| ^ | Polaris Industries, Inc. | 97,100 | 4,520 |
* |
| JAKKS Pacific, Inc. | 27,578 | 648 |
|
| Hasbro, Inc. | 16,098 | 572 |
* |
| RC2 Corp. | 6,952 | 129 |
|
| Media (1.4%) |
|
|
* |
| DreamWorks Animation SKG, Inc. | 1,099,567 | 30,744 |
* |
| Lamar Advertising Co. Class A | 495,300 | 19,584 |
* |
| Marvel Entertainment, Inc. | 358,500 | 10,285 |
|
| National CineMedia Inc. | 437,896 | 8,390 |
* |
| Morningstar, Inc. | 140,734 | 8,160 |
|
| Interactive Data Corp. | 288,900 | 7,795 |
|
| Arbitron Inc. | 141,770 | 6,782 |
* |
| Discovery Holding Co. Class A | 292,775 | 6,781 |
| ^ | New York Times Co. Class A | 334,900 | 6,531 |
|
| John Wiley & Sons Class A | 128,600 | 5,922 |
|
| Regal Entertainment Group Class A | 302,390 | 5,733 |
* |
| Valassis Communications, Inc. | 391,200 | 5,555 |
|
| Meredith Corp. | 141,900 | 4,599 |
* |
| Harris Interactive Inc. | 1,466,700 | 3,667 |
* |
| Gemstar-TV Guide International, Inc. | 735,550 | 2,964 |
|
| Harte-Hanks, Inc. | 123,300 | 1,684 |
* | ^ | Sirius Satellite Radio, Inc. | 625,300 | 1,607 |
* |
| XM Satellite Radio Holdings, Inc. | 108,500 | 1,210 |
|
| Warner Music Group Corp. | 106,710 | 927 |
* |
| Entravision Communications Corp. | 116,756 | 816 |
* |
| Nexstar Broadcasting Group, Inc. | 126,700 | 715 |
* |
| Alloy, Inc. | 94,761 | 655 |
* | ^ | Mediacom Communications Corp. | 110,750 | 475 |
* |
| Getty Images, Inc. | 12,200 | 398 |
* |
| Global Sources Ltd. | 27,920 | 388 |
|
| Value Line, Inc. | 6,469 | 290 |
* |
| DG FastChannel Inc. | 11,800 | 220 |
|
| CKX, Inc. | 17,600 | 158 |
* |
| Triple Crown Media, Inc. | 13,340 | 7 |
|
| Multiline Retail (0.4%) |
|
|
* |
| Dollar Tree, Inc. | 790,883 | 24,992 |
* |
| Big Lots Inc. | 727,066 | 19,653 |
|
| Family Dollar Stores, Inc. | 9,900 | 212 |
| ^ | Bon-Ton Stores, Inc. | 10,010 | 88 |
|
| Specialty Retail (4.4%) |
|
|
* |
| GameStop Corp. Class A | 1,239,696 | 68,233 |
|
| Penske Automotive Group Inc. | 2,218,800 | 46,439 |
|
| Ross Stores, Inc. | 1,377,797 | 46,142 |
* |
| O’Reilly Automotive, Inc. | 1,412,491 | 40,779 |
* |
| Urban Outfitters, Inc. | 955,830 | 32,737 |
* |
| Rent-A-Center, Inc. | 1,243,800 | 26,779 |
|
| Aaron Rents, Inc. | 1,045,050 | 26,022 |
* |
| Tractor Supply Co. | 592,005 | 21,052 |
|
| Tiffany & Co. | 414,900 | 18,065 |
* |
| Aeropostale, Inc. | 464,290 | 14,760 |
|
| Advance Auto Parts, Inc. | 299,534 | 10,388 |
|
| OfficeMax, Inc. | 548,300 | 10,017 |
* |
| Dick’s Sporting Goods, Inc. | 292,975 | 8,379 |
|
| The Buckle, Inc. | 169,950 | 8,256 |
* |
| J. Crew Group, Inc. | 168,100 | 7,985 |
* |
| AnnTaylor Stores Corp. | 302,900 | 7,663 |
* |
| Collective Brands, Inc. | 596,900 | 7,384 |
* | ^ | Jos. A. Bank Clothiers, Inc. | 252,788 | 6,171 |
* |
| The Gymboree Corp. | 137,100 | 5,925 |
|
| RadioShack Corp. | 383,521 | 5,331 |
* |
| Hot Topic, Inc. | 953,414 | 5,063 |
* |
| The Dress Barn, Inc. | 368,500 | 4,960 |
|
| Limited Brands, Inc. | 237,200 | 4,393 |
* |
| The Wet Seal, Inc. Class A | 1,265,450 | 4,391 |
|
| American Eagle Outfitters, Inc. | 230,601 | 4,236 |
* |
| Tween Brands, Inc. | 206,310 | 3,920 |
* | ^ | Zumiez Inc. | 166,505 | 3,488 |
* |
| hhgregg, Inc. | 285,000 | 2,927 |
|
| Barnes & Noble, Inc. | 90,500 | 2,921 |
|
| Men’s Wearhouse, Inc. | 69,050 | 1,839 |
* | ^ | CarMax, Inc. | 73,300 | 1,521 |
|
| Guess ?, Inc. | 32,000 | 1,225 |
* |
| New York & Co., Inc. | 166,900 | 1,060 |
|
| Monro Muffler Brake, Inc. | 46,189 | 762 |
* |
| Cabela’s Inc. | 36,632 | 496 |
* |
| Jo-Ann Stores, Inc. | 23,725 | 449 |
* |
| Build-A-Bear-Workshop, Inc. | 32,670 | 356 |
* |
| Appliance Recycling Centers of America, Inc. | 22,260 | 129 |
* |
| West Marine, Inc. | 11,710 | 59 |
* |
| CSK Auto Corp. | 2,800 | 33 |
* |
| Conn’s, Inc. | 482 | 8 |
* |
| Jennifer Convertibles, Inc. | 4,000 | 7 |
* |
| AutoZone Inc. | 5 | 1 |
|
| Textiles, Apparel & Luxury Goods (0.6%) |
|
|
* |
| Deckers Outdoor Corp. | 79,300 | 10,949 |
* |
| Fossil, Inc. | 289,350 | 10,356 |
* |
| Hanesbrands Inc. | 247,100 | 8,653 |
* |
| Skechers U.S.A., Inc. | 342,316 | 8,096 |
|
| Wolverine World Wide, Inc. | 219,700 | 6,314 |
* |
| The Warnaco Group, Inc. | 128,600 | 5,934 |
* |
| Volcom, Inc. | 298,745 | 5,673 |
|
| Phillips-Van Heusen Corp. | 83,355 | 3,518 |
* |
| Lululemon Athletica, Inc. | 68,800 | 2,131 |
* |
| FGX International Holdings Ltd. | 160,000 | 2,088 |
* | ^ | Crocs, Inc. | 93,800 | 958 |
* |
| Maidenform Brands, Inc. | 62,400 | 930 |
* |
| G-III Apparel Group, Ltd. | 61,806 | 912 |
|
| Liz Claiborne, Inc. | 35,590 | 630 |
* |
| Culp, Inc. | 30,950 | 218 |
* |
| Carter’s, Inc. | 9,640 | 136 |
* |
| Man Sang Holdings, Inc. | 7,000 | 50 |
|
| Weyco Group, Inc. | 748 | 20 |
|
|
|
| 1,313,121 |
Consumer Staples (2.6%) |
|
| ||
* |
| Central European Distribution Corp. | 558,130 | 34,001 |
|
| Nu Skin Enterprises, Inc. | 1,690,630 | 30,313 |
|
| Longs Drug Stores, Inc. | 749,359 | 30,019 |
|
| Tyson Foods, Inc. | 1,022,100 | 18,193 |
* |
| Energizer Holdings, Inc. | 207,703 | 16,421 |
* |
| Performance Food Group Co. | 449,670 | 15,046 |
* |
| Chattem, Inc. | 213,300 | 14,905 |
|
| Flowers Foods, Inc. | 565,000 | 14,628 |
|
| Herbalife Ltd. | 291,500 | 12,762 |
|
| Hormel Foods Corp. | 272,300 | 10,731 |
|
| Diamond Foods, Inc. | 414,950 | 8,863 |
|
| PriceSmart, Inc. | 304,500 | 8,693 |
* | ^ | Bare Escentuals, Inc. | 332,790 | 7,591 |
|
| Spartan Stores, Inc. | 352,330 | 7,357 |
* |
| Darling International, Inc. | 439,400 | 6,710 |
* |
| NBTY, Inc. | 202,048 | 5,688 |
* |
| Winn-Dixie Stores, Inc. | 282,000 | 5,000 |
| ^ | Cal-Maine Foods, Inc. | 122,622 | 3,623 |
|
| Alberto-Culver Co. | 136,500 | 3,436 |
|
| Nash-Finch Co. | 74,426 | 2,723 |
|
| The Estee Lauder Cos. Inc. Class A | 51,613 | 2,354 |
|
| Reddy Ice Holdings, Inc. | 173,071 | 2,291 |
* |
| Fresh Del Monte Produce Inc. | 60,000 | 1,901 |
|
| Inter Parfums, Inc. | 63,780 | 1,847 |
|
| Church & Dwight, Inc. | 31,600 | 1,796 |
|
| Sanderson Farms, Inc. | 39,000 | 1,625 |
* |
| Omega Protein Corp. | 98,477 | 1,477 |
|
| Ingles Markets, Inc. | 47,433 | 1,082 |
* |
| Ralcorp Holdings, Inc. | 12,800 | 781 |
* |
| Elizabeth Arden, Inc. | 19,192 | 355 |
|
| Coca-Cola Bottling Co. | 4,100 | 235 |
* |
| Nutraceutical International Corp. | 18,200 | 205 |
|
| McCormick & Co., Inc. | 5,300 | 200 |
|
| Arden Group Inc. Class A | 1,203 | 161 |
* |
| Susser Holdings Corp. | 7,627 | 117 |
|
| Griffin Land & Nurseries, Inc. | 3,300 | 109 |
* |
| Physicians Formula Holdings, Inc. | 3,610 | 42 |
* | ^ | USANA Health Sciences, Inc. | 1,700 | 33 |
|
| Casey’s General Stores, Inc. | 162 | 4 |
* |
| Natural Alternatives International, Inc. | 205 | 1 |
|
|
|
| 273,319 |
Energy (10.6%) |
|
| ||
* |
| Ultra Petroleum Corp. | 656,350 | 54,523 |
|
| Tidewater Inc. | 773,790 | 50,467 |
* |
| Atwood Oceanics, Inc. | 494,434 | 49,785 |
|
| St. Mary Land & Exploration Co. | 1,103,910 | 48,263 |
* |
| Superior Energy Services, Inc. | 951,901 | 42,245 |
* |
| Comstock Resources, Inc. | 923,353 | 42,003 |
* |
| Helix Energy Solutions Group, Inc. | 1,093,393 | 37,777 |
|
| Rowan Cos., Inc. | 930,900 | 36,296 |
|
| CARBO Ceramics Inc. | 760,900 | 36,166 |
|
| XTO Energy, Inc. | 550,925 | 34,080 |
* |
| W-H Energy Services, Inc. | 417,959 | 32,304 |
* |
| Southwestern Energy Co. | 755,580 | 31,969 |
* |
| Oceaneering International, Inc. | 441,900 | 29,510 |
* | ^ | Delta Petroleum Corp. | 1,167,410 | 28,648 |
|
| Helmerich & Payne, Inc. | 508,197 | 27,316 |
* |
| FMC Technologies Inc. | 357,030 | 23,992 |
* |
| Core Laboratories N.V. | 179,440 | 22,480 |
* |
| Unit Corp. | 342,138 | 21,729 |
|
| Foundation Coal Holdings, Inc. | 359,249 | 21,548 |
* |
| Oil States International, Inc. | 415,247 | 20,787 |
* |
| Denbury Resources, Inc. | 668,800 | 20,439 |
* |
| Encore Acquisition Co. | 431,078 | 19,670 |
|
| Range Resources Corp. | 293,401 | 19,476 |
|
| Niko Resources Ltd. | 212,040 | 19,160 |
* |
| Mariner Energy Inc. | 663,286 | 18,280 |
* |
| OPTI Canada Inc. | 830,400 | 17,579 |
* |
| Lundin Petroleum AB | 1,137,000 | 15,801 |
|
| Penn Virginia Corp. | 289,063 | 15,176 |
* |
| Parallel Petroleum Corp. | 707,854 | 14,999 |
|
| Massey Energy Co. | 283,436 | 14,832 |
* |
| National Oilwell Varco Inc. | 196,338 | 13,439 |
* |
| Exterran Holdings, Inc. | 188,395 | 12,583 |
* |
| Quicksilver Resources, Inc. | 269,256 | 11,171 |
* |
| SandRidge Energy, Inc. | 223,920 | 10,117 |
* |
| Clean Energy Fuels Corp. | 730,200 | 9,507 |
* |
| Rosetta Resources, Inc. | 420,606 | 9,165 |
|
| W&T Offshore, Inc. | 195,328 | 7,989 |
| ^ | Frontline Ltd. | 141,700 | 7,944 |
* |
| ATP Oil & Gas Corp. | 266,720 | 7,666 |
* |
| Swift Energy Co. | 139,300 | 7,263 |
* |
| Willbros Group, Inc. | 193,700 | 6,991 |
* |
| Petrohawk Energy Corp. | 295,393 | 6,983 |
* |
| Uranium One Inc. | 1,504,400 | 6,946 |
* |
| EXCO Resources, Inc. | 307,837 | 6,871 |
* |
| Forest Oil Corp. | 108,755 | 6,409 |
* |
| ION Geophysical Corp. | 393,433 | 6,267 |
* |
| Bois d’Arc Energy, Inc. | 243,515 | 5,820 |
* |
| PetroQuest Energy, Inc. | 279,310 | 5,804 |
* |
| Hornbeck Offshore Services, Inc. | 111,700 | 5,570 |
* |
| Bill Barrett Corp. | 99,211 | 5,102 |
* |
| Whiting Petroleum Corp. | 65,866 | 5,040 |
* |
| Dawson Geophysical Co. | 66,300 | 4,796 |
* |
| Dresser Rand Group, Inc. | 125,400 | 4,586 |
* |
| Contango Oil & Gas Co. | 58,098 | 4,452 |
|
| Frontier Oil Corp. | 152,500 | 3,790 |
* |
| Parker Drilling Co. | 425,529 | 3,413 |
* |
| Continental Resources, Inc. | 77,192 | 3,317 |
* |
| Matrix Service Co. | 160,000 | 3,218 |
* | ^ | McMoRan Exploration Co. | 104,300 | 2,860 |
|
| Cabot Oil & Gas Corp. | 49,600 | 2,826 |
* |
| Gulfmark Offshore, Inc. | 47,064 | 2,814 |
* |
| Grey Wolf, Inc. | 442,000 | 2,771 |
* |
| Global Industries Ltd. | 168,810 | 2,694 |
* |
| T-3 Energy Services, Inc. | 49,270 | 2,602 |
* |
| Newpark Resources, Inc. | 449,909 | 2,470 |
|
| Gulf Island Fabrication, Inc. | 61,500 | 2,432 |
* |
| Complete Production Services, Inc. | 87,572 | 2,365 |
* |
| Callon Petroleum Co. | 113,795 | 2,276 |
* |
| Warren Resources Inc. | 180,451 | 2,216 |
* |
| SEACOR Holdings Inc. | 22,890 | 1,948 |
|
| Berry Petroleum Class A | 37,925 | 1,878 |
* |
| Basic Energy Services Inc. | 73,080 | 1,695 |
* |
| Trico Marine Services, Inc. | 44,944 | 1,694 |
|
| Cimarex Energy Co. | 23,700 | 1,477 |
* |
| Union Drilling, Inc. | 86,260 | 1,459 |
* |
| OYO Geospace Corp. | 29,894 | 1,447 |
* |
| Petroleum Development Corp. | 16,699 | 1,256 |
* |
| Cal Dive International, Inc. | 96,180 | 1,172 |
|
| Atlas America, Inc. | 14,497 | 1,008 |
|
| Knightsbridge Tankers Ltd. | 34,325 | 991 |
|
| Patterson-UTI Energy, Inc. | 33,000 | 922 |
|
| Lufkin Industries, Inc. | 11,692 | 882 |
|
| Holly Corp. | 18,000 | 747 |
* |
| Alpha Natural Resources, Inc. | 13,681 | 666 |
* |
| Vaalco Energy, Inc. | 96,400 | 625 |
|
| Ship Finance International Ltd. | 20,300 | 615 |
| ^ | Double Hull Tankers, Inc. | 53,800 | 551 |
* |
| Bolt Technology Corp. | 25,350 | 460 |
* |
| Energy Partners, Ltd. | 36,267 | 441 |
* |
| Pioneer Drilling Co. | 24,113 | 394 |
|
| Delek US Holdings, Inc. | 26,500 | 292 |
* |
| Gulfport Energy Corp. | 24,641 | 286 |
* |
| Harvest Natural Resources, Inc. | 28,940 | 275 |
* |
| NATCO Group Inc. | 3,900 | 197 |
* |
| Prime Energy Corp. | 625 | 36 |
* |
| International Coal Group, Inc. | 4,402 | 35 |
|
| APCO Argentina Inc. | 318 | 8 |
|
|
|
| 1,111,302 |
Financials (6.1%) |
|
| ||
|
| Cash America International Inc. | 1,086,900 | 44,335 |
* |
| Affiliated Managers Group, Inc. | 340,530 | 33,828 |
| ^ | CapitalSource Inc. REIT | 1,887,349 | 26,517 |
|
| Waddell & Reed Financial, Inc. | 756,000 | 25,598 |
|
| Jefferies Group, Inc. | 1,266,563 | 23,811 |
|
| Platinum Underwriters Holdings, Ltd. | 466,200 | 16,723 |
|
| Aspen Insurance Holdings Ltd. | 613,700 | 15,950 |
|
| U-Store-It Trust REIT | 1,229,000 | 14,834 |
|
| Eaton Vance Corp. | 392,300 | 14,358 |
* |
| ProAssurance Corp. | 262,500 | 13,868 |
* | ^ | Western Alliance Bancorp | 1,050,900 | 13,420 |
|
| People’s United Financial Inc. | 780,900 | 13,252 |
* |
| Markel Corp. | 30,500 | 13,249 |
|
| Reinsurance Group of America, Inc. | 251,100 | 13,052 |
* |
| Nasdaq Stock Market Inc. | 353,100 | 12,870 |
|
| Federated Investors, Inc. | 346,500 | 11,601 |
|
| Huntington Bancshares Inc. | 1,175,300 | 11,036 |
|
| Lazard Ltd. Class A | 277,035 | 10,843 |
|
| SEI Investments Co. | 451,700 | 10,511 |
* |
| Investment Technology Group, Inc. | 210,230 | 10,146 |
|
| UMB Financial Corp. | 201,311 | 9,993 |
|
| PartnerRe Ltd. | 131,416 | 9,722 |
|
| Janus Capital Group Inc. | 331,900 | 9,313 |
* |
| Interactive Brokers Group, Inc. | 293,530 | 9,267 |
|
| Digital Realty Trust, Inc. REIT | 225,650 | 8,744 |
* |
| SVB Financial Group | 170,700 | 8,306 |
2 |
| Advanta Corp. Class A | 1,000,000 | 7,590 |
|
| MFA Mortgage Investments, Inc. REIT | 1,077,700 | 7,533 |
| ^ | Greenhill & Co., Inc. | 112,357 | 7,309 |
* |
| Knight Capital Group, Inc. Class A | 384,868 | 7,201 |
* |
| Aberdeen Asset Management PLC | 2,546,387 | 7,119 |
|
| Ventas, Inc. REIT | 146,300 | 7,104 |
|
| Assurant, Inc. | 108,500 | 7,053 |
|
| Highwood Properties, Inc. REIT | 199,500 | 6,990 |
|
| Bank of Hawaii Corp. | 123,700 | 6,783 |
|
| Home Properties, Inc. REIT | 124,000 | 6,519 |
|
| Mid-America Apartment Communities, Inc. REIT | 124,100 | 6,515 |
|
| Transatlantic Holdings, Inc. | 99,374 | 6,444 |
|
| Tanger Factory Outlet Centers, Inc. REIT | 159,200 | 6,422 |
|
| UDR, Inc. REIT | 245,600 | 6,209 |
|
| First Community Bancorp | 288,200 | 6,193 |
|
| Jones Lang LaSalle Inc. | 78,600 | 6,100 |
* |
| Philadelphia Consolidated Holding Corp. | 163,600 | 6,034 |
|
| Taubman Co. REIT | 105,100 | 5,956 |
|
| Nationwide Health Properties, Inc. REIT | 159,700 | 5,752 |
|
| Washington REIT | 148,800 | 5,287 |
|
| QC Holdings Inc. | 586,580 | 5,144 |
|
| First Industrial Realty Trust REIT | 159,900 | 4,831 |
| ^ | The St. Joe Co. | 110,300 | 4,486 |
|
| Cullen/Frost Bankers, Inc. | 77,900 | 4,348 |
|
| IPC Holdings Ltd. | 142,600 | 4,151 |
|
| Max Re Capital Ltd. | 176,700 | 4,137 |
|
| Alexandria Real Estate Equities, Inc. REIT | 39,200 | 4,117 |
|
| Popular, Inc. | 321,578 | 4,010 |
* |
| Dollar Financial Corp. | 179,200 | 3,867 |
* |
| FCStone Group, Inc. | 87,585 | 3,628 |
| ^ | City Bank Lynnwood (WA) | 185,000 | 3,352 |
|
| National City Corp. | 500,000 | 3,150 |
| ^ | National Financial Partners Corp. | 113,260 | 3,049 |
* |
| MF Global Ltd. | 210,500 | 2,772 |
* |
| Alleghany Corp. | 7,731 | 2,663 |
|
| Southside Bancshares, Inc. | 102,830 | 2,481 |
* |
| Stifel Financial Corp. | 48,689 | 2,302 |
|
| Apartment Investment & Management Co. Class A REIT | 61,593 | 2,278 |
|
| Grubb & Ellis Co. | 352,500 | 2,164 |
|
| Rayonier Inc. REIT | 46,700 | 1,963 |
|
| Saul Centers, Inc. REIT | 37,400 | 1,866 |
|
| Gamco Investors Inc. Class A | 39,892 | 1,835 |
|
| SL Green Realty Corp. REIT | 19,556 | 1,815 |
|
| HCC Insurance Holdings, Inc. | 70,081 | 1,730 |
|
| Forest City Enterprise Class A | 45,300 | 1,673 |
|
| Weingarten Realty Investors REIT | 43,500 | 1,605 |
| ^ | GLG Partners, Inc. | 192,300 | 1,586 |
|
| Post Properties, Inc. REIT | 43,200 | 1,585 |
|
| Equity Lifestyle Properties, Inc. REIT | 30,700 | 1,518 |
|
| Entertainment Properties Trust REIT | 28,300 | 1,510 |
|
| The Hanover Insurance Group Inc. | 32,110 | 1,441 |
* |
| Cardtronics Inc. | 167,300 | 1,387 |
|
| Odyssey Re Holdings Corp. | 38,500 | 1,378 |
|
| Duke Realty Corp. REIT | 55,800 | 1,363 |
|
| Maguire Properties, Inc. REIT | 84,000 | 1,352 |
|
| Federal Realty Investment Trust REIT | 15,300 | 1,257 |
|
| City Holding Co. | 29,636 | 1,232 |
|
| Associated Estates Realty Corp. REIT | 96,510 | 1,168 |
|
| EastGroup Properties, Inc. REIT | 23,100 | 1,102 |
|
| Kilroy Realty Corp. REIT | 20,900 | 1,093 |
* |
| World Acceptance Corp. | 24,800 | 977 |
|
| Douglas Emmett, Inc. REIT | 38,254 | 909 |
|
| Getty Realty Holding Corp. REIT | 47,600 | 862 |
|
| NYMAGIC, Inc. | 29,033 | 661 |
* |
| Alexander’s, Inc. REIT | 1,700 | 606 |
|
| Suffolk Bancorp | 14,600 | 473 |
|
| Amtrust Financial Services Inc. | 25,800 | 401 |
|
| Westamerica Bancorporation | 6,600 | 386 |
|
| S & T Bancorp, Inc. | 10,700 | 365 |
|
| Frontier Financial Corp. | 20,400 | 326 |
|
| TrustCo Bank NY | 33,200 | 290 |
|
| Ramco-Gershenson Properties Trust REIT | 12,260 | 275 |
* |
| First Cash Financial Services, Inc. | 16,900 | 251 |
| ^ | The First Marblehead Corp. | 58,800 | 218 |
|
| Universal Insurance Holdings, INC. | 49,460 | 176 |
* | ^ | ZipRealty, Inc. | 27,275 | 136 |
| ^ | Sierra Bancorp | 5,536 | 120 |
|
| Sun Communities, Inc. REIT | 5,900 | 115 |
|
| East West Bancorp, Inc. | 7,900 | 112 |
|
| optionsXpress Holdings Inc. | 4,700 | 101 |
|
| Southwest Bancorp, Inc. | 5,601 | 99 |
|
| Fidelity Southern Corp. | 12,814 | 98 |
|
| TriCo Bancshares | 5,599 | 95 |
| ^ | First Busey Corp. | 4,800 | 95 |
|
| Urstadt Biddle Properties Class A REIT | 5,220 | 88 |
|
| SWS Group, Inc. | 6,060 | 80 |
* |
| MSCI, Inc.-Class A Shares | 2,300 | 71 |
* |
| Seabright Insurance Holdings, Inc. | 3,342 | 52 |
|
| StellarOne Corp. | 1,878 | 30 |
* |
| NewStar Financial, Inc. | 4,700 | 25 |
* |
| Reis, Inc. | 4,690 | 24 |
|
| Wesco Financial Corp. | 40 | 17 |
|
| United Western Bancorp. Inc. | 530 | 9 |
* |
| Robert Realty Investors, Inc. | 870 | 6 |
|
| Pathfinder Bancorp, Inc. | 580 | 5 |
|
| Peoples Bancorp of North Carolina | 366 | 5 |
|
| Meta Financial Group, Inc. | 109 | 2 |
|
| Investors Capital Holdings, Ltd. | 400 | 2 |
|
| First State Bancorporation | 100 | 1 |
|
|
|
| 644,213 |
Health Care (16.7%) |
|
| ||
|
| Biotechnology (4.2%) |
|
|
* |
| Cephalon, Inc. | 1,272,944 | 79,444 |
* |
| Millennium Pharmaceuticals, Inc. | 2,123,900 | 52,821 |
* |
| Alkermes, Inc. | 2,640,300 | 32,819 |
* | ^ | Isis Pharmaceuticals, Inc. | 2,161,049 | 25,457 |
* |
| Regeneron Pharmaceuticals, Inc. | 997,964 | 19,580 |
* |
| Celgene Corp. | 299,670 | 18,621 |
* | ^ | Amylin Pharmaceuticals, Inc. | 625,200 | 17,243 |
* |
| Human Genome Sciences, Inc. | 2,627,800 | 17,212 |
* |
| Medarex, Inc. | 2,267,600 | 16,259 |
* |
| LifeCell Corp. | 316,720 | 16,083 |
* |
| BioMarin Pharmaceutical Inc. | 435,800 | 15,889 |
* |
| Seattle Genetics, Inc. | 1,558,504 | 15,834 |
* |
| Applera Corp.-Celera Genomics Group | 1,055,091 | 14,117 |
* |
| Martek Biosciences Corp. | 399,630 | 14,091 |
* |
| PDL BioPharma Inc. | 1,033,110 | 13,699 |
* |
| Myriad Genetics, Inc. | 271,000 | 11,257 |
* |
| Onyx Pharmaceuticals, Inc. | 303,500 | 10,671 |
* |
| Alexion Pharmaceuticals, Inc. | 107,200 | 7,545 |
* |
| OSI Pharmaceuticals, Inc. | 173,700 | 6,019 |
* |
| Alnylam Pharmaceuticals Inc. | 225,400 | 5,653 |
* |
| Vertex Pharmaceuticals, Inc. | 195,347 | 4,985 |
* |
| Cell Genesys, Inc. | 1,210,500 | 4,648 |
* |
| ImmunoGen, Inc. | 1,286,000 | 4,141 |
* | ^ | Enzon Pharmaceuticals, Inc. | 465,000 | 4,055 |
* |
| Cytokinetics, Inc. | 890,149 | 3,071 |
* |
| United Therapeutics Corp. | 31,795 | 2,687 |
* |
| Incyte Corp. | 238,700 | 2,590 |
* |
| CV Therapeutics, Inc. | 250,853 | 2,295 |
* |
| XOMA Ltd. | 698,200 | 1,690 |
* |
| Cubist Pharmaceuticals, Inc. | 24,000 | 465 |
* |
| Momenta Pharmaceuticals, Inc. | 18,500 | 259 |
* |
| Celsion Corp. | 531 | 3 |
|
| Health Care Equipment & Supplies (3.7%) |
|
|
|
| DENTSPLY International Inc. | 1,144,539 | 44,488 |
* |
| Edwards Lifesciences Corp. | 579,400 | 32,110 |
* |
| Hologic, Inc. | 1,082,680 | 31,603 |
* |
| Haemonetics Corp. | 453,100 | 25,931 |
* |
| IDEXX Laboratories Corp. | 479,300 | 25,499 |
* |
| ResMed Inc. | 462,430 | 19,940 |
* |
| Align Technology, Inc. | 1,528,900 | 18,775 |
|
| Mindray Medical International Ltd. ADR | 548,900 | 18,663 |
|
| Cooper Cos., Inc. | 526,180 | 18,416 |
* |
| Intuitive Surgical, Inc. | 55,864 | 16,159 |
* |
| Inverness Medical Innovations, Inc. | 419,100 | 15,507 |
* |
| Varian Medical Systems, Inc. | 322,245 | 15,107 |
* |
| Cyberonics, Inc. | 889,200 | 14,049 |
* |
| Gen-Probe Inc. | 234,700 | 13,228 |
|
| Beckman Coulter, Inc. | 161,860 | 11,055 |
* |
| Kinetic Concepts, Inc. | 266,740 | 10,579 |
* |
| Immucor Inc. | 332,870 | 8,981 |
* | ^ | ArthroCare Corp. | 189,200 | 8,525 |
* |
| Cynosure Inc. | 256,130 | 6,665 |
* | ^ | Integra LifeSciences Holdings | 132,708 | 5,623 |
* |
| Zoll Medical Corp. | 128,448 | 4,288 |
|
| Meridian Bioscience Inc. | 148,000 | 3,986 |
* |
| Natus Medical Inc. | 191,098 | 3,759 |
|
| Invacare Corp. | 174,175 | 3,142 |
* |
| Masimo Corp. | 99,425 | 2,898 |
* |
| CryoLife Inc. | 261,855 | 2,781 |
|
| Mentor Corp. | 73,700 | 2,157 |
* |
| Merit Medical Systems, Inc. | 122,500 | 1,802 |
* |
| CONMED Corp. | 64,356 | 1,642 |
|
| Analogic Corp. | 27,866 | 1,605 |
* |
| Orthofix International N.V. | 50,766 | 1,562 |
* |
| Angiodynamics, Inc. | 75,178 | 1,111 |
* |
| Sonic Innovations, Inc. | 206,804 | 885 |
* |
| Osteotech, Inc. | 137,510 | 696 |
* |
| IRIS International, Inc. | 38,777 | 529 |
* |
| Medical Action Industries Inc. | 22,200 | 364 |
|
| Atrion Corp. | 2,111 | 236 |
|
| STERIS Corp. | 8,500 | 236 |
* |
| Northstar Neuroscience, Inc. | 52,300 | 94 |
* |
| Angeion Corp. | 11,890 | 85 |
* |
| Anika Resh Inc. | 8,580 | 74 |
* |
| MTS Medication Tech | 6,293 | 65 |
* |
| Greatbatch, Inc. | 3,040 | 55 |
* |
| Wright Medical Group, Inc. | 1,518 | 42 |
* |
| Vascular Solutions, Inc. | 4,451 | 28 |
* |
| SonoSite, Inc. | 760 | 24 |
|
| Health Care Providers & Services (3.5%) |
|
|
* |
| Henry Schein, Inc. | 870,542 | 48,202 |
* |
| Pediatrix Medical Group, Inc. | 423,027 | 28,774 |
* |
| Patterson Cos. | 761,750 | 26,052 |
* |
| Amedisys Inc. | 429,180 | 22,232 |
* |
| Health Net Inc. | 746,786 | 21,873 |
* |
| Community Health Systems, Inc. | 537,000 | 20,154 |
* |
| Psychiatric Solutions, Inc. | 496,940 | 17,249 |
* |
| LifePoint Hospitals, Inc. | 528,500 | 15,918 |
* |
| inVentiv Health, Inc. | 504,670 | 15,004 |
* |
| Sun Healthcare Group Inc. | 1,127,500 | 14,827 |
* |
| Coventry Health Care Inc. | 330,100 | 14,765 |
* |
| Healthways, Inc. | 398,530 | 14,558 |
|
| Universal Health Services Class B | 209,700 | 13,136 |
* |
| MWI Veterinary Supply Inc. | 310,143 | 10,691 |
* |
| DaVita, Inc. | 176,085 | 9,229 |
* |
| Lincare Holdings, Inc. | 327,500 | 7,971 |
|
| Chemed Corp. | 199,800 | 6,813 |
* |
| WellCare Health Plans Inc. | 143,000 | 6,261 |
|
| Owens & Minor, Inc. Holding Co. | 134,400 | 6,091 |
* |
| Skilled Healthcare Group Inc. | 460,500 | 5,572 |
* |
| Kindred Healthcare, Inc. | 223,500 | 5,304 |
* |
| Universal American Corp. | 424,710 | 4,557 |
* |
| Tenet Healthcare Corp. | 708,600 | 4,535 |
* | ^ | Emergency Medical Services LP Class A | 199,700 | 4,507 |
* |
| Air Methods Corp. | 103,680 | 4,158 |
* |
| Apria Healthcare Group Inc. | 188,300 | 3,318 |
* |
| Sunrise Senior Living, Inc. | 135,880 | 2,915 |
* |
| Gentiva Health Services, Inc. | 107,000 | 2,326 |
* |
| Providence Service Corp. | 67,900 | 1,911 |
* | ^ | Virtual Radiologic Corp. | 129,300 | 1,806 |
* |
| HMS Holdings Corp. | 69,119 | 1,781 |
* |
| CorVel Corp. | 49,000 | 1,612 |
* |
| Hanger Orthopedic Group, Inc. | 106,010 | 1,251 |
* |
| Healthspring, Inc. | 68,900 | 1,160 |
* |
| American Dental Partners, Inc. | 91,833 | 1,065 |
* |
| Res-Care, Inc. | 59,403 | 968 |
* |
| MedCath Corp. | 32,300 | 599 |
* |
| RehabCare Group, Inc. | 26,070 | 443 |
* |
| IntegraMed America, Inc. | 38,528 | 379 |
|
| National Healthcare Corp. | 6,926 | 347 |
* |
| Matria Healthcare, Inc. | 8,600 | 219 |
* |
| RadNet, Inc. | 30,728 | 215 |
* |
| Medical Staffing Network Holdings, Inc. | 8,099 | 35 |
|
| Birner Dental Management Services, Inc. | 200 | 4 |
|
| Health Care Technolgy (0.6%) |
|
|
* |
| The TriZetto Group, Inc. | 985,500 | 20,745 |
* |
| Eclipsys Corp. | 886,800 | 18,419 |
* |
| HLTH Corp. | 1,022,700 | 11,372 |
* |
| Cerner Corp. | 144,827 | 6,701 |
|
| IMS Health, Inc. | 165,300 | 4,091 |
* |
| A.D.A.M., Inc. | 10,070 | 70 |
|
| Life Science Tools & Services (2.9%) |
|
|
* |
| Covance, Inc. | 599,477 | 50,230 |
|
| Pharmaceutical Product Development, Inc. | 962,156 | 39,853 |
* |
| Qiagen NV | 1,378,400 | 30,614 |
* |
| Invitrogen Corp. | 253,387 | 23,709 |
* |
| Varian, Inc. | 353,106 | 17,984 |
* |
| Bruker BioSciences Corp. | 1,387,614 | 16,818 |
* |
| Luminex Corp. | 806,700 | 15,739 |
* |
| Illumina, Inc. | 193,637 | 15,082 |
* |
| Nektar Therapeutics | 3,125,900 | 15,067 |
* |
| Techne Corp. | 155,300 | 11,262 |
|
| PerkinElmer, Inc. | 388,838 | 10,328 |
* |
| Exelixis, Inc. | 1,108,300 | 8,434 |
* |
| Kendle International Inc. | 180,868 | 7,721 |
* |
| ICON Plc - ADR | 94,004 | 6,768 |
* |
| PAREXEL International Corp. | 242,472 | 6,159 |
* |
| Waters Corp. | 96,231 | 5,914 |
* |
| Charles River Laboratories, Inc. | 80,940 | 4,699 |
* |
| Dionex Corp. | 50,700 | 3,966 |
* |
| Bio-Rad Laboratories, Inc. Class A | 20,870 | 1,740 |
* |
| Affymetrix, Inc. | 154,751 | 1,688 |
* |
| Pharmanet Development Group, Inc. | 60,477 | 1,443 |
|
| Applera Corp.-Applied Biosystems Group | 44,300 | 1,414 |
* |
| Harvard Bioscience, Inc. | 265,386 | 1,306 |
* |
| Albany Molecular Research, Inc. | 86,887 | 1,010 |
* |
| Millipore Corp. | 11,800 | 827 |
* |
| eResearch Technology, Inc. | 41,800 | 509 |
* |
| Bioanalytical Systems, Inc. | 2,680 | 15 |
|
| Pharmaceuticals (1.8%) |
|
|
* |
| Endo Pharmaceuticals Holdings, Inc. | 1,271,440 | 31,570 |
* |
| Xenoport Inc. | 487,113 | 20,839 |
* |
| Barr Pharmaceuticals Inc. | 312,195 | 15,682 |
|
| Dr. Reddy’s Laboratories Ltd. ADR | 979,500 | 14,957 |
|
| Hikma Pharmaceuticals PLC | 1,372,514 | 12,734 |
|
| Perrigo Co. | 310,051 | 12,709 |
|
| Medicis Pharmaceutical Corp. | 447,142 | 9,211 |
* |
| Warner Chilcott Ltd. | 452,100 | 7,781 |
* |
| The Medicines Co. | 391,500 | 7,732 |
* |
| Sciele Pharma, Inc. | 395,573 | 7,623 |
* |
| Durect Corp. | 1,671,700 | 7,590 |
* |
| K-V Pharmaceutical Co. Class A | 289,900 | 7,085 |
* |
| Cypress Bioscience, Inc. | 1,061,450 | 6,984 |
* |
| Impax Laboratories, Inc. | 570,900 | 5,321 |
* |
| Eurand NV | 323,577 | 5,161 |
* | ^ | Pain Therapeutics, Inc. | 488,038 | 3,387 |
* |
| Watson Pharmaceuticals, Inc. | 99,890 | 3,101 |
* |
| Obagi Medical Products, Inc. | 361,537 | 2,896 |
| ^ | Mylan Inc. | 129,910 | 1,711 |
* |
| Caraco Pharmaceutical Laboratories, Ltd. | 74,893 | 1,234 |
* | ^ | Questcor Pharmaceuticals, Inc. | 231,984 | 984 |
* |
| Replidyne, Inc. | 157,501 | 221 |
* | ^ | Pozen Inc. | 13,200 | 175 |
* |
| Bentley Pharmaceuticals, Inc. | 5,100 | 79 |
* |
| King Pharmaceuticals, Inc. | 5,596 | 53 |
* |
| Vivus, Inc. | 7,900 | 45 |
* |
| Noven Pharmaceuticals, Inc. | 1,524 | 14 |
|
|
|
| 1,755,615 |
Industrials (17.0%) |
|
| ||
|
| Aerospace & Defense (1.5%) |
|
|
* |
| Alliant Techsystems, Inc. | 268,950 | 29,520 |
* |
| AerCap Holdings NV | 1,474,017 | 25,471 |
* |
| Teledyne Technologies, Inc. | 374,990 | 22,023 |
* |
| BE Aerospace, Inc. | 525,748 | 21,219 |
|
| Safran SA | 897,434 | 18,760 |
|
| Precision Castparts Corp. | 102,514 | 12,052 |
* |
| Esterline Technologies Corp. | 112,210 | 6,246 |
|
| Triumph Group, Inc. | 93,500 | 5,504 |
* |
| Stanley Inc. | 159,797 | 4,032 |
* |
| TransDigm Group, Inc. | 78,100 | 2,965 |
* |
| AAR Corp. | 125,146 | 2,928 |
* |
| Ceradyne, Inc. | 49,200 | 1,917 |
|
| Cubic Corp. | 56,320 | 1,527 |
* |
| Ducommun, Inc. | 23,200 | 756 |
|
| HEICO Corp. | 8,400 | 433 |
|
| Curtiss-Wright Corp. | 7,266 | 345 |
* |
| Herley Industries Inc. | 20,494 | 250 |
* |
| Orbital Sciences Corp. | 9,100 | 245 |
* |
| Edac Technologies Corp. | 33,598 | 240 |
* |
| Ladish Co., Inc. | 4,300 | 129 |
* |
| MTC Technologies, Inc. | 1,200 | 29 |
|
| Air Freight & Logistics (0.2%) |
|
|
|
| UTI Worldwide, Inc. | 972,855 | 21,383 |
|
| Pacer International, Inc. | 143,300 | 2,660 |
* |
| Dynamex Inc. | 91,378 | 2,296 |
|
| Forward Air Corp. | 10,200 | 348 |
* |
| Park-Ohio Holdings Corp. | 15,223 | 254 |
|
| Airlines (0.3%) |
|
|
* | ^ | AirTran Holdings, Inc. | 3,060,053 | 10,435 |
* |
| Airasia Bhd. | 20,949,800 | 8,367 |
|
| UAL Corp. | 385,400 | 5,742 |
|
| Skywest, Inc. | 165,457 | 3,149 |
* |
| Copa Holdings SA Class A | 39,400 | 1,540 |
* |
| Pinnacle Airlines Corp. | 79,171 | 659 |
* |
| Delta Air Lines Inc. | 18,900 | 161 |
|
| Building Products (0.0%) |
|
|
|
| AAON, Inc. | 102,483 | 1,853 |
|
| Apogee Enterprises, Inc. | 41,375 | 923 |
|
| Insteel Industries, Inc. | 21,802 | 272 |
|
| Lennox International Inc. | 4,090 | 136 |
|
| Commercial Services & Supplies (5.5%) |
|
|
|
| The Dun & Bradstreet Corp. | 651,700 | 54,938 |
* |
| Stericycle, Inc. | 735,650 | 39,269 |
* |
| The Advisory Board Co. | 750,715 | 34,998 |
* |
| Covanta Holding Corp. | 1,307,300 | 34,813 |
* |
| Corrections Corp. of America | 1,340,421 | 34,181 |
* |
| Tetra Tech, Inc. | 1,584,133 | 33,473 |
* |
| FTI Consulting, Inc. | 485,454 | 31,069 |
|
| Equifax, Inc. | 565,054 | 21,625 |
|
| McGrath RentCorp | 821,300 | 21,214 |
|
| Ritchie Brothers Auctioneers Inc. | 799,180 | 19,940 |
|
| Robert Half International, Inc. | 613,100 | 14,530 |
* |
| Waste Connections, Inc. | 440,200 | 14,117 |
|
| Watson Wyatt & Co. Holdings | 236,375 | 13,856 |
* |
| IHS Inc. Class A | 194,100 | 12,820 |
* |
| Geo Group Inc. | 479,083 | 12,672 |
|
| China Everbright International, Ltd. | 29,931,000 | 11,917 |
* |
| ChoicePoint Inc. | 228,870 | 11,066 |
* |
| Allied Waste Industries, Inc. | 871,050 | 10,766 |
* |
| Kenexa Corp. | 605,440 | 10,589 |
|
| Steelcase Inc. | 933,397 | 10,342 |
* |
| Clean Harbors Inc. | 148,140 | 9,773 |
* |
| GeoEye Inc. | 422,401 | 9,728 |
|
| Healthcare Services Group, Inc. | 547,800 | 8,359 |
* | ^ | RSC Holdings Inc. | 875,130 | 8,086 |
|
| The Brink’s Co. | 110,000 | 8,003 |
* |
| Mobile Mini, Inc. | 358,990 | 7,629 |
* |
| Consolidated Graphics, Inc. | 128,000 | 7,446 |
* |
| Copart, Inc. | 135,700 | 5,546 |
|
| American Ecology Corp. | 207,300 | 5,510 |
* |
| United Stationers, Inc. | 111,700 | 4,925 |
|
| Interface, Inc. | 347,550 | 4,463 |
* |
| Huron Consulting Group Inc. | 99,500 | 4,165 |
* |
| Spherion Corp. | 788,905 | 3,897 |
* |
| Layne Christensen Co. | 90,469 | 3,860 |
* |
| First Advantage Corp. Class A | 170,700 | 3,501 |
* |
| PeopleSupport Inc. | 334,300 | 3,306 |
|
| Bowne & Co., Inc. | 179,099 | 2,980 |
|
| Resources Connection, Inc. | 134,300 | 2,714 |
|
| Manpower Inc. | 37,005 | 2,484 |
* |
| Kforce Inc. | 272,188 | 2,240 |
| ^ | HNI Corp. | 95,700 | 2,083 |
|
| The Corporate Executive Board Co. | 46,800 | 2,039 |
|
| Heidrick & Struggles International, Inc. | 67,700 | 2,026 |
* |
| CRA International Inc. | 54,787 | 1,889 |
* |
| M&F Worldwide Corp. | 49,700 | 1,710 |
|
| CDI Corp. | 61,080 | 1,661 |
|
| VSE Corp. | 36,795 | 1,230 |
|
| Rollins, Inc. | 65,355 | 1,041 |
* |
| GP Strategies Corp. | 116,640 | 991 |
* |
| LECG Corp. | 94,348 | 980 |
|
| Kimball International, Inc. Class B | 91,010 | 935 |
|
| Kelly Services, Inc. Class A | 41,226 | 917 |
|
| Comfort Systems USA, Inc. | 45,020 | 612 |
* |
| Exponent, Inc. | 14,422 | 487 |
|
| Barrett Business Services, Inc. | 39,184 | 470 |
|
| Herman Miller, Inc. | 18,600 | 434 |
* |
| Team, Inc. | 14,100 | 419 |
|
| Waste Industries USA, Inc. | 10,250 | 387 |
* |
| Learning Tree International, Inc. | 17,928 | 320 |
* |
| North American Galvanizing & Coatings Inc. | 58,200 | 307 |
* |
| Industrial Services of America, Inc. | 19,900 | 231 |
* |
| Westaff Inc. | 94,500 | 189 |
|
| ABM Industries Inc. | 4,820 | 101 |
* |
| National Technical Systems, Inc. | 13,571 | 78 |
* |
| Nashua Corp. | 7,407 | 75 |
* |
| Hudson Highland Group, Inc. | 6,500 | 58 |
|
| Angelica Corp. | 443 | 7 |
* |
| A.T. Cross Co. Class A | 540 | 4 |
|
| Construction & Engineering (1.3%) |
|
|
|
| Chicago Bridge & Iron Co. N.V. | 1,228,732 | 48,953 |
* |
| Jacobs Engineering Group Inc. | 309,900 | 26,754 |
|
| Outotec Oyj | 266,677 | 16,612 |
* |
| Aecom Technology Corp. | 434,572 | 11,933 |
* |
| Quanta Services, Inc. | 389,925 | 10,349 |
* |
| Shaw Group, Inc. | 208,737 | 10,316 |
* |
| Perini Corp. | 229,305 | 8,296 |
* |
| Michael Baker Corp. | 163,100 | 3,435 |
* |
| EMCOR Group, Inc. | 37,200 | 932 |
* |
| Northwest Pipe Co. | 11,673 | 496 |
* |
| Meadow Valley Corp. | 24,450 | 246 |
* |
| Furmanite Corp. | 18,975 | 161 |
|
| Electrical Equipment (1.6%) |
|
|
* |
| First Solar, Inc. | 103,720 | 30,285 |
* |
| Suntech Power Holdings Co., Ltd. ADR | 452,600 | 20,245 |
* |
| General Cable Corp. | 295,165 | 19,776 |
|
| Ametek, Inc. | 375,420 | 18,215 |
|
| Acuity Brands, Inc. | 339,420 | 16,238 |
* |
| EnerSys | 669,130 | 15,658 |
|
| Roper Industries Inc. | 184,825 | 11,481 |
|
| Hubbell Inc. Class B | 146,500 | 6,553 |
|
| Regal-Beloit Corp. | 147,200 | 5,460 |
|
| Belden Inc. | 149,100 | 5,031 |
|
| Woodward Governor Co. | 137,400 | 4,827 |
* |
| II-VI, Inc. | 107,800 | 4,004 |
* |
| AZZ Inc. | 125,800 | 3,356 |
* |
| GrafTech International Ltd. | 132,500 | 2,604 |
* | ^ | Evergreen Solar, Inc. | 50,700 | 436 |
* |
| SL Industries, Inc. | 10,730 | 189 |
* |
| Powell Industries, Inc. | 1,400 | 59 |
* |
| La Barge, Inc. | 1,980 | 26 |
|
| Tech/Ops Sevcon, Inc. | 2,820 | 20 |
* |
| Nortech Systems, Inc. | 2,500 | 16 |
* |
| Coleman Cable Inc. | 970 | 12 |
* |
| Servotronics Inc. | 100 | 2 |
|
| Industrial Conglomerates (0.4%) |
|
|
* |
| McDermott International, Inc. | 402,900 | 21,587 |
|
| Walter Industries, Inc. | 129,066 | 8,952 |
|
| Carlisle Co., Inc. | 148,880 | 4,300 |
|
| Teleflex Inc. | 38,959 | 2,146 |
|
| Machinery (3.8%) |
|
|
|
| Kennametal, Inc. | 1,256,898 | 43,702 |
* |
| RBC Bearings Inc. | 920,628 | 36,798 |
|
| The Manitowoc Co., Inc. | 933,780 | 35,316 |
|
| SPX Corp. | 240,270 | 29,553 |
|
| Harsco Corp. | 495,290 | 29,386 |
|
| Donaldson Co., Inc. | 639,700 | 27,853 |
|
| Lincoln Electric Holdings, Inc. | 258,173 | 19,699 |
|
| Albany International Corp. | 490,700 | 17,812 |
|
| Flowserve Corp. | 126,035 | 15,640 |
* |
| AGCO Corp. | 234,035 | 14,073 |
|
| Barnes Group, Inc. | 450,030 | 11,737 |
|
| Crane Co. | 204,995 | 8,392 |
|
| Robbins & Myers, Inc. | 195,080 | 7,776 |
|
| Trinity Industries, Inc. | 245,060 | 7,450 |
|
| The Toro Co. | 157,613 | 6,681 |
* |
| Flow International Corp. | 660,410 | 6,624 |
* |
| Hansen Transmissions | 1,500,000 | 6,561 |
* |
| Hurco Cos., Inc. | 137,165 | 6,281 |
|
| Oshkosh Truck Corp. | 150,100 | 6,094 |
* |
| Astec Industries, Inc. | 158,725 | 5,817 |
* |
| Kadant Inc. | 213,900 | 5,579 |
|
| Valmont Industries, Inc. | 51,600 | 5,081 |
* |
| Chart Industries, Inc. | 120,900 | 4,913 |
* |
| Columbus McKinnon Corp. | 170,188 | 4,818 |
|
| Cummins Inc. | 75,400 | 4,724 |
* |
| Gardner Denver Inc. | 96,600 | 4,487 |
|
| Ampco-Pittsburgh Corp. | 96,600 | 4,368 |
|
| Lindsay Manufacturing Co. | 38,100 | 3,967 |
|
| Mueller Industries Inc. | 107,100 | 3,467 |
|
| Kaydon Corp. | 57,600 | 3,017 |
* |
| L.B. Foster Co. Class A | 92,500 | 2,969 |
|
| The Timken Co. | 64,900 | 2,346 |
|
| Dynamic Materials Corp. | 40,900 | 1,924 |
|
| Bucyrus International, Inc. | 12,600 | 1,587 |
|
| Pall Corp. | 35,700 | 1,241 |
|
| CLARCOR Inc. | 20,200 | 848 |
|
| Twin Disc, Inc. | 41,585 | 750 |
* |
| EnPro Industries, Inc. | 20,057 | 728 |
|
| The Eastern Co. | 31,450 | 605 |
|
| Sun Hydraulics Corp. | 16,000 | 483 |
|
| Tennant Co. | 13,986 | 477 |
|
| Hardinge, Inc. | 26,767 | 446 |
|
| NACCO Industries, Inc. Class A | 4,555 | 409 |
* |
| K-Tron International, Inc | 1,605 | 220 |
* |
| Gehl Co. | 9,857 | 152 |
|
| NN, Inc. | 8,837 | 89 |
* |
| Taylor Devices Inc. | 8,030 | 41 |
|
| Xerium Technologies Inc. | 11,600 | 20 |
* |
| The Middleby Corp. | 180 | 11 |
|
| Met-Pro Corp. | 116 | 1 |
|
| Marine (0.3%) |
|
|
| ^ | Genco Shipping and Trading Ltd. | 137,100 | 9,275 |
* |
| Kirby Corp. | 144,900 | 7,946 |
|
| Horizon Lines Inc. | 534,454 | 5,638 |
| ^ | Dryships Inc. | 47,030 | 3,880 |
* |
| Ultrapetrol Bahamas Ltd. | 32,459 | 312 |
|
| Road & Rail (1.5%) |
|
|
|
| J.B. Hunt Transport Services, Inc. | 845,400 | 28,718 |
|
| Knight Transportation, Inc. | 1,470,500 | 24,984 |
* |
| Kansas City Southern | 545,653 | 24,598 |
|
| Con-way, Inc. | 442,100 | 20,447 |
|
| Werner Enterprises, Inc. | 986,900 | 19,195 |
|
| Heartland Express, Inc. | 1,169,520 | 18,092 |
* |
| Avis Budget Group, Inc. | 569,000 | 7,556 |
* |
| Hertz Global Holdings Inc. | 551,542 | 7,093 |
* |
| Genesee & Wyoming Inc. Class A | 185,000 | 6,601 |
|
| Landstar System, Inc. | 8,600 | 447 |
* |
| Saia, Inc. | 11,500 | 159 |
|
| Trading Companies & Distributors (0.6%) |
|
|
|
| MSC Industrial Direct Co., Inc. Class A | 776,640 | 37,869 |
|
| Watsco, Inc. | 250,700 | 11,374 |
|
| GATX Corp. | 126,800 | 5,579 |
|
| Applied Industrial Technology, Inc. | 184,805 | 4,465 |
|
| Textainer Group Holdings Ltd. | 147,800 | 2,527 |
|
| Kaman Corp. Class A | 56,958 | 1,544 |
* |
| NuCo2, Inc. | 6,000 | 166 |
|
| Lawson Products, Inc. | 140 | 4 |
|
|
|
| 1,786,703 |
Information Technology (21.0%) |
|
| ||
|
| Communications Equipment (2.9%) |
|
|
* |
| Ciena Corp. | 1,705,285 | 57,656 |
* |
| Blue Coat Systems, Inc. | 1,219,824 | 25,750 |
* |
| NICE-Systems Ltd. ADR | 787,567 | 25,076 |
* |
| ViaSat, Inc. | 1,019,600 | 22,533 |
* |
| Comverse Technology, Inc. | 1,062,700 | 18,528 |
* |
| Riverbed Technology, Inc. | 1,286,100 | 17,581 |
* |
| Polycom, Inc. | 762,895 | 17,089 |
|
| ADTRAN Inc. | 655,670 | 15,513 |
* |
| Sycamore Networks, Inc. | 4,803,200 | 15,466 |
* |
| ADC Telecommunications, Inc. | 993,400 | 13,927 |
* |
| OpNext, Inc. | 1,686,740 | 9,952 |
* |
| Powerwave Technologies, Inc. | 3,057,600 | 8,347 |
* |
| Acme Packet, Inc. | 832,826 | 7,620 |
* |
| Harris Stratex Networks, Inc. Class A | 655,775 | 6,223 |
* |
| Comtech Telecommunications Corp. | 147,147 | 5,699 |
* |
| EMS Technologies, Inc. | 198,706 | 5,139 |
* |
| Harmonic, Inc. | 608,055 | 5,029 |
* |
| CommScope, Inc. | 105,530 | 5,018 |
* |
| Bookham, Inc. | 2,247,400 | 3,821 |
* |
| JDS Uniphase Corp. | 261,500 | 3,742 |
* |
| Avocent Corp. | 140,043 | 2,732 |
* |
| Aruba Networks, Inc. | 404,500 | 2,411 |
* |
| Network Equipment Technologies, Inc. | 148,303 | 964 |
* |
| NETGEAR, Inc. | 59,430 | 963 |
* |
| Tekelec | 61,706 | 908 |
* |
| Airvana, Inc. | 139,300 | 900 |
* |
| PC-Tel, Inc. | 107,804 | 886 |
* |
| Oplink Communications, Inc. | 78,256 | 752 |
* |
| Mastec Inc. | 73,681 | 603 |
* |
| Loral Space and Communications Ltd. | 25,545 | 552 |
* |
| MRV Communications Inc. | 249,177 | 391 |
* |
| Digi International, Inc. | 44,374 | 366 |
* |
| Dycom Industries, Inc. | 22,100 | 318 |
* |
| SeaChange International, Inc. | 4,981 | 36 |
* |
| OPTELECOM INC | 300 | 2 |
|
| Computers & Peripherals (0.8%) |
|
|
* |
| Western Digital Corp. | 576,820 | 16,722 |
* |
| Brocade Communications Systems, Inc. | 1,544,000 | 11,055 |
* |
| Hutchinson Technology, Inc. | 708,950 | 10,025 |
* |
| Emulex Corp. | 691,577 | 9,053 |
* |
| Novatel Wireless, Inc. | 901,292 | 8,040 |
* |
| NetApp, Inc. | 238,475 | 5,771 |
* |
| Lexmark International, Inc. | 178,000 | 5,587 |
* |
| Teradata Corp. | 253,460 | 5,396 |
* | ^ | Data Domain, Inc. | 202,495 | 4,404 |
* |
| Super Micro Computer Inc. | 349,400 | 2,607 |
* |
| Stratasys, Inc. | 113,400 | 2,204 |
* |
| Synaptics Inc. | 43,400 | 1,473 |
* |
| Hypercom Corp. | 335,144 | 1,431 |
* |
| QLogic Corp. | 73,800 | 1,178 |
* |
| Electronics for Imaging, Inc. | 32,546 | 469 |
* |
| Immersion Corp. | 26,800 | 303 |
* |
| Rimage Corp. | 10,608 | 190 |
|
| Electronic Equipment & Instruments (2.5%) |
|
|
* |
| Mettler-Toledo International Inc. | 563,615 | 53,690 |
* |
| Littelfuse, Inc. | 708,400 | 26,041 |
* |
| Ingram Micro, Inc. Class A | 1,484,800 | 25,256 |
* |
| Avnet, Inc. | 807,310 | 21,143 |
|
| Amphenol Corp. | 381,460 | 17,616 |
* |
| Arrow Electronics, Inc. | 641,159 | 17,446 |
* |
| Trimble Navigation Ltd. | 417,900 | 13,703 |
* |
| FLIR Systems, Inc. | 364,884 | 12,526 |
* |
| Cogent Inc. | 1,059,650 | 9,887 |
* |
| Dolby Laboratories Inc. | 244,600 | 9,821 |
* | ^ | Multi-Fineline Electronix, Inc. | 413,600 | 7,817 |
* |
| Anixter International Inc. | 90,900 | 5,179 |
* |
| Rofin-Sinar Technologies Inc. | 127,552 | 4,857 |
* |
| TTM Technologies, Inc. | 364,700 | 4,854 |
|
| MTS Systems Corp. | 121,745 | 4,186 |
* |
| FARO Technologies, Inc. | 114,137 | 4,022 |
|
| National Instruments Corp. | 130,400 | 3,836 |
* |
| Plexus Corp. | 122,000 | 2,939 |
* |
| Electro Scientific Industries, Inc. | 162,483 | 2,666 |
* |
| Vishay Intertechnology, Inc. | 251,130 | 2,373 |
|
| Technitrol, Inc. | 88,515 | 1,859 |
* |
| OSI Systems Inc. | 57,413 | 1,404 |
* |
| Itron, Inc. | 14,728 | 1,371 |
|
| AVX Corp. | 97,740 | 1,287 |
* |
| PC Connection, Inc. | 143,700 | 1,073 |
* |
| Coherent, Inc. | 33,315 | 993 |
* |
| Checkpoint Systems, Inc. | 36,652 | 950 |
* |
| Measurement Specialties, Inc. | 52,591 | 851 |
* |
| Spectrum Control, Inc. | 91,879 | 788 |
* |
| Perceptron, Inc. | 52,498 | 528 |
* |
| IntriCon Corp. | 39,778 | 377 |
* |
| Gerber Scientific, Inc. | 39,400 | 365 |
* |
| CPI International, Inc. | 22,030 | 252 |
* |
| ScanSource, Inc. | 9,600 | 240 |
* |
| Zones, Inc. | 16,184 | 139 |
* |
| Tessco Technologies, Inc. | 4,370 | 59 |
* |
| ADDvantage Technologies Group, Inc. | 14,950 | 58 |
|
| Keithley Instruments Inc. | 4,641 | 49 |
* |
| Vicon Industries Inc. | 6,430 | 33 |
* |
| Schmitt Industries Inc. | 4,100 | 26 |
|
| Mesa Laboratories, Inc. | 413 | 9 |
* |
| LeCroy Corp. | 1,052 | 8 |
* |
| Data I/O Corp. | 1,210 | 6 |
* |
| RF Monolithics, Inc. | 1,600 | 4 |
* |
| PAR Technology Corp. | 400 | 3 |
* |
| Sutron Corp. | 322 | 2 |
|
| Internet Software & Services (1.6%) |
|
|
* |
| Ariba, Inc. | 2,775,320 | 32,943 |
* |
| ValueClick, Inc. | 1,060,765 | 21,162 |
* |
| VistaPrint Ltd. | 440,845 | 15,002 |
* |
| VeriSign, Inc. | 267,895 | 9,658 |
|
| InfoSpace, Inc. | 713,000 | 8,599 |
* |
| DealerTrack Holdings Inc. | 435,000 | 8,369 |
|
| Marchex, Inc. | 792,100 | 8,182 |
* |
| Interwoven Inc. | 665,069 | 7,489 |
* |
| Sohu.com Inc. | 103,000 | 7,120 |
* |
| Omniture, Inc. | 240,800 | 5,495 |
* |
| Vignette Corp. | 463,300 | 5,351 |
* |
| j2 Global Communications, Inc. | 239,644 | 5,128 |
|
| United Online, Inc. | 443,322 | 4,735 |
* |
| Greenfield Online, Inc. | 403,450 | 4,603 |
* |
| Vocus, Inc. | 142,850 | 3,970 |
* |
| Digital River, Inc. | 115,430 | 3,792 |
* |
| EarthLink, Inc. | 376,775 | 3,440 |
* |
| Akamai Technologies, Inc. | 90,500 | 3,237 |
* | ^ | WebMD Health Corp. Class A | 102,600 | 3,217 |
* |
| AsiaInfo Holdings, Inc. | 241,791 | 2,943 |
* |
| S1 Corp. | 325,600 | 2,201 |
* | ^ | Bankrate, Inc. | 33,300 | 1,740 |
* |
| Chordiant Software, Inc. | 238,974 | 1,090 |
* |
| SonicWALL, Inc. | 136,144 | 1,047 |
* |
| Keynote Systems Inc. | 79,766 | 921 |
* |
| Internet Gold-Golden Lines Ltd. | 61,386 | 633 |
* |
| Websense, Inc. | 26,400 | 513 |
|
| TheStreet.com, Inc. | 45,426 | 355 |
| ^ | Imergent, Inc. | 26,850 | 306 |
* |
| Perficient, Inc. | 6,715 | 62 |
* |
| Onvia.com, Inc. | 3,920 | 23 |
|
| IT Services (3.4%) |
|
|
|
| Syntel, Inc. | 1,064,896 | 35,259 |
* |
| Alliance Data Systems Corp. | 576,742 | 33,111 |
| ^ | Heartland Payment Systems, Inc. | 1,352,630 | 29,623 |
|
| Global Payments Inc. | 558,885 | 24,736 |
* |
| NeuStar, Inc. Class A | 815,403 | 22,432 |
* |
| Sapient Corp. | 2,829,495 | 20,146 |
* |
| Hewitt Associates, Inc. | 469,215 | 19,238 |
* |
| VeriFone Holdings, Inc. | 1,639,200 | 18,343 |
* |
| CyberSource Corp. | 936,160 | 16,991 |
* |
| Affiliated Computer Services, Inc. Class A | 312,710 | 16,564 |
|
| Total System Services, Inc. | 645,904 | 15,373 |
* |
| Cognizant Technology Solutions Corp. | 415,923 | 13,414 |
* |
| Euronet Worldwide, Inc. | 729,900 | 12,905 |
* | ^ | DST Systems, Inc. | 215,359 | 12,887 |
* |
| MPS Group, Inc. | 1,086,051 | 11,653 |
* |
| Iron Mountain, Inc. | 362,700 | 9,963 |
|
| Broadridge Financial Solutions LLC | 416,800 | 7,761 |
|
| Integral Systems, Inc. | 167,698 | 5,784 |
|
| MAXIMUS, Inc. | 120,759 | 4,579 |
|
| infoUSA Inc. | 713,500 | 4,046 |
* |
| ManTech International Corp. | 83,011 | 3,965 |
* |
| Perot Systems Corp. | 236,280 | 3,695 |
|
| Cass Information Systems, Inc. | 83,400 | 2,812 |
* |
| Unisys Corp. | 347,501 | 1,446 |
* |
| Online Resources Corp. | 114,452 | 1,157 |
* |
| Sykes Enterprises, Inc. | 67,753 | 1,126 |
* |
| The Hackett Group Inc. | 240,491 | 957 |
* |
| Ciber, Inc. | 150,710 | 943 |
* |
| TNS Inc. | 40,820 | 939 |
* |
| CSG Systems International, Inc. | 70,199 | 849 |
* |
| TechTeam Global, Inc. | 75,579 | 703 |
* |
| Ness Technologies Inc. | 55,285 | 501 |
* |
| SM&A Corp. | 100,300 | 498 |
* |
| iGATE Corp. | 53,003 | 431 |
* |
| SRA International, Inc. | 15,200 | 399 |
* |
| CACI International, Inc. | 7,730 | 387 |
|
| Gevity HR, Inc. | 54,009 | 368 |
* |
| Convergys Corp. | 15,643 | 246 |
|
| MoneyGram International, Inc. | 150,500 | 233 |
* |
| RightNow Technologies Inc. | 2,671 | 32 |
* |
| Inx Inc. | 4,055 | 29 |
* |
| Csp Inc. | 2,080 | 12 | |
|
| Semiconductors & Semiconductor Equipment (4.8%) |
|
| |
* |
| Microsemi Corp. | 3,067,262 | 75,148 | |
|
| Intersil Corp. | 1,412,640 | 37,746 | |
* |
| FEI Co. | 1,350,502 | 29,535 | |
* |
| Fairchild Semiconductor International, Inc. | 2,214,990 | 28,883 | |
* |
| Verigy Ltd. | 1,326,000 | 28,337 | |
* |
| PMC Sierra Inc. | 3,441,765 | 26,743 | |
* |
| ATMI, Inc. | 854,085 | 25,144 | |
* |
| Varian Semiconductor Equipment Associates, Inc. | 598,550 | 21,925 | |
* |
| Cypress Semiconductor Corp. | 765,000 | 21,512 | |
* |
| ON Semiconductor Corp. | 2,857,975 | 21,349 | |
* |
| Cymer, Inc. | 678,500 | 17,634 | |
* |
| Advanced Analogic Technologies, Inc. | 1,786,297 | 12,361 | |
* |
| Tessera Technologies, Inc. | 581,690 | 11,773 | |
* |
| MKS Instruments, Inc. | 482,710 | 11,030 | |
* |
| Teradyne, Inc. | 736,000 | 9,781 | |
* |
| Atheros Communications, Inc. | 331,550 | 8,826 | |
* |
| Spreadtrum Communications, Inc. | 1,015,600 | 8,826 | |
* |
| Diodes Inc. | 317,775 | 8,593 | |
* |
| Integrated Device Technology Inc. | 755,975 | 8,081 | |
* |
| Skyworks Solutions, Inc. | 877,325 | 7,624 | |
* |
| Semtech Corp. | 431,400 | 7,006 | |
* |
| OmniVision Technologies, Inc. | 405,594 | 6,506 | |
* |
| AuthenTec, Inc. | 448,200 | 6,010 | |
* |
| Amkor Technology, Inc. | 629,316 | 6,010 | |
* |
| Netlogic Microsystems Inc. | 177,750 | 5,828 | |
* |
| Zoran Corp. | 417,186 | 5,490 | |
* |
| RF Micro Devices, Inc. | 1,430,400 | 4,820 | |
* |
| Marvell Technology Group Ltd. | 326,350 | 4,226 | |
* | ^ | Sigma Designs, Inc. | 231,300 | 4,136 | |
* |
| LSI Corp. | 553,847 | 3,434 | |
* |
| Cirrus Logic, Inc. | 404,746 | 2,894 | |
* |
| Silicon Laboratories Inc. | 76,300 | 2,577 | |
* |
| Entegris Inc. | 287,100 | 2,165 | |
* |
| MEMC Electronic Materials, Inc. | 33,980 | 2,140 | |
* |
| Silicon Motion Technology Corp. ADR | 120,700 | 2,104 | |
* |
| Monolithic Power Systems | 85,859 | 1,966 | |
* |
| Standard Microsystem Corp. | 60,411 | 1,791 | |
* |
| Mattson Technology, Inc. | 352,373 | 1,709 | |
* |
| TriQuint Semiconductor, Inc. | 245,310 | 1,617 | |
* |
| Microtune, Inc. | 401,892 | 1,419 | |
* |
| Ceva, Inc. | 129,311 | 1,265 | |
* |
| LAM Research Corp. | 27,200 | 1,111 | |
* |
| Pericom Semiconductor Corp. | 65,063 | 1,109 | |
* |
| Techwell, Inc. | 79,270 | 832 | |
* |
| Eagle Test Systems, Inc. | 62,300 | 752 | |
* |
| Power Integrations, Inc. | 22,800 | 711 | |
* |
| IXYS Corp. | 80,043 | 574 | |
* |
| Veeco Instruments, Inc. | 29,909 | 563 | |
* |
| SRS Labs, Inc. | 94,401 | 559 | |
* |
| International Rectifier Corp. | 23,300 | 530 | |
* |
| Trident Microsystems, Inc. | 76,943 | 334 | |
* |
| Ultratech, Inc. | 22,461 | 320 | |
* |
| Cabot Microelectronics Corp. | 9,000 | 306 | |
* |
| hi/fn, Inc. | 62,996 | 282 | |
* |
| PLX Technology, Inc. | 17,001 | 147 | |
* |
| Aetrium, Inc. | 23,992 | 74 | |
* |
| PDF Solutions, Inc. | 12,104 | 58 | |
* |
| Semitool, Inc. | 2,620 | 23 | |
* |
| Applied Micro Circuits Corp. | 1,800 | 16 | |
* |
| Tegal Corp. | 1,425 | 6 | |
* |
| White Electronic Designs Corp. | 930 | 4 | |
|
| Trio-Tech International | 600 | 4 | |
|
| Software (5.0%) |
|
| |
* |
| Red Hat, Inc. | 2,424,213 | 49,866 | |
* |
| Cadence Design Systems, Inc. | 3,812,969 | 42,438 | |
* |
| BMC Software, Inc. | 1,028,910 | 35,765 | |
|
| FactSet Research Systems Inc. | 586,937 | 35,234 | |
* |
| MICROS Systems, Inc. | 955,412 | 34,060 | |
* |
| Concur Technologies, Inc. | 985,792 | 32,669 | |
* |
| salesforce.com, inc. | 398,700 | 26,605 | |
* |
| Synopsys, Inc. | 1,150,200 | 26,581 | |
* | 3 | TiVo Inc. | 2,935,400 | 24,158 | |
* |
| ANSYS, Inc. | 583,064 | 23,457 | |
* |
| Progress Software Corp. | 693,671 | 20,970 | |
* |
| Activision, Inc. | 506,200 | 13,693 | |
* |
| SPSS, Inc. | 281,325 | 11,883 | |
* |
| McAfee Inc. | 273,400 | 9,091 | |
* |
| NAVTEQ Corp. | 119,400 | 8,861 | |
* |
| THQ Inc. | 413,900 | 8,808 | |
* |
| Sybase, Inc. | 293,710 | 8,641 | |
* |
| Net 1 UEPS Technologies, Inc. | 341,600 | 8,007 | |
* |
| Sonic Solutions, Inc. | 833,600 | 7,661 | |
* |
| Lawson Software, Inc. | 948,428 | 7,578 | |
* |
| Manhattan Associates, Inc. | 253,716 | 6,599 | |
|
| Jack Henry & Associates Inc. | 222,800 | 5,855 | |
* |
| Novell, Inc. | 898,800 | 5,644 | |
* |
| Taleo Corp. Class A | 286,150 | 5,580 | |
* |
| JDA Software Group, Inc. | 283,454 | 5,357 | |
* |
| PROS Holdings, Inc. | 450,500 | 5,262 | |
* |
| Ulticom, Inc. | 676,000 | 4,732 | |
* |
| Informatica Corp. | 274,264 | 4,377 | |
* |
| Citrix Systems, Inc. | 131,625 | 4,311 | |
* |
| Radiant Systems, Inc. | 251,200 | 3,389 | |
|
| Fair Isaac, Inc. | 132,100 | 3,272 | |
* |
| Compuware Corp. | 422,300 | 3,184 | |
* |
| DemandTec, Inc. | 409,450 | 3,165 | |
* |
| EPIQ Systems, Inc. | 204,323 | 3,155 | |
* |
| Solera Holdings, Inc. | 93,329 | 2,409 | |
* |
| TIBCO Software Inc. | 294,575 | 2,259 | |
* |
| Quest Software, Inc. | 167,566 | 2,232 | |
* |
| The Ultimate Software Group, Inc. | 59,100 | 1,938 | |
* |
| Phoenix Technologies Ltd. | 161,215 | 1,901 | |
* |
| NetScout Systems, Inc. | 181,865 | 1,819 | |
* |
| Nuance Communications, Inc. | 75,900 | 1,539 | |
* |
| Double-Take Software Inc. | 73,200 | 1,089 | |
* |
| Actuate Software Corp. | 237,484 | 967 | |
* |
| Take-Two Interactive Software, Inc. | 34,200 | 897 | |
* |
| Interactive Intelligence Inc. | 69,500 | 882 | |
|
| Pegasystems Inc. | 75,300 | 796 | |
* |
| Synchronoss Technologies, Inc. | 36,700 | 766 | |
* |
| Mentor Graphics Corp. | 66,843 | 673 | |
* |
| Parametric Technology Corp. | 35,700 | 622 | |
* |
| Digimarc Corp. | 59,480 | 606 | |
|
| QAD Inc. | 76,338 | 580 | |
* |
| VASCO Data Security International, Inc. | 47,400 | 478 | |
* |
| Wind River Systems Inc. | 57,178 | 471 | |
* |
| Sumtotal Systems Inc. | 108,701 | 446 |
* |
| Epicor Software Corp. | 47,300 | 378 |
|
| Renaissance Learning, Inc. | 23,300 | 328 |
* |
| Ansoft Corp. | 8,600 | 285 |
* |
| Macrovision Corp. | 14,500 | 229 |
* |
| Moldflow Corp. | 5,400 | 107 |
* |
| Datawatch Corp. | 26,010 | 90 |
* |
| Pervasive Software Inc. | 18,850 | 90 |
* |
| Versant Corp. | 2,100 | 64 |
* |
| Dynamics Research Corp. | 3,731 | 37 |
* |
| NetManage, Inc. | 100 | — |
* |
| BSQUARE Corp. | 13 | — |
|
|
|
| 2,210,020 |
Materials (5.7%) |
|
| ||
|
| AptarGroup Inc. | 1,672,000 | 73,819 |
|
| AK Steel Holding Corp. | 821,312 | 51,562 |
|
| Albemarle Corp. | 1,001,170 | 37,454 |
* |
| Terra Industries, Inc. | 961,168 | 36,390 |
|
| FMC Corp. | 545,932 | 34,274 |
|
| Celanese Corp. Series A | 723,143 | 32,361 |
|
| Sensient Technologies Corp. | 1,014,500 | 30,202 |
|
| Hercules, Inc. | 1,485,195 | 27,922 |
|
| Sealed Air Corp. | 760,700 | 19,238 |
* |
| Owens-Illinois, Inc. | 344,400 | 18,994 |
|
| Minerals Technologies, Inc. | 251,470 | 17,035 |
|
| Steel Dynamics, Inc. | 449,762 | 15,674 |
|
| CF Industries Holdings, Inc. | 115,400 | 15,429 |
* |
| Rockwood Holdings, Inc. | 386,477 | 14,265 |
|
| Cleveland-Cliffs Inc. | 83,598 | 13,409 |
|
| Arch Chemicals, Inc. | 318,730 | 10,859 |
|
| Greif Inc. Class A | 159,537 | 10,306 |
|
| RPM International, Inc. | 459,811 | 10,254 |
* |
| LSB Industries, Inc. | 633,860 | 9,704 |
|
| Nalco Holding Co. | 410,702 | 9,442 |
|
| Kaiser Aluminum Corp. | 117,596 | 8,071 |
|
| Ball Corp. | 148,900 | 8,008 |
|
| Airgas, Inc. | 165,200 | 7,951 |
* |
| RTI International Metals, Inc. | 185,800 | 7,653 |
* |
| Rhodia SA | 370,660 | 7,630 |
* |
| Pactiv Corp. | 319,600 | 7,603 |
|
| Reliance Steel & Aluminum Co. | 103,640 | 6,299 |
* |
| Century Aluminum Co. | 84,654 | 5,866 |
|
| Lubrizol Corp. | 96,600 | 5,634 |
|
| Carpenter Technology Corp. | 95,600 | 4,902 |
* |
| Apex Silver Mines Ltd. | 451,293 | 4,535 |
|
| Schnitzer Steel Industries, Inc. Class A | 39,446 | 3,471 |
|
| International Flavors & Fragrances, Inc. | 64,200 | 2,928 |
|
| Silgan Holdings, Inc. | 50,000 | 2,664 |
* | ^ | Coeur d’Alene Mines Corp. | 777,529 | 2,387 |
| ^ | Martin Marietta Materials, Inc. | 21,500 | 2,352 |
|
| Myers Industries, Inc. | 180,920 | 2,276 |
|
| Cabot Corp. | 77,180 | 2,251 |
|
| Scotts Miracle-Gro Co. | 58,007 | 1,922 |
|
| A.M. Castle & Co. | 49,840 | 1,541 |
* |
| Intrepid Potash, Inc. | 30,930 | 1,469 |
* |
| Domtar Corp. | 224,405 | 1,340 |
* |
| Buckeye Technology, Inc. | 154,268 | 1,331 |
* |
| Crown Holdings, Inc. | 46,900 | 1,259 |
* | ^ | ShengdaTech Inc. | 142,448 | 1,100 |
|
| Penford Corp. | 49,641 | 1,090 |
|
| Packaging Corp. of America | 40,100 | 881 |
|
| Chemtura Corp. | 115,800 | 801 |
|
| Innophos Holdings Inc. | 36,759 | 658 |
* |
| GenTek, Inc. | 20,900 | 649 |
|
| Innospec, Inc. | 29,417 | 600 |
* |
| Hecla Mining Co. | 35,670 | 366 |
* |
| Stillwater Mining Co. | 18,996 | 269 |
|
| Valspar Corp. | 8,560 | 188 |
|
| Stepan Co. | 3,330 | 131 |
|
| Rock-Tenn Co. | 3,854 | 131 |
|
| Schweitzer-Mauduit International, Inc. | 5,900 | 131 |
* |
| American Pacific Corp. | 6,060 | 104 |
* |
| Rock of Ages Corp. | 11,950 | 45 |
|
| U.S. Energy Corp. | 11,410 | 31 |
|
|
|
| 597,111 |
Telecommunication Services (1.2%) |
|
| ||
* | ^ | Clearwire Corp. | 1,737,740 | 26,309 |
| ^ | Partner Communications Company Ltd. | 1,024,500 | 23,840 |
* |
| American Tower Corp. Class A | 348,505 | 15,132 |
* |
| SBA Communications Corp. | 463,970 | 15,005 |
|
| CenturyTel, Inc. | 364,634 | 11,832 |
* |
| Cogent Communications Group, Inc. | 363,106 | 7,629 |
|
| NTELOS Holdings Corp. | 254,600 | 6,589 |
* |
| Premiere Global Services, Inc. | 390,310 | 5,667 |
* |
| Syniverse Holdings Inc. | 236,500 | 3,715 |
* |
| Gilat Satellite Network Ltd. | 278,635 | 2,979 |
|
| Telephone & Data Systems, Inc. | 49,700 | 1,904 |
|
| Atlantic Tele-Network, Inc. | 48,528 | 1,511 |
* |
| Leap Wireless International, Inc. | 18,800 | 1,005 |
* |
| Rural Cellular Corp. Class A | 9,200 | 409 |
* |
| Centennial Communications Corp. Class A | 64,000 | 388 |
* |
| Global Crossing Ltd. | 15,562 | 260 |
|
| Shenandoah Telecommunications Co. | 15,500 | 210 |
* |
| Hungarian Telephone and Cable Corp. | 6,355 | 102 |
* |
| Virgin Mobile USA, Inc.-A | 1,200 | 5 |
|
|
|
| 124,491 |
Utilities (0.9%) |
|
| ||
|
| CenterPoint Energy Inc. | 1,242,886 | 18,917 |
|
| Ormat Technologies Inc. | 376,800 | 18,576 |
|
| UGI Corp. Holding Co. | 595,100 | 15,473 |
|
| Southern Union Co. | 510,400 | 13,076 |
|
| ITC Holdings Corp. | 143,600 | 8,010 |
|
| Energen Corp. | 85,080 | 5,806 |
* |
| American Water Works Co., Inc. | 237,850 | 5,012 |
|
| Equitable Resources, Inc. | 52,800 | 3,504 |
* |
| Reliant Energy, Inc. | 131,100 | 3,375 |
|
| WGL Holdings Inc. | 56,200 | 1,843 |
|
| Sierra Pacific Resources | 86,310 | 1,176 |
|
| ALLETE, Inc. | 9,770 | 408 |
* |
| Maine & Maritimes Corp. | 10,730 | 381 |
|
| Central Vermont Public Service Corp. | 4,390 | 102 |
|
|
|
| 95,659 |
Exchange-Traded Funds (1.2%) |
|
| ||
4 | ^ | Vanguard Small-Cap ETF | 1,165,083 | 75,917 |
4 |
| Vanguard Small-Cap Growth ETF | 713,200 | 47,749 |
|
|
|
| 123,666 |
|
|
|
|
|
Total Common Stocks (Cost $9,440,700) |
| 10,035,220 | ||
Temporary Cash Investments (6.6%)1 |
|
| |
Money Market Fund (6.0%) |
|
| |
5 | Vanguard Market Liquidity Fund, 2.304% | 446,189,699 | 446,190 |
5 | Vanguard Market Liquidity Fund, 2.304% | 179,089,300 | 179,089 |
|
|
| 625,279 |
|
|
|
|
|
| Face |
|
|
| Amount |
|
|
| ($000) |
|
Repurchase Agreement (0.3%) |
|
| |
| J.P. Morgan Securities Inc. 1.960%, 5/1/08 |
|
|
| (Dated 4/30/08, Repurchase Value $36,402,000, collateralized |
|
|
| by Federal National Mortgage Assn., 4.500%–6.000%, 3/1/23–1/1/38) | 36,400 | 36,400 |
|
|
|
|
U.S. Agency Obligations (0.3%) |
|
| |
6 | Federal Home Loan Bank |
|
|
7 | 2.693%, 5/7/08 | 15,000 | 14,995 |
7 | 2.076%, 7/30/08 | 1,000 | 995 |
6 | Federal Home Loan Mortgage Corp. |
|
|
7 | 2.114%, 7/21/08 | 3,000 | 2,986 |
7 | 2.116%, 8/29/08 | 12,000 | 11,918 |
6 | Federal National Mortgage Assn. |
|
|
7 | 2.549%, 5/21/08 | 1,000 | 999 |
|
|
| 31,893 |
|
|
|
|
Total Temporary Cash Investments (Cost $693,568) |
| 693,572 | |
Total Investments (102.1%) (Cost $10,134,268) |
| 10,728,792 | |
Liability For Covered Call Options Written (0.0%) |
|
| |
Written Contracts |
|
| |
| TiVo Inc., Expires 5/17/08, Strike Price $12.50 | 2,657 | (14) |
| TiVo Inc., Expires 5/17/08, Strike Price $10.00 | 1,960 | (19) |
| TiVo Inc., Expires 6/21/08, Strike Price $10.00 | 2,792 | (84) |
Total Covered Call Options Written (Premium Received $311) |
| (117) | |
Other Assets and Liabilities—Net (–2.1%) |
| (223,511) | |
Net Assets (100%) |
| 10,505,164 | |
* | Non-income-producing security. |
^ | Part of security position is on loan to broker-dealers. |
1 | The fund invests a portion of its cash reserves in equity markets through the use of index futures contracts. After giving effect to futures investments, the fund’s effective common stock and temporary cash investment positions represent 98.2% and 3.9%. |
2 | Considered an affiliated company of the fund as the fund owns more than 5% of the outstanding voting securities of such company. |
3 | Securities with a value of $6,098,000 have been segregated in connection with covered call options written. |
4 | Considered an affiliated company of the fund as the issuer is another member of The Vanguard Group. |
5 | Affiliated money market fund available only to Vanguard funds and certain trusts and accounts managed by Vanguard. Rate shown is the 7-day yield. |
6 | The issuer operates under a congressional charter; its securities are neither issued nor guaranteed by the U.S. government. If needed, access to additional funding from the U.S. Treasury (beyond the issuer’s line of credit) would require congressional action. |
7 | Securities with a value of $31,893,000 have been segregated as initial margin for open futures contracts. |
ADR—American Depositary Receipt.
REIT—Real Estate Investment Trust.
| |
| |
| |
| |
| |
| |
| |
| |
| |
| |
| |
| |
| |
| |
| |
| © 2008 Vanguard Group. Inc. |
| All rights reserved. |
| Vanguard Marketing Corporation, Distributor. |
|
|
| SNA242 062008 |
Item 2: Not Applicable.
Item 3: Not Applicable.
Item 4: Not Applicable.
Item 5: Not Applicable.
Item 6: Not Applicable.
Item 7: Not applicable.
Item 8: Not Applicable.
Item 9: Not Applicable.
Item 10: Not Applicable.
Item 11: Controls and Procedures.
(a) Disclosure Controls and Procedures. The Principal Executive and Financial Officers concluded that the Registrant's Disclosure Controls and Procedures are effective based on their evaluation of the Disclosure Controls and Procedures as of a date within 90 days of the filing date of this report.
(b) Internal Control Over Financial Reporting. There were no significant changes in Registrant’s Internal Control Over Financial Reporting or in other factors that could significantly affect this control subsequent to the date of the evaluation, including any corrective actions with regard to significant deficiencies and material weaknesses.
Item 12: Exhibits.
| (a) | Certifications. |
Pursuant to the requirements of the Securities Exchange Act of 1934 and the Investment Company Act of 1940, the registrant has duly caused this report to be signed on its behalf by the undersigned, thereunto duly authorized.
| VANGUARD EXPLORER FUND |
|
|
By: | (signature) |
| (HEIDI STAM) |
| JOHN J. BRENNAN* |
| CHIEF EXECUTIVE OFFICER |
|
|
Date: June 13, 2008 | |
Pursuant to the requirements of the Securities Exchange Act of 1934 and the Investment Company Act of 1940, this report has been signed below by the following persons on behalf of the registrant and in the capacities and on the dates indicated.
| VANGUARD EXPLORER FUND |
|
|
By: | (signature) |
| (HEIDI STAM) |
| JOHN J. BRENNAN* |
| CHIEF EXECUTIVE OFFICER |
|
|
Date: June 13, 2008 | |
| VANGUARD EXPLORER FUND |
|
|
By: | (signature) |
| (HEIDI STAM) |
| THOMAS J. HIGGINS* |
| TREASURER |
|
|
Date: June 13, 2008 | |
*By Power of Attorney. Filed on January 18, 2008, see File Number 2-29601. Incorporated by Reference.