UNITED STATES
SECURITIES AND EXCHANGE COMMISSION
Washington, D.C. 20549
FORM N-CSR
CERTIFIED SHAREHOLDER REPORT
OF
REGISTERED MANAGEMENT INVESTMENT COMPANIES
| Investment Company Act file number: | 811-01530 | |
Name of Registrant: | Vanguard Explorer Fund | |
Address of Registrant: | P.O. Box 2600 | |
| Valley Forge, PA 19482 | ||
Name and address of agent for service: | Heidi Stam, Esquire | |
| P.O. Box 876 | ||
| Valley Forge, PA 19482 | ||
Registrant’s telephone number, including area code: (610) 669-1000 | ||
Date of fiscal year end: October 31 | ||
Date of reporting period: November 1, 2013 – April 30, 2014 | ||
Item 1: Reports to Shareholders | ||
![]()
Semiannual Report | April 30, 2014
Vanguard Explorer™ Fund

Vanguard’s Principles for Investing Success
We want to give you the best chance of investment success. These principles,
grounded in Vanguard’s research and experience, can put you on the right path.
Goals. Create clear, appropriate investment goals.
Balance. Develop a suitable asset allocation using broadly diversified funds.
Cost. Minimize cost.
Discipline. Maintain perspective and long-term discipline.
A single theme unites these principles: Focus on the things you can control.
We believe there is no wiser course for any investor.
| Contents | |
| Your Fund’s Total Returns. | 1 |
| Chairman’s Letter. | 2 |
| Advisors’ Report. | 8 |
| Fund Profile. | 14 |
| Performance Summary. | 16 |
| Financial Statements. | 17 |
| About Your Fund’s Expenses. | 31 |
| Trustees Approve Advisory Arrangements. | 33 |
| Glossary. | 36 |
Please note: The opinions expressed in this report are just that—informed opinions. They should not be considered promises or advice.
Also, please keep in mind that the information and opinions cover the period through the date on the front of this report. Of course, the
risks of investing in your fund are spelled out in the prospectus.
See the Glossary for definitions of investment terms used in this report.
About the cover: The ship’s wheel represents leadership and guidance, essential qualities in navigating difficult seas.
This one is a replica based on an 18th-century British vessel. The HMSVanguard, another ship of that era, served as the
flagship for British Admiral Horatio Nelson when he defeated a French fleet at the Battle of the Nile.
Your Fund’s Total Returns
| Six Months Ended April 30, 2014 | |
| Total | |
| Returns | |
| Vanguard Explorer Fund | |
| Investor Shares | 3.19% |
| Admiral™ Shares | 3.27 |
| Russell 2500 Growth Index | 3.35 |
| Small-Cap Growth Funds Average | 0.47 |
| Small-Cap Growth Funds Average: Derived from data provided by Lipper, a Thomson Reuters Company. | |
| Admiral Shares carry lower expenses and are available to investors who meet certain account-balance requirements. | |
| Your Fund’s Performance at a Glance | ||||
| October 31, 2013, Through April 30, 2014 | ||||
| Distributions Per Share | ||||
| Starting | Ending | Income | Capital | |
| Share Price | Share Price | Dividends | Gains | |
| Vanguard Explorer Fund | ||||
| Investor Shares | $107.96 | $100.41 | $0.040 | $10.822 |
| Admiral Shares | 100.54 | 93.42 | 0.216 | 10.062 |
1

Chairman’s Letter
Dear Shareholder,
For the six months ended April 30, 2014, Vanguard Explorer Fund returned about 3%. This result nearly matched that of its benchmark, the Russell 2500 Growth Index, and easily exceeded the average return of its small-capitalization growth fund peers.
Small-cap stocks, which had been outperforming large-caps, decelerated over the period and returned less than the overall U.S. market. Given the cyclical nature of the market, such a turnaround is not unusual. The fund posted positive results in seven of ten market sectors, with industrial stocks the leading contributor to returns.
Please note that one of the fund’s advisors, Chartwell Investment Partners, is now a subsidiary of TriState Capital Bank. There is no change to Chartwell’s investment approach, and Edward Antoian and John Heffern continue to manage Chartwell’s portion of the fund. Chartwell has advised Vanguard Explorer Fund since 1997.
Also, after the close of the period, the fund’s trustees approved the addition of an eighth advisor, Arrowpoint Asset Management, LLC. Arrowpoint is a diversified investment management firm that uses an in-depth fundamental research approach. The firm, which began managing assets in 2007, currently manages more than $5 billion, including about $2 billion in assets in investments with objectives
2
similar to the Explorer Fund’s. Adding Arrowpoint supplements Explorer’s blend of proven managers while allowing the fund to retain its small-cap growth character. We believe this updated combination of advisors will benefit shareholders over the long term.
I also want to congratulate Kenneth L. Abrams on the 20th anniversary of his managing the Explorer Fund’s assets for Wellington Management Company, llp. Wellington has advised the fund since its inception in 1967, and Kenny began overseeing Wellington’s portion of the fund in February 1994.
Recent progress was sporadic, but stocks continued to climb
For the half year ended April 30, U.S. stocks returned almost 8%, notwithstanding the patches of turbulence the market has encountered in 2014. Technology stocks, for example, turned in a rocky performance amid concerns about pricey valuations. Weak economic data from China and the conflict in Ukraine also unsettled investors.
Global economic and political shifts are, of course, as inevitable as they are unpredictable. Broad diversification remains the best way of managing the risks they pose to your portfolio. As Joe Davis, our chief economist, noted recently,
| Market Barometer | |||
| Total Returns | |||
| Periods Ended April 30, 2014 | |||
| Six | One | Five Years | |
| Months | Year | (Annualized) | |
| Stocks | |||
| Russell 1000 Index (Large-caps) | 8.25% | 20.81% | 19.52% |
| Russell 2000 Index (Small-caps) | 3.08 | 20.50 | 19.84 |
| Russell 3000 Index (Broad U.S. market) | 7.83 | 20.78 | 19.54 |
| FTSE All-World ex US Index (International) | 2.84 | 9.77 | 13.22 |
| Bonds | |||
| Barclays U.S. Aggregate Bond Index (Broad taxable market) | 1.74% | -0.26% | 4.88% |
| Barclays Municipal Bond Index (Broad tax-exempt market) | 4.08 | 0.50 | 5.54 |
| Citigroup Three-Month U.S. Treasury Bill Index | 0.00 | 0.04 | 0.08 |
| CPI | |||
| Consumer Price Index | 1.51% | 1.95% | 2.14% |
3
“Having a broader portfolio tends to moderate those individual issues and that’s always, I think, a valuable starting point for investors.”
International stocks, in aggregate, returned nearly 3%, with the developed markets of Europe faring the best. The developed markets of the Pacific region and emerging markets, where China’s weakness was felt most, declined.
Despite low yields, the bond market experienced a surprising rally
Bonds continued to emerge from the struggles that marked much of 2013, when the market was roiled by worries about the prospect of the Federal Reserve reducing its stimulative bond-buying. In January, however, when the Fed actually started to trim purchases, investors seemed to take the news in stride.
The broad U.S. taxable bond market returned 1.74% for the six months. The yield of the 10-year Treasury note ended in April at 2.69%, up from 2.54% on October 31 but down from nearly 3% on December 31. (Bond prices and yields move in opposite directions.)
Municipal bonds returned 4.08%. Money market funds and savings accounts posted paltry returns as the Fed’s target for short-term interest rates remained at 0%–0.25%.
| Expense Ratios | |||
| Your Fund Compared With Its Peer Group | |||
| Investor | Admiral | Peer Group | |
| Shares | Shares | Average | |
| Explorer Fund | 0.51% | 0.34% | 1.42% |
The fund expense ratios shown are from the prospectus dated February 24, 2014, and represent estimated costs for the current fiscal year.
For the six months ended April 30, 2014, the fund’s annualized expense ratios were 0.52% for Investor Shares and 0.36% for Admiral Shares.
The peer-group expense ratio is derived from data provided by Lipper, a Thomson Reuters Company, and captures information through
year-end 2013.
Peer group: Small-Cap Growth Funds.
4
International bond markets (as measured by the Barclays Global Aggregate Index ex USD) returned 2.33%.
The fund’s performance reflected a defensive shift in the market
As investors moved from the most promising growth stocks to more defensive companies and industries,
| Growth stocks versus value stocks: A case for both |
| Growth and value stocks typically take turns outperforming each other. The chart here |
| shows how they have switched off during the past 20 years in leading or lagging a broad |
| market average. |
| These two styles of investing are typically considered complementary—when growth is |
| performing well, value typically isn’t, and vice versa. Very generally speaking, growth stocks |
| represent companies that are expected to expand their businesses at a rapid pace, while |
| value stocks typically represent more established, slower-growing companies. |
| Which does better in the long run? Neither. Vanguard research has shown that there is no |
| significant long-term difference in the risk/reward characteristics of growth and value stocks. |
| But, because their performance can vary considerably over shorter time periods, a truly |
| diversified portfolio should have exposure to both. |
| Rolling 12-month return differences, 1994–2013 |
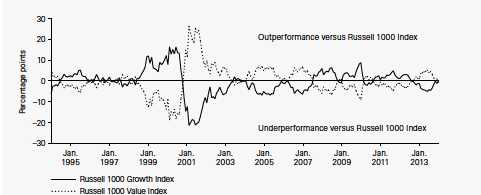
| Note: “Rolling” means here that 12-month returns were calculated from the start of each month in the 20-year period ended |
| December 31, 2013. |
| Source: Vanguard. |
5
this shift in market sentiment played out in your fund’s sector performance. Two sectors normally favored by conservative stock investors—health care and financials—were areas of relative strength for the fund. In health care, providers and pharmaceutical firms stood out. In financials, the advisors’ real estate investment trust holdings did particularly well as the REIT market began to bounce back from a subpar 2013.
The usually staid utilities sector was the fund’s best performer; it returned 15%, easily outdistancing its benchmark counterpart. The fund’s energy stocks also outperformed notably, with energy equipment and services firms benefiting from growth in U.S. energy production and distribution.
On the negative side of the ledger, consumer discretionary, Explorer’s second-largest sector, retreated –3%. Specialty retailers were particularly hurt by tepid holiday sales and by the severe winter that crimped consumer spending across much of the United States. The biggest drag on performance came from the materials sector, where the advisors’ holdings in chemical firms and construction materials significantly trailed their benchmark counterparts.
Information technology, the fund’s largest sector, turned in a flat performance as investors took a pause after bidding up industry stock prices last year.
You can find more information about the Explorer Fund’s performance and positioning in the Advisors’ Report that follows this letter.
Taking only a slice of the market can add risk to your portfolio
Like other Vanguard funds devoted to particular segments of the market, Vanguard Explorer Fund offers you a low-cost, transparent way to gain exposure to a specific part of the market—in this case, small-company growth stocks. Segment-specific funds can do important work for an investor—filling in a gap in a portfolio, for example.
But keep in mind that by choosing just a slice of the market, you’re also choosing to take on additional risk. Investors who depart from a market-proportional approach by overweighting a certain segment of the market are exposing themselves to more volatility by reducing their portfolio’s diversification.
6
Diversification is, of course, a powerful strategy for managing risk. Vanguard generally counsels that investors get exposure to large-, mid-, and small-cap stocks in a way that approximates the U.S. stock market, because this approach helps ensure that they stay diversified.
As we say in Vanguard’s Principles for Investing Success: “Leadership among market segments changes constantly and rapidly, so investors must diversify both to mitigate losses and to participate in gains.” (You can read more about our investment principles at vanguard.com/research.)
You can achieve balanced market-cap or growth/value representation through a total-market stock fund, or you can assemble segment-specific funds in way that mirrors the overall market. Either way, appropriate diversification should remain paramount.
As always, thank you for investing with Vanguard.
Sincerely,

F. William McNabb III
Chairman and Chief Executive Officer
May 14, 2014
7
Advisors’ Report
For the six months ended April 30, 2014, Vanguard Explorer Fund returned about 3% for both share classes. Your fund is managed by seven independent advisors, a strategy that enhances the fund’s diversification by providing exposure to distinct yet complementary investment approaches. It’s not uncommon for different advisors to have different views about individual securities or the broader investment environment.
The advisors, the amount and percentage of fund assets each manages, and brief descriptions of their investment strategies are presented in the table on page 12. The advisors have provided the following assessment of the investment environment during the past six months and the notable successes and shortfalls in their portfolios. These comments were prepared on May 21, 2014.
Wellington Management Company, llp
Portfolio Managers:
Kenneth L. Abrams, Senior Vice President
and Equity Portfolio Manager
Daniel J. Fitzpatrick, CFA, Vice President
and Equity Portfolio Manager
Stocks posted strong returns for the six months, as the S&P 500 Index returned more than 8% and the MSCI World Index returned more than 6%. Smaller-capitalization equities generally under-performed large-caps.
Successes: As has been the case over longer time horizons, our results for this period were driven by strong stock selection. Our bottom-up selection decisions were especially fruitful in the information technology, health care, industrial, and energy sectors.
Our position in AerCap Holdings, a Netherlands-based integrated global aviation company, was among the portfolio’s biggest relative contributors, as investors responded with enthusiasm to AerCap’s announcement that it would acquire ILFC, the aircraft leasing business of AIG. We continue to hold the company. Another top contributor to relative returns was Kindred Healthcare, a diversified U.S. provider of post-acute health care services; its shares rallied, returning more than 80%.
Shortfalls: Weak stock selection in the telecommunication services sector slightly hindered relative performance. Our underweight allocation to health care (an indirect result of our stock picks) also detracted.
Among the biggest relative detractors was television and movie producer DreamWorks Animation; lower-than-hoped-for business activity in its 2014 projections, with key TV revenue recognition delayed until 2015, held back results. DreamWorks is building new businesses in TV and online while delivering a very strong film slate in 2016. We still hold the stock.
8
Kalmar Investment Advisers
Portfolio Managers:
Ford B. Draper, Jr., President
and Chief Investment Officer
Dana F. Walker, CFA
Put simply, the last six months in the stock market can be seen as two periods: The first four months, when the markets were exceptionally rewarding, with gains driven mainly by ongoing Federal Reserve stimulus and a rise in overall valuations; and the final two months, which saw a significant correction focused on small and midsized stocks. Excessive valuations had built among high-growth, momentum-driven stocks, often those of companies with low to no earnings (for example, social media and similar internet stocks). The excesses were even more extreme for many biotechnology companies, where a speculative feeding frenzy took place. Both types of stocks are being repriced at lower levels in the present correction.
We had expected 2014 to be more volatile than 2013, and that has definitely been the case thus far. Longer term, equity valuations have risen in recent years but do not appear extreme, except in certain speculative areas mentioned above. Moreover, the U.S. and world economies appear to be slowly improving, and with the depressant of severe winter weather behind us, growth appears likely to strengthen. This may lead to a stabilization and improvement in stock prices, supported by rising corporate earnings.
Monetary tightening by the Fed still appears quite distant, reducing the risk of recession.
Successes: Energy and producer durables were our biggest contributors by industry category. Significant individual contributors included Actavis, PolyOne, Trimble Navigation, and Salix Pharmaceuticals.
Shortfalls: Consumer discretionary and health care were our biggest detractors. Our health care returns were held back in the first four months of the period because our valuation disciplines prevented us from owning the red-hot biotechs (though this helped insulate us in the present correction). Conn’s, Clean Harbors, and Ultimate Software were among significant individual detractors, as was Ulta Salon, which we added to on price weakness.
Granahan Investment Management, Inc.
Portfolio Managers:
Gary C. Hatton, CFA, Co-Founder
and Chief Investment Officer
Jane M. White, Co-Founder,
President, and Chief Executive Officer
Jennifer M. Pawloski,
Vice President
John V. Schneider, CFA,
Vice President
After 2013’s strong performance, the market is undergoing a transition. Foreign political unrest dominated recent headlines, and this put downward pressure on the market. The counterbalance was a strong
9
U.S. market for initial public offerings in the first part of 2014. Short-term market movements notwithstanding, we remain focused on executing our process for long-term results; we use in-depth research to identify well-run companies that we believe are poised for growth, and we judiciously own the stocks of these companies when their risk/reward ratios are attractive.
Our investment approach places companies in one of three life-cycle categories: pioneer, core growth, and special situation. This sorting is an important portfolio construction tool that helps mitigate risk.
Successes: Health care holdings, specifically biotechs and pharmaceuticals, helped performance. Alkermes, our top performer, remains successful with its long-acting antischizophrenia drugs. It has also added to its internal pipeline.
Shortfalls: Early in the period, we cut back many of our pioneer companies, in which valuations were stretched. Our reductions were not enough, as these stocks were hit particularly hard in the final three months. Stock selection held back returns in most sectors of the portfolio, though our significant overweighting of technology dampened returns the most. Individual detractors included network-equipment maker Infoblox, which preannounced an earnings miss caused by weakness in federal business and fewer big-ticket deals.
Chartwell Investment Partners, Inc.
Portfolio Managers:
Edward N. Antoian, CFA, CPA,
Managing Partner
John A. Heffern, Managing Partner
and Senior Portfolio Manager
Financial markets shrugged off the impact of harsh winter weather and geopolitical tensions to advance for the period. The equity market continues to focus on and reward companies meeting or exceeding investor expectations. Against this backdrop, our portfolio decisions reflected our steadfast bias toward quality, leadership, defensible profit margins, and a pattern of successfully executing growth-oriented business models.
Successes: Avis Budget Group was our top contributor to performance. This global vehicle rental services company drove results through an improving price structure, stabilization of costs, and a more aggressive capital allocation process. Another top contributor, HFF, a commercial real estate and capital markets services firm, preannounced record transaction volume in 2013 and reported double-digit revenue growth. In January, it announced a large special dividend.
Shortfalls: WNS Holdings, a provider of global business-process outsourcing services, declined amid concerns over reported changes at one of its larger travel industry clients. Aegerion Pharmaceuticals
10
declined in concert with the weakness in the biotech industry, as well as because of dimmer sales prospects for its signature drug.
Century Capital Management, LLC
Portfolio Manager:
Alexander L. Thorndike, Chief Investment
Officer and Managing Partner
The U.S. recovery keeps marching steadily forward. The U.S. Index of Leading Economic Indicators continues to move higher, while unemployment and consumer sentiment have returned to prerecession levels, supporting our theory that the economic expansion is likely to extend into 2015. Muted inflation and relatively stable energy prices are allowing the Fed to taper its bond-buying stimulus program while maintaining support for the recovery with low interest rates for the foreseeable future. We are further encouraged by the improving housing market, normalizing household debt levels, and lower government deficits. Smaller-cap companies are fairly valued; therefore, we are spending more time analyzing the relative trade-offs of growth and profitability within our investable universe.
Globally, improving economic outlooks in Europe and Asia are finally contributing to North American growth. The recent Russian aggression in Ukraine is an important reminder that the Western powers in the North Atlantic will see
more regional competitive friction with the expansionary ambitions of China and Russia. A synchronized global expansion needs geopolitical calm to ensure growth.
Successes: Our top performer by total return was Basic Energy Services, which provides oil field services to the onshore exploration and production industry. Jazz Pharmaceuticals, a specialty pharmaceutical company primarily focused on the central nervous system, also contributed. We trimmed our holdings in both companies during the period.
Shortfalls: Our worst performer by total return was MercadoLibre, a Latin American e-commerce platform. DSW, a branded footwear and accessory retailer, also underperformed. We still hold both companies and believe they remain undervalued.
Stephens Investment Management
Group, LLC
Portfolio Manager:
Ryan E. Crane, CFA,
Chief Investment Officer
Small and midsized growth companies saw a sharp change in investor sentiment during the period: Expensive stocks suffered while investors rotated into the cheapest companies. As a result, volatility increased, and value-based strategies significantly beat growth strategies. With the Fed tapering its stimulus program and
11
the domestic economy seemingly improving, we appear to be at an interesting inflection point, in both the financial markets and the economy.
Successes: As natural gas prices rebounded and domestic energy production further expands, our overweight position in energy stocks helped our performance. We also did well in biotechnology, specialty pharmaceuticals, and life science tools.
Shortfalls: We faced stylistic challenges during the period, and that caused disappointments across most sectors and industries. Our fastest-growing companies tend to be the most expensive and thus have been most hurt by the recent environment. Technology and some of our tech-biased industrials were the hardest hit. Generally speaking, though, long-term fundamentals for our investments still seem very much intact.
Vanguard Equity Investment Group
Portfolio Managers:
James D. Troyer, CFA, Principal
James P. Stetler, Principal
Michael R. Roach, CFA
Our stock selection models were robust in distinguishing the outperformers from the underperformers in each industry group for the six months. All the models contributed to results, with valuation and quality models leading the way.
Successes: Our stock selections were positive in eight sectors and negative in two. Selection contributed the most to relative returns in information technology, consumer staples, and industrials. In technology, Freescale Semiconductor, Zebra Technologies, and CalAmp contributed the most to relative returns. In consumer staples, Pilgrim’s Pride and Keurig Green Mountain led results, as did American Airlines Group and Manitowoc in industrials.
Shortfalls: Our selections in materials and energy slightly detracted from our results. In materials, Schweitzer-Mauduit International and Rock-Tenn Company did not perform as expected, and in energy our underweighting of Cheniere Energy proved costly.
12
| Vanguard Explorer Fund Investment Advisors | |||
| Fund Assets Managed | |||
| Investment Advisor | % | $ Million | Investment Strategy |
| Wellington Management | 31 | 3,841 | Conducts research and analysis of individual |
| Company, LLP | companies to select stocks believed to have | ||
| exceptional growth potential relative to their market | |||
| valuations. Each stock is considered individually before | |||
| purchase, and company developments are continually | |||
| monitored for comparison with expectations for | |||
| growth. | |||
| Kalmar Investment Advisers | 23 | 2,840 | Employs a “growth with value” strategy using creative, |
| bottom-up research to uncover vigorously growing, | |||
| high-quality businesses whose stocks can also be | |||
| bought inefficiently valued. The strategy has a dual | |||
| objective of strong returns with lower risk. | |||
| Granahan Investment | 17 | 2,076 | Bases its investment process on the beliefs that |
| Management, Inc. | earnings drive stock prices and that small, dynamic | ||
| companies with exceptional growth prospects have the | |||
| greatest long-term potential. A bottom-up, fundamental | |||
| approach places companies in one of three life-cycle | |||
| categories: pioneer, core growth, and special situation. | |||
| In each, the process looks for companies with strong | |||
| earnings growth potential and leadership in their | |||
| markets. | |||
| Chartwell Investment Partners, | 9 | 1,138 | Uses a bottom-up, fundamental, research-driven |
| Inc. | stock-selection strategy focusing on companies with | ||
| sustainable growth, strong management teams, | |||
| competitive positions, and outstanding product and | |||
| service offerings. These companies should continually | |||
| demonstrate growth in earnings per share. | |||
| Century Capital Management, | 9 | 1,118 | Employs a fundamental, bottom-up approach that |
| LLC | attempts to identify reasonably priced companies that | ||
| will grow faster than the overall market. Companies | |||
| also must have a superior return on equity, high | |||
| recurring revenues, and improving margins. | |||
| Stephens Investment | 6 | 710 | Employs a disciplined, bottom-up investment selection |
| Management Group, LLC | process that combines rigorous fundamental analysis | ||
| with quantitative screening to identify companies with | |||
| superior earnings growth potential. The approach | |||
| screens for core growth stocks and for catalyst stocks. | |||
| Core growth stocks have strong growth franchises, | |||
| recurring revenue, and above-average growth rates; | |||
| catalyst stocks are experiencing changes that could | |||
| lead to accelerated earnings growth. | |||
| Vanguard Equity Investment | 4 | 513 | Employs a quantitative fundamental management |
| Group | approach, using models that assess valuation, growth | ||
| prospects, management decisions, market sentiment, | |||
| and earnings and balance-sheet quality of companies | |||
| as compared with their peers. | |||
| Cash Investments | 1 | 174 | These short-term reserves are invested by Vanguard in |
| equity index products to simulate investment in stocks. | |||
| Each advisor also may maintain a modest cash | |||
| position. | |||
13
Explorer Fund
Fund Profile
As of April 30, 2014
| Share-Class Characteristics | ||
| Investor | Admiral | |
| Shares | Shares | |
| Ticker Symbol | VEXPX | VEXRX |
| Expense Ratio1 | 0.51% | 0.34% |
| 30-Day SEC Yield | 0.12% | 0.28% |
| Portfolio Characteristics | |||
| DJ | |||
| U.S. | |||
| Russell | Total | ||
| 2500 | Market | ||
| Growth | FA | ||
| Fund | Index | Index | |
| Number of Stocks | 648 | 1,495 | 3,664 |
| Median Market Cap | $3.2B | $4.0B | $47.3B |
| Price/Earnings Ratio | 29.2x | 31.5x | 19.7x |
| Price/Book Ratio | 3.0x | 4.2x | 2.6x |
| Return on Equity | 12.3% | 15.3% | 17.4% |
| Earnings Growth | |||
| Rate | 15.6% | 16.3% | 12.4% |
| Dividend Yield | 0.7% | 0.8% | 1.9% |
| Foreign Holdings | 3.4% | 0.0% | 0.0% |
| Turnover Rate | |||
| (Annualized) | 65% | — | — |
| Short-Term Reserves | 1.3% | — | — |
| Volatility Measures | ||
| DJ | ||
| U.S. Total | ||
| Russell 2500 | Market | |
| Growth Index | FA Index | |
| R-Squared | 0.99 | 0.92 |
| Beta | 0.99 | 1.25 |
| These measures show the degree and timing of the fund’s | ||
| fluctuations compared with the indexes over 36 months. | ||
| Ten Largest Holdings (% of total net assets) | ||
| West Pharmaceutical | ||
| Services Inc. | Health Care Supplies | 0.9% |
| PTC Inc. | Application Software | 0.8 |
| Alliance Data Systems | Data Processing & | |
| Corp. | Outsourced Services | 0.8 |
| Urban Outfitters Inc. | Apparel Retail | 0.7 |
| Cadence Design | ||
| Systems Inc. | Application Software | 0.6 |
| Salix Pharmaceuticals | ||
| Ltd. | Pharmaceuticals | 0.6 |
| Cooper Cos. Inc. | Health Care Supplies | 0.6 |
| Affiliated Managers | Asset Management | |
| Group Inc. | & Custody Banks | 0.6 |
| NASDAQ OMX Group | ||
| Inc. | Specialized Finance | 0.5 |
| Alkermes plc | Biotechnology | 0.5 |
| Top Ten | 6.6% | |
| The holdings listed exclude any temporary cash investments and equity index products. | ||
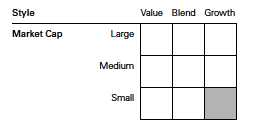
Investment Focus
1 The expense ratios shown are from the prospectus dated February 24, 2014, and represent estimated costs for the current fiscal year. For the six
months ended April 30, 2014, the annualized expense ratios were 0.52% for Investor Shares and 0.36% for Admiral Shares.
14
Explorer Fund
| Sector Diversification (% of equity exposure) | |||
| DJ | |||
| U.S. | |||
| Russell | Total | ||
| 2500 | Market | ||
| Growth | FA | ||
| Fund | Index | Index | |
| Consumer | |||
| Discretionary | 18.0% | 18.0% | 12.6% |
| Consumer Staples | 3.2 | 3.7 | 8.6 |
| Energy | 6.1 | 4.8 | 9.9 |
| Financials | 8.2 | 8.2 | 17.3 |
| Health Care | 15.2 | 16.5 | 12.8 |
| Industrials | 17.5 | 19.0 | 11.6 |
| Information | |||
| Technology | 23.8 | 20.3 | 17.9 |
| Materials | 6.1 | 7.8 | 3.9 |
| Other | 0.1 | 0.0 | 0.0 |
| Telecommunication | |||
| Services | 1.1 | 1.1 | 2.2 |
| Utilities | 0.7 | 0.6 | 3.2 |
15
Explorer Fund
Performance Summary
All of the returns in this report represent past performance, which is not a guarantee of future results that may be achieved by the fund. (Current performance may be lower or higher than the performance data cited. For performance data current to the most recent month-end, visit our website at vanguard.com/performance.) Note, too, that both investment returns and principal value can fluctuate widely, so an investor’s shares, when sold, could be worth more or less than their original cost. The returns shown do not reflect taxes that a shareholder would pay on fund distributions or on the sale of fund shares.
Fiscal-Year Total Returns (%): October 31, 2003, Through April 30, 2014
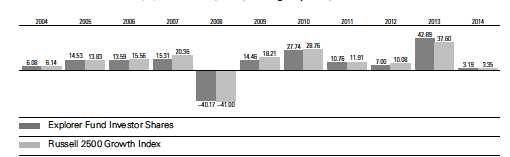
Note: For 2014, performance data reflect the six months ended April 30, 2014.
Average Annual Total Returns: Periods Ended March 31, 2014
This table presents returns through the latest calendar quarter—rather than through the end of the fiscal period.
Securities and Exchange Commission rules require that we provide this information.
| Inception | One | Five | Ten | |
| Date | Year | Years | Years | |
| Investor Shares | 12/11/1967 | 29.26% | 25.23% | 8.76% |
| Admiral Shares | 11/12/2001 | 29.46 | 25.44 | 8.94 |
See Financial Highlights for dividend and capital gains information.
16
Explorer Fund
Financial Statements (unaudited)
Statement of Net Assets—Investments Summary
As of April 30, 2014
This Statement summarizes the fund’s holdings by asset type. Details are reported for each of the fund’s 50 largest individual holdings and for investments that, in total for any issuer, represent more than 1% of the fund’s net assets. The total value of smaller holdings is reported as a single amount within each category.
The fund reports a complete list of its holdings in regulatory filings four times in each fiscal year, at the quarter-ends. For the second and fourth fiscal quarters, the complete listing of the fund’s holdings is available electronically on vanguard.com and on the Securities and Exchange Commission’s website (sec.gov), or you can have it mailed to you without charge by calling 800-662-7447. For the first and third fiscal quarters, the fund files the lists with the SEC on Form N-Q. Shareholders can look up the fund’s Forms N-Q on the SEC’s website. Forms N-Q may also be reviewed and copied at the SEC’s Public Reference Room (see the back cover of this report for further information).
| Market | Percentage | |||
| Value | of Net | |||
| Shares | ($000) | Assets | ||
| Common Stocks | ||||
| Consumer Discretionary | ||||
| * | Urban Outfitters Inc. | 2,404,460 | 85,731 | 0.7% |
| * | Life Time Fitness Inc. | 1,370,335 | 65,776 | 0.5% |
| * | LKQ Corp. | 2,238,795 | 65,194 | 0.5% |
| * | Crocs Inc. | 3,876,300 | 58,648 | 0.5% |
| * | Imax Corp. | 2,243,472 | 57,523 | 0.5% |
| * | CarMax Inc. | 1,261,795 | 55,241 | 0.4% |
| Churchill Downs Inc. | 589,054 | 51,737 | 0.4% | |
| Consumer Discretionary—Other † | 1,733,417 | 14.0% | ||
| 2,173,267 | 17.5% | |||
| Consumer Staples | ||||
| * | United Natural Foods Inc. | 775,944 | 53,563 | 0.5% |
| Consumer Staples—Other † | 325,848 | 2.6% | ||
| 379,411 | 3.1% | |||
| Energy | ||||
| Western Refining Inc. | 1,383,658 | 60,189 | 0.5% | |
| Core Laboratories NV | 268,745 | 50,438 | 0.4% | |
| Energy—Other † | 627,569 | 5.0% | ||
| 738,196 | 5.9% | |||
| Financials | ||||
| * | Affiliated Managers Group Inc. | 349,006 | 69,173 | 0.6% |
| NASDAQ OMX Group Inc. | 1,841,677 | 67,958 | 0.5% | |
| *,1 | eHealth Inc. | 1,429,565 | 59,884 | 0.5% |
| Financials—Other † | 770,022 | 6.2% | ||
| 967,037 | 7.8% | |||
| Health Care | ||||
| West Pharmaceutical Services Inc. | 2,465,740 | 106,964 | 0.9% | |
| * | Salix Pharmaceuticals Ltd. | 669,512 | 73,646 | 0.6% |
| Cooper Cos. Inc. | 535,155 | 70,592 | 0.6% | |
| * | Alkermes plc | 1,441,835 | 66,699 | 0.5% |
17
| Explorer Fund | ||||
| Market | Percentage | |||
| Value | of Net | |||
| Shares | ($000) | Assets | ||
| Kindred Healthcare Inc. | 2,588,939 | 64,982 | 0.5% | |
| * | Globus Medical Inc. | 2,660,683 | 64,974 | 0.5% |
| * | Bruker Corp. | 2,907,890 | 60,077 | 0.5% |
| * | Hospira Inc. | 1,112,000 | 50,930 | 0.4% |
| * | ICON plc | 1,304,728 | 50,584 | 0.4% |
| * | LifePoint Hospitals Inc. | 894,000 | 49,992 | 0.4% |
| Health Care—Other † | 1,168,298 | 9.4% | ||
| 1,827,738 | 14.7% | |||
| Industrials | ||||
| MSC Industrial Direct Co. Inc. Class A | 685,295 | 62,403 | 0.5% | |
| Chicago Bridge & Iron Co. NV | 748,705 | 59,949 | 0.5% | |
| Pentair Ltd. | 767,725 | 57,034 | 0.5% | |
| * | IHS Inc. Class A | 462,345 | 55,773 | 0.5% |
| * | B/E Aerospace Inc. | 632,547 | 55,519 | 0.5% |
| * | AerCap Holdings NV | 1,321,636 | 55,152 | 0.4% |
| Waste Connections Inc. | 1,233,500 | 55,088 | 0.4% | |
| * | Armstrong World Industries Inc. | 972,435 | 51,111 | 0.4% |
| * | Moog Inc. Class A | 772,808 | 50,580 | 0.4% |
| * | DXP Enterprises Inc. | 437,973 | 49,583 | 0.4% |
| EnerSys Inc. | 726,165 | 49,074 | 0.4% | |
| *,1 | American Woodmark Corp. | 799,559 | 23,995 | 0.2% |
| Industrials—Other † | 1,493,872 | 12.0% | ||
| 2,119,133 | 17.1% | |||
| Information Technology | ||||
| * | PTC Inc. | 2,795,666 | 98,883 | 0.8% |
| * | Alliance Data Systems Corp. | 407,098 | 98,477 | 0.8% |
| * | Cadence Design Systems Inc. | 4,864,560 | 75,693 | 0.6% |
| * | Euronet Worldwide Inc. | 1,443,930 | 66,406 | 0.5% |
| * | Ultimate Software Group Inc. | 551,764 | 66,008 | 0.5% |
| * | First Solar Inc. | 965,468 | 65,159 | 0.5% |
| * | Bankrate Inc. | 3,711,709 | 65,029 | 0.5% |
| * | Silicon Laboratories Inc. | 1,415,920 | 63,646 | 0.5% |
| * | Finisar Corp. | 2,380,600 | 62,253 | 0.5% |
| Belden Inc. | 775,675 | 57,253 | 0.5% | |
| * | TiVo Inc. | 4,778,160 | 56,669 | 0.5% |
| * | Sapient Corp. | 3,391,930 | 55,187 | 0.5% |
| * | Teradyne Inc. | 2,932,320 | 51,814 | 0.4% |
| *,1 | WNS Holdings Ltd. ADR | 2,619,414 | 48,773 | 0.4% |
| Information Technology—Other † | 1,946,413 | 15.7% | ||
| 2,877,663 | 23.2% | |||
| Materials | ||||
| * | Graphic Packaging Holding Co. | 6,437,664 | 66,050 | 0.5% |
| PolyOne Corp. | 1,544,520 | 57,873 | 0.5% | |
| Ball Corp. | 928,995 | 52,200 | 0.4% | |
| Materials—Other † | 558,788 | 4.5% | ||
| 734,911 | 5.9% | |||
| Other | ||||
| ^,2 | Vanguard Small-Cap Growth ETF | 463,200 | 55,376 | 0.5% |
| ^ | iShares Russell 2000 ETF | 482,850 | 54,070 | 0.4% |
| Other—Other † | 15,009 | 0.1% | ||
| 124,455 | 1.0% | |||
18
| Explorer Fund | ||||
| Market | Percentage | |||
| Value | of Net | |||
| ($000) | Assets | |||
| Telecommunication Services † | 134,846 | 1.1% | ||
| Utilities † | 86,447 | 0.7% | ||
| Total Common Stocks (Cost $9,038,420) | 12,163,104 | 98.0%3 | ||
| Coupon | Shares | |||
| Temporary Cash Investments | ||||
| Money Market Fund | ||||
| 4,5 Vanguard Market Liquidity Fund | 0.124% | 369,582,586 | 369,583 | 3.0% |
| Repurchase Agreement † | 25,300 | 0.2% | ||
| 6U.S. Government and Agency Obligations † | 12,399 | 0.1% | ||
| Total Temporary Cash Investments (Cost $407,281) | 407,282 | 3.3%3 | ||
| Total Investments (Cost $9,445,701) | 12,570,386 | 101.3% | ||
| Other Assets and Liabilities | ||||
| Other Assets | 113,210 | 0.9% | ||
| Liabilities5 | (273,113) | (2.2%) | ||
| (159,903) | (1.3%) | |||
| Net Assets | 12,410,483 | 100.0% | ||
19
| Explorer Fund | |
| At April 30, 2014, net assets consisted of: | |
| Amount | |
| ($000) | |
| Paid-in Capital | 8,348,600 |
| Overdistributed Net Investment Income | (11,390) |
| Accumulated Net Realized Gains | 954,436 |
| Unrealized Appreciation (Depreciation) | |
| Investment Securities | 3,124,685 |
| Futures Contracts | (5,851) |
| Foreign Currencies | 3 |
| Net Assets | 12,410,483 |
| Investor Shares—Net Assets | |
| Applicable to 50,290,857 outstanding $.001 par value shares of | |
| beneficial interest (unlimited authorization) | 5,049,600 |
| Net Asset Value Per Share—Investor Shares | $100.41 |
| Admiral Shares—Net Assets | |
| Applicable to 78,796,076 outstanding $.001 par value shares of | |
| beneficial interest (unlimited authorization) | 7,360,883 |
| Net Asset Value Per Share—Admiral Shares | $93.42 |
See Note A in Notes to Financial Statements.
* Non-income-producing security.
^ Includes partial security positions on loan to broker-dealers. The total value of securities on loan is $116,586,000.
† Represents the aggregate value, by category, of securities that are not among the 50 largest holdings and, in total for any issuer,
represent 1% or less of net assets.
1 Considered an affiliated company of the fund as the fund owns more than 5% of the outstanding voting securities of such company.
2 Considered an affiliated company of the fund as the issuer is another member of The Vanguard Group.
3 The fund invests a portion of its cash reserves in equity markets through the use of index futures contracts. After giving effect to futures
investments, the fund’s effective common stock and temporary cash investment positions represent 99.0% and 2.3%, respectively,
of net assets.
4 Affiliated money market fund available only to Vanguard funds and certain trusts and accounts managed by Vanguard. Rate shown is the
7-day yield.
5 Includes $120,010,000 of collateral received for securities on loan.
6 Securities with a value of $6,899,000 have been segregated as initial margin for open futures contracts.
ADR—American Depositary Receipt.
See accompanying Notes, which are an integral part of the Financial Statements.
20
Explorer Fund
Statement of Operations
| Six Months Ended | |
| April 30, 2014 | |
| ($000) | |
| Investment Income | |
| Income | |
| Dividends1,2 | 37,839 |
| Interest2 | 277 |
| Securities Lending | 1,521 |
| Total Income | 39,637 |
| Expenses | |
| Investment Advisory Fees—Note B | |
| Basic Fee | 13,438 |
| Performance Adjustment | 491 |
| The Vanguard Group—Note C | |
| Management and Administrative—Investor Shares | 7,384 |
| Management and Administrative—Admiral Shares | 4,190 |
| Marketing and Distribution—Investor Shares | 473 |
| Marketing and Distribution—Admiral Shares | 616 |
| Custodian Fees | 79 |
| Shareholders’ Reports—Investor Shares | 10 |
| Shareholders’ Reports—Admiral Shares | 30 |
| Trustees’ Fees and Expenses | 11 |
| Total Expenses | 26,722 |
| Expenses Paid Indirectly | (297) |
| Net Expenses | 26,425 |
| Net Investment Income | 13,212 |
| Realized Net Gain (Loss) | |
| Investment Securities Sold2 | 944,116 |
| Futures Contracts | 20,038 |
| Foreign Currencies | (6) |
| Realized Net Gain (Loss) | 964,148 |
| Change in Unrealized Appreciation (Depreciation) | |
| Investment Securities | (576,063) |
| Futures Contracts | (11,491) |
| Foreign Currencies | 2 |
| Change in Unrealized Appreciation (Depreciation) | (587,552) |
| Net Increase (Decrease) in Net Assets Resulting from Operations | 389,808 |
| 1 Dividends are net of foreign withholding taxes of $228,000. | |
| 2 Dividend income, interest income, and realized net gain (loss) from affiliated companies of the fund were $1,066,000, $260,000, and $81,703,000, respectively. | |
See accompanying Notes, which are an integral part of the Financial Statements.
21
Explorer Fund
Statement of Changes in Net Assets
| Six Months Ended | Year Ended | |
| April 30, | October 31, | |
| 2014 | 2013 | |
| ($000) | ($000) | |
| Increase (Decrease) in Net Assets | ||
| Operations | ||
| Net Investment Income | 13,212 | 34,926 |
| Realized Net Gain (Loss) | 964,148 | 1,321,182 |
| Change in Unrealized Appreciation (Depreciation) | (587,552) | 2,274,875 |
| Net Increase (Decrease) in Net Assets Resulting from Operations | 389,808 | 3,630,983 |
| Distributions | ||
| Net Investment Income | ||
| Investor Shares | (1,971) | (16,823) |
| Admiral Shares | (14,527) | (20,358) |
| Realized Capital Gain1 | ||
| Investor Shares | (533,162) | (142,437) |
| Admiral Shares | (676,723) | (111,244) |
| Total Distributions | (1,226,383) | (290,862) |
| Capital Share Transactions | ||
| Investor Shares | (177,361) | (1,200,040) |
| Admiral Shares | 1,354,803 | 1,163,674 |
| Net Increase (Decrease) from Capital Share Transactions | 1,177,442 | (36,366) |
| Total Increase (Decrease) | 340,867 | 3,303,755 |
| Net Assets | ||
| Beginning of Period | 12,069,616 | 8,765,861 |
| End of Period2 | 12,410,483 | 12,069,616 |
| 1 Includes fiscal 2014 short-term gain distributions totaling $192,517,000. Short-term gain distributions are treated as ordinary income dividends for tax purposes. | ||
| 2 Net Assets—End of Period includes undistributed (overdistributed) net investment income of ($11,390,000) and ($8,098,000). | ||
See accompanying Notes, which are an integral part of the Financial Statements.
22
Explorer Fund
Financial Highlights
| Investor Shares | ||||||
| Six Months | ||||||
| Ended | ||||||
| For a Share Outstanding | April 30, | Year Ended October 31, | ||||
| Throughout Each Period | 2014 | 2013 | 2012 | 2011 | 2010 | 2009 |
| Net Asset Value, Beginning of Period | $107.96 | $78.03 | $73.02 | $66.02 | $51.77 | $45.54 |
| Investment Operations | ||||||
| Net Investment Income | . 066 | . 2191 | .108 | .077 | .109 | .178 |
| Net Realized and Unrealized Gain (Loss) | ||||||
| on Investments | 3.246 | 32.286 | 4.998 | 7.029 | 14.239 | 6.334 |
| Total from Investment Operations | 3.312 | 32.505 | 5.106 | 7.106 | 14.348 | 6.512 |
| Distributions | ||||||
| Dividends from Net Investment Income | (. 040) | (. 272) | (. 096) | (.106) | (. 098) | (. 282) |
| Distributions from Realized Capital Gains | (10.822) | (2.303) | — | — | — | — |
| Total Distributions | (10.862) | (2.575) | (. 096) | (.106) | (. 098) | (. 282) |
| Net Asset Value, End of Period | $100.41 | $107.96 | $78.03 | $73.02 | $66.02 | $51.77 |
| Total Return2 | 3.19% | 42.89% | 7.00% | 10.76% | 27.74% | 14.46% |
| Ratios/Supplemental Data | ||||||
| Net Assets, End of Period (Millions) | $5,050 | $5,573 | $5,008 | $5,864 | $6,290 | $5,677 |
| Ratio of Total Expenses to | ||||||
| Average Net Assets3 | 0.52% | 0.50% | 0.49% | 0.50% | 0.49% | 0.54% |
| Ratio of Net Investment Income to | ||||||
| Average Net Assets | 0.12% | 0.27%1 | 0.16% | 0.12% | 0.19% | 0.38% |
| Portfolio Turnover Rate | 65% | 65% | 59% | 89%4 | 82% | 95% |
The expense ratio, net income ratio, and turnover rate for the current period have been annualized.
1 Net investment income per share and the ratio of net investment income to average net assets include $.038 and 0.03%, respectively,
resulting from a special dividend from HFF Inc. in December 2012.
2 Total returns do not include account service fees that may have applied in the periods shown. Fund prospectuses provide information
about any applicable account service fees.
3 Includes performance-based investment advisory fee increases (decreases) of 0.01%, 0.00%, (0.03%), 0.00%, (0.01%), and (0.01%).
4 Excludes the value of portfolio securities received or delivered as a result of in-kind purchases or redemptions of the fund’s capital shares.
See accompanying Notes, which are an integral part of the Financial Statements.
23
Explorer Fund
Financial Highlights
| Admiral Shares | ||||||
| Six Months | ||||||
| Ended | ||||||
| For a Share Outstanding | April 30, | Year Ended October 31, | ||||
| Throughout Each Period | 2014 | 2013 | 2012 | 2011 | 2010 | 2009 |
| Net Asset Value, Beginning of Period | $100.54 | $72.68 | $68.04 | $61.50 | $48.21 | $42.45 |
| Investment Operations | ||||||
| Net Investment Income | .155 | . 3751 | .236 | .179 | .206 | .246 |
| Net Realized and Unrealized Gain (Loss) | ||||||
| on Investments | 3.003 | 30.019 | 4.621 | 6.550 | 13.259 | 5.881 |
| Total from Investment Operations | 3.158 | 30.394 | 4.857 | 6.729 | 13.465 | 6.127 |
| Distributions | ||||||
| Dividends from Net Investment Income | (. 216) | (. 392) | (. 217) | (.189) | (.175) | (. 367) |
| Distributions from Realized Capital Gains | (10.062) | (2.142) | — | — | — | — |
| Total Distributions | (10.278) | (2.534) | (. 217) | (.189) | (.175) | (. 367) |
| Net Asset Value, End of Period | $93.42 | $100.54 | $72.68 | $68.04 | $61.50 | $48.21 |
| Total Return | 3.27% | 43.13% | 7.16% | 10.94% | 27.98% | 14.66% |
| Ratios/Supplemental Data | ||||||
| Net Assets, End of Period (Millions) | $7,361 | $6,497 | $3,757 | $3,288 | $2,864 | $2,252 |
| Ratio of Total Expenses to | ||||||
| Average Net Assets2 | 0.36% | 0.34% | 0.32% | 0.34% | 0.32% | 0.34% |
| Ratio of Net Investment Income to | ||||||
| Average Net Assets | 0.28% | 0.43%1 | 0.33% | 0.28% | 0.36% | 0.58% |
| Portfolio Turnover Rate | 65% | 65% | 59% | 89%3 | 82% | 95% |
The expense ratio, net income ratio, and turnover rate for the current period have been annualized.
1 Net investment income per share and the ratio of net investment income to average net assets include $.019 and 0.03%, respectively,
resulting from a special dividend from HFF Inc. in December 2012.
2 Includes performance-based investment advisory fee increases (decreases) of 0.01%, 0.00%, (0.03%), 0.00%, (0.01%), and (0.01%).
3 Excludes the value of portfolio securities received or delivered as a result of in-kind purchases or redemptions of the fund’s capital shares.
See accompanying Notes, which are an integral part of the Financial Statements.
24
Explorer Fund
Notes to Financial Statements
Vanguard Explorer Fund is registered under the Investment Company Act of 1940 as an open-end investment company, or mutual fund. The fund offers two classes of shares: Investor Shares and Admiral Shares. Investor Shares are available to any investor who meets the fund’s minimum purchase requirements. Admiral Shares are designed for investors who meet certain administrative, service, and account-size criteria.
A. The following significant accounting policies conform to generally accepted accounting principles for U.S. investment companies. The fund consistently follows such policies in preparing its financial statements.
1. Security Valuation: Securities are valued as of the close of trading on the New York Stock Exchange (generally 4 p.m., Eastern time) on the valuation date. Equity securities are valued at the latest quoted sales prices or official closing prices taken from the primary market in which each security trades; such securities not traded on the valuation date are valued at the mean of the latest quoted bid and asked prices. Securities for which market quotations are not readily available, or whose values have been affected by events occurring before the fund’s pricing time but after the close of the securities’ primary markets, are valued at their fair values calculated according to procedures adopted by the board of trustees. These procedures include obtaining quotations from an independent pricing service, monitoring news to identify significant market- or security-specific events, and evaluating changes in the values of foreign market proxies (for example, ADRs, futures contracts, or exchange-traded funds), between the time the foreign markets close and the fund’s pricing time. When fair-value pricing is employed, the prices of securities used by a fund to calculate its net asset value may differ from quoted or published prices for the same securities. Investments in Vanguard Market Liquidity Fund are valued at that fund’s net asset value. Temporary cash investments acquired over 60 days to maturity are valued using the latest bid prices or using valuations based on a matrix system (which considers such factors as security prices, yields, maturities, and ratings), both as furnished by independent pricing services. Other temporary cash investments are valued at amortized cost, which approximates market value.
2. Foreign Currency: Securities and other assets and liabilities denominated in foreign currencies are translated into U.S. dollars using exchange rates obtained from an independent third party as of the fund’s pricing time on the valuation date. Realized gains (losses) and unrealized appreciation (depreciation) on investment securities include the effects of changes in exchange rates since the securities were purchased, combined with the effects of changes in security prices. Fluctuations in the value of other assets and liabilities resulting from changes in exchange rates are recorded as unrealized foreign currency gains (losses) until the assets or liabilities are settled in cash, at which time they are recorded as realized foreign currency gains (losses).
3. Futures Contracts: The fund uses index futures contracts to a limited extent, with the objective of maintaining full exposure to the stock market while maintaining liquidity. The fund may purchase or sell futures contracts to achieve a desired level of investment, whether to accommodate portfolio turnover or cash flows from capital share transactions. The primary risks associated with the use of futures contracts are imperfect correlation between changes in market values of stocks held by the fund and the prices of futures contracts, and the possibility of an illiquid market. Counterparty risk involving futures is mitigated because a regulated clearinghouse is the counterparty instead of the clearing broker. To further mitigate counterparty risk, the fund trades futures contracts on an exchange, monitors the financial strength of its clearing brokers and clearinghouse, and has entered into clearing agreements with its clearing brokers. The clearinghouse imposes initial margin requirements to secure the fund’s performance and requires daily settlement of variation margin representing changes in the market value of each contract.
25
Explorer Fund
Futures contracts are valued at their quoted daily settlement prices. The aggregate notional amounts of the contracts are not recorded in the Statement of Net Assets. Fluctuations in the value of the contracts are recorded in the Statement of Net Assets as an asset (liability) and in the Statement of Operations as unrealized appreciation (depreciation) until the contracts are closed, when they are recorded as realized futures gains (losses).
During the six months ended April 30, 2014, the fund’s average investments in long and short futures contracts represented 2% and 0% of net assets, respectively, based on quarterly average aggregate settlement values.
4. Repurchase Agreements: The fund enters into repurchase agreements with institutional counterparties. Securities pledged as collateral to the fund under repurchase agreements are held by a custodian bank until the agreements mature. Each agreement requires that the market value of the collateral be sufficient to cover payments of interest and principal. The fund further mitigates its counterparty risk by entering into repurchase agreements only with a diverse group of prequalified counterparties, monitoring their financial strength, and entering into master repurchase agreements with its counterparties. The master repurchase agreements provide that, in the event of a counter-party’s default (including bankruptcy), the fund may terminate any repurchase agreements with that counterparty, determine the net amount owed, and sell or retain the collateral up to the net amount owed to the fund. Such action may be subject to legal proceedings, which may delay or limit the disposition of collateral.
5. Federal Income Taxes: The fund intends to continue to qualify as a regulated investment company and distribute all of its taxable income. Management has analyzed the fund’s tax positions taken for all open federal income tax years (October 31, 2010–2013), and for the period ended April 30, 2014, and has concluded that no provision for federal income tax is required in the fund’s financial statements.
6. Distributions: Distributions to shareholders are recorded on the ex-dividend date.
7. Securities Lending: To earn additional income, the fund lends its securities to qualified institutional borrowers. Security loans are required to be secured at all times by collateral in an amount at least equal to the market value of securities loaned. Daily market fluctuations could cause the value of loaned securities to be more or less than the value of the collateral received. When this occurs, the collateral is adjusted and settled on the next business day. The fund further mitigates its counterparty risk by entering into securities lending transactions only with a diverse group of prequalified counter-parties, monitoring their financial strength, and entering into master securities lending agreements with its counterparties. The master securities lending agreements provide that, in the event of a counterparty’s default (including bankruptcy), the fund may terminate any loans with that borrower, determine the net amount owed, and sell or retain the collateral up to the net amount owed to the fund; however, such actions may be subject to legal proceedings. While collateral mitigates counter-party risk, in the absence of a default the fund may experience delays and costs in recovering the securities loaned. The fund invests cash collateral received in Vanguard Market Liquidity Fund, and records a liability in the Statement of Net Assets for the return of the collateral, during the period the securities are on loan. Securities lending income represents fees charged to borrowers plus income earned on invested cash collateral, less expenses associated with the loan.
8. Credit Facility: The fund and certain other funds managed by The Vanguard Group participate in a $2.89 billion committed credit facility provided by a syndicate of lenders pursuant to a credit agreement that may be renewed annually; each fund is individually liable for its borrowings, if any, under the credit facility. Borrowings may be utilized for temporary and emergency purposes, and are subject to the fund’s regulatory and contractual borrowing restrictions. The participating funds are
26
Explorer Fund
charged administrative fees and an annual commitment fee of 0.06% of the undrawn amount of the facility; these fees are allocated to the funds based on a method approved by the fund’s board of trustees and included in Management and Administrative expenses on the fund’s Statement of Operations. Any borrowings under this facility bear interest at a rate equal to the higher of the federal funds rate or LIBOR reference rate plus an agreed-upon spread.
The fund had no borrowings outstanding at April 30, 2014, or at any time during the period then ended.
9. Other: Dividend income is recorded on the ex-dividend date. Interest income includes income distributions received from Vanguard Market Liquidity Fund and is accrued daily. Premiums and discounts on debt securities purchased are amortized and accreted, respectively, to interest income over the lives of the respective securities. Security transactions are accounted for on the date securities are bought or sold. Costs used to determine realized gains (losses) on the sale of investment securities are those of the specific securities sold.
Each class of shares has equal rights as to assets and earnings, except that each class separately bears certain class-specific expenses related to maintenance of shareholder accounts (included in Management and Administrative expenses) and shareholder reporting. Marketing and distribution expenses are allocated to each class of shares based on a method approved by the board of trustees. Income, other non-class-specific expenses, and gains and losses on investments are allocated to each class of shares based on its relative net assets.
B. Wellington Management Company, LLP, Kalmar Investment Advisers, Granahan Investment Management, Inc., Chartwell Investment Partners, Inc., Century Capital Management, LLC, and Stephens Investment Management Group, LLC, each provide investment advisory services to a portion of the fund for a fee calculated at an annual percentage rate of average net assets managed by the advisor. The basic fees of Wellington Management Company, LLP, and Kalmar Investment Advisers are subject to quarterly adjustments based on performance for the preceding three years relative to the Russell 2500 Growth Index. The basic fee of Granahan Investment Management, Inc., is subject to quarterly adjustments based on performance for the preceding three years relative to the Russell 2500 Growth Index for periods prior to November 1, 2013, and the new benchmark, a 50/50 blend of the Russell 2500 Growth Index and the Russell 2000 Growth Index, beginning November 1, 2013. The new benchmark will be fully phased in by October 31, 2016. The basic fee of Chartwell Investment Partners, Inc., is subject to quarterly adjustments based on performance for the preceding three years relative to the Russell 2500 Growth Index for periods prior to February 1, 2012, and the current benchmark, Russell 2000 Growth Index, beginning February 1, 2012. The current benchmark will be fully phased in by January 31, 2015. The basic fee of Century Capital Management, LLC, is subject to quarterly adjustments based on performance for the preceding three years relative to a 50/50 blend of the Russell 2500 Index and the Russell 2500 Growth Index. In accordance with the advisory contract entered into with Stephens Investment Management Group, LLC, beginning August 1, 2014, the investment advisory fee will be subject to quarterly adjustments based on performance since October 31, 2013, relative to the Russell 2500 Growth Index.
The Vanguard Group provides investment advisory services to a portion of the fund on an at-cost basis; the fund paid Vanguard advisory fees of $276,000 for the six months ended April 30, 2014.
For the six months ended April 30, 2014, the aggregate investment advisory fee represented an effective annual basic rate of 0.21% of the fund’s average net assets, before an increase of $491,000 (0.01%) based on performance.
27
Explorer Fund
C. The Vanguard Group furnishes at cost corporate management, administrative, marketing, and distribution services. The costs of such services are allocated to the fund based on methods approved by the board of trustees. The fund has committed to provide up to 0.40% of its net assets in capital contributions to Vanguard. At April 30, 2014, the fund had contributed capital of $1,379,000 to Vanguard (included in Other Assets), representing 0.01% of the fund’s net assets and 0.55% of Vanguard’s capitalization. The fund’s trustees and officers are also directors and officers of Vanguard.
D. The fund has asked its investment advisors to direct certain security trades, subject to obtaining the best price and execution, to brokers who have agreed to rebate to the fund part of the commissions generated. Such rebates are used solely to reduce the fund’s management and administrative expenses. For the six months ended April 30, 2014, these arrangements reduced the fund’s expenses by $297,000 (an annual rate of 0.00% of average net assets).
E. Various inputs may be used to determine the value of the fund’s investments. These inputs are summarized in three broad levels for financial statement purposes. The inputs or methodologies used to value securities are not necessarily an indication of the risk associated with investing in those securities.
Level 1—Quoted prices in active markets for identical securities.
Level 2—Other significant observable inputs (including quoted prices for similar securities, interest rates, prepayment speeds, credit risk, etc.).
Level 3—Significant unobservable inputs (including the fund’s own assumptions used to determine the fair value of investments).
The following table summarizes the market value of the fund’s investments as of April 30, 2014, based on the inputs used to value them:
| Level 1 | Level 2 | Level 3 | |
| Investments | ($000) | ($000) | ($000) |
| Common Stocks | 12,082,994 | 65,101 | 15,009 |
| Temporary Cash Investments | 369,583 | 37,699 | — |
| Futures Contracts—Assets1 | 952 | — | — |
| Futures Contracts—Liabilities1 | (83) | — | — |
| Total | 12,453,446 | 102,800 | 15,009 |
| 1 Represents variation margin on the last day of the reporting period. | |||
F. At April 30, 2014, the aggregate settlement value of open futures contracts and the related unrealized appreciation (depreciation) were:
| ($000) | ||||
| Aggregate | ||||
| Number of | Settlement | Unrealized | ||
| Long (Short) | Value | Appreciation | ||
| Futures Contracts | Expiration | Contracts | Long (Short) | (Depreciation) |
| E-mini Russell 2000 Index | June 2014 | 851 | 95,618 | (5,469) |
| E-mini S&P MidCap 400 Index | June 2014 | 213 | 28,821 | (382) |
| (5,851) | ||||
Unrealized appreciation (depreciation) on open futures contracts is required to be treated as realized gain (loss) for tax purposes.
Explorer Fund
G. Distributions are determined on a tax basis and may differ from net investment income and realized capital gains for financial reporting purposes. Differences may be permanent or temporary. Permanent differences are reclassified among capital accounts in the financial statements to reflect their tax character. Temporary differences arise when certain items of income, expense, gain, or loss are recognized in different periods for financial statement and tax purposes. These differences will reverse at some time in the future. Differences in classification may also result from the treatment of short-term gains as ordinary income for tax purposes. The fund’s tax-basis capital gains and losses are determined only at the end of each fiscal year.
At April 30, 2014, the cost of investment securities for tax purposes was $9,445,750,000. Net unrealized appreciation of investment securities for tax purposes was $3,124,636,000, consisting of unrealized gains of $3,427,649,000 on securities that had risen in value since their purchase and $303,013,000 in unrealized losses on securities that had fallen in value since their purchase.
H. During the six months ended April 30, 2014, the fund purchased $4,261,304,000 of investment securities and sold $3,990,961,000 of investment securities, other than temporary cash investments.
I. Capital share transactions for each class of shares were:
| Six Months Ended | Year Ended | |||
| April 30, 2014 | October 31, 2013 | |||
| Amount | Shares | Amount | Shares | |
| ($000) | (000) | ($000) | (000) | |
| Investor Shares | ||||
| Issued | 332,029 | 3,192 | 512,781 | 5,468 |
| Issued in Lieu of Cash Distributions | 528,322 | 5,327 | 157,299 | 2,003 |
| Redeemed | (1,037,712) | (9,846) | (1,870,120) | (20,041) |
| Net Increase (Decrease)—Investor Shares | (177,361) | (1,327) | (1,200,040) | (12,570) |
| Admiral Shares | ||||
| Issued | 1,262,908 | 12,901 | 1,844,750 | 20,811 |
| Issued in Lieu of Cash Distributions | 653,398 | 7,085 | 123,108 | 1,686 |
| Redeemed | (561,503) | (5,813) | (804,184) | (9,572) |
| Net Increase (Decrease)—Admiral Shares | 1,354,803 | 14,173 | 1,163,674 | 12,925 |
29
Explorer Fund
J. Certain of the fund’s investments are in companies that are considered to be affiliated companies of the fund because the fund owns more than 5% of the outstanding voting securities of the company. Transactions during the period in securities of these companies were as follows:
| Current Period Transactions | |||||
| Oct. 31, 2013 | Proceeds from | Apr. 30, 2014 | |||
| Market | Purchases | Securities | Dividend | Market | |
| Value | at Cost | Sold | Income | Value | |
| ($000) | ($000) | ($000) | ($000) | ($000) | |
| American Woodmark Corp. | NA1 | 8,343 | 1,394 | — | 23,995 |
| eHealth Inc. | 63,502 | 10,496 | 16,296 | — | 59,884 |
| Kindred Healthcare Inc. | 44,737 | — | 12,203 | 697 | NA2 |
| TiVo Inc. | 81,667 | 6,124 | 22,798 | — | NA2 |
| WNS Holdings Ltd. ADR | NA1 | 10,566 | 7,235 | — | 48,773 |
| 189,906 | 697 | 132,652 | |||
1 Not applicable—At October 31, 2013, the issuer was not an affiliated company of the fund.
2 Not applicable—At April 30, 2014, the security was still held, but the issuer was no longer an affiliated company of the fund.
K. Management has determined that no transactions occurred subsequent to April 30, 2014, that would require recognition or disclosure in these financial statements. In May 2014, the fund’s board of trustees approved the addition of Arrowpoint Asset Management, LLC, as the eighth advisor to the fund’s advisory team.
30
About Your Fund’s Expenses
As a shareholder of the fund, you incur ongoing costs, which include costs for portfolio management, administrative services, and shareholder reports (like this one), among others. Operating expenses, which are deducted from a fund’s gross income, directly reduce the investment return of the fund.
A fund’s expenses are expressed as a percentage of its average net assets. This figure is known as the expense ratio. The following examples are intended to help you understand the ongoing costs (in dollars) of investing in your fund and to compare these costs with those of other mutual funds. The examples are based on an investment of $1,000 made at the beginning of the period shown and held for the entire period.
The accompanying table illustrates your fund’s costs in two ways:
• Based on actual fund return. This section helps you to estimate the actual expenses that you paid over the period. The ”Ending Account Value“ shown is derived from the fund‘s actual return, and the third column shows the dollar amount that would have been paid by an investor who started with $1,000 in the fund. You may use the information here, together with the amount you invested, to estimate the expenses that you paid over the period.
To do so, simply divide your account value by $1,000 (for example, an $8,600 account value divided by $1,000 = 8.6), then multiply the result by the number given for your fund under the heading ”Expenses Paid During Period.“
• Based on hypothetical 5% yearly return. This section is intended to help you compare your fund‘s costs with those of other mutual funds. It assumes that the fund had a yearly return of 5% before expenses, but that the expense ratio is unchanged. In this case—because the return used is not the fund’s actual return—the results do not apply to your investment. The example is useful in making comparisons because the Securities and Exchange Commission requires all mutual funds to calculate expenses based on a 5% return. You can assess your fund’s costs by comparing this hypothetical example with the hypothetical examples that appear in shareholder reports of other funds.
Note that the expenses shown in the table are meant to highlight and help you compare ongoing costs only and do not reflect transaction costs incurred by the fund for buying and selling securities. Further, the expenses do not include any purchase, redemption, or account service fees described in the fund prospectus. If such fees were applied to your account, your costs would be higher. Your fund does not carry a “sales load.”
The calculations assume no shares were bought or sold during the period. Your actual costs may have been higher or lower, depending on the amount of your investment and the timing of any purchases or redemptions.
You can find more information about the fund’s expenses, including annual expense ratios, in the Financial Statements section of this report. For additional information on operating expenses and other shareholder costs, please refer to your fund’s current prospectus.
31
| Six Months Ended April 30, 2014 | |||
| Beginning | Ending | Expenses | |
| Account Value | Account Value | Paid During | |
| Explorer Fund | 10/31/2013 | 4/30/2014 | Period |
| Based on Actual Fund Return | |||
| Investor Shares | $1,000.00 | $1,031.93 | $2.62 |
| Admiral Shares | 1,000.00 | 1,032.74 | 1.81 |
| Based on Hypothetical 5% Yearly Return | |||
| Investor Shares | $1,000.00 | $1,022.22 | $2.61 |
| Admiral Shares | 1,000.00 | 1,023.01 | 1.81 |
The calculations are based on expenses incurred in the most recent six-month period. The fund’s annualized six-month expense ratios for that
period are 0.52% for Investor Shares and 0.36% for Admiral Shares. The dollar amounts shown as “Expenses Paid” are equal to the
annualized expense ratio multiplied by the average account value over the period, multiplied by the number of days in the most recent
six-month period, then divided by the number of days in the most recent 12-month period.
32
Trustees Approve Advisory Arrangements
The board of trustees of Vanguard Explorer Fund has renewed the fund’s investment advisory arrangements with Century Capital Management, LLC (Century Capital); Chartwell Investment Partners (Chartwell); Granahan Investment Management, Inc. (Granahan); Kalmar Investment Advisers (Kalmar); Stephens Investment Management Group, LLC (SIMG); Wellington Management Company, LLP (Wellington Management); and The Vanguard Group, Inc. (Vanguard) (through its Equity Investment Group). In addition, the board also approved a new advisory agreement with Chartwell for the reasons described below.
In March 2014, Chartwell was acquired by TriState Capital Holdings, Inc. (TriState Capital). The acquisition resulted in what is legally referred to as a change in control of Chartwell. This change constituted an “assignment” under the Investment Company Act of 1940 and triggered the automatic termination of Chartwell’s former advisory agreement with the fund. The board of trustees approved a new advisory agreement to allow for an uninterrupted advisory relationship between Chartwell and the fund. The new agreement is identical in all material respects to the former agreement with Chartwell except for the date of the agreement and a change to the Chartwell entity name from Chartwell Investment Partners, L.P., to Chartwell Investment Partners, Inc.
The board determined that renewing and approving the fund’s advisory arrangements was in the best interests of the fund and its shareholders.
Nature, extent, and quality of services
The board considered the quality of the fund’s investment management services over both the short and long term, and took into account the organizational depth and stability of each advisor. The board noted the following:
Century Capital. Century Capital is an investment management boutique, owned by the investment professionals within the firm. Century Capital employs a fundamental, bottom-up investment approach that seeks to identify reasonably priced companies that will grow faster than the overall market. Independent research is a core tenet. The ideal investment is a well-managed company that is reasonably valued, in a non-capital-intensive business, with established products or services, a high return on equity, high recurring revenues, and improving margins. The firm has managed a portion of the fund since 2008.
Chartwell. Chartwell, founded in 1997, is a wholly owned subsidiary of TriState Capital. The firm has expertise in small- and mid-cap equity management and employs a fundamental bottom-up strategy, seeking companies with superior growth potential trading at reasonable valuations. Using fundamental research, the firm selects a relatively aggressive portfolio of 70–90 stocks concentrated mostly in the consumer, health care, and technology sectors. Stocks considered for purchase fall into three categories: superior growth potential, based on market trends or new products or services; lower relative valuation, based on market trends or new products or services; lower relative valuation, based on price/earnings ratios, price/sales ratios, and price/earnings to growth rates; and underpriced because of an industry downturn or short-term problems. The firm has managed a portion of the fund since 1997.
Granahan. Founded in 1985, Granahan specializes in small-cap growth equity investing. The firm uses fundamental research to select a portfolio of 130–170 stocks with sustainable growth characteristics. Granahan achieves portfolio diversification through dedicated allocations to three categories of growth companies: core growth (40%–70%), represented by companies with strong
33
market position, based on proprietary products or services; pioneers (15%–30%), companies with unique technology or innovations; and special situation (15%–30%), companies with growth potential overlooked by the market. The firm has managed a portion of the fund since 1990.
Kalmar. Kalmar, together with its parent company, Kalmar Investments Inc., founded in 1982, specializes in small- and mid-cap growth equity investing. Kalmar is a research-driven investment firm that is entirely focused on the management of “growth with value” small- and mid-cap equity portfolios. Kalmar believes that there is a high-reward and low-risk anomaly offered by the equity market in the stocks of solid, well-managed, rapidly growing smaller companies. Through independent fundamental research, Kalmar attempts to discover such companies, buy them at undervalued levels, and own them for the longer term. The firm has managed a portion of the fund since 2005.
SIMG. SIMG, a subsidiary of Stephens Investments Holdings LLC, a privately held and family-owned company, is an investment advisory firm founded in 2005. SIMG employs a disciplined, bottom-up investment selection process that combines rigorous fundamental analysis with quantitative screening in an effort to identify companies that exhibit potential for superior earnings growth. It invests in two distinctly different types of stocks: core growth and earnings catalyst. The characteristics it seeks for core growth stocks are consistent and predictable earnings growth that is generated by unique, defensible business models. For earnings catalyst stocks, it looks for inflection points such as large earnings surprises or positive revisions to earnings estimates or guidance.
Wellington Management. Founded in 1928, Wellington Management is among the nation’s oldest and most respected institutional investment managers. Using a bottom-up, fundamentally driven approach, Wellington Management invests opportunistically in a diversified portfolio of high-quality stocks. Wellington Management attempts to identify companies with key success factors such as top market share, substantial insider ownership, and fully funded business plans. The research-intensive approach is supported by the team’s deep and tenured analytical staff, which may also leverage Wellington Management’s extensive industry research capabilities. The firm has advised the fund since 1967.
Vanguard. Vanguard has been managing investments for more than three decades. The Equity Investment Group adheres to a sound, disciplined investment management process; the team has considerable experience, stability, and depth. Vanguard has managed a portion of the fund since 1997.
The board concluded that each advisor’s experience, stability, depth, and performance, among other factors, warranted approval and continuation of the advisory arrangements.
Investment performance
The board considered the short- and long-term performance of the fund and each advisor, including any periods of outperformance or underperformance relative to a benchmark index and peer group. The board concluded that the performance was such that each advisory arrangement should continue. Information about the fund’s most recent performance can be found in the Performance Summary section of this report.
Cost
The board concluded that the fund��s expense ratio was well below the average expense ratio charged by funds in its peer group and that the fund’s advisory fee rate was also well below the peer-group average. Information about the fund’s expenses appears in the About Your Fund’s Expenses section of this report as well as in the Financial Statements section, which also includes information about the fund’s advisory fee rate.
34
The board did not consider profitability of Century Capital, Chartwell, Granahan, Kalmar, SIMG, or Wellington Management in determining whether to approve the advisory fees, because the firms are independent of Vanguard and the advisory fees are the result of arm’s-length negotiations. The board does not conduct a profitability analysis of Vanguard because of Vanguard’s unique “at-cost” structure. Unlike most other mutual fund management companies, Vanguard is owned by the funds it oversees, and produces “profits” only in the form of reduced expenses for fund shareholders.
The benefit of economies of scale
The board concluded that the fund’s shareholders benefit from economies of scale because of breakpoints in the advisory fee schedules for Century Capital, Chartwell, Granahan, Kalmar, SIMG, and Wellington Management. The breakpoints reduce the effective rate of the fees as the fund’s assets managed by each advisor increase.
The board also concluded that the fund’s at-cost arrangement with Vanguard ensures that the fund will realize economies of scale as it grows, with the cost to shareholders declining as the fund’s assets managed by Vanguard increase.
The board will consider whether to renew the advisory arrangements again after a one-year period.
35
Glossary
30-Day SEC Yield. A fund’s 30-day SEC yield is derived using a formula specified by the U.S. Securities and Exchange Commission. Under the formula, data related to the fund’s security holdings in the previous 30 days are used to calculate the fund’s hypothetical net income for that period, which is then annualized and divided by the fund’s estimated average net assets over the calculation period. For the purposes of this calculation, a security’s income is based on its current market yield to maturity (for bonds), its actual income (for asset-backed securities), or its projected dividend yield (for stocks). Because the SEC yield represents hypothetical annualized income, it will differ—at times significantly—from the fund’s actual experience. As a result, the fund’s income distributions may be higher or lower than implied by the SEC yield.
Beta. A measure of the magnitude of a fund’s past share-price fluctuations in relation to the ups and downs of a given market index. The index is assigned a beta of 1.00. Compared with a given index, a fund with a beta of 1.20 typically would have seen its share price rise or fall by 12% when the index rose or fell by 10%. For this report, beta is based on returns over the past 36 months for both the fund and the index. Note that a fund’s beta should be reviewed in conjunction with its R-squared (see definition). The lower the R-squared, the less correlation there is between the fund and the index, and the less reliable beta is as an indicator of volatility.
Dividend Yield. Dividend income earned by stocks, expressed as a percentage of the aggregate market value (or of net asset value, for a fund). The yield is determined by dividing the amount of the annual dividends by the aggregate value (or net asset value) at the end of the period. For a fund, the dividend yield is based solely on stock holdings and does not include any income produced by other investments.
Earnings Growth Rate. The average annual rate of growth in earnings over the past five years for the stocks now in a fund.
Equity Exposure. A measure that reflects a fund’s investments in stocks and stock futures. Any holdings in short-term reserves are excluded.
Expense Ratio. A fund’s total annual operating expenses expressed as a percentage of the fund’s average net assets. The expense ratio includes management and administrative expenses, but does not include the transaction costs of buying and selling portfolio securities.
Foreign Holdings. The percentage of a fund represented by securities or depositary receipts of companies based outside the United States.
Inception Date. The date on which the assets of a fund (or one of its share classes) are first invested in accordance with the fund’s investment objective. For funds with a subscription period, the inception date is the day after that period ends. Investment performance is measured from the inception date.
Median Market Cap. An indicator of the size of companies in which a fund invests; the midpoint of market capitalization (market price x shares outstanding) of a fund’s stocks, weighted by the proportion of the fund’s assets invested in each stock. Stocks representing half of the fund’s assets have market capitalizations above the median, and the rest are below it.
Price/Book Ratio. The share price of a stock divided by its net worth, or book value, per share. For a fund, the weighted average price/book ratio of the stocks it holds.
36
Price/Earnings Ratio. The ratio of a stock’s current price to its per-share earnings over the past year. For a fund, the weighted average P/E of the stocks it holds. P/E is an indicator of market expectations about corporate prospects; the higher the P/E, the greater the expectations for a company’s future growth.
R-Squared. A measure of how much of a fund’s past returns can be explained by the returns from the market in general, as measured by a given index. If a fund’s total returns were precisely synchronized with an index’s returns, its R-squared would be 1.00. If the fund’s returns bore no relationship to the index’s returns, its R-squared would be 0. For this report, R-squared is based on returns over the past 36 months for both the fund and the index.
Return on Equity. The annual average rate of return generated by a company during the past five years for each dollar of shareholder’s equity (net income divided by shareholder’s equity). For a fund, the weighted average return on equity for the companies whose stocks it holds.
Short-Term Reserves. The percentage of a fund invested in highly liquid, short-term securities that can be readily converted to cash.
Turnover Rate. An indication of the fund’s trading activity. Funds with high turnover rates incur higher transaction costs and may be more likely to distribute capital gains (which may be taxable to investors). The turnover rate excludes in-kind transactions, which have minimal impact on costs.
37
This page intentionally left blank.
This page intentionally left blank.
The People Who Govern Your Fund
The trustees of your mutual fund are there to see that the fund is operated and managed in your best interests since, as a shareholder, you are a part owner of the fund. Your fund’s trustees also serve on the board of directors of The Vanguard Group, Inc., which is owned by the Vanguard funds and provides services to them on an at-cost basis.
A majority of Vanguard’s board members are independent, meaning that they have no affiliation with Vanguard or the funds they oversee, apart from the sizable personal investments they have made as private individuals. The independent board members have distinguished backgrounds in business, academia, and public service. Each of the trustees and executive officers oversees 178 Vanguard funds.
The following table provides information for each trustee and executive officer of the fund. More information about the trustees is in the Statement of Additional Information, which can be obtained, without charge, by contacting Vanguard at 800-662-7447, or online at vanguard.com.
| InterestedTrustee1 | and Delphi Automotive LLP (automotive components); |
| Senior Advisor at New Mountain Capital. | |
| F. William McNabb III | |
| Born 1957. Trustee Since July 2009. Chairman of the | Amy Gutmann |
| Board. Principal Occupation(s) During the Past Five | Born 1949. Trustee Since June 2006. Principal |
| Years: Chairman of the Board of The Vanguard Group, | Occupation(s) During the Past Five Years: President of |
| Inc., and of each of the investment companies served | the University of Pennsylvania; Christopher H. Browne |
| by The Vanguard Group, since January 2010; Director | Distinguished Professor of Political Science, School of |
| of The Vanguard Group since 2008; Chief Executive | Arts and Sciences, and Professor of Communication, |
| Officer and President of The Vanguard Group, and of | Annenberg School for Communication, with secondary |
| each of the investment companies served by The | faculty appointments in the Department of Philosophy, |
| Vanguard Group, since 2008; Director of Vanguard | School of Arts and Sciences, and at the Graduate |
| Marketing Corporation; Managing Director of The | School of Education, University of Pennsylvania; |
| Vanguard Group (1995–2008). | Trustee of the National Constitution Center; Chair |
| of the Presidential Commission for the Study of | |
| Bioethical Issues. | |
| IndependentTrustees | |
| Emerson U. Fullwood | JoAnn Heffernan Heisen |
| Born 1948. Trustee Since January 2008. Principal | Born 1950. Trustee Since July 1998. Principal |
| Occupation(s) During the Past Five Years: Executive | Occupation(s) During the Past Five Years: Corporate |
| Chief Staff and Marketing Officer for North America | Vice President and Chief Global Diversity Officer |
| and Corporate Vice President (retired 2008) of Xerox | (retired 2008) and Member of the Executive |
| Corporation (document management products and | Committee (1997–2008) of Johnson & Johnson |
| services); Executive in Residence and 2009–2010 | (pharmaceuticals/medical devices/consumer |
| Distinguished Minett Professor at the Rochester | products); Director of Skytop Lodge Corporation |
| Institute of Technology; Director of SPX Corporation | (hotels), the University Medical Center at Princeton, |
| (multi-industry manufacturing), the United Way of | the Robert Wood Johnson Foundation, and the Center |
| Rochester, Amerigroup Corporation (managed health | for Talent Innovation; Member of the Advisory Board |
| care), the University of Rochester Medical Center, | of the Maxwell School of Citizenship and Public Affairs |
| Monroe Community College Foundation, and North | at Syracuse University. |
| Carolina A&T University. | |
| F. Joseph Loughrey | |
| Rajiv L. Gupta | Born 1949. Trustee Since October 2009. Principal |
| Born 1945. Trustee Since December 2001.2 | Occupation(s) During the Past Five Years: President |
| Principal Occupation(s) During the Past Five Years: | and Chief Operating Officer (retired 2009) of Cummins |
| Chairman and Chief Executive Officer (retired 2009) | Inc. (industrial machinery); Chairman of the Board |
| and President (2006–2008) of Rohm and Haas Co. | of Hillenbrand, Inc. (specialized consumer services), |
| (chemicals); Director of Tyco International, Ltd. | and of Oxfam America; Director of SKF AB (industrial |
| (diversified manufacturing and services), Hewlett- | machinery), Hyster-Yale Materials Handling, Inc. |
| Packard Co. (electronic computer manufacturing), | (forklift trucks), the Lumina Foundation for Education, |
| and the V Foundation for Cancer Research; Member | Executive Officers | |
| of the Advisory Council for the College of Arts and | ||
| Letters and of the Advisory Board to the Kellogg | Glenn Booraem | |
| Institute for International Studies, both at the | Born 1967. Controller Since July 2010. Principal | |
| University of Notre Dame. | Occupation(s) During the Past Five Years: Principal | |
| of The Vanguard Group, Inc.; Controller of each of | ||
| Mark Loughridge | the investment companies served by The Vanguard | |
| Born 1953. Trustee Since March 2012. Principal | Group; Assistant Controller of each of the investment | |
| Occupation(s) During the Past Five Years: Senior Vice | companies served by The Vanguard Group (2001–2010). | |
| President and Chief Financial Officer (retired 2013) | ||
| at IBM (information technology services); Fiduciary | Thomas J. Higgins | |
| Member of IBM’s Retirement Plan Committee (2004– | Born 1957. Chief Financial Officer Since September | |
| 2013); Member of the Council on Chicago Booth. | 2008. Principal Occupation(s) During the Past Five | |
| Years: Principal of The Vanguard Group, Inc.; Chief | ||
| Scott C. Malpass | Financial Officer of each of the investment companies | |
| Born 1962. Trustee Since March 2012. Principal | served by The Vanguard Group; Treasurer of each of | |
| Occupation(s) During the Past Five Years: Chief | the investment companies served by The Vanguard | |
| Investment Officer and Vice President at the University | Group (1998–2008). | |
| of Notre Dame; Assistant Professor of Finance at the | ||
| Mendoza College of Business at Notre Dame; Member | Kathryn J. Hyatt | |
| of the Notre Dame 403(b) Investment Committee; | Born 1955. Treasurer Since November 2008. Principal | |
| Board Member of TIFF Advisory Services, Inc. | Occupation(s) During the Past Five Years: Principal of | |
| (investment advisor); Member of the Investment | The Vanguard Group, Inc.; Treasurer of each of the | |
| Advisory Committees of the Financial Industry | investment companies served by The Vanguard | |
| Regulatory Authority (FINRA) and of Major League | Group; Assistant Treasurer of each of the investment | |
| Baseball. | companies served by The Vanguard Group (1988–2008). | |
| André F. Perold | Heidi Stam | |
| Born 1952. Trustee Since December 2004. Principal | Born 1956. Secretary Since July 2005. Principal | |
| Occupation(s) During the Past Five Years: George | Occupation(s) During the Past Five Years: Managing | |
| Gund Professor of Finance and Banking, Emeritus | Director of The Vanguard Group, Inc.; General Counsel | |
| at the Harvard Business School (retired 2011); | of The Vanguard Group; Secretary of The Vanguard | |
| Chief Investment Officer and Managing Partner of | Group and of each of the investment companies | |
| HighVista Strategies LLC (private investment firm); | served by The Vanguard Group; Director and Senior | |
| Director of Rand Merchant Bank; Overseer of the | Vice President of Vanguard Marketing Corporation. | |
| Museum of Fine Arts Boston. | ||
| Vanguard Senior ManagementTeam | ||
| Alfred M. Rankin, Jr. | ||
| Born 1941. Trustee Since January 1993. Principal | Mortimer J. Buckley | Chris D. McIsaac |
| Occupation(s) During the Past Five Years: Chairman, | Kathleen C. Gubanich | Michael S. Miller |
| President, and Chief Executive Officer of NACCO | Paul A. Heller | James M. Norris |
| Industries, Inc. (housewares/lignite), and of Hyster- | Martha G. King | Glenn W. Reed |
| Yale Materials Handling, Inc. (forklift trucks); Chairman | John T. Marcante | |
| of the Board of University Hospitals of Cleveland. | ||
| Peter F. Volanakis | Chairman Emeritus and Senior Advisor | |
| Born 1955. Trustee Since July 2009. Principal | ||
| Occupation(s) During the Past Five Years: President | John J. Brennan | |
| and Chief Operating Officer (retired 2010) of Corning | Chairman, 1996–2009 | |
| Incorporated (communications equipment); Trustee of | Chief Executive Officer and President, 1996–2008 | |
| Colby-Sawyer College; Member of the Advisory Board | ||
| of the Norris Cotton Cancer Center and of the Advisory | ||
| Board of the Parthenon Group (strategy consulting). | Founder | |
| John C. Bogle | ||
| Chairman and Chief Executive Officer, 1974–1996 | ||
1 Mr. McNabb is considered an “interested person,” as defined in the Investment Company Act of 1940, because he is an officer of the
Vanguard funds.
2 December 2002 for Vanguard Equity Income Fund, the Vanguard Municipal Bond Funds, and the Vanguard State Tax-Exempt Funds.
 | ||
| P.O. Box 2600 | ||
| Valley Forge, PA 19482-2600 | ||
| Connect with Vanguard® > vanguard.com | ||
| Fund Information > 800-662-7447 | CFA® is a trademark owned by CFA Institute. | |
| Direct Investor Account Services > 800-662-2739 | ||
| Institutional Investor Services > 800-523-1036 | ||
| Text Telephone for People | ||
| With Hearing Impairment > 800-749-7273 | ||
| This material may be used in conjunction | ||
| with the offering of shares of any Vanguard | ||
| fund only if preceded or accompanied by | ||
| the fund’s current prospectus. | ||
| All comparative mutual fund data are from Lipper, a | ||
| Thomson Reuters Company, or Morningstar, Inc., unless | ||
| otherwise noted. | ||
| You can obtain a free copy of Vanguard’s proxy voting | ||
| guidelines by visiting vanguard.com/proxyreporting or by | ||
| calling Vanguard at 800-662-2739. The guidelines are | ||
| also available from the SEC’s website, sec.gov. In | ||
| addition, you may obtain a free report on how your fund | ||
| voted the proxies for securities it owned during the 12 | ||
| months ended June 30. To get the report, visit either | ||
| vanguard.com/proxyreporting or sec.gov. | ||
| You can review and copy information about your fund at | ||
| the SEC’s Public Reference Room in Washington, D.C. To | ||
| find out more about this public service, call the SEC at | ||
| 202-551-8090. Information about your fund is also | ||
| available on the SEC’s website, and you can receive | ||
| copies of this information, for a fee, by sending a | ||
| request in either of two ways: via e-mail addressed to | ||
| publicinfo@sec.gov or via regular mail addressed to the | ||
| Public Reference Section, Securities and Exchange | ||
| Commission, Washington, DC 20549-1520. | ||
| © 2014 The Vanguard Group, Inc. | ||
| All rights reserved. | ||
| Vanguard Marketing Corporation, Distributor. | ||
| Q242 062014 | ||
Item 2: Code of Ethics.
Not Applicable.
Item 3:
Not Applicable.
Item 4: Principal Accountant Fees and Services.
Not. Applicable.
Item 5: Audit Committee of Listed Registrants.
Not Applicable.
Item 6: Investments.
Vanguard® Explorer™ Fund
Schedule of Investments
April 30, 2014
| Market | |||
| Value | |||
| Shares | ($000) | ||
| Common Stocks (98.0%)1 | |||
| Consumer Discretionary (17.5%) | |||
| * | Urban Outfitters Inc. | 2,404,460 | 85,731 |
| * | Life Time Fitness Inc. | 1,370,335 | 65,776 |
| * | LKQ Corp. | 2,238,795 | 65,194 |
| * | Crocs Inc. | 3,876,300 | 58,648 |
| * | Imax Corp. | 2,243,472 | 57,523 |
| * | CarMax Inc. | 1,261,795 | 55,241 |
| Churchill Downs Inc. | 589,054 | 51,737 | |
| * | Jarden Corp. | 800,921 | 45,773 |
| DSW Inc. Class A | 1,315,036 | 43,909 | |
| Hanesbrands Inc. | 519,263 | 42,626 | |
| * | Tenneco Inc. | 700,777 | 41,956 |
| * | Ulta Salon Cosmetics & Fragrance Inc. | 461,980 | 40,520 |
| Dick's Sporting Goods Inc. | 740,570 | 38,998 | |
| * | Five Below Inc. | 959,800 | 38,690 |
| * | Buffalo Wild Wings Inc. | 262,479 | 38,353 |
| Tractor Supply Co. | 569,455 | 38,290 | |
| Service Corp. International | 2,038,105 | 38,255 | |
| New York Times Co. Class A | 2,372,400 | 38,148 | |
| Texas Roadhouse Inc. Class A | 1,508,690 | 37,325 | |
| Cheesecake Factory Inc. | 827,898 | 37,164 | |
| Dana Holding Corp. | 1,752,100 | 37,092 | |
| GameStop Corp. Class A | 911,491 | 36,168 | |
| HSN Inc. | 617,600 | 35,846 | |
| * | DreamWorks Animation SKG Inc. Class A | 1,448,640 | 34,811 |
| * | HomeAway Inc. | 1,027,391 | 33,514 |
| * | Live Nation Entertainment Inc. | 1,563,195 | 32,640 |
| * | Standard Pacific Corp. | 4,079,700 | 32,597 |
| Brunswick Corp. | 810,860 | 32,589 | |
| Lennar Corp. Class A | 837,615 | 32,324 | |
| Signet Jewelers Ltd. | 312,676 | 31,680 | |
| * | Steven Madden Ltd. | 866,842 | 30,868 |
| * | Under Armour Inc. Class A | 625,800 | 30,595 |
| * | Tumi Holdings Inc. | 1,467,620 | 29,969 |
| Wolverine World Wide Inc. | 1,065,890 | 29,952 | |
| Six Flags Entertainment Corp. | 746,132 | 29,950 | |
| * | Cabela's Inc. | 449,200 | 29,472 |
| * | Dorman Products Inc. | 507,695 | 29,218 |
| Ryland Group Inc. | 721,484 | 27,698 | |
| Pier 1 Imports Inc. | 1,477,556 | 26,980 | |
| * | Denny's Corp. | 3,934,881 | 26,521 |
| *,^ | Outerwall Inc. | 350,921 | 24,336 |
| * | Del Frisco's Restaurant Group Inc. | 857,088 | 22,293 |
| * | Gentherm Inc. | 607,487 | 22,082 |
| * | Krispy Kreme Doughnuts Inc. | 1,249,235 | 21,912 |
| * | Deckers Outdoor Corp. | 267,500 | 21,119 |
| Movado Group Inc. | 535,826 | 21,047 | |
| *,^ | Conn's Inc. | 456,470 | 20,190 |
| * | Vitamin Shoppe Inc. | 420,150 | 20,117 |
| Brinker International Inc. | 395,299 | 19,425 | |
| * | TRW Automotive Holdings Corp. | 239,765 | 19,265 |
| * | Cumulus Media Inc. Class A | 2,932,800 | 18,799 |
| * | MGM Resorts International | 731,830 | 18,464 |
| * | iRobot Corp. | 503,141 | 16,855 |
| * | Ascena Retail Group Inc. | 969,100 | 16,669 |
| * | Grand Canyon Education Inc. | 364,605 | 15,722 |
| * | Francesca's Holdings Corp. | 908,200 | 14,858 |
| Monro Muffler Brake Inc. | 244,295 | 13,778 | |
| * | Bally Technologies Inc. | 196,274 | 12,779 |
| * | Marriott Vacations Worldwide Corp. | 228,586 | 12,453 |
| * | Bloomin' Brands Inc. | 573,235 | 12,221 |
| Vail Resorts Inc. | 170,192 | 11,782 | |
| 1 | |||
Vanguard® Explorer Fund
Schedule of Investments
April 30, 2014
| Market | |||
| Value | |||
| Shares | ($000) | ||
| Abercrombie & Fitch Co. | 305,000 | 11,212 | |
| * | BJ's Restaurants Inc. | 338,610 | 9,667 |
| Oxford Industries Inc. | 141,830 | 9,362 | |
| Lions Gate Entertainment Corp. | 352,187 | 9,344 | |
| * | Discovery Communications Inc. | 133,100 | 9,334 |
| * | Chuy's Holdings Inc. | 253,679 | 9,120 |
| * | Bravo Brio Restaurant Group Inc. | 601,000 | 8,997 |
| Ross Stores Inc. | 128,700 | 8,762 | |
| Cinemark Holdings Inc. | 295,100 | 8,741 | |
| * | Genesco Inc. | 108,090 | 8,255 |
| National CineMedia Inc. | 478,400 | 7,267 | |
| Callaway Golf Co. | 756,592 | 6,590 | |
| * | Tesla Motors Inc. | 31,539 | 6,557 |
| * | Hibbett Sports Inc. | 105,799 | 5,697 |
| *,^ | SodaStream International Ltd. | 127,000 | 5,401 |
| Shoe Carnival Inc. | 209,500 | 4,785 | |
| * | Express Inc. | 321,350 | 4,682 |
| Goodyear Tire & Rubber Co. | 171,600 | 4,324 | |
| Domino's Pizza Inc. | 51,942 | 3,864 | |
| * | Starz | 114,400 | 3,692 |
| * | Liberty Ventures Class A | 62,400 | 3,622 |
| * | Shutterfly Inc. | 88,200 | 3,610 |
| * | NVR Inc. | 3,300 | 3,554 |
| Cablevision Systems Corp. Class A | 204,000 | 3,407 | |
| * | Smith & Wesson Holding Corp. | 203,800 | 3,128 |
| Cracker Barrel Old Country Store Inc. | 29,200 | 2,766 | |
| Nutrisystem Inc. | 182,000 | 2,730 | |
| * | Tower International Inc. | 97,600 | 2,714 |
| Brown Shoe Co. Inc. | 112,000 | 2,642 | |
| Sturm Ruger & Co. Inc. | 40,550 | 2,609 | |
| * | Red Robin Gourmet Burgers Inc. | 36,600 | 2,488 |
| GNC Holdings Inc. Class A | 54,600 | 2,457 | |
| La-Z-Boy Inc. | 97,000 | 2,350 | |
| Buckle Inc. | 49,400 | 2,321 | |
| * | Asbury Automotive Group Inc. | 36,100 | 2,229 |
| * | Jack in the Box Inc. | 40,800 | 2,185 |
| * | Orbitz Worldwide Inc. | 254,100 | 1,868 |
| PetSmart Inc. | 27,545 | 1,864 | |
| Tupperware Brands Corp. | 21,000 | 1,783 | |
| * | Multimedia Games Holding Co. Inc. | 48,600 | 1,419 |
| Williams-Sonoma Inc. | 22,100 | 1,388 | |
| Dillard's Inc. Class A | 12,000 | 1,175 | |
| Ruth's Hospitality Group Inc. | 80,900 | 1,019 | |
| * | Kirkland's Inc. | 54,100 | 926 |
| * | Visteon Corp. | 10,600 | 920 |
| * | LifeLock Inc. | 55,500 | 871 |
| Foot Locker Inc. | 13,500 | 628 | |
| * | Barnes & Noble Inc. | 38,200 | 627 |
| * | AMC Entertainment Holdings Inc. | 25,900 | 599 |
| * | Strayer Education Inc. | 11,800 | 503 |
| Polaris Industries Inc. | 3,500 | 470 | |
| * | ANN Inc. | 3,271 | 128 |
| ARAMARK Holdings Corp. | 3,800 | 107 | |
| 2,173,267 | |||
| Consumer Staples (3.1%) | |||
| * | United Natural Foods Inc. | 775,944 | 53,563 |
| ^ | Herbalife Ltd. | 802,688 | 48,145 |
| Hillshire Brands Co. | 1,278,100 | 45,564 | |
| Sanderson Farms Inc. | 498,800 | 41,036 | |
| PriceSmart Inc. | 361,053 | 34,676 | |
| Ingredion Inc. | 456,700 | 32,175 | |
| Glanbia plc | 1,347,697 | 20,128 | |
| * | Susser Holdings Corp. | 256,159 | 19,822 |
| Casey's General Stores Inc. | 262,900 | 18,051 | |
| 2 | |||
Vanguard® Explorer Fund
Schedule of Investments
April 30, 2014
| Market | |||
| Value | |||
| Shares | ($000) | ||
| * | Natural Grocers by Vitamin Cottage Inc. | 367,400 | 13,079 |
| * | TreeHouse Foods Inc. | 116,700 | 8,734 |
| Whole Foods Market Inc. | 149,900 | 7,450 | |
| Inter Parfums Inc. | 186,875 | 6,838 | |
| * | Fresh Market Inc. | 178,010 | 6,604 |
| * | Boulder Brands Inc. | 343,800 | 5,074 |
| * | Annie's Inc. | 138,400 | 4,499 |
| * | Rite Aid Corp. | 534,200 | 3,900 |
| Nu Skin Enterprises Inc. Class A | 41,927 | 3,648 | |
| * | Pilgrim's Pride Corp. | 146,586 | 3,204 |
| Keurig Green Mountain Inc. | 23,200 | 2,173 | |
| * | Omega Protein Corp. | 49,800 | 566 |
| * | SUPERVALU Inc. | 69,000 | 482 |
| 379,411 | |||
| Energy (5.9%) | |||
| Western Refining Inc. | 1,383,658 | 60,189 | |
| Core Laboratories NV | 268,745 | 50,438 | |
| Trican Well Service Ltd. | 3,388,000 | 48,530 | |
| Energen Corp. | 560,700 | 43,684 | |
| * | Dresser-Rand Group Inc. | 681,900 | 41,214 |
| Cabot Oil & Gas Corp. | 959,435 | 37,687 | |
| Superior Energy Services Inc. | 1,106,965 | 36,441 | |
| * | Gulfport Energy Corp. | 458,930 | 33,809 |
| * | Southwestern Energy Co. | 701,615 | 33,593 |
| Alon USA Energy Inc. | 1,858,700 | 30,278 | |
| * | Key Energy Services Inc. | 2,784,357 | 27,955 |
| * | Atwood Oceanics Inc. | 533,525 | 26,442 |
| * | Bonanza Creek Energy Inc. | 491,560 | 23,900 |
| * | Rex Energy Corp. | 1,055,379 | 22,226 |
| * | RSP Permian Inc. | 766,300 | 21,725 |
| * | Carrizo Oil & Gas Inc. | 385,100 | 21,188 |
| * | Kodiak Oil & Gas Corp. | 1,603,973 | 20,386 |
| * | Basic Energy Services Inc. | 739,779 | 19,545 |
| Patterson-UTI Energy Inc. | 597,100 | 19,424 | |
| * | TETRA Technologies Inc. | 1,514,916 | 18,936 |
| * | Penn Virginia Corp. | 923,378 | 15,365 |
| Oceaneering International Inc. | 150,800 | 11,051 | |
| *,^ | Halcon Resources Corp. | 1,963,908 | 10,841 |
| RPC Inc. | 449,250 | 9,987 | |
| * | Dril-Quip Inc. | 85,200 | 9,638 |
| * | Athlon Energy Inc. | 170,700 | 6,898 |
| Range Resources Corp. | 74,300 | 6,720 | |
| * | Oasis Petroleum Inc. | 125,500 | 5,837 |
| * | Forum Energy Technologies Inc. | 193,600 | 5,781 |
| SM Energy Co. | 54,700 | 4,055 | |
| * | REX American Resources Corp. | 42,600 | 2,784 |
| * | SEACOR Holdings Inc. | 29,700 | 2,477 |
| * | Alpha Natural Resources Inc. | 526,200 | 2,263 |
| * | Matrix Service Co. | 70,400 | 2,180 |
| Frank's International NV | 59,600 | 1,635 | |
| * | Abraxas Petroleum Corp. | 289,200 | 1,579 |
| * | Cheniere Energy Inc. | 18,400 | 1,039 |
| * | Quicksilver Resources Inc. | 146,000 | 476 |
| 738,196 | |||
| Financials (7.8%) | |||
| * | Affiliated Managers Group Inc. | 349,006 | 69,173 |
| NASDAQ OMX Group Inc. | 1,841,677 | 67,958 | |
| *,2 | eHealth Inc. | 1,429,565 | 59,884 |
| PacWest Bancorp | 1,243,573 | 48,959 | |
| Protective Life Corp. | 878,647 | 44,943 | |
| Redwood Trust Inc. | 1,981,600 | 43,199 | |
| Zions Bancorporation | 1,474,890 | 42,654 | |
| Pebblebrook Hotel Trust | 1,181,100 | 40,677 | |
| International Bancshares Corp. | 1,727,197 | 39,656 | |
| 3 | |||
Vanguard® Explorer Fund
Schedule of Investments
April 30, 2014
| Market | ||
| Value | ||
| Shares | ($000) | |
| Synovus Financial Corp. | 10,311,440 | 33,100 |
| Och-Ziff Capital Management Group LLC Class A | 2,669,149 | 32,003 |
| Solar Capital Ltd. | 1,435,400 | 31,435 |
| * Encore Capital Group Inc. | 724,218 | 31,301 |
| Radian Group Inc. | 2,092,966 | 29,260 |
| Primerica Inc. | 633,800 | 29,085 |
| HFF Inc. Class A | 746,927 | 25,396 |
| * WisdomTree Investments Inc. | 2,228,084 | 25,155 |
| Douglas Emmett Inc. | 848,444 | 23,417 |
| Financial Engines Inc. | 518,300 | 22,935 |
| MFA Financial Inc. | 2,584,725 | 20,497 |
| First Industrial Realty Trust Inc. | 1,107,355 | 20,342 |
| ^ Cohen & Steers Inc. | 453,124 | 18,356 |
| * Signature Bank | 154,385 | 18,344 |
| STAG Industrial Inc. | 720,900 | 16,963 |
| Evercore Partners Inc. Class A | 310,130 | 16,570 |
| * Portfolio Recovery Associates Inc. | 245,500 | 14,030 |
| PrivateBancorp Inc. | 500,097 | 13,788 |
| Lexington Realty Trust | 861,030 | 9,265 |
| American Equity Investment Life Holding Co. | 363,239 | 8,471 |
| * SVB Financial Group | 76,400 | 8,151 |
| Cardinal Financial Corp. | 466,644 | 7,840 |
| IntercontinentalExchange Group Inc. | 32,300 | 6,603 |
| * Hilltop Holdings Inc. | 269,800 | 6,027 |
| Waddell & Reed Financial Inc. Class A | 62,100 | 4,189 |
| Universal Insurance Holdings Inc. | 200,300 | 2,930 |
| * Credit Acceptance Corp. | 21,535 | 2,832 |
| * Cowen Group Inc. Class A | 589,050 | 2,421 |
| Omega Healthcare Investors Inc. | 69,200 | 2,407 |
| Nelnet Inc. Class A | 49,676 | 2,099 |
| * World Acceptance Corp. | 28,076 | 2,038 |
| Apartment Investment & Management Co. Class A | 60,300 | 1,859 |
| Corrections Corp. of America | 56,600 | 1,856 |
| Axis Capital Holdings Ltd. | 39,000 | 1,784 |
| Lazard Ltd. Class A | 37,600 | 1,769 |
| Regency Centers Corp. | 33,100 | 1,735 |
| Ryman Hospitality Properties Inc. | 36,900 | 1,681 |
| * Realogy Holdings Corp. | 37,600 | 1,581 |
| Extra Space Storage Inc. | 30,000 | 1,570 |
| * Greenlight Capital Re Ltd. Class A | 39,300 | 1,251 |
| * Strategic Hotels & Resorts Inc. | 108,500 | 1,171 |
| Inland Real Estate Corp. | 107,800 | 1,127 |
| Montpelier Re Holdings Ltd. | 32,300 | 988 |
| * MGIC Investment Corp. | 100,800 | 867 |
| Fidelity & Guaranty Life | 36,100 | 774 |
| Sovran Self Storage Inc. | 9,600 | 729 |
| Hanover Insurance Group Inc. | 10,100 | 590 |
| GAMCO Investors Inc. | 6,800 | 516 |
| Geo Group Inc. | 14,000 | 469 |
| Rayonier Inc. | 8,127 | 367 |
| 967,037 | ||
| Health Care (14.7%) | ||
| West Pharmaceutical Services Inc. | 2,465,740 | 106,964 |
| * Salix Pharmaceuticals Ltd. | 669,512 | 73,646 |
| Cooper Cos. Inc. | 535,155 | 70,592 |
| * Alkermes plc | 1,441,835 | 66,699 |
| Kindred Healthcare Inc. | 2,588,939 | 64,982 |
| * Globus Medical Inc. | 2,660,683 | 64,974 |
| * Bruker Corp. | 2,907,890 | 60,077 |
| * Hospira Inc. | 1,112,000 | 50,930 |
| * ICON plc | 1,304,728 | 50,584 |
| * LifePoint Hospitals Inc. | 894,000 | 49,992 |
| Universal Health Services Inc. Class B | 559,950 | 45,798 |
| * Cyberonics Inc. | 749,373 | 44,333 |
| 4 | ||
Vanguard® Explorer Fund
Schedule of Investments
April 30, 2014
| Market | |||
| Value | |||
| Shares | ($000) | ||
| * | Covance Inc. | 484,520 | 42,773 |
| * | Akorn Inc. | 1,597,337 | 40,285 |
| * | WellCare Health Plans Inc. | 592,900 | 40,003 |
| ^ | ResMed Inc. | 776,209 | 38,694 |
| * | Henry Schein Inc. | 338,350 | 38,650 |
| * | Insulet Corp. | 936,715 | 35,249 |
| DENTSPLY International Inc. | 743,250 | 33,171 | |
| * | Nektar Therapeutics | 2,478,300 | 29,170 |
| * | Actavis plc | 135,995 | 27,788 |
| * | Mettler-Toledo International Inc. | 117,459 | 27,382 |
| * | Bio-Rad Laboratories Inc. Class A | 209,240 | 25,780 |
| * | Brookdale Senior Living Inc. Class A | 769,038 | 24,486 |
| * | ABIOMED Inc. | 1,022,000 | 24,211 |
| * | Capital Senior Living Corp. | 958,250 | 23,698 |
| * | Molina Healthcare Inc. | 604,028 | 22,591 |
| * | Wright Medical Group Inc. | 812,914 | 22,233 |
| Questcor Pharmaceuticals Inc. | 264,524 | 21,739 | |
| * | Tornier NV | 1,183,087 | 20,077 |
| * | Alexion Pharmaceuticals Inc. | 122,286 | 19,346 |
| * | Portola Pharmaceuticals Inc. | 779,548 | 18,288 |
| * | NPS Pharmaceuticals Inc. | 680,736 | 18,121 |
| * | QIAGEN NV | 827,000 | 18,111 |
| * | WuXi PharmaTech Cayman Inc. ADR | 525,094 | 17,853 |
| * | Allscripts Healthcare Solutions Inc. | 1,158,300 | 17,629 |
| * | Air Methods Corp. | 302,129 | 16,819 |
| * | CareFusion Corp. | 422,408 | 16,499 |
| * | Luminex Corp. | 811,260 | 15,584 |
| * | Sarepta Therapeutics Inc. | 403,660 | 14,988 |
| * | TESARO Inc. | 600,000 | 14,976 |
| *,^ | Exact Sciences Corp. | 1,247,000 | 14,964 |
| * | Hyperion Therapeutics Inc. | 600,440 | 14,795 |
| * | Auxilium Pharmaceuticals Inc. | 625,000 | 14,069 |
| * | Illumina Inc. | 100,000 | 13,585 |
| * | Lannett Co. Inc. | 392,149 | 13,541 |
| * | Vertex Pharmaceuticals Inc. | 194,100 | 13,141 |
| *,^ | Horizon Pharma Inc. | 808,800 | 11,469 |
| * | Acadia Healthcare Co. Inc. | 271,687 | 11,416 |
| Trinity Biotech plc ADR | 454,013 | 11,128 | |
| PerkinElmer Inc. | 263,238 | 11,048 | |
| * | Neogen Corp. | 249,950 | 10,442 |
| *,^ | Exelixis Inc. | 2,801,947 | 9,919 |
| * | PTC Therapeutics Inc. | 484,000 | 9,457 |
| * | IDEXX Laboratories Inc. | 70,300 | 8,889 |
| * | athenahealth Inc. | 71,700 | 8,865 |
| * | Cerner Corp. | 170,500 | 8,747 |
| * | Thoratec Corp. | 248,875 | 8,158 |
| * | Medidata Solutions Inc. | 216,900 | 7,876 |
| * | Cepheid Inc. | 176,800 | 7,687 |
| * | PharMerica Corp. | 271,217 | 7,374 |
| * | TherapeuticsMD Inc. | 1,594,216 | 6,696 |
| * | Jazz Pharmaceuticals plc | 47,760 | 6,443 |
| * | NuVasive Inc. | 190,900 | 6,435 |
| * | Depomed Inc. | 451,433 | 6,325 |
| * | Aegerion Pharmaceuticals Inc. | 142,710 | 6,316 |
| * | Catamaran Corp. | 160,200 | 6,048 |
| * | IPC The Hospitalist Co. Inc. | 149,070 | 6,037 |
| * | Hologic Inc. | 270,400 | 5,674 |
| * | HMS Holdings Corp. | 325,255 | 5,259 |
| * | Incyte Corp. Ltd. | 97,265 | 4,723 |
| * | Aratana Therapeutics Inc. | 333,462 | 4,595 |
| * | Ligand Pharmaceuticals Inc. | 71,300 | 4,504 |
| * | Endo Health Solutions Inc. | 69,900 | 4,400 |
| * | MacroGenics Inc. | 209,770 | 4,183 |
| * | Centene Corp. | 52,900 | 3,513 |
| 5 | |||
Vanguard® Explorer Fund
Schedule of Investments
April 30, 2014
| Market | |||
| Value | |||
| Shares | ($000) | ||
| * | United Therapeutics Corp. | 33,100 | 3,310 |
| * | Align Technology Inc. | 64,800 | 3,265 |
| * | Seattle Genetics Inc. | 82,500 | 3,175 |
| * | PAREXEL International Corp. | 66,400 | 3,011 |
| * | Charles River Laboratories International Inc. | 54,000 | 2,901 |
| Chemed Corp. | 33,106 | 2,757 | |
| * | Quintiles Transnational Holdings Inc. | 57,100 | 2,691 |
| * | Zeltiq Aesthetics Inc. | 145,090 | 2,654 |
| PDL BioPharma Inc. | 309,500 | 2,628 | |
| * | MedAssets Inc. | 102,900 | 2,349 |
| * | Addus HomeCare Corp. | 100,900 | 2,181 |
| * | Isis Pharmaceuticals Inc. | 80,500 | 2,142 |
| * | Providence Service Corp. | 52,400 | 2,128 |
| *,^ | Myriad Genetics Inc. | 48,400 | 2,043 |
| * | Corvel Corp. | 44,475 | 2,025 |
| * | Anika Therapeutics Inc. | 46,200 | 1,975 |
| * | AMN Healthcare Services Inc. | 145,200 | 1,812 |
| * | Alliance HealthCare Services Inc. | 63,200 | 1,799 |
| * | Prestige Brands Holdings Inc. | 52,700 | 1,766 |
| * | Revance Therapeutics Inc. | 42,900 | 1,471 |
| * | Insys Therapeutics Inc. | 33,441 | 1,373 |
| * | Cara Therapeutics Inc. | 68,200 | 981 |
| * | Prothena Corp. plc | 33,894 | 746 |
| * | Team Health Holdings Inc. | 14,500 | 703 |
| * | Cytokinetics Inc. | 133,100 | 606 |
| * | DexCom Inc. | 14,900 | 483 |
| HealthSouth Corp. | 12,200 | 423 | |
| * | Sagent Pharmaceuticals Inc. | 18,600 | 385 |
| * | Halozyme Therapeutics Inc. | 49,200 | 367 |
| Utah Medical Products Inc. | 2,000 | 102 | |
| 1,827,738 | |||
| Industrials (17.1%) | |||
| MSC Industrial Direct Co. Inc. Class A | 685,295 | 62,403 | |
| Chicago Bridge & Iron Co. NV | 748,705 | 59,949 | |
| Pentair Ltd. | 767,725 | 57,034 | |
| * | IHS Inc. Class A | 462,345 | 55,773 |
| * | B/E Aerospace Inc. | 632,547 | 55,519 |
| * | AerCap Holdings NV | 1,321,636 | 55,152 |
| Waste Connections Inc. | 1,233,500 | 55,088 | |
| * | Armstrong World Industries Inc. | 972,435 | 51,111 |
| * | Moog Inc. Class A | 772,808 | 50,580 |
| * | DXP Enterprises Inc. | 437,973 | 49,583 |
| EnerSys Inc. | 726,165 | 49,074 | |
| Watsco Inc. | 460,975 | 47,439 | |
| AO Smith Corp. | 1,006,015 | 47,041 | |
| * | WESCO International Inc. | 521,075 | 45,740 |
| * | Middleby Corp. | 173,667 | 43,847 |
| * | MRC Global Inc. | 1,461,300 | 42,655 |
| Flowserve Corp. | 563,370 | 41,154 | |
| Manpowergroup Inc. | 504,090 | 41,003 | |
| * | Swift Transportation Co. | 1,620,980 | 38,985 |
| Kennametal Inc. | 829,685 | 38,771 | |
| * | JetBlue Airways Corp. | 4,872,000 | 38,513 |
| AMETEK Inc. | 730,365 | 38,505 | |
| Acuity Brands Inc. | 303,165 | 37,765 | |
| John Bean Technologies Corp. | 1,281,760 | 37,158 | |
| * | United Rentals Inc. | 392,576 | 36,835 |
| * | Esterline Technologies Corp. | 334,200 | 36,434 |
| * | Teledyne Technologies Inc. | 392,303 | 36,429 |
| * | RBC Bearings Inc. | 576,194 | 35,874 |
| * | Quanta Services Inc. | 936,965 | 33,056 |
| Generac Holdings Inc. | 559,863 | 32,965 | |
| Con-way Inc. | 773,240 | 32,847 | |
| * | Genesee & Wyoming Inc. Class A | 323,963 | 32,076 |
| 6 | |||
Vanguard® Explorer Fund
Schedule of Investments
April 30, 2014
| Market | |||
| Value | |||
| Shares | ($000) | ||
| AGCO Corp. | 556,400 | 30,991 | |
| Herman Miller Inc. | 977,936 | 30,150 | |
| * | Advisory Board Co. | 493,924 | 28,282 |
| Robert Half International Inc. | 592,937 | 26,564 | |
| *,2 | American Woodmark Corp. | 799,559 | 23,995 |
| Carlisle Cos. Inc. | 280,820 | 23,097 | |
| * | Old Dominion Freight Line Inc. | 367,214 | 22,264 |
| * | TriMas Corp. | 595,582 | 21,358 |
| * | Rush Enterprises Inc. Class A | 660,171 | 21,191 |
| * | Stericycle Inc. | 179,925 | 20,950 |
| * | Avis Budget Group Inc. | 390,229 | 20,522 |
| * | Huron Consulting Group Inc. | 285,165 | 20,304 |
| Universal Forest Products Inc. | 399,991 | 20,196 | |
| * | Hexcel Corp. | 448,100 | 18,681 |
| *,^ | FuelCell Energy Inc. | 8,126,300 | 18,447 |
| * | Copart Inc. | 487,808 | 17,693 |
| * | Saia Inc. | 415,995 | 17,127 |
| * | H&E Equipment Services Inc. | 440,879 | 16,996 |
| Mobile Mini Inc. | 376,500 | 16,634 | |
| Kaman Corp. | 350,827 | 14,724 | |
| MSA Safety Inc. | 272,398 | 14,369 | |
| *,^ | Polypore International Inc. | 393,310 | 13,640 |
| Knight Transportation Inc. | 559,380 | 13,274 | |
| * | Clean Harbors Inc. | 218,700 | 13,122 |
| TAL International Group Inc. | 290,794 | 12,266 | |
| * | CAI International Inc. | 542,519 | 11,800 |
| * | Rexnord Corp. | 413,131 | 11,047 |
| KAR Auction Services Inc. | 351,900 | 10,480 | |
| Exponent Inc. | 142,322 | 10,022 | |
| * | Proto Labs Inc. | 163,100 | 9,874 |
| * | Verisk Analytics Inc. Class A | 163,600 | 9,831 |
| * | WageWorks Inc. | 228,800 | 9,694 |
| * | Columbus McKinnon Corp. | 346,643 | 9,183 |
| McGrath RentCorp | 289,000 | 9,127 | |
| Corporate Executive Board Co. | 112,400 | 7,758 | |
| * | 51job Inc. ADR | 94,052 | 6,343 |
| UTi Worldwide Inc. | 496,289 | 4,859 | |
| * | Astronics Corp. | 83,600 | 4,775 |
| Alaska Air Group Inc. | 49,224 | 4,631 | |
| Towers Watson & Co. Class A | 40,800 | 4,579 | |
| * | WABCO Holdings Inc. | 40,900 | 4,377 |
| Huntington Ingalls Industries Inc. | 40,500 | 4,171 | |
| IDEX Corp. | 55,450 | 4,135 | |
| Lincoln Electric Holdings Inc. | 61,100 | 4,082 | |
| * | Spirit Airlines Inc. | 65,700 | 3,734 |
| Copa Holdings SA Class A | 27,000 | 3,653 | |
| ITT Corp. | 81,100 | 3,499 | |
| Manitowoc Co. Inc. | 109,100 | 3,467 | |
| Deluxe Corp. | 61,809 | 3,396 | |
| Pitney Bowes Inc. | 123,800 | 3,318 | |
| * | Chart Industries Inc. | 47,300 | 3,227 |
| Cintas Corp. | 53,900 | 3,176 | |
| Lennox International Inc. | 36,100 | 3,026 | |
| Fortune Brands Home & Security Inc. | 74,200 | 2,957 | |
| RR Donnelley & Sons Co. | 167,800 | 2,953 | |
| * | AECOM Technology Corp. | 81,900 | 2,655 |
| * | Taser International Inc. | 162,700 | 2,628 |
| * | DigitalGlobe Inc. | 87,800 | 2,615 |
| * | Power Solutions International Inc. | 31,330 | 2,593 |
| Mueller Water Products Inc. Class A | 283,700 | 2,587 | |
| Steelcase Inc. Class A | 147,179 | 2,426 | |
| * | Spirit AeroSystems Holdings Inc. Class A | 80,700 | 2,423 |
| Crane Co. | 31,400 | 2,284 | |
| Altra Industrial Motion Corp. | 61,500 | 2,101 | |
| 7 | |||
Vanguard® Explorer Fund
Schedule of Investments
April 30, 2014
| Market | |||
| Value | |||
| Shares | ($000) | ||
| * | USG Corp. | 57,200 | 1,708 |
| * | PGT Inc. | 150,200 | 1,494 |
| Hyster-Yale Materials Handling Inc. | 10,300 | 993 | |
| Aceto Corp. | 30,800 | 674 | |
| AMERCO | 2,000 | 500 | |
| Toro Co. | 7,600 | 483 | |
| Harsco Corp. | 13,300 | 318 | |
| Barrett Business Services Inc. | 5,600 | 282 | |
| 2,119,133 | |||
| Information Technology (23.2%) | |||
| * | PTC Inc. | 2,795,666 | 98,883 |
| * | Alliance Data Systems Corp. | 407,098 | 98,477 |
| * | Cadence Design Systems Inc. | 4,864,560 | 75,693 |
| * | Euronet Worldwide Inc. | 1,443,930 | 66,406 |
| * | Ultimate Software Group Inc. | 551,764 | 66,008 |
| * | First Solar Inc. | 965,468 | 65,159 |
| * | Bankrate Inc. | 3,711,709 | 65,029 |
| * | Silicon Laboratories Inc. | 1,415,920 | 63,646 |
| * | Finisar Corp. | 2,380,600 | 62,253 |
| Belden Inc. | 775,675 | 57,253 | |
| * | TiVo Inc. | 4,778,160 | 56,669 |
| * | Sapient Corp. | 3,391,930 | 55,187 |
| * | Teradyne Inc. | 2,932,320 | 51,814 |
| * | Acxiom Corp. | 1,732,241 | 48,918 |
| *,2 | WNS Holdings Ltd. ADR | 2,619,414 | 48,773 |
| * | Trimble Navigation Ltd. | 1,168,280 | 44,897 |
| * | Microsemi Corp. | 1,855,890 | 43,651 |
| * | ON Semiconductor Corp. | 4,592,440 | 43,215 |
| * | Aspen Technology Inc. | 991,118 | 42,608 |
| * | Informatica Corp. | 1,127,445 | 39,968 |
| * | Atmel Corp. | 5,042,905 | 39,183 |
| * | Aruba Networks Inc. | 1,972,160 | 38,990 |
| IAC/InterActiveCorp | 587,884 | 38,965 | |
| Convergys Corp. | 1,793,081 | 38,623 | |
| * | Pandora Media Inc. | 1,578,395 | 36,966 |
| * | CoStar Group Inc. | 228,494 | 36,762 |
| * | Electronics For Imaging Inc. | 940,130 | 35,528 |
| * | Demandware Inc. | 691,258 | 34,307 |
| EVERTEC Inc. | 1,416,300 | 33,340 | |
| *,^ | Ubiquiti Networks Inc. | 852,916 | 33,033 |
| * | NCR Corp. | 1,076,540 | 32,845 |
| * | MICROS Systems Inc. | 618,695 | 31,863 |
| * | F5 Networks Inc. | 302,495 | 31,813 |
| * | Concur Technologies Inc. | 354,959 | 28,564 |
| * | Cardtronics Inc. | 832,708 | 27,879 |
| NICE Systems Ltd. ADR | 643,285 | 27,790 | |
| * | Freescale Semiconductor Ltd. | 1,263,300 | 27,755 |
| * | Mellanox Technologies Ltd. | 778,133 | 27,211 |
| * | WEX Inc. | 281,300 | 26,996 |
| * | Red Hat Inc. | 541,500 | 26,344 |
| * | Dealertrack Technologies Inc. | 554,152 | 25,319 |
| Heartland Payment Systems Inc. | 610,619 | 24,999 | |
| * | Ruckus Wireless Inc. | 2,387,200 | 24,946 |
| * | RADWARE Ltd. | 1,354,700 | 22,393 |
| j2 Global Inc. | 472,062 | 21,885 | |
| * | SPS Commerce Inc. | 415,401 | 21,518 |
| FactSet Research Systems Inc. | 199,650 | 21,263 | |
| * | Tyler Technologies Inc. | 259,056 | 21,152 |
| * | Integrated Device Technology Inc. | 1,805,615 | 21,072 |
| * | Ciena Corp. | 1,057,820 | 20,913 |
| ^ | MercadoLibre Inc. | 220,127 | 20,531 |
| * | Web.com Group Inc. | 667,103 | 20,487 |
| * | Syntel Inc. | 248,652 | 19,972 |
| * | Monolithic Power Systems Inc. | 529,412 | 19,641 |
| 8 | |||
Vanguard® Explorer Fund
Schedule of Investments
April 30, 2014
| Market | |||
| Value | |||
| Shares | ($000) | ||
| Intersil Corp. Class A | 1,574,795 | 19,433 | |
| *,^ | InvenSense Inc. | 889,400 | 19,149 |
| * | Infoblox Inc. | 961,600 | 18,867 |
| * | Fortinet Inc. | 852,550 | 18,739 |
| * | Constant Contact Inc. | 724,439 | 18,734 |
| * | Fairchild Semiconductor International Inc. Class A | 1,419,200 | 18,066 |
| * | Riverbed Technology Inc. | 928,800 | 18,065 |
| * | Super Micro Computer Inc. | 865,202 | 17,616 |
| MAXIMUS Inc. | 407,414 | 17,344 | |
| * | Qlik Technologies Inc. | 747,500 | 16,430 |
| * | VeriFone Systems Inc. | 468,540 | 15,668 |
| Power Integrations Inc. | 323,760 | 15,291 | |
| *,^ | Endurance International Group Holdings Inc. | 1,203,425 | 15,223 |
| * | Skyworks Solutions Inc. | 367,592 | 15,090 |
| * | Synchronoss Technologies Inc. | 487,639 | 14,844 |
| * | Brocade Communications Systems Inc. | 1,535,600 | 14,296 |
| * | SS&C Technologies Holdings Inc. | 363,862 | 14,162 |
| * | Nanometrics Inc. | 826,028 | 13,431 |
| * | Spansion Inc. Class A | 688,935 | 12,284 |
| * | CalAmp Corp. | 677,446 | 12,025 |
| *,^ | Stratasys Ltd. | 120,580 | 11,681 |
| * | LinkedIn Corp. Class A | 72,903 | 11,188 |
| * | PROS Holdings Inc. | 403,400 | 11,053 |
| * | Progress Software Corp. | 514,792 | 11,047 |
| * | Conversant Inc. | 451,860 | 11,043 |
| * | Palo Alto Networks Inc. | 172,444 | 10,964 |
| * | Cognex Corp. | 317,400 | 10,928 |
| * | Imperva Inc. | 452,533 | 10,354 |
| * | Gigamon Inc. | 646,500 | 10,195 |
| Littelfuse Inc. | 110,000 | 9,961 | |
| *,^ | 3D Systems Corp. | 208,515 | 9,871 |
| * | Liquidity Services Inc. | 538,110 | 9,282 |
| * | EPAM Systems Inc. | 297,900 | 9,274 |
| *,^ | IPG Photonics Corp. | 138,000 | 8,919 |
| * | SciQuest Inc. | 362,169 | 8,685 |
| * | Diodes Inc. | 323,485 | 8,530 |
| * | Proofpoint Inc. | 333,331 | 8,480 |
| * | Netscout Systems Inc. | 214,344 | 8,351 |
| * | Interactive Intelligence Group Inc. | 131,969 | 8,257 |
| Microchip Technology Inc. | 172,200 | 8,186 | |
| * | LivePerson Inc. | 748,120 | 7,406 |
| *,^ | Care.com Inc. | 600,294 | 7,354 |
| * | Information Services Group Inc. | 1,427,119 | 7,064 |
| * | Entropic Communications Inc. | 1,912,830 | 7,058 |
| *,^ | Tremor Video Inc. | 1,494,924 | 6,742 |
| FLIR Systems Inc. | 197,900 | 6,737 | |
| * | II-VI Inc. | 462,366 | 6,658 |
| * | MaxLinear Inc. | 832,996 | 6,556 |
| * | WebMD Health Corp. | 144,968 | 6,392 |
| * | Virtusa Corp. | 178,000 | 5,869 |
| * | Semtech Corp. | 236,577 | 5,673 |
| * | Cavium Inc. | 124,800 | 5,288 |
| *,^ | Allot Communications Ltd. | 367,600 | 5,014 |
| FEI Co. | 59,800 | 4,755 | |
| * | Gartner Inc. | 64,738 | 4,463 |
| * | E2open Inc. | 258,100 | 4,457 |
| Hittite Microwave Corp. | 70,500 | 4,185 | |
| Broadridge Financial Solutions Inc. | 105,700 | 4,053 | |
| Jack Henry & Associates Inc. | 70,700 | 3,900 | |
| National Instruments Corp. | 141,800 | 3,873 | |
| * | Cornerstone OnDemand Inc. | 100,900 | 3,709 |
| * | Cree Inc. | 78,000 | 3,679 |
| * | Envestnet Inc. | 98,051 | 3,613 |
| * | Advanced Micro Devices Inc. | 856,000 | 3,501 |
| 9 | |||
Vanguard® Explorer Fund
Schedule of Investments
April 30, 2014
| Market | ||||
| Value | ||||
| Shares | ($000) | |||
| * | ANSYS Inc. | 43,500 | 3,319 | |
| * | VeriSign Inc. | 70,300 | 3,317 | |
| DST Systems Inc. | 34,996 | 3,226 | ||
| * | ARRIS Group Inc. | 122,900 | 3,206 | |
| Booz Allen Hamilton Holding Corp. Class A | 136,341 | 3,169 | ||
| * | Take-Two Interactive Software Inc. | 155,100 | 3,161 | |
| *,^ | SunPower Corp. Class A | 94,200 | 3,148 | |
| Anixter International Inc. | 31,931 | 3,129 | ||
| * | Guidewire Software Inc. | 80,800 | 3,051 | |
| * | Manhattan Associates Inc. | 95,852 | 3,022 | |
| CDW Corp. | 102,500 | 2,889 | ||
| * | Zebra Technologies Corp. | 40,600 | 2,819 | |
| * | Tableau Software Inc. Class A | 50,800 | 2,808 | |
| * | Plexus Corp. | 65,500 | 2,746 | |
| * | RF Micro Devices Inc. | 318,130 | 2,685 | |
| * | Glu Mobile Inc. | 617,400 | 2,470 | |
| * | Applied Micro Circuits Corp. | 245,600 | 2,385 | |
| Blackbaud Inc. | 74,000 | 2,253 | ||
| Mentor Graphics Corp. | 102,360 | 2,119 | ||
| * | FireEye Inc. | 52,300 | 2,053 | |
| * | Unisys Corp. | 84,040 | 2,048 | |
| * | ServiceSource International Inc. | 327,610 | 2,044 | |
| Pegasystems Inc. | 91,400 | 1,515 | ||
| * | AVG Technologies NV | 80,500 | 1,508 | |
| * | Vantiv Inc. Class A | 48,800 | 1,501 | |
| * | CommVault Systems Inc. | 25,100 | 1,215 | |
| CSG Systems International Inc. | 44,500 | 1,173 | ||
| * | Blackhawk Network Holdings Inc. | 34,200 | 820 | |
| Advent Software Inc. | 26,200 | 755 | ||
| * | Comverse Inc. | 27,800 | 693 | |
| * | Synaptics Inc. | 9,900 | 615 | |
| * | CommScope Holding Co. Inc. | 21,000 | 560 | |
| * | Silicon Image Inc. | 99,100 | 556 | |
| * | MicroStrategy Inc. Class A | 4,400 | 534 | |
| * | Ultra Clean Holdings Inc. | 35,000 | 298 | |
| * | Genpact Ltd. | 12,400 | 209 | |
| LSI Corp. | 15,300 | 170 | ||
| QAD Inc. Class A | 6,000 | 114 | ||
| 2,877,663 | ||||
| Materials (5.9%) | ||||
| * | Graphic Packaging Holding Co. | 6,437,664 | 66,050 | |
| PolyOne Corp. | 1,544,520 | 57,873 | ||
| Ball Corp. | 928,995 | 52,200 | ||
| Allegheny Technologies Inc. | 1,135,900 | 46,799 | ||
| Smurfit Kappa Group plc | 2,023,972 | 44,973 | ||
| Minerals Technologies Inc. | 725,060 | 43,134 | ||
| Ashland Inc. | 445,455 | 43,031 | ||
| * | WR Grace & Co. | 450,285 | 41,471 | |
| * | KapStone Paper and Packaging Corp. | 1,394,914 | 36,798 | |
| Steel Dynamics Inc. | 1,965,300 | 35,906 | ||
| Worthington Industries Inc. | 942,470 | 34,683 | ||
| FMC Corp. | 430,775 | 33,170 | ||
| OM Group Inc. | 1,051,300 | 30,793 | ||
| * | Constellium NV Class A | 989,700 | 30,206 | |
| Carpenter Technology Corp. | 420,860 | 26,430 | ||
| US Silica Holdings Inc. | 464,450 | 20,979 | ||
| Schweitzer-Mauduit International Inc. | 400,514 | 17,478 | ||
| Eagle Materials Inc. | 172,182 | 14,348 | ||
| Methanex Corp. | 200,890 | 12,455 | ||
| Airgas Inc. | 59,700 | 6,344 | ||
| Sealed Air Corp. | 138,000 | 4,735 | ||
| Balchem Corp. | 73,300 | 4,541 | ||
| Packaging Corp. of America | 65,300 | 4,351 | ||
| Westlake Chemical Corp. | 51,400 | 3,660 | ||
| 10 | ||||
Vanguard® Explorer Fund
Schedule of Investments
April 30, 2014
| Market | |||||
| Value | |||||
| Shares | ($000) | ||||
| Rock-Tenn Co. Class A | 36,000 | 3,442 | |||
| * | Owens-Illinois Inc. | 104,300 | 3,315 | ||
| Avery Dennison Corp. | 57,200 | 2,783 | |||
| Quaker Chemical Corp. | 33,756 | 2,512 | |||
| American Vanguard Corp. | 126,532 | 2,254 | |||
| Valspar Corp. | 24,500 | 1,789 | |||
| International Flavors & Fragrances Inc. | 17,600 | 1,734 | |||
| * | Berry Plastics Group Inc. | 72,500 | 1,631 | ||
| * | Ferro Corp. | 115,600 | 1,500 | ||
| NewMarket Corp. | 3,273 | 1,219 | |||
| Scotts Miracle-Gro Co. Class A | 5,300 | 324 | |||
| 734,911 | |||||
| Other (1.0%) | |||||
| ^,3 | Vanguard Small-Cap Growth ETF | 463,200 | 55,376 | ||
| ^ | iShares Russell 2000 ETF | 482,850 | 54,070 | ||
| *,4 | Dropbox Private Placement | 425,730 | 8,131 | ||
| *,4 | Pure Storage Inc. Private Placement | 437,384 | 6,878 | ||
| 124,455 | |||||
| Telecommunication Services (1.1%) | |||||
| * | tw telecom inc Class A | 1,455,725 | 44,676 | ||
| * | SBA Communications Corp. Class A | 445,610 | 39,998 | ||
| * | Vonage Holdings Corp. | 9,656,390 | 37,080 | ||
| * | 8x8 Inc. | 695,359 | 6,745 | ||
| Inteliquent Inc. | 205,500 | 2,803 | |||
| * | FairPoint Communications Inc. | 109,400 | 1,492 | ||
| Atlantic Tele-Network Inc. | 24,500 | 1,450 | |||
| IDT Corp. Class B | 38,000 | 602 | |||
| 134,846 | |||||
| Utilities (0.7%) | |||||
| ITC Holdings Corp. | 1,163,100 | 43,000 | |||
| NRG Yield Inc. Class A | 939,692 | 40,256 | |||
| American States Water Co. | 79,800 | 2,423 | |||
| Otter Tail Corp. | 26,200 | 768 | |||
| 86,447 | |||||
| Total Common Stocks (Cost $9,038,420) | 12,163,104 | ||||
| Coupon | |||||
| Temporary Cash Investments (3.3%)1 | |||||
| Money Market Fund (3.0%) | |||||
| 5,6 | Vanguard Market Liquidity Fund | 0.124% | 369,582,586 | 369,583 | |
| Face | |||||
| Maturity | Amount | ||||
| Date | ($000) | ||||
| Repurchase Agreement (0.2%) | |||||
| Deutsche Bank Securities, Inc. (Dated 4/30/14, | |||||
| Repurchase Value $25,300,000, collateralized by | |||||
| Government National Mortgage Assn. 2.250%- | |||||
| 7.000%, 9/20/26-6/15/53, with a value of | |||||
| $25,806,000) | 0.050% | 5/1/14 | 25,300 | 25,300 | |
| U.S. Government and Agency Obligations (0.1%) | |||||
| 7 | Federal Home Loan Bank Discount Notes | 0.060% | 5/7/14 | 4,600 | 4,600 |
| 7,8 | Federal Home Loan Bank Discount Notes | 0.125% | 5/30/14 | 200 | 200 |
| 7,8 | Federal Home Loan Bank Discount Notes | 0.035% | 6/4/14 | 3,500 | 3,500 |
| 7,8 | Federal Home Loan Bank Discount Notes | 0.060% | 7/7/14 | 1,800 | 1,800 |
| 11 | |||||
Vanguard® Explorer Fund
Schedule of Investments
April 30, 2014
| Face | Market | |||
| Maturity | Amount | Value | ||
| Coupon | Date | ($000) | ($000) | |
| 7,8 Federal Home Loan Bank Discount Notes | 0.110% | 7/16/14 | 2,300 | 2,299 |
| 12,399 | ||||
| Total Temporary Cash Investments (Cost $407,281) | 407,282 | |||
| Total Investments (101.3%) (Cost $9,445,701) | 12,570,386 | |||
| Other Assets and Liabilities—Net (-1.3%)6 | (159,903) | |||
| Net Assets (100%) | 12,410,483 |
* Non-income-producing security.
^ Includes partial security positions on loan to broker-dealers. The total value of securities on loan is $116,586,000.
1 The fund invests a portion of its cash reserves in equity markets through the use of index futures contracts. After giving effect to futures
investments, the fund's effective common stock and temporary cash investment positions represent 99.0% and 2.3%, respectively, of net
assets.
2 Considered an affiliated company of the fund as the fund owns more than 5% of the outstanding voting securities of such company.
3 Considered an affiliated company of the fund as the issuer is another member of The Vanguard Group.
4 Restricted securities totaling $15,009,000, representing 0.1% of net assets.
5 Affiliated money market fund available only to Vanguard funds and certain trusts and accounts managed by Vanguard. Rate shown is the 7-day
yield.
6 Includes $120,010,000 of collateral received for securities on loan.
7 The issuer operates under a congressional charter; its securities are generally neither guaranteed by the U.S. Treasury nor backed by the full
faith and credit of the U.S. government.
8 Securities with a value of $6,899,000 have been segregated as initial margin for open futures contracts.
ADR—American Depositary Receipt.
12
This page intentionally left blank.
© 2014 The Vanguard Group, Inc.
All rights reserved.
Vanguard Marketing Corporation, Distributor.
SNA242_062014
Item 7: Disclosure of Proxy Voting Policies and Procedures for Closed-End Management
Investment Companies.
Not Applicable.
Item 8: Portfolio Managers of Closed-End Management Investment Companies.
Not Applicable.
Item 9: Purchase of Equity Securities by Closed-End Management Investment Company and
Affiliated Purchasers.
Not Applicable.
Item 10: Submission of Matters to a Vote of Security Holders.
Not Applicable.
Item 11: Controls and Procedures.
(a) Disclosure Controls and Procedures. The Principal Executive and Financial Officers concluded that the Registrant’s Disclosure Controls and Procedures are effective based on their evaluation of the Disclosure Controls and Procedures as of a date within 90 days of the filing date of this report.
(b) Internal Control Over Financial Reporting. There were no significant changes in Registrant’s Internal Control Over Financial Reporting or in other factors that could significantly affect this control subsequent to the date of the evaluation, including any corrective actions with regard to significant deficiencies and material weaknesses.
Item 12: Exhibits.
(a) Certifications.
Pursuant to the requirements of the Securities Exchange Act of 1934 and the Investment Company Act of 1940, the registrant has duly caused this report to be signed on its behalf by the undersigned, thereunto duly authorized.
| VANGUARD EXPLORER FUND | |
| BY: | /s/ F. WILLIAM MCNABB III* |
| F. WILLIAM MCNABB III | |
| CHIEF EXECUTIVE OFFICER | |
| Date: June 19, 2014 | |
Pursuant to the requirements of the Securities Exchange Act of 1934 and the Investment Company Act of 1940, this report has been signed below by the following persons on behalf of the registrant and in the capacities and on the dates indicated.
| VANGUARD EXPLORER FUND | |
BY: | /s/ F. WILLIAM MCNABB III* |
| F. WILLIAM MCNABB III | |
| CHIEF EXECUTIVE OFFICER | |
Date: June 19, 2014 | |
| VANGUARD EXPLORER FUND |
BY: | /s/ THOMAS J. HIGGINS* |
| THOMAS J. HIGGINS | |
| CHIEF FINANCIAL OFFICER | |
Date: June 19, 2014 | |
* By: /s/ Heidi Stam
Heidi Stam, pursuant to a Power of Attorney filed on April 22, 2014 see file Number 2-17620, Incorporated by Reference.