UNITED STATES
SECURITIES AND EXCHANGE COMMISSION
Washington, D.C. 20549
FORM N-CSR
CERTIFIED SHAREHOLDER REPORT
OF
REGISTERED MANAGEMENT INVESTMENT COMPANIES
| Investment Company Act file number: | 811-01530 | |
Name of Registrant: | Vanguard Explorer Fund | |
Address of Registrant: | P.O. Box 2600 | |
| Valley Forge, PA 19482 | ||
Name and address of agent for service: | Heidi Stam, Esquire | |
| P.O. Box 876 | ||
| Valley Forge, PA 19482 | ||
Registrant’s telephone number, including area code: (610) 669-1000 | ||
Date of fiscal year end: October 31 | ||
Date of reporting period: November 1, 2015 – April 30, 2016 | ||
Item 1: Reports to Shareholders | ||
Semiannual Report | April 30, 2016
Vanguard Explorer™ Fund
Vanguard’s Principles for Investing Success
We want to give you the best chance of investment success. These principles, grounded in Vanguard’s research and experience, can put you on the right path.
Goals. Create clear, appropriate investment goals.
Balance. Develop a suitable asset allocation using broadly diversified funds. Cost. Minimize cost.
Discipline. Maintain perspective and long-term discipline.
A single theme unites these principles: Focus on the things you can control.
We believe there is no wiser course for any investor.
| Contents | |
| Your Fund’s Total Returns. | 1 |
| Chairman’s Letter. | 2 |
| Advisors’ Report. | 7 |
| Fund Profile. | 13 |
| Performance Summary. | 15 |
| Financial Statements. | 16 |
| About Your Fund’s Expenses. | 30 |
| Trustees Approve Advisory Arrangements. | 32 |
| Glossary. | 35 |
Please note: The opinions expressed in this report are just that—informed opinions. They should not be considered promises or advice.
Also, please keep in mind that the information and opinions cover the period through the date on the front of this report. Of course, the
risks of investing in your fund are spelled out in the prospectus.
See the Glossary for definitions of investment terms used in this report.
About the cover: Pictured is a sailing block on the Brilliant, a 1932 schooner docked in Mystic, Connecticut. A type of pulley, the
sailing block helps coordinate the setting of the sails. At Vanguard, the intricate coordination of technology and people allows
us to help millions of clients around the world reach their financial goals.
Your Fund’s Total Returns
| Six Months Ended April 30, 2016 | |
| Total | |
| Returns | |
| Vanguard Explorer Fund | |
| Investor Shares | -1.56% |
| Admiral™ Shares | -1.50 |
| Russell 2500 Growth Index | -3.05 |
| Small-Cap Growth Funds Average | -4.98 |
| Small-Cap Growth Funds Average: Derived from data provided by Lipper, a Thomson Reuters Company. | |
| Admiral Shares carry lower expenses and are available to investors who meet certain account-balance requirements. | |
| Your Fund’s Performance at a Glance | ||||
| October 31, 2015, Through April 30, 2016 | ||||
| Distributions Per Share | ||||
| Starting | Ending | Income | Capital | |
| Share Price | Share Price | Dividends | Gains | |
| Vanguard Explorer Fund | ||||
| Investor Shares | $90.55 | $80.61 | $0.270 | $8.344 |
| Admiral Shares | 84.28 | 74.95 | 0.383 | 7.755 |
1

Chairman’s Letter
Dear Shareholder,
For the six months ended April 30, 2016, the broad U.S. stock market delivered flat returns. Large-company stocks did a bit better than those of their smaller counterparts, and value stocks outpaced growth stocks.
In this environment, Vanguard Explorer Fund returned –1.56% for Investor Shares and –1.50% for Admiral Shares. Stocks in the information technology and financial sectors weighed heaviest on returns. The fund’s benchmark, the Russell 2500 Growth Index, returned –3.05%, and the fund’s peers, on average, had even steeper declines.
Please note that as of January, Century Capital Management, LLC, is no longer an advisor to the Explorer Fund. The assets formerly managed by Century have been allocated among three of the fund’s advisors: Arrowpoint Partners, Vanguard Quantitative Equity Group, and Stephens Investment Management Group, LLC. Wellington Management Company llp, Kalmar Investment Advisers, Granahan Investment Management, Inc., and Chartwell Investment Partners, LLC, also continue to serve as advisors to the fund.
U.S. stocks traveled a rocky road, finishing the period about even
The most recent half year was marked by inconsistency, sharp declines, and even sharper rallies for the domestic equity market.
2
After struggling during the first four months of the period, U.S. stocks rebounded in the final two. Most of the surge came in March as investors cheered the Federal Reserve’s indication that it would scale back its original plan for interest rate hikes in 2016. Continued aggressive stimulus by central bankers in Europe and Asia and a recovery in oil prices also helped.
International stocks traced an even rockier path than their U.S. counterparts en route to modestly negative returns. Developed markets, especially Europe, notched weak results, while emerging markets managed a slight advance.
Bonds have proved attractive with some help from the Fed
The broad U.S. bond market returned 2.82% for the half year. After retreating in November and December, it recorded positive results for each of the next four months. It also received a boost from the Fed’s cautious approach to raising short-term interest rates.
The yield of the 10-year U.S. Treasury note closed at 1.83% at the end of April, down from 2.17% six months earlier. (Bond prices and yields move in opposite directions.)
| Market Barometer | |||
| Total Returns | |||
| Periods Ended April 30, 2016 | |||
| Six | One | Five Years | |
| Months | Year | (Annualized) | |
| Stocks | |||
| Russell 1000 Index (Large-caps) | 0.22% | 0.34% | 10.81% |
| Russell 2000 Index (Small-caps) | -1.90 | -5.94 | 6.98 |
| Russell 3000 Index (Broad U.S. market) | 0.06 | -0.18 | 10.50 |
| FTSE All-World ex US Index (International) | -1.52 | -10.65 | 0.25 |
| Bonds | |||
| Barclays U.S. Aggregate Bond Index (Broad taxable market) | 2.82% | 2.72% | 3.60% |
| Barclays Municipal Bond Index (Broad tax-exempt market) | 3.55 | 5.29 | 5.37 |
| Citigroup Three-Month U.S. Treasury Bill Index | 0.08 | 0.10 | 0.05 |
| CPI | |||
| Consumer Price Index | 0.60% | 1.13% | 1.25% |
3
Even though the Fed raised short-term interest rates a quarter of a percentage point in December, the target rate of 0.25%–0.5% is still very low historically, and it restrained returns for money market funds and savings accounts.
International bond markets (as measured by the Barclays Global Aggregate Index ex USD) returned 8.72%, helped by foreign currencies’ strength against the dollar in a reversal from the trend of recent years. Even without this currency benefit, however, their returns were solid.
Both tech and financial stocks weighed on the fund’s performance
The Explorer Fund’s advisors seek out smaller U.S. companies that they believe offer the best promise of above-average growth. For the most recent six months, the fund’s holdings held up better than those in the Russell 2500 Growth Index. The advisors continued to concentrate the fund in five of the ten industry sectors—information technology, health care, industrials, consumer discretionary, and financials.
The fund’s largest sector, information technology, was the most notable detractor. Although general weakness in the industry led to disappointing results across the board, stocks of software and internet companies weighed most heavily on the fund. Financial stocks were another drag on performance as the fund lost ground in most areas of the sector.
| Expense Ratios | |||
| Your Fund Compared With Its Peer Group | |||
| Investor | Admiral | Peer Group | |
| Shares | Shares | Average | |
| Explorer Fund | 0.49% | 0.35% | 1.36% |
The fund expense ratios shown are from the prospectus dated February 25, 2016, and represent estimated costs for the current fiscal year.
For the six months ended April 30, 2016, the fund’s annualized expense ratios were 0.47% for Investor Shares and 0.34% for Admiral Shares.
The peer-group expense ratio is derived from data provided by Lipper, a Thomson Reuters Company, and captures information through
year-end 2015.
Peer group: Small-Cap Growth Funds.
4
| Do U.S.-based multinationals provide enough global diversification? |
| Some investors believe that their portfolios get enough exposure to international stocks |
| through their holdings in large-capitalization, multinational U.S. companies such as the ones |
| represented in the Standard & Poor’s 500 Index. After all, those firms generated almost half |
| of their total sales outside the United States in 2014.* |
| However, international exposure based only on a broad index of U.S.-based companies would |
| be patchy at best. The near-even split of domestic and foreign sales for S&P 500 companies |
| is an average; when you look at individual sectors, a different picture emerges. Information |
| technology firms earned the highest percentage of sales abroad (almost 60% in 2014). Utilities |
| and telecommunication services, which tend to operate regionally or nationally, generated the |
| least overseas revenue. |
| As the chart below shows, such a portfolio would also differ significantly from a broadly |
| diversified global portfolio in some sector weightings. It would, for example, have more |
| exposure to IT and health care stocks and considerably less to materials and financials. |
| The bottom line: Large-cap U.S. stocks can give you a degree of exposure to international |
| economic and market forces, but not to the same extent as a combination of both U.S. and |
| non-U.S. stocks. |
| S&P 500 Index sector weightings vary from those of global stocks |
| (Differences in percentage points) |
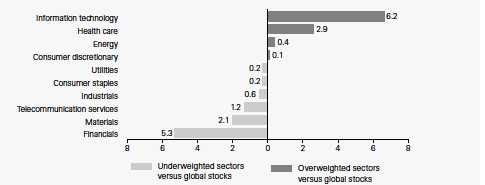
| Notes: Data are 12-month-average sector weightings as of March 31, 2016. Global stocks are represented by the FTSE All-World Index. |
| Sources: Vanguard calculations, based on data from S&P Dow Jones Indices LLC and FTSE International Limited. |
| * All S&P 500 Index and sector revenue data are from S&P Dow Jones Indices LLC for 2014. |
| There are additional risks when investing outside the United States, including the possibility that returns will be hurt |
| by a decline in the value of foreign currencies or by unfavorable developments in a particular country or region. |
5
Although health care hurt absolute returns, the fund’s holdings in the sector, especially biotechnology stocks, held up considerably better than those in the index. Consumer discretionary and industrials were additional bright spots relative to the index.
You can find more information about the Explorer Fund’s performance and positioning in the Advisors’ Report that follows this letter.
Whether a fund is index or active, low costs and talent matter
If you listen to some pundits, you might think index and actively managed investing are incompatible opposites. We at Vanguard don’t see it that way.
To us, it’s not index versus active. In fact, depending on your goals, it could well be both.
Vanguard is a pioneer in index investing. In 1976, we opened the first index mutual fund, giving shareholders an opportunity to track the performance of the S&P 500 Index. But our roots in active management—which aims to choose investments that will outperform the market—go back to the 1929 launch of what became Vanguard Wellington™ Fund.
Our index and active funds share important traits. Both are low cost, and as their assets grow, we can take advantage of the economies of scale by further reducing fund expense ratios. That allows you to keep more of your fund’s returns.
And low costs aren’t the whole story. Talent and experience are vital regardless of a fund’s management style.
When it comes to indexing, portfolio managers in our Equity Index Group and Fixed Income Group have honed their expertise over decades. That wisdom helps our index funds meet their objectives of closely tracking their benchmarks.
Our active funds, too, benefit from world-class managers—both our own experts and premier money managers we hire around the globe. There’s no guarantee that active management will lead to market-beating results, but the combination of talent and low costs can give investors a better chance of success.
If you’d like to know more, see Keys to Improving the Odds of Active Management Success and The Case for Index-Fund Investing, available at vanguard.com/research.
As always, thank you for investing with Vanguard.
Sincerely,

F. William McNabb III
Chairman and Chief Executive Officer
May 16, 2016
6
Advisors’ Report
For the six months ended April 30, 2016, Vanguard Explorer Fund returned –1.56% for Investor Shares and –1.50% for Admiral Shares. Your fund is managed by seven independent advisors, a strategy that enhances the fund’s diversification by providing exposure to distinct yet complementary investment approaches. It’s not uncommon for different advisors to have different views about individual securities or the broader investment environment.
The advisors, the amount and percentage of fund assets each manages, and brief descriptions of their investment strategies are presented in the table that begins on page 11. The advisors have provided the following assessment of the investment environment during the past six months and the notable successes and shortfalls in their portfolios.
Please note that the Granahan and Kalmar discussions refer to industry sectors as defined by Russell classifications rather than the Global Industry Classification Standard used elsewhere in this report. These comments were prepared on May 20, 2016.
Wellington Management Company llp
Portfolio Managers:
Kenneth L. Abrams, Senior Managing
Director and Equity Portfolio Manager
Daniel J. Fitzpatrick, CFA, Senior Managing
Director and Equity Portfolio Manager
For the six months ended April 30, 2016, small- and mid-capitalization stocks returned –3.05%, as measured by the portfolio’s benchmark, the Russell 2500 Growth Index. The utilities and telecommunication services sectors posted the index’s largest positive returns; energy and health care performed worst.
Our bottom-up stock selection decisions were helpful in consumer discretionary, health care, industrials, and consumer staples.
Our position in U.S.-based film company DreamWorks Animation was the portfolio’s top contributor to relative and absolute performance. The firm surprised on profitability early in the period, and results were better across the board for consumer products, television, and new media. More recently, rumored talks of a merger with Comcast and a concerted effort by the company to de-risk its balance sheet have elevated the stock price. We trimmed the position on strength.
Relative performance was hindered by weak stock selection in telecommunication services and materials. Our overweight allocation to the energy sector (a result of our bottom-up stock selection process) also detracted, as energy was the benchmark’s biggest laggard during the six months.
Pharmaceutical company PTC Therapeutics was the portfolio’s largest relative detractor. Share prices slid after the company received a Refuse to File letter from the Food and
7
Drug Administration for its drug Translarna. The application for the drug, meant to combat Duchenne muscular dystrophy, was deemed insufficiently complete to permit a substantive review. This was a new position during the period, and we continue to hold the stock.
Kalmar Investment Advisers
Portfolio Managers:
Ford B. Draper, Jr., President,
Chief Investment Officer, and
Co-Leader of the Investment Team
Dana F. Walker, CFA, Portfolio Manager
and Co-Leader of the Investment Team
World markets panicked in January and early February because of rising recession fears emanating from China and by extension including the United States. Markets then recovered in a V-shaped reversal after reassuring economic data and supportive signals from the Federal Reserve. Although a gradual slowing here and abroad is once again raising concerns, we believe that slow but steady growth is likely to continue, at least in the United States. If so, corporate earnings growth and positive equity returns should be achievable, particularly since most low-quality excesses in our market were substantially corrected in the early-2016 decline.
Our portfolio benefited most from our health care and energy holdings, which advanced while these sectors declined in the benchmark. We were most handicapped by our financial services and producer durables stocks.
Our most conspicuous successes were in the exciting biotechnology and health care fields, including Medivation, Ligand, Inogen, and West Pharmaceutical Services. Other individual winners from various sectors included Texas Roadhouse, Michaels Stores, PDC Energy, and Trex Company. Underperformers included Alliance Data Systems, The Advisory Board Company, comScore, United Natural Foods, and Encore Capital Group.
Granahan Investment
Management, Inc.
Portfolio Managers:
Gary C. Hatton, CFA, Co-Founder
and Chief Investment Officer
Jane M. White, Co-Founder,
President, and Chief Executive Officer
Jennifer M. Pawloski, Vice President
In the last six months, the stock market transitioned away from conceptual, pioneer-type names. This shift benefited the portfolio’s core growth and special situation holdings, which provide investors with visibility into a company’s management, business-model quality, and long-term growth prospects. These quality companies appear to be well-situated at a time when fears of recession have subsided, strong employment numbers have been reported, and the Federal Reserve has delayed hiking interest rates.
Our positioning away from pioneer biotech names hurt performance last year but paid off handsomely over the last six months.
8
Life science systems company Bruker Corporation was our top performer. Stock selection in the energy sector was strong.
Our worst sector was producer durables, where industrial distributors and transporters were under pressure from the macroeconomic struggles of their commodity-linked customers. Technology companies, particularly those selling software as a service, were hit hard during the downdraft at the beginning of 2016, probably because of higher valuations. Since then, many of these firms have recovered.
Arrowpoint Partners
Portfolio Managers:
Chad Meade, Partner
Brian Schaub, CFA, Partner
Volatility led the charge during the past six months. Over a short time, the Russell 2500 Growth Index experienced a 20% correction followed by a 20% rally. Investors grappled with the current state of the U.S. and global economies, Federal Reserve interest-rate policy, commodity prices, and corporate earnings. Our strategy aims to take advantage of market volatility, and we were pleased to deliver on our key objectives of 80% downside protection and 100% upside participation. Our focus remains on companies with strong competitive advantages and stable business models that we believe have the potential to create value for investors over time.
Positive contributions in consumer discretionary, our strongest sector, came from Sally Beauty Holdings and Tumi. Another top performer was MSC Industrial Direct.
The financial and energy sectors hurt results. Financial firms LPL Financial and WisdomTree Investments detracted, as did energy company telecommunications provider RigNet.
Stephens Investment Management
Group, LLC
Portfolio Manager:
Ryan E. Crane, CFA,
Chief Investment Officer
Volatility rose in the last six months as investors dealt with increased uncertainty on multiple economic fronts. Already low and falling interest rates, a weaker U.S. dollar, and rebounding crude oil prices contributed to the noise. At the same time, earnings growth slowed across the board. We believe this combination of events is significant and is resulting in a change of market leadership.
Despite challenges in the previous period, our positioning in energy allowed us to benefit from bottoming crude prices. Similarly, although our limited and selective biotechnology exposure had earlier worked against us, we were rewarded this time for owning profitable, high-quality issuers. In fact, biotech holdings were our biggest relative contributors.
9
Our exposure to software companies, especially those in network security, was a net drag on performance. We have narrowed our focus among these firms and reduced our network security holdings. However, we continue to believe that long-term fundamentals justify our exposure here.
Vanguard Quantitative Equity Group
Portfolio Managers:
Michael R. Roach, CFA
James P. Stetler, Principal
Binbin Guo, Principal, Head of Equity
Research and Portfolio Strategies
For the fiscal half year, our stock selection models effectively identified industry group leaders. The strongest contributions came from our valuation and quality models; our sentiment and management decision models were slightly negative.
Stock selection was positive in six of the ten sector groups. Our choices in health care and materials contributed the most to relative returns. Health care companies Bruker Corporation and Amedisys performed well. In materials, Koppers, Trinseo, and Ryerson Holding Corporation drove results. Our selections in consumer discretionary and energy detracted. Outerwall and American Axle & Manufacturing under-performed in consumer discretionary, and CVR Energy and Teekay Corporation disappointed in energy.
Chartwell Investment Partners, LLC
Portfolio Manager:
John A. Heffern, Managing Partner
and Senior Portfolio Manager
The equity markets staged a strong and rapid rally after mid-February, offsetting the steep losses of late last year. Against this backdrop, our portfolio decisions steadfastly reflected our bias toward quality, leadership, defensible margins, and a pattern of successful execution around growth-oriented business models.
Heartland Payment Systems was our top contributor. After posting solid revenue growth and margin expansion, this payment and payroll processing company agreed to be acquired by Global Payments. H&E Equipment Services, which offers integrated heavy industrial equipment services, also boosted results. Improvements in energy sentiment and perceived capital discipline in the industry helped the stock rebound from depressed levels.
TrueBlue, a temporary staffing services provider, was hurt by weakness at one of its largest retail clients and compression of bill and pay-rate spreads. TeamHealth, which offers outsourced physician solutions for hospitals and post-acute providers, underperformed because of a lower earnings contribution from a recent acquisition and concerns over volume growth.
10
| Vanguard Explorer Fund Investment Advisors | |||
| Fund Assets Managed | |||
| Investment Advisor | % | $ Million | Investment Strategy |
| Wellington Management | 32 | 3,419 | Conducts research and analysis of individual |
| Company LLP | companies to select stocks believed to have | ||
| exceptional growth potential relative to their market | |||
| valuations. Each stock is considered individually before | |||
| purchase, and company developments are continually | |||
| monitored for comparison with expectations for | |||
| growth. | |||
| Kalmar Investment Advisers | 15 | 1,672 | Employs a “growth with value” strategy using creative, |
| bottom-up research to uncover vigorously growing, | |||
| high-quality businesses whose stocks can also be | |||
| bought inefficiently valued. The strategy has a dual | |||
| objective of strong returns with lower risk. | |||
| Granahan Investment | 14 | 1,562 | Bases its investment process on the beliefs that |
| Management, Inc. | earnings drive stock prices and that small, dynamic | ||
| companies with exceptional growth prospects have the | |||
| greatest long-term potential. A bottom-up, fundamental | |||
| approach places companies in one of three life-cycle | |||
| categories: pioneer, core growth, and special situation. | |||
| In each, the process looks for companies with strong | |||
| earnings growth potential and leadership in their | |||
| markets. | |||
| Arrowpoint Partners | 10 | 1,126 | The firm uses in-depth fundamental research to |
| uncover companies that, in its opinion, can control their | |||
| own economic destiny. It starts by identifying | |||
| businesses with strong competitive advantages in | |||
| industries with high barriers to entry, then narrows the | |||
| focus to companies with large potential markets and | |||
| high-quality business models focused on the future. | |||
| Finally, considerations are made for potential downside | |||
| risk, resulting in a diversified portfolio of between 75 | |||
| and 100 stocks. | |||
| Stephens Investment | 10 | 1,088 | Employs a disciplined, bottom-up investment selection |
| Management Group, LLC | process that combines rigorous fundamental analysis | ||
| with quantitative screening to identify companies with | |||
| superior earnings growth potential. The approach | |||
| screens for core growth stocks and for catalyst stocks. | |||
| Core growth stocks have strong growth franchises, | |||
| recurring revenue, and above-average growth rates; | |||
| catalyst stocks are experiencing changes that could | |||
| lead to accelerated earnings growth. | |||
| Vanguard Quantitative Equity | 10 | 1,084 | Employs a quantitative fundamental management |
| Group | approach, using models that assess valuation, growth | ||
| prospects, management decisions, market sentiment, | |||
| and earnings and balance-sheet quality of companies | |||
| as compared with their peers. | |||
11
| Fund Assets Managed | |||
| Investment Advisor | % | $ Million | Investment Strategy |
| Chartwell Investment Partners, | 7 | 758 | Uses a bottom-up, fundamental, research-driven |
| LLC | stock-selection strategy focusing on companies with | ||
| sustainable growth, strong management teams, | |||
| competitive positions, and outstanding product and | |||
| service offerings. These companies should continually | |||
| demonstrate growth in earnings per share. | |||
| Cash Investments | 2 | 135 | These short-term reserves are invested by Vanguard in |
| equity index products to simulate investment in stocks. | |||
| Each advisor also may maintain a modest cash | |||
| position. | |||
12
Explorer Fund
Fund Profile
As of April 30, 2016
| Share-Class Characteristics | ||
| Investor | Admiral | |
| Shares | Shares | |
| Ticker Symbol | VEXPX | VEXRX |
| Expense Ratio1 | 0.49% | 0.35% |
| 30-Day SEC Yield | 0.18% | 0.38% |
| Portfolio Characteristics | |||
| DJ | |||
| U.S. | |||
| Russell | Total | ||
| 2500 | Market | ||
| Growth | FA | ||
| Fund | Index | Index | |
| Number of Stocks | 724 | 1,481 | 3,887 |
| Median Market Cap | $2.6B | $4.0B | $51.6B |
| Price/Earnings Ratio | 34.3x | 31.1x | 22.0x |
| Price/Book Ratio | 2.8x | 4.2x | 2.7x |
| Return on Equity | 13.2% | 16.9% | 16.8% |
| Earnings Growth | |||
| Rate | 13.8% | 14.9% | 7.8% |
| Dividend Yield | 0.9% | 1.0% | 2.1% |
| Foreign Holdings | 3.4% | 0.0% | 0.0% |
| Turnover Rate | |||
| (Annualized) | 74% | — | — |
| Short-Term | |||
| Reserves | 2.0% | — | — |
| Volatility Measures | ||
| DJ | ||
| U.S. Total | ||
| Russell 2500 | Market | |
| Growth Index | FA Index | |
| R-Squared | 0.98 | 0.82 |
| Beta | 0.98 | 1.16 |
These measures show the degree and timing of the fund’s fluctuations compared with the indexes over 36 months.
| Ten Largest Holdings (% of total net assets) | ||
| Cadence Design | ||
| Systems Inc. | Application Software | 1.1% |
| Cardtronics Inc. | Data Processing & | |
| Outsourced Services | 0.9 | |
| Demandware Inc. | Internet Software & | |
| Services | 0.8 | |
| Ultimate Software Group | ||
| Inc. | Application Software | 0.7 |
| DSW Inc. | Apparel Retail | 0.6 |
| Globus Medical Inc. | Health Care | |
| Equipment | 0.6 | |
| MGIC Investment Corp. | Thrifts & Mortgage | |
| Finance | 0.6 | |
| Ligand Pharmaceuticals | ||
| Inc. | Biotechnology | 0.6 |
| West Pharmaceutical | ||
| Services Inc. | Health Care Supplies | 0.6 |
| Nasdaq Inc. | Specialized Finance | 0.6 |
| Top Ten | 7.1% | |
The holdings listed exclude any temporary cash investments and equity index products.
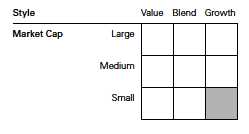
Investment Focus
1 The expense ratios shown are from the prospectus dated February 25, 2016, and represent estimated costs for the current fiscal year. For the six
months ended April 30, 2016, the annualized expense ratios were 0.47% for Investor Shares and 0.34% for Admiral Shares.
13
Explorer Fund
| Sector Diversification (% of equity exposure) | |||
| DJ | |||
| U.S. | |||
| Russell | Total | ||
| 2500 | Market | ||
| Growth | FA | ||
| Fund | Index | Index | |
| Consumer | |||
| Discretionary | 17.7% | 20.2% | 13.5% |
| Consumer Staples | 2.4 | 3.5 | 9.0 |
| Energy | 3.5 | 0.8 | 6.7 |
| Financials | 10.5 | 10.5 | 17.8 |
| Health Care | 19.1 | 19.3 | 14.1 |
| Industrials | 18.1 | 17.0 | 10.8 |
| Information | |||
| Technology | 23.8 | 20.5 | 19.0 |
| Materials | 4.0 | 7.4 | 3.3 |
| Telecommunication | |||
| Services | 0.7 | 0.6 | 2.4 |
| Utilities | 0.2 | 0.2 | 3.4 |
14
Explorer Fund
Performance Summary
All of the returns in this report represent past performance, which is not a guarantee of future results that may be achieved by the fund. (Current performance may be lower or higher than the performance data cited. For performance data current to the most recent month-end, visit our website at vanguard.com/performance.) Note, too, that both investment returns and principal value can fluctuate widely, so an investor’s shares, when sold, could be worth more or less than their original cost. The returns shown do not reflect taxes that a shareholder would pay on fund distributions or on the sale of fund shares.
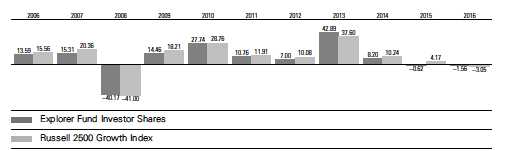
Fiscal-Year Total Returns (%): October 31, 2005, Through April 30, 2016
Average Annual Total Returns: Periods Ended March 31, 2016
This table presents returns through the latest calendar quarter—rather than through the end of the fiscal period.
Securities and Exchange Commission rules require that we provide this information.
| Inception | One | Five | Ten | |
| Date | Year | Years | Years | |
| Investor Shares | 12/11/1967 | -11.07% | 7.90% | 5.51% |
| Admiral Shares | 11/12/2001 | -10.96 | 8.06 | 5.68 |
See Financial Highlights for dividend and capital gains information.
15
Explorer Fund
Financial Statements (unaudited)
Statement of Net Assets—Investments Summary
As of April 30, 2016
This Statement summarizes the fund’s holdings by asset type. Details are reported for each of the fund’s 50 largest individual holdings and for investments that, in total for any issuer, represent more than 1% of the fund’s net assets. The total value of smaller holdings is reported as a single amount within each category.
The fund reports a complete list of its holdings in regulatory filings four times in each fiscal year, at the quarter-ends. For the second and fourth fiscal quarters, the complete listing of the fund’s holdings is available electronically on vanguard.com and on the Securities and Exchange Commission’s website (sec.gov), or you can have it mailed to you without charge by calling 800-662-7447. For the first and third fiscal quarters, the fund files the lists with the SEC on Form N-Q. Shareholders can look up the fund’s Forms N-Q on the SEC’s website. Forms N-Q may also be reviewed and copied at the SEC’s Public Reference Room (see the back cover of this report for further information).
| Market | Percentage | |||
| Value• | of Net | |||
| Shares | ($000) | Assets | ||
| Common Stocks | ||||
| Consumer Discretionary | ||||
| DSW Inc. Class A | 2,857,660 | 70,213 | 0.6% | |
| * | DreamWorks Animation SKG Inc. Class A | 1,228,830 | 49,055 | 0.5% |
| * | Ulta Salon Cosmetics & Fragrance Inc. | 227,665 | 47,418 | 0.4% |
| Bloomin’ Brands Inc. | 2,462,400 | 46,047 | 0.4% | |
| * | Tenneco Inc. | 821,400 | 43,781 | 0.4% |
| * | LKQ Corp. | 1,327,540 | 42,548 | 0.4% |
| *,^ | 2U Inc. | 1,473,292 | 41,296 | 0.4% |
| *,1 | MarineMax Inc. | 1,441,763 | 27,408 | 0.3% |
| Consumer Discretionary—Other † | 1,503,516 | 13.9% | ||
| 1,871,282 | 17.3% | |||
| Consumer Staples † | 244,450 | 2.2% | ||
| Energy † | 371,316 | 3.4% | ||
| Financials | ||||
| * | MGIC Investment Corp. | 9,614,898 | 69,516 | 0.6% |
| Nasdaq Inc. | 1,082,367 | 66,793 | 0.6% | |
| MarketAxess Holdings Inc. | 472,550 | 58,010 | 0.5% | |
| * | Affiliated Managers Group Inc. | 265,176 | 45,165 | 0.4% |
| Assured Guaranty Ltd. | 1,716,440 | 44,404 | 0.4% | |
| Assurant Inc. | 517,436 | 43,760 | 0.4% | |
| *,1 | eHealth Inc. | 1,380,405 | 15,447 | 0.2% |
| Financials—Other † | 741,975 | 6.9% | ||
| 1,085,070 | 10.0% | |||
| Health Care | ||||
| * | Globus Medical Inc. | 2,787,918 | 69,809 | 0.7% |
| * | Ligand Pharmaceuticals Inc. | 571,953 | 69,132 | 0.6% |
| West Pharmaceutical Services Inc. | 962,530 | 68,532 | 0.6% | |
| * | ABIOMED Inc. | 573,442 | 55,704 | 0.5% |
16
Explorer Fund
| Market | Percentage | |||
| Value• | of Net | |||
| Shares | ($000) | Assets | ||
| * | Cepheid | 1,946,760 | 55,560 | 0.5% |
| * | Insulet Corp. | 1,628,026 | 54,213 | 0.5% |
| * | ICON plc | 753,228 | 50,903 | 0.5% |
| * | Allscripts Healthcare Solutions Inc. | 3,793,820 | 50,837 | 0.5% |
| * | WellCare Health Plans Inc. | 555,440 | 49,984 | 0.5% |
| Kindred Healthcare Inc. | 3,217,959 | 47,497 | 0.4% | |
| * | athenahealth Inc. | 349,754 | 46,622 | 0.4% |
| * | Alkermes plc | 1,094,142 | 43,492 | 0.4% |
| * | LifePoint Health Inc. | 625,621 | 42,267 | 0.4% |
| *,1 | Imprivata Inc. | 2,420,390 | 29,335 | 0.3% |
| Health Care—Other † | 1,279,513 | 11.8% | ||
| 2,013,400 | 18.6% | |||
| Industrials | ||||
| * | Clean Harbors Inc. | 1,335,691 | 65,983 | 0.6% |
| * | WageWorks Inc. | 1,136,494 | 61,212 | 0.6% |
| * | Genesee & Wyoming Inc. Class A | 862,499 | 56,157 | 0.5% |
| John Bean Technologies Corp. | 988,853 | 51,559 | 0.5% | |
| MSC Industrial Direct Co. Inc. Class A | 644,012 | 49,911 | 0.5% | |
| 1 | H&E Equipment Services Inc. | 2,226,164 | 45,035 | 0.4% |
| GATX Corp. | 957,100 | 43,969 | 0.4% | |
| * | Middleby Corp. | 380,225 | 41,688 | 0.4% |
| Industrials—Other † | 1,501,140 | 13.8% | ||
| 1,916,654 | 17.7% | |||
| Information Technology | ||||
| * | Cadence Design Systems Inc. | 4,923,060 | 114,166 | 1.0% |
| *,1 | Cardtronics Inc. | 2,429,936 | 95,788 | 0.9% |
| * | Demandware Inc. | 1,864,586 | 85,920 | 0.8% |
| * | Ultimate Software Group Inc. | 378,854 | 74,479 | 0.7% |
| * | Euronet Worldwide Inc. | 791,341 | 61,012 | 0.6% |
| * | Cavium Inc. | 1,121,701 | 55,378 | 0.5% |
| * | CoStar Group Inc. | 242,012 | 47,751 | 0.4% |
| * | HubSpot Inc. | 1,029,009 | 45,575 | 0.4% |
| * | M/A-COM Technology Solutions Holdings Inc. | 1,085,673 | 44,393 | 0.4% |
| * | First Solar Inc. | 794,568 | 44,369 | 0.4% |
| Power Integrations Inc. | 888,155 | 42,853 | 0.4% | |
| * | Tyler Technologies Inc. | 287,582 | 42,105 | 0.4% |
| * | Electronics For Imaging Inc. | 1,048,712 | 41,781 | 0.4% |
| * | Alliance Data Systems Corp. | 205,218 | 41,723 | 0.4% |
| * | WNS Holdings Ltd. ADR | 1,314,397 | 41,653 | 0.4% |
| * | WEX Inc. | 436,970 | 41,289 | 0.4% |
| *,1 | Information Services Group Inc. | 2,093,515 | 8,583 | 0.1% |
| Information Technology—Other † | 1,577,251 | 14.5% | ||
| 2,506,069 | 23.1% | |||
| Materials | ||||
| PolyOne Corp. | 1,658,470 | 59,672 | 0.5% | |
| Minerals Technologies Inc. | 816,370 | 48,901 | 0.5% | |
| Materials—Other † | 308,545 | 2.8% | ||
| 417,118 | 3.8% | |||
| Other | ||||
| 2 | Vanguard Small-Cap Growth ETF | 384,700 | 46,391 | 0.4% |
| 2 | Vanguard Small-Cap ETF | 202,930 | 23,024 | 0.2% |
| 3 | Other—Other † | 3,949 | 0.1% | |
| 73,364 | 0.7% | |||
17
Explorer Fund
| Market | Percentage | ||||
| Value• | of Net | ||||
| Shares | ($000) | Assets | |||
| Telecommunication Services † | 72,625 | 0.7% | |||
| Utilities † | 21,138 | 0.2% | |||
| Total Common Stocks (Cost $9,305,308) | 10,592,486 | 97.7%4 | |||
| Coupon | |||||
| Temporary Cash Investments | |||||
| Money Market Fund | |||||
| 5,6 Vanguard Market Liquidity Fund | 0.495% | 463,835,981 | 463,836 | 4.3% | |
| Face | |||||
| Maturity | Amount | ||||
| Date | ($000) | ||||
| Repurchase Agreement | |||||
| Deutsche Bank Securities, Inc. | |||||
| (Dated 4/29/16, Repurchase Value | |||||
| $35,801,000, collateralized by | |||||
| Federal Home Loan Mortgage | |||||
| Corp. 6.000%, 11/15/17, and | |||||
| Government National Mortgage | |||||
| Assn. 3.500%–5.500%, | |||||
| 7/20/37–9/20/45, with a value | |||||
| of $36,516,000) | 0.310% | 5/2/16 | 35,800 | 35,800 | 0.3% |
| 7U.S. Government and Agency Obligations † | 22,988 | 0.2% | |||
| Total Temporary Cash Investments (Cost $522,617) | 522,624 | 4.8%4 | |||
| Total Investments (Cost $9,827,925) | 11,115,110 | 102.5% | |||
| Amount | |||||
| ($000) | |||||
| Other Assets and Liabilities | |||||
| Other Assets | |||||
| Investment in Vanguard | 911 | ||||
| Receivables for Investment Securities Sold | 64,864 | ||||
| Receivables for Accrued Income | 2,154 | ||||
| Receivables for Capital Shares Issued | 13,464 | ||||
| Other Assets | 472 | ||||
| Total Other Assets | 81,865 | 0.8% | |||
| Liabilities | |||||
| Payables for Investment Securities Purchased | (91,665) | ||||
| Collateral for Securities on Loan | (208,099) | ||||
| Payables to Investment Advisor | (4,973) | ||||
| Payables for Capital Shares Redeemed | (21,321) | ||||
| Payables to Vanguard | (23,980) | ||||
| Other Liabilities | (2,558) | ||||
| Total Liabilities | (352,596) | (3.3%) | |||
| Net Assets | 10,844,379 | 100.0% | |||
18
Explorer Fund
| At April 30, 2016, net assets consisted of: | |
| Amount | |
| ($000) | |
| Paid-in Capital | 9,500,838 |
| Overdistributed Net Investment Income | (10,044) |
| Accumulated Net Realized Gains | 64,157 |
| Unrealized Appreciation (Depreciation) | |
| Investment Securities | 1,287,185 |
| Futures Contracts | 2,234 |
| Foreign Currencies | 9 |
| Net Assets | 10,844,379 |
| Investor Shares—Net Assets | |
| Applicable to 43,399,948 outstanding $.001 par value shares of | |
| beneficial interest (unlimited authorization) | 3,498,339 |
| Net Asset Value Per Share—Investor Shares | $80.61 |
| Admiral Shares—Net Assets | |
| Applicable to 98,010,006 outstanding $.001 par value shares of | |
| beneficial interest (unlimited authorization) | 7,346,040 |
| Net Asset Value Per Share—Admiral Shares | $74.95 |
• See Note A in Notes to Financial Statements.
* Non-income-producing security.
^ Includes partial security positions on loan to broker-dealers. The total value of securities on loan is $194,505,000.
† Represents the aggregate value, by category, of securities that are not among the 50 largest holdings and, in total for any issuer, represent
1% or less of net assets.
1 Considered an affiliated company of the fund as the fund owns more than 5% of the outstanding voting securities of such company.
2 Considered an affiliated company of the fund as the issuer is another member of The Vanguard Group.
3 Includes restricted security totaling $3,800,000, representing 0.0% of net assets.
4 The fund invests a portion of its cash reserves in equity markets through the use of index futures contracts. After giving effect to futures
investments, the fund’s effective common stock and temporary cash investment positions represent 98.6% and 3.9%, respectively, of
net assets.
5 Affiliated money market fund available only to Vanguard funds and certain trusts and accounts managed by Vanguard. Rate shown is the
7-day yield.
6 Includes $208,099,000 of collateral received for securities on loan.
7 Securities with a value of $4,797,000 have been segregated as initial margin for open futures contracts.
ADR—American Depositary Receipt.
See accompanying Notes, which are an integral part of the Financial Statements.
19
Explorer Fund
Statement of Operations
| Six Months Ended | |
| April 30, 2016 | |
| ($000) | |
| Investment Income | |
| Income | |
| Dividends1 | 42,994 |
| Interest | 672 |
| Securities Lending | 2,696 |
| Total Income | 46,362 |
| Expenses | |
| Investment Advisory Fees—Note B | |
| Basic Fee | 11,703 |
| Performance Adjustment | (824) |
| The Vanguard Group—Note C | |
| Management and Administrative—Investor Shares | 4,275 |
| Management and Administrative—Admiral Shares | 4,365 |
| Marketing and Distribution—Investor Shares | 353 |
| Marketing and Distribution—Admiral Shares | 363 |
| Custodian Fees | 99 |
| Shareholders’ Reports—Investor Shares | 40 |
| Shareholders’ Reports—Admiral Shares | 43 |
| Trustees’ Fees and Expenses | 7 |
| Total Expenses | 20,424 |
| Expenses Paid Indirectly | (97) |
| Net Expenses | 20,327 |
| Net Investment Income | 26,035 |
| Realized Net Gain (Loss) | |
| Investment Securities Sold | 106,468 |
| Futures Contracts | (16,956) |
| Foreign Currencies | (26) |
| Realized Net Gain (Loss) | 89,486 |
| Change in Unrealized Appreciation (Depreciation) | |
| Investment Securities | (297,502) |
| Futures Contracts | 514 |
| Foreign Currencies | 10 |
| Change in Unrealized Appreciation (Depreciation) | (296,978) |
| Net Increase (Decrease) in Net Assets Resulting from Operations | (181,457) |
| 1 Dividends are net of foreign withholding taxes of $488,000. | |
See accompanying Notes, which are an integral part of the Financial Statements.
20
Explorer Fund
Statement of Changes in Net Assets
| Six Months Ended | Year Ended | |
| April 30, | October 31, | |
| 2016 | 2015 | |
| ($000) | ($000) | |
| Increase (Decrease) in Net Assets | ||
| Operations | ||
| Net Investment Income | 26,035 | 45,120 |
| Realized Net Gain (Loss) | 89,486 | 1,156,580 |
| Change in Unrealized Appreciation (Depreciation) | (296,978) | (1,234,023) |
| Net Increase (Decrease) in Net Assets Resulting from Operations | (181,457) | (32,323) |
| Distributions | ||
| Net Investment Income | ||
| Investor Shares | (11,268) | (6,525) |
| Admiral Shares | (34,000) | (25,239) |
| Realized Capital Gain1 | ||
| Investor Shares | (348,212) | (599,231) |
| Admiral Shares | (688,442) | (1,010,709) |
| Total Distributions | (1,081,922) | (1,641,704) |
| Capital Share Transactions | ||
| Investor Shares | 57,777 | (165,454) |
| Admiral Shares | 609,766 | 987,026 |
| Net Increase (Decrease) from Capital Share Transactions | 667,543 | 821,572 |
| Total Increase (Decrease) | (595,836) | (852,455) |
| Net Assets | ||
| Beginning of Period | 11,440,215 | 12,292,670 |
| End of Period2 | 10,844,379 | 11,440,215 |
1 Includes fiscal 2016 and 2015 short-term gain distributions totaling $74,171,000 and $198,950,000, respectively. Short-term gain
distributions are treated as ordinary income dividends for tax purposes.
2 Net Assets—End of Period includes undistributed (overdistributed) net investment income of ($10,044,000) and $9,215,000.
See accompanying Notes, which are an integral part of the Financial Statements.
21
Explorer Fund
Financial Highlights
| Investor Shares | ||||||
| Six Months | ||||||
| Ended | ||||||
| For a Share Outstanding | April 30, | Year Ended October 31, | ||||
| Throughout Each Period | 2016 | 2015 | 2014 | 2013 | 2012 | 2011 |
| Net Asset Value, Beginning of Period | $90.55 | $105.28 | $107.96 | $78.03 | $73.02 | $66.02 |
| Investment Operations | ||||||
| Net Investment Income | .178 | . 281 | .120 | . 2191 | .108 | .077 |
| Net Realized and Unrealized Gain (Loss) | ||||||
| on Investments | (1.504) | (.900) | 8.062 | 32.286 | 4.998 | 7.029 |
| Total from Investment Operations | (1.326) | (.619) | 8.182 | 32.505 | 5.106 | 7.106 |
| Distributions | ||||||
| Dividends from Net Investment Income | (. 270) | (.152) | (. 040) | (. 272) | (. 096) | (.106) |
| Distributions from Realized Capital Gains | (8.344) | (13.959) | (10.822) | (2.303) | — | — |
| Total Distributions | (8.614) | (14.111) | (10.862) | (2.575) | (.096) | (.106) |
| Net Asset Value, End of Period | $80.61 | $90.55 | $105.28 | $107.96 | $78.03 | $73.02 |
| Total Return2 | -1.56% | -0.62% | 8.20% | 42.89% | 7.00% | 10.76% |
| Ratios/Supplemental Data | ||||||
| Net Assets, End of Period (Millions) | $3,498 | $3,863 | $4,623 | $5,573 | $5,008 | $5,864 |
| Ratio of Total Expenses to | ||||||
| Average Net Assets3 | 0.47% | 0.48% | 0.51% | 0.50% | 0.49% | 0.50% |
| Ratio of Net Investment Income to | ||||||
| Average Net Assets | 0.42% | 0.27% | 0.12% | 0.27%1 | 0.16% | 0.12% |
| Portfolio Turnover Rate | 74% | 62% | 66% | 65% | 59% | 89%4 |
The expense ratio, net income ratio, and turnover rate for the current period have been annualized.
1 Net investment income per share and the ratio of net investment income to average net assets include $.038 and 0.03%, respectively,
resulting from a special dividend from HFF Inc. in December 2012.
2 Total returns do not include account service fees that may have applied in the periods shown. Fund prospectuses provide information about any applicable account service fees.
3 Includes performance-based investment advisory fee increases (decreases) of (0.02%), (0.02%), 0.00%, 0.00%, (0.03%), and 0.00%.
4 Excludes the value of portfolio securities received or delivered as a result of in-kind purchases or redemptions of the fund’s capital shares.
See accompanying Notes, which are an integral part of the Financial Statements.
22
Explorer Fund
Financial Highlights
| Admiral Shares | ||||||
| Six Months | ||||||
| Ended | ||||||
| For a Share Outstanding | April 30, | Year Ended October 31, | ||||
| Throughout Each Period | 2016 | 2015 | 2014 | 2013 | 2012 | 2011 |
| Net Asset Value, Beginning of Period | $84.28 | $98.03 | $100.54 | $72.68 | $68.04 | $61.50 |
| Investment Operations | ||||||
| Net Investment Income | .219 | .402 | .302 | .3751 | .236 | .179 |
| Net Realized and Unrealized Gain (Loss) | ||||||
| on Investments | (1.411) | (.853) | 7.466 | 30.019 | 4.621 | 6.550 |
| Total from Investment Operations | (1.192) | (.451) | 7.768 | 30.394 | 4.857 | 6.729 |
| Distributions | ||||||
| Dividends from Net Investment Income | (. 383) | (. 324) | (. 216) | (. 392) | (. 217) | (.189) |
| Distributions from Realized Capital Gains | (7.755) | (12.975) | (10.062) | (2.142) | — | — |
| Total Distributions | (8.138) | (13.299) | (10.278) | (2.534) | (.217) | (.189) |
| Net Asset Value, End of Period | $74.95 | $84.28 | $98.03 | $100.54 | $72.68 | $68.04 |
| Total Return2 | -1.50% | -0.48% | 8.37% | 43.13% | 7.16% | 10.94% |
| Ratios/Supplemental Data | ||||||
| Net Assets, End of Period (Millions) | $7,346 | $7,577 | $7,670 | $6,497 | $3,757 | $3,288 |
| Ratio of Total Expenses to | ||||||
| Average Net Assets3 | 0.34% | 0.34% | 0.35% | 0.34% | 0.32% | 0.34% |
| Ratio of Net Investment Income to | ||||||
| Average Net Assets | 0.55% | 0.41% | 0.28% | 0.43%1 | 0.33% | 0.28% |
| Portfolio Turnover Rate | 74% | 62% | 66% | 65% | 59% | 89%4 |
The expense ratio, net income ratio, and turnover rate for the current period have been annualized.
1 Net investment income per share and the ratio of net investment income to average net assets include $.019 and 0.03%, respectively,
resulting from a special dividend from HFF Inc. in December 2012.
2 Total returns do not include account service fees that may have applied in the periods shown. Fund prospectuses provide information about any applicable account service fees.
3 Includes performance-based investment advisory fee increases (decreases) of (0.02%), (0.02%), 0.00%, 0.00%, (0.03%), and 0.00%.
4 Excludes the value of portfolio securities received or delivered as a result of in-kind purchases or redemptions of the fund’s capital shares.
See accompanying Notes, which are an integral part of the Financial Statements.
23
Explorer Fund
Notes to Financial Statements
Vanguard Explorer Fund is registered under the Investment Company Act of 1940 as an open-end investment company, or mutual fund. The fund offers two classes of shares: Investor Shares and Admiral Shares. Investor Shares are available to any investor who meets the fund’s minimum purchase requirements. Admiral Shares are designed for investors who meet certain administrative, service, and account-size criteria.
A. The following significant accounting policies conform to generally accepted accounting principles for U.S. investment companies. The fund consistently follows such policies in preparing its financial statements.
1. Security Valuation: Securities are valued as of the close of trading on the New York Stock Exchange (generally 4 p.m., Eastern time) on the valuation date. Equity securities are valued at the latest quoted sales prices or official closing prices taken from the primary market in which each security trades; such securities not traded on the valuation date are valued at the mean of the latest quoted bid and asked prices. Securities for which market quotations are not readily available, or whose values have been affected by events occurring before the fund’s pricing time but after the close of the securities’ primary markets, are valued at their fair values calculated according to procedures adopted by the board of trustees. These procedures include obtaining quotations from an independent pricing service, monitoring news to identify significant market- or security-specific events, and evaluating changes in the values of foreign market proxies (for example, ADRs, futures contracts, or exchange-traded funds), between the time the foreign markets close and the fund’s pricing time. When fair-value pricing is employed, the prices of securities used by a fund to calculate its net asset value may differ from quoted or published prices for the same securities. Investments in Vanguard Market Liquidity Fund are valued at that fund’s net asset value. Temporary cash investments acquired over 60 days to maturity are valued using the latest bid prices or using valuations based on a matrix system (which considers such factors as security prices, yields, maturities, and ratings), both as furnished by independent pricing services. Other temporary cash investments are valued at amortized cost, which approximates market value.
2. Foreign Currency: Securities and other assets and liabilities denominated in foreign currencies are translated into U.S. dollars using exchange rates obtained from an independent third party as of the fund’s pricing time on the valuation date. Realized gains (losses) and unrealized appreciation (depreciation) on investment securities include the effects of changes in exchange rates since the securities were purchased, combined with the effects of changes in security prices. Fluctuations in the value of other assets and liabilities resulting from changes in exchange rates are recorded as unrealized foreign currency gains (losses) until the assets or liabilities are settled in cash, at which time they are recorded as realized foreign currency gains (losses).
3. Futures Contracts: The fund uses index futures contracts to a limited extent, with the objective of maintaining full exposure to the stock market while maintaining liquidity. The fund may purchase or sell futures contracts to achieve a desired level of investment, whether to accommodate portfolio turnover or cash flows from capital share transactions. The primary risks associated with the use of futures contracts are imperfect correlation between changes in market values of stocks held by the fund and the prices of futures contracts, and the possibility of an illiquid market. Counterparty risk involving futures is mitigated because a regulated clearinghouse is the counterparty instead of the clearing broker. To further mitigate counterparty risk, the fund trades futures contracts on an exchange, monitors the financial strength of its clearing brokers and clearinghouse, and has entered into clearing
24
Explorer Fund
agreements with its clearing brokers. The clearinghouse imposes initial margin requirements to secure the fund’s performance and requires daily settlement of variation margin representing changes in the market value of each contract.
Futures contracts are valued at their quoted daily settlement prices. The aggregate settlement values of the contracts are not recorded in the Statement of Net Assets. Fluctuations in the value of the contracts are recorded in the Statement of Net Assets as an asset (liability) and in the Statement of Operations as unrealized appreciation (depreciation) until the contracts are closed, when they are recorded as realized futures gains (losses).
During the six months ended April 30, 2016, the fund’s average investments in long and short futures contracts represented 1% and 0% of net assets, respectively, based on the average of aggregate settlement values at each quarter-end during the period.
4. Repurchase Agreements: The fund enters into repurchase agreements with institutional counterparties. Securities pledged as collateral to the fund under repurchase agreements are held by a custodian bank until the agreements mature. Each agreement requires that the market value of the collateral be sufficient to cover payments of interest and principal. The fund further mitigates its counterparty risk by entering into repurchase agreements only with a diverse group of prequalified counterparties, monitoring their financial strength, and entering into master repurchase agreements with its counterparties. The master repurchase agreements provide that, in the event of a counterparty’s default (including bankruptcy), the fund may terminate any repurchase agreements with that counterparty, determine the net amount owed, and sell or retain the collateral up to the net amount owed to the fund. Such action may be subject to legal proceedings, which may delay or limit the disposition of collateral.
5. Federal Income Taxes: The fund intends to continue to qualify as a regulated investment company and distribute all of its taxable income. Management has analyzed the fund’s tax positions taken for all open federal income tax years (October 31, 2012–2015), and for the period ended April 30, 2016, and has concluded that no provision for federal income tax is required in the fund’s financial statements.
6. Distributions: Distributions to shareholders are recorded on the ex-dividend date.
7. Securities Lending: To earn additional income, the fund lends its securities to qualified institutional borrowers. Security loans are subject to termination by the fund at any time, and are required to be secured at all times by collateral in an amount at least equal to the market value of securities loaned. Daily market fluctuations could cause the value of loaned securities to be more or less than the value of the collateral received. When this occurs, the collateral is adjusted and settled on the next business day. The fund further mitigates its counterparty risk by entering into securities lending transactions only with a diverse group of prequalified counterparties, monitoring their financial strength, and entering into master securities lending agreements with its counterparties. The master securities lending agreements provide that, in the event of a counterparty’s default (including bankruptcy), the fund may terminate any loans with that borrower, determine the net amount owed, and sell or retain the collateral up to the net amount owed to the fund; however, such actions may be subject to legal proceedings. While collateral mitigates counterparty risk, in the absence of a default the fund may experience delays and costs in recovering the securities loaned. The fund invests cash collateral received in Vanguard Market Liquidity Fund, and records a liability in the Statement of Net Assets for the return of the collateral, during the period the securities are on loan. Securities lending income represents fees charged to borrowers plus income earned on invested cash collateral, less expenses associated with the loan.
25
Explorer Fund
8. Credit Facility: The fund and certain other funds managed by The Vanguard Group (“Vanguard”) participate in a $3.1 billion committed credit facility provided by a syndicate of lenders pursuant to a credit agreement that may be renewed annually; each fund is individually liable for its borrowings, if any, under the credit facility. Borrowings may be utilized for temporary and emergency purposes, and are subject to the fund’s regulatory and contractual borrowing restrictions. The participating funds are charged administrative fees and an annual commitment fee of 0.10% of the undrawn amount of the facility; these fees are allocated to the funds based on a method approved by the fund’s board of trustees and included in Management and Administrative expenses on the fund’s Statement of Operations. Any borrowings under this facility bear interest at a rate based upon the higher of the one-month London Interbank Offered Rate, federal funds effective rate, or overnight bank funding rate plus an agreed-upon spread.
The fund had no borrowings outstanding at April 30, 2016, or at any time during the period then ended.
9. Other: Dividend income is recorded on the ex-dividend date. Interest income includes income distributions received from Vanguard Market Liquidity Fund and is accrued daily. Premiums and discounts on debt securities purchased are amortized and accreted, respectively, to interest income over the lives of the respective securities. Security transactions are accounted for on the date securities are bought or sold. Costs used to determine realized gains (losses) on the sale of investment securities are those of the specific securities sold.
Each class of shares has equal rights as to assets and earnings, except that each class separately bears certain class-specific expenses related to maintenance of shareholder accounts (included in Management and Administrative expenses) and shareholder reporting. Marketing and distribution expenses are allocated to each class of shares based on a method approved by the board of trustees. Income, other non-class-specific expenses, and gains and losses on investments are allocated to each class of shares based on its relative net assets.
B. The investment advisory firms Wellington Management Company LLP, Kalmar Investment Advisers, Granahan Investment Management, Inc., Arrowpoint Asset Management, LLC, Stephens Investment Management Group, LLC, and Chartwell Investment Partners, LLC, each provide investment advisory services to a portion of the fund for a fee calculated at an annual percentage rate of average net assets managed by the advisor. The basic fees of Wellington Management Company LLP and Kalmar Investment Advisers are subject to quarterly adjustments based on performance relative to the Russell 2500 Growth Index for the preceding three years. The basic fee of Granahan Investment Management, Inc., is subject to quarterly adjustments based on performance relative to the Russell 2500 Growth Index for periods prior to November 1, 2013, and the current benchmark, a 50/50 blend of the Russell 2500 Growth Index and the Russell 2000 Growth Index, beginning November 1, 2013, for the preceding three years. The current benchmark will be fully phased in by October 31, 2016. The basic fee of Arrowpoint Asset Management, LLC, is subject to quarterly adjustments based on performance relative to the Russell 2500 Growth Index since July 31, 2014. The basic fee of Stephens Investment Management Group, LLC, is subject to quarterly adjustments based on performance relative to the Russell 2500 Growth Index since October 31, 2013. The basic fee of Chartwell Investment Partners, LLC, is subject to quarterly adjustments based on performance relative to the Russell 2000 Growth Index for the preceding three years. Until January 2016, a portion of the
26
Explorer Fund
fund was managed by Century Capital Management, LLC. The basic fee paid to Century Capital Management, LLC, was subject to quarterly adjustments based on performance relative to a 50/50 blend of the Russell 2500 Index and the Russell 2500 Growth Index for the preceding three years.
Vanguard provides investment advisory services to a portion of the fund as described below; the fund paid Vanguard advisory fees of $490,000 for the six months ended April 30, 2016.
For the six months ended April 30, 2016, the aggregate investment advisory fee paid to all advisors represented an effective annual basic rate of 0.23% of the fund’s average net assets, before a net decrease of $824,000 (0.02%) based on performance.
C. In accordance with the terms of a Funds’ Service Agreement (the “FSA”) between Vanguard and the fund, Vanguard furnishes to the fund investment advisory, corporate management, administrative, marketing, and distribution services at Vanguard’s cost of operations (as defined by the FSA). These costs of operations are allocated to the fund based on methods and guidelines approved by the board of trustees. Vanguard does not require reimbursement in the current period for certain costs of operations (such as deferred compensation/benefits and risk/insurance costs); the fund’s liability for these costs of operations is included in Payables to Vanguard on the Statement of Net Assets.
Upon the request of Vanguard, the fund may invest up to 0.40% of its net assets as capital in Vanguard. At April 30, 2016, the fund had contributed to Vanguard capital in the amount of $911,000, representing 0.01% of the fund’s net assets and 0.36% of Vanguard’s capitalization. The fund’s trustees and officers are also directors and employees, respectively, of Vanguard.
D. The fund has asked its investment advisors to direct certain security trades, subject to obtaining the best price and execution, to brokers who have agreed to rebate to the fund part of the commissions generated. Such rebates are used solely to reduce the fund’s management and administrative expenses. For the six months ended April 30, 2016, these arrangements reduced the fund’s expenses by $97,000 (an annual rate of 0.00% of average net assets).
E. Various inputs may be used to determine the value of the fund’s investments. These inputs are summarized in three broad levels for financial statement purposes. The inputs or methodologies used to value securities are not necessarily an indication of the risk associated with investing in those securities.
Level 1—Quoted prices in active markets for identical securities.
Level 2—Other significant observable inputs (including quoted prices for similar securities, interest rates, prepayment speeds, credit risk, etc.).
Level 3—Significant unobservable inputs (including the fund’s own assumptions used to determine the fair value of investments).
27
Explorer Fund
The following table summarizes the market value of the fund’s investments as of April 30, 2016, based on the inputs used to value them:
| Level 1 | Level 2 | Level 3 | |
| Investments | ($000) | ($000) | ($000) |
| Common Stocks | 10,478,818 | 109,719 | 3,949 |
| Temporary Cash Investments | 463,836 | 58,788 | — |
| Futures Contracts—Liabilities1 | (787) | — | — |
| Total | 10,941,867 | 168,507 | 3,949 |
| 1 Represents variation margin on the last day of the reporting period. | |||
F. At April 30, 2016, the aggregate settlement value of open futures contracts and the related unrealized appreciation (depreciation) were:
| ($000) | ||||
| Aggregate | ||||
| Number of | Settlement | Unrealized | ||
| Long (Short) | Value | Appreciation | ||
| Futures Contracts | Expiration | Contracts | Long (Short) | (Depreciation) |
| E-mini S&P 500 Index | June 2016 | 485 | 49,933 | 379 |
| E-mini Russell 2000 Index | June 2016 | 395 | 44,540 | 1,855 |
| 2,234 |
Unrealized appreciation (depreciation) on open futures contracts is required to be treated as realized gain (loss) for tax purposes.
G. Distributions are determined on a tax basis and may differ from net investment income and realized capital gains for financial reporting purposes. Differences may be permanent or temporary. Permanent differences are reclassified among capital accounts in the financial statements to reflect their tax character. Temporary differences arise when certain items of income, expense, gain, or loss are recognized in different periods for financial statement and tax purposes. These differences will reverse at some time in the future. Differences in classification may also result from the treatment of short-term gains as ordinary income for tax purposes. The fund’s tax-basis capital gains and losses are determined only at the end of each fiscal year.
During the six months ended April 30, 2016, the fund realized net foreign currency losses of $26,000, which decreased distributable net income for tax purposes; accordingly, such losses have been reclassified from accumulated net realized gains to overdistributed net investment income.
At April 30, 2016, the cost of investment securities for tax purposes was $9,830,092,000. Net unrealized appreciation of investment securities for tax purposes was $1,285,018,000, consisting of unrealized gains of $1,981,077,000 on securities that had risen in value since their purchase and $696,059,000 in unrealized losses on securities that had fallen in value since their purchase.
H. During the six months ended April 30, 2016, the fund purchased $3,919,833,000 of investment securities and sold $4,292,201,000 of investment securities, other than temporary cash investments.
28
Explorer Fund
I. Capital share transactions for each class of shares were:
| Six Months Ended | Year Ended | |||
| April 30, 2016 | October 31, 2015 | |||
| Amount | Shares | Amount | Shares | |
| ($000) | (000) | ($000) | (000) | |
| Investor Shares | ||||
| Issued | 148,566 | 1,910 | 337,035 | 3,515 |
| Issued in Lieu of Cash Distributions | 354,130 | 4,350 | 596,496 | 6,570 |
| Redeemed | (444,919) | (5,519) | (1,098,985) | (11,335) |
| Net Increase (Decrease)—Investor Shares | 57,777 | 741 | (165,454) | (1,250) |
| Admiral Shares | ||||
| Issued | 577,255 | 7,778 | 1,450,900 | 16,121 |
| Issued in Lieu of Cash Distributions | 683,869 | 9,039 | 983,181 | 11,649 |
| Redeemed | (651,358) | (8,716) | (1,447,055) | (16,099) |
| Net Increase (Decrease)—Admiral Shares | 609,766 | 8,101 | 987,026 | 11,671 |
J. Certain of the fund’s investments are in companies that are considered to be affiliated companies of the fund because the fund owns more than 5% of the outstanding voting securities of the company or the issuer is another member of The Vanguard Group. Transactions during the period in securities of these companies were as follows:
| Current Period Transactions | ||||||
| Oct. 31, | Proceeds | April 30, | ||||
| 2015 | from | Capital Gain | 2016 | |||
| Market | Purchases | Securities | Distributions | Market | ||
| Value | at Cost | Sold1 | Income | Received | Value | |
| ($000) | ($000) | ($000) | ($000) | ($000) | ($000) | |
| Cardtronics Inc. | NA 2 | 10,760 | — | — | — | 95,788 |
| eHealth Inc. | 16,496 | — | — | — | — | 15,447 |
| H&E Equipment Services Inc. | 35,355 | 6,797 | 628 | 1,129 | — | 45,035 |
| Imprivata Inc. | 16,426 | 9,833 | — | — | — | 29,335 |
| Information Services Group Inc. | 7,315 | 346 | — | — | — | 8,583 |
| MarineMax Inc. | 21,376 | 1,454 | — | — | — | 27,408 |
| Vanguard Market Liquidity Fund | 413,253 | NA3 | NA 3 | 591 | — | 463,836 |
| Vanguard Small-Cap ETF | — | 316,920 | 291,708 | 1,075 | — | 23,024 |
| Vanguard Small-Cap Growth ETF | 57,108 | — | 9,442 | 272 | — | 46,391 |
| Total | 567,329 | 3,067 | — | 754,847 | ||
| 1 Includes net realized gain (loss) on affiliated investment securities sold of $2,372,000. | ||||||
| 2 Not applicable—at October 31, 2015, the issuer was not an affiliated company of the fund. | ||||||
| 3 Not applicable—purchases and sales are for temporary cash investment purposes. | ||||||
K. Management has determined that no material events or transactions occurred subsequent to April 30, 2016, that would require recognition or disclosure in these financial statements.
29
About Your Fund’s Expenses
As a shareholder of the fund, you incur ongoing costs, which include costs for portfolio management, administrative services, and shareholder reports (like this one), among others. Operating expenses, which are deducted from a fund’s gross income, directly reduce the investment return of the fund.
A fund’s expenses are expressed as a percentage of its average net assets. This figure is known as the expense ratio. The following examples are intended to help you understand the ongoing costs (in dollars) of investing in your fund and to compare these costs with those of other mutual funds. The examples are based on an investment of $1,000 made at the beginning of the period shown and held for the entire period.
The accompanying table illustrates your fund’s costs in two ways:
• Based on actual fund return. This section helps you to estimate the actual expenses that you paid over the period. The ”Ending Account Value“ shown is derived from the fund‘s actual return, and the third column shows the dollar amount that would have been paid by an investor who started with $1,000 in the fund. You may use the information here, together with the amount you invested, to estimate the expenses that you paid over the period.
To do so, simply divide your account value by $1,000 (for example, an $8,600 account value divided by $1,000 = 8.6), then multiply the result by the number given for your fund under the heading ”Expenses Paid During Period.“
• Based on hypothetical 5% yearly return. This section is intended to help you compare your fund‘s costs with those of other mutual funds. It assumes that the fund had a yearly return of 5% before expenses, but that the expense ratio is unchanged. In this case—because the return used is not the fund’s actual return—the results do not apply to your investment. The example is useful in making comparisons because the Securities and Exchange Commission requires all mutual funds to calculate expenses based on a 5% return. You can assess your fund’s costs by comparing this hypothetical example with the hypothetical examples that appear in shareholder reports of other funds.
Note that the expenses shown in the table are meant to highlight and help you compare ongoing costs only and do not reflect transaction costs incurred by the fund for buying and selling securities. Further, the expenses do not include any purchase, redemption, or account service fees described in the fund prospectus. If such fees were applied to your account, your costs would be higher. Your fund does not carry a “sales load.”
The calculations assume no shares were bought or sold during the period. Your actual costs may have been higher or lower, depending on the amount of your investment and the timing of any purchases or redemptions.
You can find more information about the fund’s expenses, including annual expense ratios, in the Financial Statements section of this report. For additional information on operating expenses and other shareholder costs, please refer to your fund’s current prospectus.
30
| Six Months Ended April 30, 2016 | |||
| Beginning | Ending | Expenses | |
| Account Value | Account Value | Paid During | |
| Explorer Fund | 10/31/2015 | 4/30/2016 | Period |
| Based on Actual Fund Return | |||
| Investor Shares | $1,000.00 | $984.42 | $2.32 |
| Admiral Shares | 1,000.00 | 984.95 | 1.68 |
| Based on Hypothetical 5% Yearly Return | |||
| Investor Shares | $1,000.00 | $1,022.53 | $2.36 |
| Admiral Shares | 1,000.00 | 1,023.17 | 1.71 |
The calculations are based on expenses incurred in the most recent six-month period. The fund’s annualized six-month expense ratios for that
period are 0.47% for Investor Shares and 0.34% for Admiral Shares. The dollar amounts shown as “Expenses Paid” are equal to the
annualized expense ratio multiplied by the average account value over the period, multiplied by the number of days in the most recent
six-month period, then divided by the number of days in the most recent 12-month period (182/366).
31
Trustees Approve Advisory Arrangements
The board of trustees of Vanguard Explorer Fund has renewed the fund’s investment advisory arrangements with Arrowpoint Asset Management, LLC (Arrowpoint Partners); Chartwell Investment Partners, LLC (Chartwell); Granahan Investment Management, Inc. (Granahan); Kalmar Investment Advisers (Kalmar); Stephens Investment Management Group, LLC (SIMG); Wellington Management Company LLP (Wellington Management); and The Vanguard Group, Inc. (Vanguard)—through its Quantitative Equity Group. The board determined that renewing the fund’s advisory arrangements was in the best interests of the fund and its shareholders. Please note that in December, the fund’s board of trustees modified its investment advisory arrangements. Century Capital Management no longer serves as an advisor to the fund.
The board based its decision upon an evaluation of each advisor’s investment staff, portfolio management process, and performance. The trustees considered the factors discussed below, among others. However, no single factor determined whether the board approved the arrangements. Rather, it was the totality of the circumstances that drove the board’s decision.
Nature, extent, and quality of services
The board reviewed the quality of the fund’s investment management services over both the short and long term and took into account the organizational depth and stability of each advisor. The board considered the following:
Arrowpoint Partners. Founded in 2007, Arrowpoint Partners offers a wide range of strategies, including equities, fixed income, and structured products, to institutional, high net-worth, and retail investors. Using in-depth, fundamental research, the investment team seeks to identify companies that it believes can control their own economic destiny. These are companies with strong competitive advantages in industries with high barriers to entry, large potential markets for their products, and high-quality business models focused on future growth. In evaluating companies and constructing the portfolio, Arrowpoint Partners places significant emphasis on understanding risk in the belief that avoiding large mistakes is the key to success in small-cap investing. Arrowpoint Partners has managed a portion of the fund since 2014.
Chartwell. Founded in 1997, Chartwell is a wholly owned subsidiary of TriState Capital Holdings, Inc. The firm has expertise in small- and mid-cap equity management and employs a fundamental bottom-up strategy, seeking companies with superior growth potential trading at reasonable valuations. Using fundamental research, the firm selects a portfolio of 70 to 90 stocks that it believes will generate accelerated earnings growth over the intermediate term while trading at attractive valuations, with exposure typically concentrated in higher-growth industries such as information technology, consumer discretionary, and health care. Chartwell employs a higher-turnover approach, often acting quickly on signs of deterioration in line with an investment thesis that avoiding large mistakes is essential in small-cap investing. Chartwell has managed a portion of the fund since 1997.
Granahan. Founded in 1985, Granahan specializes in small-cap growth equity investing. The firm uses fundamental research to select a portfolio of 150 to 170 stocks with sustainable growth characteristics. It seeks portfolio diversification through dedicated allocations to three categories of growth companies: core growth (40% to 70% of sub-portfolio assets), companies with strong market position and established profit growth; pioneers (15% to 30%), companies earlier in their life cycle with unique technology or innovations; and special situation (15% to 30%), companies with a catalyst for change that could lead to future growth. Granahan employs a multi-counselor approach, with four portfolio managers responsible for their areas of expertise across the broad sector areas of technology, health care, and consumer discretionary. Granahan has managed a portion of the fund since 1990.
32
Kalmar. Together with its parent company, Kalmar Investments Inc., founded in 1982, Kalmar specializes in small- and mid-cap growth equity investing. The firm believes that the equity market offers a high-reward and low-risk anomaly in the stocks of solid, well-managed, rapidly growing smaller companies. Through independent fundamental research, Kalmar attempts to discover such companies, buy them at undervalued levels, and own them for the longer term. Although a smaller, boutique firm, it has a deep analyst team in which overlapping sector coverage supports idea generation and debate. Kalmar has managed a portion of the fund since 2005.
SIMG. Founded in 2005, SIMG, a subsidiary of Stephens Investments Holdings LLC, is a privately held and family-owned company. It specializes in equity investment management focused on small-and mid-cap growth companies. SIMG employs a disciplined, bottom-up investment selection process that combines rigorous fundamental analysis with quantitative screening, seeking to identify companies that will exhibit potential for superior earnings growth. It invests in two distinctly different types of stocks: core growth and earnings catalyst. The characteristics it seeks for core growth stocks are consistent and predictable earnings growth that is generated by unique, defensible business models. For earnings catalyst stocks, it looks for inflection points such as large earnings surprises or positive revisions to earnings estimates or guidance. SIMG generally requires all stocks to be profitable or on the cusp of profitability and exhibiting at least 12% earnings growth. It has managed a portion of the fund since 2013.
Wellington Management. Founded in 1928, Wellington Management is among the nation’s oldest and most respected institutional investment managers. Using a bottom-up, fundamentally driven approach, it invests opportunistically in a diversified portfolio of high-quality stocks. The firm attempts to identify companies with key success factors such as top market share, substantial insider ownership, and fully funded business plans. The investment team has the support of Wellington Management’s global industry analysts in conducting its research intensive approach. Wellington Management has advised the fund since 1967.
Vanguard. Vanguard has been managing investments for more than three decades. The Quantitative Equity Group adheres to a sound, disciplined investment management process; the team has considerable experience, stability, and depth. Vanguard has managed a portion of the fund since 1997.
The board concluded that each advisor’s experience, stability, depth, and performance, among other factors, warranted continuation of the advisory arrangements.
Investment performance
The board considered the short- and long-term performance of the fund and each advisor, including any periods of outperformance or underperformance relative to a benchmark index and peer group. The board concluded that the performance was such that each advisory arrangement should continue. Information about the fund’s most recent performance can be found in the Performance Summary section of this report.
Cost
The board concluded that the fund’s expense ratio was well below the average expense ratio charged by funds in its peer group and that the fund’s advisory fee rate was also well below the peer-group average. Information about the fund’s expenses appears in the About Your Fund’s Expenses section of this report as well as in the Financial Statements section, which also includes information about the fund’s advisory fee rate.
33
The board did not consider profitability of Arrowpoint Partners, Chartwell, Granahan, Kalmar, SIMG, or Wellington Management in determining whether to approve the advisory fees because the firms are independent of Vanguard and the advisory fees are the result of arm’s-length negotiations. The board does not conduct a profitability analysis of Vanguard because of Vanguard’s unique “at-cost” structure. Unlike most other mutual fund management companies, Vanguard is owned by the funds it oversees and produces “profits” only in the form of reduced expenses for fund shareholders.
The benefit of economies of scale
The board concluded that the fund’s shareholders benefit from economies of scale because of breakpoints in the advisory fee schedules for Arrowpoint Partners, Chartwell, Granahan, Kalmar, SIMG, and Wellington Management. The breakpoints reduce the effective rate of the fees as the fund’s assets managed by each advisor increase.
The board also concluded that the fund’s at-cost arrangement with Vanguard ensures that the fund will realize economies of scale as it grows, with the cost to shareholders declining as the fund’s assets managed by Vanguard increase.
The board will consider whether to renew the advisory arrangements again after a one-year period.
34
Glossary
30-Day SEC Yield. A fund’s 30-day SEC yield is derived using a formula specified by the U.S. Securities and Exchange Commission. Under the formula, data related to the fund’s security holdings in the previous 30 days are used to calculate the fund’s hypothetical net income for that period, which is then annualized and divided by the fund’s estimated average net assets over the calculation period. For the purposes of this calculation, a security’s income is based on its current market yield to maturity (for bonds), its actual income (for asset-backed securities), or its projected dividend yield (for stocks). Because the SEC yield represents hypothetical annualized income, it will differ—at times significantly—from the fund’s actual experience. As a result, the fund’s income distributions may be higher or lower than implied by the SEC yield.
Beta. A measure of the magnitude of a fund’s past share-price fluctuations in relation to the ups and downs of a given market index. The index is assigned a beta of 1.00. Compared with a given index, a fund with a beta of 1.20 typically would have seen its share price rise or fall by 12% when the index rose or fell by 10%. For this report, beta is based on returns over the past 36 months for both the fund and the index. Note that a fund’s beta should be reviewed in conjunction with its R-squared (see definition). The lower the R-squared, the less correlation there is between the fund and the index, and the less reliable beta is as an indicator of volatility.
Dividend Yield. Dividend income earned by stocks, expressed as a percentage of the aggregate market value (or of net asset value, for a fund). The yield is determined by dividing the amount of the annual dividends by the aggregate value (or net asset value) at the end of the period. For a fund, the dividend yield is based solely on stock holdings and does not include any income produced by other investments.
Earnings Growth Rate. The average annual rate of growth in earnings over the past five years for the stocks now in a fund.
Equity Exposure. A measure that reflects a fund’s investments in stocks and stock futures. Any holdings in short-term reserves are excluded.
Expense Ratio. A fund’s total annual operating expenses expressed as a percentage of the fund’s average net assets. The expense ratio includes management and administrative expenses, but does not include the transaction costs of buying and selling portfolio securities.
Foreign Holdings. The percentage of a fund represented by securities or depositary receipts of companies based outside the United States.
Inception Date. The date on which the assets of a fund (or one of its share classes) are first invested in accordance with the fund’s investment objective. For funds with a subscription period, the inception date is the day after that period ends. Investment performance is measured from the inception date.
Median Market Cap. An indicator of the size of companies in which a fund invests; the midpoint of market capitalization (market price x shares outstanding) of a fund’s stocks, weighted by the proportion of the fund’s assets invested in each stock. Stocks representing half of the fund’s assets have market capitalizations above the median, and the rest are below it.
Price/Book Ratio. The share price of a stock divided by its net worth, or book value, per share. For a fund, the weighted average price/book ratio of the stocks it holds.
35
Price/Earnings Ratio. The ratio of a stock’s current price to its per-share earnings over the past year. For a fund, the weighted average P/E of the stocks it holds. P/E is an indicator of market expectations about corporate prospects; the higher the P/E, the greater the expectations for a company’s future growth.
R-Squared. A measure of how much of a fund’s past returns can be explained by the returns from the market in general, as measured by a given index. If a fund’s total returns were precisely synchronized with an index’s returns, its R-squared would be 1.00. If the fund’s returns bore no relationship to the index’s returns, its R-squared would be 0. For this report, R-squared is based on returns over the past 36 months for both the fund and the index.
Return on Equity. The annual average rate of return generated by a company during the past five years for each dollar of shareholder’s equity (net income divided by shareholder’s equity). For a fund, the weighted average return on equity for the companies whose stocks it holds.
Short-Term Reserves. The percentage of a fund invested in highly liquid, short-term securities that can be readily converted to cash.
Turnover Rate. An indication of the fund’s trading activity. Funds with high turnover rates incur higher transaction costs and may be more likely to distribute capital gains (which may be taxable to investors). The turnover rate excludes in-kind transactions, which have minimal impact on costs.
36
This page intentionally left blank.
This page intentionally left blank.
This page intentionally left blank.
The People Who Govern Your Fund
The trustees of your mutual fund are there to see that the fund is operated and managed in your best interests since, as a shareholder, you are a part owner of the fund. Your fund’s trustees also serve on the board of directors of The Vanguard Group, Inc., which is owned by the Vanguard funds and provides services to them on an at-cost basis.
A majority of Vanguard’s board members are independent, meaning that they have no affiliation with Vanguard or the funds they oversee, apart from the sizable personal investments they have made as private individuals. The independent board members have distinguished backgrounds in business, academia, and public service. Each of the trustees and executive officers oversees 198 Vanguard funds.
The following table provides information for each trustee and executive officer of the fund. More information about the trustees is in the Statement of Additional Information, which can be obtained, without charge, by contacting Vanguard at 800-662-7447, or online at vanguard.com.
| InterestedTrustee1 | Rajiv L. Gupta |
| Born 1945. Trustee Since December 2001.2 Principal | |
| F. William McNabb III | Occupation(s) During the Past Five Years and Other |
| Born 1957. Trustee Since July 2009. Chairman of | Experience: Chairman and Chief Executive Officer |
| the Board. Principal Occupation(s) During the Past | (retired 2009) and President (2006–2008) of |
| Five Years and Other Experience: Chairman of the | Rohm and Haas Co. (chemicals); Director of Tyco |
| Board of The Vanguard Group, Inc., and of each of | International plc (diversified manufacturing and |
| the investment companies served by The Vanguard | services), HP Inc. (printer and personal computer |
| Group, since January 2010; Director of The Vanguard | manufacturing), and Delphi Automotive plc |
| Group since 2008; Chief Executive Officer and | (automotive components); Senior Advisor at |
| President of The Vanguard Group, and of each of | New Mountain Capital. |
| the investment companies served by The Vanguard | |
| Group, since 2008; Director of Vanguard Marketing | Amy Gutmann |
| Corporation; Managing Director of The Vanguard | Born 1949. Trustee Since June 2006. Principal |
| Group (1995–2008). | Occupation(s) During the Past Five Years and |
| Other Experience: President of the University of | |
| IndependentTrustees | Pennsylvania; Christopher H. Browne Distinguished |
| Professor of Political Science, School of Arts and | |
| Emerson U. Fullwood | Sciences, and Professor of Communication, Annenberg |
| Born 1948. Trustee Since January 2008. Principal | School for Communication, with secondary faculty |
| Occupation(s) During the Past Five Years and Other | appointments in the Department of Philosophy, School |
| Experience: Executive Chief Staff and Marketing | of Arts and Sciences, and at the Graduate School of |
| Officer for North America and Corporate Vice President | Education, University of Pennsylvania; Trustee of the |
| (retired 2008) of Xerox Corporation (document manage- | National Constitution Center; Chair of the Presidential |
| ment products and services); Executive in Residence | Commission for the Study of Bioethical Issues. |
| and 2009–2010 Distinguished Minett Professor at | |
| the Rochester Institute of Technology; Lead Director | JoAnn Heffernan Heisen |
| of SPX FLOW, Inc. (multi-industry manufacturing); | Born 1950. Trustee Since July 1998. Principal |
| Director of the United Way of Rochester, the University | Occupation(s) During the Past Five Years and |
| of Rochester Medical Center, Monroe Community | Other Experience: Corporate Vice President and |
| College Foundation, North Carolina A&T University, | Chief Global Diversity Officer (retired 2008) and |
| and Roberts Wesleyan College. | Member of the Executive Committee (1997–2008) |
| of Johnson & Johnson (pharmaceuticals/medical | |
| devices/consumer products); Director of Skytop | |
| Lodge Corporation (hotels) and the Robert Wood | |
| Johnson Foundation; Member of the Advisory | |
| Board of the Institute for Women’s Leadership | |
| at Rutgers University. |
| F. Joseph Loughrey | Executive Officers | |
| Born 1949. Trustee Since October 2009. Principal | ||
| Occupation(s) During the Past Five Years and Other | Glenn Booraem | |
| Experience: President and Chief Operating Officer | Born 1967. Treasurer Since May 2015. Principal | |
| (retired 2009) of Cummins Inc. (industrial machinery); | Occupation(s) During the Past Five Years and | |
| Chairman of the Board of Hillenbrand, Inc. (specialized | Other Experience: Principal of The Vanguard Group, | |
| consumer services), and of Oxfam America; Director | Inc.; Treasurer of each of the investment companies | |
| of SKF AB (industrial machinery), Hyster-Yale Materials | served by The Vanguard Group; Controller of each of | |
| Handling, Inc. (forklift trucks), the Lumina Foundation | the investment companies served by The Vanguard | |
| for Education, and the V Foundation for Cancer | Group (2010–2015); Assistant Controller of each of | |
| Research; Member of the Advisory Council for the | the investment companies served by The Vanguard | |
| College of Arts and Letters and of the Advisory Board | Group (2001–2010). | |
| to the Kellogg Institute for International Studies, both | ||
| at the University of Notre Dame. | Thomas J. Higgins | |
| Born 1957. Chief Financial Officer Since September | ||
| Mark Loughridge | 2008. Principal Occupation(s) During the Past Five | |
| Born 1953. Trustee Since March 2012. Principal | Years and Other Experience: Principal of The Vanguard | |
| Occupation(s) During the Past Five Years and Other | Group, Inc.; Chief Financial Officer of each of the | |
| Experience: Senior Vice President and Chief Financial | investment companies served by The Vanguard Group; | |
| Officer (retired 2013) at IBM (information technology | Treasurer of each of the investment companies served | |
| services); Fiduciary Member of IBM’s Retirement Plan | by The Vanguard Group (1998–2008). | |
| Committee (2004–2013); Director of the Dow Chemical | ||
| Company; Member of the Council on Chicago Booth. | Peter Mahoney | |
| Born 1974. Controller Since May 2015. Principal | ||
| Scott C. Malpass | Occupation(s) During the Past Five Years and | |
| Born 1962. Trustee Since March 2012. Principal | Other Experience: Head of Global Fund Accounting | |
| Occupation(s) During the Past Five Years and Other | at The Vanguard Group, Inc.; Controller of each of the | |
| Experience: Chief Investment Officer and Vice | investment companies served by The Vanguard Group; | |
| President at the University of Notre Dame; Assistant | Head of International Fund Services at The Vanguard | |
| Professor of Finance at the Mendoza College of | Group (2008–2014). | |
| Business at Notre Dame; Member of the Notre Dame | ||
| 403(b) Investment Committee, the Board of Advisors | Heidi Stam | |
| for Spruceview Capital Partners, and the Investment | Born 1956. Secretary Since July 2005. Principal | |
| Advisory Committee of Major League Baseball; Board | Occupation(s) During the Past Five Years and Other | |
| Member of TIFF Advisory Services, Inc., and Catholic | Experience: Managing Director of The Vanguard | |
| Investment Services, Inc. (investment advisors). | Group, Inc.; General Counsel of The Vanguard Group; | |
| Secretary of The Vanguard Group and of each of the | ||
| André F. Perold | investment companies served by The Vanguard Group; | |
| Born 1952. Trustee Since December 2004. Principal | Director and Senior Vice President of Vanguard | |
| Occupation(s) During the Past Five Years and Other | Marketing Corporation. | |
| Experience: George Gund Professor of Finance and | ||
| Banking, Emeritus at the Harvard Business School | Vanguard Senior ManagementTeam | |
| (retired 2011); Chief Investment Officer and Managing | Mortimer J. Buckley | James M. Norris |
| Partner of HighVista Strategies LLC (private investment | Kathleen C. Gubanich | Thomas M. Rampulla |
| firm); Director of Rand Merchant Bank; Overseer of | Martha G. King | Glenn W. Reed |
| the Museum of Fine Arts Boston. | John T. Marcante | Karin A. Risi |
| Chris D. McIsaac | ||
| Peter F. Volanakis | ||
| Born 1955. Trustee Since July 2009. Principal | ||
| Occupation(s) During the Past Five Years and Other | Chairman Emeritus and Senior Advisor | |
| Experience: President and Chief Operating Officer | ||
| (retired 2010) of Corning Incorporated (communications | John J. Brennan | |
| equipment); Trustee of Colby-Sawyer College and | Chairman, 1996–2009 | |
| Chairman of its Finance and Enrollment Committee; | Chief Executive Officer and President, 1996–2008 | |
| Member of the Advisory Board of the Norris Cotton | ||
| Cancer Center. | Founder | |
| John C. Bogle | ||
| Chairman and Chief Executive Officer, 1974–1996 | ||
1 Mr. McNabb is considered an “interested person,” as defined in the Investment Company Act of 1940, because he is an officer of the Vanguard funds.
2 December 2002 for Vanguard Equity Income Fund, the Vanguard Municipal Bond Funds, and the Vanguard State Tax-Exempt Funds.
 | ||
| P.O. Box 2600 | ||
| Valley Forge, PA 19482-2600 | ||
| Connect with Vanguard® > vanguard.com | ||
| Fund Information > 800-662-7447 | CFA® is a registered trademark owned by CFA Institute. | |
| Direct Investor Account Services > 800-662-2739 | ||
| Institutional Investor Services > 800-523-1036 | ||
| Text Telephone for People | ||
| Who Are Deaf or Hard of Hearing> 800-749-7273 | ||
| This material may be used in conjunction | ||
| with the offering of shares of any Vanguard | ||
| fund only if preceded or accompanied by | ||
| the fund’s current prospectus. | ||
| All comparative mutual fund data are from Lipper, a | ||
| Thomson Reuters Company, or Morningstar, Inc., unless | ||
| otherwise noted. | ||
| You can obtain a free copy of Vanguard’s proxy voting | ||
| guidelines by visiting vanguard.com/proxyreporting or by | ||
| calling Vanguard at 800-662-2739. The guidelines are | ||
| also available from the SEC’s website, sec.gov. In | ||
| addition, you may obtain a free report on how your fund | ||
| voted the proxies for securities it owned during the 12 | ||
| months ended June 30. To get the report, visit either | ||
| vanguard.com/proxyreporting or sec.gov. | ||
| You can review and copy information about your fund at | ||
| the SEC’s Public Reference Room in Washington, D.C. To | ||
| find out more about this public service, call the SEC at | ||
| 202-551-8090. Information about your fund is also | ||
| available on the SEC’s website, and you can receive | ||
| copies of this information, for a fee, by sending a | ||
| request in either of two ways: via email addressed to | ||
| publicinfo@sec.gov or via regular mail addressed to the | ||
| Public Reference Section, Securities and Exchange | ||
| Commission, Washington, DC 20549-1520. | ||
| © 2016 The Vanguard Group, Inc. | ||
| All rights reserved. | ||
| Vanguard Marketing Corporation, Distributor. | ||
| Q242 062016 | ||
Item 2: Code of Ethics.
Not Applicable.
Item 3: Audit Committee Financial Expert.
Not Applicable.
Item 4: Principal Accountant Fees and Services.
(a) Audit Fees.
Not Applicable.
Item 5: Audit Committee of Listed Registrants.
Not Applicable.
Item 6: Investments.
Vanguard® ExplorerTM Fund
Schedule of Investments
April 30, 2016
| Market | |||
| Value | |||
| Shares | ($000) | ||
| Common Stocks (97.7%)1 | |||
| Consumer Discretionary (17.3%) | |||
| DSW Inc. Class A | 2,857,660 | 70,213 | |
| * | DreamWorks Animation SKG Inc. Class A | 1,228,830 | 49,055 |
| * | Ulta Salon Cosmetics & Fragrance Inc. | 227,665 | 47,418 |
| Bloomin' Brands Inc. | 2,462,400 | 46,047 | |
| * | Tenneco Inc. | 821,400 | 43,781 |
| * | LKQ Corp. | 1,327,540 | 42,548 |
| *,^ | 2U Inc. | 1,473,292 | 41,296 |
| National CineMedia Inc. | 2,888,656 | 41,019 | |
| * | Tumi Holdings Inc. | 1,508,145 | 40,237 |
| * | Grand Canyon Education Inc. | 895,249 | 39,149 |
| * | Michaels Cos. Inc. | 1,355,095 | 38,525 |
| New York Times Co. Class A | 2,932,126 | 37,590 | |
| * | IMAX Corp. | 1,169,699 | 37,430 |
| Cheesecake Factory Inc. | 733,448 | 37,413 | |
| La-Z-Boy Inc. | 1,401,200 | 36,249 | |
| Cinemark Holdings Inc. | 1,031,600 | 35,745 | |
| ^ | MDC Partners Inc. Class A | 1,713,387 | 34,679 |
| HSN Inc. | 651,480 | 34,548 | |
| Lennar Corp. Class A | 758,685 | 34,376 | |
| Brunswick Corp. | 708,239 | 34,017 | |
| *,^ | lululemon athletica Inc. | 508,309 | 33,320 |
| Chico's FAS Inc. | 2,592,800 | 32,695 | |
| * | Kate Spade & Co. | 1,240,040 | 31,906 |
| * | ServiceMaster Global Holdings Inc. | 818,625 | 31,370 |
| * | Sally Beauty Holdings Inc. | 988,729 | 31,046 |
| Tractor Supply Co. | 326,525 | 30,909 | |
| Texas Roadhouse Inc. Class A | 748,195 | 30,466 | |
| *,2 | MarineMax Inc. | 1,441,763 | 27,408 |
| * | CarMax Inc. | 509,150 | 26,959 |
| Oxford Industries Inc. | 383,930 | 25,501 | |
| Service Corp. International | 944,610 | 25,193 | |
| Papa John's International Inc. | 419,100 | 23,717 | |
| Wolverine World Wide Inc. | 1,249,898 | 23,686 | |
| * | Live Nation Entertainment Inc. | 1,088,745 | 23,386 |
| Sonic Corp. | 668,071 | 22,962 | |
| Carter's Inc. | 215,146 | 22,950 | |
| Dunkin' Brands Group Inc. | 484,204 | 22,515 | |
| * | Buffalo Wild Wings Inc. | 162,710 | 21,748 |
| * | Shutterfly Inc. | 472,590 | 21,730 |
| * | G-III Apparel Group Ltd. | 470,995 | 21,312 |
| * | Burlington Stores Inc. | 369,425 | 21,046 |
| * | Bright Horizons Family Solutions Inc. | 320,075 | 21,003 |
| *,^ | Hibbett Sports Inc. | 561,672 | 20,276 |
| * | Urban Outfitters Inc. | 667,585 | 20,241 |
| * | Boyd Gaming Corp. | 1,059,138 | 19,742 |
| Hanesbrands Inc. | 651,795 | 18,922 | |
| Ross Stores Inc. | 282,900 | 16,063 | |
| * | Express Inc. | 846,679 | 15,393 |
| Polaris Industries Inc. | 135,885 | 13,300 | |
| * | Five Below Inc. | 287,655 | 11,995 |
| *,^ | Mattress Firm Holding Corp. | 302,245 | 11,794 |
| * | JC Penney Co. Inc. | 1,131,123 | 10,497 |
| * | Netflix Inc. | 113,100 | 10,182 |
| * | Gentherm Inc. | 269,810 | 9,913 |
| * | Chuy's Holdings Inc. | 318,367 | 9,723 |
| * | Krispy Kreme Doughnuts Inc. | 555,117 | 9,665 |
| Leggett & Platt Inc. | 194,500 | 9,587 | |
| Callaway Golf Co. | 1,016,771 | 9,497 | |
| Expedia Inc. | 76,295 | 8,833 | |
| Aaron's Inc. | 332,900 | 8,725 | |
| Monro Muffler Brake Inc. | 117,501 | 8,133 | |
1
Vanguard® Explorer Fund
Schedule of Investments
April 30, 2016
| Market | |||
| Value | |||
| Shares | ($000) | ||
| * | O'Reilly Automotive Inc. | 29,000 | 7,618 |
| * | Popeyes Louisiana Kitchen Inc. | 139,544 | 7,502 |
| Foot Locker Inc. | 115,200 | 7,078 | |
| American Eagle Outfitters Inc. | 449,000 | 6,425 | |
| Lithia Motors Inc. Class A | 77,000 | 6,392 | |
| Nexstar Broadcasting Group Inc. Class A | 123,000 | 6,314 | |
| * | American Axle & Manufacturing Holdings Inc. | 403,300 | 6,255 |
| * | Dave & Buster's Entertainment Inc. | 157,200 | 6,084 |
| Harman International Industries Inc. | 79,100 | 6,072 | |
| * | Smith & Wesson Holding Corp. | 273,000 | 5,960 |
| * | Potbelly Corp. | 415,600 | 5,922 |
| * | Steven Madden Ltd. | 168,171 | 5,888 |
| ClubCorp Holdings Inc. | 438,000 | 5,847 | |
| *,^ | Kona Grill Inc. | 432,358 | 5,759 |
| ^ | Outerwall Inc. | 133,621 | 5,520 |
| * | MSG Networks Inc. | 315,900 | 5,399 |
| PetMed Express Inc. | 290,200 | 5,311 | |
| * | Carrols Restaurant Group Inc. | 372,900 | 5,187 |
| * | Isle of Capri Casinos Inc. | 339,500 | 5,058 |
| Ruth's Hospitality Group Inc. | 317,400 | 5,040 | |
| Big Lots Inc. | 107,500 | 4,930 | |
| Sturm Ruger & Co. Inc. | 75,800 | 4,853 | |
| * | NVR Inc. | 2,890 | 4,801 |
| Cato Corp. Class A | 130,800 | 4,786 | |
| Vail Resorts Inc. | 36,000 | 4,667 | |
| DR Horton Inc. | 138,200 | 4,154 | |
| * | Strayer Education Inc. | 83,100 | 4,125 |
| * | Madison Square Garden Co. Class A | 24,900 | 3,909 |
| Libbey Inc. | 208,100 | 3,871 | |
| * | Asbury Automotive Group Inc. | 62,300 | 3,777 |
| Interpublic Group of Cos. Inc. | 145,300 | 3,333 | |
| Domino's Pizza Inc. | 27,400 | 3,312 | |
| *,^ | Diamond Resorts International Inc. | 146,700 | 3,111 |
| * | ZAGG Inc. | 383,450 | 3,071 |
| * | Red Robin Gourmet Burgers Inc. | 46,036 | 2,986 |
| Cooper Tire & Rubber Co. | 78,800 | 2,722 | |
| ^ | World Wrestling Entertainment Inc. Class A | 160,200 | 2,666 |
| GNC Holdings Inc. Class A | 109,000 | 2,655 | |
| * | MCBC Holdings Inc. | 193,026 | 2,590 |
| Bob Evans Farms Inc. | 56,400 | 2,568 | |
| Jack in the Box Inc. | 37,900 | 2,560 | |
| *,^ | JAKKS Pacific Inc. | 331,483 | 2,486 |
| Children's Place Inc. | 31,300 | 2,439 | |
| * | Penn National Gaming Inc. | 149,700 | 2,415 |
| Cracker Barrel Old Country Store Inc. | 14,000 | 2,050 | |
| Visteon Corp. | 25,500 | 2,032 | |
| * | Tile Shop Holdings Inc. | 111,500 | 1,989 |
| * | Helen of Troy Ltd. | 19,800 | 1,971 |
| * | Denny's Corp. | 196,300 | 1,941 |
| Tupperware Brands Corp. | 33,100 | 1,922 | |
| AMC Entertainment Holdings Inc. | 64,400 | 1,815 | |
| Brinker International Inc. | 38,399 | 1,779 | |
| * | Cooper-Standard Holding Inc. | 22,800 | 1,758 |
| Hooker Furniture Corp. | 63,300 | 1,570 | |
| ^ | Regal Entertainment Group Class A | 75,200 | 1,568 |
| * | Dorman Products Inc. | 28,014 | 1,507 |
| Sinclair Broadcast Group Inc. Class A | 46,300 | 1,485 | |
| Bassett Furniture Industries Inc. | 41,700 | 1,230 | |
| Caleres Inc. | 42,700 | 1,076 | |
| * | BJ's Restaurants Inc. | 23,300 | 1,039 |
| *,^ | Hemisphere Media Group Inc. Class A | 85,560 | 1,023 |
| Culp Inc. | 34,100 | 895 | |
| Six Flags Entertainment Corp. | 12,600 | 757 | |
| Tower International Inc. | 27,900 | 640 |
2
Vanguard® Explorer Fund
Schedule of Investments
April 30, 2016
| Market | |||
| Value | |||
| Shares | ($000) | ||
| * | Francesca's Holdings Corp. | 35,100 | 583 |
| * | Pinnacle Entertainment Inc. | 33,200 | 366 |
| * | Red Rock Resorts Inc. Class A | 12,000 | 224 |
| 1,871,282 | |||
| Consumer Staples (2.2%) | |||
| Greencore Group plc | 7,786,354 | 41,090 | |
| * | TreeHouse Foods Inc. | 457,140 | 40,411 |
| ^ | Sanderson Farms Inc. | 439,800 | 40,347 |
| * | Post Holdings Inc. | 383,700 | 27,565 |
| * | Performance Food Group Co. | 927,535 | 24,005 |
| * | Monster Beverage Corp. | 104,300 | 15,042 |
| * | Smart & Final Stores Inc. | 487,745 | 7,765 |
| * | WhiteWave Foods Co. Class A | 161,600 | 6,498 |
| Casey's General Stores Inc. | 54,200 | 6,070 | |
| Dean Foods Co. | 345,100 | 5,946 | |
| * | Boston Beer Co. Inc. Class A | 32,223 | 5,029 |
| Ingredion Inc. | 41,300 | 4,753 | |
| * | Herbalife Ltd. | 76,000 | 4,404 |
| ^ | Cal-Maine Foods Inc. | 83,900 | 4,259 |
| Ingles Markets Inc. Class A | 67,700 | 2,442 | |
| ^ | Natural Health Trends Corp. | 53,900 | 1,951 |
| *,^ | Blue Buffalo Pet Products Inc. | 74,800 | 1,852 |
| * | USANA Health Sciences Inc. | 15,000 | 1,777 |
| *,^ | Pilgrim's Pride Corp. | 47,586 | 1,281 |
| * | Sprouts Farmers Market Inc. | 45,500 | 1,277 |
| * | Amplify Snack Brands Inc. | 44,500 | 686 |
| 244,450 | |||
| Energy (3.4%) | |||
| ^ | Core Laboratories NV | 298,585 | 39,909 |
| Patterson-UTI Energy Inc. | 1,809,150 | 35,731 | |
| Western Refining Inc. | 1,241,900 | 33,233 | |
| ^ | Veresen Inc. | 3,600,000 | 26,052 |
| Ensco plc Class A | 2,085,600 | 24,944 | |
| Energen Corp. | 565,660 | 24,035 | |
| * | PDC Energy Inc. | 281,700 | 17,688 |
| * | Diamondback Energy Inc. | 196,310 | 16,997 |
| Superior Energy Services Inc. | 951,563 | 16,043 | |
| Cabot Oil & Gas Corp. | 616,940 | 14,436 | |
| * | Matador Resources Co. | 588,020 | 12,672 |
| ^ | RPC Inc. | 754,550 | 11,409 |
| * | Rice Energy Inc. | 635,300 | 10,997 |
| * | Gulfport Energy Corp. | 330,975 | 10,359 |
| * | RigNet Inc. | 532,916 | 9,113 |
| * | Dril-Quip Inc. | 140,281 | 9,093 |
| * | Forum Energy Technologies Inc. | 503,000 | 8,420 |
| Oceaneering International Inc. | 214,900 | 7,876 | |
| Range Resources Corp. | 176,300 | 7,777 | |
| Baker Hughes Inc. | 153,300 | 7,414 | |
| * | Carrizo Oil & Gas Inc. | 208,900 | 7,389 |
| * | Southwestern Energy Co. | 447,890 | 6,015 |
| ^ | US Silica Holdings Inc. | 225,252 | 5,755 |
| ^ | Atwood Oceanics Inc. | 302,725 | 2,924 |
| Teekay Corp. | 198,800 | 2,227 | |
| * | Par Pacific Holdings Inc. | 88,747 | 1,696 |
| CVR Energy Inc. | 45,800 | 1,112 | |
| 371,316 | |||
| Financials (10.0%) | |||
| * | MGIC Investment Corp. | 9,614,898 | 69,516 |
| Nasdaq Inc. | 1,082,367 | 66,793 | |
| MarketAxess Holdings Inc. | 472,550 | 58,010 | |
| * | Affiliated Managers Group Inc. | 265,176 | 45,165 |
| Assured Guaranty Ltd. | 1,716,440 | 44,404 | |
| Assurant Inc. | 517,436 | 43,760 | |
3
Vanguard® Explorer Fund
Schedule of Investments
April 30, 2016
| Market | |||
| Value | |||
| Shares | ($000) | ||
| Zions Bancorporation | 1,378,500 | 37,936 | |
| Financial Engines Inc. | 1,170,312 | 37,696 | |
| * | Western Alliance Bancorp | 986,810 | 36,098 |
| Redwood Trust Inc. | 2,594,020 | 33,618 | |
| MFA Financial Inc. | 4,857,005 | 33,562 | |
| * | First BanCorp | 8,014,389 | 31,256 |
| *,^ | LendingTree Inc. | 334,937 | 29,967 |
| Investment Technology Group Inc. | 1,500,000 | 29,280 | |
| Douglas Emmett Inc. | 894,500 | 29,027 | |
| First American Financial Corp. | 734,380 | 26,452 | |
| ^ | WisdomTree Investments Inc. | 2,423,221 | 26,389 |
| Solar Capital Ltd. | 1,397,895 | 24,645 | |
| *,^ | Encore Capital Group Inc. | 778,851 | 21,925 |
| ^ | LPL Financial Holdings Inc. | 729,635 | 19,262 |
| PrivateBancorp Inc. | 375,511 | 15,625 | |
| *,2 | eHealth Inc. | 1,380,405 | 15,447 |
| * | SVB Financial Group | 143,500 | 14,964 |
| FactSet Research Systems Inc. | 98,650 | 14,871 | |
| Opus Bank | 405,059 | 14,631 | |
| STAG Industrial Inc. | 720,900 | 14,389 | |
| Evercore Partners Inc. Class A | 265,180 | 13,694 | |
| * | MGM Growth Properties LLC Class A | 522,215 | 11,525 |
| National Storage Affiliates Trust | 548,362 | 10,704 | |
| MSCI Inc. Class A | 134,900 | 10,244 | |
| QTS Realty Trust Inc. Class A | 207,046 | 10,025 | |
| * | Customers Bancorp Inc. | 376,607 | 9,784 |
| LaSalle Hotel Properties | 390,200 | 9,326 | |
| * | Hilltop Holdings Inc. | 439,300 | 8,724 |
| Lamar Advertising Co. Class A | 139,100 | 8,630 | |
| Wintrust Financial Corp. | 165,255 | 8,597 | |
| Lazard Ltd. Class A | 217,100 | 7,826 | |
| Gaming and Leisure Properties Inc. | 234,620 | 7,693 | |
| Bank of the Ozarks Inc. | 179,432 | 7,411 | |
| Ryman Hospitality Properties Inc. | 130,300 | 6,714 | |
| CoreSite Realty Corp. | 86,200 | 6,459 | |
| * | PRA Group Inc. | 193,395 | 6,417 |
| State Bank Financial Corp. | 301,954 | 6,305 | |
| * | Cowen Group Inc. Class A | 1,793,478 | 6,250 |
| BGC Partners Inc. Class A | 674,200 | 6,122 | |
| DuPont Fabros Technology Inc. | 150,800 | 6,005 | |
| * | Texas Capital Bancshares Inc. | 129,000 | 5,911 |
| RLJ Lodging Trust | 278,800 | 5,874 | |
| * | Pacific Premier Bancorp Inc. | 224,201 | 5,215 |
| * | Walker & Dunlop Inc. | 229,500 | 5,060 |
| * | INTL. FCStone Inc. | 173,900 | 4,747 |
| * | KCG Holdings Inc. Class A | 342,300 | 4,690 |
| James River Group Holdings Ltd. | 149,700 | 4,635 | |
| * | Bats Global Markets Inc. | 193,088 | 4,578 |
| OM Asset Management plc | 323,200 | 4,337 | |
| Yadkin Financial Corp. | 169,975 | 4,253 | |
| Cardinal Financial Corp. | 190,426 | 4,214 | |
| Universal Insurance Holdings Inc. | 198,120 | 3,489 | |
| Iron Mountain Inc. | 91,300 | 3,335 | |
| *,^ | Credit Acceptance Corp. | 15,217 | 2,987 |
| *,^ | World Acceptance Corp. | 60,076 | 2,607 |
| CBOE Holdings Inc. | 39,700 | 2,460 | |
| Investar Holding Corp. | 128,006 | 1,944 | |
| Heritage Insurance Holdings Inc. | 138,400 | 1,839 | |
| Sabra Health Care REIT Inc. | 74,000 | 1,561 | |
| Omega Healthcare Investors Inc. | 45,600 | 1,540 | |
| * | Regional Management Corp. | 92,000 | 1,520 |
| * | SLM Corp. | 210,000 | 1,422 |
| Extra Space Storage Inc. | 16,200 | 1,376 | |
| *,^ | Impac Mortgage Holdings Inc. | 65,280 | 927 |
4
Vanguard® Explorer Fund
Schedule of Investments
April 30, 2016
| Market | |||
| Value | |||
| Shares | ($000) | ||
| Federal Realty Investment Trust | 5,800 | 882 | |
| Universal Health Realty Income Trust | 9,600 | 524 | |
| 1,085,070 | |||
| Health Care (18.6%) | |||
| * | Globus Medical Inc. | 2,787,918 | 69,809 |
| * | Ligand Pharmaceuticals Inc. | 571,953 | 69,132 |
| West Pharmaceutical Services Inc. | 962,530 | 68,532 | |
| * | ABIOMED Inc. | 573,442 | 55,704 |
| * | Cepheid | 1,946,760 | 55,560 |
| * | Insulet Corp. | 1,628,026 | 54,213 |
| * | ICON plc | 753,228 | 50,903 |
| * | Allscripts Healthcare Solutions Inc. | 3,793,820 | 50,837 |
| * | WellCare Health Plans Inc. | 555,440 | 49,984 |
| Kindred Healthcare Inc. | 3,217,959 | 47,497 | |
| * | athenahealth Inc. | 349,754 | 46,622 |
| * | Alkermes plc | 1,094,142 | 43,492 |
| * | LifePoint Health Inc. | 625,621 | 42,267 |
| Cooper Cos. Inc. | 249,124 | 38,136 | |
| ResMed Inc. | 670,494 | 37,414 | |
| * | Acadia Healthcare Co. Inc. | 558,895 | 35,317 |
| * | Align Technology Inc. | 472,400 | 34,103 |
| * | Surgical Care Affiliates Inc. | 705,300 | 34,101 |
| * | LDR Holding Corp. | 1,223,302 | 32,968 |
| DENTSPLY SIRONA Inc. | 512,636 | 30,553 | |
| * | Medidata Solutions Inc. | 696,449 | 30,386 |
| *,2 | Imprivata Inc. | 2,420,390 | 29,335 |
| * | INC Research Holdings Inc. Class A | 605,800 | 29,157 |
| * | Medivation Inc. | 501,345 | 28,978 |
| * | Bio-Rad Laboratories Inc. Class A | 180,240 | 25,567 |
| * | Alnylam Pharmaceuticals Inc. | 358,730 | 24,049 |
| * | Molina Healthcare Inc. | 451,982 | 23,395 |
| Bruker Corp. | 811,050 | 22,953 | |
| * | Bluebird Bio Inc. | 502,792 | 22,299 |
| * | Charles River Laboratories International Inc. | 278,300 | 22,061 |
| * | AMN Healthcare Services Inc. | 610,160 | 21,667 |
| * | Hologic Inc. | 627,236 | 21,069 |
| Teleflex Inc. | 130,500 | 20,329 | |
| * | Cynosure Inc. Class A | 408,730 | 20,003 |
| * | Nektar Therapeutics | 1,275,500 | 20,000 |
| * | Jazz Pharmaceuticals plc | 127,765 | 19,254 |
| * | DexCom Inc. | 288,640 | 18,583 |
| * | Akorn Inc. | 717,943 | 18,272 |
| * | Inogen Inc. | 372,848 | 18,217 |
| * | IDEXX Laboratories Inc. | 214,500 | 18,093 |
| * | QIAGEN NV | 775,000 | 17,406 |
| * | Zeltiq Aesthetics Inc. | 546,890 | 16,352 |
| * | Community Health Systems Inc. | 852,700 | 16,269 |
| * | Pacira Pharmaceuticals Inc. | 296,914 | 16,066 |
| * | Acceleron Pharma Inc. | 528,000 | 15,814 |
| * | Spectranetics Corp. | 921,239 | 15,661 |
| * | Centene Corp. | 248,710 | 15,410 |
| *,^ | TESARO Inc. | 370,228 | 15,342 |
| * | Masimo Corp. | 353,442 | 15,322 |
| * | Neogen Corp. | 317,350 | 14,992 |
| * | NuVasive Inc. | 282,785 | 14,971 |
| * | HMS Holdings Corp. | 885,355 | 14,954 |
| * | Ionis Pharmaceuticals Inc. | 361,360 | 14,805 |
| * | Cerner Corp. | 262,800 | 14,754 |
| * | Endologix Inc. | 1,309,657 | 14,681 |
| *,^ | Adeptus Health Inc. Class A | 194,650 | 13,260 |
| * | HealthEquity Inc. | 518,125 | 13,031 |
| * | Illumina Inc. | 96,300 | 13,000 |
| CONMED Corp. | 308,297 | 12,770 | |
| * | Ultragenyx Pharmaceutical Inc. | 178,400 | 12,063 |
5
Vanguard® Explorer Fund
Schedule of Investments
April 30, 2016
| Market | |||
| Value | |||
| Shares | ($000) | ||
| * | Luminex Corp. | 590,525 | 11,870 |
| * | Sage Therapeutics Inc. | 281,291 | 10,602 |
| *,^ | Cempra Inc. | 587,000 | 9,938 |
| * | Ironwood Pharmaceuticals Inc. Class A | 930,910 | 9,728 |
| * | ExamWorks Group Inc. | 266,000 | 9,589 |
| * | Intuitive Surgical Inc. | 13,700 | 8,581 |
| * | Nevro Corp. | 117,480 | 7,900 |
| Cantel Medical Corp. | 117,630 | 7,880 | |
| * | Mettler-Toledo International Inc. | 21,909 | 7,842 |
| * | Cardiovascular Systems Inc. | 560,000 | 7,829 |
| * | Quintiles Transnational Holdings Inc. | 112,200 | 7,750 |
| * | Prestige Brands Holdings Inc. | 135,700 | 7,705 |
| *,^ | Evolent Health Inc. Class A | 623,512 | 7,488 |
| * | Myriad Genetics Inc. | 205,200 | 7,387 |
| * | United Therapeutics Corp. | 67,800 | 7,133 |
| * | Neurocrine Biosciences Inc. | 153,663 | 7,004 |
| * | Intersect ENT Inc. | 343,898 | 6,895 |
| *,^ | Novadaq Technologies Inc. | 578,361 | 6,478 |
| * | PRA Health Sciences Inc. | 136,300 | 6,467 |
| * | Juno Therapeutics Inc. | 148,475 | 6,249 |
| * | Revance Therapeutics Inc. | 329,686 | 6,060 |
| * | Repligen Corp. | 224,173 | 5,972 |
| * | Emergent BioSolutions Inc. | 154,900 | 5,967 |
| * | Quidel Corp. | 341,555 | 5,909 |
| * | Enanta Pharmaceuticals Inc. | 200,000 | 5,840 |
| *,^ | OvaScience Inc. | 691,495 | 5,795 |
| * | Amedisys Inc. | 112,400 | 5,787 |
| Chemed Corp. | 44,300 | 5,749 | |
| * | DBV Technologies SA ADR | 166,610 | 5,660 |
| *,^ | AAC Holdings Inc. | 270,600 | 5,572 |
| * | Diplomat Pharmacy Inc. | 179,360 | 5,433 |
| * | Atara Biotherapeutics Inc. | 297,238 | 5,353 |
| * | VCA Inc. | 77,000 | 4,849 |
| * | PTC Therapeutics Inc. | 613,800 | 4,554 |
| * | Amsurg Corp. | 55,400 | 4,486 |
| * | Supernus Pharmaceuticals Inc. | 213,429 | 3,662 |
| Quality Systems Inc. | 235,800 | 3,320 | |
| * | Anika Therapeutics Inc. | 72,600 | 3,315 |
| * | ICU Medical Inc. | 32,200 | 3,199 |
| * | Infinity Pharmaceuticals Inc. | 547,400 | 3,175 |
| * | Cross Country Healthcare Inc. | 237,100 | 2,947 |
| *,^ | Esperion Therapeutics Inc. | 173,000 | 2,835 |
| * | Rigel Pharmaceuticals Inc. | 975,600 | 2,761 |
| * | Tetraphase Pharmaceuticals Inc. | 485,300 | 2,718 |
| * | LHC Group Inc. | 66,800 | 2,695 |
| * | PAREXEL International Corp. | 42,600 | 2,603 |
| * | Merrimack Pharmaceuticals Inc. | 297,000 | 2,103 |
| * | Zafgen Inc. | 323,597 | 2,061 |
| * | Spectrum Pharmaceuticals Inc. | 286,700 | 2,033 |
| * | Array BioPharma Inc. | 626,200 | 1,998 |
| * | Acorda Therapeutics Inc. | 76,300 | 1,972 |
| *,^ | Cytokinetics Inc. | 227,800 | 1,854 |
| * | SciClone Pharmaceuticals Inc. | 133,100 | 1,757 |
| Utah Medical Products Inc. | 25,070 | 1,677 | |
| * | NxStage Medical Inc. | 99,520 | 1,604 |
| * | PharMerica Corp. | 58,838 | 1,391 |
| * | FibroGen Inc. | 75,100 | 1,352 |
| * | OraSure Technologies Inc. | 185,300 | 1,330 |
| * | Amphastar Pharmaceuticals Inc. | 107,700 | 1,325 |
| * | ImmunoGen Inc. | 190,000 | 1,301 |
| * | Five Prime Therapeutics Inc. | 26,600 | 1,266 |
| * | Raptor Pharmaceutical Corp. | 210,800 | 1,035 |
| LeMaitre Vascular Inc. | 60,800 | 1,008 | |
| * | BioCryst Pharmaceuticals Inc. | 296,900 | 968 |
6
Vanguard® Explorer Fund
Schedule of Investments
April 30, 2016
| Market | |||
| Value | |||
| Shares | ($000) | ||
| *,^ | Insys Therapeutics Inc. | 64,800 | 939 |
| * | Exact Sciences Corp. | 128,518 | 902 |
| * | iRadimed Corp. | 52,233 | 855 |
| Universal Health Services Inc. Class B | 6,200 | 829 | |
| * | Natus Medical Inc. | 24,800 | 790 |
| * | Team Health Holdings Inc. | 18,570 | 777 |
| *,^ | NewLink Genetics Corp. | 44,500 | 721 |
| * | Sucampo Pharmaceuticals Inc. Class A | 55,300 | 596 |
| *,^ | Sorrento Therapeutics Inc. | 86,700 | 595 |
| * | Civitas Solutions Inc. | 28,700 | 575 |
| Computer Programs & Systems Inc. | 10,300 | 529 | |
| *,^ | Orexigen Therapeutics Inc. | 1,111,800 | 497 |
| * | Peregrine Pharmaceuticals Inc. | 1,396,779 | 495 |
| 2,013,400 | |||
| Industrials (17.7%) | |||
| * | Clean Harbors Inc. | 1,335,691 | 65,983 |
| * | WageWorks Inc. | 1,136,494 | 61,212 |
| * | Genesee & Wyoming Inc. Class A | 862,499 | 56,157 |
| John Bean Technologies Corp. | 988,853 | 51,559 | |
| MSC Industrial Direct Co. Inc. Class A | 644,012 | 49,911 | |
| 2 | H&E Equipment Services Inc. | 2,226,164 | 45,035 |
| GATX Corp. | 957,100 | 43,969 | |
| * | Middleby Corp. | 380,225 | 41,688 |
| * | Teledyne Technologies Inc. | 440,143 | 40,911 |
| Owens Corning | 886,000 | 40,818 | |
| Equifax Inc. | 307,035 | 36,921 | |
| Advanced Drainage Systems Inc. | 1,563,874 | 36,157 | |
| * | Generac Holdings Inc. | 941,412 | 35,887 |
| * | Swift Transportation Co. | 2,155,670 | 35,827 |
| * | WESCO International Inc. | 591,530 | 34,776 |
| Waste Connections Inc. | 513,790 | 34,568 | |
| Watts Water Technologies Inc. Class A | 614,069 | 34,308 | |
| * | AerCap Holdings NV | 844,600 | 33,792 |
| Landstar System Inc. | 501,680 | 32,885 | |
| Acuity Brands Inc. | 133,490 | 32,557 | |
| CEB Inc. | 521,120 | 32,148 | |
| * | On Assignment Inc. | 849,986 | 30,650 |
| * | RBC Bearings Inc. | 407,194 | 29,847 |
| HEICO Corp. Class A | 560,716 | 28,697 | |
| * | Armstrong World Industries Inc. | 697,905 | 28,482 |
| Curtiss-Wright Corp. | 366,600 | 28,074 | |
| * | Advisory Board Co. | 871,936 | 27,588 |
| Carlisle Cos. Inc. | 267,375 | 27,246 | |
| Tennant Co. | 470,543 | 25,132 | |
| Kennametal Inc. | 1,030,555 | 24,094 | |
| * | IHS Inc. Class A | 193,605 | 23,848 |
| * | Stericycle Inc. | 245,745 | 23,483 |
| * | Trex Co. Inc. | 491,690 | 23,331 |
| ManpowerGroup Inc. | 293,040 | 22,573 | |
| AMETEK Inc. | 467,665 | 22,490 | |
| * | Hawaiian Holdings Inc. | 522,681 | 21,989 |
| JB Hunt Transport Services Inc. | 264,440 | 21,917 | |
| Heartland Express Inc. | 1,204,322 | 21,810 | |
| * | Proto Labs Inc. | 350,348 | 20,961 |
| AO Smith Corp. | 265,970 | 20,538 | |
| * | Sensata Technologies Holding NV | 529,369 | 19,941 |
| * | TrueBlue Inc. | 1,045,595 | 19,542 |
| * | TransUnion | 625,100 | 18,722 |
| * | TriNet Group Inc. | 1,106,851 | 18,396 |
| Forward Air Corp. | 400,246 | 18,243 | |
| * | TASER International Inc. | 946,423 | 17,282 |
| Snap-on Inc. | 105,500 | 16,804 | |
| Watsco Inc. | 124,205 | 16,702 | |
| Apogee Enterprises Inc. | 401,978 | 16,658 | |
7
Vanguard® Explorer Fund
Schedule of Investments
April 30, 2016
| Market | |||
| Value | |||
| Shares | ($000) | ||
| Kaman Corp. | 350,827 | 14,766 | |
| * | Kirby Corp. | 224,340 | 14,317 |
| Woodward Inc. | 260,225 | 14,107 | |
| * | Verisk Analytics Inc. Class A | 179,600 | 13,933 |
| * | JetBlue Airways Corp. | 698,900 | 13,831 |
| Albany International Corp. | 331,600 | 13,360 | |
| Ryder System Inc. | 193,300 | 13,322 | |
| Orbital ATK Inc. | 141,300 | 12,293 | |
| Mobile Mini Inc. | 377,400 | 12,171 | |
| Wabtec Corp. | 136,483 | 11,319 | |
| * | United Rentals Inc. | 166,831 | 11,166 |
| Huntington Ingalls Industries Inc. | 67,600 | 9,786 | |
| * | Rush Enterprises Inc. Class A | 484,433 | 9,538 |
| Ritchie Bros Auctioneers Inc. | 329,035 | 9,440 | |
| Alaska Air Group Inc. | 133,748 | 9,420 | |
| * | Spirit AeroSystems Holdings Inc. Class A | 190,800 | 8,996 |
| Donaldson Co. Inc. | 264,297 | 8,637 | |
| * | Roadrunner Transportation Systems Inc. | 672,266 | 7,946 |
| B/E Aerospace Inc. | 158,000 | 7,684 | |
| * | Astronics Corp. | 200,111 | 7,394 |
| * | HD Supply Holdings Inc. | 205,600 | 7,048 |
| Werner Enterprises Inc. | 275,525 | 6,982 | |
| * | Wabash National Corp. | 488,500 | 6,961 |
| * | Quanta Services Inc. | 289,770 | 6,873 |
| Herman Miller Inc. | 224,400 | 6,770 | |
| Global Brass & Copper Holdings Inc. | 234,756 | 6,362 | |
| Knight Transportation Inc. | 237,580 | 6,313 | |
| ^ | Greenbrier Cos. Inc. | 207,600 | 6,226 |
| General Cable Corp. | 398,000 | 6,225 | |
| BWX Technologies Inc. | 184,300 | 6,154 | |
| Cintas Corp. | 67,400 | 6,051 | |
| Flowserve Corp. | 115,935 | 5,659 | |
| * | Saia Inc. | 186,267 | 5,387 |
| * | American Woodmark Corp. | 72,500 | 5,281 |
| * | Armstrong Flooring Inc. | 348,952 | 5,081 |
| Allison Transmission Holdings Inc. | 171,200 | 4,932 | |
| West Corp. | 226,500 | 4,854 | |
| * | Echo Global Logistics Inc. | 198,500 | 4,639 |
| * | Meritor Inc. | 534,600 | 4,544 |
| * | Lydall Inc. | 115,822 | 4,261 |
| Graco Inc. | 54,200 | 4,249 | |
| Insteel Industries Inc. | 138,700 | 4,021 | |
| Comfort Systems USA Inc. | 133,900 | 3,949 | |
| * | DXP Enterprises Inc. | 161,878 | 3,537 |
| Harsco Corp. | 476,000 | 3,375 | |
| Celadon Group Inc. | 326,600 | 3,289 | |
| Exponent Inc. | 60,544 | 3,018 | |
| Steelcase Inc. Class A | 180,100 | 2,748 | |
| RR Donnelley & Sons Co. | 153,500 | 2,671 | |
| Deluxe Corp. | 41,409 | 2,600 | |
| Kimball International Inc. Class B | 189,157 | 2,202 | |
| *,^ | Power Solutions International Inc. | 169,200 | 2,191 |
| * | Spirit Airlines Inc. | 48,100 | 2,113 |
| * | YRC Worldwide Inc. | 229,300 | 2,110 |
| Interface Inc. Class A | 121,100 | 2,061 | |
| * | Ply Gem Holdings Inc. | 125,200 | 1,834 |
| Brink's Co. | 51,200 | 1,733 | |
| Pitney Bowes Inc. | 78,900 | 1,655 | |
| Lincoln Electric Holdings Inc. | 25,700 | 1,611 | |
| Heidrick & Struggles International Inc. | 72,300 | 1,426 | |
| ^ | American Railcar Industries Inc. | 32,000 | 1,312 |
| * | FTI Consulting Inc. | 32,075 | 1,293 |
| * | Vectrus Inc. | 57,900 | 1,248 |
| Air Lease Corp. Class A | 39,700 | 1,210 |
8
Vanguard® Explorer Fund
Schedule of Investments
April 30, 2016
| Market | |||
| Value | |||
| Shares | ($000) | ||
| * | Avis Budget Group Inc. | 44,100 | 1,107 |
| * | Caesarstone Sdot-Yam Ltd. | 29,000 | 1,074 |
| Robert Half International Inc. | 24,100 | 923 | |
| * | AECOM | 27,200 | 884 |
| * | Astronics Corp. Class B | 21,286 | 786 |
| Barrett Business Services Inc. | 21,800 | 676 | |
| * | USA Truck Inc. | 33,900 | 601 |
| * | PAM Transportation Services Inc. | 23,458 | 580 |
| * | Hudson Technologies Inc. | 122,507 | 429 |
| 1,916,654 | |||
| Information Technology (23.1%) | |||
| * | Cadence Design Systems Inc. | 4,923,060 | 114,166 |
| *,2 | Cardtronics Inc. | 2,429,936 | 95,788 |
| * | Demandware Inc. | 1,864,586 | 85,920 |
| * | Ultimate Software Group Inc. | 378,854 | 74,479 |
| * | Euronet Worldwide Inc. | 791,341 | 61,012 |
| * | Cavium Inc. | 1,121,701 | 55,378 |
| * | CoStar Group Inc. | 242,012 | 47,751 |
| * | HubSpot Inc. | 1,029,009 | 45,575 |
| * | M/A-COM Technology Solutions Holdings Inc. | 1,085,673 | 44,393 |
| * | First Solar Inc. | 794,568 | 44,369 |
| Power Integrations Inc. | 888,155 | 42,853 | |
| * | Tyler Technologies Inc. | 287,582 | 42,105 |
| * | Electronics For Imaging Inc. | 1,048,712 | 41,781 |
| * | Alliance Data Systems Corp. | 205,218 | 41,723 |
| * | WNS Holdings Ltd. ADR | 1,314,397 | 41,653 |
| * | WEX Inc. | 436,970 | 41,289 |
| SS&C Technologies Holdings Inc. | 596,811 | 36,495 | |
| * | Entegris Inc. | 2,743,916 | 36,467 |
| Belden Inc. | 568,535 | 35,897 | |
| * | Ruckus Wireless Inc. | 2,576,300 | 35,398 |
| Convergys Corp. | 1,311,137 | 34,745 | |
| * | Acxiom Corp. | 1,532,665 | 33,673 |
| Teradyne Inc. | 1,742,845 | 32,957 | |
| * | Manhattan Associates Inc. | 527,725 | 31,948 |
| * | Gigamon Inc. | 913,985 | 29,787 |
| *,^ | SunPower Corp. Class A | 1,460,310 | 29,411 |
| *,^ | Stratasys Ltd. | 1,188,844 | 29,091 |
| * | Proofpoint Inc. | 498,203 | 29,025 |
| * | Red Hat Inc. | 383,600 | 28,145 |
| * | Ciena Corp. | 1,672,140 | 28,142 |
| * | SPS Commerce Inc. | 520,397 | 26,504 |
| * | Trimble Navigation Ltd. | 1,095,764 | 26,244 |
| * | VeriFone Systems Inc. | 919,285 | 26,163 |
| * | Aspen Technology Inc. | 677,610 | 25,770 |
| * | GoDaddy Inc. Class A | 817,790 | 24,836 |
| FLIR Systems Inc. | 801,510 | 24,214 | |
| * | Fleetmatics Group plc | 655,010 | 23,744 |
| * | Guidewire Software Inc. | 399,627 | 22,767 |
| * | TiVo Inc. | 2,219,290 | 22,149 |
| Methode Electronics Inc. | 731,715 | 21,754 | |
| * | Gartner Inc. | 245,746 | 21,422 |
| * | Verint Systems Inc. | 631,690 | 21,376 |
| * | Super Micro Computer Inc. | 767,392 | 20,651 |
| *,^ | Mobileye NV | 510,467 | 19,474 |
| * | Genpact Ltd. | 695,585 | 19,400 |
| * | F5 Networks Inc. | 181,505 | 19,013 |
| * | Infoblox Inc. | 1,064,700 | 17,812 |
| Intersil Corp. Class A | 1,457,495 | 17,038 | |
| National Instruments Corp. | 617,460 | 17,023 | |
| * | ON Semiconductor Corp. | 1,775,541 | 16,814 |
| * | Mellanox Technologies Ltd. | 385,600 | 16,677 |
| * | Microsemi Corp. | 471,600 | 15,935 |
| * | Silicon Laboratories Inc. | 322,688 | 15,102 |
9
Vanguard® Explorer Fund
Schedule of Investments
April 30, 2016
| Market | |||
| Value | |||
| Shares | ($000) | ||
| *,^ | Cimpress NV | 169,850 | 14,925 |
| Global Payments Inc. | 195,069 | 14,080 | |
| MercadoLibre Inc. | 112,700 | 14,075 | |
| Brooks Automation Inc. | 1,473,924 | 13,943 | |
| * | Imperva Inc. | 293,960 | 13,663 |
| *,^ | Pandora Media Inc. | 1,327,700 | 13,184 |
| *,^ | Shutterstock Inc. | 314,500 | 12,901 |
| Cognex Corp. | 359,643 | 12,778 | |
| Microchip Technology Inc. | 262,100 | 12,735 | |
| * | Envestnet Inc. | 387,100 | 12,147 |
| Monolithic Power Systems Inc. | 184,696 | 11,529 | |
| * | Radware Ltd. | 1,035,000 | 11,178 |
| * | Qlik Technologies Inc. | 358,300 | 11,032 |
| * | Finisar Corp. | 666,500 | 10,971 |
| * | ChannelAdvisor Corp. | 859,919 | 10,715 |
| * | RealPage Inc. | 484,468 | 10,653 |
| * | Bottomline Technologies de Inc. | 425,360 | 10,447 |
| * | BroadSoft Inc. | 262,400 | 10,277 |
| * | Palo Alto Networks Inc. | 64,800 | 9,776 |
| * | Wix.com Ltd. | 392,812 | 9,710 |
| *,^ | CyberArk Software Ltd. | 237,600 | 9,704 |
| * | Progress Software Corp. | 380,000 | 9,698 |
| * | Barracuda Networks Inc. | 522,398 | 9,205 |
| * | Perficient Inc. | 435,000 | 9,083 |
| MAXIMUS Inc. | 170,308 | 9,009 | |
| * | PTC Inc. | 238,809 | 8,707 |
| * | Fortinet Inc. | 266,700 | 8,670 |
| * | Descartes Systems Group Inc. | 466,553 | 8,594 |
| *,2 | Information Services Group Inc. | 2,093,515 | 8,583 |
| FEI Co. | 94,800 | 8,439 | |
| CDW Corp. | 213,900 | 8,235 | |
| * | Virtusa Corp. | 227,000 | 8,068 |
| * | Synchronoss Technologies Inc. | 258,900 | 8,044 |
| * | comScore Inc. | 259,270 | 7,939 |
| * | Arista Networks Inc. | 118,785 | 7,913 |
| * | Semtech Corp. | 349,177 | 7,556 |
| Littelfuse Inc. | 63,500 | 7,396 | |
| * | Cvent Inc. | 206,280 | 7,292 |
| * | Teradata Corp. | 274,800 | 6,952 |
| CSG Systems International Inc. | 155,900 | 6,919 | |
| Booz Allen Hamilton Holding Corp. Class A | 247,441 | 6,822 | |
| * | Akamai Technologies Inc. | 129,600 | 6,608 |
| *,^ | Pure Storage Inc. Class A | 437,384 | 6,364 |
| * | New Relic Inc. | 242,149 | 6,243 |
| * | LivePerson Inc. | 992,204 | 6,003 |
| * | ANSYS Inc. | 64,800 | 5,882 |
| Travelport Worldwide Ltd. | 419,800 | 5,856 | |
| EarthLink Holdings Corp. | 998,300 | 5,800 | |
| * | Integrated Device Technology Inc. | 298,600 | 5,757 |
| * | EPAM Systems Inc. | 78,600 | 5,732 |
| Leidos Holdings Inc. | 115,000 | 5,705 | |
| *,^ | Advanced Micro Devices Inc. | 1,570,200 | 5,574 |
| *,^ | InvenSense Inc. | 714,400 | 5,487 |
| * | PROS Holdings Inc. | 462,000 | 5,433 |
| * | Extreme Networks Inc. | 1,460,400 | 5,126 |
| * | IPG Photonics Corp. | 58,229 | 5,047 |
| * | Tableau Software Inc. Class A | 96,900 | 5,010 |
| * | Paylocity Holding Corp. | 129,172 | 4,943 |
| Broadridge Financial Solutions Inc. | 82,300 | 4,925 | |
| * | Qualys Inc. | 194,500 | 4,898 |
| *,^ | Rapid7 Inc. | 379,500 | 4,751 |
| Hackett Group Inc. | 308,200 | 4,586 | |
| Jabil Circuit Inc. | 263,600 | 4,576 | |
| DST Systems Inc. | 33,896 | 4,091 |
10
Vanguard® Explorer Fund
Schedule of Investments
April 30, 2016
| Market | |||
| Value | |||
| Shares | ($000) | ||
| * | FireEye Inc. | 229,700 | 3,985 |
| *,^ | Unisys Corp. | 501,062 | 3,863 |
| * | Plexus Corp. | 89,000 | 3,717 |
| *,^ | Allot Communications Ltd. | 685,200 | 3,714 |
| TeleTech Holdings Inc. | 127,679 | 3,548 | |
| * | Applied Micro Circuits Corp. | 568,600 | 3,548 |
| * | Synaptics Inc. | 49,400 | 3,535 |
| * | OSI Systems Inc. | 69,370 | 3,530 |
| * | Stamps.com Inc. | 41,000 | 3,377 |
| Science Applications International Corp. | 63,400 | 3,366 | |
| * | A10 Networks Inc. | 551,952 | 3,295 |
| * | Sykes Enterprises Inc. | 112,800 | 3,288 |
| * | Brightcove Inc. | 543,400 | 3,288 |
| * | Nimble Storage Inc. | 443,800 | 3,275 |
| * | ARRIS International plc | 141,432 | 3,220 |
| * | LinkedIn Corp. Class A | 25,062 | 3,141 |
| * | MicroStrategy Inc. Class A | 16,500 | 2,959 |
| * | Cirrus Logic Inc. | 81,400 | 2,939 |
| * | Zendesk Inc. | 120,000 | 2,712 |
| * | Jive Software Inc. | 658,682 | 2,681 |
| * | Inphi Corp. | 89,510 | 2,656 |
| Avnet Inc. | 64,200 | 2,640 | |
| * | Interactive Intelligence Group Inc. | 69,900 | 2,598 |
| * | Care.com Inc. | 341,386 | 2,540 |
| NIC Inc. | 140,511 | 2,488 | |
| * | Callidus Software Inc. | 135,000 | 2,471 |
| * | WebMD Health Corp. | 34,400 | 2,158 |
| *,^ | Fitbit Inc. Class A | 117,000 | 2,135 |
| QAD Inc. Class A | 97,012 | 1,902 | |
| * | Blackhawk Network Holdings Inc. | 58,500 | 1,880 |
| * | Rackspace Hosting Inc. | 66,400 | 1,519 |
| * | Web.com Group Inc. | 72,900 | 1,457 |
| * | Infinera Corp. | 117,000 | 1,391 |
| * | RingCentral Inc. Class A | 69,600 | 1,328 |
| Diebold Inc. | 48,500 | 1,274 | |
| * | Angie's List Inc. | 142,400 | 1,246 |
| * | ShoreTel Inc. | 196,300 | 1,201 |
| * | Silicon Graphics International Corp. | 245,100 | 1,098 |
| Monotype Imaging Holdings Inc. | 49,773 | 1,096 | |
| Jack Henry & Associates Inc. | 13,300 | 1,078 | |
| * | SecureWorks Corp. Class A | 79,500 | 1,060 |
| * | Alarm.com Holdings Inc. | 45,400 | 1,036 |
| * | Travelzoo Inc. | 134,521 | 1,026 |
| * | Zebra Technologies Corp. | 16,400 | 1,026 |
| *,^ | Digimarc Corp. | 33,175 | 990 |
| * | Take-Two Interactive Software Inc. | 26,500 | 906 |
| * | Five9 Inc. | 96,100 | 889 |
| * | Guidance Software Inc. | 157,000 | 801 |
| * | Cray Inc. | 21,000 | 795 |
| * | AVG Technologies NV | 37,500 | 743 |
| * | Workiva Inc. | 53,700 | 640 |
| * | Advanced Energy Industries Inc. | 19,500 | 631 |
| * | ePlus Inc. | 7,800 | 627 |
| * | Glu Mobile Inc. | 194,800 | 520 |
| 2,506,069 | |||
| Materials (3.8%) | |||
| PolyOne Corp. | 1,658,470 | 59,672 | |
| Minerals Technologies Inc. | 816,370 | 48,901 | |
| RPC Group plc | 3,851,370 | 41,099 | |
| Graphic Packaging Holding Co. | 2,753,614 | 36,568 | |
| KapStone Paper and Packaging Corp. | 2,024,234 | 32,165 | |
| Methanex Corp. | 855,820 | 29,919 | |
| Smurfit Kappa Group plc | 1,325,320 | 27,530 | |
| Ashland Inc. | 224,210 | 25,022 | |
![]()
Vanguard® Explorer Fund
Schedule of Investments
April 30, 2016
| Market | |||
| Value | |||
| Shares | ($000) | ||
| * | WR Grace & Co. | 215,780 | 16,546 |
| Sealed Air Corp. | 240,300 | 11,381 | |
| Quaker Chemical Corp. | 111,515 | 9,932 | |
| Balchem Corp. | 128,921 | 7,911 | |
| Avery Dennison Corp. | 101,600 | 7,377 | |
| *,^ | Trinseo SA | 155,300 | 6,645 |
| * | Koppers Holdings Inc. | 257,500 | 6,471 |
| Bemis Co. Inc. | 118,300 | 5,936 | |
| Schweitzer-Mauduit International Inc. | 162,414 | 5,585 | |
| Stepan Co. | 81,491 | 4,995 | |
| * | Chemtura Corp. | 164,600 | 4,584 |
| Huntsman Corp. | 275,600 | 4,338 | |
| AEP Industries Inc. | 52,605 | 3,242 | |
| * | Ryerson Holding Corp. | 329,069 | 2,922 |
| Worthington Industries Inc. | 76,400 | 2,884 | |
| * | US Concrete Inc. | 42,000 | 2,594 |
| * | Axalta Coating Systems Ltd. | 84,000 | 2,391 |
| RPM International Inc. | 44,600 | 2,254 | |
| Steel Dynamics Inc. | 76,200 | 1,921 | |
| * | Crown Holdings Inc. | 32,600 | 1,727 |
| Kaiser Aluminum Corp. | 16,700 | 1,584 | |
| Packaging Corp. of America | 14,200 | 921 | |
| * | Clearwater Paper Corp. | 13,200 | 789 |
| * | GCP Applied Technologies Inc. | 34,800 | 770 |
| Ball Corp. | 7,600 | 542 | |
| 417,118 | |||
| Other (0.7%) | |||
| 3 | Vanguard Small-Cap Growth ETF | 384,700 | 46,391 |
| 3 | Vanguard Small-Cap ETF | 202,930 | 23,024 |
| *,4 | Dropbox Private Placement | 378,066 | 3,800 |
| * | Dyax Corp CVR Exp. 12/31/2019 | 134,316 | 149 |
| 73,364 | |||
| Telecommunication Services (0.7%) | |||
| * | Vonage Holdings Corp. | 8,380,671 | 39,137 |
| * | SBA Communications Corp. Class A | 171,330 | 17,654 |
| Cogent Communications Holdings Inc. | 202,607 | 7,841 | |
| * | General Communication Inc. Class A | 143,200 | 2,420 |
| Inteliquent Inc. | 125,740 | 2,086 | |
| * | FairPoint Communications Inc. | 99,400 | 1,318 |
| * | Cincinnati Bell Inc. | 289,000 | 1,104 |
| ^ | Windstream Holdings Inc. | 122,700 | 1,065 |
| 72,625 | |||
| Utilities (0.2%) | |||
| ^ | 8Point3 Energy Partners LP | 1,201,549 | 18,948 |
| Spark Energy Inc. Class A | 50,261 | 1,296 | |
| Ormat Technologies Inc. | 20,600 | 894 | |
| 21,138 | |||
| Total Common Stocks (Cost $9,305,308) | 10,592,486 | ||
12
Vanguard® Explorer Fund
Schedule of Investments
April 30, 2016
| Market | |||||
| Value | |||||
| Coupon | Shares | ($000) | |||
| Temporary Cash Investments (4.8%)1 | |||||
| Money Market Fund (4.3%) | |||||
| 5,6 | Vanguard Market Liquidity Fund | 0.495% | 463,835,981 | 463,836 | |
| Face | |||||
| Maturity | Amount | ||||
| Date | ($000) | ||||
| Repurchase Agreement (0.3%) | |||||
| Deutsche Bank Securities, Inc. (Dated 4/29/16, | |||||
| Repurchase Value $35,801,000, collateralized by | |||||
| Federal Home Loan Mortgage Corp. 6.000%, | |||||
| 11/15/17, and Government National Mortgage Assn. | |||||
| 3.500%-5.500%, 7/20/37-9/20/45, with a value of | |||||
| $36,516,000) | 0.310% | 5/2/16 | 35,800 | 35,800 | |
| U.S. Government and Agency Obligations (0.2%) | |||||
| 7,8 | Federal Home Loan Bank Discount Notes | 0.567%-0.572% | 7/6/16 | 15,000 | 14,991 |
| 7,8 | Federal Home Loan Bank Discount Notes | 0.335% | 7/22/16 | 5,000 | 4,997 |
| United States Treasury Note/Bond | 0.375% | 5/31/16 | 3,000 | 3,000 | |
| 22,988 | |||||
| Total Temporary Cash Investments (Cost $522,617) | 522,624 | ||||
| Total Investments (102.5%) (Cost $9,827,925) | 11,115,110 | ||||
| Other Assets and Liabilities—Net (-2.5%)6 | (270,731) | ||||
| Net Assets (100%) | 10,844,379 | ||||
* Non-income-producing security.
^ Includes partial security positions on loan to broker-dealers. The total value of securities on loan is $194,505,000.
1 The fund invests a portion of its cash reserves in equity markets through the use of index futures contracts. After giving effect to futures
investments, the fund's effective common stock and temporary cash investment positions represent 98.6% and 3.9%, respectively, of net
assets.
2 Considered an affiliated company of the fund as the fund owns more than 5% of the outstanding voting securities of such company.
3 Considered an affiliated company of the fund as the issuer is another member of The Vanguard Group.
4 Restricted security represents 0.0% of net assets.
5 Affiliated money market fund available only to Vanguard funds and certain trusts and accounts managed by Vanguard. Rate shown is the 7-day
yield.
6 Includes $208,099,000 of collateral received for securities on loan.
7 The issuer operates under a congressional charter; its securities are generally neither guaranteed by the U.S. Treasury nor backed by the full
faith and credit of the U.S. government.
8 Securities with a value of $4,797,000 have been segregated as initial margin for open futures contracts.
ADR—American Depositary Receipt.
CVR—Contingent Value Rights.
REIT—Real Estate Investment Trust.
13
© 2016 The Vanguard Group, Inc.
All rights reserved.
Vanguard Marketing Corporation, Distributor.
SNA242 062016
Item 7: Disclosure of Proxy Voting Policies and Procedures for Closed-End Management
Investment Companies.
Not Applicable.
Item 8: Portfolio Managers of Closed-End Management Investment Companies.
Not Applicable.
Item 9: Purchase of Equity Securities by Closed-End Management Investment Company and
Affiliated Purchasers.
Not Applicable.
Item 10: Submission of Matters to a Vote of Security Holders.
Not Applicable.
Item 11: Controls and Procedures.
(a) Disclosure Controls and Procedures. The Principal Executive and Financial Officers concluded that the Registrant’s Disclosure Controls and Procedures are effective based on their evaluation of the Disclosure Controls and Procedures as of a date within 90 days of the filing date of this report.
(b) Internal Control Over Financial Reporting. There were no significant changes in Registrant’s Internal Control Over Financial Reporting or in other factors that could significantly affect this control subsequent to the date of the evaluation, including any corrective actions with regard to significant deficiencies and material weaknesses.
Item 12: Exhibits.
(a) Certifications.
Pursuant to the requirements of the Securities Exchange Act of 1934 and the Investment Company Act of 1940, the registrant has duly caused this report to be signed on its behalf by the undersigned, thereunto duly authorized.
| VANGUARD EXPLORER FUND | |
| BY: | /s/ F. WILLIAM MCNABB III* |
| F. WILLIAM MCNABB III | |
| CHIEF EXECUTIVE OFFICER | |
| Date: June 15, 2016 | |
Pursuant to the requirements of the Securities Exchange Act of 1934 and the Investment Company Act of 1940, this report has been signed below by the following persons on behalf of the registrant and in the capacities and on the dates indicated.
| VANGUARD EXPLORER FUND | |
| BY: | /s/ F. WILLIAM MCNABB III* |
| F. WILLIAM MCNABB III | |
| CHIEF EXECUTIVE OFFICER | |
| Date: June 15, 2016 | |
| VANGUARD EXPLORER FUND |
| BY: | /s/ THOMAS J. HIGGINS* |
| THOMAS J. HIGGINS | |
| CHIEF FINANCIAL OFFICER | |
| Date: June 15, 2016 | |
* By: /s/ Heidi Stam
Heidi Stam, pursuant to a Power of Attorney filed on April 22, 2014 see file Number 2-17620, Incorporated by Reference.