UNITED STATES
SECURITIES AND EXCHANGE COMMISSION
Washington, D.C. 20549
FORM N-CSR
CERTIFIED SHAREHOLDER REPORT
OF
REGISTERED MANAGEMENT INVESTMENT COMPANIES
Investment Company Act file number: 811-01530
Name of Registrant: Vanguard Explorer Fund
Address of Registrant:
P.O. Box 2600
Valley Forge, PA 19482
Name and address of agent for service:
Anne E. Robinson, Esquire
P.O. Box 876
Valley Forge, PA 19482
Registrant’s telephone number, including area code: (610) 669-1000
Date of fiscal year end: October 31
Date of reporting period: November 1, 2017—April 30, 2018
Item 1: Reports to Shareholders
| Semiannual Report | April 30, 2018 |
| Vanguard Explorer™ Fund |
Vanguard’s Principles for Investing Success
We want to give you the best chance of investment success. These
principles, grounded in Vanguard’s research and experience, can put you on
the right path.
Goals. Create clear, appropriate investment goals.
Balance. Develop a suitable asset allocation using broadly diversified funds.
Cost. Minimize cost.
Discipline. Maintain perspective and long-term discipline.
A single theme unites these principles: Focus on the things you can control.
We believe there is no wiser course for any investor.
| Contents | |
| Your Fund’s Performance at a Glance. | 1 |
| CEO’s Perspective. | 2 |
| Advisors’ Report. | 4 |
| Results of Proxy Voting. | 10 |
| Fund Profile. | 11 |
| Performance Summary. | 13 |
| Financial Statements. | 14 |
| About Your Fund’s Expenses. | 30 |
| Trustees Approve Advisory Arrangements. | 32 |
| Glossary. | 35 |
Please note: The opinions expressed in this report are just that—informed opinions. They should not be considered promises or advice. Also, please keep in mind that the information and opinions cover the period through the date on the front of this report. Of course, the risks of investing in your fund are spelled out in the prospectus.
See the Glossary for definitions of investment terms used in this report.
About the cover: Nautical images have been part of Vanguard’s rich heritage since its start in 1975. For an incoming ship, a lighthouse offers a beacon and safe path to shore. You can similarly depend on Vanguard to put you first––and light the way––as you strive to meet your financial goals. Our client focus and low costs, stemming from our unique ownership structure, assure that your interests are paramount.
Your Fund’s Performance at a Glance
• For the six months ended April 30, 2018, Vanguard Explorer Fund returned 8.79% for
Investor Shares and 8.85% for Admiral Shares. It exceeded the return of its benchmark,
the Russell 2500 Growth Index, and the average return of its small-capitalization growth
fund peers.
• During the period, small-caps slightly trailed their large-cap counterparts. Growth
stocks surpassed their value counterparts.
• Consumer discretionary, information technology, and industrial holdings did well.
Financials, consumer staples, and utilities contributed least to relative performance.
• Each of the Explorer Fund’s five independent advisors employs a growth-oriented
strategy and manages its piece of the portfolio with a long-term focus.
| Total Returns: Six Months Ended April 30, 2018 | |
| Total | |
| Returns | |
| Vanguard Explorer Fund | |
| Investor Shares | 8.79% |
| Admiral™ Shares | 8.85 |
| Russell 2500 Growth Index | 5.37 |
| Small-Cap Growth Funds Average | 6.70 |
| Small-Cap Growth Funds Average: Derived from data provided by Lipper, a Thomson Reuters Company. | |
| Admiral Shares carry lower expenses and are available to investors who meet certain account-balance requirements. |
| Expense Ratios | |||
| Your Fund Compared With Its Peer Group | |||
| Investor | Admiral | Peer Group | |
| Shares | Shares | Average | |
| Explorer Fund | 0.44% | 0.32% | 1.31% |
The fund expense ratios shown are from the prospectus dated February 23, 2018, and represent estimated costs for the current fiscal year. For the six months ended April 30, 2018, the fund’s annualized expense ratios were 0.43% for Investor Shares and 0.31% for Admiral Shares. The peer-group expense ratio is derived from data provided by Lipper, a Thomson Reuters Company, and captures information through year-end 2017.
Peer group: Small-Cap Growth Funds.
1
CEO’s Perspective

Tim Buckley
President and Chief Executive Officer
Dear Shareholder,
I feel extremely fortunate to have the chance to lead a company filled with people who come to work every day passionate about Vanguard’s core purpose: to take a stand for all investors, to treat them fairly, and to give them the best chance for investment success.
When I joined Vanguard in 1991, I found a mission-driven team focused on improving lives—helping people retire more comfortably, put their children through college, and achieve financial security. I also found a company with purpose in an industry ripe for improvement.
It was clear, even early in my career, that the cards were stacked against most investors. Hidden fees, performance-chasing, and poor advice were relentlessly eroding investors’ dreams.
We knew Vanguard could be different and, as a result, could make a real difference. We have lowered the costs of investing for our shareholders significantly. And we’re proud of the performance of our funds.
Vanguard is built for Vanguard investors—we focus solely on you, our fund shareholders. Everything we do is designed to give our clients the best chance for investment success. In my role as CEO, I’ll keep this priority
2
front and center. We’re proud of what we’ve achieved, but we’re even more excited about what’s to come.
Steady, time-tested guidance
Our guidance for investors, as always, is to stay the course, tune out the hyperbolic headlines, and focus on your goals and what you can control, such as costs and how much you save. This time-tested advice has served our clients well over the decades.
Regardless of how the markets perform in the short term, I’m incredibly optimistic about the future for our investors. We have a dedicated team serving you, and we will never stop striving to make Vanguard the best place for you to invest through our high-quality funds and services, advice and guidance to help you meet your financial goals, and an experience that makes you feel good about entrusting us with your hard-earned savings.
Thank you for your continued loyalty.
Sincerely,

Mortimer J. Buckley
President and Chief Executive Officer
May 16, 2018
| Market Barometer | |||
| Total Returns | |||
| Periods Ended April 30, 2018 | |||
| Six | One | Five Years | |
| Months | Year | (Annualized) | |
| Stocks | |||
| Russell 1000 Index (Large-caps) | 3.83% | 13.17% | 12.84% |
| Russell 2000 Index (Small-caps) | 3.27 | 11.54 | 11.74 |
| Russell 3000 Index (Broad U.S. market) | 3.79 | 13.05 | 12.75 |
| FTSE All-World ex US Index (International) | 3.72 | 15.84 | 5.85 |
| Bonds | |||
| Bloomberg Barclays U.S. Aggregate Bond Index | |||
| (Broad taxable market) | -1.87% | -0.32% | 1.47% |
| Bloomberg Barclays Municipal Bond Index | |||
| (Broad tax-exempt market) | -0.97 | 1.56 | 2.44 |
| Citigroup Three-Month U.S. Treasury Bill Index | 0.67 | 1.16 | 0.32 |
| CPI | |||
| Consumer Price Index | 1.57% | 2.46% | 1.50% |
3
Advisors’ Report
For the six months ended April 30, 2018, Vanguard Explorer Fund returned 8.79% for Investor Shares and 8.85% for Admiral Shares. It exceeded the return of its benchmark, the Russell 2500 Growth Index, and the average return of its small-capitalization growth fund peers.
Your fund is managed by five independent advisors, a strategy that enhances its diversification by providing exposure to distinct yet complementary investment approaches. It’s not uncommon for different advisors to have different views about individual securities or the broader investment environment.
The advisors, the amount and percentage of fund assets each manages, and brief descriptions of their investment strategies are presented in the table on page 8.
The advisors have provided the following assessment of the investment environment during the past six months and the notable successes and shortfalls in their portfolios. These comments were prepared on May 17, 2018.
Wellington Management Company llp
Portfolio Managers:
Kenneth L. Abrams, Senior Managing Director and Equity Portfolio Manager Daniel J. Fitzpatrick, CFA, Senior Managing Director and Equity Portfolio Manager
Our bottom-up security selection was the primary contributor to relative performance. Selection added most in the health care and consumer discretionary sectors.
Top individual contributors included Delek (energy), Haemonetics (health care), Insulet (health care), Smurfit Kappa (materials), and Globus Medical (health care). Delek, a large energy conglomerate, delivered strong fourth-quarter results, helped by a recent acquisition that should strengthen Delek’s logistics and operating presence in the Permian region in Texas and New Mexico. We also supported company management’s moves to increase the dividend and buy back stock.
Weaker selection in financials, an overweight position in materials, and a small cash position were a drag on performance, but not enough to offset strength elsewhere.
4
In financials, our position in MGIC weighed most on relative performance. Shares of the private mortgage insurer dipped during the period in response to increased fear of competition and negative sentiment about a new program with Freddie Mac. We believe the company’s operating performance can improve over the next few years as its legacy portfolio runs off and is replaced by high-quality new businesses.
Vanguard Quantitative Equity Group
Portfolio Managers: James Stetler
Binbin Guo, Principal, Head of Alpha Equity Investments
For the six months ended April 30, 2018, our stock selection models effectively identified industry group leaders in several sectors. Three of our five model components boosted relative returns, with valuation and management decisions making significant contributions and sentiment adding flat but positive performance. Growth and quality detracted.
Stock selection was positive in 6 of 11 sectors. Selection in the consumer discretionary sector was a significant contributor to performance; selection in the materials and real estate sectors also boosted returns. Overweight positions in Tailored Brands, Match Group, ImmunoGen, Etsy, and RingCentral were among the portfolio’s top performers for the period.
Selection in the health care, information technology, and consumer staples sectors detracted from performance. An underweight position in Nektar Therapeutics and overweight positions in Kemet, Ultra Clean Holdings, and HRG Group were among the worst performers.
Stephens Investment Management Group, LLC
Portfolio Manager: Ryan E. Crane, CFA, Chief Investment Officer
On the heels of a strong year, the economy and equity markets showed continued strength over the six months ended April 30, 2018. With the new federal tax law in place, many companies reported an uptick in earnings and guided expectations for the year even higher. We believe there has been a “regime change” in the market, as interest rates have continued to rise and inflation concerns are more pronounced. Volatility returned to the market, and the environment has become more favorable for stock pickers.
Stylistically, this was a standout period for us. Much of our success was due to our being positioned for a return to faster growth, higher rates, and inflation. We did very well in consumer stocks, in particular with companies that aren’t hurt by e-commerce-related competition, such as Ross Stores and Burlington Stores, and with restaurants that are benefiting from
5
e-commerce changes with mobile ordering and delivery services. Domino’s Pizza and Wingstop were big contributors.
Our overweight allocations to high-quality, medium-sized software companies seemed to benefit from the rotation away from the so-called FANG stocks—Facebook, Amazon, Netflix, and Google (now Alphabet).
Energy stocks were essentially the only drag on returns. We reduced our exposure to that sector in the prior six months, so its impact on the overall portfolio was minimal. Crude oil prices continued their rebound and, toward the end of the period, activity in North America was robust.
ClearBridge Investments, LLC
Portfolio Managers:
Brian Angerame, Managing Director
Derek Deutsch, CFA, Managing Director
Aram Green, Managing Director
Jeffrey Russell, CFA, Managing Director
Stock selection in the information technology and industrial sectors helped results most for the period.
GrubHub and Insulet were the leading contributors to performance. GrubHub is an online and mobile platform for takeout food ordering and restaurant delivery. Its shares were lifted by better-than-expected growth in the number of active diners and a transformative alliance
with fast-casual dining company Yum! Brands, which will dramatically expand GrubHub’s delivery network.
Insulet developed and commercialized an innovative tubeless insulin pump therapy to improve the lives of diabetes patients. Recent increases in the number of patients using the therapy drove the stock’s outperformance, along with other corporate developments. Core-Mark, a distributor of consumer goods primarily to convenience stores, detracted most from performance as its startup investments on newly won contracts proved to be larger than initially planned.
There were three strategic takeovers among companies in the portfolio during the six-month period. Buffalo Wild Wings, a fast-casual restaurant chain, was acquired by Roark Capital. Blue Buffalo Pet Products was acquired by General Mills. On the last day of the reporting period, Financial Engines agreed to be acquired by Hellman & Friedman.
ArrowMark Partners
Portfolio Managers: Chad Meade, Partner
Brian Schaub, CFA, Partner
U.S. stocks posted strong gains for the period, fueled by positive economic and earnings news and changes to corporate tax law. Volatility returned to the equity market in the first quarter of 2018, reflecting
6
concerns about rising U.S. interest rates and higher global trade barriers, both of which could hinder growth and spur inflation. We were pleased to see volatility return to the market, as our risk-first approach is particularly effective during heightened volatility. Our growth outlook is somewhat tempered by more demanding valuations as fundamentals and lower tax rates are more accurately reflected in security prices, especially in the technology and health care sectors.
The industrial sector remained our largest overweight position, and TriNet Group, a professional services business, was the top contributor. The company continued to benefit from benign health and workers compensation claims and past price increases. Consumer discretionary
holdings added to performance, particularly recently purchased apparel stocks with strong brands and healthy e-commerce growth. Relative performance also benefited from our underweight position in the materials sector.
Our lone consumer staples holding, Casey’s General Stores, and lone energy holding, RigNet, detracted. Casey’s was pressured by slower customer traffic related to weather and by poorly controlled expenses. RigNet suffered from continued weakness in the offshore drilling market and declining revenue per site. Negative exposure to the momentum factor also detracted from performance as we continue to stay disciplined regarding our valuation-based price targets.
7
Vanguard Explorer Fund Investment Advisors
| Fund Assets Managed | |||
| Investment Advisor | % | $Million | Investment Strategy |
| Wellington Management | 36 | 4,993 | Conducts research and analysis of individual |
| Company LLP | companies to select stocks believed to have | ||
| exceptional growth potential relative to their market | |||
| valuations. Each stock is considered individually | |||
| before purchase, and company developments are | |||
| continually monitored for comparison with | |||
| expectations for growth. | |||
| Vanguard Quantitative Equity | 16 | 2,239 | Employs a quantitative fundamental management |
| Group | approach, using models that assess valuation, growth | ||
| prospects, management decisions, market | |||
| sentiment, and earnings and balance-sheet quality of | |||
| companies as compared with their peers. | |||
| Stephens Investment | 15 | 2,111 | Employs a disciplined, bottom-up investment |
| Management Group, LLC | selection process that combines rigorous | ||
| fundamental analysis with quantitative screening to | |||
| identify companies with superior earnings growth | |||
| potential. The approach screens for core growth | |||
| stocks and for catalyst stocks. Core growth stocks | |||
| have strong growth franchises, recurring revenue, | |||
| and above-average growth rates; catalyst stocks are | |||
| experiencing changes that could lead to accelerated | |||
| earnings growth. | |||
| ClearBridge Investments, LLC | 15 | 2,109 | The firm seeks to invest in quality growth companies |
| that are category leaders (or have the ability to | |||
| become market leaders), and display capital allocation | |||
| discipline aimed at fueling long-term sustainable | |||
| growth. ClearBridge focuses on cash-flow-based | |||
| metrics to value companies, as well as revenue or | |||
| earnings multiples, relying on the most appropriate | |||
| valuation metrics for each company. This approach | |||
| aligns with the team’s style of investing in | |||
| cash-generative, quality growth companies. The | |||
| research process is disciplined and collaborative, with | |||
| each member of the team executing on a shared | |||
| investment philosophy and process. | |||
8
| Fund Assets Managed | |||
| Investment Advisor | % | $Million | Investment Strategy |
| ArrowMark Partners | 15 | 2,100 | The firm uses in-depth fundamental research to |
| uncover companies that, in its opinion, can control | |||
| their own economic destiny. The portfolio managers | |||
| start by identifying businesses with strong | |||
| competitive advantages in industries with high | |||
| barriers to entry, then narrow their focus to | |||
| companies with large potential markets and | |||
| high-quality business models focused on the future. | |||
| Finally, considerations are made for potential | |||
| downside risk, resulting in a diversified portfolio of | |||
| 75–100 stocks. | |||
| Cash Investments | 3 | 353 | These short-term reserves are invested by Vanguard |
| in equity index products to simulate investment in | |||
| stocks. Each advisor also may maintain a modest | |||
| cash position. | |||
9
Results of Proxy Voting
At a special meeting of shareholders on November 15, 2017, fund shareholders approved the following proposals:
Proposal 1—Elect trustees for the fund.*
The individuals listed in the table below were elected as trustees for the fund. All trustees with the exception of Ms. Mulligan, Ms. Raskin, and Mr. Buckley (each of whom already serves as a director of The Vanguard Group, Inc.) served as trustees to the funds prior to the shareholder meeting.
| Percentage | |||
| Trustee | For | Withheld | For |
| Mortimer J. Buckley | 89,240,658 | 2,494,593 | 97.3% |
| Emerson U. Fullwood | 89,125,318 | 2,609,933 | 97.2% |
| Amy Gutmann | 89,243,002 | 2,492,249 | 97.3% |
| JoAnn Heffernan Heisen | 89,237,123 | 2,498,129 | 97.3% |
| F. Joseph Loughrey | 89,207,176 | 2,528,076 | 97.2% |
| Mark Loughridge | 89,241,918 | 2,493,334 | 97.3% |
| Scott C. Malpass | 89,068,256 | 2,666,995 | 97.1% |
| F. William McNabb III | 89,172,729 | 2,562,522 | 97.2% |
| Deanna Mulligan | 89,245,746 | 2,489,505 | 97.3% |
| André F. Perold | 88,928,383 | 2,806,869 | 96.9% |
| Sarah Bloom Raskin | 89,202,467 | 2,532,785 | 97.2% |
| Peter F. Volanakis | 89,224,999 | 2,510,252 | 97.3% |
| * Results are for all funds within the same trust. |
Proposal 3—Approve a manager-of-managers arrangement with wholly owned subsidiaries of Vanguard.
This arrangement enables Vanguard or the fund to enter into and materially amend investment advisory arrangements with wholly owned subsidiaries of Vanguard, subject to the approval of the fund’s board of trustees and any conditions imposed by the Securities and Exchange Commission (SEC), while avoiding the costs and delays associated with obtaining future shareholder approval. The ability of the fund to operate in this manner is contingent upon the SEC’s approval of a pending application for an order of exemption.
| Broker | Percentage | ||||
| Vanguard Fund | For | Abstain | Against | Non-Votes | For |
| Explorer Fund | 80,654,442 | 3,110,359 | 2,754,130 | 5,216,321 | 87.9% |
10
Explorer Fund
Fund Profile
As of April 30, 2018
| Share-Class Characteristics | ||
| Investor | Admiral | |
| Shares | Shares | |
| Ticker Symbol | VEXPX | VEXRX |
| Expense Ratio1 | 0.44% | 0.32% |
| 30-Day SEC Yield | 0.31% | 0.43% |
| Portfolio Characteristics | |||
| Russell | DJ | ||
| 2500 | U.S. Total | ||
| Growth | Market | ||
| Fund | Index | FA Index | |
| Number of Stocks | 549 | 1,442 | 3,752 |
| Median Market Cap | $4.4B | $5.2B | $66.1B |
| Price/Earnings Ratio | 22.6x | 24.8x | 20.5x |
| Price/Book Ratio | 3.6x | 4.6x | 2.9x |
| Return on Equity | 10.1% | 12.6% | 15.0% |
| Earnings Growth | |||
| Rate | 13.8% | 16.6% | 8.4% |
| Dividend Yield | 0.7% | 0.8% | 1.8% |
| Foreign Holdings | 3.6% | 0.0% | 0.0% |
| Turnover Rate | |||
| (Annualized) | 51% | — | — |
| Short-Term | |||
| Reserves | 1.7% | — | — |
| Volatility Measures | ||
| Russell | DJ | |
| 2500 | U.S. Total | |
| Growth | Market | |
| Index | FA Index | |
| R-Squared | 0.97 | 0.80 |
| Beta | 0.95 | 1.07 |
These measures show the degree and timing of the fund’s fluctuations compared with the indexes over 36 months.
| Ten Largest Holdings (% of total net assets) | ||
| TriNet Group Inc. | Human Resource & | |
| Employment | ||
| Services | 1.1% | |
| Insulet Corp. | Health Care | |
| Equipment | 1.0 | |
| ICON plc | Life Sciences Tools | |
| & Services | 1.0 | |
| athenahealth Inc. | Health Care | |
| Technology | 0.8 | |
| Kirby Corp. | Marine | 0.8 |
| 2U Inc. | Internet Software & | |
| Services | 0.8 | |
| SVB Financial Group | Regional Banks | 0.7 |
| Medidata Solutions Inc. | Health Care | |
| Technology | 0.7 | |
| Sensata Technologies | Electrical | |
| Holding plc | Components & | |
| Equipment | 0.7 | |
| Cadence Design | ||
| Systems Inc. | Application Software | 0.6 |
| Top Ten | 8.2% | |
The holdings listed exclude any temporary cash investments and equity index products.
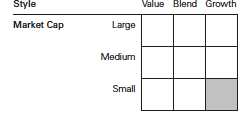
Investment Focus
1 The expense ratios shown are from the prospectus dated February 23, 2018, and represent estimated costs for the current fiscal year. For the six months ended April 30, 2018, the annualized expense ratios were 0.43% for Investor Shares and 0.31% for Admiral Shares.
11
Explorer Fund
| Sector Diversification (% of equity exposure) | |||
| Russell | DJ | ||
| 2500 | U.S. Total | ||
| Growth | Market | ||
| Fund | Index | FA Index | |
| Consumer | |||
| Discretionary | 14.8% | 14.6% | 13.1% |
| Consumer Staples | 2.3 | 2.1 | 6.3 |
| Energy | 2.1 | 1.6 | 6.0 |
| Financials | 7.9 | 7.7 | 15.1 |
| Health Care | 18.2 | 18.2 | 13.6 |
| Industrials | 20.8 | 19.3 | 10.5 |
| Information | |||
| Technology | 24.5 | 26.1 | 23.8 |
| Materials | 4.7 | 6.0 | 3.3 |
| Real Estate | 3.5 | 3.4 | 3.7 |
| Telecommunication | |||
| Services | 0.5 | 0.6 | 1.7 |
| Utilities | 0.7 | 0.4 | 2.9 |
Sector categories are based on the Global Industry Classification Standard (“GICS”), except for the “Other” category (if applicable), which includes securities that have not been provided a GICS classification as of the effective reporting period.
12
Explorer Fund
Performance Summary
All of the returns in this report represent past performance, which is not a guarantee of future results that may be achieved by the fund. (Current performance may be lower or higher than the performance data cited. For performance data current to the most recent month-end, visit our website at vanguard.com/performance.) Note, too, that both investment returns and principal value can fluctuate widely, so an investor’s shares, when sold, could be worth more or less than their original cost. The returns shown do not reflect taxes that a shareholder would pay on fund distributions or on the sale of fund shares.
Fiscal-Year Total Returns (%): October 31, 2007, Through April 30, 2018

Average Annual Total Returns: Periods Ended March 31, 2018
This table presents returns through the latest calendar quarter—rather than through the end of the fiscal period.
Securities and Exchange Commission rules require that we provide this information.
| Inception | One | Five | Ten | |
| Date | Year | Years | Years | |
| Investor Shares | 12/11/1967 | 20.61% | 12.89% | 10.62% |
| Admiral Shares | 11/12/2001 | 20.76 | 13.04 | 10.79 |
See Financial Highlights for dividend and capital gains information.
13
Explorer Fund
Financial Statements (unaudited)
Statement of Net Assets—Investments Summary
As of April 30, 2018
This Statement summarizes the fund’s holdings by asset type. Details are reported for each of the fund’s 50 largest individual holdings and for investments that, in total for any issuer, represent more than 1% of the fund’s net assets. The total value of smaller holdings is reported as a single amount within each category.
The fund reports a complete list of its holdings in regulatory filings four times in each fiscal year, at the quarter-ends. For the second and fourth fiscal quarters, the complete listing of the fund’s holdings is available electronically on vanguard.com and on the Securities and Exchange Commission’s website (sec.gov), or you can have it mailed to you without charge by calling 800-662-7447. For the first and third fiscal quarters, the fund files the lists with the SEC on Form N-Q. Shareholders can look up the fund’s Forms N-Q on the SEC’s website. Forms N-Q may also be reviewed and copied at the SEC’s Public Reference Room (see the back cover of this report for further information).
| Market | Percentage | |||
| Value• | of Net | |||
| Shares | ($000) | Assets | ||
| Common Stocks | ||||
| Consumer Discretionary | ||||
| * | Burlington Stores Inc. | 627,182 | 85,203 | 0.6% |
| Carter’s Inc. | 817,300 | 81,992 | 0.6% | |
| Cinemark Holdings Inc. | 1,990,992 | 77,987 | 0.6% | |
| New York Times Co. Class A | 3,269,202 | 76,663 | 0.6% | |
| * | Live Nation Entertainment Inc. | 1,891,407 | 74,654 | 0.5% |
| *,^ | Under Armour Inc. | 4,606,647 | 70,712 | 0.5% |
| Consumer Discretionary—Other † | 1,492,451 | 10.7% | ||
| 1,959,662 | 14.1% | |||
| Consumer Staples † | 302,174 | 2.2% | ||
| Energy | ||||
| *,^ | Jagged Peak Energy Inc. | 4,243,618 | 60,811 | 0.4% |
| Energy—Other † | 207,955 | 1.5% | ||
| 268,766 | 1.9% | |||
| Financials | ||||
| * | SVB Financial Group | 337,562 | 101,137 | 0.7% |
| Nasdaq Inc. | 915,604 | 80,866 | 0.6% | |
| Financial Engines Inc. | 1,776,097 | 79,303 | 0.6% | |
| Assured Guaranty Ltd. | 1,682,439 | 61,056 | 0.4% | |
| Financials—Other † | 676,186 | 4.9% | ||
| 998,548 | 7.2% | |||
| Health Care | ||||
| * | Insulet Corp. | 1,628,925 | 140,088 | 1.0% |
| * | ICON plc | 1,134,259 | 133,423 | 1.0% |
| * | athenahealth Inc. | 938,880 | 114,985 | 0.8% |
14
| Explorer Fund | ||||
| Market | Percentage | |||
| Value• | of Net | |||
| Shares | ($000) | Assets | ||
| * | Medidata Solutions Inc. | 1,390,480 | 99,225 | 0.7% |
| Encompass Health Corp. | 1,312,779 | 79,843 | 0.6% | |
| * | Haemonetics Corp. | 894,858 | 69,835 | 0.5% |
| * | Molina Healthcare Inc. | 778,434 | 64,805 | 0.5% |
| * | Globus Medical Inc. | 1,230,133 | 62,971 | 0.4% |
| Hill-Rom Holdings Inc. | 713,768 | 61,263 | 0.4% | |
| Health Care—Other † | 1,582,214 | 11.4% | ||
| 2,408,652 | 17.3% | |||
| Industrials | ||||
| * | TriNet Group Inc. | 2,846,274 | 147,010 | 1.1% |
| * | Kirby Corp. | 1,335,138 | 113,887 | 0.8% |
| * | Sensata Technologies Holding plc | 1,903,648 | 96,553 | 0.7% |
| * | Middleby Corp. | 670,470 | 84,372 | 0.6% |
| * | Teledyne Technologies Inc. | 430,655 | 80,571 | 0.6% |
| * | TransUnion | 1,058,228 | 68,690 | 0.5% |
| John Bean Technologies Corp. | 601,324 | 64,793 | 0.5% | |
| * | United Rentals Inc. | 426,630 | 63,994 | 0.5% |
| Woodward Inc. | 885,659 | 63,714 | 0.5% | |
| * | Copart Inc. | 1,235,220 | 63,095 | 0.4% |
| * | AerCap Holdings NV | 1,174,556 | 61,230 | 0.4% |
| * | Trex Co. Inc. | 578,150 | 60,058 | 0.4% |
| * | Chart Industries Inc. | 1,046,400 | 59,373 | 0.4% |
| Industrials—Other † | 1,730,547 | 12.4% | ||
| 2,757,887 | 19.8% | |||
| Information Technology | ||||
| * | 2U Inc. | 1,298,287 | 104,499 | 0.8% |
| * | Cadence Design Systems Inc. | 2,223,188 | 89,061 | 0.6% |
| * | First Solar Inc. | 1,238,219 | 87,802 | 0.6% |
| * | Fortinet Inc. | 1,510,296 | 83,610 | 0.6% |
| *,^ | GrubHub Inc. | 812,288 | 82,155 | 0.6% |
| MercadoLibre Inc. | 237,611 | 80,695 | 0.6% | |
| * | GoDaddy Inc. Class A | 1,189,317 | 76,782 | 0.6% |
| MAXIMUS Inc. | 1,113,299 | 75,292 | 0.5% | |
| * | HubSpot Inc. | 660,422 | 69,939 | 0.5% |
| *,1 | Cardtronics plc Class A | 2,589,959 | 67,986 | 0.5% |
| * | New Relic Inc. | 957,902 | 66,948 | 0.5% |
| * | ServiceNow Inc. | 387,852 | 64,438 | 0.5% |
| * | Ciena Corp. | 2,355,176 | 60,646 | 0.4% |
| Power Integrations Inc. | 873,292 | 59,209 | 0.4% | |
| 2 | Information Technology—Other † | 2,193,196 | 15.7% | |
| 3,262,258 | 23.4% | |||
| Materials | ||||
| Carpenter Technology Corp. | 1,347,430 | 71,764 | 0.5% | |
| Orion Engineered Carbons SA | 2,347,015 | 62,900 | 0.5% | |
| Materials—Other † | 485,264 | 3.5% | ||
| 619,928 | 4.5% | |||
| Other | ||||
| 3 | Vanguard Small-Cap ETF | 900,910 | 132,857 | 1.0% |
| ^,3 | Vanguard Small-Cap Growth ETF | 384,700 | 63,233 | 0.4% |
| 4 | Other—Other † | 268 | 0.0% | |
| 196,358 | 1.4% | |||
15
| Explorer Fund | |||||
| Market | Percentage | ||||
| Value• | of Net | ||||
| Shares | ($000) | Assets | |||
| Real Estate | |||||
| * SBA Communications Corp. Class A | 448,184 | 71,812 | 0.5% | ||
| Real Estate—Other † | 398,935 | 2.9% | |||
| 470,747 | 3.4% | ||||
| Telecommunication Services † | 66,246 | 0.5% | |||
| Utilities † | 73,194 | 0.5% | |||
| Total Common Stocks (Cost $10,384,312) | 13,384,420 | 96.2%5 | |||
| Coupon | |||||
| Temporary Cash Investments | |||||
| Money Market Fund | |||||
| 6,7 Vanguard Market Liquidity Fund | 1.886% | 7,144,632 | 714,463 | 5.2% | |
| Face | |||||
| Maturity | Amount | ||||
| Date | ($000) | ||||
| Repurchase Agreement | |||||
| Deutsche Bank Securities, Inc. | |||||
| (Dated 4/30/18, Repurchase | |||||
| Value $60,803,000, collateralized | |||||
| by U. S. Treasury Note/Bond | |||||
| 3.750%, 8/15/41, with a value | |||||
| of $62,016,000) | 1.730% | 5/1/18 | 60,800 | 60,800 | 0.4% |
| 8U.S. Government and Agency Obligations † | 14,377 | 0.1% | |||
| Total Temporary Cash Investments (Cost $789,579) | 789,640 | 5.7%5 | |||
| Total Investments (Cost $11,173,891) | 14,174,060 | 101.9% | |||
| Other Assets and Liabilities | |||||
| Other Assets 8 | 69,663 | 0.5% | |||
| Liabilities7 | (339,223) | (2.4%) | |||
| (269,560) | (1.9%) | ||||
| Net Assets | 13,904,500 | 100.0% | |||
16
| Explorer Fund | |
| Amount | |
| ($000) | |
| Statement of Assets and Liabilities | |
| Assets | |
| Investments in Securities, at Value | |
| Unaffiliated Issuers | 13,195,521 |
| Affiliated Issuers | 978,539 |
| Total Investments in Securities | 14,174,060 |
| Investment in Vanguard | 751 |
| Receivables for Investment Securities Sold | 48,108 |
| Receivables for Accrued Income | 2,986 |
| Receivables for Capital Shares Issued | 10,265 |
| Other Assets 8 | 7,553 |
| Total Assets | 14,243,723 |
| Liabilities | |
| Payables for Investment Securities Purchased | 41,550 |
| Collateral for Securities on Loan | 261,176 |
| Payables to Investment Advisor | 5,919 |
| Payables for Capital Shares Redeemed | 6,484 |
| Payables to Vanguard | 21,266 |
| Variation Margin Payable—Futures Contracts | 2,828 |
| Total Liabilities | 339,223 |
| Net Assets | 13,904,500 |
| At April 30, 2018, net assets consisted of: | |
| Amount | |
| ($000) | |
| Paid-in Capital | 10,236,379 |
| Overdistributed Net Investment Income | (4,390) |
| Accumulated Net Realized Gains | 679,472 |
| Unrealized Appreciation (Depreciation) | |
| Investment Securities | 3,000,169 |
| Futures Contracts | (7,110) |
| Foreign Currencies | (20) |
| Net Assets | 13,904,500 |
17
Explorer Fund
| Amount | |
| ($000) | |
| Investor Shares—Net Assets | |
| Applicable to 35,629,175 outstanding $.001 par value shares of | |
| beneficial interest (unlimited authorization) | 3,535,006 |
| Net Asset Value Per Share—Investor Shares | $99.22 |
| Admiral Shares—Net Assets | |
| Applicable to 112,271,267 outstanding $.001 par value shares of | |
| beneficial interest (unlimited authorization) | 10,369,494 |
| Net Asset Value Per Share—Admiral Shares | $92.36 |
• See Note A in Notes to Financial Statements.
* Non-income-producing security.
^ Includes partial security positions on loan to broker-dealers. The total value of securities on loan is $251,285,000.
† Represents the aggregate value, by category, of securities that are not among the 50 largest holdings and, in total for any issuer,
represent 1% or less of net assets.
1 Considered an affiliated company of the fund as the fund owns more than 5% of the outstanding voting securities of such company.
2 Includes restricted security representing 0.0% of net assets. See Restricted Security table for additional information.
3 Considered an affiliated company of the fund as the issuer is another member of The Vanguard Group.
4 Certain of the fund’s securities are valued using significant unobservable inputs.
5 The fund invests a portion of its cash reserves in equity markets through the use of index futures contracts. After giving effect
to futures investments, the fund’s effective common stock and temporary cash investment positions represent 98.4% and 3.5%,
respectively, of net assets.
6 Affiliated money market fund available only to Vanguard funds and certain trusts and accounts managed by Vanguard. Rate shown
is the 7-day yield.
7 Includes $261,176,000 of collateral received for securities on loan.
8 Securities with a value of $13,482,000 and cash of $26,000 have been segregated as initial margin for open futures contracts.
| Restricted Security as of Period End | ||
| Acquisition | ||
| Acquisition | Cost | |
| Security Name | Date | ($000) |
| Dropbox Inc. Class A | May 2012 | 1,615 |
18
| Explorer Fund | ||||
| Derivative Financial Instruments Outstanding as of Period End | ||||
| Futures Contracts | ||||
| ($000) | ||||
| Value and | ||||
| Number of | Unrealized | |||
| Long (Short) | Notional | Appreciation | ||
| Expiration | Contracts | Amount | (Depreciation) | |
| Long Futures Contracts | ||||
| E-mini Russell 2000 Index | June 2018 | 3,797 | 293,090 | (7,110) |
Unrealized appreciation (depreciation) on open futures contracts is required to be treated as realized gain (loss) for tax purposes.
See accompanying Notes, which are an integral part of the Financial Statements.
19
| Explorer Fund | |
| Statement of Operations | |
| Six Months Ended | |
| April 30, 2018 | |
| ($000) | |
| Investment Income | |
| Income | |
| Dividends—Unaffiliated Issuers1 | 39,237 |
| Dividends—Affiliated Issuers | 1,594 |
| Interest—Unaffiliated Issuers | 488 |
| Interest—Affiliated Issuers | 2,796 |
| Securities Lending—Net | 6,012 |
| Total Income | 50,127 |
| Expenses | |
| Investment Advisory Fees—Note B | |
| Basic Fee | 11,964 |
| Performance Adjustment | 133 |
| The Vanguard Group—Note C | |
| Management and Administrative—Investor Shares | 4,125 |
| Management and Administrative—Admiral Shares | 6,179 |
| Marketing and Distribution—Investor Shares | 244 |
| Marketing and Distribution—Admiral Shares | 286 |
| Custodian Fees | 74 |
| Shareholders’ Reports and Proxy—Investor Shares | 27 |
| Shareholders’ Reports and Proxy—Admiral Shares | 52 |
| Trustees’ Fees and Expenses | 12 |
| Total Expenses | 23,096 |
| Net Investment Income | 27,031 |
| Realized Net Gain (Loss) | |
| Investment Securities Sold—Unaffiliated Issuers | 677,320 |
| Investment Securities Sold—Affiliated Issuers | (6,278) |
| Futures Contracts | 13,613 |
| Foreign Currencies | (55) |
| Realized Net Gain (Loss) | 684,600 |
| Change in Unrealized Appreciation (Depreciation) | |
| Investment Securities—Unaffiliated Issuers | 407,798 |
| Investment Securities—Affiliated Issuers | 33,927 |
| Futures Contracts | (11,386) |
| Foreign Currencies | (19) |
| Change in Unrealized Appreciation (Depreciation) | 430,320 |
| Net Increase (Decrease) in Net Assets Resulting from Operations | 1,141,951 |
| 1 Dividends are net of foreign withholding taxes of $311,000. | |
| See accompanying Notes, which are an integral part of the Financial Statements. | |
20
| Explorer Fund | ||
| Statement of Changes in Net Assets | ||
| Six Months Ended | Year Ended | |
| April 30, | October 31, | |
| 2018 | 2017 | |
| ($000) | ($000) | |
| Increase (Decrease) in Net Assets | ||
| Operations | ||
| Net Investment Income | 27,031 | 64,452 |
| Realized Net Gain (Loss) | 684,600 | 1,498,818 |
| Change in Unrealized Appreciation (Depreciation) | 430,320 | 1,285,151 |
| Net Increase (Decrease) in Net Assets Resulting from Operations | 1,141,951 | 2,848,421 |
| Distributions | ||
| Net Investment Income | ||
| Investor Shares | (15,839) | (12,371) |
| Admiral Shares | (44,212) | (37,862) |
| Realized Capital Gain1 | ||
| Investor Shares | (363,510) | (138,868) |
| Admiral Shares | (1,024,156) | (311,675) |
| Return of Capital | ||
| Total Distributions | (1,447,717) | (500,776) |
| Capital Share Transactions | ||
| Investor Shares | 96,605 | (495,947) |
| Admiral Shares | 1,079,470 | 362,658 |
| Net Increase (Decrease) from Capital Share Transactions | 1,176,075 | (133,289) |
| Total Increase (Decrease) | 870,309 | 2,214,356 |
| Net Assets | ||
| Beginning of Period | 13,034,191 | 10,819,835 |
| End of Period2 | 13,904,500 | 13,034,191 |
1 Includes fiscal 2018 and 2017 short-term gain distributions totaling $300,088,000 and $0, respectively. Short-term gain
distributions are treated as ordinary income dividends for tax purposes.
2 Net Assets—End of Period includes undistributed (overdistributed) net investment income of ($4,390,000) and $28,685,000.
See accompanying Notes, which are an integral part of the Financial Statements.
21
| Explorer Fund | ||||||
| Financial Highlights | ||||||
| Investor Shares | ||||||
| Six Months | ||||||
| Ended | ||||||
| For a Share Outstanding | April 30, | Year Ended October 31, | ||||
| Throughout Each Period | 2018 | 2017 | 2016 | 2015 | 2014 | 2013 |
| Net Asset Value, Beginning of Period | $102.10 | $83.91 | $90.55 | $105.28 | $107.96 | $78.03 |
| Investment Operations | ||||||
| Net Investment Income | .1551 | .4211 | .393 | .281 | .120 | .2192 |
| Net Realized and Unrealized Gain (Loss) | ||||||
| on Investments | 8.332 | 21.657 | 1.581 | (.900) | 8.062 | 32.286 |
| Total from Investment Operations | 8.487 | 22.078 | 1.974 | (.619) | 8.182 | 32.505 |
| Distributions | ||||||
| Dividends from Net Investment Income | (. 475) | (. 318) | (. 270) | (.152) | (. 040) | (. 272) |
| Distributions from Realized Capital Gains | (10.892) | (3.570) | (8.344) | (13.959) | (10.822) | (2.303) |
| Total Distributions | (11.367) | (3.888) | (8.614) | (14.111) | (10.862) | (2.575) |
| Net Asset Value, End of Period | $99.22 | $102.10 | $83.91 | $90.55 | $105.28 | $107.96 |
| Total Return3 | 8.79% | 27.10% | 2.47% | -0.62% | 8.20% | 42.89% |
| Ratios/Supplemental Data | ||||||
| Net Assets, End of Period (Millions) | $3,535 | $3,520 | $3,324 | $3,863 | $4,623 | $5,573 |
| Ratio of Total Expenses to | ||||||
| Average Net Assets4 | 0.43% | 0.43% | 0.45% | 0.48% | 0.51% | 0.50% |
| Ratio of Net Investment Income to | ||||||
| Average Net Assets | 0.36% | 0.45% | 0.46% | 0.27% | 0.12% | 0.27%2 |
| Portfolio Turnover Rate | 51% | 76% | 66% | 62% | 66% | 65% |
The expense ratio, net investment income ratio, and turnover rate for the current period have been annualized.
1 Calculated based on average shares outstanding.
2 Net investment income per share and the ratio of net investment income to average net assets include $.038 and 0.03%,
respectively, resulting from a special dividend from HFF Inc. in December 2012.
3 Total returns do not include account service fees that may have applied in the periods shown. Fund prospectuses provide information
about any applicable account service fees.
4 Includes performance-based investment advisory fee increases (decreases) of 0.00%, (0.01%), (0.02%), (0.02%), 0.00%, and 0.00%.
See accompanying Notes, which are an integral part of the Financial Statements.
22
| Explorer Fund | ||||||
| Financial Highlights | ||||||
| Admiral Shares | ||||||
| Six Months | ||||||
| Ended | ||||||
| For a Share Outstanding | April 30, | Year Ended October 31, | ||||
| Throughout Each Period | 2018 | 2017 | 2016 | 2015 | 2014 | 2013 |
| Net Asset Value, Beginning of Period | $94.99 | $78.07 | $84.28 | $98.03 | $100.54 | $72.68 |
| Investment Operations | ||||||
| Net Investment Income | .1971 | .4951 | .473 | .402 | . 302 | . 3752 |
| Net Realized and Unrealized Gain (Loss) | ||||||
| on Investments | 7.746 | 20.145 | 1.455 | (.853) | 7.466 | 30.019 |
| Total from Investment Operations | 7.943 | 20.640 | 1.928 | (.451) | 7.768 | 30.394 |
| Distributions | ||||||
| Dividends from Net Investment Income | (. 438) | (. 403) | (. 383) | (. 324) | (. 216) | (. 392) |
| Distributions from Realized Capital Gains | (10.135) | (3.317) | (7.755) | (12.975) | (10.062) | (2.142) |
| Total Distributions | (10.573) | (3.720) | (8.138) | (13.299) | (10.278) | (2.534) |
| Net Asset Value, End of Period | $92.36 | $94.99 | $78.07 | $84.28 | $98.03 | $100.54 |
| Total Return3 | 8.85% | 27.25% | 2.60% | -0.48% | 8.37% | 43.13% |
| Ratios/Supplemental Data | ||||||
| Net Assets, End of Period (Millions) | $10,369 | $9,514 | $7,496 | $7,577 | $7,670 | $6,497 |
| Ratio of Total Expenses to | ||||||
| Average Net Assets4 | 0.31% | 0.31% | 0.33% | 0.34% | 0.35% | 0.34% |
| Ratio of Net Investment Income to | ||||||
| Average Net Assets | 0.48% | 0.57% | 0.58% | 0.41% | 0.28% | 0.43%2 |
| Portfolio Turnover Rate | 51% | 76% | 66% | 62% | 66% | 65% |
The expense ratio, net investment income ratio, and turnover rate for the current period have been annualized.
1 Calculated based on average shares outstanding.
2 Net investment income per share and the ratio of net investment income to average net assets include $.019 and 0.03%,
respectively, resulting from a special dividend from HFF Inc. in December 2012.
3 Total returns do not include account service fees that may have applied in the periods shown. Fund prospectuses provide
information about any applicable account service fees.
4 Includes performance-based investment advisory fee increases (decreases) of 0.00%, (0.01%), (0.02%), (0.02%), 0.00%, and 0.00%.
See accompanying Notes, which are an integral part of the Financial Statements.
23
Explorer Fund
Notes to Financial Statements
Vanguard Explorer Fund is registered under the Investment Company Act of 1940 as an open-end investment company, or mutual fund. The fund offers two classes of shares: Investor Shares and Admiral Shares. Investor Shares are available to any investor who meets the fund’s minimum purchase requirements. Admiral Shares are designed for investors who meet certain administrative, service, and account-size criteria.
A. The following significant accounting policies conform to generally accepted accounting principles for U.S. investment companies. The fund consistently follows such policies in preparing its financial statements.
1. Security Valuation: Securities are valued as of the close of trading on the New York Stock Exchange (generally 4 p.m., Eastern time) on the valuation date. Equity securities are valued at the latest quoted sales prices or official closing prices taken from the primary market in which each security trades; such securities not traded on the valuation date are valued at the mean of the latest quoted bid and asked prices. Securities for which market quotations are not readily available, or whose values have been affected by events occurring before the fund’s pricing time but after the close of the securities’ primary markets, are valued at their fair values calculated according to procedures adopted by the board of trustees. These procedures include obtaining quotations from an independent pricing service, monitoring news to identify significant market-or security-specific events, and evaluating changes in the values of foreign market proxies (for example, ADRs, futures contracts, or exchange-traded funds), between the time the foreign markets close and the fund’s pricing time. When fair-value pricing is employed, the prices of securities used by a fund to calculate its net asset value may differ from quoted or published prices for the same securities. Investments in Vanguard Market Liquidity Fund are valued at that fund’s net asset value. Temporary cash investments are valued using the latest bid prices or using valuations based on a matrix system (which considers such factors as security prices, yields, maturities, and ratings), both as furnished by independent pricing services.
2. Foreign Currency: Securities and other assets and liabilities denominated in foreign currencies are translated into U.S. dollars using exchange rates obtained from an independent third party as of the fund’s pricing time on the valuation date. Realized gains (losses) and unrealized appreciation (depreciation) on investment securities include the effects of changes in exchange rates since the securities were purchased, combined with the effects of changes in security prices. Fluctuations in the value of other assets and liabilities resulting from changes in exchange rates are recorded as unrealized foreign currency gains (losses) until the assets or liabilities are settled in cash, at which time they are recorded as realized foreign currency gains (losses).
3. Futures Contracts: The fund uses index futures contracts to a limited extent, with the objective of maintaining full exposure to the stock market while maintaining liquidity. The fund may purchase or sell futures contracts to achieve a desired level of investment, whether to accommodate portfolio turnover or cash flows from capital share transactions. The primary risks associated with the use of futures contracts are imperfect correlation between changes in market values of stocks held by the fund and the prices of futures contracts, and the possibility of an illiquid market. Counterparty risk involving futures is mitigated because a regulated clearinghouse is the counterparty instead of the clearing broker. To further mitigate counterparty risk, the fund trades futures contracts on an exchange, monitors the financial strength of its clearing brokers and clearinghouse, and has
24
Explorer Fund
entered into clearing agreements with its clearing brokers. The clearinghouse imposes initial margin requirements to secure the fund’s performance and requires daily settlement of variation margin representing changes in the market value of each contract.
Futures contracts are valued at their quoted daily settlement prices. The notional amounts of the contracts are not recorded in the Statement of Net Assets. Fluctuations in the value of the contracts are recorded in the Statement of Assets and Liabilities as an asset (liability) and in the Statement of Operations as unrealized appreciation (depreciation) until the contracts are closed, when they are recorded as realized futures gains (losses).
During the six months ended April 30, 2018, the fund’s average investments in long and short futures contracts represented 2% and 0% of net assets, respectively, based on the average of the notional amounts at each quarter-end during the period.
4. Repurchase Agreements: The fund enters into repurchase agreements with institutional counterparties. Securities pledged as collateral to the fund under repurchase agreements are held by a custodian bank until the agreements mature, and in the absence of a default, such collateral cannot be repledged, resold, or rehypothecated. Each agreement requires that the market value of the collateral be sufficient to cover payments of interest and principal. The fund further mitigates its counterparty risk by entering into repurchase agreements only with a diverse group of prequalified counterparties, monitoring their financial strength, and entering into master repurchase agreements with its counterparties. The master repurchase agreements provide that, in the event of a counterparty’s default (including bankruptcy), the fund may terminate any repurchase agreements with that counterparty, determine the net amount owed, and sell or retain the collateral up to the net amount owed to the fund. Such action may be subject to legal proceedings, which may delay or limit the disposition of collateral.
5. Federal Income Taxes: The fund intends to continue to qualify as a regulated investment company and distribute all of its taxable income. Management has analyzed the fund’s tax positions taken for all open federal income tax years (October 31, 2014–2017), and for the period ended April 30, 2018, and has concluded that no provision for federal income tax is required in the fund’s financial statements.
6. Distributions: Distributions to shareholders are recorded on the ex-dividend date.
7. Securities Lending: To earn additional income, the fund lends its securities to qualified institutional borrowers. Security loans are subject to termination by the fund at any time, and are required to be secured at all times by collateral in an amount at least equal to the market value of securities loaned. Daily market fluctuations could cause the value of loaned securities to be more or less than the value of the collateral received. When this occurs, the collateral is adjusted and settled before the opening of the market on the next business day. The fund further mitigates its counterparty risk by entering into securities lending transactions only with a diverse group of prequalified counterpar-ties, monitoring their financial strength, and entering into master securities lending agreements with its counterparties. The master securities lending agreements provide that, in the event of a counterparty’s default (including bankruptcy), the fund may terminate any loans with that borrower, determine the net amount owed, and sell or retain the collateral up to the net amount owed to the fund; however, such actions may be subject to legal proceedings. While collateral mitigates
25
Explorer Fund
counterparty risk, in the event of a default, the fund may experience delays and costs in recovering the securities loaned. The fund invests cash collateral received in Vanguard Market Liquidity Fund, and records a liability in the Statement of Assets and Liabilities for the return of the collateral, during the period the securities are on loan. Securities lending income represents fees charged to borrowers plus income earned on invested cash collateral, less expenses associated with the loan. During the term of the loan, the fund is entitled to all distributions made on or in respect of the loaned securities.
8. Credit Facility: The fund and certain other funds managed by The Vanguard Group (“Vanguard”) participate in a $3.1 billion committed credit facility provided by a syndicate of lenders pursuant to a credit agreement that may be renewed annually; each fund is individually liable for its borrowings, if any, under the credit facility. Borrowings may be utilized for temporary and emergency purposes, and are subject to the fund’s regulatory and contractual borrowing restrictions. The participating funds are charged administrative fees and an annual commitment fee of 0.10% of the undrawn amount of the facility; these fees are allocated to the funds based on a method approved by the fund’s board of trustees and included in Management and Administrative expenses on the fund’s Statement of Operations. Any borrowings under this facility bear interest at a rate based upon the higher of the one-month London Interbank Offered Rate, federal funds effective rate, or overnight bank funding rate plus an agreed-upon spread.
The fund had no borrowings outstanding at April 30, 2018, or at any time during the period then ended.
9. Other: Dividend income is recorded on the ex-dividend date. Interest income includes income distributions received from Vanguard Market Liquidity Fund and is accrued daily. Premiums and discounts on debt securities purchased are amortized and accreted, respectively, to interest income over the lives of the respective securities. Security transactions are accounted for on the date securities are bought or sold. Costs used to determine realized gains (losses) on the sale of investment securities are those of the specific securities sold.
Each class of shares has equal rights as to assets and earnings, except that each class separately bears certain class-specific expenses related to maintenance of shareholder accounts (included in Management and Administrative expenses), shareholder reporting, and the proxy. Marketing and distribution expenses are allocated to each class of shares based on a method approved by the board of trustees. Income, other non-class-specific expenses, and gains and losses on investments are allocated to each class of shares based on its relative net assets.
B. The investment advisory firms Wellington Management Company LLP, Stephens Investment Management Group, LLC, ClearBridge Investments, LLC, and ArrowMark Colorado Holdings, LLC, each provide investment advisory services to a portion of the fund for a fee calculated at an annual percentage rate of average net assets managed by the advisor. The basic fee of Wellington Management Company LLP is subject to quarterly adjustments based on performance relative to the Russell 2500 Growth Index for the preceding three years. The basic fee of Stephens Investment Management Group, LLC, is subject to quarterly adjustments based on performance relative to the Russell 2500 Growth Index since October 31, 2013. In accordance with the advisory contract entered into with ClearBridge Investments, LLC, beginning May 1, 2018, the basic fee will be
26
Explorer Fund
subject to quarterly adjustments based on performance relative to the Russell 2500 Growth Index since April 30, 2017. The basic fee of ArrowMark Colorado Holdings, LLC, is subject to quarterly adjustments based on performance relative to the Russell 2500 Growth Index since July 31, 2014.
Vanguard provides investment advisory services to a portion of the fund as described below; the fund paid Vanguard advisory fees of $592,000 for the six months ended April 30, 2018.
For the six months ended April 30, 2018, the aggregate investment advisory fee paid to all advisors represented an effective annual basic rate of 0.18% of the fund’s average net assets, before an increase of $133,000 (0.00%) based on performance.
C. In accordance with the terms of a Funds’ Service Agreement (the “FSA”) between Vanguard and the fund, Vanguard furnishes to the fund investment advisory, corporate management, administrative, marketing, and distribution services at Vanguard’s cost of operations (as defined by the FSA). These costs of operations are allocated to the fund based on methods and guidelines approved by the board of trustees. Vanguard does not require reimbursement in the current period for certain costs of operations (such as deferred compensation/benefits and risk/insurance costs); the fund’s liability for these costs of operations is included in Payables to Vanguard on the Statement of Assets and Liabilities. All other costs of operations payable to Vanguard are generally settled twice a month.
Upon the request of Vanguard, the fund may invest up to 0.40% of its net assets as capital in Vanguard. At April 30, 2018, the fund had contributed to Vanguard capital in the amount of $751,000, representing 0.01% of the fund’s net assets and 0.30% of Vanguard’s capitalization. The fund’s trustees and officers are also directors and employees, respectively, of Vanguard.
D. Various inputs may be used to determine the value of the fund’s investments. These inputs are summarized in three broad levels for financial statement purposes. The inputs or methodologies used to value securities are not necessarily an indication of the risk associated with investing in those securities.
Level 1—Quoted prices in active markets for identical securities.
Level 2—Other significant observable inputs (including quoted prices for similar securities, interest rates, prepayment speeds, credit risk, etc.).
Level 3—Significant unobservable inputs (including the fund’s own assumptions used to determine the fair value of investments). Any investments valued with significant unobservable inputs are noted on the Statement of Net Assets.
The following table summarizes the market value of the fund’s investments as of April 30, 2018, based on the inputs used to value them:
| Level 1 | Level 2 | Level 3 | |
| Investments | ($000) | ($000) | ($000) |
| Common Stocks | 13,329,454 | 54,698 | 268 |
| Temporary Cash Investments | 714,463 | 75,177 | — |
| Futures Contracts—Liabilities1 | (2,828) | — | — |
| Total | 14,041,089 | 129,875 | 268 |
| 1 Represents variation margin on the last day of the reporting period. | |||
27
Explorer Fund
E. Distributions are determined on a tax basis and may differ from net investment income and realized capital gains for financial reporting purposes. Differences may be permanent or temporary. Permanent differences are reclassified among capital accounts in the financial statements to reflect their tax character. Temporary differences arise when certain items of income, expense, gain, or loss are recognized in different periods for financial statement and tax purposes. These differences will reverse at some time in the future. Differences in classification may also result from the treatment of short-term gains as ordinary income for tax purposes. The fund’s tax-basis capital gains and losses are determined only at the end of each fiscal year.
At April 30, 2018, the cost of investment securities for tax purposes was $11,173,891,000. Net unrealized appreciation of investment securities for tax purposes was $3,000,169,000, consisting of unrealized gains of $3,507,866,000 on securities that had risen in value since their purchase and $507,697,000 in unrealized losses on securities that had fallen in value since their purchase.
F. During the six months ended April 30, 2018, the fund purchased $3,350,024,000 of investment securities and sold $3,781,962,000 of investment securities, other than temporary cash investments.
| G. Capital share transactions for each class of shares were: | ||||
| Six Months Ended | Year Ended | |||
| April 30, 2018 | October 31, 2017 | |||
| Amount | Shares | Amount | Shares | |
| ($000) | (000) | ($000) | (000) | |
| Investor Shares | ||||
| Issued | 206,815 | 2,082 | 241,157 | 2,593 |
| Issued in Lieu of Cash Distributions | 372,091 | 3,912 | 148,985 | 1,706 |
| Redeemed | (482,301) | (4,840) | (886,089) | (9,437) |
| Net Increase (Decrease)—Investor Shares | 96,605 | 1,154 | (495,947) | (5,138) |
| Admiral Shares | ||||
| Issued | 855,677 | 9,250 | 1,314,009 | 15,041 |
| Issued in Lieu of Cash Distributions | 995,253 | 11,246 | 325,490 | 4,011 |
| Redeemed | (771,460) | (8,386) | (1,276,841) | (14,911) |
| Net Increase (Decrease)—Admiral Shares | 1,079,470 | 12,110 | 362,658 | 4,141 |
28
Explorer Fund
H. Certain of the fund’s investments are in companies that are considered to be affiliated companies of the fund because the fund owns more than 5% of the outstanding voting securities of the company or the issuer is another member of The Vanguard Group. Transactions during the period in securities of these companies were as follows:
| Current Period Transactions | ||||||||
| Oct. 31, | Proceeds | Realized | April 30, | |||||
| 2017 | from | Net | Change in | Capital Gain | 2018 | |||
| Market | Purchases | Securities | Gain | Unrealized | Distributions | Market | ||
| Value | at Cost | Sold | (Loss) | App. (Dep.) | Income | Received | Value | |
| ($000) | ($000) | ($000) | ($000) | ($000) | ($000) | ($000) | ($000) | |
| Cardtronics plc Class A NA1 | 13,454 | — | — | 7,380 | — | — | 67,986 | |
| Kindred | ||||||||
| Healthcare Inc. | 30,653 | — | 45,746 | (4,877) | 19,970 | — | — | — |
| Vanguard Market | ||||||||
| Liquidity Fund | 565,395 | NA 2 | NA 2 | (128) | 61 | 2,796 | — | 714,463 |
| Vanguard | ||||||||
| Small-Cap ETF | 68,655 | 307,070 | 244,964 | (1,273) | 3,369 | 1,290 | — | 132,857 |
| Vanguard | ||||||||
| Small-Cap | ||||||||
| Growth ETF | 60,086 | — | — | — | 3,147 | 304 | — | 63,233 |
| Total | 724,789 | (6,278) | 33,927 | 4,390 | — | 978,539 | ||
1 Not applicable—at October 31, 2017, the issuer was not an affiliated company of the fund, but it was affiliated during the year.
2 Not applicable—purchases and sales are for temporary cash investment purposes.
I. Management has determined that no material events or transactions occurred subsequent to April 30, 2018, that would require recognition or disclosure in these financial statements.
29
About Your Fund’s Expenses
As a shareholder of the fund, you incur ongoing costs, which include costs for portfolio management, administrative services, and shareholder reports (like this one), among others. Operating expenses, which are deducted from a fund’s gross income, directly reduce the investment return of the fund.
A fund’s expenses are expressed as a percentage of its average net assets. This figure is known as the expense ratio. The following examples are intended to help you understand the ongoing costs (in dollars) of investing in your fund and to compare these costs with those of other mutual funds. The examples are based on an investment of $1,000 made at the beginning of the period shown and held for the entire period.
The accompanying table illustrates your fund’s costs in two ways:
• Based on actual fund return. This section helps you to estimate the actual expenses that you paid over the period. The ”Ending Account Value“ shown is derived from the fund‘s actual return, and the third column shows the dollar amount that would have been paid by an investor who started with $1,000 in the fund. You may use the information here, together with the amount you invested, to estimate the expenses that you paid over the period.
To do so, simply divide your account value by $1,000 (for example, an $8,600 account value divided by $1,000 = 8.6), then multiply the result by the number given for your fund under the heading ”Expenses Paid During Period.“
• Based on hypothetical 5% yearly return. This section is intended to help you compare your fund‘s costs with those of other mutual funds. It assumes that the fund had a yearly return of 5% before expenses, but that the expense ratio is unchanged. In this case—because the return used is not the fund’s actual return—the results do not apply to your investment. The example is useful in making comparisons because the Securities and Exchange Commission requires all mutual funds to calculate expenses based on a 5% return. You can assess your fund’s costs by comparing this hypothetical example with the hypothetical examples that appear in shareholder reports of other funds.
Note that the expenses shown in the table are meant to highlight and help you compare ongoing costs only and do not reflect transaction costs incurred by the fund for buying and selling securities. Further, the expenses do not include any purchase, redemption, or account service fees described in the fund prospectus. If such fees were applied to your account, your costs would be higher. Your fund does not carry a “sales load.”
The calculations assume no shares were bought or sold during the period. Your actual costs may have been higher or lower, depending on the amount of your investment and the timing of any purchases or redemptions.
You can find more information about the fund’s expenses, including annual expense ratios, in the Financial Statements section of this report. For additional information on operating expenses and other shareholder costs, please refer to your fund’s current prospectus.
30
| Six Months Ended April 30, 2018 | |||
| Beginning | Ending | Expenses | |
| Account Value | Account Value | Paid During | |
| Explorer Fund | 10/31/2017 | 4/30/2018 | Period |
| Based on Actual Fund Return | |||
| Investor Shares | $1,000.00 | $1,087.93 | $2.23 |
| Admiral Shares | 1,000.00 | 1,088.46 | 1.61 |
| Based on Hypothetical 5% Yearly Return | |||
| Investor Shares | $1,000.00 | $1,022.66 | $2.16 |
| Admiral Shares | 1,000.00 | 1,023.26 | 1.56 |
The calculations are based on expenses incurred in the most recent six-month period. The fund’s annualized six-month expense ratios for that period are 0.43% for Investor Shares and 0.31% for Admiral Shares. The dollar amounts shown as “Expenses Paid” are equal to the annualized expense ratio multiplied by the average account value over the period, multiplied by the number of days in the most recent six-month period, then divided by the number of days in the most recent 12-month period (181/365).
31
Trustees Approve Advisory Arrangements
The board of trustees of Vanguard Explorer Fund has renewed the fund’s investment advisory arrangements with ArrowMark Colorado Holdings, LLC (ArrowMark Partners); ClearBridge Investments, LLC (ClearBridge); Stephens Investment Management Group, LLC (SIMG); Wellington Management Company LLP (Wellington Management); and The Vanguard Group, Inc. (Vanguard), through its Quantitative Equity Group. The board determined that renewing the fund’s advisory arrangements was in the best interests of the fund and its shareholders.
The board based its decision upon an evaluation of each advisor’s investment staff, portfolio management process, and performance. This evaluation included information provided to the board by Vanguard’s Portfolio Review Department, which is responsible for fund and advisor oversight and product management. The Portfolio Review Department met regularly with the advisors and made monthly presentations to the board during the fiscal year that directed the board’s focus to relevant information and topics.
The board, or an investment committee made up of board members, also received information throughout the year during advisor presentations. For each advisor presentation, the board was provided with letters and reports that included information about, among other things, the advisory firm and the advisor’s assessment of the investment environment, portfolio performance, and portfolio characteristics.
In addition, the board received monthly reports, which included a Market and Economic Report, a Fund Dashboard Monthly Summary, and a Fund Performance Report.
Prior to their meeting, the trustees were provided with a memo and materials that summarized the information they received over the course of the year. They also considered the factors discussed below, among others. However, no single factor determined whether the board approved the arrangements. Rather, it was the totality of the circumstances that drove the board’s decision.
Nature, extent, and quality of services
The board reviewed the quality of the fund’s investment management services over both the short and long term and took into account the organizational depth and stability of each advisor. The board considered the following:
ArrowMark Partners. Founded in 2007, ArrowMark Partners offers a wide range of strategies, including equities, fixed income, and structured products, to institutional, high-net-worth, and retail investors. Using in-depth, fundamental research, the investment team seeks to identify companies that it believes can control their own economic destiny. These are companies with strong competitive advantages, high barriers to entry, large potential markets for their products, and high-quality businesses focused on future growth. In evaluating companies and constructing the portfolio, ArrowMark Partners places significant emphasis on understanding risk in the belief that avoiding large mistakes is the key to success in small-cap investing. ArrowMark Partners has managed a portion of the fund since 2014.
ClearBridge. ClearBridge, headquartered in New York, New York, is a global investment management firm rebranded in 2005, with a legacy dating back to 1962. The ClearBridge small-/mid-cap growth team is made up of seven members, with four portfolio managers and three analysts who collaborate closely across four strategies. The advisor seeks to invest in quality growth companies that have large, exploitable opportunities. There is a focus on companies that are category leaders (or have the ability to become market leaders), generate substantial free cash
32
flow, and display capital allocation discipline aimed at fueling long-term sustainable growth. The research process is disciplined and collaborative, with each team member executing on a shared investment philosophy and process. ClearBridge has managed a portion of the fund since 2017.
SIMG. Founded in 2005, SIMG is a subsidiary of Stephens Investments Holdings LLC, a privately held and family-owned company. SIMG specializes in equity investment management focused on small- and mid-cap growth companies. The team employs a disciplined, bottom-up investment selection process that combines rigorous fundamental analysis with quantitative screening, seeking to identify companies that will exhibit potential for superior earnings growth. The team invests in two types of stocks: core growth and earnings catalyst. The characteristic SIMG seeks for core growth stocks is consistent and predictable earnings growth that is generated by unique, defensible business models. For earnings catalyst stocks, SIMG looks for inflection points such as large earnings surprises or positive revisions to earnings estimates or guidance. The team generally requires all stocks to be profitable or on the cusp of profitability and to exhibit at least 12% earnings growth. SIMG has managed a portion of the fund since 2013.
Wellington Management. Founded in 1928, Wellington Management is among the nation’s oldest and most respected institutional investment managers. Using a bottom-up, fundamentally driven approach, Wellington Management invests opportunistically in a diversified portfolio of high-quality stocks. The advisor attempts to identify companies with key success factors such as top market share, substantial insider ownership, and fully funded business plans. The investment team has the support of Wellington Management’s global industry analysts in conducting its research-intensive approach. Wellington Management has advised the fund since 1967.
Vanguard. Vanguard has been managing investments for more than three decades. The Quantitative Equity Group adheres to a sound, disciplined investment management process; the team has considerable experience, stability, and depth. Vanguard has managed a portion of the fund since 1997.
The board concluded that each advisor’s experience, stability, depth, and performance, among other factors, warranted continuation of the advisory arrangements.
Investment performance
The board considered the short- and long-term performance of the fund and each advisor, including any periods of outperformance or underperformance compared with a relevant benchmark index and peer group. The board concluded that the performance was such that each advisory arrangement should continue. Information about the fund’s most recent performance can be found in the Performance Summary section of this report.
Cost
The board concluded that the fund’s expense ratio was well below the average expense ratio charged by funds in its peer group and that the fund’s advisory expense rate was also well below its peer-group average. Information about the fund’s expense ratios appears in the About Your Fund’s Expenses section of this report as well as in the Financial Statements section, which also includes information about the fund’s advisory expense rate.
The board did not consider the profitability of ArrowMark Partners, ClearBridge, SIMG, or Wellington Management in determining whether to approve the advisory fees because the firms are independent of Vanguard and the advisory fees are the result of arm’s-length negotiations.
33
The board does not conduct a profitability analysis of Vanguard, because of Vanguard’s unique “at-cost” structure. Unlike most other mutual fund management companies, Vanguard is owned by the funds it oversees and produces “profits” only in the form of reduced expenses for fund shareholders.
The benefit of economies of scale
The board concluded that the fund’s shareholders benefit from economies of scale because of breakpoints in the advisory fee schedules for ArrowMark Partners, ClearBridge, SIMG, and Wellington Management. The breakpoints reduce the effective rate of the fees as the fund’s assets managed by each advisor increase.
The board also concluded that the fund’s at-cost arrangement with Vanguard ensures that the fund will realize economies of scale as it grows, with the cost to shareholders declining as the fund’s assets managed by Vanguard increase.
The board will consider whether to renew the advisory arrangements again after a one-year period.
34
Glossary
30-Day SEC Yield. A fund’s 30-day SEC yield is derived using a formula specified by the U.S. Securities and Exchange Commission. Under the formula, data related to the fund’s security holdings in the previous 30 days are used to calculate the fund’s hypothetical net income for that period, which is then annualized and divided by the fund’s estimated average net assets over the calculation period. For the purposes of this calculation, a security’s income is based on its current market yield to maturity (for bonds), its actual income (for asset-backed securities), or its projected dividend yield (for stocks). Because the SEC yield represents hypothetical annualized income, it will differ—at times significantly—from the fund’s actual experience. As a result, the fund’s income distributions may be higher or lower than implied by the SEC yield.
Beta. A measure of the magnitude of a fund’s past share-price fluctuations in relation to the ups and downs of a given market index. The index is assigned a beta of 1.00. Compared with a given index, a fund with a beta of 1.20 typically would have seen its share price rise or fall by 12% when the index rose or fell by 10%. For this report, beta is based on returns over the past 36 months for both the fund and the index. Note that a fund’s beta should be reviewed in conjunction with its R-squared (see definition). The lower the R-squared, the less correlation there is between the fund and the index, and the less reliable beta is as an indicator of volatility.
Dividend Yield. Dividend income earned by stocks, expressed as a percentage of the aggregate market value (or of net asset value, for a fund). The yield is determined by dividing the amount of the annual dividends by the aggregate value (or net asset value) at the end of the period. For a fund, the dividend yield is based solely on stock holdings and does not include any income produced by other investments.
Earnings Growth Rate. The average annual rate of growth in earnings over the past five years for the stocks now in a fund.
Equity Exposure. A measure that reflects a fund’s investments in stocks and stock futures. Any holdings in short-term reserves are excluded.
Expense Ratio. A fund’s total annual operating expenses expressed as a percentage of the fund’s average net assets. The expense ratio includes management and administrative expenses, but does not include the transaction costs of buying and selling portfolio securities.
Foreign Holdings. The percentage of a fund represented by securities or depositary receipts of companies based outside the United States.
Inception Date. The date on which the assets of a fund (or one of its share classes) are first invested in accordance with the fund’s investment objective. For funds with a subscription period, the inception date is the day after that period ends. Investment performance is measured from the inception date.
Median Market Cap. An indicator of the size of companies in which a fund invests; the midpoint of market capitalization (market price x shares outstanding) of a fund’s stocks, weighted by the proportion of the fund’s assets invested in each stock. Stocks representing half of the fund’s assets have market capitalizations above the median, and the rest are below it.
Price/Book Ratio. The share price of a stock divided by its net worth, or book value, per share.
For a fund, the weighted average price/book ratio of the stocks it holds.
35
Price/Earnings Ratio. The ratio of a stock’s current price to its per-share earnings over the past year. For a fund, the weighted average P/E of the stocks it holds. P/E is an indicator of market expectations about corporate prospects; the higher the P/E, the greater the expectations for a company’s future growth.
R-Squared. A measure of how much of a fund’s past returns can be explained by the returns from the market in general, as measured by a given index. If a fund’s total returns were precisely synchronized with an index’s returns, its R-squared would be 1.00. If the fund’s returns bore no relationship to the index’s returns, its R-squared would be 0. For this report, R-squared is based on returns over the past 36 months for both the fund and the index.
Return on Equity. The annual average rate of return generated by a company during the past five years for each dollar of shareholder’s equity (net income divided by shareholder’s equity). For a fund, the weighted average return on equity for the companies whose stocks it holds.
Short-Term Reserves. The percentage of a fund invested in highly liquid, short-term securities that can be readily converted to cash.
Turnover Rate. An indication of the fund’s trading activity. Funds with high turnover rates incur higher transaction costs and may be more likely to distribute capital gains (which may be taxable to investors). The turnover rate excludes in-kind transactions, which have minimal impact on costs.
36
The Global Industry Classification Standard (“GICS”) was developed by and is the exclusive property and a service mark of MSCI Inc. (“MSCI”) and Standard and Poor’s, a division of McGraw-Hill Companies, Inc. (“S&P”), and is licensed for use by Vanguard. Neither MSCI, S&P nor any third party involved in making or compiling the GICS or any GICS classification makes any express or implied warranties or representations with respect to such standard or classification (or the results to be obtained by the use thereof), and all such parties hereby expressly disclaim all warranties of originality, accuracy, completeness, merchantability or fitness for a particular purpose with respect to any such standard or classification. Without limiting any of the foregoing, in no event shall MSCI, S&P, any of its affiliates or any third party involved in making or compiling the GICS or any GICS classification have any liability for any direct, indirect, special, punitive, consequential or any other damages (including lost profits) even if notified of the possibility of such damages.
37
This page intentionally left blank.
The People Who Govern Your Fund
The trustees of your mutual fund are there to see that the fund is operated and managed in your best interests since, as a shareholder, you are a part owner of the fund. Your fund’s trustees also serve on the board of directors of The Vanguard Group, Inc., which is owned by the Vanguard funds and provides services to them on an at-cost basis.
A majority of Vanguard’s board members are independent, meaning that they have no affiliation with Vanguard or the funds they oversee, apart from the sizable personal investments they have made as private individuals. The independent board members have distinguished backgrounds in business, academia, and public service. Each of the trustees and executive officers oversees 208 Vanguard funds.
Information for each trustee and executive officer of the fund appears below. The mailing address of the trustees and officers is P.O. Box 876, Valley Forge, PA 19482. More information about the trustees is in the Statement of Additional Information, which can be obtained, without charge, by contacting Vanguard at 800-662-7447, or online at vanguard.com.
Interested Trustees1
F. William McNabb III
Born in 1957. Trustee since July 2009. Principal occupation(s) during the past five years and other experience: chairman of the board (January 2010–present) of Vanguard and of each of the investment companies served by Vanguard, trustee (2009–present) of each of the investment companies served by Vanguard, and director (2008–present) of Vanguard. Chief executive officer and president (2008–2017) of Vanguard and each of the investment companies served by Vanguard, managing director (1995–2008) of Vanguard, and director (1997–2018) of Vanguard Marketing Corporation. Director (2018–present) of UnitedHealth Group.
Mortimer J. Buckley
Born in 1969. Trustee since January 2018. Principal occupation(s) during the past five years and other experience: chief executive officer (January 2018–present) of Vanguard; chief executive officer, president, and trustee (January 2018–present) of each of the investment companies served by Vanguard; president and director (2017–present) of Vanguard; and president (February 2018–present) of Vanguard Marketing Corporation. Chief investment officer (2013–2017), managing director (2002–2017), head of the Retail Investor Group (2006–2012), and chief information officer (2001–2006) of Vanguard. Chairman of the board (2011–2017) of the Children’s Hospital of Philadelphia.
Independent Trustees
Emerson U. Fullwood
Born in 1948. Trustee since January 2008. Principal occupation(s) during the past five years and other experience: executive chief staff and marketing officer for North America and corporate vice president (retired 2008) of Xerox Corporation (document management products and services). Former president of the Worldwide Channels Group, Latin America, and Worldwide Customer Service and executive chief staff officer of Developing Markets of Xerox. Executive in residence and 2009–2010 Distinguished Minett Professor at the Rochester Institute of Technology. Lead director of SPX FLOW, Inc. (multi-industry manufacturing). Director of the University of Rochester Medical Center, the Monroe Community College Foundation, the United Way of Rochester, North Carolina A&T University, and Roberts Wesleyan College. Trustee of the University of Rochester.
Amy Gutmann
Born in 1949. Trustee since June 2006. Principal occupation(s) during the past five years and other experience: president (2004–present) of the University of Pennsylvania. Christopher H. Browne Distinguished Professor of Political Science, School of Arts and Sciences, and professor of communication, Annenberg School for Communication, with secondary faculty appointments in the Department of Philosophy, School of Arts and Sciences, and at the Graduate School of Education, University of Pennsylvania. Trustee of the National Constitution Center.
1 Mr. McNabb and Mr. Buckley are considered “interested persons,” as defined in the Investment Company Act of 1940, because they are officers of the Vanguard funds.
JoAnn Heffernan Heisen
Born in 1950. Trustee since July 1998. Principal occupation(s) during the past five years and other experience: corporate vice president of Johnson & Johnson (pharmaceuticals/medical devices/consumer products) and member of its executive committee (1997–2008). Chief global diversity officer (retired 2008), vice president and chief information officer (1997–2006), controller (1995–1997), treasurer (1991–1995), and assistant treasurer (1989–1991) of Johnson & Johnson. Director of Skytop Lodge Corporation (hotels) and the Robert Wood Johnson Foundation. Member of the advisory board of the Institute for Women’s Leadership at Rutgers University.
F. Joseph Loughrey
Born in 1949. Trustee since October 2009. Principal occupation(s) during the past five years and other experience: president and chief operating officer (retired 2009) and vice chairman of the board (2008–2009) of Cummins Inc. (industrial machinery). Chairman of the board of Hillenbrand, Inc. (specialized consumer services), Oxfam America, and the Lumina Foundation for Education. Director of the V Foundation for Cancer Research. Member of the advisory council for the College of Arts and Letters and chair of the advisory board to the Kellogg Institute for International Studies, both at the University of Notre Dame.
Mark Loughridge
Born in 1953. Trustee since March 2012. Principal occupation(s) during the past five years and other experience: senior vice president and chief financial officer (retired 2013) of IBM (information technology services). Fiduciary member of IBM’s Retirement Plan Committee (2004–2013), senior vice president and general manager (2002–2004) of IBM Global Financing, vice president and controller (1998–2002) of IBM, and a variety of other prior management roles at IBM. Member of the Council on Chicago Booth.
Scott C. Malpass
Born in 1962. Trustee since March 2012. Principal occupation(s) during the past five years and other experience: chief investment officer (1989–present) and vice president (1996–present) of the University of Notre Dame. Assistant professor of finance at the Mendoza College of Business, University of Notre Dame, and member of the Notre Dame 403(b) Investment Committee. Chairman of the board of TIFF Advisory Services, Inc. Member of the board of Catholic Investment Services, Inc. (investment advisors), the board of advisors for Spruceview Capital Partners, and the board of superintendence of the Institute for the Works of Religion.
Deanna Mulligan
Born in 1963. Trustee since January 2018. Principal occupation(s) during the past five years and other experience: president (2010–present) and chief executive officer (2011–present) of The Guardian Life Insurance Company of America. Chief operating officer (2010–2011) and executive vice president (2008–2010) of Individual Life and Disability of The Guardian Life Insurance Company of America. Member of the board of The Guardian Life Insurance Company of America, the American Council of Life Insurers, the Partnership for New York City (business leadership), and the Committee Encouraging Corporate Philanthropy. Trustee of the Economic Club of New York and the Bruce Museum (arts and science). Member of the Advisory Council for the Stanford Graduate School of Business.
André F. Perold
Born in 1952. Trustee since December 2004. Principal occupation(s) during the past five years and other experience: George Gund Professor of Finance and Banking, Emeritus at the Harvard Business School (retired 2011). Chief investment officer and co-managing partner of HighVista Strategies LLC (private investment firm). Overseer of the Museum of Fine Arts Boston.
Sarah Bloom Raskin
Born in 1961. Trustee since January 2018. Principal occupation(s) during the past five years and other experience: deputy secretary (2014–2017) of the United States Department of the Treasury. Governor (2010–2014) of the Federal Reserve Board. Commissioner (2007–2010) of financial regulation for the State of Maryland. Member of the board of directors (2012–2014) of Neighborhood Reinvestment Corporation. Director of i(x) Investments, LLC.
Peter F. Volanakis
Born in 1955. Trustee since July 2009. Principal occupation(s) during the past five years and other experience: president and chief operating officer (retired 2010) of Corning Incorporated (communications equipment) and director of Corning Incorporated (2000–2010) and Dow Corning (2001–2010). Director (2012) of SPX Corporation (multi-industry manufacturing). Overseer of the Amos Tuck School of Business Administration, Dartmouth College (2001–2013). Chairman of the board of trustees of Colby-Sawyer College. Member of the Board of Hypertherm Inc. (industrial cutting systems, software, and consumables).
Executive Officers
Glenn Booraem
Born in 1967. Principal occupation(s) during the past five years and other experience: principal of Vanguard. Investment stewardship officer (2017–present), treasurer (2015–2017), controller (2010–2015), and assistant controller (2001–2010) of each of the investment companies served by Vanguard.
Christine M. Buchanan
Born in 1970. Principal occupation(s) during the past five years and other experience: principal of Vanguard and global head of Fund Administration at Vanguard. Treasurer (2017–present) of each of the investment companies served by Vanguard. Partner (2005–2017) at KPMG LLP (audit, tax, and advisory services).
Brian Dvorak
Born in 1973. Principal occupation(s) during the past five years and other experience: principal of Vanguard. Chief compliance officer (2017–present) of Vanguard and each of the investment companies served by Vanguard. Assistant vice president (2017–present) of Vanguard Marketing Corporation. Vice president and director of Enterprise Risk Management (2011–2013) at Oppenheimer Funds, Inc.
Thomas J. Higgins
Born in 1957. Principal occupation(s) during the past five years and other experience: principal of Vanguard. Chief financial officer (2008–present) and treasurer (1998–2008) of each of the investment companies served by Vanguard.
Peter Mahoney
Born in 1974. Principal occupation(s) during the past five years and other experience: principal of Vanguard. Controller (2015–present) of each of the investment companies served by Vanguard. Head of International Fund Services (2008–2014) at Vanguard.
Anne E. Robinson
Born in 1970. Principal occupation(s) during the past five years and other experience: general counsel (2016–present) of Vanguard. Secretary (2016–present) of Vanguard and of each of the investment companies served by Vanguard. Managing director (2016–present) of Vanguard. Director and senior vice president (2016–2018) of Vanguard Marketing Corporation. Managing director and general counsel of Global Cards and Consumer Services (2014–2016) at Citigroup. Counsel (2003–2014) at American Express.
Michael Rollings
Born in 1963. Principal occupation(s) during the past five years and other experience: finance director (2017–present) and treasurer (2017) of each of the investment companies served by Vanguard. Managing director (2016–present) of Vanguard. Chief financial officer (2016–present) of Vanguard. Director (2016–present) of Vanguard Marketing Corporation. Executive vice president and chief financial officer (2006–2016) of MassMutual Financial Group.
| Vanguard Senior Management Team | |
| Mortimer J. Buckley | James M. Norris |
| Gregory Davis | Thomas M. Rampulla |
| John James | Karin A. Risi |
| Martha G. King | Anne E. Robinson |
| John T. Marcante | Michael Rollings |
| Chris D. McIsaac | |
| Chairman Emeritus and Senior Advisor | |
| John J. Brennan | |
| Chairman, 1996–2009 | |
| Chief Executive Officer and President, 1996–2008 | |
| Founder | |
| John C. Bogle | |
| Chairman and Chief Executive Officer, 1974–1996 | |
 | |
P.O. Box 2600 | |
Connect with Vanguard® > vanguard.com | |
| Fund Information > 800-662-7447 | Source for Bloomberg Barclays indexes: Bloomberg |
| Direct Investor Account Services > 800-662-2739 | Index Services Limited. Copyright 2018, Bloomberg. All |
| Institutional Investor Services > 800-523-1036 | rights reserved. |
| Text Telephone for People | |
| Who Are Deaf or Hard of Hearing > 800-749-7273 | CFA® is a registered trademark owned by CFA Institute. |
| This material may be used in conjunction | |
| with the offering of shares of any Vanguard | |
| fund only if preceded or accompanied by | |
| the fund’s current prospectus. | |
| All comparative mutual fund data are from Lipper, a | |
| Thomson Reuters Company, or Morningstar, Inc., unless | |
| otherwise noted. | |
| You can obtain a free copy of Vanguard’s proxy voting | |
| guidelines by visiting vanguard.com/proxyreporting or by | |
| calling Vanguard at 800-662-2739. The guidelines are | |
| also available from the SEC’s website, sec.gov. In | |
| addition, you may obtain a free report on how your fund | |
| voted the proxies for securities it owned during the 12 | |
| months ended June 30. To get the report, visit either | |
| vanguard.com/proxyreporting or sec.gov. | |
| You can review and copy information about your fund at | |
| the SEC’s Public Reference Room in Washington, D.C. To | |
| find out more about this public service, call the SEC at | |
| 202-551-8090. Information about your fund is also | |
| available on the SEC’s website, and you can receive | |
| copies of this information, for a fee, by sending a | |
| request in either of two ways: via email addressed to | |
| publicinfo@sec.gov or via regular mail addressed to the | |
| Public Reference Section, Securities and Exchange | |
| Commission, Washington, DC 20549-1520. | |
| © 2018 The Vanguard Group, Inc. | |
| All rights reserved. | |
| Vanguard Marketing Corporation, Distributor. | |
| Q242 062018 | |
Item 2: Code of Ethics.
Not Applicable.
Item 3: Audit Committee Financial Expert.
Not Applicable.
Item 4: Principal Accountant Fees and Services.
(a) Audit Fees.
Not Applicable.
Item 5: Audit Committee of Listed Registrants.
Not Applicable.
Item 6: Investments.
| Vanguard® Explorer Fund | |||
| Schedule of Investments | |||
| April 30, 2018 | |||
| Market | |||
| Value | |||
| Shares | ($000) | ||
| Common Stocks (96.2%)1 | |||
| Consumer Discretionary (14.1%) | |||
| * | Burlington Stores Inc. | 627,182 | 85,203 |
| Carter's Inc. | 817,300 | 81,992 | |
| Cinemark Holdings Inc. | 1,990,992 | 77,987 | |
| New York Times Co. Class A | 3,269,202 | 76,663 | |
| * | Live Nation Entertainment Inc. | 1,891,407 | 74,654 |
| *,^ | Under Armour Inc. | 4,606,647 | 70,712 |
| Acushnet Holdings Corp. | 2,434,268 | 58,812 | |
| Monro Inc. | 1,021,560 | 57,156 | |
| * | Grand Canyon Education Inc. | 522,383 | 54,323 |
| Cheesecake Factory Inc. | 1,027,843 | 53,396 | |
| Chico's FAS Inc. | 5,289,553 | 52,525 | |
| * | TRI Pointe Group Inc. | 3,049,007 | 52,169 |
| * | Deckers Outdoor Corp. | 558,754 | 52,109 |
| * | ServiceMaster Global Holdings Inc. | 996,539 | 50,425 |
| * | Chipotle Mexican Grill Inc. Class A | 108,693 | 46,013 |
| * | Sally Beauty Holdings Inc. | 2,507,079 | 43,347 |
| La-Z-Boy Inc. | 1,469,766 | 42,329 | |
| Polaris Industries Inc. | 328,452 | 34,428 | |
| *,^ | Carvana Co. Class A | 1,310,968 | 34,361 |
| ^ | Lions Gate Entertainment Corp. Class A | 1,376,824 | 34,269 |
| Tenneco Inc. | 758,482 | 33,897 | |
| ^ | Papa John's International Inc. | 536,000 | 33,232 |
| ^ | Hanesbrands Inc. | 1,727,098 | 31,900 |
| Dunkin' Brands Group Inc. | 502,484 | 30,631 | |
| * | Ulta Beauty Inc. | 115,532 | 28,988 |
| * | Lululemon Athletica Inc. | 282,119 | 28,156 |
| * | Skechers U.S.A. Inc. Class A | 911,502 | 25,978 |
| Wingstop Inc. | 530,349 | 25,913 | |
| * | Ollie's Bargain Outlet Holdings Inc. | 392,115 | 24,390 |
| Advance Auto Parts Inc. | 208,400 | 23,851 | |
| Aaron's Inc. | 559,029 | 23,351 | |
| Lear Corp. | 124,307 | 23,242 | |
| Wolverine World Wide Inc. | 769,550 | 23,056 | |
| * | TripAdvisor Inc. | 599,901 | 22,448 |
| Ross Stores Inc. | 258,591 | 20,907 | |
| Core-Mark Holding Co. Inc. | 1,010,670 | 20,830 | |
| * | Bright Horizons Family Solutions Inc. | 183,988 | 17,457 |
| Cooper Tire & Rubber Co. | 706,400 | 17,272 | |
| Tailored Brands Inc. | 532,983 | 16,816 | |
| * | Scientific Games Corp. | 303,773 | 16,191 |
| *,^ | RH | 168,152 | 16,050 |
| * | LKQ Corp. | 515,098 | 15,978 |
| * | Chuy's Holdings Inc. | 536,760 | 15,351 |
| Domino's Pizza Inc. | 61,281 | 14,813 | |
| * | Weight Watchers International Inc. | 210,797 | 14,766 |
| Bloomin' Brands Inc. | 604,240 | 14,296 | |
| National CineMedia Inc. | 2,430,460 | 13,902 | |
| Dick's Sporting Goods Inc. | 414,277 | 13,708 | |
| Expedia Group Inc. | 118,134 | 13,602 | |
| Toll Brothers Inc. | 320,626 | 13,518 | |
| World Wrestling Entertainment Inc. Class A | 337,990 | 13,449 | |
| * | Michael Kors Holdings Ltd. | 187,271 | 12,813 |
| * | Helen of Troy Ltd. | 142,630 | 12,715 |
| Ruth's Hospitality Group Inc. | 449,054 | 12,057 | |
| ^ | PetMed Express Inc. | 289,302 | 9,680 |
| * | MCBC Holdings Inc. | 384,900 | 9,238 |
| * | Planet Fitness Inc. Class A | 227,421 | 9,163 |
| * | Penn National Gaming Inc. | 302,114 | 9,157 |
| H&R Block Inc. | 330,714 | 9,144 | |
| *,^ | Under Armour Inc. Class A | 511,000 | 9,075 |
| Winnebago Industries Inc. | 227,875 | 8,636 | |
1
| Vanguard® Explorer Fund | |||
| Schedule of Investments | |||
| April 30, 2018 | |||
| Market | |||
| Value | |||
| Shares | ($000) | ||
| Market | |||
| Value | |||
| Shares | ($000) | ||
| Vail Resorts Inc. | 36,370 | 8,340 | |
| * | NVR Inc. | 2,509 | 7,778 |
| * | Chegg Inc. | 252,078 | 5,851 |
| Children's Place Inc. | 42,989 | 5,483 | |
| * | Sleep Number Corp. | 176,871 | 5,013 |
| * | Sotheby's | 90,428 | 4,775 |
| * | Crocs Inc. | 252,875 | 3,995 |
| Cracker Barrel Old Country Store Inc. | 23,225 | 3,823 | |
| * | Red Robin Gourmet Burgers Inc. | 56,830 | 3,543 |
| * | Taylor Morrison Home Corp. Class A | 132,952 | 3,159 |
| * | Hilton Grand Vacations Inc. | 68,742 | 2,956 |
| * | Visteon Corp. | 23,355 | 2,906 |
| * | MSG Networks Inc. | 135,495 | 2,778 |
| MDC Holdings Inc. | 93,623 | 2,716 | |
| * | Malibu Boats Inc. Class A | 76,183 | 2,567 |
| * | ZAGG Inc. | 216,134 | 2,421 |
| Thor Industries Inc. | 17,196 | 1,825 | |
| * | Lumber Liquidators Holdings Inc. | 62,751 | 1,510 |
| Nutrisystem Inc. | 50,223 | 1,456 | |
| Brinker International Inc. | 32,961 | 1,437 | |
| Oxford Industries Inc. | 15,459 | 1,191 | |
| Lithia Motors Inc. Class A | 10,938 | 1,049 | |
| Bassett Furniture Industries Inc. | 20,664 | 600 | |
| 1,959,662 | |||
| Consumer Staples (2.2%) | |||
| * | Performance Food Group Co. | 1,625,279 | 52,740 |
| Nu Skin Enterprises Inc. Class A | 665,679 | 47,363 | |
| * | Post Holdings Inc. | 581,313 | 46,255 |
| Casey's General Stores Inc. | 360,231 | 34,798 | |
| ^ | Calavo Growers Inc. | 315,318 | 29,545 |
| * | Monster Beverage Corp. | 473,203 | 26,026 |
| MGP Ingredients Inc. | 205,421 | 19,677 | |
| ^ | National Beverage Corp. | 126,758 | 11,201 |
| * | HRG Group Inc. | 796,960 | 8,958 |
| Lamb Weston Holdings Inc. | 114,499 | 7,479 | |
| * | Sprouts Farmers Market Inc. | 267,841 | 6,704 |
| Medifast Inc. | 63,377 | 6,362 | |
| * | US Foods Holding Corp. | 43,265 | 1,479 |
| * | Pilgrim's Pride Corp. | 67,546 | 1,459 |
| * | Boston Beer Co. Inc. Class A | 6,211 | 1,392 |
| Ingles Markets Inc. Class A | 21,487 | 736 | |
| 302,174 | |||
| Energy (1.9%) | |||
| *,^ | Jagged Peak Energy Inc. | 4,243,618 | 60,811 |
| Delek US Holdings Inc. | 1,247,342 | 59,087 | |
| ^ | Core Laboratories NV | 257,200 | 31,494 |
| * | Parsley Energy Inc. Class A | 713,890 | 21,438 |
| Cabot Oil & Gas Corp. | 622,365 | 14,881 | |
| ^ | RPC Inc. | 771,874 | 13,901 |
| * | ProPetro Holding Corp. | 726,659 | 13,298 |
| ^ | CVR Energy Inc. | 309,645 | 10,683 |
| * | RigNet Inc. | 665,780 | 10,053 |
| * | Forum Energy Technologies Inc. | 769,310 | 9,693 |
| * | Carrizo Oil & Gas Inc. | 436,063 | 8,752 |
| * | Callon Petroleum Co. | 430,815 | 5,993 |
| Range Resources Corp. | 234,391 | 3,246 | |
| * | Abraxas Petroleum Corp. | 1,021,140 | 2,920 |
| * | Laredo Petroleum Inc. | 228,699 | 2,516 |
| 268,766 | |||
| Financials (7.2%) | |||
| * | SVB Financial Group | 337,562 | 101,137 |
| Nasdaq Inc. | 915,604 | 80,866 | |
| Financial Engines Inc. | 1,776,097 | 79,303 | |
2
| Vanguard® Explorer Fund | |||
| Schedule of Investments | |||
| April 30, 2018 | |||
| Market | |||
| Value | |||
| Shares | ($000) | ||
| Assured Guaranty Ltd. | 1,682,439 | 61,056 | |
| * | Texas Capital Bancshares Inc. | 535,082 | 52,786 |
| LPL Financial Holdings Inc. | 867,552 | 52,548 | |
| Assurant Inc. | 561,323 | 52,102 | |
| Hannon Armstrong Sustainable Infrastructure Capital Inc. | 2,521,363 | 48,940 | |
| Sterling Bancorp | 2,044,960 | 48,568 | |
| * | MGIC Investment Corp. | 4,125,388 | 41,336 |
| Redwood Trust Inc. | 2,661,054 | 40,821 | |
| WisdomTree Investments Inc. | 3,655,764 | 38,641 | |
| * | Green Dot Corp. Class A | 494,383 | 30,063 |
| MarketAxess Holdings Inc. | 144,765 | 28,755 | |
| Affiliated Managers Group Inc. | 156,870 | 25,862 | |
| Solar Capital Ltd. | 1,263,598 | 25,752 | |
| MSCI Inc. Class A | 120,709 | 18,086 | |
| FirstCash Inc. | 198,905 | 17,245 | |
| *,^ | Credit Acceptance Corp. | 48,441 | 16,026 |
| Primerica Inc. | 161,638 | 15,638 | |
| Walker & Dunlop Inc. | 269,177 | 15,373 | |
| Bank of the Ozarks | 325,233 | 15,221 | |
| * | Essent Group Ltd. | 387,241 | 12,763 |
| Legg Mason Inc. | 297,265 | 11,801 | |
| *,^ | PRA Group Inc. | 322,475 | 11,480 |
| Bank of NT Butterfield & Son Ltd. | 170,823 | 8,106 | |
| Hilltop Holdings Inc. | 361,385 | 8,102 | |
| Federated Investors Inc. Class B | 274,041 | 7,254 | |
| East West Bancorp Inc. | 107,181 | 7,140 | |
| *,^ | BofI Holding Inc. | 159,414 | 6,421 |
| Universal Insurance Holdings Inc. | 166,872 | 5,415 | |
| * | Regional Management Corp. | 104,227 | 3,426 |
| SEI Investments Co. | 51,351 | 3,247 | |
| * | Third Point Reinsurance Ltd. | 237,922 | 3,164 |
| * | Green Bancorp Inc. | 86,046 | 1,940 |
| * | NMI Holdings Inc. Class A | 80,435 | 1,114 |
| Cboe Global Markets Inc. | 9,832 | 1,050 | |
| 998,548 | |||
| Health Care (17.3%) | |||
| * | Insulet Corp. | 1,628,925 | 140,088 |
| * | ICON plc | 1,134,259 | 133,423 |
| * | athenahealth Inc. | 938,880 | 114,985 |
| * | Medidata Solutions Inc. | 1,390,480 | 99,225 |
| Encompass Health Corp. | 1,312,779 | 79,843 | |
| * | Haemonetics Corp. | 894,858 | 69,835 |
| * | Molina Healthcare Inc. | 778,434 | 64,805 |
| * | Globus Medical Inc. | 1,230,133 | 62,971 |
| Hill-Rom Holdings Inc. | 713,768 | 61,263 | |
| * | Mettler-Toledo International Inc. | 101,676 | 56,931 |
| * | IDEXX Laboratories Inc. | 235,684 | 45,838 |
| * | ABIOMED Inc. | 145,409 | 43,761 |
| * | HealthEquity Inc. | 624,067 | 40,982 |
| * | LifePoint Health Inc. | 822,071 | 39,377 |
| * | BioMarin Pharmaceutical Inc. | 465,241 | 38,852 |
| * | Amedisys Inc. | 576,500 | 38,101 |
| * | Penumbra Inc. | 301,750 | 37,523 |
| * | Ultragenyx Pharmaceutical Inc. | 670,660 | 34,096 |
| * | DexCom Inc. | 442,151 | 32,357 |
| STERIS plc | 337,836 | 31,932 | |
| * | Illumina Inc. | 127,797 | 30,790 |
| * | Neogen Corp. | 445,860 | 30,385 |
| * | Ligand Pharmaceuticals Inc. | 192,530 | 29,813 |
| * | Spark Therapeutics Inc. | 388,598 | 29,658 |
| * | PRA Health Sciences Inc. | 333,167 | 27,376 |
| *,^ | Teladoc Inc. | 623,265 | 26,800 |
| * | Intuitive Surgical Inc. | 59,631 | 26,284 |
| * | Prestige Brands Holdings Inc. | 859,454 | 25,302 |
3
| Vanguard® Explorer Fund | |||
| Schedule of Investments | |||
| April 30, 2018 | |||
| Market | |||
| Value | |||
| Shares | ($000) | ||
| ResMed Inc. | 266,106 | 25,184 | |
| * | Seattle Genetics Inc. | 483,200 | 24,735 |
| Arena Pharmaceuticals Inc. | 612,947 | 24,420 | |
| * | Audentes Therapeutics Inc. | 647,300 | 24,183 |
| *,^ | MiMedx Group Inc. | 2,918,686 | 23,962 |
| * | Syneos Health Inc. | 586,206 | 22,334 |
| * | Premier Inc. Class A | 663,860 | 21,901 |
| * | Align Technology Inc. | 86,371 | 21,580 |
| * | Catalent Inc. | 519,967 | 21,376 |
| * | MEDNAX Inc. | 462,589 | 21,237 |
| * | Cambrex Corp. | 396,030 | 20,970 |
| * | Veeva Systems Inc. Class A | 295,847 | 20,748 |
| * | WellCare Health Plans Inc. | 100,155 | 20,548 |
| * | Blueprint Medicines Corp. | 266,200 | 20,423 |
| Chemed Corp. | 65,004 | 20,036 | |
| * | Cerner Corp. | 340,984 | 19,862 |
| *,^ | CRISPR Therapeutics AG | 423,624 | 19,851 |
| * | Immunomedics Inc. | 1,071,610 | 19,514 |
| * | Exact Sciences Corp. | 357,868 | 17,897 |
| * | Hologic Inc. | 445,564 | 17,283 |
| Cooper Cos. Inc. | 74,241 | 16,980 | |
| * | Charles River Laboratories International Inc. | 161,528 | 16,830 |
| * | Inogen Inc. | 118,690 | 16,685 |
| * | NuVasive Inc. | 310,454 | 16,519 |
| * | Pacira Pharmaceuticals Inc. | 498,930 | 16,515 |
| * | Nevro Corp. | 181,173 | 16,190 |
| * | TESARO Inc. | 312,569 | 15,913 |
| * | Repligen Corp. | 412,603 | 15,266 |
| * | Acadia Healthcare Co. Inc. | 420,837 | 14,973 |
| * | Neurocrine Biosciences Inc. | 184,462 | 14,956 |
| *,^ | Heron Therapeutics Inc. | 474,091 | 14,365 |
| * | Nektar Therapeutics Class A | 171,067 | 14,311 |
| * | Emergent BioSolutions Inc. | 273,582 | 14,188 |
| * | ImmunoGen Inc. | 1,263,591 | 13,887 |
| * | Aduro Biotech Inc. | 1,845,707 | 12,735 |
| * | Atara Biotherapeutics Inc. | 313,691 | 12,657 |
| * | HMS Holdings Corp. | 650,658 | 11,718 |
| * | AxoGen Inc. | 291,043 | 11,584 |
| Bruker Corp. | 392,225 | 11,582 | |
| * | Agios Pharmaceuticals Inc. | 134,765 | 11,308 |
| * | DBV Technologies SA ADR | 513,846 | 11,279 |
| * | Revance Therapeutics Inc. | 396,052 | 11,070 |
| * | Masimo Corp. | 123,248 | 11,059 |
| * | Tivity Health Inc. | 297,718 | 10,703 |
| * | Endologix Inc. | 2,328,665 | 10,037 |
| * | Momenta Pharmaceuticals Inc. | 469,690 | 9,770 |
| * | Array BioPharma Inc. | 698,260 | 9,468 |
| * | FibroGen Inc. | 204,244 | 9,283 |
| * | Sangamo Therapeutics Inc. | 539,853 | 8,530 |
| * | PTC Therapeutics Inc. | 275,674 | 7,644 |
| * | Exelixis Inc. | 344,474 | 7,172 |
| * | Halozyme Therapeutics Inc. | 352,552 | 6,674 |
| * | Vanda Pharmaceuticals Inc. | 472,372 | 6,590 |
| * | Loxo Oncology Inc. | 47,202 | 5,943 |
| * | AAC Holdings Inc. | 478,980 | 5,427 |
| * | Magellan Health Inc. | 55,615 | 4,663 |
| * | Lantheus Holdings Inc. | 261,525 | 4,655 |
| * | BioCryst Pharmaceuticals Inc. | 901,122 | 4,434 |
| * | AnaptysBio Inc. | 45,668 | 4,283 |
| LeMaitre Vascular Inc. | 135,371 | 4,257 | |
| * | Cytokinetics Inc. | 492,604 | 4,089 |
| * | Corcept Therapeutics Inc. | 240,407 | 4,010 |
| * | Medpace Holdings Inc. | 107,710 | 3,984 |
| * | Amphastar Pharmaceuticals Inc. | 195,190 | 3,726 |
4
| Vanguard® Explorer Fund | |||
| Schedule of Investments | |||
| April 30, 2018 | |||
| Market | |||
| Value | |||
| Shares | ($000) | ||
| * | OraSure Technologies Inc. | 198,073 | 3,512 |
| * | AMN Healthcare Services Inc. | 47,535 | 3,178 |
| * | Concert Pharmaceuticals Inc. | 164,155 | 2,996 |
| * | Cotiviti Holdings Inc. | 77,837 | 2,689 |
| * | Supernus Pharmaceuticals Inc. | 51,690 | 2,424 |
| * | Ionis Pharmaceuticals Inc. | 40,837 | 1,757 |
| * | Zogenix Inc. | 43,267 | 1,700 |
| * | MyoKardia Inc. | 32,970 | 1,629 |
| * | Innoviva Inc. | 98,360 | 1,426 |
| * | MacroGenics Inc. | 61,293 | 1,413 |
| * | Select Medical Holdings Corp. | 75,240 | 1,358 |
| *,^ | PetIQ Inc. | 58,786 | 1,314 |
| * | Ophthotech Corp. | 420,409 | 1,106 |
| *,^ | Novavax Inc. | 663,794 | 1,036 |
| * | CytomX Therapeutics Inc. | 38,799 | 1,020 |
| * | Civitas Solutions Inc. | 54,436 | 776 |
| * | Genomic Health Inc. | 24,132 | 766 |
| 2,408,652 | |||
| Industrials (19.8%) | |||
| * | TriNet Group Inc. | 2,846,274 | 147,010 |
| * | Kirby Corp. | 1,335,138 | 113,887 |
| * | Sensata Technologies Holding plc | 1,903,648 | 96,553 |
| * | Middleby Corp. | 670,470 | 84,372 |
| * | Teledyne Technologies Inc. | 430,655 | 80,571 |
| * | TransUnion | 1,058,228 | 68,690 |
| John Bean Technologies Corp. | 601,324 | 64,793 | |
| * | United Rentals Inc. | 426,630 | 63,994 |
| Woodward Inc. | 885,659 | 63,714 | |
| * | Copart Inc. | 1,235,220 | 63,095 |
| * | AerCap Holdings NV | 1,174,556 | 61,230 |
| * | Trex Co. Inc. | 578,150 | 60,058 |
| * | Chart Industries Inc. | 1,046,400 | 59,373 |
| * | Proto Labs Inc. | 493,190 | 58,764 |
| * | XPO Logistics Inc. | 598,653 | 58,165 |
| HEICO Corp. Class A | 805,732 | 58,134 | |
| IDEX Corp. | 426,266 | 56,975 | |
| MSC Industrial Direct Co. Inc. Class A | 646,405 | 55,875 | |
| * | SPX FLOW Inc. | 1,159,116 | 52,160 |
| * | CoStar Group Inc. | 136,157 | 49,923 |
| Advanced Drainage Systems Inc. | 1,954,219 | 49,246 | |
| Actuant Corp. Class A | 2,045,019 | 48,160 | |
| Watts Water Technologies Inc. Class A | 644,118 | 47,987 | |
| AGCO Corp. | 707,474 | 44,344 | |
| Timken Co. | 1,022,305 | 43,704 | |
| GATX Corp. | 668,857 | 43,636 | |
| Multi-Color Corp. | 640,485 | 41,600 | |
| ^ | Schneider National Inc. Class B | 1,502,718 | 40,093 |
| Tennant Co. | 529,486 | 39,182 | |
| * | JELD-WEN Holding Inc. | 1,374,300 | 38,632 |
| * | Clean Harbors Inc. | 825,834 | 37,823 |
| Terex Corp. | 1,031,920 | 37,686 | |
| Kennametal Inc. | 919,771 | 33,526 | |
| * | Cimpress NV | 231,729 | 33,325 |
| * | Masonite International Corp. | 525,310 | 31,886 |
| Heartland Express Inc. | 1,766,691 | 31,500 | |
| Wabtec Corp. | 347,023 | 30,819 | |
| * | Verisk Analytics Inc. Class A | 268,691 | 28,602 |
| * | MRC Global Inc. | 1,467,520 | 27,487 |
| ABM Industries Inc. | 837,799 | 26,081 | |
| Forward Air Corp. | 474,719 | 25,630 | |
| * | Spirit Airlines Inc. | 695,453 | 24,842 |
| Orbital ATK Inc. | 187,000 | 24,755 | |
| Allegion plc | 293,638 | 22,663 | |
| * | WABCO Holdings Inc. | 161,860 | 20,878 |
5
| Vanguard® Explorer Fund | |||
| Schedule of Investments | |||
| April 30, 2018 | |||
| Market | |||
| Value | |||
| Shares | ($000) | ||
| Harris Corp. | 132,869 | 20,783 | |
| * | WageWorks Inc. | 493,207 | 20,542 |
| Graco Inc. | 440,115 | 19,361 | |
| * | SiteOne Landscape Supply Inc. | 270,162 | 18,506 |
| Huntington Ingalls Industries Inc. | 69,073 | 16,799 | |
| Ritchie Bros Auctioneers Inc. | 501,908 | 16,427 | |
| Allison Transmission Holdings Inc. | 418,328 | 16,311 | |
| * | Evoqua Water Technologies Corp. | 766,854 | 15,667 |
| * | Generac Holdings Inc. | 307,123 | 13,824 |
| JB Hunt Transport Services Inc. | 115,890 | 13,609 | |
| * | Beacon Roofing Supply Inc. | 276,628 | 13,541 |
| * | Axon Enterprise Inc. | 317,342 | 13,322 |
| Quad/Graphics Inc. | 534,130 | 13,198 | |
| * | Continental Building Products Inc. | 465,437 | 13,079 |
| * | Harsco Corp. | 586,372 | 11,991 |
| * | Mercury Systems Inc. | 368,171 | 11,811 |
| Old Dominion Freight Line Inc. | 87,399 | 11,699 | |
| * | HD Supply Holdings Inc. | 300,220 | 11,622 |
| * | IHS Markit Ltd. | 234,332 | 11,513 |
| Spirit AeroSystems Holdings Inc. Class A | 140,548 | 11,296 | |
| Air Lease Corp. Class A | 266,631 | 11,116 | |
| KBR Inc. | 643,627 | 10,742 | |
| EMCOR Group Inc. | 136,367 | 10,035 | |
| Global Brass & Copper Holdings Inc. | 320,707 | 9,621 | |
| * | Meritor Inc. | 449,349 | 8,749 |
| * | Avis Budget Group Inc. | 156,615 | 7,738 |
| *,^ | Kornit Digital Ltd. | 502,780 | 7,315 |
| * | Aerojet Rocketdyne Holdings Inc. | 260,155 | 7,269 |
| * | TrueBlue Inc. | 250,328 | 6,671 |
| Rockwell Automation Inc. | 39,874 | 6,560 | |
| * | SP Plus Corp. | 179,854 | 6,322 |
| * | Rush Enterprises Inc. Class A | 151,061 | 6,168 |
| Xylem Inc. | 83,310 | 6,073 | |
| * | Builders FirstSource Inc. | 314,438 | 5,732 |
| * | ASGN Inc. | 70,873 | 5,714 |
| Wabash National Corp. | 271,080 | 5,438 | |
| Kimball International Inc. Class B | 313,946 | 5,186 | |
| Barrett Business Services Inc. | 52,105 | 4,560 | |
| Toro Co. | 77,143 | 4,504 | |
| Copa Holdings SA Class A | 38,086 | 4,463 | |
| Applied Industrial Technologies Inc. | 67,030 | 4,287 | |
| ^ | Greenbrier Cos. Inc. | 95,102 | 4,170 |
| * | Vectrus Inc. | 115,158 | 4,146 |
| KAR Auction Services Inc. | 76,649 | 3,985 | |
| * | Atkore International Group Inc. | 222,127 | 3,947 |
| Hillenbrand Inc. | 57,341 | 2,658 | |
| H&E Equipment Services Inc. | 69,021 | 2,233 | |
| Insperity Inc. | 24,530 | 1,969 | |
| Brink's Co. | 22,810 | 1,683 | |
| Mueller Water Products Inc. Class A | 138,333 | 1,354 | |
| HEICO Corp. | 13,142 | 1,155 | |
| 2,757,887 | |||
| Information Technology (23.4%) | |||
| * | 2U Inc. | 1,298,287 | 104,499 |
| * | Cadence Design Systems Inc. | 2,223,188 | 89,061 |
| * | First Solar Inc. | 1,238,219 | 87,802 |
| * | Fortinet Inc. | 1,510,296 | 83,610 |
| *,^ | GrubHub Inc. | 812,288 | 82,155 |
| MercadoLibre Inc. | 237,611 | 80,695 | |
| * | GoDaddy Inc. Class A | 1,189,317 | 76,782 |
| MAXIMUS Inc. | 1,113,299 | 75,292 | |
| * | HubSpot Inc. | 660,422 | 69,939 |
| *,2 | Cardtronics plc Class A | 2,589,959 | 67,986 |
| * | New Relic Inc. | 957,902 | 66,948 |
6
| Vanguard® Explorer Fund | |||
| Schedule of Investments | |||
| April 30, 2018 | |||
| Market | |||
| Value | |||
| Shares | ($000) | ||
| * | ServiceNow Inc. | 387,852 | 64,438 |
| * | Ciena Corp. | 2,355,176 | 60,646 |
| Power Integrations Inc. | 873,292 | 59,209 | |
| * | Atlassian Corp. plc Class A | 1,043,584 | 58,420 |
| * | Cornerstone OnDemand Inc. | 1,318,784 | 58,198 |
| * | Twilio Inc. Class A | 1,284,293 | 54,210 |
| * | Tableau Software Inc. Class A | 597,939 | 50,855 |
| CDW Corp. | 704,543 | 50,227 | |
| * | Zendesk Inc. | 1,011,802 | 49,325 |
| Entegris Inc. | 1,519,388 | 48,924 | |
| SS&C Technologies Holdings Inc. | 933,662 | 46,356 | |
| * | Take-Two Interactive Software Inc. | 463,126 | 46,178 |
| Teradyne Inc. | 1,414,232 | 46,033 | |
| * | Square Inc. | 915,992 | 43,363 |
| *,^ | Trade Desk Inc. Class A | 820,621 | 41,991 |
| * | Cloudera Inc. | 2,890,352 | 41,188 |
| * | Proofpoint Inc. | 316,485 | 37,326 |
| * | IPG Photonics Corp. | 175,202 | 37,323 |
| * | Arrow Electronics Inc. | 458,289 | 34,253 |
| * | Trimble Inc. | 983,578 | 34,032 |
| * | Euronet Worldwide Inc. | 429,812 | 33,573 |
| * | CyberArk Software Ltd. | 605,117 | 33,257 |
| * | Etsy Inc. | 1,090,609 | 32,653 |
| * | Wix.com Ltd. | 386,640 | 31,801 |
| * | Aspen Technology Inc. | 355,015 | 31,153 |
| * | WEX Inc. | 179,649 | 29,089 |
| * | ON Semiconductor Corp. | 1,302,970 | 28,770 |
| FLIR Systems Inc. | 533,050 | 28,545 | |
| * | Guidewire Software Inc. | 334,745 | 28,326 |
| * | Yelp Inc. Class A | 600,042 | 26,912 |
| Microchip Technology Inc. | 305,587 | 25,565 | |
| * | Envestnet Inc. | 468,792 | 25,455 |
| * | Ultimate Software Group Inc. | 103,366 | 24,800 |
| * | Shutterstock Inc. | 582,284 | 24,537 |
| Broadridge Financial Solutions Inc. | 222,576 | 23,862 | |
| ^ | Switch Inc. | 1,624,313 | 23,146 |
| * | Semtech Corp. | 578,845 | 22,749 |
| *,^ | Ambarella Inc. | 487,322 | 22,704 |
| * | ANSYS Inc. | 133,743 | 21,621 |
| *,^ | Advanced Micro Devices Inc. | 1,966,228 | 21,393 |
| * | Descartes Systems Group Inc. | 723,426 | 21,377 |
| * | Red Hat Inc. | 129,551 | 21,125 |
| * | Tyler Technologies Inc. | 95,855 | 20,985 |
| *,^ | Acacia Communications Inc. | 736,107 | 20,721 |
| * | Stamps.com Inc. | 87,510 | 19,930 |
| Cognex Corp. | 420,370 | 19,442 | |
| * | PTC Inc. | 235,300 | 19,377 |
| * | RingCentral Inc. Class A | 286,022 | 19,178 |
| * | RealPage Inc. | 342,673 | 18,333 |
| Booz Allen Hamilton Holding Corp. Class A | 460,117 | 18,234 | |
| *,^ | Inphi Corp. | 637,410 | 18,217 |
| * | Imperva Inc. | 406,560 | 18,194 |
| Alliance Data Systems Corp. | 86,570 | 17,578 | |
| *,^ | ANGI Homeservices Inc. Class A | 1,314,943 | 17,568 |
| * | Qualys Inc. | 224,918 | 17,307 |
| * | Zebra Technologies Corp. | 127,905 | 17,245 |
| *,^ | Match Group Inc. | 365,080 | 17,203 |
| * | Shopify Inc. | 128,721 | 17,201 |
| * | Presidio Inc. | 1,107,031 | 16,960 |
| * | Nutanix Inc. | 327,372 | 16,562 |
| j2 Global Inc. | 207,040 | 16,435 | |
| * | Silicon Laboratories Inc. | 168,799 | 15,681 |
| National Instruments Corp. | 380,922 | 15,576 | |
| * | Q2 Holdings Inc. | 312,751 | 15,403 |
7
| Vanguard® Explorer Fund | |||
| Schedule of Investments | |||
| April 30, 2018 | |||
| Market | |||
| Value | |||
| Shares | ($000) | ||
| * | Splunk Inc. | 149,842 | 15,381 |
| * | Five9 Inc. | 518,844 | 15,238 |
| * | Electronic Arts Inc. | 128,026 | 15,104 |
| * | Gartner Inc. | 120,007 | 14,556 |
| * | Palo Alto Networks Inc. | 74,950 | 14,429 |
| * | Pure Storage Inc. Class A | 690,505 | 13,969 |
| *,^ | Stratasys Ltd. | 719,533 | 13,793 |
| * | ChannelAdvisor Corp. | 1,019,143 | 13,555 |
| * | Integrated Device Technology Inc. | 484,475 | 13,483 |
| * | Manhattan Associates Inc. | 313,004 | 13,478 |
| LogMeIn Inc. | 121,757 | 13,418 | |
| * | Varonis Systems Inc. | 196,996 | 12,874 |
| * | Coherent Inc. | 75,200 | 12,650 |
| * | IAC/InterActiveCorp | 77,244 | 12,524 |
| * | DocuSign Inc. | 314,913 | 12,165 |
| * | 8x8 Inc. | 588,129 | 11,910 |
| *,^ | Unisys Corp. | 941,965 | 10,550 |
| * | Carbonite Inc. | 315,702 | 9,818 |
| * | Extreme Networks Inc. | 903,504 | 9,667 |
| *,^ | 3D Systems Corp. | 925,787 | 9,295 |
| SYNNEX Corp. | 86,818 | 8,697 | |
| * | Workiva Inc. | 384,907 | 8,660 |
| * | PROS Holdings Inc. | 291,079 | 8,593 |
| * | Arista Networks Inc. | 31,867 | 8,430 |
| * | KEMET Corp. | 464,331 | 7,996 |
| * | Hortonworks Inc. | 455,046 | 7,704 |
| * | SMART Global Holdings Inc. | 193,201 | 7,564 |
| TTEC Holdings Inc. | 230,252 | 7,368 | |
| * | Ultra Clean Holdings Inc. | 415,738 | 7,280 |
| * | Amkor Technology Inc. | 853,781 | 7,069 |
| * | Lumentum Holdings Inc. | 136,959 | 6,910 |
| * | A10 Networks Inc. | 1,071,086 | 6,534 |
| * | Microsemi Corp. | 97,789 | 6,326 |
| * | ePlus Inc. | 75,253 | 6,009 |
| * | Control4 Corp. | 281,802 | 5,873 |
| * | Axcelis Technologies Inc. | 237,683 | 5,229 |
| * | Glu Mobile Inc. | 1,177,332 | 5,157 |
| MKS Instruments Inc. | 50,059 | 5,126 | |
| * | Care.com Inc. | 327,230 | 5,105 |
| * | Sykes Enterprises Inc. | 158,207 | 4,550 |
| * | Blucora Inc. | 147,532 | 3,836 |
| Pivotal Software Inc. Class A | 196,200 | 3,539 | |
| CSG Systems International Inc. | 76,909 | 3,291 | |
| *,3 | Dropbox Inc. Class A | 118,921 | 3,223 |
| Travelport Worldwide Ltd. | 181,306 | 3,108 | |
| Hackett Group Inc. | 187,611 | 3,041 | |
| * | NCR Corp. | 77,230 | 2,376 |
| * | Virtusa Corp. | 44,265 | 2,131 |
| * | Web.com Group Inc. | 107,175 | 1,993 |
| * | Apptio Inc. Class A | 62,591 | 1,847 |
| Versum Materials Inc. | 51,801 | 1,822 | |
| * | TTM Technologies Inc. | 127,834 | 1,782 |
| InterDigital Inc. | 22,973 | 1,710 | |
| * | Xcerra Corp. | 128,545 | 1,553 |
| * | Brightcove Inc. | 159,877 | 1,543 |
| * | Avid Technology Inc. | 321,377 | 1,440 |
| Plantronics Inc. | 22,064 | 1,437 | |
| * | Box Inc. | 54,933 | 1,256 |
| * | OSI Systems Inc. | 17,524 | 1,122 |
| Blackbaud Inc. | 10,113 | 1,061 | |
| * | Itron Inc. | 16,099 | 1,053 |
| * | Diodes Inc. | 36,763 | 1,050 |
| 3,262,258 | |||
8
| Vanguard® Explorer Fund | |||
| Schedule of Investments | |||
| April 30, 2018 | |||
| Market | |||
| Value | |||
| Shares | ($000) | ||
| Materials (4.5%) | |||
| Carpenter Technology Corp. | 1,347,430 | 71,764 | |
| Orion Engineered Carbons SA | 2,347,015 | 62,900 | |
| * | Ferro Corp. | 2,681,213 | 59,013 |
| Smurfit Kappa Group plc | 1,215,089 | 51,475 | |
| Methanex Corp. | 835,813 | 50,483 | |
| * | Berry Global Group Inc. | 858,723 | 47,230 |
| Minerals Technologies Inc. | 566,930 | 39,147 | |
| PolyOne Corp. | 920,152 | 38,508 | |
| * | Summit Materials Inc. Class A | 1,069,609 | 30,099 |
| Graphic Packaging Holding Co. | 1,475,456 | 21,099 | |
| Chemours Co. | 351,391 | 17,011 | |
| Louisiana-Pacific Corp. | 576,973 | 16,346 | |
| Huntsman Corp. | 485,624 | 14,457 | |
| Balchem Corp. | 162,824 | 14,368 | |
| Westlake Chemical Corp. | 130,169 | 13,924 | |
| * | Koppers Holdings Inc. | 256,811 | 11,248 |
| Packaging Corp. of America | 83,663 | 9,679 | |
| Kronos Worldwide Inc. | 384,306 | 8,854 | |
| Rayonier Advanced Materials Inc. | 410,111 | 8,776 | |
| Greif Inc. Class A | 118,602 | 6,941 | |
| Boise Cascade Co. | 163,054 | 6,783 | |
| * | Owens-Illinois Inc. | 275,310 | 5,597 |
| * | AdvanSix Inc. | 140,351 | 5,027 |
| Albemarle Corp. | 44,453 | 4,310 | |
| * | Ingevity Corp. | 44,837 | 3,445 |
| * | Kraton Corp. | 25,428 | 1,161 |
| * | Ferroglobe plc | 25,000 | 283 |
| 619,928 | |||
| Other (1.4%) | |||
| 4 | Vanguard Small-Cap ETF | 900,910 | 132,857 |
| ^,4 | Vanguard Small-Cap Growth ETF | 384,700 | 63,233 |
| *,5 | Dyax Corp. CVR Exp. 12/31/2019 | 134,316 | 268 |
| 196,358 | |||
| Real Estate (3.4%) | |||
| * | SBA Communications Corp. Class A | 448,184 | 71,812 |
| Jones Lang LaSalle Inc. | 346,380 | 58,715 | |
| LaSalle Hotel Properties | 1,782,520 | 52,709 | |
| Life Storage Inc. | 587,227 | 51,934 | |
| Douglas Emmett Inc. | 1,312,511 | 48,917 | |
| PS Business Parks Inc. | 423,480 | 48,819 | |
| * | Five Point Holdings LLC Class A | 2,956,816 | 39,326 |
| National Storage Affiliates Trust | 797,019 | 20,978 | |
| Ryman Hospitality Properties Inc. | 187,923 | 14,729 | |
| CoreSite Realty Corp. | 128,661 | 13,394 | |
| CubeSmart | 452,763 | 13,329 | |
| PotlatchDeltic Corp. | 148,824 | 7,717 | |
| National Health Investors Inc. | 110,495 | 7,543 | |
| Gaming and Leisure Properties Inc. | 219,020 | 7,506 | |
| First Industrial Realty Trust Inc. | 236,381 | 7,354 | |
| EastGroup Properties Inc. | 32,198 | 2,891 | |
| RMR Group Inc. Class A | 17,408 | 1,295 | |
| Lamar Advertising Co. Class A | 14,654 | 934 | |
| HFF Inc. Class A | 24,053 | 845 | |
| 470,747 | |||
| Telecommunication Services (0.5%) | |||
| * | Vonage Holdings Corp. | 4,671,071 | 52,223 |
| * | Boingo Wireless Inc. | 544,539 | 12,775 |
| Shenandoah Telecommunications Co. | 33,064 | 1,248 | |
| 66,246 | |||
| Utilities (0.5%) | |||
| Pattern Energy Group Inc. Class A | 2,284,695 | 41,536 | |
| ^ | 8Point3 Energy Partners LP Class A | 1,728,749 | 20,918 |
9
| Vanguard® Explorer Fund | |||||
| Schedule of Investments | |||||
| April 30, 2018 | |||||
| Market | |||||
| Value | |||||
| Shares | ($000) | ||||
| NRG Energy Inc. | 346,454 | 10,740 | |||
| 73,194 | |||||
| Total Common Stocks (Cost $10,384,312) | 13,384,420 | ||||
| Coupon | |||||
| Temporary Cash Investments (5.7%)1 | |||||
| Money Market Fund (5.2%) | |||||
| 6,7 | Vanguard Market Liquidity Fund | 1.886% | 7,144,632 | 714,463 | |
| Face | |||||
| Maturity | Amount | ||||
| Date | ($000) | ||||
| Repurchase Agreement (0.4%) | |||||
| Deutsche Bank Securities, Inc. | 1.730% | 5/1/18 | 60,800 | 60,800 | |
| (Dated 4/30/18, Repurchase | |||||
| Value $60,803,000, collateralized | |||||
| by U.S. Treasury Note/Bond 3.750%, | |||||
| 8/15/41, with a value of $62,016,000) | |||||
| U.S. Government and Agency Obligations (0.1%) | |||||
| United States Treasury Bill | 1.461% | 5/3/18 | 200 | 200 | |
| 8 | United States Treasury Bill | 1.404%-1.429% | 5/24/18 | 8,100 | 8,092 |
| 8 | United States Treasury Bill | 1.422%-1.446% | 5/31/18 | 5,100 | 5,093 |
| United States Treasury Bill | 1.941% | 9/27/18 | 200 | 199 | |
| United States Treasury Bill | 1.946% | 10/4/18 | 500 | 496 | |
| 8 | United States Treasury Bill | 1.934% | 10/11/18 | 300 | 297 |
| 14,377 | |||||
| Total Temporary Cash Investments (Cost $789,579) | 789,640 | ||||
| Total Investments (101.9%) (Cost $11,173,891) | 14,174,060 | ||||
| Other Assets and Liabilities—Net (-1.9%)7,8 | (269,560) | ||||
| Net Assets (100%) | 13,904,500 | ||||
* Non-income-producing security.
^ Includes partial security positions on loan to broker-dealers. The total value of securities on loan is $251,285,000.
1 The fund invests a portion of its cash reserves in equity markets through the use of index futures contracts. After giving effect to futures
investments, the fund's effective common stock and temporary cash investment positions represent 98.4% and 3.5%, respectively, of net
assets.
2 Considered an affiliated company of the fund as the fund owns more than 5% of the outstanding voting securities of such company.
3 Restricted security totaling representing 0.0% of net assets. See Restricted Security table for additional information.
4 Considered an affiliated company of the fund as the issuer is another member of The Vanguard Group.
5 Certain of the fund’s securities are valued using significant unobservable inputs.
6 Affiliated money market fund available only to Vanguard funds and certain trusts and accounts managed by Vanguard. Rate shown is the 7-day
yield.
7 Includes $261,176,000 of collateral received for securities on loan.
8 Securities with a value of $13,482,000 and cash of $26,000 have been segregated as initial margin for open futures contracts.
ADR—American Depositary Receipt.
CVR—Contingent Value Rights.
10
This page intentionally left blank.
| © 2018 The Vanguard Group, Inc. | |
| All rights reserved. | |
| Vanguard Marketing Corporation, Distributor. | |
| SNA242 062018 |
Item 7: Disclosure of Proxy Voting Policies and Procedures for Closed-End Management Investment Companies.
Not Applicable.
Item 8: Portfolio Managers of Closed-End Management Investment Companies.
Not Applicable.
Item 9: Purchase of Equity Securities by Closed-End Management Investment Company and Affiliated Purchasers.
Not Applicable.
Item 10: Submission of Matters to a Vote of Security Holders.
Not Applicable.
Item 11: Controls and Procedures.
(a) Disclosure Controls and Procedures. The Principal Executive and Financial Officers concluded that the Registrant’s Disclosure Controls and Procedures are effective based on their evaluation of the Disclosure Controls and Procedures as of a date within 90 days of the filing date of this report.
(b) Internal Control Over Financial Reporting. There were no significant changes in Registrant’s Internal Control Over Financial Reporting or in other factors that could significantly affect this control subsequent to the date of the evaluation, including any corrective actions with regard to significant deficiencies and material weaknesses.
Item 12: Disclosure of Securities Lending Activities for Closed-End Management Investment Companies.
Not Applicable.
Item 13: Exhibits.
(a) Certifications.
Pursuant to the requirements of the Securities Exchange Act of 1934 and the Investment Company Act of 1940, the registrant has duly caused this report to be signed on its behalf by the undersigned, thereunto duly authorized.
| VANGUARD EXPLORER FUND | |
| By: | /s/ MORTIMER J. BUCKLEY* |
| MORTIMER J. BUCKLEY | |
| CHIEF EXECUTIVE OFFICER | |
| Date: June 14, 2018 | |
Pursuant to the requirements of the Securities Exchange Act of 1934 and the Investment Company Act of 1940, this report has been signed below by the following persons on behalf of the registrant and in the capacities and on the dates indicated.
| VANGUARD EXPLORER FUND | |
| By: | /s/ MORTIMER J. BUCKLEY* |
| MORTIMER J. BUCKLEY | |
| CHIEF EXECUTIVE OFFICER | |
| Date: June 14, 2018 | |
| VANGUARD EXPLORER FUND | |
| By: | /s/ THOMAS J. HIGGINS* |
| THOMAS J. HIGGINS | |
| CHIEF FINANCIAL OFFICER | |
| Date: June 14, 2018 | |
* By: /s/ Anne E. Robinson
Anne E. Robinson, pursuant to a Power of Attorney filed on January 18, 2018; see file Number 33-32216,
Incorporated by Reference.