UNITED STATES
SECURITIES AND EXCHANGE COMMISSION
Washington, DC 20549
FORM N-CSR
CERTIFIED SHAREHOLDER REPORT OF REGISTERED MANAGEMENT INVESTMENT COMPANIES
Investment Company Act file number 811-03143
Templeton Global Smaller Companies Fund
(Exact name of registrant as specified in charter)
300 S.E. 2nd Street, Fort Lauderdale, FL 33301-1923
(Address of principal executive offices) (Zip code)
Craig S. Tyle, One Franklin Parkway, San Mateo, CA 94403-1906
(Name and address of agent for service)
Registrant's telephone number, including area code: (954) 527-7500_
Date of fiscal year end: _8/31__
Date of reporting period: 8/31/13__
Item 1. Reports to Stockholders.
Annual Report
Templeton Global Smaller Companies Fund
Your Fund’s Goal and Main Investments: Templeton Global Smaller Companies Fund seeks to achieve long-term capital growth. Under normal market conditions, the Fund invests at least 80% of its net assets in equity securities of smaller companies located anywhere in the world.
We are pleased to bring you Templeton Global Smaller Companies Fund’s annual report for the fiscal year ended August 31, 2013.
| Performance data represent |
| past performance, which does |
| not guarantee future results. |
| Investment return and principal |
| value will fluctuate, and you may |
| have a gain or loss when you sell |
| your shares. Current performance |
| may differ from figures shown. |
| Please visit franklintempleton.com |
| or call (800) 342-5236 for most |
| recent month-end performance. |
Performance Overview
For the 12 months under review, Templeton Global Smaller Companies Fund –Class A delivered a +24.04% cumulative total return. In comparison, the MSCI All Country (AC) World Small Cap Index, which measures performance of small capitalization companies in global developed and emerging markets, generated a +21.92% total return.1 Please note index performance information is provided for reference and we do not attempt to track the index but rather undertake investments on the basis of fundamental research. You can find the Fund’s long-term performance data in the Performance Summary.
Economic and Market Overview
The 12 months under review encompassed a period of improving investor sentiment as reinvigorated policy support and economic recovery in the developed world offset a slowdown in emerging markets, sell-offs in bonds and commodities, and rising geopolitical tensions. Investors entered the period cautiously, given economic uncertainty and imminent leadership transitions in some of the world’s largest economies. Ultimately, leadership transitions in the U.S., China and Japan proceeded smoothly and the drama of electoral politics was replaced by that of fiscal politics as U.S. lawmakers struck a deal on New Year’s Day to partially avert $600 billion of automatic tax hikes and spending cuts.
1. Source: © 2013 Morningstar. All Rights Reserved. The information contained herein: (1) is proprietary to Morningstar
and/or its content providers; (2) may not be copied or distributed; and (3) is not warranted to be accurate, complete or
timely. Neither Morningstar nor its content providers are responsible for any damages or losses arising from any use of
this information. The index is unmanaged and includes reinvested dividends. One cannot invest directly in an index, and
an index is not representative of the Fund’s portfolio.
The dollar value, number of shares or principal amount, and names of all portfolio holdings are listed in the
Fund’s Statement of Investments (SOI). The SOI begins on page 17.
Annual Report | 3
The stock market rally accelerated in 2013 amid redoubled central bank commitments, continued corporate earnings strength and increasing signs of economic progress, though the recovery remained uneven. U.S. growth and employment trends generally exceeded expectations and Europe emerged from recession, while Japan’s growth improved but failed to meet analysts’ expectations. Growth in China and emerging markets, however, tended to lag. Differences in global economic trends corresponded with increasingly divergent policy approaches. The U.S. Federal Reserve Board vowed to keep interest rates low until unemployment met its 6.5% target but sparked considerable volatility and a Treasury sell-off by suggesting it may taper monthly bond purchases should economic conditions warrant. The European Central Bank cut benchmark interest rates to a record low and pledged to maintain systemic support following a bank run in Cyprus and political turmoil in Greece, Spain, Portugal and Italy. Elsewhere, the Bank of Japan set an explicit inflation target and pledged to double bond purchases in an unprecedented wave of policy reform.
Emerging market central banks were less accommodative, with Brazil and India hiking interest rates amid rising inflation and China taking measures to curb real estate and credit speculation. Chinese tightening rattled credit markets, and a spike in interbank lending rates underscored concerns about the country’s shadow banking system. Volatility soon engulfed the broader emerging market region as protests roiled Turkey and Brazil, civil war threatened Egypt and international military intervention looked possible in Syria. Regional asset prices tumbled as investors responded to rising bond rates by unwinding highly leveraged emerging market carry trades.2 In response, emerging market stocks recorded their biggest outflows on record and regional currencies sharply depreciated. Oil staged a late rally based on supply concerns related to geopolitical turmoil, while gold, which had recorded its biggest drop in four decades over the summer, recovered somewhat at period-end. Overall, risks remained elevated during the period, though policy stayed supportive, and increasingly divergent economic and political circumstances resulted in declining market correlations, which many bottom-up investors perceived as more favorable.
Investment Strategy
At Templeton, when choosing investments for this Fund, we take a bottom-up, value-oriented, long-term approach, focusing on the market price of a company’s securities relative to our evaluation of the company’s long-term earnings, asset
2. In a carry trade, an investor seeks to profit from an interest rate differential by borrowing low-yielding currencies and
lending high-yielding currencies. The use of borrowed capital to facilitate the trade creates leverage for the borrower.
4 | Annual Report
value and cash flow growth potential. We also consider the company’s price/earnings ratio, profit margins and liquidation value.
Manager’s Discussion
Several holdings performed well during the fiscal year under review. The share price of Arkansas Best, one of North America’s largest motor carriers for shipping relatively small freight loads, increased after a favorable employment agreement with its trucking union. The company rejected a surprise takeover offer from a rival trucking firm and its second-quarter results improved from the prior quarter. Arkansas Best has a net cash balance sheet, a strong management team and slowly improving company and industry fundamentals. In our assessment, an improved U.S. economy and the firm’s strong operating leverage may result in solid stock performance over the longer term.
As the market leader in China’s meat processing industry, People’s Food Holdings has a broad product offering, strong brand recognition, well-established logistics network and mature distribution channels. In our view, these characteristics led to strong operational and share price performance.
Resulting from a stock market turnaround and marked improvement in its equity asset performance, AllianceBernstein Holding, one of the largest U.S.-based asset managers, recovered from earlier lows. The company also benefited from its strong free cash flow and solid balance sheet.
Several holdings underperformed during the annual reporting period. Emeco Holdings, the leading supplier of heavy earthmoving equipment rentals to the Australian mining industry, focuses on coal and gold, with a growing presence in iron ore. Shares lost value during the period as weak commodity prices pressured the company. Over the longer term, we believe the trend for mining production volumes, which drives the utilization level of Emeco’s fleet, looks positive, and the company’s conservative balance sheet positions it well for solid long-term growth.
HudBay Minerals, an integrated zinc and copper producer, holds assets in North and Central America. Independent credit rating agency Moody’s Investors Service downgraded the company during the period, and it was hampered by weaker-than-expected metals prices that reduced earnings and weakened liquidity. In our longer term view, an increase in metals prices and announced acquisitions could lead to a rise in production, reserves, net asset value and earnings.
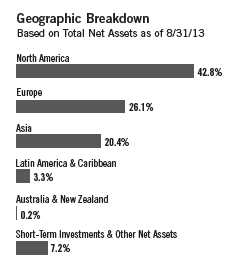
| Top 10 Countries | ||
| Based on Equity Securities | ||
| 8/31/13 | ||
| % of Total | ||
| Net Assets | ||
| U.S. | 36.1 | % |
| Japan | 9.1 | % |
| Canada | 6.7 | % |
| U.K. | 5.9 | % |
| South Korea | 5.0 | % |
| Switzerland | 3.4 | % |
| Netherlands | 2.8 | % |
| Finland | 2.8 | % |
| Germany | 2.7 | % |
| Hong Kong | 2.2 | % |
Annual Report | 5
| Top 10 Equity Holdings | ||
| 8/31/13 | ||
| Company | % of Total | |
| Sector/Industry, Country | Net Assets | |
| Arkansas Best Corp. | 2.5 | % |
| Road & Rail, U.S. | ||
| LeapFrog Enterprises Inc. | 2.4 | % |
| Leisure Equipment & Products, U.S. | ||
| Amer Sports OYJ | 2.0 | % |
| Leisure Equipment & Products, Finland | ||
| AllianceBernstein Holding LP | 2.0 | % |
| Capital Markets, U.S. | ||
| Spartan Stores Inc. | 1.9 | % |
| Food & Staples Retailing, U.S. | ||
| Hibbett Sports Inc. | 1.8 | % |
| Specialty Retail, U.S. | ||
| Panalpina Welttransport Holding AG | 1.7 | % |
| Air Freight & Logistics, Switzerland | ||
| Steiner Leisure Ltd. | 1.7 | % |
| Diversified Consumer Services, Bahamas | ||
| Simpson Manufacturing Co. Inc. | 1.7 | % |
| Building Products, U.S. | ||
| Hyster-Yale Materials Handling Inc. | 1.7 | % |
| Machinery, U.S. | ||
Headquartered in London, African Minerals, a minerals exploration and development firm, has a strong Sierra Leone-based iron ore production growth profile that could, in our view, help offset any potential further weakness in the underlying commodity price. Although the share price was weak during the period owing to global economic issues, we believe the company could benefit over the longer term from potentially strong revenue and earnings growth as a new project accelerates, tripling iron ore production, and from low-cost growth options that could increase production significantly over the next five years.
Thank you for your continued participation in Templeton Global Smaller Companies Fund. We look forward to serving your future investment needs.

The foregoing information reflects our analysis, opinions and portfolio holdings as of August 31, 2013, the end of
the reporting period. The way we implement our main investment strategies and the resulting portfolio holdings
may change depending on factors such as market and economic conditions. These opinions may not be relied upon
as investment advice or an offer for a particular security. The information is not a complete analysis of every
aspect of any market, country, industry, security or the Fund. Statements of fact are from sources considered
reliable, but the investment manager makes no representation or warranty as to their completeness or accuracy.
Although historical performance is no guarantee of future results, these insights may help you understand our
investment management philosophy.
6 | Annual Report
Performance Summary as of 8/31/13
Your dividend income will vary depending on dividends or interest paid by securities in the Fund’s portfolio, adjusted for operating expenses of each class. Capital gain distributions are net profits realized from the sale of portfolio securities. The performance table and graphs do not reflect any taxes that a shareholder would pay on Fund dividends, capital gain distributions, if any, or any realized gains on the sale of Fund shares. Total return reflects reinvestment of the Fund’s dividends and capital gain distributions, if any, and any unrealized gains or losses.
| Price and Distribution Information | ||||||||
| Class A (Symbol: TEMGX) | Change | 8/31/13 | 8/31/12 | |||||
| Net Asset Value (NAV) | +$ | 1.42 | $ | 7.81 | $ | 6.39 | ||
| Distributions (9/1/12–8/31/13) | ||||||||
| Dividend Income | $ | 0.1021 | ||||||
| Class C (Symbol: TESGX) | Change | 8/31/13 | 8/31/12 | |||||
| Net Asset Value (NAV) | +$ | 1.37 | $ | 7.53 | $ | 6.16 | ||
| Distributions (9/1/12–8/31/13) | ||||||||
| Dividend Income | $ | 0.0516 | ||||||
| Class R6 (Symbol: n/a) | Change | 8/31/13 | 5/1/13 | |||||
| Net Asset Value (NAV) | +$ | 0.41 | $ | 7.84 | $ | 7.43 | ||
| Advisor Class (Symbol: TGSAX) | Change | 8/31/13 | 8/31/12 | |||||
| Net Asset Value (NAV) | +$ | 1.43 | $ | 7.84 | $ | 6.41 | ||
| Distributions (9/1/12–8/31/13) | ||||||||
| Dividend Income | $ | 0.1190 | ||||||
Annual Report | 7
Performance Summary (continued)
Performance
Cumulative total return excludes sales charges. Aggregate and average annual total returns and value of $10,000 investment include maximum sales charges. Class A: 5.75% maximum initial sales charge; Class C: 1% contingent deferred sales charge in first year only; Class R6/Advisor Class: no sales charges.
| Class A | 1-Year | 5-Year | 10-Year | ||||||||
| Cumulative Total Return1 | + | 24.04 | % | + | 37.71 | % | + | 131.01 | % | ||
| Average Annual Total Return2 | + | 16.91 | % | + | 5.34 | % | + | 8.09 | % | ||
| Value of $10,000 Investment3 | $ | 11,691 | $ | 12,971 | $ | 21,764 | |||||
| Avg. Ann. Total Return (9/30/13)4 | + | 19.70 | % | + | 9.66 | % | + | 8.64 | % | ||
| Total Annual Operating Expenses5 | 1.41 | % | |||||||||
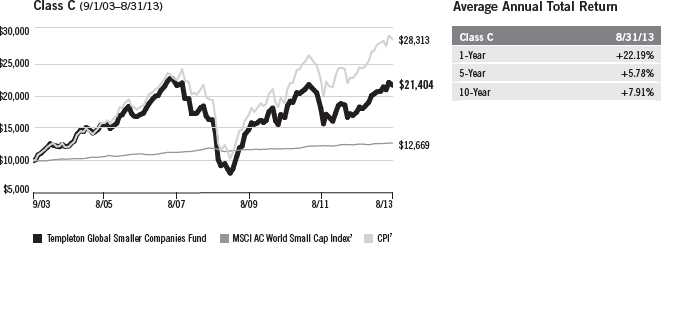
| Class C | 1-Year | 5-Year | 10-Year | ||||||||
| Cumulative Total Return1 | + | 23.19 | % | + | 32.43 | % | + | 114.04 | % | ||
| Average Annual Total Return2 | + | 22.19 | % | + | 5.78 | % | + | 7.91 | % | ||
| Value of $10,000 Investment3 | $ | 12,219 | $ | 13,243 | $ | 21,404 | |||||
| Avg. Ann. Total Return (9/30/13)4 | + | 25.17 | % | + | 10.12 | % | + | 8.46 | % | ||
| Total Annual Operating Expenses5 | 2.16 | % | |||||||||
| Class R6 | Inception (5/1/13) | ||||||||||
| Cumulative Total Return1 | + | 5.52 | % | ||||||||
| Aggregate Total Return6 | + | 5.52 | % | ||||||||
| Value of $10,000 Investment3 | $ | 10,552 | |||||||||
| Aggregate Total Return (9/30/13)4, 6 | + | 9.65 | % | ||||||||
| Total Annual Operating Expenses5 | 0.98 | % | |||||||||
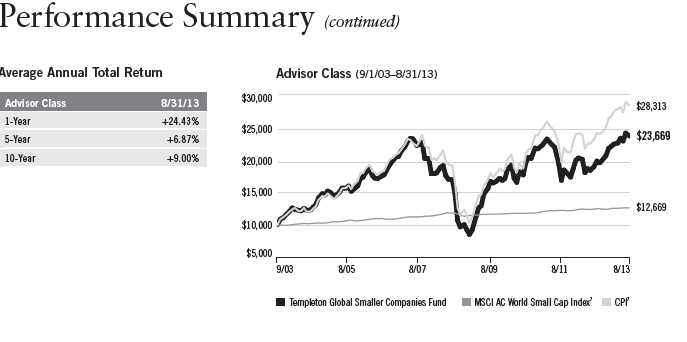
| Advisor Class | 1-Year | 5-Year | 10-Year | ||||||||
| Cumulative Total Return1 | + | 24.43 | % | + | 39.41 | % | + | 136.69 | % | ||
| Average Annual Total Return2 | + | 24.43 | % | + | 6.87 | % | + | 9.00 | % | ||
| Value of $10,000 Investment3 | $ | 12,443 | $ | 13,941 | $ | 23,669 | |||||
| Avg. Ann. Total Return (9/30/13)4 | + | 27.43 | % | + | 11.22 | % | + | 9.54 | % | ||
| Total Annual Operating Expenses5 | 1.16 | % |
Performance data represent past performance, which does not guarantee future results. Investment return and principal value
will fluctuate, and you may have a gain or loss when you sell your shares. Current performance may differ from figures shown.
For most recent month-end performance, go to franklintempleton.com or call (800) 342-5236.
8 | Annual Report
Performance Summary (continued)
Total Return Index Comparison for a Hypothetical $10,000 Investment
Total return represents the change in value of an investment over the periods shown. It includes
any current, applicable, maximum sales charge, Fund expenses, account fees and reinvested distri-
butions. The unmanaged index includes reinvestment of any income or distributions. It differs
from the Fund in composition and does not pay management fees or expenses. One cannot invest
directly in an index.
Annual Report | 9
Endnotes
All investments involve risks, including possible loss of principal. Special risks are associated with foreign invest-
ing, including currency fluctuations, economic instability and political developments. Investments in emerging
markets involve heightened risks related to the same factors, in addition to those associated with these markets’
smaller size and lesser liquidity. In addition, smaller company stocks have historically exhibited greater price
volatility than large-company stocks, particularly over the short term. The Fund is actively managed but there is
no guarantee that the manager’s investment decisions will produce the desired results. The Fund’s prospectus also
includes a description of the main investment risks.
Class C: Prior to 1/1/04, these shares were offered with an initial sales charge; thus actual total returns would
have differed. These shares have higher annual fees and expenses than Class A shares.
Class R6: Shares are available to certain eligible investors as described in the prospectus.
Advisor Class: Shares are available to certain eligible investors as described in the prospectus.
1. Cumulative total return represents the change in value of an investment over the periods indicated.
2. Average annual total return represents the average annual change in value of an investment over the periods
indicated.
3. These figures represent the value of a hypothetical $10,000 investment in the Fund over the periods indicated.
4. In accordance with SEC rules, we provide standardized average annual total return information through the latest
calendar quarter.
5. Figures are as stated in the Fund’s current prospectus. In periods of market volatility, assets may decline signifi-
cantly, causing total annual Fund operating expenses to become higher than the figures shown.
6. Aggregate total return represents the change in value of an investment for the period indicated. Since Class R6
shares have existed for less than one year, average annual total return is not available.
7. Source: © 2013 Morningstar. The MSCI AC World Small Cap Index is a free float-adjusted, market capitalization-
weighted index designed to measure performance of small cap equity securities of global developed and emerging
markets. The Consumer Price Index (CPI), calculated by the Bureau of Labor Statistics, is a commonly used measure
of the inflation rate.
10 | Annual Report
Your Fund’s Expenses
As a Fund shareholder, you can incur two types of costs:
- Transaction costs, including sales charges (loads) on Fund purchases; and
- Ongoing Fund costs, including management fees, distribution and service (12b-1) fees, and other Fund expenses. All mutual funds have ongoing costs, sometimes referred to as operating expenses.
The following table shows ongoing costs of investing in the Fund and can help you understand these costs and compare them with those of other mutual funds. The table assumes a $1,000 investment held for the six months indicated.
Actual Fund Expenses
The first line (Actual) for each share class listed in the table provides actual account values and expenses. The “Ending Account Value” is derived from the Fund’s actual return, which includes the effect of Fund expenses.
You can estimate the expenses you paid during the period by following these steps. Of course, your account value and expenses will differ from those in this illustration:
| 1. | Divide your account value by $1,000. |
| If an account had an $8,600 value, then $8,600 ÷ $1,000 = 8.6. | |
| 2. | Multiply the result by the number under the heading “Expenses Paid During Period.” |
| If Expenses Paid During Period were $7.50, then 8.6 x $7.50 = $64.50. |
In this illustration, the estimated expenses paid this period are $64.50.
Hypothetical Example for Comparison with Other Funds
Information in the second line (Hypothetical) for each class in the table can help you compare ongoing costs of investing in the Fund with those of other mutual funds. This information may not be used to estimate the actual ending account balance or expenses you paid during the period. The hypothetical “Ending Account Value” is based on the actual expense ratio for each class and an assumed 5% annual rate of return before expenses, which does not represent the Fund’s actual return. The figure under the heading “Expenses Paid During Period” shows the hypothetical expenses your account would have incurred under this scenario. You can compare this figure with the 5% hypothetical examples that appear in shareholder reports of other funds.
Annual Report | 11
Your Fund’s Expenses (continued)
Please note that expenses shown in the table are meant to highlight ongoing costs and do not reflect any transaction costs, such as sales charges. Therefore, the second line for each class is useful in comparing ongoing costs only, and will not help you compare total costs of owning different funds. In addition, if transaction costs were included, your total costs would have been higher. Please refer to the Fund prospectus for additional information on operating expenses.
| Beginning Account | Ending Account | Expenses Paid During | ||||
| Class A | Value 3/1/13 | Value 8/31/13 | Period* 3/1/13–8/31/13 | |||
| Actual | $ | 1,000 | $ | 1,068.40 | $ | 7.25 |
| Hypothetical (5% return before expenses) | $ | 1,000 | $ | 1,018.20 | $ | 7.07 |
| Class C | ||||||
| Actual | $ | 1,000 | $ | 1,065.10 | $ | 11.14 |
| Hypothetical (5% return before expenses) | $ | 1,000 | $ | 1,014.42 | $ | 10.87 |
| Class R6 | ||||||
| Actual (5/1/13–8/31/13) | $ | 1,000 | $ | 1,055.20 | $ | 3.29 |
| Hypothetical (5% return before expenses) | $ | 1,000 | $ | 1,020.42 | $ | 4.84 |
| Advisor Class | ||||||
| Actual | $ | 1,000 | $ | 1,071.00 | $ | 5.95 |
| Hypothetical (5% return before expenses) | $ | 1,000 | $ | 1,019.46 | $ | 5.80 |
*Expenses are calculated using the most recent six-month expense ratio, annualized for each class (A: 1.39%; C: 2.14%; R6: 0.95%; and Advisor: 1.14%),
multiplied by the average account value over the period, multiplied by 184/365 to reflect the one-half year period for Class R6 Hypothetical expenses
and Actual and Hypothetical expenses for Classes A, C and Advisor. The multiplier is 123/365 for Actual Class R6 expenses to reflect the number of
days since inception.
12 | Annual Report
Templeton Global Smaller Companies Fund
Financial Highlights
| Year Ended August 31, | |||||||||||||||
| Class A | 2013 | 2012 | 2011 | 2010 | 2009 | ||||||||||
| Per share operating performance | |||||||||||||||
| (for a share outstanding throughout the year) | |||||||||||||||
| Net asset value, beginning of year | $ | 6.39 | $ | 6.61 | $ | 6.06 | $ | 5.42 | $ | 6.97 | |||||
| Income from investment operationsa: | |||||||||||||||
| Net investment incomeb | 0.05 | 0.07 | 0.06 | 0.01 | 0.06 | ||||||||||
| Net realized and unrealized gains (losses) | 1.47 | (0.23 | ) | 0.51 | 0.70 | (0.98 | ) | ||||||||
| Total from investment operations | 1.52 | (0.16 | ) | 0.57 | 0.71 | (0.92 | ) | ||||||||
| Less distributions from: | |||||||||||||||
| Net investment income | (0.10 | ) | (0.06 | ) | (0.02 | ) | (0.07 | ) | (0.09 | ) | |||||
| Net realized gains | — | — | — | — | (0.54 | ) | |||||||||
| Total distributions | (0.10 | ) | (0.06 | ) | (0.02 | ) | (0.07 | ) | (0.63 | ) | |||||
| Net asset value, end of year | $ | 7.81 | $ | 6.39 | $ | 6.61 | $ | 6.06 | $ | 5.42 | |||||
| Total returnc | 24.04 | % | (2.31 | )% | 9.31 | % | 13.11 | % | (8.08 | )% | |||||
| Ratios to average net assets | |||||||||||||||
| Expenses | 1.39 | %d | 1.41 | % | 1.35 | %d | 1.39 | %d | 1.49 | %d | |||||
| Net investment income | 0.72 | % | 1.06 | % | 0.80 | % | 0.23 | % | 1.47 | % | |||||
| Supplemental data | |||||||||||||||
| Net assets, end of year (000’s) | $ | 892,067 | $ | 726,065 | $ | 833,869 | $ | 816,589 | $ | 732,847 | |||||
| Portfolio turnover rate | 27.67 | % | 25.44 | % | 23.31 | % | 22.33 | % | 31.29 | % | |||||
aThe amount shown for a share outstanding throughout the period may not correlate with the Statement of Operations for the period due to the timing of sales and repurchases of
the Fund shares in relation to income earned and/or fluctuating market value of the investments of the Fund.
bBased on average daily shares outstanding.
cTotal return does not reflect sales commissions or contingent deferred sales charges, if applicable.
dBenefit of expense reduction rounds to less than 0.01%.
Annual Report | The accompanying notes are an integral part of these financial statements. | 13
Templeton Global Smaller Companies Fund
Financial Highlights (continued)
| Year Ended August 31, | |||||||||||||||
| Class C | 2013 | 2012 | 2011 | 2010 | 2009 | ||||||||||
| Per share operating performance | |||||||||||||||
| (for a share outstanding throughout the year) | |||||||||||||||
| Net asset value, beginning of year | $ | 6.16 | $ | 6.39 | $ | 5.88 | $ | 5.28 | $ | 6.77 | |||||
| Income from investment operationsa: | |||||||||||||||
| Net investment income (loss)b | —c | 0.02 | —c | (0.03 | ) | 0.03 | |||||||||
| Net realized and unrealized gains (losses) | 1.42 | (0.23 | ) | 0.51 | 0.68 | (0.96 | ) | ||||||||
| Total from investment operations | 1.42 | (0.21 | ) | 0.51 | 0.65 | (0.93 | ) | ||||||||
| Less distributions from: | |||||||||||||||
| Net investment income | (0.05 | ) | (0.02 | ) | — | (0.05 | ) | (0.02 | ) | ||||||
| Net realized gains | — | — | — | — | (0.54 | ) | |||||||||
| Total distributions | (0.05 | ) | (0.02 | ) | — | (0.05 | ) | (0.56 | ) | ||||||
| Net asset value, end of year | $ | 7.53 | $ | 6.16 | $ | 6.39 | $ | 5.88 | $ | 5.28 | |||||
| Total returnd | 23.19 | % | (3.07 | )% | 8.67 | % | 12.27 | % | (8.96 | )% | |||||
| Ratios to average net assets | |||||||||||||||
| Expenses | 2.14 | %e | 2.16 | % | 2.10 | %e | 2.14 | %e | 2.26 | %e | |||||
| Net investment income (loss) | (0.03 | )% | 0.31 | % | 0.05 | % | (0.52 | )% | 0.70 | % | |||||
| Supplemental data | |||||||||||||||
| Net assets, end of year (000’s) | $ | 39,726 | $ | 34,090 | $ | 42,043 | $ | 36,390 | $ | 33,300 | |||||
| Portfolio turnover rate | 27.67 | % | 25.44 | % | 23.31 | % | 22.33 | % | 31.29 | % | |||||
aThe amount shown for a share outstanding throughout the period may not correlate with the Statement of Operations for the period due to the timing of sales and repurchases of
the Fund shares in relation to income earned and/or fluctuating market value of the investments of the Fund.
bBased on average daily shares outstanding.
cAmount rounds to less than $0.01 per share.
dTotal return does not reflect sales commissions or contingent deferred sales charges, if applicable.
eBenefit of expense reduction rounds to less than 0.01%.
14 | The accompanying notes are an integral part of these financial statements. | Annual Report
Templeton Global Smaller Companies Fund
Financial Highlights (continued)
| Period Ended | |||
| August 31, | |||
| Class R6 | 2013 | a | |
| Per share operating performance | |||
| (for a share outstanding throughout the period) | |||
| Net asset value, beginning of period | $ | 7.43 | |
| Income from investment operations: | |||
| Net investment incomeb | 0.03 | ||
| Net realized and unrealized gains (losses) | 0.38 | ||
| Total from investment operations | 0.41 | ||
| Net asset value, end of period | $ | 7.84 | |
| Total returnc | 5.52 | % | |
| Ratios to average net assetsd | |||
| Expenses before waiver and payments by affiliates | 3.26 | % | |
| Expenses net of waiver and payments by affiliates | 0.95 | % | |
| Net investment income (loss) | (1.15 | )% | |
| Supplemental data | |||
| Net assets, end of period (000’s) | $ | 5 | |
| Portfolio turnover rate | 27.67 | % | |
aFor the period May 1, 2013 (effective date) to August 31, 2013.
bThe amount shown for a share outstanding throughout the period may not correlate with the Statement of Operations for the period due to the timing of sales and repurchases of
the Fund shares in relation to income earned and/or fluctuating market value of the investments of the Fund.
cTotal return is not annualized for periods less than one year.
dRatios are annualized for periods less than one year.
Annual Report | The accompanying notes are an integral part of these financial statements. | 15
Templeton Global Smaller Companies Fund
Financial Highlights (continued)
| Year Ended August 31, | |||||||||||||||
| Advisor Class | 2013 | 2012 | 2011 | 2010 | 2009 | ||||||||||
| Per share operating performance | |||||||||||||||
| (for a share outstanding throughout the year) | |||||||||||||||
| Net asset value, beginning of year | $ | 6.41 | $ | 6.63 | $ | 6.08 | $ | 5.43 | $ | 7.00 | |||||
| Income from investment operationsa: | |||||||||||||||
| Net investment incomeb | 0.07 | 0.08 | 0.08 | 0.03 | 0.07 | ||||||||||
| Net realized and unrealized gains (losses) | 1.48 | (0.23 | ) | 0.51 | 0.69 | (1.00 | ) | ||||||||
| Total from investment operations | 1.55 | (0.15 | ) | 0.59 | 0.72 | (0.93 | ) | ||||||||
| Less distributions from: | |||||||||||||||
| Net investment income | (0.12 | ) | (0.07 | ) | (0.04 | ) | (0.07 | ) | (0.10 | ) | |||||
| Net realized gains | — | — | — | — | (0.54 | ) | |||||||||
| Total distributions | (0.12 | ) | (0.07 | ) | (0.04 | ) | (0.07 | ) | (0.64 | ) | |||||
| Net asset value, end of year | $ | 7.84 | $ | 6.41 | $ | 6.63 | $ | 6.08 | $ | 5.43 | |||||
| Total return | 24.43 | % | (2.07 | )% | 9.60 | % | 13.38 | % | (7.94 | )% | |||||
| Ratios to average net assets | |||||||||||||||
| Expenses | 1.14 | %c | 1.16 | % | 1.10 | %c | 1.14 | %c | 1.26 | %c | |||||
| Net investment income | 0.97 | % | 1.31 | % | 1.05 | % | 0.48 | % | 1.70 | % | |||||
| Supplemental data | |||||||||||||||
| Net assets, end of year (000’s) | $ | 140,733 | $ | 116,877 | $ | 113,402 | $ | 95,765 | $ | 108,383 | |||||
| Portfolio turnover rate | 27.67 | % | 25.44 | % | 23.31 | % | 22.33 | % | 31.29 | % | |||||
aThe amount shown for a share outstanding throughout the period may not correlate with the Statement of Operations for the period due to the timing of sales and repurchases of
the Fund shares in relation to income earned and/or fluctuating market value of the investments of the Fund.
bBased on average daily shares outstanding.
cBenefit of expense reduction rounds to less than 0.01%.
16 | The accompanying notes are an integral part of these financial statements. | Annual Report
Templeton Global Smaller Companies Fund
Statement of Investments, August 31, 2013
| Industry | Shares/Units | Value | ||
| Common Stocks and Other Equity Interests 92.4% | ||||
| Australia 0.2% | ||||
| Emeco Holdings Ltd. | Trading Companies & Distributors | 12,521,493 | $ | 2,006,507 |
| Austria 1.2% | ||||
| Wienerberger AG | Building Products | 872,868 | 12,633,638 | |
| Bahamas 1.7% | ||||
| a Steiner Leisure Ltd. | Diversified Consumer Services | 326,160 | 18,173,635 | |
| Belgium 1.2% | ||||
| Barco NV | Electronic Equipment, Instruments | |||
| & Components | 173,890 | 12,439,363 | ||
| Brazil 1.0% | ||||
| Companhia de Saneamento de Minas Gerais | Water Utilities | 339,700 | 4,099,041 | |
| Diagnosticos da America SA | Health Care Providers & Services | 1,320,700 | 6,147,303 | |
| 10,246,344 | ||||
| Canada 6.7% | ||||
| a ATS Automation Tooling Systems Inc. | Machinery | 740,180 | 8,916,307 | |
| Canaccord Financial Inc. | Capital Markets | 1,668,300 | 9,929,509 | |
| Dorel Industries Inc., B | Household Durables | 171,300 | 5,853,909 | |
| Ensign Energy Services Inc. | Energy Equipment & Services | 416,500 | 6,950,562 | |
| Genworth MI Canada Inc. | Thrifts & Mortgage Finance | 494,800 | 13,221,909 | |
| HudBay Minerals Inc. | Metals & Mining | 1,576,150 | 10,353,560 | |
| Mullen Group Ltd. | Energy Equipment & Services | 299,500 | 7,178,675 | |
| Trican Well Service Ltd. | Energy Equipment & Services | 646,600 | 9,090,271 | |
| 71,494,702 | ||||
| Cayman Islands 0.6% | ||||
| Stella International Holdings Ltd. | Textiles, Apparel & Luxury Goods | 2,417,987 | 5,924,681 | |
| China 1.8% | ||||
| b Daphne International Holdings Ltd. | Textiles, Apparel & Luxury Goods | 5,920,000 | 3,779,065 | |
| People’s Food Holdings Ltd. | Food Products | 8,084,840 | 6,051,669 | |
| b Prince Frog International Holdings Ltd. | Personal Products | 8,295,700 | 5,156,529 | |
| Yingde Gases | Chemicals | 5,180,500 | 4,656,524 | |
| 19,643,787 | ||||
| Finland 2.8% | ||||
| Amer Sports OYJ | Leisure Equipment & Products | 1,089,557 | 21,573,843 | |
| Huhtamaki OYJ | Containers & Packaging | 426,680 | 8,346,988 | |
| 29,920,831 | ||||
| France 0.6% | ||||
| Ipsos | Media | 180,625 | 6,938,079 | |
Annual Report | 17
Templeton Global Smaller Companies Fund
Statement of Investments, August 31, 2013 (continued)
| Industry | Shares/Units | Value | ||
| Common Stocks and Other Equity Interests (continued) | ||||
| Germany 2.3% | ||||
| Gerresheimer AG | Life Sciences Tools & Services | 130,320 | $ | 7,863,531 |
| Jenoptik AG | Electronic Equipment, Instruments | |||
| & Components | 590,140 | 8,065,686 | ||
| a Kloeckner & Co. SE | Trading Companies & Distributors | 639,220 | 8,237,980 | |
| 24,167,197 | ||||
| Greece 0.5% | ||||
| a JUMBO SA | Specialty Retail | 486,140 | 5,134,213 | |
| Hong Kong 2.2% | ||||
| Dah Sing Financial Group | Commercial Banks | 1,388,000 | 6,479,708 | |
| Techtronic Industries Co. Ltd. | Household Durables | 6,569,000 | 16,095,714 | |
| Value Partners Group Ltd. | Capital Markets | 2,479,500 | 1,413,331 | |
| 23,988,753 | ||||
| India 0.2% | ||||
| Jain Irrigation Systems Ltd. | Machinery | 3,409,300 | 2,578,741 | |
| Italy 1.4% | ||||
| Amplifon SpA | Health Care Providers & Services | 970,688 | 5,132,221 | |
| Azimut Holding SpA | Capital Markets | 464,930 | 9,986,348 | |
| 15,118,569 | ||||
| Japan 9.1% | ||||
| Asahi Co. Ltd. | Specialty Retail | 288,000 | 4,528,293 | |
| Asics Corp. | Textiles, Apparel & Luxury Goods | 907,900 | 15,968,160 | |
| Capcom Co. Ltd. | Software | 307,800 | 5,313,224 | |
| Descente Ltd. | Textiles, Apparel & Luxury Goods | 812,000 | 5,692,729 | |
| en-japan Inc. | Professional Services | 16 | 26,038 | |
| Keihin Corp. | Auto Components | 403,000 | 5,855,994 | |
| Kobayashi Pharmaceutical Co. Ltd. | Personal Products | 318,710 | 17,699,796 | |
| MEITEC Corp. | Professional Services | 445,100 | 11,062,301 | |
| Nissin Kogyo Co. Ltd. | Auto Components | 244,470 | 4,342,092 | |
| Seria Co. Ltd. | Multiline Retail | 223,000 | 6,908,035 | |
| Shinko Plantech Co. Ltd. | Energy Equipment & Services | 1,062,000 | 8,538,421 | |
| Square Enix Holdings Co. Ltd. | Software | 609,200 | 8,920,573 | |
| Tokai Rika Co. Ltd. | Auto Components | 163,500 | 3,255,505 | |
| 98,111,161 | ||||
| Netherlands 2.8% | ||||
| Aalberts Industries NV | Machinery | 594,081 | 14,802,081 | |
| Accell Group NV | Leisure Equipment & Products | 260,768 | 4,891,054 | |
| Arcadis NV | Construction & Engineering | 278,220 | 6,895,335 | |
| USG People NV | Professional Services | 521,736 | 3,792,968 | |
| 30,381,438 | ||||
| Norway 0.4% | ||||
| Tomra Systems ASA | Commercial Services & Supplies | 507,376 | 4,539,396 | |
18 | Annual Report
Templeton Global Smaller Companies Fund
Statement of Investments, August 31, 2013 (continued)
| Industry | Shares/Units | Value | ||
| Common Stocks and Other Equity Interests (continued) | ||||
| South Korea 5.0% | ||||
| BS Financial Group Inc. | Commercial Banks | 1,284,130 | $ | 16,477,288 |
| Daum Communication Corp. | Internet Software & Services | 71,766 | 5,492,873 | |
| DGB Financial Group Inc. | Commercial Banks | 840,880 | 11,774,062 | |
| KIWOOM Securities Co. Ltd. | Capital Markets | 79,940 | 3,728,686 | |
| Sindoh Co. Ltd. | Office Electronics | 143,648 | 8,019,608 | |
| Youngone Corp. | Textiles, Apparel & Luxury Goods | 312,788 | 8,590,369 | |
| 54,082,886 | ||||
| Spain 2.2% | ||||
| Construcciones y Auxiliar de Ferrocarriles SA | Machinery | 27,137 | 12,052,215 | |
| Melia Hotels International SA | Hotels, Restaurants & Leisure | 565,517 | 5,086,740 | |
| Tecnicas Reunidas SA | Energy Equipment & Services | 149,190 | 6,517,438 | |
| 23,656,393 | ||||
| Sweden 0.6% | ||||
| a,c D Carnegie & Co. AB | Capital Markets | 2,352,546 | — | |
| Oriflame Cosmetics SA, SDR | Personal Products | 236,200 | 6,910,927 | |
| 6,910,927 | ||||
| Switzerland 3.4% | ||||
| a,bLogitech International SA | Computers & Peripherals | 1,091,970 | 7,982,301 | |
| Panalpina Welttransport Holding AG | Air Freight & Logistics | 125,960 | 18,750,494 | |
| Vontobel Holding AG | Capital Markets | 272,678 | 10,081,818 | |
| 36,814,613 | ||||
| Taiwan 2.1% | ||||
| Giant Manufacturing Co. Ltd. | Leisure Equipment & Products | 1,678,311 | 11,293,737 | |
| a Ta Chong Bank Ltd. | Commercial Banks | 21,585,166 | 6,833,669 | |
| Tripod Technology Corp. | Electronic Equipment, Instruments | |||
| & Components | 2,253,000 | 4,461,759 | ||
| 22,589,165 | ||||
| Thailand 0.0%† | ||||
| Hana Microelectronics PCL, fgn. | Electronic Equipment, Instruments | |||
| & Components | 82,600 | 54,484 | ||
| Turkey 0.4% | ||||
| Aygaz AS | Gas Utilities | 981,785 | 3,791,828 | |
| United Kingdom 5.9% | ||||
| a African Minerals Ltd. | Metals & Mining | 1,977,280 | 5,826,545 | |
| Bellway PLC | Household Durables | 293,380 | 6,099,930 | |
| Bodycote PLC | Machinery | 644,000 | 6,270,787 | |
| Bovis Homes Group PLC | Household Durables | 543,379 | 6,265,843 | |
| Greggs PLC | Food & Staples Retailing | 1,100,580 | 7,108,876 | |
| Laird PLC | Electronic Equipment, Instruments | |||
| & Components | 4,096,330 | 13,666,012 | ||
Annual Report | 19
Templeton Global Smaller Companies Fund
Statement of Investments, August 31, 2013 (continued)
| Industry | Shares/Units | Value | ||
| Common Stocks and Other Equity Interests (continued) | ||||
| United Kingdom (continued) | ||||
| a Persimmon PLC | Household Durables | 333,867 | $ | 5,684,303 |
| UBM PLC | Media | 455,240 | 4,879,061 | |
| a Vectura Group PLC | Pharmaceuticals | 4,503,490 | 6,953,784 | |
| 62,755,141 | ||||
| United States 36.1% | ||||
| AllianceBernstein Holding LP | Capital Markets | 1,086,817 | 21,008,173 | |
| Arkansas Best Corp. | Road & Rail | 1,062,090 | 26,424,799 | |
| a Brocade Communications Systems Inc. | Communications Equipment | 2,234,697 | 16,536,758 | |
| b Columbia Sportswear Co. | Textiles, Apparel & Luxury Goods | 268,640 | 15,202,338 | |
| a Deckers Outdoor Corp. | Textiles, Apparel & Luxury Goods | 91,580 | 5,378,493 | |
| FirstMerit Corp. | Commercial Banks | 790,700 | 16,731,212 | |
| a Glu Mobile Inc. | Software | 346,776 | 839,198 | |
| a Green Dot Corp. | Consumer Finance | 619,220 | 14,217,291 | |
| GulfMark Offshore Inc., A | Energy Equipment & Services | 263,690 | 12,124,466 | |
| d Heidrick & Struggles International Inc. | Professional Services | 990,670 | 14,909,583 | |
| a Hibbett Sports Inc. | Specialty Retail | 382,440 | 19,810,392 | |
| Hyster-Yale Materials Handling Inc. | Machinery | 237,090 | 17,926,375 | |
| a Investment Technology Group Inc. | Capital Markets | 959,320 | 16,308,440 | |
| iShares MSCI EAFE Small-Cap ETF | Diversified Financial Services | 358,900 | 15,999,762 | |
| iShares Russell 2000 ETF | Diversified Financial Services | 152,800 | 15,338,064 | |
| d JAKKS Pacific Inc. | Leisure Equipment & Products | 1,527,120 | 7,925,753 | |
| Janus Capital Group Inc. | Capital Markets | 1,640,250 | 13,712,490 | |
| a LeapFrog Enterprises Inc. | Leisure Equipment & Products | 2,663,380 | 25,621,716 | |
| a Navistar International Corp. | Machinery | 173,590 | 5,948,929 | |
| Simpson Manufacturing Co. Inc. | Building Products | 574,950 | 17,978,686 | |
| Spartan Stores Inc. | Food & Staples Retailing | 995,280 | 20,462,957 | |
| a Stillwater Mining Co. | Metals & Mining | 449,350 | 5,118,097 | |
| a Swift Energy Co. | Oil, Gas & Consumable Fuels | 1,140,610 | 12,866,081 | |
| The Finish Line Inc., A | Specialty Retail | 124,800 | 2,615,808 | |
| a Tutor Perini Corp. | Construction & Engineering | 869,900 | 16,684,682 | |
| a Unit Corp. | Energy Equipment & Services | 175,760 | 8,093,748 | |
| a VASCO Data Security International Inc. | Software | 896,010 | 7,078,479 | |
| a,dWest Marine Inc. | Specialty Retail | 1,235,180 | 14,031,645 | |
| 386,894,415 | ||||
| Total Common Stocks and Other Equity | ||||
| Interests (Cost $833,875,269) | 990,990,887 | |||
20 | Annual Report
Templeton Global Smaller Companies Fund
Statement of Investments, August 31, 2013 (continued)
| Industry | Shares/Units | Value | ||
| Preferred Stocks (Cost $4,829,383) 0.4% | ||||
| Germany 0.4% | ||||
| Draegerwerk AG & Co. KGAA, pfd. | Health Care Equipment & Supplies | 37,400 | $ | 4,498,614 |
| Total Investments before Short Term | ||||
| Investments (Cost $838,704,652) | 995,489,501 | |||
| Short Term Investments (Cost $23,379,095) 2.2% | ||||
| e Investments from Cash Collateral Received for Loaned | ||||
| Securities | ||||
| Money Market Funds 2.2% | ||||
| United States 2.2% | ||||
| f BNY Mellon Overnight Government Fund, 0.028% | 23,379,095 | 23,379,095 | ||
| Total Investments | ||||
| (Cost $862,083,747) 95.0% | 1,018,868,596 | |||
| Other Assets, less Liabilities 5.0% | 53,663,961 | |||
| Net Assets 100.0% | $ | 1,072,532,557 | ||
See Abbreviations on page 36.
†Rounds to less than 0.1% of net assets.
aNon-income producing.
bA portion or all of the security is on loan at August 31, 2013. See Note 1(c).
cSecurity has been deemed illiquid because it may not be able to be sold within seven days.
dSee Note 8 regarding holdings of 5% voting securities.
eSee Note 1(c) regarding securities on loan.
fThe rate shown is the annualized seven-day yield at period end.
Annual Report | The accompanying notes are an integral part of these financial statements. | 21
Templeton Global Smaller Companies Fund
Financial Statements
Statement of Assets and Liabilities
August 31, 2013
| Assets: | |||
| Investments in securities: | |||
| Cost - Unaffiliated issuers | $ | 804,476,161 | |
| Cost - Non-controlled affiliated issuers (Note 8) | 57,607,586 | ||
| Total cost of investments | $ | 862,083,747 | |
| Value - Unaffiliated issuers | $ | 982,001,615 | |
| Value - Non-controlled affiliated issuers (Note 8) | 36,866,981 | ||
| Total value of investments (includes securities loaned in the amount $22,632,035) | 1,018,868,596 | ||
| Cash | 71,023,463 | ||
| Foreign currency, at value (cost $121,642) | 120,267 | ||
| Receivables: | |||
| Investment securities sold | 9,766,588 | ||
| Capital shares sold | 5,283,213 | ||
| Dividends and interest | 1,046,190 | ||
| Other assets | 219 | ||
| Total assets | 1,106,108,536 | ||
| Liabilities: | |||
| Payables: | |||
| Investment securities purchased | 7,660,836 | ||
| Capital shares redeemed | 988,721 | ||
| Management fees | 692,121 | ||
| Administrative fees | 115,840 | ||
| Distribution fees | 226,811 | ||
| Transfer agent fees | 290,740 | ||
| Payable upon return of securities loaned | 23,379,095 | ||
| Accrued expenses and other liabilities | 221,815 | ||
| Total liabilities | 33,575,979 | ||
| Net assets, at value | $ | 1,072,532,557 | |
| Net assets consist of: | |||
| Paid-in capital | $ | 1,006,785,588 | |
| Undistributed net investment income | 3,547,404 | ||
| Net unrealized appreciation (depreciation) | 156,678,124 | ||
| Accumulated net realized gain (loss) | (94,478,559 | ) | |
| Net assets, at value | $ | 1,072,532,557 |
22 | The accompanying notes are an integral part of these financial statements. | Annual Report
Templeton Global Smaller Companies Fund
Financial Statements (continued)
Statement of Assets and Liabilities (continued)
August 31, 2013
| Class A: | |||
| Net assets, at value | $ | 892,067,465 | |
| Shares outstanding | 114,236,705 | ||
| Net asset value per sharea | $ | 7.81 | |
| Maximum offering price per share (net asset value per share ÷ 94.25%) | $ | 8.29 | |
| Class C: | |||
| Net assets, at value | $ | 39,726,454 | |
| Shares outstanding | 5,274,861 | ||
| Net asset value and maximum offering price per sharea | $ | 7.53 | |
| Class R6 | |||
| Net assets, at value | $ | 5,277 | |
| Shares outstanding | 673 | ||
| Net asset value and maximum offering price per share | $ | 7.84 | |
| Advisor Class: | |||
| Net assets, at value | $ | 140,733,361 | |
| Shares outstanding | 17,955,838 | ||
| Net asset value and maximum offering price per share | $ | 7.84 | |
| aRedemption price is equal to net asset value less contingent deferred sales charges, if applicable. | |||
Annual Report | The accompanying notes are an integral part of these financial statements. | 23
Templeton Global Smaller Companies Fund
Financial Statements (continued)
Statement of Operations
for the year ended August 31, 2013
| Investment income: | |||
| Dividends: (net of foreign taxes $1,682,717) | |||
| Unaffiliated issuers | $ | 18,959,430 | |
| Non-controlled affiliated issuers (Note 8) | 764,507 | ||
| Interest | 6,301 | ||
| Income from securities loaned | 674,034 | ||
| Total investment income | 20,404,272 | ||
| Expenses: | |||
| Management fees (Note 3a) | 7,266,216 | ||
| Administrative fees (Note 3b) | 1,244,215 | ||
| Distribution fees: (Note 3c) | |||
| Class A | 2,010,397 | ||
| Class B | 1,300 | ||
| Class C | 367,321 | ||
| Transfer agent fees: (Note 3e) | |||
| Class A | 1,567,999 | ||
| Class B | 252 | ||
| Class C | 71,627 | ||
| Class R6 | 41 | ||
| Advisor Class | 248,716 | ||
| Custodian fees (Note 4) | 137,410 | ||
| Reports to shareholders | 198,276 | ||
| Registration and filing fees | 97,849 | ||
| Professional fees | 117,604 | ||
| Trustees’ fees and expenses | 88,856 | ||
| Other | 30,757 | ||
| Total expenses | 13,448,836 | ||
| Expense reductions (Note 4) | (47 | ) | |
| Expenses waived/paid by affiliates (Note 3f) | (41 | ) | |
| Net expenses | 13,448,748 | ||
| Net investment income | 6,955,524 | ||
| Realized and unrealized gains (losses): | |||
| Net realized gain (loss) from: | |||
| Investments | 57,907,176 | ||
| Foreign currency transactions | (152,628 | ) | |
| Net realized gain (loss) | 57,754,548 | ||
| Net change in unrealized appreciation (depreciation) on: | |||
| Investments | 139,161,657 | ||
| Translation of other assets and liabilities denominated in foreign currencies | (91,840 | ) | |
| Net change in unrealized appreciation (depreciation) | 139,069,817 | ||
| Net realized and unrealized gain (loss) | 196,824,365 | ||
| Net increase (decrease) in net assets resulting from operations | $ | 203,779,889 |
24 | The accompanying notes are an integral part of these financial statements. | Annual Report
Templeton Global Smaller Companies Fund
Financial Statements (continued)
| Statements of Changes in Net Assets | ||||||
| Year Ended August 31, | ||||||
| 2013 | 2012 | |||||
| Increase (decrease) in net assets: | ||||||
| Operations: | ||||||
| Net investment income | $ | 6,955,524 | $ | 9,525,437 | ||
| Net realized gain (loss) from investments and foreign currency transactions | 57,754,548 | (40,576,906 | ) | |||
| Net change in unrealized appreciation (depreciation) on investments and translation of | ||||||
| other assets and liabilities denominated in foreign currencies | 139,069,817 | 3,067,422 | ||||
| Net increase (decrease) in net assets resulting from operations | 203,779,889 | (27,984,047 | ) | |||
| Distributions to shareholders from: | ||||||
| Net investment income: | ||||||
| Class A | (11,272,741 | ) | (7,297,641 | ) | ||
| Class B | — | (1,063 | ) | |||
| Class C | (269,735 | ) | (134,613 | ) | ||
| Advisor Class | (2,061,929 | ) | (1,300,050 | ) | ||
| Total distributions to shareholders | (13,604,405 | ) | (8,733,367 | ) | ||
| Capital share transactions: (Note 2) | ||||||
| Class A | 8,305,557 | (76,445,964 | ) | |||
| Class B | (458,067 | ) | (1,047,866 | ) | ||
| Class C | (1,570,949 | ) | (6,259,478 | ) | ||
| Class R6 | 5,000 | — | ||||
| Advisor Class | (1,377,132 | ) | 7,078,026 | |||
| Total capital share transactions | 4,904,409 | (76,675,282 | ) | |||
| Net increase (decrease) in net assets | 195,079,893 | (113,392,696 | ) | |||
| Net assets: | ||||||
| Beginning of year | 877,452,664 | 990,845,360 | ||||
| End of year | $ | 1,072,532,557 | $ | 877,452,664 | ||
| Undistributed net investment income included in net assets: | ||||||
| End of year | $ | 3,547,404 | $ | 9,868,915 | ||
Annual Report | The accompanying notes are an integral part of these financial statements. | 25
Templeton Global Smaller Companies Fund
Notes to Financial Statements
1. ORGANIZATION AND SIGNIFICANT ACCOUNTING POLICIES
Templeton Global Smaller Companies Fund (Fund) is registered under the Investment Company Act of 1940, as amended, (1940 Act) as an open-end investment company. The Fund offers four classes of shares: Class A, Class C, Class R6, and Advisor Class. Effective May 1, 2013, the Fund began offering a new class of shares, Class R6. Effective March 22, 2013, all Class B shares were converted to Class A. Each class of shares differs by its initial sales load, contingent deferred sales charges, voting rights on matters affecting a single class, its exchange privilege and fees primarily due to differing arrangements for distribution and transfer agent fees.
The following summarizes the Fund’s significant accounting policies.
a. Financial Instrument Valuation
The Fund’s investments in financial instruments are carried at fair value daily. Fair value is the price that would be received to sell an asset or paid to transfer a liability in an orderly transaction between market participants on the measurement date. Under procedures approved by the Fund’s Board of Trustees (the Board), the Fund’s administrator, investment manager and other affiliates have formed the Valuation and Liquidity Oversight Committee (VLOC). The VLOC provides administration and oversight of the Fund’s valuation policies and procedures, which are approved annually by the Board. Among other things, these procedures allow the Fund to utilize independent pricing services, quotations from securities and financial instrument dealers, and other market sources to determine fair value.
Equity securities listed on an exchange or on the NASDAQ National Market System are valued at the last quoted sale price or the official closing price of the day, respectively. Foreign equity securities are valued as of the close of trading on the foreign stock exchange on which the security is primarily traded, or the NYSE, whichever is earlier. The value is then converted into its U.S. dollar equivalent at the foreign exchange rate in effect at the close of the NYSE on the day that the value of the security is determined. Over-the-counter (OTC) securities are valued within the range of the most recent quoted bid and ask prices. Securities that trade in multiple markets or on multiple exchanges are valued according to the broadest and most representative market. Certain equity securities are valued based upon fundamental characteristics or relationships to similar securities. Investments in non-registered money market funds are valued at closing net asset value.
The Fund has procedures to determine the fair value of financial instruments for which market prices are not reliable or readily available. Under these procedures, the VLOC convenes on a regular basis to review such financial instruments and considers a number of factors, including significant unobservable valuation inputs, when arriving at fair value. The VLOC primarily employs a market-based approach which may use related or comparable assets or liabilities, recent transactions, market multiples, book values, and other relevant information for the investment to determine the fair value of the investment. An income-based valuation approach may also be used in which the anticipated future cash flows of the investment are discounted to calculate fair value. Discounts may also be applied due to the nature or duration of any restrictions
26 | Annual Report
Templeton Global Smaller Companies Fund
Notes to Financial Statements (continued)
| 1. | ORGANIZATION AND SIGNIFICANT ACCOUNTING POLICIES (continued) |
| a. | Financial Instrument Valuation (continued) |
on the disposition of the investments. Due to the inherent uncertainty of valuations of such investments, the fair values may differ significantly from the values that would have been used had an active market existed. The VLOC employs various methods for calibrating these valuation approaches including a regular review of key inputs and assumptions, transactional back-testing or disposition analysis, and reviews of any related market activity.
Trading in securities on foreign securities stock exchanges and OTC markets may be completed before the daily close of business on the NYSE. Occasionally, events occur between the time at which trading in a foreign security is completed and the close of the NYSE that might call into question the reliability of the value of a portfolio security held by the Fund. As a result, differences may arise between the value of the Fund’s portfolio securities as determined at the foreign market close and the latest indications of value at the close of the NYSE. In order to minimize the potential for these differences, the VLOC monitors price movements following the close of trading in foreign stock markets through a series of country specific market proxies (such as baskets of American Depositary Receipts, futures contracts and exchange traded funds). These price movements are measured against established trigger thresholds for each specific market proxy to assist in determining if an event has occurred that may call into question the reliability of the values of the foreign securities held by the Fund. If such an event occurs, the securities may be valued using fair value procedures, which may include the use of independent pricing services.
In addition, certain foreign markets may be open on days that the NYSE is closed, which could result in differences between the value of the Fund’s portfolio securities on the last business day and the last calendar day of the reporting period. Any significant security valuation changes due to an open foreign market are adjusted and reflected by the Fund for financial reporting purposes.
b. Foreign Currency Translation
Portfolio securities and other assets and liabilities denominated in foreign currencies are translated into U.S. dollars based on the exchange rate of such currencies against U.S. dollars on the date of valuation. The Fund may enter into foreign currency exchange contracts to facilitate transactions denominated in a foreign currency. Purchases and sales of securities, income and expense items denominated in foreign currencies are translated into U.S. dollars at the exchange rate in effect on the transaction date. Occasionally, events may impact the availability or reliability of foreign exchange rates used to convert the U.S. dollar equivalent value. If such an event occurs, the foreign exchange rate will be valued at fair value using procedures established and approved by the Board.
The Fund does not separately report the effect of changes in foreign exchange rates from changes in market prices on securities held. Such changes are included in net realized and unrealized gain or loss from investments on the Statement of Operations.
Realized foreign exchange gains or losses arise from sales of foreign currencies, currency gains or losses realized between the trade and settlement dates on securities transactions and the difference
Annual Report | 27
Templeton Global Smaller Companies Fund
Notes to Financial Statements (continued)
| 1. | ORGANIZATION AND SIGNIFICANT ACCOUNTING POLICIES (continued) |
| b. | Foreign Currency Translation (continued) |
between the recorded amounts of dividends, interest, and foreign withholding taxes and the U.S. dollar equivalent of the amounts actually received or paid. Net unrealized foreign exchange gains and losses arise from changes in foreign exchange rates on foreign denominated assets and liabilities other than investments in securities held at the end of the reporting period.
c. Securities Lending
The Fund participates in an agency based securities lending program. The Fund receives cash collateral against the loaned securities in an amount equal to at least 102% of the market value of the loaned securities. Collateral is maintained over the life of the loan in an amount not less than 100% of the market value of loaned securities, as determined at the close of fund business each day; any additional collateral required due to changes in security values is delivered to the Fund on the next business day. The collateral is invested in a non-registered money fund as indicated on the Statement of Investments. The Fund receives income from the investment of cash collateral, in addition to lending fees and rebates paid by the borrower. The Fund bears the market risk with respect to the collateral investment, securities loaned, and the risk that the agent may default on its obligations to the Fund. The securities lending agent has agreed to indemnify the Fund in the event of default by a third party borrower.
d. Income and Deferred Taxes
It is the Fund’s policy to qualify as a regulated investment company under the Internal Revenue Code. The Fund intends to distribute to shareholders substantially all of its taxable income and net realized gains to relieve it from federal income and excise taxes. As a result, no provision for U.S. federal income taxes is required.
The Fund may be subject to foreign taxation related to income received, capital gains on the sale of securities and certain foreign currency transactions in the foreign jurisdictions in which it invests. Foreign taxes, if any, are recorded based on the tax regulations and rates that exist in the foreign markets in which the Fund invests. When a capital gain tax is determined to apply the Fund records an estimated deferred tax liability in an amount that would be payable if the securities were disposed of on the valuation date.
The Fund recognizes the tax benefits of uncertain tax positions only when the position is “more likely than not” to be sustained upon examination by the tax authorities based on the technical merits of the tax position. As of August 31, 2013, and for all open tax years, the Fund has determined that no liability for unrecognized tax benefits is required in the Fund’s financial statements related to uncertain tax positions taken on a tax return (or expected to be taken on future tax returns). Open tax years are those that remain subject to examination and are based on each tax jurisdiction statute of limitation.
28 | Annual Report
Templeton Global Smaller Companies Fund
Notes to Financial Statements (continued)
| 1. | ORGANIZATION AND SIGNIFICANT ACCOUNTING POLICIES (continued) |
| e. | Security Transactions, Investment Income, Expenses and Distributions |
Security transactions are accounted for on trade date. Realized gains and losses on security transactions are determined on a specific identification basis. Interest income and estimated expenses are accrued daily. Amortization of premium and accretion of discount on debt securities are included in interest income. Dividend income is recorded on the ex-dividend date except that certain dividends from foreign securities are recognized as soon as the Fund is notified of the ex-dividend date. Distributions to shareholders are recorded on the ex-dividend date and are determined according to income tax regulations (tax basis). Distributable earnings determined on a tax basis may differ from earnings recorded in accordance with accounting principles generally accepted in the United States of America. These differences may be permanent or temporary. Permanent differences are reclassified among capital accounts to reflect their tax character. These reclassifications have no impact on net assets or the results of operations. Temporary differences are not reclassified, as they may reverse in subsequent periods.
Realized and unrealized gains and losses and net investment income, not including class specific expenses, are allocated daily to each class of shares based upon the relative proportion of net assets of each class. Differences in per share distributions, by class, are generally due to differences in class specific expenses.
f. Accounting Estimates
The preparation of financial statements in accordance with accounting principles generally accepted in the United States of America requires management to make estimates and assumptions that affect the reported amounts of assets and liabilities at the date of the financial statements and the amounts of income and expenses during the reporting period. Actual results could differ from those estimates.
g. Guarantees and Indemnifications
Under the Fund’s organizational documents, its officers and trustees are indemnified by the Fund against certain liabilities arising out of the performance of their duties to the Fund. Additionally, in the normal course of business, the Fund enters into contracts with service providers that contain general indemnification clauses. The Fund’s maximum exposure under these arrangements is unknown as this would involve future claims that may be made against the Fund that have not yet occurred. Currently, the Fund expects the risk of loss to be remote.
Annual Report | 29
Templeton Global Smaller Companies Fund
Notes to Financial Statements (continued)
2. SHARES OF BENEFICIAL INTEREST
At August 31, 2013, there were an unlimited number of shares authorized (without par value).
Transactions in the Fund’s shares were as follows:
| Year Ended August 31, | ||||||||||
| 2013 | 2012 | |||||||||
| Shares | Amount | Shares | Amount | |||||||
| Class A Shares: | ||||||||||
| Shares sold | 21,872,236 | $ | 162,224,042 | 12,042,425 | $ | 75,636,330 | ||||
| Shares issued in reinvestment | ||||||||||
| of distributions | 1,470,109 | 10,070,246 | 1,129,848 | 6,462,731 | ||||||
| Shares redeemed | (22,783,857 | ) | (163,988,731 | ) | (25,621,848 | ) | (158,545,025 | ) | ||
| Net increase (decrease) | 558,488 | $ | 8,305,557 | (12,449,575 | ) | $ | (76,445,964 | ) | ||
| Class B Sharesa: | ||||||||||
| Shares sold | 682 | $ | 4,321 | 10,607 | $ | 62,430 | ||||
| Shares issued in reinvestment | ||||||||||
| of distributions | — | — | 180 | 980 | ||||||
| Shares redeemed | (70,218 | ) | (462,388 | ) | (186,702 | ) | (1,111,276 | ) | ||
| Net increase (decrease) | (69,536 | ) | $ | (458,067 | ) | (175,915 | ) | $ | (1,047,866 | ) |
| Class C Shares: | ||||||||||
| Shares sold | 875,497 | $ | 6,183,553 | 641,910 | $ | 3,888,727 | ||||
| Shares issued in reinvestment | ||||||||||
| of distributions | 35,428 | 235,241 | 20,661 | 114,669 | ||||||
| Shares redeemed | (1,168,004 | ) | (7,989,743 | ) | (1,715,267 | ) | (10,262,874 | ) | ||
| Net increase (decrease) | (257,079 | ) | $ | (1,570,949 | ) | (1,052,696 | ) | $ | (6,259,478 | ) |
| Class R6 Sharesb: | ||||||||||
| Shares sold | 673 | $ | 5,000 | |||||||
| Net increase (decrease) | 673 | $ | 5,000 | |||||||
| Advisor Class Shares: | ||||||||||
| Shares sold | 2,584,735 | $ | 18,937,131 | 3,279,165 | $ | 20,465,987 | ||||
| Shares issued in reinvestment | ||||||||||
| of distributions | 282,548 | 1,938,283 | 210,499 | 1,206,162 | ||||||
| Shares redeemed | (3,145,132 | ) | (22,252,546 | ) | (2,352,334 | ) | (14,594,123 | ) | ||
| Net increase (decrease) | (277,849 | ) | $ | (1,377,132 | ) | 1,137,330 | $ | 7,078,026 | ||
| aEffective March 22, 2013, all Class B shares were converted to Class A. | ||||||||||
| bFor the period May 1, 2013 (effective date) to August 31, 2013. | ||||||||||
30 | Annual Report
Templeton Global Smaller Companies Fund
Notes to Financial Statements (continued)
3. TRANSACTIONS WITH AFFILIATES
Franklin Resources, Inc. is the holding company for various subsidiaries that together are referred to as Franklin Templeton Investments. Certain officers and trustees of the Fund are also officers and/or directors of the following subsidiaries:
| Subsidiary | Affiliation |
| Franklin Templeton Investment Corp. (FTIC) | Investment manager |
| Templeton Investment Counsel, LLC (TIC) | Investment manager – sub-advisor |
| Franklin Templeton Services, LLC (FT Services) | Administrative manager |
| Franklin Templeton Distributors, Inc. (Distributors) | Principal underwriter |
| Franklin Templeton Investor Services, LLC (Investor Services) | Transfer agent |
a. Management Fees
The Fund pays an investment management fee to FTIC based on the average daily net assets of the Fund as follows:
| Annualized Fee Rate | Net Assets | |
| 0.750 | % | Up to and including $1 billion |
| 0.730 | % | Over $1 billion, up to and including $5 billion |
| 0.710 | % | Over $5 billion, up to and including $10 billion |
| 0.690 | % | Over $10 billion, up to and including $15 billion |
| 0.670 | % | Over $15 billion, up to and including $20 billion |
| 0.650 | % | In excess of $20 billion |
Under a subadvisory agreement, TIC, an affiliate of FTIC, provides subadvisory services to the Fund. The subadvisory fee is paid by FTIC fees based on the average daily net assets and is not an additional expense of the Fund.
b. Administrative Fees
The Fund pays an administrative fee to FT Services based on the Fund’s average daily net assets as follows:
| Annualized Fee Rate | Net Assets | |
| 0.150 | % | Up to and including $200 million |
| 0.135 | % | Over $200 million, up to and including $700 million |
| 0.100 | % | Over $700 million, up to and including $1.2 billion |
| 0.075 | % | In excess of $1.2 billion |
c. Distribution Fees
The Board has adopted distribution plans for each share class, with the exception of Class R6 and Advisor Class shares, pursuant to Rule 12b-1 under the 1940 Act. Distribution fees are not charged on shares held by affiliates. Under the Fund’s Class A reimbursement distribution plan, the Fund reimburses Distributors for costs incurred in connection with the servicing, sale and distribution of the Fund’s shares up to the maximum annual plan rate. Under the
Annual Report | 31
Templeton Global Smaller Companies Fund
Notes to Financial Statements (continued)
| 3. | TRANSACTIONS WITH AFFILIATES (continued) |
| c. | Distribution Fees (continued) |
Class A reimbursement distribution plan, costs exceeding the maximum for the current plan year cannot be reimbursed in subsequent periods. In addition, under the Fund’s Class B and C compensation distribution plans, the Fund pays Distributors for costs incurred in connection with the servicing, sale and distribution of the Fund’s shares up to the maximum annual plan rate for each class. The plan year, for purposes of monitoring compliance with the maximum annual plan rates, is February 1 through January 31.
The maximum annual plan rates, based on the average daily net assets, for each class, are as follows:
| Class A | 0.25 | % |
| Class B | 1.00 | % |
| Class C | 1.00 | % |
d. Sales Charges/Underwriting Agreements
Front-end sales charges and contingent deferred sales charges (CDSC) do not represent expenses of the Fund. These charges are deducted from the proceeds of sales of Fund shares prior to investment or from redemption proceeds prior to remittance, as applicable. Distributors has advised the Fund of the following commission transactions related to the sales and redemptions of the Fund’s shares for the year:
| Sales charges retained net of commissions paid to | ||
| unaffiliated broker/dealers | $ | 503,020 |
| CDSC retained | $ | 5,503 |
e. Transfer Agent Fees
Each class of shares, except for Class R6, pays transfer agent fees to Investor Services for its performance of shareholder servicing obligations and reimburses Investor Services for out of pocket expenses incurred, including shareholding servicing fees paid to third parties. These fees are allocated daily based upon their relative proportion of such classes’ aggregate net assets. Class R6 pays Investor Services transfer agent fees specific to that class.
For the year ended August 31, 2013, the Fund paid transfer agent fees of $1,888,635, of which $906,938 was retained by Investor Services.
f. Waiver and Expense Reimbursement
Investor Services has contractually agreed in advance to waive or limit its fees so that the Class R6 transfer agent fees do not exceed 0.01% until December 31, 2014.
32 | Annual Report
Templeton Global Smaller Companies Fund
Notes to Financial Statements (continued)
4. EXPENSE OFFSET ARRANGEMENT
The Fund has entered into an arrangement with its custodian whereby credits realized as a result of uninvested cash balances are used to reduce a portion of the Fund’s custodian expenses. During the year ended August 31, 2013, the custodian fees were reduced as noted in the Statement of Operations.
5. INCOME TAXES
For tax purposes, capital losses may be carried over to offset future capital gains. Capital loss carry-forwards with no expiration, if any, must be fully utilized before those losses with expiration dates.
At August 31, 2013, the Fund had capital loss carryforwards of $86,469,348 expiring in 2018.
During the year ended August 31, 2013, the Fund utilized $58,400,823 of capital loss carryforwards.
The tax character of distributions paid during the years ended August 31, 2013 and 2012, was as follows:
| 2013 | 2012 | |||
| Distributions paid from ordinary income | $ | 13,604,405 | $ | 8,733,367 |
At August 31, 2013, the cost of investments, net unrealized appreciation (depreciation) and undistributed ordinary income for income tax purposes were as follows:
| Cost of investments | $ | 869,838,860 | |
| Unrealized appreciation | $ | 240,065,740 | |
| Unrealized depreciation | (91,036,004 | ) | |
| Net unrealized appreciation (depreciation) | $ | 149,029,736 | |
| Distributable earnings - undistributed ordinary income | $ | 3,311,379 | |
Differences between income and/or capital gains as determined on a book basis and a tax basis are primarily due to differing treatments of passive foreign investment company shares.
6. INVESTMENT TRANSACTIONS
Purchases and sales of investments (excluding short term securities) for the year ended August 31, 2013, aggregated $251,659,361 and $286,350,157, respectively.
Annual Report | 33
Templeton Global Smaller Companies Fund
Notes to Financial Statements (continued)
7. CONCENTRATION OF RISK
Investing in foreign securities may include certain risks and considerations not typically associated with investing in U.S. securities, such as fluctuating currency values and changing local and regional economic, political and social conditions, which may result in greater market volatility. In addition, certain foreign securities may not be as liquid as U.S. securities.
8. HOLDINGS OF 5% VOTING SECURITIES OF PORTFOLIO COMPANIES
The 1940 Act defines “affiliated companies” to include investments in portfolio companies in which a fund owns 5% or more of the outstanding voting securities. Investments in “affiliated companies” for the Fund for the year ended August 31, 2013, were as shown below.
| Number of | Number of | |||||||||
| Shares Held | Shares Held | Value | Realized | |||||||
| at Beginning | Gross | Gross | at End | at End | Investment | Capital | ||||
| Name of Issuer | of Period | Additions | Reductions | of Period | of Period | Income | Gain (Loss) | |||
| Non-Controlled Affiliates | ||||||||||
| Heidrick & Struggles International | ||||||||||
| Inc. | 499,310 | 491,360 | — | 990,670 | $ | 14,909,583 | $ | 401,401 | $ | — |
| JAKKS Pacific Inc. | 1,067,960 | 459,160 | — | 1,527,120 | 7,925,753 | 363,106 | — | |||
| West Marine Inc. | 1,235,180 | — | — | 1,235,180 | 14,031,645 | — | — | |||
| Total Affiliated Securities (Value is 3.44% of Net Assets) | $ | 36,866,981 | $ | 764,507 | $ | — | ||||
9. CREDIT FACILITY
The Fund, together with other U.S. registered and foreign investment funds (collectively, Borrowers), managed by Franklin Templeton Investments, are borrowers in a joint syndicated senior unsecured credit facility totaling $1.5 billion (Global Credit Facility) which matures on January 17, 2014. This Global Credit Facility provides a source of funds to the Borrowers for temporary and emergency purposes, including the ability to meet future unanticipated or unusually large redemption requests.
Under the terms of the Global Credit Facility, the Fund shall, in addition to interest charged on any borrowings made by the Fund and other costs incurred by the Fund, pay its share of fees and expenses incurred in connection with the implementation and maintenance of the Global Credit Facility, based upon its relative share of the aggregate net assets of all of the Borrowers, including an annual commitment fee of 0.07% based upon the unused portion of the Global Credit Facility. These fees are reflected in other expenses on the Statement of Operations. During the year ended August 31, 2013, the Fund did not use the Global Credit Facility.
34 | Annual Report
Templeton Global Smaller Companies Fund
Notes to Financial Statements (continued)
10. FAIR VALUE MEASUREMENTS
The Fund follows a fair value hierarchy that distinguishes between market data obtained from independent sources (observable inputs) and the Fund’s own market assumptions (unobservable inputs). These inputs are used in determining the value of the Fund’s financial instruments and are summarized in the following fair value hierarchy:
- Level 1 – quoted prices in active markets for identical financial instruments
- Level 2 – other significant observable inputs (including quoted prices for similar financial instruments, interest rates, prepayment speed, credit risk, etc.)
- Level 3 – significant unobservable inputs (including the Fund’s own assumptions in deter- mining the fair value of financial instruments)
The inputs or methodology used for valuing financial instruments are not an indication of the risk associated with investing in those financial instruments.
For movements between the levels within the fair value hierarchy, the Fund has adopted a policy of recognizing the transfers as of the date of the underlying event which caused the movement.
A summary of inputs used as of August 31, 2013, in valuing the Fund’s assets carried at fair value, is as follows:
| Level 1 | Level 2 | Level 3 | Total | |||||
| Assets: | ||||||||
| Investments in Securities: | ||||||||
| Equity Investmentsa,b | $ | 995,489,501 | $ | — | $ | — c | $ | 995,489,501 |
| Short Term Investments | — | 23,379,095 | — | 23,379,095 | ||||
| Total Investments in | ||||||||
| Securities | $ | 995,489,501 | $ | 23,379,095 | $ | —c | $ | 1,018,868,596 |
aFor detailed categories, see the accompanying Statement of Investments.
bIncludes common, preferred stocks as well as other equity investments.
cIncludes securities determined to have no value at August 31, 2013.
A reconciliation of assets in which Level 3 inputs are used in determining fair value is presented when there are significant Level 3 investments at the end of the period.
Annual Report | 35
Templeton Global Smaller Companies Fund
Notes to Financial Statements (continued)
11. NEW ACCOUNTING PRONOUNCEMENTS
In December 2011, the Financial Accounting Standards Board (FASB) issued Accounting Standards Update (ASU) No. 2011-11, Balance Sheet (Topic 210): Disclosures about Offsetting Assets and Liabilities. The amendments in the ASU enhance disclosures about offsetting of financial assets and liabilities to enable investors to understand the effect of these arrangements on a fund’s financial position. In January 2013, FASB issued ASU No. 2013-01, Balance Sheet (Topic 210): Clarifying the Scope of Disclosures about Offsetting Assets and Liabilities. The amendments in ASU No. 2013-01 clarify the intended scope of disclosures required by ASU No. 2011-11. These ASUs are effective for interim and annual reporting periods beginning on or after January 1, 2013. The Fund believes the adoption of these ASUs will not have a material impact on its financial statements.
In June 2013, the FASB issued ASU No. 2013-08, Investment Companies (Topic 946): Amendments to the Scope, Measurement, and Disclosure Requirements. The ASU modifies the criteria used in defining an investment company under U.S. Generally Accepted Accounting Principles and also sets forth certain measurement and disclosure requirements. Under the ASU, an entity that is registered under the 1940 Act automatically qualifies as an investment company. The ASU is effective for interim and annual reporting periods beginning after December 15, 2013. The Fund is currently reviewing the requirements and believes the adoption of this ASU will not have a material impact on its financial statements.
12. SUBSEQUENT EVENTS
The Fund has evaluated subsequent events through the issuance of the financial statements and determined that no events have occurred that require disclosure.
ABBREVIATIONS
Selected Portfolio
ETF - Exchange Traded Fund
SDR - Swedish Depositary Receipt
36 | Annual Report
Templeton Global Smaller Companies Fund
Report of Independent Registered Public Accounting Firm
To the Board of Trustees and Shareholders of Templeton Global Smaller Companies Fund
In our opinion, the accompanying statement of assets and liabilities, including the statement of investments, and the related statements of operations and of changes in net assets and the financial highlights present fairly, in all material respects, the financial position of Templeton Global Smaller Companies Fund (the “Fund”) at August 31, 2013, the results of its operations for the year then ended, the changes in its net assets for each of the two years in the period then ended and the financial highlights for each of the periods presented, in conformity with accounting principles generally accepted in the United States of America. These financial statements and financial highlights (hereafter referred to as “financial statements”) are the responsibility of the Fund’s management. Our responsibility is to express an opinion on these financial statements based on our audits. We conducted our audits of these financial statements in accordance with the standards of the Public Company Accounting Oversight Board (United States). Those standards require that we plan and perform the audit to obtain reasonable assurance about whether the financial statements are free of material misstatement. An audit includes examining, on a test basis, evidence supporting the amounts and disclosures in the financial statements, assessing the accounting principles used and significant estimates made by management, and evaluating the overall financial statement presentation. We believe that our audits, which included confirmation of securities at August 31, 2013 by correspondence with the custodian and brokers, provide a reasonable basis for our opinion.
PricewaterhouseCoopers LLP
San Francisco, California October 18, 2013
Annual Report | 37
Templeton Global Smaller Companies Fund
Tax Information (unaudited)
Under Section 854(b)(1)(A) of the Internal Revenue Code (Code), the Fund hereby reports 20.28% of the ordinary income dividends as income qualifying for the dividends received deduction for the fiscal year ended August 31, 2013.
Under Section 854(b)(1)(B) of the Code, the Fund hereby reports the maximum amount allowable but no less than $12,189,381 as qualified dividends for purposes of the maximum rate under Section 1(h)(11) of the Code for the fiscal year ended August 31, 2013. Distributions, including qualified dividend income, paid during calendar year 2013 will be reported to shareholders on Form 1099-DIV by mid-February 2014. Shareholders are advised to check with their tax advisors for information on the treatment of these amounts on their individual income tax returns.
At August 31, 2012, more than 50% of the Fund’s total assets were invested in securities of foreign issuers. In most instances, foreign taxes were withheld from income paid to the Fund on these investments. As shown in the table below, the Fund hereby reports to shareholders the foreign source income and foreign taxes paid, pursuant to Section 853 of the Code. This written statement will allow shareholders of record on December 19, 2012, to treat their proportionate share of foreign taxes paid by the Fund as having been paid directly by them. The shareholder shall consider these amounts as foreign taxes paid in the tax year in which they receive the Fund distribution.
The following table provides a detailed analysis of foreign tax paid, foreign source income, and foreign qualified dividends as reported by the Fund, to Class A, Class B, Class C, and Advisor Class shareholders of record.
| Foreign Tax | Foreign | Foreign | ||||
| Paid | Source Income | Qualified Dividends | ||||
| Class | Per Share | Per Share | Per Share | |||
| Class A | $ | 0.0137 | $ | 0.0809 | $ | 0.0460 |
| Class B | $ | — | $ | — | $ | — |
| Class C | $ | 0.0137 | $ | 0.0374 | $ | 0.0213 |
| Advisor Class | $ | 0.0137 | $ | 0.0950 | $ | 0.0540 |
Foreign Tax Paid Per Share (Column 1) is the amount per share available to you, as a tax credit (assuming you held your shares in the Fund for a minimum of 16 days during the 31-day period beginning 15 days before the ex-dividend date of the Fund’s distribution to which the foreign taxes relate), or, as a tax deduction.
Foreign Source Income Per Share (Column 2) is the amount per share of income dividends attributable to foreign securities held by the Fund, plus any foreign taxes withheld on these dividends. The amounts reported include foreign source qualified dividends that have not been adjusted for the rate differential applicable to such dividend income.1
38 | Annual Report
Templeton Global Smaller Companies Fund
Tax Information (unaudited) (continued)
Foreign Qualified Dividends Per Share (Column 3) is the amount per share of foreign source qualified dividends, plus any foreign taxes withheld on these dividends. These amounts represent the portion of the Foreign Source Income reported to you in column 2 that were derived from qualified foreign securities held by the Fund.1
By mid-February 2013, shareholders received Form 1099-DIV which included their share of taxes paid and foreign source income distributed during the calendar year 2012. The Foreign Source Income reported on Form 1099-DIV has not been adjusted for the rate differential on foreign source qualified dividend income. Shareholders are advised to check with their tax advisors for information on the treatment of these amounts on their 2012 individual income tax returns.
1Qualified dividends are taxed at reduced long term capital gains tax rates. In determining the amount of foreign tax credit that may be applied against the U.S. tax liability of individuals receiving foreign source qualified dividends, adjustments may be required to the foreign tax credit limitation calculation to reflect the rate differential applicable to such dividend income. The rules however permit certain individuals to elect not to apply the rate differential adjustments for capital gains and/or dividends for any taxable year. Please consult your tax advisor and the instructions to Form 1116 for more information.
Annual Report | 39
Templeton Global Smaller Companies Fund
Board Members and Officers
The name, year of birth and address of the officers and board members, as well as their affiliations, positions held with the Trust, principal occupations during at least the past five years and number of portfolios overseen in the Franklin Templeton Investments fund complex are shown below. Generally, each board member serves until that person’s successor is elected and qualified.
| Independent Board Members | ||||
| Number of Portfolios in | ||||
| Name, Year of Birth | Length of | Fund Complex Overseen | Other Directorships Held | |
| and Address | Position | Time Served | by Board Member* | During at Least the Past 5 Years |
| Harris J. Ashton (1932) | Trustee | Since 1992 | 141 | Bar-S Foods (meat packing |
| 300 S.E. 2nd Street | company) (1981-2010). | |||
| Fort Lauderdale, FL 33301-1923 | ||||
| Principal Occupation During at Least the Past 5 Years: | ||||
| Director of various companies; and formerly, Director, RBC Holdings, Inc. (bank holding company) (until 2002); and President, | ||||
| Chief Executive Officer and Chairman of the Board, General Host Corporation (nursery and craft centers) (until 1998). | ||||
| Ann Torre Bates (1958) | Trustee | Since 2008 | 38 | SLM Corporation (Sallie Mae), |
| 300 S.E. 2nd Street | Ares Capital Corporation (specialty | |||
| Fort Lauderdale, FL 33301-1923 | finance company) and Allied Capital | |||
| Corporation (financial services) | ||||
| (2003-2010). | ||||
| Principal Occupation During at Least the Past 5 Years: | ||||
| Independent strategic and financial consultant; and formerly, Executive Vice President and Chief Financial Officer, NHP Incorporated | ||||
| (manager of multifamily housing) (1995-1997); and Vice President and Treasurer, US Airways, Inc. (until 1995). | ||||
| Frank J. Crothers (1944) | Trustee | Since 2004 | 27 | Talon Metals Corp. (mining explo- |
| 300 S.E. 2nd Street | ration), Fortis, Inc. (utility holding | |||
| Fort Lauderdale, FL 33301-1923 | company) and AML Foods Limited | |||
| (retail distributors). | ||||
| Principal Occupation During at Least the Past 5 Years: | ||||
| Director and Vice Chairman, Caribbean Utilities Company, Ltd.; director of various other private business and nonprofit organizations; and | ||||
| formerly, Chairman, Atlantic Equipment and Power Ltd. (1977-2003). | ||||
| Edith E. Holiday (1952) | Lead | Trustee since | 141 | Hess Corporation (exploration and |
| 300 S.E. 2nd Street | Independent | 2004 and Lead | refining of oil and gas), H.J. Heinz | |
| Fort Lauderdale, FL 33301-1923 | Trustee | Independent | Company (processed foods and allied | |
| Trustee since | products) (1994-2013), RTI | |||
| 2007 | International Metals, Inc. (manufacture | |||
| and distribution of titanium), Canadian | ||||
| National Railway (railroad) and White | ||||
| Mountains Insurance Group, Ltd. | ||||
| (holding company). | ||||
| Principal Occupation During at Least the Past 5 Years: | ||||
| Director or Trustee of various companies and trusts; and formerly, Assistant to the President of the United States and Secretary of the | ||||
| Cabinet (1990-1993); General Counsel to the United States Treasury Department (1989-1990); and Counselor to the Secretary and Assistant | ||||
| Secretary for Public Affairs and Public Liaison – United States Treasury Department (1988-1989). | ||||
| 40 | Annual Report | ||||
| Number of Portfolios in | |||||
| Name, Year of Birth | Length of | Fund Complex Overseen | Other Directorships Held | ||
| and Address | Position | Time Served | by Board Member* | During at Least the Past 5 Years | |
| J. Michael Luttig (1954) | Trustee | Since 2009 | 141 | Boeing Capital Corporation (aircraft | |
| 300 S.E. 2nd Street | financing) (2006-2013). | ||||
| Fort Lauderdale, FL 33301-1923 | |||||
| Principal Occupation During at Least the Past 5 Years: | |||||
| Executive Vice President, General Counsel and member of Executive Council, The Boeing Company (aerospace company); and formerly, | |||||
| Federal Appeals Court Judge, U.S. Court of Appeals for the Fourth Circuit (1991-2006). | |||||
| David W. Niemiec (1949) | Trustee | Since 2005 | 34 | Emeritus Corporation (assisted living) | |
| 300 S.E. 2nd Street | (1999-2010) and OSI Pharmaceuticals, | ||||
| Fort Lauderdale, FL 33301-1923 | Inc. (pharmaceutical products) | ||||
| (2006-2010). | |||||
| Principal Occupation During at Least the Past 5 Years: | |||||
| Advisor, Saratoga Partners (private equity fund); and formerly, Managing Director, Saratoga Partners (1998-2001) and SBC Warburg Dillon | |||||
| Read (investment banking) (1997-1998); Vice Chairman, Dillon, Read & Co. Inc. (investment banking) (1991-1997); and Chief Financial | |||||
| Officer, Dillon, Read & Co. Inc. (1982-1997). | |||||
| Frank A. Olson (1932) | Trustee | Since 2004 | 141 | Hess Corporation (exploration and | |
| 300 S.E. 2nd Street | refining of oil and gas) (1998-2013). | ||||
| Fort Lauderdale, FL 33301-1923 | |||||
| Principal Occupation During at Least the Past 5 Years: | |||||
| Chairman Emeritus, The Hertz Corporation (car rental) (since 2000) (Chairman of the Board (1980-2000) and Chief Executive Officer | |||||
| (1977-1999)); and formerly, Chairman of the Board, President and Chief Executive Officer, UAL Corporation (airlines) (until 1987). | |||||
| Larry D. Thompson (1945) | Trustee | Since 2005 | 141 | Cbeyond, Inc. (business communica- | |
| 300 S.E. 2nd Street | tions provider) (2010-2012), The | ||||
| Fort Lauderdale, FL 33301-1923 | Southern Company (energy company) | ||||
| (2010-2012) and The Washington | |||||
| Post Company (education and media | |||||
| organization). | |||||
| Principal Occupation During at Least the Past 5 Years: | |||||
| Executive Vice President – Government Affairs, General Counsel and Corporate Secretary, PepsiCo, Inc. (consumer products) (July 2012); | |||||
| and formerly, John A. Sibley Professor of Corporate and Business Law, University of Georgia School of Law (2011-2012); Senior Vice | |||||
| President – Government Affairs, General Counsel and Secretary, PepsiCo, Inc. (2004-2011); Senior Fellow of The Brookings Institution | |||||
| (2003-2004); Visiting Professor, University of Georgia School of Law (2004); and Deputy Attorney General, U.S. Department of Justice | |||||
| (2001-2003). | |||||
| Constantine D. Tseretopoulos | Trustee | Since 2004 | 27 | None | |
| (1954 | ) | ||||
| 300 S.E. 2nd Street | |||||
| Fort Lauderdale, FL 33301-1923 | |||||
| Principal Occupation During at Least the Past 5 Years: | |||||
| Physician, Chief of Staff, owner and operator of the Lyford Cay Hospital (1987-present); director of various nonprofit organizations; and | |||||
| formerly, Cardiology Fellow, University of Maryland (1985-1987); and Internal Medicine Resident, Greater Baltimore Medical Center | |||||
| (1982-1985). | |||||
| Robert E. Wade (1946) | Trustee | Since 2006 | 45 | El Oro Ltd. (investments). | |
| 300 S.E. 2nd Street | |||||
| Fort Lauderdale, FL 33301-1923 | |||||
| Principal Occupation During at Least the Past 5 Years: | |||||
| Attorney at law engaged in private practice (1972-2008) and member of various boards. | |||||
| Annual Report | 41 | |||||
| Interested Board Members and Officers | ||||
| Number of Portfolios in | ||||
| Name, Year of Birth | Length of | Fund Complex Overseen | Other Directorships Held | |
| and Address | Position | Time Served | by Board Member* | During at Least the Past 5 Years |
| **Gregory E. Johnson (1961) | Trustee | Since 2007 | 152 | None |
| One Franklin Parkway | ||||
| San Mateo, CA 94403-1906 | ||||
| Principal Occupation During at Least the Past 5 Years: | ||||
| Chairman of the Board, Member – Office of the Chairman, Director, President and Chief Executive Officer, Franklin Resources, Inc.; officer | ||||
| and/or director or trustee, as the case may be, of some of the other subsidiaries of Franklin Resources, Inc. and of 44 of the investment | ||||
| companies in Franklin Templeton Investments; and Chairman, Investment Company Institute. | ||||
| **Rupert H. Johnson, Jr. (1940) | Chairman of | Chairman of the | 141 | None |
| One Franklin Parkway | the Board and | Board and Trustee | ||
| San Mateo, CA 94403-1906 | Trustee and | since June 2013, | ||
| Vice President | and Vice President | |||
| since 1996 | ||||
| Principal Occupation During at Least the Past 5 Years: | ||||
| Vice Chairman, Member – Office of the Chairman and Director, Franklin Resources, Inc.; Director, Franklin Advisers, Inc.; Senior Vice | ||||
| President, Franklin Advisory Services, LLC; and officer and/or director or trustee, as the case may be, of some of the other subsidiaries of | ||||
| Franklin Resources, Inc. and of 41 of the investment companies in Franklin Templeton Investments. | ||||
| Alison E. Baur (1964) | Vice President | Since 2012 | Not Applicable | Not Applicable |
| One Franklin Parkway | ||||
| San Mateo, CA 94403-1906 | ||||
| Principal Occupation During at Least the Past 5 Years: | ||||
| Deputy General Counsel, Franklin Templeton Investments; and officer of some of the other subsidiaries of Franklin Resources, Inc. and of | ||||
| 46 of the investment companies in Franklin Templeton Investments. | ||||
| Norman J. Boersma (1957) | President and | Since 2012 | Not Applicable | Not Applicable |
| Lyford Cay | Chief | |||
| Nassau, Bahamas | Executive | |||
| Officer – | ||||
| Investment | ||||
| Management | ||||
| Principal Occupation During at Least the Past 5 Years: | ||||
| Director, President and Chief Executive Officer, Templeton Global Advisors Ltd.; Executive Vice President, Franklin Templeton Investment | ||||
| Corp.; Chief Investment Officer of Templeton Global Equity Group; and officer of six of the investment companies in Franklin Templeton | ||||
| Investments. | ||||
| Laura F. Fergerson (1962) | Chief Executive | Since 2009 | Not Applicable | Not Applicable |
| One Franklin Parkway | Officer – | |||
| San Mateo, CA 94403-1906 | Finance and | |||
| Administration | ||||
| Principal Occupation During at Least the Past 5 Years: | ||||
| Senior Vice President, Franklin Templeton Services, LLC; and officer of 46 of the investment companies in Franklin Templeton Investments. | ||||
42 | Annual Report
| Number of Portfolios in | ||||
| Name, Year of Birth | Length of | Fund Complex Overseen | Other Directorships Held | |
| and Address | Position | Time Served | by Board Member* | During at Least the Past 5 Years |
| Aliya S. Gordon (1973) | Vice President | Since 2009 | Not Applicable | Not Applicable |
| One Franklin Parkway | ||||
| San Mateo, CA 94403-1906 | ||||
| Principal Occupation During at Least the Past 5 Years: | ||||
| Senior Associate General Counsel, Franklin Templeton Investments; officer of 46 of the investment companies in Franklin Templeton | ||||
| Investments; and formerly, Litigation Associate, Steefel, Levitt & Weiss, LLP (2000-2004). | ||||
| Steven J. Gray (1955) | Vice President | Since 2009 | Not Applicable | Not Applicable |
| One Franklin Parkway | ||||
| San Mateo, CA 94403-1906 | ||||
| Principal Occupation During at Least the Past 5 Years: | ||||
| Senior Associate General Counsel, Franklin Templeton Investments; Vice President, Franklin Templeton Distributors, Inc.; and officer of 46 of | ||||
| the investment companies in Franklin Templeton Investments. | ||||
| Selena L. Holmes (1965) | Vice President | Since 2012 | Not Applicable | Not Applicable |
| 100 Fountain Parkway | – AML | |||
| St. Petersburg, FL 33716-1205 | Compliance | |||
| Principal Occupation During at Least the Past 5 Years: | ||||
| Director, Global Compliance Monitoring; and officer of 46 of the investment companies in Franklin Templeton Investments. | ||||
| Kimberly H. Novotny (1972) | Vice President | Since March 2013 | Not Applicable | Not Applicable |
| 300 S.E. 2nd Street Fort | ||||
| Lauderdale, FL 33301-1923 | ||||
| Principal Occupation During at Least the Past 5 Years: | ||||
| Senior Corporate Counsel, Franklin Templeton Investments; Vice President, Secretary and Trust Officer, Fiduciary Trust International of the | ||||
| South; Vice President, Templeton Investment Counsel, LLC; Assistant Secretary, Franklin Resources, Inc.; and officer of 46 of the investment | ||||
| companies in Franklin Templeton Investments. | ||||
| Mark H. Otani (1968) | Treasurer, | Since 2009 | Not Applicable | Not Applicable |
| One Franklin Parkway | Chief Financial | |||
| San Mateo, CA 94403-1906 | Officer and | |||
| Chief | ||||
| Accounting | ||||
| Officer | ||||
| Principal Occupation During at Least the Past 5 Years: | ||||
| Director, Global Fund Accounting Operations, Franklin Templeton Investments; and officer of 14 of the investment companies in Franklin | ||||
| Templeton Investments. | ||||
| Robert C. Rosselot (1960) | Chief | Since March 2013 | Not Applicable | Not Applicable |
| 300 S.E. 2nd Street | Compliance | |||
| Fort Lauderdale, FL 33301-1923 | Officer | |||
| Principal Occupation During at Least the Past 5 Years: | ||||
| Director, Global Compliance, Franklin Templeton Investments; officer of 46 of the investment companies in Franklin Templeton Investments; | ||||
| and formerly, Senior Associate General Counsel, Franklin Templeton Investments (2007-2013); and Secretary and Vice President, Templeton | ||||
| Group of Funds (2004-2013). | ||||
Annual Report | 43
| Number of Portfolios in | ||||
| Name, Year of Birth | Length of | Fund Complex Overseen | Other Directorships Held | |
| and Address | Position | Time Served | by Board Member* | During at Least the Past 5 Years |
| Karen L. Skidmore (1952) | Vice President | Since 2009 | Not Applicable | Not Applicable |
| One Franklin Parkway | ||||
| San Mateo, CA 94403-1906 | ||||
| Principal Occupation During at Least the Past 5 Years: | ||||
| Senior Associate General Counsel, Franklin Templeton Investments; and officer of 46 of the investment companies in Franklin Templeton | ||||
| Investments. | ||||
| Craig S. Tyle (1960) | Vice President | Since 2005 | Not Applicable | Not Applicable |
| One Franklin Parkway | ||||
| San Mateo, CA 94403-1906 | ||||
| Principal Occupation During at Least the Past 5 Years: | ||||
| General Counsel and Executive Vice President, Franklin Resources, Inc.; officer of some of the other subsidiaries of Franklin Resources, Inc. | ||||
| and of 46 of the investment companies in Franklin Templeton Investments; and formerly, Partner, Shearman & Sterling, LLP (2004-2005); | ||||
| and General Counsel, Investment Company Institute (ICI) (1997-2004). | ||||
| Lori A. Weber (1964) | Secretary and | Secretary since | Not Applicable | Not Applicable |
| 300 S.E. 2nd Street | Vice President | March 2013 and | ||
| Fort Lauderdale, FL 33301-1923 | Vice President | |||
| since 2011 | ||||
| Principal Occupation During at Least the Past 5 Years: | ||||
| Senior Associate General Counsel, Franklin Templeton Investments; Assistant Secretary, Franklin Resources, Inc.; Vice President and | ||||
| Secretary, Templeton Investment Counsel, LLC; Vice President, Fiduciary Trust International of the South; and officer of 46 of the investment | ||||
| companies in Franklin Templeton Investments. | ||||
*We base the number of portfolios on each separate series of the U.S. registered investment companies within the Franklin Templeton Investments fund complex. These portfolios
have a common investment manager or affiliated investment managers.
**Gregory E. Johnson is considered to be an interested person of the Fund under the federal securities laws due to his position as an officer and director of Franklin Resources, Inc.
(Resources), which is the parent company of the Fund's investment manager and distributor. Rupert H. Johnson, Jr. is considered to be an interested person of the Fund under the
federal securities laws due to his position as officer and director and major shareholder of Resources.
Note 1: Rupert H. Johnson, Jr. is the uncle of Gregory E. Johnson.
Note 2: Officer information is current as of the date of this report. It is possible that after this date, information about officers may change.
Note 3: Effective June 13, 2013, Charles B. Johnson ceased to be a trustee of the Fund.
The Sarbanes-Oxley Act of 2002 and Rules adopted by the U.S. Securities and Exchange Commission require the Fund to disclose whether the Fund’s Audit Committee
includes at least one member who is an audit committee financial expert within the meaning of such Act and Rules. The Fund’s Board has determined that there is at least
one such financial expert on the Audit Committee and has designated each of Ann Torre Bates and David W. Niemiec as an audit committee financial expert. The Board
believes that Ms. Bates and Mr. Niemiec qualify as such an expert in view of their extensive business background and experience. Ms. Bates has served as a member of
the Fund Audit Committee since 2008. She currently serves as a director of SLM Corporation and Ares Capital Corporation and was formerly a director of Allied Capital
Corporation from 2003 to 2010, Executive Vice President and Chief Financial Officer of NHP Incorporated and Vice President and Treasurer of US Airways, Inc. Mr. Niemiec
has served as a member of the Fund Audit Committee since 2005, currently serves as an Advisor to Saratoga Partners and was formerly its Managing Director from 1998 to
2001. Mr. Niemiec was formerly a director of Emeritus Corporation from 1999 to 2010 and OSI Pharmaceuticals, Inc. from 2006 to 2010, Managing Director of SBC Warburg
Dillon Read from 1997 to 1998, and was Vice Chairman from 1991 to 1997 and Chief Financial Officer from 1982 to 1997 of Dillon, Read & Co. Inc. As a result of such
background and experience, the Board believes that Ms. Bates and Mr. Niemiec have each acquired an understanding of generally accepted accounting principles and
financial statements, the general application of such principles in connection with the accounting estimates, accruals and reserves, and analyzing and evaluating financial
statements that present a breadth and level of complexity of accounting issues generally comparable to those of the Fund, as well as an understanding of internal controls and
procedures for financial reporting and an understanding of audit committee functions. Ms. Bates and Mr. Niemiec are independent Board members as that term is defined
under the applicable U.S. Securities and Exchange Commission Rules and Releases.
The Statement of Additional Information (SAI) includes additional information about the board members and is available, without charge, upon request. Shareholders may
call (800) DIAL BEN/342-5236 to request the SAI.
44 | Annual Report
Templeton Global Smaller Companies Fund
Shareholder Information
Board Review of Investment Management Agreement
At a meeting held May 21, 2013, the Board of Trustees (Board), including a majority of non-interested or independent Trustees, approved renewal of the investment management agreement for the Fund. In reaching this decision, the Board took into account information furnished throughout the year at regular Board meetings, as well as information prepared specifically in connection with the annual renewal review process. Information furnished and discussed throughout the year included investment performance reports and related financial information for the Fund, along with periodic reports on expenses, shareholder services, legal and compliance matters, pricing, brokerage commissions and execution and other services provided by the Investment Manager (Manager) and its affiliates as well as a third-party survey of transfer agent fees charged funds within the Franklin Templeton Investments complex in comparison with those charged other fund complexes deemed comparable. Information furnished specifically in connection with the renewal process included a report for the Fund prepared by Lipper, Inc. (Lipper), an independent organization, as well as additional material, including a Fund profitability analysis prepared by management. The Lipper report compared the Fund’s investment performance and expenses with those of other mutual funds deemed comparable to the Fund as selected by Lipper. The Fund profitability analysis discussed the profitability to Franklin Templeton Investments from its overall U.S. fund operations, as well as on an individual fund-by-fund basis. Additional material accompanying such profitability analysis included information on a fund-by-fund basis listing portfolio managers and other accounts they manage, as well as information on management fees charged by the Manager and its affiliates to U.S. mutual funds and other accounts, including management’s explanation of differences where relevant and a three-year expense analysis with an explanation for any increase in expense ratios. Such material also included a memorandum prepared by management describing project initiatives and capital investments relating to the services provided to the Fund by the Franklin Templeton Investments organization, as well as a memorandum relating to economies of scale and an analysis concerning transfer agent fees charged by an affiliate of the Manager.
In considering such materials, the independent Trustees received assistance and advice from and met separately with independent counsel. In approving continuance of the investment management agreement for the Fund, the Board, including a majority of independent Trustees, determined that the existing management fee structure was fair and reasonable and that continuance of the investment management agreement was in the best interests of the Fund and its shareholders. While attention was given to all information furnished, the following discusses some primary factors relevant to the Board’s decision.
NATURE, EXTENT AND QUALITY OF SERVICES. The Board was satisfied with the nature and quality of the overall services provided by the Manager and its affiliates to the Fund and its shareholders. In addition to investment performance and expenses discussed later, the Board’s opinion was based, in part, upon periodic reports furnished it showing that the investment policies and restrictions for the Fund were consistently complied with as well as other reports periodically furnished the Board covering matters such as the compliance of portfolio managers and other management personnel with the code of ethics adopted throughout the Franklin Templeton fund
Annual Report | 45
Templeton Global Smaller Companies Fund
Shareholder Information (continued)
Board Review of Investment Management Agreement (continued)
complex, the adherence to fair value pricing procedures established by the Board, and the accuracy of net asset value calculations. The Board also noted the extent of benefits provided Fund shareholders from being part of the Franklin Templeton family of funds, including the right to exchange investments between the same class of funds without a sales charge, the ability to reinvest Fund dividends into other funds and the right to combine holdings in other funds to obtain a reduced sales charge. Favorable consideration was given to management’s continuous efforts and expenditures in establishing back-up systems and recovery procedures to function in the event of a natural disaster, it being noted that such systems and procedures had functioned well during the Florida hurricanes and blackouts experienced in previous years and that those operations in the New York/New Jersey area ran smoothly during the more recent Hurricane Sandy. Among other factors taken into account by the Board were the Manager’s best execution trading policies, including a favorable report by an independent portfolio trading analytical firm, which also covered FOREX transactions. Consideration was also given to the experience of the Fund’s portfolio management team, the number of accounts managed and general method of compensation. In this latter respect, the Board noted that a primary factor in management’s determination of a portfolio manager’s bonus compensation was the relative investment performance of the funds he or she managed and that a portion of such bonus was required to be invested in a predesignated list of funds within such person’s fund management area so as to be aligned with the interests of shareholders. The Board also took into account the transfer agent and shareholder services provided Fund shareholders by an affiliate of the Manager and the continuous enhancements to the Franklin Templeton website. Particular attention was given to management’s conservative approach and diligent risk management procedures, including continuous monitoring of counterparty credit risk and attention given to derivatives and other complex instruments including expanded collateralization requirements. The Board also took into account, among other things, management’s efforts in establishing a global credit facility for the benefit of the Fund and other accounts managed by Franklin Templeton Investments to provide a source of cash for temporary and emergency purposes or to meet unusual redemption requests as well as the strong financial position of the Manager’s parent company and its commitment to the mutual fund business as evidenced by its subsidization of money market funds.
INVESTMENT PERFORMANCE. The Board placed significant emphasis on the investment performance of the Fund in view of its importance to shareholders. While consideration was given to performance reports and discussions with portfolio managers at Board meetings during the year, particular attention in assessing such performance was given to the Lipper report furnished for the agreement renewal. The Lipper report prepared for the Fund showed the investment performance of its Class A shares for the one-year period ended February 28, 2013, as well as the previous 10 years ended on such date in comparison to a performance universe consisting of the Fund and all retail and institutional global small/mid-cap funds as selected by Lipper. On a comparative basis, the Lipper report showed the Fund’s total return to be in the middle performing quintile of such performance universe for the one-year period, and on an annualized basis to be in the second-lowest performing quintile of such performance universe
46 | Annual Report
Templeton Global Smaller Companies Fund
Shareholder Information (continued)
Board Review of Investment Management Agreement (continued)
for the previous three-year period, the second-highest quintile of such universe for the previous five-year period, and the middle performing quintile of such performance universe for the previous 10-year period. The Board found the Fund’s comparative performance as set forth in the Lipper report to be acceptable and noted changes to the Fund’s portfolio management team during the past two years.
COMPARATIVE EXPENSES. Consideration was given to a comparative analysis of the management fee and total expense ratio of the Fund compared with those of a group of other funds selected by Lipper as its appropriate Lipper expense group. Lipper expense data is based upon information taken from each fund’s most recent annual report, which reflects historical asset levels that may be quite different from those currently existing, particularly in a period of market volatility. While recognizing such inherent limitation and the fact that expense ratios generally increase as assets decline and decrease as assets grow, the Board believed the independent analysis conducted by Lipper to be an appropriate measure of comparative expenses. In reviewing comparative costs, Lipper provides information on the Fund’s contractual investment management fee in comparison with the contractual investment management fee that would have been charged by other funds within its Lipper expense group assuming they were similar in size to the Fund, as well as the actual total expenses of the Fund in comparison with those of its Lipper expense group. The Lipper contractual investment management fee analysis includes administrative charges as being part of a management fee, and total expenses, for comparative consistency, are shown by Lipper for Fund Class A shares. The results of such expense comparisons showed that the contractual investment management fee rate for the Fund was less than four basis points above the median of its Lipper expense group while its actual total expense ratio was below the median of such expense group. The Board found the contractual investment management fee rate and total expense ratio of the Fund in comparison to its Lipper expense group to be acceptable.
MANAGEMENT PROFITABILITY. The Board also considered the level of profits realized by the Manager and its affiliates in connection with the operation of the Fund. In this respect, the Board reviewed the Fund profitability analysis that addresses the overall profitability of Franklin Templeton’s U.S. fund business, as well as its profits in providing management and other services to each of the individual funds during the 12-month period ended September 30, 2012, being the most recent fiscal year-end for Franklin Resources, Inc., the Manager’s parent. In reviewing the analysis, attention was given to the methodology followed in allocating costs to the Fund, it being recognized that allocation methodologies are inherently subjective and various allocation methodologies may each be reasonable while producing different results. In this respect, the Board noted that, while being continuously refined and reflecting changes in the Manager’s own cost accounting, the allocation methodology was consistent with that followed in profitability report presentations for the Fund made in prior years and that the Fund’s independent registered public accounting firm had been engaged by the Manager to periodically review the reasonableness of the allocation methodologies solely for use by the Fund’s Board in reference to the profitability analysis. In reviewing and discussing such analysis, management discussed with the Board its belief that costs
Annual Report | 47
Templeton Global Smaller Companies Fund
Shareholder Information (continued)
Board Review of Investment Management Agreement (continued)
incurred in establishing the infrastructure necessary for the type of mutual fund operations conducted by the Manager and its affiliates may not be fully reflected in the expenses allocated to the Fund in determining its profitability, as well as the fact that the level of profits, to a certain extent, reflected operational cost savings and efficiencies initiated by management. The Board also took into account management’s expenditures in improving shareholder services provided the Fund, as well as the need to implement systems and meet additional regulatory and compliance requirements resulting from statutes such as the Sarbanes-Oxley and Dodd-Frank Acts and recent SEC and other regulatory requirements. In addition, the Board considered a third-party study comparing the profitability of the Manager’s parent on an overall basis to other publicly held managers broken down to show profitability from management operations exclusive of distribution expenses, as well as profitability including distribution expenses. The Board also considered the extent to which the Manager and its affiliates might derive ancillary benefits from fund operations, including revenues generated from transfer agent services and potential benefits resulting from allocation of fund brokerage and the use of commission dollars to pay for research. Based upon its consideration of all these factors, the Board determined that the level of profits realized by the Manager and its affiliates from providing services to the Fund was not excessive in view of the nature, quality and extent of services provided.
ECONOMIES OF SCALE. The Board also considered whether economies of scale are realized by the Manager as the Fund grows larger and the extent to which this is reflected in the level of management fees charged. While recognizing that any precise determination is inherently subjective, the Board noted that based upon the Fund profitability analysis, it appears that as some funds get larger, at some point economies of scale do result in the Manager realizing a larger profit margin on management services provided such a fund. The Board also noted that economies of scale are shared with a fund and its shareholders through management fee breakpoints so that as a fund grows in size, its effective management fee rate declines. The Fund’s investment management agreement provides a fee at the rate of 0.75% on the first $1 billion of Fund net assets; 0.73% on the next $4 billion of Fund net assets; with further breakpoints continuing thereafter up to the $20 billion level of Fund net assets. The Fund is also charged a separate fee for administrative services at the rate of 0.15% on the first $200 million of Fund net assets, 0.135% on the next $500 million of Fund net assets, 0.100% on the next $500 million of Fund net assets, and 0.075% on assets above the $1.2 billion level. In discussing such fee structure, management stated its view that it starts with a relatively low rate reflecting anticipated economies of scale as the Fund’s assets increase and pointed out the Fund’s comparative contractual management fee rate and actual total expense ratio within its Lipper expense group. At the end of 2012, the Fund’s net assets were approximately $917 million, and to the extent economies of scale may be realized by the Manager and its affiliates through growth of the Fund, the Board believes the schedule of fees under the investment management agreement provides a sharing of benefits with the Fund and its shareholders.
48 | Annual Report
Templeton Global Smaller Companies Fund
Shareholder Information (continued)
Proxy Voting Policies and Procedures
The Fund’s investment manager has established Proxy Voting Policies and Procedures (Policies) that the Fund uses to determine how to vote proxies relating to portfolio securities. Shareholders may view the Fund’s complete Policies online at franklintempleton.com. Alternatively, shareholders may request copies of the Policies free of charge by calling the Proxy Group collect at (954) 527-7678 or by sending a written request to: Franklin Templeton Companies, LLC, 300 S.E. 2nd Street, Fort Lauderdale, FL 33301, Attention: Proxy Group. Copies of the Fund’s proxy voting records are also made available online at franklintempleton.com and posted on the U.S. Securities and Exchange Commission’s website at sec.gov and reflect the most recent 12-month period ended June 30.
Quarterly Statement of Investments
The Fund files a complete statement of investments with the U.S. Securities and Exchange Commission for the first and third quarters for each fiscal year on Form N-Q. Shareholders may view the filed Form N-Q by visiting the Commission’s website at sec.gov. The filed form may also be viewed and copied at the Commission’s Public Reference Room in Washington, DC. Information regarding the operations of the Public Reference Room may be obtained by calling (800) SEC-0330.
Householding of Reports and Prospectuses
You will receive the Fund’s financial reports every six months as well as an annual updated summary prospectus (prospectus available upon request). To reduce Fund expenses, we try to identify related shareholders in a household and send only one copy of the financial reports and summary prospectus. This process, called “householding,” will continue indefinitely unless you instruct us otherwise. If you prefer not to have these documents householded, please call us at (800) 632-2301. At any time you may view current prospectuses/summary prospectuses and financial reports on our website. If you choose, you may receive these documents through electronic delivery.
Annual Report | 49
This page intentionally left blank.
This page intentionally left blank.
This page intentionally left blank.
Item 2. Code of Ethics.
| (a) | The Registrant has adopted a code of ethics that applies to its principal executive officers and principal financial and accounting officer. |
| (c) | N/A |
| (d) | N/A |
| (f) | Pursuant to Item 12(a)(1), the Registrant is attaching as an exhibit a copy of its code of ethics that applies to its principal executive officers and principal financial and accounting officer. |
Item 3. Audit Committee Financial Expert.
(a)(1) The Registrant has an audit committee financial expert serving on its audit committee.
(2) The audit committee financial expert is David W. Niemiec and he is "independent" as defined under the relevant Securities and Exchange Commission Rules and Releases.
Item 4. Principal Accountant Fees and Services.
(a) Audit Fees
The aggregate fees paid to the principal accountant for professional services rendered by the principal accountant for the audit of the registrant’s annual financial statements or for services that are normally provided by the principal accountant in connection with statutory and regulatory filings or engagements were $42,862 for the fiscal year ended August 31, 2013 and $47,823 for the fiscal year ended August 31, 2012.
(b) Audit-Related Fees
The aggregate fees paid to the principal accountant for assurance and related services rendered by the principal accountant to the registrant that are reasonably related to the performance of the audit of the registrant's financial statements and are not reported under paragraph (a) of Item 4 were $2,894 for the fiscal year ended August 31, 2013 and $2,894 for the fiscal year ended August 31, 2012. The services for which these fees were paid included attestation services.
There were no fees paid to the principal accountant for assurance and related services rendered by the principal accountant to the registrant's investment adviser and any entity controlling, controlled by or under common control with the investment adviser that provides ongoing services to the registrant that are reasonably related to the performance of the audit of their financial statements.
(c) Tax Fees
There were no fees paid to the principal accountant for professional services rendered by the principal accountant to the registrant for tax compliance, tax advice and tax planning.
The aggregate fees paid to the principal accountant for professional services rendered by the principal accountant to the registrant’s investment adviser and any entity controlling, controlled by or under common control with the
investment adviser that provides ongoing services to the registrant for tax
compliance, tax advice and tax planning were $3,100 for the fiscal year ended
August 31, 2013 and $54,600 for the fiscal year ended August 31, 2012. The
services for which these fees were paid included technical tax consultation for
capital gain tax reporting to foreign governments, application of local country
tax laws to investments and licensing securities with local country offices.
(d) All Other Fees
The aggregate fees paid to the principal accountant for products and services
rendered by the principal accountant to the registrant, other than the services
reported in paragraphs (a)-(c) of Item 4 were $0 for the fiscal year ended
August 31, 2013 and $323 for the fiscal year ended August 31, 2012. The services
for which these fees were paid included review of materials provided to the fund
Board in connection with the investment management contract renewal process.
The aggregate fees paid to the principal accountant for products and services
rendered by the principal accountant to the registrant’s investment adviser and
any entity controlling, controlled by or under common control with the
investment adviser that provides ongoing services to the registrant, other than
the services reported in paragraphs (a)-(c) of Item 4 were $39,194 for the
fiscal year ended August 31, 2013 and $152,127 for the fiscal year ended August
31, 2012. The services for which these fees were paid included preparation and
review of materials provided to the fund Board in connection with the investment
management contract renewal process.
(e) (1) The registrant’s audit committee is directly responsible for approving
the services to be provided by the auditors, including:
(i) pre-approval of all audit and audit related services;
(ii) pre-approval of all non-audit related services to be provided to
the Fund by the auditors;
(iii) pre-approval of all non-audit related services to be provided to
the registrant by the auditors to the registrant’s investment adviser or to any
entity that controls, is controlled by or is under common control with the
registrant’s investment adviser and that provides ongoing services to the
registrant where the non-audit services relate directly to the operations or
financial reporting of the registrant; and
(iv) establishment by the audit committee, if deemed necessary or
appropriate, as an alternative to committee pre-approval of services to be
provided by the auditors, as required by paragraphs (ii) and (iii) above, of
policies and procedures to permit such services to be pre-approved by other
means, such as through establishment of guidelines or by action of a designated
member or members of the committee; provided the policies and procedures are
detailed as to the particular service and the committee is informed of each
service and such policies and procedures do not include delegation of audit
committee responsibilities, as contemplated under the Securities Exchange Act
of 1934, to management; subject, in the case of (ii) through (iv), to any
waivers, exceptions or exemptions that may be available under applicable law or
rules.
(e) (2) None of the services provided to the registrant described in paragraphs
(b)-(d) of Item 4 were approved by the audit committee pursuant to paragraph
(c)(7)(i)(C) of Rule 2-01 of regulation S-X.
(f) No disclosures are required by this Item 4(f).
(g) The aggregate non-audit fees paid to the principal accountant for services
rendered by the principal accountant to the registrant and the registrant’s
investment adviser and any entity controlling, controlled by or under common
control with the investment adviser that provides ongoing services to the
registrant were $45,188 for the fiscal year ended August 31, 2013 and $209,944
for the fiscal year ended August 31, 2012.
(h) The registrant’s audit committee of the board has considered whether the
provision of non-audit services that were rendered to the registrant’s
investment adviser (not including any sub-adviser whose role is primarily
portfolio management and is subcontracted with or overseen by another investment
adviser), and any entity controlling, controlled by, or under common control
with the investment adviser that provides ongoing services to the registrant
that were not pre-approved pursuant to paragraph (c)(7)(ii) of Rule 2-01 of
Regulation S-X is compatible with maintaining the principal accountant’s
independence.
Item 5. Audit Committee of Listed Registrants. N/A
Item 6. Schedule of Investments. N/A
Item 7. Disclosure of Proxy Voting Policies and Procedures for Closed-End
Management Investment Companies. N/A
Item 8. Portfolio Managers of Closed-End Management Investment Companies. N/A
Item 9. Purchases of Equity Securities by Closed-End Management Investment
Company and Affiliated Purchasers. N/A
Item 10. Submission of Matters to a Vote of Security Holders.
There have been no changes to the procedures by which shareholders may
recommend nominees to the Registrant's Board of Trustees that would require
disclosure herein.
Item 11. Controls and Procedures.
(a) Evaluation of Disclosure Controls and Procedures. The Registrant maintains
disclosure controls and procedures that are designed to ensure that information
required to be disclosed in the Registrant’s filings under the Securities
Exchange Act of 1934 and the Investment Company Act of 1940 is recorded,
processed, summarized and reported within the periods specified in the rules
and forms of the Securities and Exchange Commission. Such information is
accumulated and communicated to the Registrant’s management, including its
principal executive officer and principal financial officer, as appropriate, to
allow timely decisions regarding required disclosure. The Registrant’s
management, including the principal executive officer and the principal
financial officer, recognizes that any set of controls and procedures, no
matter how well designed and operated, can provide only reasonable assurance of
achieving the desired control objectives.
Within 90 days prior to the filing date of this Shareholder Report on Form N-
CSR, the Registrant had carried out an evaluation, under the supervision and
with the participation of the Registrant’s management, including the
Registrant’s principal executive officer and the Registrant’s principal
financial officer, of the effectiveness of the design and operation of the
Registrant’s disclosure controls and procedures. Based on such evaluation, the
Registrant’s principal executive officer and principal financial officer
concluded that the Registrant’s disclosure controls and procedures are
effective.
(b) Changes in Internal Controls. There have been no changes in the
Registrant’s internal controls or in other factors that could materially affect
the internal controls over financial reporting subsequent to the date of their
evaluation in connection with the preparation of this Shareholder Report on
Form N-CSR.
Item 12. Exhibits.
(a)(1) Code of Ethics
(a)(2) Certifications pursuant to Section 302 of the Sarbanes-Oxley Act of 2002
of Laura F. Fergerson, Chief Executive Officer - Finance and Administration, and
Mark H. Otani, Chief Financial Officer and Chief Accounting Officer
(b) Certifications pursuant to Section 906 of the Sarbanes-Oxley Act of 2002 of
Laura F. Fergerson, Chief Executive Officer - Finance and Administration, and
Mark H. Otani, Chief Financial Officer and Chief Accounting Officer
SIGNATURES
Pursuant to the requirements of the Securities Exchange Act of 1934 and the Investment Company Act of 1940, the registrant has duly caused this report to be signed on its behalf by the undersigned, thereunto duly authorized.
TEMPLETON GLOBAL SMALLER COMPANIES FUND
By /s/LAURA F. FERGERSON
Laura F. Fergerson
Chief Executive Officer –
Finance and Administration
Date: October 28, 2013
Pursuant to the requirements of the Securities Exchange Act of 1934 and the Investment Company Act of 1940, this report has been signed below by the following persons on behalf of the registrant and in the capacities and on the dates indicated.
By /s/LAURA F. FERGERSON
Laura F. Fergerson
Chief Executive Officer –
Finance and Administration
Date: October 28, 2013
By /s/MARK H. OTANI
Mark H. Otani
Chief Financial Officer and
Chief Accounting Officer
Date: October 28, 2013