UNITED STATES
SECURITIES AND EXCHANGE COMMISSION
Washington, DC 20549
FORM N-CSRS
CERTIFIED SHAREHOLDER REPORT OF REGISTERED MANAGEMENT INVESTMENT
COMPANIES
Investment Company Act file number 811-03143
Templeton Global Smaller Companies Fund
(Exact name of registrant as specified in charter)
300 S.E. 2nd Street, Fort Lauderdale, FL 33301-1923
(Address of principal executive offices) (Zip code)
Craig S. Tyle, One Franklin Parkway, San Mateo, CA 94403-1906
(Name and address of agent for service)
Registrant's telephone number, including area code: (954) 527-7500_
Date of fiscal year end: _8/31__
Date of reporting period: 2/28/17_
Item 1. Reports to Stockholders.
Visit franklintempleton.com for fund updates, to access your account, or to find helpful financial planning tools.
2 Semiannual Report
franklintempleton.com
Semiannual Report
Templeton Global Smaller Companies Fund
This semiannual report for Templeton Global Smaller Companies Fund covers the period ended February 28, 2017.
Your Fund’s Goal and Main Investments
The Fund seeks to achieve long-term capital growth. Under normal market conditions, the Fund invests at least 80% of its net assets in equity securities of smaller companies located anywhere in the world. The Fund may invest a significant amount of its assets in the securities of companies located in emerging markets, and will invest its assets in issuers located in at least three different countries (including the U.S.) and will invest at least 40% of its net assets in foreign securities.
Performance Overview
For the six months under review, the Fund’s Class A shares posted a +5.81% cumulative total return. In comparison, the MSCI All Country World Index (ACWI) Small Cap Index, which measures performance of small capitalization companies in global developed and emerging markets, generated a +8.67% total return.1 Please note index performance information is provided for reference and we do not attempt to track the index but rather undertake investments on the basis of fundamental research. You can find the Fund’s long-term performance data in the Performance Summary beginning on page 7.
Performance data represent past performance, which does not guarantee future results. Investment return and principal value will fluctuate, and you may have a gain or loss when you sell your shares. Current performance may differ from figures shown. For most recent month-end performance, go to franklintempleton.com or call (800) 342-5236.
Economic and Market Overview
The global economy in general expanded during the six months under review, aided by accommodative monetary policies of various central banks. In this environment, global developed and emerging market stocks rose, as measured by the MSCI ACWI. Further supporting global markets were an improvement in industrial commodity prices, upbeat economic data across regions, encouraging corporate earnings reports and
investor optimism about U.S. President Donald Trump’s pro-growth policies and his executive order to scale back regulations on the financial industry. In addition, hopes of tax reforms under the Trump administration and his business-friendly policy shifts, an upbeat assessment of the U.S. economy by U.S. Federal Reserve (Fed) Chair Janet Yellen, and a deal by major oil producing countries to curb oil production supported global equity markets. However, investors expressed concerns about the terms of the U.K.’s exit from the European Union and President Trump’s protectionist policies and his executive order banning entry from several Muslim-majority countries. Other headwinds included uncertainty about the Fed’s timing for raising interest rates, the health of European banks, concern surrounding elections in Europe, particularly in France, and investor caution ahead of Donald Trump’s congressional address.
The U.S. economy continued to grow in 2016’s fourth quarter, though at a slower pace compared to the third quarter. Strength in consumer spending, private inventory investment, residential and non-residential fixed investment, and state and local government spending was partially offset by declines in net exports and federal government spending. The manufacturing sector generally expanded, and the services sector continued to grow. The unemployment rate decreased slightly from 4.9% in
1. Source: Morningstar.
The index is unmanaged and includes reinvestment of any income or distributions. The index does not reflect any fees, expenses or sales charges. One cannot invest directly in
an index, and an index is not representative of the Fund’s portfolio.
The dollar value, number of shares or principal amount, and names of all portfolio holdings are listed in the Fund’s Statement of Investments (SOI).
The SOI begins on page 14.
franklintempleton.com
Semiannual Report 3
TEMPLETON GLOBAL SMALLER COMPANIES FUND
August 2016 to 4.7% at period-end.2 Inflation increased during the period, as measured by the Consumer Price Index. At its December meeting, the Fed raised its target range for the federal funds rate to 0.50%–0.75%, as policymakers cited improved labor market conditions and higher inflation. The minutes of its February meeting indicated that the Fed might find it appropriate to hike interest rates again “fairly soon.”
In Europe, the U.K.’s economy grew at a faster rate in the fourth quarter of 2016 than in the third quarter, supported by growth in services. The eurozone’s economic growth held steady in the fourth quarter from the third quarter, while the region’s annual inflation rate rose to its highest level in four years. At its December meeting, the European Central Bank (ECB) extended the continuation of its monthly asset purchases from March to December 2017, but it planned to scale back the purchase amount beginning in April. In January, the ECB kept its key policy rates unchanged and retained its monthly asset purchases, indicating it could increase the program in size and duration if needed.
In Asia, Japan’s quarterly gross domestic product grew more slowly in 2016’s fourth quarter compared with the third quarter, mainly due to declines in public investment. At its September meeting, the Bank of Japan overhauled its monetary stimulus program to adjust Japanese government bond purchases, with the aim of keeping the 10-year rate for such bonds near 0%.
In emerging markets, economic growth generally moderated during the period. Brazil’s economy continued to be in recession, and the country’s central bank cut its benchmark interest rate in October and November 2016 and in January and February 2017 to spur economic growth. The Bank of Russia reduced its key interest rates in September 2016 to try to revive its economy. China’s economy grew at a faster-than-expected rate in 2016’s fourth quarter over 2015’s fourth quarter, driven by consumer spending and a property market supported by robust bank lending. The People’s Bank of China (PBOC) devalued its currency against the U.S. dollar during the period. In February 2017, the PBOC increased its short-term lending rates. In India, economic growth declined from October through December 2016. Overall, emerging market stocks, as measured by the MSCI Emerging Markets Index, rose during the period.
Investment Strategy
When choosing equity investments for the Fund, we apply a bottom-up, value-oriented, long-term approach, focusing on the market price of a company’s securities relative to our evaluation of the company’s long-term earnings, asset value and cash flow potential. We also consider the company’s price/earnings ratio, profit margins and liquidation value. We may consider selling a security when we believe the security has become overvalued due to either its price appreciation or changes in the company’s fundamentals, when we believe that the market capitalization of a security has become too large, or when we believe another security is a more attractive investment opportunity.
Manager’s Discussion
Several Fund holdings performed well during the six months under review. Tutor Perini is one of the largest general contractors in the U.S. Shares of Tutor Perini benefited during the period as the company grew backlog and enjoyed solid pricing on its long-duration projects. Major brokerages were positive about the stock, suggesting their belief that the company may be able to continue growing its revenue profitably in the future. We believe Tutor Perini is well positioned to potentially profit from the expected boom in infrastructure spending under U.S. President Donald Trump.
Stillwater Mining is engaged in the mining and marketing of palladium, platinum and associated metals from a geological formation in southern Montana.3 Shares of the company appreciated on the news that Stillwater is being acquired by Sibanye Gold in an all-cash deal that is expected to close in June 2017.
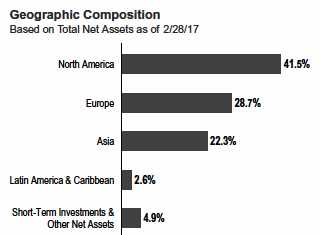
| Top 10 Countries | ||
| 2/28/17 | ||
| % of Total | ||
| Net Assets | ||
| U.S. | 36.7 | % |
| Japan | 11.8 | % |
| U.K. | 5.6 | % |
| Canada | 4.8 | % |
| Germany | 4.5 | % |
| Italy | 3.8 | % |
| Taiwan | 3.6 | % |
| Hong Kong | 3.6 | % |
| Switzerland | 3.3 | % |
| Finland | 2.9 | % |
2. Source: U.S. Bureau of Labor Statistics.
3. Not held at period-end.
4 Semiannual Report
franklintempleton.com
TEMPLETON GLOBAL SMALLER COMPANIES FUND
U.S.-based Winnebago Industries is synonymous with the term “motorhome” and is the top-selling brand of recreational vehicles (RVs) globally. Winnebago outperformed the broader consumer market during the period, with its recent acquisition of Grand Design providing the company with a large footprint in the towable category, where it previously had no product offerings. We believe pent-up demand for premium RV products and capacity expansion should be key to fueling both the company’s growth prospects and operating leverage opportunities. Winnebago’s new chief executive officer has stated that he will continue to look for ways to unlock value in the brand through acquisitions.
| Top 10 Holdings | ||
| 2/28/17 | ||
| Company | % of Total | |
| Sector/Industry, Country | Net Assets | |
| Tutor Perini Corp. | 2.0 | % |
| Construction & Engineering, U.S. | ||
| Huntington Bancshares Inc. | 1.9 | % |
| Banks, U.S. | ||
| Interpump Group SpA | 1.9 | % |
| Machinery, Italy | ||
| Hillenbrand Inc. | 1.8 | % |
| Machinery, U.S. | ||
| Knowles Corp. | 1.8 | % |
| Electronic Equipment, Instruments & Components, | ||
| U.S. | ||
| Simpson Manufacturing Co. Inc. | 1.8 | % |
| Building Products, U.S. | ||
| Gerresheimer AG | 1.8 | % |
| Life Sciences Tools & Services, Germany | ||
| Tsumura & Co. | 1.7 | % |
| Pharmaceuticals, Japan | ||
| Jenoptik AG | 1.7 | % |
| Electronic Equipment, Instruments & Components, | ||
| Germany | ||
| Kobayashi Pharmaceutical Co. Ltd. | 1.7 | % |
| Personal Products, Japan |
The Fund’s portfolio also had some underperformers during the period. JAKKS Pacific is a leading toy company that designs, develops, produces and markets toys and other leisure products. The company reported disappointing quarterly results during the period, driven by management’s decision to suspend sales to U.S. retailer K-Mart.4 Looking at the longer term, JAKKS has made a concerted effort to increase margins through restructuring and product reconciliation. Management has also instituted strict margin guidelines on any new product licenses and plans to increase distribution in emerging markets.
Expectations are very low, and we believe any positive news could bring forward price appreciation.
Laird, a supplier of products such as “shark-fin” antennae for wireless connections and electromagnetic interference shielding for Apple’s iPhone and iPad, was another significant detractor, falling on Brexit concerns early in the period and a profit warning in its precious metals division later in the period. The company is one of many Apple suppliers that did not maintain or gain market share after partnering with Apple. Laird has issued a cost saving plan, which we believe should help the company offset this issue.
The share price of Huhtamaki, a Finnish company that manufactures and supplies packaging for various industries, was down based on economic concerns in Europe. However, with significant sales generated in emerging markets and a strong position in Asia, particularly in fast-growing India, Huhtamaki is well positioned to reap the benefits of expected strong growth in these markets, in our view. As a global leader in food service packaging and paper cups, Huhtamaki is also exposed to the increasing on-the-go trend in Europe and other markets.
It is important to recognize the effect of currency movements on the Fund’s performance. In general, if the value of the U.S. dollar goes up compared with a foreign currency, an investment traded in that foreign currency will go down in value because it will be worth fewer U.S. dollars. This can have a negative effect on Fund performance. Conversely, when the U.S. dollar weakens in relation to a foreign currency, an investment traded in that foreign currency will increase in value, which can contribute to Fund performance. For the six months ended February 28, 2017, the U.S. dollar rose in value relative to most currencies. As a result, the Fund’s performance was negatively affected by the portfolio’s substantial investment in securities with non-U.S. currency exposure.
4. Not a Fund holding.
See www.franklintempletondatasources.com for additional data provider information.
franklintempleton.com
Semiannual Report 5
TEMPLETON GLOBAL SMALLER COMPANIES FUND
Thank you for your continued participation in Templeton Global Smaller Companies Fund. We look forward to serving your future investment needs.

The foregoing information reflects our analysis, opinions and portfolio holdings as of February 28, 2017, the end of the reporting period. The way we implement our main investment strategies and the resulting portfolio holdings may change depending on factors such as market and economic conditions. These opinions may not be relied upon as investment advice or an offer for a particular security. The information is not a complete analysis of every aspect of any market, country, industry, security or the Fund. Statements of fact are from sources considered reliable, but the investment manager makes no representation or warranty as to their completeness or accuracy. Although historical performance is no guarantee of future results, these insights may help you understand our investment management philosophy.
6 Semiannual Report
franklintempleton.com
TEMPLETON GLOBAL SMALLER COMPANIES FUND
Performance Summary as of February 28, 2017
The performance table does not reflect any taxes that a shareholder would pay on Fund dividends, capital gain distributions, if any, or any realized gains on the sale of Fund shares. Total return reflects reinvestment of the Fund’s dividends and capital gain distributions, if any, and any unrealized gains or losses. Your dividend income will vary depending on dividends or interest paid by securities in the Fund’s portfolio, adjusted for operating expenses of each class. Capital gain distributions are net profits realized from the sale of portfolio securities.
Performance as of 2/28/171
Cumulative total return excludes sales charges. Average annual total return includes maximum sales charges. Sales charges will vary depending on the size of the investment and the class of share purchased. The maximum is 5.75% and the minimum is 0%. Class A: 5.75% maximum initial sales charge; Advisor Class: no sales charges. For other share classes, visit franklintempleton.com.
| Cumulative | Average Annual | |||
| Share Class | Total Return2 | Total Return3 | ||
| A | ||||
| 6-Month | +5.81 | % | -0.31 | % |
| 1-Year | +20.95 | % | +14.00 | % |
| 5-Year | +40.70 | % | +5.80 | % |
| 10-Year | +34.64 | % | +2.41 | % |
| Advisor | ||||
| 6-Month | +6.00 | % | +6.00 | % |
| 1-Year | +21.25 | % | +21.25 | % |
| 5-Year | +42.45 | % | +7.33 | % |
| 10-Year | +38.14 | % | +3.28 | % |
Performance data represent past performance, which does not guarantee future results. Investment return and principal value will fluctuate, and you may have a gain or loss when you sell your shares. Current performance may differ from figures shown. For most recent month-end performance, go to franklintempleton.com or call (800) 342-5236.
See page 8 for Performance Summary footnotes.
franklintempleton.com
Semiannual Report 7
TEMPLETON GLOBAL SMALLER COMPANIES FUND
PERFORMANCE SUMMARY
| Distributions (9/1/16–2/28/17) | |||||
| Net Investment | |||||
| Share Class | Income | ||||
| A | $ | 0.0301 | |||
| R6 | $ | 0.0707 | |||
| Advisor | $ | 0.0578 | |||
| Total Annual Operating Expenses4 | |||||
| Share Class | With Waiver | Without Waiver | |||
| A | 1.41 | % | 1.42 | % | |
| Advisor | 1.16 | % | 1.17 | % | |
Each class of shares is available to certain eligible investors and has different annual fees and expenses, as described in the prospectus.
All investments involve risks, including possible loss of principal. Smaller, midsized and relatively new or unseasoned companies can be particularly sensitive to
changing economic conditions, and their prospects for growth are less certain than those of larger, more established companies. In addition, smaller company
stocks have historically exhibited greater price volatility than larger company stocks, particularly over the short term. Special risks are associated with foreign
investing, including currency fluctuations, economic instability and political developments. Investments in emerging markets involve heightened risks related to
the same factors, in addition to those associated with these markets’ smaller size and lesser liquidity. Value securities may not increase in price as anticipated or
may decline further in value. The Fund is actively managed but there is no guarantee that the manager’s investment decisions will produce the desired results. The
Fund’s prospectus also includes a description of the main investment risks.
1. The Fund has a fee waiver associated with any investment it makes in a Franklin Templeton money fund and/or other Franklin Templeton fund, contractually guaranteed
through 12/31/17. Fund investment results reflect the fee waiver; without this waiver, the results would have been lower.
2. Cumulative total return represents the change in value of an investment over the periods indicated.
3. Average annual total return represents the average annual change in value of an investment over the periods indicated. Return for less than one year, ifany,hasnotbeen
annualized.
4. Figures are as stated in the Fund’s current prospectus and may differ from the expenses ratios disclosed in the Your Fund’s Expenses and Financial Highlights sections in
this report. In periods of market volatility, assets may decline significantly, causing total annual Fund operating expenses to become higher than the figures shown.
8 Semiannual Report
franklintempleton.com
TEMPLETON GLOBAL SMALLER COMPANIES FUND
Your Fund’s Expenses
As a Fund shareholder, you can incur two types of costs: (1) transaction costs, including sales charges (loads) on Fund purchases and redemptions; and (2) ongoing Fund costs, including management fees, distribution and service (12b-1) fees, and other Fund expenses. All mutual funds have ongoing costs, sometimes referred to as operating expenses. The table below shows ongoing costs of investing in the Fund and can help you understand these costs and compare them with those of other mutual funds. The table assumes a $1,000 investment held for the six months indicated.
Actual Fund Expenses
The table below provides information about actual account values and actual expenses in the columns under the heading “Actual.” In these columns the Fund’s actual return, which includes the effect of Fund expenses, is used to calculate the “Ending Account Value” for each class of shares. You can estimate the expenses you paid during the period by following these steps (of course, your account value and expenses will differ from those in this illustration): Divide your account value by $1,000 (if your account had an $8,600 value, then $8,600 ÷ $1,000 = 8.6). Then multiply the result by the number in the row for your class of shares under the headings “Actual” and “Expenses Paid During Period” (if Actual Expenses Paid During Period were $7.50, then 8.6 x $7.50 = $64.50). In this illustration, the actual expenses paid this period are $64.50.
Hypothetical Example for Comparison with Other Funds
Under the heading “Hypothetical” in the table, information is provided about hypothetical account values and hypothetical expenses based on the Fund’s actual expense ratio and an assumed rate of return of 5% per year before expenses, which is not the Fund’s actual return. This information may not be used to estimate the actual ending account balance or expenses you paid for the period, but it can help you compare ongoing costs of investing in the Fund with those of other funds. To do so, compare this 5% hypothetical example for the class of shares you hold with the 5% hypothetical examples that appear in the shareholder reports of other funds.
Please note that expenses shown in the table are meant to highlight ongoing costs and do not reflect any transactional costs. Therefore, information under the heading “Hypothetical” is useful in comparing ongoing costs only, and will not help you compare total costs of owning different funds. In addition, if transactional costs were included, your total costs would have been higher.
| Actual | Hypothetical | |||||||||||
| (actual return after expenses) | (5% annual return before expenses) | |||||||||||
| Expenses | Expenses | Net | ||||||||||
| Beginning | Ending | Paid During | Ending | Paid During | Annualized | |||||||
| Share | Account | Account | Period | Account | Period | Expense | ||||||
| Class | Value 9/1/16 | Value 2/28/17 | 9/1/16–2/28/171,2 | Value 2/28/17 | 9/1/16–2/28/171,2 | Ratio2 | ||||||
| A | $ | 1,000 | $ | 1,058.10 | $ | 7.04 | $ | 1,017.95 | $ | 6.90 | 1.38 | % |
| C | $ | 1,000 | $ | 1,053.60 | $ | 10.85 | $ | 1,014.23 | $ | 10.64 | 2.13 | % |
| R6 | $ | 1,000 | $ | 1,059.20 | $ | 4.70 | $ | 1,020.23 | $ | 4.61 | 0.92 | % |
| Advisor | $ | 1,000 | $ | 1,060.00 | $ | 5.77 | $ | 1,019.19 | $ | 5.66 | 1.13 | % |
1. Expenses are equal to the annualized expense ratio for the six-month period as indicated above–in the far right column–multiplied by the simple average account value
over the period indicated, and then multiplied by 181/365 to reflect the one-half year period.
2. Reflects expenses after fee waivers and expense reimbursements. Does not include acquired fund fees and expenses.
franklintempleton.com
Semiannual Report 9
TEMPLETON GLOBAL SMALLER COMPANIES FUND
| Financial Highlights | ||||||||||||||||||
| Six Months Ended | ||||||||||||||||||
| February 28, 2017 | Year Ended August 31, | |||||||||||||||||
| (unaudited) | 2016 | 2015 | 2014 | 2013 | 2012 | |||||||||||||
| Class A | ||||||||||||||||||
| Per share operating performance | ||||||||||||||||||
| (for a share outstanding throughout the period) | ||||||||||||||||||
| Net asset value, beginning of period | $ | 8.63 | $ | 8.32 | $ | 9.20 | $ | 7.81 | $ | 6.39 | $ | 6.61 | ||||||
| Income from investment operationsa: | ||||||||||||||||||
| Net investment incomeb | —c | 0.04 | 0.05 | 0.03 | 0.05 | 0.07 | ||||||||||||
| Net realized and unrealized gains (losses) | 0.50 | 0.29 | (0.83 | ) | 1.38 | 1.47 | (0.23 | ) | ||||||||||
| Total from investment operations | 0.50 | 0.33 | (0.78 | ) | 1.41 | 1.52 | (0.16 | ) | ||||||||||
| Less distributions from: | ||||||||||||||||||
| Net investment income. | (0.03 | ) | (0.02 | ) | (0.04 | ) | (0.02 | ) | (0.10 | ) | (0.06 | ) | ||||||
| Net realized gains | (0.03 | ) | — | (0.06 | ) | — | — | — | ||||||||||
| Total distributions | (0.06 | ) | (0.02 | ) | (0.10 | ) | (0.02 | ) | (0.10 | ) | (0.06 | ) | ||||||
| Net asset value, end of period | $ | 9.07 | $ | 8.63 | $ | 8.32 | $ | 9.20 | $ | 7.81 | $ | 6.39 | ||||||
| Total returnd | 5.81 | % | 3.95 | % | (8.44 | )% | 18.09 | % | 24.04 | % | (2.31 | )% | ||||||
| Ratios to average net assetse | ||||||||||||||||||
| Expenses before waiver and payments by | ||||||||||||||||||
| affiliates | 1.39 | % | 1.42 | % | 1.38 | % | 1.34 | % | 1.39 | % | 1.41 | % | ||||||
| Expenses net of waiver and payments by | ||||||||||||||||||
| affiliates | 1.38 | %f | 1.41 | % | 1.38 | %g | 1.34 | % | 1.39 | %f | 1.41 | % | ||||||
| Net investment income | 0.02 | % | 0.47 | % | 0.52 | % | 0.28 | % | 0.72 | % | 1.06 | % | ||||||
| Supplemental data | ||||||||||||||||||
| Net assets, end of period (000’s) | $ | 990,533 | $ | 1,020,120 | $ | 960,417 | $ | 1,082,873 | $ | 892,067 | $ | 726,065 | ||||||
| Portfolio turnover rate | 9.84 | % | 28.73 | % | 22.16 | % | 25.64 | % | 27.67 | % | 25.44 | % | ||||||
aThe amount shown for a share outstanding throughout the period may not correlate with the Statement of Operations for the period due to the timing of sales and
repurchases of the Fund’s shares in relation to income earned and/or fluctuating fair value of the investments of the Fund.
bBased on average daily shares outstanding.
cAmount rounds to less than $0.01 per share.
dTotal return does not reflect sales commissions or contingent deferred sales charges, if applicable, and is not annualized for periods less than one year.
eRatios are annualized for periods less than one year.
fBenefit of expense reduction rounds to less than 0.01%.
gBenefit of waiver and payments by affiliates rounds to less than 0.01%.
10 Semiannual Report | The accompanying notes are an integral part of these financial statements. franklintempleton.com
TEMPLETON GLOBAL SMALLER COMPANIES FUND
FINANCIAL HIGHLIGHTS
| Six Months Ended | ||||||||||||||||||
| February 28, 2017 | Year Ended August 31, | |||||||||||||||||
| (unaudited) | 2016 | 2015 | 2014 | 2013 | 2012 | |||||||||||||
| Class C | ||||||||||||||||||
| Per share operating performance | ||||||||||||||||||
| (for a share outstanding throughout the period) | ||||||||||||||||||
| Net asset value, beginning of period | $ | 8.22 | $ | 7.97 | $ | 8.83 | $ | 7.53 | $ | 6.16 | $ | 6.39 | ||||||
| Income from investment operationsa: | ||||||||||||||||||
| Net investment income (loss)b | (0.03 | ) | (0.02 | ) | (0.02 | ) | (0.04 | ) | (—)c | 0.02 | ||||||||
| Net realized and unrealized gains (losses) | 0.47 | 0.27 | (0.78 | ) | 1.34 | 1.42 | (0.23 | ) | ||||||||||
| Total from investment operations | 0.44 | 0.25 | (0.80 | ) | 1.30 | 1.42 | (0.21 | ) | ||||||||||
| Less distributions from: | ||||||||||||||||||
| Net investment income. | — | — | — | — | (0.05 | ) | (0.02 | ) | ||||||||||
| Net realized gains | (0.03 | ) | — | (0.06 | ) | — | — | — | ||||||||||
| Total distributions | (0.03 | ) | — | (0.06 | ) | — | (0.05 | ) | (0.02 | ) | ||||||||
| Net asset value, end of period | $ | 8.63 | $ | 8.22 | $ | 7.97 | $ | 8.83 | $ | 7.53 | $ | 6.16 | ||||||
| Total returnd | 5.36 | % | 3.14 | % | (9.06 | )% | 17.26 | % | 23.19 | % | (3.07 | )% | ||||||
| Ratios to average net assetse | ||||||||||||||||||
| Expenses before waiver and payments by | ||||||||||||||||||
| affiliates | 2.14 | % | 2.17 | % | 2.13 | % | 2.09 | % | 2.14 | % | 2.16 | % | ||||||
| Expenses net of waiver and payments by | ||||||||||||||||||
| affiliates | 2.13 | %f | 2.16 | % | 2.13 | %g | 2.09 | % | 2.14 | %f | 2.16 | % | ||||||
| Net investment income (loss) | (0.73 | )% | (0.28 | )% | (0.23 | )% | (0.47 | )% | (0.03 | )% | 0.31 | % | ||||||
| Supplemental data | ||||||||||||||||||
| Net assets, end of period (000’s) | $ | 31,608 | $ | 33,802 | $ | 36,829 | $ | 47,636 | $ | 39,726 | $ | 34,090 | ||||||
| Portfolio turnover rate | 9.84 | % | 28.73 | % | 22.16 | % | 25.64 | % | 27.67 | % | 25.44 | % | ||||||
aThe amount shown for a share outstanding throughout the period may not correlate with the Statement of Operations for the period due to the timing of sales and
repurchases of the Fund’s shares in relation to income earned and/or fluctuating fair value of the investments of the Fund.
bBased on average daily shares outstanding.
cAmount rounds to less than $0.01 per share.
dTotal return does not reflect sales commissions or contingent deferred sales charges, if applicable, and is not annualized for periods less than one year.
eRatios are annualized for periods less than one year.
fBenefit of expense reduction rounds to less than 0.01%.
gBenefit of waiver and payments by affiliates rounds to less than 0.01%.
franklintempleton.com The accompanying notes are an integral part of these financial statements. | Semiannual Report 11
| Six Months Ended | |||||||||||||||
| February 28, 2017 | Year Ended August 31, | ||||||||||||||
| (unaudited) | 2016 | 2015 | 2014 | 2013 | a | ||||||||||
| Class R6 | |||||||||||||||
| Per share operating performance | |||||||||||||||
| (for a share outstanding throughout the period) | |||||||||||||||
| Net asset value, beginning of period | $ | 8.68 | $ | 8.37 | $ | 9.25 | $ | 7.84 | $ | 7.43 | |||||
| Income from investment operationsb: | |||||||||||||||
| Net investment incomec | 0.02 | 0.08 | 0.08 | 0.09 | 0.03 | ||||||||||
| Net realized and unrealized gains (losses) | 0.49 | 0.28 | (0.82 | ) | 1.38 | 0.38 | |||||||||
| Total from investment operations. | 0.51 | 0.36 | (0.74 | ) | 1.47 | 0.41 | |||||||||
| Less distributions from: | |||||||||||||||
| Net investment income | (0.07 | ) | (0.05 | ) | (0.08 | ) | (0.06 | ) | — | ||||||
| Net realized gains | (0.03 | ) | — | (0.06 | ) | — | — | ||||||||
| Total distributions | (0.10 | ) | (0.05 | ) | (0.14 | ) | (0.06 | ) | — | ||||||
| Net asset value, end of period. | $ | 9.09 | $ | 8.68 | $ | 8.37 | $ | 9.25 | $ | 7.84 | |||||
| Total returnd | 5.92 | % | 4.42 | % | (7.99 | )% | 18.72 | % | 5.52 | % | |||||
| Ratios to average net assetse | |||||||||||||||
| Expenses before waiver and payments by affiliates | 0.93 | % | 0.95 | % | 0.94 | % | 0.92 | % | 3.26 | % | |||||
| Expenses net of waiver and payments by affiliates | 0.92 | %f | 0.94 | % | 0.94 | %g | 0.92 | % | 0.95 | %f | |||||
| Net investment income (loss) | 0.48 | % | 0.94 | % | 0.96 | % | 0.70 | % | (1.15 | )% | |||||
| Supplemental data | |||||||||||||||
| Net assets, end of period (000’s) | $ | 20,809 | $ | 20,690 | $ | 22,148 | $ | 26,371 | $ | 5 | |||||
| Portfolio turnover rate | 9.84 | % | 28.73 | % | 22.16 | % | 25.64 | % | 27.67 | % | |||||
aFor the period May 1, 2013 (effective date) to August 31, 2013.
bThe amount shown for a share outstanding throughout the period may not correlate with the Statement of Operations for the period due to the timing of sales and
repurchases of the Fund’s shares in relation to income earned and/or fluctuating fair value of the investments of the Fund.
cBased on average daily shares outstanding.
dTotal return is not annualized for periods less than one year.
eRatios are annualized for periods less than one year.
fBenefit of expense reduction rounds to less than 0.01%.
gBenefit of waiver and payments by affiliates rounds to less than 0.01%.
12 Semiannual Report | The accompanying notes are an integral part of these financial statements. franklintempleton.com
TEMPLETON GLOBAL SMALLER COMPANIES FUND
FINANCIAL HIGHLIGHTS
TEMPLETON GLOBAL SMALLER COMPANIES FUND
FINANCIAL HIGHLIGHTS
| Six Months Ended | ||||||||||||||||||
| February 28, 2017 | Year Ended August 31, | |||||||||||||||||
| (unaudited) | 2016 | 2015 | 2014 | 2013 | 2012 | |||||||||||||
| Advisor Class | ||||||||||||||||||
| Per share operating performance | ||||||||||||||||||
| (for a share outstanding throughout the period) | ||||||||||||||||||
| Net asset value, beginning of period | $ | 8.67 | $ | 8.36 | $ | 9.24 | $ | 7.84 | $ | 6.41 | $ | 6.63 | ||||||
| Income from investment operationsa: | ||||||||||||||||||
| Net investment incomeb | 0.01 | 0.06 | 0.07 | 0.03 | 0.07 | 0.08 | ||||||||||||
| Net realized and unrealized gains (losses) | 0.51 | 0.29 | (0.83 | ) | 1.41 | 1.48 | (0.23 | ) | ||||||||||
| Total from investment operations | 0.52 | 0.35 | (0.76 | ) | 1.44 | 1.55 | (0.15 | ) | ||||||||||
| Less distributions from: | ||||||||||||||||||
| Net investment income. | (0.06 | ) | (0.04 | ) | (0.06 | ) | (0.04 | ) | (0.12 | ) | (0.07 | ) | ||||||
| Net realized gains | (0.03 | ) | — | (0.06 | ) | — | — | — | ||||||||||
| Total distributions | (0.09 | ) | (0.04 | ) | (0.12 | ) | (0.04 | ) | (0.12 | ) | (0.07 | ) | ||||||
| Net asset value, end of period | $ | 9.10 | $ | 8.67 | $ | 8.36 | $ | 9.24 | $ | 7.84 | $ | 6.41 | ||||||
| Total returnc | 6.00 | % | 4.18 | % | (8.21 | )% | 18.40 | % | 24.43 | % | (2.07 | )% | ||||||
| Ratios to average net assetsd | ||||||||||||||||||
| Expenses before waiver and payments by | ||||||||||||||||||
| affiliates | 1.14 | % | 1.17 | % | 1.13 | % | 1.09 | % | 1.14 | % | 1.16 | % | ||||||
| Expenses net of waiver and payments by | ||||||||||||||||||
| affiliates | 1.13 | %e | 1.16 | % | 1.13 | %f | 1.09 | % | 1.14 | %e | 1.16 | % | ||||||
| Net investment income | 0.27 | % | 0.72 | % | 0.77 | % | 0.53 | % | 0.97 | % | 1.31 | % | ||||||
| Supplemental data | ||||||||||||||||||
| Net assets, end of period (000’s) | $ | 80,888 | $ | 50,213 | $ | 42,778 | $ | 62,955 | $ | 140,733 | $ | 116,877 | ||||||
| Portfolio turnover rate | 9.84 | % | 28.73 | % | 22.16 | % | 25.64 | % | 27.67 | % | 25.44 | % | ||||||
aThe amount shown for a share outstanding throughout the period may not correlate with the Statement of Operations for the period due to the timing of sales and
repurchases of the Fund’s shares in relation to income earned and/or fluctuating fair value of the investments of the Fund.
bBased on average daily shares outstanding.
cTotal return is not annualized for periods less than one year.
dRatios are annualized for periods less than one year.
eBenefit of expense reduction rounds to less than 0.01%.
fBenefit of waiver and payments by affiliates rounds to less than 0.01%.
franklintempleton.com The accompanying notes are an integral part of these financial statements. | Semiannual Report 13
TEMPLETON GLOBAL SMALLER COMPANIES FUND
| Statement of Investments, February 28, 2017 (unaudited) | ||||
| Shares/ | ||||
| Industry | Units | Value | ||
| Common Stocks and Other Equity Interests 94.0% | ||||
| Belgium 1.3% | ||||
| Barco NV | Electronic Equipment, Instruments | |||
| & Components | 167,740 | $ | 15,025,938 | |
| Brazil 1.0% | ||||
| M Dias Branco SA | Food Products | 255,400 | 11,352,571 | |
| Canada 4.8% | ||||
| a Badger Daylighting Ltd | Construction & Engineering | 631,100 | 15,699,265 | |
| b Canaccord Genuity Group Inc | Capital Markets | 2,093,900 | 8,652,479 | |
| a Genworth MI Canada Inc | Thrifts & Mortgage Finance | 174,700 | 4,979,803 | |
| b Major Drilling Group International Inc | Metals & Mining | 1,151,200 | 6,573,343 | |
| Mullen Group Ltd | Energy Equipment & Services | 828,300 | 10,392,645 | |
| Shawcor Ltd | Energy Equipment & Services | 311,500 | 8,284,823 | |
| 54,582,358 | ||||
| Colombia 0.9% | ||||
| b Gran Tierra Energy Inc | Oil, Gas & Consumable Fuels | 3,836,400 | 10,203,498 | |
| Finland 2.9% | ||||
| Amer Sports OYJ | Leisure Products | 720,317 | 17,080,171 | |
| Huhtamaki OYJ | Containers & Packaging | 423,700 | 15,265,192 | |
| 32,345,363 | ||||
| Germany 4.5% | ||||
| Gerresheimer AG | Life Sciences Tools & Services | 253,670 | 19,864,892 | |
| Grand City Properties SA | Real Estate Management & Development | 576,010 | 10,961,429 | |
| Jenoptik AG | Electronic Equipment, Instruments | |||
| & Components | 869,000 | 19,350,643 | ||
| 50,176,964 | ||||
| Hong Kong 3.6% | ||||
| Luk Fook Holdings (International) Ltd | Specialty Retail | 3,082,000 | 8,952,666 | |
| Techtronic Industries Co. Ltd | Household Durables | 4,692,000 | 16,802,581 | |
| Value Partners Group Ltd | Capital Markets | 8,730,000 | 8,827,894 | |
| Vinda International Holdings Ltd | Household Products | 2,842,000 | 5,564,689 | |
| 40,147,830 | ||||
| Italy 3.8% | ||||
| Azimut Holding SpA | Capital Markets | 255,833 | 4,290,546 | |
| Interpump Group SpA | Machinery | 1,039,417 | 21,138,292 | |
| b Technogym SpA | Leisure Products | 1,922,665 | 9,988,765 | |
| Tod’s SpA | Textiles, Apparel & Luxury Goods | 101,380 | 7,144,193 | |
| 42,561,796 | ||||
| Japan 11.8% | ||||
| Anritsu Corp | Electronic Equipment, Instruments | |||
| & Components | 976,500 | 7,498,535 | ||
| Asics Corp | Textiles, Apparel & Luxury Goods | 830,900 | 14,612,392 | |
| Bunka Shutter Co. Ltd | Building Products | 818,500 | 5,965,542 | |
| Capcom Co. Ltd | Software | 434,400 | 8,811,789 | |
| Dowa Holdings Co. Ltd | Metals & Mining | 2,021,000 | 16,344,543 | |
| a IDOM Inc | Specialty Retail | 1,114,900 | 7,244,945 | |
| Keihin Corp | Auto Components | 133,900 | 2,234,737 | |
| Kobayashi Pharmaceutical Co. Ltd | Personal Products | 405,520 | 18,719,908 | |
| a,b Laox Co. Ltd | Specialty Retail | 754,500 | 4,286,741 | |
| MEITEC Corp | Professional Services | 204,000 | 7,950,286 | |
| Nachi-Fujikoshi Corp | Machinery | 1,353,800 | 7,295,101 | |
| Nihon Parkerizing Co. Ltd | Chemicals | 432,200 | 5,206,582 | |
14 Semiannual Report
franklintempleton.com
TEMPLETON GLOBAL SMALLER COMPANIES FUND
STATEMENT OF INVESTMENTS (UNAUDITED)
| Shares/ | ||||
| Industry | Units | Value | ||
| Common Stocks and Other Equity Interests (continued) | ||||
| Japan (continued) | ||||
| TechnoPro Holdings Inc | Professional Services | 180,500 | $ | 6,305,362 |
| Tsumura & Co | Pharmaceuticals | 665,800 | 19,682,312 | |
| 132,158,775 | ||||
| Netherlands 2.0% | ||||
| Aalberts Industries NV | Machinery | 463,871 | 15,981,161 | |
| Arcadis NV | Construction & Engineering | 523,802 | 7,094,206 | |
| 23,075,367 | ||||
| Norway 0.6% | ||||
| Ekornes ASA | Household Durables | 552,060 | 7,073,053 | |
| Philippines 0.3% | ||||
| Vista Land & Lifescapes Inc | Real Estate Management & Development | 38,946,600 | 3,603,691 | |
| Poland 0.9% | ||||
| CCC SA | Textiles, Apparel & Luxury Goods | 182,650 | 10,117,933 | |
| South Korea 2.0% | ||||
| BNK Financial Group Inc | Banks | 1,441,282 | 11,033,057 | |
| DGB Financial Group Inc | Banks | 1,202,820 | 11,032,175 | |
| 22,065,232 | ||||
| Spain 1.6% | ||||
| Construcciones y Auxiliar de Ferrocarriles SA | Machinery | 254,090 | 9,490,497 | |
| Tecnicas Reunidas SA | Energy Equipment & Services | 220,457 | 8,537,519 | |
| 18,028,016 | ||||
| Sweden 2.2% | ||||
| Cloetta AB, B | Food Products | 1,627,090 | 6,265,205 | |
| c The Thule Group AB, Reg S | Leisure Products | 1,137,720 | 18,165,452 | |
| 24,430,657 | ||||
| Switzerland 3.3% | ||||
| b Basilea Pharmaceutica AG | Biotechnology | 70,700 | 6,046,641 | |
| Bucher Industries AG | Machinery | 35,120 | 10,006,345 | |
| Logitech International SA | Technology Hardware, Storage & Peripherals | 351,380 | 10,123,258 | |
| Vontobel Holding AG | Capital Markets | 200,418 | 10,942,219 | |
| 37,118,463 | ||||
| Taiwan 3.6% | ||||
| Chicony Electronics Co. Ltd | Technology Hardware, Storage & Peripherals | 4,988,538 | 11,766,608 | |
| Giant Manufacturing Co. Ltd | Leisure Products | 1,707,311 | 10,568,313 | |
| Merida Industry Co. Ltd | Leisure Products | 1,034,000 | 5,288,831 | |
| Tripod Technology Corp | Electronic Equipment, Instruments | |||
| & Components | 4,841,000 | 12,648,787 | ||
| 40,272,539 | ||||
| Thailand 1.0% | ||||
| Hana Microelectronics PCL, fgn | Electronic Equipment, Instruments | |||
| & Components | 2,910,000 | 3,542,681 | ||
| TISCO Financial Group PCL, fgn | Banks | 3,787,000 | 7,430,808 | |
| 10,973,489 | ||||
| United Kingdom 5.6% | ||||
| Bellway PLC | Household Durables | 137,760 | 4,450,375 | |
| Bovis Homes Group PLC | Household Durables | 322,550 | 3,118,823 | |
| DFS Furniture PLC | Household Durables | 2,245,770 | 6,918,163 | |
| Foxtons Group PLC | Real Estate Management & Development | 3,397,329 | 4,032,510 | |
| Greggs PLC | Food & Staples Retailing | 968,370 | 11,740,302 | |
franklintempleton.com
Semiannual Report 15
TEMPLETON GLOBAL SMALLER COMPANIES FUND
STATEMENT OF INVESTMENTS (UNAUDITED)
| Shares/ | ||||
| Industry | Units | Value | ||
| Common Stocks and Other Equity Interests (continued) | ||||
| United Kingdom (continued) | ||||
| Laird PLC | Electronic Equipment, Instruments | |||
| & Components | 2,076,820 | $ | 4,312,338 | |
| b LivaNova PLC | Health Care Equipment & Supplies | 208,900 | 10,528,560 | |
| Oxford Instruments PLC | Electronic Equipment, Instruments | |||
| & Components | 821,664 | 8,153,699 | ||
| SIG PLC | Trading Companies & Distributors | 2,932,183 | 4,071,066 | |
| b Vectura Group PLC | Pharmaceuticals | 3,075,270 | 5,523,963 | |
| 62,849,799 | ||||
| United States 36.3% | ||||
| Alamo Group Inc | Machinery | 233,420 | 17,541,513 | |
| AllianceBernstein Holding LP | Capital Markets | 747,372 | 17,712,716 | |
| ArcBest Corp | Road & Rail | 306,970 | 9,009,570 | |
| b Black Diamond Inc | Leisure Products | 767,000 | 4,256,850 | |
| b Boston Beer Inc., A | Beverages | 34,600 | 5,489,290 | |
| Columbia Sportswear Co | Textiles, Apparel & Luxury Goods | 326,750 | 17,951,645 | |
| b Deckers Outdoor Corp | Textiles, Apparel & Luxury Goods | 107,040 | 5,654,923 | |
| Education Realty Trust Inc | Real Estate Investment Trusts (REITs) | 127,300 | 5,365,695 | |
| b Ferro Corp | Chemicals | 982,440 | 13,754,160 | |
| The Finish Line Inc., A | Specialty Retail | 238,990 | 3,895,537 | |
| a,b Freshpet Inc | Food Products | 1,509,900 | 15,249,990 | |
| b Green Dot Corp | Consumer Finance | 196,940 | 5,772,311 | |
| Heidrick & Struggles International Inc | Professional Services | 588,490 | 14,388,580 | |
| b Hibbett Sports Inc | Specialty Retail | 407,090 | 12,009,155 | |
| Hillenbrand Inc | Machinery | 574,350 | 20,877,622 | |
| Huntington Bancshares Inc | Banks | 1,541,499 | 21,796,796 | |
| Hyster-Yale Materials Handling Inc | Machinery | 178,800 | 10,887,132 | |
| Investment Technology Group Inc | Capital Markets | 537,260 | 10,755,945 | |
| a,b,d JAKKS Pacific Inc | Leisure Products | 1,756,930 | 9,223,883 | |
| Janus Capital Group Inc | Capital Markets | 1,237,410 | 15,665,611 | |
| b Knowles Corp | Electronic Equipment, Instruments | |||
| & Components | 1,061,860 | 20,101,010 | ||
| LCI Industries | Auto Components | 154,690 | 16,660,113 | |
| b Newpark Resources Inc | Energy Equipment & Services | 1,204,140 | 9,271,878 | |
| b NOW Inc | Trading Companies & Distributors | 399,010 | 7,637,051 | |
| b Patrick Industries Inc | Building Products | 127,290 | 10,164,107 | |
| Simpson Manufacturing Co. Inc | Building Products | 463,040 | 19,984,806 | |
| SpartanNash Co | Food & Staples Retailing | 441,320 | 15,402,068 | |
| b Texas Capital Bancshares Inc | Banks | 63,570 | 5,667,266 | |
| b Trimas Corp | Machinery | 348,050 | 7,674,503 | |
| b Tutor Perini Corp | Construction & Engineering | 733,410 | 22,332,334 | |
| United Insurance Holdings Corp | Insurance | 367,090 | 6,211,163 | |
| b,d West Marine Inc | Specialty Retail | 1,454,630 | 13,368,050 | |
| Winnebago Industries Inc | Automobiles | 503,210 | 16,605,930 | |
| 408,339,203 | ||||
| Total Common Stocks and Other Equity | ||||
| Interests (Cost $827,233,320) | 1,056,502,535 | |||
| Management Investment Companies (Cost | ||||
| $4,079,748) 0.4% | ||||
| United States 0.4% | ||||
| iShares Russell 2000 ETF | Diversified Financial Services | 30,200 | 4,162,768 | |
16 Semiannual Report
franklintempleton.com
TEMPLETON GLOBAL SMALLER COMPANIES FUND
STATEMENT OF INVESTMENTS (UNAUDITED)
| Industry | Shares | Value | ||
| Preferred Stocks (Cost $6,172,377) 0.7% | ||||
| Brazil 0.7% | ||||
| e Alpargatas SA, 2.543%, pfd | Textiles, Apparel & Luxury Goods | 2,082,350 | $ | 7,916,560 |
| Total Investments before Short Term | ||||
| Investments (Cost $837,485,445) | 1,068,581,863 |
| Principal | ||||
| Amount | ||||
| Short Term Investments 6.3% | ||||
| U.S. Government and Agency Securities | ||||
| 4.0% | ||||
| United States 4.0% | ||||
| f FHLB, 3/01/17. | $ | 30,900,000 | 30,900,000 | |
| f FHLMC, 3/01/17 | 14,200,000 | 14,200,000 | ||
| Total U.S. Government and Agency | ||||
| Securities (Cost $45,099,522) | 45,100,000 |
| Shares | |||||||
| g Investments from Cash Collateral | |||||||
| Received for Loaned Securities (Cost | |||||||
| $ | 25,531,222) 2.3% | ||||||
| Money Market Funds 2.3% | |||||||
| United States 2.3% | |||||||
| h,i Institutional Fiduciary Trust Money Market Portfolio, | |||||||
| 0.17%. | 25,531,222 | 25,531,222 | |||||
| Total Investments (Cost $908,116,189) | |||||||
| 101.4% | 1,139,213,085 | ||||||
| Other Assets, less Liabilities (1.4)% | (15,374,703 | ) | |||||
| Net Assets 100.0% | $ | 1,123,838,382 | |||||
See Abbreviations on page 30.
aA portion or all of the security is on loan at February 28, 2017. See Note 1(c).
bNon-income producing.
cSecurity was purchased pursuant to Regulation S under the Securities Act of 1933, which exempts from registration securities offered and sold outside of the United States.
Such a security cannot be sold in the United States without either an effective registration statement filed pursuant to the Securities Act of 1933, or pursuant to an exemption
from registration. This security has been deemed liquid under guidelines approved by the Fund’s Board of Trustees. At February 28, 2017, the value of this security was
$18,165,452, representing 1.6% of net assets.
dSee Note 8 regarding holdings of 5% voting securities.
eVariable rate security. The rate shown represents the yield at period end.
fThe security was issued on a discount basis with no stated coupon rate.
gSee Note 1(c) regarding securities on loan.
hSee Note 3(f) regarding investments in affiliated management investment companies.
iThe rate shown is the annualized seven-day yield at period end.
franklintempleton.com The accompanying notes are an integral part of these financial statements. | Semiannual Report 17
TEMPLETON GLOBAL SMALLER COMPANIES FUND
Financial Statements
Statement of Assets and Liabilities
February 28, 2017 (unaudited)
| Assets: | |||
| Investments in securities: | |||
| Cost - Unaffiliated issuers | $ | 838,491,512 | |
| Cost - Non-controlled affiliates (Note 3f and 8) | 69,624,677 | ||
| Total cost of investments | $ | 908,116,189 | |
| Value - Unaffiliated issuers | $ | 1,091,089,930 | |
| Value - Non-controlled affiliates (Note 3f and 8) | 48,123,155 | ||
| Total value of investments (includes securities loaned in the amount of $23,827,016) | 1,139,213,085 | ||
| Cash. | 157,819 | ||
| Foreign currency, at value (cost $190,862) | 191,073 | ||
| Receivables: | |||
| Investment securities sold | 10,594,194 | ||
| Capital shares sold | 1,692,877 | ||
| Dividends and interest | 2,466,025 | ||
| European Union tax reclaims | 992,381 | ||
| Other assets | 1,126 | ||
| Total assets | 1,155,308,580 | ||
| Liabilities: | |||
| Payables: | |||
| Investment securities purchased | 1,389,772 | ||
| Capital shares redeemed | 3,047,144 | ||
| Management fees | 747,951 | ||
| Distribution fees | 216,193 | ||
| Transfer agent fees | 347,200 | ||
| Payable upon return of securities loaned | 25,531,222 | ||
| Accrued expenses and other liabilities. | 190,716 | ||
| Total liabilities | 31,470,198 | ||
| Net assets, at value | $ | 1,123,838,382 | |
| Net assets consist of: | |||
| Paid-in capital | $ | 882,621,461 | |
| Distributions in excess of net investment income | (490,188 | ) | |
| Net unrealized appreciation (depreciation) | 230,997,533 | ||
| Accumulated net realized gain (loss) | 10,709,576 | ||
| Net assets, at value | $ | 1,123,838,382 |
18 Semiannual Report | The accompanying notes are an integral part of these financial statements. franklintempleton.com
TEMPLETON GLOBAL SMALLER COMPANIES FUND
FINANCIAL STATEMENTS
| Statement of Assets and Liabilities (continued) | ||
| February 28, 2017 (unaudited) | ||
| Class A: | ||
| Net assets, at value | $ | 990,533,335 |
| Shares outstanding. | 109,204,429 | |
| Net asset value per sharea | $ | 9.07 |
| Maximum offering price per share (net asset value per share ÷ 94.25%) | $ | 9.62 |
| Class C: | ||
| Net assets, at value | $ | 31,607,979 |
| Shares outstanding. | 3,662,163 | |
| Net asset value and maximum offering price per sharea | $ | 8.63 |
| Class R6: | ||
| Net assets, at value | $ | 20,809,433 |
| Shares outstanding. | 2,288,038 | |
| Net asset value and maximum offering price per share | $ | 9.09 |
| Advisor Class: | ||
| Net assets, at value | $ | 80,887,635 |
| Shares outstanding. | 8,892,701 | |
| Net asset value and maximum offering price per share | $ | 9.10 |
aRedemption price is equal to net asset value less contingent deferred sales charges, if applicable.
franklintempleton.com The accompanying notes are an integral part of these financial statements. | Semiannual Report 19
| TEMPLETON GLOBAL SMALLER COMPANIES FUND | |||
| FINANCIAL STATEMENTS | |||
| Statement of Operations | |||
| for the six months ended February 28, 2017 (unaudited) | |||
| Investment income: | |||
| Dividends (net of foreign taxes of $534,631) | $ | 6,974,712 | |
| Interest | 75,732 | ||
| Income from securities loaned (net of fees and rebates) | 655,946 | ||
| Total investment income | 7,706,390 | ||
| Expenses: | |||
| Management fees (Note 3a) | 4,806,401 | ||
| Distribution fees: (Note 3c) | |||
| Class A | 1,228,200 | ||
| Class C | 160,424 | ||
| Transfer agent fees: (Note 3e) | |||
| Class A | 1,018,205 | ||
| Class C | 33,254 | ||
| Class R6 | 60 | ||
| Advisor Class | 67,555 | ||
| Custodian fees (Note 4) | 7,894 | ||
| Reports to shareholders | 88,795 | ||
| Registration and filing fees | 71,631 | ||
| Professional fees. | 75,471 | ||
| Trustees’ fees and expenses. | 48,175 | ||
| Other | 18,692 | ||
| Total expenses | 7,624,757 | ||
| Expense reductions (Note 4) | (502 | ) | |
| Expenses waived/paid by affiliates (Note 3f) | (62,075 | ) | |
| Net expenses | 7,562,180 | ||
| Net investment income | 144,210 | ||
| Realized and unrealized gains (losses): | |||
| Net realized gain (loss) from: | |||
| Investments | 25,871,663 | ||
| Foreign currency transactions | (141,265 | ) | |
| Net realized gain (loss) | 25,730,398 | ||
| Net change in unrealized appreciation (depreciation) on: | |||
| Investments | 36,340,017 | ||
| Translation of other assets and liabilities | |||
| denominated in foreign currencies | (64,020 | ) | |
| Net change in unrealized appreciation (depreciation) | 36,275,997 | ||
| Net realized and unrealized gain (loss) | 62,006,395 | ||
| Net increase (decrease) in net assets resulting from operations | $ | 62,150,605 | |
20 Semiannual Report | The accompanying notes are an integral part of these financial statements. franklintempleton.com
TEMPLETON GLOBAL SMALLER COMPANIES FUND
FINANCIAL STATEMENTS
| Statements of Changes in Net Assets | ||||||
| Six Months Ended | ||||||
| February 28, 2017 | Year Ended | |||||
| (unaudited) | August 31, 2016 | |||||
| Increase (decrease) in net assets: | ||||||
| Operations: | ||||||
| Net investment income | $ | 144,210 | $ | 4,886,714 | ||
| Net realized gain (loss) | 25,730,398 | 6,813,158 | ||||
| Net change in unrealized appreciation (depreciation) | 36,275,997 | 33,317,898 | ||||
| Net increase (decrease) in net assets resulting from operations | 62,150,605 | 45,017,770 | ||||
| Distributions to shareholders from: | ||||||
| Net investment income: | ||||||
| Class A | (3,353,089 | ) | (1,973,681 | ) | ||
| Class R6 | (161,237 | ) | (142,401 | ) | ||
| Advisor Class | (448,360 | ) | (172,151 | ) | ||
| Net realized gains: | ||||||
| Class A | (3,253,159 | ) | — | |||
| Class C | (110,990 | ) | — | |||
| Class R6 | (66,593 | ) | — | |||
| Advisor Class | (226,507 | ) | — | |||
| Total distributions to shareholders | (7,619,935 | ) | (2,288,233 | ) | ||
| Capital share transactions: (Note 2) | ||||||
| Class A | (78,152,988 | ) | 20,075,387 | |||
| Class C | (3,755,288 | ) | (3,943,590 | ) | ||
| Class R6 | (849,107 | ) | (2,134,095 | ) | ||
| Advisor Class | 27,241,023 | 5,924,685 | ||||
| Total capital share transactions | (55,516,360 | ) | 19,922,387 | |||
| Net increase (decrease) in net assets | (985,690 | ) | 62,651,924 | |||
| Net assets: | ||||||
| Beginning of period | 1,124,824,072 | 1,062,172,148 | ||||
| End of period | $ | 1,123,838,382 | $ | 1,124,824,072 | ||
| Undistributed net investment income included in net assets: | ||||||
| End of period | $ | — | $ | 3,328,288 | ||
| Distributions in excess of net investment income included in net assets: | ||||||
| End of period | $ | (490,188 | ) | $ | — | |
franklintempleton.com The accompanying notes are an integral part of these financial statements. | Semiannual Report 21
TEMPLETON GLOBAL SMALLER COMPANIES FUND
Notes to Financial Statements (unaudited)
1. Organization and Significant Accounting Policies
Templeton Global Smaller Companies Fund (Fund) is registered under the Investment Company Act of 1940 (1940 Act) as an open-end management investment company and applies the specialized accounting and reporting guidance in U.S. Generally Accepted Accounting Principles (U.S. GAAP). The Fund offers four classes of shares: Class A, Class C, Class R6, and Advisor Class. Each class of shares differs by its initial sales load, contingent deferred sales charges, voting rights on matters affecting a single class, its exchange privilege and fees primarily due to differing arrangements for distribution and transfer agent fees.
The following summarizes the Fund’s significant accounting policies.
a. Financial Instrument Valuation
The Fund’s investments in financial instruments are carried at fair value daily. Fair value is the price that would be received to sell an asset or paid to transfer a liability in an orderly transaction between market participants on the measurement date. The Fund calculates the net asset value (NAV) per share as of 4 p.m. Eastern time each day the New York Stock Exchange (NYSE) is open for trading. Under compliance policies and procedures approved by the Fund’s Board of Trustees (the Board), the Fund’s administrator has responsibility for oversight of valuation, including leading the cross-functional Valuation Committee (VC). The VC provides administration and oversight of the Fund’s valuation policies and procedures, which are approved annually by the Board. Among other things, these procedures allow the Fund to utilize independent pricing services, quotations from securities and financial instrument dealers, and other market sources to determine fair value.
Equity securities and exchange traded funds listed on an exchange or on the NASDAQ National Market System are valued at the last quoted sale price or the official closing price of the day, respectively. Foreign equity securities are valued as of the close of trading on the foreign stock exchange on which the security is primarily traded or as of 4 p.m. Eastern time. The value is then converted into its U.S. dollar equivalent at the foreign exchange rate in effect at 4 p.m. Eastern time on the day that the value of the security is determined. Over-the-counter (OTC) securities are valued within the range of the most recent quoted bid and ask prices. Securities that trade in multiple markets or on multiple exchanges are valued according to the broadest and most representative market. Certain equity securities are valued based upon fundamental characteristics or relationships to similar securities.
Debt securities generally trade in the OTC market rather than on a securities exchange. The Fund’s pricing services use multiple valuation techniques to determine fair value. In instances where sufficient market activity exists, the pricing services may utilize a market-based approach through which quotes from market makers are used to determine fair value. In instances where sufficient market activity may not exist or is limited, the pricing services also utilize proprietary valuation models which may consider market characteristics such as benchmark yield curves, credit spreads, estimated default rates, anticipated market interest rate volatility, coupon rates, anticipated timing of principal repayments, underlying collateral, and other unique security features in order to estimate the relevant cash flows, which are then discounted to calculate the fair value.
Investments in open-end mutual funds are valued at the closing NAV.
The Fund has procedures to determine the fair value of financial instruments for which market prices are not reliable or readily available. Under these procedures, the VC convenes on a regular basis to review such financial instruments and considers a number of factors, including significant unobservable valuation inputs, when arriving at fair value. The VC primarily employs a market-based approach which may use related or comparable assets or liabilities, recent transactions, market multiples, book values, and other relevant information for the investment to determine the fair value of the investment. An income-based valuation approach may also be used in which the anticipated future cash flows of the investment are discounted to calculate fair value. Discounts may also be applied due to the nature or duration of any restrictions on the disposition of the investments. Due to the inherent uncertainty of valuations of such investments, the fair values may differ significantly from the values that would have been used had an active market existed. The VC employs various methods for calibrating these valuation approaches including a regular review of key inputs and assumptions, transactional back-testing or disposition analysis, and reviews of any related market activity.
Trading in securities on foreign securities stock exchanges and OTC markets may be completed before 4 p.m. Eastern time. In addition, trading in certain foreign markets may not take place
22 Semiannual Report
franklintempleton.com
TEMPLETON GLOBAL SMALLER COMPANIES FUND
NOTES TO FINANCIAL STATEMENTS (UNAUDITED)
on every Fund’s business day. Occasionally, events occur between the time at which trading in a foreign security is completed and 4 p.m. Eastern time that might call into question the reliability of the value of a portfolio security held by the Fund. As a result, differences may arise between the value of the Fund’s portfolio securities as determined at the foreign market close and the latest indications of value at 4 p.m. Eastern time. In order to minimize the potential for these differences, the VC monitors price movements following the close of trading in foreign stock markets through a series of country specific market proxies (such as baskets of American Depositary Receipts, futures contracts and exchange traded funds). These price movements are measured against established trigger thresholds for each specific market proxy to assist in determining if an event has occurred that may call into question the reliability of the values of the foreign securities held by the Fund. If such an event occurs, the securities may be valued using fair value procedures, which may include the use of independent pricing services.
When the last day of the reporting period is a non-business day, certain foreign markets may be open on those days that the Fund’s NAV is not calculated, which could result in differences between the value of the Fund’s portfolio securities on the last business day and the last calendar day of the reporting period. Any significant security valuation changes due to an open foreign market are adjusted and reflected by the Fund for financial reporting purposes.
b. Foreign Currency Translation
Portfolio securities and other assets and liabilities denominated in foreign currencies are translated into U.S. dollars based on the exchange rate of such currencies against U.S. dollars on the date of valuation. The Fund may enter into foreign currency exchange contracts to facilitate transactions denominated in a foreign currency. Purchases and sales of securities, income and expense items denominated in foreign currencies are translated into U.S. dollars at the exchange rate in effect on the transaction date. Portfolio securities and assets and liabilities denominated in foreign currencies contain risks that those currencies will decline in value relative to the U.S. dollar. Occasionally, events may impact the availability or reliability of foreign exchange rates used to convert the U.S. dollar equivalent value. If such an event occurs, the foreign exchange rate will be valued at fair value using procedures established and approved by the Board.
The Fund does not separately report the effect of changes in foreign exchange rates from changes in market prices on securities held. Such changes are included in net realized and unrealized gain or loss from investments in the Statement of Operations.
Realized foreign exchange gains or losses arise from sales of foreign currencies, currency gains or losses realized between the trade and settlement dates on securities transactions and the difference between the recorded amounts of dividends, interest, and foreign withholding taxes and the U.S. dollar equivalent of the amounts actually received or paid. Net unrealized foreign exchange gains and losses arise from changes in foreign exchange rates on foreign denominated assets and liabilities other than investments in securities held at the end of the reporting period.
c. Securities Lending
The Fund participates in an agency based securities lending program to earn additional income. The Fund receives cash collateral against the loaned securities in an amount equal to at least 102% of the fair value of the loaned securities. Collateral is maintained over the life of the loan in an amount not less than 100% of the fair value of loaned securities, as determined at the close of Fund business each day; any additional collateral required due to changes in security values is delivered to the Fund on the next business day. The collateral is deposited into a joint cash account with other funds and is used to invest in a money market fund managed by Franklin Advisers, Inc., an affiliate of the Fund. The Fund may receive income from the investment of cash collateral, in addition to lending fees and rebates paid by the borrower. Income from securities loaned, net of fees paid to the securities lending agent and/or third-party vendor, is reported separately in the Statement of Operations. The Fund bears the market risk with respect to the collateral investment, securities loaned, and the risk that the agent may default on its obligations to the Fund. If the borrower defaults on its obligation to return the securities loaned, the Fund has the right to repurchase the securities in the open market using the collateral received. The securities lending agent has agreed to indemnify the Fund in the event of default by a third party borrower.
d. Income and Deferred Taxes
It is the Fund’s policy to qualify as a regulated investment company under the Internal Revenue Code. The Fund intends to distribute to shareholders substantially all of its taxable income
franklintempleton.com
Semiannual Report 23
TEMPLETON GLOBAL SMALLER COMPANIES FUND
NOTES TO FINANCIAL STATEMENTS (UNAUDITED)
1. Organization and Significant Accounting
Policies (continued)
d. Income and Deferred Taxes (continued)
and net realized gains to relieve it from federal income and excise taxes. As a result, no provision for U.S. federal income taxes is required.
The Fund may be subject to foreign taxation related to income received, capital gains on the sale of securities and certain foreign currency transactions in the foreign jurisdictions in which it invests. Foreign taxes, if any, are recorded based on the tax regulations and rates that exist in the foreign markets in which the Fund invests. When a capital gain tax is determined to apply, the Fund records an estimated deferred tax liability in an amount that would be payable if the securities were disposed of on the valuation date. As a result of several court cases, in certain countries across the European Union, the Fund filed additional tax reclaims for previously withheld taxes on dividends earned in those countries (EU reclaims). These additional filings are subject to various administrative proceedings by the local jurisdictions’ tax authorities within the European Union, as well as a number of related judicial proceedings. Income recognized, if any, for EU reclaims is reflected as other income in the Statement of Operations and any related receivable, if any, is reflected as European Union tax reclaims in the Statement of Assets and Liabilities. When uncertainty exists as to the ultimate resolution of these proceedings, the likelihood of receipt of these EU reclaims, and the potential timing of payment, no amounts are reflected in the financial statements. For U.S. income tax purposes, EU reclaims received by the Funds, if any, reduce the amounts of foreign taxes Fund shareholders can use as tax credits in their individual income tax returns.
The Fund may recognize an income tax liability related to its uncertain tax positions under U.S. GAAP when the uncertain tax position has a less than 50% probability that it will be sustained upon examination by the tax authorities based on its technical merits. As of February 28, 2017, the Fund has determined that no tax liability is required in its financial statements related to uncertain tax positions for any open tax years (or expected to be taken in future tax years). Open tax years are those that remain subject to examination and are based on each tax jurisdiction’s statute of limitation.
e. Security Transactions, Investment Income, Expenses and Distributions
Security transactions are accounted for on trade date. Realized gains and losses on security transactions are determined on a specific identification basis. Interest income and estimated expenses are accrued daily. Amortization of premium and accretion of discount on debt securities are included in interest income. Dividend income is recorded on the ex-dividend date except for certain dividends from securities where the dividend rate is not available. In such cases, the dividend is recorded as soon as the information is received by the Fund. Distributions to shareholders are recorded on the ex-dividend date and are determined according to income tax regulations (tax basis). Distributable earnings determined on a tax basis may differ from earnings recorded in accordance with U.S. GAAP. These differences may be permanent or temporary. Permanent differences are reclassified among capital accounts to reflect their tax character. These reclassifications have no impact on net assets or the results of operations. Temporary differences are not reclassified, as they may reverse in subsequent periods.
Realized and unrealized gains and losses and net investment income, not including class specific expenses, are allocated daily to each class of shares based upon the relative proportion of net assets of each class. Differences in per share distributions, by class, are generally due to differences in class specific expenses.
f. Accounting Estimates
The preparation of financial statements in accordance with U.S. GAAP requires management to make estimates and assumptions that affect the reported amounts of assets and liabilities at the date of the financial statements and the amounts of income and expenses during the reporting period. Actual results could differ from those estimates.
g. Guarantees and Indemnifications
Under the Fund’s organizational documents, its officers and trustees are indemnified by the Fund against certain liabilities arising out of the performance of their duties to the Fund. Additionally, in the normal course of business, the Fund enters into contracts with service providers that contain general indemnification clauses. The Fund’s maximum exposure under
24 Semiannual Report
franklintempleton.com
TEMPLETON GLOBAL SMALLER COMPANIES FUND
NOTES TO FINANCIAL STATEMENTS (UNAUDITED)
these arrangements is unknown as this would involve future
claims that may be made against the Fund that have not yet
occurred. Currently, the Fund expects the risk of loss to be
remote.
2. Shares of Beneficial Interest
At February 28, 2017, there were an unlimited number of shares authorized (without par value). Transactions in the Fund’s shares were as follows:
| Six Months Ended | Year Ended | |||||||||||
| February 28, 2017 | August 31, 2016 | |||||||||||
| Shares | Amount | Shares | Amount | |||||||||
| Class A Shares: | ||||||||||||
| Shares sold | 7,310,115 | $ | 64,121,848 | 22,938,065 | $ | 183,197,684 | ||||||
| Shares issued in reinvestment of distributions | 720,606 | 6,283,687 | 235,464 | 1,857,806 | ||||||||
| Shares redeemed | (16,985,589 | ) | (148,558,523 | ) | (20,385,144 | ) | (164,980,103 | ) | ||||
| Net increase (decrease) | (8,954,868 | ) | $ | (78,152,988 | ) | 2,788,385 | $ | 20,075,387 | ||||
| Class C Shares: | ||||||||||||
| Shares sold | 207,468 | $ | 1,735,923 | 600,940 | $ | 4,575,436 | ||||||
| Shares issued in reinvestment of distributions | 12,519 | 104,029 | — | — | ||||||||
| Shares redeemed | (670,510 | ) | (5,595,240 | ) | (1,110,645 | ) | (8,519,026 | ) | ||||
| Net increase (decrease) | (450,523 | ) | $ | (3,755,288 | ) | (509,705 | ) | $ | (3,943,590 | ) | ||
| Class R6 Shares: | ||||||||||||
| Shares sold | 84,460 | $ | 742,660 | 194,331 | $ | 1,566,410 | ||||||
| Shares redeemed | (180,911 | ) | (1,591,767 | ) | (456,917 | ) | (3,700,505 | ) | ||||
| Net increase (decrease) | (96,451 | ) | $ | (849,107 | ) | (262,586 | ) | $ | (2,134,095 | ) | ||
| Advisor Class Shares: | ||||||||||||
| Shares sold | 6,329,365 | $ | 55,424,911 | 3,225,218 | $ | 26,839,388 | ||||||
| Shares issued in reinvestment of distributions | 66,899 | 584,698 | 16,846 | 133,253 | ||||||||
| Shares redeemed | (3,292,593 | ) | (28,768,586 | ) | (2,568,759 | ) | (21,047,956 | ) | ||||
| Net increase (decrease) | 3,103,671 | $ | 27,241,023 | 673,305 | $ | 5,924,685 | ||||||
3. Transactions with Affiliates
Franklin Resources, Inc. is the holding company for various subsidiaries that together are referred to as Franklin Templeton Investments. Certain officers and trustees of the Fund are also officers and/or directors of the following subsidiaries:
| Subsidiary | Affiliation |
| Templeton Investment Counsel, LLC (TIC) | Investment manager |
| Franklin Templeton Investments Corp. (FTIC) | Investment manager - sub-advisor |
| Franklin Templeton Services, LLC (FT Services) | Administrative manager |
| Franklin Templeton Distributors, Inc. (Distributors) | Principal underwriter |
| Franklin Templeton Investor Services, LLC (Investor Services) | Transfer agent |
franklintempleton.com
Semiannual Report 25
TEMPLETON GLOBAL SMALLER COMPANIES FUND
NOTES TO FINANCIAL STATEMENTS (UNAUDITED)
| 3. | Transactions with Affiliates (continued) |
| a. | Management Fees |
The Fund pays an investment management fee to TIC based on the average daily net assets of the Fund as follows:
| Annualized Fee Rate | Net Assets | |
| 0.900% | Up to and including $200 million | |
| 0.885% | Over $200 million, up to and including $700 million | |
| 0.850% | Over $700 million, up to and including $1 billion | |
| 0.830% | Over $1 billion, up to and including $1.2 billion | |
| 0.805% | Over $1.2 billion, up to and including $5 billion | |
| 0.785% | Over $5 billion, up to and including $10 billion | |
| 0.765% | Over $10 billion, up to and including $15 billion | |
| 0.745% | Over $15 billion, up to and including $20 billion | |
| 0.725% | In excess of $20 billion |
For the period ended February 28, 2017, the annualized effective investment management fee rate was 0.873% of the Fund’s average daily net assets.
Under a subadvisory agreement, FTIC, an affiliate of TIC, provides subadvisory services to the Fund. The subadvisory fee is paid by TIC based on the Fund’s average daily net assets, and is not an additional expense of the Fund.
b. Administrative Fees
Under an agreement with TIC, FT Services provides administrative services to the Fund. The fee is paid by TIC based on the Fund’s average daily net assets, and is not an additional expense of the Fund.
c. Distribution Fees
The Board has adopted distribution plans for each share class, with the exception of Class R6/Advisor Class shares, pursuant to Rule 12b-1 under the 1940 Act. Under the Fund’s Class A reimbursement distribution plan, the Fund reimburses Distributors for costs incurred in connection with the servicing, sale and distribution of the Fund’s shares up to the maximum annual plan rate. Under the Class A reimbursement distribution plan, costs exceeding the maximum for the current plan year cannot be reimbursed in subsequent periods. In addition, under the Fund’s Class C compensation distribution plan, the Fund pays Distributors for costs incurred in connection with the servicing, sale and distribution of the Fund’s shares up to the maximum annual plan rate for each class. The plan year, for purposes of monitoring compliance with the maximum annual plan rates, is February 1 through January 31.
The maximum annual plan rates, based on the average daily net assets, for each class, are as follows:
| Class A | 0.25 | % |
| Class C | 1.00 | % |
26 Semiannual Report
franklintempleton.com
TEMPLETON GLOBAL SMALLER COMPANIES FUND
NOTES TO FINANCIAL STATEMENTS (UNAUDITED)
d. Sales Charges/Underwriting Agreements
Front-end sales charges and contingent deferred sales charges (CDSC) do not represent expenses of the Fund. These charges are deducted from the proceeds of sales of Fund shares prior to investment or from redemption proceeds prior to remittance, as applicable. Distributors has advised the Fund of the following commission transactions related to the sales and redemptions of the Fund’s shares for the period:
| Sales charges retained net of commissions paid to | ||
| unaffiliated brokers/dealers | $ | 153,480 |
| CDSC retained | $ | 11,311 |
| e. Transfer Agent Fees | ||
Each class of shares, except for Class R6, pays transfer agent fees to Investor Services for its performance of shareholder servicing obligations and reimburses Investor Services for out of pocket expenses incurred, including shareholder servicing fees paid to third parties. These fees are allocated daily based upon their relative proportion of such classes’ aggregate net assets. Class R6 pays Investor Services transfer agent fees specific to that class.
For the period ended February 28, 2017, the Fund paid transfer agent fees of $1,119,074, of which $419,126 was retained by Investor Services.
f. Investments in Affiliated Management Investment Companies
The Fund invests in one or more affiliated management investment companies for purposes other than exercising a controlling influence over the management or policies. Management fees paid by the Fund are waived on assets invested in the affiliated management investment companies, as noted in the Statement of Operations, in an amount not to exceed the management and administrative fees paid directly or indirectly by each affiliate. During the period ended February 28, 2017, the Fund held investments in affiliated management investment companies as follows:
| % of | |||||||||||
| Affiliated | |||||||||||
| Number of | Number of | Fund Shares | |||||||||
| Shares Held | Shares | Value | Outstanding | ||||||||
| at Beginning | Gross | Gross | Held at End | at End | Investment | Realized | Held at End | ||||
| of Period | Additions | Reductions | of Period | of Period | Income | Gain (Loss) | of Period | ||||
| Non-Controlled Affiliates | |||||||||||
| Institutional Fiduciary Trust Money | |||||||||||
| Market Portfolio, 0.17% | 51,554,815 | 101,947,669 | (127,971,262 | ) | 25,531,222 | $ | 25,531,222 | $ – | $ – | 0.2 | % |
| g. Waiver and Expense Reimbursements | |||||||||||
Investor Services has contractually agreed in advance to waive or limit its fees so that the Class R6 transfer agent fees do not exceed 0.01% until December 31, 2017. There were no Class R6 transfer agent fees waived during the period ended February 28, 2017.
4. Expense Offset Arrangement
The Fund has entered into an arrangement with its custodian whereby credits realized as a result of uninvested cash balances are used to reduce a portion of the Fund’s custodian expenses. During the period ended February 28, 2017, the custodian fees were reduced as noted in the Statement of Operations.
franklintempleton.com
Semiannual Report 27
TEMPLETON GLOBAL SMALLER COMPANIES FUND
NOTES TO FINANCIAL STATEMENTS (UNAUDITED)
5. Income Taxes
For tax purposes, capital losses may be carried over to offset future capital gains, if any. At August 31, 2016, the Fund had short-term capital loss carryforwards of $8,267,429.
At February 28, 2017, the cost of investments and net unrealized appreciation (depreciation) for income tax purposes were as follows:
| Cost of investments | $ | 911,212,336 | |
| Unrealized appreciation | $ | 307,534,606 | |
| Unrealized depreciation | (79,533,857 | ) | |
| Net unrealized appreciation (depreciation) | $ | 228,000,749 | |
Differences between income and/or capital gains as determined on a book basis and a tax basis are primarily due to differing treatments of passive foreign investment company shares, wash sales and EU reclaims.
6. Investment Transactions
Purchases and sales of investments (excluding short term securities) for the period ended February 28, 2017, aggregated $103,893,400 and $163,777,264, respectively.
At February 28, 2017, in connection with securities lending transactions, the Fund loaned equity investments and received $25,531,222 of cash collateral. The gross amount of recognized liability for such transactions is included in payable upon return of securities loaned in the Statement of Assets and Liabilities. The agreements can be terminated at any time.
7. Concentration of Risk
Investing in foreign securities may include certain risks and considerations not typically associated with investing in U.S. securities, such as fluctuating currency values and changing local and regional economic, political and social conditions, which may result in greater market volatility. In addition, certain foreign securities may not be as liquid as U.S. securities.
8. Holdings of 5% Voting Securities of Portfolio Companies
The 1940 Act defines "affiliated companies" to include investments in portfolio companies in which a fund owns 5% or more of the outstanding voting securities. During the period ended February 28, 2017, the Fund held investments in “affiliated companies” as follows:
| Number of | Number of | |||||||||
| Shares Held | Shares | Value at | Realized | |||||||
| at Beginning | Gross | Gross | Held at End | End of | Investment | Gain | ||||
| Name of Issuer | of Period | Additions | Reductions | of Period | Period | Income | (Loss) | |||
| Non-Controlled Affiliates | ||||||||||
| JAKKS Pacific Inc | 1,756,930 | — | — | 1,756,930 | $ | 9,223,883 | $ | — | $ | — |
| West Marine Inc | 1,454,630 | — | — | 1,454,630 | 13,368,050 | — | — | |||
| Total Affiliated Securities (Value is 2.0% of Net Assets) | $ | 22,591,933 | $ | — | $ | — | ||||
28 Semiannual Report
franklintempleton.com
TEMPLETON GLOBAL SMALLER COMPANIES FUND
NOTES TO FINANCIAL STATEMENTS (UNAUDITED)
9. Credit Facility
The Fund, together with other U.S. registered and foreign investment funds (collectively, Borrowers), managed by Franklin Templeton Investments, are borrowers in a joint syndicated senior unsecured credit facility totaling $2 billion (Global Credit Facility) which matures on February 9, 2018. This Global Credit Facility provides a source of funds to the Borrowers for temporary and emergency purposes, including the ability to meet future unanticipated or unusually large redemption requests.
Under the terms of the Global Credit Facility, the Fund shall, in addition to interest charged on any borrowings made by the Fund and other costs incurred by the Fund, pay its share of fees and expenses incurred in connection with the implementation and maintenance of the Global Credit Facility, based upon its relative share of the aggregate net assets of all of the Borrowers, including an annual commitment fee of 0.15% based upon the unused portion of the Global Credit Facility. These fees are reflected in other expenses in the Statement of Operations. During the period ended February 28, 2017, the Fund did not use the Global Credit Facility.
10. Fair Value Measurements
The Fund follows a fair value hierarchy that distinguishes between market data obtained from independent sources (observable inputs) and the Fund’s own market assumptions (unobservable inputs). These inputs are used in determining the value of the Fund’s financial instruments and are summarized in the following fair value hierarchy:
- Level 1 – quoted prices in active markets for identical financial instruments
- Level 2 – other significant observable inputs (including quoted prices for similar financial instruments, interest rates, prepayment speed, credit risk, etc.)
- Level 3 – significant unobservable inputs (including the Fund’s own assumptions in determining the fair value of financial instruments)
The input levels are not necessarily an indication of the risk or liquidity associated with financial instruments at that level.
For movements between the levels within the fair value hierarchy, the Fund has adopted a policy of recognizing the transfers as of the date of the underlying event which caused the movement.
A summary of inputs used as of February 28, 2017, in valuing the Fund’s assets carried at fair value, is as follows:
| Level 1 | Level 2 | Level 3 | Total | |||||
| Assets: | ||||||||
| Investments in Securities: | ||||||||
| Equity Investmentsa,b | $ | 1,064,419,095 | $ | — | $ | — | $ | 1,064,419,095 |
| Management Investment Companies | 4,162,768 | — | — | 4,162,768 | ||||
| Short Term Investments | 25,531,222 | 45,100,000 | — | 70,631,222 | ||||
| Total Investments in Securities | $ | 1,094,113,085 | $ | 45,100,000 | $ | — | $ | 1,139,213,085 |
| aIncludes common and preferred stocks as well as other equity investments. | ||||||||
| bFor detailed categories, see the accompanying Statement of Investments. | ||||||||
franklintempleton.com
Semiannual Report 29
TEMPLETON GLOBAL SMALLER COMPANIES FUND
NOTES TO FINANCIAL STATEMENTS (UNAUDITED)
11. Investment Company Reporting Modernization
In October 2016, the U.S. Securities and Exchange Commission adopted new rules and amended existing rules (together, final rules) intended to modernize the reporting and disclosure of information by registered investment companies. In part, the final rules amend Regulation S-X and require standardized, enhanced disclosures about derivatives in investment company financial statements, as well as other amendments. The compliance date for the amendments to Regulation S-X is August 1, 2017. Management is currently evaluating the impact that the adoption of the amendments to Regulation S-X will have on the Fund’s financial statements and related disclosures.
12. Subsequent Events
The Fund has evaluated subsequent events through the issuance of the financial statements and determined that no events have occurred that require disclosure.
| Abbreviations | |
| Selected Portfolio | |
| ETF | Exchange Traded Fund |
| FHLB | Federal Home Loan Bank |
| FHLMC | Federal Home Loan Mortgage Corp. |
30 Semiannual Report
franklintempleton.com
TEMPLETON GLOBAL SMALLER COMPANIES FUND
Shareholder Information
Proxy Voting Policies and Procedures
The Fund’s investment manager has established Proxy Voting
Policies and Procedures (Policies) that the Fund uses to
determine how to vote proxies relating to portfolio securities.
Shareholders may view the Fund’s complete Policies online at
franklintempleton.com. Alternatively, shareholders may request
copies of the Policies free of charge by calling the Proxy Group
collect at (954) 527-7678 or by sending a written request
to: Franklin Templeton Companies, LLC, 300 S.E. 2nd Street,
Fort Lauderdale, FL 33301, Attention: Proxy Group. Copies of
the Fund’s proxy voting records are also made available online
at franklintempleton.com and posted on the U.S. Securities and
Exchange Commission’s website at sec.gov and reflect the
most recent 12-month period ended June 30.
Quarterly Statement of Investments
The Fund files a complete statement of investments with the
U.S. Securities and Exchange Commission for the first and
third quarters for each fiscal year on Form N-Q. Shareholders
may view the filed Form N-Q by visiting the Commission’s
website at sec.gov. The filed form may also be viewed and
copied at the Commission’s Public Reference Room in
Washington, DC. Information regarding the operations of the
Public Reference Room may be obtained by calling (800)
SEC-0330.
franklintempleton.com
Semiannual Report 31
This page intentionally left blank.
Item 2. Code of Ethics.
(a) The Registrant has adopted a code of ethics that applies to its principal executive officers and principal financial and accounting officer.
(c) N/A
(d) N/A
(f) Pursuant to Item 12(a)(1), the Registrant is attaching as an exhibit a copy of its code of ethics that applies to its principal executive officers and principal financial and accounting officer.
Item 3. Audit Committee Financial Expert.
(a)(1) The Registrant has an audit committee financial expert serving on its audit committee.
(2) The audit committee financial expert is David W. Niemiec and he is "independent" as defined under the relevant Securities and Exchange Commission Rules and Releases.
Item 4. Principal Accountant Fees and Services. N/A
Item 5. Audit Committee of Listed Registrants. N/A
Item 6. Schedule of Investments. N/A
Item 7. Disclosure of Proxy Voting Policies and Procedures for Closed-End Management Investment Companies. N/A
Item 8. Portfolio Managers of Closed-End Management Investment Companies. N/A
Item 9. Purchases of Equity Securities by Closed-End Management Investment Company and Affiliated Purchasers. N/A
Item 10. Submission of Matters to a Vote of Security Holders.
There have been no changes to the procedures by which shareholders may recommend nominees to the Registrant's Board of Trustees that would require disclosure herein.
Item 11. Controls and Procedures.
(a) Evaluation of Disclosure Controls and Procedures. The Registrant maintains disclosure controls and procedures that are designed to ensure that information required to be disclosed in the Registrant’s filings under the Securities Exchange Act of 1934 and the Investment Company Act of 1940 is recorded, processed, summarized and reported within the periods specified in the rules and forms of the Securities and Exchange Commission. Such information is accumulated and communicated to the Registrant’s management, including its principal executive officer and principal financial officer, as appropriate, to allow timely decisions regarding required disclosure. The Registrant’s management, including the principal executive officer and the principal financial officer, recognizes that any set of controls and procedures, no matter how well designed and operated, can provide only reasonable assurance of achieving the desired control objectives.
Within 90 days prior to the filing date of this Shareholder Report on Form N-CSR, the Registrant had carried out an evaluation, under the supervision and with the participation of the Registrant’s management, including the Registrant’s principal executive officer and the Registrant’s principal financial officer, of the effectiveness of the design and operation of the Registrant’s disclosure controls and procedures. Based on such evaluation, the Registrant’s principal executive officer and principal financial officer concluded that the Registrant’s disclosure controls and procedures are effective.
(b) Changes in Internal Controls. There have been no changes in the Registrant’s internal controls or in other factors that could materially affect the internal controls over financial reporting subsequent to the date of their evaluation in connection with the preparation of this Shareholder Report on Form N-CSR.
Item 12. Exhibits.
(a)(1) Code of Ethics
(a)(2) Certifications pursuant to Section 302 of the Sarbanes-Oxley Act of 2002 of Laura F. Fergerson, Chief Executive Officer - Finance and Administration, and Mark H. Otani, Chief Financial Officer and Chief Accounting Officer
(b) Certifications pursuant to Section 906 of the Sarbanes-Oxley Act of 2002 of Laura F. Fergerson, Chief Executive Officer - Finance and Administration, and Mark H. Otani, Chief Financial Officer and Chief Accounting Officer
SIGNATURES
Pursuant to the requirements of the Securities Exchange Act of 1934 and the Investment Company Act of 1940, the registrant has duly caused this report to be signed on its behalf by the undersigned, thereunto duly authorized.
TEMPLETON GLOBAL SMALLER COMPANIES FUND
By /s/ Laura F. Fergerson
Laura F. Fergerson
Chief Executive Officer –
Finance and Administration
Date April 26, 2017
Pursuant to the requirements of the Securities Exchange Act of 1934 and the Investment Company Act of 1940, this report has been signed below by the following persons on behalf of the registrant and in the capacities and on the dates indicated.
By /s/ Laura F. Fergerson
Laura F. Fergerson
Chief Executive Officer –
Finance and Administration
Date April 26, 2017
By /s/ Mark H. Otani
Mark H. Otani
Chief Financial Officer and
Chief Accounting Officer
Date April 26, 2017