Exhibit 99.1
Annual Shareholder Meeting May 4, 2010 Safe Harbor Statement Discussions and statements in this presentation that are not statements of historical fact (including without limitation statements that include terms such as “will,” “may,” “should,” “believe,” “expect,” “anticipate,” “estimate,” “project”,“intend,” and “plan”) and statements regarding Citizens’ future financial and operating results, plans, objectives, expectations and intentions, are forward-looking statements that involve risks and uncertainties, many of which are beyond Citizens’ control or are subject to change. No forward -looking statement is a guarantee of future performance and actual results could differ materially. Factors that could cause or contribute to such differences include, without limitation, risks and uncertainties detailed from time to time in Citizens’ filings with the Securities and Exchange Commission. Other factors not currently anticipated may also materially and adversely affect Citizens’ results of operations, cash flows, financial position and prospects. There can be no assurance that future results will meet expectations. While Citizens believes that the forward-looking statements in this presentation are reasonable, you should not place undue reliance on any forward-looking statement. In addition, these statements speak only as of the date made. Citizens does not undertake, and expressly disclaims any obligation to update or alter any statements, whether as a result of new information, future events or otherwise, except as required by applicable law. |
1
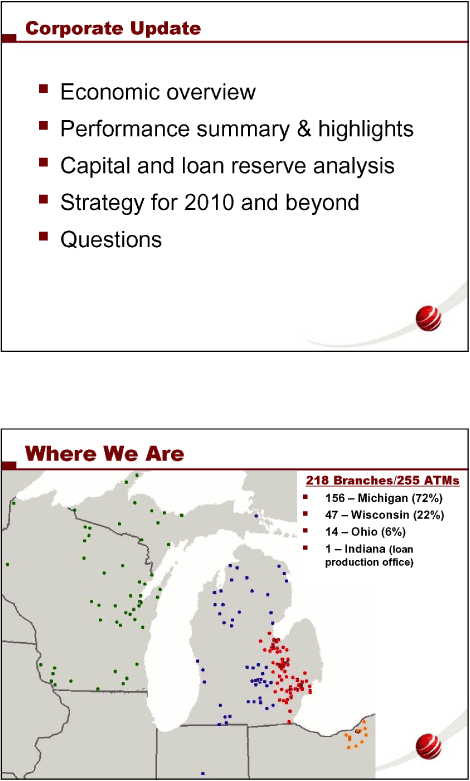
Corporate Update Economic overview Performance summary & highlights Capital and loan reserve analysis Strategy for 2010 and beyond Questions Where We Are 218 Branches/255 ATMs 156 — Michigan (72%) 47 — Wisconsin (22%) 14 — Ohio (6%) 1 — Indiana (loan production office) |
2
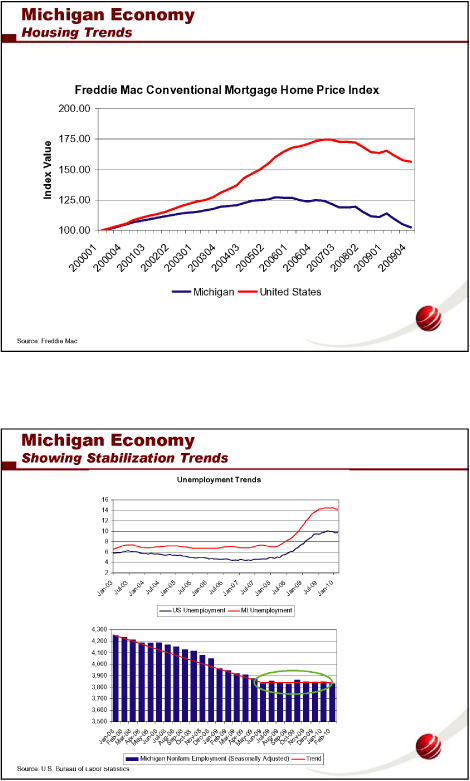
Michigan Economy Housing Trends Freddie Mac Conventional Mortgage Home Price Index 200.00 175.00 Value 150.00 Index 125.00 100.00 1 2 0 3 0 2 0 3 0 1 0 2 0 1 0 4 000 00040 1 03040 4 050 07030 8 0 9 2 0 2 0 2 0 2002200301 2 0 2 0 2 0 2006200604 2 0 2 0 20092 0 Michigan United States Source: Freddie Mac 5 Michigan Economy Showing Stabilization Trends Unemployment Trends 16 14 12 10 8 6 4 2 7 - - 03 — 03 — 04 — 0 4 — 05 — 05 - 06 — 06 — 07 — 08 — 08 — 09 - 0 9 — 10 Jul n — 0 J an J an Jul Jan J ul Jan Ju l J a Jul J an Jul J an Jul Jan US Unemployment MI Unemployment 4,300 4,200 4,100 4,000 3,900 3,800 3,700 3,600 3,500 8 8 8 8 8 9 9 9 - - 0 0 8 — 0- 0 8- 0- 0 80808 090 9 — 0909- 09- 0- 0 — 10- 10 b — r — 0 — 0v — 08 c — 08 b - r — 0r — 09 — 09 v — 09 c — 09 J an F eM aAp r J unJu l O ctNo Jan — F eM aA p Jun — Jul OctN o Jan Feb M ay Aug — Sep — De M ay Au g Se p D e Michigan Nonfarm Employment (Seasonally Adjusted) Trend Source: U.S. Bureau of Labor Statistics 6 3 |
3
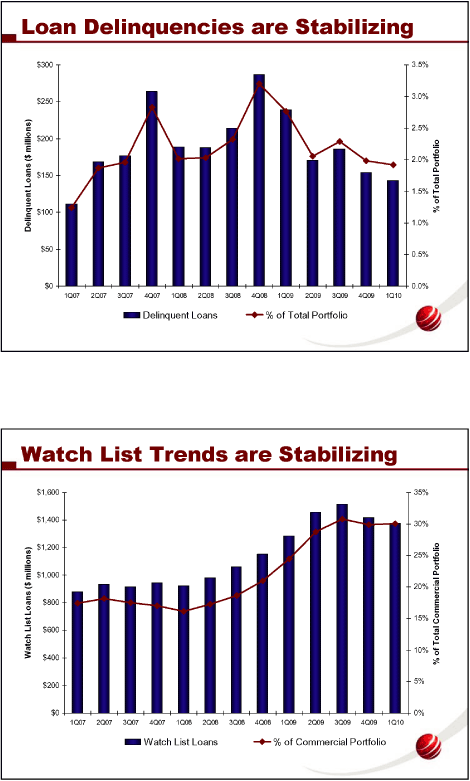
Loan Delinquencies are Stabilizing $300 3.5% 3.0% $250 millions) 2.5% $200 Portfolio $ ( 2.0% Loans $150 1.5% Delinquent % of Total $100 1.0% $50 0.5% $0 0.0% 1Q07 2Q07 3Q07 4Q07 1Q08 2Q08 3Q08 4Q08 1Q09 2Q09 3Q09 4Q09 1Q10 Delinquent Loans % of Total Portfolio 7 Watch List Trends are Stabilizing $1,600 35% $1,400 30% $1,200 Portfolio millions) 25% $1,000 Commercial $ ( 20% Loans $800 List 15% $600 Watch 10% $400% of Total 5% $200 $0 0% 1Q07 2Q07 3Q07 4Q07 1Q08 2Q08 3Q08 4Q08 1Q09 2Q09 3Q09 4Q09 1Q10 Watch List Loans % of Commercial Portfolio 8 4 |
4
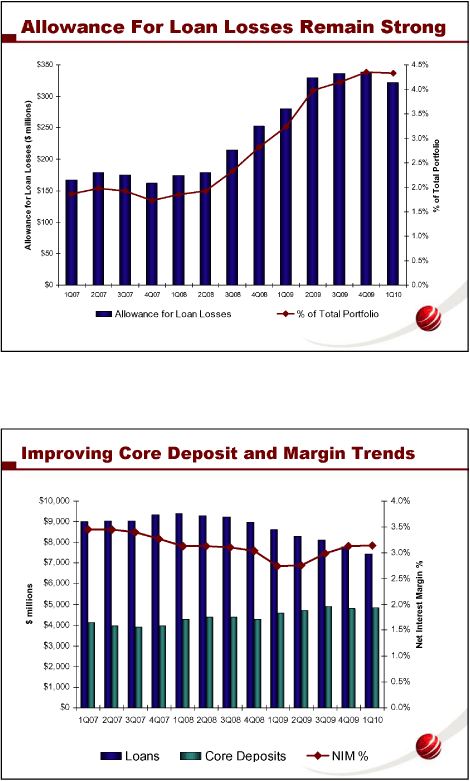
Allowance For Loan Losses Remain Strong $350 4.5% |
4.0% $300 millions) 3.5% $250 $3.0%( |
Portfolio Losses $200 2.5% |
2.0% for Loan $150 1.5% % of Total Allowance $100 1.0% $50 |
0.5% $0 0.0% |
1Q07 2Q07 3Q07 4Q07 1Q08 2Q08 3Q08 4Q08 1Q09 2Q09 3Q09 4Q09 1Q10 Allowance for Loan Losses % of Total Portfolio |
9 Improving Core Deposit and Margin Trends |
$10,000 4.0% $9,000 |
3.5% $8,000 3.0% $7,000% 2.5% Margin $6,000 millions $5,000 2.0% Interest $ $4,000 1.5% $3,000 Net 1.0% $2,000 0.5% $1,000 |
$0 0.0% 1Q07 2Q07 3Q07 4Q07 1Q08 2Q08 3Q08 4Q08 1Q09 2Q09 3Q09 4Q09 1Q10 Loans Core Deposits NIM % |
10 5 |
5
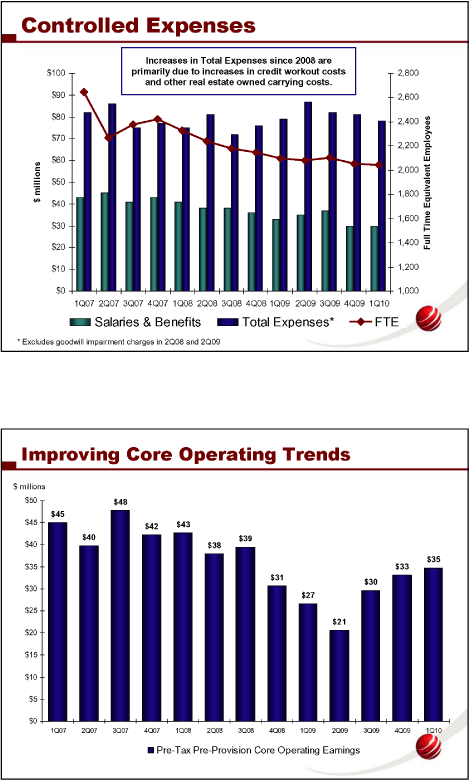
Controlled Expenses Increases in Total Expenses since 2008 are $100 primarily due to increases in credit workout costs 2,800 and other real estate owned carrying costs. |
$90 2,600 $80 2,400 Employees $70 2,200 $60 millions 2,000 Equivalent $50 1,800 $ $40 1,600 $30 1,400 |
$20 Full Time $10 1,200 |
$0 1,000 1Q07 2Q07 3Q07 4Q07 1Q08 2Q08 3Q08 4Q08 1Q09 2Q09 3Q09 4Q09 1Q10 Salaries & Benefits Total Expenses* FTE |
* Excludes goodwill impairment charges in 2Q08 and 2Q09 11 |
Improving Core Operating Trends $ millions |
$50 $48 $45 $45 $43 $42 |
$40 $39 $40 $38 $35 |
$35 $33 $31 $30 $30 $27 $25 $21 $20 $15 $10 $5 |
$0 1Q07 2Q07 3Q07 4Q07 1Q08 2Q08 3Q08 4Q08 1Q09 2Q09 3Q09 4Q09 1Q10 |
Pre-Tax Pre-Provision Core Operating Earnings 126 |
6
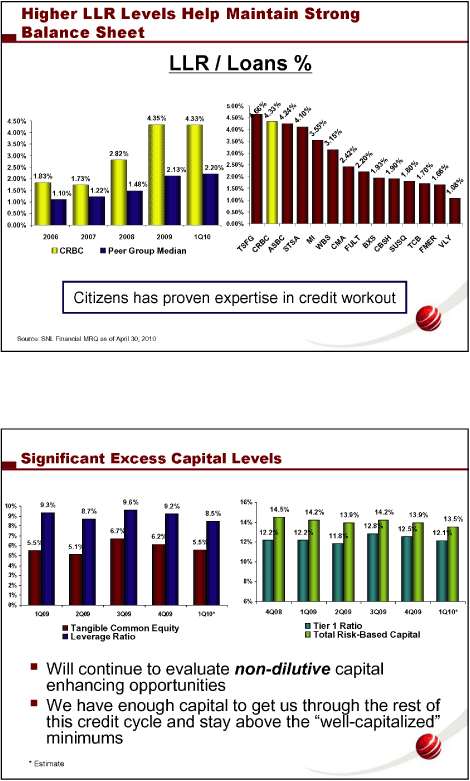
Higher LLR Levels Help Maintain Strong Balance Sheet LLR / Loans % |
5.00% 4.35% 4.33% 4.50% 4 . 66% 4 . 33% 4 . 24% 4.50% 4 . 10% |
4.00% 4.00% 3 . 55% 5% 3.50% 3.50% |
3 . 1 3.00% 2.82% 3.00% 2% |
2 . 4 0% 2.50% 2.20% 2.50% 2 . 2 3% 0 % |
2.13% 0 % 0 % 1 . 9 1 . 9 |
2.00% 1.83% 1.73% 2.00% 1 . 8 1 . 7 1 . 66% |
1.48% 1.50% 1.22% 1.50% |
1.10% 1 . 08% 1.00% 1.00% 0.50% 0.50% 0.00% 0.00% 2006 2007 2008 2009 1Q10 F G BC B C |
T S STSA M IW B SCMA FULTBXS CBSH SUSQTCB CRBC Peer Group Median C R A S FMERVLY |
Citizens has proven expertise in credit workout Source: SNL Financial MRQ as of April 30, 2010 |
13 Significant Excess Capital Levels |
9.3% 9.6% 16% 10% 9.2% 8.7% 14.5% 14.2% 14.2% |
9% 8.5% 13.9% 13.9% 13.5% |
14% 8% 12.8% |
6.7% 12.5% 12.2% 12.2% 12.1% |
7% 6.2% 11.8% 5.5% 5.5% 12% 6% 5.1% |
5% 10% |
4% 3% 8% |
2% 1% 6% |
0% 1Q09 2Q09 3Q09 4Q09 1Q10* 4Q08 1Q09 2Q09 3Q09 4Q09 1Q10* |
Tangible Common Equity Tier 1 Ratio Leverage Ratio Total Risk-Based Capital |
Will continue to evaluate non-dilutive capital enhancing opportunities We have enough capital to get us through the rest of this credit cycle and stay above the “well-capitalized” minimums |
* Estimate |
14 7 |
7
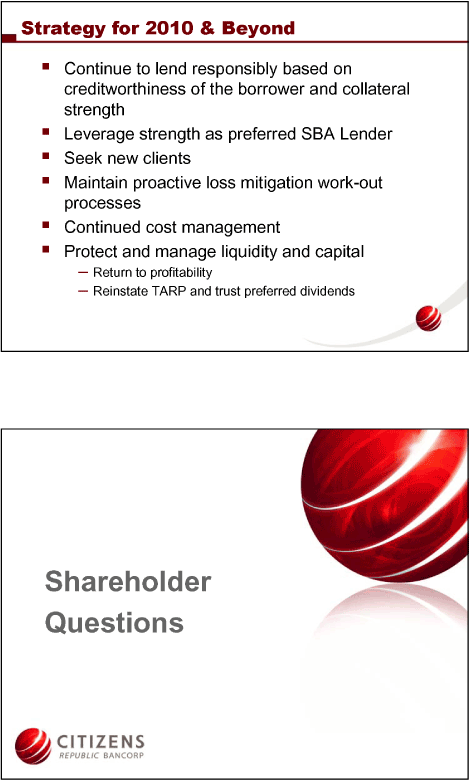
Strategy for 2010 & Beyond Continue to lend responsibly based on creditworthiness of the borrower and collateral strength Leverage strength as preferred SBA Lender Seek new clients Maintain proactive loss mitigation work-out processes Continued cost management Protect and manage liquidity and capital |
- Return to profitability - - Reinstate TARP and trust preferred dividends |
15 Shareholder Questions |
8