Exhibit 99.3
Roadmap to Front-end Peer Group Profitability
28 April 2008
© 2008 ASM
Proprietary Information

Safe Harbour Statements
All matters discussed in this document, except for any historical data, are forward-looking statements. Forward-looking statements involve risks and uncertainties that could cause actual results to differ materially from those in the forward-looking statements. These include, but are not limited to, economic conditions and trends in the semiconductor industry generally and the timing of the industry cycles specifically, currency fluctuations, the timing of significant orders, market acceptance of new products, competitive factors, litigation involving intellectual property, shareholder and other issues, commercial and economic disruption due to natural disasters, terrorist activity, armed conflict or political instability, epidemics and other risks indicated in the Company’s filings from time to time with the U.S. Securities and Exchange Commission. All statements are made as of the date provided and we assume no obligation nor intend to update or revise any forward-looking statements to reflect future developments or circumstances.
© 2008 ASM
Proprietary Information
April 2008
2 |
|
Agenda
Introduction
Current situation FE
Roadmap to peer profitability FE in 2009
Concluding remarks
Appendix
FE and BE convergence
Peer selection criteria
© 2008 ASM
Proprietary Information
April 2008
3 |
|
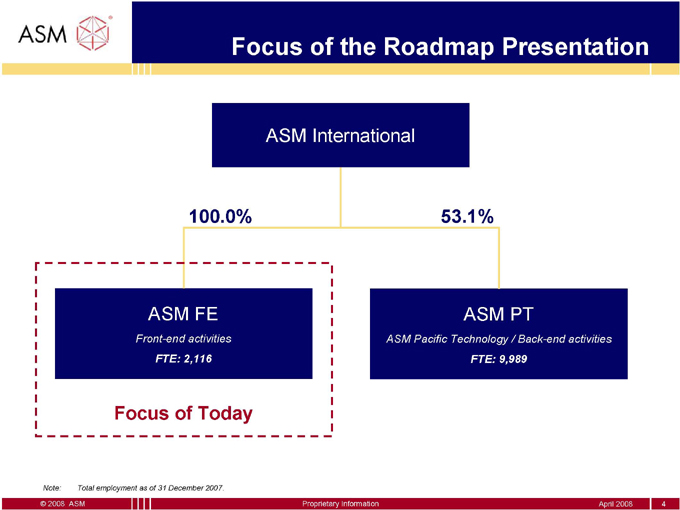
Focus of the Roadmap Presentation
ASM International
100.0%
53.1%
ASM FE ASM PT
Front-end activities ASM Pacific Technology / Back-end activities
FTE: 2,116 FTE: 9,989
Focus of Today
Note: Total employment as of 31 December 2007.
© 2008 ASM Proprietary Information April 2008 4
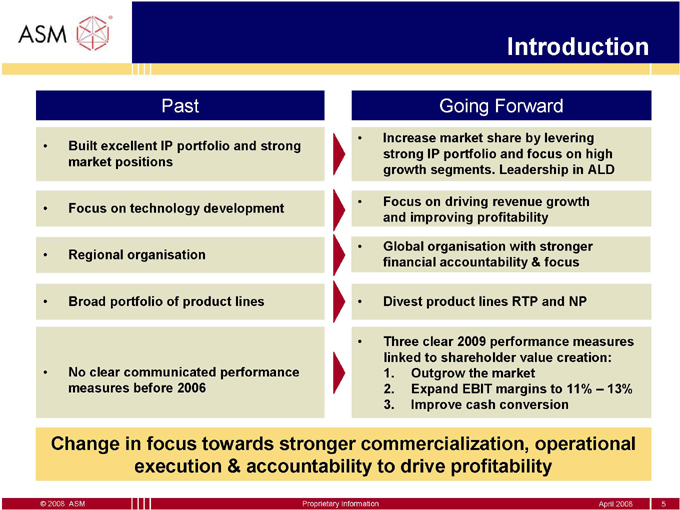
Past
Built excellent IP portfolio and strong market positions
Focus on technology development
Regional organisation
Broad portfolio of product lines
No clear communicated performance measures before 2006
Introduction
Going Forward
Increase market share by levering strong IP portfolio and focus on high growth segments. Leadership in ALD
Focus on driving revenue growth and improving profitability
Global organisation with stronger financial accountability & focus
Divest product lines RTP and NP
Three clear 2009 performance measures linked to shareholder value creation:
1. Outgrow the market
2. Expand EBIT margins to 11% – 13%
3. Improve cash conversion
Change in focus towards stronger commercialization, operational execution & accountability to drive profitability
© 2008 ASM
Proprietary Information
April 2008
5 |
|
Agenda
Introduction
Current situation FE
Roadmap to peer profitability FE in 2009
Concluding remarks
Appendix
FE and BE convergence
Peer selection criteria
© 2008 ASM
Proprietary Information
April 2008
6 |
|
Strong Technology and
Leading IP Portfolio…
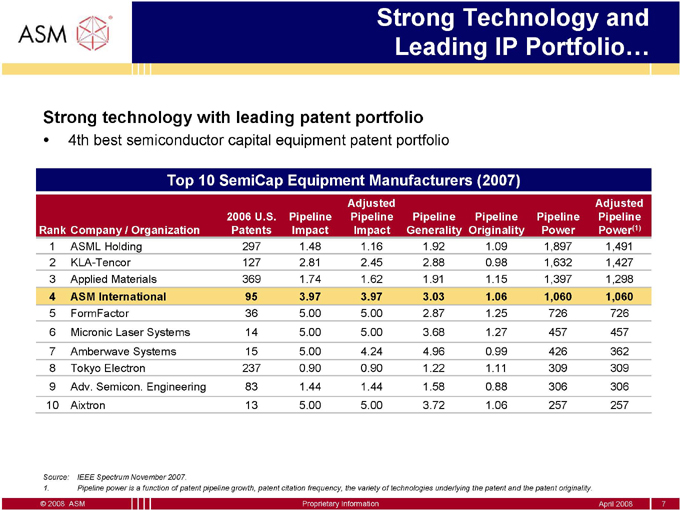
Strong technology with leading patent portfolio
• 4th best semiconductor capital equipment patent portfolio
Top 10 SemiCap Equipment Manufacturers (2007)
Adjusted Adjusted 2006 U.S. Pipeline Pipeline Pipeline Pipeline Pipeline Pipeline Rank Company / Organization Patents Impact Impact Generality Originality Power Power(1)
1 |
| ASML Holding 297 1.48 1.16 1.92 1.09 1,897 1,491 |
2 |
| KLA-Tencor 127 2.81 2.45 2.88 0.98 1,632 1,427 |
3 |
| Applied Materials 369 1.74 1.62 1.91 1.15 1,397 1,298 |
4 |
| ASM International 95 3.97 3.97 3.03 1.06 1,060 1,060 |
5 |
| FormFactor 36 5.00 5.00 2.87 1.25 726 726 |
6 |
| Micronic Laser Systems 14 5.00 5.00 3.68 1.27 457 457 |
7 |
| Amberwave Systems 15 5.00 4.24 4.96 0.99 426 362 |
8 |
| Tokyo Electron 237 0.90 0.90 1.22 1.11 309 309 |
9 Adv. Semicon. Engineering 83 1.44 1.44 1.58 0.88 306 306
10 Aixtron 13 5.00 5.00 3.72 1.06 257 257
Source: IEEE Spectrum November 2007.
1. Pipeline power is a function of patent pipeline growth, patent citation frequency, the variety of technologies underlying the patent and the patent originality.
© 2008 ASM Proprietary Information April 2008 7
… with Excellent Market Positions and
Worldwide Sales
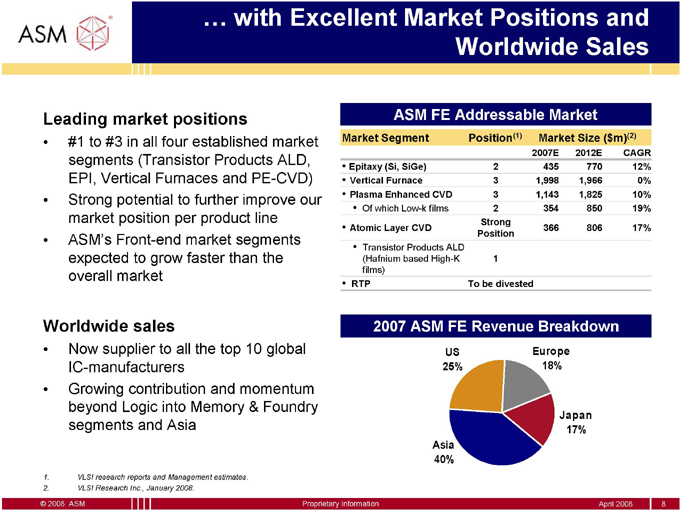
Leading market positions
#1 to #3 in all four established market segments (Transistor Products ALD, EPI, Vertical Furnaces and PE-CVD)
Strong potential to further improve our market position per product line
ASM’s Front-end market segments expected to grow faster than the overall market
Worldwide sales
• Now supplier to all the top 10 global IC-manufacturers
• Growing contribution and momentum beyond Logic into Memory & Foundry segments and Asia
1. VLSI research reports and Management estimates.
2. VLSI Research Inc., January 2008.
ASM FE Addressable Market
Market Segment Position(1) Market Size ($m)(2)
2007E 2012E CAGR
• Epitaxy (Si, SiGe) 2 435 770 12%
• Vertical Furnace 3 1,998 1,966 0%
• Plasma Enhanced CVD 3 1,143 1,825 10%
• Of which Low-k films 2 354 850 19% Strong
• Atomic Layer CVD 366 806 17% Position
• Transistor Products ALD
(Hafnium based High-K 1 films)
• RTP To be divested
2007 ASM FE Revenue Breakdown
US Europe 25% 18%
Japan
17%
Asia
40%
© 2008 ASM
Proprietary Information April 2008
8 |
|
We Have Made Significant Financial and
Operational Improvements…
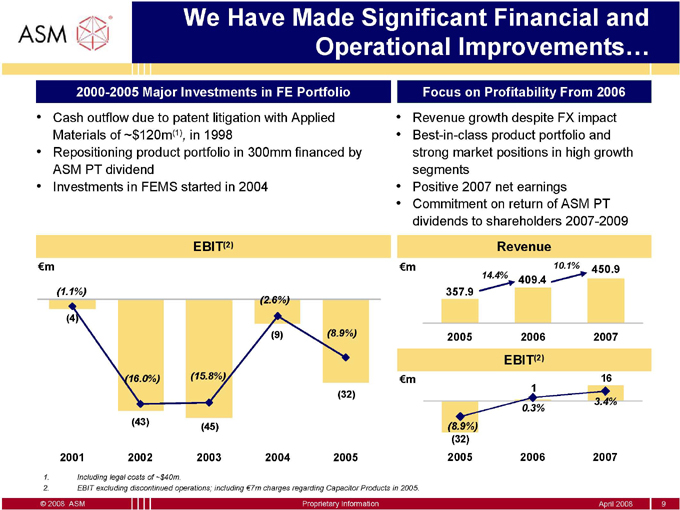
2000-2005 Major Investments in FE Portfolio
Focus on Profitability From 2006
Cash outflow due to patent litigation with Applied Materials of ~$120m(1), in 1998
Repositioning product portfolio in 300mm financed by ASM PT dividend
Investments in FEMS started in 2004
Revenue growth despite FX impact
Best-in-class product portfolio and strong market positions in high growth segments
Positive 2007 net earnings
Commitment on return of ASM PT dividends to shareholders 2007-2009
EBIT(2) Revenue
€m €m 10.1% 450.9
14.4%
409.4
(1.1%) 357.9
(2.6%)
(4) |
|
(9) |
| (8.9%) 2005 2006 2007 |
EBIT(2)
(16.0%) (15.8%) €m 16 1 (32) 3.4%
0.3%
(43) |
|
(45) |
| (8.9%) |
(32) |
|
2001 2002 2003 2004 2005 2005 2006 2007
Including legal costs of ~$40m.
EBIT excluding discontinued operations; including €7m charges regarding Capacitor Products in 2005.
© 2008 ASM
Proprietary Information
April 2008
9
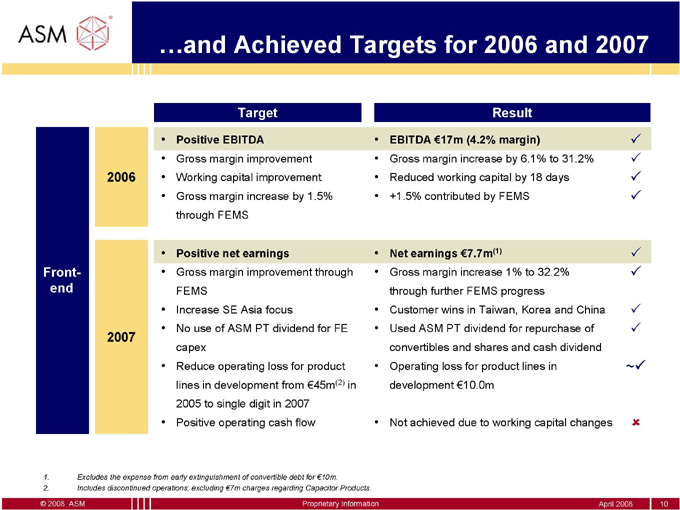
…and Achieved Targets for 2006 and 2007
Target
• Positive EBITDA
• Gross margin improvement 2006 • Working capital improvement
• Gross margin increase by 1.5% through FEMS
• Positive net earnings
Front- • Gross margin improvement through end FEMS
• Increase SE Asia focus
2007 • No use of ASM PT dividend for FE capex
• Reduce operating loss for product lines in development from €45m(2) in 2005 to single digit in 2007
• Positive operating cash flow
Excludes the expense from early extinguishment of convertible debt for €10m.
Includes discontinued operations; excluding €7m charges regarding Capacitor Products.
Result
EBITDA €17m (4.2% margin) 333
Gross margin increase by 6.1% to 31.2% 333
Reduced working capital by 18 days 333
+1.5% contributed by FEMS 333
• Net earnings €7.7m(1) 33 3
• Gross margin increase 1% to 32.2% 33 3 through further FEMS progress
• Customer wins in Taiwan, Korea and China 33 3
• Used ASM PT dividend for repurchase of 33 3 convertibles and shares and cash dividend
• Operating loss for product lines in ~33 3 development €10.0m
• Not achieved due to working capital changes 33 3
© 2008 ASM
Proprietary Information
April 2008
10
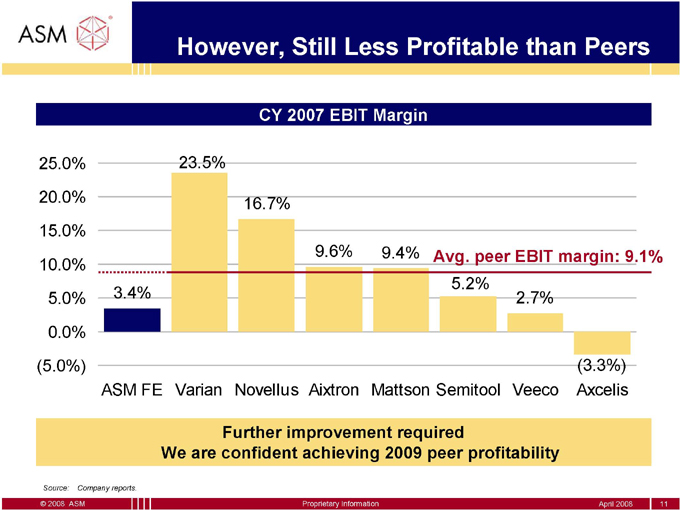
However, Still Less Profitable than Peers
CY 2007 EBIT Margin
25.0% 23.5%
20.0%
16.7%
15.0%
9.6% 9.4% Avg. peer EBIT margin: 9.1%
10.0%
5.2%
5.0% 3.4% 2.7%
0.0%
(5.0%) (3.3%) ASM FE Varian Novellus Aixtron Mattson Semitool Veeco Axcelis
Further improvement required
We are confident achieving 2009 peer profitability
Source: Company reports.
© 2008 ASM Proprietary Information April 2008 11
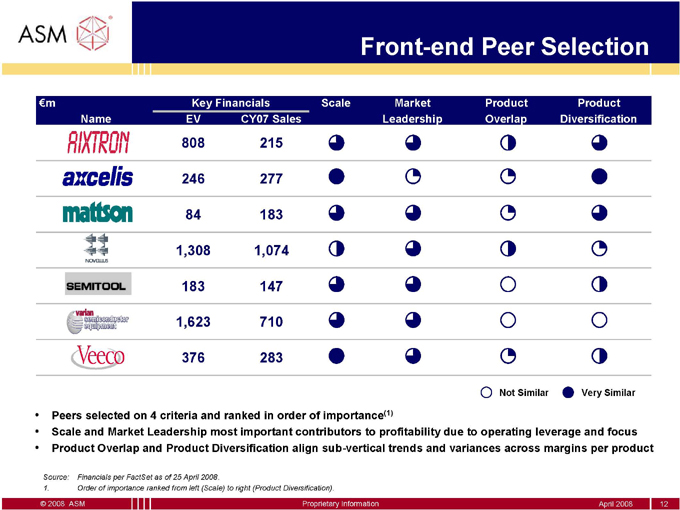
Front-end Peer Selection
€m Key Financials Scale Market Product Product Name EV CY07 Sales Leadership Overlap Diversification
808 215
246 277
84 183 1,308 1,074 183 147 1,623 710 376 283
Not Similar Very Similar
Peers selected on 4 criteria and ranked in order of importance(1)
Scale and Market Leadership most important contributors to profitability due to operating leverage and focus
Product Overlap and Product Diversification align sub-vertical trends and variances across margins per product
Source: Financials per FactSet as of 25 April 2008.
1. Order of importance ranked from left (Scale) to right (Product Diversification).
© 2008 ASM Proprietary Information April 2008 12

Agenda
Introduction
Current situation FE
Roadmap to peer profitability FE in 2009
Concluding remarks
Appendix
FE and BE convergence
Peer selection criteria
© 2008 ASM
Proprietary Information
April 2008
13
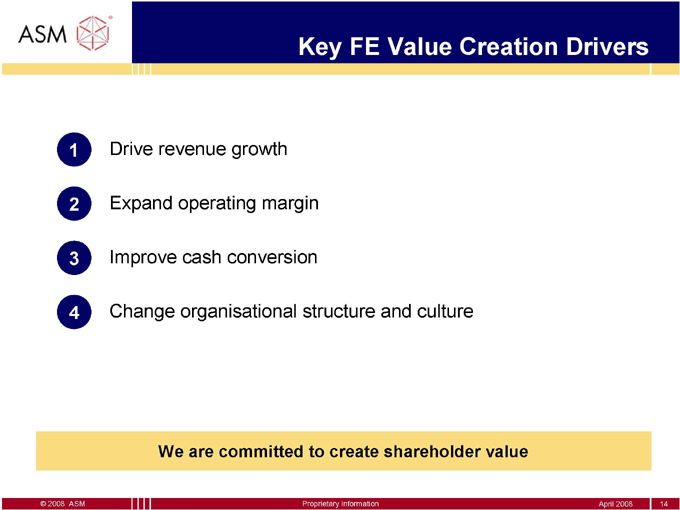
Key FE Value Creation Drivers
1. Drive revenue growth
2. Expand operating margin
3. Improve cash conversion
4. Change organisational structure and culture
We are committed to create shareholder value
© 2008 ASM
Proprietary Information
April 2008
14
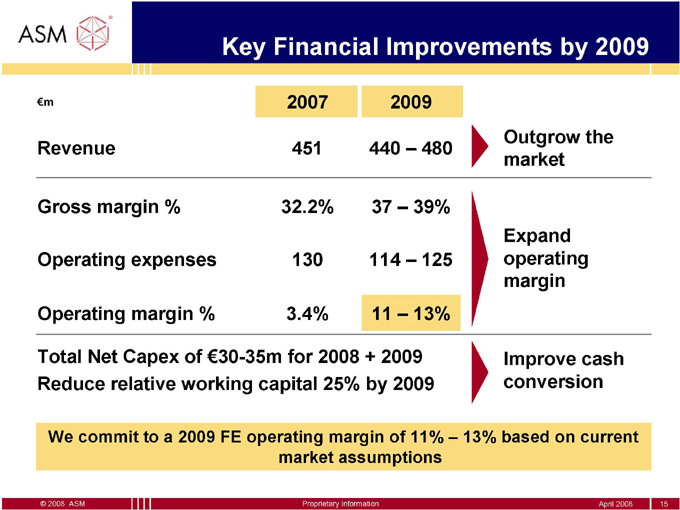
Key Financial Improvements by 2009
€m 2007 2009
Outgrow the Revenue 451 440 – 480 market
Gross margin % 32.2% 37 – 39%
Expand Operating expenses 130 114 – 125 operating margin
Operating margin % 3.4% 11 – 13%
Total Net Capex of €30-35m for 2008 + 2009 Improve cash Reduce relative working capital 25% by 2009 conversion
We commit to a 2009 FE operating margin of 11% – 13% based on current market assumptions
© 2008 ASM
Proprietary Information
April 2008
15
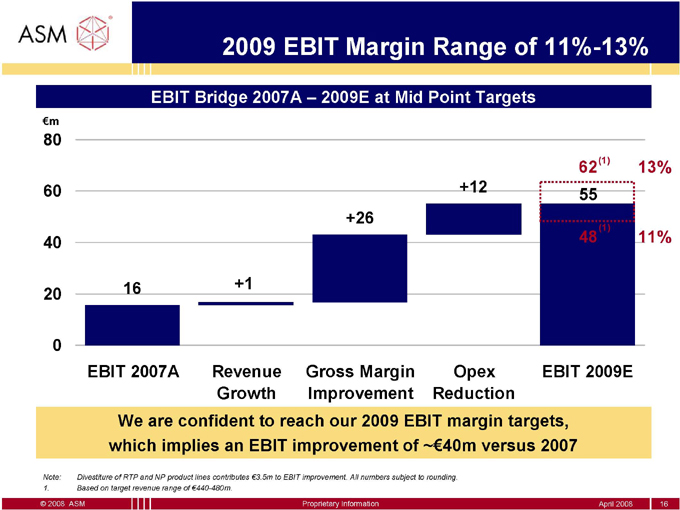
2009 EBIT Margin Range of 11%-13%
EBIT Bridge 2007A – 2009E at Mid Point Targets
€m
80
(1) |
|
62 13%
60 +12
55 +26 (1)
40 48 11%
16 +1 20
0
EBIT 2007A Revenue Gross Margin Opex EBIT 2009E Growth Improvement Reduction
We are confident to reach our 2009 EBIT margin targets, which implies an EBIT improvement of ~€40m versus 2007
Note: Divestiture of RTP and NP product lines contributes €3.5m to EBIT improvement. All numbers subject to rounding.
1. Based on target revenue range of €440-480m.
© 2008 ASM Proprietary Information April 2008 16
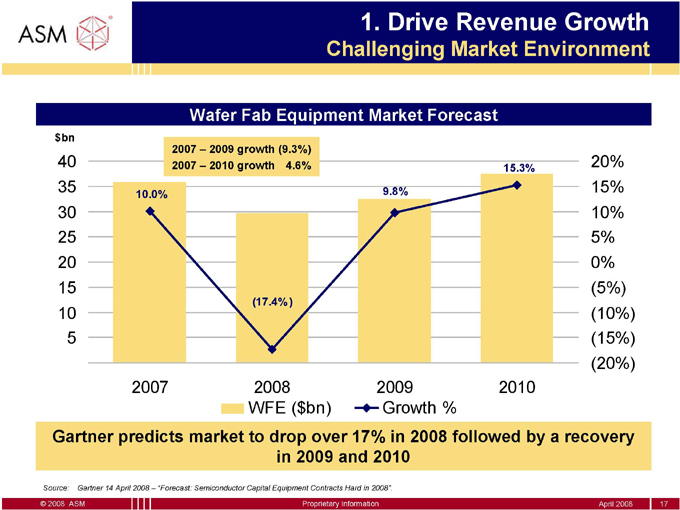
1. Drive Revenue Growth
Challenging Market Environment
Wafer Fab Equipment Market Forecast
$bn
2007 – 2009 growth (9.3%)
40 2007 – 2010 growth 4.6% 15.3% 20%
35 9.8% 15%
10.0%
30 10%
25 5%
20 0%
15 (5%)
(17.4% )
10 (10%)
5 |
| (15%) |
(20%)
2007 2008 2009 2010
WFE ($bn) Growth %
Gartner predicts market to drop over 17% in 2008 followed by a recovery in 2009 and 2010
Source: Gartner 14 April 2008 – “Forecast: Semiconductor Capital Equipment Contracts Hard in 2008”.
© 2008 ASM Proprietary Information April 2008 17
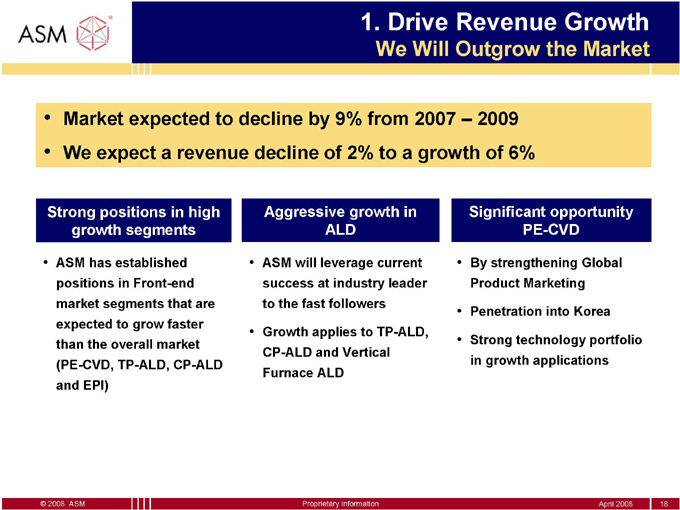
1. Drive Revenue Growth
We Will Outgrow the Market
Market expected to decline by 9% from 2007 – 2009
We expect a revenue decline of 2% to a growth of 6%
Strong positions in high growth segments
ASM has established positions in Front-end market segments that are expected to grow faster than the overall market (PE-CVD, TP-ALD, CP-ALD and EPI)
Aggressive growth in ALD
ASM will leverage current success at industry leader to the fast followers
Growth applies to TP-ALD, CP-ALD and Vertical Furnace ALD
Significant opportunity PE-CVD
By strengthening Global Product Marketing
Penetration into Korea
Strong technology portfolio in growth applications
© 2008 ASM
Proprietary Information
April 2008
18
1. Change of
Sales Organization
2. Appointment
VP Global Sales & Service
3 |
| Focus and Penetration |
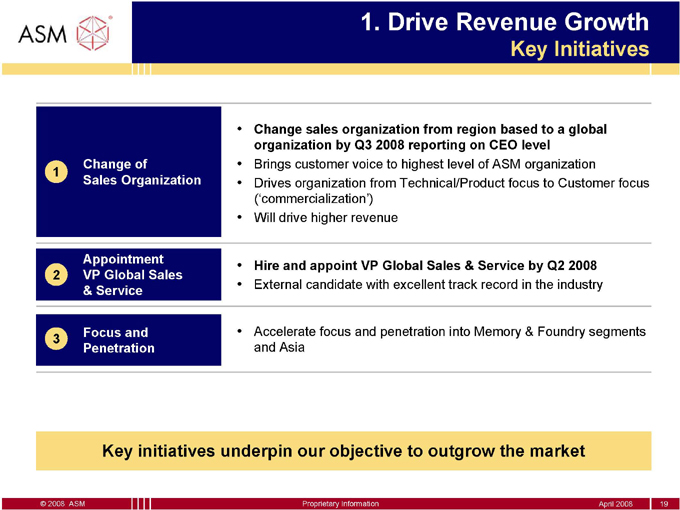
1. Drive Revenue Growth
Key Initiatives
Change sales organization from region based to a global organization by Q3 2008 reporting on CEO level
Brings customer voice to highest level of ASM organization
Drives organization from Technical/Product focus to Customer focus (‘commercialization’)
Will drive higher revenue
Hire and appoint VP Global Sales & Service by Q2 2008
External candidate with excellent track record in the industry
Accelerate focus and penetration into Memory & Foundry segments and Asia
Key initiatives underpin our objective to outgrow the market
© 2008 ASM
Proprietary Information
April 2008
19
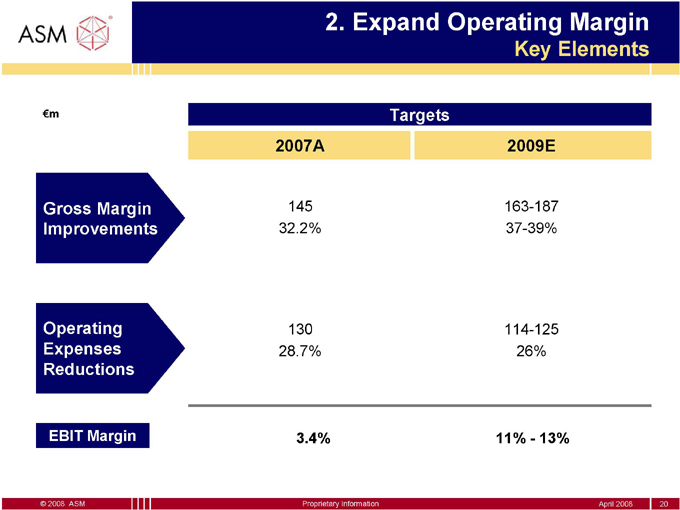
2. Expand Operating Margin
Key Elements
€m Targets
2007A 2009E
Gross Margin 145 163-187 Improvements 32.2% 37-39%
Operating 130 114-125 Expenses 28.7% 26% Reductions
EBIT Margin
3.4%
11%—13%
© 2008 ASM
Proprietary Information
April 2008
20
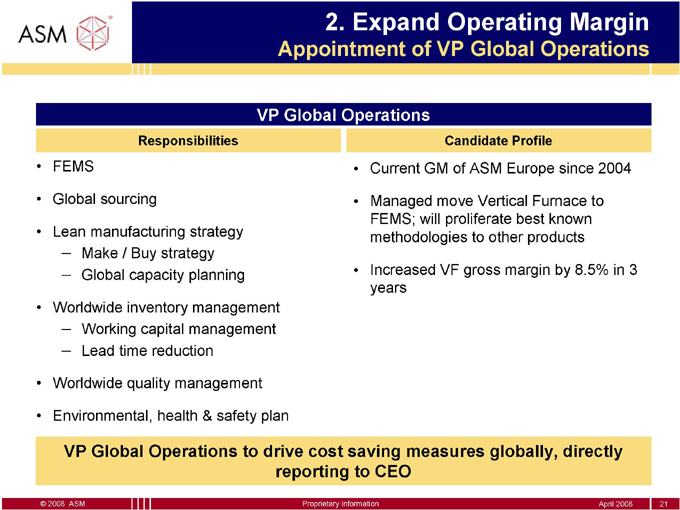
2. Expand Operating Margin
Appointment of VP Global Operations
VP Global Operations
Responsibilities
FEMS
Global sourcing
Lean manufacturing strategy
Make / Buy strategy
Global capacity planning
Worldwide inventory management
Working capital management
Lead time reduction
Worldwide quality management
Environmental, health & safety plan
•
•
•
Candidate Profile
Current GM of ASM Europe since 2004
Managed move Vertical Furnace to FEMS; will proliferate best known methodologies to other products
Increased VF gross margin by 8.5% in 3 years
VP Global Operations to drive cost saving measures globally, directly reporting to CEO
© 2008 ASM
Proprietary Information
April 2008
21
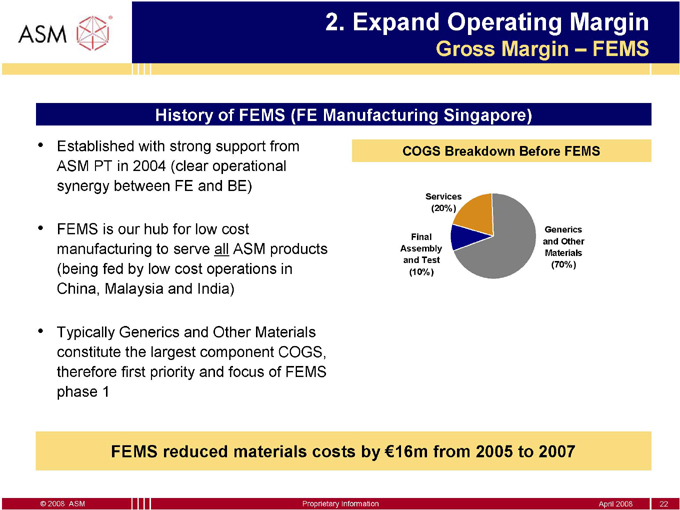
2. Expand Operating Margin
Gross Margin – FEMS
History of FEMS (FE Manufacturing Singapore)
Established with strong support from ASM PT in 2004 (clear operational synergy between FE and BE)
FEMS is our hub for low cost manufacturing to serve all ASM products (being fed by low cost operations in China, Malaysia and India)
Typically Generics and Other Materials constitute the largest component COGS, therefore first priority and focus of FEMS phase 1
COGS Breakdown Before FEMS
Services (20% )
Generics Final and Other Assembly Materials and Test (70% ) (10% )
FEMS reduced materials costs by €16m from 2005 to 2007
© 2008 ASM
Proprietary Information
April 2008
22
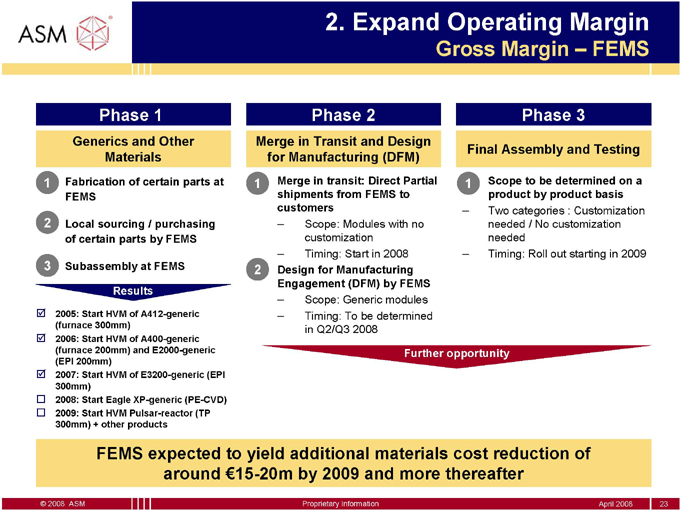
Phase 1
Generics and Other Materials
• Fabrication of certain parts at FEMS
• Local sourcing / purchasing of certain parts by FEMS
• Subassembly at FEMS
Results
2005: Start HVM of A412-generic (furnace 300mm)
2006: Start HVM of A400-generic (furnace 200mm) and E2000-generic (EPI 200mm)
2007: Start HVM of E3200-generic (EPI 300mm)
2008: Start Eagle XP-generic (PE-CVD)
2009: Start HVM Pulsar-reactor (TP 300mm) + other products
2. Expand Operating Margin
Gross Margin – FEMS
•2 |
| Design for Manufacturing |
Engagement (DFM) by FEMS
– Scope: Generic modules
– Timing: To be determined
in Q2/Q3 2008
Further opportunity
FEMS expected to yield additional materials cost reduction of around €15-20m by 2009 and more thereafter
© 2008 ASM
Proprietary Information
April 2008
23
Phase 2
Merge in Transit and Design for Manufacturing (DFM)
•1 |
| Merge in transit: Direct Partial shipments from FEMS to customers |
– Scope: Modules with no customization
– Timing: Start in 2008
Phase 3
Final Assembly and Testing
•1 |
| Scope to be determined on a product by product basis |
– Two categories : Customization needed / No customization needed
– Timing: Roll out starting in 2009
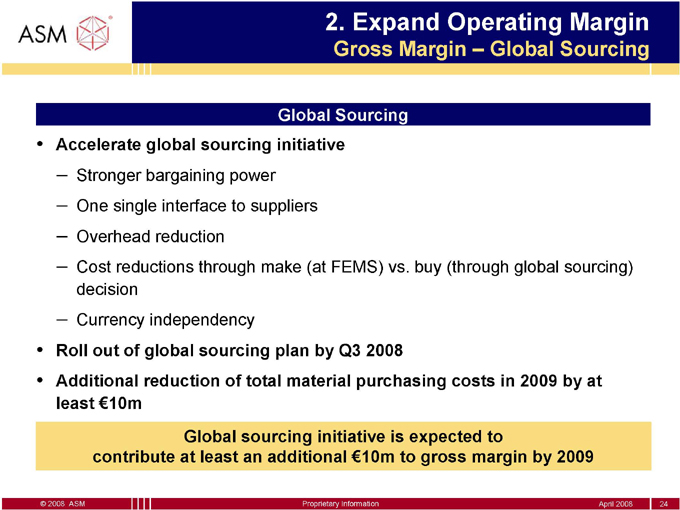
2. Expand Operating Margin
Gross Margin – Global Sourcing
Global Sourcing
Accelerate global sourcing initiative
Stronger bargaining power
One single interface to suppliers
Overhead reduction
Cost reductions through make (at FEMS) vs. buy (through global sourcing) decision
Currency independency
Roll out of global sourcing plan by Q3 2008
Additional reduction of total material purchasing costs in 2009 by at least €10m
Global sourcing initiative is expected to contribute at least an additional €10m to gross margin by 2009
© 2008 ASM
Proprietary Information
April 2008
24
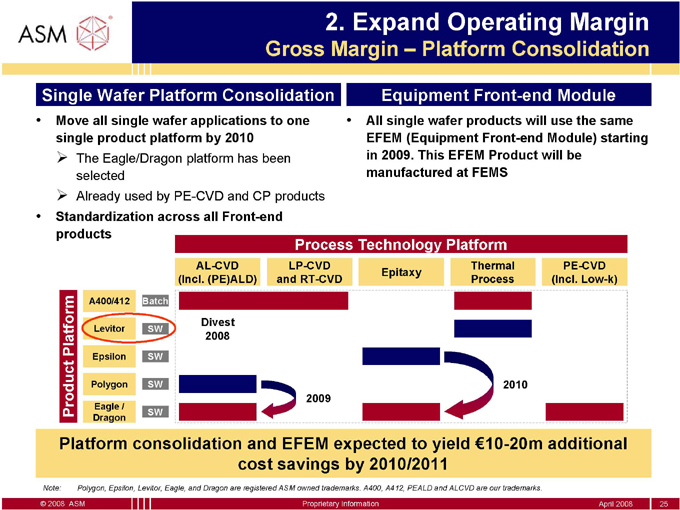
2. Expand Operating Margin
Gross Margin – Platform Consolidation
Single Wafer Platform Consolidation Equipment Front-end Module
• Move all single wafer applications to one • All single wafer products will use the same single product platform by 2010 EFEM (Equipment Front-end Module) starting
3 |
| The Eagle/Dragon platform has been in 2009. This EFEM Product will be selected manufactured at FEMS |
3 |
| Already used by PE-CVD and CP products |
• Standardization across all Front-end products
Process Technology Platform
AL-CVD LP-CVD Thermal PE-CVD Epitaxy (Incl. (PE)ALD) and RT-CVD Process (Incl. Low-k)
A400/412 Batch
Divest
Platform Levitor SW 2008 Epsilon SW
Polygon SW 2010
2009
Eagle /
Product SW
Dragon
Platform consolidation and EFEM expected to yield €10-20m additional cost savings by 2010/2011
Note: Polygon, Epsilon, Levitor, Eagle, and Dragon are registered ASM owned trademarks. A400, A412, PEALD and ALCVD are our trademarks.
© 2008 ASM Proprietary Information April 2008 25
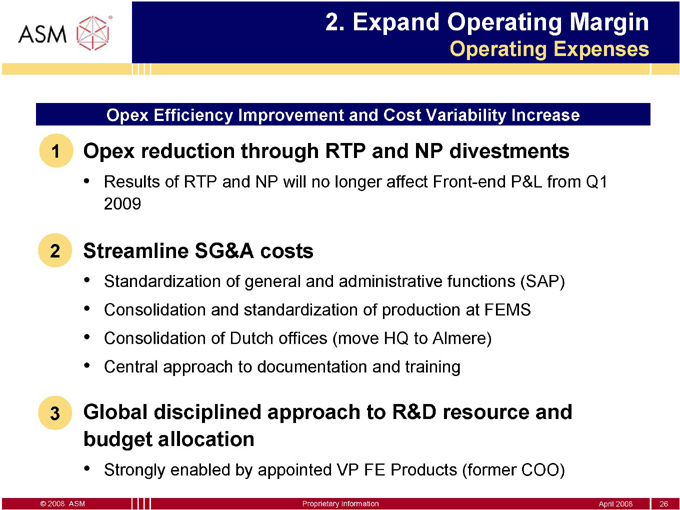
2. Expand Operating Margin
Operating Expenses
Opex Efficiency Improvement and Cost Variability Increase
1 |
| Opex reduction through RTP and NP divestments |
Results of RTP and NP will no longer affect Front-end P&L from Q1 2009
2 |
| Streamline SG&A costs |
Standardization of general and administrative functions (SAP)
Consolidation and standardization of production at FEMS
Consolidation of Dutch offices (move HQ to Almere)
Central approach to documentation and training
3 |
| Global disciplined approach to R&D resource and |
budget allocation
• Strongly enabled by appointed VP FE Products (former COO)
© 2008 ASM
Proprietary Information
April 2008
26
2. Expand Operating Margin
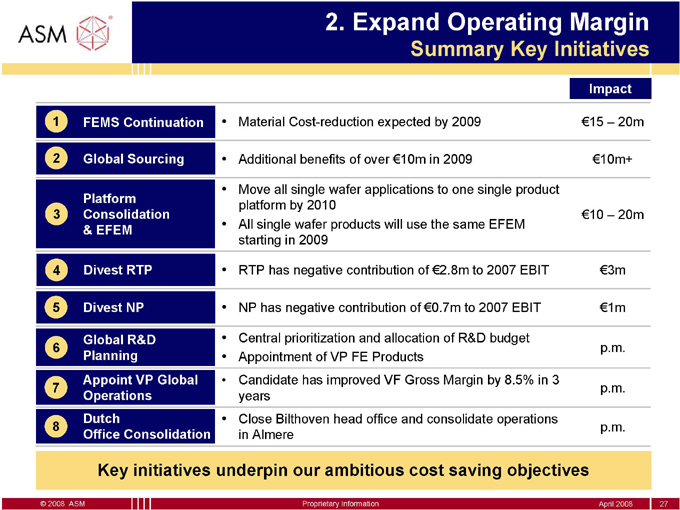
Summary Key Initiatives
Impact
1 |
| FEMS Continuation • Material Cost-reduction expected by 2009 €15 – 20m |
2 |
| Global Sourcing • Additional benefits of over €10m in 2009 €10m+ |
Platform • Move all single wafer applications to one single product
3 |
| Consolidation platform by 2010 €10 – 20m |
• All single wafer products will use the same EFEM
& EFEM starting in 2009
4 |
| Divest RTP • RTP has negative contribution of €2.8m to 2007 EBIT €3m |
5 |
| Divest NP • NP has negative contribution of €0.7m to 2007 EBIT €1m |
6 Global R&D • Central prioritization and allocation of R&D budget p.m. Planning • Appointment of VP FE Products Appoint VP Global • Candidate has improved VF Gross Margin by 8.5% in 3 7 p.m.
Operations years
Dutch • Close Bilthoven head office and consolidate operations
8 |
| p.m. |
Office Consolidation in Almere
Key initiatives underpin our ambitious cost saving objectives
© 2008 ASM
Proprietary Information
April 2008
27
2. Expand Operating Margin
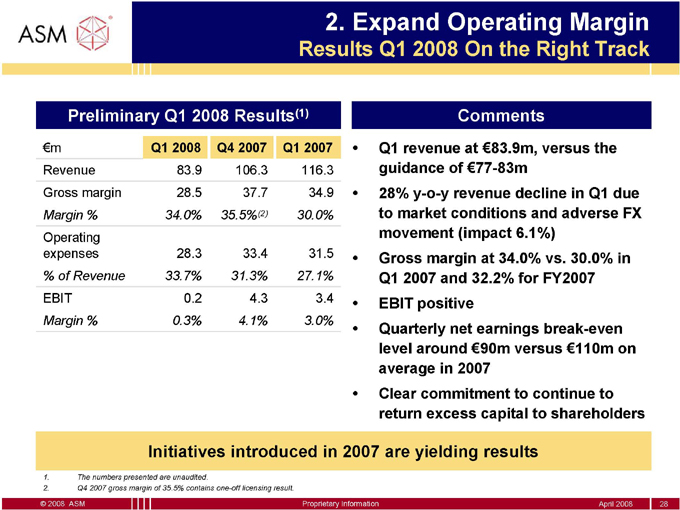
Results Q1 2008 On the Right Track
Preliminary Q1 2008 Results(1)
€m Q1 2008 Q4 2007 Q1 2007
Revenue 83.9 106.3 116.3
Gross margin 28.5 37.7 34.9
Margin % 34.0% 35.5%(2) 30.0%
Operating expenses 28.3 33.4 31.5
% of Revenue 33.7% 31.3% 27.1%
EBIT 0.2 4.3 3.4
Margin % 0.3% 4.1% 3.0%
Comments
Q1 revenue at €83.9m, versus the guidance of €77-83m
28% y-o-y revenue decline in Q1 due to market conditions and adverse FX movement (impact 6.1%)
Gross margin at 34.0% vs. 30.0% in Q1 2007 and 32.2% for FY2007
EBIT positive
Quarterly net earnings break-even level around €90m versus €110m on average in 2007
Clear commitment to continue to return excess capital to shareholders
Initiatives introduced in 2007 are yielding results
The numbers presented are unaudited.
Q4 2007 gross margin of 35.5% contains one-off licensing result.
© 2008 ASM
Proprietary Information
April 2008
28
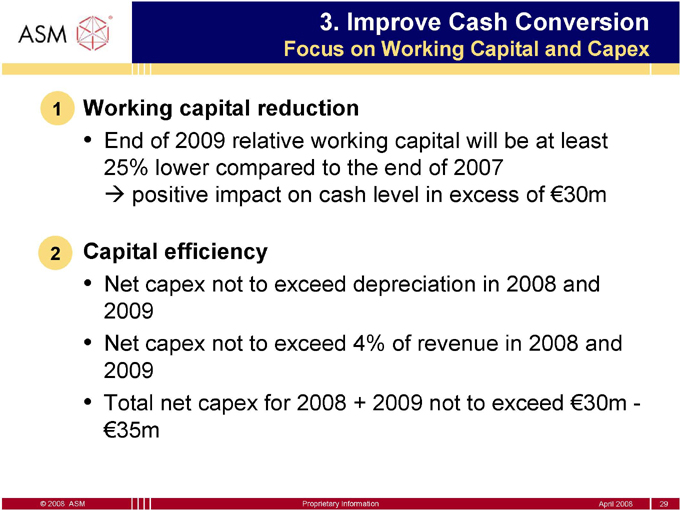
3. Improve Cash Conversion
Focus on Working Capital and Capex
1 |
| Working capital reduction |
End of 2009 relative working capital will be at least 25% lower compared to the end of 2007 3 positive impact on cash level in excess of €30m
2 |
| Capital efficiency |
Net capex not to exceed depreciation in 2008 and 2009
Net capex not to exceed 4% of revenue in 2008 and 2009
Total net capex for 2008 + 2009 not to exceed €30m—€35m
© 2008 ASM
Proprietary Information
April 2008
29
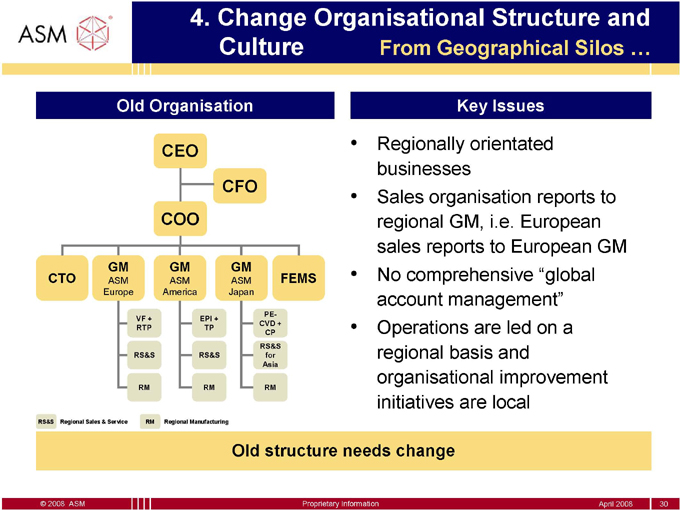
4. Change Organisational Structure and
Culture From Geographical Silos …
Old Organisation Key Issues
• Regionally orientated
CEO
businesses
CFO
• Sales organisation reports to COO regional GM, i.e. European sales reports to European GM
GM GM GM
CTO ASM ASM ASM FEMS • No comprehensive “global
Europe America Japan
account management”
PE-VF + EPI + CVD +
RTP TP • Operations are led on a
CP
RS&S
RS&S RS&S for regional basis and
Asia
organisational improvement
RM RM RM
initiatives are local
RS&S Regional Sales & Service RM Regional Manufacturing
Old structure needs change
© 2008 ASM
Proprietary Information
April 2008
30
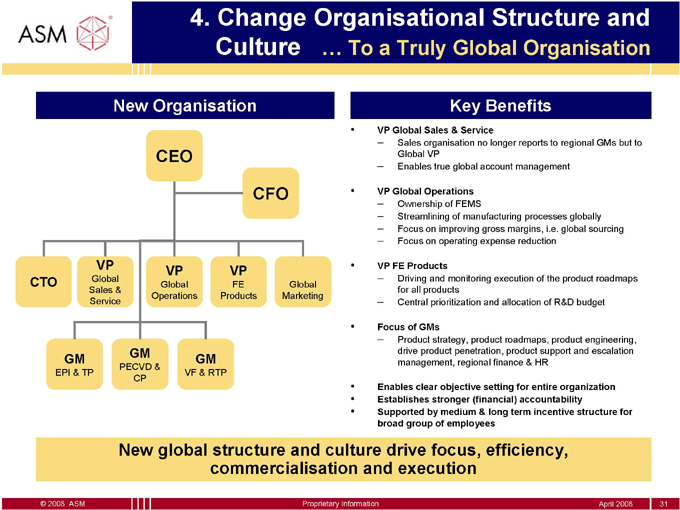
4. Change Organisational Structure and
Culture … To a Truly Global Organisation
New Organisation Key Benefits
• VP Global Sales & Service
??Sales organisation no longer reports to regional GMs but to CEO Global VP
??Enables true global account management
CFO • VP Global Operations
??Ownership of FEMS
??Streamlining of manufacturing processes globally
??Focus on improving gross margins, i.e. global sourcing
??Focus on operating expense reduction
VP • VP FE Products
Global VP VP ??Driving and monitoring execution of the product roadmaps CTO Global FE Global Sales & for all products Operations Products Marketing Service ??Central prioritization and allocation of R&D budget
• Focus of GMs
??Product strategy, product roadmaps, product engineering, GM GM GM drive product penetration, product support and escalation management, regional finance & HR
PECVD &
EPI & TP VF & RTP CP
• Enables clear objective setting for entire organization
• Establishes stronger (financial) accountability
• Supported by medium & long term incentive structure for broad group of employees
New global structure and culture drive focus, efficiency, commercialisation and execution
© 2008 ASM
Proprietary Information
April 2008
31
Agenda
Introduction
Current situation FE
Roadmap to peer profitability FE in 2009
Concluding remarks
Appendix
FE and BE convergence
Peer selection criteria
© 2008 ASM
Proprietary Information
April 2008
32
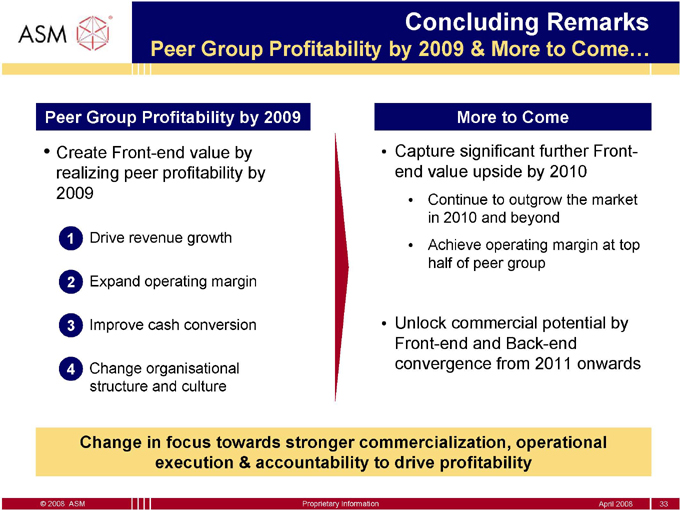
Concluding Remarks
Peer Group Profitability by 2009 & More to Come…
Peer Group Profitability by 2009 More to Come
• Create Front-end value by • Capture significant further Front-realizing peer profitability by end value upside by 2010 2009
• Continue to outgrow the market in 2010 and beyond 1 • Drive revenue growth
• Achieve operating margin at top half of peer group 2 • Expand operating margin
3 • Improve cash conversion • Unlock commercial potential by Front-end and Back-end 4 • Change organisational convergence from 2011 onwards
structure and culture
Change in focus towards stronger commercialization, operational execution & accountability to drive profitability
© 2008 ASM
Proprietary Information
April 2008
33
Agenda
Introduction
Current situation FE
Roadmap to peer profitability FE in 2009
Concluding remarks
Appendix
FE and BE convergence
Peer selection criteria
© 2008 ASM
Proprietary Information
April 2008
34
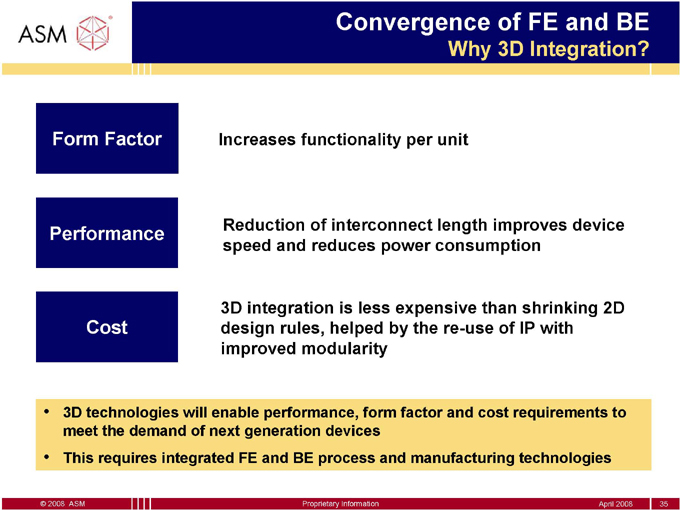
Convergence of FE and BE
Why 3D Integration?
Form Factor
Increases functionality per unit
Reduction of interconnect length improves device
Performance
speed and reduces power consumption
3D integration is less expensive than shrinking 2D Cost design rules, helped by the re-use of IP with improved modularity
3D technologies will enable performance, form factor and cost requirements to meet the demand of next generation devices
This requires integrated FE and BE process and manufacturing technologies
© 2008 ASM
Proprietary Information
April 2008
35
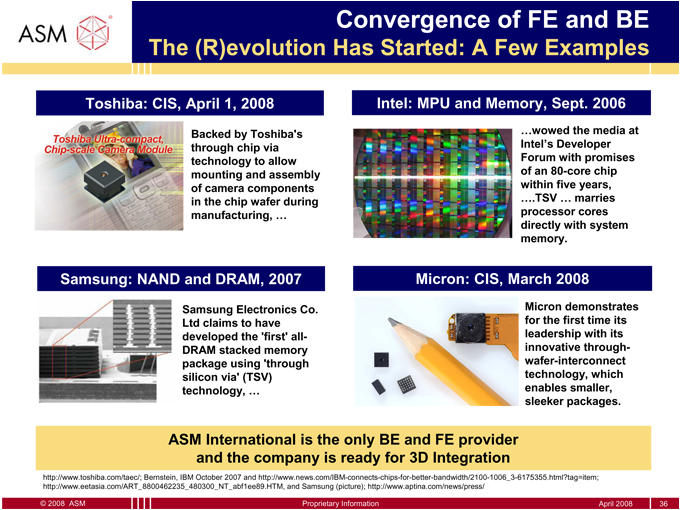
Convergence of FE and BE
The (R)evolution Has Started: A Few Examples
Toshiba: CIS, April 1, 2008 Intel: MPU and Memory, Sept. 2006
Backed by Toshiba’s …wowed the media at through chip via Intel’s Developer technology to allow Forum with promises mounting and assembly of an 80-core chip of camera components within five years, in the chip wafer during ….TSV … marries manufacturing, … processor cores directly with system memory.
Samsung: NAND and DRAM, 2007 Micron: CIS, March 2008
Samsung Electronics Co. Micron demonstrates Ltd claims to have for the first time its developed the ‘first’ all- leadership with its DRAM stacked memory innovative through-package using ‘through wafer-interconnect silicon via’ (TSV) technology, which technology, … enables smaller, sleeker packages.
ASM International is the only BE and FE provider and the company is ready for 3D Integration
http://www.toshiba.com/taec/; Bernstein, IBM October 2007 and http://www.news.com/IBM-connects-chips-for-better-bandwidth/2100-1006_3-6175355.html?tag=item; http://www.eetasia.com/ART_8800462235_480300_NT_abf1ee89.HTM, and Samsung (picture); http://www.aptina.com/news/press/
© 2008 ASM
Proprietary Information
April 2008
36
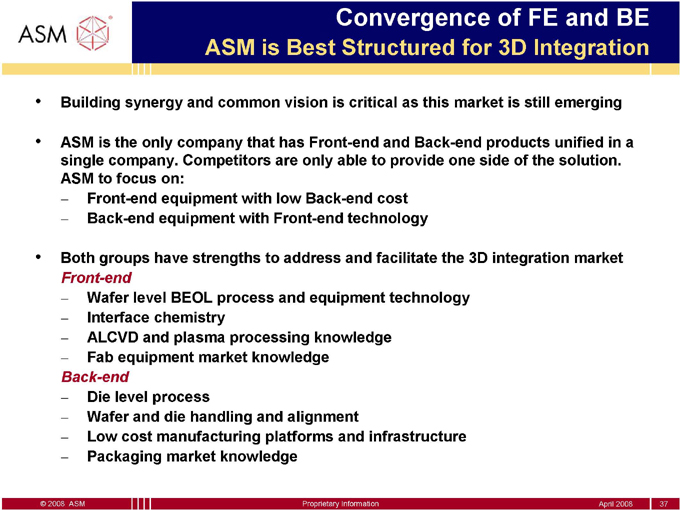
Convergence of FE and BE
ASM is Best Structured for 3D Integration
Building synergy and common vision is critical as this market is still emerging
ASM is the only company that has Front-end and Back-end products unified in a single company. Competitors are only able to provide one side of the solution.
ASM to focus on:
Front-end equipment with low Back-end cost
Back-end equipment with Front-end technology
Both groups have strengths to address and facilitate the 3D integration market
Front-end
Wafer level BEOL process and equipment technology
Interface chemistry
ALCVD and plasma processing knowledge
Fab equipment market knowledge
Back-end
Die level process
Wafer and die handling and alignment
Low cost manufacturing platforms and infrastructure
Packaging market knowledge
© 2008 ASM
Proprietary Information
April 2008
37
Agenda
Introduction
Current situation FE
Roadmap to peer profitability FE in 2009
Concluding remarks
Appendix
FE and BE convergence
Peer selection criteria
© 2008 ASM
Proprietary Information
April 2008
38
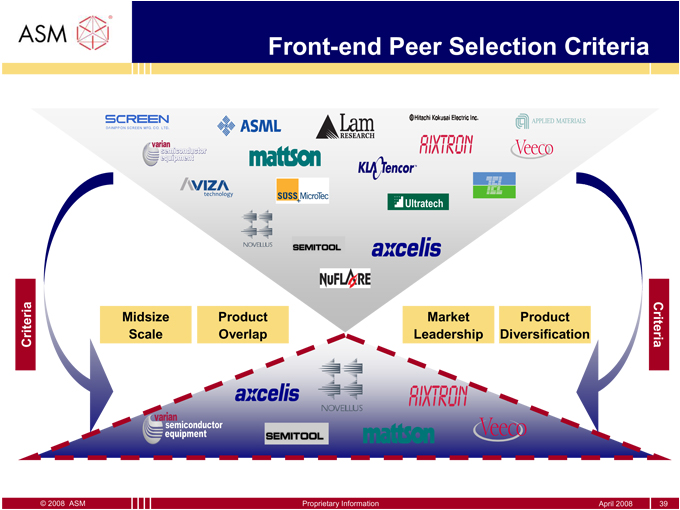
Front-end Peer Selection Criteria
Ultratech
Midsize Product Market Product
Criteria Scale Overlap Leadership Diversification Criteria
© 2008 ASM Proprietary Information April 2008 39