Exhibit 99.1
ASM INTERNATIONAL REPORTS
FOURTH QUARTER 2009 AND FULL YEAR 2009 OPERATING RESULTS
ALMERE, THE NETHERLANDS, February 24, 2010 - ASM International N.V. (NASDAQ: ASMI and Euronext Amsterdam: ASM) reports today its fourth quarter 2009 and full year 2009 operating results in accordance with US GAAP.
Fourth quarter:
| • | 2009 fourth quarter net sales were EUR 201.9 million, up 12% from the third quarter of 2009 and up 34% from the fourth quarter of 2008. Compared to the third quarter of 2009, Front-end sales were up 30%, Back-end sales were up 7%; |
| • | Restructuring expenses of EUR 6.9 million were incurred and a reassessment of the inventory impairment charge that was recognized in the second and third quarter resulted in a benefit of EUR 2.3 million in the fourth quarter of 2009; |
| • | Net loss (allocated to the shareholders of the parent) for the quarter 2009 was EUR 11.7 million, or EUR 0.23 diluted net loss per share, as compared to net loss of EUR 15.8 million, or EUR 0.31 diluted net loss per share for the third quarter of 2009 and net loss of EUR 6.2 million or EUR 0.12 diluted net earnings per share for the fourth quarter of 2008; |
| • | 2009 fourth quarter bookings were EUR 252.1 million, up 23% from the third quarter of 2009. Bookings in our Front-end segment were up 32% and bookings in our Back-end segment were up 21%. |
| • | We successfully finalized the refinancing of the Company by the placement of EUR 150 million 6.5% senior unsecured convertible bonds, due 2014 and obtained a new standby revolving credit facility of EUR 65 million, In January 2010 the standby facility was increased to EUR 90 million. |
Full year:
| • | 2009 net sales were EUR 590.7 million, down 21% compared to 2008. Sales from our Front-end segment were down 46% and sales from our Back-end segment were down 4%; |
| • | Restructuring expenses of EUR 35.7 million were incurred and an inventory impairment charge of EUR 24.2 million was recognized; |
| • | Net loss, allocated to the shareholders of the parent, was EUR 106.6 million, or EUR 2.06 diluted net loss per share, as compared to net earnings EUR 18.4 million for 2008, or EUR 0.35 diluted net earnings per share; |
| • | Bookings at EUR 696.8 million, up 9% compared to 2008. Year-end backlog was EUR 196.7 million, up 117% from the end of the previous year; |
| • | Cash flow from operations amounted to EUR 62.7million. Front-end cash flow was negative EUR 23.7 million, Back-end positive EUR 86.4 million. |
1
Investor Contacts:
Erik Kamerbeek
Investor Relations
+31 88 100 8500
Mary Jo Dieckhaus
Investor Relations
+1 212-986-290
Media Contact:
Ian Bickerton
+31 625 018 512
2
Commenting on the Company’s operating results, Chuck del Prado, President and Chief Executive Officer of ASM International, said “For the 2009 fourth quarter, consolidated operating results continued to improve. Our performance was driven by industry momentum, increased customer demand for technology-enabling processes, and leverage from our leaner and more efficient operations.
For Front-end, we saw a steady pick-up in orders during the quarter, and made solid progress in our PERFORM! restructuring initiatives, as evidenced by the improvement in Front-end fourth quarter gross margin. We also saw both new and expanded customer commitments to our products and processes in the world’s leading edge factories.
For the 2009 fourth quarter, our industry-leading Back-end achieved record levels of revenues, profits and bookings in the quarter, reflecting strong demand for assembly and packaging equipment from both IC sub-contractors and IDMs, and adjacent markets such as LEDs.”
Unaudited Accounts
ASM International N.V. is currently finalizing the financial statements for the year ended December 31, 2009. We expect to file our Form 20-F with the U.S. Securities and Exchange Commission before the end of March 2010 and to publish our Statutory Annual Accounts for the year 2009 in early April 2010. The consolidated balance sheets of ASM International N.V. as of December 31, 2009, the related statements of operations and cash flows for the year ended December 31, 2009 and all quarterly information as presented in this press release have not been audited by Deloitte Accountants B.V.
All amounts in this press release are rounded to the nearest thousand or million euro; therefore amounts may not equal (sub) totals due to rounding.
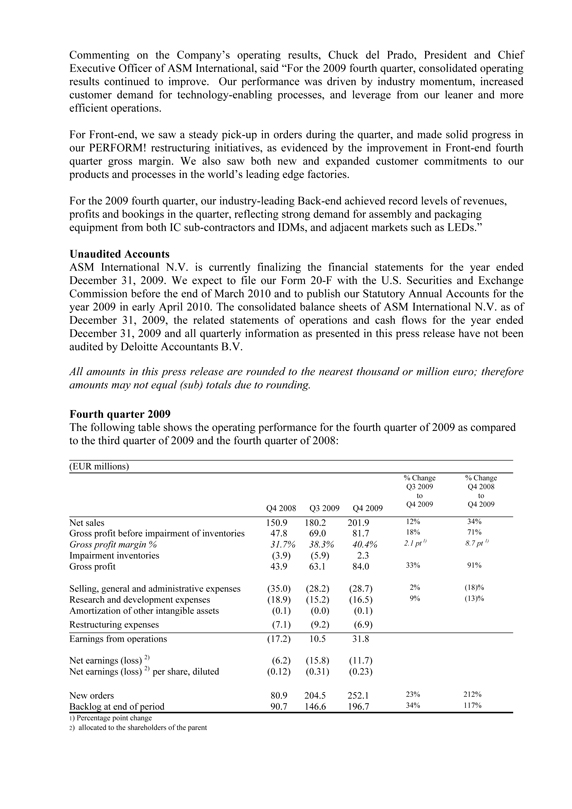
Fourth quarter 2009
The following table shows the operating performance for the fourth quarter of 2009 as compared to the third quarter of 2009 and the fourth quarter of 2008:
(EUR millions)
% Change% Change
Q3 2009 Q4 2008
to to
Q4 2008 Q3 2009 Q4 2009 Q4 2009 Q4 2009
Net sales 150.9 180.2 201.9 12% 34%
Gross profit before impairment of inventories 47.8 69.0 81.7 18% 71%
Gross profit margin % 31.7% 38.3% 40.4% 2.1 pt 1) 8.7 pt 1)
Impairment inventories(3.9)(5.9) 2.3
Gross profit 43.9 63.1 84.0 33% 91%
Selling, general and administrative expenses(35.0)(28.2)(28.7) 2%(18)%
Research and development expenses(18.9)(15.2)(16.5) 9%(13)%
Amortization of other intangible assets(0.1)(0.0)(0.1)
Restructuring expenses(7.1)(9.2)(6.9)
Earnings from operations(17.2) 10.5 31.8
Net earnings (loss) 2)(6.2)(15.8)(11.7)
Net earnings (loss) 2) per share, diluted(0.12)(0.31)(0.23)
New orders 80.9 204.5 252.1 23% 212%
Backlog at end of period 90.7 146.6 196.7 34% 117%
1) Percentage point change
2) allocated to the shareholders of the parent
3
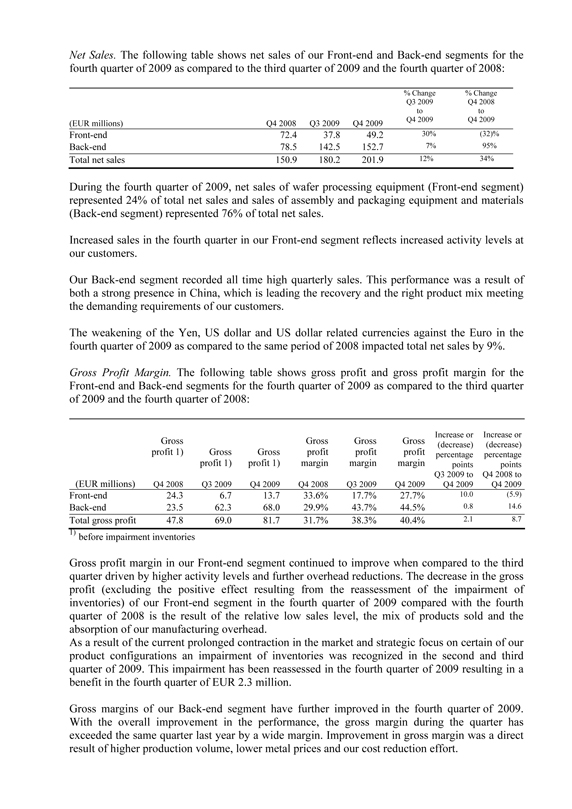
Net Sales. The following table shows net sales of our Front-end and Back-end segments for the fourth quarter of 2009 as compared to the third quarter of 2009 and the fourth quarter of 2008:
% Change% Change
Q3 2009 Q4 2008
to to
(EUR millions) Q4 2008 Q3 2009 Q4 2009 Q4 2009 Q4 2009
Front-end 72.4 37.8 49.2 30%(32)%
Back-end 78.5 142.5 152.7 7% 95%
Total net sales 150.9 180.2 201.9 12% 34%
During the fourth quarter of 2009, net sales of wafer processing equipment (Front-end segment) represented 24% of total net sales and sales of assembly and packaging equipment and materials (Back-end segment) represented 76% of total net sales.
Increased sales in the fourth quarter in our Front-end segment reflects increased activity levels at our customers.
Our Back-end segment recorded all time high quarterly sales. This performance was a result of both a strong presence in China, which is leading the recovery and the right product mix meeting the demanding requirements of our customers.
The weakening of the Yen, US dollar and US dollar related currencies against the Euro in the fourth quarter of 2009 as compared to the same period of 2008 impacted total net sales by 9%.
Gross Profit Margin. The following table shows gross profit and gross profit margin for the Front-end and Back-end segments for the fourth quarter of 2009 as compared to the third quarter of 2009 and the fourth quarter of 2008:
Increase or Increase or
Gross Gross Gross Gross(decrease)(decrease)
profit 1) Gross Gross profit profit profit percentage percentage
profit 1) profit 1) margin margin margin points points
Q3 2009 to Q4 2008 to
(EUR millions) Q4 2008 Q3 2009 Q4 2009 Q4 2008 Q3 2009 Q4 2009 Q4 2009 Q4 2009
Front-end 24.3 6.7 13.7 33.6% 17.7% 27.7% 10.0(5.9)
Back-end 23.5 62.3 68.0 29.9% 43.7% 44.5% 0.8 14.6
Total gross profit 47.8 69.0 81.7 31.7% 38.3% 40.4% 2.1 8.7
1) before impairment inventories
Gross profit margin in our Front-end segment continued to improve when compared to the third quarter driven by higher activity levels and further overhead reductions. The decrease in the gross profit (excluding the positive effect resulting from the reassessment of the impairment of inventories) of our Front-end segment in the fourth quarter of 2009 compared with the fourth quarter of 2008 is the result of the relative low sales level, the mix of products sold and the absorption of our manufacturing overhead.
As a result of the current prolonged contraction in the market and strategic focus on certain of our product configurations an impairment of inventories was recognized in the second and third quarter of 2009. This impairment has been reassessed in the fourth quarter of 2009 resulting in a benefit in the fourth quarter of EUR 2.3 million.
Gross margins of our Back-end segment have further improved in the fourth quarter of 2009. With the overall improvement in the performance, the gross margin during the quarter has exceeded the same quarter last year by a wide margin. Improvement in gross margin was a direct result of higher production volume, lower metal prices and our cost reduction effort.
4
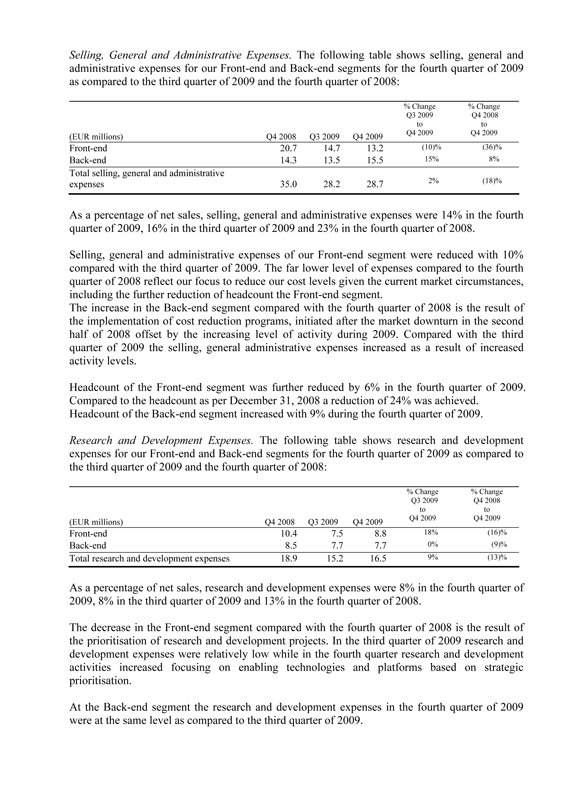
Selling, General and Administrative Expenses. The following table shows selling, general and administrative expenses for our Front-end and Back-end segments for the fourth quarter of 2009 as compared to the third quarter of 2009 and the fourth quarter of 2008:
% Change% Change
Q3 2009 Q4 2008
to to
(EUR millions) Q4 2008 Q3 2009 Q4 2009 Q4 2009 Q4 2009
Front-end 20.7 14.7 13.2(10)%(36)%
Back-end 14.3 13.5 15.5 15% 8%
Total selling, general and administrative
expenses 35.0 28.2 28.7 2%(18)%
As a percentage of net sales, selling, general and administrative expenses were 14% in the fourth quarter of 2009, 16% in the third quarter of 2009 and 23% in the fourth quarter of 2008.
Selling, general and administrative expenses of our Front-end segment were reduced with 10% compared with the third quarter of 2009. The far lower level of expenses compared to the fourth quarter of 2008 reflect our focus to reduce our cost levels given the current market circumstances, including the further reduction of headcount the Front-end segment.
The increase in the Back-end segment compared with the fourth quarter of 2008 is the result of the implementation of cost reduction programs, initiated after the market downturn in the second half of 2008 offset by the increasing level of activity during 2009. Compared with the third quarter of 2009 the selling, general administrative expenses increased as a result of increased activity levels.
Headcount of the Front-end segment was further reduced by 6% in the fourth quarter of 2009. Compared to the headcount as per December 31, 2008 a reduction of 24% was achieved.
Headcount of the Back-end segment increased with 9% during the fourth quarter of 2009.
Research and Development Expenses. The following table shows research and development expenses for our Front-end and Back-end segments for the fourth quarter of 2009 as compared to the third quarter of 2009 and the fourth quarter of 2008:
% Change% Change
Q3 2009 Q4 2008
to to
(EUR millions) Q4 2008 Q3 2009 Q4 2009 Q4 2009 Q4 2009
Front-end 10.4 7.5 8.8 18%(16)%
Back-end 8.5 7.7 7.7 0%(9)%
Total research and development expenses 18.9 15.2 16.5 9%(13)%
As a percentage of net sales, research and development expenses were 8% in the fourth quarter of 2009, 8% in the third quarter of 2009 and 13% in the fourth quarter of 2008.
The decrease in the Front-end segment compared with the fourth quarter of 2008 is the result of the prioritisation of research and development projects. In the third quarter of 2009 research and development expenses were relatively low while in the fourth quarter research and development activities increased focusing on enabling technologies and platforms based on strategic prioritisation.
At the Back-end segment the research and development expenses in the fourth quarter of 2009 were at the same level as compared to the third quarter of 2009.
5
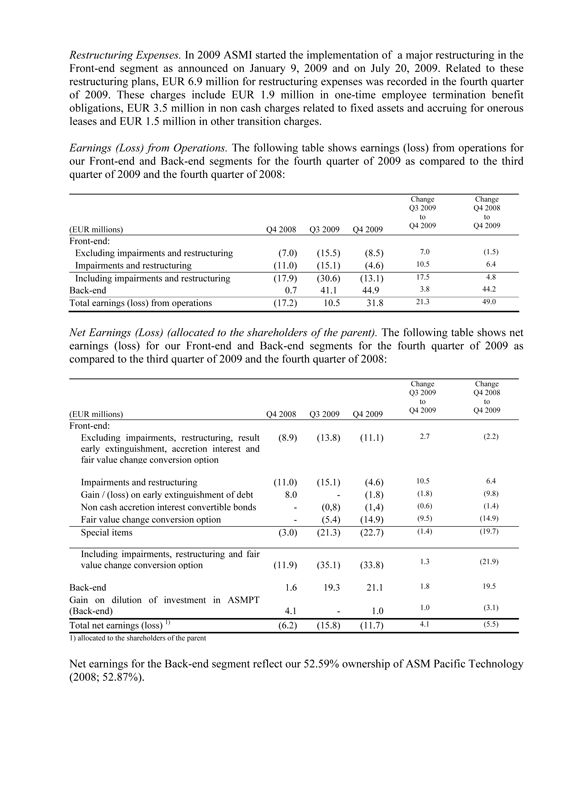
Restructuring Expenses. In 2009 ASMI started the implementation of a major restructuring in the Front-end segment as announced on January 9, 2009 and on July 20, 2009. Related to these restructuring plans, EUR 6.9 million for restructuring expenses was recorded in the fourth quarter of 2009. These charges include EUR 1.9 million in one-time employee termination benefit obligations, EUR 3.5 million in non cash charges related to fixed assets and accruing for onerous leases and EUR 1.5 million in other transition charges.
Earnings (Loss) from Operations. The following table shows earnings (loss) from operations for our Front-end and Back-end segments for the fourth quarter of 2009 as compared to the third quarter of 2009 and the fourth quarter of 2008:
Change Change
Q3 2009 Q4 2008
to to
(EUR millions) Q4 2008 Q3 2009 Q4 2009 Q4 2009 Q4 2009
Front-end:
Excluding impairments and restructuring(7.0)(15.5)(8.5) 7.0(1.5)
Impairments and restructuring(11.0)(15.1)(4.6) 10.5 6.4
Including impairments and restructuring(17.9)(30.6)(13.1) 17.5 4.8
Back-end 0.7 41.1 44.9 3.8 44.2
Total earnings (loss) from operations(17.2) 10.5 31.8 21.3 49.0
Net Earnings (Loss) (allocated to the shareholders of the parent). The following table shows net earnings (loss) for our Front-end and Back-end segments for the fourth quarter of 2009 as compared to the third quarter of 2009 and the fourth quarter of 2008:
Change Change
Q3 2009 Q4 2008
to to
(EUR millions) Q4 2008 Q3 2009 Q4 2009 Q4 2009 Q4 2009
Front-end:
Excluding impairments, restructuring, result(8.9)(13.8)(11.1) 2.7(2.2)
early extinguishment, accretion interest and
fair value change conversion option
Impairments and restructuring(11.0)(15.1)(4.6) 10.5 6.4
Gain / (loss) on early extinguishment of debt 8.0 -(1.8)(1.8)(9.8)
Non cash accretion interest convertible bonds -(0,8)(1,4)(0.6)(1.4)
Fair value change conversion option -(5.4)(14.9)(9.5)(14.9)
Special items(3.0)(21.3)(22.7)(1.4)(19.7)
Including impairments, restructuring and fair
value change conversion option(11.9)(35.1)(33.8) 1.3(21.9)
Back-end 1.6 19.3 21.1 1.8 19.5
Gain on dilution of investment in ASMPT
(Back-end) 4.1—1.0 1.0(3.1)
Total net earnings (loss) 1)(6.2)(15.8)(11.7) 4.1(5.5)
1) allocated to the shareholders of the parent
Net earnings for the Back-end segment reflect our 52.59% ownership of ASM Pacific Technology (2008; 52.87%).
6
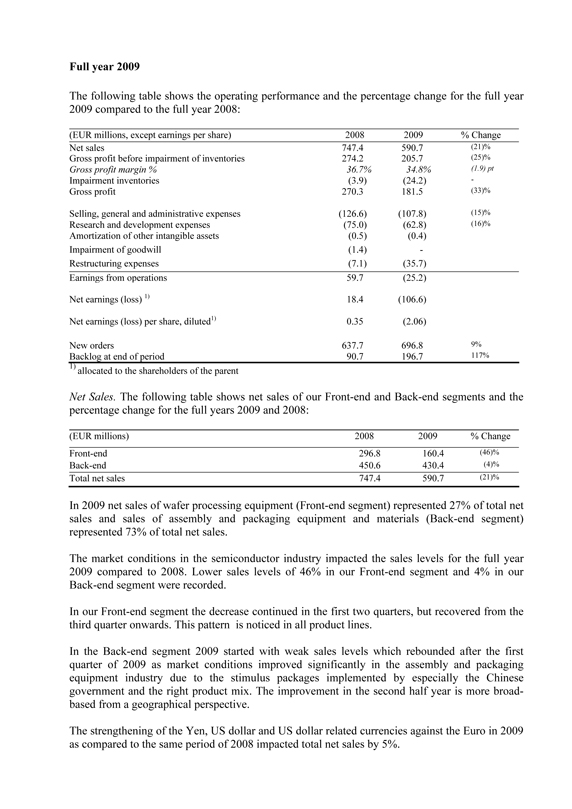
Full year 2009
The following table shows the operating performance and the percentage change for the full year 2009 compared to the full year 2008:
(EUR millions, except earnings per share) 2008 2009% Change
Net sales 747.4 590.7(21)%
Gross profit before impairment of inventories 274.2 205.7(25)%
Gross profit margin % 36.7% 34.8%(1.9) pt
Impairment inventories(3.9)(24.2) -
Gross profit 270.3 181.5(33)%
Selling, general and administrative expenses(126.6)(107.8)(15)%
Research and development expenses(75.0)(62.8)(16)%
Amortization of other intangible assets(0.5)(0.4)
Impairment of goodwill(1.4) -
Restructuring expenses(7.1)(35.7)
Earnings from operations 59.7(25.2)
Net earnings (loss) 1) 18.4(106.6)
Net earnings (loss) per share, diluted1) 0.35(2.06)
New orders 637.7 696.8 9%
Backlog at end of period 90.7 196.7 117%
1) allocated to the shareholders of the parent
Net Sales. The following table shows net sales of our Front-end and Back-end segments and the percentage change for the full years 2009 and 2008:
(EUR millions) 2008 2009% Change
Front-end 296.8 160.4(46)%
Back-end 450.6 430.4(4)%
Total net sales 747.4 590.7(21)%
In 2009 net sales of wafer processing equipment (Front-end segment) represented 27% of total net sales and sales of assembly and packaging equipment and materials (Back-end segment) represented 73% of total net sales.
The market conditions in the semiconductor industry impacted the sales levels for the full year 2009 compared to 2008. Lower sales levels of 46% in our Front-end segment and 4% in our Back-end segment were recorded.
In our Front-end segment the decrease continued in the first two quarters, but recovered from the third quarter onwards. This pattern is noticed in all product lines.
In the Back-end segment 2009 started with weak sales levels which rebounded after the first quarter of 2009 as market conditions improved significantly in the assembly and packaging equipment industry due to the stimulus packages implemented by especially the Chinese government and the right product mix. The improvement in the second half year is more broad-based from a geographical perspective.
The strengthening of the Yen, US dollar and US dollar related currencies against the Euro in 2009 as compared to the same period of 2008 impacted total net sales by 5%.
7
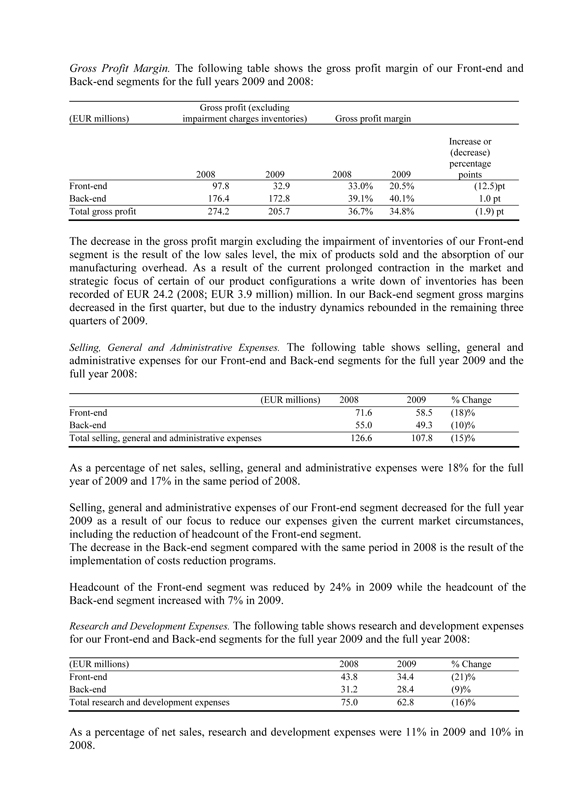
Gross Profit Margin. The following table shows the gross profit margin of our Front-end and Back-end segments for the full years 2009 and 2008:
Gross profit (excluding
(EUR millions) impairment charges inventories) Gross profit margin
Increase or
(decrease)
percentage
2008 2009 2008 2009 points
Front-end 97.8 32.9 33.0% 20.5%(12.5)pt
Back-end 176.4 172.8 39.1% 40.1% 1.0 pt
Total gross profit 274.2 205.7 36.7% 34.8%(1.9) pt
The decrease in the gross profit margin excluding the impairment of inventories of our Front-end segment is the result of the low sales level, the mix of products sold and the absorption of our manufacturing overhead. As a result of the current prolonged contraction in the market and strategic focus of certain of our product configurations a write down of inventories has been recorded of EUR 24.2 (2008; EUR 3.9 million) million. In our Back-end segment gross margins decreased in the first quarter, but due to the industry dynamics rebounded in the remaining three quarters of 2009.
Selling, General and Administrative Expenses. The following table shows selling, general and administrative expenses for our Front-end and Back-end segments for the full year 2009 and the full year 2008:
(EUR millions) 2008 2009% Change
Front-end 71.6 58.5(18)%
Back-end 55.0 49.3(10)%
Total selling, general and administrative expenses 126.6 107.8(15)%
As a percentage of net sales, selling, general and administrative expenses were 18% for the full year of 2009 and 17% in the same period of 2008.
Selling, general and administrative expenses of our Front-end segment decreased for the full year 2009 as a result of our focus to reduce our expenses given the current market circumstances, including the reduction of headcount of the Front-end segment.
The decrease in the Back-end segment compared with the same period in 2008 is the result of the implementation of costs reduction programs.
Headcount of the Front-end segment was reduced by 24% in 2009 while the headcount of the Back-end segment increased with 7% in 2009.
Research and Development Expenses. The following table shows research and development expenses for our Front-end and Back-end segments for the full year 2009 and the full year 2008:
(EUR millions) 2008 2009% Change
Front-end 43.8 34.4(21)%
Back-end 31.2 28.4(9)%
Total research and development expenses 75.0 62.8(16)%
As a percentage of net sales, research and development expenses were 11% in 2009 and 10% in 2008.
8

The decrease in the Front-end segment is the result of the prioritisation of research and development projects. The reduction in the Back-end segment is result of cost reduction efforts.
Restructuring Expenses. In 2009 ASMI started the implementation of a major restructuring in the Front-end segment as announced on January 9, 2009 and on July 20, 2009. Related to these restructuring plans, an amount of EUR 35.7 million restructuring expenses was recorded for the full year of 2009. These charges include EUR 19.4 million in one-time employee termination benefit obligations, EUR 4.6 million in non cash fixed asset impairment charges, EUR 2.3 million related to onerous contracts, EUR 3.9 million related to the management buy-out of our RTP business and EUR 5.5 million in other transition expenses.
Earnings (Loss) from Operations. The following table shows earnings (loss) from operations for our Front-end and Back-end segments for the full year 2009 compared to the same period in 2008:
(EUR millions) 2008 2009 Change
Front-end:
Excluding impairments and restructuring charges(19.5)(60.4)(40.9)
Impairments and restructuring charges(11.0)(59.9)(48.9)
Including impairments and restructuring charges(30.5)(120.3)(89.8)
Back-end 90.2 95.1 4.9
Total earnings (loss) from operations 59.7(25.2)(84.9)
Net Earnings (Loss) allocated to the shareholders of the parent. The following table shows net earnings (loss) for our Front-end and Back-end segments for the full year 2009 compared to the same period in 2008:
(EUR millions) 2008 2009 Change
Front-end:
Excluding impairments, restructuring, result early(26.2)(61.1)(34.9)
extinguishment, accretion interest and fair value change
conversion option
Impairments and restructuring(11.0)(59.9)(48.9)
Gain / (loss) on early extinguishment of debt 8.0(1.8)(9.8)
Non cash accretion interest convertible bonds -(4.3)(4.3)
Fair value change conversion option -(24.4)(24.4)
Special items(3.0)(90.4)(87.4)
Including impairments, restructuring and fair value change(29.2)(151.5)(122.3)
conversion option
Back-end 43.5 44.0(0.4)
Gain on dilution of investment in ASMPT (Back-end) 4.1 1.0(3.1)
Total net earnings (loss) 1) 18.4(106.6)(125.8)
1) allocated to the shareholders of the parent
Net earnings for the Back-end segment reflect our 52.59% ownership of ASM Pacific Technology (2008; 52.87%).
9
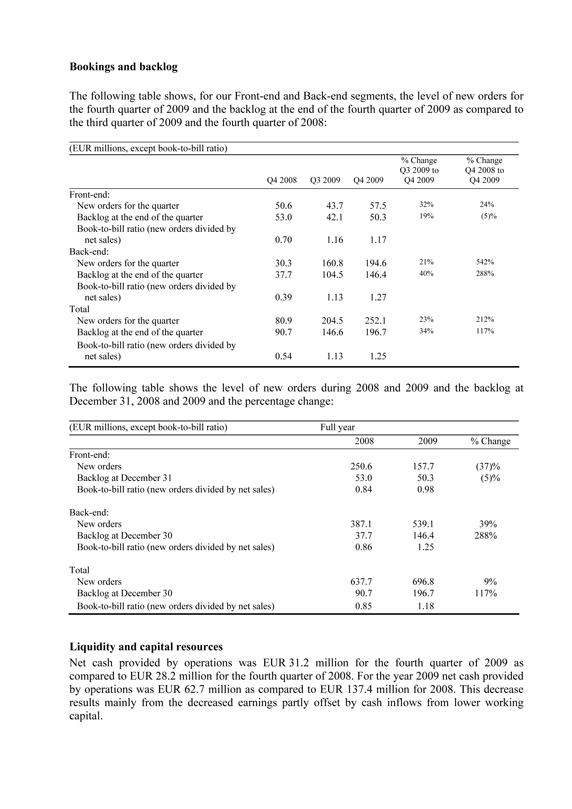
Bookings and backlog
The following table shows, for our Front-end and Back-end segments, the level of new orders for the fourth quarter of 2009 and the backlog at the end of the fourth quarter of 2009 as compared to the third quarter of 2009 and the fourth quarter of 2008:
(EUR millions, except book-to-bill ratio)
% Change% Change
Q3 2009 to Q4 2008 to
Q4 2008 Q3 2009 Q4 2009 Q4 2009 Q4 2009
Front-end:
New orders for the quarter 50.6 43.7 57.5 32% 24%
Backlog at the end of the quarter 53.0 42.1 50.3 19%(5)%
Book-to-bill ratio (new orders divided by
net sales) 0.70 1.16 1.17
Back-end:
New orders for the quarter 30.3 160.8 194.6 21% 542%
Backlog at the end of the quarter 37.7 104.5 146.4 40% 288%
Book-to-bill ratio (new orders divided by
net sales) 0.39 1.13 1.27
Total
New orders for the quarter 80.9 204.5 252.1 23% 212%
Backlog at the end of the quarter 90.7 146.6 196.7 34% 117%
Book-to-bill ratio (new orders divided by
net sales) 0.54 1.13 1.25
The following table shows the level of new orders during 2008 and 2009 and the backlog at December 31, 2008 and 2009 and the percentage change:
(EUR millions, except book-to-bill ratio) Full year
2008 2009% Change
Front-end:
New orders 250.6 157.7(37)%
Backlog at December 31 53.0 50.3(5)%
Book-to-bill ratio (new orders divided by net sales) 0.84 0.98
Back-end:
New orders 387.1 539.1 39%
Backlog at December 30 37.7 146.4 288%
Book-to-bill ratio (new orders divided by net sales) 0.86 1.25
Total
New orders 637.7 696.8 9%
Backlog at December 30 90.7 196.7 117%
Book-to-bill ratio (new orders divided by net sales) 0.85 1.18
Liquidity and capital resources
Net cash provided by operations was EUR 31.2 million for the fourth quarter of 2009 as compared to EUR 28.2 million for the fourth quarter of 2008. For the year 2009 net cash provided by operations was EUR 62.7 million as compared to EUR 137.4 million for 2008. This decrease results mainly from the decreased earnings partly offset by cash inflows from lower working capital.
10
Net cash used in investing activities was EUR 8.2 million for the fourth quarter of 2009 as compared to EUR 9.3 million for the fourth quarter of 2008. For 2009 net cash used in investing activities was EUR 15.5 million compared to EUR 33.0 million in the same period last year. The decrease results from lower capital expenditures.
The Company issued EUR 150 million senior unsecured convertible bonds due November 6 2014. The Bonds will be convertible into new and/or existing shares of the Company and will carry a quarterly coupon of 6.5% per annum and a conversion price of € 17.09.
The issue was done to extend the Company’s debt maturity profile and we intend to use part of the proceeds of the Offering for general corporate purposes. In addition, the company intends to partially use the proceeds to buy back its outstanding convertible bonds due 2010 and 2011 on an ongoing basis. In December 2009 USD 4 million of the convertible bond due 2010 and USD 26 million of the convertible bonds due 2011 were repurchased. During January 2010 a further USD 39 million of the outstanding convertible bonds due 2011 were repurchased.
ASM also negotiated a new standby revolving credit facility of EUR 65 million. This secured credit facility replaced ASM’s former secured credit facility provided by Rabobank and has a term of 3 years. The facility was increased to EUR 90 million on January 11, 2010.
Net cash from financing activities was EUR 120.6 million for the fourth quarter of 2009 as compared to net cash used in financing activities of EUR 37.7 million for the fourth quarter of 2008. For 2009 net cash from financing activities was EUR 90.9 million, in 2008 net cash used in financing activities was EUR 121.5 million. In the fourth quarter of 2009, we received the net proceeds of the newly issued convertible bond (EUR 144.5 million) and repurchased a part of the outstanding convertibles (EUR 26.8 million). In 2008, EUR 38.0 million was spent on the repurchase of the convertible bond and EUR 36.5 million on the repurchase of treasury shares.
Net working capital, consisting of accounts receivable, inventories, other current assets, accounts payable, accrued expenses, advance payments from customers and deferred revenue, decreased from EUR 253.9 million at December 31, 2008 to EUR 181.3 million at December 31, 2009. The decrease includes the (non-cash) impairment in 2009 of EUR 24.2 million in inventories and the balance of lower manufacturing and sales levels in the Front-end segment and the higher manufacturing and sales levels in the Back-end segment. The number of outstanding days of working capital, measured based on quarterly sales, decreased from 155 days at December 31, 2008 to 83 days at December 31, 2009. For the same period, as a result of the focus on reduction of working capital, our Front-end segment working capital ratio decreased from 173 days to 100 days. Our Back-end segment decreased from 138 days to 77 days.
Dividend
Based on market circumstances, ASMI will not propose to pay a cash dividend in 2010. In the current economic environment where timing of an industry upturn is extremely uncertain, cash preservation is an imperative.
Change in accounting policies
As per January 1, 2009, ASMI applies FAS 160 “Non-controlling Interests in Consolidated Financial Statements”. This Statement changes the way the consolidated income statement is presented. It requires consolidated net income to be reported at amounts that include the amounts attributable to both the parent and the non-controlling interest (“minority interest”). It also requires disclosure, on the face of the consolidated statement of income, of the amounts of consolidated net income attributable to the parent and to the minority interest. Previously, net income attributable to the minority interest generally was reported as an expense in arriving at consolidated net income.
11
As per January 1, 2009, ASMI applies EITF 07-05 “Determining Whether an Instrument (or Embedded Feature) Is Indexed to an Entity’s Own Stock”.
The Company’s convertible subordinated notes include a component that creates a financial liability to the Company and a component that grants an option to the holder of the convertible note to convert it into common shares of the Company (“conversion option”). EITF 07-05 requires separate recognition of these components.
The fair value of the liability component is estimated using the prevailing market interest rate at the date of issue, for similar non-convertible debt. Subsequently, the liability is measured at amortized cost. The interest expense on the liability component is calculated by applying the market interest rate for similar non-convertible debt at the date of issue to the liability component of the instrument. The difference between this amount and the interest paid is added to the carrying amount of the convertible subordinated notes, thus creating a non-cash interest expense (for Q4, 2009 EUR 1.4 million and for full year 2009 EUR 4.3 million). The conversion option is measured at market value through the income statement (revaluation loss in Q4, 2009 EUR 14.9 million and EUR 24.4 million for 2009 full year).
Outlook
Based on analyst projections for a significant increase in semiconductor equipment spending for 2010, ASM’s strategic engagements with customers for leading-edge technologies and an improved Front-end operating model, we are cautiously optimistic on our prospects for 2010 for the Company as a whole. Our vision is tempered by a challenging global economic environment and the uncertainty of its impact on our industry in the second half year.
For the first quarter in Front-end, we see a similar level of activity as compared to Q4 2009. We expect our cost-containment initiatives to continue contributing to results.
For Back-end, the strong backlog at year-end provides a solid foundation for healthy billing in Q1. Additionally, Back-end business conditions remain robust: the demand for shipments from multiple markets has created tight capacity for all products. Therefore all indications are that, for Q1, Back-end will report another solid quarter.
12
ASM International will host an investor conference call and web cast on
THURSDAY, FEBRUARY 25, 2010
18:00 Continental European Time
12:00 p.m.- noon—US Eastern Time
The teleconference dial-in numbers are as follows:
United States—+1 718 247 0886 International—+ 44 (0)20 7806 1968
A simultaneous audio web cast will be accessible at www.asm.com.
The teleconference will be available for replay, beginning one hour after completion of the live broadcast, through March 25, 2010.
The replay dial-in numbers are:
United States—+1 347 366 9565 International—+ 44 (0)20 7111 1244
About ASM International
ASM International N.V., headquartered in Almere, the Netherlands, and its subsidiaries design and manufacture equipment and materials used to produce semiconductor devices. ASM International and its subsidiaries provide production solutions for wafer processing (Front-end segment) as well as assembly and packaging (Back-end segment) through facilities in the United States, Europe, Japan and Asia. ASM International’s common stock trades on NASDAQ (symbol ASMI) and the Euronext Amsterdam Stock Exchange (symbol ASM). For more information, visit ASMI’s website at www.asm.com.
Safe Harbor Statement under the U.S. Private Securities Litigation Reform Act of 1995: All matters discussed in this statement, except for any historical data, are forward-looking statements. Forward-looking statements involve risks and uncertainties that could cause actual results to differ materially from those in the forward-looking statements. These include, but are not limited to, economic conditions and trends in the semiconductor industry generally and the timing of the industry cycles specifically, currency fluctuations, financing and liquidity matters, the success of restructurings, the timing of significant orders, market acceptance of new products, competitive factors, litigation involving intellectual property, shareholder and other issues, commercial and economic disruption due to natural disasters, terrorist activity, armed conflict or political instability, epidemics and other risks indicated in the Company’s filings from time to time with the U.S. Securities and Exchange Commission, including, but not limited to, the Company’s reports on Form 20-F and Form 6-K. The Company assumes no obligation nor intends to update or revise any forward-looking statements to reflect future developments or circumstances.
13
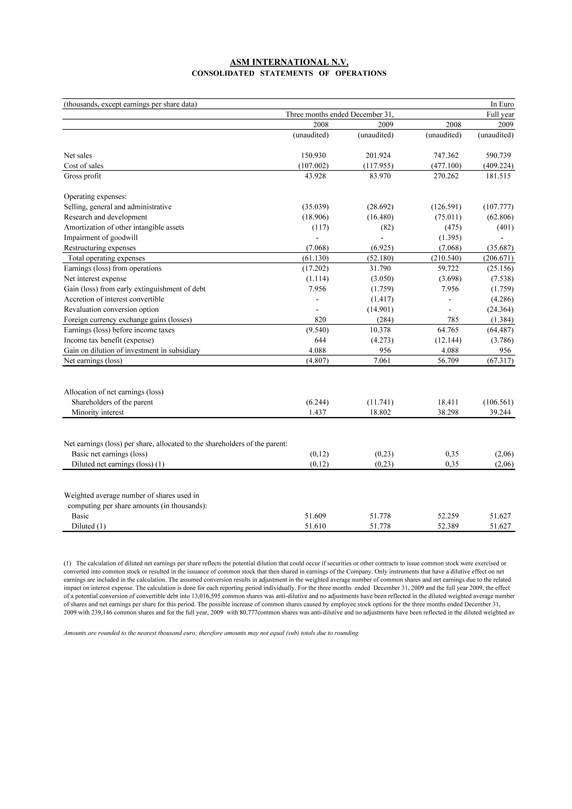
ASM INTERNATIONAL N.V.
CONSOLIDATED STATEMENTS OF OPERATIONS
ASM INTERNATIONAL N.V.
CONSOLIDATED STATEMENTS OF OPERATIONS
(thousands, except earnings per share data) In Euro
Three months ended December 31, Full year
2008 2009 2008 2009
(unaudited)(unaudited)(unaudited)(unaudited)
Net sales 150.930 201.924 747.362 590.739
Cost of sales(107.002)(117.955)(477.100)(409.224)
Gross profit 43.928 83.970 270.262 181.515
Operating expenses:
Selling, general and administrative(35.039)(28.692)(126.591)(107.777)
Research and development(18.906)(16.480)(75.011)(62.806)
Amortization of other intangible assets(117)(82)(475)(401)
Impairment of goodwill—-(1.395) -
Restructuring expenses(7.068)(6.925)(7.068)(35.687)
Total operating expenses(61.130)(52.180)(210.540)(206.671)
Earnings (loss) from operations(17.202) 31.790 59.722(25.156)
Net interest expense(1.114)(3.050)(3.698)(7.538)
Gain (loss) from early extinguishment of debt 7.956(1.759) 7.956(1.759)
Accretion of interest convertible -(1.417) -(4.286)
Revaluation conversion option -(14.901) -(24.364)
Foreign currency exchange gains (losses) 820(284) 785(1.384)
Earnings (loss) before income taxes(9.540) 10.378 64.765(64.487)
Income tax benefit (expense) 644(4.273)(12.144)(3.786)
Gain on dilution of investment in subsidiary 4.088 956 4.088 956
Net earnings (loss)(4.807) 7.061 56.709(67.317)
Allocation of net earnings (loss)
Shareholders of the parent(6.244)(11.741) 18.411(106.561)
Minority interest 1.437 18.802 38.298 39.244
Net earnings (loss) per share, allocated to the shareholders of the parent:
Basic net earnings (loss)(0,12)(0,23) 0,35(2,06)
Diluted net earnings (loss) (1)(0,12)(0,23) 0,35(2,06)
Weighted average number of shares used in
computing per share amounts (in thousands):
Basic 51.609 51.778 52.259 51.627
Diluted (1) 51.610 51.778 52.389 51.627
(1) The calculation of diluted net earnings per share reflects the potential dilution that could occur if securities or other contracts to issue common stock were exercised or converted into common stock or resulted in the issuance of common stock that then shared in earnings of the Company. Only instruments that have a dilutive effect on net earnings are included in the calculation. The assumed conversion results in adjustment in the weighted average number of common shares and net earnings due to the related impact on interest expense. The calculation is done for each reporting period individually. For the three months ended December 31, 2009 and the full year 2009, the effect of a potential conversion of convertible debt into 13,016,595 common shares was anti-dilutive and no adjustments have been reflected in the diluted weighted average number of shares and net earnings per share for this period. The possible increase of common shares caused by employee stock options for the three months ended December 31, 2009 with 239,146 common shares and for the full year, 2009 with 80,777common shares was anti-dilutive and no adjustments have been reflected in the diluted weighted ave
Amounts are rounded to the nearest thousand euro; therefore amounts may not equal (sub) totals due to rounding.
14
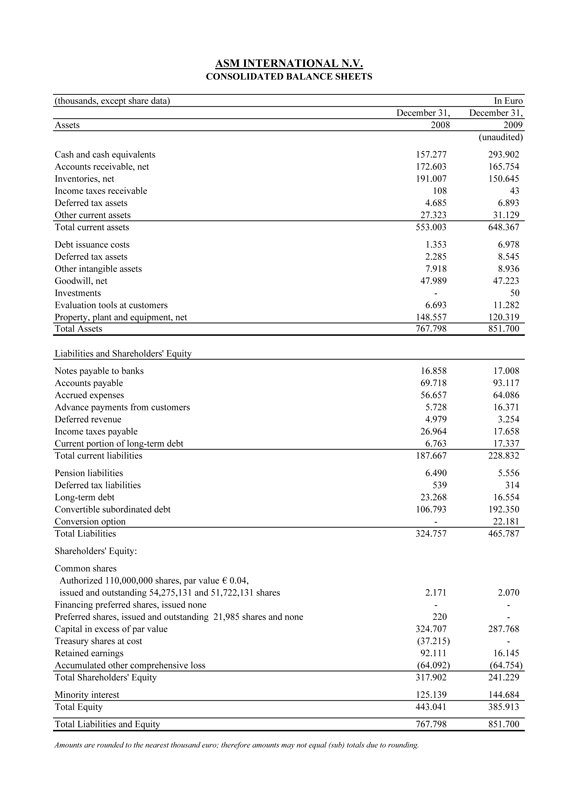
ASM INTERNATIONAL N.V. CONSOLIDATED BALANCE SHEETS
(thousands, except share data) In Euro
December 31, December 31,
Assets 2008 2009
(unaudited)
Cash and cash equivalents 157.277 293.902
Accounts receivable, net 172.603 165.754
Inventories, net 191.007 150.645
Income taxes receivable 108 43
Deferred tax assets 4.685 6.893
Other current assets 27.323 31.129
Total current assets 553.003 648.367
Debt issuance costs 1.353 6.978
Deferred tax assets 2.285 8.545
Other intangible assets 7.918 8.936
Goodwill, net 47.989 47.223
Investments—50
Evaluation tools at customers 6.693 11.282
Property, plant and equipment, net 148.557 120.319
Total Assets 767.798 851.700
Liabilities and Shareholders’ Equity
Notes payable to banks 16.858 17.008
Accounts payable 69.718 93.117
Accrued expenses 56.657 64.086
Advance payments from customers 5.728 16.371
Deferred revenue 4.979 3.254
Income taxes payable 26.964 17.658
Current portion of long-term debt 6.763 17.337
Total current liabilities 187.667 228.832
Pension liabilities 6.490 5.556
Deferred tax liabilities 539 314
Long-term debt 23.268 16.554
Convertible subordinated debt 106.793 192.350
Conversion option—22.181
Total Liabilities 324.757 465.787
Shareholders’ Equity:
Common shares
Authorized 110,000,000 shares, par value € 0.04,
issued and outstanding 54,275,131 and 51,722,131 shares 2.171 2.070
Financing preferred shares, issued none—-
Preferred shares, issued and outstanding 21,985 shares and none 220 -
Capital in excess of par value 324.707 287.768
Treasury shares at cost(37.215) -
Retained earnings 92.111 16.145
Accumulated other comprehensive loss(64.092)(64.754)
Total Shareholders’ Equity 317.902 241.229
Minority interest 125.139 144.684
Total Equity 443.041 385.913
Total Liabilities and Equity 767.798 851.700
Amounts are rounded to the nearest thousand euro; therefore amounts may not equal (sub) totals due to rounding.
15
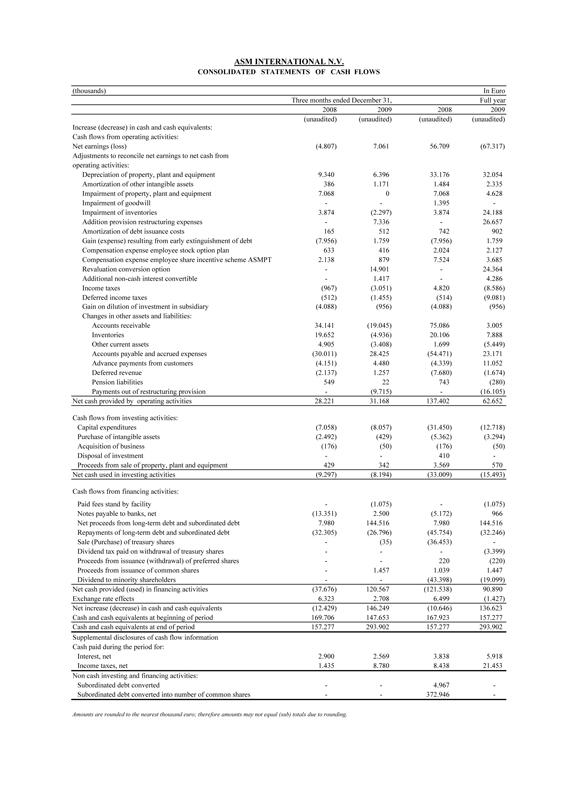
ASM INTERNATIONAL N.V.
CONSOLIDATED STATEMENTS OF CASH FLOWS
(thousands) In Euro
Three months ended December 31, Full year
2008 2009 2008 2009
(unaudited)(unaudited)(unaudited)(unaudited)
Increase (decrease) in cash and cash equivalents:
Cash flows from operating activities:
Net earnings (loss)(4.807) 7.061 56.709(67.317)
Adjustments to reconcile net earnings to net cash from
operating activities:
Depreciation of property, plant and equipment 9.340 6.396 33.176 32.054
Amortization of other intangible assets 386 1.171 1.484 2.335
Impairment of property, plant and equipment 7.068 0 7.068 4.628
Impairment of goodwill—- 1.395 -
Impairment of inventories 3.874(2.297) 3.874 24.188
Addition provision restructuring expenses—7.336—26.657
Amortization of debt issuance costs 165 512 742 902
Gain (expense) resulting from early extinguishment of debt(7.956) 1.759(7.956) 1.759
Compensation expense employee stock option plan 633 416 2.024 2.127
Compensation expense employee share incentive scheme ASMPT 2.138 879 7.524 3.685
Revaluation conversion option—14.901—24.364
Additional non-cash interest convertible—1.417—4.286
Income taxes(967)(3.051) 4.820(8.586)
Deferred income taxes(512)(1.455)(514)(9.081)
Gain on dilution of investment in subsidiary(4.088)(956)(4.088)(956)
Changes in other assets and liabilities:
Accounts receivable 34.141(19.045) 75.086 3.005
Inventories 19.652(4.936) 20.106 7.888
Other current assets 4.905(3.408) 1.699(5.449)
Accounts payable and accrued expenses(30.011) 28.425(54.471) 23.171
Advance payments from customers(4.151) 4.480(4.339) 11.052
Deferred revenue(2.137) 1.257(7.680)(1.674)
Pension liabilities 549 22 743(280)
Payments out of restructuring provision -(9.715) -(16.105)
Net cash provided by operating activities 28.221 31.168 137.402 62.652
Cash flows from investing activities:
Capital expenditures(7.058)(8.057)(31.450)(12.718)
Purchase of intangible assets(2.492)(429)(5.362)(3.294)
Acquisition of business(176)(50)(176)(50)
Disposal of investment—- 410 -
Proceeds from sale of property, plant and equipment 429 342 3.569 570
Net cash used in investing activities(9.297)(8.194)(33.009)(15.493)
Cash flows from financing activities:
Paid fees stand by facility -(1.075) -(1.075)
Notes payable to banks, net(13.351) 2.500(5.172) 966
Net proceeds from long-term debt and subordinated debt 7.980 144.516 7.980 144.516
Repayments of long-term debt and subordinated debt(32.305)(26.796)(45.754)(32.246)
Sale (Purchase) of treasury shares -(35)(36.453) -
Dividend tax paid on withdrawal of treasury shares——(3.399)
Proceeds from issuance (withdrawal) of preferred shares—- 220(220)
Proceeds from issuance of common shares—1.457 1.039 1.447
Dividend to minority shareholders—-(43.398)(19.099)
Net cash provided (used) in financing activities(37.676) 120.567(121.538) 90.890
Exchange rate effects 6.323 2.708 6.499(1.427)
Net increase (decrease) in cash and cash equivalents(12.429) 146.249(10.646) 136.623
Cash and cash equivalents at beginning of period 169.706 147.653 167.923 157.277
Cash and cash equivalents at end of period 157.277 293.902 157.277 293.902
Supplemental disclosures of cash flow information
Cash paid during the period for:
Interest, net 2.900 2.569 3.838 5.918
Income taxes, net 1.435 8.780 8.438 21.453
Non cash investing and financing activities:
Subordinated debt converted—- 4.967 -
Subordinated debt converted into number of common shares—- 372.946 -
Amounts are rounded to the nearest thousand euro; therefore amounts may not equal (sub) totals due to rounding.
16
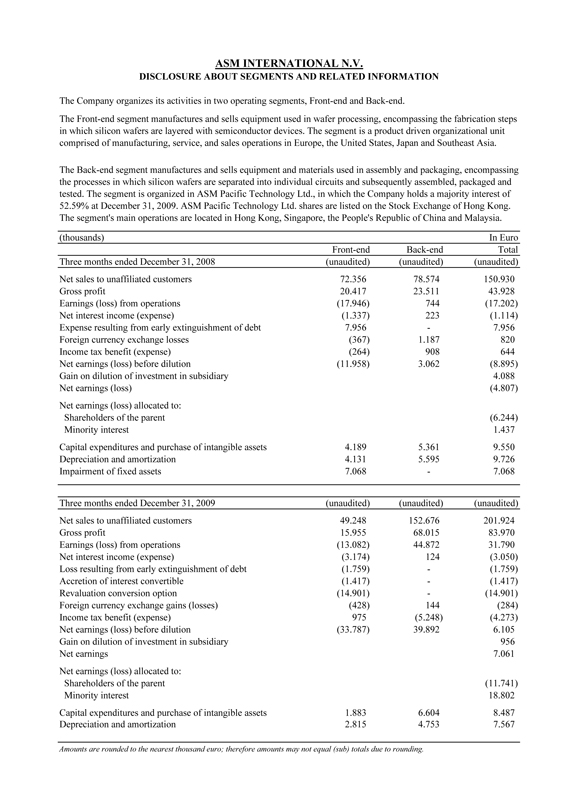
ASM INTERNATIONAL N.V.
DISCLOSURE ABOUT SEGMENTS AND RELATED INFORMATION
The Company organizes its activities in two operating segments, Front-end and Back-end.
The Front-end segment manufactures and sells equipment used in wafer processing, encompassing the fabrication steps in which silicon wafers are layered with semiconductor devices. The segment is a product driven organizational unit comprised of manufacturing, service, and sales operations in Europe, the United States, Japan and Southeast Asia.
The Back-end segment manufactures and sells equipment and materials used in assembly and packaging, encompassing the processes in which silicon wafers are separated into individual circuits and subsequently assembled, packaged and tested. The segment is organized in ASM Pacific Technology Ltd., in which the Company holds a majority interest of 52.59% at December 31, 2009. ASM Pacific Technology Ltd. shares are listed on the Stock Exchange of Hong Kong. The segment’s main operations are located in Hong Kong, Singapore, the People’s Republic of China and Malaysia.
(thousands) In Euro
Front-end Back-end Total
Three months ended December 31, 2008(unaudited)(unaudited)(unaudited)
Net sales to unaffiliated customers 72.356 78.574 150.930
Gross profit 20.417 23.511 43.928
Earnings (loss) from operations(17.946) 744(17.202)
Net interest income (expense)(1.337) 223(1.114)
Expense resulting from early extinguishment of debt 7.956—7.956
Foreign currency exchange losses(367) 1.187 820
Income tax benefit (expense)(264) 908 644
Net earnings (loss) before dilution(11.958) 3.062(8.895)
Gain on dilution of investment in subsidiary 4.088
Net earnings (loss)(4.807)
Net earnings (loss) allocated to:
Shareholders of the parent(6.244)
Minority interest 1.437
Capital expenditures and purchase of intangible assets 4.189 5.361 9.550
Depreciation and amortization 4.131 5.595 9.726
Impairment of fixed assets 7.068—7.068
Three months ended December 31, 2009(unaudited)(unaudited)(unaudited)
Net sales to unaffiliated customers 49.248 152.676 201.924
Gross profit 15.955 68.015 83.970
Earnings (loss) from operations(13.082) 44.872 31.790
Net interest income (expense)(3.174) 124(3.050)
Loss resulting from early extinguishment of debt(1.759) -(1.759)
Accretion of interest convertible(1.417) -(1.417)
Revaluation conversion option(14.901) - -(14.901)
Foreign currency exchange gains (losses)(428) 144(284)
Income tax benefit (expense) 975(5.248)(4.273)
Net earnings (loss) before dilution(33.787) 39.892 6.105
Gain on dilution of investment in subsidiary 956
Net earnings 7.061
Net earnings (loss) allocated to:
Shareholders of the parent(11.741)
Minority interest 18.802
Capital expenditures and purchase of intangible assets 1.883 6.604 8.487
Depreciation and amortization 2.815 4.753 7.567
Amounts are rounded to the nearest thousand euro; therefore amounts may not equal (sub) totals due to rounding.
17
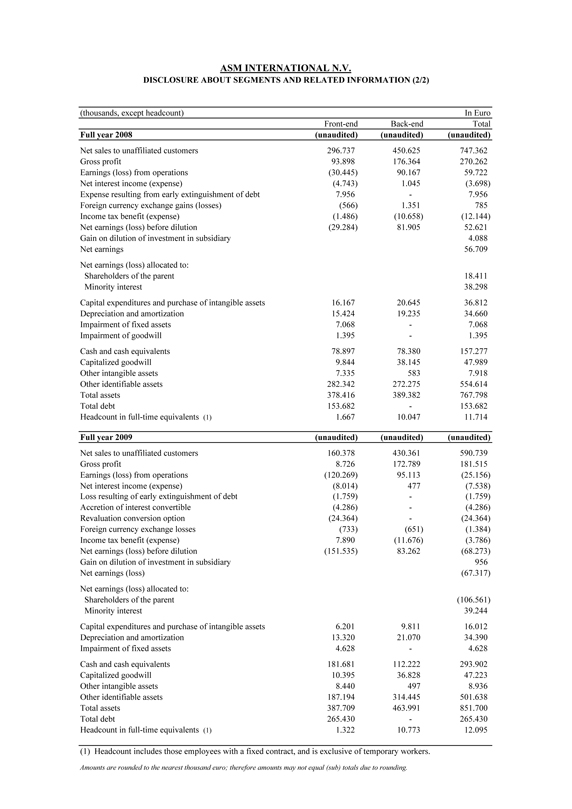
ASM INTERNATIONAL N.V.
DISCLOSURE ABOUT SEGMENTS AND RELATED INFORMATION (2/2)
(thousands, except headcount) In Euro
Front-end Back-end Total
Full year 2008(unaudited)(unaudited)(unaudited)
Net sales to unaffiliated customers 296.737 450.625 747.362
Gross profit 93.898 176.364 270.262
Earnings (loss) from operations(30.445) 90.167 59.722
Net interest income (expense)(4.743) 1.045(3.698)
Expense resulting from early extinguishment of debt 7.956—7.956
Foreign currency exchange gains (losses)(566) 1.351 785
Income tax benefit (expense)(1.486)(10.658)(12.144)
Net earnings (loss) before dilution(29.284) 81.905 52.621
Gain on dilution of investment in subsidiary 4.088
Net earnings 56.709
Net earnings (loss) allocated to:
Shareholders of the parent 18.411
Minority interest 38.298
Capital expenditures and purchase of intangible assets 16.167 20.645 36.812
Depreciation and amortization 15.424 19.235 34.660
Impairment of fixed assets 7.068—7.068
Impairment of goodwill 1.395—1.395
Cash and cash equivalents 78.897 78.380 157.277
Capitalized goodwill 9.844 38.145 47.989
Other intangible assets 7.335 583 7.918
Other identifiable assets 282.342 272.275 554.614
Total assets 378.416 389.382 767.798
Total debt 153.682—153.682
Headcount in full-time equivalents (1) 1.667 10.047 11.714
Full year 2009(unaudited)(unaudited)(unaudited)
Net sales to unaffiliated customers 160.378 430.361 590.739
Gross profit 8.726 172.789 181.515
Earnings (loss) from operations(120.269) 95.113(25.156)
Net interest income (expense)(8.014) 477(7.538)
Loss resulting of early extinguishment of debt(1.759) -(1.759)
Accretion of interest convertible(4.286) -(4.286)
Revaluation conversion option(24.364) -(24.364)
Foreign currency exchange losses(733)(651)(1.384)
Income tax benefit (expense) 7.890(11.676)(3.786)
Net earnings (loss) before dilution(151.535) 83.262(68.273)
Gain on dilution of investment in subsidiary 956
Net earnings (loss)(67.317)
Net earnings (loss) allocated to:
Shareholders of the parent(106.561)
Minority interest 39.244
Capital expenditures and purchase of intangible assets 6.201 9.811 16.012
Depreciation and amortization 13.320 21.070 34.390
Impairment of fixed assets 4.628—4.628
Cash and cash equivalents 181.681 112.222 293.902
Capitalized goodwill 10.395 36.828 47.223
Other intangible assets 8.440 497 8.936
Other identifiable assets 187.194 314.445 501.638
Total assets 387.709 463.991 851.700
Total debt 265.430—265.430
Headcount in full-time equivalents (1) 1.322 10.773 12.095
(1) | Headcount includes those employees with a fixed contract, and is exclusive of temporary workers. |
Amounts are rounded to the nearest thousand euro; therefore amounts may not equal (sub) totals due to rounding.
18
ASM INTERNATIONAL N.V.
NOTES TO THE CONSOLIDATED FINANCIAL STATEMENTS
Basis of Presentation
ASM International N.V, (“ASMI”) follows accounting principles generally accepted in the United States of America (“US GAAP”). Amounts are rounded to the nearest thousand euro; therefore amounts may not equal (sub) totals due to rounding.
Principles of Consolidation
The Consolidated Financial Statements include the accounts of ASMI and its subsidiaries, where ASMI holds a controlling interest. The minority interest of third parties is disclosed separately in the Consolidated Financial Statements. All intercompany profits, transactions and balances have been eliminated in consolidation.
Change in accounting policies
As per 1 January 2009, ASMI applies FAS 160 “Non-controlling Interests in Consolidated Financial Statements”. This Statement changes the way the consolidated income statement is presented. It requires consolidated net income to be reported at amounts that include the amounts attributable to both the parent and the non-controlling interest (“minority interest”). It also requires disclosure, on the face of the consolidated statement of income, of the amounts of consolidated net income attributable to the parent and to the minority interest. Previously, net income attributable to the minority interest generally was reported as an expense in arriving at consolidated net income.
As per 1 January 2009, ASMI applies EITF 07-05 “Determining Whether an Instrument (or Embedded Feature) Is Indexed to an Entity’s Own Stock”.
The Company’s convertible subordinated notes include a component that creates a financial liability to the Company and a component that grants an option to the holder of the convertible note to convert it into common shares of the Company (“conversion option”). EITF 07-05 requires separate recognition of these components.
The fair value of the liability component is estimated using the prevailing market interest rate at the date of issue, for similar non-convertible debt. Subsequently, the liability is measured at amortized cost. The interest expense on the liability component is calculated by applying the market interest rate for similar non-convertible debt at the date of issue to the liability component of the instrument. The difference between this amount and the interest paid is added to the carrying amount of the convertible subordinated notes, thus creating a non-cash interest expense. The conversion option is measured at market value through the income statement.
19
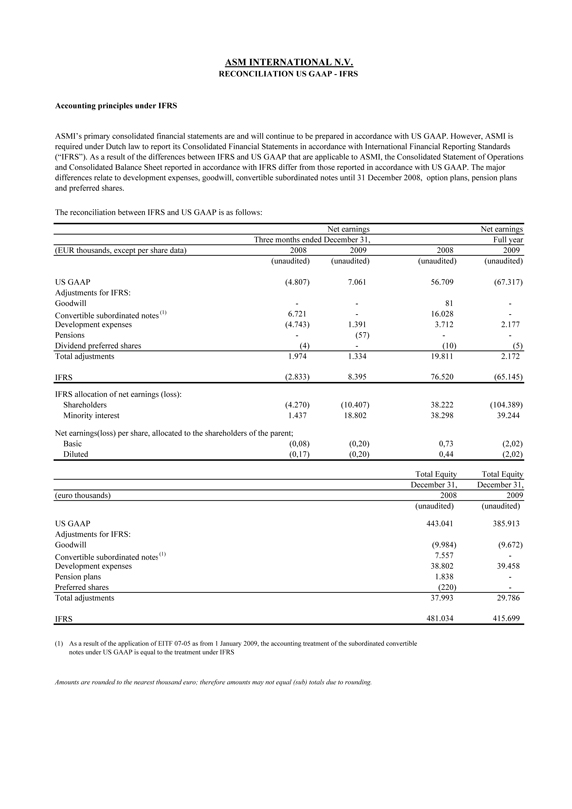
ASM INTERNATIONAL N.V. RECONCILIATION US GAAP—IFRS
Accounting principles under IFRS
ASMI’s primary consolidated financial statements are and will continue to be prepared in accordance with US GAAP. However, ASMI is required under Dutch law to report its Consolidated Financial Statements in accordance with International Financial Reporting Standards (“IFRS”). As a result of the differences between IFRS and US GAAP that are applicable to ASMI, the Consolidated Statement of Operations and Consolidated Balance Sheet reported in accordance with IFRS differ from those reported in accordance with US GAAP. The major differences relate to development expenses, goodwill, convertible subordinated notes until 31 December 2008, option plans, pension plans and preferred shares.
The reconciliation between IFRS and US GAAP is as follows:
Net earnings Net earnings
Three months ended December 31, Full year
(EUR thousands, except per share data) 2008 2009 2008 2009
(unaudited)(unaudited)(unaudited)(unaudited)
US GAAP(4.807) 7.061 56.709(67.317)
Adjustments for IFRS:
Goodwill—- 81 -
Convertible subordinated notes (1) 6.721—16.028 -
Development expenses(4.743) 1.391 3.712 2.177
Pensions -(57)—-
Dividend preferred shares(4) -(10)(5)
Total adjustments 1.974 1.334 19.811 2.172
IFRS(2.833) 8.395 76.520(65.145)
IFRS allocation of net earnings (loss):
Shareholders(4.270)(10.407) 38.222(104.389)
Minority interest 1.437 18.802 38.298 39.244
Net earnings(loss) per share, allocated to the shareholders of the parent;
Basic(0,08)(0,20) 0,73(2,02)
Diluted(0,17)(0,20) 0,44(2,02)
Total Equity Total Equity
December 31, December 31,
(euro thousands) 2008 2009
(unaudited)(unaudited)
US GAAP 443.041 385.913
Adjustments for IFRS:
Goodwill(9.984)(9.672)
Convertible subordinated notes(1) 7.557 -
Development expenses 38.802 39.458
Pension plans 1.838 -
Preferred shares(220) -
Total adjustments 37.993 29.786
IFRS 481.034 415.699
(1) As a result of the application of EITF 07-05 as from 1 January 2009, the accounting treatment of the subordinated convertible notes under US GAAP is equal to the treatment under IFRS
Amounts are rounded to the nearest thousand euro; therefore amounts may not equal (sub) totals due to rounding.
20