Exhibit 99.1

ASM INTERNATIONAL REPORT
FIRST QUARTER 2011 OPERATING RESULTS
ALMERE, THE NETHERLANDS, April 27, 2011 –ASM International N.V. (NASDAQ: ASMI and Euronext Amsterdam: ASM) reports today its first quarter 2011 operating results in accordance with US GAAP.
Highlights:
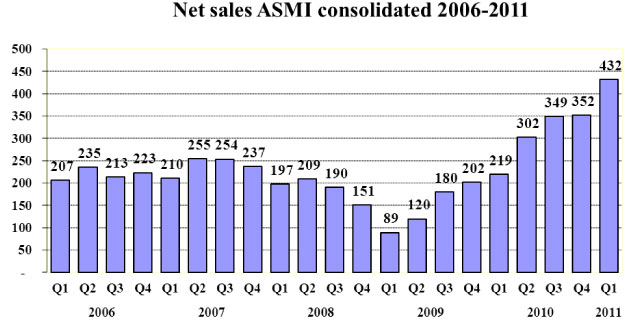
| • | Net sales for the first quarter 2011 were EUR 432 million, up 23% quarter-to-quarter and up 97% year on year. Excluding the acquired SEAS business, net sales decreased by 6% quarter-to -quarter. Net sales of our Front-end segment were up 17% quarter-to-quarter while comparable Back-end sales decreased by 15% mainly due to seasonality. |
| • | Result from operations decreased from EUR 103 million in Q4, 2010 to EUR 94 million in Q1 2011. The first quarter of 2010 showed a profit of EUR 45 million; |
| • | The Front-end segment increased from an operating profit of EUR 12.5 million (including EUR 1.8 million restructuring charges) to an operating profit of EUR 18.7 million quarter-to-quarter. Q1 2010 showed an operating loss of EUR 5.0 million including EUR 3.6 million restructuring charges; |
| • | The Back-end segment operating profit decreased from EUR 90.0 million to EUR 75.0 million quarter-to-quarter and includes a profit of EUR 11.5 million as a result of the acquisition of the former Siemens SEAS business. Compared to the first quarter of 2010, the operating profit increased by EUR 25.3 million. |
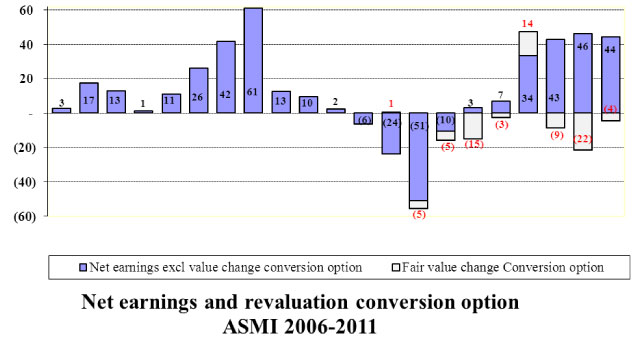
| • | First quarter 2011 net earnings were EUR 40 million compared to net earnings of EUR 25 million for the fourth quarter of 2010 and EUR 4 million for the first quarter of 2010. Excluding the revaluation of the conversion option, net earnings levelled at EUR 46 million in the fourth quarter 2010 and EUR 45 million in the first quarter 2011. As from Q2 2011 there will be no longer conversion option revaluation effects recognized through the income statement. |
| • | Book to bill in the first quarter was 1.0, both in the Front-end and the Back-end segment. Including the acquired backlog of the former SEAS business (EUR 101 million) the backlog increased from EUR 500 million at the end of the fourth quarter 2010, to EUR 579 million at the end of the first quarter 2011. |
Comment
Commenting on the results, Chuck del Prado, President and Chief Executive Officer of ASM International, said, “The first quarter of 2011 showed again strong results in the Front-end operations where we are now also reporting a positive cash flow from operations. The Front-end order book remains healthy, reflecting continued strong demand for ALD. Our Back-end segment showed the seasonal sales development. We noted an increase in incoming orders particularly towards the end of the quarter. The acquired SEAS business has already contributed this quarter to the bottom line”.
1
Outlook
Based upon the current backlog and our current visibility:
| • | For our Front-end operations we expect a single digit growth in the second quarter of 2011 at constant FX-rates, compared to the first quarter of 2011. We expect lower bookings for Q2 than in Q1, 2011. Despite this we expect 2011 to become a strong growth year for our Front-end operations. |
| • | We expect for our Back-end operations a solid quarter given our strong backlog, assuming limited end-market demand disruption caused by the Japan earthquake. |
About ASM International
ASM International N.V., headquartered in Almere, the Netherlands, and its subsidiaries design and manufacture equipment and materials used to produce semiconductor devices. ASM International and its subsidiaries provide production solutions for wafer processing (Front-end segment) as well as assembly and packaging (Back-end segment) through facilities in the United States, Europe, Japan and Asia. ASM International’s common stock trades on NASDAQ (symbol ASMI) and the Euronext Amsterdam Stock Exchange (symbol ASM). For more information, visit ASMI’s website atwww.asm.com.
Safe Harbor Statement under the U.S. Private Securities Litigation Reform Act of 1995: All matters discussed in this statement, except for any historical data, are forward-looking statements. Forward-looking statements involve risks and uncertainties that could cause actual results to differ materially from those in the forward-looking statements. These include, but are not limited to, economic conditions and trends in the semiconductor industry generally and the timing of the industry cycles specifically, currency fluctuations, corporate transactions, financing and liquidity matters, the success of restructurings, the timing of significant orders, market acceptance of new products, competitive factors, litigation involving intellectual property, shareholder and other issues, commercial and economic disruption due to natural disasters, terrorist activity, armed conflict or political instability, epidemics and other risks indicated in the Company’s filings from time to time with the U.S. Securities and Exchange Commission, including, but not limited to, the Company’s reports on Form 20-F and Form 6-K. The Company assumes no obligation nor intends to update or revise any forward-looking statements to reflect future developments or circumstances.
ASM International will host an investor conference call and web cast on Thursday, April 28, 2011 at 15:00 Continental European Time (9:00 a.m. – US Eastern Time, 9:00 p.m. Hong Kong Time).
The teleconference dial-in numbers are as follows:
| • | United States: +1 718 247 0877 |
| • | International: + 44 (0)20 7138 0814 |
A simultaneous audio web cast will be accessible atwww.asm.com.
The teleconference will be available for replay, beginning one hour after completion of the live broadcast, through May 27, 2011.
The replay dial-in numbers are:
| • | United States: +1 347 366 9565 |
| • | International: + 44 (0)20 7111 1244 |
| • | Access Code: 3545080# |
| Investor Contacts: | Media Contact: | |||
| Erik Kamerbeek | Ian Bickerton | |||
| +31 88100 8500 | +31 20 6855 955 | |||
| Mary Jo Dieckhaus | +31 62501 8512 | |||
| +1 212 986 2900 |
2
ANNEX 1
OPERATING AND FINANCIAL REVIEW
The following table shows the operating performance for the first quarter of 2011 as compared to the fourth quarter of 2010 and the first quarter of 2010:
| (EUR millions, except earnings per share) | ||||||||||||||||||||
| Q1 2010 | Q4 2010 | Q1 2011 | % Change Q4 2010 to Q1 2011 | % Change Q1 2010 to Q1 2011 | ||||||||||||||||
Net sales | 219.1 | 352.2 | 432.2 | 23 | % | 97 | % | |||||||||||||
Gross profit | 92.5 | 161.3 | 165.5 | 3 | % | 78 | % | |||||||||||||
Gross profit margin % | 42.2 | % | 45.8 | % | 38.3 | % | ||||||||||||||
Selling, general and administrative expenses | (26.7 | ) | (34.6 | ) | (42.3 | ) | 22 | % | 58 | % | ||||||||||
Research and development expenses | (17.5 | ) | (22.3 | ) | (29.5 | ) | 32 | % | 68 | % | ||||||||||
Restructuring expenses | (3.6 | ) | (1.8 | ) | — | |||||||||||||||
Result from operations | 44.7 | 102.5 | 93.7 | (9 | )% | 110 | % | |||||||||||||
Net earnings1) | 4.2 | 24.7 | 40.1 | |||||||||||||||||
Net earnings per share, diluted in euro1) | 0.08 | 0.47 | 0.69 | |||||||||||||||||
| 1) | allocated to the shareholders of the parent |
Net Sales. The following table shows net sales of our Front-end and Back-end segments for the first quarter of 2011 as compared to the fourth quarter of 2010 and the first quarter of 2010:
| (EUR millions) | Q1 2010 | Q4 2010 | Q1 2011 | % Change Q4 2010 to Q1 2011 | % Change Q1 2010 to Q1 2011 | |||||||||||||||
Front-end | 54.0 | 99.6 | 116.1 | 17 | % | 115 | % | |||||||||||||
Back-end: | ||||||||||||||||||||
-Excluding ASM AS (comparable) | 165.1 | 252.7 | 213.7 | (15 | )% | 29 | % | |||||||||||||
-ASM AS | — | — | 102.4 | |||||||||||||||||
-Back-end total | 165.1 | 252.7 | 316.1 | 25 | % | 91 | % | |||||||||||||
ASMI consolidated | 219.1 | 352.2 | 432.2 | 23 | % | 97 | % | |||||||||||||
The first quarter 2011 sales increase in our Front-end segment, compared to the previous quarter, was driven by increased equipment sales in particular for our ALD and EPI technologies. The newly acquired ASM AS business , the former Siemens business, had a strong positive effect on the net sales of our Back-end segment.
The impact of currency changes quarter to quarter was a decrease of 2%, and year-over-year, an increase of 2%.
3
Gross Profit (Margin).The following table shows our gross profit and gross profit margin for our Front-end and Back-end segments for the first quarter of 2011 as compared to the fourth quarter of 2010 and the first quarter of 2010:
| (EUR millions) | Gross Q1 2010 | Gross Q4 2010 | Gross Q1 2011 | Gross Q1 2010 | Gross Q4 2010 | Gross Q1 2011 | Increase or percentage Q4 2010 to | Increase or percentage Q1 2010 to Q1 2011 | ||||||||||||||||||||||||
Front-end | 18.0 | 40.6 | 45.6 | 33.4 | % | 40.7 | % | 39.2 | % | (1.5 | ) | 5.8 | ||||||||||||||||||||
Back-end: | ||||||||||||||||||||||||||||||||
-Comparable | 74.5 | 120.7 | 91.5 | 45.1 | % | 47.8 | % | 42.8 | % | (5.0 | ) | (2.3 | ) | |||||||||||||||||||
-ASM AS | — | — | 28.5 | — | — | 27.8 | % | n/a | n/a | |||||||||||||||||||||||
-Back-end total | 74.5 | 120.7 | 120.0 | 45.1 | % | 47.8 | % | 38.0 | % | (9.8 | ) | (7.1 | ) | |||||||||||||||||||
ASMI consolidated | 92.5 | 161.3 | 165.5 | 42.2 | % | 45.8 | % | 38.3 | % | (7.5 | ) | (3.9 | ) | |||||||||||||||||||
The gross profit margin of our Front-end segment showed a decrease of 1.5% point in the first quarter, compared to the fourth quarter of 2010, mainly driven by one offs. The comparable Back-end gross profit margin was impacted by a strong increase in raw material prices for its lead frame business.
The impact of currency changes quarter to quarter was a decrease of 2%, and year to year an increase of 2%.
Selling, General and Administrative Expenses.The following table shows selling, general and administrative expenses for our Front-end and Back-end segments for the first quarter of 2011, compared to the fourth quarter of 2010 and the first quarter of 2010:
| (EUR millions) | Q1 2010 | Q4 2010 | Q1 2011 | % Change Q4 2010 to Q1 2011 | % Change Q1 2010 to Q1 2011 | |||||||||||||||
Front-end | 11.0 | 15.1 | 15.5 | 2 | % | 41 | % | |||||||||||||
Back-end: | ||||||||||||||||||||
-Comparable | 15.6 | 19.5 | 15.8 | (19 | )% | 1 | % | |||||||||||||
- ASM AS | — | — | 8.6 | |||||||||||||||||
- Acquisition related transaction costs | — | — | 2.4 | |||||||||||||||||
-Back-end total | 15.6 | 19.5 | 26.8 | 38 | % | 72 | % | |||||||||||||
ASMI consolidated | 26.7 | 34.6 | 42.3 | 22 | % | 58 | % | |||||||||||||
Total selling, general and administrative expenses as a percentage of net sales | 12 | % | 10 | % | 10 | % | ||||||||||||||
In the Front-end segment SG&A as a percentage of sales decreased from 15% for the fourth quarter of 2010 to 13% for the first quarter of 2011. SG&A was 22% of net sales for the first quarter of 2010. In the Back-end segment, on a comparable base, SG&A as a percentage of sales decreased from 8%, in the fourth quarter of 2010, to 7% in the first quarter of 2011.
4
The impact of currency changes quarter-to-quarter was a decrease of 1%, and year-to-year an increase of 2%.
Research and Development Expenses. The following table shows research and development expenses for our Front-end and Back-end segments for the first quarter of 2011 as compared to the fourth quarter of 2010 and the first quarter of 2010:
| (EUR millions) | Q1 2010 | Q4 2010 | Q1 2011 | % Change Q4 2010 to Q1 2011 | % Change Q1 2010 to Q1 2011 | |||||||||||||||
Front-end | 8.3 | 11.2 | 11.3 | 2 | % | 36 | % | |||||||||||||
Back-end: | ||||||||||||||||||||
-Comparable | 9.2 | 11.1 | 9.8 | (12 | )% | 7 | % | |||||||||||||
-ASM AS | — | — | 8.3 | |||||||||||||||||
Back-end | 9.2 | 11.1 | 18.2 | 63 | % | 97 | % | |||||||||||||
ASMI consolidated | 17.5 | 22.3 | 29.5 | 32 | % | 68 | % | |||||||||||||
Total research and development expenses as a percentage of net sales | 8 | % | 6 | % | 7 | % | ||||||||||||||
R&D on a comparable base, as a % of sales, was stable in Q1. In absolute amounts, the increase in R&D spending is fully attributable to the acquired SEAS business.
The impact of currency changes quarter-to-quarter was a decrease of 1%, and year-to-year an increase of 3%.
Result from Operations.The following table shows results from operations for our Front-end and Back-end segments for the first quarter of 2011 as compared to the fourth quarter of 2010 and the first quarter of 2010:
| (EUR millions) | Q1 2010 | Q4 2010 | Q1 2011 | Change Q4 2010 to Q1 2011 | Change Q1 2010 to Q1 2011 | |||||||||||||||
Front-end: | ||||||||||||||||||||
-Excluding impairments and restructuring | (1.4 | ) | 14.3 | 18.7 | 4.5 | 20.1 | ||||||||||||||
-Impairments and restructuring | (3.6 | ) | (1.8 | ) | — | 1.8 | 3.6 | |||||||||||||
-Including impairments and restructuring | (5.0 | ) | 12.5 | 18.7 | 6.3 | 23.8 | ||||||||||||||
Back-end: | ||||||||||||||||||||
-Comparable | 49.7 | 90.0 | 65.9 | (24.1 | ) | 16.2 | ||||||||||||||
-ASM AS | — | — | 11.5 | 11.5 | 11.5 | |||||||||||||||
-Acquisition related transaction costs | — | — | (2.4 | ) | (2.4 | ) | (2.4 | ) | ||||||||||||
-Including ASM AS | 49.7 | 90.0 | 75.0 | (15.1 | ) | 25.3 | ||||||||||||||
ASMI consolidated | 44.7 | 102.5 | 93.7 | (8.8 | ) | 49.1 | ||||||||||||||
Total result from operations excluding impairments and restructuring as a percentage of net sales | 22 | % | 30 | % | 22 | % | ||||||||||||||
The impact of currency changes quarter to quarter was a decrease of 2%, and year-to-year an increase of 2%.
5
Net Earnings allocated to the shareholders of the parent.The following table shows net earnings for our Front-end and Back-end segments for the first quarter of 2011 as compared to the fourth quarter of 2010 and the first quarter of 2010:
| (EUR millions) | Q1 2010 | Q4 2010 | Q1 2011 | Change Q4 2010 to Q1 2011 | Change Q1 2010 to Q1 2011 | |||||||||||||||
Front-end: | ||||||||||||||||||||
-Excluding impairments, restructuring expenses, result on early extinguishment of debt and fair value changes conversion option | (10.1 | ) | 5.9 | 11.3 | 5.4 | 21.4 | ||||||||||||||
-Impairments and restructuring | (3.6 | ) | (1.8 | ) | — | 1.8 | 3.6 | |||||||||||||
-Result on early extinguishment of debt | (2.3 | ) | (0.5 | ) | — | 0.5 | 2.3 | |||||||||||||
-Fair value changes conversion options | (2.6 | ) | (21.7 | ) | (4.4 | ) | 17.3 | (1.8 | ) | |||||||||||
Special items | (8.5 | ) | (24.0 | ) | (4.4 | ) | 19.6 | 4.1 | ||||||||||||
-Including impairments, restructuring expenses, result on early extinguishment of debt and fair value changes conversion option | (18.6 | ) | (18.1 | ) | 7.0 | 25.0 | 25.5 | |||||||||||||
Back-end: | 22.7 | 42.7 | 33.1 | (9.6 | ) | 10.4 | ||||||||||||||
Total net earnings allocated to the shareholders of the parent | 4.2 | 24.7 | 40.1 | 15.4 | 35.9 | |||||||||||||||
On December 31, 2010 we initiated a full redemption for all of the outstanding principal balance of our 4.25% Convertible Subordinated notes due 2011, as per February 15, 2011. This proposal for redemption resulted in an almost full conversion of convertible notes into common shares. Until conversion, the conversion option had to be valued at fair value resulting in a non-cash loss of EUR 4.4 for Q1, due to the increase of our share price. After this redemption and conversion, there are no longer any convertible bonds outstanding that are subjected to fair value valuation recognized through the income statement.
Net earnings for the Back-end segment reflect our 52.36% ownership of ASM Pacific Technology.
6
Bookings and backlog
The following table shows, for our Front-end and Back-end segments, the level of new orders for the first quarter of 2011 and the backlog at the end of the first quarter of 2011 as compared to the fourth quarter of 2010 and the first quarter of 2010:
| (EUR millions, except book-to-bill ratio) | ||||||||||||||||||||
| Q1 2010 | Q4 2010 | Q1 2011 | % Change Q4 2010 to Q1 2011 | % Change Q1 2010 to Q1 2011 | ||||||||||||||||
Front-end: | ||||||||||||||||||||
Backlog at the beginning of the quarter | 50.3 | 139.4 | 162.9 | 17 | % | 224 | % | |||||||||||||
-New orders for the quarter | 62.8 | 120.2 | 120.8 | 1 | % | 92 | % | |||||||||||||
-Net sales for the quarter | (54.0 | ) | (99.5 | ) | (116.1 | ) | 17 | % | 115 | % | ||||||||||
-FX-effect for the quarter | 2.6 | 2.8 | (7.0 | ) | ||||||||||||||||
Backlog at the end of the quarter | 61.7 | 162.9 | 160.6 | (1 | )% | 160 | % | |||||||||||||
Book-to-bill ratio (new orders divided by net sales) | 1.2 | 1.2 | 1.0 | |||||||||||||||||
Back-end: | ||||||||||||||||||||
Backlog at the beginning of the quarter | 146.4 | 447.8 | 336.9 | (25 | )% | 130 | % | |||||||||||||
-Acquisition ASM AS business | — | — | 101.0 | |||||||||||||||||
-New orders for the quarter | 275.8 | 134.1 | 322.7 | 141 | % | 17 | % | |||||||||||||
-Net sales for the quarter | (165.1 | ) | (252.7 | ) | (316.1 | ) | 25 | % | 91 | % | ||||||||||
-FX-effect for the quarter | 14.1 | 7.8 | (26.5 | ) | ||||||||||||||||
Backlog at the end of the quarter | 271.3 | 336.9 | 418.0 | 24 | % | 54 | % | |||||||||||||
Book-to-bill ratio (new orders divided by net sales) | 1.7 | 0.5 | 1.0 | |||||||||||||||||
ASMI consolidated: | ||||||||||||||||||||
Backlog at the beginning of the quarter | 196.7 | 587.2 | 499.8 | (15 | )% | 154 | % | |||||||||||||
-Acquisition ASM AS business | — | — | 101.0 | |||||||||||||||||
-New orders for the quarter | 338.6 | 254.3 | 443.5 | 74 | % | 31 | % | |||||||||||||
-Net sales for the quarter | (219.1 | ) | (352.2 | ) | (432.2 | ) | 23 | % | 97 | % | ||||||||||
-FX-effect for the quarter | 16.7 | 10.6 | (33.5 | ) | ||||||||||||||||
Backlog at the end of the quarter | 333.0 | 499.8 | 578.6 | 16 | % | 74 | % | |||||||||||||
Book-to-bill ratio (new orders divided by net sales) | 1.5 | 0.7 | 1.0 | |||||||||||||||||
Our Front-end segment again showed strong order bookings in Q1 especially for ALD equipment. In our Back-end segment the demand for equipment increased towards the end of the quarter.
7
Liquidity and capital resources
Net cash provided by operations was EUR 84 million for the first quarter of 2011, as compared to EUR 73 million for the fourth quarter of 2010. This increase results mainly from the lower investments in working capital. For the first quarter of 2010 net cash provided by operations was EUR 26 million.
Net cash used in investing activities was EUR 22 million for the first quarter of 2011, as compared to EUR 38 million for the fourth quarter of 2010 and 11 million for the first quarter of 2010. The increase results mainly from increased capital expenditures in our Back-end segment.
Net cash used in financing activities was EUR 77 million for the first quarter of 2011, as compared to net cash used in financing activities of EUR 10 million for the fourth quarter of 2010. This increase of proceeds is mainly caused by the cash equivalents acquired with the SEAS business combination for which a one to one refunding agreement exists. For the first quarter of 2010 proceeds from financing activities of EUR 40 million were reported.
Net working capital, consisting of accounts receivable, inventories, other current assets, accounts payable, accrued expenses, advance payments from customers and deferred revenue, increased from EUR 293 million at December 31, 2010 to EUR 334 million at March 31, 2011 mainly as a result of the consolidation of the acquired SEAS business.
The number of outstanding days of working capital, measured against quarterly sales, decreased from 76 days at December 31, 2010 to 71 days at March 31, 2011. For the same period, our Front-end segment decreased from 93 days to 77 days while our Back-end segment decreased from 70 days to 69 days.
Note that the consequences of applying Purchase Price Allocation (PPA) have not been reflected in our financial statements yet. As a result of this allocation, which will be finalized in the second half of 2011, a possible badwill will be recognized in the income statement. The preliminary amount of this expected badwill has now been classed in liabilities.
Sources of liquidity. At March 31, 2011, the Company’s principal sources of liquidity consisted of EUR 465 million in cash and cash equivalents and EUR 124 million in undrawn bank lines. Approximately EUR 319 million of the cash and cash equivalents and EUR 28 million of the undrawn bank lines are restricted to use in the Company’s Back-end operations. EUR 17 million of the cash and cash equivalents and EUR 6 million in undrawn bank lines are restricted to use in the Company’s Front-end operations in Japan.
8
Historical development sales and net earnings in EUR millions
9
ASM INTERNATIONAL N.V.
CONSOLIDATED STATEMENTS OF OPERATIONS
| (thousands, except earnings per share data) | In Euro | |||||||
| Three months ended March 31, | ||||||||
| 2010 | 2011 | |||||||
| (unaudited) | (unaudited) | |||||||
Net sales | 219,052 | 432,194 | ||||||
Cost of sales | (126,582 | ) | (266,648 | ) | ||||
Gross profit | 92,470 | 165,545 | ||||||
Operating expenses: | ||||||||
Selling, general and administrative | (26,643 | ) | (42,345 | ) | ||||
Research and development | (17,511 | ) | (29,484 | ) | ||||
Restructuring expenses | (3,649 | ) | 0 | |||||
Total operating expenses | (47,803 | ) | (71,828 | ) | ||||
Earnings from operations | 44,667 | 93,717 | ||||||
Net interest expense | (4,550 | ) | (2,891 | ) | ||||
Loss from early extinguishment of debt | (2,281 | ) | — | |||||
Accretion of interest convertible | (1,830 | ) | (1,138 | ) | ||||
Revaluation conversion option | (2,577 | ) | (4,378 | ) | ||||
Foreign currency exchange losses | (1,337 | ) | (2,797 | ) | ||||
Earnings before income taxes | 32,092 | 82,512 | ||||||
Income tax expense | (7,437 | ) | (12,316 | ) | ||||
Net earnings | 24,656 | 70,197 | ||||||
Allocation of net earnings | ||||||||
Shareholders of the parent | 4,172 | 40,074 | ||||||
Minority interest | 20,484 | 30,123 | ||||||
Net earnings per share, allocated to the shareholders of the parent: | ||||||||
Basic net earnings | 0.08 | 0.73 | ||||||
Diluted net earnings (1) | 0.08 | 0.69 | ||||||
Weighted average number of shares used in computing per share amounts (in thousands): | ||||||||
Basic | 51,770 | 54,754 | ||||||
Diluted (1) | 51,770 | 64,139 | ||||||
| (1) | The calculation of diluted net earnings per share reflects the potential dilution that could occur if securities or other contracts to issue common stock were exercised or converted into common stock or resulted in the issuance of common stock that then shared in earnings of the Company. Only instruments that have a dilutive effect on net earnings are included in the calculation. The assumed conversion results in adjustment in the weighted average number of common shares and net earnings due to the related impact on interest expense. The calculation is done for each reporting period individually. For the three months ended March 31, 2011, the effect of a potential conversion of convertible debt into 8,777,063 common shares was dilutive and adjustments have been reflected in the diluted weighted average number of shares and net earnings per share for this period. The possible increase of common shares caused by employee stock options for the three months ended March 31, 2011 with 607,514 common shares, adjustments have been reflected in the diluted weighted average number of shares and net earnings per share for this period. |
Amounts are rounded to the nearest thousand euro; therefore amounts may not equal (sub) totals due to rounding.
ASM INTERNATIONAL N.V.
CONSOLIDATED BALANCE SHEETS
| (thousands, except share data) | In Euro | |||||||
| December 31, | March 31, | |||||||
| Assets | 2010 | 2011 | ||||||
| (unaudited) | ||||||||
Cash and cash equivalents | 340,294 | 465,482 | ||||||
Accounts receivable, net | 271,271 | 334,160 | ||||||
Inventories, net | 254,557 | 379,154 | ||||||
Income taxes receivable | 57 | 945 | ||||||
Deferred tax assets | 8,567 | 7,988 | ||||||
Other current assets | 51,184 | 72,262 | ||||||
Total current assets | 925,928 | 1,259,991 | ||||||
Debt issuance costs | 5,564 | 4,974 | ||||||
Deferred tax assets | 5,807 | 7,141 | ||||||
Other intangible assets | 6,804 | 6,960 | ||||||
Goodwill, net | 50,815 | 48,070 | ||||||
Investments | 50 | 1,044 | ||||||
Other non current assets | 8,221 | 7,352 | ||||||
Assets held for sale | 6,347 | 5,885 | ||||||
Evaluation tools at customers | 6,644 | 6,420 | ||||||
Property, plant and equipment, net | 197,937 | 209,988 | ||||||
Total Assets | 1,214,117 | 1,557,825 | ||||||
Liabilities and Shareholders’ Equity | ||||||||
Notes payable to banks | 8,297 | 13,065 | ||||||
Accounts payable | 170,553 | 202,934 | ||||||
Accrued expenses | 93,035 | 321,893 | ||||||
Advance payments from customers | 28,272 | 50,176 | ||||||
Deferred revenue | 4,367 | 6,919 | ||||||
Income taxes payable | 47,493 | 59,218 | ||||||
Current portion of long-term debt | 72,264 | 14,335 | ||||||
Total current liabilities | 424,282 | 668,540 | ||||||
Pension liabilities | 7,167 | 9,149 | ||||||
Deferred tax liabilities | 321 | 954 | ||||||
Long-term debt | 4,316 | 2,467 | ||||||
Convertible subordinated debt | 130,804 | 131,816 | ||||||
Conversion option | — | — | ||||||
Total Liabilities | 566,890 | 812,926 | ||||||
Shareholders’ Equity: | ||||||||
Common shares | ||||||||
Authorized 110,000,000 shares, par value €0.04, issued and outstanding 52,931,881 and 55,210,491 shares | 2,117 | 2,185 | ||||||
Financing preferred shares, issued none | — | — | ||||||
Preferred shares, issued and outstanding none | — | — | ||||||
Capital in excess of par value | 311,841 | 372,711 | ||||||
Treasury shares at cost | — | — | ||||||
Retained earnings | 131,741 | 171,812 | ||||||
Accumulated other comprehensive loss | (34,239 | ) | (57,039 | ) | ||||
Total Shareholders’ Equity | 411,460 | 489,669 | ||||||
Non-controlling interest | 235,767 | 255,229 | ||||||
Total Equity | 647,227 | 744,898 | ||||||
Total Liabilities and Equity | 1,214,117 | 1,557,825 | ||||||
Amounts are rounded to the nearest thousand euro; therefore amounts may not equal (sub) totals due to rounding.
ASM INTERNATIONAL N.V.
CONSOLIDATED STATEMENTS OF CASH FLOWS
| (thousands) | ||||||||
| Three months ended March 31, | ||||||||
| 2010 | 2011 | |||||||
| (unaudited) | (unaudited) | |||||||
Increase (decrease) in cash and cash equivalents: | ||||||||
Cash flows from operating activities: | ||||||||
Net earnings | 24,656 | 70,197 | ||||||
Adjustments to reconcile net earnings to net cash from operating activities: | ||||||||
Depreciation of property, plant and equipment | 7,041 | 10,761 | ||||||
Depreciation evaluation tools | 513 | 661 | ||||||
Amortization of other intangible assets | 681 | 745 | ||||||
Addition (release) provision restructuring expenses | 890 | (1,703 | ) | |||||
Amortization of debt issuance costs | 710 | 434 | ||||||
Loss resulting from early extinguishment of debt | 2,281 | — | ||||||
Compensation expense employee stock option plan | 653 | 572 | ||||||
Compensation expense employee share incentive scheme ASMPT | 1,158 | 1,117 | ||||||
Revaluation conversion option | 2,577 | 4,378 | ||||||
Additional non-cash interest convertible | 1,830 | 1,138 | ||||||
Income taxes | 3,074 | 2,320 | ||||||
Deferred income taxes | 289 | (411 | ) | |||||
Changes in other assets and liabilities: | ||||||||
Accounts receivable | (9,286 | ) | 16,157 | |||||
Inventories | (13,872 | ) | (35,452 | ) | ||||
Other current assets | (7,428 | ) | (14,863 | ) | ||||
Accounts payable and accrued expenses | 4,697 | 15,576 | ||||||
Advance payments from customers | 9,417 | 9,441 | ||||||
Deferred revenue | (1,775 | ) | 2,921 | |||||
Pension liabilities | 104 | 38 | ||||||
Payments out of restructuring provision | (2,426 | ) | — | |||||
Net cash provided by operating activities | 25,781 | 84,031 | ||||||
Cash flows from investing activities: | ||||||||
Capital expenditures | (11,174 | ) | (21,538 | ) | ||||
Purchase of intangible assets | (75 | ) | 49 | |||||
Acquisition of business | — | (994 | ) | |||||
Proceeds from sale of property, plant and equipment | 514 | 34 | ||||||
Net cash used in investing activities | (10,735 | ) | (22,449 | ) | ||||
Cash flows from financing activities: | ||||||||
Notes payable to banks, net | (4,437 | ) | (1,007 | ) | ||||
Debt issuance costs paid | (272 | ) | — | |||||
Cash from business combination | — | 78,130 | ||||||
Repayments of long-term debt and subordinated debt | (36,636 | ) | (2,291 | ) | ||||
Proceeds from issuance of common shares | 1,146 | 1,885 | ||||||
Dividend to minority shareholders | — | — | ||||||
Net cash used in financing activities | (40,199 | ) | 76,717 | |||||
Exchange rate effects | 10,254 | (13,110 | ) | |||||
Net increase (decrease) in cash and cash equivalents | (14,899 | ) | 125,189 | |||||
Cash and cash equivalents at beginning of period | 293,902 | 340,294 | ||||||
Cash and cash equivalents at end of period | 279,003 | 465,482 | ||||||
Supplemental disclosures of cash flow information | ||||||||
Cash paid during the period for: | ||||||||
Interest, net | 3,782 | 3,043 | ||||||
Income taxes, net | 4,074 | (284 | ) | |||||
Non cash investing and financing activities: | ||||||||
Subordinated debt converted | — | 32,202 | ||||||
Subordinated debt converted into number of common shares | — | 2,151,021 | ||||||
Amounts are rounded to the nearest thousand euro; therefore amounts may not equal (sub) totals due to rounding.
ASM INTERNATIONAL N.V.
DISCLOSURE ABOUT SEGMENTS AND RELATED INFORMATION
The Company organizes its activities in two operating segments, Front-end and Back-end.
The Front-end segment manufactures and sells equipment used in wafer processing, encompassing the fabrication steps in which silicon wafers are layered with semiconductor devices. The segment is a product driven organizational unit comprised of manufacturing, service, and sales operations in Europe, the United States, Japan and Southeast Asia.
The Back-end segment manufactures and sells equipment and materials used in assembly and packaging, encompassing the processes in which silicon wafers are separated into individual circuits and subsequently assembled, packaged and tested. The segment is organized in ASM Pacific Technology Ltd., in which the Company holds a majority interest of 52.36% at March 31, 2011, whilst the remaining shares are listed on the Stock Exchange of Hong Kong. The segment's main operations are located in Hong Kong, Singapore, the People's Republic of China and Malaysia.
| (thousands) | In Euro | |||||||||||
| Front-end | Back-end | Total | ||||||||||
| Three months ended March 31, 2010 | (unaudited) | (unaudited) | (unaudited) | |||||||||
Net sales to unaffiliated customers | 53,956 | 165,096 | 219,052 | |||||||||
Gross profit | 18,002 | 74,467 | 92,470 | |||||||||
Earnings (loss) from operations | (5,017 | ) | 49,684 | 44,667 | ||||||||
Net interest income (expense) | (4,653 | ) | 103 | (4,550 | ) | |||||||
Loss resulting from early extinguishment of debt | (2,281 | ) | — | (2,281 | ) | |||||||
Accretion of interest convertible | (1,830 | ) | — | (1,830 | ) | |||||||
Revaluation conversion option | (2,577 | ) | — | (2,577 | ) | |||||||
Foreign currency exchange gains (losses) | (1,713 | ) | 376 | (1,337 | ) | |||||||
Income tax expense | (483 | ) | (6,954 | ) | (7,437 | ) | ||||||
Net earnings (loss) | (18,554 | ) | 43,210 | 24,656 | ||||||||
Net earnings allocated to: | ||||||||||||
Shareholders of the parent | 4,172 | |||||||||||
Minority interest | 20,484 | |||||||||||
Capital expenditures and purchase of intangible assets | 3,055 | 8,194 | 11,249 | |||||||||
Depreciation and amortization | 3,209 | 5,026 | 8,234 | |||||||||
Cash and cash equivalents | 142,234 | 136,769 | 279,003 | |||||||||
Capitalized goodwill | 11,079 | 39,338 | 50,417 | |||||||||
Other intangible assets | 7,791 | 508 | 8,299 | |||||||||
Other identifiable assets | 196,163 | 372,758 | 568,921 | |||||||||
Total assets | 357,267 | 549,374 | 906,641 | |||||||||
Total debt | 236,554 | — | 236,554 | |||||||||
Headcount in full-time equivalents (1)
|
| 1,311
|
|
| 11,679
|
|
| 12,990
|
| |||
| Three months ended March 31, 2011 | (unaudited) | (unaudited) | (unaudited) | |||||||||
Net sales to unaffiliated customers | 116,135 | 316,059 | 432,194 | |||||||||
Gross profit | 45,572 | 119,973 | 165,545 | |||||||||
Earnings from operations | 18,735 | 74,982 | 93,717 | |||||||||
Net interest income (expense) | (3,197 | ) | 306 | (2,891 | ) | |||||||
Accretion of interest convertible | (1,138 | ) | — | (1,138 | ) | |||||||
Revaluation conversion option | (4,378 | ) | — | (4,378 | ) | |||||||
Foreign currency exchange gains (losses) | (3,155 | ) | 358 | (2,797 | ) | |||||||
Income tax benefit (expense) | 92 | (12,407 | ) | (12,316 | ) | |||||||
Net earnings | 6,959 | 63,237 | 70,197 | |||||||||
Net earnings allocated to: | ||||||||||||
Shareholders of the parent | 40,074 | |||||||||||
Minority interest | 30,123 | |||||||||||
Capital expenditures and purchase of intangible assets | 3,889 | 17,600 | 21,489 | |||||||||
Depreciation and amortization | 3,599 | 8,568 | 12,168 | |||||||||
Cash and cash equivalents | 146,645 | 318,837 | 465,482 | |||||||||
Capitalized goodwill | 10,851 | 37,219 | 48,070 | |||||||||
Other intangible assets | 5,004 | 1,956 | 6,960 | |||||||||
Other identifiable assets | 295,710 | 741,603 | 1,037,313 | |||||||||
Total assets | 458,210 | 1,099,615 | 1,557,825 | |||||||||
Total debt | 156,323 | 5,360 | 161,683 | |||||||||
Headcount in full-time equivalents (1)
|
| 1,508
|
|
| 16,670
|
|
| 18,178
|
| |||
| (1) | Headcount includes those employees with a fixed contract, and is exclusive of temporary workers. |
Amounts are rounded to the nearest thousand euro; therefore amounts may not equal (sub) totals due to rounding.
ASM INTERNATIONAL N.V.
NOTES TO THE CONSOLIDATED FINANCIAL STATEMENTS
Basis of Presentation
ASM International N.V, (“ASMI”) follows accounting principles generally accepted in the United States of America (“US GAAP”).
Amounts are rounded to the nearest thousand euro; therefore amounts may not equal (sub) totals due to rounding.
Principles of Consolidation
The Consolidated Financial Statements include the accounts of ASMI and its subsidiaries, where ASMI holds a controlling interest. The minority interest of third parties is disclosed separately in the Consolidated Financial Statements. All intercompany profits, transactions and balances have been eliminated in consolidation.
Change in accounting policies
No significant changes in accounting policies incurred during the first quarter of 2011.
ASM INTERNATIONAL N.V.
RECONCILIATION US GAAP—IFRS
Accounting principles under IFRS
ASMI’s primary consolidated financial statements are and will continue to be prepared in accordance with US GAAP. However, ASMI is required under Dutch law to report its Consolidated Financial Statements in accordance with International Financial Reporting Standards (“IFRS”). As a result of the differences between IFRS and US GAAP that are applicable to ASMI, the Consolidated Statement of Operations and Consolidated Balance Sheet reported in accordance with IFRS differ from those reported in accordance with US GAAP. The major differences relate to development expenses, goodwill, inventory obsolescence reserve, pension plans and preferred shares.
The reconciliation between IFRS and US GAAP is as follows:
| Net earnings | ||||||||||||
| Three months ended March 31, | ||||||||||||
| (EUR thousands, except per share data) | 2010 | 2011 | ||||||||||
| (unaudited) | (unaudited) | |||||||||||
US GAAP | 24,656 | 70,197 | ||||||||||
Adjustments for IFRS: | ||||||||||||
Inventory obsolescence reserve | — | (1,046 | ) | |||||||||
Development expenses | (662 | ) | 2,496 | |||||||||
Capitalized debt issuance costs | — | 150 | ||||||||||
Total adjustments | (662 | ) | 1,600 | |||||||||
IFRS | 23,994 | 71,797 | ||||||||||
IFRS allocation of net earnings (loss): | ||||||||||||
Shareholders | 3,510 | 41,674 | ||||||||||
Minority interest | 20,484 | 30,123 | ||||||||||
Net earnings (loss) per share, allocated to the shareholders of the parent; | ||||||||||||
Basic | 0.07 | 0.76 | ||||||||||
Diluted | 0.07 | 0.72 | ||||||||||
Total Equity |
Total Equity | |||||||||||
| (euro thousands) | March 31, 2010 | March 31, 2011 | ||||||||||
| (unaudited) | (unaudited) | |||||||||||
US GAAP | 443,785 | 744,898 | ||||||||||
Adjustments for IFRS: | ||||||||||||
Goodwill | (9,360 | ) | (9,766 | ) | ||||||||
Capitalized debt issuance costs | (1,283 | ) | (976 | ) | ||||||||
Development expenses | 28,014 | 34,591 | ||||||||||
Pension plans | 391 | 565 | ||||||||||
Inventory obsolescence reserve | — | 2,093 | ||||||||||
Total adjustments | 17,762 | 26,507 | ||||||||||
IFRS | 461,547 | 771,405 | ||||||||||
Amounts are rounded to the nearest thousand euro; therefore amounts may not equal (sub) totals due to rounding.