CHAPTER TWO
Property/Casualty
The insurance industry flows with the cycles of the world around it. In the property/casualty sector (known as nonlife outside the United States), one of the industry’s main categories, major catastrophic events such as hurricanes can wipe out whatever gains insurers have made in the years leading up to the event.
Property insurance covers damages or loss of property. As a result, rates can be significantly higher in areas susceptible to perils such as hurricanes. Casualty insurance covers legal expenses from losses such as bodily injury or property damage that the policyholder may cause to others.
Insurance companies set a reserve amount through a prediction of how much a claim may cost over the course of the premium payments. Unlike property reserves, which are mostly for specific known events, casualty reserves have to be sufficient to cover events that may unfold well into the future (i.e., medical professional liability, product liability and asbestos-related claims). These “long-tail” lines of business are named so due to the length of time that may elapse before claims are finally settled.
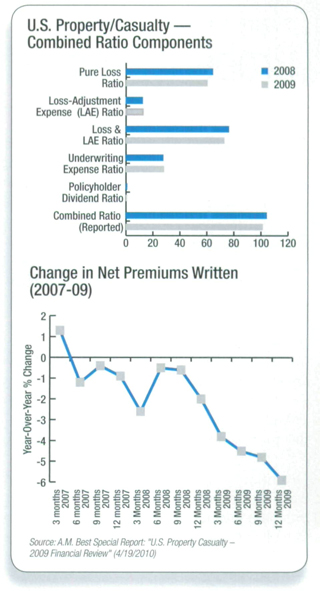
Determining and comparing profitability among property/casualty companies typically is achieved through the combined ratio, which measures the percentage of premium income an insurer paid out in claims and expenses. A combined ratio (calculated by adding the loss and loss-adjustment expense, or LAE, ratio, the expense ratio and the policyholder dividend ratio) of less than 100 means that the insurer is making an underwriting profit.
Assets
Property owned by insurance companies — primarily stocks, bonds, mortgages and real estate.
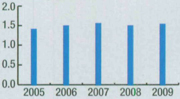
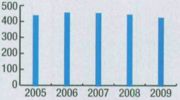
Assets by Year
U.S. Industry ($ Trillions)
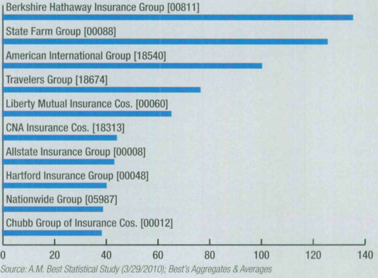
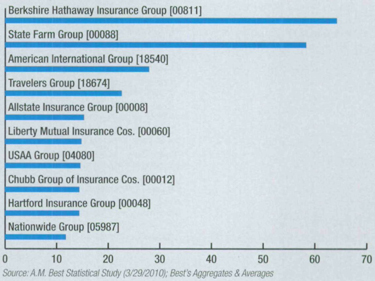
Top U.S. Property/Casualty Insurers
Admitted Assets 2009 ($ Billions)
| www.ambest.com | 15 |
However, companies with combined ratios over 100 still may earn a profit because the ratio does not account for investment income.
The industry’s combined ratio improved to 101.1 in 2009, according to Best’s Aggregates & Averages, down approximately four percentage points from the 105.1 recorded the year before, as catastrophe-related losses were down from 2008 when Hurricanes Ike and Gustav slammed into the United States. Mortgage and financial guaranty losses were down as well.
However, after back-to-back years of declines in 2007 and 2008, net premiums written decreased once again in 2009, falling approximately 5.9% to $419.3 billion from $445.4 billion in 2008. This marks the first time in A.M. Best’s recorded history that net premiums written declined in three consecutive years.
Property/casualty insurance generally falls into two areas of concentration: personal and commercial lines.
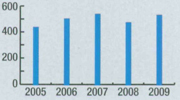
Policyholders’ Surplus
The sum remaining after all liabilities are deducted from assets — essentially an insurer’s net worth.
Policyholders' Surplus
U.S. Industry ($ Billions)
Top U.S. Property/Casualty Insurers
Policyholders' Surplus 2009 ($ Billions)
| 16 | Insurance Facts and Stats |
Personal Lines
Personal insurance is to protect people and their property, typically homes and vehicles from loss and damage. Auto and homeowners coverage dominates mostly because of legal provisions that mandate coverage be obtained.
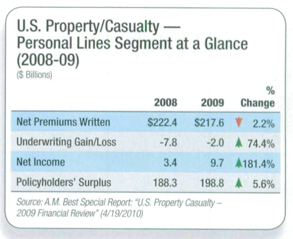
The personal lines segment's operating performance in 2009 significantly improved with $9.7 billion of reported net income, compared with $3.4 billion a year earlier. Net income increased as underwriting losses decreased due primarily to reduced catastrophe activity. Improved investment-market conditions also helped decrease realized capital losses.
In addition, the recessionary environment is impacting top-line revenue. Revenue on the auto line has been tempered by consumers foregoing purchases of new cars and reducing the amount of coverage they buy. On the homeowners line, revenue also has been pressured by economic conditions, given increased foreclosures and fewer home sales.
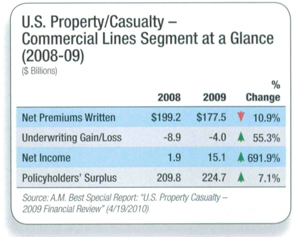
Commercial Lines
Commercial insurance protects businesses, hospitals, governments and schools from losses caused by crime, fire, or other acts that damage property. Like auto and homeowners on the personal lines side, workers’ compensation consistently is a top line due to mandates and requirements defined by U.S. states. Medical professional liability also is a major business line.
Premiums
Direct premiums written are before reinsurance transactions — insurance purchased by an insurance company to reduce risk. Net premiums are after the reinsurance deductions.
Net Premiums
U.S. Industry ($ Billions)
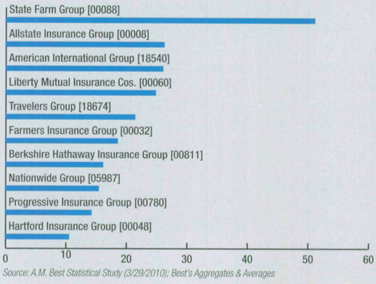
Top U.S. Property/Casualty Insurers
Direct Premiums Written 2009 ($ Billions)
| www.ambest.com | 17 |
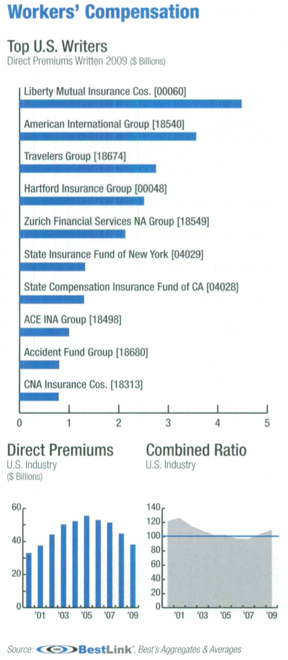
Workers’ Compensation: Workers’ compensation started as, and continues to be, a compromise between employers and employees. Employers pay benefits regardless of who is to blame for the accident or injury, unless the employee was negligent. In return, the employee gives up the right to sue.
Unlike much of the U.S. property/casualty industry, which has seen some measure of recovery over the past few years, the workers' comp segment's operating performance has continued to deteriorate. Net premiums written on this line from 2006 to 2009 has plunged more than any other individual line of business, falling nearly 24% in the three-year period. Furthermore, since workers' comp is tied directly to the economy and labor markets, the anticipated jobless recovery means that underwriting performance is not expected to rebound any time soon.
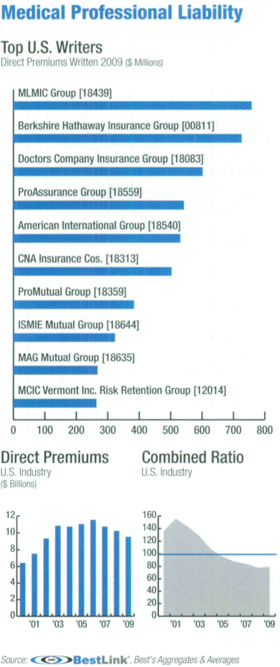
Medical Professional Liability: This commercial segment has produced strong underwriting and operating profits despite a highly competitive, soft market environment. Its 2009 combined ratio, 78.7, according to Best’s Aggregates & Averages, saw a slight deterioration from 2008, but generally has been improving steadily since posting a ratio of 155.0 in 2001. For the most part, insurers’ balance sheets are conservative and typically avoid high-risk investment products. As a result, the effects from the global investment market meltdown on insurers have been negligible.
In the early part of the 2000s, rising premiums and a reduction in the number of firms offering coverage led to an availability crisis. In fact, the St. Paul Cos., the largest writer throughout most of the 1990s, announced in 2001 it would stop writing policies. Tort reform was enacted to enhance the availability of affordable insurance coverage to health care providers, but these reforms were challenged almost as soon as they were enacted. Many provisions since have been overturned. Despite the reversals, underwriting profitability within the industry has afforded companies the opportunity to reduce premium rates.
The commercial segment saw improved, although tempered, results in 2009. Despite a better year in mortgage and financial guaranty lines over 2008, their continued poor performance suppressed overall results. The segment’s 2009 combined ratio is 102.8, but if results for mortgage and financial guaranty insurers were excluded, the ratio improves to 99.9.
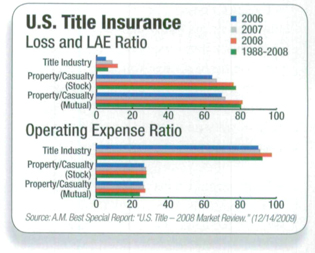
Title Insurance
Virtually every real estate transaction depends upon a title insurance company. While other types of insurance generally insure against losses caused by future events, title insurance covers claims based on past events that have caused a defect in the land title, brought on by reasons such as public-record errors, forgeries or incorrect marital statements.
| 18 | Insurance Facts and Stats |
��
Lenders also insist on title policies because they sell loans packaged as securities to mortgage investors in the secondary market, and the lenders need the insurance to ensure that the mortgages backing the securities are valid.
A reviving housing market helped the industry improve in 2009. But despite the recovery, the title industry still faces difficulties due to high unemployment, continued home foreclosure activity and uncertainty surrounding the direction of home prices.
Unlike property/casualty profit cycles that depend on the supply of insurance in the market (known as capacity), title insurance cycles stem from the amount of real estate transactions. Housing activity plays an essential part, as title companies collect premiums after the largest component of their costs - operating expenses - has been incurred. And because general expenses incurred as part of the title-search process typically make up 85% or more of premium volume, title insurers, unlike other property/casualty insurers, have little available cash flow for investments.
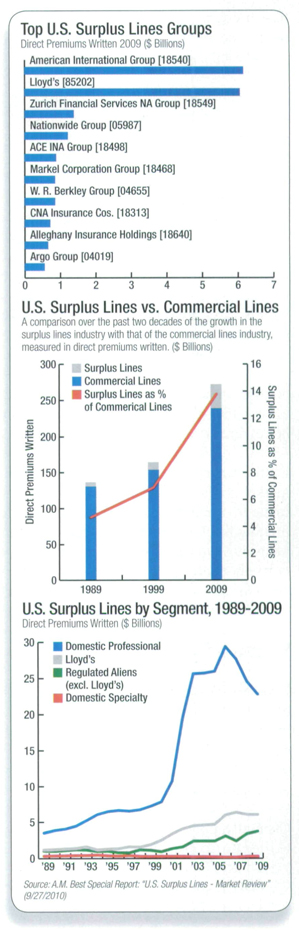
Excess & Surplus
If property/casualty coverage isn’t available from admitted insurers – ones licensed by a state – it can be purchased from a nonadmitted carrier. The majority of surplus lines business is commercial lines, although some personal lines coverage is written such as homeowners insurance in catastrophe-prone areas. As nonadmitted carriers, surplus lines insurers escape most regulation, and are free from some coverage requirements that apply to an admitted insurer.
Generally, policies are written by surplus insurers because admitted carriers have elected not to provide coverage. The reasons vary, but include the following:
· Distressed risks: The risk, characterized by unfavorable attributes, such as a history of frequent losses, does not meet the guidelines of the standard market.
| www.ambest.com | 19 |
· Unique risks: The risk is so specialized or unusual, such as prize indemnity insurance (where a premium is paid to an insurance company, which then reimburses the insured should a prize be given away), that it falls outside of what the admitted insurer is comfortable writing.
· High-capacity risk: The risk requires high insurance limits that may exceed the capacity of the standard market. These are very large exposures with equally high potential for loss, such as aviation liability insurance, or coverage for a museum with art worth millions or billions of dollars.
In addition, when the insurance market is restricted and market conditions are considered hard, standard market carriers typically reduce their appetites for some risks or lines of insurance, and business flows into the surplus lines market.
Lloyd’s is an important market for placement of U.S. surplus lines business, with surplus lines and reinsurance activities generating the majority of Lloyd’s U.S. revenues. Domestic professional surplus lines companies are U.S. domiciled insurers that write 50% or more of their total direct premium written on a nonad-mitted basis. Domestic specialty companies also are U.S. domiciled, but their direct nonadmitted premium writings amount to less than 50% of their total direct premium written.
In 2009, the surplus lines market’s performance represented a partial rebound from 2008, when catastrophes and the financial crisis shrank margins noticeably. Still, current soft market conditions continue to negatively affect the market. In particular, the soft market has put pressure on commercial lines, the primary insurance sector for the surplus lines market. The recession has led to lower employee payrolls and sales revenues, and therefore lower exposures, which has contributed to a drop in premium volume.
| 20 | Insurance Facts and Stats |
CHALLENGES TO PROPERTY/CASUALTY INDUSTRY: Improvement in the property/casualty sector’s financial results in 2009 was driven by factors that were largely out of insurers’ control, primarily a quieter than expected year for natural catastrophes and a rebound in the financial markets.
Catastrophe risk remains a primary threat to solvency. No single exposure can affect policyholder security more instantaneously than a catastrophe.
The volatility of catastrophe-prone lines limits the amount of exposure an insurer can safely write. A significant tool in underwriting decisions is mapping software to determine probable maximum loss (PML) – the worst-case scenario – as a basis for limiting the amount of an insurer’s liability to loss from a single occurrence. The quality of the data used to estimate losses remains a concern. The high amount of claims after Hurricanes Katrina, Rita and Wilma in 2005 showed that flawed data (incomplete and inaccurate) resulted in a wide gap between modeled and actual losses.
In a rebound from one of the worst years for catastrophe losses, insurers in 2009 paid roughly half as much in claims as they did the previous year. Despite a number of severe weather events, a below-average Atlantic hurricane season and fewer major catastrophes helped ease the insurance burden to about $26 billion, after a total that exceeded $50 billion in 2008. Extended catastrophe-free intervals can lead insurers to increase their catastrophe exposure – and that can come back to haunt them.
The property/casualty industry’s overall net investment gains (sum of net investment income and realized capital gains/losses) increased approximately 31% to $43.5 billion in 2009 from 2008. However, net investment income fell approximately $5.7 billion from 2008 to $48.3 billion in 2009.
The decrease came as insurers reallocated their portfolios into more conservative investments in response to cycles in the underwriting and economic conditions. (The overall net investment gains occurred because of a significantly reduced impact of realized capital losses.) Investment returns likely will continue to be impacted by low interest rates.
In a lingering soft market, property/casualty insurers tend to underprice and aggressively underwrite to generate capital. Those insurers that have the ability to manage the cycle efficiently – by maintaining underwriting discipline and investing to supplement strong underwriting performance, rather than to offset it - likely will outperform competitors.
| www.ambest.com | 21 |
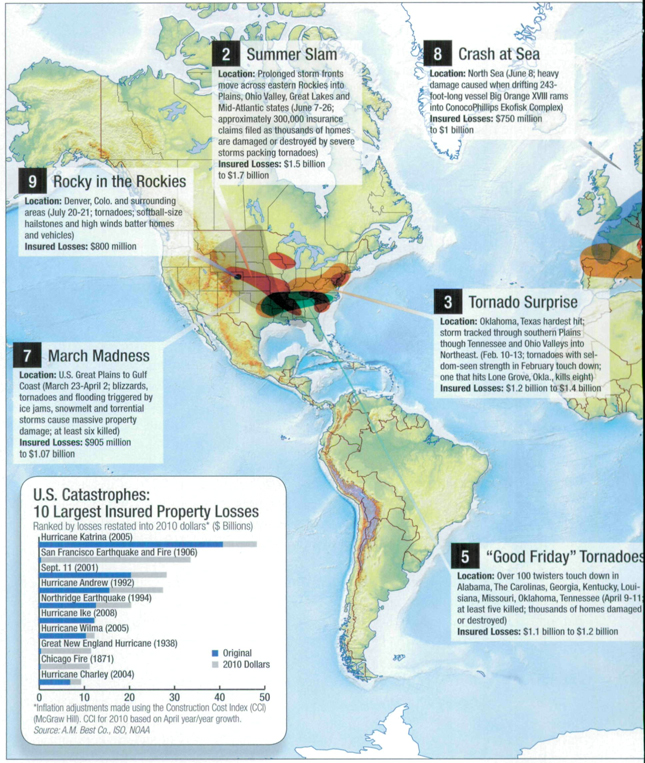
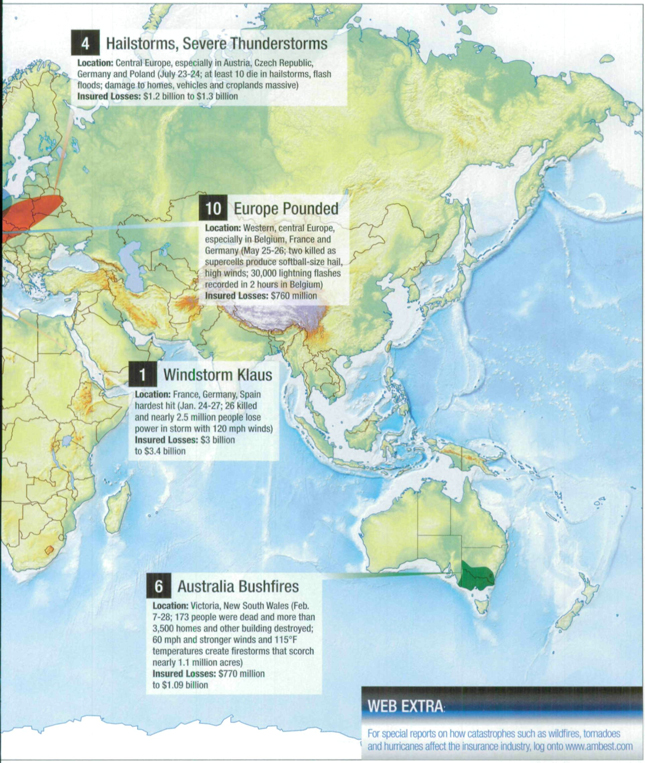
A catastrophe is an event that causes $25 million or more in direct insured losses to property and that affects a significant number of policyholders and insurers. Here are the insured loss events expected to be the top 10 costliest of 2009 once all claims have been paid. For a video presentation go to www.bestreview.com.
| 22 | Insurance Facts and Stats |
| www.ambest.com | 23 |
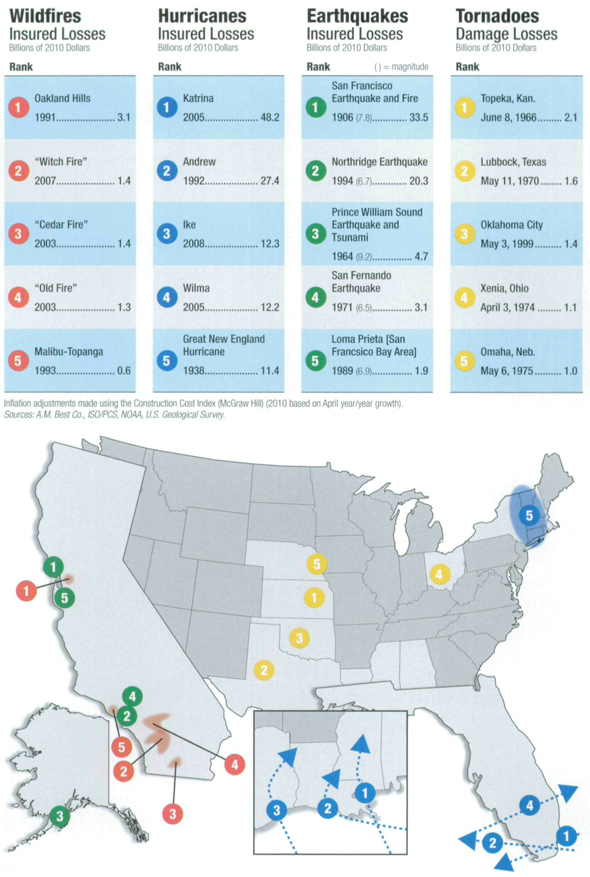
Historic U.S. Catastrophes
| 24 | Insurance Facts and Stats |
Lines of Business
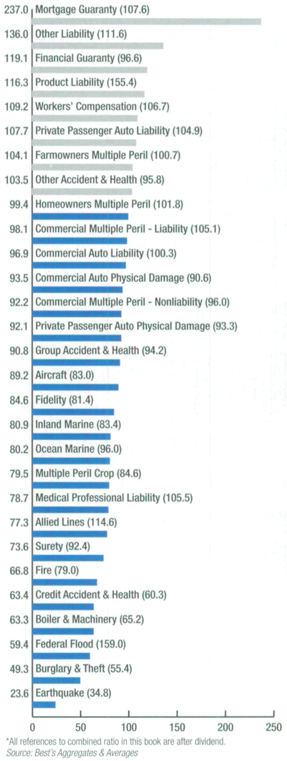
The effect of catastrophic events over the past 10 years (i.e., Sept. 11, Hurricane Katrina) is evident in premium and combined-ratio spikes in certain business lines.
U.S. Property/Casualty Direct Premiums Written 2009 | Combined Ratios by Line of Business, 2009* | |
Number in parenthesis represents the percentage change from 2008. ($ Billions) | Number in parenthesis represents the 10-year combined ratio. | |
 |  |
| www.ambest.com | 25 |
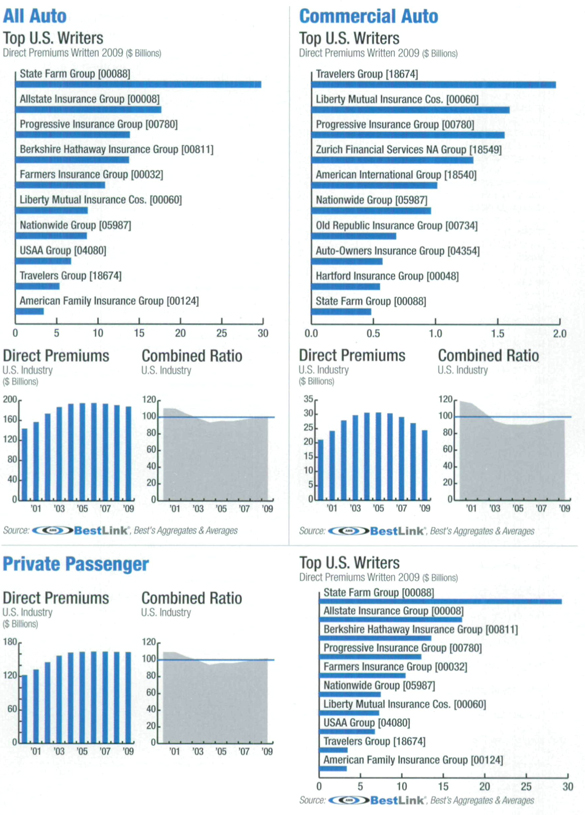
Auto
Automobile insurance is the most bought insurance in the United States. Different coverages can be purchased based on the needs of the insured.
| 26 | Insurance Facts and Stats |
Workers’
Compensation
It is a system under which employers provide insurance - and the payment of lost wages - for employees in the case of injury, disability or death resulting from workplace hazards.
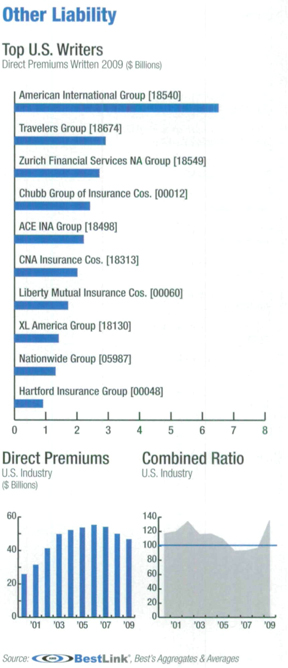
Other Liability
Liability insurance coverage protects against legal liability resulting from negligence, carelessness or a failure to act causing property damage or personal injury to others. Examples of coverage include errors and omission, personal injury and liquor liability.
| www.ambest.com | 27 |
Homeowners
Multiple Peril
Typical policies cover most property or liability perils – such as fire or theft – to which the homeowner is exposed. Coverage includes structures on the property, as well as personal possessions in the structures. However, standard homeowners insurance does not cover flood damage.

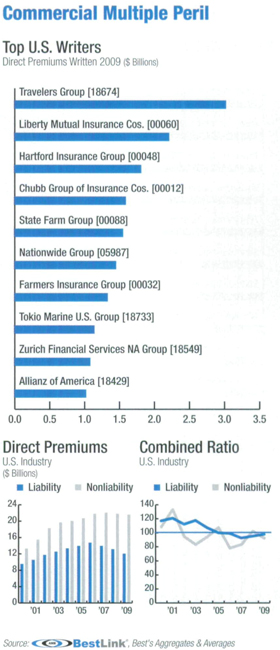
Commercial
Multiple Peril
Commercial multiple peril policies package two or more insurance coverages protecting a business from various property and liability risk exposures, such as the physical assets of businesses (nonliability) and the actions of owners or employee (liability).
| 28 | Insurance Facts and Stats |
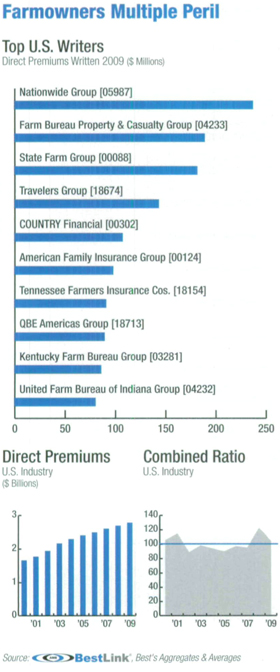
Farmowners
Multiple Peril
Policies are similar to homeowners insurance, protecting farmowners and ranchowners against a number of named perils and liabilities. Coverage usually protects the home and its contents, as well as barns, stables and other structures.
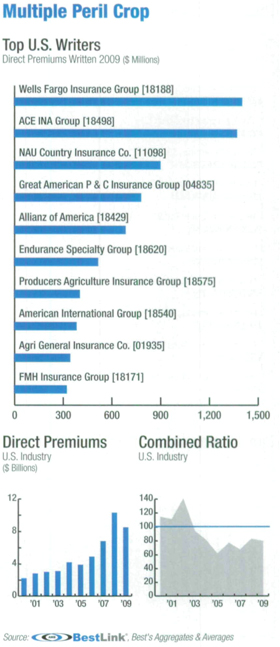
Multiple Peril Crop
Crop insurance, written under the jurisdiction of the National Crop Insurance Services, covers growing crops against perils such as hail, wind and fire.
| www.ambest.com | 29 |
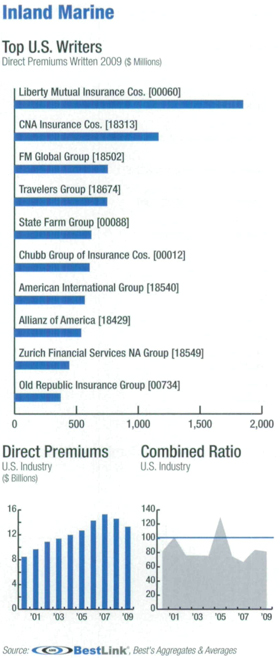
Inland Marine
Coverage was developed for shipments that do not involve ocean transport. It covers articles in transit by all forms of land and air transportation as well as bridges, tunnels and other means of transportation and communication. It also provides special coverage for distinctive items such as jewelry, fine arts and silverware.
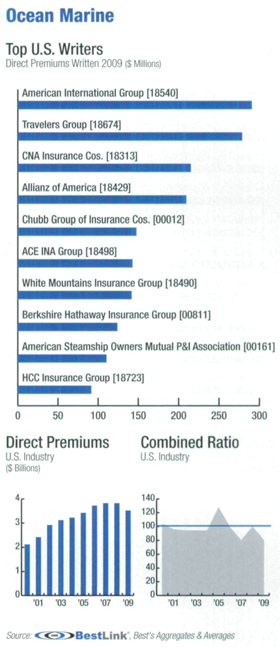
Ocean Marine
Ocean marine insures against property damage to all types of vessels and water craft and to the loss of cargo. Coverage excludes war and terrorism risk.
| 30 | Insurance Facts and Stats |
Medical
Professional Liability
Policies provide professional liability coverage for physicians and other medical professionals against lawsuits alleging negligence or errors and omissions during the care of patients.
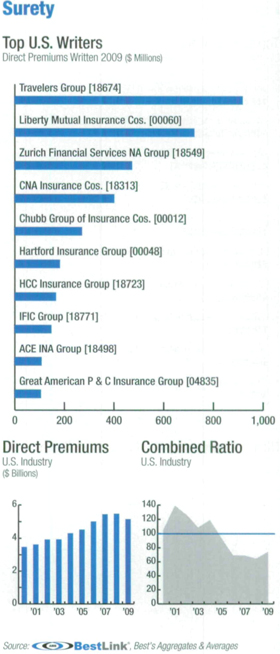
Surety
Surety bonds guarantee that a principal will perform a specific obligation. They are three-party contracts:
| • | The principal: the primary party who will be performing the obligation |
| • | The oblige: the party who is the recipient of the obligation |
| • | The surety: ensures that the obligation will be performed |
In the case of public construction projects, surety bonds protect taxpayer dollars should the contractor default.
| www.ambest.com | 31 |
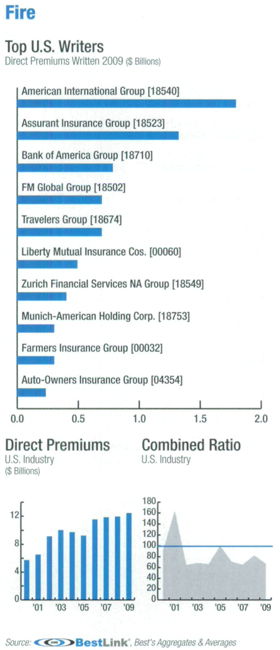
Fire
Fire insurance protects property against losses caused by fire or lightning and may be included in homeowners or commercial multiple peril policies.
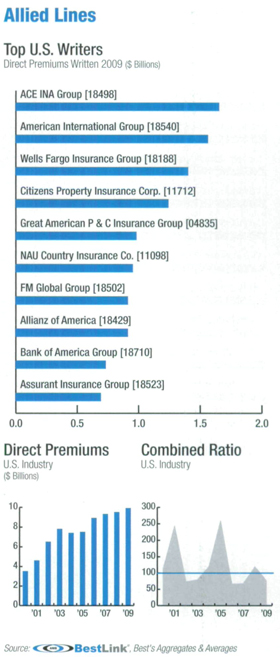
Allied Lines
Think wind, rain and fire. Allied lines are types of property insurance that are usually bought in conjunction with fire insurance. It includes wind, water damage and vandalism coverage.
| 32 | Insurance Facts and Stats |
Earthquake
Because earthquakes are not covered by standard homeowners or most business policies, coverage must be purchased separately. It covers direct damage to property resulting from an earthquake or volcano. It typically excludes damage resulting from fire, explosion, flood or a tidal wave that follows the quake or eruption.

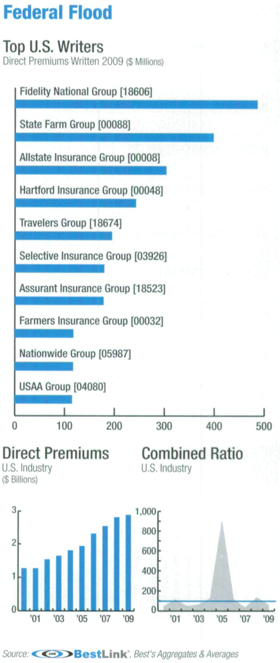
Federal Flood
Like earthquake insurance, flood coverage is excluded under homeowners policies and many commercial property policies. Coverage for flood damage is available from the National Flood Insurance Program but is sold by licensed insurance agents.
| www.ambest.com | 33 |
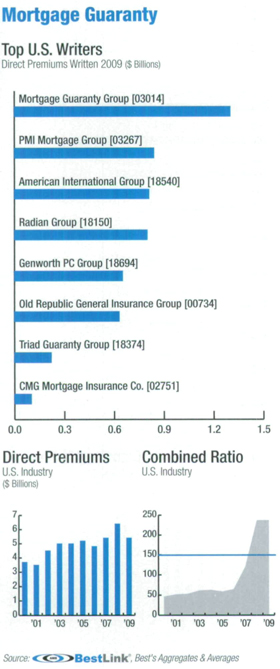
Mortgage Guaranty
Also called private mortgage insurance (PMI), mortgage guaranty insurance covers the lender originating the mortgage in the event that the mortgage holder defaults on a loan, spreading the risk of foreclosure between the lender and the insurer.
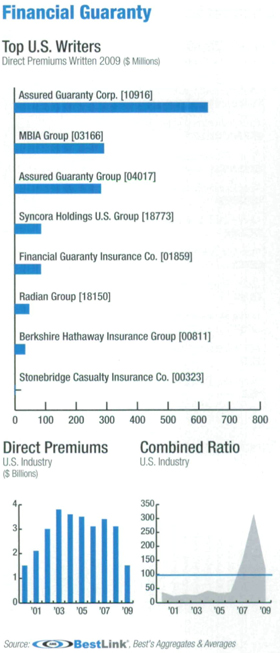
Financial Guaranty
With financial guaranty insurance, losses from specified financial transactions are covered, and investors in debt instruments, such as municipal bonds, will receive timely principal and interest payments if a default occurs. It also can hike the credit rating of debt to which the guaranty is attached.
| 34 | Insurance Facts and Stats |
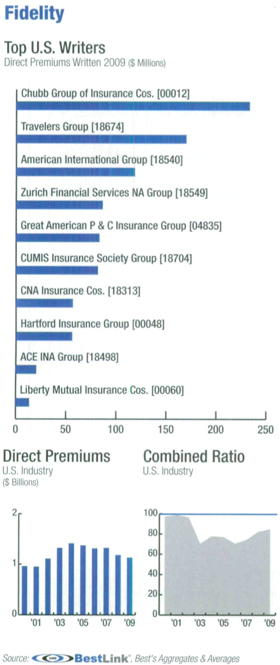
Fidelity
Coverage created to cover commercial businesses and financial establishments for losses of monies or stock through acts of employee dishonesty. Fidelity coverage also can encompass Internet transactions, as dependence on e-commerce soars.
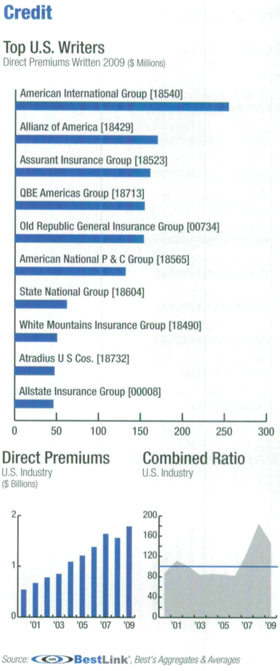
Credit
Credit insurance protects companies against the risk of nonpayment by buyers arising from commercial risks, such as insolvency, or noncommercial risks, such as death, disability or unemployment.
| www.ambest.com | 35 |
Product Liability
Coverage of the liability that parties along the supply chain of a product — from the manufacturer or the storeowner — have to assume if some defect in the product sold or manufactured injures a third party or damages his or her property.

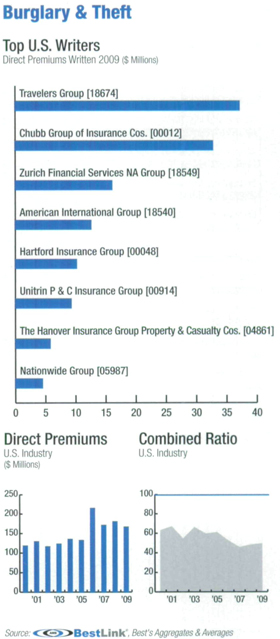
Burglary & Theft
This is insurance for when someone breaks in and damages or steals your property at your home or while your business is closed. It is provided in a standard homeowners policy and in a business multiple peril policy.
| 36 | Insurance Facts and Stats |
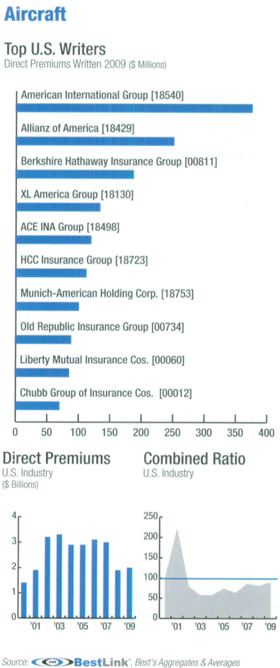
Aircraft
Insurers sell commercial airlines property insurance on the hulls and instrumentation of airplanes, and liability insurance for negligent acts that result in injury or property damage to passengers or others. Damage is covered on the ground and in the air.
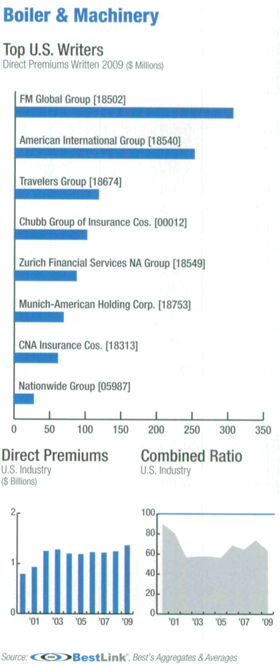
Boiler & Machinery
Policies protect against a sudden or accidental breakdown of heating, cooling, production machinery and electrical equipment.
| www.ambest.com | 37 |
Canada
There are about 200 property/casualty insurers active in Canada, according to Best’s Key Rating Guide, including Canadian-incorporated companies and branches of foreign companies licensed in Canada. Most companies are located in Ontario, where roughly one in every three Canadians resides.
In addition, government-owned entities also provide property/casualty insurance. The area of greatest government participation is auto insurance.
After a difficult year in 2008, the Canadian property/casualty industry’s overall capitalization rebounded in 2009, due greatly to improvement in the global investment markets. Total comprehensive income rose to C$4.5 billion, a more than threefold increase over 2008. Pretax net income in 2009 jumped 13.4%, to C$2.2 billion.
Still, underwriting losses from competitive pricing on major commercial lines, severe personal auto claims activity and weather-related losses tempered financial results. The combined ratio improved marginally to 100.0, compared with 101.1 in 2008.
An added industry concern over the past 12 to 18 months has been the significant compression in investment yields and historically low interest rates. This trend has negatively affected a growing number of insurers’ underwriting results.
NOTE:
• Financial data of Insurance Corporation of British Columbia, which was established in 1973 to provide universal auto insurance to B.C. motorists, is not included because it is run by the province.
• Data also excludes Lloyd’s Underwriters Canada Branch due to significant differences between permitted and prescribed accounting practices. (US$1 = C$1.0275 as of Dec. 31, 2009)
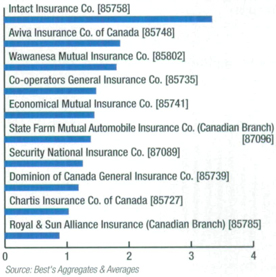
Top Canada Property/Casualty Insurers
Assets 2009 (C$ Billions)
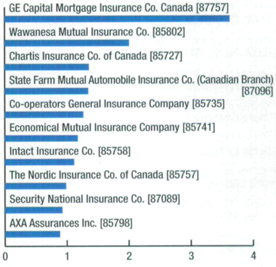
Top Canada Property/Casualty Insurers
Capital & Surplus 2009 (C$ Billions)
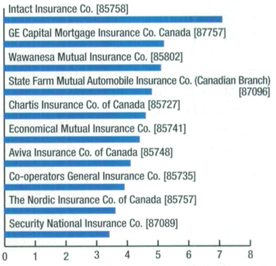
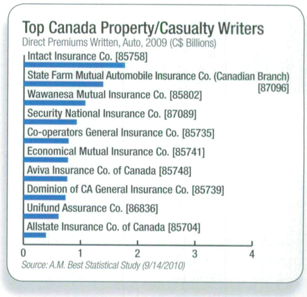
Top Canada Property/Casualty Insurers
Direct Premiums Written 2009 (C$ Billions)
| 38 | Insurance Facts and Stats |
Auto
Auto insurers saw their net loss ratio decline marginally to 76.5 in 2009, compared with 79.9 in 2008. Favorable claims development related to failed constitutional challenges to minor injury caps in Alberta and Nova Scotia in 2009 helped to drive the positive change. Insurers also were able to raise rates in most provinces to combat rising medical cost inflation and increasing claims severity, especially in Ontario. (Auto insurance reform in that province became effective in September 2010.)
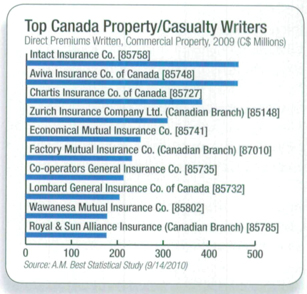
Commercial Property
Historically a profitable line, commercial property has been impacted by higher incurred claims and lower investment yields. As result, writers have seen their margins shrink. Although net claims incurred increased 4.5% in 2009, that jump is considerably smaller than the 2007 and 2008 increases of 11.1% and 18.9%, respectively.
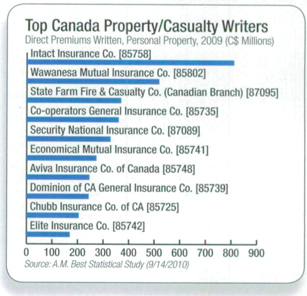
Personal Property
Claims related to storm losses put pressure on insurers’ underwriting results and profitability. The net loss ratio of 75.9 in 2009 remained nearly unchanged from the previous year, when it was 75.8, but the ratio remains well above the 65.9 average posted from 2004-07.
| www.ambest.com | 39 |
Copyright of Best’s Review is the property of AM Best Company Inc. and its content may not be copied or emailed to multiple sites or posted to a listserv without the copyright holder’s express written permission. However, users may print, download, or email articles for individual use.